Embed Size (px)
Citation preview
Guideline for the preparation of Standard Management Accounts

Page 2 of 25
Table of Contents
1 Introduction.....................................................................................................................................................................................32 Executive summary ........................................................................................................................................................................33 Statement of financial position......................................................................................................................................................44 Ratios – statement of financial position .......................................................................................................................................55 Consolidated statement of comprehensive income....................................................................................................................66 Ratios – consolidated statement of comprehensive income......................................................................................................77 Monthly cash flow statement (actual and forecast for remainder of the year)..........................................................................88 Statement of changes in members’ funds....................................................................................................................................99 Periodic consolidated statement of comprehensive income ...................................................................................................1010 Periodic statement of comprehensive income per option ........................................................................................................1111 Ratios – periodic statement of comprehensive income per option .........................................................................................1212 Notes to management accounts..................................................................................................................................................1314 Graphs and tables ........................................................................................................................................................................1515 Detailed investment schedule .....................................................................................................................................................1716 Annexure B compliance testing ..................................................................................................................................................17

Guideline for the preparation of standard management accounts
Page 3 of 25
1 Introduction
This guideline is intended to provide a general idea of what standard management accounts should entail. It should be noted that themanagement accounts prepared by the administrators do not have to precisely match the guideline. Nevertheless, all due care shouldbe taken by administrators when preparing management accounts to ensure that sufficient and relevant information is provided to theusers of management accounts for decision making purposes.
Supporting schedules such as investment compliance can be a separate attachment to the accounts.
2 Executive summary
The executive summary should provide a broad overview of the scheme’s operations. It should relay pertinent information in order toafford the trustees a clear view of what occurred during the period under review.

Guideline for the preparation of standard management accounts
Page 4 of 25
3 Statement of financial positionAs at dd/mm/yyyy
Notes Month Previous yearActual Budget Actual
ASSETSNon-current assetsProperty, plant & equipment (specify)Investment propertyInvestmentsOther non-current assets (specify)
Current assetsInventoriesTrade and other receivablesInvestmentsCash and cash equivalentsPMSA trust investment 12bOther current assets (specify)
Total assets
FUNDS AND LIABILITIESMembers' FundsAccumulated fundsRevaluation reserve - investmentsRevaluation reserve - property, plant & equipmentReserves set aside for specific purposes (specify)Other reserves (specify)Minority interest
Non-current liabilitiesBorrowingsOther non-current liabilities (specify)
Current liabilitiesOutstanding claims provisionTrade and other payablesOther current liabilities (specify)PMSA trust liability 12a
Total funds and liabilities

Guideline for the preparation of standard management accounts
Page 5 of 25
4 Ratios – statement of financial positionAs at dd/mm/yyyy
Accumulated reserves as a % of annualised gross contributions (solvency ratio)Note: ratios should be calculated excluding personal medical savings account trustinvestments and liabilitiesTotal assets: total liabilities (norm 2:1)Current assets/ current liabilities (norm 1:1)
Average trade and other receivables days outstanding(Outstanding trade and other receivables) /annualised gross contribution * no of days)
Average trade and other payables days outstanding(Outstanding trade and other payables/ annualised risk claims incurred * no of days)
Claims paying ability(Cash & cash equivalents +short term investments)/ (gross claims)* no of months)
Reserves per member
(Under)/ Over provision of IBNR as a % of IBNR
NB: The above ratios are illustrative only. The scheme must use ratios which aresuitable for their circumstances.
Current month Previous year
Actual Budget Actual
Guideline for the preparation of standard management accounts
Page 6 of 25
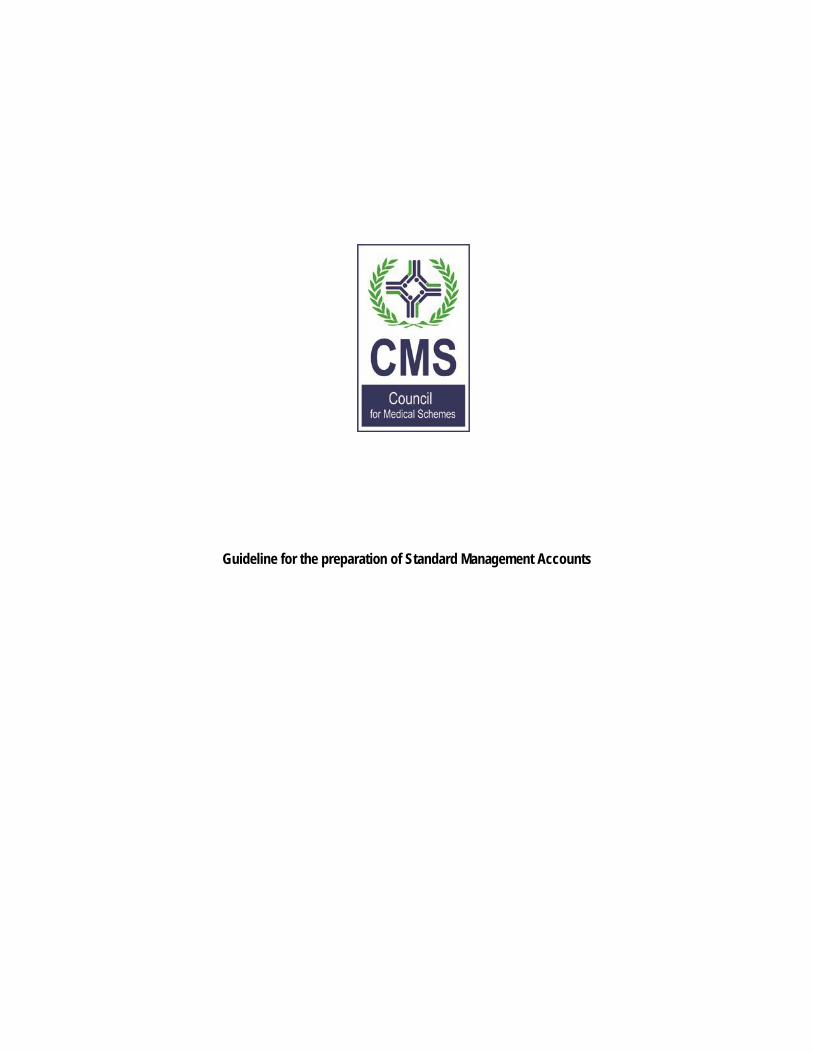
5 Consolidated statement of comprehensive incomeFor the period ended dd/mm/yyyy
Notes
Risk contribution income 12cRelevant healthcare expenditureNet claims incurredRisk claims incurredThird party claims recoveriesAccredited managed healthcare services (no risk transfer)Net income/expense on risk transfer arrangementsRisk transfer arrangement fees/ premiums paidRecoveries from risk transfer arrangementsProfit/ (loss) share arising from risk transfer arrangements
Gross healthcare resultNet income/ (expense) on commercial reinsuranceCommercial reinsurance premiums paidRecoveries from commercial reinsuranceProfit/ (loss) share arising from commercial reinsuranceBroker service feesAdministration expensesNet impairment losses on healthcare receivablesNet healthcare resultOther incomeInvestment incomeIncome from use of own facilities by external partiesGrantsSundry income
Other expenditureAsset management feesCost incurred in provision of own facilities to external partiesInterest paid on savings accountsSundry expensesNet surplus/ (deficit ) for the year
Other comprehensive incomeFair value adjustment on available for sale investmentsReclassification adjustment*Land and buildings revaluationTotal comprehensive income for the year
*The reclassification adjustment relates to gain/loss on sale of available-for-sale investments which is taken to the statement ofcomprehensive income within “Investment income”
Note: Any other individual line items are to be disclosed separately on the face of the statement of comprehensive income and not insundry income or expense, following the same ‘by function’ classification.
Current month YTD Previous year
Actual Budget Actual BudgetActualYTD Full year
Guideline for the preparation of standard management accounts
Page 7 of 25
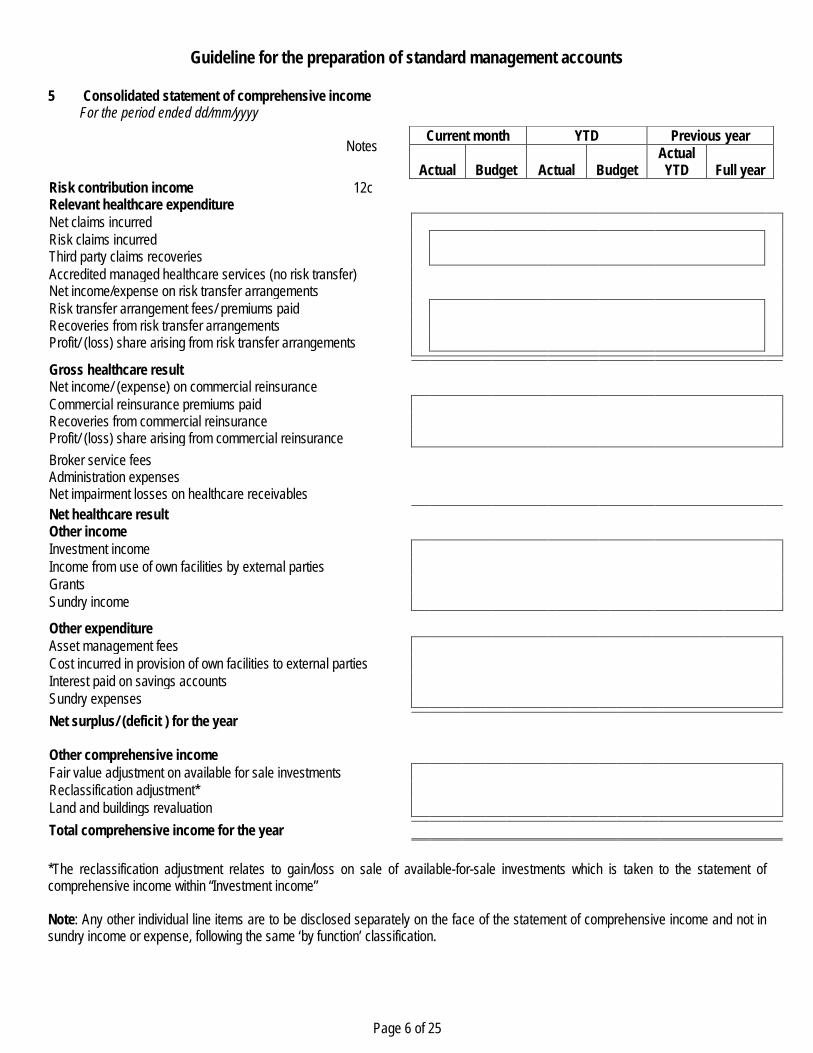
6 Ratios – consolidated statement of comprehensive incomeFor the period ended dd/mm/yyyy
Month YTDCurrentR'000
BudgetR'000
Previous yearR'000
CurrentR'000
BudgetR'000
Previous year
NUMBER OF:MembersDependantsBeneficiariesAverage membersAverage beneficiariesAverage agePensioner ratio
RATIOS
Gross contributions per average beneficiary per month (pabpm)Risk contribution income pabpmNet relevant healthcare expenditure incurred pabpmNon-healthcare expenditure pabpmAdministration expenses pabpmNet relevant healthcare expenditure incurred as % of riskcontribution incomeNon-healthcare expenditure as % of risk contribution incomeAdministration expenses as a % of risk contribution incomeNet surplus/(deficit) for the year as % of risk contribution incomeInvestment income as % of risk contribution income
Page 8 of 25
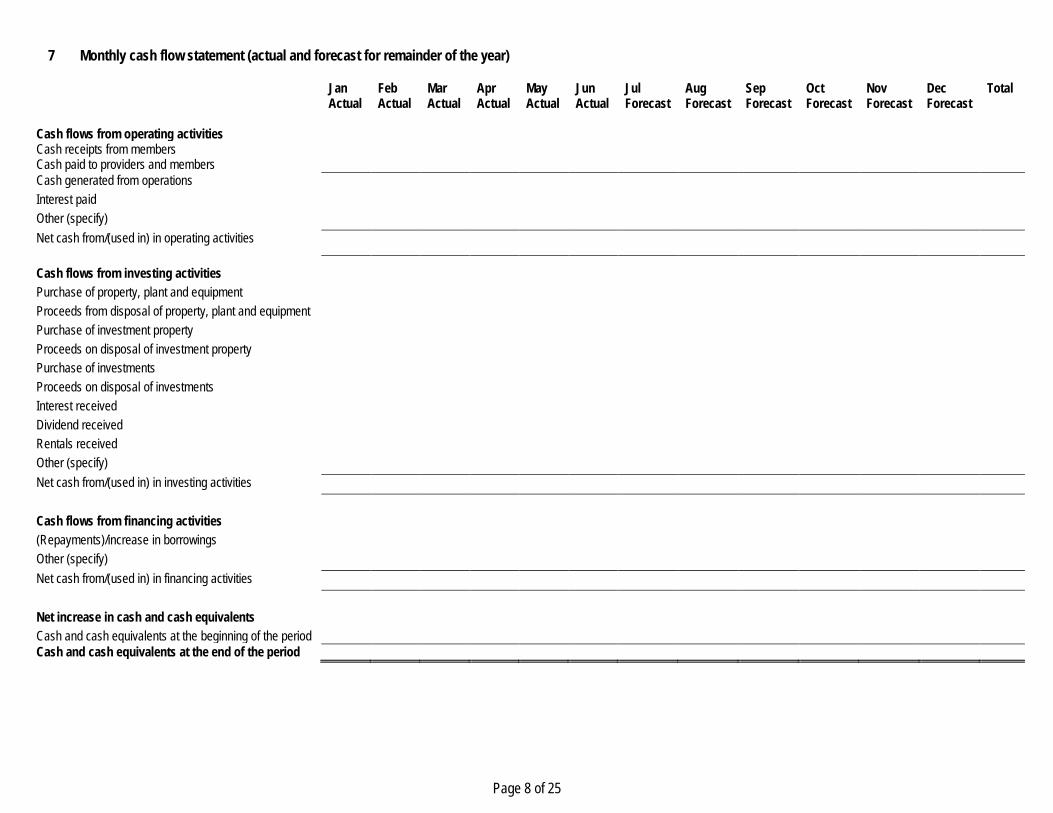
7 Monthly cash flow statement (actual and forecast for remainder of the year)
JanActual
FebActual
MarActual
AprActual
MayActual
JunActual
JulForecast
AugForecast
SepForecast
OctForecast
NovForecast
DecForecast
Total
Cash flows from operating activitiesCash receipts from membersCash paid to providers and membersCash generated from operationsInterest paidOther (specify)Net cash from/(used in) in operating activities
Cash flows from investing activitiesPurchase of property, plant and equipmentProceeds from disposal of property, plant and equipmentPurchase of investment propertyProceeds on disposal of investment propertyPurchase of investmentsProceeds on disposal of investmentsInterest receivedDividend receivedRentals receivedOther (specify)Net cash from/(used in) in investing activities
Cash flows from financing activities(Repayments)/increase in borrowingsOther (specify)Net cash from/(used in) in financing activities
Net increase in cash and cash equivalentsCash and cash equivalents at the beginning of the periodCash and cash equivalents at the end of the period
Guideline for the preparation of standard management accounts
Page 9 of 25
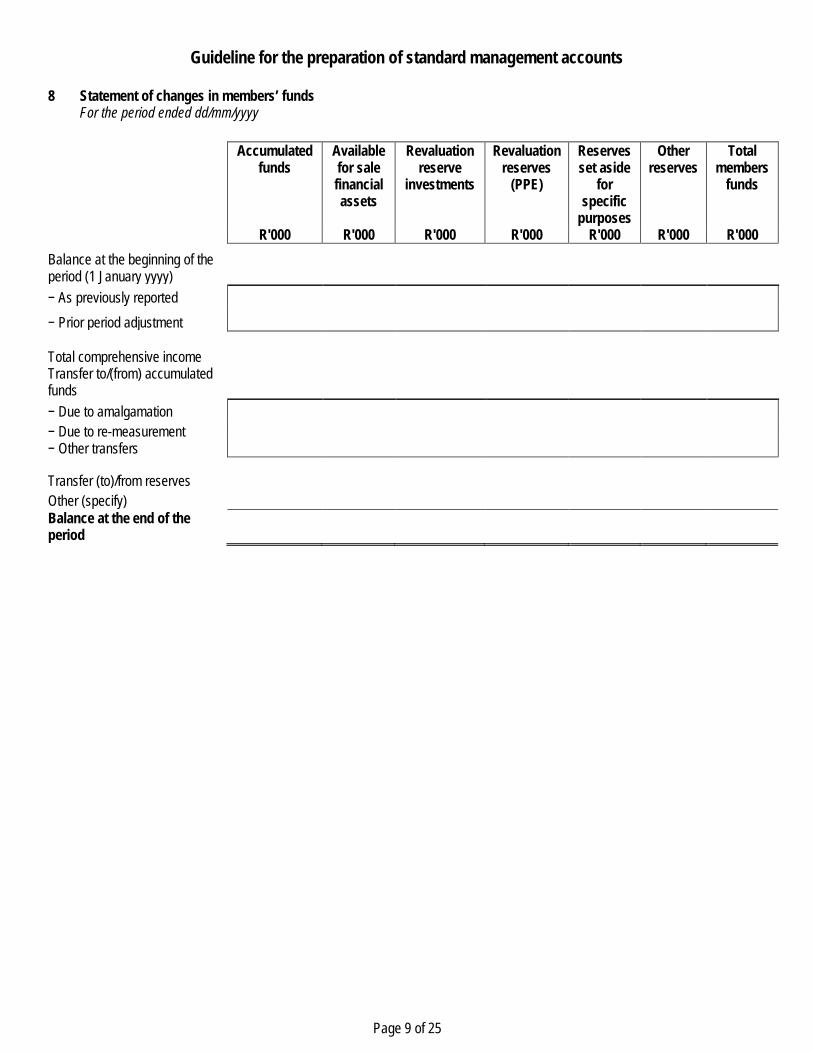
8 Statement of changes in members’ fundsFor the period ended dd/mm/yyyy
Accumulatedfunds
Availablefor salefinancialassets
Revaluationreserve
investments
Revaluationreserves
(PPE)
Reservesset aside
forspecific
purposes
Otherreserves
Totalmembers
funds
R'000 R'000 R'000 R'000 R'000 R'000 R'000Balance at the beginning of theperiod (1 January yyyy)− As previously reported− Prior period adjustment
Total comprehensive incomeTransfer to/(from) accumulatedfunds− Due to amalgamation− Due to re-measurement− Other transfers
Transfer (to)/from reservesOther (specify)Balance at the end of theperiod

Guideline for the preparation of standard management accounts
Page 10 of 25
9 Periodic consolidated statement of comprehensive incomeFor the period ended dd/mm/yyyy
JanR’000
FebR’000
MarR’000
YTDR’000
Budget YTDR’000
Risk contribution incomeRelevant healthcare expenditureNet claims incurredRisk claims incurredThird party claims recoveriesAccredited managed healthcare services (no risk transfer)Net income/expense on risk transfer arrangementsRisk transfer arrangement fees/ premiums paidRecoveries from risk transfer arrangementsProfit/ (loss) share arising from risk transfer arrangements
Gross healthcare resultNet income/ (expense) on commercial reinsuranceCommercial reinsurance premiums paidRecoveries from commercial reinsuranceProfit/ (loss) share arising from commercial reinsuranceBroker service feesAdministration expensesNet impairment losses on healthcare receivablesNet healthcare resultOther incomeInvestment incomeIncome from use of own facilities by external partiesGrantsSundry income
Other expenditureAsset management feesCost incurred in provision of own facilities to external partiesInterest paid on savings accountsSundry expensesNet surplus/ (deficit ) for the year
Other comprehensive incomeFair value adjustment on available for sale investmentsReclassification adjustment*Land and buildings revaluationTotal comprehensive income for the year
*The reclassification adjustment relates to gain/loss on sale of available-for-sale investments which is taken to the statement ofcomprehensive income within “Investment income”.
Note: Any other individual line items are to be disclosed separately on the face of the statement of comprehensive income and not insundry income or expense, following the same ‘by function’ classification.
Guideline for the preparation of standard management accounts
Page 11 of 25
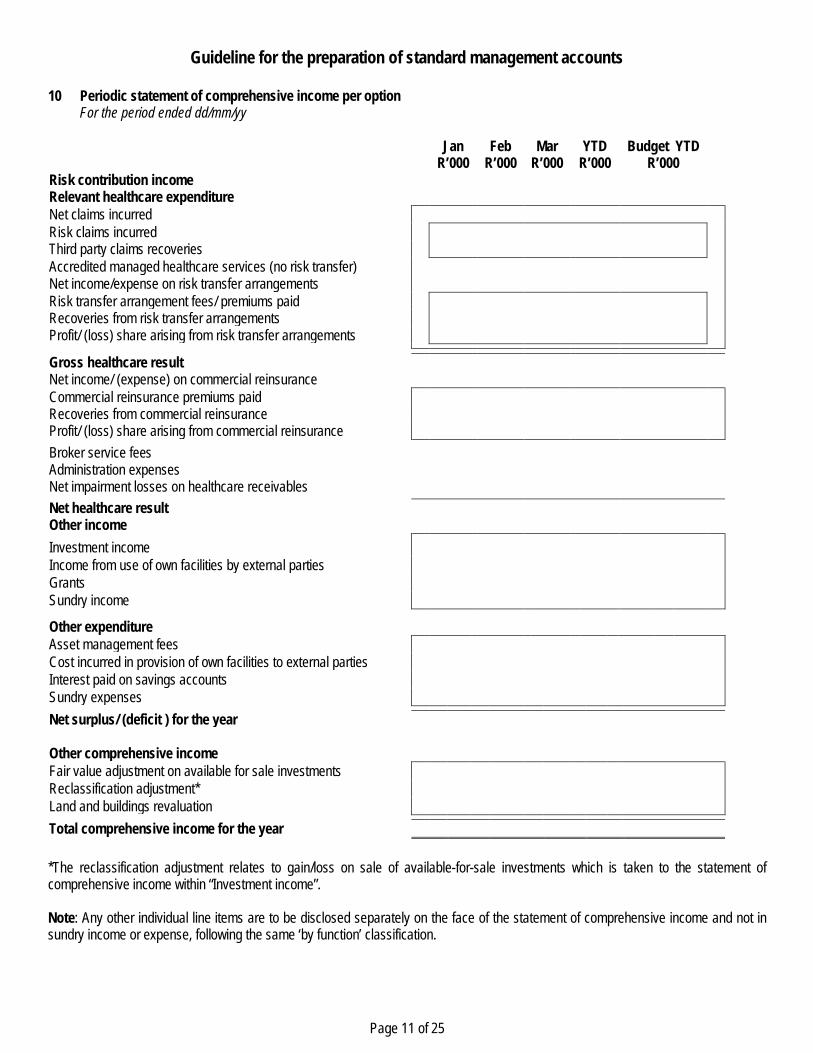
10 Periodic statement of comprehensive income per optionFor the period ended dd/mm/yy
JanR’000
FebR’000
MarR’000
YTDR’000
Budget YTDR’000
Risk contribution incomeRelevant healthcare expenditureNet claims incurredRisk claims incurredThird party claims recoveriesAccredited managed healthcare services (no risk transfer)Net income/expense on risk transfer arrangementsRisk transfer arrangement fees/ premiums paidRecoveries from risk transfer arrangementsProfit/ (loss) share arising from risk transfer arrangements
Gross healthcare resultNet income/ (expense) on commercial reinsuranceCommercial reinsurance premiums paidRecoveries from commercial reinsuranceProfit/ (loss) share arising from commercial reinsuranceBroker service feesAdministration expensesNet impairment losses on healthcare receivablesNet healthcare resultOther incomeInvestment incomeIncome from use of own facilities by external partiesGrantsSundry income
Other expenditureAsset management feesCost incurred in provision of own facilities to external partiesInterest paid on savings accountsSundry expensesNet surplus/ (deficit ) for the year
Other comprehensive incomeFair value adjustment on available for sale investmentsReclassification adjustment*Land and buildings revaluationTotal comprehensive income for the year
*The reclassification adjustment relates to gain/loss on sale of available-for-sale investments which is taken to the statement ofcomprehensive income within “Investment income”.
Note: Any other individual line items are to be disclosed separately on the face of the statement of comprehensive income and not insundry income or expense, following the same ‘by function’ classification.
Guideline for the preparation of standard management accounts
Page 12 of 25
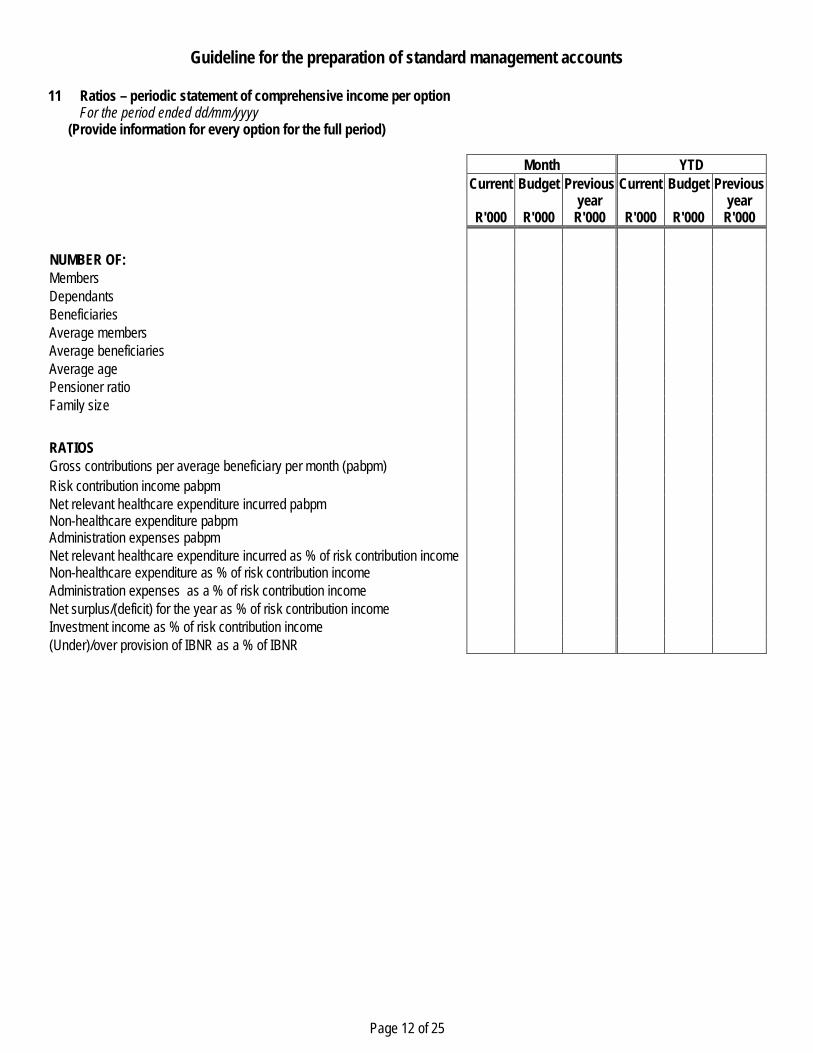
11 Ratios – periodic statement of comprehensive income per optionFor the period ended dd/mm/yyyy
(Provide information for every option for the full period)
Month YTDCurrent
R'000
Budget
R'000
Previousyear
R'000
Current
R'000
Budget
R'000
Previousyear
R'000
NUMBER OF:MembersDependantsBeneficiariesAverage membersAverage beneficiariesAverage agePensioner ratioFamily size
RATIOSGross contributions per average beneficiary per month (pabpm)Risk contribution income pabpmNet relevant healthcare expenditure incurred pabpmNon-healthcare expenditure pabpmAdministration expenses pabpmNet relevant healthcare expenditure incurred as % of risk contribution incomeNon-healthcare expenditure as % of risk contribution incomeAdministration expenses as a % of risk contribution incomeNet surplus/(deficit) for the year as % of risk contribution incomeInvestment income as % of risk contribution income(Under)/over provision of IBNR as a % of IBNR
Guideline for the preparation of standard management accounts
Page 13 of 25
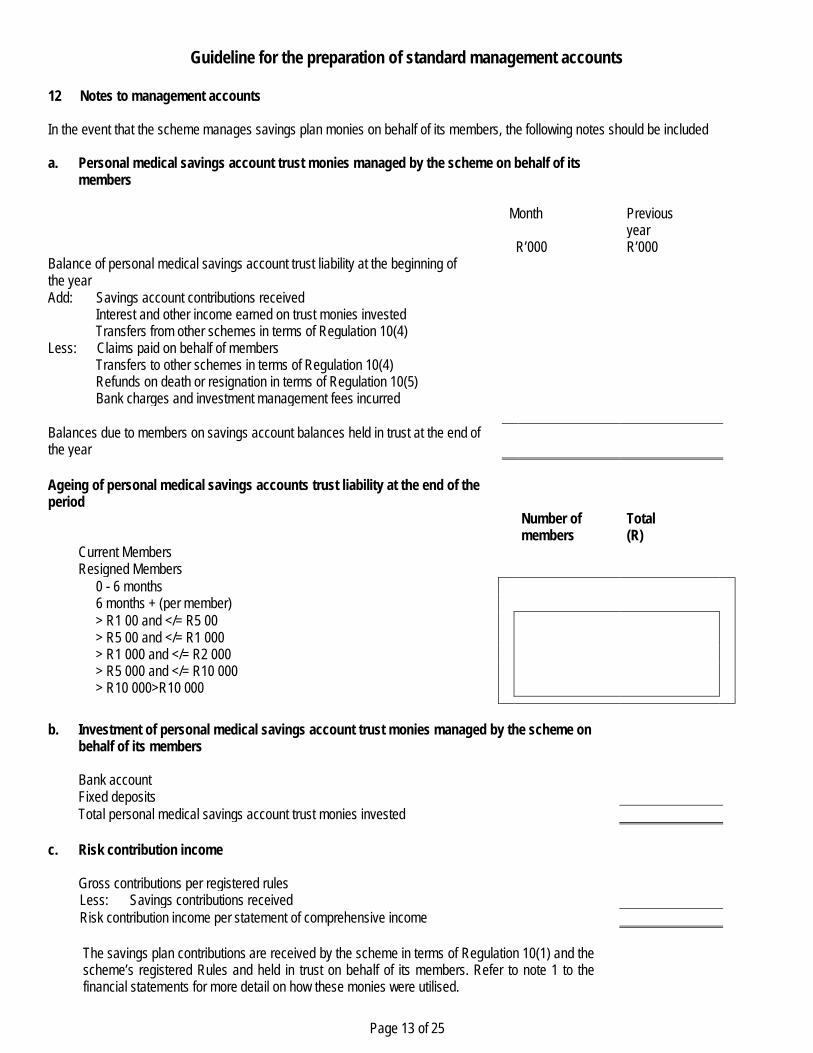
12 Notes to management accounts
In the event that the scheme manages savings plan monies on behalf of its members, the following notes should be included
a. Personal medical savings account trust monies managed by the scheme on behalf of itsmembers
Month Previousyear
R’000 R’000Balance of personal medical savings account trust liability at the beginning ofthe yearAdd: Savings account contributions received
Interest and other income earned on trust monies investedTransfers from other schemes in terms of Regulation 10(4)
Less: Claims paid on behalf of membersTransfers to other schemes in terms of Regulation 10(4)Refunds on death or resignation in terms of Regulation 10(5)Bank charges and investment management fees incurred
Balances due to members on savings account balances held in trust at the end ofthe year
Ageing of personal medical savings accounts trust liability at the end of theperiod
Number ofmembers
Total(R)
Current MembersResigned Members
0 - 6 months6 months + (per member)> R1 00 and </= R5 00> R5 00 and </= R1 000> R1 000 and </= R2 000> R5 000 and </= R10 000> R10 000>R10 000
b. Investment of personal medical savings account trust monies managed by the scheme onbehalf of its members
Bank accountFixed depositsTotal personal medical savings account trust monies invested
c. Risk contribution income
Gross contributions per registered rulesLess: Savings contributions receivedRisk contribution income per statement of comprehensive income
The savings plan contributions are received by the scheme in terms of Regulation 10(1) and thescheme’s registered Rules and held in trust on behalf of its members. Refer to note 1 to thefinancial statements for more detail on how these monies were utilised.
Guideline for the preparation of standard management accounts
Page 14 of 25
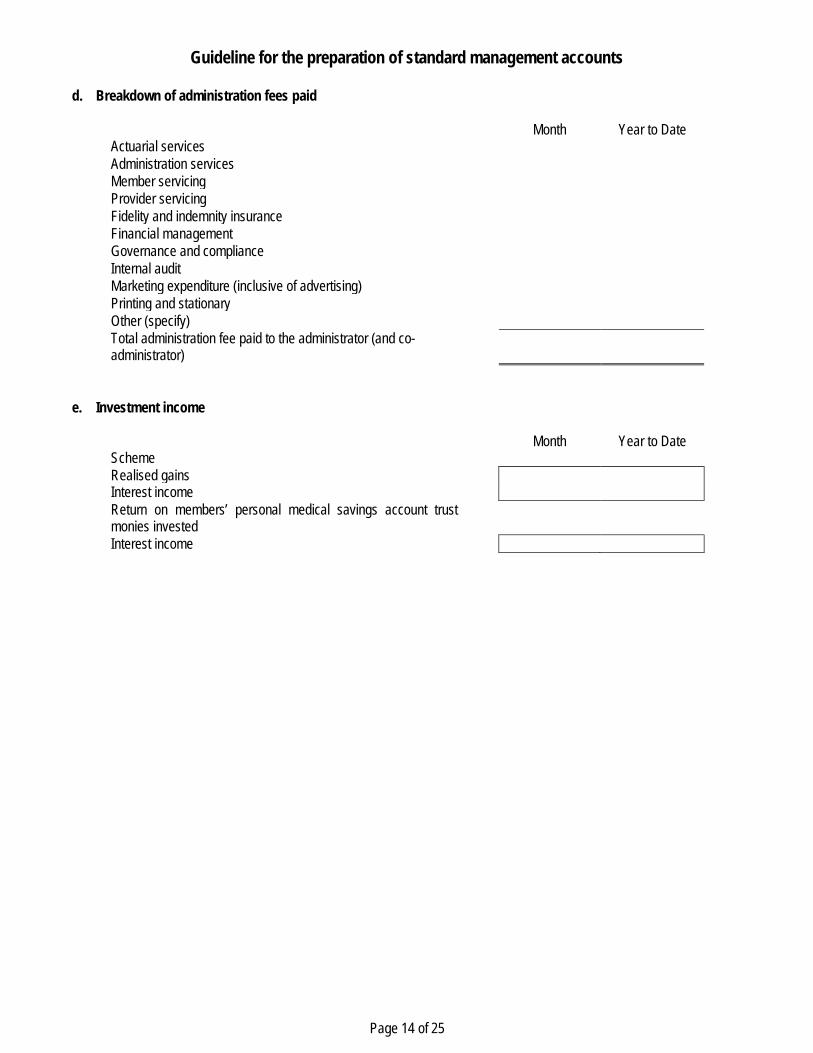
d. Breakdown of administration fees paid
Month Year to DateActuarial servicesAdministration servicesMember servicingProvider servicingFidelity and indemnity insuranceFinancial managementGovernance and complianceInternal auditMarketing expenditure (inclusive of advertising)Printing and stationaryOther (specify)Total administration fee paid to the administrator (and co-administrator)
e. Investment income
Month Year to DateSchemeRealised gainsInterest incomeReturn on members’ personal medical savings account trustmonies investedInterest income
Guideline for the preparation of standard management accounts
Page 15 of 25
13 Variances
A brief explanation should be given for the major differences between actual and budgeted figures on a consolidated and per optionlevel. An explanation is preferable for all variances of more than 10%.
14 Graphs and tables
Graphs and tables are suggested to enable users of the statements, especially trustees, to distinguish at a glance the most importantperformance and statistical indicators.
Most of these indicators will appear in the financial statements, notes or ratios, but they are easier to summarise and understand whenit is presented graphically.
It might be useful to compare the monthly and cumulative figures and ratios with not only the previous period, but also with the budget.
The following list is not exhaustive and is merely an example of what could be presented in the monthly management accounts toensure that the Board of Trustees is making informed decisions:
Membership· The average age and pensioner ratio of beneficiaries per benefit option;· The chronic distribution of beneficiaries;· Analysis of member movement (e.g. reason(s) given by members for leaving the scheme: death, new employment, etc.); and· A graph depicting the number of members per month for current year, previous year and budget.
Non-healthcare expenditure· A graph of the total non-healthcare expenditure as a percentage of risk contribution income per month;· A graph of the non-healthcare expenses per average beneficiary per month;· Details on contractual administration fees; and· Details on benefit management services (not accredited managed healthcare)
Underwriting performance· A graph of the total contributions per member per month, compared to benefit costs per member per month. A moving 12-
month average can also be depicted;· A graph of claims paid as a percentage of risk contribution income per month. This should also be compared with previous
periods. This could also be depicted on a per member per month basis; and· A graph of the operating results as a percentage of risk contribution income.
Claims/benefits· A pie chart of benefits paid by category i.e. hospitals, medicines, specialists etc. A comparison with previous periods and other
schemes or industry averages, if available, is useful;· A list of the highest claims by category, compared to previous periods;· A table of the average claims cost per member, by category of service, compared to previous periods;· Analysis of claims paid aged over service dates. For each month’s claims paid indicate the percentage of previous month’s
claims paid in current month, as well as the percentage claims paid relating to the current month;· Comparison of actual claims paid with the monthly IBNR provision;· Chronic utilisation of beneficiaries;· A table reflecting a split of non-PMB and PMB claims for the current year, as well as previous year;· Analysis of savings claims paid; and· Details on accredited managed healthcare services paid (no transfer of risk).
Other indicators· Graph of outstanding contributions as percentage of gross contributions;· A trend graph depicting current assets to current liabilities;

Guideline for the preparation of standard management accounts
Page 16 of 25
· A trend graph depicting total assets to total liabilities;· A trend graph depicting the scheme’s ability to pay claims from cash and cash equivalents;· Debtor impairment graph (actual v/s budgeted); and· Graph of membership vs solvency ratio.
Guideline for the preparation of standard management accounts
Page 17 of 25
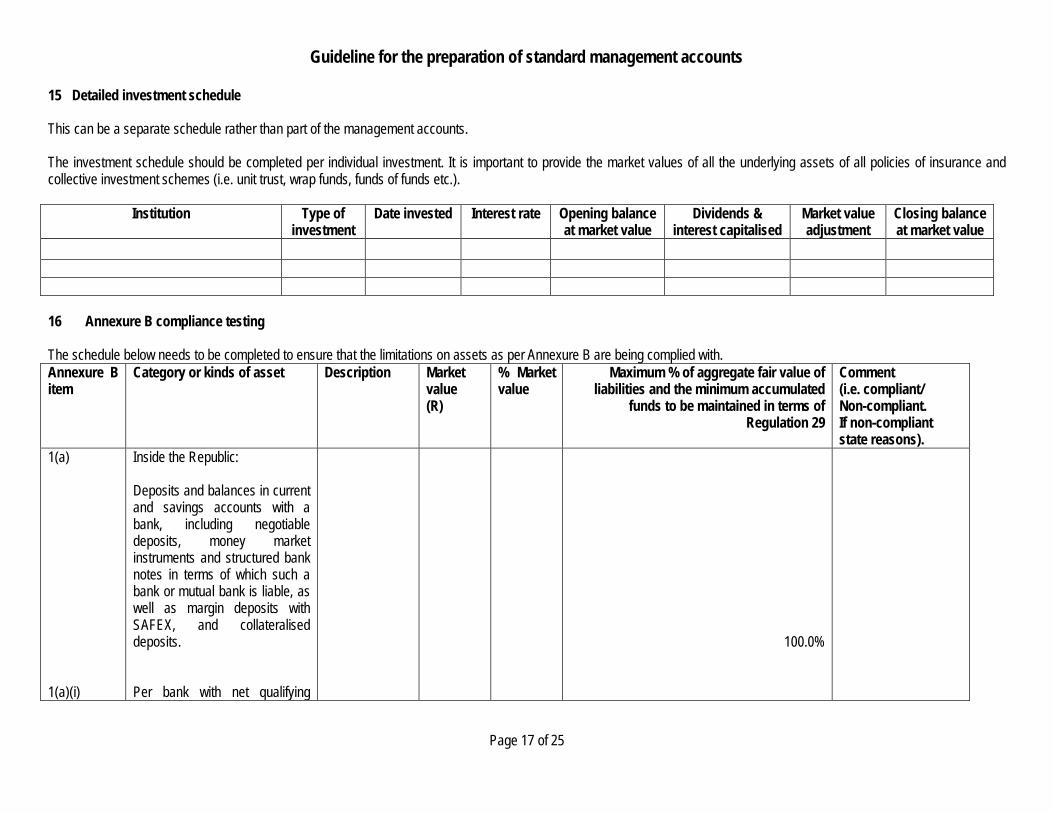
15 Detailed investment schedule
This can be a separate schedule rather than part of the management accounts.
The investment schedule should be completed per individual investment. It is important to provide the market values of all the underlying assets of all policies of insurance andcollective investment schemes (i.e. unit trust, wrap funds, funds of funds etc.).
Institution Type ofinvestment
Date invested Interest rate Opening balanceat market value
Dividends &interest capitalised
Market valueadjustment
Closing balanceat market value
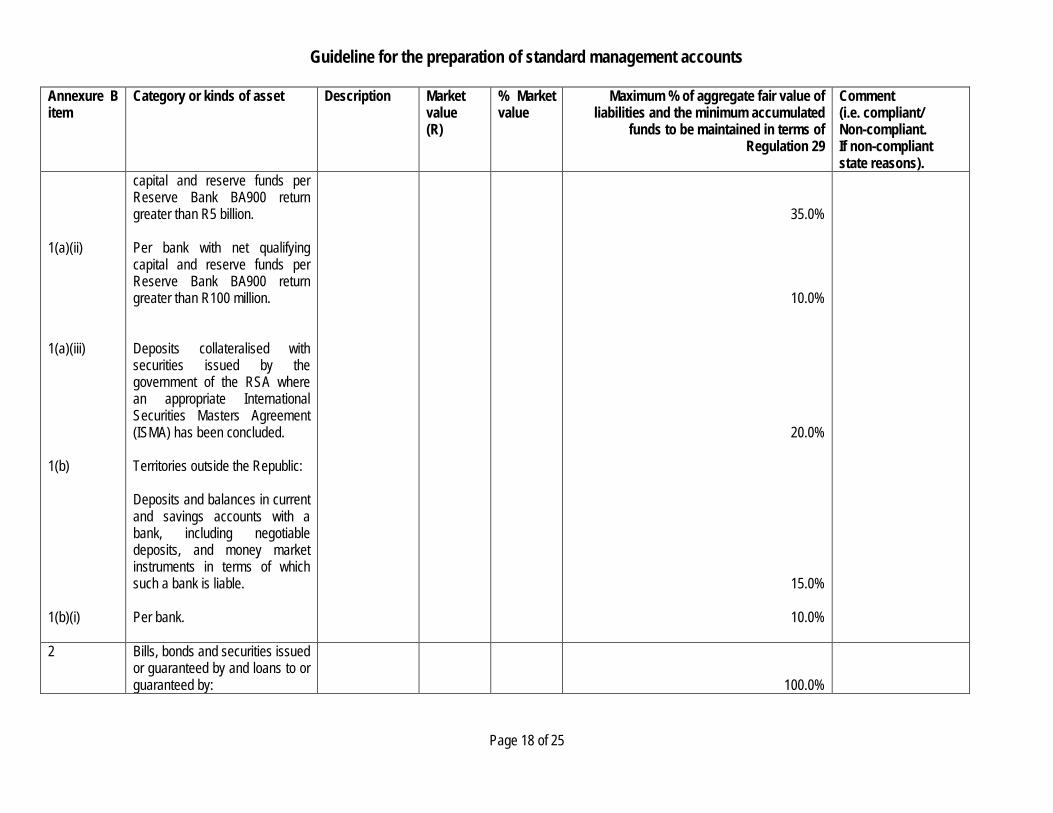
16 Annexure B compliance testing
The schedule below needs to be completed to ensure that the limitations on assets as per Annexure B are being complied with.Annexure Bitem
Category or kinds of asset Description Marketvalue(R)
% Marketvalue
Maximum % of aggregate fair value ofliabilities and the minimum accumulated
funds to be maintained in terms ofRegulation 29
Comment(i.e. compliant/Non-compliant.If non-compliantstate reasons).
1(a)
1(a)(i)
Inside the Republic:
Deposits and balances in currentand savings accounts with abank, including negotiabledeposits, money marketinstruments and structured banknotes in terms of which such abank or mutual bank is liable, aswell as margin deposits withSAFEX, and collateraliseddeposits.
Per bank with net qualifying
100.0%
Guideline for the preparation of standard management accounts
Page 18 of 25
Annexure Bitem
Category or kinds of asset Description Marketvalue(R)
% Marketvalue
Maximum % of aggregate fair value ofliabilities and the minimum accumulated
funds to be maintained in terms ofRegulation 29
Comment(i.e. compliant/Non-compliant.If non-compliantstate reasons).
1(a)(ii)
1(a)(iii)
1(b)
1(b)(i)
capital and reserve funds perReserve Bank BA900 returngreater than R5 billion.
Per bank with net qualifyingcapital and reserve funds perReserve Bank BA900 returngreater than R100 million.
Deposits collateralised withsecurities issued by thegovernment of the RSA wherean appropriate InternationalSecurities Masters Agreement(ISMA) has been concluded.
Territories outside the Republic:
Deposits and balances in currentand savings accounts with abank, including negotiabledeposits, and money marketinstruments in terms of whichsuch a bank is liable.
Per bank.
35.0%
10.0%
20.0%
15.0%
10.0%
2 Bills, bonds and securities issuedor guaranteed by and loans to orguaranteed by: 100.0%

Guideline for the preparation of standard management accounts
Page 19 of 25
Annexure Bitem
Category or kinds of asset Description Marketvalue(R)
% Marketvalue
Maximum % of aggregate fair value ofliabilities and the minimum accumulated
funds to be maintained in terms ofRegulation 29
Comment(i.e. compliant/Non-compliant.If non-compliantstate reasons).
2(a)
2(a)(i)
2(a)(ii)
2(a)(iii)
2(a)(iv)
2(a)(v)
2(a)(vi)
2(a)(vii)
2(a)(viii)
2(a)(ix)2(a)(x)
2(a)(xi)
Inside the Republic.
Instruments guaranteed by thegovernment of the RSA.
A local authority authorised bylaw to levy rates uponimmovable property.
Development Bank.
Industrial DevelopmentCorporation (IDC).
Infrastructure FinanceCorporation Limited (INCA).
Land and Agricultural Bank.
Trans-Caledonian TunnelAuthority (TCTA).
SA Roads Board.
Eskom.Transnet.
Per bank with net qualifyingcapital and reserve funds perReserve Bank BA900 return
100.0%
10.0%
20.0%
20.0%
20.0%
20.0%
20.0%
20.0%
20.0%
20.0%20.0%
Guideline for the preparation of standard management accounts
Page 20 of 25
Annexure Bitem
Category or kinds of asset Description Marketvalue(R)
% Marketvalue
Maximum % of aggregate fair value ofliabilities and the minimum accumulated
funds to be maintained in terms ofRegulation 29
Comment(i.e. compliant/Non-compliant.If non-compliantstate reasons).
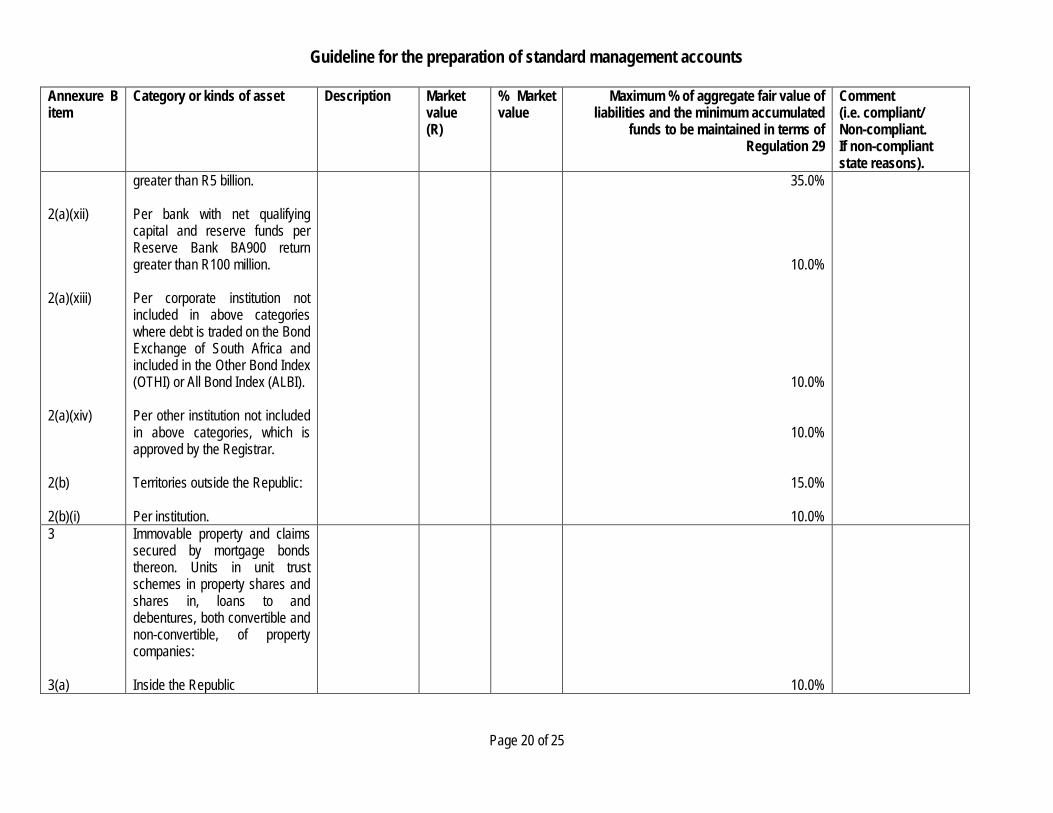
2(a)(xii)
2(a)(xiii)
2(a)(xiv)
2(b)
2(b)(i)
greater than R5 billion.
Per bank with net qualifyingcapital and reserve funds perReserve Bank BA900 returngreater than R100 million.
Per corporate institution notincluded in above categorieswhere debt is traded on the BondExchange of South Africa andincluded in the Other Bond Index(OTHI) or All Bond Index (ALBI).
Per other institution not includedin above categories, which isapproved by the Registrar.
Territories outside the Republic:
Per institution.
35.0%
10.0%
10.0%
10.0%
15.0%
10.0%3
3(a)
Immovable property and claimssecured by mortgage bondsthereon. Units in unit trustschemes in property shares andshares in, loans to anddebentures, both convertible andnon-convertible, of propertycompanies:
Inside the Republic 10.0%

Guideline for the preparation of standard management accounts
Page 21 of 25
Annexure Bitem
Category or kinds of asset Description Marketvalue(R)
% Marketvalue
Maximum % of aggregate fair value ofliabilities and the minimum accumulated
funds to be maintained in terms ofRegulation 29
Comment(i.e. compliant/Non-compliant.If non-compliantstate reasons).
3(a)(i)
3(b)
Per single property, propertycompany or developmentproject.
Territories outside the Republic.
2.5%
0.0%4
4(a)
4(a)(i)
4(a)(ii)
Preference and ordinary sharesin companies excluding shares inproperty companies. Convertibledebentures, whether voluntary orcompulsory convertible,exchange traded funds, units inequity unit trust schemes withthe objective to invest mainly inshares and linked policies ofinsurance with the proceeds andvalue determined by theperformance of an underlyingequity portfolio.
Inside the Republic:
Unlisted shares, unlisteddebentures and shares andconvertible debentures listed inthe Development Capital andVenture Capital sectors of theJSE Securities Exchange.
Shares and convertibles listed onthe JSE Securities exchange
40.0%
2.5%

Guideline for the preparation of standard management accounts
Page 22 of 25
Annexure Bitem
Category or kinds of asset Description Marketvalue(R)
% Marketvalue
Maximum % of aggregate fair value ofliabilities and the minimum accumulated
funds to be maintained in terms ofRegulation 29
Comment(i.e. compliant/Non-compliant.If non-compliantstate reasons).
4(a)(ii)(i)
(4)(a)(ii)(ii)
4(a)(ii)(iii)
4(a)(iii)
4(a)(iii)(i)
4(a)(iii)(ii)
4(a)(iv)
other than in the DevelopmentCapital and Venture Capitalsectors:
Per company with a marketcapitalisation of more thanR50 billion.
Per company with a marketcapitalisation of betweenR5 billion and R50 billion.
Per company with a marketcapitalisation of less thanR5 billion.
Exchange traded funds tradedExchange traded funds tradedon the JSE Securities Exchange:Per fund with diversified holdingsacross the component sectors ofthe JSE Securities Exchange.
Per fund with holdings focused insubsectors of the JSE SecuritiesExchange.
Units in equity unit trusts orpooled equity managed funds:
7.5%
5.0%
2.5%
20.0%
10.0%
Guideline for the preparation of standard management accounts
Page 23 of 25
Annexure Bitem
Category or kinds of asset Description Marketvalue(R)
% Marketvalue
Maximum % of aggregate fair value ofliabilities and the minimum accumulated
funds to be maintained in terms ofRegulation 29
Comment(i.e. compliant/Non-compliant.If non-compliantstate reasons).
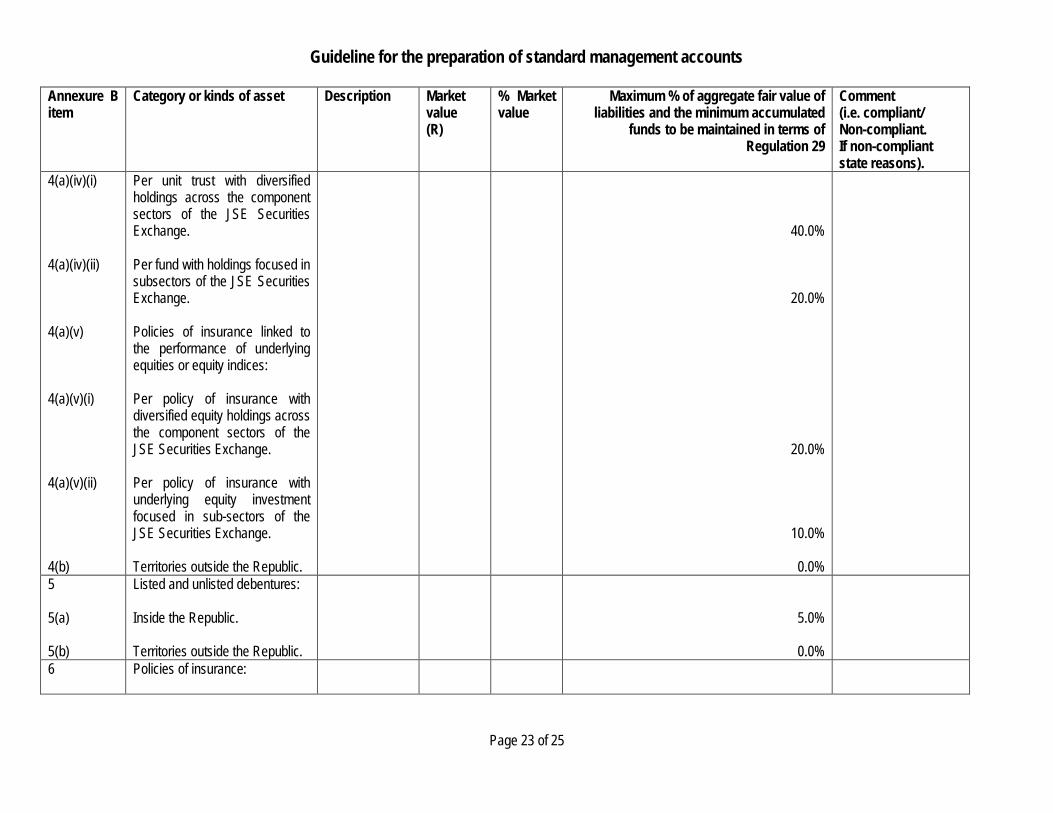
4(a)(iv)(i)
4(a)(iv)(ii)
4(a)(v)
4(a)(v)(i)
4(a)(v)(ii)
4(b)
Per unit trust with diversifiedholdings across the componentsectors of the JSE SecuritiesExchange.
Per fund with holdings focused insubsectors of the JSE SecuritiesExchange.
Policies of insurance linked tothe performance of underlyingequities or equity indices:
Per policy of insurance withdiversified equity holdings acrossthe component sectors of theJSE Securities Exchange.
Per policy of insurance withunderlying equity investmentfocused in sub-sectors of theJSE Securities Exchange.
Territories outside the Republic.
40.0%
20.0%
20.0%
10.0%
0.0%5
5(a)
5(b)
Listed and unlisted debentures:
Inside the Republic.
Territories outside the Republic.
5.0%
0.0%6 Policies of insurance:

Guideline for the preparation of standard management accounts
Page 24 of 25
Annexure Bitem
Category or kinds of asset Description Marketvalue(R)
% Marketvalue
Maximum % of aggregate fair value ofliabilities and the minimum accumulated
funds to be maintained in terms ofRegulation 29
Comment(i.e. compliant/Non-compliant.If non-compliantstate reasons).
6(a)
6(a)(i)
6(a)(ii)
6(b)
Insurers registered in theRepublic:
Per registered insurer where thepolicy proceeds are not directlylinked to the market value of theunderlying assets.
Per registered insurer where thepolicy proceeds are directlylinked to the market value of theunderlying assets and theunderlying assets are invested ina balanced manner across theasset classes and categoriesstipulated in sections 1-7 above– complying with all the statedmaxima and minima.
Insurers registered in territoriesoutside of the Republic.
90.0%
35.0%
90.0%
0.0%7
7(a)
7(a)(i)
7(a)(ii)
Any other assets not referred toelsewhere:
Inside the Republic:
Where inventories are included,inclusion at the smaller of bookand realisable value.
Other.
2.5%
2.5%
2.5%

Guideline for the preparation of standard management accounts
Page 25 of 25
Annexure Bitem
Category or kinds of asset Description Marketvalue(R)
% Marketvalue
Maximum % of aggregate fair value ofliabilities and the minimum accumulated
funds to be maintained in terms ofRegulation 29
Comment(i.e. compliant/Non-compliant.If non-compliantstate reasons).
7(b) Territories outside the Republic. 0.0%
Explanatory notes and conditions for Annexure B:
· In respect of items 1(a) (i) and 1(a) (ii), for banks that are subsidiaries of foreign banks, the foreign parent’s capital may not be taken into account.· The sum of deposits in categories 1(a) (i) and 1(a) (ii) shall not be less than 20%;· Total amounts in categories 1(b) and 2(b) are subject to an aggregate maximum of 15%;· The aggregate of amounts in categories 1(a) (ii), 2(a) (xii) and 2(a) (xiii) shall be subject to a maximum limit of 30%;· The total exposure allowance per bank, being the aggregate of amounts included in categories 1(a) (i) and 2(a) (xi) is subject to an aggregate maximum of 35%;· The total exposure allowance per bank, being the aggregate of amounts included in categories 1(a) (ii) and 2(a) (xii) is subject to an aggregate maximum of 10%;· The total exposure allowance for all banks within categories 1(a) (ii) and 2(a) (xii) is subject to an aggregate maximum of 30%;· Unit trusts and policies of insurance may not be utilised to circumvent the limitations of these regulations. Medical schemes are required to demonstrate on a “look through”
basis that such avenues have not been utilised to bypass the limitations imposed by Annexure B.


![Research Data Management Knowledge Graphs for · 1/23/2020 · [10] Prof. Dr. Harald Sack: Knowledge Graphs for Research Data Management, QPTDat Workshop 2020, Karlsruhe, 23. January](https://img.pdfslide.us/doc/110x75/5ecc23df6cc030231e63c1e9/research-data-management-knowledge-graphs-for-1232020-10-prof-dr-harald.jpg)