Embed Size (px)
Citation preview
1
Guidelines on the use of the GAHI Map Web App: Soil-transmitted
helminths and Schistosomiasis
Introduction
The GAHI Map Web App: Soil-transmitted helminths and Schistosomiasis web map
application collates our epidemiological data into a single, freely available resource to
describe the changing distribution of Soil-transmitted helminths (STH) and
schistosomes.
This web map application makes available school and community survey data on the STH
and schistosomiasis assembled by the Global Atlas of Helminth Infection. Combined and
species-specific prevalence data can be visualised as points at a site-level, as well as
aggregated to the second administrative level, typically defined as a district. Also
provided are the environmental limits for the distribution of STH,1 and the predicted
proportion of households using improved sanitation and drinking-water source at the
district level.2
Users can make maps at regional, national and local levels, filter survey data by
characteristics (such as year of survey), tailor the map layouts and print them in different
formats.
These distributions provide more than simple cartographic interest. They can be used help
tailor intervention strategies towards the dominant intestinal helminth species, and can
contribute to investigation of the impact of scaling up of interventions. Analysis of
historical infection risk prior to large-scale intervention can help identify factors that may
contribute to the persistence of transmission and provide a basis to stratify surveillance
activities.
Note: Only data publicly available or data shared by authors without releasing restriction
is displayed. We will be releasing more data as authors provide permission.
Funtions
Using this web map application, the users will be able to:
• Visualise environmental limits for the distribution of STH at global scale, modelled
based on environmental and demographics characteristics1.
1 Pullan R, Brooker SJ. (2012). The global limits and population at risk of soil-transmitted helminth infections in
2010. Parasite & Vectors 26;5:81
2 Pullan RL, Freeman MC, Gething PW, Brooker SJ (2014) Geographical Inequalities in Use of Improved Drinking
Water Supply and Sanitation across Sub-Saharan Africa: Mapping and Spatial Analysis of Cross-sectional Survey Data. PLoS Med 11(4): e1001626
2
• Display school and community surveys available in the Global Atlas of Helminth
Infection database and obtain details for publicly available surveys.
• View combined STH prevalence and highest observed schistosomiasis prevalence for
each survey site.
• View site-level species breakdowns for STH, and form of infection (i.e. intestinal
and genitourinary) for schistosomiasis.
• Display district-level average prevalence of schistosomiasis and STH for those
districts with sufficient data – defined as at least 5 surveys with a minimum of
250 individuals (in total) conducted within a 2-year period.
• Filter surveys according to key characteristics (e.g. location, type of survey,
diagnostic method, year) and download the result of the query as a CSV file.
• Display a range of water supply and sanitation coverage indicators by district for
sub-Saharan Africa in 2012, based on spatial modelling of population-based
household survey data.2
• Tailor map layouts and print them in different formats. A mask-out option is
available to produce country maps, hiding the surrounding countries. This will help
produce comprehensive and readable country maps.
Data
Survey data were identified through structured searches of electronic bibliographic
databases (PubMed, EMBASE, MEDLINE) using specified queries; for schistosomiasis,
Schistosomiasis OR bilharzia OR Schistosoma mansoni OR Schistosoma haematobium OR
Schistosoma intercalatum AND country name; and for STH infection, hookworm OR
ascariasis OR trichuriasis OR Necator americanus OR Ancyclostoma duodenale OR Ascaris
lumbricoides OR Trichuris trichiura OR intestinal parasites OR geohelminths OR soil-
transmitted helminths AND country name. This was complemented with manual searches
of local archives and libraries and direct contact with researchers.
Estimates of infection prevalence were included according to pre-defined criteria: only
cross-sectional prevalence surveys; data were excluded if based on hospital or clinic
surveys, post-intervention surveys, or surveys among sub-populations, such as among
refugees, prisoners or nomads. No restrictions were placed on sample size or diagnostic
method. The longitude and latitude of each survey were determined using a combination
of resources including national schools databases, village databases digitised from
topographical maps, a range of electronic gazetteers (Geonames, Fuzzy Gazetteer, Google
Earth) and contact with authors who used GPS. This methodology is a continuation of work
done by Brooker et al.3
The prevalence of infection with any STH species (i.e. combined prevalence of STH) was calculated using a simple probabilistic model of combined infection, incorporating a small correction factor to allow for non-independence between species, following the approach
3 Brooker S, Kabatereine NB, Smith JL, Mupfasoni D, et al. (2009) An updated atlas of human helminths infections: the
example of East Africa. Int J Health Geog, 8:42
3
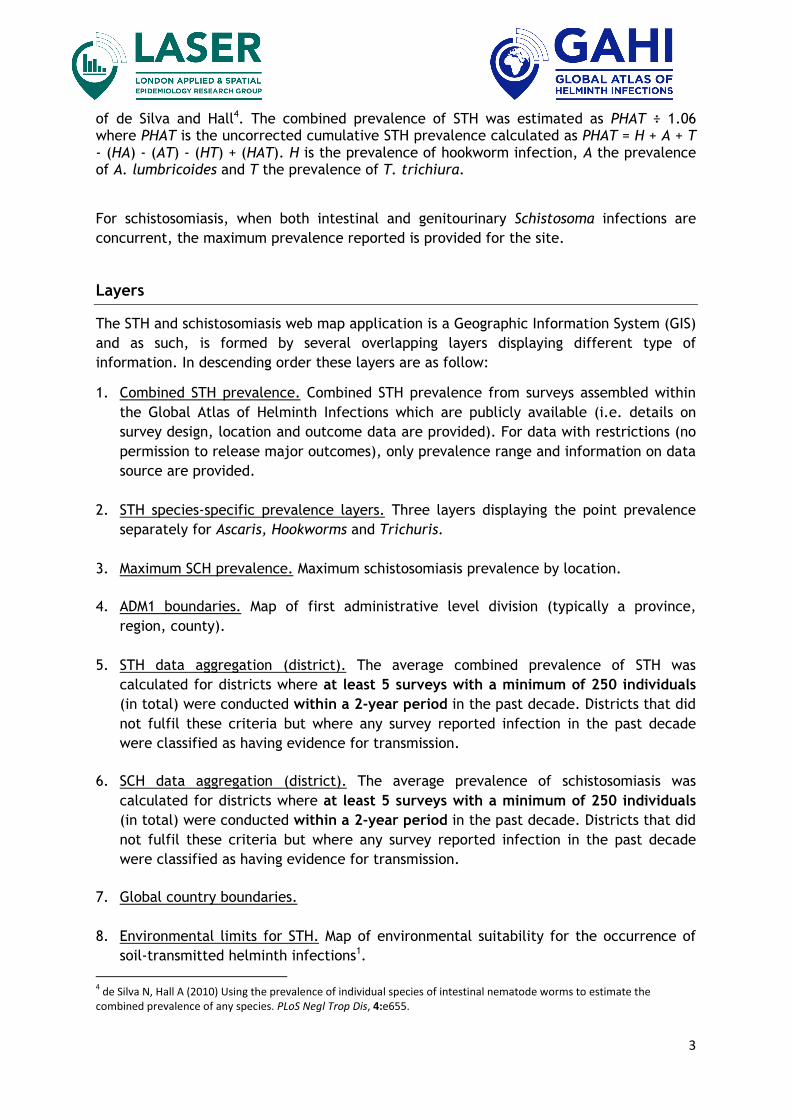
of de Silva and Hall4. The combined prevalence of STH was estimated as PHAT ÷ 1.06 where PHAT is the uncorrected cumulative STH prevalence calculated as PHAT = H + A + T - (HA) - (AT) - (HT) + (HAT). H is the prevalence of hookworm infection, A the prevalence of A. lumbricoides and T the prevalence of T. trichiura.
For schistosomiasis, when both intestinal and genitourinary Schistosoma infections are
concurrent, the maximum prevalence reported is provided for the site.
Layers
The STH and schistosomiasis web map application is a Geographic Information System (GIS)
and as such, is formed by several overlapping layers displaying different type of
information. In descending order these layers are as follow:
1. Combined STH prevalence. Combined STH prevalence from surveys assembled within
the Global Atlas of Helminth Infections which are publicly available (i.e. details on
survey design, location and outcome data are provided). For data with restrictions (no
permission to release major outcomes), only prevalence range and information on data
source are provided.
2. STH species-specific prevalence layers. Three layers displaying the point prevalence
separately for Ascaris, Hookworms and Trichuris.
3. Maximum SCH prevalence. Maximum schistosomiasis prevalence by location.
4. ADM1 boundaries. Map of first administrative level division (typically a province,
region, county).
5. STH data aggregation (district). The average combined prevalence of STH was
calculated for districts where at least 5 surveys with a minimum of 250 individuals
(in total) were conducted within a 2-year period in the past decade. Districts that did
not fulfil these criteria but where any survey reported infection in the past decade
were classified as having evidence for transmission.
6. SCH data aggregation (district). The average prevalence of schistosomiasis was
calculated for districts where at least 5 surveys with a minimum of 250 individuals
(in total) were conducted within a 2-year period in the past decade. Districts that did
not fulfil these criteria but where any survey reported infection in the past decade
were classified as having evidence for transmission.
7. Global country boundaries.
8. Environmental limits for STH. Map of environmental suitability for the occurrence of
soil-transmitted helminth infections1.
4 de Silva N, Hall A (2010) Using the prevalence of individual species of intestinal nematode worms to estimate the
combined prevalence of any species. PLoS Negl Trop Dis, 4:e655.
4
9. Safe drinking water. Maps show the predicted proportion of households with access to
an improved drinking-water source. This is defined as one that is protected from
outside faecal contamination: piped water, standpipes, tubewells, borewells,
protected dug wells, protected springs and rainwater.
10. Adequate sanitation. Maps show the predicted proportion of households with access to
an improved sanitation facility. This is defined as one that hygienically separates
excreta from human contact: flush toilets, piped sewer systems, septic tanks,
ventilated improved pit latrines, pit latrines with a slab and composting toilets. This
metric includes households that share access to an improved facility.
11. Open defecation. Maps show the predicted proportion of households who report
habitually defecating in the open, and have no access to an improved or unimproved
sanitation facility.
Finally, a Country layer has been provided to hide those countries which the user does not want to
be displayed in their map layouts. It must be used along with the Masking out by country widget
(see below).
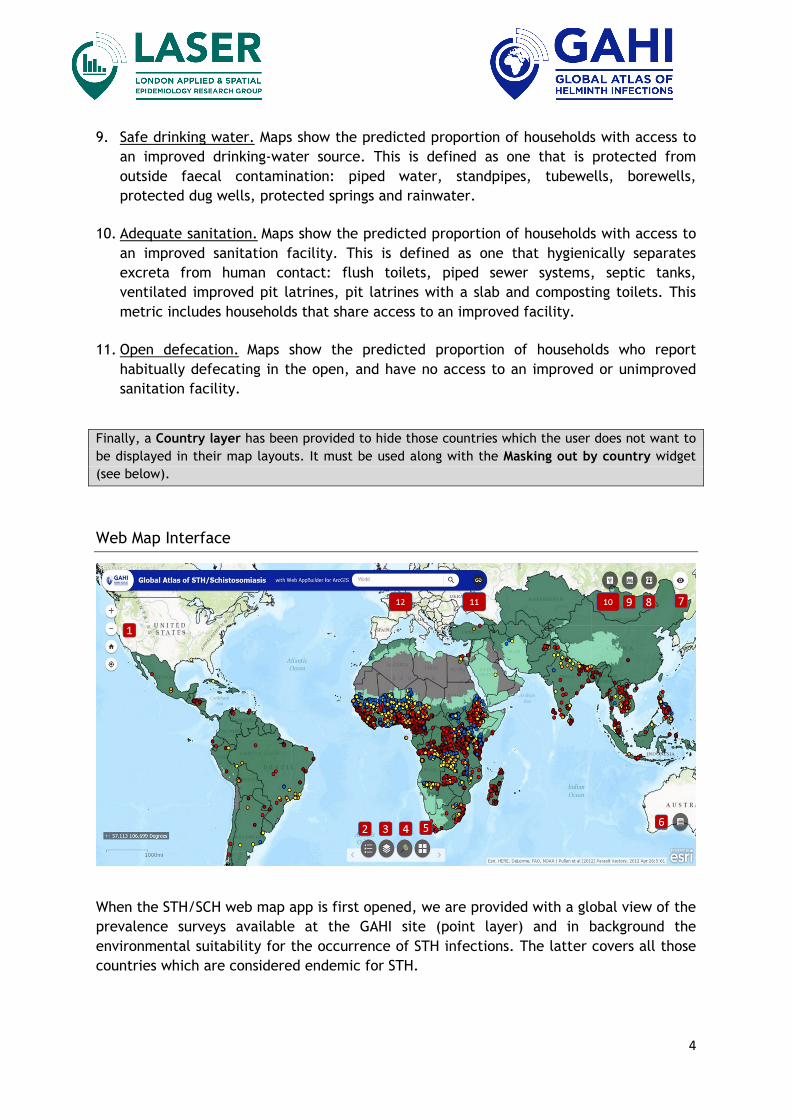
Web Map Interface
When the STH/SCH web map app is first opened, we are provided with a global view of the
prevalence surveys available at the GAHI site (point layer) and in background the
environmental suitability for the occurrence of STH infections. The latter covers all those
countries which are considered endemic for STH.
5
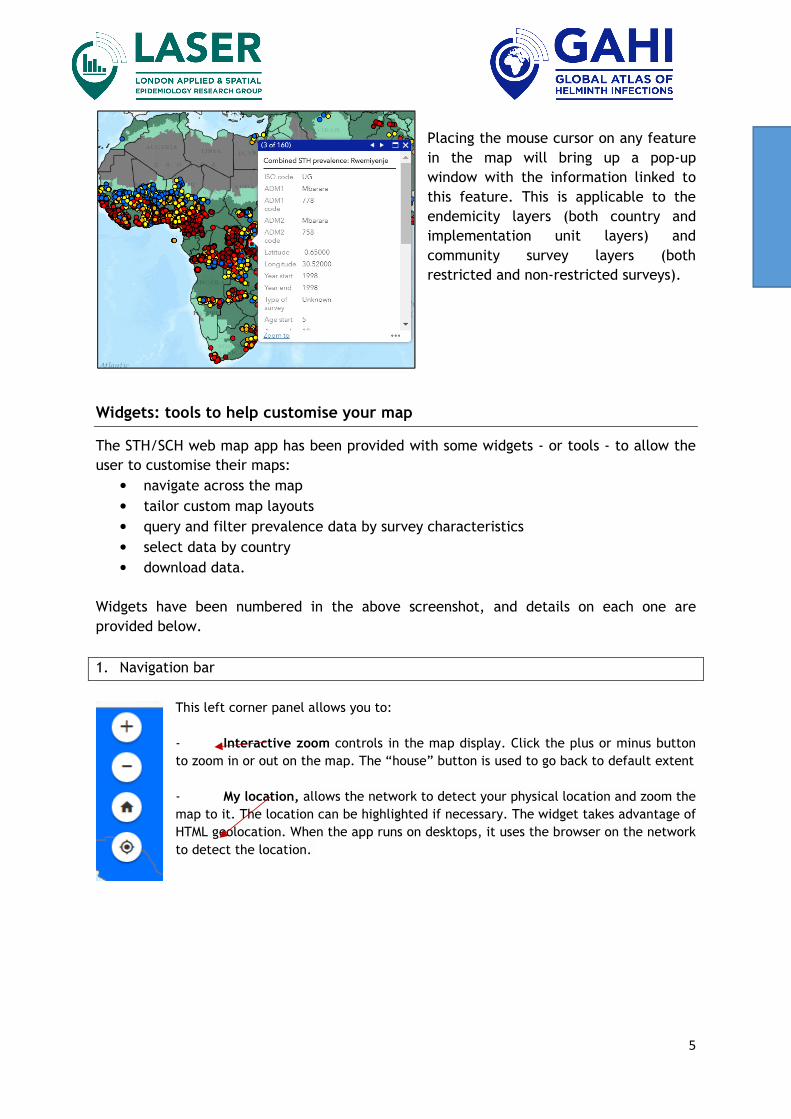
Placing the mouse cursor on any feature
in the map will bring up a pop-up
window with the information linked to
this feature. This is applicable to the
endemicity layers (both country and
implementation unit layers) and
community survey layers (both
restricted and non-restricted surveys).
Widgets: tools to help customise your map
The STH/SCH web map app has been provided with some widgets - or tools - to allow the
user to customise their maps:
• navigate across the map
• tailor custom map layouts
• query and filter prevalence data by survey characteristics
• select data by country
• download data.
Widgets have been numbered in the above screenshot, and details on each one are
provided below.
1. Navigation bar
This left corner panel allows you to:
- Interactive zoom controls in the map display. Click the plus or minus button
to zoom in or out on the map. The “house” button is used to go back to default extent
- My location, allows the network to detect your physical location and zoom the
map to it. The location can be highlighted if necessary. The widget takes advantage of
HTML geolocation. When the app runs on desktops, it uses the browser on the network
to detect the location.
6
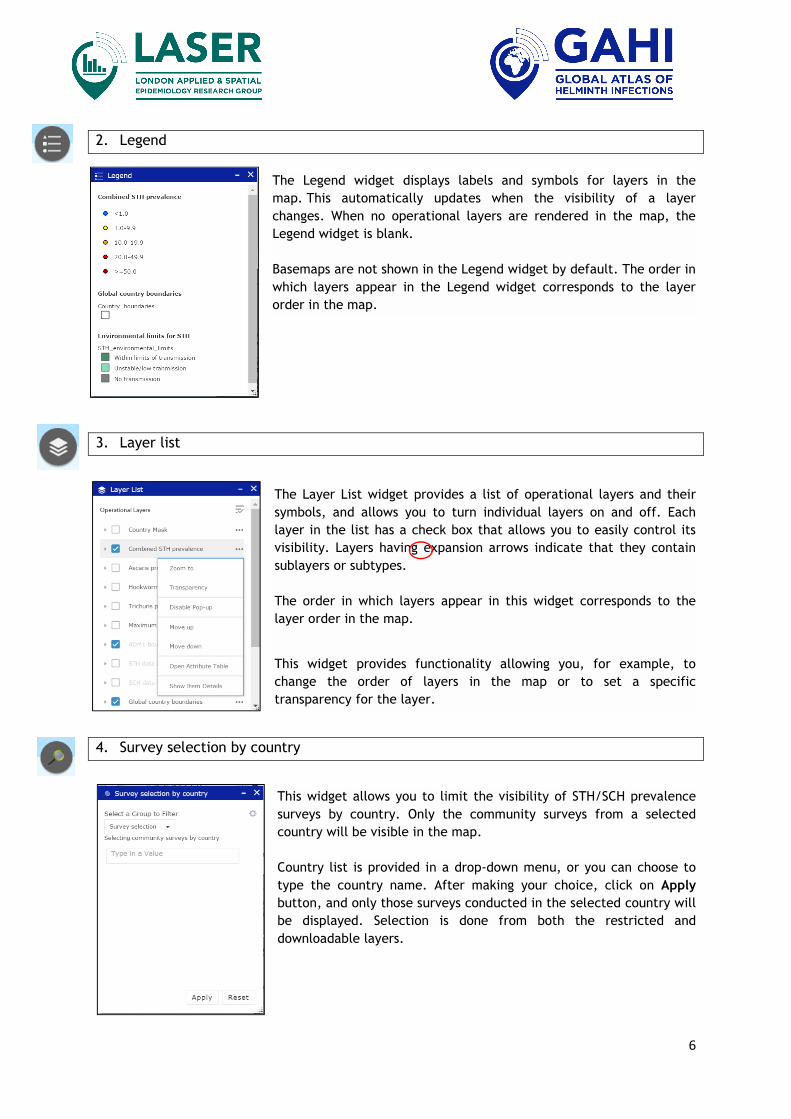
2. Legend
The Legend widget displays labels and symbols for layers in the
map. This automatically updates when the visibility of a layer
changes. When no operational layers are rendered in the map, the
Legend widget is blank.
Basemaps are not shown in the Legend widget by default. The order in
which layers appear in the Legend widget corresponds to the layer
order in the map.
3. Layer list
The Layer List widget provides a list of operational layers and their
symbols, and allows you to turn individual layers on and off. Each
layer in the list has a check box that allows you to easily control its
visibility. Layers having expansion arrows indicate that they contain
sublayers or subtypes.
The order in which layers appear in this widget corresponds to the
layer order in the map.
This widget provides functionality allowing you, for example, to
change the order of layers in the map or to set a specific
transparency for the layer.
4. Survey selection by country
This widget allows you to limit the visibility of STH/SCH prevalence
surveys by country. Only the community surveys from a selected
country will be visible in the map.
Country list is provided in a drop-down menu, or you can choose to
type the country name. After making your choice, click on Apply
button, and only those surveys conducted in the selected country will
be displayed. Selection is done from both the restricted and
downloadable layers.
7
If you want this selection to persist after widget is closed, tick on the corresponding option
available under the icon, at the right top corner. You can also choose to save the selection
settings, which can be used later.
Click Reset to undo the selection.
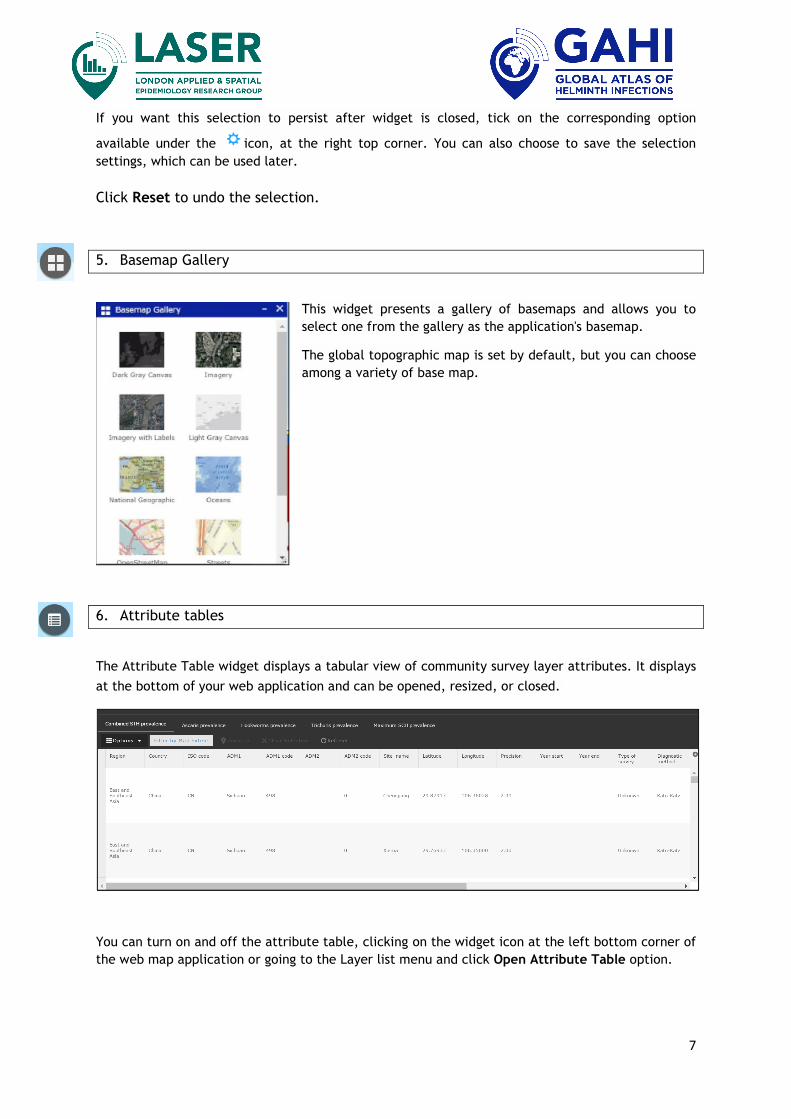
5. Basemap Gallery
This widget presents a gallery of basemaps and allows you to
select one from the gallery as the application's basemap.
The global topographic map is set by default, but you can choose
among a variety of base map.
6. Attribute tables
The Attribute Table widget displays a tabular view of community survey layer attributes. It displays
at the bottom of your web application and can be opened, resized, or closed.
You can turn on and off the attribute table, clicking on the widget icon at the left bottom corner of
the web map application or going to the Layer list menu and click Open Attribute Table option.
8
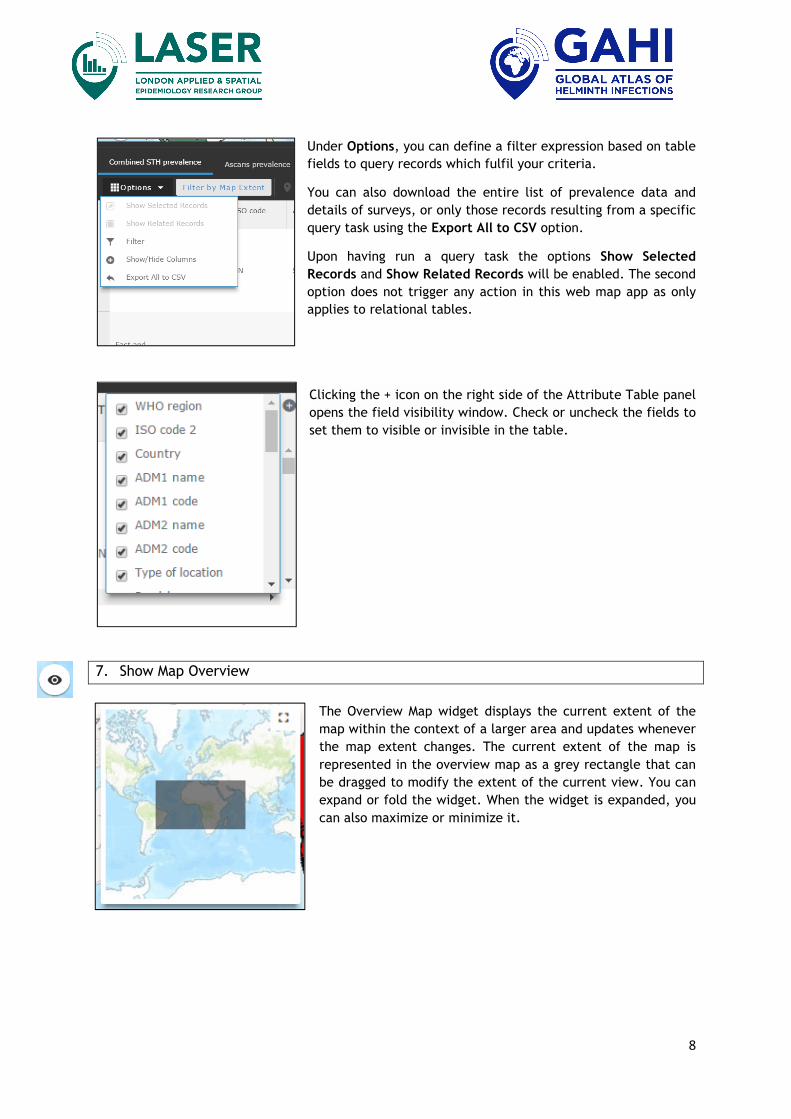
Under Options, you can define a filter expression based on table
fields to query records which fulfil your criteria.
You can also download the entire list of prevalence data and
details of surveys, or only those records resulting from a specific
query task using the Export All to CSV option.
Upon having run a query task the options Show Selected
Records and Show Related Records will be enabled. The second
option does not trigger any action in this web map app as only
applies to relational tables.
Clicking the + icon on the right side of the Attribute Table panel
opens the field visibility window. Check or uncheck the fields to
set them to visible or invisible in the table.
7. Show Map Overview
The Overview Map widget displays the current extent of the
map within the context of a larger area and updates whenever
the map extent changes. The current extent of the map is
represented in the overview map as a grey rectangle that can
be dragged to modify the extent of the current view. You can
expand or fold the widget. When the widget is expanded, you
can also maximize or minimize it.
9
8. About
A brief explanation of the purpose of the Global Atlas of Lymphatic Filariasis is provided
together with some helpful references for some of the data provided in the web map app.
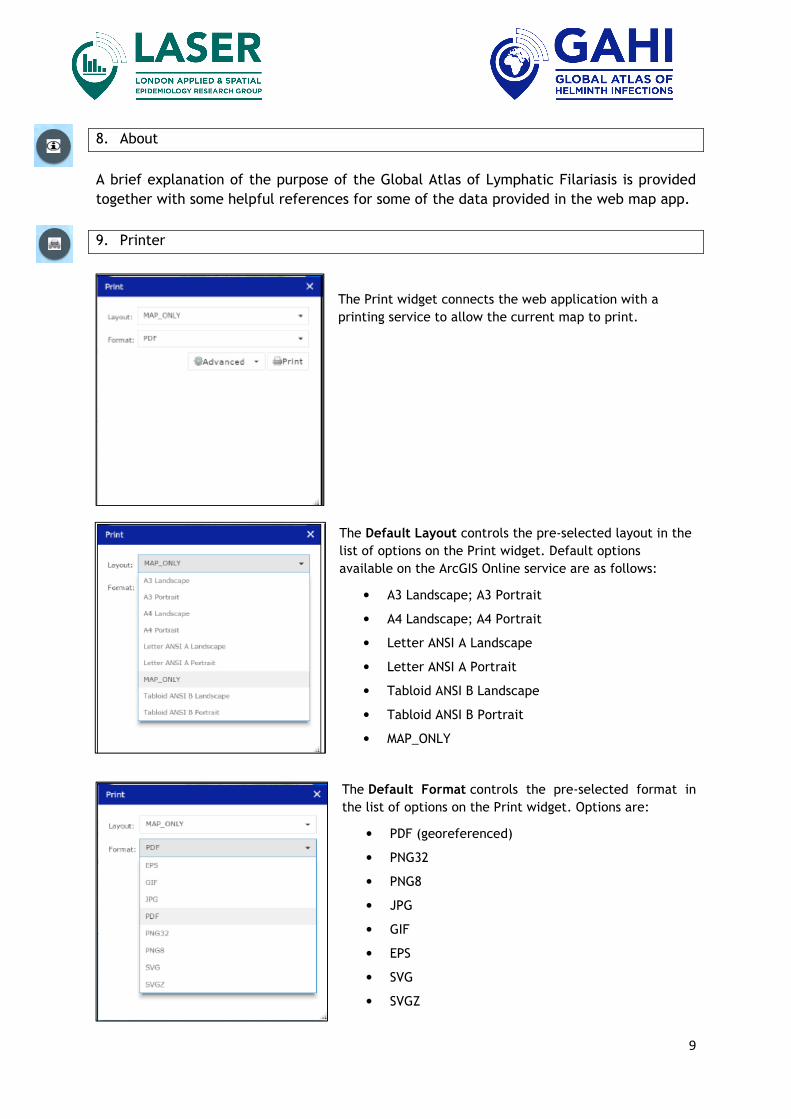
9. Printer
The Print widget connects the web application with a
printing service to allow the current map to print.
The Default Layout controls the pre-selected layout in the
list of options on the Print widget. Default options
available on the ArcGIS Online service are as follows:
• A3 Landscape; A3 Portrait
• A4 Landscape; A4 Portrait
• Letter ANSI A Landscape
• Letter ANSI A Portrait
• Tabloid ANSI B Landscape
• Tabloid ANSI B Portrait
• MAP_ONLY
The Default Format controls the pre-selected format in
the list of options on the Print widget. Options are:
• PDF (georeferenced)
• PNG32
• PNG8
• JPG
• GIF
• EPS
• SVG
• SVGZ
10
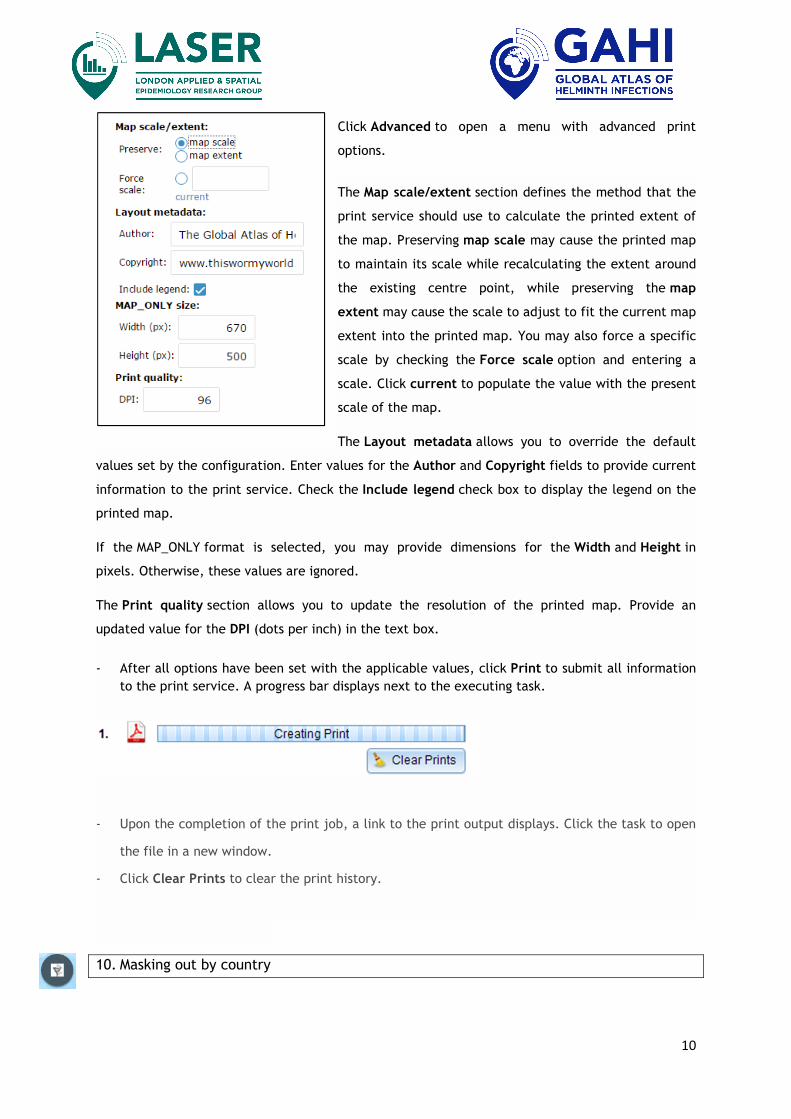
Click Advanced to open a menu with advanced print
options.
The Map scale/extent section defines the method that the
print service should use to calculate the printed extent of
the map. Preserving map scale may cause the printed map
to maintain its scale while recalculating the extent around
the existing centre point, while preserving the map
extent may cause the scale to adjust to fit the current map
extent into the printed map. You may also force a specific
scale by checking the Force scale option and entering a
scale. Click current to populate the value with the present
scale of the map.
The Layout metadata allows you to override the default
values set by the configuration. Enter values for the Author and Copyright fields to provide current
information to the print service. Check the Include legend check box to display the legend on the
printed map.
If the MAP_ONLY format is selected, you may provide dimensions for the Width and Height in
pixels. Otherwise, these values are ignored.
The Print quality section allows you to update the resolution of the printed map. Provide an
updated value for the DPI (dots per inch) in the text box.
- After all options have been set with the applicable values, click Print to submit all information
to the print service. A progress bar displays next to the executing task.
- Upon the completion of the print job, a link to the print output displays. Click the task to open
the file in a new window.
- Click Clear Prints to clear the print history.
10. Masking out by country
11
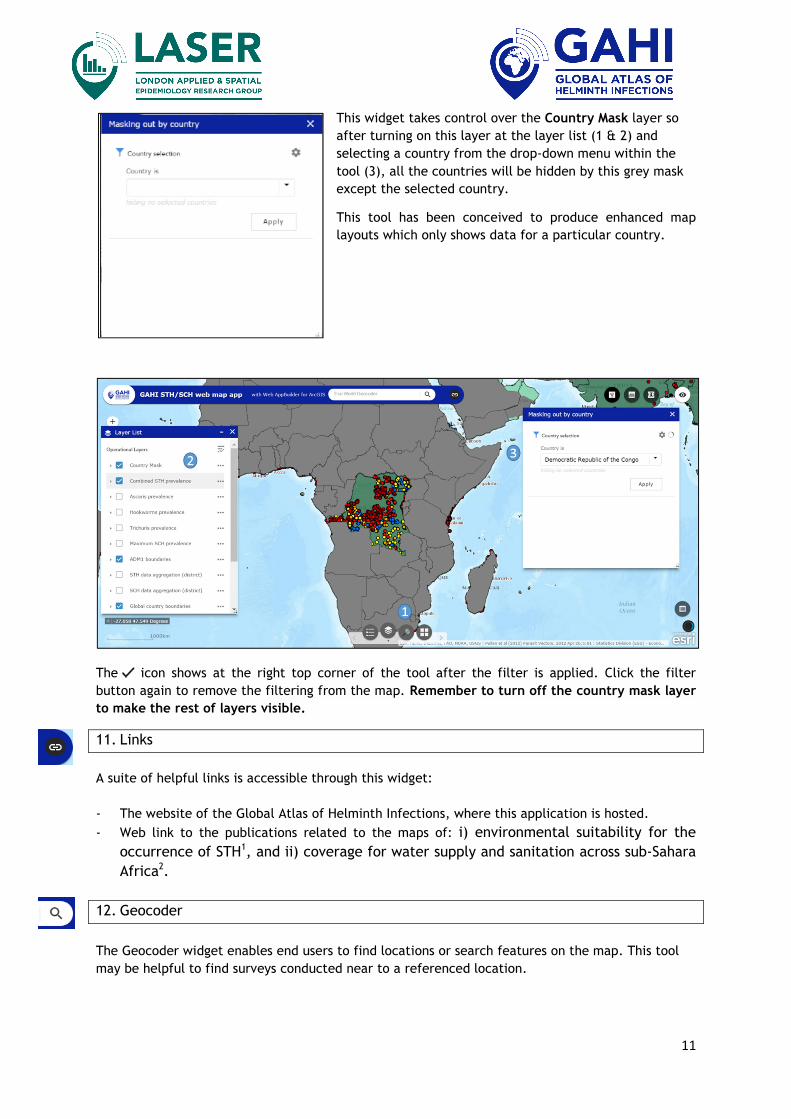
This widget takes control over the Country Mask layer so
after turning on this layer at the layer list (1 & 2) and
selecting a country from the drop-down menu within the
tool (3), all the countries will be hidden by this grey mask
except the selected country.
This tool has been conceived to produce enhanced map
layouts which only shows data for a particular country.
The icon shows at the right top corner of the tool after the filter is applied. Click the filter
button again to remove the filtering from the map. Remember to turn off the country mask layer
to make the rest of layers visible.
11. Links
A suite of helpful links is accessible through this widget:
- The website of the Global Atlas of Helminth Infections, where this application is hosted.
- Web link to the publications related to the maps of: i) environmental suitability for the
occurrence of STH1, and ii) coverage for water supply and sanitation across sub-Sahara
Africa2.
12. Geocoder
The Geocoder widget enables end users to find locations or search features on the map. This tool
may be helpful to find surveys conducted near to a referenced location.