Embed Size (px)
Citation preview
1
Guidelines on How to Complete the Modified CIF Template for Voting Manufacturers
INTENDED AUDIENCE This document provides guidance and instructions on how to complete a modified version of ISO/IEC 25062:2006, the Common Industry Format (CIF) usability test report. This modified version of the CIF has been specifically tailored for voting manufacturers and is intended to be used by voting manufacturers’ usability test administrator(s) and data logger(s).
The CIF was originally designed to provide a consistent format for reporting the results of usability testing and to provide a sufficient amount of detail about a usability test so future testing teams could recreate the test, capturing data in the exact same fashion. The guidance and instructions contained in this document is to enable voting manufacturers to effectively communicate the results of usability testing.
In addition to this document, a template based on the modified CIF format has also been created to assist usability test administrator(s) and data logger(s) in developing a usability report that will meet the guidance set forth in this document.
INTENDED PURPOSE OF THIS DOCUMENT The guidance included in this document has been prepared to help voting manufacturers meet the Voluntary Voting System Guidelines (VVSG) developed by the Technical Guidelines Development Committee (TGDC).
These guidelines require that voting manufactures conduct summative usability testing with:
Voters from the general population (Section 3.2.1.2)
Voters who need alternative languages (Section 3.2.7-A.4)
Voters with low vision (Section 3.3.2-A)
Voters who are blind (Section 3.3.3-A)
Voters with dexterity disabilities (Section 3.3.4-A)
Poll Workers (Section 3.2.8.1-B)
NOTE: This guideline is an example of the study conducted with voters from the general population (Section 3.2.1.2). It must be tailored to report the results of the studies for other participant groups.
2
The VVSG requires that “manufacturers conduct summative usability testing on the voting system using individuals who are representative” of the population being tested and that results shall be reported using the Common Industry Format (CIF).1
STRUCTURE OF THIS DOCUMENT
The purpose of this document is to provide guidance and instructions on how to complete a modified version of the CIF, and meet the requirements set forth in the VVSG.
This document includes guidance and instructions for each section of the modified CIF (and any related subsections), including:
1.0 Executive Summary
2.0 Introduction
3.0 Method
4.0 Results
5.0 Conclusion
6.0 Appendices
In addition to these sections, the modified CIF includes a title page and several appendices. A sample title page has been included in the modified CIF template.
HOW TO USE THIS DOCUMENT This document is based on ISO/IEC 25062:2006 Common Industry Format (CIF), a format used to report the results of summative usability testing. Before using this document, you must become familiar with this standard. ISO/IEC 25062:2006 can be purchased from: http://www.iso.org/iso/iso_catalogue/catalogue_tc/catalogue_detail.htm?csnumber=43046.
It is important to note that the numbering format included in this document is identical to the numbering used in the Modified CIF Template for Voting Manufacturers.
When completing the modified CIF template, it is highly recommended that voting manufacturers, their usability test administrator(s) and their data logger(s) refer to the corresponding sections in this document for instructions and guidance.
1 Voluntary Voting System Guidelines Recommendations to the Election Assistance Commission, Aug. 2007
3
TABLE OF CONTENTS
1.0 Executive Summary ................................................................................................................................ 4
2.0 Introduction ........................................................................................................................................... 6
2.1 Full Product Description .................................................................................................................................. 6
2.2 Test Objectives ................................................................................................................................................ 7
3.0 Method .................................................................................................................................................. 9
3.1 Participants ...................................................................................................................................................... 9
3.2 Context of Use in the Test ............................................................................................................................. 11
3.2.1 Tasks .................................................................................................................................................... 11
3.2.2 Test Location ....................................................................................................................................... 13
3.2.3 Voting Environment ............................................................................................................................. 14
3.2.4 Test Administrator Tools ..................................................................................................................... 17
3.3 Experimental Design ...................................................................................................................................... 18
3.3.1 Procedure ............................................................................................................................................ 18
3.3.2 Participant General Instructions .......................................................................................................... 20
3.3.3 Participant Task Instructions ............................................................................................................... 20
3.4 Usability Metrics ............................................................................................................................................ 21
3.4.1 Effectiveness ........................................................................................................................................ 21
3.4.2 Efficiency .............................................................................................................................................. 24
3.4.3 Satisfaction ........................................................................................................................................... 24
4.0 Results .................................................................................................................................................. 26
4.1 Data Analysis.................................................................................................................................................. 26
4.2 Presentation of the Results ........................................................................................................................... 28
4.2.1 Performance Results ........................................................................................................................... 29
4.2.2 Satisfaction Results .............................................................................................................................. 29
5.0 Conclusion............................................................................................................................................ 30
6.0 Appendices .......................................................................................................................................... 31
Appendix A: Participant Demographics ............................................................................................................... 31
Appendix B: Informed Consent............................................................................................................................ 32
Appendix C: Instructions for Participants ............................................................................................................ 32
Appendix D: Ballot Contests For Voters .............................................................................................................. 33
Appendix E: Training Materials For Poll Workers ................................................................................................ 33
Appendix F: Performance Results ........................................................................................................................ 33
Appendix G: Post Test Satisfaction Questionnaire .............................................................................................. 34

4
1.0 EXECUTIVE SUMMARY The executive summary of the usability test report shall be a high-level overview of the test conducted, while providing enough information to adequately describe the methodology used and the results discovered.
The executive summary shall include key information about the test logistics, including:
Date test was conducted
Location of usability test (including a brief description of the location)
Purpose of the usability test
Voting system tested (including version number, class structure, a brief description of how the system works and how users interact with the system to cast a vote)
Name of organization, test administrator(s) and data logger(s) who conducted the test (including a brief summary of each individual’s qualifications)
The executive summary shall provide details about the usability test and its goals, including:
Number of participants tested (including a short description about the types of users recruited and tested)
Number of tasks tested (including an overview of the types of tasks included and how the tasks were selected)
Summary of the usability test methodology used
Goals of the study and specific test objectives
The executive summary shall provide a high-level overview of the usability test results, including:
The types of metrics captured
How the results were analyzed
List of key results, presented in an easy-to-read format
5
GUIDANCE AND TIPS
The executive summary provides a quick overview of the usability test and provides information on all of the key findings. It is important that the executive summary provides a quick glimpse of the usability test in no more than three pages.
This section may also include a summary of the top usability findings and recommendations for improvement (although the CIF does not specifically require that findings and recommendations be included in the report).
– If included, findings and recommendations should be presented in order of importance and criticality. Findings and recommendations may also be categorized by short-term and long-term improvements.
– If findings and recommendations are included in the report, it is important to only provide high-level findings and recommendations in the executive summary, as more detailed findings and recommendations should appear later in the report.
6
2.0 INTRODUCTION The introduction shall provide an overview of the product and version tested, including how it works, as well as information about the goals and objectives of this specific usability test.
This section should also indicate whether the version tested is the same version that will be provided to the Voting System Test Laboratory (VSTL) for usability testing. If not, this report shall also include the full version number (or timestamp) of the voting system provided to the VSTL and describe any differences between the system tested by the manufacturer and the version to be tested by the test laboratory.
2.1 FULL PRODUCT DESCRIPTION
The product description shall include:
Full product identification of the voting system, including version number or timestamp. If a different version number is submitted to the laboratory for usability testing, this report should describe the differences between the versions.
Voting classes (See the Voluntary Voting System Guidelines, Aug. 2007)
High-level description of how the product works.
In addition, this section should adequately describe which features of the system were included in the usability testing. Since a usability test is not a full evaluation of an entire product and all of a system’s features, it is important to indicate which aspects of a system were included in the usability test.
The report shall:
Specify which features of the voting system were included in the testing
Explain how the test administrator(s) chose the aspects which were evaluated
Detail whether features for alternative languages, features for low-vision or blind voters, or features that assist voters with dexterity disabilities were included in the test.
7
GUIDANCE AND TIPS
It is essential to include the version number (or other identifying information) of the product so that it is easy to identify which system the test was performed on.
Photos of the system can serve as a record of what the product looked like at the time of testing. Not only do these artifacts help to illustrate the product, they also serve as a point-in-time reference so that it is possible to compare design changes over time.
It is also important to note how you chose the features to be included in the usability test. It is usually a good idea to test the features of the product that are most frequently used or areas that have known usability problems (or are susceptible to usability issues).
2.2 TEST OBJECTIVES
This section of the report helps to clarify the purpose of the usability test and the goals of the evaluation. The test objectives focus on explicit research questions or specific features of the voting system.
This section shall include information on:
The purpose of the usability test and the overarching goals of the evaluation
The specific test objectives which may be focused on particular features of the voting system or areas of interest
Research questions that the study was intended to answer
If the test objectives focus on a specific feature or a subset of tasks for the voting system, provide a rationale for this decision. Detail the functions and components of the voting system that the user directly interacted with and how these components were selected to be included in the usability testing.
8
GUIDANCE AND TIPS
When designing a voting system, it is critical to define usability objectives for the system in the initial stages so that system designers can make decisions about the product with these goals in mind. During usability testing, it is important to revisit these design objectives to evaluate the success with which they have been achieved.
It can also be helpful to develop a list of research questions when planning the test. Each research question will likely focus on one element of a system, i.e. visual interface. A research question may be: Will voters’ performance be affected by the location of a candidate’s name in a list (i.e. will voters be more likely to find the correct name if the name appears at the top of the list as opposed to the middle or bottom of the list).
Once a solid set of research questions have been developed, the usability test should be designed and conducted in such a way to answer these research questions. By including a list of research questions or test objectives, the readers of the report will have a better understanding of the decisions made to support your test methodology.
When defining your test goals, prioritize the tasks that can be included in the usability test, so that you can thoroughly test each scenario.
When selecting the tasks to include in your usability test consider selecting tasks that are frequently performed, or tasks that you think are vulnerable to usability issues.
When outlining the test objectives, consider how each objective will be measured and how data will be used to answer your research questions.
9
3.0 METHOD The method section shall provide details on the usability test, including the number and types of participants tested, the types of tasks included in the usability test, the test location, the test procedure, participant instructions, and the metrics recorded during the usability test. This section provides a comprehensive description of the test method and that is sufficiently descriptive so that another individual or organization could use this information to reproduce the exact same study.
3.1 PARTICIPANTS
List the number and types of participants included in your usability test. It is important to ensure that the users recruited are a representative sample of the voting population. This section shall include:
Total number of participants tested
Types of user groups tested:
o Voters from the general population
o Voters who need alternative languages
o Voters with low vision
o Voters who are blind
o Voters with dexterity disabilities
o Poll workers
Key characteristics and demographics of the participants. This information can be expressed in a table, a bulleted list or even in a graph/chart
Once you have adequately described the voters / poll workers who participated in the usability test, it is important to note how these users were selected. Be sure to describe your recruiting strategies and detail any compensation given to participants. You may want to answer the following questions:
How were the voters / poll workers selected? What was your recruiting strategy to find test participants matching your target profile? If there were differences between the users you were trying to recruit and the users who participated in the actual study, be sure to note this as well.
Were the users provided compensation for their participation and time?
10
GUIDANCE AND TIPS
Test administrator(s) shall recruit at least eight test participants within each user group, including at least eight general voters, eight voters with low vision, eight blind voters, eight voters with dexterity disabilities, eight voters who need alternate languages and eight poll workers. Using fewer than eight participants makes it difficult to ascertain issues with the product because of the variability between subjects.
Although a minimum of eight participants is required, it is strongly suggested that test administrator(s) consider testing with larger numbers of voters / poll workers in order to gather additional data to support the study’s conclusions. For greater statistical analysis, studies with 30 or more users are recommended. Note that Voting System Test Laboratory will use 100 participants as required by experimental design to ensure sufficient amount of data for more complex data analyses.
Not only is it important to recruit a sufficient sample size, but it is also crucial to recruit a representative a sample as possible. Test administrator(s) are encouraged to recruit a mix of voters and a mix of poll workers including users of different ages, genders, levels of education, ethnicity, voting experience, geography, etc. Test administrator(s) may also choose to recruit a sample similar to the samples that will be used during the conformance testing.
Ensure that this section provides a high-level overview of the number and types of participants tested. Detailed tables of participant demographics should be included as an appendix to the test report.
11
3.2 CONTEXT OF USE IN THE TEST
The context of use section shall describe the environment in which the voting system was evaluated. It shall describe the tasks tested, the testing location, and the specific types of equipment used during the testing. Lastly, it shall describe any test administrator tools that were used to help facilitate or conduct the usability testing.
3.2.1 TASKS
The section on tasks shall specify the number and types of tasks tested. It should also specify how these tasks were selected and why they were included in this usability test.
It is important to provide readers of this report with a thorough understanding of what was included in the test, such as:
Number of tasks tested
Description of the tasks used, including information about voter tasks and poll worker tasks
Rationale for how these tasks were selected
Once the tasks that were included in the usability test have been descibed, it is important to describe the scenarios given to users. Scenarios are short stories that usability specialists write to describe a task to a test participant. The scenario may also give the user instructions (such as which candidate to vote for in a specific election). For this section of the report, include:
A list of the scenarios provided to test participants
A list of instructions given to the participants, such as directions on who to vote for (for voters) or training materials (for poll workers)
Next, explain how each task/scenario was evaluated. Describe the performance metrics captured and analyzed for each scenario, for example:
Successful completion criteria established for each task
Time to complete each task
Number of errors made by task
And any additional performance metrics that were captured
12
Guidance and Tips
Be sure to prioritize the tasks selected as part of your usability test. (Consider including critical tasks or tasks that may reveal usability issues with the system). Ensure that you define metrics to measure the success of each task or group of tasks.
Typical tasks for voters may include:
– Selecting a pre-determined name from a list of candidates
– Selecting a name from the top, middle, or bottom of the list
– Selecting a name from X party or Y party
– Submitting a vote for a “write-in” candidate
– Reviewing and voting on short, simple amendments
– Reviewing and voting on long, complex amendments
Be sure to customize the tasks for the voters you will be testing with. For instance, the tasks may differ slightly for a voter who needs an alternate language (for this group, you may need to include a task that asks voters to select language preferences at the beginning of the test). In addition, tasks or instructions may need to be tailored for voters with dexterity disabilities, voters with low vision, or blind voters.
Typical tasks for poll workers shall include:
– Setup, which includes all the steps necessary to take the system from its state as normally delivered to the polling place, to the state in which it is ready to record votes
– Operation, which includes such functions as: preparing the system for the next voter; providing assistance to voters who wish to change their ballots or need other help; helping the system to recover in the case of voters who abandon the voting session without having cast a ballot; and routine maintenance operations, such as installing a new roll of paper
13
3.2.2 TEST LOCATION
This section shall describe the test location in sufficient detail so that those reading the report not only understand the environment in which the voting system was tested in, but in enough detail that the test could be repeated in a similar environment. The section shall include a description of the location.
The following list is just a sample of some of the details that may be reported about the test location and is not intended to be a comprehensive list:
Type of building used for testing
Number and set-up of polling stations
Type of lighting and temperature settings
In addition to a detailed description of the environment, this section should include any aspects of the location that could have an impact on the test results.
Guidance and Tips
The location used for testing should closely resemble that of a typical polling location.
Pictures of the testing location should be included in the test report to help document the physical aspects of the testing location.
– Shutdown, which includes all the steps necessary to take the system from the state in which it is ready to record votes to its normal completed state in which it has captured all the votes cast.
The poll worker usability test may also include a test of the documentation and manuals used by poll workers to learn how to use and manage the system. This information can then be subsequently used to improve the usability of poll worker documentation.
14
3.2.3 VOTING SYSTEM TESTING ENVIRONMENT
This section shall describe the voting system used, including:
Description of the voting system (if not already included in the ‘Product Description’ section of this report)
List of any additional part of the system equipment used in the testing environment
This section shall also include photos of the system to help document the system’s state at the time of testing.
3.2.3.1 DISPLAY DEVICES
This section shall describe the display devices used in the testing.
The following list is just a sample of the types of display devices that may be used and is not intended to be a comprehensive list of display devices:
If a paper ballot is used, include a copy of the ballot in an appendix of this report
If an electronic display is used, describe the display and specify any user-controlled settings. In addition, a copy of the electronic ballot shall be provided in an appendix of this report
When testing voters who need alternative languages, voters with dexterity disabilities, voters with low vision or blind voters, note the settings of the voting system, if not the default settings
When testing with poll workers, be sure to include a description of any training documentation or instructional guides provided to users. These materials should also be included in an appendix of this report
Include a description of any other type of display device, including settings of the display, used during testing
15
3.2.3.2 AUDIO
This section shall describe any audio heard or used by voters during the usability testing.
The following list is just a sample of the types of audio devices that may be used and is not intended to be a comprehensive list of audio devices:
When testing voters with low vision or blind voters, indicate how sound or audio is used. Include notes on what information is communicated to voters, including a description of instructions, warnings and error messages, and contest choices
If headphones are used, please describe the headphones here
If voters were allowed to adjust volume controls, note that here and list the volume settings used during testing
If voters were allowed to pause or replay the audio, please list the controls that voters were allowed to use to activate and manage the audio
Include a description of any other type of audio, including audio settings, used during testing
3.2.3.3 INPUT DEVICES
This section shall describe any input devices that were used during the usability test, including assistive technology devices to accommodate voters with disabilities.
The following list is just a sample of the types of input devices that may be used and is not intended to be a comprehensive list of input devices:
Describe any input devices used during the usability test.
16
GUIDANCE AND TIPS
Readers of this report should have a clear understanding of the voting system used and the state of that system. Using photos can be a helpful way to document and illustrate the system and the testing environment.
When conducting the usability test, it is recommended that the testing team try to control the differences between the voting systems so that the effect of user-controlled items can be measured. By keeping the state of the voting systems as similar as possible across users, voting manufacturers will have a better understanding of the design decisions that affect voting performance.
17
3.2.4 TEST ADMINISTRATOR TOOLS
This section shall describe the tools used to conduct the usability test. a
The following list is just a sample of the types of test administrators tools that may be used and is not intended to be a comprehensive list:
Forms for informed consent and non-disclosure
Voter profile questionnaire
Pre-test questionnaire
Facilitator’s guide
Participants’ scenarios
Voting instructions
Data collection materials
Post-test questionnaire
Voter satisfaction questionnaire
Compensation receipt and acknowledgment form
Not only should this section document all of the materials used in testing, it should also describe any additional data logging tools used to record the data, including items such as a stopwatch, video camera, digital camera, logging software or other tools used during the usability test.
GUIDANCE AND TIPS
Describe each of the test administrator tools, and how they were used.
Include each of the materials used during testing as an appendix so as to provide enough information that the test could be re-created at a later date.
18
3.3 EXPERIMENTAL DESIGN
The section on experimental design shall describe the test design, including the test procedures, instructions given to voters, and the usability metrics.
3.3.1 PROCEDURE
The procedure section on tasks shall document the usability testing procedure and shall provide the sequence of events that occurred during the usability test, from the greeting of the voter or poll worker to dismissing the participant.
This section shall also document the make-up of the usability testing team, including the usability test administrator(s) and data logger(s), including their roles, responsibilities, and procedures for their interactions with the voters or poll workers during the usability test. This section shall include:
Number of individuals conducting the test and the roles of each individual
Protocol for interaction between the participant and the usability test administrator(s) and data logger(s)
Describe the sequence of events that occurred during testing. Be sure to include all of the steps that occurred during testing, taking care to reference how the test administrator tools (described above) were used and noting when voters or poll workers were given instructions by the usability test administrator(s) or data logger(s).
The next section will provide information on the instructions given to participants; this section should simply note at what stage in the process the instructions were provided.
The sequence of events is intended to enable the VSTL to understand the procedures of the usability test conducted.
The following list is just a sample of the types of procedures that may be followed and is not intended to be a comprehensive list:
Describe the procedure for greeting the participant
Specify when participants were asked to review and sign any informed consent or non-disclosure forms. Include a copy of any consent forms used in an appendix of this report
19
Indicate that voters and poll workers were informed of their rights during the test (including the right to leave at any time) and that the test participants understood these instructions
Describe the instructions given to participants to explain how the usability test would be conducted and to reassure voters that the usability test was a test of the voting system, not a test of voters’ abilities. If a formal moderator guide or script was developed, include a copy in an appendix to this report
If voters were given any “warm-up” or “practice” tasks/scenarios, be sure to detail this information here. Include a copy of the tasks given to users in an appendix to this report
If poll workers were given any pre-task training, be sure to detail this information here. Include a copy of any training materials given to poll workers in an appendix of this report
State how the tasks were administered to voters and poll workers and whether time limits on tasks were imposed
Detail any post-test procedures, including a de-brief interview or any post-test satisfaction questionnaires. Include a copy of the interview guides and post-test questionnaires in an appendix of this report
Specify whether voters and poll workers were paid for their participation, and if so, indicate the amount and form of that compensation here
GUIDANCE AND TIPS
This section is a step-by-step description of what happened during the usability test and the roles that each member of the testing team played.
This section need not provide copies of the test administrator tools. Include these tools in an appendix.
This section need not include the instructions given to participants. This information is specified in the next section.
20
3.3.2 PARTICIPANT GENERAL INSTRUCTIONS
This section shall include:
Instructions given to voters or poll workers. If brief, the instructions may be included here or included in an appendix
Instructions on how voters or poll workers were to interact with any the test administrator(s) and data logger(s), including how they were instructed to ask for assistance and indicate that they were finished with the usability tasks provided to them
GUIDANCE AND TIPS
This section is critical, as it is important that each voter category and poll worker have the same settings during the usability testing. By standardizing the instructions provided to participants, it ensures that the each participant receives the same guidance during the usability test.
3.3.3 PARTICIPANT TASK INSTRUCTIONS
This section shall include:
List of instructions given to participants to help them complete a task. This includes any instructions given to voters to select a particular candidate for each task
Description of how the instructions were administered and when they were administered during the usability testing process. If brief, the instructions may be included here or included in an appendix
21
3.4 USABILITY METRICS
This section shall detail the types of usability metrics captured and shall specifically describe the metrics used to measure voters’ or poll workers effectiveness, efficiency, and satisfaction with the voting system.
3.4.1 EFFECTIVENESS
This section shall describe the metrics used to measure the effectiveness of the voting system and may include measures such as completion rate, number of errors, and number of assists.
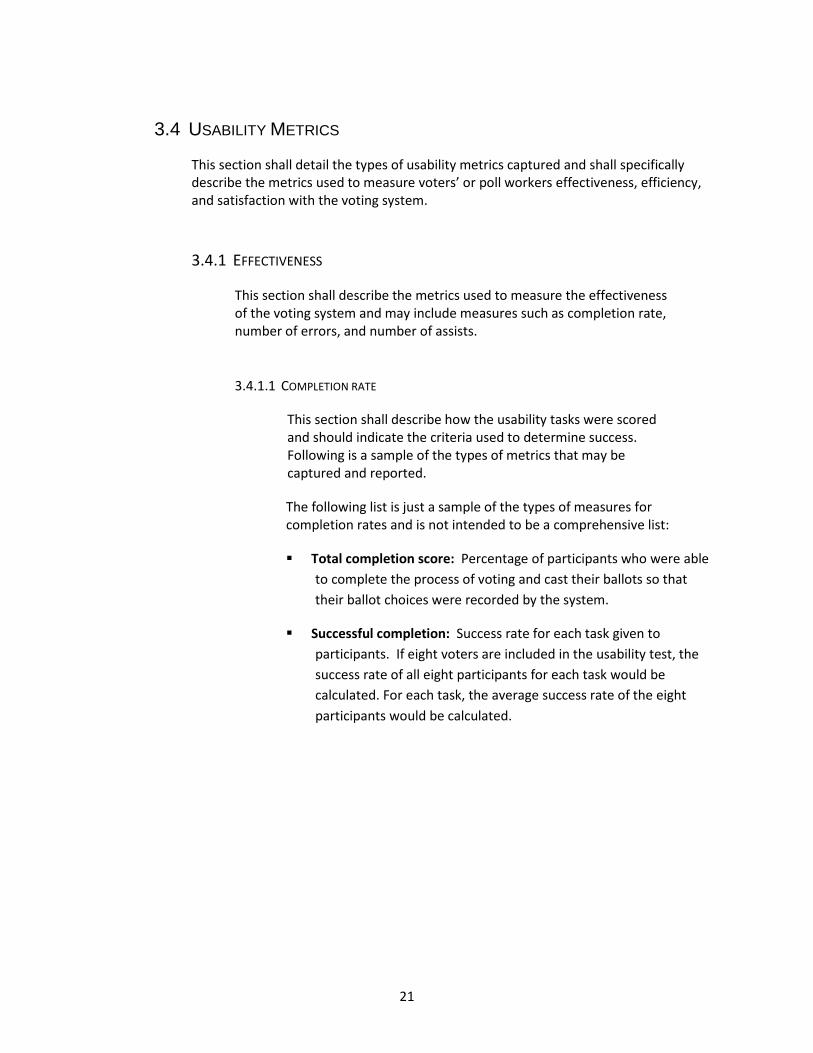
3.4.1.1 COMPLETION RATE
This section shall describe how the usability tasks were scored and should indicate the criteria used to determine success. Following is a sample of the types of metrics that may be captured and reported.
The following list is just a sample of the types of measures for completion rates and is not intended to be a comprehensive list:
Total completion score: Percentage of participants who were able to complete the process of voting and cast their ballots so that their ballot choices were recorded by the system.
Successful completion: Success rate for each task given to participants. If eight voters are included in the usability test, the success rate of all eight participants for each task would be calculated. For each task, the average success rate of the eight participants would be calculated.
22
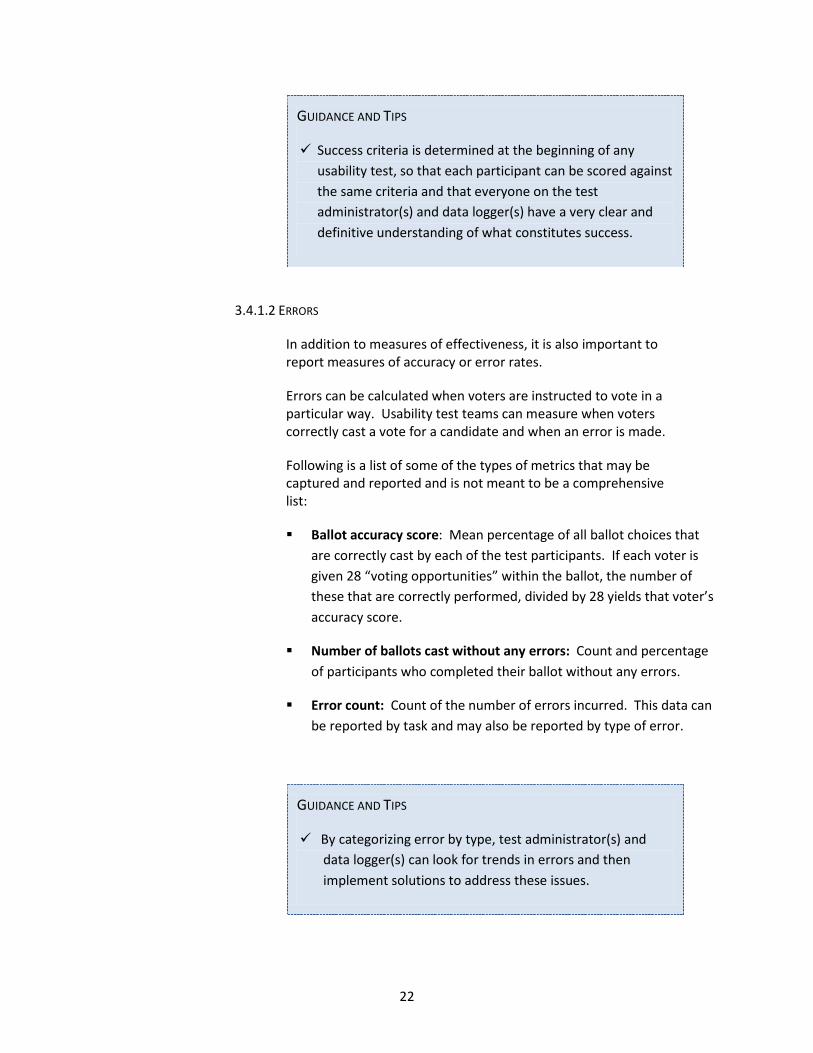
GUIDANCE AND TIPS
Success criteria is determined at the beginning of any usability test, so that each participant can be scored against the same criteria and that everyone on the test administrator(s) and data logger(s) have a very clear and definitive understanding of what constitutes success.
3.4.1.2 ERRORS
In addition to measures of effectiveness, it is also important to report measures of accuracy or error rates.
Errors can be calculated when voters are instructed to vote in a particular way. Usability test teams can measure when voters correctly cast a vote for a candidate and when an error is made.
Following is a list of some of the types of metrics that may be captured and reported and is not meant to be a comprehensive list:
Ballot accuracy score: Mean percentage of all ballot choices that are correctly cast by each of the test participants. If each voter is given 28 “voting opportunities” within the ballot, the number of these that are correctly performed, divided by 28 yields that voter’s accuracy score.
Number of ballots cast without any errors: Count and percentage of participants who completed their ballot without any errors.
Error count: Count of the number of errors incurred. This data can be reported by task and may also be reported by type of error.
GUIDANCE AND TIPS
By categorizing error by type, test administrator(s) and data logger(s) can look for trends in errors and then implement solutions to address these issues.
23
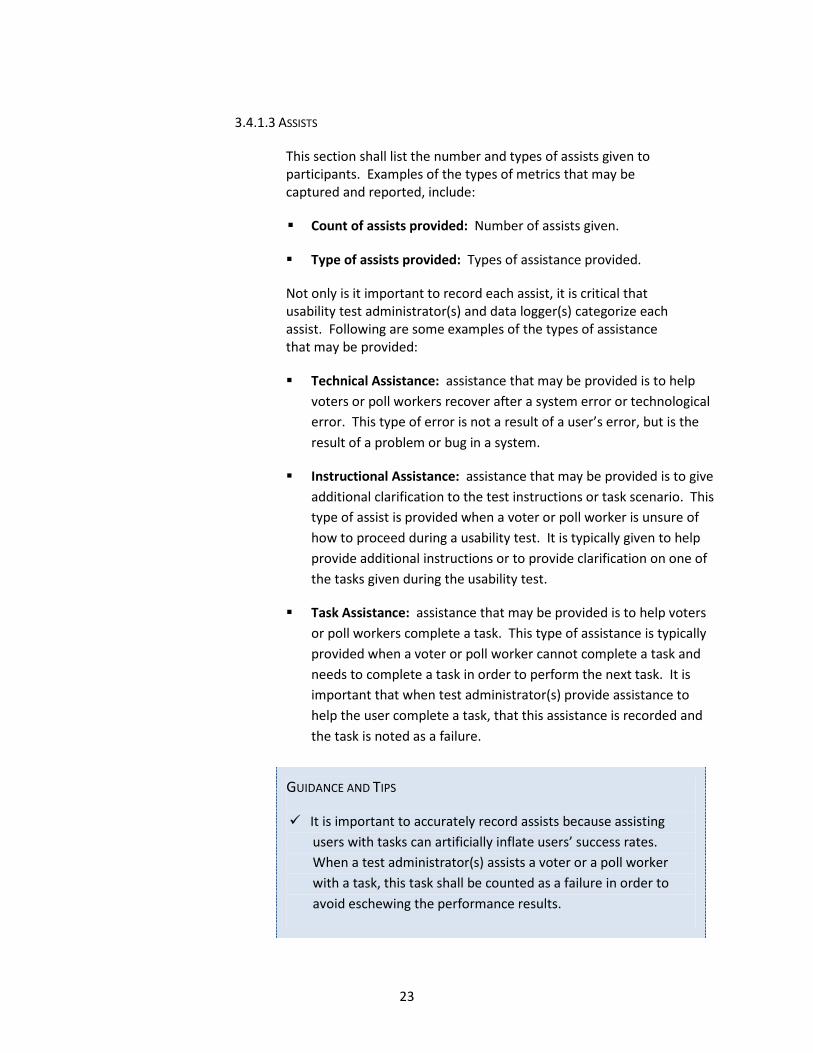
3.4.1.3 ASSISTS
This section shall list the number and types of assists given to participants. Examples of the types of metrics that may be captured and reported, include:
Count of assists provided: Number of assists given.
Type of assists provided: Types of assistance provided.
Not only is it important to record each assist, it is critical that usability test administrator(s) and data logger(s) categorize each assist. Following are some examples of the types of assistance that may be provided:
Technical Assistance: assistance that may be provided is to help voters or poll workers recover after a system error or technological error. This type of error is not a result of a user’s error, but is the result of a problem or bug in a system.
Instructional Assistance: assistance that may be provided is to give additional clarification to the test instructions or task scenario. This type of assist is provided when a voter or poll worker is unsure of how to proceed during a usability test. It is typically given to help provide additional instructions or to provide clarification on one of the tasks given during the usability test.
Task Assistance: assistance that may be provided is to help voters or poll workers complete a task. This type of assistance is typically provided when a voter or poll worker cannot complete a task and needs to complete a task in order to perform the next task. It is important that when test administrator(s) provide assistance to help the user complete a task, that this assistance is recorded and the task is noted as a failure.
GUIDANCE AND TIPS
It is important to accurately record assists because assisting users with tasks can artificially inflate users’ success rates. When a test administrator(s) assists a voter or a poll worker with a task, this task shall be counted as a failure in order to avoid eschewing the performance results.
24
3.4.2 EFFICIENCY
This section shall describe the metrics used to measure the efficiency of the voting system and may include measures such as average completion time and mean time on task.
3.4.2.1 TIME-ON-TASK
This section shall list any measures that were used to record the time on task.
The following list is just a sample of the types of time-on-task measures that may be used and is not intended to be a comprehensive list:
Average session time: Mean time taken per test participant to complete the process of activating, filing out and casting the ballot.
3.4.3 SATISFACTION
This section shall describe the metrics used to evaluate voters’ or poll workers’ satisfaction and confidence with the voting system.
3.4.2.1 SATISFACTION RATING
This section shall list any measures that were used to measure voter or poll worker satisfaction.
The following list is just a sample of the types of satisfaction ratings that may be used and is not intended to be a comprehensive list:
Satisfaction rating: Mean satisfaction rating of voters and poll workers for the voting system.
Voter confidence rating: Mean confidence level expressed by voters that they believed they voted correctly and the system successfully recorded their votes.
Post-test comments: Comments made by voters and poll workers regarding their overall satisfaction with the system. The comments may be reported for a series of questions asked during a post-test debriefing. This information may be reported with verbatim comments, or a summary of the types of comments provided may be included.
25
GUIDANCE AND TIPS
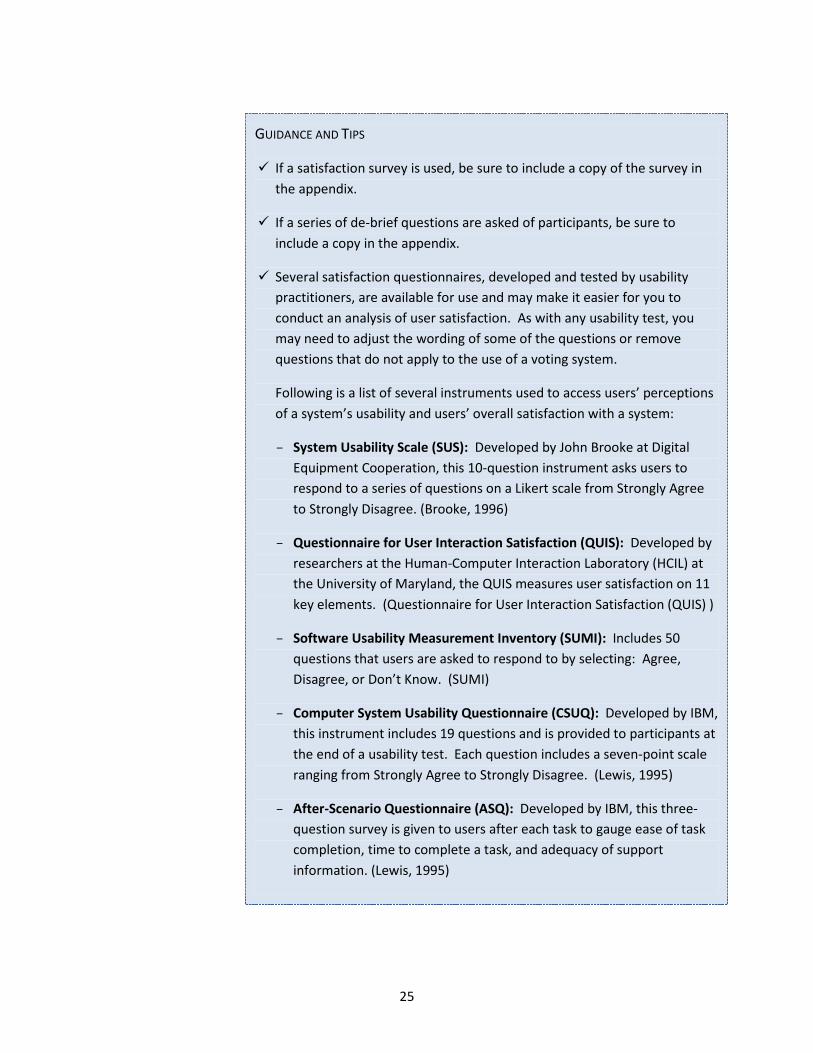
If a satisfaction survey is used, be sure to include a copy of the survey in the appendix.
If a series of de-brief questions are asked of participants, be sure to include a copy in the appendix.
Several satisfaction questionnaires, developed and tested by usability practitioners, are available for use and may make it easier for you to conduct an analysis of user satisfaction. As with any usability test, you may need to adjust the wording of some of the questions or remove questions that do not apply to the use of a voting system.
Following is a list of several instruments used to access users’ perceptions of a system’s usability and users’ overall satisfaction with a system:
– System Usability Scale (SUS): Developed by John Brooke at Digital Equipment Cooperation, this 10-question instrument asks users to respond to a series of questions on a Likert scale from Strongly Agree to Strongly Disagree. (Brooke, 1996)
– Questionnaire for User Interaction Satisfaction (QUIS): Developed by researchers at the Human-Computer Interaction Laboratory (HCIL) at the University of Maryland, the QUIS measures user satisfaction on 11 key elements. (Questionnaire for User Interaction Satisfaction (QUIS) )
– Software Usability Measurement Inventory (SUMI): Includes 50 questions that users are asked to respond to by selecting: Agree, Disagree, or Don’t Know. (SUMI)
– Computer System Usability Questionnaire (CSUQ): Developed by IBM, this instrument includes 19 questions and is provided to participants at the end of a usability test. Each question includes a seven-point scale ranging from Strongly Agree to Strongly Disagree. (Lewis, 1995)
– After-Scenario Questionnaire (ASQ): Developed by IBM, this three-question survey is given to users after each task to gauge ease of task completion, time to complete a task, and adequacy of support information. (Lewis, 1995)
26
4.0 Results
4.1 DATA ANALYSIS
The following information shall be provided in sufficient detail to allow replication of the data analysis methods by another organization if the test is repeated. The following lists are just a sample of the types of items that may be reported and are not meant to be a comprehensive set of all details that may be reported about the data analysis.
Data collection: Differences between the data that was planned to be collected and the data that was actually collected. Detail how the data was collected:
o Were votes automatically recorded by the voting system or were they manually recorded by the test administrator(s) or data logger(s)?
o Was demographic and satisfaction data captured by paper and pencil or did voters and poll workers complete the questions on a computer or other online system?
o Was time data captured with a stopwatch and then entered into a spreadsheet (or other datalogging formats)?
o How were voters’ and poll workers’ open-ended comments recorded? Were they captured by audio / video equipment and later transcribed into verbatim comments? Were the comments simply noted by hand by the test facilitator during the post-test debrief?
Indicate if there were differences between the data that was collected and what was initially planned.
o How was missing data handled? If a voter “skipped” a vote, how was this recorded?
o If assists were provided to voters and poll workers by the test administrator(s) and data logger(s), how were these assists recorded? Were the number and type of assists captured?
o Were there voters and poll workers whose behaviors were not consistent with the rest of the test participants or could be considered outliers? If so, how was the data handled? How were outliers determined? Were any statistical tests run to confirm outliers?
This section is extremely important and will enable future testing teams to recreate the test, capturing data in the exact same fashion.
27
Data scoring: Mapping between the data values that were collected and the values
used in further testing, examples include:
o How were voters’ and poll workers’ errors categorized? Were errors coded when users voted for the wrong candidate? How many errors were possible per task? Were the errors categorized when the data was scored so that the test administrator(s) could analyze when the majority of errors occurred and what caused these errors?
o How were voters’ and poll workers’ open-ended comments scored? Were similar comments categorized into groups or ‘themes’?
o How were the satisfaction surveys scored? Was the data scored manually or by a testing tool?
o If ranges were used to collect demographic data, how do the ranges relate to the actual data (i.e. How do actual ages map to age ranges?)
When documenting how the data was scored, it is important to describe who was responsible for scoring the data and any safeguards that were put into place to ensure data was scored in a consistent manner (i.e. Did one person score the data while a second person reviewed the scores for accuracy and consistency?).
In addition, note any tools that were used to score the data. Did the test administrator(s) or data logger(s) use any scoring worksheets or standard categories when coding the data? If so, include a copy of these tools in an appendix to this report.
GUIDANCE AND TIPS
It is important to note how data was collected and then subsequently analyzed. This information will help the VSTL understand how data was scored when interpreting the results section of the usability report.
28
4.2 PRESENTATION OF THE RESULTS
This section shall detail the test results by task (or task group). The data shall be presented in tabular format and may be included as an appendix. The testing team will provide values for each task, including:
Completion rate
Errors
Assists
Time on task (if collected per task)
Satisfaction or confidence rating (if collected per task)
GUIDANCE AND TIPS
Since this information is presented by task with metrics for each individual user, this data may better suited for an appendix. It is up to the discretion of the voting manufacturer whether to include this information here or to place it at the end of the report in an appendix.
29
4.2.1 PERFORMANCE RESULTS
This section shall provide summary tables that characterize the measures of effectiveness and efficiency across all tasks and all users. This section may take the form of a data table and include graphs and charts to illustrate the data in a graphical presentation.
GUIDANCE AND TIPS
While summary tables allow the VSTL to easily review task data, graphs/charts can help to understand better the results of testing.
4.2.2 SATISFACTION RESULTS
This section shall provide summary tables of satisfaction and/or confidence data. This data may be presented in a summary table or in various graphs and charts that appropriately summarize the results of the satisfaction data.
GUIDANCE AND TIPS
While summary tables allow the VSTL to easily review task data, graphs/charts can help readers of this report to quickly understand the results of testing.
30
5.0 CONCLUSION This section may include a list of findings and recommendations (although not required). It may also include a list of next steps or plans for future usability testing.
GUIDANCE AND TIPS
This section can serve to provide a summary of the testing and the resulting findings (if you choose to report this information).
It may also be helpful to note if improvements have been made to the system as a result of the testing and whether these changes have been incorporated into the version begin submitted to the VSTL (again, this information is not required).
31
6.0 APPENDICES The usability report shall provide several appendices, including (but not limited to):
Participant demographics
Informed consent
Instructions for participants
Ballot contests
Poll worker training materials
Post-test satisfaction questionnaire
Results
6.1 APPENDIX A: PARTICIPANT DEMOGRAPHICS
Participant demographics shall be included as an appendix to the report in the form of a tabular summary of characteristics for each user.
This section may also include a brief summary of the voters and poll workers who participated in the usability test and may include various graphs and charts to summarize the data.
GUIDANCE AND TIPS
It is sometimes helpful to create a table or spreadsheet of voter or poll worker demographics and then copy and paste the information into the report.
In addition to a tabular summary, it can also be helpful to provide an overall summary of the voters and poll workers who participated in the usability study. By providing charts and graphs that summarize the user data, readers of the report can more easily understand the overall characteristics of the group of users tested.
32
6.2 APPENDIX B: INFORMED CONSENT
Provide a copy of the informed consent and any additional non-disclosure or release forms provided to voters and poll workers during the usability test.
The Informed Consent shall inform participants of their rights during the study and describe how the data will be collected and used, especially with regard to personally identifiable information. In addition, users may be asked to sign a Non-Disclosure Agreement in an effort to protect proprietary designs or important confidential systems.
GUIDANCE AND TIPS
An example Informed Consent Form used by the National Institute of Standards and Technology (NIST) can be found here: http://vote.nist.gov/meeting20070817/Informed-consent-form.doc.
6.3 APPENDIX C: INSTRUCTIONS FOR PARTICIPANTS
Provide a copy of the facilitator’s introduction and any additional instructions provided to voters and poll workers during the course of the usability testing.
GUIDANCE AND TIPS
An example set of instructions used by NIST can be found here: http://vote.nist.gov/meeting20070817/Voting-instructions.doc.
33
6.4 APPENDIX D: BALLOT CONTESTS FOR VOTERS
Provide a copy of the test ballot for usability testing with voters.
Note: voting manufacturers are not required to use a copy of the test ballot that will be used by the VSLT, although it may be a good idea to do so, in order to understand how the system may perform during the testing conducted at the test laboratory.
If a paper ballot was used, insert an exact replica of that ballot. This information may take the form of an image in order to capture the exact presentation of the ballot.
If an electronic ballot was used, a copy of that ballot shall be provided (in text form) in this section of the report and may be associated with photos to illustrate how the information was presented to voters.
GUIDANCE AND TIPS
An example test ballot used by NIST can be found here: http://vote.nist.gov/meeting20070817/test-ballot-specification.doc.
6.5 APPENDIX E: TRAINING MATERIALS FOR POLL WORKERS
Provide a copy of any additional instructions, training materials or help documentation provided to poll workers during the course of the usability testing.
6.6 APPENDIX F: PERFORMANCE RESULTS
Provide a copy of the testing results in tabular format. This section shall include raw data and results for each of the following measures:
Completion rate
Errors
Assists
Time on task
And any additional measures collected during the usability testing
34
GUIDANCE AND TIPS
Many times, it is more convenient and easier to analyze data in a spreadsheet. This data can then be easily copied into the final report.
In addition to a tabular summary, it can also be helpful to provide an overall summary of voter or poll worker performance. By providing charts and graphs that summarize user performance, readers of the report can more easily understand the overall performance of the voting system.
6.7 APPENDIX G: POST TEST SATISFACTION QUESTIONNAIRE
Provide a copy of any post-test satisfaction questionnaires provided to users, as well as information on how the questionnaires were scored.
Provide a copy of the post-test debrief questions that were asked of users after completing the tasks in the usability test.
Additionally, provide a copy of the results in a tabular format.
GUIDANCE AND TIPS
Many times, it is more convenient and easier to analyze data in a spreadsheet. This data can then be easily copied into the final report.
In addition to a tabular summary, it can also be helpful to provide an overall summary of voter or poll worker satisfaction. By providing charts and graphs that summarize user satisfaction, readers of the report can more easily understand the overall satisfaction of voters and poll workers using the voting system.
35
Works Cited
Please note: The following references were cited in preparing the “Guidelines on How to Complete the Modified CIF Fortmat for Voting Manufacturers.” These works are not intended to be a part of the modified CIF report developed by voting manufacturers, their usabiltiy test administrator(s) or data loggers(s).
Brooke, J. (1996). SUS: A Quick and Dirty Usability Scale. In Usability Evaluation in Industry (p. London). Taylor & Francis.
ISO/IEC 25062:2006. (n.d.). Retrieved from International Organization of Standardization's Software engineering -- Software Product Quality Requirements and Evaluation (SQuaRE) -- Common Industry Format (CIF) for usability test reports: http://www.iso.org/iso/iso_catalogue/catalogue_tc/catalogue_detail.htm?csnumber=43046
Lewis, J. R. (1995). IBM Computer Usability Satisfaction Questionnaires: Psychometric Evaluation and Instructions for Use. International Journal of Human-Computer Interaction, 57-78.
Questionnaire for User Interaction Satisfaction (QUIS). (n.d.). Retrieved July 2008, from University of Maryland: http://www.lap.umd.edu/QUIS/index.html.
SUMI. (n.d.). Retrieved 2008, from Human Factors Research Group: http://www.ucc.ie/hfrg/questionnaires/sumi/index.html.
Chisnell, D. Rubin, J. (2008) Handbook of Usability Testing. Wiley Publishing, Inc., Indianapolis, IN.