Embed Size (px)
Citation preview

GUIDELINES ON BIOMETEOROLOGY
AND AIR QUALITY FORECASTS
WMO/TD No. 1184PWS-10
W o r l d M e t e o r o l o g i c a l O r g a n i z a t i o n
GUIDELINES ON BIOMETEOROLOGY
AND AIR QUALITY FORECASTS
WMO/TD No. 1184PWS-10
W o r l d M e t e o r o l o g i c a l O r g a n i z a t i o n
Geneva, Switzerland
2004

The designations employed and the presentation of material in thispublication do not imply the expression of any opinion whatsoever onthe part of any of the participating agencies concerning the legal statusof any country, territory, city or area, or of its authorities, or concern-ing the delimitation of its frontiers or boundaries.
© 2004, World Meteorological Organization
WMO/TD No. 1184
NOTE
Authors:Wolfgang Kusch, Hwang Yung Fong, Gerd Jendritzky, Ingo Jacobsen
Edited by: Haleh Kootval
Cover: Rafiek El-Shanawani
Page
CHAPTER 1 – INTRODUCTION . . . . . . . . . . . . . . . . . . . . . . . . . . . . . . . . . . . . . . . . . . . . . . . . . . . . . . . . . . . . . . . . . . . . . 1
CHAPTER 2 – HUMAN BIOMETEOROLOGY . . . . . . . . . . . . . . . . . . . . . . . . . . . . . . . . . . . . . . . . . . . . . . . . . . . . . . . . . 32.1 Atmospheric environment . . . . . . . . . . . . . . . . . . . . . . . . . . . . . . . . . . . . . . . . . . . . . . . . . . . . . . . . . . . . . . . . . . . . . . . . 32.2 Thermal environment . . . . . . . . . . . . . . . . . . . . . . . . . . . . . . . . . . . . . . . . . . . . . . . . . . . . . . . . . . . . . . . . . . . . . . . . . . . 3
2.2.1 Thermal indices . . . . . . . . . . . . . . . . . . . . . . . . . . . . . . . . . . . . . . . . . . . . . . . . . . . . . . . . . . . . . . . . . . . . . . . . . . . 32.2.1.1 Perceived temperature (PT) . . . . . . . . . . . . . . . . . . . . . . . . . . . . . . . . . . . . . . . . . . . . . . . . . . . . . . . . 42.2.1.2 Heat index . . . . . . . . . . . . . . . . . . . . . . . . . . . . . . . . . . . . . . . . . . . . . . . . . . . . . . . . . . . . . . . . . . . . . . . 52.2.1.3 Net effective temperature (NET) . . . . . . . . . . . . . . . . . . . . . . . . . . . . . . . . . . . . . . . . . . . . . . . . . . . . 62.2.1.4 Wind chill . . . . . . . . . . . . . . . . . . . . . . . . . . . . . . . . . . . . . . . . . . . . . . . . . . . . . . . . . . . . . . . . . . . . . . . 6
2.2.2 Perceived temperature related mortality . . . . . . . . . . . . . . . . . . . . . . . . . . . . . . . . . . . . . . . . . . . . . . . . . . . . . . 72.2.3 Bioclimate maps (meso– and macro scale) . . . . . . . . . . . . . . . . . . . . . . . . . . . . . . . . . . . . . . . . . . . . . . . . . . . . 72.2.4 Urban bioclimatology (UBIKLIM) . . . . . . . . . . . . . . . . . . . . . . . . . . . . . . . . . . . . . . . . . . . . . . . . . . . . . . . . . . . 72.2.5 Health resort climatology . . . . . . . . . . . . . . . . . . . . . . . . . . . . . . . . . . . . . . . . . . . . . . . . . . . . . . . . . . . . . . . . . . . 8
2.3 Radiation . . . . . . . . . . . . . . . . . . . . . . . . . . . . . . . . . . . . . . . . . . . . . . . . . . . . . . . . . . . . . . . . . . . . . . . . . . . . . . . . . . . . . . 82.3.1 UV-index . . . . . . . . . . . . . . . . . . . . . . . . . . . . . . . . . . . . . . . . . . . . . . . . . . . . . . . . . . . . . . . . . . . . . . . . . . . . . . . . 92.3.2 UV-index in Europe . . . . . . . . . . . . . . . . . . . . . . . . . . . . . . . . . . . . . . . . . . . . . . . . . . . . . . . . . . . . . . . . . . . . . . . 9
2.4 Air quality management and allergenic pollen . . . . . . . . . . . . . . . . . . . . . . . . . . . . . . . . . . . . . . . . . . . . . . . . . . . . . . . 92.4.1 Air quality in health resorts . . . . . . . . . . . . . . . . . . . . . . . . . . . . . . . . . . . . . . . . . . . . . . . . . . . . . . . . . . . . . . . . . 102.4.2 Allergenic pollen grains . . . . . . . . . . . . . . . . . . . . . . . . . . . . . . . . . . . . . . . . . . . . . . . . . . . . . . . . . . . . . . . . . . . . 10
2.5 Weather and health (biotropy) . . . . . . . . . . . . . . . . . . . . . . . . . . . . . . . . . . . . . . . . . . . . . . . . . . . . . . . . . . . . . . . . . . . . 102.5.1 Human biometeorological advice . . . . . . . . . . . . . . . . . . . . . . . . . . . . . . . . . . . . . . . . . . . . . . . . . . . . . . . . . . . . 11
2.6 International projects . . . . . . . . . . . . . . . . . . . . . . . . . . . . . . . . . . . . . . . . . . . . . . . . . . . . . . . . . . . . . . . . . . . . . . . . . . . . 112.6.1 WMO/WHO/UNEP showcase projects on Heat Health Warning Systems (HHWS) . . . . . . . . . . . . . . . . 122.6.2 Climate Change and Adaptation Strategies for Human Health in Europe (cCASHh) . . . . . . . . . . . . . . . . 13
2.7 Approaches to management and operation of human biometeorology programs . . . . . . . . . . . . . . . . . . . . . . . . . 132.7.1 Role of Regional Specialized Meteorological Centres (RSMCs) . . . . . . . . . . . . . . . . . . . . . . . . . . . . . . . . . . 13
2.7.1.1 RSMCs with geographical specialization . . . . . . . . . . . . . . . . . . . . . . . . . . . . . . . . . . . . . . . . . . . . . 132.7.1.2 RSMCs with activity specialization . . . . . . . . . . . . . . . . . . . . . . . . . . . . . . . . . . . . . . . . . . . . . . . . . . 132.7.1.3 RSMCs with non-real-time activities . . . . . . . . . . . . . . . . . . . . . . . . . . . . . . . . . . . . . . . . . . . . . . . . 132.7.1.4 Future developments . . . . . . . . . . . . . . . . . . . . . . . . . . . . . . . . . . . . . . . . . . . . . . . . . . . . . . . . . . . . . . 13
CHAPTER 3 – AIR QUALITY FORECASTS . . . . . . . . . . . . . . . . . . . . . . . . . . . . . . . . . . . . . . . . . . . . . . . . . . . . . . . . . . . . 153.1 Air quality and health . . . . . . . . . . . . . . . . . . . . . . . . . . . . . . . . . . . . . . . . . . . . . . . . . . . . . . . . . . . . . . . . . . . . . . . . . . . . 15
3.1.1 Tropospheric ozone . . . . . . . . . . . . . . . . . . . . . . . . . . . . . . . . . . . . . . . . . . . . . . . . . . . . . . . . . . . . . . . . . . . . . . . . 153.1.2 Stratospheric ozone . . . . . . . . . . . . . . . . . . . . . . . . . . . . . . . . . . . . . . . . . . . . . . . . . . . . . . . . . . . . . . . . . . . . . . . . 153.1.3 Smog and acidification . . . . . . . . . . . . . . . . . . . . . . . . . . . . . . . . . . . . . . . . . . . . . . . . . . . . . . . . . . . . . . . . . . . . . 163.1.4 Particulate material . . . . . . . . . . . . . . . . . . . . . . . . . . . . . . . . . . . . . . . . . . . . . . . . . . . . . . . . . . . . . . . . . . . . . . . 173.1.5 Environmental emergency response . . . . . . . . . . . . . . . . . . . . . . . . . . . . . . . . . . . . . . . . . . . . . . . . . . . . . . . . . 17
3.1.5.1 Radioactivity . . . . . . . . . . . . . . . . . . . . . . . . . . . . . . . . . . . . . . . . . . . . . . . . . . . . . . . . . . . . . . . . . . . . . 173.1.5.2 Chemical accidents . . . . . . . . . . . . . . . . . . . . . . . . . . . . . . . . . . . . . . . . . . . . . . . . . . . . . . . . . . . . . . . . 183.1.5.3 Forest fires . . . . . . . . . . . . . . . . . . . . . . . . . . . . . . . . . . . . . . . . . . . . . . . . . . . . . . . . . . . . . . . . . . . . . . . 183.1.5.4 Volcanic eruptions . . . . . . . . . . . . . . . . . . . . . . . . . . . . . . . . . . . . . . . . . . . . . . . . . . . . . . . . . . . . . . . . 183.1.6 User requirements . . . . . . . . . . . . . . . . . . . . . . . . . . . . . . . . . . . . . . . . . . . . . . . . . . . . . . . . . . . . . . . . . 18
3.2 Atmospheric transport modelling . . . . . . . . . . . . . . . . . . . . . . . . . . . . . . . . . . . . . . . . . . . . . . . . . . . . . . . . . . . . . . . . . 183.2.1 Model systems . . . . . . . . . . . . . . . . . . . . . . . . . . . . . . . . . . . . . . . . . . . . . . . . . . . . . . . . . . . . . . . . . . . . . . . . . . . . 19
3.2.1.1 Modelling approaches . . . . . . . . . . . . . . . . . . . . . . . . . . . . . . . . . . . . . . . . . . . . . . . . . . . . . . . . . . . . . 193.2.1.1.1 Lagrangean models . . . . . . . . . . . . . . . . . . . . . . . . . . . . . . . . . . . . . . . . . . . . . . . . . . . . . 203.2.1.1.2 Eulerian models . . . . . . . . . . . . . . . . . . . . . . . . . . . . . . . . . . . . . . . . . . . . . . . . . . . . . . . . 213.2.1.1.3 Hybrid models . . . . . . . . . . . . . . . . . . . . . . . . . . . . . . . . . . . . . . . . . . . . . . . . . . . . . . . . . 213.2.1.1.4 Statistical models . . . . . . . . . . . . . . . . . . . . . . . . . . . . . . . . . . . . . . . . . . . . . . . . . . . . . . . 22
3.2.1.2 Requirements . . . . . . . . . . . . . . . . . . . . . . . . . . . . . . . . . . . . . . . . . . . . . . . . . . . . . . . . . . . . . . . . . . . . . 223.2.1.2.1 Initial fields . . . . . . . . . . . . . . . . . . . . . . . . . . . . . . . . . . . . . . . . . . . . . . . . . . . . . . . . . . . . 22
CONTENTS

3.2.1.2.2 Emission data . . . . . . . . . . . . . . . . . . . . . . . . . . . . . . . . . . . . . . . . . . . . . . . . . . . . . . . . . . 233.2.1.2.3 Boundary conditions . . . . . . . . . . . . . . . . . . . . . . . . . . . . . . . . . . . . . . . . . . . . . . . . . . . 23
3.2.1.3 Validation of models . . . . . . . . . . . . . . . . . . . . . . . . . . . . . . . . . . . . . . . . . . . . . . . . . . . . . . . . . . . . . . . 233.3 Environmental emergency response (EER) . . . . . . . . . . . . . . . . . . . . . . . . . . . . . . . . . . . . . . . . . . . . . . . . . . . . . . . . . 24
3.3.1 Requirements . . . . . . . . . . . . . . . . . . . . . . . . . . . . . . . . . . . . . . . . . . . . . . . . . . . . . . . . . . . . . . . . . . . . . . . . . . . . . 243.3.2 Tracer experiments and exercises . . . . . . . . . . . . . . . . . . . . . . . . . . . . . . . . . . . . . . . . . . . . . . . . . . . . . . . . . . . . 24
3.3.2.1 Tracer experiments . . . . . . . . . . . . . . . . . . . . . . . . . . . . . . . . . . . . . . . . . . . . . . . . . . . . . . . . . . . . . . . . 253.3.2.2 Emergency exercises . . . . . . . . . . . . . . . . . . . . . . . . . . . . . . . . . . . . . . . . . . . . . . . . . . . . . . . . . . . . . . . 25
3.3.3 Collaboration with responsible authorities . . . . . . . . . . . . . . . . . . . . . . . . . . . . . . . . . . . . . . . . . . . . . . . . . . . . 253.4 Role of NMSs . . . . . . . . . . . . . . . . . . . . . . . . . . . . . . . . . . . . . . . . . . . . . . . . . . . . . . . . . . . . . . . . . . . . . . . . . . . . . . . . . . . 26
3.4.1 Operational database . . . . . . . . . . . . . . . . . . . . . . . . . . . . . . . . . . . . . . . . . . . . . . . . . . . . . . . . . . . . . . . . . . . . . . 263.4.1.1 Environmental networks . . . . . . . . . . . . . . . . . . . . . . . . . . . . . . . . . . . . . . . . . . . . . . . . . . . . . . . . . . . 263.4.1.2 Surface observations and vertical soundings . . . . . . . . . . . . . . . . . . . . . . . . . . . . . . . . . . . . . . . . . . 273.4.1.3 Satellite data . . . . . . . . . . . . . . . . . . . . . . . . . . . . . . . . . . . . . . . . . . . . . . . . . . . . . . . . . . . . . . . . . . . . . . 283.4.1.4 Data exchange . . . . . . . . . . . . . . . . . . . . . . . . . . . . . . . . . . . . . . . . . . . . . . . . . . . . . . . . . . . . . . . . . . . . 28
3.4.2 Operational forecasts . . . . . . . . . . . . . . . . . . . . . . . . . . . . . . . . . . . . . . . . . . . . . . . . . . . . . . . . . . . . . . . . . . . . . . 293.4.3 Reasons for the responsibility of NMSs . . . . . . . . . . . . . . . . . . . . . . . . . . . . . . . . . . . . . . . . . . . . . . . . . . . . . . . 29
3.5 Collaboration with national and international organizations . . . . . . . . . . . . . . . . . . . . . . . . . . . . . . . . . . . . . . . . . . 293.5.1 WMO and international organizations . . . . . . . . . . . . . . . . . . . . . . . . . . . . . . . . . . . . . . . . . . . . . . . . . . . . . . . 293.5.2National . . . . . . . . . . . . . . . . . . . . . . . . . . . . . . . . . . . . . . . . . . . . . . . . . . . . . . . . . . . . . . . . . . . . . . . . . . . . . . . . . . . 303.5.3Regional . . . . . . . . . . . . . . . . . . . . . . . . . . . . . . . . . . . . . . . . . . . . . . . . . . . . . . . . . . . . . . . . . . . . . . . . . . . . . . . . . . . 303.5.4 International Collaboration between NMHSs and research institutes . . . . . . . . . . . . . . . . . . . . . . . . . . . . . 31
CHAPTER 4 – OUTLOOK . . . . . . . . . . . . . . . . . . . . . . . . . . . . . . . . . . . . . . . . . . . . . . . . . . . . . . . . . . . . . . . . . . . . . . . . . . . . 32
REFERENCES . . . . . . . . . . . . . . . . . . . . . . . . . . . . . . . . . . . . . . . . . . . . . . . . . . . . . . . . . . . . . . . . . . . . . . . . . . . . . . . . . . . . . . 32
Page
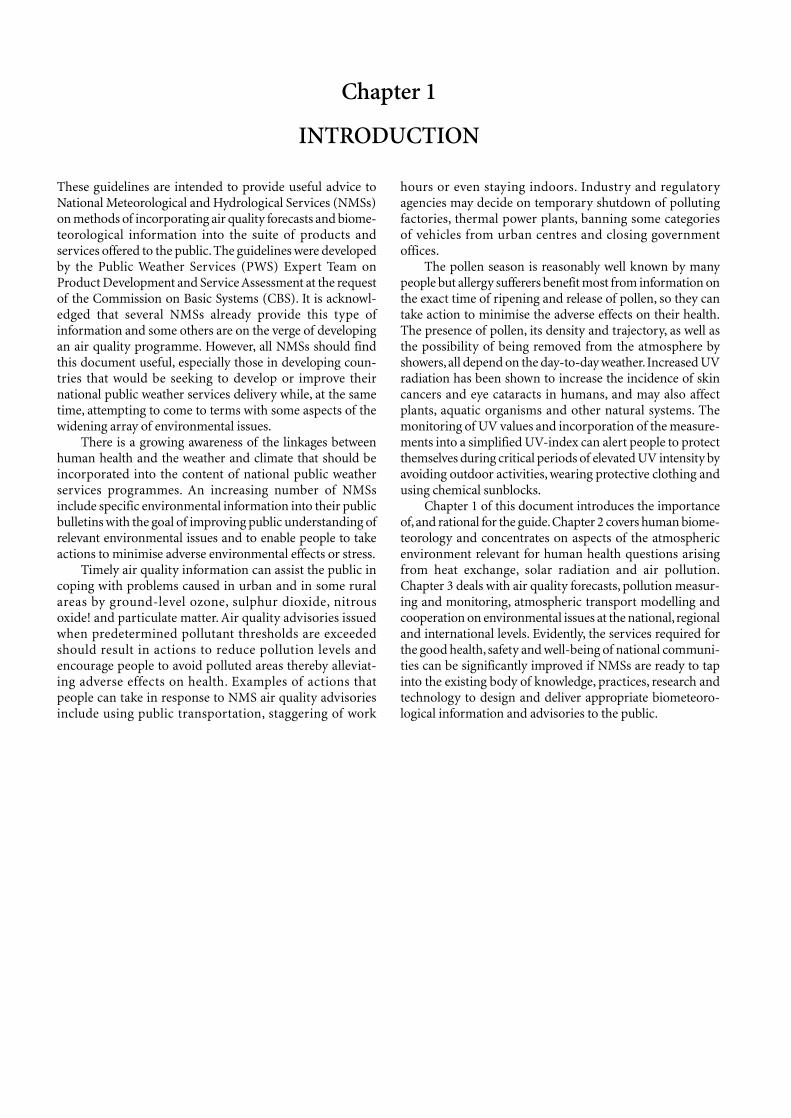
These guidelines are intended to provide useful advice toNational Meteorological and Hydrological Services (NMSs)on methods of incorporating air quality forecasts and biome-teorological information into the suite of products andservices offered to the public. The guidelines were developedby the Public Weather Services (PWS) Expert Team onProduct Development and Service Assessment at the requestof the Commission on Basic Systems (CBS). It is acknowl-edged that several NMSs already provide this type ofinformation and some others are on the verge of developingan air quality programme. However, all NMSs should findthis document useful, especially those in developing coun-tries that would be seeking to develop or improve theirnational public weather services delivery while, at the sametime, attempting to come to terms with some aspects of thewidening array of environmental issues.
There is a growing awareness of the linkages betweenhuman health and the weather and climate that should beincorporated into the content of national public weatherservices programmes. An increasing number of NMSsinclude specific environmental information into their publicbulletins with the goal of improving public understanding ofrelevant environmental issues and to enable people to takeactions to minimise adverse environmental effects or stress.
Timely air quality information can assist the public incoping with problems caused in urban and in some ruralareas by ground-level ozone, sulphur dioxide, nitrousoxide! and particulate matter. Air quality advisories issuedwhen predetermined pollutant thresholds are exceededshould result in actions to reduce pollution levels andencourage people to avoid polluted areas thereby alleviat-ing adverse effects on health. Examples of actions thatpeople can take in response to NMS air quality advisoriesinclude using public transportation, staggering of work
hours or even staying indoors. Industry and regulatoryagencies may decide on temporary shutdown of pollutingfactories, thermal power plants, banning some categoriesof vehicles from urban centres and closing governmentoffices.
The pollen season is reasonably well known by manypeople but allergy sufferers benefit most from information onthe exact time of ripening and release of pollen, so they cantake action to minimise the adverse effects on their health.The presence of pollen, its density and trajectory, as well asthe possibility of being removed from the atmosphere byshowers, all depend on the day-to-day weather. Increased UVradiation has been shown to increase the incidence of skincancers and eye cataracts in humans, and may also affectplants, aquatic organisms and other natural systems. Themonitoring of UV values and incorporation of the measure-ments into a simplified UV-index can alert people to protectthemselves during critical periods of elevated UV intensity byavoiding outdoor activities, wearing protective clothing andusing chemical sunblocks.
Chapter 1 of this document introduces the importanceof,and rational for the guide.Chapter 2 covers human biome-teorology and concentrates on aspects of the atmosphericenvironment relevant for human health questions arisingfrom heat exchange, solar radiation and air pollution.Chapter 3 deals with air quality forecasts, pollution measur-ing and monitoring, atmospheric transport modelling andcooperation on environmental issues at the national, regionaland international levels. Evidently, the services required forthe good health, safety and well-being of national communi-ties can be significantly improved if NMSs are ready to tapinto the existing body of knowledge, practices, research andtechnology to design and deliver appropriate biometeoro-logical information and advisories to the public.
Chapter 1
INTRODUCTION
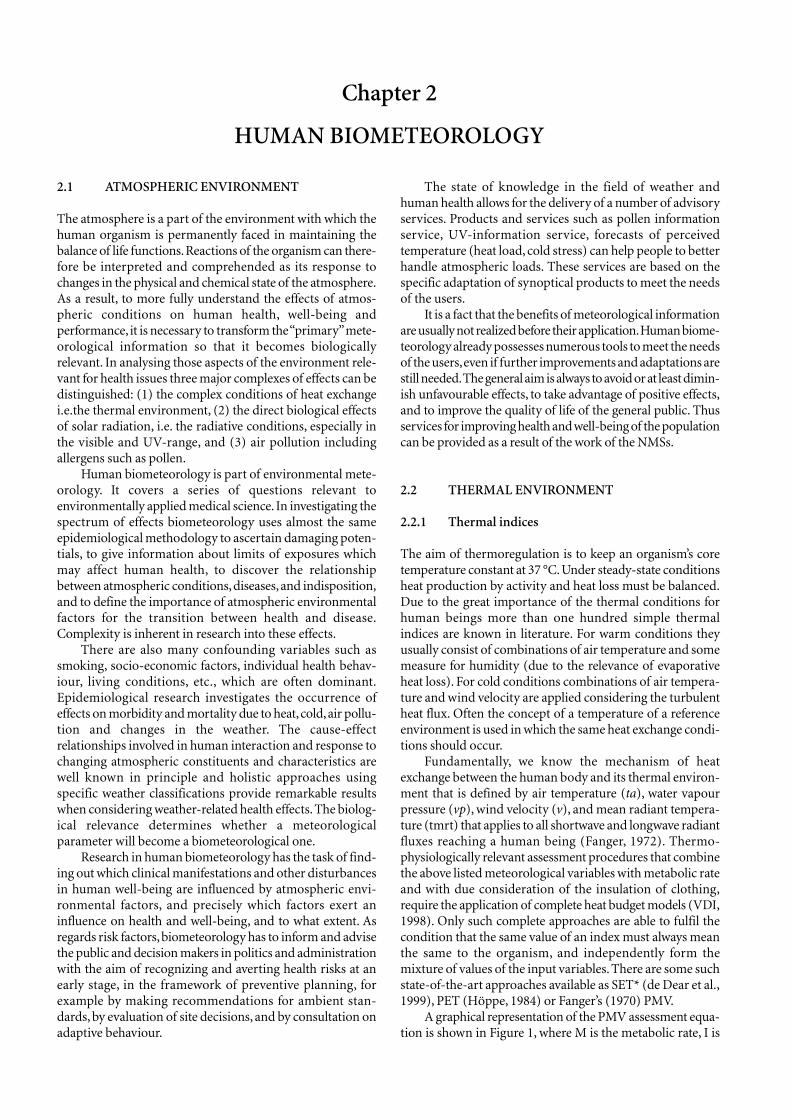
2.1 ATMOSPHERIC ENVIRONMENT
The atmosphere is a part of the environment with which thehuman organism is permanently faced in maintaining thebalance of life functions.Reactions of the organism can there-fore be interpreted and comprehended as its response tochanges in the physical and chemical state of the atmosphere.As a result, to more fully understand the effects of atmos-pheric conditions on human health, well-being andperformance, it is necessary to transform the “primary”mete-orological information so that it becomes biologicallyrelevant. In analysing those aspects of the environment rele-vant for health issues three major complexes of effects can bedistinguished: (1) the complex conditions of heat exchangei.e.the thermal environment, (2) the direct biological effectsof solar radiation, i.e. the radiative conditions, especially inthe visible and UV-range, and (3) air pollution includingallergens such as pollen.
Human biometeorology is part of environmental mete-orology. It covers a series of questions relevant toenvironmentally applied medical science. In investigating thespectrum of effects biometeorology uses almost the sameepidemiological methodology to ascertain damaging poten-tials, to give information about limits of exposures whichmay affect human health, to discover the relationshipbetween atmospheric conditions, diseases, and indisposition,and to define the importance of atmospheric environmentalfactors for the transition between health and disease.Complexity is inherent in research into these effects.
There are also many confounding variables such assmoking, socio-economic factors, individual health behav-iour, living conditions, etc., which are often dominant.Epidemiological research investigates the occurrence ofeffects on morbidity and mortality due to heat,cold,air pollu-tion and changes in the weather. The cause-effectrelationships involved in human interaction and response tochanging atmospheric constituents and characteristics arewell known in principle and holistic approaches usingspecific weather classifications provide remarkable resultswhen considering weather-related health effects. The biolog-ical relevance determines whether a meteorologicalparameter will become a biometeorological one.
Research in human biometeorology has the task of find-ing out which clinical manifestations and other disturbancesin human well-being are influenced by atmospheric envi-ronmental factors, and precisely which factors exert aninfluence on health and well-being, and to what extent. Asregards risk factors, biometeorology has to inform and advisethe public and decision makers in politics and administrationwith the aim of recognizing and averting health risks at anearly stage, in the framework of preventive planning, forexample by making recommendations for ambient stan-dards, by evaluation of site decisions, and by consultation onadaptive behaviour.
The state of knowledge in the field of weather andhuman health allows for the delivery of a number of advisoryservices. Products and services such as pollen informationservice, UV-information service, forecasts of perceivedtemperature (heat load, cold stress) can help people to betterhandle atmospheric loads. These services are based on thespecific adaptation of synoptical products to meet the needsof the users.
It is a fact that the benefits of meteorological informationare usually not realized before their application.Human biome-teorology already possesses numerous tools to meet the needsof the users,even if further improvements and adaptations arestill needed.The general aim is always to avoid or at least dimin-ish unfavourable effects, to take advantage of positive effects,and to improve the quality of life of the general public. Thusservices for improving health and well-being of the populationcan be provided as a result of the work of the NMSs.
2.2 THERMAL ENVIRONMENT
2.2.1 Thermal indices
The aim of thermoregulation is to keep an organism’s coretemperature constant at 37 °C. Under steady-state conditionsheat production by activity and heat loss must be balanced.Due to the great importance of the thermal conditions forhuman beings more than one hundred simple thermalindices are known in literature. For warm conditions theyusually consist of combinations of air temperature and somemeasure for humidity (due to the relevance of evaporativeheat loss). For cold conditions combinations of air tempera-ture and wind velocity are applied considering the turbulentheat flux. Often the concept of a temperature of a referenceenvironment is used in which the same heat exchange condi-tions should occur.
Fundamentally, we know the mechanism of heatexchange between the human body and its thermal environ-ment that is defined by air temperature (ta), water vapourpressure (vp), wind velocity (v), and mean radiant tempera-ture (tmrt) that applies to all shortwave and longwave radiantfluxes reaching a human being (Fanger, 1972). Thermo-physiologically relevant assessment procedures that combinethe above listed meteorological variables with metabolic rateand with due consideration of the insulation of clothing,require the application of complete heat budget models (VDI,1998). Only such complete approaches are able to fulfil thecondition that the same value of an index must always meanthe same to the organism, and independently form themixture of values of the input variables. There are some suchstate-of-the-art approaches available as SET* (de Dear et al.,1999), PET (Höppe, 1984) or Fanger’s (1970) PMV.
A graphical representation of the PMV assessment equa-tion is shown in Figure 1, where M is the metabolic rate, I is
Chapter 2
HUMAN BIOMETEOROLOGY
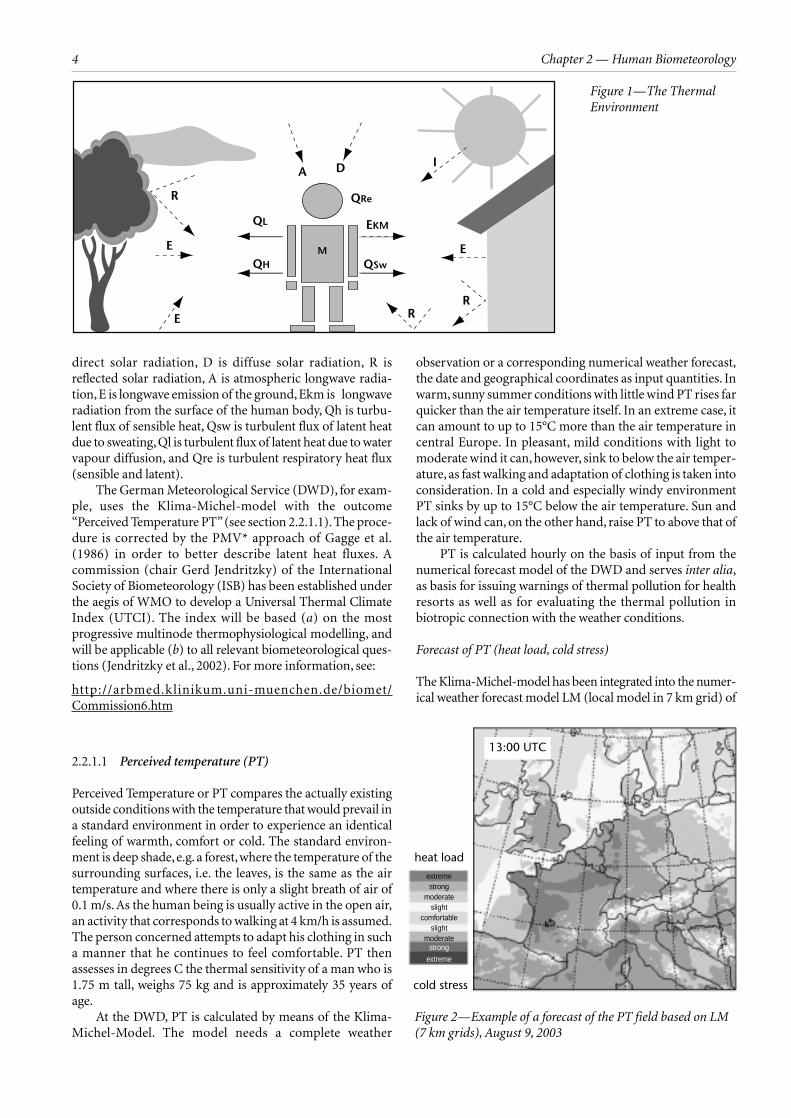
direct solar radiation, D is diffuse solar radiation, R isreflected solar radiation, A is atmospheric longwave radia-tion, E is longwave emission of the ground, Ekm is longwaveradiation from the surface of the human body, Qh is turbu-lent flux of sensible heat, Qsw is turbulent flux of latent heatdue to sweating, Ql is turbulent flux of latent heat due to watervapour diffusion, and Qre is turbulent respiratory heat flux(sensible and latent).
The German Meteorological Service (DWD), for exam-ple, uses the Klima-Michel-model with the outcome“Perceived Temperature PT”(see section 2.2.1.1). The proce-dure is corrected by the PMV* approach of Gagge et al.(1986) in order to better describe latent heat fluxes. Acommission (chair Gerd Jendritzky) of the InternationalSociety of Biometeorology (ISB) has been established underthe aegis of WMO to develop a Universal Thermal ClimateIndex (UTCI). The index will be based (a) on the mostprogressive multinode thermophysiological modelling, andwill be applicable (b) to all relevant biometeorological ques-tions (Jendritzky et al., 2002). For more information, see:
http://arbmed.klinikum.uni-muenchen.de/biomet/Commission6.htm
2.2.1.1 Perceived temperature (PT)
Perceived Temperature or PT compares the actually existingoutside conditions with the temperature that would prevail ina standard environment in order to experience an identicalfeeling of warmth, comfort or cold. The standard environ-ment is deep shade, e.g. a forest, where the temperature of thesurrounding surfaces, i.e. the leaves, is the same as the airtemperature and where there is only a slight breath of air of0.1 m/s. As the human being is usually active in the open air,an activity that corresponds to walking at 4 km/h is assumed.The person concerned attempts to adapt his clothing in sucha manner that he continues to feel comfortable. PT thenassesses in degrees C the thermal sensitivity of a man who is1.75 m tall, weighs 75 kg and is approximately 35 years ofage.
At the DWD, PT is calculated by means of the Klima-Michel-Model. The model needs a complete weather
observation or a corresponding numerical weather forecast,the date and geographical coordinates as input quantities. Inwarm, sunny summer conditions with little wind PT rises farquicker than the air temperature itself. In an extreme case, itcan amount to up to 15°C more than the air temperature incentral Europe. In pleasant, mild conditions with light tomoderate wind it can, however, sink to below the air temper-ature, as fast walking and adaptation of clothing is taken intoconsideration. In a cold and especially windy environmentPT sinks by up to 15°C below the air temperature. Sun andlack of wind can, on the other hand, raise PT to above that ofthe air temperature.
PT is calculated hourly on the basis of input from thenumerical forecast model of the DWD and serves inter alia,as basis for issuing warnings of thermal pollution for healthresorts as well as for evaluating the thermal pollution inbiotropic connection with the weather conditions.
Forecast of PT (heat load, cold stress)
The Klima-Michel-model has been integrated into the numer-ical weather forecast model LM (local model in 7 km grid) of
Chapter 2 — Human Biometeorology4
R
E
E
E
IDA
RR
QL EKM
QRe
QH QSwM
Figure 1—The ThermalEnvironment
Figure 2—Example of a forecast of the PT field based on LM(7 km grids), August 9, 2003
heat load
13:00 UTC
cold stress
extreme
extreme
strong
strong
moderate
moderate
slight
slightcomfortable
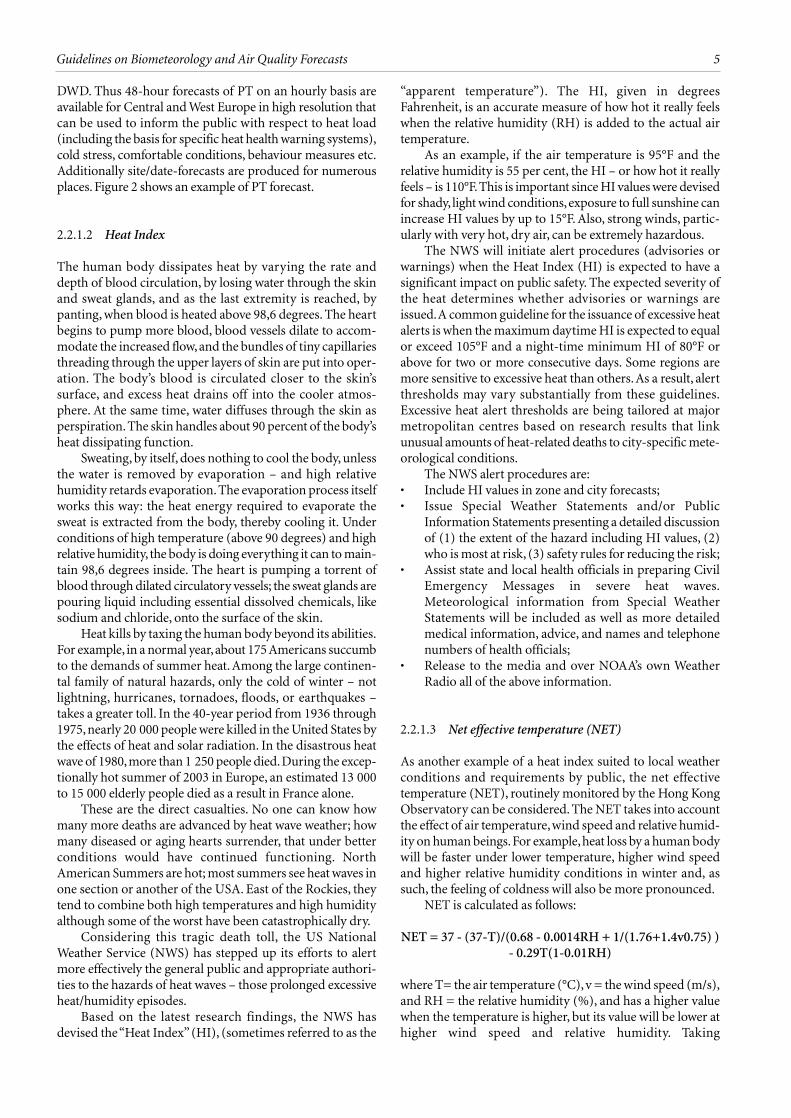
DWD. Thus 48-hour forecasts of PT on an hourly basis areavailable for Central and West Europe in high resolution thatcan be used to inform the public with respect to heat load(including the basis for specific heat health warning systems),cold stress, comfortable conditions, behaviour measures etc.Additionally site/date-forecasts are produced for numerousplaces. Figure 2 shows an example of PT forecast.
2.2.1.2 Heat Index
The human body dissipates heat by varying the rate anddepth of blood circulation, by losing water through the skinand sweat glands, and as the last extremity is reached, bypanting, when blood is heated above 98,6 degrees. The heartbegins to pump more blood, blood vessels dilate to accom-modate the increased flow, and the bundles of tiny capillariesthreading through the upper layers of skin are put into oper-ation. The body’s blood is circulated closer to the skin’ssurface, and excess heat drains off into the cooler atmos-phere. At the same time, water diffuses through the skin asperspiration. The skin handles about 90 percent of the body’sheat dissipating function.
Sweating, by itself, does nothing to cool the body, unlessthe water is removed by evaporation – and high relativehumidity retards evaporation. The evaporation process itselfworks this way: the heat energy required to evaporate thesweat is extracted from the body, thereby cooling it. Underconditions of high temperature (above 90 degrees) and highrelative humidity, the body is doing everything it can to main-tain 98,6 degrees inside. The heart is pumping a torrent ofblood through dilated circulatory vessels; the sweat glands arepouring liquid including essential dissolved chemicals, likesodium and chloride, onto the surface of the skin.
Heat kills by taxing the human body beyond its abilities.For example, in a normal year, about 175 Americans succumbto the demands of summer heat. Among the large continen-tal family of natural hazards, only the cold of winter – notlightning, hurricanes, tornadoes, floods, or earthquakes –takes a greater toll. In the 40-year period from 1936 through1975, nearly 20 000 people were killed in the United States bythe effects of heat and solar radiation. In the disastrous heatwave of 1980, more than 1 250 people died.During the excep-tionally hot summer of 2003 in Europe, an estimated 13 000to 15 000 elderly people died as a result in France alone.
These are the direct casualties. No one can know howmany more deaths are advanced by heat wave weather; howmany diseased or aging hearts surrender, that under betterconditions would have continued functioning. NorthAmerican Summers are hot; most summers see heat waves inone section or another of the USA. East of the Rockies, theytend to combine both high temperatures and high humidityalthough some of the worst have been catastrophically dry.
Considering this tragic death toll, the US NationalWeather Service (NWS) has stepped up its efforts to alertmore effectively the general public and appropriate authori-ties to the hazards of heat waves – those prolonged excessiveheat/humidity episodes.
Based on the latest research findings, the NWS hasdevised the “Heat Index” (HI), (sometimes referred to as the
“apparent temperature”). The HI, given in degreesFahrenheit, is an accurate measure of how hot it really feelswhen the relative humidity (RH) is added to the actual airtemperature.
As an example, if the air temperature is 95°F and therelative humidity is 55 per cent, the HI – or how hot it reallyfeels – is 110°F.This is important since HI values were devisedfor shady, light wind conditions,exposure to full sunshine canincrease HI values by up to 15°F. Also, strong winds, partic-ularly with very hot, dry air, can be extremely hazardous.
The NWS will initiate alert procedures (advisories orwarnings) when the Heat Index (HI) is expected to have asignificant impact on public safety. The expected severity ofthe heat determines whether advisories or warnings areissued.A common guideline for the issuance of excessive heatalerts is when the maximum daytime HI is expected to equalor exceed 105°F and a night-time minimum HI of 80°F orabove for two or more consecutive days. Some regions aremore sensitive to excessive heat than others.As a result, alertthresholds may vary substantially from these guidelines.Excessive heat alert thresholds are being tailored at majormetropolitan centres based on research results that linkunusual amounts of heat-related deaths to city-specific mete-orological conditions.
The NWS alert procedures are:• Include HI values in zone and city forecasts;• Issue Special Weather Statements and/or Public
Information Statements presenting a detailed discussionof (1) the extent of the hazard including HI values, (2)who is most at risk, (3) safety rules for reducing the risk;
• Assist state and local health officials in preparing CivilEmergency Messages in severe heat waves.Meteorological information from Special WeatherStatements will be included as well as more detailedmedical information, advice, and names and telephonenumbers of health officials;
• Release to the media and over NOAA’s own WeatherRadio all of the above information.
2.2.1.3 Net effective temperature (NET)
As another example of a heat index suited to local weatherconditions and requirements by public, the net effectivetemperature (NET), routinely monitored by the Hong KongObservatory can be considered. The NET takes into accountthe effect of air temperature, wind speed and relative humid-ity on human beings. For example, heat loss by a human bodywill be faster under lower temperature, higher wind speedand higher relative humidity conditions in winter and, assuch, the feeling of coldness will also be more pronounced.
NET is calculated as follows:
NET = 37 - (37-T)/(0.68 - 0.0014RH + 1/(1.76+1.4v0.75) )- 0.29T(1-0.01RH)
where T= the air temperature (°C), v = the wind speed (m/s),and RH = the relative humidity (%), and has a higher valuewhen the temperature is higher, but its value will be lower athigher wind speed and relative humidity. Taking
5Guidelines on Biometeorology and Air Quality Forecasts
acclimatization into account, it is believed that people of aparticular place will feel stressfully cold and hot when thevalue of NET is at the lowest and highest 2.5 per centrespectively. In Hong Kong, China, the Cold (or Very Hot)Weather Warning will be issued when the NET is forecast tobe lower (or higher) than 2.5 per cent (97.5 per cent).
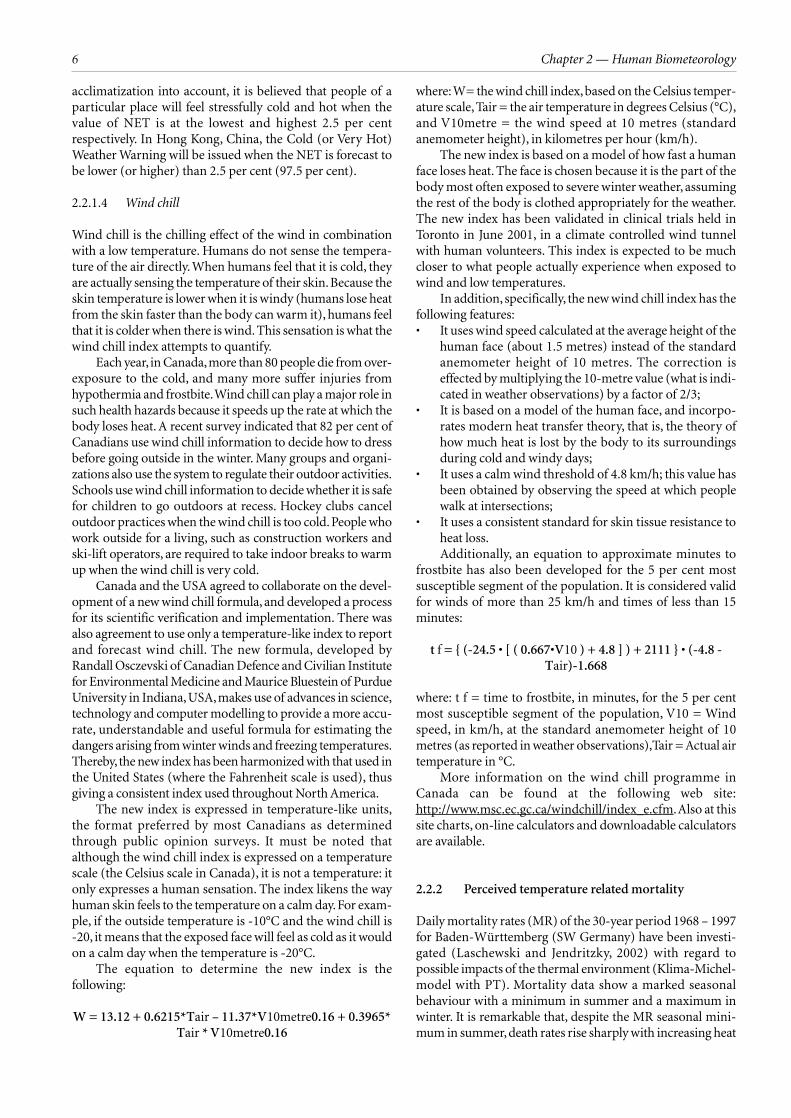
2.2.1.4 Wind chill
Wind chill is the chilling effect of the wind in combinationwith a low temperature. Humans do not sense the tempera-ture of the air directly. When humans feel that it is cold, theyare actually sensing the temperature of their skin. Because theskin temperature is lower when it is windy (humans lose heatfrom the skin faster than the body can warm it), humans feelthat it is colder when there is wind. This sensation is what thewind chill index attempts to quantify.
Each year, in Canada,more than 80 people die from over-exposure to the cold, and many more suffer injuries fromhypothermia and frostbite.Wind chill can play a major role insuch health hazards because it speeds up the rate at which thebody loses heat. A recent survey indicated that 82 per cent ofCanadians use wind chill information to decide how to dressbefore going outside in the winter. Many groups and organi-zations also use the system to regulate their outdoor activities.Schools use wind chill information to decide whether it is safefor children to go outdoors at recess. Hockey clubs canceloutdoor practices when the wind chill is too cold. People whowork outside for a living, such as construction workers andski-lift operators, are required to take indoor breaks to warmup when the wind chill is very cold.
Canada and the USA agreed to collaborate on the devel-opment of a new wind chill formula, and developed a processfor its scientific verification and implementation. There wasalso agreement to use only a temperature-like index to reportand forecast wind chill. The new formula, developed byRandall Osczevski of Canadian Defence and Civilian Institutefor Environmental Medicine and Maurice Bluestein of PurdueUniversity in Indiana, USA, makes use of advances in science,technology and computer modelling to provide a more accu-rate, understandable and useful formula for estimating thedangers arising from winter winds and freezing temperatures.Thereby,the new index has been harmonized with that used inthe United States (where the Fahrenheit scale is used), thusgiving a consistent index used throughout North America.
The new index is expressed in temperature-like units,the format preferred by most Canadians as determinedthrough public opinion surveys. It must be noted thatalthough the wind chill index is expressed on a temperaturescale (the Celsius scale in Canada), it is not a temperature: itonly expresses a human sensation. The index likens the wayhuman skin feels to the temperature on a calm day. For exam-ple, if the outside temperature is -10°C and the wind chill is-20, it means that the exposed face will feel as cold as it wouldon a calm day when the temperature is -20°C.
The equation to determine the new index is thefollowing:
W = 13.12 + 0.6215*Tair – 11.37*V10metre0.16 + 0.3965*Tair * V10metre0.16
where:W= the wind chill index, based on the Celsius temper-ature scale, Tair = the air temperature in degrees Celsius (°C),and V10metre = the wind speed at 10 metres (standardanemometer height), in kilometres per hour (km/h).
The new index is based on a model of how fast a humanface loses heat. The face is chosen because it is the part of thebody most often exposed to severe winter weather, assumingthe rest of the body is clothed appropriately for the weather.The new index has been validated in clinical trials held inToronto in June 2001, in a climate controlled wind tunnelwith human volunteers. This index is expected to be muchcloser to what people actually experience when exposed towind and low temperatures.
In addition, specifically, the new wind chill index has thefollowing features:• It uses wind speed calculated at the average height of the
human face (about 1.5 metres) instead of the standardanemometer height of 10 metres. The correction iseffected by multiplying the 10-metre value (what is indi-cated in weather observations) by a factor of 2/3;
• It is based on a model of the human face, and incorpo-rates modern heat transfer theory, that is, the theory ofhow much heat is lost by the body to its surroundingsduring cold and windy days;
• It uses a calm wind threshold of 4.8 km/h; this value hasbeen obtained by observing the speed at which peoplewalk at intersections;
• It uses a consistent standard for skin tissue resistance toheat loss.Additionally, an equation to approximate minutes to
frostbite has also been developed for the 5 per cent mostsusceptible segment of the population. It is considered validfor winds of more than 25 km/h and times of less than 15minutes:
t f = (-24.5 • [ ( 0.667•V10 ) + 4.8 ] ) + 2111 • (-4.8 -Tair)-1.668
where: t f = time to frostbite, in minutes, for the 5 per centmost susceptible segment of the population, V10 = Windspeed, in km/h, at the standard anemometer height of 10metres (as reported in weather observations),Tair = Actual airtemperature in °C.
More information on the wind chill programme inCanada can be found at the following web site:http://www.msc.ec.gc.ca/windchill/index_e.cfm.Also at thissite charts, on-line calculators and downloadable calculatorsare available.
2.2.2 Perceived temperature related mortality
Daily mortality rates (MR) of the 30-year period 1968 – 1997for Baden-Württemberg (SW Germany) have been investi-gated (Laschewski and Jendritzky, 2002) with regard topossible impacts of the thermal environment (Klima-Michel-model with PT). Mortality data show a marked seasonalbehaviour with a minimum in summer and a maximum inwinter. It is remarkable that, despite the MR seasonal mini-mum in summer, death rates rise sharply with increasing heat
Chapter 2 — Human Biometeorology6
load, reaching highest values during pronounced heat waveseven in the moderate climate of southwest Germany. Undercomfortable conditions, when demands on the thermoregu-latory system of the body are minimal, mortality data showthe lowest rates.
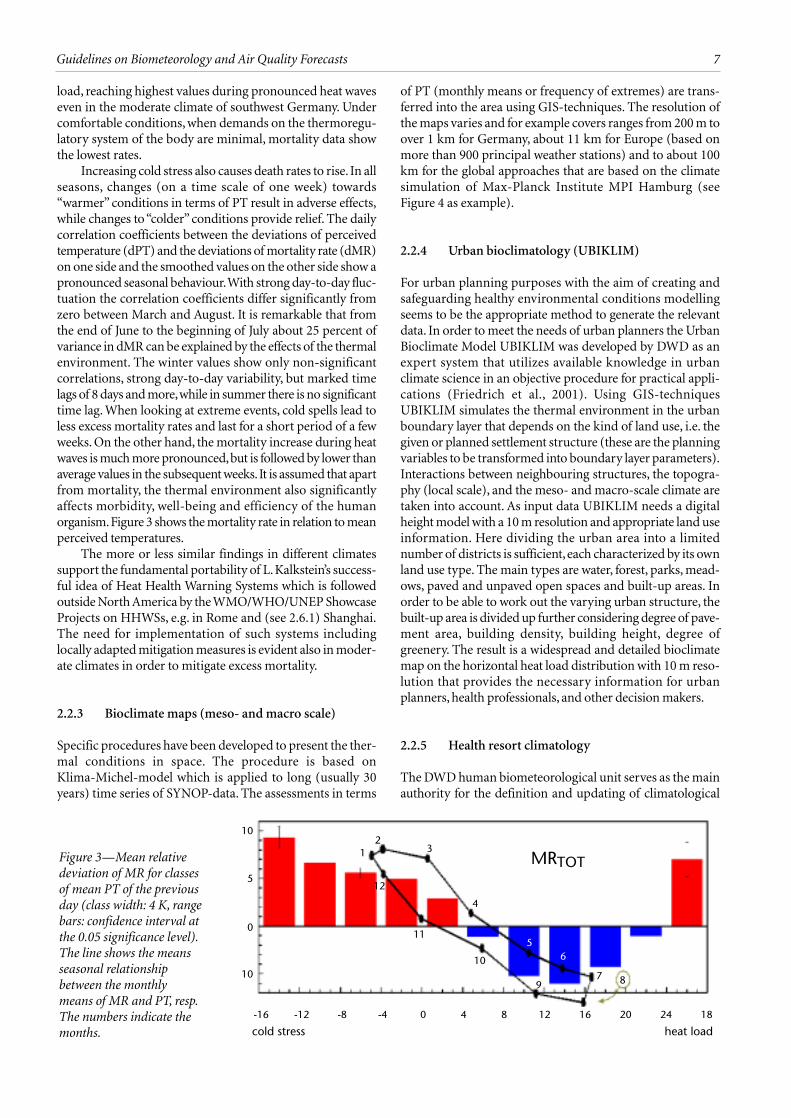
Increasing cold stress also causes death rates to rise. In allseasons, changes (on a time scale of one week) towards“warmer” conditions in terms of PT result in adverse effects,while changes to “colder” conditions provide relief. The dailycorrelation coefficients between the deviations of perceivedtemperature (dPT) and the deviations of mortality rate (dMR)on one side and the smoothed values on the other side show apronounced seasonal behaviour.With strong day-to-day fluc-tuation the correlation coefficients differ significantly fromzero between March and August. It is remarkable that fromthe end of June to the beginning of July about 25 percent ofvariance in dMR can be explained by the effects of the thermalenvironment. The winter values show only non-significantcorrelations, strong day-to-day variability, but marked timelags of 8 days and more,while in summer there is no significanttime lag. When looking at extreme events, cold spells lead toless excess mortality rates and last for a short period of a fewweeks. On the other hand, the mortality increase during heatwaves is much more pronounced,but is followed by lower thanaverage values in the subsequent weeks.It is assumed that apartfrom mortality, the thermal environment also significantlyaffects morbidity, well-being and efficiency of the humanorganism.Figure 3 shows the mortality rate in relation to meanperceived temperatures.
The more or less similar findings in different climatessupport the fundamental portability of L. Kalkstein’s success-ful idea of Heat Health Warning Systems which is followedoutside North America by the WMO/WHO/UNEP ShowcaseProjects on HHWSs, e.g. in Rome and (see 2.6.1) Shanghai.The need for implementation of such systems includinglocally adapted mitigation measures is evident also in moder-ate climates in order to mitigate excess mortality.
2.2.3 Bioclimate maps (meso- and macro scale)
Specific procedures have been developed to present the ther-mal conditions in space. The procedure is based onKlima-Michel-model which is applied to long (usually 30years) time series of SYNOP-data. The assessments in terms
of PT (monthly means or frequency of extremes) are trans-ferred into the area using GIS-techniques. The resolution ofthe maps varies and for example covers ranges from 200 m toover 1 km for Germany, about 11 km for Europe (based onmore than 900 principal weather stations) and to about 100km for the global approaches that are based on the climatesimulation of Max-Planck Institute MPI Hamburg (seeFigure 4 as example).
2.2.4 Urban bioclimatology (UBIKLIM)
For urban planning purposes with the aim of creating andsafeguarding healthy environmental conditions modellingseems to be the appropriate method to generate the relevantdata. In order to meet the needs of urban planners the UrbanBioclimate Model UBIKLIM was developed by DWD as anexpert system that utilizes available knowledge in urbanclimate science in an objective procedure for practical appli-cations (Friedrich et al., 2001). Using GIS-techniquesUBIKLIM simulates the thermal environment in the urbanboundary layer that depends on the kind of land use, i.e. thegiven or planned settlement structure (these are the planningvariables to be transformed into boundary layer parameters).Interactions between neighbouring structures, the topogra-phy (local scale), and the meso- and macro-scale climate aretaken into account. As input data UBIKLIM needs a digitalheight model with a 10 m resolution and appropriate land useinformation. Here dividing the urban area into a limitednumber of districts is sufficient, each characterized by its ownland use type. The main types are water, forest, parks, mead-ows, paved and unpaved open spaces and built-up areas. Inorder to be able to work out the varying urban structure, thebuilt-up area is divided up further considering degree of pave-ment area, building density, building height, degree ofgreenery. The result is a widespread and detailed bioclimatemap on the horizontal heat load distribution with 10 m reso-lution that provides the necessary information for urbanplanners, health professionals, and other decision makers.
2.2.5 Health resort climatology
The DWD human biometeorological unit serves as the mainauthority for the definition and updating of climatological
7Guidelines on Biometeorology and Air Quality Forecasts
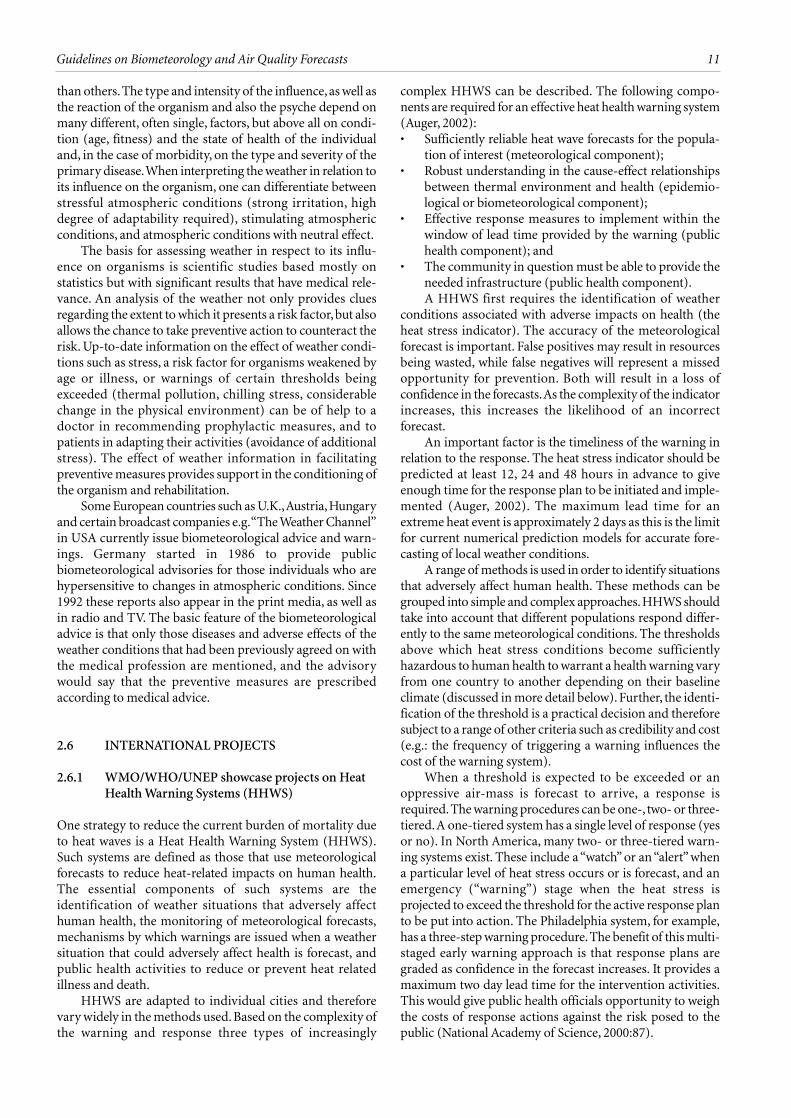
Figure 3—Mean relativedeviation of MR for classesof mean PT of the previousday (class width: 4 K, rangebars: confidence interval atthe 0.05 significance level).The line shows the meansseasonal relationshipbetween the monthlymeans of MR and PT, resp.The numbers indicate themonths.
10
5
0
10
-16 -12 -8 -4 0 4 8 12 18242016
12
3
4
56
879
10
11
12
MRTOT
cold stress heat load

guidelines and standards for health resorts and spas. Acommunity only gets its status after having gone trough anapproval process that is based on these standards. For specialapplication in climatic health resorts the product KURKLIMhas been developed that consists of several modules, such as(a) an evaluation of the fundamental suitability of thethermal environment for therapeutical applications (10 mresolution), (b) a thermophysiological assessment of thehiking trails, (c) a procedure to utilize real-timemeteorological data of the health resort for therapeuticalpurposes.
2.3 RADIATION
2.3.1 UV-index
Depletion of stratospheric ozone has led to an increasedexposure to ultraviolet-B (UV-B) radiation which in turn hasaffected the environment and human health. UV-B radiationis responsible for a wide range of potentially damaginghuman and animal health effects, particularly to the skin,eyes and the immune system. Human exposure to UV-Bdepends upon the location, the duration and timing ofoutdoor activities and precautionary attire such as sunglasses,long-sleeved clothings, sunscreen lotions, etc. UV-Bcontributes to severe damage of the cornea, lens and retina ofthe human eye. Long exposures to UV-B radiation can resultin photokeratitis or “snow-blindness”. Lifetime cumulativeexposures contribute to the risk of cataracts and other formsof ocular damage.
In addition, excessive exposure may have consequencesranging from premature ageing of the skin to skin cancer,which has become one of the most common types of cancer.Frequent and intense exposure to sunlight with sunburn,especially in infancy and childhood, encourages the forma-tion of malignant melanoma. The number of new growths ofmalignant melanoma has doubled every 7 to 8 years over the
past 40 years. This can be attributed to the change in leisurebehaviour which equates a sporty suntan with good health.
It should be noted that the UV flux received in countriessituated near the equatorial zone is high and while the localpopulation is better genetically adapted to the adverse effectsof UV-B, often visitors from higher latitudes to these regionsare exposed to high doses without getting adequate informa-tion and advice for protection, NMSs in such countries areencouraged to endeavour to provide information on the levelsof expected UV radiation in their areas of responsibility forthe protection of their own citizens as well as visitors.Nevertheless, ultraviolet rays also have positive properties.They stimulate the formation of vitamin D3, which is impor-tant for formation of bones.A very low dose of ultraviolet raysis, however, sufficient for this and lies far below the thresholdof sunburn.
The UV index (UVI) is a simple means of measuringthe strength of ultraviolet rays that cause sunburn and isgiven as a daily maximum. The UVI was developed throughan international effort by the World Health Organization(WHO), WMO, the United Nations EnvironmentProgramme (UNEP), the International Commission on Non-Ionizing Radiation Protection (ICNIRP) and the GermanFederal Office for Radiation Protection. A booklet jointlyprepared by these organizations entitled Global Solar UVIndex,A Practical Guide contains valuable information aboutthe scheme of reporting the UVI as well as sun protectionmessages and the Internet links of the organizations thatreport the UVI. Since its initial publication in 1995, severalinternational meetings of experts have been convened withthe aim to harmonize the reporting of UVI and to improve itsuse as an educational tool to promote sun protection. Theindex which is standard worldwide, takes cloud cover andthe thickness of the ozone layer, which have a direct influenceon the ultraviolet rays reaching the ground, into account. Incentral Europe the index has winter values of between 0 and1 (low). In the summertime, the index values are in the rangeof 5 to 7 (high) in the northern, western and central Europe,
Chapter 2 — Human Biometeorology8
453627189
453627189
3627
189
3627
189
0 4 8 12
4
6
8
10
12
14
16
18
20
22
24
26
Frequency of heat
Berlin
Figure 4—The frequencyof heat load conditions inBerlin/Germany based onUBIKLIM-simulation in10 m grids
whereas the values in the southern mainland Europe andislands such as the Canary Islands can be as high as 9 to 11(very high to extreme). However, it should be noted that veryhigh values of 9 to 11 may also be found in high Alpineregions in Europe.
An example of a country where extensive work on UVradiation has been done is Canada. Today there are 13 Ozonemonitoring sites across Canada: 10 across southern/centralCanada and 3 in the high Arctic at Resolute Bay, Eureka, andAlert. Exposure to ultraviolet radiation from the sun hasalways been a risk to human health. In the last twenty years,however, those risks have increased as man-made chemicalshave caused a thinning of the ozone layer.With the depletionof the ozone layer there has been a corresponding increase inthe ultraviolet radiation reaching the surface. Since 1982 agradual thinning of the ozone layer has been observed.Measurements show that the ozone layer over southernCanada is today about 7 per cent thinner than it was before1982. Ozone depletion is most pronounced in the springtimewhen photochemical activity is greatest in the stratosphere.At this time of the year, depletion rates as high as 10 to 20 percent have occurred over central Canada.
It is estimated that more than 71 000 new cases of skincancers were diagnosed across Canada in 2 000 and over 800people died from a particular kind of skin cancer known asmelanoma. Skin cancers take a long time to develop –anywhere from 10 to 30 years – so early prevention is veryimportant. In 1998,Environment Canada in partnership withHealth Canada started the Children’s UV Index SunAwareness Program. The programme teaches students underthe age of 14 about the UV Index and how to use it to mini-mize the risk to their health from solar ultraviolet radiation.
In Canada, the UV Index ranges from 0 to 10 and isissued for 48 locations. The UV Index forecast is the maxi-mum value expected for a given day usually around solarnoon and are included as a routine forecast element in thepublic forecast bulletins from April through September.Generally, the UV index is higher at lower latitudes. However,the UV Index is also dependent on altitude, reflection, andclouds. Generally, the process for forecasting the UV Index isas follows:
1. The thickness of the ozone layer across North Americais forecast using the computer weather predictionmodels.
2. These values are then corrected based on observationsfrom the 12 ozone-monitoring stations across Canada.
3. This information along with variables on latitude andtime of year, is then fed into mathematical algorithms toproduce the clear sky UV Index for each desiredlocation.
4. The cloud and precipitation forecasts are generated bymeteorologists in each of the regional forecast centresacross Canada and are assigned a transmission factor,which is then used to adjust the clear-sky UV forecast.
2.3.2 UV index in Europe
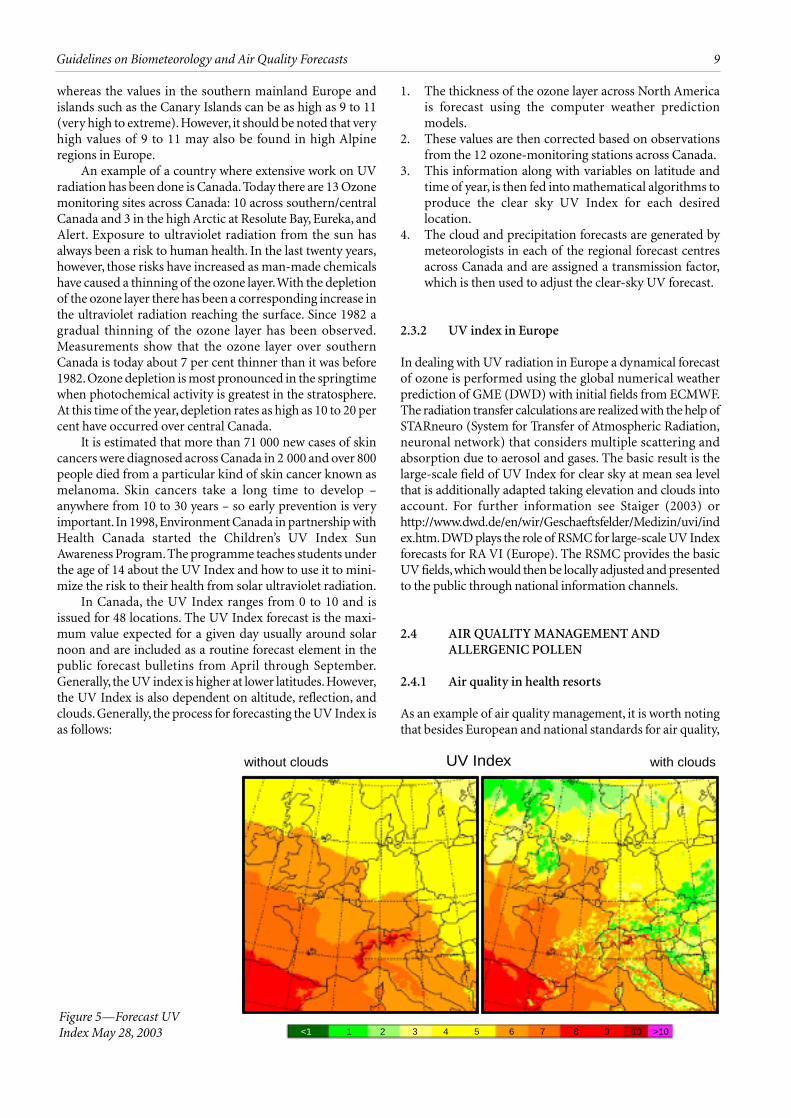
In dealing with UV radiation in Europe a dynamical forecastof ozone is performed using the global numerical weatherprediction of GME (DWD) with initial fields from ECMWF.The radiation transfer calculations are realized with the help ofSTARneuro (System for Transfer of Atmospheric Radiation,neuronal network) that considers multiple scattering andabsorption due to aerosol and gases. The basic result is thelarge-scale field of UV Index for clear sky at mean sea levelthat is additionally adapted taking elevation and clouds intoaccount. For further information see Staiger (2003) orhttp://www.dwd.de/en/wir/Geschaeftsfelder/Medizin/uvi/index.htm.DWD plays the role of RSMC for large-scale UV Indexforecasts for RA VI (Europe). The RSMC provides the basicUV fields,which would then be locally adjusted and presentedto the public through national information channels.
2.4 AIR QUALITY MANAGEMENT ANDALLERGENIC POLLEN
2.4.1 Air quality in health resorts
As an example of air quality management, it is worth notingthat besides European and national standards for air quality,
9Guidelines on Biometeorology and Air Quality Forecasts
without clouds with cloudsUV Index
<1 1 2 43 5 6 7 8 9 10 >10
Figure 5—Forecast UVIndex May 28, 2003

special air quality regulations exist in Germany for healthresorts. The goal is to prevent not only adverse effects onhuman health but to provide sufficient air quality for medicaltreatment and recovery. For this task special methods for airpollution monitoring have been developed by DWD espe-cially for particulate matter, NO2 and benzene. Passivesampling methods have been proved to be an appropriatetechnique and are in practical operation in German healthresorts. These methods are characterised by their low costand easy use.
2.4.2 Allergenic pollen grains
An example of how pollen is treated in relation to healthproblems is that of Germany. More than 10 per cent of theGerman population suffers from pollinosis,and this tendencyis on the increase. The main allergenic pollen grains are fromhazelnut, birch, alder, grasses, rye, and mugwort. The region-alised daily pollen forecast is based on the weather forecast ofDWD (particularly on wind flow and precipitation), onmeasured pollen data from about 50 stations (network ofFoundation Pollen Information Service), and on up-to-datephenological data. Forecast texts are automatically generated.A joint MeteoSwiss-DWD research project on automaticdetection of allergenic pollen grains based on fluorescencemicroscopy and pattern recognition techniques was success-fully completed recently (Ronneberger et al., 2002). Thisknowledge will be utilised in another multidisciplinaryproject to develop an automatic measuring device. The long-term objective is the establishment of a new pollen network.
2.5 WEATHER AND HEALTH (BIOTROPY)
Beyond the above discussed issues numerous independentstudies verify the impact of weather, in particular of weatherchanges on human beings, resulting in deterioration incardio-vascular and respiratory diseases,occurrence of bloodclotting, aggravating inflammation and increased risks of
occupational and traffic accidents. Other effects aresubsumed under the term subjective impairment in well-being and include sleep disturbances, problems withconcentration, headache and fatigue.
The human organism is obviously forced to respond tothe weather-related stress called “biotropy”in order to remainhomeostasis (in stable equilibrium). For weakened orimpaired human beings the organism reacts insufficientlyresulting in a so-called ARS (atmosphere related syndrome).Several independent public opinion polls last year found outquite consistently that about 50 per cent of the populationfeels concerned about weather-related stress. Increasedbiotropy can be interpreted as an increased health risk.
Studies in this field require problem-tailored weatherclassifications. As an example, one can note the procedurefollowed at DWD which is based on a vorticity approach inorder to specify the different patterns of highs and lows withtheir typical advections and other dynamic processes.However, in spite of the successful use of biosynoptic classi-fications such a holistic approach does not really allow insightin cause-effect relationships. Every day DWD disseminatesrelevant medical-meteorological 48-hour forecasts for 11regions (Medical-Meteorological Information Service).
2.5.1 Human biometeorological advice
“Weather”is the description of the meteorological part of thephysical environment of the human beings in the form of astate or a change of state. It is very significant in people’sconsciousness due to its influence on so many aspects of life,including the health sector. Interfaces between the organismand weather can, on the one hand, be defined physiologicallyand thus causally, through the meteorological elements. Onthe other hand, such stresses can be defined only via stochas-tic relations, whereby mostly the symptoms of the reactionscan be explained.
The influence of the weather is usually not ascribed tosingle meteorological elements, but registers as a collection ofinfluences in which some elements can carry more weight
Chapter 2 — Human Biometeorology10
Figure 6—Main allergicpollen grains of CentralEurope
Hazel
Grass
Alder
Rye
Birch
Mugwort
than others. The type and intensity of the influence, as well asthe reaction of the organism and also the psyche depend onmany different, often single, factors, but above all on condi-tion (age, fitness) and the state of health of the individualand, in the case of morbidity, on the type and severity of theprimary disease.When interpreting the weather in relation toits influence on the organism, one can differentiate betweenstressful atmospheric conditions (strong irritation, highdegree of adaptability required), stimulating atmosphericconditions, and atmospheric conditions with neutral effect.
The basis for assessing weather in respect to its influ-ence on organisms is scientific studies based mostly onstatistics but with significant results that have medical rele-vance. An analysis of the weather not only provides cluesregarding the extent to which it presents a risk factor, but alsoallows the chance to take preventive action to counteract therisk. Up-to-date information on the effect of weather condi-tions such as stress, a risk factor for organisms weakened byage or illness, or warnings of certain thresholds beingexceeded (thermal pollution, chilling stress, considerablechange in the physical environment) can be of help to adoctor in recommending prophylactic measures, and topatients in adapting their activities (avoidance of additionalstress). The effect of weather information in facilitatingpreventive measures provides support in the conditioning ofthe organism and rehabilitation.
Some European countries such as U.K.,Austria,Hungaryand certain broadcast companies e.g.“The Weather Channel”in USA currently issue biometeorological advice and warn-ings. Germany started in 1986 to provide publicbiometeorological advisories for those individuals who arehypersensitive to changes in atmospheric conditions. Since1992 these reports also appear in the print media, as well asin radio and TV. The basic feature of the biometeorologicaladvice is that only those diseases and adverse effects of theweather conditions that had been previously agreed on withthe medical profession are mentioned, and the advisorywould say that the preventive measures are prescribedaccording to medical advice.
2.6 INTERNATIONAL PROJECTS
2.6.1 WMO/WHO/UNEP showcase projects on HeatHealth Warning Systems (HHWS)
One strategy to reduce the current burden of mortality dueto heat waves is a Heat Health Warning System (HHWS).Such systems are defined as those that use meteorologicalforecasts to reduce heat-related impacts on human health.The essential components of such systems are theidentification of weather situations that adversely affecthuman health, the monitoring of meteorological forecasts,mechanisms by which warnings are issued when a weathersituation that could adversely affect health is forecast, andpublic health activities to reduce or prevent heat relatedillness and death.
HHWS are adapted to individual cities and thereforevary widely in the methods used. Based on the complexity ofthe warning and response three types of increasingly
complex HHWS can be described. The following compo-nents are required for an effective heat health warning system(Auger, 2002):• Sufficiently reliable heat wave forecasts for the popula-
tion of interest (meteorological component);• Robust understanding in the cause-effect relationships
between thermal environment and health (epidemio-logical or biometeorological component);
• Effective response measures to implement within thewindow of lead time provided by the warning (publichealth component); and
• The community in question must be able to provide theneeded infrastructure (public health component).A HHWS first requires the identification of weather
conditions associated with adverse impacts on health (theheat stress indicator). The accuracy of the meteorologicalforecast is important. False positives may result in resourcesbeing wasted, while false negatives will represent a missedopportunity for prevention. Both will result in a loss ofconfidence in the forecasts.As the complexity of the indicatorincreases, this increases the likelihood of an incorrectforecast.
An important factor is the timeliness of the warning inrelation to the response. The heat stress indicator should bepredicted at least 12, 24 and 48 hours in advance to giveenough time for the response plan to be initiated and imple-mented (Auger, 2002). The maximum lead time for anextreme heat event is approximately 2 days as this is the limitfor current numerical prediction models for accurate fore-casting of local weather conditions.
A range of methods is used in order to identify situationsthat adversely affect human health. These methods can begrouped into simple and complex approaches.HHWS shouldtake into account that different populations respond differ-ently to the same meteorological conditions. The thresholdsabove which heat stress conditions become sufficientlyhazardous to human health to warrant a health warning varyfrom one country to another depending on their baselineclimate (discussed in more detail below). Further, the identi-fication of the threshold is a practical decision and thereforesubject to a range of other criteria such as credibility and cost(e.g.: the frequency of triggering a warning influences thecost of the warning system).
When a threshold is expected to be exceeded or anoppressive air-mass is forecast to arrive, a response isrequired. The warning procedures can be one-, two- or three-tiered.A one-tiered system has a single level of response (yesor no). In North America, many two- or three-tiered warn-ing systems exist. These include a “watch” or an “alert” whena particular level of heat stress occurs or is forecast, and anemergency (“warning”) stage when the heat stress isprojected to exceed the threshold for the active response planto be put into action. The Philadelphia system, for example,has a three-step warning procedure. The benefit of this multi-staged early warning approach is that response plans aregraded as confidence in the forecast increases. It provides amaximum two day lead time for the intervention activities.This would give public health officials opportunity to weighthe costs of response actions against the risk posed to thepublic (National Academy of Science, 2000:87).
11Guidelines on Biometeorology and Air Quality Forecasts
There are many different levels of response. The basic(passive) response is the issue of a warning of high tempera-tures (heat stress conditions) through the mass media (TV,radio, public websites). In the USA, NOAA issues specialweather statements and/or public information statementspresenting a detailed discussion of:
• The extent of the hazard, including MHI values;• Who is most at risk;• Safety rules for reducing the risk.NOAA also assists state and local health officials in
preparing Civil Emergency Messages in severe heat waves.Meteorological information from Special Weather Statementsare included as well as more detailed medical information,advice, and names and telephone numbers of health officials.
Public warnings are aimed at the wider community inorder to modify the behaviour of individuals and to increaseawareness of the dangers that are connected with heat expo-sure in order to reduce heat related impacts. Therefore,warnings need to be linked to specific advice on how peoplerecognise the problem and what they should do to protectthemselves and others. The CDC (Centers for DiseaseControl and Prevention in Atlanta) have issued guidelines forreducing heat related illness. These guidelines summarise thegeneral advice that is issued throughout North America,Australia and Europe. It is worth to remark that the adviceconcerning the use of fans is not quite correct. To use fanseven when temperature exceeds 35°C can provide comfort,because normally the increase in evaporative heat loss ishigher than the increase in sensible heat gain. However, theremust be an increased intake in liquids to avoid dehydration.
The warning may be targeted at health or welfare serviceproviders. Intervention activities that are in place in theUnited States include (Kalkstein, 2001):• Media announcement that provide information on how
to avoid heat related illnesses during oppressive weather;• Promotion of the “buddy” system. Media announce-
ments encourage friends,relatives,neighbours,and othervolunteers to make daily visits to elderly persons duringhot weather;
• Activation of “Heatline”, which provides informationand counselling to the general public on avoidance ofheat stress;
• Home visits, department of Health field teams makehome visits to persons requiring more attention thancan be provided over the Heatline;
• Nursing and personal care boarding home interventions.When a warning is issued, these facilities are informed ofthe high-risk heat situation;
• Halt of utility service suspensions during warm periods;• Increased medical emergency staffing;• Daytime outreach to the homeless.
Intervention plans should be best suited to local needs,through coordination between the local health agencies andmeteorological officials (Cegnar & Kalkstein, 1999). Acomprehensive warning system should involve multipleagencies, such as: city managers, public health and socialservices workers, and emergency medical officers. However,the vast majority of systems are controlled by themeteorological agency and have little practical involvementfrom other agencies.
Based on the good experience with the HHWS inPhiladelphia and in some other North-American cities,WMO/WHO/UNEP sponsors Showcase Projects in Romeand Shanghai in order to show the value of these systems forall countries that sometimes suffer from heatwaves.
2.6.2 Climate Change and Adaptation Strategies forHuman Health in Europe (cCASHh)
The key objectives of the cCASHh (climate Change andAdaptation Strategies for Human health in Europe) projectfunded by the European Commission are:• To identify the vulnerability of European populations to
adverse impacts of climate change on human health;• To review current measures, technologies, policies and
barriers to improve the adaptive capacity of humanpopulations to climate change;
• To identify for European populations the most appro-priate measures, technologies and policies, as well as themost effective approaches to implementation, in order tosuccessfully adapt to climate change;
• To provide estimates of health benefits of specific strate-gies or combination of strategies for adaptation forvulnerable populations under different climate changescenarios;
• To estimate the costs (due to climate-related damage andthe implementation of adaptive measures) and benefits(both of climate change and of adaptation strategies)including co-benefits independent of climate change.Research within the cCASHh project is divided into
eleven work-packages (WP1: coordination,WP2: conceptualframework, WP3: vulnerability assessment thermal stresses,WP4: vulnerability assessment extreme weather events,WP5:vulnerability assessment vector borne disease, WP6:vulnerability assessment water and food borne disease,WP7:policy analysis, WP8: economic analysis, WP9: integratedassessment model thermal stresses, WP10 integratedassessment model - vector borne diseases, WP11dissemination and outreach). Work-package 3 deals withvulnerability to thermal stresses and has the followingobjectives:• Identify populations in Europe who are particularly
vulnerable to heat stress and identify and reduce thisvulnerability;
• Identify and evaluate adaptation strategies.As part of the WP 3 work and in collaboration with DWD, the
London School of Hygiene and Tropical Medicine andthe WHO European Centre for Environment and Health,a workshop was organised and conducted to:
• Identify the potential impacts of climate change on heatrelated morbidity and mortality;
• Review and evaluate existing short-term and long-termadaptation measures;
• Make recommendations for the implementation andevaluation of heat health warning systems and appro-priate other strategies to reduce heat stress;
• Identify information gaps and research needs.During the workshop, the current state of knowledge of
the potential to reduce heat stress through urban planning
Chapter 2 — Human Biometeorology12
13Guidelines on Biometeorology and Air Quality Forecasts
and Heat Health Warning Systems was presented,with a focuson developing criteria for evaluation of their effectiveness.
2.7 APPROACHES TO MANAGEMENT ANDOPERATION OF HUMANBIOMETEOROLOGY PROGRAMS
2.7.1 Role of Regional Specialized MeteorologicalCentres (RSMCs)
RSMCs are centres established within the WMO frameworkto carry out specific functions in the different categoriesdescribed below.
2.7.1.1 RSMCs with geographical specialization
RSMCs with geographical specialization are designated inWMO Regions, capable of preparing with the support ofWMCs (World Meteorological Centres), and whereapplicable RSMCs outside the Region, analyses and short-,medium-, extended- and long-range weather forecasts withthe highest possible quality and with meteorological content,geographical coverage and frequency required by Membersand agreed for the system. Output products from RSMCscomprise:(a) Analyses and prognoses at the surface and/or in the free
atmosphere for short-, medium-, extended- and long-ranges, for the tropical, subtropical and extra-tropicalareas, according to the obligations of each RSMC and asagreed by the Regional Association;
(b) Interpreted forecasts of specific weather parameters inmap form or at specific locations (e.g. precipitationamounts, temperature, wind, humidity, etc.), subject toagreement between Members, where appropriate;
(c) Guidance on storm-position and track forecasts for theareas affected by tropical storms;
(d) Climate analyses, long-range forecasts, onset, intensityand cessation of the rainy season(s);
(e) Environmental quality monitoring and predictions, suchas UV-B (see 2.3.1);
(f) Results of forecast verifications and intercomparisonstudies.
2.7.1.2 RSMCs with activity specialization
Regional Specialized Meteorological Centre (RSMC) withactivity specialization are designated, subject to the formalcommitment by a Member or group of cooperatingMembers, to fulfil the required functions of the centre andmeet the requirements for the provision of World Weather
Watch products and services initiated and endorsed by therelevant WMO constituent body or bodies concerned. Thecentre should be capable of preparing independently or withthe support of WMCs, and where appropriate, other GlobalData Processing and Forecast System (GDPFS) centres anddisseminating to Members concerned:(a) Global medium-range forecasts and related analyses;(b) Extended- and long-range weather forecasts and related
mean analysed values and anomalies;(c) Tropical cyclone warnings and advisories, storm posi-
tion, intensity and track forecasts for their areas;(d) Three-dimensional environmental emergency response
transport model trajectories, integrated pollutantconcentration, and total deposition;
(e) Drought monitoring products such as drought indices.
2.7.1.3 RSMCs with non-real-time activities
The functions of an RSMC should also include the followingnon-real-time activities:(a) Assistance in the management of non-real-time data
involving:(i) Assistance to the WMC in management and main-
tenance of non-real-time data, in particular byobtaining late and delayed observational data for itsarea of responsibility;
(ii) Storage and retrieval of basic observational data andprocessed information needed to discharge the non-real-time responsibilities of the RSMC;
(iii) Making non-real-time data available to Membersor research institutes upon request;
(b) Development and refinement of new techniques andapplications;
(c) Carrying out comparative verifications of RSMC prod-ucts and making results available to all Membersconcerned;
(d) Regular exchange with other centres of information ontechniques and procedures used and results achieved;
(e) Providing opportunities for training of personnel inmanual and automated techniques;
(f) Continuously updating and providing, on request, acatalogue of available products.
2.7.1.4 Future developments
Similar to the RSMCs described above, if established, centreswith responsibility to issue human biometeorological and airquality products may benefit the general public as well asgovernment authorities and decision makers through adviceand information on human health issues related to weatherand climate.
3.1 AIR QUALITY AND HEALTH
Air pollution comes from many different sources such asfactories, power plants, automobiles and even from naturalcauses such as windblown dust, smoke from bush fires andvolcanic eruptions. Air quality can be affected in many waysby the pollutants emitted from these sources. With the dete-rioration of air quality and a corresponding increase in healthproblems, many countries have started air quality monitor-ing programs, acid rain monitoring networks, ozonemonitoring and even air quality forecasting.
Although the air quality monitoring activities may notbe carried out by NMSs, nevertheless, weather plays animportant part in the development, dispersion and trans-portation of particulates, ground-level ozone, pathogenicgerms and gases. A few weather factors that will affect thechanges in air quality include air temperature, amount ofcloud cover, humidity, pressure, wind speed and the presenceof temperature inversion.
Air quality indices have been developed in many coun-tries for reporting the levels of the various pollutants in theatmosphere. These indices make it easier for the public tounderstand the health significance of air pollution levels.Airquality can be measured by a nationwide or local monitoringsystem that records pollutant concentration at strategic loca-tions throughout the country.
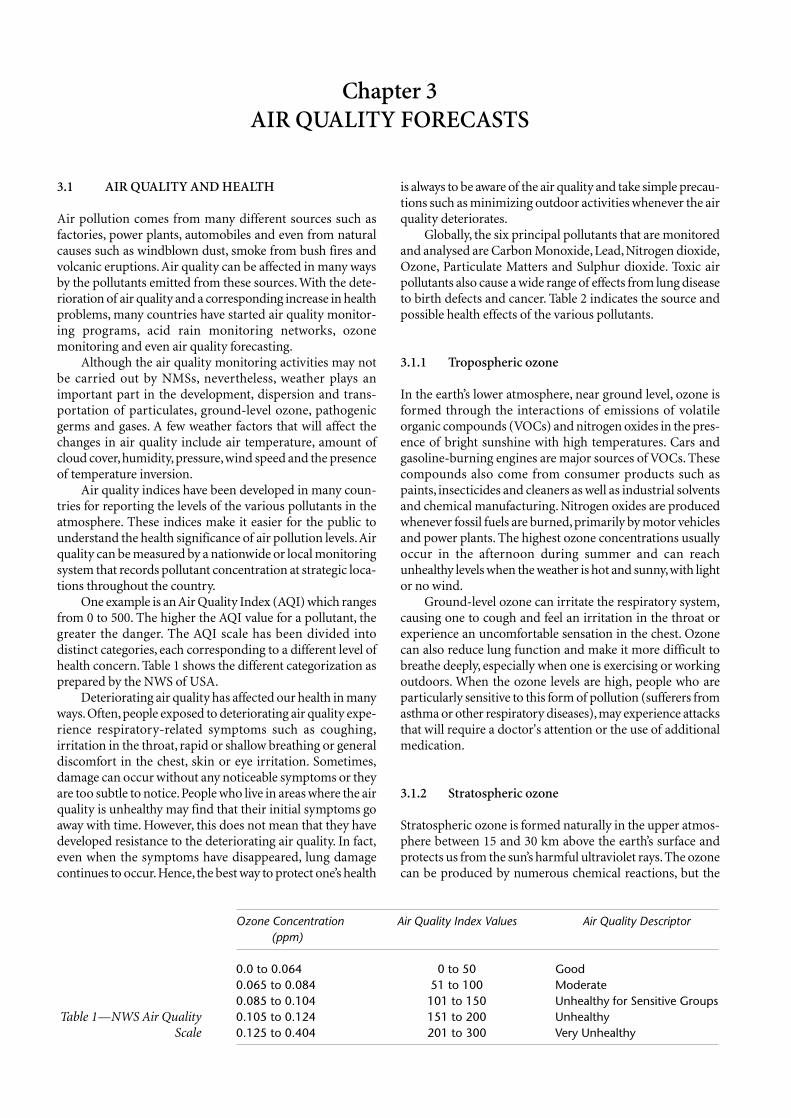
One example is an Air Quality Index (AQI) which rangesfrom 0 to 500. The higher the AQI value for a pollutant, thegreater the danger. The AQI scale has been divided intodistinct categories, each corresponding to a different level ofhealth concern. Table 1 shows the different categorization asprepared by the NWS of USA.
Deteriorating air quality has affected our health in manyways. Often, people exposed to deteriorating air quality expe-rience respiratory-related symptoms such as coughing,irritation in the throat, rapid or shallow breathing or generaldiscomfort in the chest, skin or eye irritation. Sometimes,damage can occur without any noticeable symptoms or theyare too subtle to notice. People who live in areas where the airquality is unhealthy may find that their initial symptoms goaway with time. However, this does not mean that they havedeveloped resistance to the deteriorating air quality. In fact,even when the symptoms have disappeared, lung damagecontinues to occur. Hence, the best way to protect one’s health
is always to be aware of the air quality and take simple precau-tions such as minimizing outdoor activities whenever the airquality deteriorates.
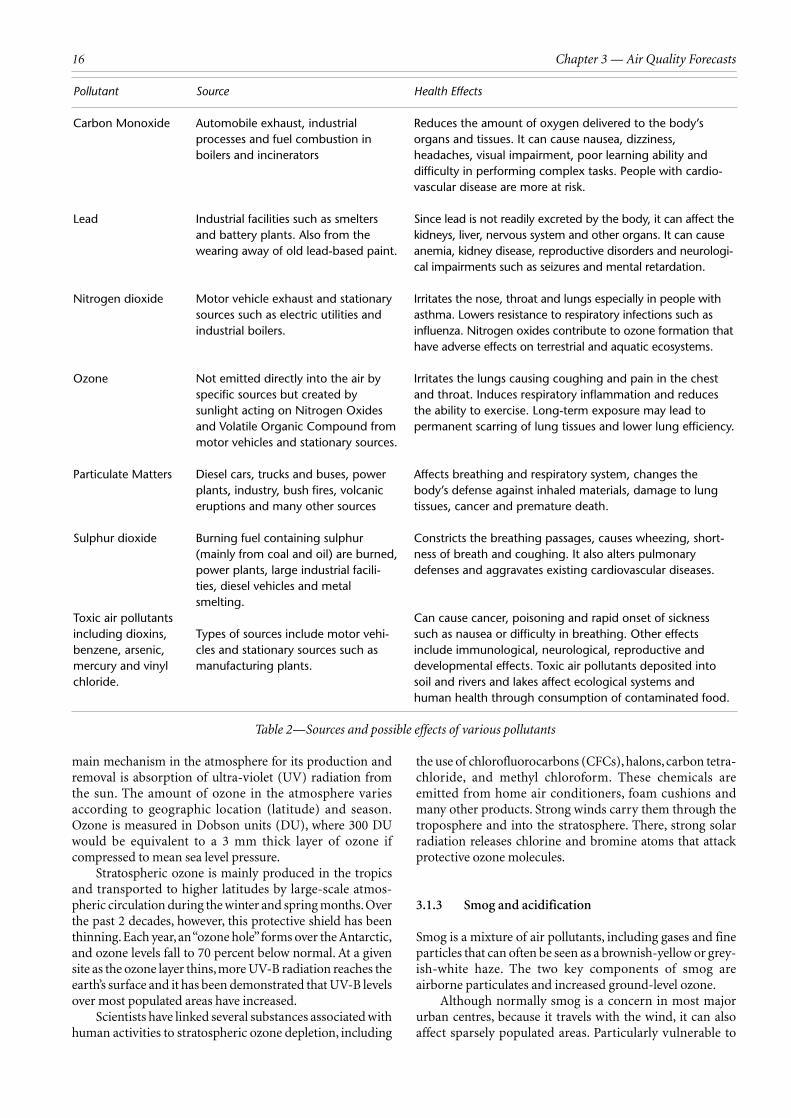
Globally, the six principal pollutants that are monitoredand analysed are Carbon Monoxide, Lead, Nitrogen dioxide,Ozone, Particulate Matters and Sulphur dioxide. Toxic airpollutants also cause a wide range of effects from lung diseaseto birth defects and cancer. Table 2 indicates the source andpossible health effects of the various pollutants.
3.1.1 Tropospheric ozone
In the earth’s lower atmosphere, near ground level, ozone isformed through the interactions of emissions of volatileorganic compounds (VOCs) and nitrogen oxides in the pres-ence of bright sunshine with high temperatures. Cars andgasoline-burning engines are major sources of VOCs. Thesecompounds also come from consumer products such aspaints, insecticides and cleaners as well as industrial solventsand chemical manufacturing. Nitrogen oxides are producedwhenever fossil fuels are burned, primarily by motor vehiclesand power plants. The highest ozone concentrations usuallyoccur in the afternoon during summer and can reachunhealthy levels when the weather is hot and sunny, with lightor no wind.
Ground-level ozone can irritate the respiratory system,causing one to cough and feel an irritation in the throat orexperience an uncomfortable sensation in the chest. Ozonecan also reduce lung function and make it more difficult tobreathe deeply, especially when one is exercising or workingoutdoors. When the ozone levels are high, people who areparticularly sensitive to this form of pollution (sufferers fromasthma or other respiratory diseases), may experience attacksthat will require a doctor's attention or the use of additionalmedication.
3.1.2 Stratospheric ozone
Stratospheric ozone is formed naturally in the upper atmos-phere between 15 and 30 km above the earth’s surface andprotects us from the sun’s harmful ultraviolet rays. The ozonecan be produced by numerous chemical reactions, but the
Chapter 3
AIR QUALITY FORECASTS
Ozone Concentration Air Quality Index Values Air Quality Descriptor(ppm)
0.0 to 0.064 0 to 50 Good0.065 to 0.084 51 to 100 Moderate0.085 to 0.104 101 to 150 Unhealthy for Sensitive Groups0.105 to 0.124 151 to 200 Unhealthy0.125 to 0.404 201 to 300 Very Unhealthy
Table 1—NWS Air QualityScale
main mechanism in the atmosphere for its production andremoval is absorption of ultra-violet (UV) radiation fromthe sun. The amount of ozone in the atmosphere variesaccording to geographic location (latitude) and season.Ozone is measured in Dobson units (DU), where 300 DUwould be equivalent to a 3 mm thick layer of ozone ifcompressed to mean sea level pressure.
Stratospheric ozone is mainly produced in the tropicsand transported to higher latitudes by large-scale atmos-pheric circulation during the winter and spring months. Overthe past 2 decades, however, this protective shield has beenthinning. Each year, an “ozone hole”forms over the Antarctic,and ozone levels fall to 70 percent below normal. At a givensite as the ozone layer thins, more UV-B radiation reaches theearth’s surface and it has been demonstrated that UV-B levelsover most populated areas have increased.
Scientists have linked several substances associated withhuman activities to stratospheric ozone depletion, including
the use of chlorofluorocarbons (CFCs), halons, carbon tetra-chloride, and methyl chloroform. These chemicals areemitted from home air conditioners, foam cushions andmany other products. Strong winds carry them through thetroposphere and into the stratosphere. There, strong solarradiation releases chlorine and bromine atoms that attackprotective ozone molecules.
3.1.3 Smog and acidification
Smog is a mixture of air pollutants, including gases and fineparticles that can often be seen as a brownish-yellow or grey-ish-white haze. The two key components of smog areairborne particulates and increased ground-level ozone.
Although normally smog is a concern in most majorurban centres, because it travels with the wind, it can alsoaffect sparsely populated areas. Particularly vulnerable to
Chapter 3 — Air Quality Forecasts16
Pollutant
Carbon Monoxide
Lead
Nitrogen dioxide
Ozone
Particulate Matters
Sulphur dioxide
Toxic air pollutantsincluding dioxins,benzene, arsenic,mercury and vinylchloride.
Source
Automobile exhaust, industrialprocesses and fuel combustion inboilers and incinerators
Industrial facilities such as smeltersand battery plants. Also from thewearing away of old lead-based paint.
Motor vehicle exhaust and stationarysources such as electric utilities andindustrial boilers.
Not emitted directly into the air byspecific sources but created bysunlight acting on Nitrogen Oxidesand Volatile Organic Compound frommotor vehicles and stationary sources.
Diesel cars, trucks and buses, powerplants, industry, bush fires, volcaniceruptions and many other sources
Burning fuel containing sulphur(mainly from coal and oil) are burned,power plants, large industrial facili-ties, diesel vehicles and metalsmelting.
Types of sources include motor vehi-cles and stationary sources such asmanufacturing plants.
Health Effects
Reduces the amount of oxygen delivered to the body’sorgans and tissues. It can cause nausea, dizziness,headaches, visual impairment, poor learning ability anddifficulty in performing complex tasks. People with cardio-vascular disease are more at risk.
Since lead is not readily excreted by the body, it can affect thekidneys, liver, nervous system and other organs. It can causeanemia, kidney disease, reproductive disorders and neurologi-cal impairments such as seizures and mental retardation.
Irritates the nose, throat and lungs especially in people withasthma. Lowers resistance to respiratory infections such asinfluenza. Nitrogen oxides contribute to ozone formation thathave adverse effects on terrestrial and aquatic ecosystems.
Irritates the lungs causing coughing and pain in the chestand throat. Induces respiratory inflammation and reducesthe ability to exercise. Long-term exposure may lead topermanent scarring of lung tissues and lower lung efficiency.
Affects breathing and respiratory system, changes thebody’s defense against inhaled materials, damage to lungtissues, cancer and premature death.
Constricts the breathing passages, causes wheezing, short-ness of breath and coughing. It also alters pulmonarydefenses and aggravates existing cardiovascular diseases.
Can cause cancer, poisoning and rapid onset of sicknesssuch as nausea or difficulty in breathing. Other effectsinclude immunological, neurological, reproductive anddevelopmental effects. Toxic air pollutants deposited intosoil and rivers and lakes affect ecological systems andhuman health through consumption of contaminated food.
Table 2—Sources and possible effects of various pollutants
smog are the elderly, those with existing heart or lung diseaseand small children. Even healthy adults can be adverselyaffected by high levels of smog.
Acidification is a serious environmental problem causedby emissions of sulphur dioxide, nitrogen oxides and ammo-nia. It has caused widespread damage to forests and soils, fishand other living organisms as well as to human health.Emissions of sulphur are the primary source of acidificationcaused by the burning of coal and oil from boilers in factoriesand plants or automobile fuel when the sulphur in the fuel isconverted into sulphur dioxide. Another source of sulphurdioxide is the uncontrolled burning of bush fires. Nitrogenoxides are produced during combustion and most of thenitrogen oxides come from traffic and combustion plants.
Acid deposition describes a process that is a combinationof wet and dry deposition. Most people are familiar with thewet acidic deposition known as acid rain. In the wet deposi-tion process, sulphuric and nitric acids are incorporated intocloud droplets during cloud formation. These raindrops willeventually fall onto the ground in the form of rain and snow.When high concentrations of acid are present, the rain showsstrong acidity.
Dry deposition refers to acidic gases and particles suchas gaseous sulphur dioxide, nitrogen oxides and nitric acid,as well as acid aerosols which are deposited directly whenthey contact and adhere to the surface of vegetation, soil andother materials during fine weather. Dry deposited gases andparticles can also be washed from trees and other surfaces byrainstorms. When that happens, the runoff water adds thoseacids to the acid rain, making the combination more acidicthan the falling rain alone.
Acidic dry deposition often lingers for one to two daysin the atmosphere before being returned to the ground.During this period, wind can carry these componentshundreds or even thousands of kilometres away from thesource of emissions. Hence, many thousand tonnes of acidicparticulates are transported across national borders.
Chemical reactions occur between acids and alkalinesubstances in the atmosphere to form compounds whichwhen inhaled, can affect human health. One of thesecompounds is ammonium sulphate, which is produced inlarge quantities during large-scale biomass burning events.The highly hygroscopic nature of ammonium sulphate allowsit to absorb moisture under humid conditions resulting in areduction of visibility or hazy conditions.
Sensitivity to acidification in the soil leads to a depletionof the mineral nutrients in the soil (such as calcium andmagnesium), thus reducing the fertility of the soil. The acid-ification process also releases aluminium and heavy metalsinto the ground water that can harm the microorganisms inthe soil that are responsible for decomposition, as well asanimals and birds in the food chain. The sensitivity of indi-vidual species to acidification varies, with the most sensitivegroup being fish, moss, fungi and microorganisms.
Rain water is naturally acidic due to the presence ofcarbon dioxide and other naturally produced acidic gases inthe atmosphere. The pH of rainwater varies at different loca-tions. PH of rain water from remote islands is found to havea value of between 5.6 and 6.0. Generally, rain water with pHless than 5.6 is considered acidic.
3.1.4 Particulate matters
Particulate matters are mostly of microscopic dimensions float-ing around in the air,and as such cannot be seen by the nakedeye.Particulates can come in almost any shape or size and canbe solid particles or liquid droplets tiny enough to remainsuspended or floating in the air for up to weeks at a time.
Particles originate from a variety of natural and man-made sources such as diesel trucks, woodstoves, and powerplants and their chemical and physical compositions varywidely. Particulate matter can be directly emitted or can beformed in the atmosphere when gaseous pollutants such assulphur dioxide and nitrogen oxide react to form fine particles.
Of greatest concern to the public health are the particlessmall enough to be inhaled into the deepest parts of the lung.These “coarser” particles, known as PM10, are less than 10microns in diameter. Sources of coarse particles includemold, spores, pollens and dust from paved or unpaved roads.The “fine” particulate matter, known as PM2.5, has a specificrange of 2.5 micron or less. Sources of fine particles includeall types of combustion (motor vehicles, power plants, woodburning, bush fires, etc) and some industrial processes.
On any given day, scientists estimate that about 10million tons of solid particulate matter are suspended in theatmosphere. The deposition of Particulate Matter on metals,wood, stone, electronics and fabric may cause soiling anddiscoloration and physical and chemical degradation ofmaterials through the action of acidic particles. Particulatematter is also associated with reduced visibility and with poorair quality.
3.1.5 Environmental emergency response
Important release of hazardous materials (radiological,chemical,or biological) into the atmosphere and water bodiesconstitutes a major threat to life and safety of mankind andcan take on international or even global dimensions. Theseenvironmental emergencies can be associated withunplanned events resulting from natural events (such asvolcanic eruptions, wild fires caused by lightning, etc.), acci-dents (typically unplanned and sudden) and/or near misses.These environmental emergencies can also result fromplanned events such as wars and/or malevolent acts.Whatever the cause behind the environmental emergency, itis the task of NMHSs to supply the best possible advice andmeteorological information to the government authoritiesresponsible for environmental emergency response activi-ties. And it is the purpose of the Emergency ResponseActivities programme of WMO is to coordinate with otherrelevant international agencies to ensure optimumprogramme effectiveness and to support NMHSs in theirrole as meteorological (and often hydrological) authority.
3.1.5.1 Radioactivity
Though radioactivity has both natural and anthropogenicsources the catastrophe of Chernobyl was the main reason ofthe development of modelling systems to forecast the
17Guidelines on Biometeorology and Air Quality Forecasts

atmospheric transport of radioactivity and to start theEmergency Response Activities programme of WMO.
Natural radiation has been part of the universe since itscreation. It stems from the decay of nuclei in the earth's crustand from cosmic radiation. The levels vary geographically,depending on local rock formations.
In addition to natural radiation, radioactivity has alsobeen artificially generated for medical purposes such as foruse in radiotherapy, scanners, scintigraphy, etc. as well as inindustrial instrumentation and in nuclear weapons andnuclear fuel plants.
Living cells can be damaged by ionizing radiation whichis emitted during radioactivity. The dosage of radiation expo-sure depends first on whether the exposure is external orinternal, the latter from inhaling or ingesting radionuclides.Other factors include the mobility of different radionuclidesin the environment.
At low dosage, the main concern is an increased risk ofcancer. Radiation can also affect germ cells increasing therisk of genetic damage. At higher doses, radiation above acertain threshold dose kills cells, causing radiation sickness.Most people exposed to such high doses have been in thevicinity of severe accidents with radioactive material, such asthe fire fighters at the Chernobyl nuclear power plant in 1986or near nuclear bomb explosions, such as the residents ofHiroshima and Nagasaki in 1945. The first symptoms of radi-ation sickness are nausea,vomiting and reddening of the skin.
3.1.5.2 Chemical accidents
The number and size of industrial and chemical plants haveincreased rapidly in recent years producing millions tobillions of tonnes of chemical products each year. Theseplants are complex, releasing large amount of toxic materialsdaily into the atmosphere. Risk on human health and theenvironment posed by chemicals is determined by chemi-cal-specific hazard properties as well as the amount ofexposure to the chemicals.
The probability of the occurrence of a chemical inci-dent, be it accidental or intentional release of hazardous orflammable materials, is on the increase. Weather parametersplay an important role in the dispersion and transport ofthese chemical releases downstream. In order to supportemergency response and rescue, current weather condition aswell as forecasted condition will provide the necessary infor-mation needed to move people out of the danger zone. For amajor chemical accident involving toxic gases, high precisionenvironmental modelling software that can simulate thedispersion of pollutants emitted into the atmosphere underdifferent conditions, can be used to provide more accurateinformation to combat the spread of the dispersion of thesetoxic pollutants as well as used in vacating people out ofharm’s way.
3.1.5.3 Forest fires
Although forest fires have been and still are considered anatural hazard, a variety of factors in the environment, such
as ease of ignition, lack of moisture, environmental temper-ature, strong wind, etc plays an important role in theincreased incidence of forest fires.
In 1997, the out-of-control forest fires in Sumatra andKalimantan, Indonesia spewed out a thick blanket of hazeover the whole South East Asia (SEA), pushing the air pollu-tion over the whole region to extremely dangerous levels. Theextremely dry weather conditions due to ENSO as well asindiscriminate burning led to this situation.
In response to the environmental disaster over the SouthEast Asian Region, a monitoring and warning system forforest/vegetation fires was developed and implemented.Adopted from the Canadian Forest Fire Danger RatingSystem, the SEA Fire Danger Rating System (FDRS) producesthe SEA Fire Danger Rating products on a daily basis.
The FDRS monitors forest/vegetation fires risk and canbe used to predict fire behaviour. This product is useful as aguide for policy makers in developing action plans to protectlife, property and the environment in the region.
3.1.5.4 Volcanic eruptions
In Volcanic eruptions, rocks and fragments are blasted intothe air by explosions or carried upwards by hot gases in erup-tion columns. Such fragments range in size from less than 2mm to more than 1 m in diameter. Large size particles fallback to the ground on or close to the volcano and progres-sively smaller fragments are carried away by the wind. It is thesmallest fragments, the volcanic ash, that can travel hundredsto thousands of kilometres downwind from a volcano thathas serious impacts on the environment.
Volcanic ash is disruptive to economic activity becauseit is highly abrasive, infiltrates almost every opening and italso affects the health of the population, in particular peoplewith respiratory-related health problems. Volcanic ash canbe a serious hazard to aviation even thousands of miles froman eruption. Airborne ash can diminish visibility, damageflight control systems, and cause jet engines to fail. In addi-tion, its abrasive effects can lead to severe damage to theaircraft’s exterior.
3.1.6 User requirements
Environmental monitoring, usage of environmental infor-mation and forecasts involve many sectors. For effectivedecision-making and usage, user requirements must be pre-determined. Regular coordination meetings with all usersincluding policy makers, enforcement agencies, healthauthorities, emergency response agencies are essential andfeedback mechanisms must be in place to ensure usefulnessof the information.
3.2 ATMOSPHERIC TRANSPORT MODELLING
Atmospheric transport models are important tools used forthe forecasting and nowcasting of geographical distributionof air pollutants, simulating plume behaviour and predicting
Chapter 3 — Air Quality Forecasts18
pollution dispersion and deposition over an area. They arealso used by policy makers in assessing emission reductionstrategies, estimating exposures and investigating economi-cal aspects of air pollution, as well as being used in thedecision making process.
Because of the diversity of air pollution problems atmos-pheric transport models have to be specially adapted to thevarious tasks. They may range from explosions and fastchemical reactions to climatological effects, and from verylocal events like the movement of heavy gases to the globalscale.This short list already shows that some problems are outof the scope of the normal forecasting range of NMHSs.Heavy gas problems can neither be resolved by routinemeasurements nor by meteorological data provided by NWPmodels. On the other side of the spectrum, there is at themoment no deterministic model which is able to simulatethe development of air pollutants on a climatological timescale.
The range of problems which can be solved by air pollu-tion forecasting is therefore mainly determined by the timeand/or space scale of emissions, health effects and the timewhich remains until the pollutant has reached a receptorpoint. Thus for chemical accidents like those of Bophal orSeveso which are mainly caused by explosions, air pollutionforecast will come too late. But in case of fires when emissionsextend over hours NMHSs may provide significant informa-tion also for local problems if they can forecast the veering ofa polluted plume.
Typically, the problems to be handle by atmospherictransport modelling can be divided into two groups:• Routine air pollution forecasting: the forecast of photo-
chemical and London type smog, of particulate matterand all other chemical substances which are emittedregularly and from many different sources (area, line andpoint sources);
• Environmental emergency response: the forecast ofmaterial which is emitted accidentally or by malevolentacts.The atmospheric transport models used in routine air
pollution forecasting are operated similarly to NWP models.They are embedded in a daily operational forecast suite.Therefore, they can in principal also be included in generalcirculation and climate models and be used to forecast futurechanges of the chemical composition of the global atmos-phere and its interaction with the meteorological andclimatological parameter.
Because of the specific problems caused by accidentalreleases WMO has put in place in cooperation with theInternational Atomic Energy Agency (IAEA), a system ofeight Regional Specialized Meteorological Centres (RSMCs)for transport calculations which will support the NMHSswhich have no emergency response system of their own.Similarly, WMO co-operates with the International CivilAviation Organization (ICAO) and the nine Volcanic AshAdvisory Centres (VAACs) in cases of volcanic ash incidents.
In its 6th Long Term Plan WMO has asked the NMHSsto extend their activities in air pollution forecasting.WMO’sCoordination Group on Emergency Response Activities(CG-ERA) supported this initiative and voted also to includebiological material like the foot-and-mouth (FMD) virus
whose transport has already been studied in a research modeby some NMHSs.
3.2.1 Model systems
Model systems have to provide a forecast of emissions result-ing from air pollutants emitted to the atmosphere. Therefore,a complete model system for air pollution forecasts willconsist of the following elements or modules:(a) An emission inventory and/or emission model;(b) A data assimilation for air pollutants;(c) A meteorological database; and (d) An air pollution model.
As an additional element a (statistical) post processingmay be added.
But depending on the forecasted air pollutant the modelsystem can be simplified. There is a broad spectrum of possi-ble model systems ranging from simple transportcalculations (trajectories, advection of passive tracers) orstatistical approaches based on the correlation between themeteorological parameter and air pollutants (i.e. temperatureand ozone) to complex modelling systems which predict thetransport, dispersion, and deposition of fifty or more chem-ical species and more than hundred chemical reactions.
The minimum requirements for an air pollutionmodelling system are a meteorological data base (normally anumerical weather forecast) and an air pollution modelwhich is adapted to the specific problem. If themeteorological forecast and the air pollution forecast areperformed simultaneously within one model using identicaltime steps it is called an on-line model. This can be useful andnecessary if convective processes have to be calculatedexplicitly. But in most cases off-line models are applied wherethe air pollution forecast uses the results of previouslycomputed weather forecasts.
3.2.1.1 Modelling approaches
Air pollution modelling and forecasting face several chal-lenges.(a) Emissions. There are different types of emissions: point
sources, line sources, area sources, heavy gases, explo-sions which should preferably be handled by differenttypes of models. Many emissions are often not wellknown and emission inventories are incomplete. Airpollution forecasting would also require an emissionforecasting. This is complicated because anthropogenicemissions depend on human behaviour which has to beforecasted. In case of bush and forest fires a dynamicemission model is necessary because the emissions feedthemselves depending on wind speed and direction,dryness of the soil and vegetation and the availability ofinflammable material;
(b) Measurements, data assimilation and model valida-tion. Measurements for a limited number of chemicalspecies are available.But most of these measurements areperformed near the ground and only some informationon the vertical structure can be gained from ozone
19Guidelines on Biometeorology and Air Quality Forecasts
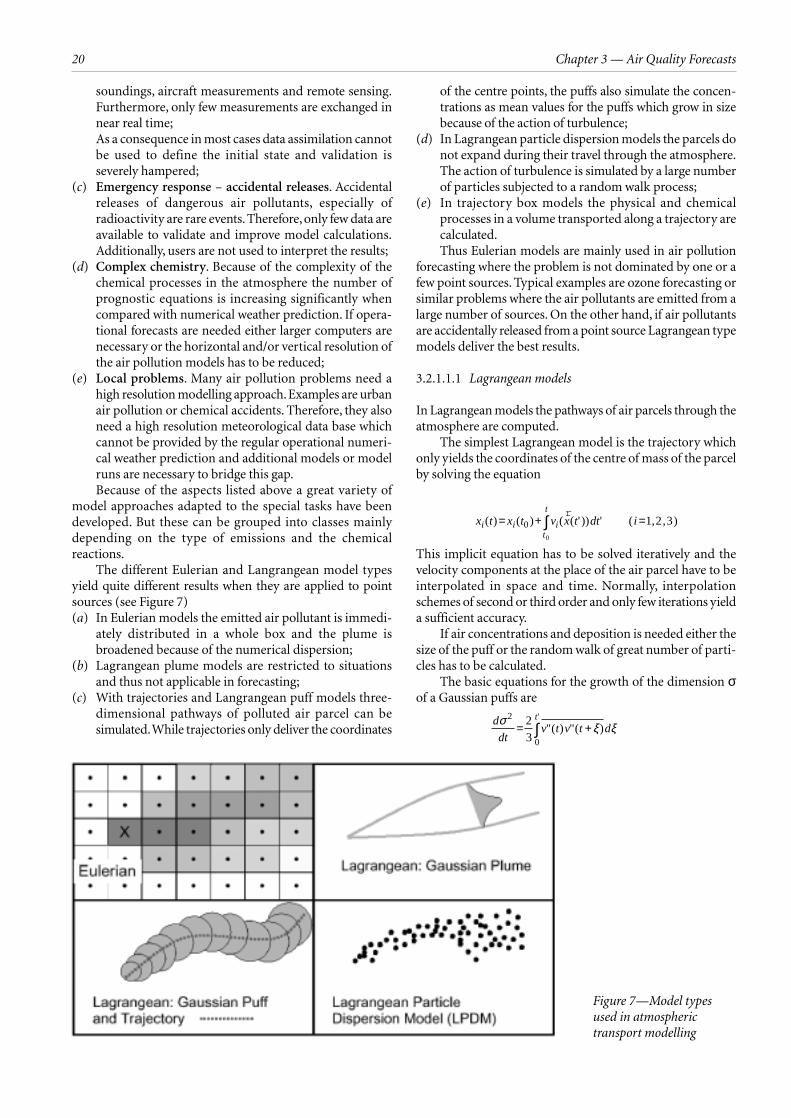
soundings, aircraft measurements and remote sensing.Furthermore, only few measurements are exchanged innear real time;As a consequence in most cases data assimilation cannotbe used to define the initial state and validation isseverely hampered;
(c) Emergency response – accidental releases. Accidentalreleases of dangerous air pollutants, especially ofradioactivity are rare events. Therefore, only few data areavailable to validate and improve model calculations.Additionally, users are not used to interpret the results;
(d) Complex chemistry. Because of the complexity of thechemical processes in the atmosphere the number ofprognostic equations is increasing significantly whencompared with numerical weather prediction. If opera-tional forecasts are needed either larger computers arenecessary or the horizontal and/or vertical resolution ofthe air pollution models has to be reduced;
(e) Local problems. Many air pollution problems need ahigh resolution modelling approach.Examples are urbanair pollution or chemical accidents. Therefore, they alsoneed a high resolution meteorological data base whichcannot be provided by the regular operational numeri-cal weather prediction and additional models or modelruns are necessary to bridge this gap.Because of the aspects listed above a great variety of
model approaches adapted to the special tasks have beendeveloped. But these can be grouped into classes mainlydepending on the type of emissions and the chemicalreactions.
The different Eulerian and Langrangean model typesyield quite different results when they are applied to pointsources (see Figure 7)(a) In Eulerian models the emitted air pollutant is immedi-
ately distributed in a whole box and the plume isbroadened because of the numerical dispersion;
(b) Lagrangean plume models are restricted to situationsand thus not applicable in forecasting;
(c) With trajectories and Langrangean puff models three-dimensional pathways of polluted air parcel can besimulated.While trajectories only deliver the coordinates
of the centre points, the puffs also simulate the concen-trations as mean values for the puffs which grow in sizebecause of the action of turbulence;
(d) In Lagrangean particle dispersion models the parcels donot expand during their travel through the atmosphere.The action of turbulence is simulated by a large numberof particles subjected to a random walk process;
(e) In trajectory box models the physical and chemicalprocesses in a volume transported along a trajectory arecalculated.Thus Eulerian models are mainly used in air pollution
forecasting where the problem is not dominated by one or afew point sources. Typical examples are ozone forecasting orsimilar problems where the air pollutants are emitted from alarge number of sources. On the other hand, if air pollutantsare accidentally released from a point source Lagrangean typemodels deliver the best results.
3.2.1.1.1 Lagrangean models
In Lagrangean models the pathways of air parcels through theatmosphere are computed.
The simplest Lagrangean model is the trajectory whichonly yields the coordinates of the centre of mass of the parcelby solving the equation
This implicit equation has to be solved iteratively and thevelocity components at the place of the air parcel have to beinterpolated in space and time. Normally, interpolationschemes of second or third order and only few iterations yielda sufficient accuracy.
If air concentrations and deposition is needed either thesize of the puff or the random walk of great number of parti-cles has to be calculated.
The basic equations for the growth of the dimension σof a Gaussian puffs are
d
dtv t v t d
tσ ξ ξ2
0
2
3= +∫ "( ) "( )
'
€
x t x t v x t dt ii i it
t( ) ( ) ( ( ' )) ' ( , , )= + =∫0
0
1 2 3r
Chapter 3 — Air Quality Forecasts20
Figure 7—Model typesused in atmospherictransport modelling
where v” are the velocity components relative to the move-ment of the parcel as a whole. The covariance depend on the turbulence in the volume and have to beparameterised. There are several approximations for thegrowth depending on the distance from the source.Lagrangean puff models are quite flexible tools. The airparcels can follow curved trajectories and grow in sizedepending on turbulence. But the position and the size areintegral values of a parcel. It can happen that the parcel hasgrown to a size where diffluent wind fields have to be takeninto account.The pentafolding mechanism (splitting one puffinto five new plumes) of the model RIMPUFF tends to over-come this problem. But a better solution would be either tocontinue the calculations with a Eulerian model or to use aLagrangean particle dispersion model.
In a Lagrangean particle dispersion model a largenumber (many thousand) trajectories of air parcels arecomputed by where the velocity isthe sum of the mean velocity and an additional turbulentcomponent . The additional turbulent velocityis computed from
where the correlation functions and the random walk veloc-ities have to be parameterised using the local turbulenceinformation. The concentration is calculated from the sum ofthe particle masses in a box volume and deposition from massfractions which particles may lose if they are either affected byrain or if they hit the ground. Other linear processes likeradioactive decay can be taken into account. The only weak-ness of the model approach is the handling of non-linearchemical reactions which depend on the concentration. Thiswould require a concentration calculation each time step anda redistribution of the reaction products to the parcels.
In contrast to the models described above trajectory boxmodels are receptor oriented. After backward trajectoriesending at a number of receptor points have been calculatedconcentrations in a box volume along the trajectory are eval-uated by solving the equation:
where ci are the concentrations, vi the transport velocities(normally identical with the wind velocity except for gravi-tational settling), Ei the emissions, Li the losses and Rij thereactions between the species i and j.
Normally, the boxes and trajectories are considered torepresent well mixed boundary layer volumes. Therefore, thechange of the height of this mixed layer and the interactionwith the overlaying free troposphere or a residual layer can betaken into account.
Except for Lagrangean particle dispersion models, allmodels of Lagrangean type treat moving air parcels whichgrow in size during their travel through the atmosphere dueto the action of turbulence.Additional methods like the split-ting of parcels (pentafolding) or the calculation of more thanone trajectory in the boundary layer are only subsitutes. Ifinformation on a constant and fixed scale are necessaryEulerian models have to be used.
3.2.1.1.2 Eulerian models
In Eulerian models basically a number of mass conservationequations (one for each deterministically forecasted chemi-cal species) have to be solved:
Additionally to the general problem in chemical model-ling to specify the sources (Ei), sinks (Li) and reactions (Rij)Eulerian air pollution models require numerical methodswhich are (a) mass consistent and (b) non-negativity consis-tent (i.e. guarantee that concentrations cannot drop belowzero) and (c) have a low numerical diffusion. As theserequirements further increase the high computing costsresulting from the calculation of a larger number of chemi-cal species, research in new numerical advection schemes isgoing on.The choice of the numerical scheme depends on theproblem to be solved. London type smog is dominated byadvection. There are only a limited number of chemicalspecies which have to be forecasted and the numerical treat-ment of chemical reactions poses no major problem. Theformation of Los Angeles or photochemical smog on theother hand is a complex process where a large number ofchemical species are involved. The transport of these speciesas well as the reaction processes have to be calculated.As thereaction times vary over several magnitudes and as many ofthem are much shorter than the advection time step, specialintegration methods (time splitting and/or implicit) areneeded to solve these equations. Typically about fifty chem-ical species have to be forecasted and more than hundredreactions taken into account.
Eulerian air pollution models are definitely the mostflexible tool for all problems involving many different sourceswith continuous emissions. They are well known to meteo-rologists because they are similar to numerical weatherprediction models. If the same grid is used in numericalweather prediction as in air pollution forecasting, a one-to-one transfer of data or even on-line version is possible wherethe meteorological and air pollution forecasts are calculatedsimultaneously.
But as in numerical weather forecasting Eulerian airpollution models need initial fields and in case of limitedarea calculations also boundary values.
3.2.1.1.3 Hybrid models
Hybrid models have especially been developed to improvethe simulation close to major point sources. By using aLagrangean puff model the artificial broadening of the plumewhich is inevitable in Eulerian models can be avoided. In thevicinity of the source, puffs are calculated and transportedalong the trajectory until they have reached a magnitudewhere they have overlapped several mesh sizes of the Eulerianmodel. The puffs are then interpolated to the Eulerian gridand advected using the normal numerical methods.
This hybrid treatment has been successfully applied inemergency response calculations. But it is also used in airpollution models when very strong emissions from only afew point sources strongly influence the concentration fields.
€
∂∂
+ ∇ • + ∇ • = − + ∑c
tv c v c E L Ri
i i i i i i ijj
( ) ( ' ' )r
dc
dtE L Ri
i i ijj
= − +∑ ,
v (t + t) = R t v (t) + R t v i i i i i' ( ) ' ( ) "∆ ∆ ∆1 2−
v v v vi i i i' : '= +vi
x t t x t t v ti i i( ) ( ) ( )+ = + ⋅∆ ∆
v t v t t"( ) "( )+ ∆
21Guidelines on Biometeorology and Air Quality Forecasts
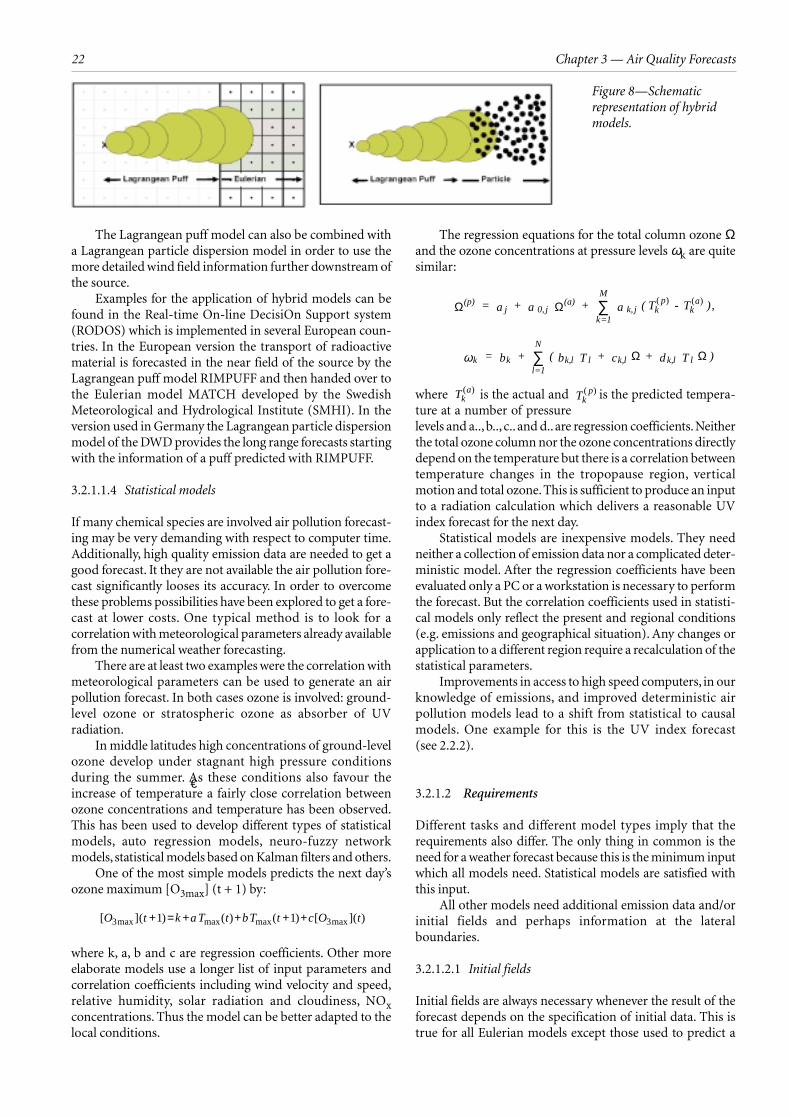
Chapter 3 — Air Quality Forecasts22
The Lagrangean puff model can also be combined witha Lagrangean particle dispersion model in order to use themore detailed wind field information further downstream ofthe source.
Examples for the application of hybrid models can befound in the Real-time On-line DecisiOn Support system(RODOS) which is implemented in several European coun-tries. In the European version the transport of radioactivematerial is forecasted in the near field of the source by theLagrangean puff model RIMPUFF and then handed over tothe Eulerian model MATCH developed by the SwedishMeteorological and Hydrological Institute (SMHI). In theversion used in Germany the Lagrangean particle dispersionmodel of the DWD provides the long range forecasts startingwith the information of a puff predicted with RIMPUFF.
3.2.1.1.4 Statistical models
If many chemical species are involved air pollution forecast-ing may be very demanding with respect to computer time.Additionally, high quality emission data are needed to get agood forecast. It they are not available the air pollution fore-cast significantly looses its accuracy. In order to overcomethese problems possibilities have been explored to get a fore-cast at lower costs. One typical method is to look for acorrelation with meteorological parameters already availablefrom the numerical weather forecasting.
There are at least two examples were the correlation withmeteorological parameters can be used to generate an airpollution forecast. In both cases ozone is involved: ground-level ozone or stratospheric ozone as absorber of UVradiation.
In middle latitudes high concentrations of ground-levelozone develop under stagnant high pressure conditionsduring the summer. As these conditions also favour theincrease of temperature a fairly close correlation betweenozone concentrations and temperature has been observed.This has been used to develop different types of statisticalmodels, auto regression models, neuro-fuzzy networkmodels, statistical models based on Kalman filters and others.
One of the most simple models predicts the next day’sozone maximum [O3max] (t + 1) by:
where k, a, b and c are regression coefficients. Other moreelaborate models use a longer list of input parameters andcorrelation coefficients including wind velocity and speed,relative humidity, solar radiation and cloudiness, NOxconcentrations. Thus the model can be better adapted to thelocal conditions.
The regression equations for the total column ozone Ωand the ozone concentrations at pressure levels ωk are quitesimilar:
where is the actual and is the predicted tempera-ture at a number of pressurelevels and a.., b.., c.. and d.. are regression coefficients. Neitherthe total ozone column nor the ozone concentrations directlydepend on the temperature but there is a correlation betweentemperature changes in the tropopause region, verticalmotion and total ozone. This is sufficient to produce an inputto a radiation calculation which delivers a reasonable UVindex forecast for the next day.
Statistical models are inexpensive models. They needneither a collection of emission data nor a complicated deter-ministic model. After the regression coefficients have beenevaluated only a PC or a workstation is necessary to performthe forecast. But the correlation coefficients used in statisti-cal models only reflect the present and regional conditions(e.g. emissions and geographical situation). Any changes orapplication to a different region require a recalculation of thestatistical parameters.
Improvements in access to high speed computers, in ourknowledge of emissions, and improved deterministic airpollution models lead to a shift from statistical to causalmodels. One example for this is the UV index forecast (see 2.2.2).
3.2.1.2 Requirements
Different tasks and different model types imply that therequirements also differ. The only thing in common is theneed for a weather forecast because this is the minimum inputwhich all models need. Statistical models are satisfied withthis input.
All other models need additional emission data and/orinitial fields and perhaps information at the lateralboundaries.
3.2.1.2.1 Initial fields
Initial fields are always necessary whenever the result of theforecast depends on the specification of initial data. This istrue for all Eulerian models except those used to predict a
€
Tkp( )Tk
a( )
k kl=1
N
k,l l k,l k,l l = b + ( b T + c + d T )ω ∑ Ω Ω
(p)j 0, j
(a)
k=1
M
k, j kp
ka = a + a + a ( T - T )Ω Ω ∑ ( ) ( ) ,
[ ]( ) ( ) ( ) [ ]( )max max max maxO t k a T t bT t c O t3 31 1+ = + + + +
Figure 8—Schematicrepresentation of hybridmodels.

plume or puff emitted from an isolated point source (i.e. inemergency response situations). Initial data may also beneeded as input to trajectory box models if the result of thecomputation significantly depends on the initial concentra-tions at the place and time of the start of the trajectory. Thisis especially true if the problem is dominated by transport.Within EMEP – the UN-ECE Co-operative Programme forMonitoring and Evaluation of the Long-range Transmissionof Air Pollutants in Europe – it could be demonstrated thatthe transport across the Atlantic Ocean influenced the resultof the computation with the trajectory box model and that itcould be improved by incorporating it as initial data for thetrajectories.
Unfortunately, the current measurement network for airpollutants hardly supports the construction of sufficientinitial fields due to the following factors;• Observations are unevenly distributed with too many
stations in the cities;• Only a small number of species are observed;• Most observations are performed close to the ground;• There is no well organised international exchange of
measurement data;• There are only a few soundings and aircraft observa-
tions to get information from the third dimension;• Only some species are observed from space with
normally very low or no vertical resolution.A Kalman filter approach is used in the Danish
Atmospheric Chemistry FOrecasting System (DACFOS)which is based on backwards trajectories.
There is some very promising research under wayincluding 4D-VAR schemes to generate initial fields forEulerian models. But at the moment no operational schemeis available. Therefore, in most cases the initial fields aregenerated by the model itself using the forecasts of the pervi-ous days. This strategy strongly depends on good emissiondata and an adequate model. The forecast of ground-levelozone starting from these initial fields yields results with aquality similar to the precipitation forecast. Thus there isroom for improvement by generating better initial fields.
3.2.1.2.2 Emission data
Nearly all air pollution forecast models critically depend onemission data. Exceptions are only statistical models ormodels which treat stratospheric ozone as an inert tracer.
It is obvious that emergency response models whichforecast the transport of air pollutants directly depend oninformation on emissions. As emergency response forecastsshould reach the user as fast as possible source simulationmodels have been developed to generate information onemissions from damaged nuclear power plants, volcanoes,chemical installations, etc. From satellites the strength ofemissions of forest fires can be estimated. But in each actualcase the height, strength and composition of the source hasto be evaluated or verified.
The preparation of emission data may be a very timeconsuming task if it is not possible to make use of alreadyexisting data. In most cases anthropogenic as well as biogenicemissions are involved. Obviously, the biogenic emissionsdepend on the actual conditions in the atmosphere
(temperature, solar radiation, etc.) and the soil (availability ofwater). However, anthropogenic emissions are alsoinfluenced by the weather (amount of heating or cooling,human activities). Therefore, an emission model directlyconnected with the meteorological forecast would be the bestchoice. But normally the influence of meteorology onanthropogenic emissions is only taken into account bysuperimposing daily, weekly and annual variations over thebasic data derived from the emission inventory.
During the last decades a lot of research - including fieldexperiments - has been invested to improve emission dataand inventories. Source-receptor relationships derived fromair pollution simulation have been used to detect and to elim-inate errors in emission inventories. In addition in order toget the best and comparable data guides have been published.One of these is the “EMEP/CORINAIR Emission InventoryGuidebook”.
Satellite information is increasingly used to improve theemission data base. Examples for this are land-use data andthe leaf-area-index (LAI).
3.2.1.2.3 Boundary conditions
Eulerian limited area models whether they are used forweather or air pollution forecasting need lateral boundarydata. And in both cases the best choice is the nesting withina coarser scale model.When such a larger scale forecast is notavailable simpler solutions can be used. They range from:(a) computation of boundary values with the help of a
cheaper model like a trajectory box model;(b) Using climatological values;(c) Enlarging the integration area so that the forecast in the
area of interest is not significantly affected by missing orimperfect boundary data.
3.2.1.3 Validation of models
All observational data, forecast products and forecast modeloutputs have to be verified to ensure that this information willeffectively meet the needs of the public, the planners and thepolicy makers.With proper and regular assessment, productquality will be trustworthy and of high standard.
There are various stages of product verification, rangingfrom observed and analysed data to forecast products. Allobserved data have to be properly verified so that any instru-mental errors could be detected through irregularity in thedata.At the same time, instruments have to be properly main-tained and regularly calibrated to ensure data accuracy.
The accuracy of atmospheric models must be validatedas an indispensable part of the model development processso that users can assess the degree of reliability and accuracyinherent in a given model. As far as possible, forecast verifi-cations should be produced in an objective way, free ofhuman interpretation. The accuracy of a forecast is a measureof how close to the actual weather the forecast was. The skillof a forecast is taken against some benchmark forecast,usually by comparing the accuracy of the issued forecast withthe accuracy of the benchmark. Reliability is the extent towhich the forecast can be “trusted” on average.
23Guidelines on Biometeorology and Air Quality Forecasts

The verification of air pollution models may be compli-cated due to the following:• The measurement data are collected by different institu-
tions, they are not freely available and in most cases notexchanged internationally;
• Individual measurements are not representative for alarger area, and the measurement networks are notplanned to support verification;
• Measurements to derive information on vertical profilesare rare.Successful attempts to establish national and international
air pollution forecasting networks demonstrate that theseproblems are not insurmountable. New tools to check therepresentativity of data and to extract information from satel-lite observations are available. In several attempts the accessto air pollution measurements performed by environmentalprotection agencies on national or regional levels and their(international) exchange have been successfully accomplished.
3.3 ENVIRONMENTAL EMERGENCY RESPONSE(EER)
Environmental emergency response covers all emissions tothe atmosphere due to accidents. These may be accidents innuclear installations, in chemical factories, during the trans-port, but also eruptions of volcanoes and bush or forest fires.Additionally there is a renewed discussion if damaged steam-ers (e.g. oil tankers) may be set on fire in order to preventenvironmental catastrophes.
A common feature of these events is:• They are rare events which may happen any time but
normally without prior announcement;• Because of this neither meteorologists nor decision
makers are very familiar with the results and the relia-bility or the atmospheric transport calculations;
• In most cases the air pollutants are emitted from pointsources;
• At the beginning of the event often only incomplete ornearly no information is available.
3.3.1 Requirements
Environmental emergency response poses special demands.Additionally due to the reasons listed above, a fast reaction isrequired because air pollutants are emitted which are animmediate threat to human health. This may include thatonly measurements of dangerous or toxic air pollutants areavailable but no source information.
An environmental emergency response system thereforehas to fulfil the following requirements:• It has to forecast the transport of dangerous air pollutants
very fast and based on minimum input information;• If only measurements are available but no information of
a potential source a backtracking model is necessary.• Good communication between all institutions and
organisational units involved in emergency response hasto be established. This includes:- regular tests and exercises, as well as
- the production and distribution of guidance material;• As specific data are rare new additional data have to be
made accessible or produced. These may be tracer exper-iments or additional observations in case of an accidents.Consequently, the forecasting systems of many NMHSs
as well as of the Regional Specialised Meteorological Centres(RSMCs) for EER consist of• A trajectory model which can quickly compute the path
of a polluted air parcel; and • An air pollution model which can forecast concentration
and deposition values.As it can be expected that in the early phase of an acci-
dent only few source data are available, default values ofstarting heights and the vertical distribution of emissionshave been agreed and implemented.
With respect to nuclear accidents a close cooperationwith the International Atomic Energy Agency (IAEA) andregular communication tests make sure that all NMHSs willget all available information via the GTS. Air pollution fore-casts and a verbal description are produced by the designatedRSMCs* for EER.
A similar cooperation exists concerning volcanic ashwhereby nine Volcanic Ash Advisory Centers (VAACs) havebeen established.
Chemical accidents are normally small scale events. Inmost cases the dangerous concentrations are limited to onlyfew kilometres around the source. Therefore, forecasts on themeso scale are needed. If heavy gases are involved the affectedarea may be even smaller. In most cases the time to producea reliable forecast and to distribute it to the user may be veryshort. Thus, the first requirement is that meteorological dataon this small scale can be provided. Though non-hydrosta-tic weather forecasting models are becoming operational atsome NMSs they normally cannot be used for this purposebecause of their too long computing time. Therefore diag-nostic models for the boundary layer are needed.
Emergency response systems may also be applied to fore-cast the spread of biological material like infectious Foot-andmouth decease (FMD) virus. The Danish MeteorologicalInstitute (DMI) has presented a study where a local scalemodel and a virus production model have been added to itsemergency response system (DERMA).
An adequate emission model is also the main prerequisiteto handle the airborne transport in case of bush or forest fires.
3.3.2 Tracer Experiments and Exercises
Tracer experiments and exercises are necessary because realaccidents are (fortunately) rare events (no major release ofradioactivity to the atmosphere after Chernobyl) and there-fore additional data are needed to validate and improvemodel systems and practical experience has to be gainedthrough exercises.
Chapter 3 — Air Quality Forecasts24
* Beijing, Obninsk and Tokyo for Asia, Montreal and Washington for
the Americas, Exeter and Toulouse for Europe and Africa,
Melbourne for South West Pacific
3.2.2.1 Tracer experiments
Neither the meteorological measurement network nor that ofenvironmental protection agencies can provide data whichallow a validation of transport model calculations startingfrom isolated point sources. Therefore, the model validationand improvement is severely hampered. The only possibilityto get data are tracer experiments where an inert tracer isemitted and measured. Whereas several small scale or localtracer experiments have been performed the number of largescale experiments is limited. After the Chernobyl accidentonly one tracer experiment - the European Tracer EXperiment(ETEX) - was organized based on the experience gained bythe two experiments over the North American continentCAPTEX (Cross Appalachian Tracer Experiment) andANATEX (Across North America Tracer EXperiment).
Large scale tracer experiments are expensive and timeconsuming. The organization of ETEX by WMO, IAEA andthe European Community (EC) took more than two years.Atrace gas had to be selected and the background concentra-tions originating from earlier experiments had to bedetermined. The measurement devices had to be built ormodified. Trajectory analyses and three dry runs wereperformed to select the best place,time,and conditions for therelease. 168 samplers had to be distributed and installed in 17European countries. Finally, in October and November 1994two releases took place accompanied with real time forecastsfrom 24 institutions world wide and measurements from 3aircraft during the first release.During the following years thedata set has been repeatedly used.The most prominent exam-ple is the ATMES II exercise where the best available data fromthe European Centre for Medium range Weather Forecast(ECMWF) were provided to the group of participating insti-tutions which had grown by 11 new members from America,Asia,Australia and Europe. The preparation of ETEX and theevaluation of the results of ETEX and ATMES II were accom-panied by a series of meetings and publications.
The results and achievements of ETEX can besummarised as follows:(a) ETEX real time experiment: Most of the models showed
differences of 3 to 6 hours in arrival time and a factor of 3in surface maximum concentrations. There is a satisfac-tory agreement between model results and measurementsafter 24 hours following the start of the release;
(b) ATMES II - reanalysis and use of meteorological datafrom ECMWF: The quality of the model results could besignificantly improved not only because of a better mete-orological data base but also because the ETEX data hadbeen exploited to improve the model itself;
(c) For this exercise which consisted of a release from a pointsource, Lagrangean models (and especially Lagrangeanparticle dispersion models) demonstrated theirsuperiority;
(d) The organisation of a large scale tracer experiment is acomplicated, time consuming and expensive action. Butit is indispensable to improve air pollution forecasts incases of emergency response. During ETEX only theforecasts during westerly flow conditions could be tested.Further experiments covering different synoptic situa-tions are necessary.
3.3.2.2 Emergency exercises
Experience shows that nearly no exercise happens withoutany problem, deficit or new questions. Either some fax orphone numbers are incorrect, measurement stations do notgive a feed back, end users ask why a computed trajectory haschanged its curvature in the new update run. Thus exercisesare indispensable in order to minimise the problems in caseof a real accident.
In an emergency many actors from different levels (local,national, international, meteorologists, environmentalists,politicians and decision makers) have to work together.Exercise plans have therefore to be developed to cover allsituations. With respect to nuclear accidents, WMO hasrecommended principles of environmental emergencyresponse exercises which are published in manuals or can bedownloaded from the Internet.
The basic framework is given in Table 3 on page 26.
3.3.3 Collaboration with responsible authorities
Only in a few countries are environmental issues treatedwithin the NMHSs. Moreover, the direct reaction to emer-gencies is the task of police, fire brigades or healthinstitutions which themselves are attached to differentgovernment authorities. Thus in case of nuclear accidentsthe national focal points of the IAEA are often theministries of internal affairs or of environment or evenoffices attached directly to the bureau of the prime minis-ter. On the other hand, the expertise on meteorology andtransport of air pollutant is concentrated at the NMS withadditional support by the WMO and its RSMCs.Additionally both sides, NMSs and national focal pointswill be informed via separate information channels.Therefore, a good cooperation between the differentauthorities is necessary. All partners have to be informedand be aware of the individual tasks and experience oftheir counterparts. Even if an administrative action isstrongly recommended by decision support system likeRODOS or ARGOS, government departments should bearin mind that any meteorological and air pollution forecasthas a limited predictability and needs an interpretation bya meteorologist.
A common method to study the skill of forecasts isthrough ensemble predictions. Compared with NWP ensem-bles based on modified initial fields or different NWPmodels, air pollution ensembles show an even larger spreadwhen different atmospheric transport models are used. Theconstruction of the best ensemble which allows to quantifythe uncertainty of the forecast and to make probability state-ments is still under development. For the moment theensemble predictions need a proper interpretation by mete-orologists and are not suited to be handed over to decisionmakers. But in the future they may be included in decisionsupport systems.
Even if the deterministic and ensemble forecasts areimproved and can be directly used in follow-up models likedecision support models, regular tests are needed to improvethe cooperation of the different authorities.
25Guidelines on Biometeorology and Air Quality Forecasts
3.4 ROLE OF NMSs
As the forecasting of atmospheric pollution is closelyconnected to the expected movement and nature of airmasses, i.e. weather forecasting, all NMSs have importantroles to play, nationally, regionally as well as globally. Many ofthese environmental issues are trans-boundary. Regionalefforts in setting up environmental networks as well as infor-mation and resource sharing among NMSs will help in theeffort to combat and reduce the impact.
3.4.1 Operational database
The operational database needed for air pollution forecastingincludes:• Meteorological data;• Emission data; and • Measurement data.
As meteorological data are normally provided by NWPmodels and a short summary on emission data and emissionmodels has been given in 3.2.1.2.2 this paragraph willconcentrate on measurement data.
3.4.1.1 Environmental networks
Though several measurements of atmospheric pollutantshave been performed decades ago the systematic build up ofmeasurement networks started in the 1950’s. Following thediscovery that the acidity in precipitation and in lakes inScandinavia was increasing more and more, and when thiswas attributed to emission of sulphur from burning coal andoil and of nitrogen oxides in other parts of Europe, a moni-toring and evaluation programme with a Europe-widemeasurement network was set up. Thie programme laterbecame the UN-ECE Co-operative Programme forMonitoring and Evaluation of the Long-range Transmissionof Air Pollutants in Europe (EMEP). During the same timemany countries started or enlarged their radioactivitymeasurement network because of the nuclear bomb tests.During the 1970s the threat of CFC’s to the ozone layer andthe potential global warming by the build-up of greenhousegases in the atmosphere resulted in an intensification ofobservational programmes.
Up to now a great number of air quality networks havebeen set up which range from the global scale and climato-logical questions to the local and urban scale.
Chapter 3 — Air Quality Forecasts26
Coordinator
Purpose
Frequency
Communications
Operations
Product standards
Product Interpretation
Assessment
National
Appropriate nationalauthority
To establish andstrengthen the linkagesbetween NMSs and IAEAcontacts at national level
At least twice a year
Notification, andproducts dissemination
As required based onnational structures andprocedures
User feedback onstandards; coupling ofstandard products withinnational systems anddatabases
Get feedback whetherproducts areunderstandable
Internal among nationalauthorities
Regional
WMO RegionalAssociation
To strengthen thelinkages between RSMCs,NMSs and IAEA atnational and internationallevels
Once a year
Notification, coordinationand productsdissemination; should bedone frequently for nightand day scenarios
Comparison andcoordination of modellingresults
User feedback onstandards
Get feedback on whetherproducts areunderstandable; productsintercomparison
Done jointly by theRSMCs involved
Global
WMO/CBS
To strengthen thelinkages between WMO,IAEA and otherinternational agencies
18 months
Notification, coordinationand productsdissemination; should bedone night and day on arotation basis
Coordination ofmodelling results
User feedback onstandards
Get feedback on whetherproducts are under-standable; productsintercomparison
Done by the WMOexpert(s) using the inputsfrom all the participants
Special *
As appropriate
To maintainpreparedness withrespect to pre-identified criticaltasks
As required to maintainpreparedness withrespect to thecritical tasks
* Details for special exercises are left open since the emphasis will change from one case to the other. Examples of such exercises are the monthly tests that RSMCs
Montréal, Washington and Melbourne are doing for nuclear accidents or the communication tests between IAEA and RTH Offenbach.
Table 3—The basic framework for environmental emergency response exercises
WMO started its Global Ozone Observing System(GO3OS) in 1957, which then in 1989 became part of theGlobal Atmosphere Watch (GAW). GAW itself is connectedwith five data centres (ozone and UV, solar radiation, green-house gases,aerosols,precipitation chemistry) and more than20 international networks and programmes.
Several regional networks and programmes have beenestablished e.g.• Acid Deposition Monitoring Network in East Asia
(EANET);• Air Pollution Information Network Africa (APINA);• North American Research Strategy for Tropospheric
Ozone (NASTRO);• Programme for the Assessments and Control of
Pollution in the Mediterranean Region (MEDPOL);• European Monitoring and Evaluation Programme
(EMEP) and European Environment Information andObservation Network (EIONET).Finally, the measurement and observing activities are
complemented by national or urban networks which are inmost cases organised by environmental protection agenciesor municipalities.
The radionuclide network set up by the PreparatoryCommission to the Comprehensive Test Ban Treaty(CTBTO) is not available for air pollution forecasts due toconfidentiality.
Though still a lot of gaps exist with respect to area cover-age and species observed, the combination of data from allthese networks allows a relatively good level of monitoring.These datasets are also extremely important for analysis andforecast and are necessary as input for environmental models.They should be shared with disaster and emergency agenciesto plan out strategies and draw on past experiences to putforward the best plan in the cross-sectorial effort to reducethe impact of environmental hazards. Databases need notnecessarily be at national level only but can also be at aregional level and information can be shared among thecountries in the region.
3.4.1.2 Surface observations and vertical soundings
Surface monitoring networks with well-distributed moni-toring stations form the back bone of air pollution datacollection. These observations provide the basic data • To diagnose the changes in the earth’s atmosphere;• To identify the need for research and greater under-
standing of the natural and man-made processes involved;• For chemical data assimilation; and• For model evaluation.Some of the monitoring networks include• Acid rain monitoring network, where rainwater samples
are collected over a prescribed period of time andanalysed for the presence of calcium, lead, manganese,iron, nickel, copper, magnesium, zinc, mercury, potas-sium, sulphate, nitrate, chloride, fluoride and ammoniaas well as the conductivity and pH of the rainwater;
• Dry deposition network, where low volume sampler isused to collect aerosol samples on filters. The exposedfilters are then analysed for acidic components;
• Air quality monitoring station, where high volumesamplers or high volume PM-10 or TSP Samplers areused to monitor suspended particulates in the air;
• Ozone monitoring network Ozone monitoring network,whereby the vertical ozone profile can be measured byozonesonde and the total column ozone observationscan be made with a Brewer Ozone Spectrophotometer;
• Surface automatic atmospheric environmental moni-toring network, including gases such as SO2, Nox, CO,CO2, and O3. Particulates of PM10 and PM2.5;
• Atmospheric background monitoring network, wherehigh volume samplers or high volume PM-10 samplersare used to monitor suspended particulates in the air,gases, pollutants such as SO2, Nox, CO, CO2 and O3.Aerosols and solar radiation are also monitored auto-matically;
• National radioactivity measurement networks whichnormally have a higher spatial density for gamma dosemonitoring and some nuclide specific measurements.For numerical weather prediction it is a well-known fact
that assimilation of measurements of vertical profiles ofcertain meteorological parameters has a large positive impacton the forecast skill. Regarding vertical concentration profilesof air pollutants this might also be the case for regional airpollution forecasting. However, apart from a few measure-ment campaigns, there is currently little known about thepossible impact from measurements of vertical concentrationprofiles of air pollutants on the forecast skill for regional airpollution models. There are only some vertical profiles ofozone available from soundings performed one to three timesa week at selected places. They are carried out with ordinarymeteorological radiosondes equipped with light-weightozone monitors. The sparseness of data is due to the costs ofthe instruments, which are lost in the soundings.
In case there is a sufficiently strong demand for profiledata, it might be considered to use other methods. Forinstance, today many routine passenger aircraft are equippedwith automatic instruments, namely,Aircraft MeteorologicalData Relay (AMDAR), which measure a number of meteo-rological parameters while the aircraft is in flight. From atechnical point of view, it would possibly be a simple task toadd ozone monitors to such systems. Another possibility isthe use of kites, which in recent years have been used forstratospheric ozone research in Arctic areas. The kites aremade of high-strength light-weight material, and the instru-ments, which are mounted with a collar, are moved up thestring holding the kite by the wind and are pulled back againby a thin line. This operation can be carried out many timesper day – and the instruments are not lost. For regular useclose to populated areas and air traffic corridors there are ofcourse a number of safety issues to consider. A third possi-bility is ozone Lidars.
In emergency response situations some countries mayadditionally measure radioactivity and/or chemical speciesby using aeroplanes or helicopters. Equipping the research orleased aircraft with radioactivity monitors under emergencyconditions and the subsequent measurement of verticalcross-sections has already been tested within the EuropeanTracer Experiment (ETEX). In such cases a good feed backbetween forecasting and measurements is necessary because
27Guidelines on Biometeorology and Air Quality Forecasts

forecasts are needed to plan the flight track and then may beupdated by using the observations. Helipods which allow themeasurement of meteorological parameters as well as chem-ical species up to 100 m below helicopters are underdevelopment. They may significantly improve the results ofair pollution modelling in case of chemical accidents becausethese measurements will improve the knowledge on thesource and chemical species involved and the parametersgoverning the spread of the plume.
3.4.1.3 Satellite data
Satellites, both polar-orbiting and geostationary, haveprovided observations from instrument measurementsproviding continual datasets of global total column ozonemeasurements. Some of the products are listed below.
Total Ozone Mapping Spectrometer (TOMS) on boardthe Nimbus-7 platform produces a data set of global totalcolumn ozone measurements. The primary TOMS dataproduct is total column ozone abundance in units of milliat-mospheres per centimetre, commonly referred to as theDobson Units (DU), which is the total amount of ozone in a1-cm column extending from the ground to the top of theatmosphere.
The Earth Probe/TOMS which was launched in 1996 waspositioned into a lower orbit to complement theADEO/TOMS instrument to cover the development of theAntarctic ozone hole in the Austral spring as well as Arcticconditions during the northern hemisphere spring. On theother hand,the ADEOS/TOMS launched aboard the JapaneseAdvanced Earth Observing System (ADEOS) in 1996 wasplaced in a higher orbit and provides global coverage of totalcolumn ozone on a daily basis.
Moderate-Resolution Imaging Spectrometer (MODIS)is a multi-spectral cross-track scanning radiometer designedto measure parameters related to biological and physicalprocesses on a global scale. The spectral bands of the scan-ning radiometer produce very high spatial resolution dataproducts such as cloud cover, cloud optic thickness, aerosoloptical depth and cirrus cloud cover which are useful for UVmodelling.
Ozone Dynamics Ultraviolet Spectrometer (ODUS) isprovided to NASA by the National Space Development Agencyof Japan (NASDA) that will provide daily global ozonemeasurements in a similar fashion to TOMS instruments.Totalcolumn Nitrogen dioxide and volcanic sulphur dioxide emis-sions are also expected to be retrieved from the measurements.
Tropospheric Emission Spectrometer (TES) is a high-resolution infrared Fourier transform spectrometer that canoperate either in a limb-scanning mode to derive verticalprofiles of species such as ozone or in a downward-lookingmode where it can provide high-resolution local coverage orglobal coverage of integrated column abundances of severalatmospheric species.
The development of satellites dedicated to atmosphericcomposition measurements has long focussed exclusively onthe stratosphere (e.g. TOMS, and the Upper AtmosphereResearch Satellite, UARS). Recently, instruments such asMOPITT (carbon monoxide and methane) and IMG
(methane), the Global Ozone Monitoring Experiment(GOME: ozone profiles, nitrogen oxide, and formaldehyde)have begun to explore the tropospheric composition. It is stilldifficult to extract information about the boundary layerfrom these instruments because they are hampered by cloudsand for some species like nitrogen oxide only yield columnobservations. However, the techniques to retrieve loweratmospheric concentrations are in rapid development.
In the near future the SCIAMACHY and MIPAS on ESA’sEnvironmental Satellite (ENVISAT) launched in 2002 willyield further information on tropospheric concentrations ofozone and its precursors. Similar opportunities will arise withthe launch in 2004 of NASA’s EOS AURA satellite with OzoneMonitoring Instrument (OMI) and the TroposphericEmission Spectrometer (TES) on board. OMI has a relativelyhigh spatial resolution that will allow it to look down to thesurface in between the clouds. A series of three GOME-2instruments are planned to be successively launched byEUMETSAT from 2006 onward. It can be expected that satel-lite data will play an increasing role in air pollution modellingand will improve the data assimilation significantly.
3.4.1.4 Data exchange
The exchange of air pollution data is not well developed andis a weak point which inhibits air pollution forecasting.Although a lot of data are exchanged within the frameworkof international programmes, this happens only a long timeafter the measurements. Thus they may be used for researchand model improvements but not for data assimilation andongoing model validation as is the case for NWP models.
On the other hand, some examples and research initia-tives show that data exchange which supports air pollutionforecasting can be organised as described below.• Within the European Union radioactivity measurements
may be exchanged using a specially developed dataformat;
• Ozone soundings are collected by the ChemicalCoordination Centre (CCC) of EMEP;
• The air pollution forecasting consortium of Franceconsisting of Météo France and different research insti-tutions receives ozone measurements from thesurrounding countries.These examples demonstrate that an international trans-
fer of air pollution data is possible. To support this aspecification of the needed data and of formats is necessary.At a workshop on ground-level ozone forecasting which wasjointly organized by the Network of European MeteorologicalServices (EUMETNET) and the European EnvironmentalAgency (EEA) the participating members from researchinstitutes, environmental agencies and meteorologicalservices from Europe and the United States recommendedthat• Ozone measurements data should be made publicly
available on the Internet, preferably using a standardformat. The data should appear in near real time, i.e.with a maximum delay of 6 hours. The measurementstations should include rural sites and should be lessthan 200 km apart;
Chapter 3 — Air Quality Forecasts28

• In addition to ozone, but with a smaller priority, real-time measurement data should be available for other airpollutants of relevance for the photochemical mecha-nism, viz. CO, NOx and a few VOC compounds.
3.4.2 Operational forecasts
It is expected that states should inform their citizens on thestate of the environment and on possible adverse effects onhealth. The inclusion of operational air quality forecasts inpublic weather bulletins can assist the public to take actionwith respect to air pollution and photochemical smog. Evenif the nature of the problem will not allow to achieve animmediate reduction of air pollution levels, it may help theindividual citizen to limit negative health effects by avoidingpolluted areas or reducing of outdoor activities.
In countries where air pollution levels defined in nationalor international guidelines may be exceeded, an operationalforecasting system or access to results of such n system is thebest prerequisite to fulfil the obligation of informing the public.Even if the forecast itself is produced by a research institute oran environmental agency it should be distributed together withthe weather forecast to reach the public.But as the air pollutionlevels are not so well known (as compared to temperature andother meteorological parameters) easily understandableindices or explanations may need to be provided.
In the cases of accidental release of hazardous materialit is the primary task of a NMHS to give advice and infor-mation to government authorities responsible for emergencyresponse which will then inform the public.
3.4.4 Reasons for the responsibility of NMSs
Weather can affect air quality in many ways. Formation oftropospheric ozone, transboundary pollutants and toxic airpollutants as well as dispersion and trajectory of these pollu-tants are very much dependent on the existing weathercondition. Forecasting air quality relies very much on thecurrent as well as on the predicted weather conditions.
One way weather can affect air quality is through hightemperature and bright sunlight, the right conditions for theformation of ground-level ozone. The higher the temperatureand the more direct the sunlight, the more ozone is produced.
Wind direction also affects ozone and other air pollutionlevels. For example, during the South-west monsoon inSouth-east Asia, the weather over the region is generally drier.The nomadic farmers in Sumatra and Kalimantan inIndonesia generally still practice traditional slash-and-burnshifting cultivation and with the drier weather in the region,they normally burn the field during this season. With theprevailing south-west wind, these pollutants are blown acrossto Malaysia and Singapore causing widespread haziness andunhealthy air quality.
The atmospheric profile also affects how quickly pollu-tants move away from a region. However, if a temperatureinversion is present, then these pollutants are trapped insideand can’t escape and after a while they may build up tounhealthy levels.
Many of the air quality models also include the weatherforecast model as one of the components and/or requireweather input. The weather parameter is very much an inte-gral part of an air quality model.With the importance of theweather component in the prediction of the air quality, theNMS has to take on an important and active role in theprediction of the air quality.
3.5 COLLABORATION WITH NATIONAL ANDINTERNATIONAL ORGANIZATIONS
3.5.1 WMO and other international organizations
Strong inter-governmental relations, good inter-organiza-tional relations and conducive foreign policy will influenceregional and international cooperation with regard to airpollution. Air pollution can be a transboundary problem(emission from one country being transported to anothercountry) or a common problem shared by neighbouringcountries. When problems are transboundary, relationsamongst countries can become strained if there are noregional understanding and cooperations with regard tosharing of information, expertise and positive commitment.
The WMO’s Global Atmosphere Watch (GAW) inte-grates many monitoring and research activities involving themeasurement of the chemical and physical properties of theatmosphere. GAW serves as an early warning system to detectfurther changes in atmospheric concentrations includingacidity and tosicity of rain as well as atmospheric content ofaerosols.Approved by the WMO Executive Council in 1989,GAW provides framework design, standards, intercalibra-tions, and data collection systems for global monitoring anddata evaluation. The Global Atmosphere WatchMeasurements Guide (No. 143) provides a detailed descrip-tion of the importance and methods of measurement ofatmospheric gases, aerosols, radioactive substances, solarradiation and atmospheric deposition.
On the research side WMO has coordinated a number ofprojects under GAW.One of the most recent projects is WMOGAW Urban Research Meteorology and Environment(GURME) project which was started in 1999 in response tothe requests from NMHSs. Because of their capabilities tocollect information that is essential for the forecasting ofurban air pollution and the evaluation of the effects of differ-ent emission control strategies, NMHSs have an importantrole to play in the study and management of urban environ-ments. WMO established GURME as a means to helpenhance the capabilities of NMHSs to handle meteorologicaland related aspects of urban pollution through coordinationand focusing of current activities. More information aboutGURME can be found on the following Web site:
http://www.wmo.ch/web/arep/gaw/urban.htmlOn the operational side, WMO participates in environ-
mental emergency response activities. By including membersfrom IAEA, ICAO and CTBTO into its coordination Groupfor Emergency Response Activities (CG-ERA) WMO stressesthe need for international cooperation. Eight RSMCs foratmospheric transport modelling further demonstrateWMO’s active role.
29Guidelines on Biometeorology and Air Quality Forecasts
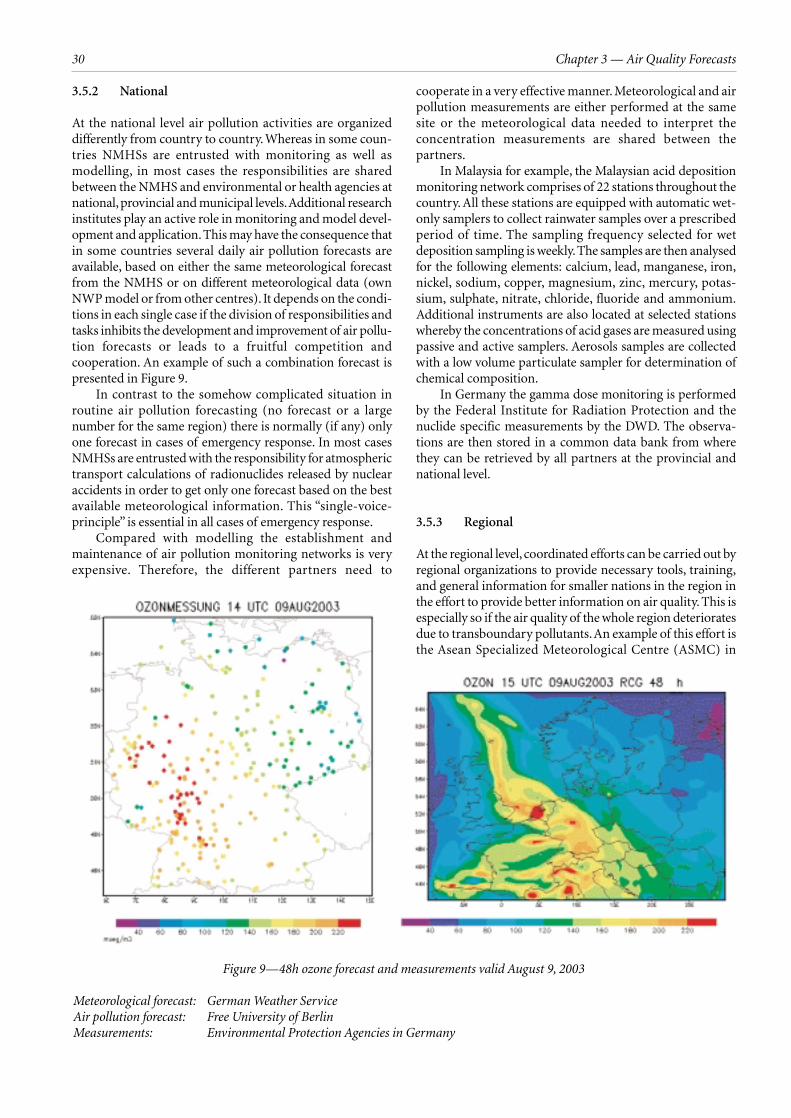
3.5.2 National
At the national level air pollution activities are organizeddifferently from country to country. Whereas in some coun-tries NMHSs are entrusted with monitoring as well asmodelling, in most cases the responsibilities are sharedbetween the NMHS and environmental or health agencies atnational, provincial and municipal levels.Additional researchinstitutes play an active role in monitoring and model devel-opment and application. This may have the consequence thatin some countries several daily air pollution forecasts areavailable, based on either the same meteorological forecastfrom the NMHS or on different meteorological data (ownNWP model or from other centres). It depends on the condi-tions in each single case if the division of responsibilities andtasks inhibits the development and improvement of air pollu-tion forecasts or leads to a fruitful competition andcooperation. An example of such a combination forecast ispresented in Figure 9.
In contrast to the somehow complicated situation inroutine air pollution forecasting (no forecast or a largenumber for the same region) there is normally (if any) onlyone forecast in cases of emergency response. In most casesNMHSs are entrusted with the responsibility for atmospherictransport calculations of radionuclides released by nuclearaccidents in order to get only one forecast based on the bestavailable meteorological information. This “single-voice-principle” is essential in all cases of emergency response.
Compared with modelling the establishment andmaintenance of air pollution monitoring networks is veryexpensive. Therefore, the different partners need to
cooperate in a very effective manner. Meteorological and airpollution measurements are either performed at the samesite or the meteorological data needed to interpret theconcentration measurements are shared between thepartners.
In Malaysia for example, the Malaysian acid depositionmonitoring network comprises of 22 stations throughout thecountry. All these stations are equipped with automatic wet-only samplers to collect rainwater samples over a prescribedperiod of time. The sampling frequency selected for wetdeposition sampling is weekly. The samples are then analysedfor the following elements: calcium, lead, manganese, iron,nickel, sodium, copper, magnesium, zinc, mercury, potas-sium, sulphate, nitrate, chloride, fluoride and ammonium.Additional instruments are also located at selected stationswhereby the concentrations of acid gases are measured usingpassive and active samplers. Aerosols samples are collectedwith a low volume particulate sampler for determination ofchemical composition.
In Germany the gamma dose monitoring is performedby the Federal Institute for Radiation Protection and thenuclide specific measurements by the DWD. The observa-tions are then stored in a common data bank from wherethey can be retrieved by all partners at the provincial andnational level.
3.5.3 Regional
At the regional level, coordinated efforts can be carried out byregional organizations to provide necessary tools, training,and general information for smaller nations in the region inthe effort to provide better information on air quality. This isespecially so if the air quality of the whole region deterioratesdue to transboundary pollutants.An example of this effort isthe Asean Specialized Meteorological Centre (ASMC) in
Chapter 3 — Air Quality Forecasts30
Figure 9—48h ozone forecast and measurements valid August 9, 2003
Meteorological forecast: German Weather ServiceAir pollution forecast: Free University of BerlinMeasurements: Environmental Protection Agencies in Germany
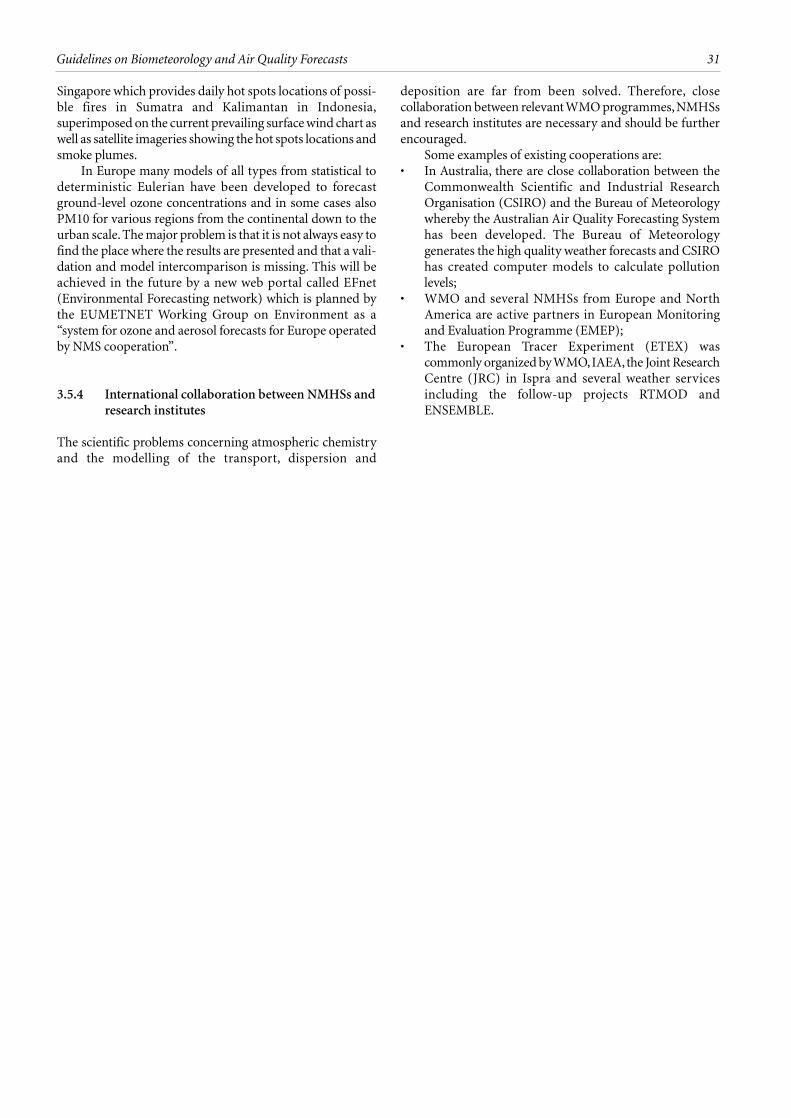
Singapore which provides daily hot spots locations of possi-ble fires in Sumatra and Kalimantan in Indonesia,superimposed on the current prevailing surface wind chart aswell as satellite imageries showing the hot spots locations andsmoke plumes.
In Europe many models of all types from statistical todeterministic Eulerian have been developed to forecastground-level ozone concentrations and in some cases alsoPM10 for various regions from the continental down to theurban scale. The major problem is that it is not always easy tofind the place where the results are presented and that a vali-dation and model intercomparison is missing. This will beachieved in the future by a new web portal called EFnet(Environmental Forecasting network) which is planned bythe EUMETNET Working Group on Environment as a“system for ozone and aerosol forecasts for Europe operatedby NMS cooperation”.
3.5.4 International collaboration between NMHSs andresearch institutes
The scientific problems concerning atmospheric chemistryand the modelling of the transport, dispersion and
deposition are far from been solved. Therefore, closecollaboration between relevant WMO programmes, NMHSsand research institutes are necessary and should be furtherencouraged.
Some examples of existing cooperations are:• In Australia, there are close collaboration between the
Commonwealth Scientific and Industrial ResearchOrganisation (CSIRO) and the Bureau of Meteorologywhereby the Australian Air Quality Forecasting Systemhas been developed. The Bureau of Meteorologygenerates the high quality weather forecasts and CSIROhas created computer models to calculate pollutionlevels;
• WMO and several NMHSs from Europe and NorthAmerica are active partners in European Monitoringand Evaluation Programme (EMEP);
• The European Tracer Experiment (ETEX) wascommonly organized by WMO,IAEA,the Joint ResearchCentre (JRC) in Ispra and several weather servicesincluding the follow-up projects RTMOD andENSEMBLE.
31Guidelines on Biometeorology and Air Quality Forecasts

There is no denying that NMHSs have an important role toplay in environmental issues. With the already well-established global network of weather observing stations anda well-connected global telecommunication network (GTS),NMHSs only need to enhance their observation programmesto include environmental monitoring. Many of the air quality
models also include weather forecast models as one of thecomponents and/or require weather input.With the changingatmospheric conditions and the demand from the generalpublic, it is becoming increasingly necessary to include airquality information as part of the routine weather forecastsissued.
Chapter 4
OUTLOOK
REFERENCES
• Guide to Public Weather Services Practices, WMO-No. 834
• U.S. Environmental Protection Agency web site at http://www.epa.gov/airnow/
• Environment Canada web site at http://www.ec.gc.ca
• Total Ozone Mapping Spectrometer web site at http://toms.gsfc.nasa.gov
• Canadian Forest Service web site at http://www.nrcan.gc.ca/cfs-scf/
• Malaysian Meteorological Service web site at http://www.kjc.gov.my
• Global Atmosphere Watch Measurements Guide No. 143
• Global Solar UV Index – A Practical Guide