Embed Size (px)
Citation preview
24th ARRB Conference – Building on 50 years of road and transport research, Melbourne, Australia 2010
© ARRB Group Ltd and Authors 2010 1
GUIDELINES FOR SELECTING TECHNIQUES FOR THE MODELLING OF ROAD NETWORK OPERATIONS
Dr. Ian Espada, ARRB Group Ltd., Australia
Dr. James Luk, ARRB Group Ltd., Australia
Dr. Young Yoo, Main Roads Western Australia
ABSTRACT
This paper describes guidelines for the selection of the appropriate modelling technique for the analysis of road network operation schemes. The guidelines include a worksheet that facilitates in the assessment of four major categories of modelling techniques based on a scoring system. The guidelines were further refined for application to single intersection analysis through a case study. SIDRA and microsimulation models, including fixed-time, vehicle-actuated and SCATSIM models were compared based on field data. The viability of manual calculation techniques was also examined. Based on the findings, a hierarchy of modelling techniques was recommended.
INTRODUCTION
The analysis of road network operation schemes often employs modelling. There are several modelling techniques that can be used. It is important that the appropriate technique is selected based on technical and practical grounds. It has been recognised that sometimes the right modelling tool has not been employed for a specific application. The objective of this study is to develop guidelines for the selection of an appropriate modelling technique. This was approached at two levels. General guidelines that are applicable to a wide range of road network operation schemes were first developed. The general guidelines were then refined for a specific application. Signalised intersection studies constitute a major share of work of road/transport agencies. Guidelines on the modelling of single intersection were developed to supplement the general guidelines. The first part of this paper describes the general guidelines and the second part of this paper describes the guidelines for single intersection modelling.
The content of this paper is a summary of Austroads project no. NS1371. Details of the study can be referred from the project reports of NS1371 (Austroads 2009a and Austroads 2010) which can be downloaded from the Austroads website (www.austroads.com.au). Technical notes on the guidelines and a worksheet were also prepared and can be downloaded from Microsimulation Hub (ARRB n.d.).
GENERAL GUIDELINES
Types of modelling techniques
Transport/traffic modelling techniques are tools that help planners/traffic engineers to examine the outcome of traffic measures. There are a variety of tools available and they can be broadly categorised into four types; namely, macro-models, micro-models, microsimulation and macrosimulation (Austroads 2006, Luk, Stewart & Walsh 2006).
Macro-models (or macroscopic analytical models) utilise the four-step model and/or land-use models to predict the volume of demand and travel patterns (i.e. origin-destination, mode share and routes taken). It is particularly useful to analyse measures that impact travel behaviour at the regional level. Example software includes EMME, CUBE and VISUM.
Micro-models (or microscopic analytical models) are models that relate directly to traffic flow theory. They include:
24th ARRB Conference – Building on 50 years of road and transport research, Melbourne, Australia 2010
© ARRB Group Ltd and Authors 2010 2
equations governing driver behaviour such as gap acceptance, lane changing, car following, etc.
theoretically or empirically derived relationships of various traffic variables, e.g. intersection delay formulae, flow-delay functions, etc.
Micro-models are robust tools for analysing isolated facilities, such as intersections. Example software includes SIDRA INTERSECTION, HCS and ARCADY. Macro-models and micro-models are analytical techniques, which are based on aggregate traffic movements. This is different from simulation techniques which replicate the behaviour of vehicles or platoons of vehicles to predict the impact of traffic measures. Macrosimulation and microsimulation are the two major types of simulation techniques.
Macrosimulation (or macroscopic simulation) is a type of simulation where vehicles are represented as a traffic stream or platoon. It is particularly useful for signal timing optimisation. Example software includes TRANSYT, SATURN and SYNCHRO.
Microsimulation (or microscopic simulation) is a type of simulation where the movement of individual vehicles is traced through a road network. This technique is useful for a wide range of applications but is also more resource intensive. Example software includes AIMSUN, PARAMICS, VISSIM and SIDRA TRIP.
Steps in technique selection
The selected tool needs to be sensitive to the relevant issues of a project. Unnecessary complexities should be avoided as they will not only increase the cost but also introduce risks. However, the objectives of the project are paramount, so while the methodology chosen needs to be simple, it should not be oversimplified. A good balance needs to be found.
The challenge is to match the context of a project to the strengths and weaknesses of each technique. The first step is to systematically contextualise the project. This is done by identifying key elements of the project. The next step is to gauge how each of the four types of modelling techniques are able to handle each of the elements identified to represent the context of the project. Each modelling technique has a certain level of suitability for each element. The recommended technique is the technique that is most suitable for all of the identified elements of the case, and exhibits no critical limitations.
The guidelines set up four steps as follows.
1. Review of case study context: The key issues and objectives of the study are documented, along with the list of alternative schemes to be considered.
2. Preliminary analysis: Prior to the development of a model, it is recommended that preliminary analysis is conducted first using alternative techniques to modelling including manual calculation, sketch planning, rule-based or warrant-based method, and qualitative assessment. A decision is then made whether further analysis by modelling is needed.
3. Review of elements of the traffic system: The user of the guidelines identifies elements relevant to the study, including characteristics of traffic or demand; type of facility; geographic and temporal scope; nature of traveller response; model functionality; performance indicators; and, accuracy, cost and presentation considerations.
4. Technique assessment: The suitability of each modelling technique is gauged as suitable, partially suitable, or unsuitable for each identified element. A score is given to a technique based on the suitability for each element. Elements identified as critical to the study site are given more weight. The score of each technique is then used as the basis for recommendation of the most appropriate technique.
The selection of the most appropriate technique is based on the following principles:
technique with the highest number of suitable elements and least number of unsuitable elements is the recommendation
24th ARRB Conference – Building on 50 years of road and transport research, Melbourne, Australia 2010
© ARRB Group Ltd and Authors 2010 3
techniques which are unsuitable in one or more critical elements should be avoided (unsuitability in certain elements may be tolerated but needs to be described as limitations of the model)
use a combination of techniques to address gaps if possible
select micro-models over simulation, if there are no critical limitations in using micro-models as this option is more cost effective than the simulation technique..
Selection worksheet
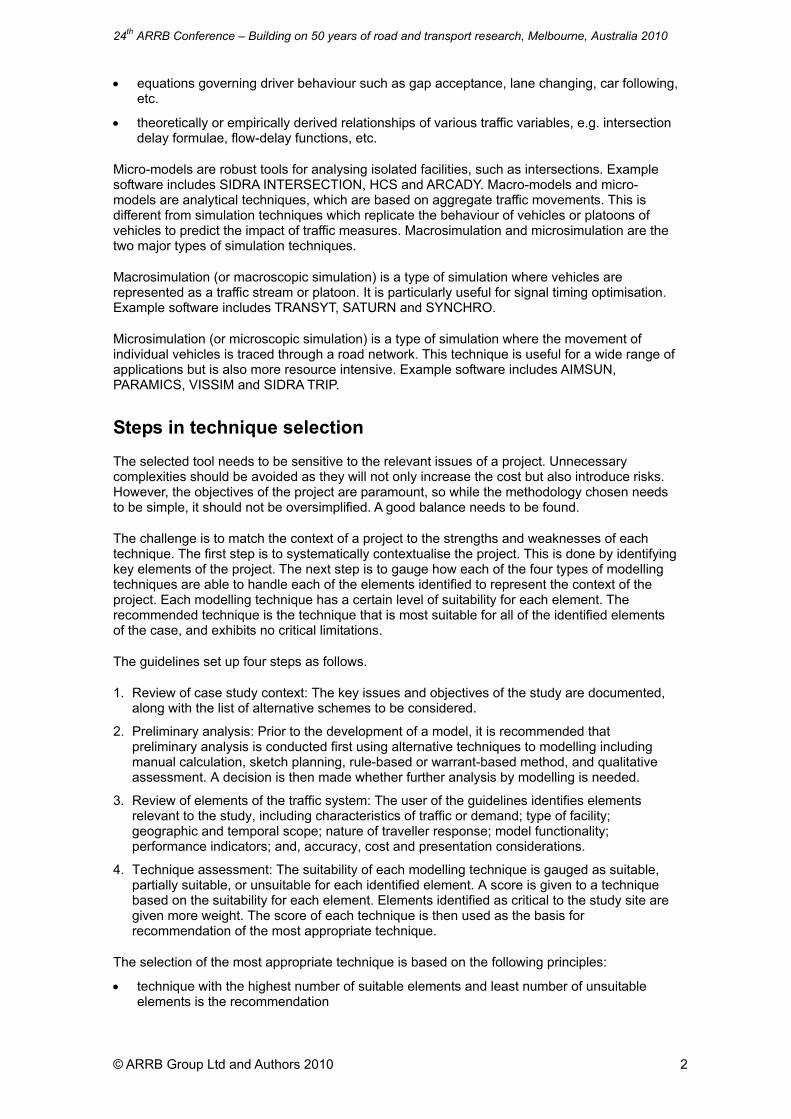
To facilitate the selection process a worksheet was developed. Table 1 illustrates the contents of the worksheet. The worksheet contains a library of around 100 elements with pre-determined assessments for each technique which aids the selection and assessment of elements relevant to the study. Technical notes on the guidelines and the worksheet can be downloaded from Microsimulation Hub (ARRB n.d.).
Table 1: Modelling technique selection worksheet
1 Context of project
1A Key issues and objectives
1B Alternative schemes and decision criteria
2 Preliminary analysis
2A Preliminary analysis results
2B Issues to be settled by modeling
2C Recommendation for further analysis by modeling: yes or no
4A Technique assessment
(suitable, partially suitable or unsuitable)
3 Review of elements of the traffic system
(select from list key aspects to be considered by the model; mark elements deemed critical to the project)
Macro-model
Micro-model
Macro-sim
Micro-sim
Demand representation e.g. origin-destination (city-wide), one-hour traffic volume, peak period volume, etc.
3A Input
Network representation e.g. highway and transit network, highway network only, cycling lanes, pedestrian facilities, etc.
Geographic and temporal scope
e.g. isolated facility, small area, corridor, long-term, short-term, etc.
Traveler response e.g. mode choice, route diversion, willingness-to-pay, etc.
3B Scope and mechanisms
Model functionality e.g. static traffic control, random incidents, pricing mechanisms, random incidents, etc.
Indicators e.g. delay, travel time, volume, ridership, journey distance, etc.
Accuracy and cost e.g. planning stage, design stage, limited funding for study, etc.
3C Output
Audience Technical and non-technical
4 Technique assessment
4B: Overall assessment
Assessment of critical elements
4C Recommended technique
4D Limitations of recommended technique
24th ARRB Conference – Building on 50 years of road and transport research, Melbourne, Australia 2010
© ARRB Group Ltd and Authors 2010 4
Practical considerations
The above four-step selection process presumes that the selection prioritises technical rigour over resources. In reality, limited resources may preclude the use of certain techniques, such as unavailability of software, lack of staff with specific expertise, or deficiency in data. These limitations would have to be taken into consideration when applying the selection process by eliminating inapplicable techniques from the set of possible techniques to use.
Assuming data is available; a single intersection analysis may require only one to three days to code and study using micro-models. Macrosimulation may require five days per intersection while microsimulation may require five to ten days especially if many scenarios are to be analysed and a higher number of simulation runs is required. The cost of software license is also a key consideration. Micro-model software is the least expensive and microsimulation software is the most expensive.
Macro-models (i.e. transport model) are basic tools for updating a city’s transport development strategy. Most cities have a macro-model which is updated approximately every five years. The set-up of a macro-model is expensive due to extensive data requirements needed for calibration and validation. Once set-up, a macro-model is a practical tool to use. Modifying a sub-set of the network for a macro-model study may only require one to three days. While most cities have a macro-model, most cities do not have a city-wide macrosimulation or microsimulation model. Developing one for even a sub-set of the CBD network will require significant effort. Even with an existing simulation model of a small network, the modification of an existing model would require significantly higher resources compared to a macro-model analysis.
Macro-model and micro-model analysis are relatively cost effective. Microsimulation is the most costly tool, while macrosimulation is intermediate, but only slightly less expensive than microsimulation.
Along with consideration of the technical aspects, the practical requirements need to be considered as well. In cases where the evaluation of techniques identify microsimulation or macrosimulation as the recommended technique but their advantages over analytical modelling (i.e. micro-model or macro-model) is not significant then it is recommended to use analytical modelling. Further analysis by simulation techniques should only be done when there are scenarios or issues that still could not be resolved by analytical modelling and can only be analysed using simulation. Even at this stage, the added cost of further analysis by simulation should be weighed over the value it could add to the recommendations of the study. It is further recommended to check the availability of existing models and data. Updating an existing microsimulation model may be cost effective than developing a new micro-model.
Illustrative example
The following is a demonstration of the general guidelines on a study of traffic signal settings of two hypothetical adjacent intersections. The study involves refinements of the signal timings of two adjacent vehicle-actuated signal controlled intersections. The traffic demand passing the intersections exhibits pronounced peaking during the morning rush hour and the peak 15-minute volume exceeds the capacity of the intersection.
Using the worksheet, relevant elements of the study were selected and noted in Table 2. Based on the default assessment of techniques for each element, the scores for each technique are calculated. Microsimulation scores an ‘8/0/0’, which means that it is a suitable technique for all eight elements of the case study (and none assessed as partially suitable or unsuitable). Furthermore, it was identified that the close proximity of the two intersections is critical to the study. Microsimulation is a suitable tool for this aspect of the study. The recommended technique for the case study is therefore microsimulation.

24th ARRB Conference – Building on 50 years of road and transport research, Melbourne, Australia 2010
© ARRB Group Ltd and Authors 2010 5
Table 2: Modelling technique selection worksheet
1 Context of project
The case study involves adjustment of traffic signal setting including coordination (design stage), under short-lived oversaturated conditions (varying 15-min volume and gridlock/highly saturated conditions).
The ability of the two adjacent intersections (highway section) to store and dissipate queues should be replicated by the model (interrupted traffic flow).
Proposed schemes include several combinations of phase sequence and timing (vehicle actuated traffic control).
The scheme that yields the least total delay is to be selected.
2 Preliminary analysis
Detailed technical aspects of the case study require modelling.
4A Technique assessment
(suitable (S), partially suitable (P) or unsuitable (U))
3 Review of elements of the traffic system
(select from list key aspects to be considered by the model; mark elements deemed critical to the project)
Macro-model
Micro-model
Macro-sim
Micro-sim
Demand representation
Varying 15-min. volume U U S S
3A Input
Network representation
VA traffic control U P P S
Geographic and temporal scope
Highway section (critical)
U U S S
Traveler response
Interrupted traffic flow U S S S
3B Scope and mechanisms
Model functionality
Gridlock/highly saturated conditions
P U S S
Indicators Delay P S S S
Accuracy and cost
Design stage P S S S
3C Output
Audience Technical S S S S
1/3/4 4/1/3 7/1/0 8/0/0 4 Technique assessment
4B Overall assessment (S/P/U)
Assessment of critical elements (S/P/U) 0/0/1 0/0/1 1/0/0 1/0/0
4C Recommended technique
4D Limitations of recommended technique
MODELLING OF SIGNALISED INTERSECTIONS
This second part of the paper aims to refine the general guidelines for a specific application through a case study. Signalised intersection studies constitute a major share of work of road/transport agencies. This case study therefore focused on selection of the appropriate modelling technique for single signalised intersection study.
Two options typically considered for modelling a single signalised intersection are micro-modelling and microsimulation. Micro-models (or microscopic analytical models) are models that relate directly to traffic flow theory. SIDRA (www.sidrasolutions.com) is the most common micro-model software used by road/transport agencies in Australia and New Zealand. Microsimulation
24th ARRB Conference – Building on 50 years of road and transport research, Melbourne, Australia 2010
© ARRB Group Ltd and Authors 2010 6
is a modelling technique where the movements of individual vehicles are simulated and used to derive various performance indicators. VISSIM (www.ptvag.com), Q-PARAMICS (www.paramics-online.com) and AIMSUN (www.aimsun.com) are the three most common microsimulation software available at road/transport agencies.
It has been noted by road/transport agencies that SIDRA is sometimes over-extended to model complex situations and microsimulation has been over-used resulting in inefficient use of resources. It was therefore desired to formulate guidance on the choice of SIDRA and microsimulation in a single signalised intersection case study.
Study sites and model development
The case study compares and examines the performance of SIDRA and microsimulation in modelling two intersections; namely, Elizabeth Dr. and Flowerdale Rd. (Liverpool, NSW) and Richmond Rd. and Garfield Rd. (Marsden Park, NSW). Data on the two study sites were provided by RTA (NSW) and were utilised for corridor improvement strategies for Elizabeth Drive (Connell Wagner 2007) and Blacktown Road and Richmond Road (Halcrow Pacific 2007).
Features of the study sites
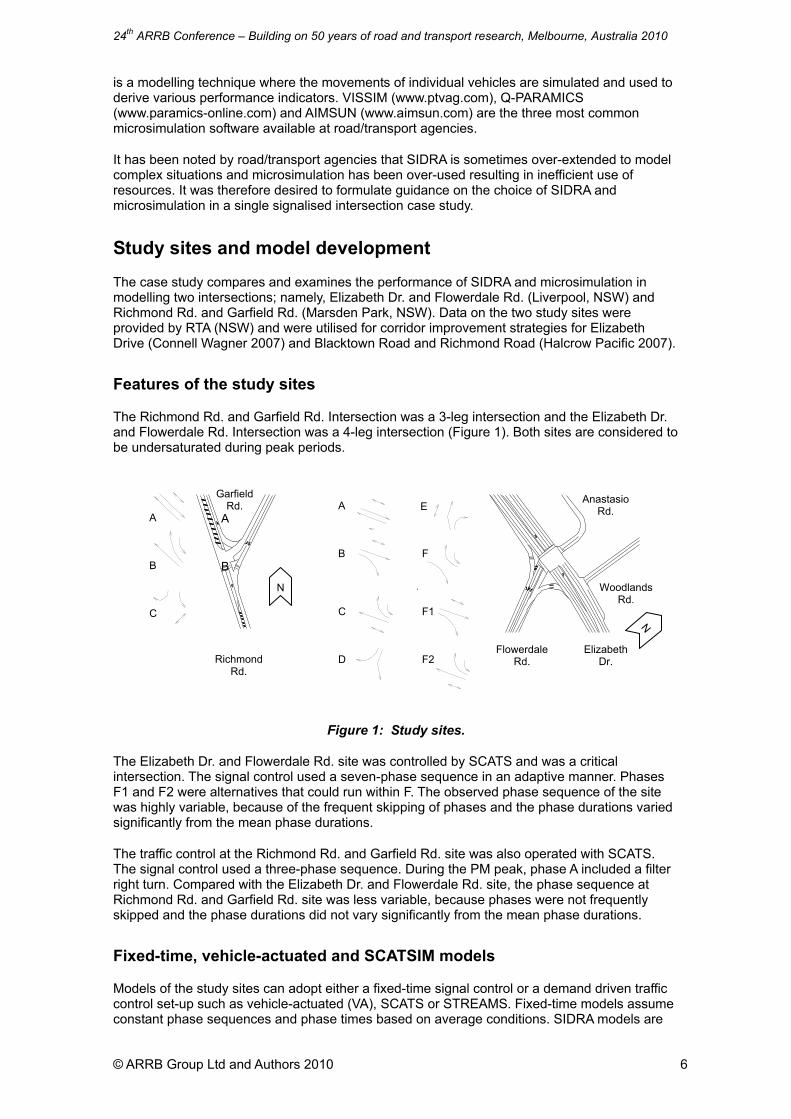
The Richmond Rd. and Garfield Rd. Intersection was a 3-leg intersection and the Elizabeth Dr. and Flowerdale Rd. Intersection was a 4-leg intersection (Figure 1). Both sites are considered to be undersaturated during peak periods.
Figure 1: Study sites.
The Elizabeth Dr. and Flowerdale Rd. site was controlled by SCATS and was a critical intersection. The signal control used a seven-phase sequence in an adaptive manner. Phases F1 and F2 were alternatives that could run within F. The observed phase sequence of the site was highly variable, because of the frequent skipping of phases and the phase durations varied significantly from the mean phase durations.
The traffic control at the Richmond Rd. and Garfield Rd. site was also operated with SCATS. The signal control used a three-phase sequence. During the PM peak, phase A included a filter right turn. Compared with the Elizabeth Dr. and Flowerdale Rd. site, the phase sequence at Richmond Rd. and Garfield Rd. site was less variable, because phases were not frequently skipped and the phase durations did not vary significantly from the mean phase durations.
Fixed-time, vehicle-actuated and SCATSIM models
Models of the study sites can adopt either a fixed-time signal control or a demand driven traffic control set-up such as vehicle-actuated (VA), SCATS or STREAMS. Fixed-time models assume constant phase sequences and phase times based on average conditions. SIDRA models are
N
Richmond Rd.
Garfield Rd.
Flowerdale Rd.
Anastasio Rd.
Woodlands Rd.
E
F
Elizabeth Dr.
A
B
C
A
B
A
B
C
D
E
F
F1
F2
N
24th ARRB Conference – Building on 50 years of road and transport research, Melbourne, Australia 2010
© ARRB Group Ltd and Authors 2010 7
based on a fixed-time traffic signal set-up. Microsimulation has the capability to model fixed-time traffic control and demand driven traffic signal schemes.
Fixed-time models are suitable when there is less variability in the phase times as in the case of the Richmond Rd. and Garfield Rd. site. The Elizabeth Dr. and Flowerdale Rd. site featured frequent skipping of phases. As a result time allocated to a phase per cycle has large variability, i.e. when skipped the phase time is zero, otherwise it is at least equal to the minimum green time. Fixed-time models were not able to accurately replicate the observed phase sequence at the Elizabeth Dr. and Flowerdale Rd. site. An A-B-D-E-F-F1 phase sequence was assumed by fixed-time models for the Elizabeth Dr. and Flowerdale Rd. site. Only microsimulation models employing demand driven traffic control schemes could accurately model the observed phase sequence at the site.
Fixed-time models, using SIDRA and microsimulation, were developed for the two study sites. Additionally, microsimulation models based on VA traffic signal and SCATSIM were developed for the Elizabeth Dr. and Flowerdale Rd. site.
SCATSIM is a microsimulation package that uses SCATS to optimise the traffic signal operation of a road network being simulated. Simulated detectors in a network model send traffic flow information to SCATS. SCATS then optimises signal timings and sends them back to the simulated network.
Richmond rd. and Garfield rd. fixed time models
Cycle average queue field measurements were available for the Richmond Rd. and Garfield Rd. site and it was used for model validation. Cycle average queue is the average number of vehicles in the queue during each cycle (Akcelik & Associates 2007). This is based on queue counts recorded in time intervals, e.g. every 5 s. This incorporates all queue states including zero queue states.
A fixed-time microsimulation model and a SIDRA model were developed for the Richmond Rd. and Garfield Rd. site. VISSIM was used to develop the microsimulation model. Both SIDRA and VISSIM models were developed by ARRB.
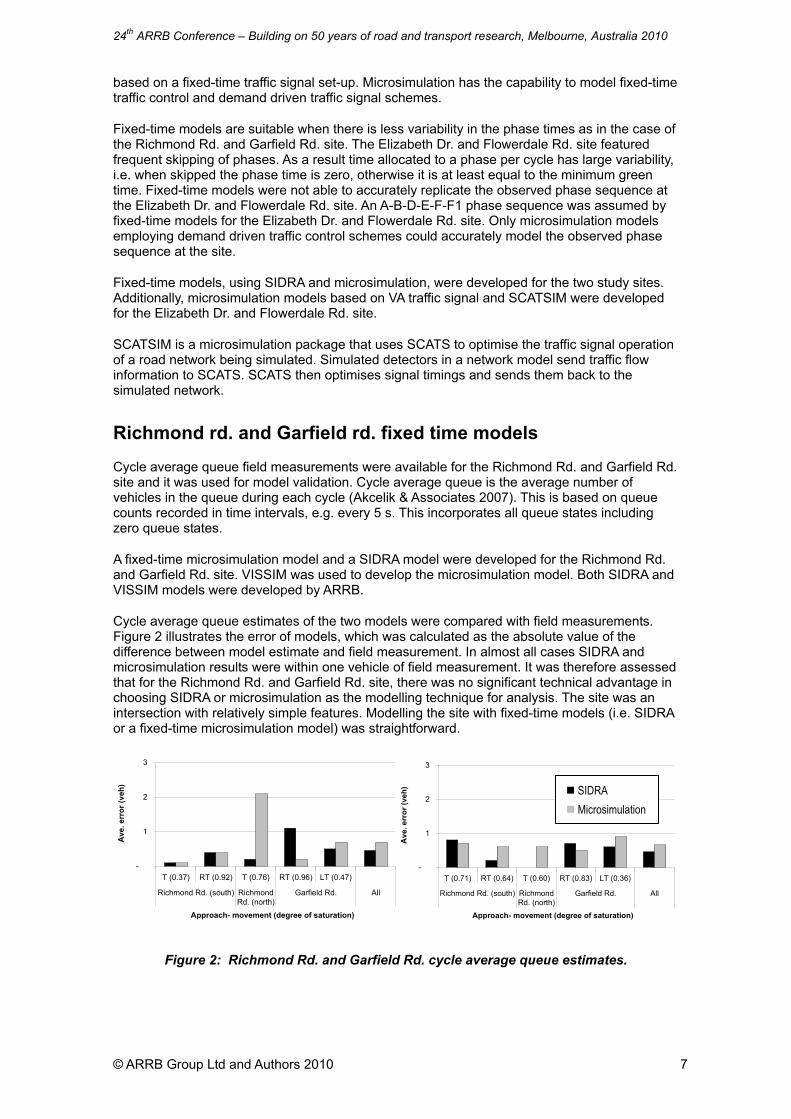
Cycle average queue estimates of the two models were compared with field measurements. Figure 2 illustrates the error of models, which was calculated as the absolute value of the difference between model estimate and field measurement. In almost all cases SIDRA and microsimulation results were within one vehicle of field measurement. It was therefore assessed that for the Richmond Rd. and Garfield Rd. site, there was no significant technical advantage in choosing SIDRA or microsimulation as the modelling technique for analysis. The site was an intersection with relatively simple features. Modelling the site with fixed-time models (i.e. SIDRA or a fixed-time microsimulation model) was straightforward.
Figure 2: Richmond Rd. and Garfield Rd. cycle average queue estimates.
-
1
2
3
T (0.37) RT (0.92) T (0.76) RT (0.96) LT (0.47)
Richmond Rd. (south) RichmondRd. (north)
Garfield Rd. All
Approach- movement (degree of saturation)
Av
e. e
rro
r (v
eh)
-
1
2
3
T (0.71) RT (0.64) T (0.60) RT (0.83) LT (0.36)
Richmond Rd. (south) RichmondRd. (north)
Garfield Rd. All
Approach- movement (degree of saturation)
Ave
. err
or
(veh
) SIDRA
Microsimulation
24th ARRB Conference – Building on 50 years of road and transport research, Melbourne, Australia 2010
© ARRB Group Ltd and Authors 2010 8
Elizabeth dr. and Flowerdale rd. field data and models
The back of queue is the maximum extent of the queue measured from the stopline in a cycle. It includes vehicles that would join the end of the queue when vehicles at the front of the queue are already moving (Akcelik & Associates 2007). Back of queue field measurements were available for the Elizabeth Dr. and Flowerdale Rd. site. The site featured 12 movements and six of the 12 movements have surveyed data. Major movements at the site were among the movements with field measurements. Comparison between model estimates and field measurements were based on mean and/or maximum back of queue. The mean back of queue is the back of queue of the average cycle during a given period; and, the maximum back of queue is the longest back of queue recorded for a given period.
Due to the more complex set-up of the Elizabeth Dr. and Flowerdale Rd. site than the Richmond Rd. and Garfield Rd. site, several model variants were developed for comparison. This included three variations of SIDRA models, five variations of fixed-time microsimulation models, one VA model and one SCATSIM model (Table 3).
Table 3: Elizabeth dr. and Flowerdale rd. Models
Model type Technique Description
SIDRA Three types of SIDRA models were used, each incorporating different feasible assumptions on traffic arrivals (random or non-random) and demand (i.e. average hourly demand input or four 15-minute demand input). The SIDRA models were developed by ARRB.
Fixed-time
Five types of fixed-time microsimulation models were used. The models incorporate different feasible assumptions similar to the SIDRA models. The following were the models used.
Two VISSIM models developed by ARRB
Q-PARAMICS model developed by RTA1
Two AIMSUN models, one developed by DTEI and another developed by TMR2
VA VA model using VISSIM developed by MRWA.
SCATSIM
Micro - simulation
SCATSIM model using Q-PARAMICS developed by RTA1.
Notes: 1. Halcrow MWT 2010 2. Stewart 2009
Elizabeth dr. and Flowerdale rd. fixed-time models
Figure 3 illustrates the error of mean back of queue estimates of SIDRA models and fixed-time microsimulation models for the Elizabeth Dr. and Flowerdale Rd. site. SIDRA results are the average of the three SIDRA models; and, microsimulation results are the average of the five fixed-time microsimulation models developed for the site.
There was no notable difference between SIDRA and microsimulation results for the AM peak period, wherein SIDRA and microsimulation were similarly accurate in general. There was however one microsimulation model that significantly overestimated queues for the through movement at the Elizabeth Dr. (west) approach. The other four microsimulation models had comparable results with the SIDRA models.
In the PM peak period, it was assessed that microsimulation had better results than SIDRA in general. SIDRA overestimated queues for the through movement at the Elizabeth Dr. (east) approach. Microsimulation had better results for this movement. It was however noted that the fixed-time microsimulation model results were biased towards overestimating queues for this movement (i.e. all estimates were higher than field measurements). Comparison based on maximum back of queue reached similar conclusions.

24th ARRB Conference – Building on 50 years of road and transport research, Melbourne, Australia 2010
© ARRB Group Ltd and Authors 2010 9
Figure 3: Elizabeth dr. and Flowerdale rd. fixed-time models mean back of queue.results
Elizabeth dr. and Flowerdale rd. VA model
Figure 4 illustrates the error of mean back of queue estimates of the VA microsimulation model for Elizabeth Dr. and Flowerdale Rd. Fixed-time model results including SIDRA and fixed-time microsimulation results were included for comparison. The VA model was developed using VISSIM. To be consistent with the VISSIM VA model, only the fixed-time VISSIM models were included. In both the AM peak and the PM peak, the VA model had more accurate results than the fixed time models. Comparison based on maximum back of queue yielded similar conclusions.
It was particularly noted that the VA model was able to accurately replicate the queues for the through movement at the Elizabeth Dr. (east) approach in the PM peak, while the fixed-time models overestimated queues for this movement. The source of the error of the fixed-time models was traced to the approximation errors in the fixed-time signal setting assumed to represent the highly variable phase sequence observed at the site. The adaptive nature of SCATS and the characteristics of demand at the site resulted in a highly variable phase sequence that could not be modelled accurately by a fixed-time model. Due to the high degree of saturation of the movement, a slight underestimation of phase time resulted in a significant overestimation of queue. Sensitivity tests confirmed that further improvement of fixed-time model results by adjusting the assumed fixed-time signal setting was not possible. Increasing phase time for the through movement at the Elizabeth Dr. (east) approach would reduce phase time for other movements which would lead to errors in other movements. The VA model was able to replicate the highly variable phase sequence observed at the site; therefore its queue estimates were more accurate.
Figure 4: Elizabeth Dr. and Flowerdale Rd. VA and fixed-time models mean back of queue results.
-
2
4
6
8
10
T (0.91) RT(0.12)
T (0.28) RT(0.96)
T/RT(0.43)
RT(0.21)
Elizabeth (east) Elizabeth (west) Flowerdale All
Approach- movement (degree of saturation)
Ave
. err
or
(veh
)
-
1
2
3
4
5
6
T (0.45) RT(0.07)
T (0.42) RT(0.98)
T/RT(0.76)
RT(0.38)
Elizabeth (east) Elizabeth (west) Flowerdale All
Approach- movement (degree of saturation)
Ave
. err
or
(ve
h)
(a) AM peak (b) PM peak
SIDRA
Microsimulation
-
2
4
6
8
10
T (0.91) RT (0.12) T (0.28) RT (0.96) T/RT(0.43)
Elizabeth (east) Elizabeth (west) Flowerdale All
Approach- movement (degree of saturation)
ave.
err
or
(veh
)
-
1
2
3
4
T (0.45) RT (0.07) T (0.42) RT (0.98) T/RT(0.76)
Elizabeth (east) Elizabeth (west) Flowerdale All
Approach- movement (degree of saturation)
ave.
err
or
(veh
)
(b) PM peak (a) AM peak
SIDRA (fixed-time)
VISSIM (fixed-time)
VISSIM (VA)
24th ARRB Conference – Building on 50 years of road and transport research, Melbourne, Australia 2010
© ARRB Group Ltd and Authors 2010 10
Elizabeth dr. and Flowerdale rd. SCATSIM model
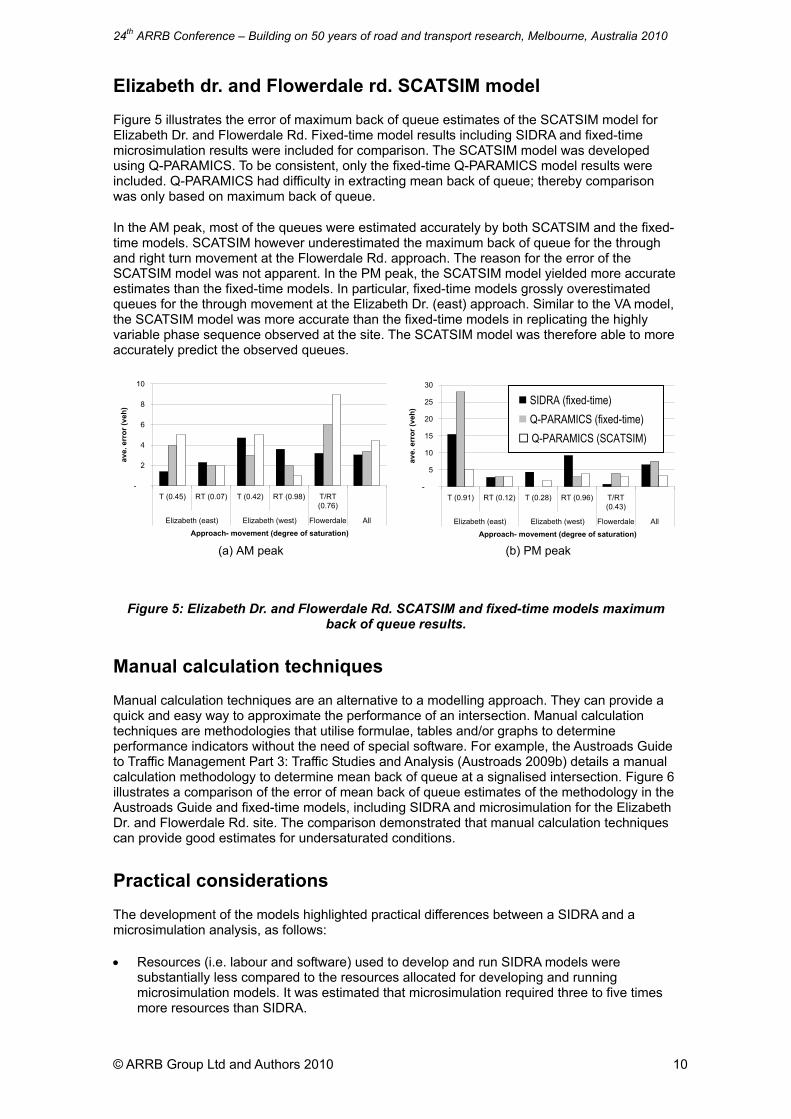
Figure 5 illustrates the error of maximum back of queue estimates of the SCATSIM model for Elizabeth Dr. and Flowerdale Rd. Fixed-time model results including SIDRA and fixed-time microsimulation results were included for comparison. The SCATSIM model was developed using Q-PARAMICS. To be consistent, only the fixed-time Q-PARAMICS model results were included. Q-PARAMICS had difficulty in extracting mean back of queue; thereby comparison was only based on maximum back of queue.
In the AM peak, most of the queues were estimated accurately by both SCATSIM and the fixed-time models. SCATSIM however underestimated the maximum back of queue for the through and right turn movement at the Flowerdale Rd. approach. The reason for the error of the SCATSIM model was not apparent. In the PM peak, the SCATSIM model yielded more accurate estimates than the fixed-time models. In particular, fixed-time models grossly overestimated queues for the through movement at the Elizabeth Dr. (east) approach. Similar to the VA model, the SCATSIM model was more accurate than the fixed-time models in replicating the highly variable phase sequence observed at the site. The SCATSIM model was therefore able to more accurately predict the observed queues.
Figure 5: Elizabeth Dr. and Flowerdale Rd. SCATSIM and fixed-time models maximum back of queue results.
Manual calculation techniques
Manual calculation techniques are an alternative to a modelling approach. They can provide a quick and easy way to approximate the performance of an intersection. Manual calculation techniques are methodologies that utilise formulae, tables and/or graphs to determine performance indicators without the need of special software. For example, the Austroads Guide to Traffic Management Part 3: Traffic Studies and Analysis (Austroads 2009b) details a manual calculation methodology to determine mean back of queue at a signalised intersection. Figure 6 illustrates a comparison of the error of mean back of queue estimates of the methodology in the Austroads Guide and fixed-time models, including SIDRA and microsimulation for the Elizabeth Dr. and Flowerdale Rd. site. The comparison demonstrated that manual calculation techniques can provide good estimates for undersaturated conditions.
Practical considerations
The development of the models highlighted practical differences between a SIDRA and a microsimulation analysis, as follows:
Resources (i.e. labour and software) used to develop and run SIDRA models were substantially less compared to the resources allocated for developing and running microsimulation models. It was estimated that microsimulation required three to five times more resources than SIDRA.
-
2
4
6
8
10
T (0.45) RT (0.07) T (0.42) RT (0.98) T/RT(0.76)
Elizabeth (east) Elizabeth (west) Flowerdale All
Approach- movement (degree of saturation)
ave.
err
or
(veh
)
-
5
10
15
20
25
30
T (0.91) RT (0.12) T (0.28) RT (0.96) T/RT(0.43)
Elizabeth (east) Elizabeth (west) Flowerdale All
Approach- movement (degree of saturation)
ave.
err
or
(veh
)
(a) AM peak (b) PM peak
SIDRA (fixed-time)
Q-PARAMICS (fixed-time)
Q-PARAMICS (SCATSIM)

24th ARRB Conference – Building on 50 years of road and transport research, Melbourne, Australia 2010
© ARRB Group Ltd and Authors 2010 11
A VA and SCATSIM microsimulation model would require at least 20% more labour resources than a fixed-time microsimulation model. The additional plug-ins and licences needed to run a VA and particularly a SCATSIM model would further increase the cost difference.
The animation capability of microsimulation was an advantage over SIDRA in visualising the performance of the intersection.
Figure 6: Elizabeth Dr. and Flowerdale Rd. manual calculation and fixed-time models mean back of queue results.
Guidance on modelling technique selection
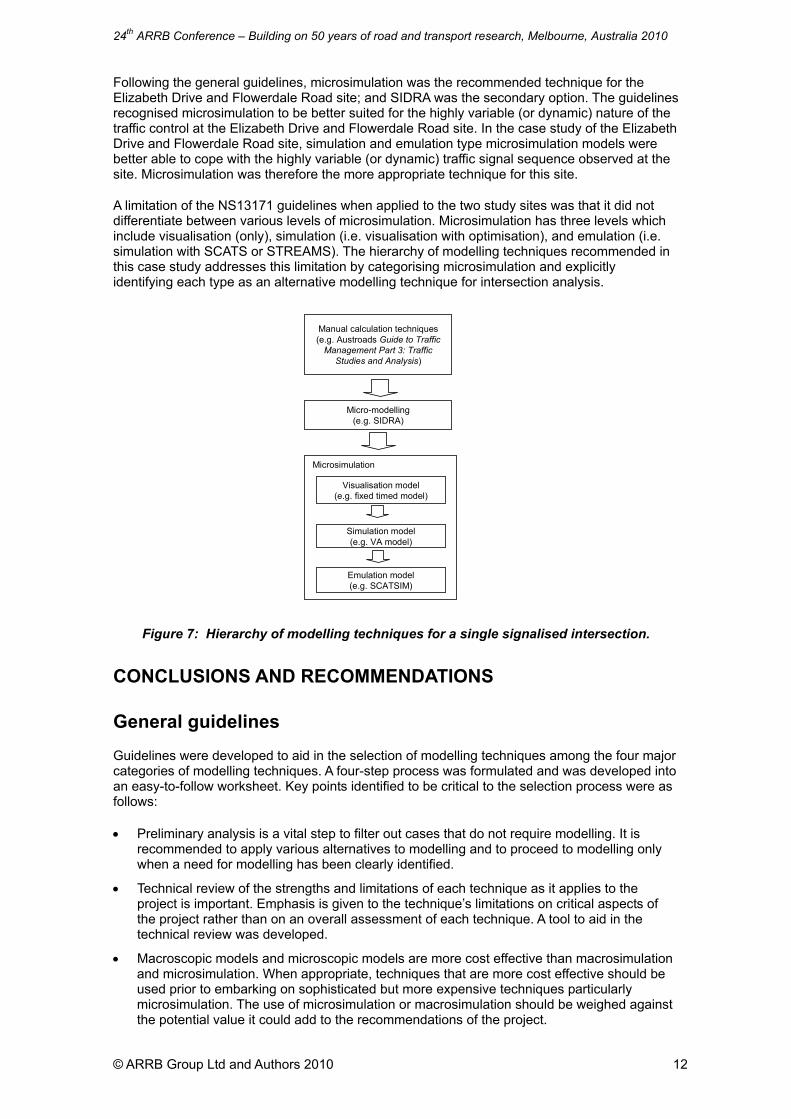
A hierarchy of modelling techniques (Figure 7) is recommended based on the findings of the case study. The hierarchy of techniques would consist of manual calculation techniques, micro-modelling (e.g. SIDRA) and microsimulation, in increasing levels of sophistication and resources required. Microsimulation could be further categorised as follows:
Visualisation models – the microsimulation model is used for the basic function of displaying movements of vehicles and pedestrians, and how traffic management measures affect these movements, e.g. fixed-time signal control, priority intersections and roundabouts.
Simulation models (i.e. visualisation with optimisation) – the model offers the extra functions of simulating the interaction of vehicle and pedestrian movements with simulated control measures such as freeway ramp metering, vehicle-actuated signal control and variable message signs based on traffic flow data from simulated detectors.
Emulation models (i.e. visualisation with SCATS or STREAMS) – this is a special form of model where simulated detectors send traffic flow information to a ‘real’ signal control system (e.g. SCATS or STREAMS) that optimises signal timings and sends them back to an interface representing simulated signal controllers.
The simplest and cheapest technique should be attempted first. More sophisticated techniques should be used only when a need has been identified based on results from simpler techniques.
Application of the general guidelines
The general guidelines described in the first part of this paper were applied to the two study sites. Based on the general guidelines, SIDRA was the recommended technique for the Richmond and Garfield site; and, microsimulation was the secondary option. The determining factor was the lower cost of a SIDRA analysis and the absence of a technical advantage of microsimulation. The recommendation of the general guidelines was consistent with the findings of this case study. The SIDRA model and microsimulation model outputs were similarly accurate, but the SIDRA analysis entailed lesser cost. SIDRA was therefore the more appropriate technique for this site.
-
1
2
3
4
5
6
T (0.45) RT(0.07)
T (0.42) RT(0.98)
T/RT(0.76)
RT(0.38)
Elizabeth (east) Elizabeth (west) Flowerdale All
Approach- movement (degree of saturation)
ave.
err
or
(ve
h)
-123456789
10
T (0.91) RT(0.12)
T (0.28) RT(0.96)
T/RT(0.43)
RT(0.21)
Elizabeth (east) Elizabeth (west) Flowerdale All
Approach- movement (degree of saturation)
ave.
err
or
(ve
h)
(a) AM peak
SIDRA (fixed-time)
Microsimulation (fixed-time)
Austroads guide
(b) PM peak
24th ARRB Conference – Building on 50 years of road and transport research, Melbourne, Australia 2010
© ARRB Group Ltd and Authors 2010 12
Microsimulation
Manual calculation techniques(e.g. Austroads Guide to Traffic
Management Part 3: Traffic Studies and Analysis)
Micro-modelling(e.g. SIDRA)
Visualisation model(e.g. fixed timed model)
Simulation model(e.g. VA model)
Emulation model(e.g. SCATSIM)
Following the general guidelines, microsimulation was the recommended technique for the Elizabeth Drive and Flowerdale Road site; and SIDRA was the secondary option. The guidelines recognised microsimulation to be better suited for the highly variable (or dynamic) nature of the traffic control at the Elizabeth Drive and Flowerdale Road site. In the case study of the Elizabeth Drive and Flowerdale Road site, simulation and emulation type microsimulation models were better able to cope with the highly variable (or dynamic) traffic signal sequence observed at the site. Microsimulation was therefore the more appropriate technique for this site.
A limitation of the NS13171 guidelines when applied to the two study sites was that it did not differentiate between various levels of microsimulation. Microsimulation has three levels which include visualisation (only), simulation (i.e. visualisation with optimisation), and emulation (i.e. simulation with SCATS or STREAMS). The hierarchy of modelling techniques recommended in this case study addresses this limitation by categorising microsimulation and explicitly identifying each type as an alternative modelling technique for intersection analysis.
Figure 7: Hierarchy of modelling techniques for a single signalised intersection.
CONCLUSIONS AND RECOMMENDATIONS
General guidelines
Guidelines were developed to aid in the selection of modelling techniques among the four major categories of modelling techniques. A four-step process was formulated and was developed into an easy-to-follow worksheet. Key points identified to be critical to the selection process were as follows:
Preliminary analysis is a vital step to filter out cases that do not require modelling. It is recommended to apply various alternatives to modelling and to proceed to modelling only when a need for modelling has been clearly identified.
Technical review of the strengths and limitations of each technique as it applies to the project is important. Emphasis is given to the technique’s limitations on critical aspects of the project rather than on an overall assessment of each technique. A tool to aid in the technical review was developed.
Macroscopic models and microscopic models are more cost effective than macrosimulation and microsimulation. When appropriate, techniques that are more cost effective should be used prior to embarking on sophisticated but more expensive techniques particularly microsimulation. The use of microsimulation or macrosimulation should be weighed against the potential value it could add to the recommendations of the project.

24th ARRB Conference – Building on 50 years of road and transport research, Melbourne, Australia 2010
© ARRB Group Ltd and Authors 2010 13
Modelling of signalised intersection
The general guidelines were refined for application to single signalised intersection analysis using two intersections as case study.
The Richmond Road and Garfield Road site was a relatively simple intersection and modelling the site with fixed-time models was straightforward. The comparison of SIDRA and fixed-time microsimulation models with field measured cycle average queues indicated that the SIDRA and fixed-time microsimulation models provided equally accurate estimates.
The Elizabeth Drive and Flowerdale Road site was a more complex intersection that featured a highly variable phase sequence. SIDRA and fixed-time microsimulation models’ estimates were determined to be equally accurate when estimating mean and maximum back of queue of the study site in general. Microsimulation models featuring complex traffic control set-up including VA and SCATSIM (i.e. microsimulation interfaced with SCATS) were compared with fixed-time models including SIDRA and fixed-time microsimulation models. VA and SCATSIM microsimulation models provided more accurate queue length estimates under certain conditions. It is noted that the findings are limited to the undersaturated conditions of the two sites available for this study.
Based on the findings of the case study, a hierarchy of modelling techniques is recommended. The hierarchy of techniques consist of manual calculation techniques, micro-modelling (e.g. SIDRA) and microsimulation, in increasing levels of sophistication and resources required. Microsimulation could be further categorised into visualisation models (e.g. fixed-time microsimulation models), simulation models (e.g. VA models) and emulation models (e.g. interface with SCATS or STREAMS). The simplest and cheapest technique should be attempted first. More sophisticated techniques should be used only when a need has been identified based on results from simpler techniques.
ACKNOWLEDGEMENTS
This paper is based on a study funded under the Austroads Network Program Project NS1371 (Guidelines for Selecting Techniques for the Modelling and Analysis of Network Operations including Environmental Impacts). The contribution from the Project Manager Young Yoo and other project team members is much appreciated.
REFERENCES
Akcelik & Associates 2007, SIDRA Intersection user guide, Akcelik & Associates, Greythorn, Vic.
Austroads 2006, The use and application of microsimulation traffic models, by J Luk & J Tay, AP-R286/06, Austroads, Sydney, NSW.
Austroads 2009a, Guidelines for selecting techniques for the modelling of network operations, by I Espada, J Luk & B Lloyd, AP-R350/09 Austroads, Sydney, NSW.
Austroads 2009b, Guide to traffic management: part 3: traffic studies and analysis, by D Bennett, R Troutbeck, P Croft, D McTiernan & A Shah, AGTM03/09, Austroads, Sydney, NSW.
Austroads 2010, 'Modelling of signalised intersections: case study (final draft)', by I Espada, P Bennett & J Luk, Austroads project NS1371, RCNS1371-5, Austroads, Sydney, NSW.
ARRB Group 2009, Microsimulation hub, ARRB Group, Vermont South, Vic, viewed 12 February 2009, <http://www.microsimulationhub.com>.
Connell Wagner 2007, ‘‘Pinch point’ corridor improvement: Elizabeth Drive, Liverpool: SIDRA modelling (draft)’, report no. 32025-001, Roads and Traffic Authority, Sydney, NSW.

24th ARRB Conference – Building on 50 years of road and transport research, Melbourne, Australia 2010
© ARRB Group Ltd and Authors 2010 14
Halcrow Pacific 2007, ‘‘Pinch point’ corridor improvement strategies Blacktown Road, Seven Hills and Blacktown Richmond, Marsden Park: calibration and validation of SIDRA model’, Roads and Traffic Authority, Sydney, NSW.
Halcrow MWT 2010, ‘Paramics model for NSW case study intersection of Elizabeth Drive and Flowerdale Road, Liverpool’, Roads and Traffic Authority, Sydney, NSW.
Luk, JYK, Stewart, D & Walsh, D 2006, ‘Microsimulation traffic models: usage, limitations and applications’, ARRB conference, 22nd, 2006, Canberra, ACT, ARRB Group, Vermont South, Vic., 18pp.
Stewart, DK 2009, ‘Modelling result for NS1371 project: Elizabeth Drive / Flowerdale Road’, Queensland Department of Transport and Main Roads, Springhill, Qld.
AUTHOR BIOGRAPHIES
Dr. Ian Espada joined the transport operations team of ARRB in 2008. Prior to ARRB he worked for ALMEC Corp. as a transport planning consultant for seven years. He has worked with several transport and traffic models for project and research applications.
Dr James Luk joined the ARRB in Melbourne in 1975 and had been seconded to RTA NSW and Queensland Main Roads. He also spent a few years with the Nanyang Technological University in Singapore as an Associate Professor and has rejoined ARRB since July 2002. James won the 1992 Best Paper Kitamura Award at the Road Engineering Association of Asia and Australasia Conference, the 1996 Best Project Award of the Parking Association of Australia and the Best Paper Award (Undergraduate) at the 2006 CAITR with his student. He is also an Adjunct Professor of La Trobe University in Melbourne.
Dr Young Yoo (MIEAust, CPEng) joined Main Roads WA in 1996, and was responsible for the development of Intelligent Transport Systems for four years. Between 2001 and 2009, he has been responsible for the Traffic Modelling Section which deals with traffic forecasting and economic assessment of road projects in Western Australia. Prior to joining Main Roads WA, he had worked in the United Kingdom, Tasmania, Canberra and then the Ministry for Planning in Western Australia in the areas of hydrodynamic engineering, concrete technology, traffic engineering, transport planning and town planning.