Embed Size (px)
Citation preview
Guidelines for Selecting an Effective Control Treatment Strategy when Changing Water Supply Sources or Modifying Treatment Portfolios
Presented by:
Steven J. Duranceau, Ph.D., P.E.
Associate Professor
Director, Environmental Systems Engineering Institute
College of Engineering and Computer Science
Department of Civil and Environmental Engineering
UNIVERSITY OF CENTRAL FLORIDA
Orlando, Florida
Prepared for:
2015 Pacific Water Conference
Enhancing Hawai’i’s Water Resources for the Future
February 4, 2015
Honolulu, Hawaii
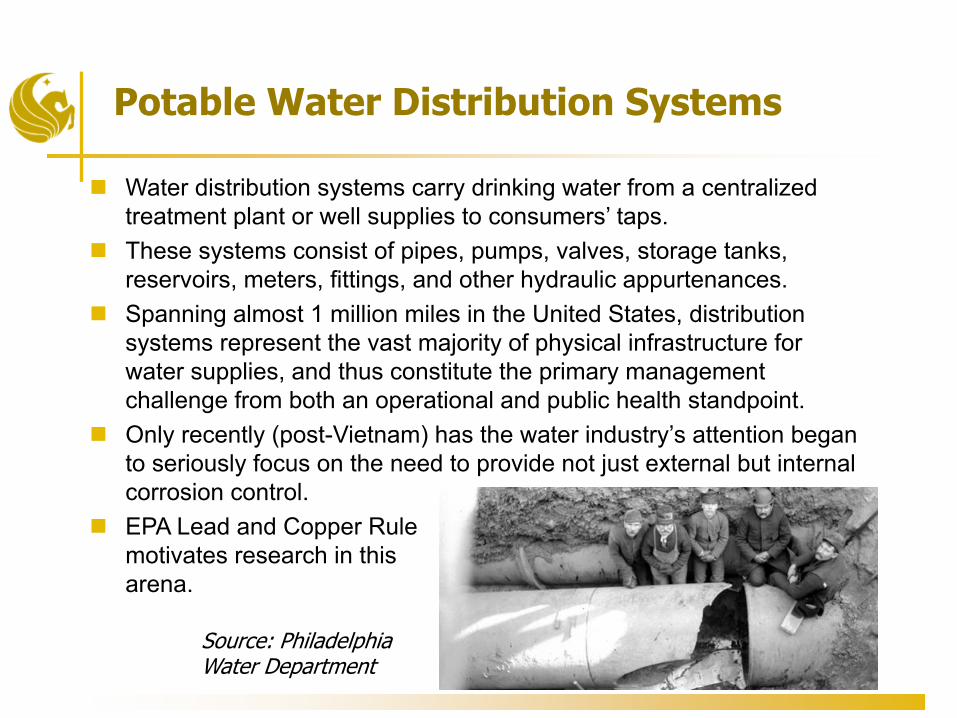
Potable Water Distribution Systems
� Water distribution systems carry drinking water from a centralized treatment plant or well supplies to consumers’ taps.
� These systems consist of pipes, pumps, valves, storage tanks, reservoirs, meters, fittings, and other hydraulic appurtenances.
� Spanning almost 1 million miles in the United States, distribution systems represent the vast majority of physical infrastructure for water supplies, and thus constitute the primary management challenge from both an operational and public health standpoint.
� Only recently (post-Vietnam) has the water industry’s attention began to seriously focus on the need to provide not just external but internal corrosion control.
� EPA Lead and Copper Rule motivates research in thisarena.
Source: Philadelphia Water Department

� Water purveyors that change water supply or vary water supply:� Groundwater supplies converted to surface water supplies.
� Surface water supplies that cycle between wet weather and spring flow.
� River supplies that vary in hardness (wet weather vs. ground seepage).
� Water purveyors that modify their treatment portfolio, perhaps with the use of alternative water supplies:� Brackish water desalination blends with native (existing) facilities.
� Seawater desalination blends with native (existing) facilities.
� Conversion of water supplies (ground to surface; surface to ground)
� Indirect potable reuse
� Direct potable reuse
Changing Water Supply Sources or Modifying Treatment Portfolios

Premise Plumbing Key Characteristics
� The total pipe length of U.S. municipal mains has be estimated at about 1 million miles. [Grigg, JAWWA, 97:58-68. 2005].
� Whereas, 5.3 million miles of copper tubing alone were installed in buildings between 1963 and 1999. [Copper Development Association, 2005].
� Premise plumbing has about 10 times more surface area per unit length than in the municipal main distribution system. [NRC, 2006]
“NRC: Because water utilities have very limited control beyond the water meter of the customer, much of our existing information on water quality is not relevant to premises.” [National Research Council, 2006]

� 1974 Safe Drinking Water Act
� 1986 Amendments to SDWA
� 1991 Lead and Copper Rule (LCR)
� Lead Action Level = 0.15 mg/L
� Copper Action Level = 1.30 mg/L
� Monitoring Requirements
� ‘Treatment Technique’
� 40 CFR 141.82 - Description of corrosion control treatment requirements
� 2000 LCR Minor Revisions
� 2007 LCR Short-Term Regulatory Revisions
Pitting Corrosion Not Covered in LCR
Legislation for Corrosion Control
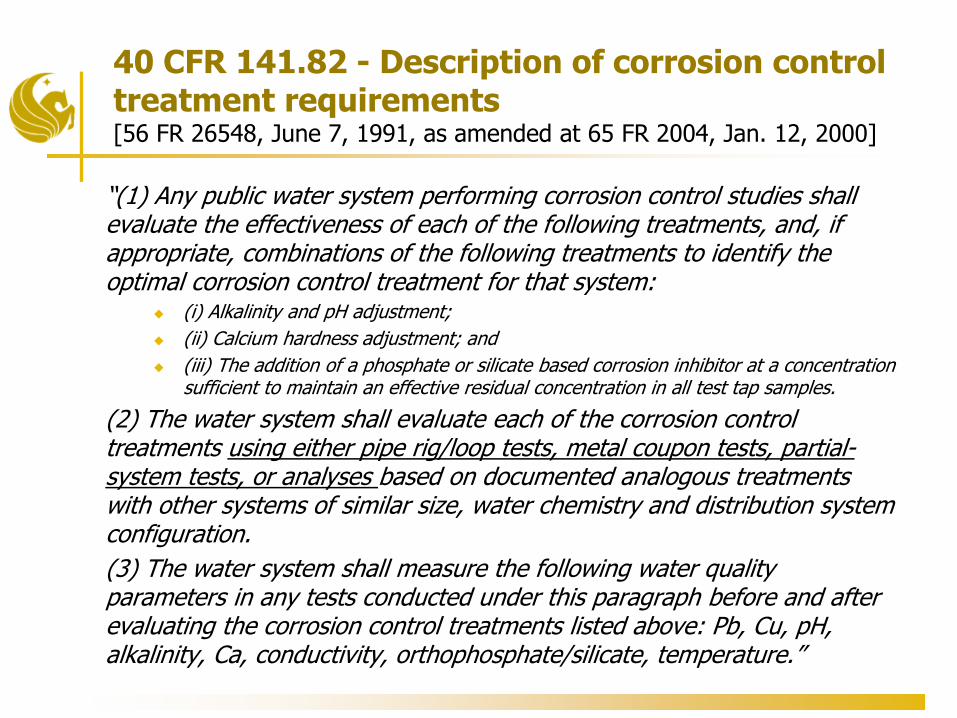
40 CFR 141.82 - Description of corrosion control treatment requirements [56 FR 26548, June 7, 1991, as amended at 65 FR 2004, Jan. 12, 2000]
“(1) Any public water system performing corrosion control studies shall evaluate the effectiveness of each of the following treatments, and, if appropriate, combinations of the following treatments to identify the optimal corrosion control treatment for that system:
� (i) Alkalinity and pH adjustment;
� (ii) Calcium hardness adjustment; and
� (iii) The addition of a phosphate or silicate based corrosion inhibitor at a concentration sufficient to maintain an effective residual concentration in all test tap samples.
(2) The water system shall evaluate each of the corrosion control treatments using either pipe rig/loop tests, metal coupon tests, partial-system tests, or analyses based on documented analogous treatments with other systems of similar size, water chemistry and distribution system configuration.
(3) The water system shall measure the following water quality parameters in any tests conducted under this paragraph before and after evaluating the corrosion control treatments listed above: Pb, Cu, pH, alkalinity, Ca, conductivity, orthophosphate/silicate, temperature.”

US Army Corps of Engineers (1988-1994)
� Development of the Pipe Loop System for Determining Effectiveness of Corrosion Control Chemicals in Potable Water Systems (1988).
� Drinking Water Treatment Optimization Using the Pipe-Loop System: Demonstration at Aberdeen Proving Ground, MD (1990).
� Using the CERL Pipe Loop System (PLS) To Evaluate Corrosion Inhibitors That Can Reduce Lead in Drinking Water (1994).
� Few water utilities rely on the USACE method to conduct studies.
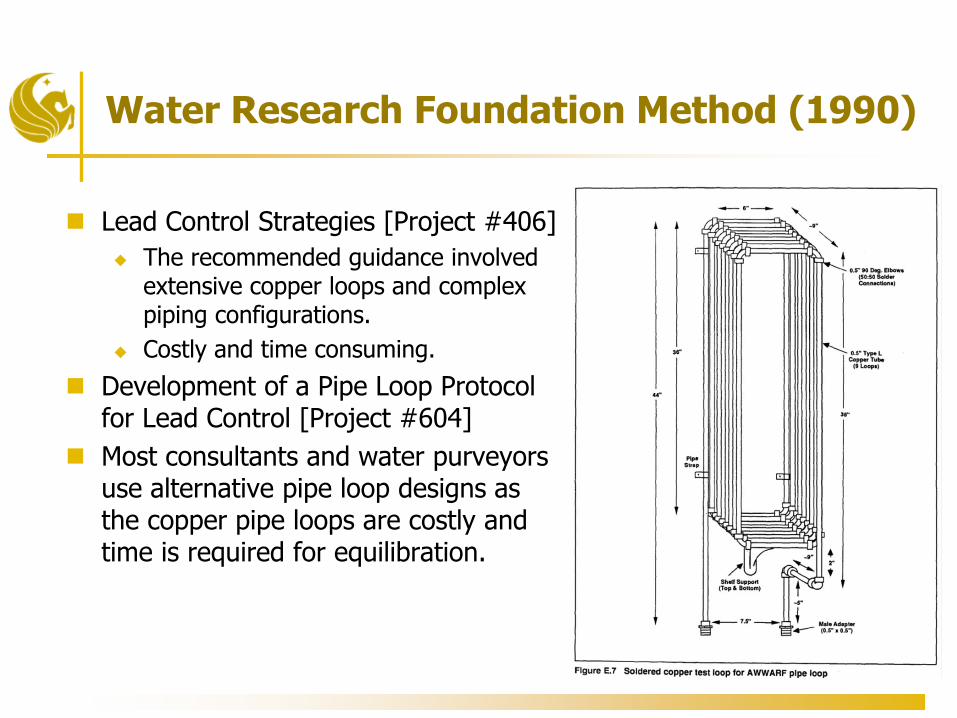
Water Research Foundation Method (1990)
� Lead Control Strategies [Project #406]
� The recommended guidance involved extensive copper loops and complex piping configurations.
� Costly and time consuming.
� Development of a Pipe Loop Protocol for Lead Control [Project #604]
� Most consultants and water purveyors use alternative pipe loop designs as the copper pipe loops are costly and time is required for equilibration.
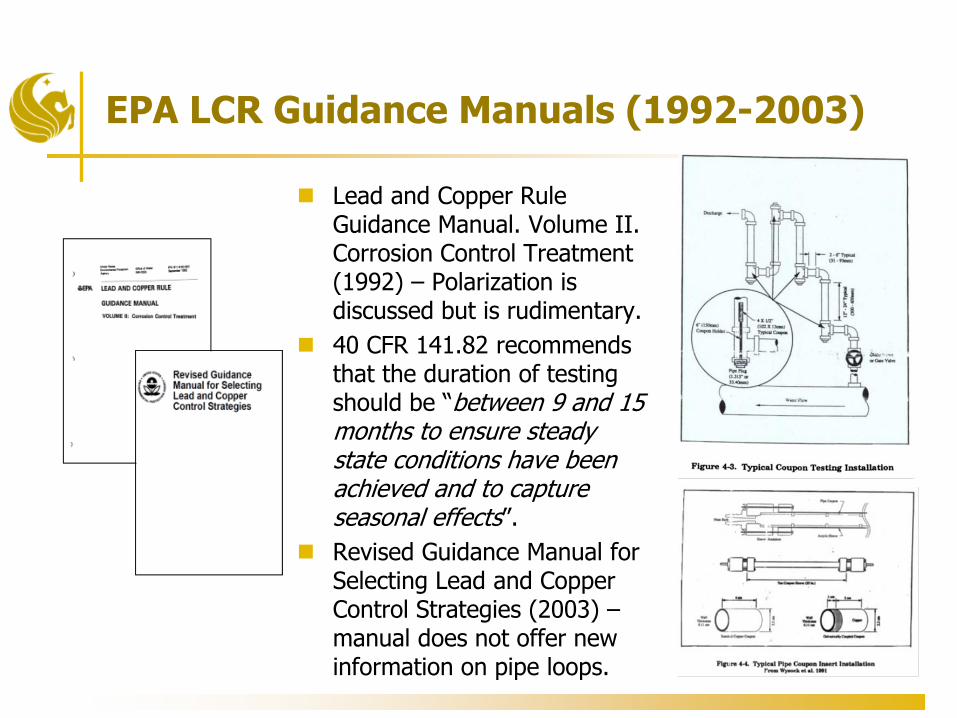
EPA LCR Guidance Manuals (1992-2003)
� Lead and Copper Rule Guidance Manual. Volume II. Corrosion Control Treatment (1992) – Polarization is discussed but is rudimentary.
� 40 CFR 141.82 recommends that the duration of testing should be “between 9 and 15 months to ensure steady state conditions have been achieved and to capture seasonal effects”.
� Revised Guidance Manual for Selecting Lead and Copper Control Strategies (2003) –manual does not offer new information on pipe loops.

Electrochemical Noise Study (2004)[AwwaRF Project; Duranceau, Townley, Bell (2004)]
� Prior studies rely on virgin components during implementation of the studies.
� Methods do not account for existing system conditions and rely on “cook and look” or “concentration” data to ascertain corrosion methods.
� Water purveyors are changing treatment and supplied to meet regulations and demands.
� A new method is needed.
� Duranceau and colleagues introduce electrochemical noise to the industry in 2004.
� Complexity limits usefulness.

� Designed a test rack to evaluate corrosion control alternatives
� Fitted with pre-corroded metal coupons and electrodes to evaluate corrosion rates under different conditions.
� Desalination, nanofiltration and ion-exchange blends studied
Coupons and Linear Polarization (2012)[Jupiter Water Utilities (FL) and UCF Design New Approach]
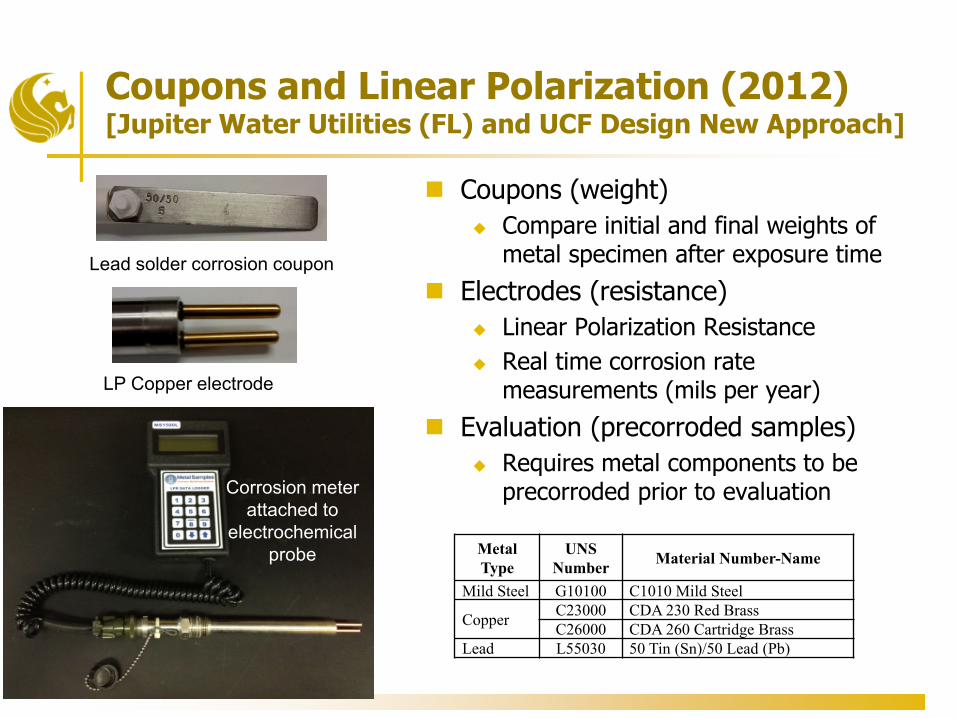
� Coupons (weight)
� Compare initial and final weights of metal specimen after exposure time
� Electrodes (resistance)
� Linear Polarization Resistance
� Real time corrosion rate measurements (mils per year)
� Evaluation (precorroded samples)
� Requires metal components to be precorroded prior to evaluationCorrosion meter
attached to electrochemical
probe
Lead solder corrosion coupon
LP Copper electrode
Coupons and Linear Polarization (2012)[Jupiter Water Utilities (FL) and UCF Design New Approach]
Metal
Type
UNS
NumberMaterial Number-Name
Mild Steel G10100 C1010 Mild Steel
CopperC23000 CDA 230 Red Brass
C26000 CDA 260 Cartridge Brass
Lead L55030 50 Tin (Sn)/50 Lead (Pb)

Test Rack Design Includes LP and Coupons [LP Provides Real Time MPY; Coupons Provide Weight Loss]
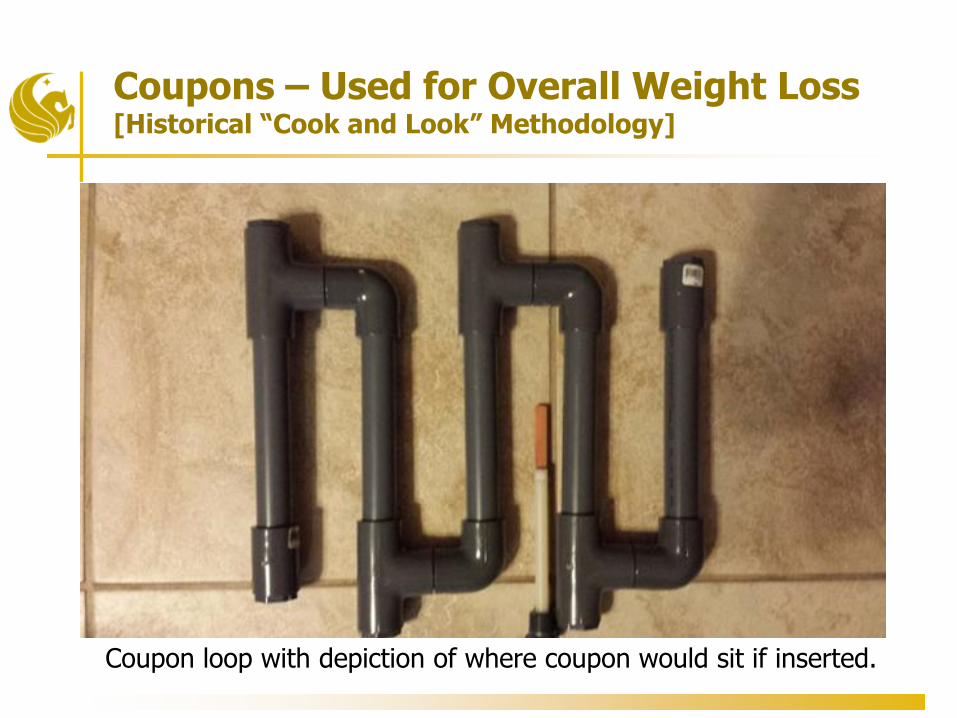
Coupons – Used for Overall Weight Loss[Historical “Cook and Look” Methodology]
Coupon loop with depiction of where coupon would sit if inserted.
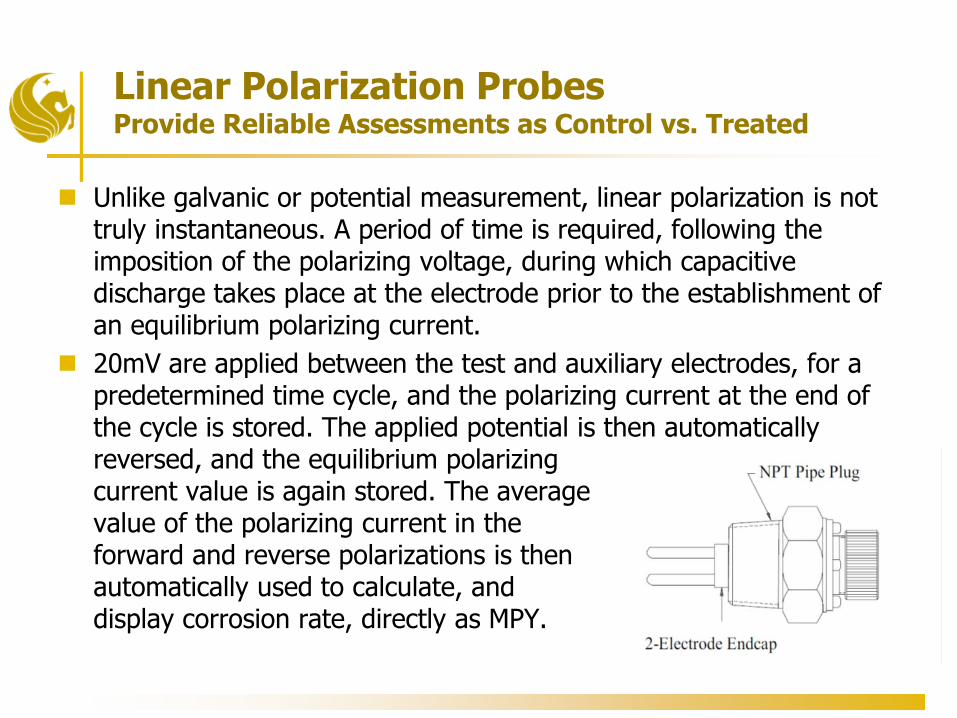
� Unlike galvanic or potential measurement, linear polarization is not truly instantaneous. A period of time is required, following the imposition of the polarizing voltage, during which capacitive discharge takes place at the electrode prior to the establishment of an equilibrium polarizing current.
� 20mV are applied between the test and auxiliary electrodes, for a predetermined time cycle, and the polarizing current at the end of the cycle is stored. The applied potential is then automatically reversed, and the equilibrium polarizing current value is again stored. The average value of the polarizing current in theforward and reverse polarizations is thenautomatically used to calculate, and display corrosion rate, directly as MPY.
Linear Polarization ProbesProvide Reliable Assessments as Control vs. Treated
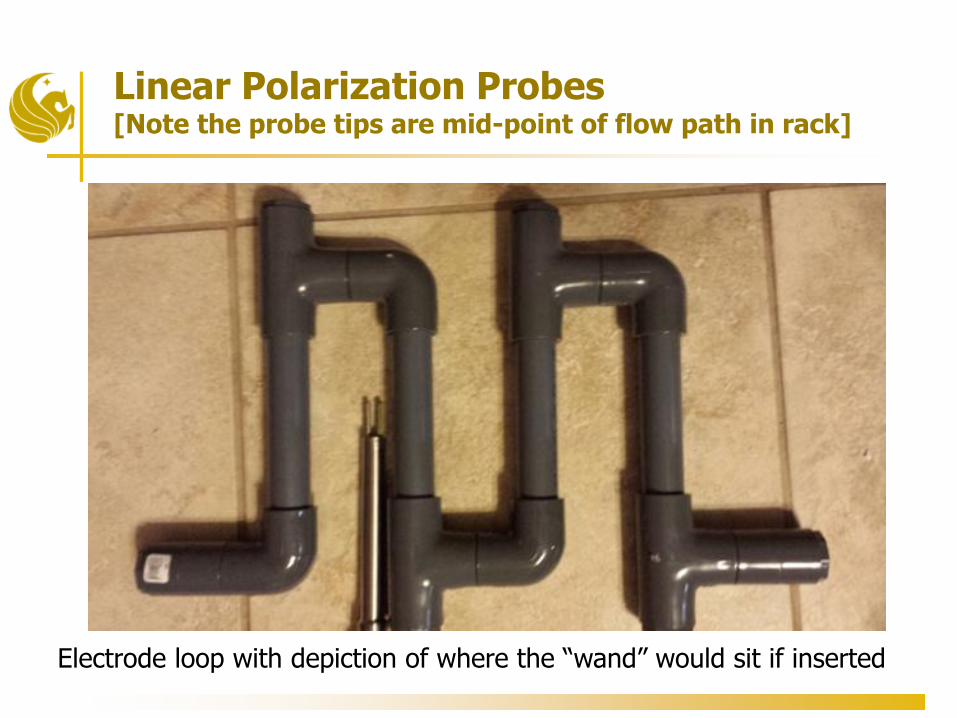
Linear Polarization Probes[Note the probe tips are mid-point of flow path in rack]
Electrode loop with depiction of where the “wand” would sit if inserted
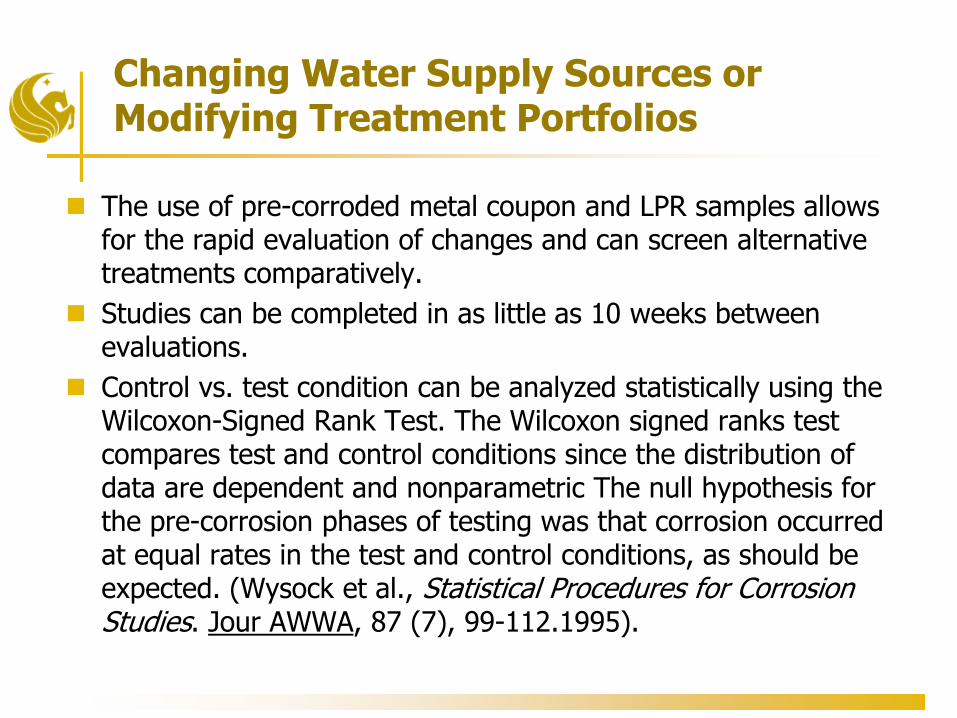
� The use of pre-corroded metal coupon and LPR samples allows for the rapid evaluation of changes and can screen alternative treatments comparatively.
� Studies can be completed in as little as 10 weeks between evaluations.
� Control vs. test condition can be analyzed statistically using the Wilcoxon-Signed Rank Test. The Wilcoxon signed ranks test compares test and control conditions since the distribution of data are dependent and nonparametric The null hypothesis for the pre-corrosion phases of testing was that corrosion occurred at equal rates in the test and control conditions, as should be expected. (Wysock et al., Statistical Procedures for Corrosion Studies. Jour AWWA, 87 (7), 99-112.1995).
Changing Water Supply Sources or Modifying Treatment Portfolios

Pre-Corrode and Post-Corrode Phase
• Pre-corrosion phase~3 weeks
• Chemical testing phase ~5 weeks

• Higher corrosion rates with corrosion inhibitor• Polyphosphate portion of chemical acts as chemical sequesterant for iron• Primary cause of discolored or red water• 57% difference
0.0
0.5
1.0
1.5
2.0
2.5
3.0
3.5
4.0
4.5
0
10
0
20
0
30
0
40
0
50
0
60
0
70
0
80
0
Co
rro
sio
n R
ate
(m
py
)
Operation Time (hrs)
Mild Steel
Test Control Test Average Control Average
1.2
2.9
0.0
0.5
1.0
1.5
2.0
2.5
3.0
3.5
Mild Steel
Av
era
ge
Co
rro
sio
n R
ate
(m
py
)
Control Test
Post Corrosion Analysis[Inhibitor Addition on Virgin Materials Would Miss Increase]

Chromatic Elemental Image[Copper Pipe Scale]
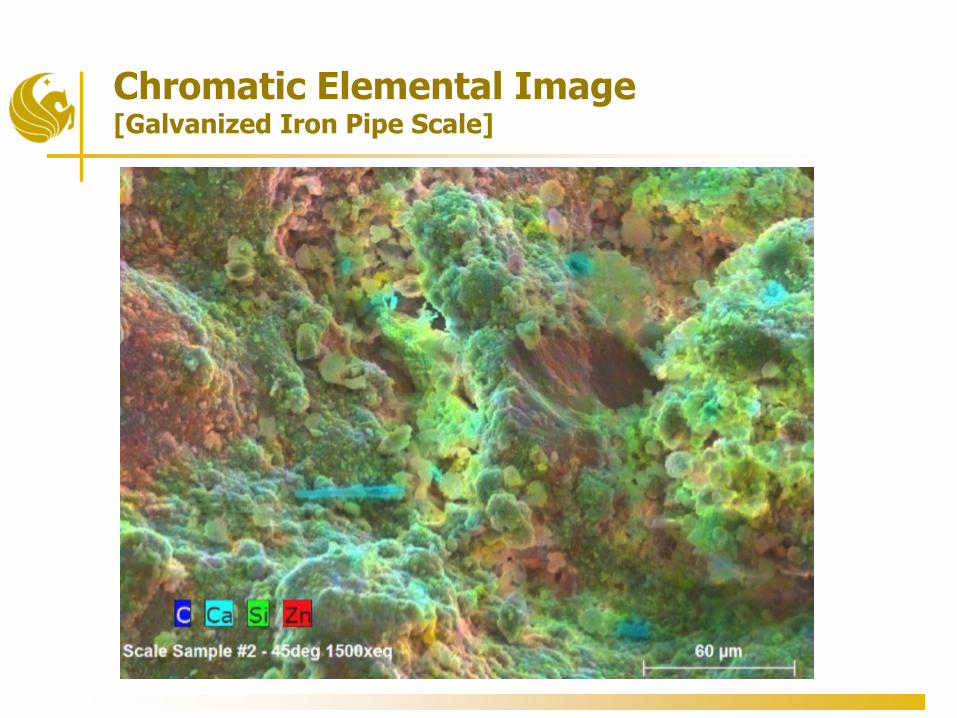
Chromatic Elemental Image[Galvanized Iron Pipe Scale]
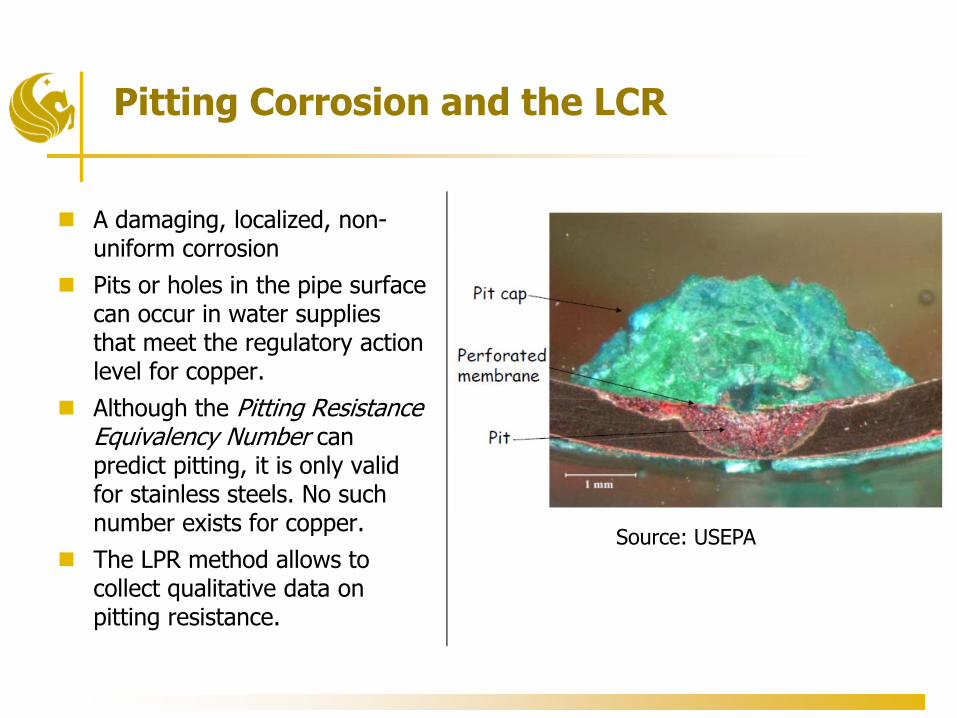
� A damaging, localized, non-uniform corrosion
� Pits or holes in the pipe surface can occur in water supplies that meet the regulatory action level for copper.
� Although the Pitting Resistance Equivalency Number can predict pitting, it is only valid for stainless steels. No such number exists for copper.
� The LPR method allows to collect qualitative data on pitting resistance.
Source: USEPA
Pitting Corrosion and the LCR
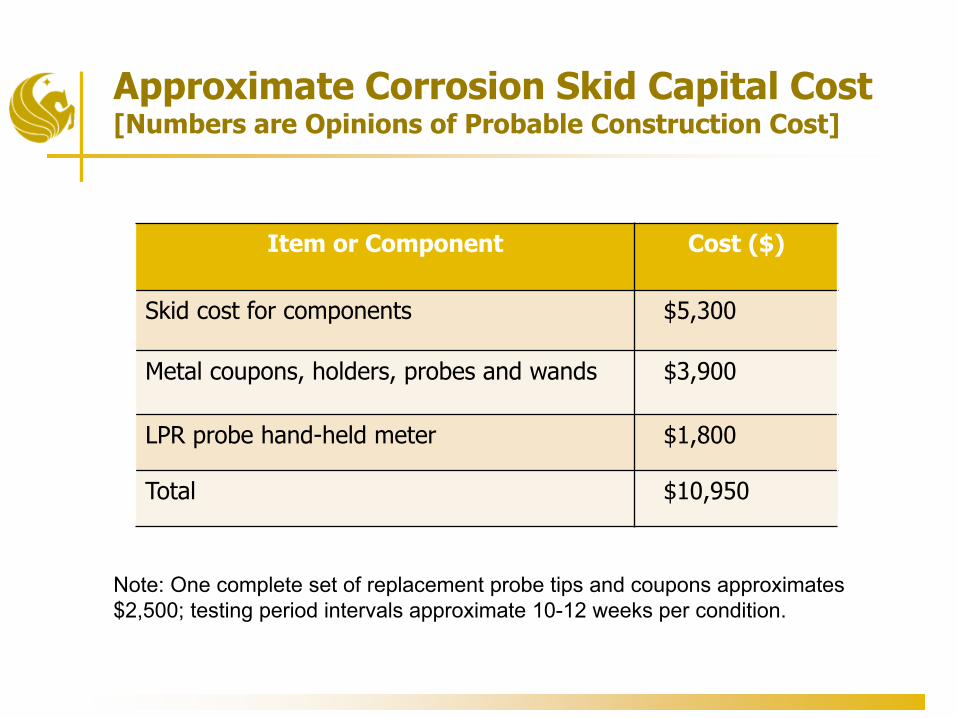
Note: One complete set of replacement probe tips and coupons approximates $2,500; testing period intervals approximate 10-12 weeks per condition.
Approximate Corrosion Skid Capital Cost[Numbers are Opinions of Probable Construction Cost]
Item or Component Cost ($)
Skid cost for components $5,300
Metal coupons, holders, probes and wands $3,900
LPR probe hand-held meter $1,800
Total $10,950

� The use of coupons and linear polarization resistance techniques provides valuable information on corrosion tests.
� Blended ortho:poly inhibitors are relatively successful in reducing corrosion rates in lead and copper components;
� It is important to compare average corrosion rates prior to and after inhibitor addition, although corrosion rates as a function of operation time should also be evaluated;
� The use of the Wilcoxon-signed ranks statistical test comparing the initial pre-corroding phase to the inhibitor effectiveness phase has proven to be a useful analytical method for corrosion studies.
� Conceptual opinion of capital construction cost approximates $10,000 for a reusable corrosion rack; probe replacement approximates $2,500 per test.
Conclusions
Thank you for attending my presentation!
Steven J. Duranceau, Ph.D., P.E.University of Central Florida
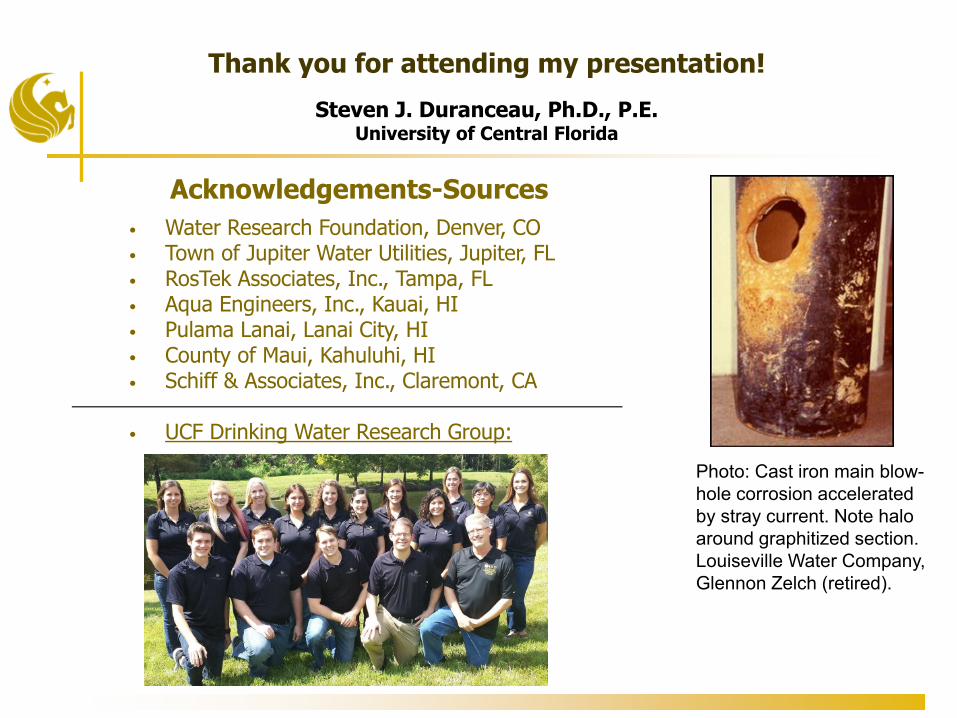
• Water Research Foundation, Denver, CO• Town of Jupiter Water Utilities, Jupiter, FL• RosTek Associates, Inc., Tampa, FL• Aqua Engineers, Inc., Kauai, HI• Pulama Lanai, Lanai City, HI• County of Maui, Kahuluhi, HI• Schiff & Associates, Inc., Claremont, CA
• UCF Drinking Water Research Group:
Acknowledgements-Sources
Photo: Cast iron main blow-hole corrosion accelerated by stray current. Note halo around graphitized section. Louiseville Water Company, Glennon Zelch (retired).