Embed Size (px)
Citation preview
Guidelines for Pneumonia
Michael S. Niederman, MD
Professor of Medicine
Vice-Chairman, Department of Medicine
State University of New York at Stony Brook
Chairman, Department of Medicine
Winthrop-University Hospital
Mineola, New York
Presenter Disclosures Related To This Presentation
• Michael S. Niederman, M.D.
– Commercial disclosures:
• Honorarium and consulting: Bayer/Nektar, Sanofi- Pasteur, Cubist, Pfizer
– Non-commercial disclosure: Advisory board FDA, IDSA/ATS HAP Guideline Committee
– Research Grant: Bayer/Nektar, Sanofi-Pasteur, Cubist

Pneumonia Guidelines
4
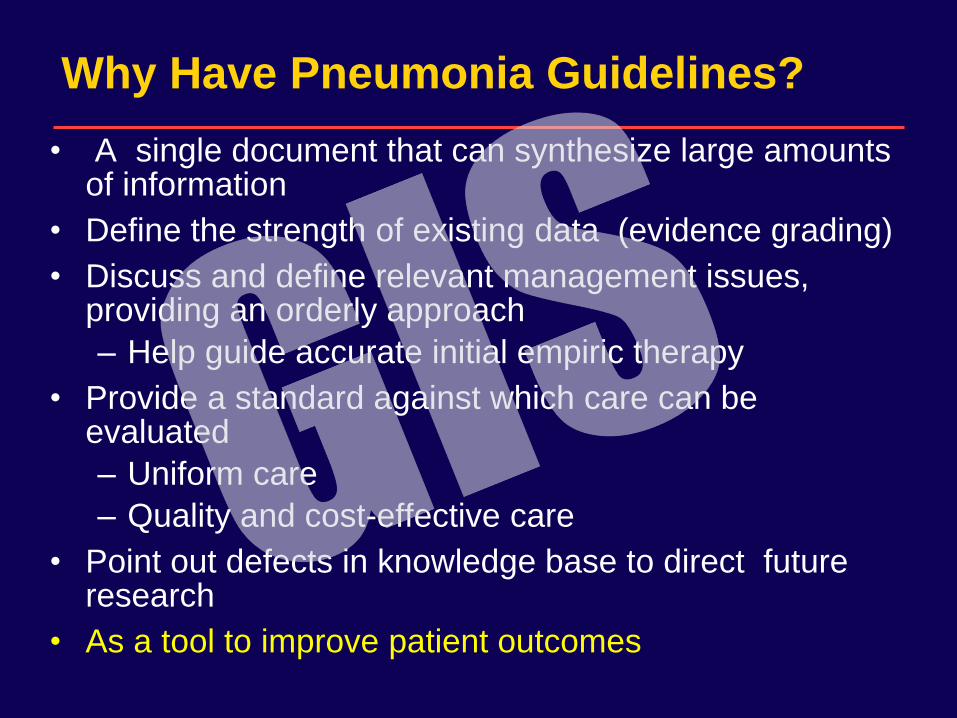
Why Have Pneumonia Guidelines?
• A single document that can synthesize large amounts of information
• Define the strength of existing data (evidence grading)
• Discuss and define relevant management issues, providing an orderly approach
– Help guide accurate initial empiric therapy
• Provide a standard against which care can be evaluated
– Uniform care
– Quality and cost-effective care
• Point out defects in knowledge base to direct future research
• As a tool to improve patient outcomes
6
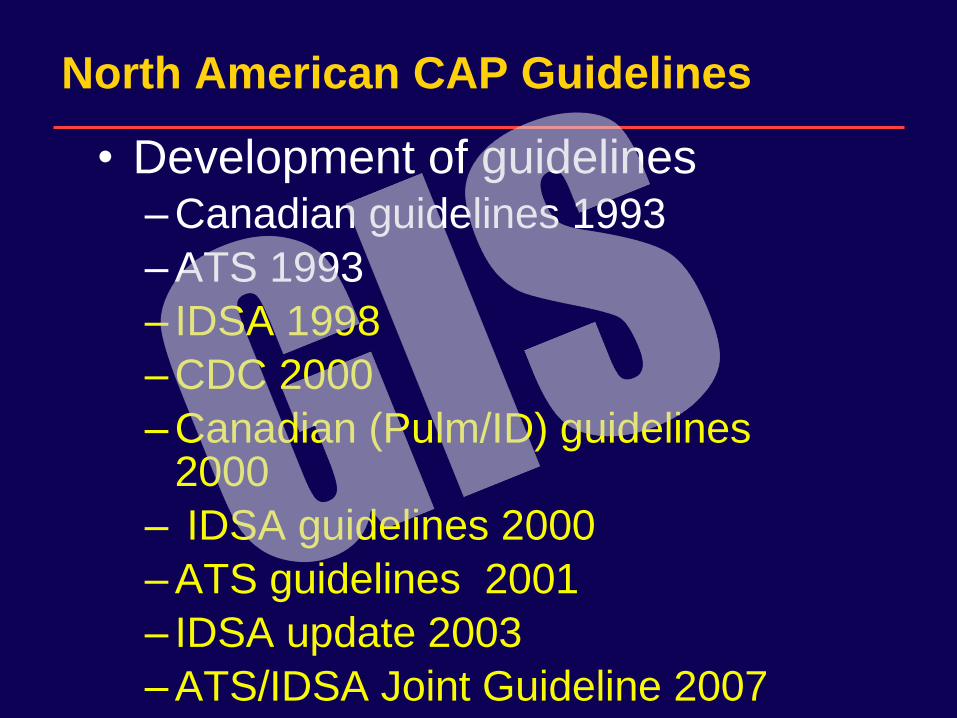
North American CAP Guidelines
• Development of guidelines – Canadian guidelines 1993
– ATS 1993
– IDSA 1998
– CDC 2000
– Canadian (Pulm/ID) guidelines 2000
– IDSA guidelines 2000
– ATS guidelines 2001
– IDSA update 2003
– ATS/IDSA Joint Guideline 2007
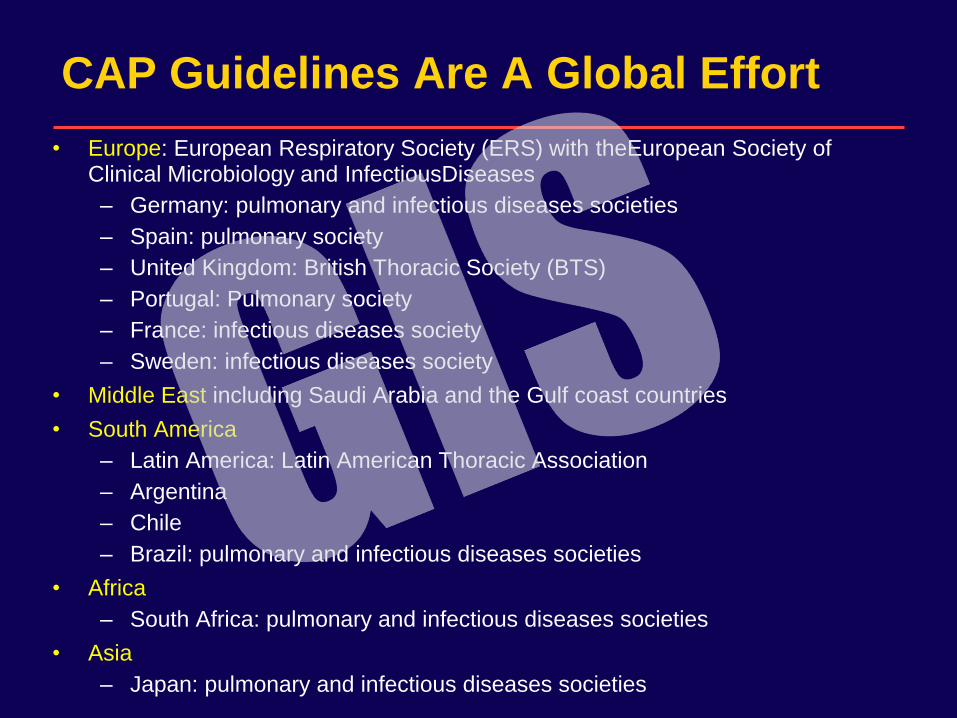
CAP Guidelines Are A Global Effort
• Europe: European Respiratory Society (ERS) with theEuropean Society of Clinical Microbiology and InfectiousDiseases
– Germany: pulmonary and infectious diseases societies
– Spain: pulmonary society
– United Kingdom: British Thoracic Society (BTS)
– Portugal: Pulmonary society
– France: infectious diseases society
– Sweden: infectious diseases society
• Middle East including Saudi Arabia and the Gulf coast countries
• South America
– Latin America: Latin American Thoracic Association
– Argentina
– Chile
– Brazil: pulmonary and infectious diseases societies
• Africa
– South Africa: pulmonary and infectious diseases societies
• Asia
– Japan: pulmonary and infectious diseases societies
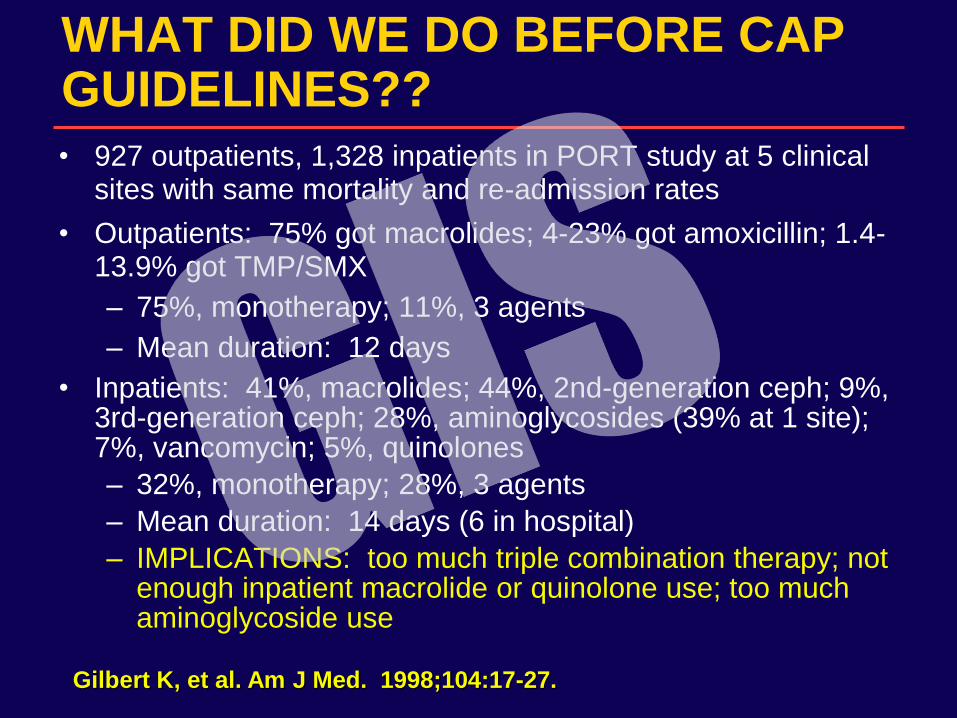
WHAT DID WE DO BEFORE CAP GUIDELINES??
• 927 outpatients, 1,328 inpatients in PORT study at 5 clinical sites with same mortality and re-admission rates
• Outpatients: 75% got macrolides; 4-23% got amoxicillin; 1.4-13.9% got TMP/SMX
– 75%, monotherapy; 11%, 3 agents
– Mean duration: 12 days
• Inpatients: 41%, macrolides; 44%, 2nd-generation ceph; 9%, 3rd-generation ceph; 28%, aminoglycosides (39% at 1 site); 7%, vancomycin; 5%, quinolones
– 32%, monotherapy; 28%, 3 agents
– Mean duration: 14 days (6 in hospital)
– IMPLICATIONS: too much triple combination therapy; not enough inpatient macrolide or quinolone use; too much aminoglycoside use
Gilbert K, et al. Am J Med. 1998;104:17-27.
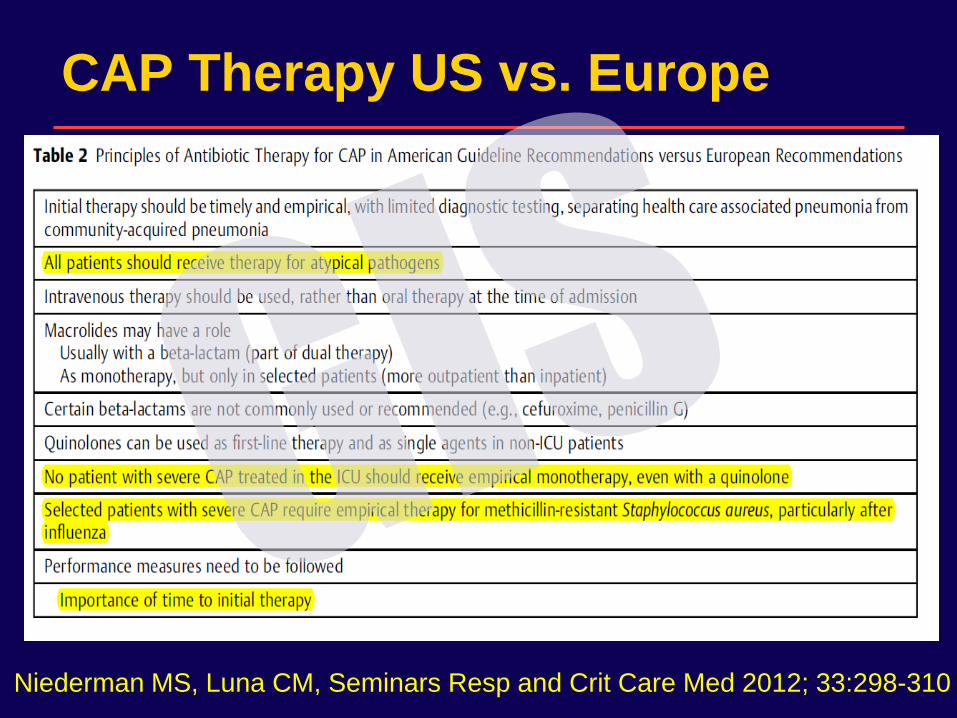
CAP Therapy US vs. Europe
Niederman MS, Luna CM, Seminars Resp and Crit Care Med 2012; 33:298-310
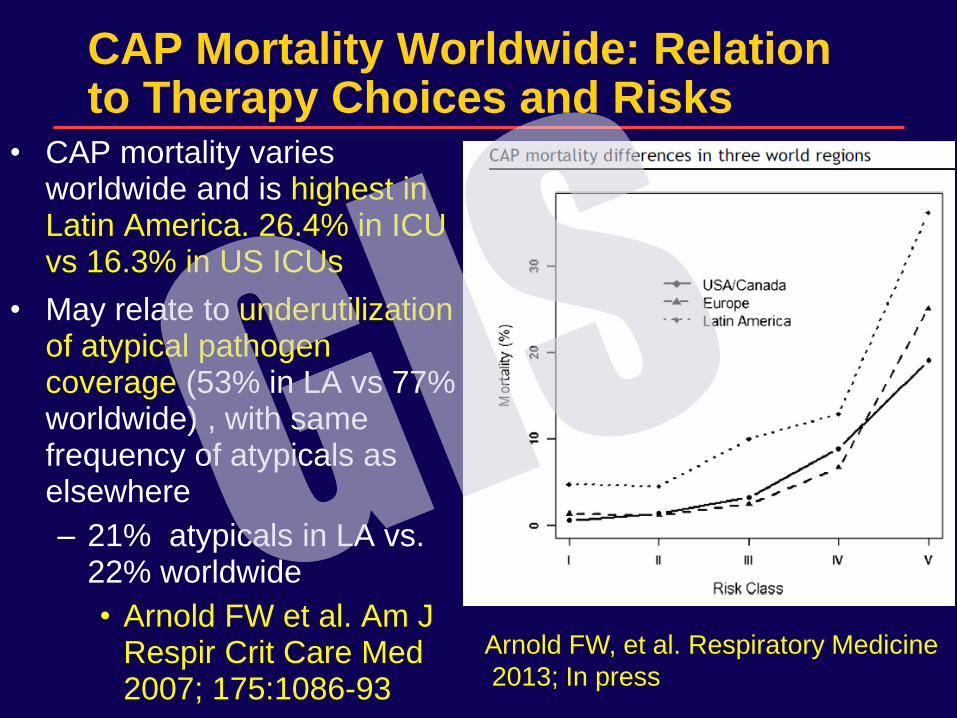
CAP Mortality Worldwide: Relation to Therapy Choices and Risks
• CAP mortality varies worldwide and is highest in Latin America. 26.4% in ICU vs 16.3% in US ICUs
• May relate to underutilization of atypical pathogen coverage (53% in LA vs 77% worldwide) , with same frequency of atypicals as elsewhere
– 21% atypicals in LA vs. 22% worldwide
• Arnold FW et al. Am J Respir Crit Care Med 2007; 175:1086-93
Arnold FW, et al. Respiratory Medicine
2013; In press
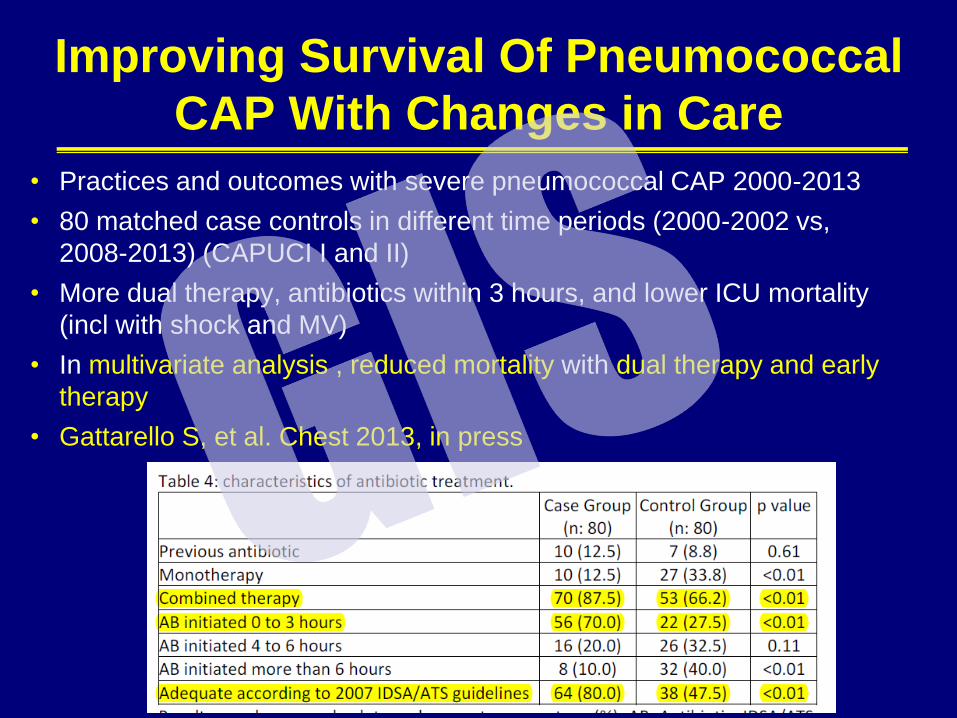
Improving Survival Of Pneumococcal
CAP With Changes in Care
• Practices and outcomes with severe pneumococcal CAP 2000-2013
• 80 matched case controls in different time periods (2000-2002 vs,
2008-2013) (CAPUCI I and II)
• More dual therapy, antibiotics within 3 hours, and lower ICU mortality
(incl with shock and MV)
• In multivariate analysis , reduced mortality with dual therapy and early
therapy
• Gattarello S, et al. Chest 2013, in press
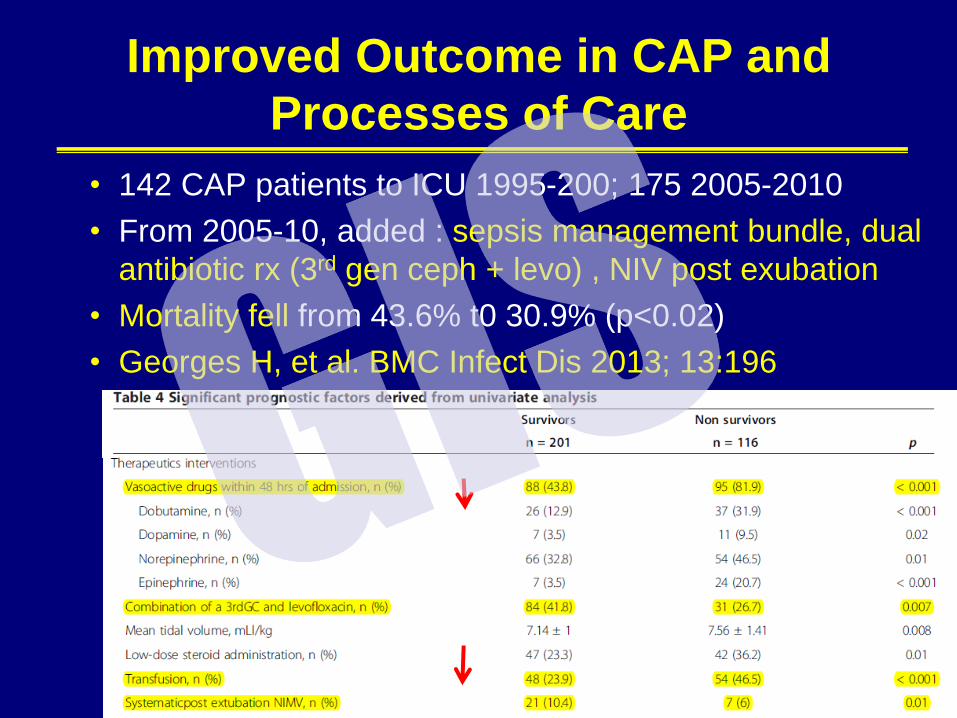
Improved Outcome in CAP and
Processes of Care
• 142 CAP patients to ICU 1995-200; 175 2005-2010
• From 2005-10, added : sepsis management bundle, dual
antibiotic rx (3rd gen ceph + levo) , NIV post exubation
• Mortality fell from 43.6% t0 30.9% (p<0.02)
• Georges H, et al. BMC Infect Dis 2013; 13:196
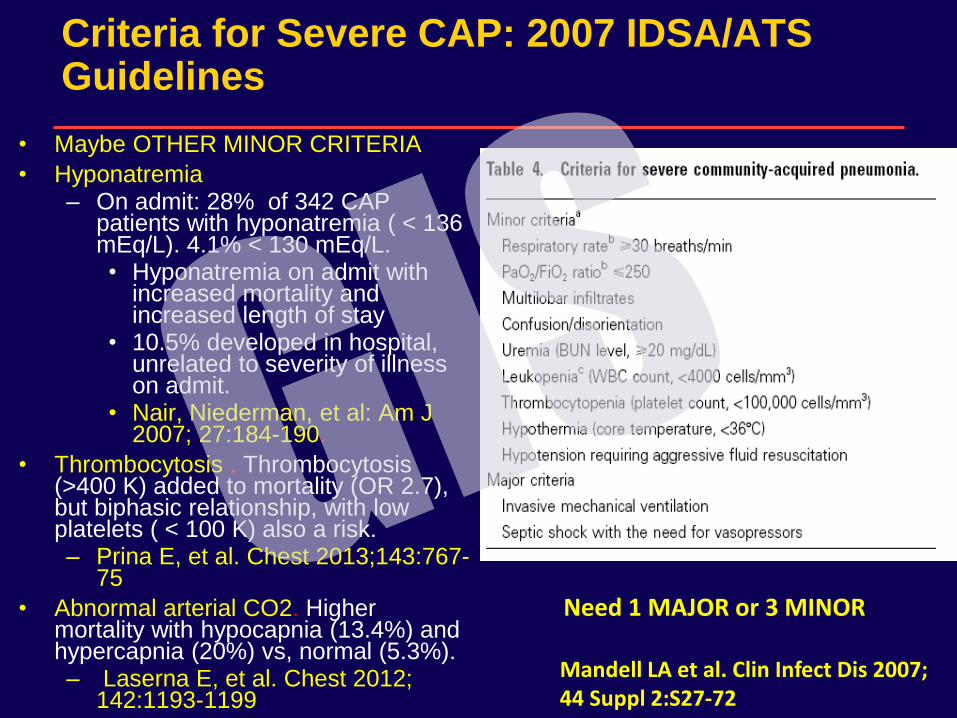
Criteria for Severe CAP: 2007 IDSA/ATS Guidelines
• Maybe OTHER MINOR CRITERIA
• Hyponatremia – On admit: 28% of 342 CAP
patients with hyponatremia ( < 136 mEq/L). 4.1% < 130 mEq/L. • Hyponatremia on admit with
increased mortality and increased length of stay
• 10.5% developed in hospital, unrelated to severity of illness on admit.
• Nair, Niederman, et al: Am J 2007; 27:184-190.
• Thrombocytosis . Thrombocytosis (>400 K) added to mortality (OR 2.7), but biphasic relationship, with low platelets ( < 100 K) also a risk. – Prina E, et al. Chest 2013;143:767-
75
• Abnormal arterial CO2. Higher mortality with hypocapnia (13.4%) and hypercapnia (20%) vs, normal (5.3%). – Laserna E, et al. Chest 2012;
142:1193-1199
Need 1 MAJOR or 3 MINOR Mandell LA et al. Clin Infect Dis 2007; 44 Suppl 2:S27-72
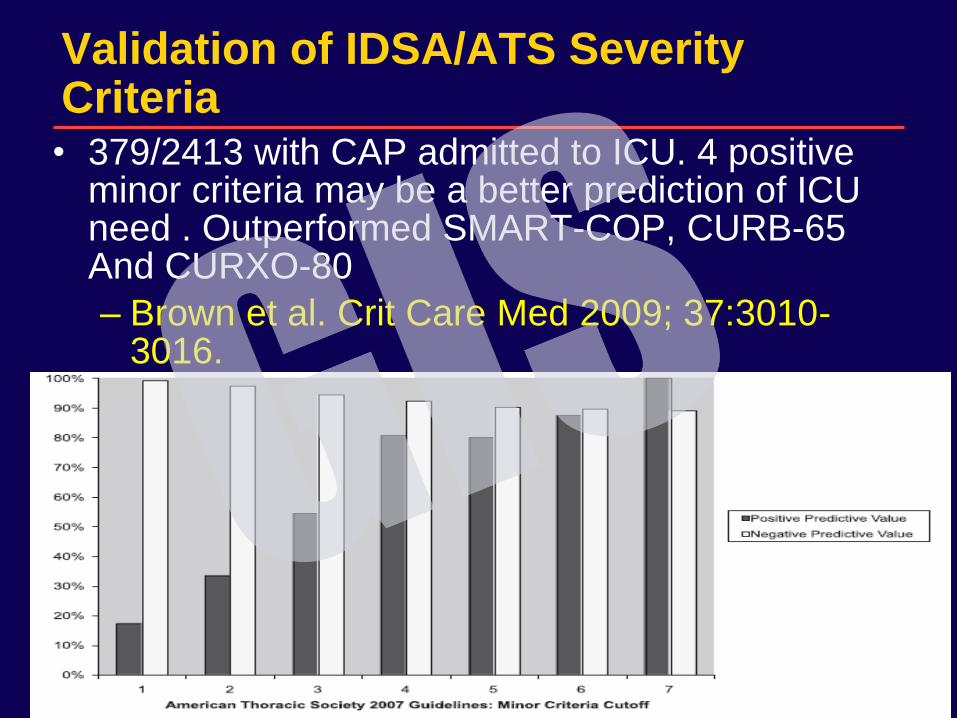
Validation of IDSA/ATS Severity Criteria • 379/2413 with CAP admitted to ICU. 4 positive
minor criteria may be a better prediction of ICU need . Outperformed SMART-COP, CURB-65 And CURXO-80
– Brown et al. Crit Care Med 2009; 37:3010-3016.
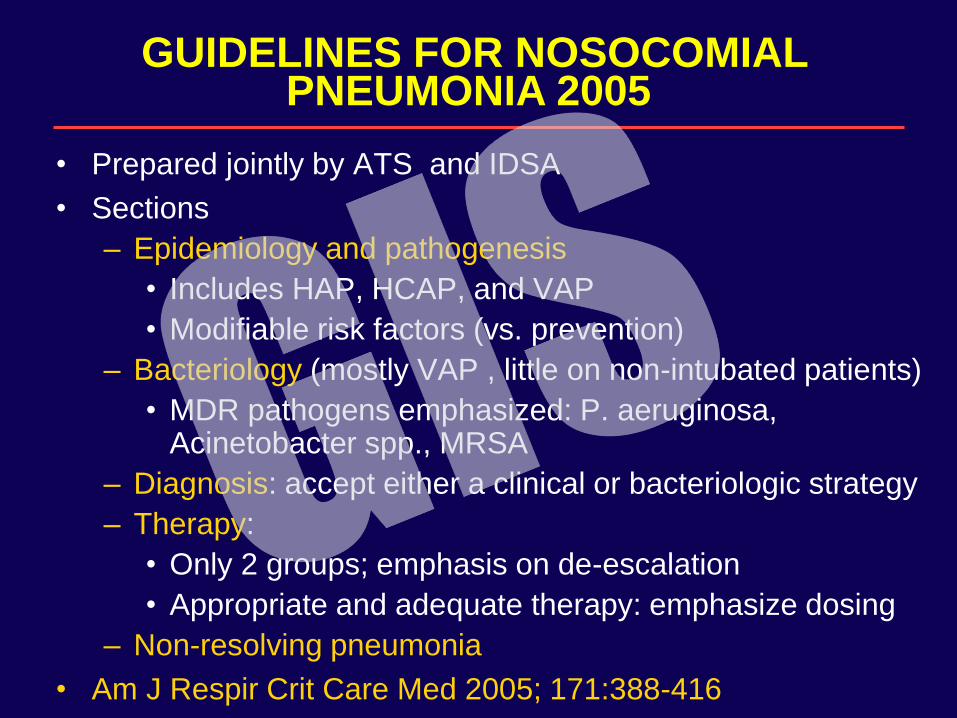
GUIDELINES FOR NOSOCOMIAL PNEUMONIA 2005
• Prepared jointly by ATS and IDSA
• Sections
– Epidemiology and pathogenesis
• Includes HAP, HCAP, and VAP
• Modifiable risk factors (vs. prevention)
– Bacteriology (mostly VAP , little on non-intubated patients)
• MDR pathogens emphasized: P. aeruginosa, Acinetobacter spp., MRSA
– Diagnosis: accept either a clinical or bacteriologic strategy
– Therapy:
• Only 2 groups; emphasis on de-escalation
• Appropriate and adequate therapy: emphasize dosing
– Non-resolving pneumonia
• Am J Respir Crit Care Med 2005; 171:388-416
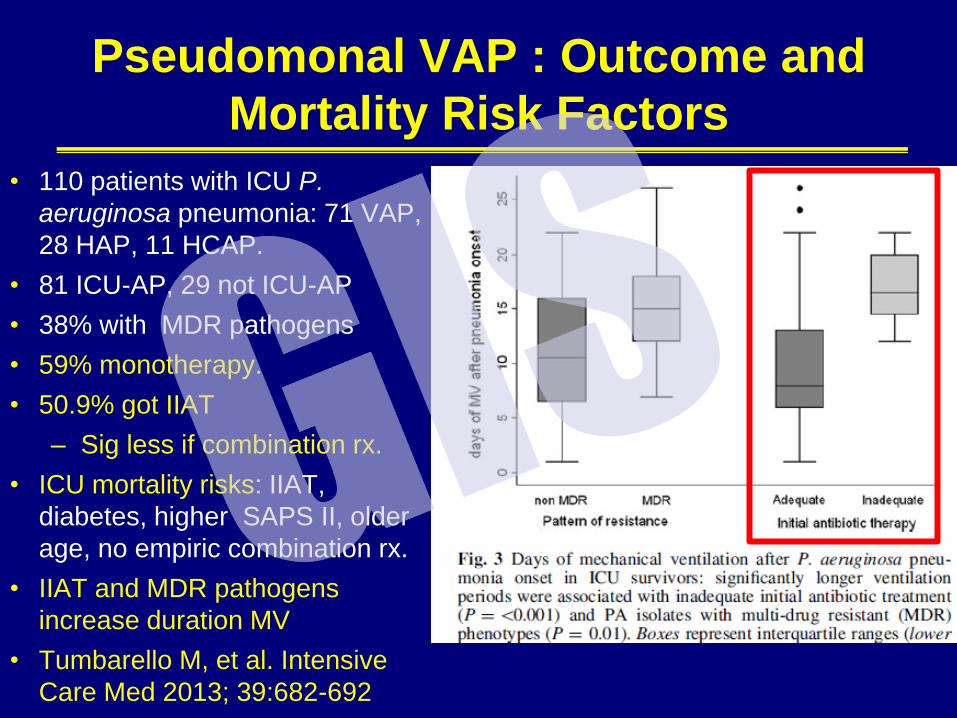
Pseudomonal VAP : Outcome and
Mortality Risk Factors
• 110 patients with ICU P.
aeruginosa pneumonia: 71 VAP,
28 HAP, 11 HCAP.
• 81 ICU-AP, 29 not ICU-AP
• 38% with MDR pathogens
• 59% monotherapy.
• 50.9% got IIAT
– Sig less if combination rx.
• ICU mortality risks: IIAT,
diabetes, higher SAPS II, older
age, no empiric combination rx.
• IIAT and MDR pathogens
increase duration MV
• Tumbarello M, et al. Intensive
Care Med 2013; 39:682-692
21
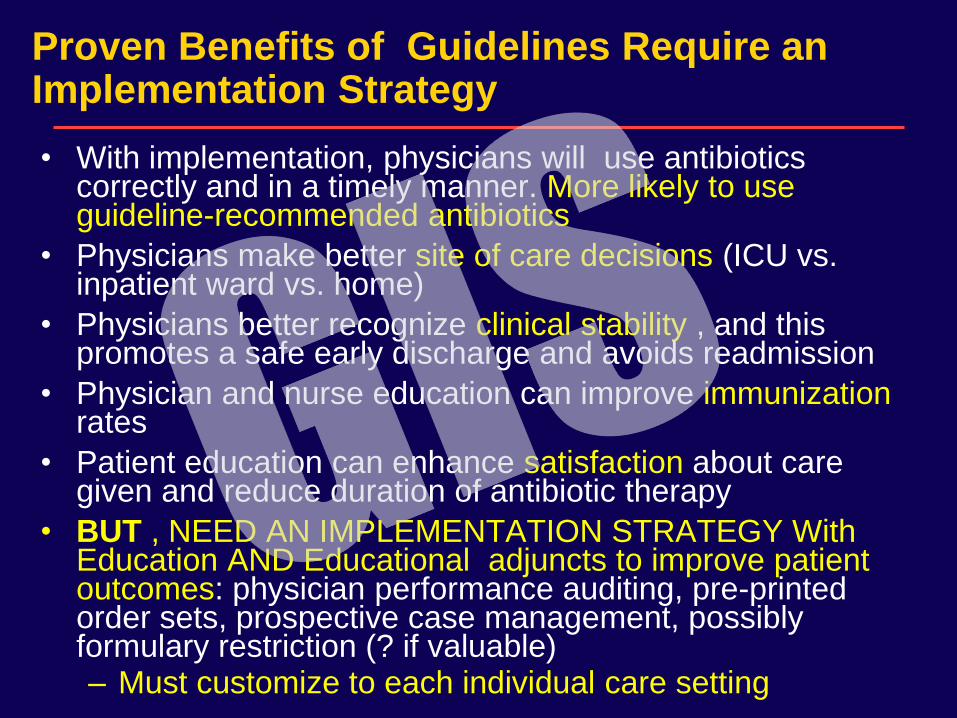
Proven Benefits of Guidelines Require an Implementation Strategy
• With implementation, physicians will use antibiotics correctly and in a timely manner. More likely to use guideline-recommended antibiotics
• Physicians make better site of care decisions (ICU vs. inpatient ward vs. home)
• Physicians better recognize clinical stability , and this promotes a safe early discharge and avoids readmission
• Physician and nurse education can improve immunization rates
• Patient education can enhance satisfaction about care given and reduce duration of antibiotic therapy
• BUT , NEED AN IMPLEMENTATION STRATEGY With Education AND Educational adjuncts to improve patient outcomes: physician performance auditing, pre-printed order sets, prospective case management, possibly formulary restriction (? if valuable) – Must customize to each individual care setting
22
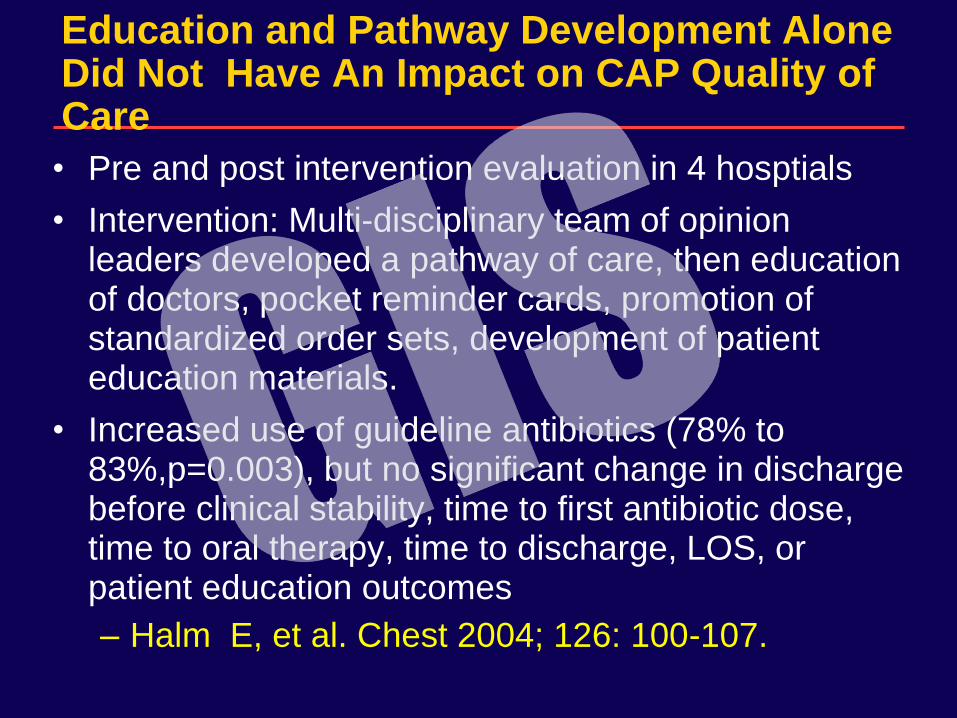
Education and Pathway Development Alone Did Not Have An Impact on CAP Quality of Care
• Pre and post intervention evaluation in 4 hosptials
• Intervention: Multi-disciplinary team of opinion leaders developed a pathway of care, then education of doctors, pocket reminder cards, promotion of standardized order sets, development of patient education materials.
• Increased use of guideline antibiotics (78% to 83%,p=0.003), but no significant change in discharge before clinical stability, time to first antibiotic dose, time to oral therapy, time to discharge, LOS, or patient education outcomes
– Halm E, et al. Chest 2004; 126: 100-107.
23
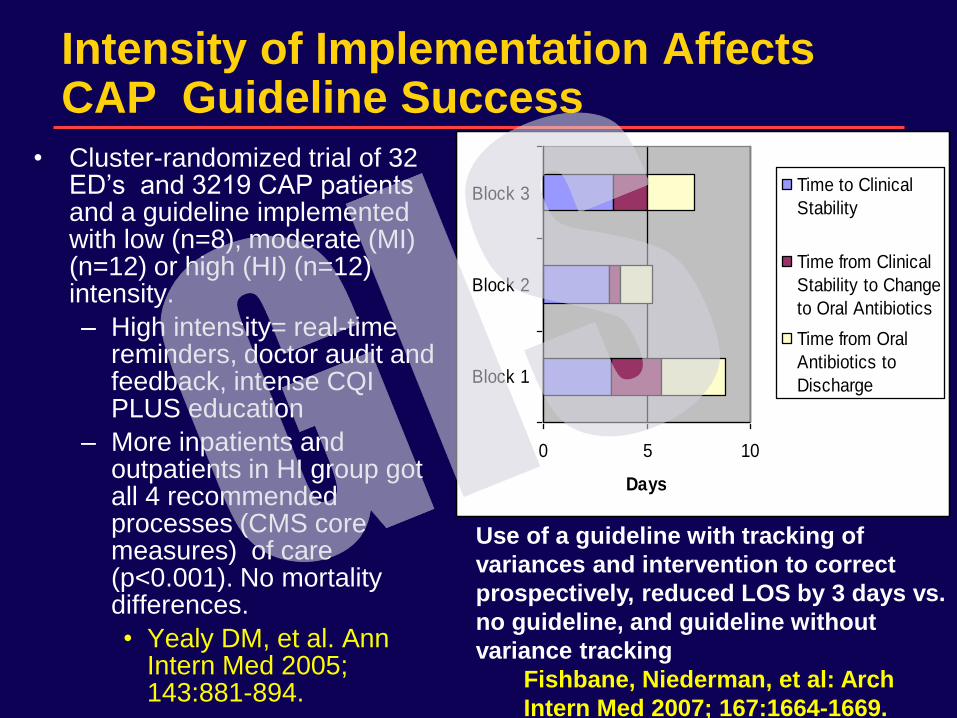
Intensity of Implementation Affects CAP Guideline Success
• Cluster-randomized trial of 32 ED’s and 3219 CAP patients and a guideline implemented with low (n=8), moderate (MI) (n=12) or high (HI) (n=12) intensity.
– High intensity= real-time reminders, doctor audit and feedback, intense CQI PLUS education
– More inpatients and outpatients in HI group got all 4 recommended processes (CMS core measures) of care (p<0.001). No mortality differences.
• Yealy DM, et al. Ann Intern Med 2005; 143:881-894.
• Figure 5
0 5 10
Block 1
Block 2
Block 3
Days
Time to Clinical
Stability
Time from Clinical
Stability to Change
to Oral Antibiotics
Time from Oral
Antibiotics to
Discharge
Use of a guideline with tracking of
variances and intervention to correct
prospectively, reduced LOS by 3 days vs.
no guideline, and guideline without
variance tracking
Fishbane, Niederman, et al: Arch
Intern Med 2007; 167:1664-1669.
Pneumonia Guidelines
26
CONCERNS ABOUT GUIDELINES
• Management without thought
• Deviations may be basis for discipline
• If experts can’t all agree, how can we have accurate guidelines??
• What do we do if the existing knowledge base is of poor quality?
– Evidence based medicine, GRADE
• How strong should new data be before changing and updating guidelines?
• Recent issue: conflict of interest and who who should author?
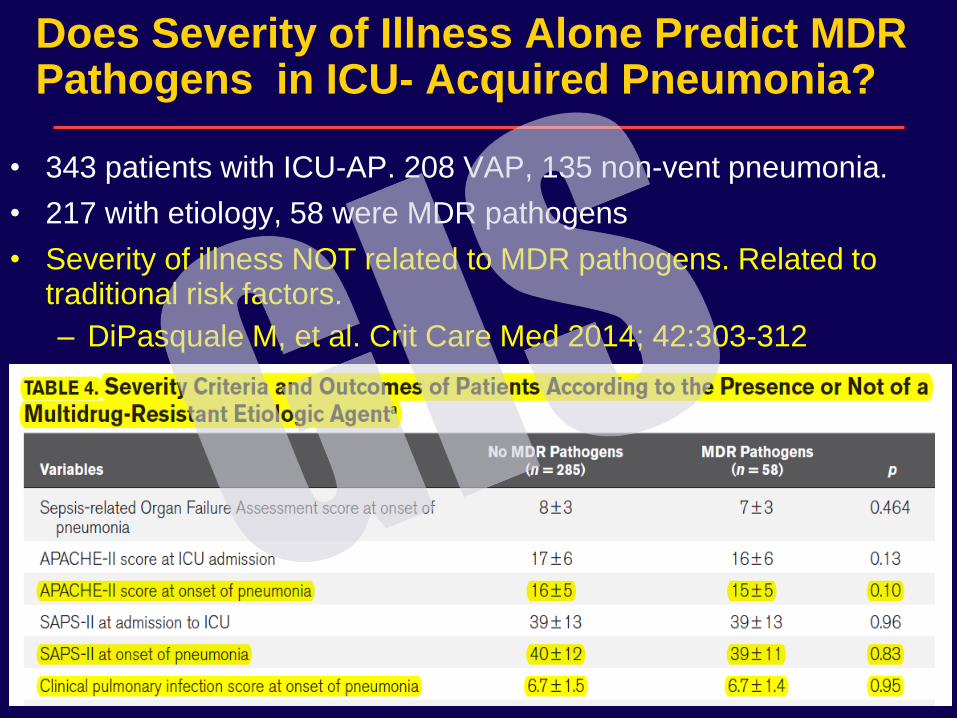
Does Severity of Illness Alone Predict MDR Pathogens in ICU- Acquired Pneumonia?
• 343 patients with ICU-AP. 208 VAP, 135 non-vent pneumonia.
• 217 with etiology, 58 were MDR pathogens
• Severity of illness NOT related to MDR pathogens. Related to traditional risk factors.
– DiPasquale M, et al. Crit Care Med 2014; 42:303-312
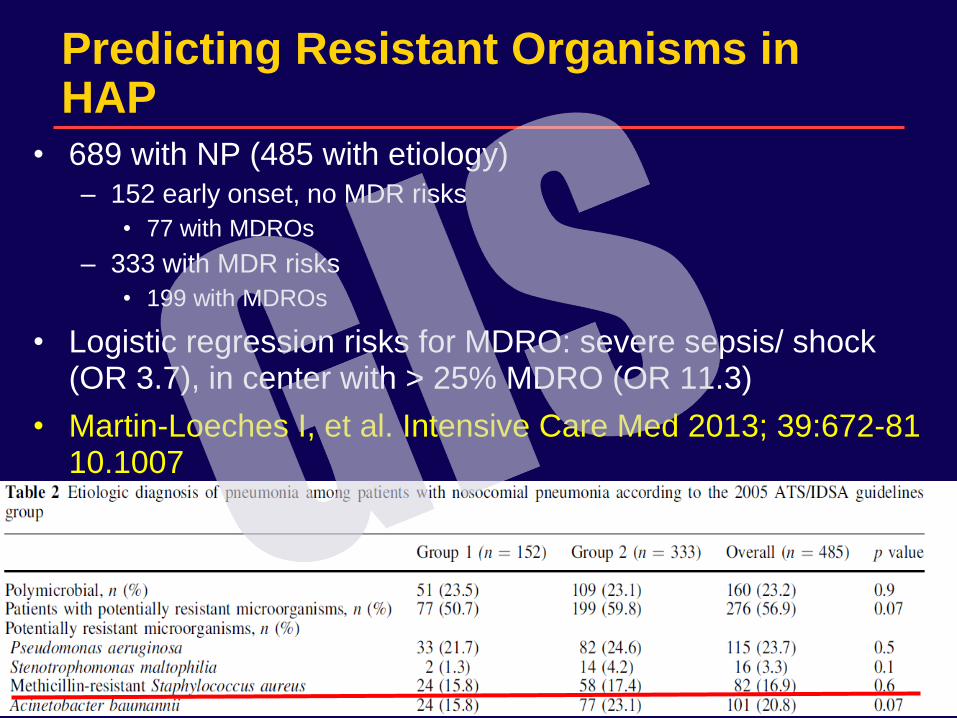
Predicting Resistant Organisms in HAP
• 689 with NP (485 with etiology)
– 152 early onset, no MDR risks
• 77 with MDROs
– 333 with MDR risks
• 199 with MDROs
• Logistic regression risks for MDRO: severe sepsis/ shock (OR 3.7), in center with > 25% MDRO (OR 11.3)
• Martin-Loeches I, et al. Intensive Care Med 2013; 39:672-81 10.1007
29
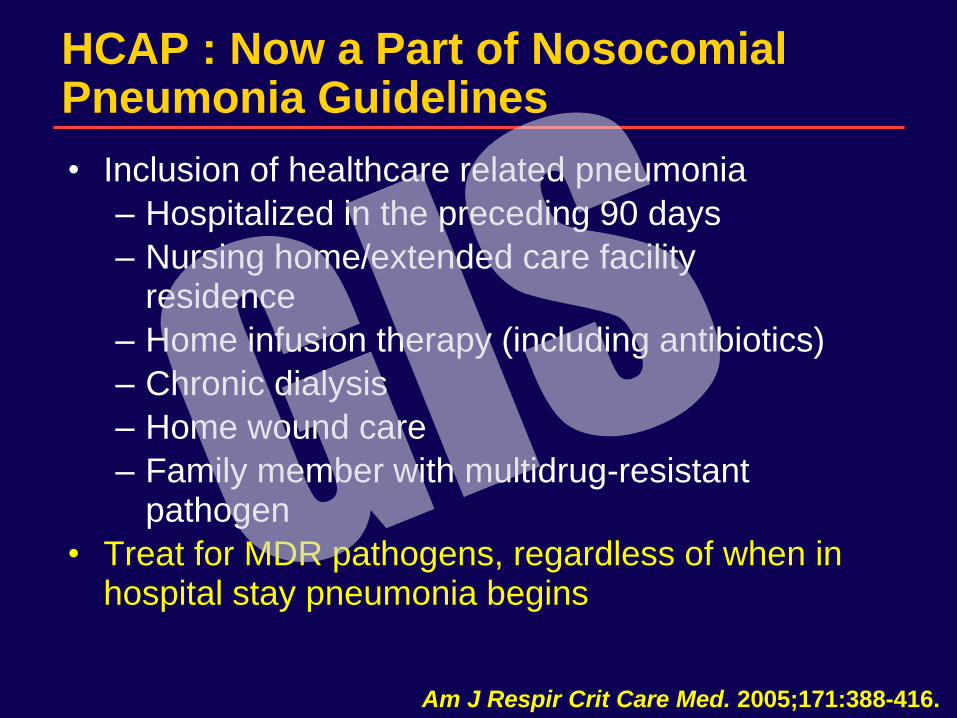
HCAP : Now a Part of Nosocomial Pneumonia Guidelines
• Inclusion of healthcare related pneumonia
– Hospitalized in the preceding 90 days
– Nursing home/extended care facility residence
– Home infusion therapy (including antibiotics)
– Chronic dialysis
– Home wound care
– Family member with multidrug-resistant pathogen
• Treat for MDR pathogens, regardless of when in hospital stay pneumonia begins
Am J Respir Crit Care Med. 2005;171:388-416.
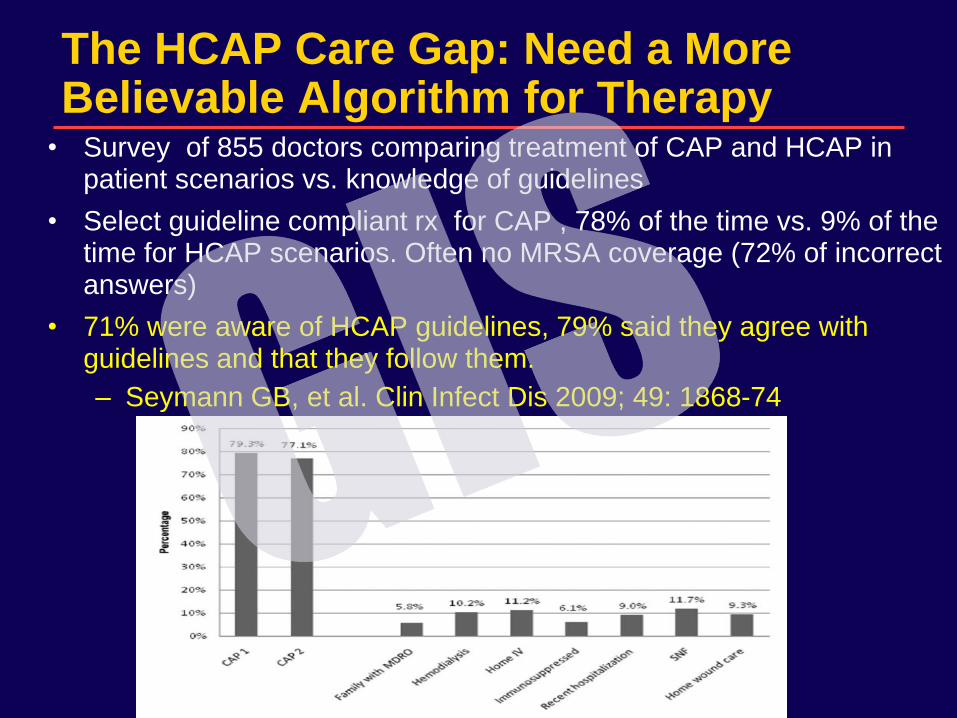
The HCAP Care Gap: Need a More Believable Algorithm for Therapy
• Survey of 855 doctors comparing treatment of CAP and HCAP in patient scenarios vs. knowledge of guidelines
• Select guideline compliant rx for CAP , 78% of the time vs. 9% of the time for HCAP scenarios. Often no MRSA coverage (72% of incorrect answers)
• 71% were aware of HCAP guidelines, 79% said they agree with guidelines and that they follow them.
– Seymann GB, et al. Clin Infect Dis 2009; 49: 1868-74
30
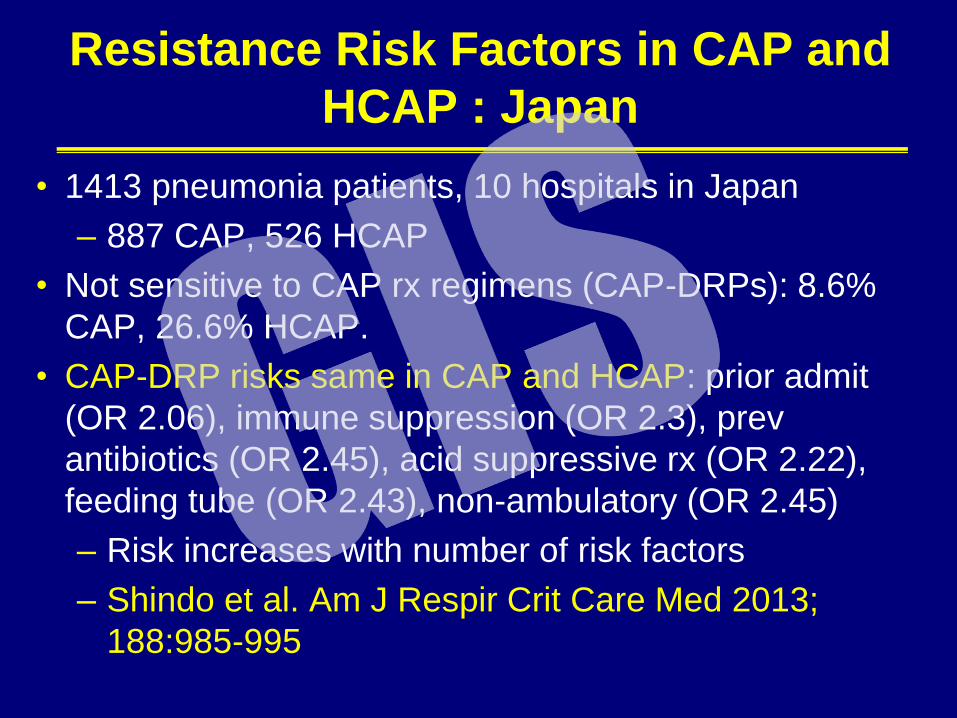
Resistance Risk Factors in CAP and
HCAP : Japan
• 1413 pneumonia patients, 10 hospitals in Japan
– 887 CAP, 526 HCAP
• Not sensitive to CAP rx regimens (CAP-DRPs): 8.6%
CAP, 26.6% HCAP.
• CAP-DRP risks same in CAP and HCAP: prior admit
(OR 2.06), immune suppression (OR 2.3), prev
antibiotics (OR 2.45), acid suppressive rx (OR 2.22),
feeding tube (OR 2.43), non-ambulatory (OR 2.45)
– Risk increases with number of risk factors
– Shindo et al. Am J Respir Crit Care Med 2013;
188:985-995
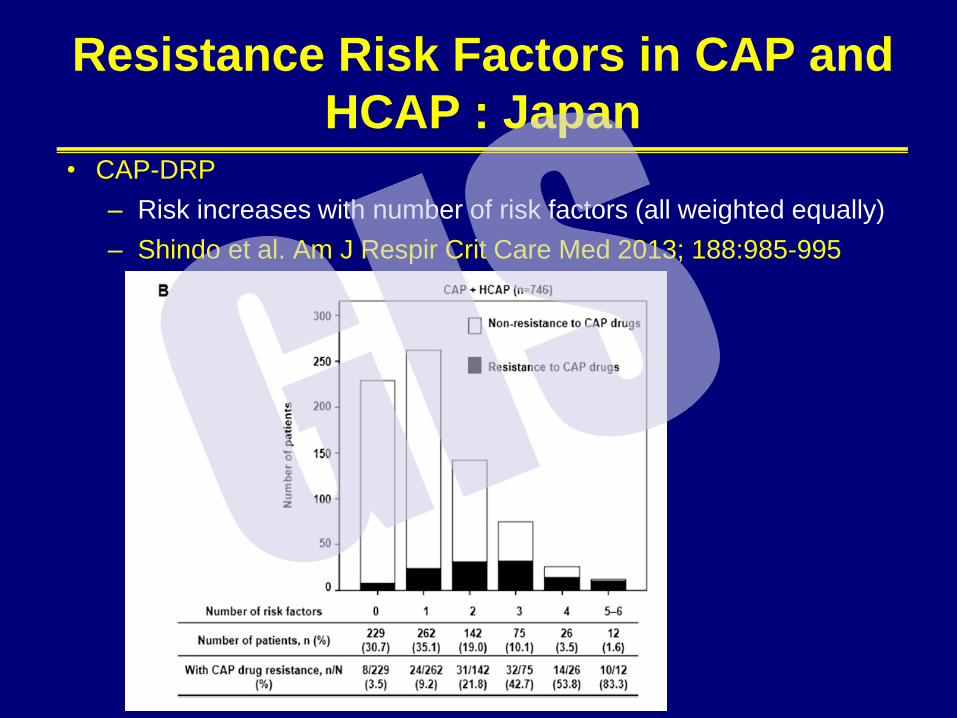
Resistance Risk Factors in CAP and
HCAP : Japan • CAP-DRP
– Risk increases with number of risk factors (all weighted equally)
– Shindo et al. Am J Respir Crit Care Med 2013; 188:985-995
34
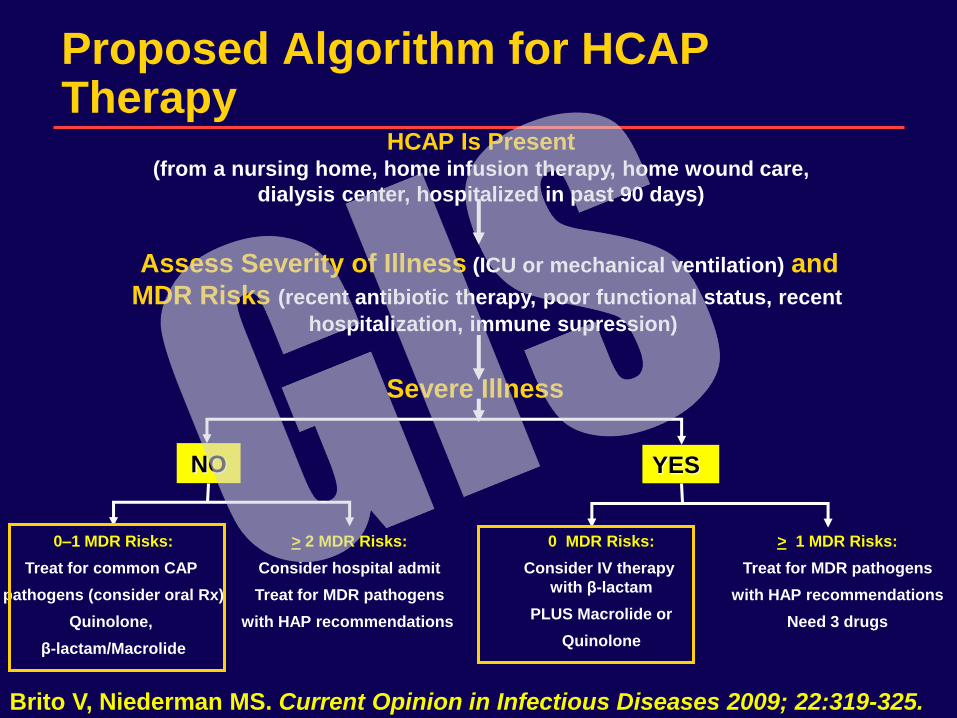
Proposed Algorithm for HCAP Therapy
Severe Illness
Assess Severity of Illness (ICU or mechanical ventilation) and
MDR Risks (recent antibiotic therapy, poor functional status, recent
hospitalization, immune supression)
YES NO
HCAP Is Present (from a nursing home, home infusion therapy, home wound care,
dialysis center, hospitalized in past 90 days)
Brito V, Niederman MS. Current Opinion in Infectious Diseases 2009; 22:319-325.
> 1 MDR Risks:
Treat for MDR pathogens
with HAP recommendations
Need 3 drugs
0–1 MDR Risks:
Treat for common CAP
pathogens (consider oral Rx)
Quinolone,
β-lactam/Macrolide
0 MDR Risks:
Consider IV therapy
with β-lactam
PLUS Macrolide or
Quinolone
> 2 MDR Risks:
Consider hospital admit
Treat for MDR pathogens
with HAP recommendations
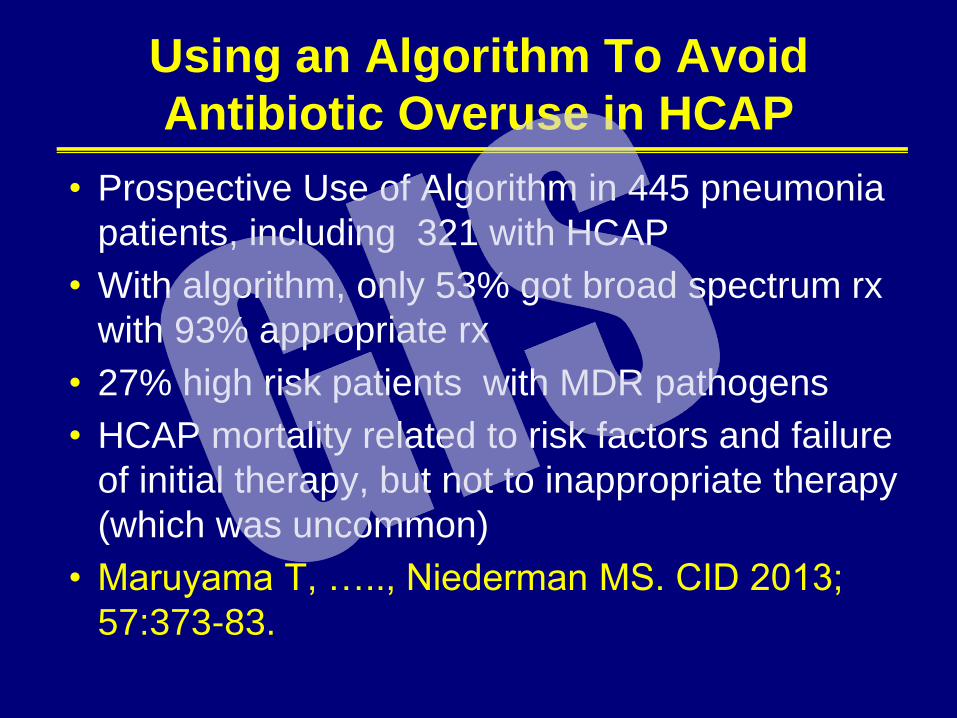
Using an Algorithm To Avoid
Antibiotic Overuse in HCAP
• Prospective Use of Algorithm in 445 pneumonia
patients, including 321 with HCAP
• With algorithm, only 53% got broad spectrum rx
with 93% appropriate rx
• 27% high risk patients with MDR pathogens
• HCAP mortality related to risk factors and failure
of initial therapy, but not to inappropriate therapy
(which was uncommon)
• Maruyama T, ….., Niederman MS. CID 2013;
57:373-83.
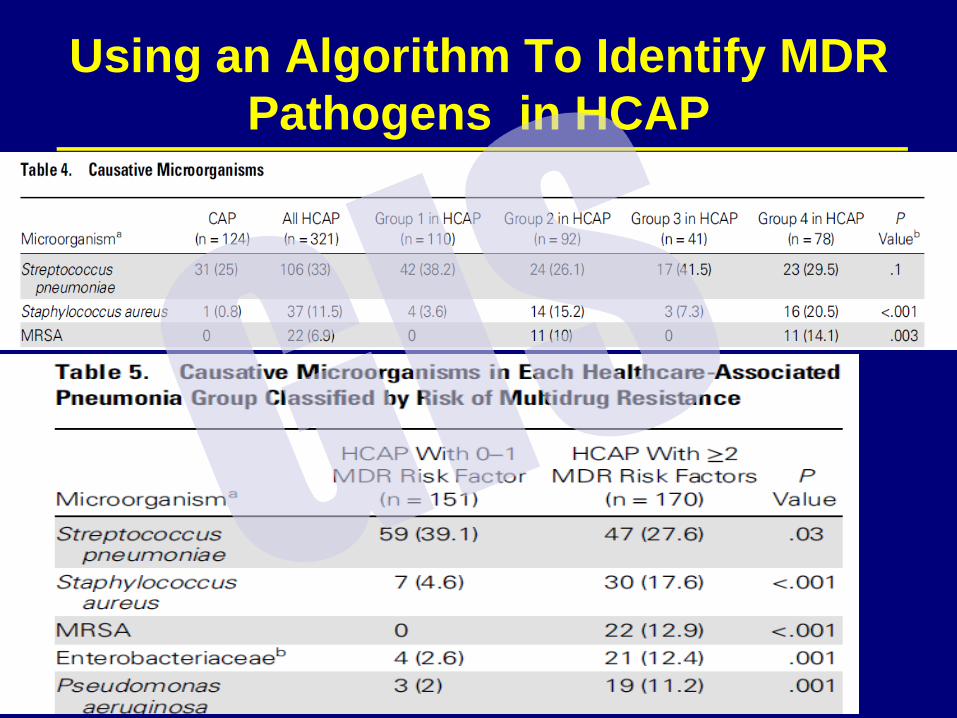
Using an Algorithm To Identify MDR
Pathogens in HCAP

A Really Ugly New Direction
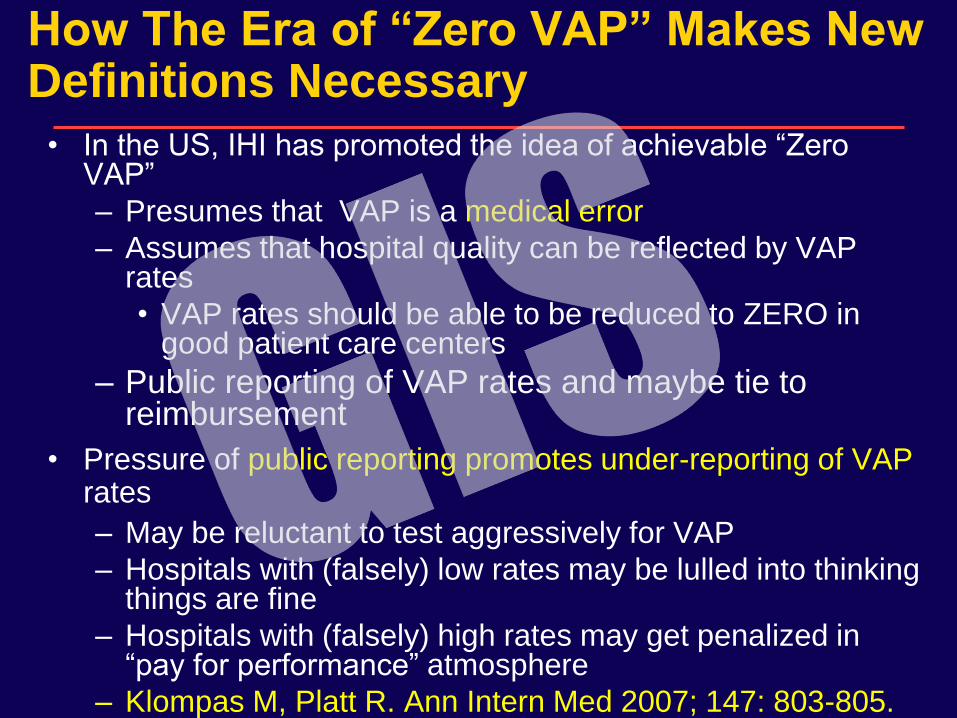
How The Era of “Zero VAP” Makes New Definitions Necessary • In the US, IHI has promoted the idea of achievable “Zero
VAP”
– Presumes that VAP is a medical error
– Assumes that hospital quality can be reflected by VAP rates
• VAP rates should be able to be reduced to ZERO in good patient care centers
– Public reporting of VAP rates and maybe tie to reimbursement
• Pressure of public reporting promotes under-reporting of VAP rates
– May be reluctant to test aggressively for VAP
– Hospitals with (falsely) low rates may be lulled into thinking things are fine
– Hospitals with (falsely) high rates may get penalized in “pay for performance” atmosphere
– Klompas M, Platt R. Ann Intern Med 2007; 147: 803-805.
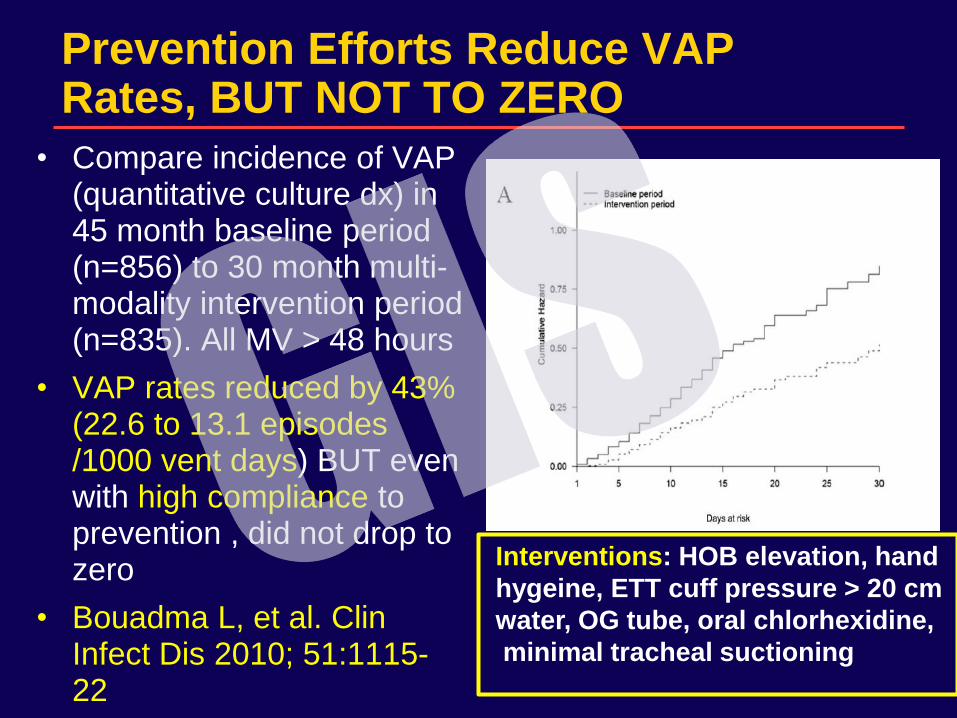
Prevention Efforts Reduce VAP Rates, BUT NOT TO ZERO
• Compare incidence of VAP (quantitative culture dx) in 45 month baseline period (n=856) to 30 month multi-modality intervention period (n=835). All MV > 48 hours
• VAP rates reduced by 43% (22.6 to 13.1 episodes /1000 vent days) BUT even with high compliance to prevention , did not drop to zero
• Bouadma L, et al. Clin Infect Dis 2010; 51:1115-22
Interventions: HOB elevation, hand
hygeine, ETT cuff pressure > 20 cm
water, OG tube, oral chlorhexidine,
minimal tracheal suctioning
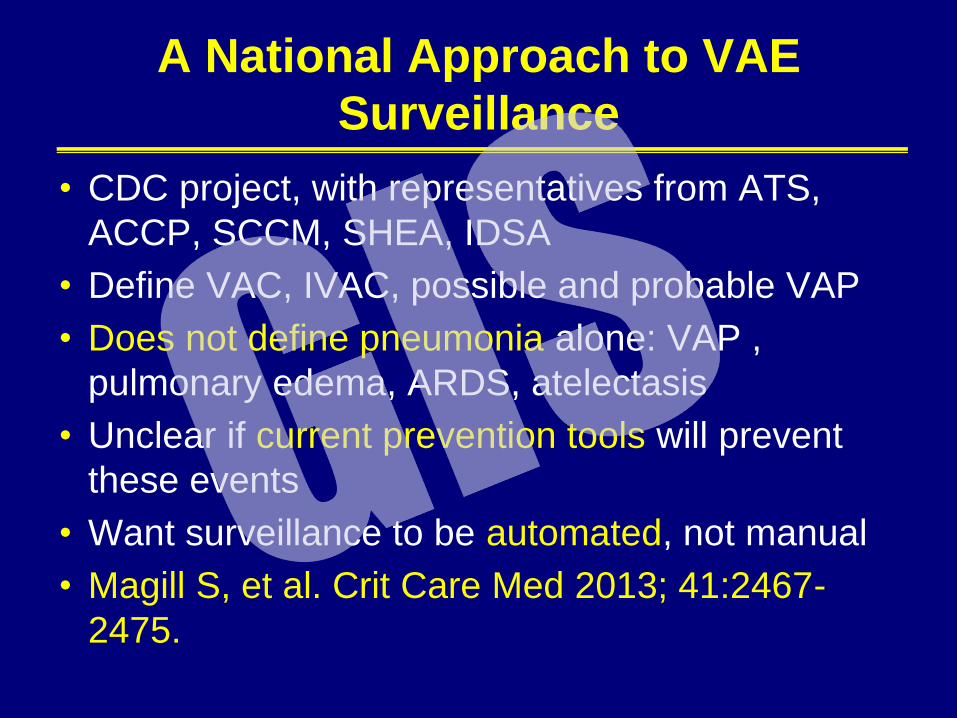
A National Approach to VAE
Surveillance
• CDC project, with representatives from ATS,
ACCP, SCCM, SHEA, IDSA
• Define VAC, IVAC, possible and probable VAP
• Does not define pneumonia alone: VAP ,
pulmonary edema, ARDS, atelectasis
• Unclear if current prevention tools will prevent
these events
• Want surveillance to be automated, not manual
• Magill S, et al. Crit Care Med 2013; 41:2467-
2475.
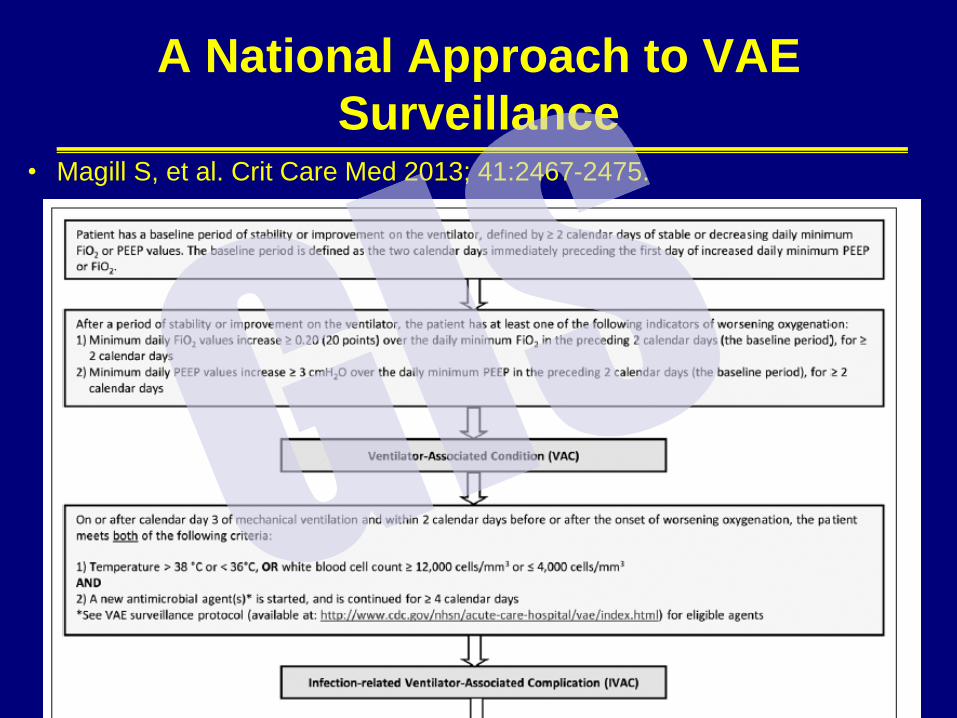
A National Approach to VAE
Surveillance • Magill S, et al. Crit Care Med 2013; 41:2467-2475.
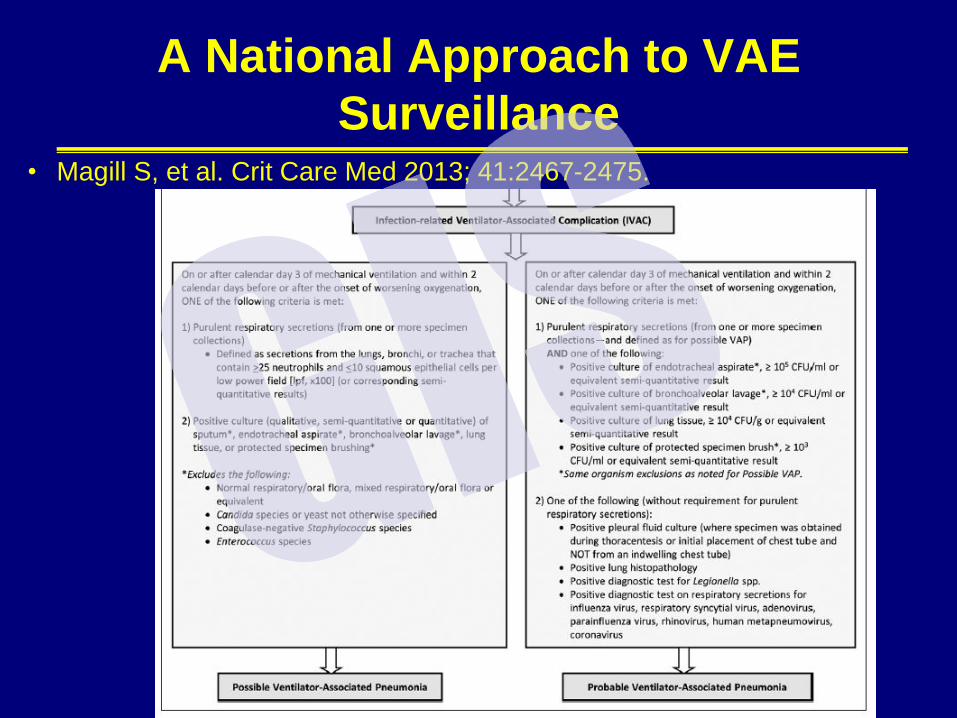
A National Approach to VAE
Surveillance • Magill S, et al. Crit Care Med 2013; 41:2467-2475.
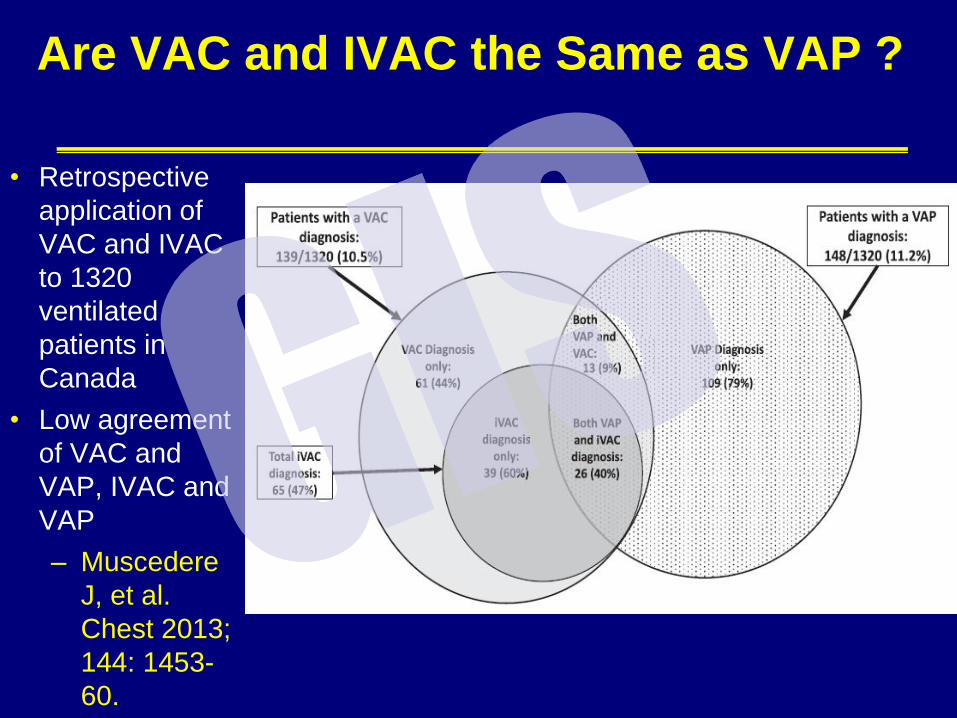
Are VAC and IVAC the Same as VAP ?
• Retrospective
application of
VAC and IVAC
to 1320
ventilated
patients in
Canada
• Low agreement
of VAC and
VAP, IVAC and
VAP
– Muscedere
J, et al.
Chest 2013;
144: 1453-
60.
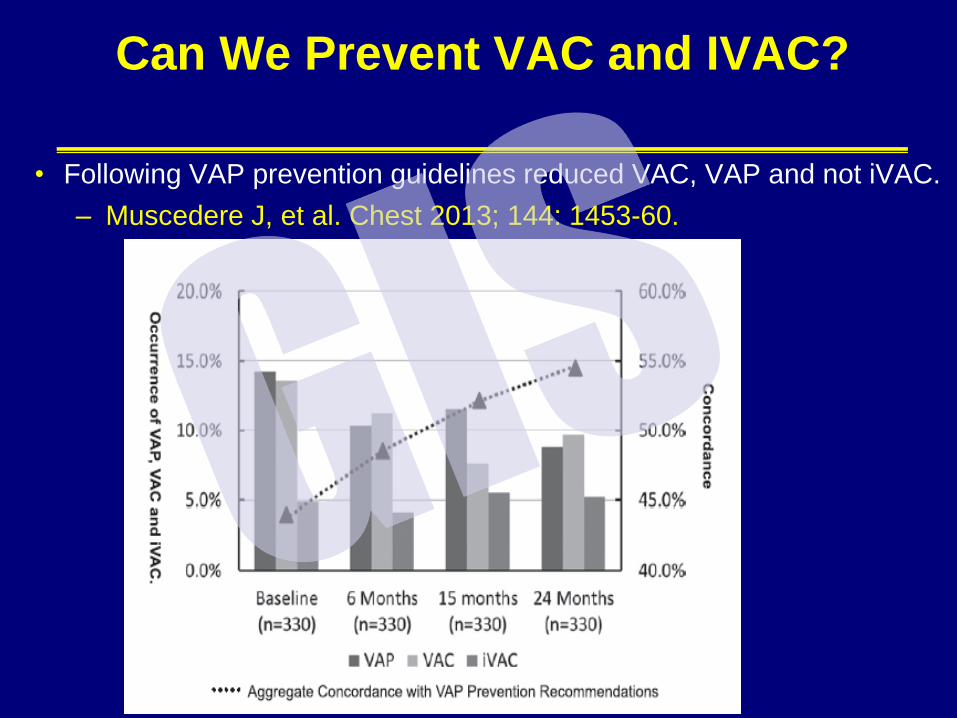
Can We Prevent VAC and IVAC?
• Following VAP prevention guidelines reduced VAC, VAP and not iVAC.
– Muscedere J, et al. Chest 2013; 144: 1453-60.
Problems with VAC and IVAC : Is This
Progress??
• VAC is more common than VAP
– How do VAC and IVAC correlate with the presence of
specific respiratory infections?
• IVAC: Is this VAP + VAT+ a lot of other things (not
pneumonia)?
• If it is VAT, will this push us to treat or not treat it?
Treat=IVAC
– What is the false negative rate? VAP can exist without
meeting the oxygenation criteria of VAC.
• Still need to show that these diseases can be modified by
current prevention strategies
• Need to show that VAC correlates with quality of care, or why
monitor?
Future Challenges
• Updating guidelines
– By whom?
– How often?
• Improving outcome thru guidelines
• Effective implementation
• A unified algorithm for all pneumonia?
– Where does HCAP belong?
• Use of biomarkers
• Prevention of CAP and HAP
• Believing that VAP still exists. Validating new definitions

Guidelines for Pneumonia: The Good , The Bad and The Ugly
Michael S. Niederman, MD
Professor of Medicine
Vice-Chairman, Department of Medicine
State University of New York at Stony Brook
Chairman, Department of Medicine
Winthrop-University Hospital
Mineola, New York

Pneumonia Guidelines


Pneumonia Guidelines