Embed Size (px)
Citation preview
' f t
NASA Contractor Report 1783 10
Guidelines for Noise and Vibration Levels for the Space Station
Committee on Hearing, Bioacoustics, and Biomechanics Commission on Behavioral and Social Sciences and Education National Research Council Washington, D.C.
JUNE 1987
(&ASA-CE-1783 10) G U I C E L I l E l S FCR l G X S E AND 1307-24162 V I E B A I I C Y L E V E L S FGE SffE S F A C E S Z A T I O N (ttaticnal Acadeey of Eciences - National Gesearch C o u n c i l ) 3 9 F. A v a i l : KllS Hf Uaclas I;O3/BE A01 CSCL 20A 63/71 0080166
National Aeronautics and Space Administration
Langley Research Center Hampton, Virginia 23665-5225
https://ntrs.nasa.gov/search.jsp?R=19870014729 2020-03-20T10:58:42+00:00Z
GUIDELINES FOR NOISE AND VIBRATION LEVELS FOR THE SPACE STATION
Committee on Hearing, Bioacoustics, and Biomechanics Commission on Behavioral and Social Sciences and Education
National Research Council
Washington, D.C. 1987
N O T I C E The project that is the subject of this report was approved by the Governing Board of the National Research Council, whose members are drawn from the councils of the National Academy of Sciences, the National Academy of Engineering, and the Institute of Medicine. The members of the committee responsible for the report were chosen for their special competences and with regard for appropriate balance.
This report has been reviewed by a group other than the authors according to procedures approved by a Report Review Committee consisting of members of the National Academy of Sciences, the National Academy of Engineering, and the Institute of Medicine.
The National Academy of Sciences is a private, nonprofit, self-perpetuating society of distinguished scholars engaged in scientific and engineering research, dedicated to the furtherance of science and technology and to their use for the general welfare. Upon the authority of the charter granted to it by the Congress in 1863, the Academy has a mandate that requires it to advise the federal government on scientific and technical matters. Dr. Frank Press is president of the National Academy of Sciences.
The National Academy of Engineering was established in 1964, under the charter of the National Academy of Sciences, as a parallel organization of outstanding engineers. It is autonomous in its ad- ministration and in the selection of its members, sharing with the National Academy of Sciences the responsibility for advising the federal government. The National Academy of Engineering also sponsors engineering programs aimed a t meeting national needs, encourages education and research, and recognizes the superior achievements of engineers. Dr. Robert M. White is president of the National Academy of Engineering.
The Institute of Medicine was established in 1970 by the National Academy of Sciences to secure the services of eminent members of appropriate professions in the examination of policy matters pertaining to the health of the public. The Institute acts under the reponsibility given to the National Academy of Sciences by its congressional charter to be an adviser to the federal government and, upon its own initiative, to identify issues of medical care, research, and education. Dr. Samuel 0. Thier is president of the Institute of Medicine.
The National Research Council was organized by the National Academy of Sciences in 1916 to associate the broad community of science and technology with the Academy’s purposes of furthering knowledge and advising the federal government. Functioning in accordance with general policies determined by the Academy, the Council has become the principal operating agency of both the National Academy of Sciences and the National Academy of Engineering in providing services to the government, the public, and the scientific and engineering communities. The Council is administered jointly by both Academies and the Institute of Medicine. Dr. Frank Press and Dr. Robert M. White are chairman and vice chairman, respectively, of the National Research Council.
This work relates to Department of the Navy Contract N00014-80-C-0159 issued by the Office of Naval Research under Contract Authority NR 201-124. However, the content does not necesasrily reflect the position or the policy of the Department of the Navy or the government, and no official endorsement should be inferred.
The United States government has a t least a royalty-free, nonexclusive and irrevocable license throughout the world for government purposes to publish, translate, reproduce, deliver, perform, dispose of, and to authorize others so to do, all o r any portion of this work.
.. 11
,
WORKING GROUP ON NOISE AND VIBRATION LEVELS FOR THE SPACE STATION
WILLIAM MELNICK (Chair), Ohio State University (psychoacoustics) DARLENE HOWARD, Georgetown University (psychology) PAUL Y. NAITOH, Naval Health Research Center, San Diego, California
WILLIAM RABINOWITZ, Massachusetts Institute of Technology (electrical engineering) HENNING VON GIERKE, Aerospace Medical Research Laboratory, Wright-Patterson
JOHN C. WEBSTER, National Technical Institute for the Deaf, Rochester, New York
HAROLD WILLIAMS, Research Center, Oklahoma City, Oklahoma (neurophysiology)
(psychophysiology)
Air Force Base, Ohio (biomechanics)
(PSY chology
... 1U
COMMITTEE ON HEARING, BIOACOUSTICS, AND BIOMECHANICS
DAVID M. GREEN (Chair), Department of Psychology, University of Florida JOHN H. MILLS, Department of Otolaryngology, Medical University of South Carolina WILLIAM M. RABINOWITZ, Department of Electrical Engineering and Computer
ROBERT J. RUBEN, Department of 0 tolaryngology, Albert Einstein College of Medicine MURRAY B. SACHS, Department of Biomedical Engineering, Johns Hopkins University
JAMES C. SAUNDERS, Department of Otorhinolaryngology and Human
ALBERT SCHULTZ, Department of Mechanical Engineering, University of Michigan DIANNE J. VAN TASELL, Department of Communication Disorders, University of
WILLIAM A. YOST, Parmly Institute, Loyola University at Chicago
Science, Massachusetts Institute of Technology
School of Medicine
Communications, University of Pennsylvania
Minnesota
MILTON A. WHITCOMB, Study Director ARLYSS K. WIGGINS, Administrative Secretary
iv
I
I
Contents
PREFACE
SUMMARY
Acoustic Guidelines, 1 Vibration Guidelines, 2
INTRODUCTION
EFFECTS OF NOISE ON SPEECH COMMUNICATION
Overall Guidance, 5 Other Factors, 6
EFFECTS OF NOISE ON SLEEP
Introduction, 9 Definition of Sleep, 9 Sleep Disturbance, 10 Stimulus Characteristics and Sleep Disturbance, 10 Effects of Sleep Loss and Sleep Disturbance on Performance, 12 Summary and Recommendations, 13
EFFECTS OF NOISE ON HEARING
Permanent Changes in Hearing Sensitivity, 14 Temporary Changes in Hearing Sensitivity, 18 Annoyance, 21
EFFECTS OF VIBRATION
Introduction, 22 Recommendations, 23
REFERENCES
GLOSSARY
V
vii
1
3
5
9
14
22
27
31
I
Preface t
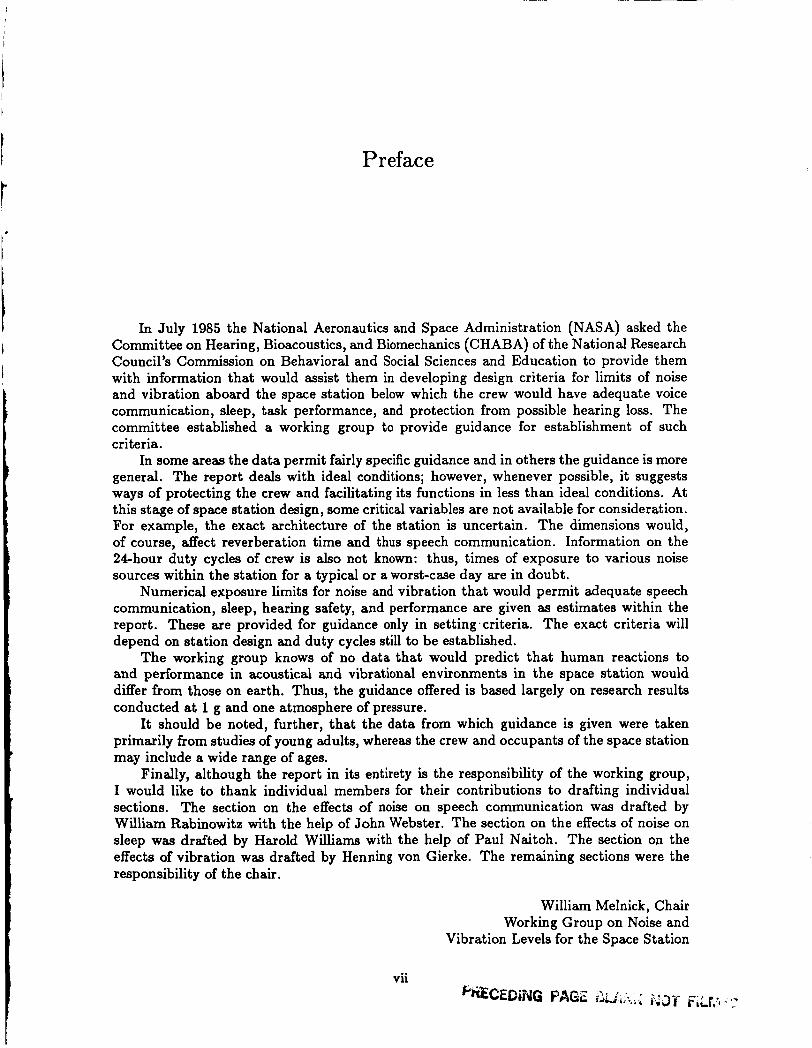
In July 1985 the National Aeronautics and Space Administration (NASA) asked the Committee on Hearing, Bioacoustics, and Biomechanics (CHABA) of the National Research Council's Commission on Behavioral and Social Sciences and Education to provide them with information that would assist them in developing design criteria for limits of noise and vibration aboard the space station below which the crew would have adequate voice communication, sleep, task performance, and protection from possible hearing loss. The committee established a working group to provide guidance for establishment of such criteria.
In some areas the data permit fairly specific guidance and in others the guidance is more general. The report deals with ideal conditions; however, whenever possible, it suggests ways of protecting the crew and facilitating its functions in less than ideal conditions. At this stage of space station design, some critical variables are not available for consideration. For example, the exact architecture of the station is uncertain. The dimensions would, of course, affect reverberation time and thus speech communication. Information on the 24hour duty cycles of crew is also not known: thus, times of exposure to various noise sources within the station for a typical or a worst-case day are in doubt.
Numerical exposure limits for noise and vibration that would permit adequate speech communication, sleep, hearing safety, and performance are given as estimates within the report. These are provided for guidance only in setting.criteria. The exact criteria will depend on station design and duty cycles still to be established.
The working group knows of no data that would predict that human reactions to and performance in acoustical and vibrational environments in the space station would differ from those on earth. Thus, the guidance offered is based largely on research results conducted at 1 g and one atmosphere of pressure.
It should be noted, further, that the data from which guidance is given were taken primarily from studies of young adults, whereas the crew and occupants of the space station may include a wide range of ages.
Finally, although the report in its entirety is the responsibility of the working group, I would like to thank individual members for their contributions to drafting individual sections. The section on the effects of noise on speech communication was drafted by William Rabinowitz with the help of John Webster. The section on the effects of noise on sleep was drafted by Harold Williams with the help of Paul Naitoh. The section on the effects of vibration was drafted by Henning von Gierke. The remaining sections were the responsibility of the chair.
William Melnick, Chair Working Group on Noise and
Vibration Levels for the Space Station
I
Summary
. The working group was established to provide information that could be used by the
National Aeronautics and Space Administration in their development of design criteria for limits of noise and vibration aboard the space station that will permit adequate voice communication, sleep, performance of tasks by the crew, and protection from hearing loss.
The working group is not aware of any data that would predict that human reactions to and performance in acoustical and vibrational environments in the space station would differ from those on earth. Therefore, guidelines developed for similar functions in earthbound environments should be applicable in space. In addition, neither design specifications of the space station geometry or internal equipment nor information concerning 24-hour duty cycles specifying exposures per day to sound sources was provided to the working group. We therefore assumed weightlessness, one atmosphere of air pressure, no earphones, no ear protection, and no oxygen mask as the typical conditions except for rare situations.
ACOUSTIC GUIDELINES
Acoustic criteria are specified in terms of A-weighted sound level (LA) or equivalent A-weighted sound level (LeP), where it is a specified time period, usually 8 or 24 hours. The equivalent A-weighted sound level is defined as the constant sound level that, in a given situation and time period, conveys the same sound energy as the actual time varying A-weighted sound. The basic unit for these measurements is the decibel.
SPEECH COMMUNICATION
1. Space station laboratory modules should have A-weighted sound levels not exceeding 55 d B (a noise criterion curve of approximately 50) and reverberation times not exceeding 1.0 s. These values should permit 95 percent intelligibility for sentences under conditions of normal vocal effort with the talker and the listener visible to each other. Communication performance could be lower in the absence of visual cues or with artificial or synthesized speech or with the use of “squawk boxes.”
2. Environments with A-weighted sound levels above 55 dB will require assistance for adequate speech communication. Designers of audiecommunication systems should recognize that the systems will amplify and distribute noise as well as speech signals to both intended and unintended listeners. Therefore, their use should be carefully controlled.
SLEEP
1. Sleep disturbance due to noise depends on the physical characteristics of the noise, its meaning, and the affected persons’ stage of sleep, as well as their motivation, gender, and age.
1
2
2. For sleeping areas, background A-weighted sound levels below 45 dB are preferred, while levels up t o 60 dB(A) are acceptable.
3. Brief noises or transients during continuous noise backgrounds are particularly disturbing to sleep. The probability of full behavioral awakening increases with increasing sound level of the transient. For transients with an LA of 60 dB, the probability of full behavioral awakening is about 0.2, while for a level of 75 dB, the probability increases to approximately 0.3.
HEARING CONSERVATION
1. The risk for producing significant hearing loss is negligible in noise exposures to an
2. A hearing conservation program similar to that described by the Occupational Safety Leq24 of 80 dB.
and Health Administration should be initiated for exposures to an Leql of 85 dB or more.
ANNOYANCE
If acoustic requirements for acceptable speech communication, sleep, and hearing con- servation are met, problems of annoyance and task disruption will be minimal.
VIBRATION GUIDELINES
Vibration criteria are specified for linear vibration in the 1-100 Hz frequency range.
HABITABILITY 1. Vibration criteria for acceptable long-term habitability should fall in the range of 1
to 5 x 10⁻²m/sec2 rms acceleration for the frequencies between 1 and 8 Hz and follow a constant velocity function from 8 to 100 Hz.
2. Below 0.5 Hz, motion sickness symptoms must be considered, although individ- ual susceptibility, several environmental factors, and the weightless condition make the establishing of general criteria difficult. To reduce the probability of motion sickness, it is recommended that acceleration not exceed 2.5 x 10⁻²m/sec2 at 0.2 Hz.
TASK PERFORMANCE
1. Specific tasks requiring more stringent vibrational criteria should be analyzed on an individual basis. In the absence of appropriate information, these tasks should be simulated on earth to determine vibration sensitivity and required accuracy.
2. If head or finger control is required to an accuracy of 5mm rms or 2.5 Newtons rms, the weighted acceleration magnitude in any axis should not exceed 5 x 10⁻³m/sec2 rms.
3. For visual tasks that require observation of details that subtend less than 2 minutes of arc at the eye, the weighted acceleration magnitude should not exceed 5 x 10⁻³m/sec2 rms with a doubling of vibration magnitude for every fi increase in the size of the detail.
1 "1
Introduction
i The hazard to the structures of the auditory system, and the accompanying hearing loss,
resulting from exposure to excessive noise or acoustic energy is established and documented. Criteria have been developed for determining exposures that could be experienced safely without increasing the likelihood of hearing impairment. Space flight and the planned space station are unique living environments for which criteria developed for earthbound activity may not be suitable.
Space missions thus far have been characterized by weightlessness, relatively long duration, confinement, and an artificial atmosphere. There have been indications of dis- satisfaction with the noise environment in orbiting missions of relatively long duration; the complaints have been chiefly those of annoyance with noise levels that interfere with communication, both assisted and unassisted, and with sleep. The noise levels measured during the orbiting phase of space flight have not been of sufficient intensity or duration to represent exposures that would be hazardous to hearing. Octave band sound pressure levels measured in the space shuttle and the skylab have been typically in the 60 to 70 decibel range and approximate the levels designated by the NC-60 curve (Wilshire, 1984).
The space station project will involve durations of 90 days or longer. The size and composition of the space station crew will differ from that used in skylab. The working crew may involve as many as eight people. The training, age, and physical and emotional characteristics of the crew could differ significantly from the astronauts who performed in the earlier space projects. These differences may enhance problems of motivation, tolerance, frustration, and annoyance. Occupational noise exposures considered safe on earth might possibly be hazardous in space. However, the experience from previous space flights indicates that the orbiting space environment is not likely to represent a major problem to the auditory sensory system.
Some of the concerns about the auditory environment of earlier space missions may not be applicable to that of the space station. The previous size restrictions required the personnel to work, socialize, sleep, etc., in the same ambient noise conditions. The noise exposure was truly 24 hours. For the space station the planned size of the habitable modules and the number of interconnected modules may alleviate the problem of confinement to a given acoustic environment, regardless of the activity of the crew members.
With more room available for various operations and functions, the task of providing acoustic conditions that do not pose a threat to hearing should be easier. The task of providing acoustic conditions for adequate face-to-face communication and sleep is much more difficult than that of preventing hearing loss. The opportunity to move from one noise environment to another makes living conditions essentially the same as for earthbound per- sonnel. Control of annoying noise exposures can be accomplished by activity management as well as by reducing noise levels at the source.
3
4
Lack of gravity does not seem to affect the auditory system, unlike the vestibular system, as evidenced by episodes of space sickness. The noise exposure of the crew from the initial stages of high energy propulsion apparently has been maintained at relatively harmless doses.
It is assumed that data on auditory function and performance safety developed on the earth’s surface will apply equally to the space station. Since there are few guidelines established for the space environment, those developed for earthbound activities must be used until they are found to be inadequate or inappropriate by space experience.
Effects of Noise on Speech Communication
Speech communication aboard the NASA space station will be influenced by a variety of factors relating to characteristics of the space station and the crew. Noise levels and reverberation times are likely to vary among different work and living spaces. Crew members will vary in the extent of their training and experience. Because many crew members are likely to be lay persons from industrial and university environments, they will probably vary considerably in their hearing levels (deficits) and ages, and their primary language may not be English. Furthermore, to enable hands-free interaction in certain experiments, there will probably be increased use of advanced technology in automatic speech recognition (for crew-to-machine communication) and computerized speech synthesis (for machine- to-crew communication). Simple and meaningful guidance cannot be given to cover all these conditions; instead, overall guidance has been specified for “typical” conditions, and adjustments have been suggested for other factors.
OVERALL GUIDANCE
These guidelines are based on the assumption that talkers and listeners working within a laboratory module will need to communicate comfortably and unaided while separated by arbitrary distances within the module. The constraint of arbitrary distance dictates that reverberation will be important in determining intelligibility since, at separations beyond about 2 m, the speech signal at the listener will be dominated by the indirect (reverberant) field of the talker and not by the direct field. In general, reverberation influences speech intelligibility in two ways. First, it provides an indirect field, which is nearly constant in level throughout an enclosed space, in contrast to the direct field, which falls 6 dB per doubling of distance from the talker. Since the indirect field reinforces the talker’s speech level, it tends to increase intelligibility. Second, reverberant energy is delayed relative to the direct field, causing a temporal “blurring” of one sound into another; therefore, it decreases intelligibility. Both of these effects must be considered in estimating intelligibility. In particular, for reverberation times exceeding 0.5 s, as is likely for the space station, the blurring effect imposes important limits on speech intelligibility.
While several methods exist for predicting the separate effects of reverberation and background noise on intelligibility, the Speech-Transmission-Index (STI) method developed recently by Houtgast and his associates (Houtgast and Steeneken, 1973, 1985; Houtgast et al., 1980) provides an integrated framework for predicting intelligibility under simultaneous conditions of reverberation and noise. At the design and planning stages, the STI method can be applied theoretically with certain assumptions. On the actual or model space station, the method can be applied empirically and objectively, without time-consuming behavioral measurements. An abbreviated version of the method, ”RASTI” (denoting rapid STI), is under consideration by various standards committees and is implemented in one
5
6
commercially available measurement system (Houtgast and Steeneken, 1984; International Electretechnical Commission, 1984; Horall and Jacobsen, 1985). Recommendations made here have been developed using STI methodology.
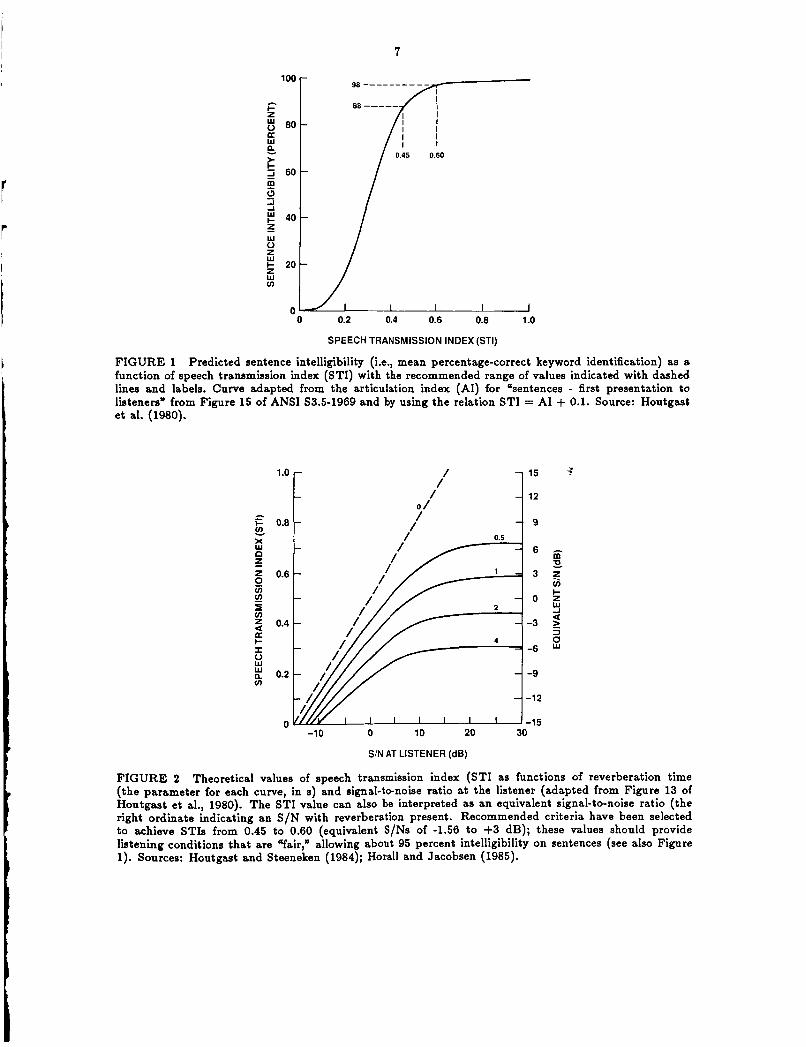
The output of the method is a number, ranging from 0 to 1, called the STI value, which is monotonically related to speech intelligibility. The suggested limits on noise (N 5 55 dBA, approximately NC-50) and reverberation (T I 1.0 9) were selected to obtain STIs in the range 0.45 to 0.60. These STIs will allow about 95 percent intelligibility of sentences (see Figure 1). This level of intelligibility is a typical target value that allows reliable communication of normal conversation (e.g., American National Standards Institute, 1970; Appendix D.l of the U.S. Environmental Protection Agency, 1974; and Webster, 1984). Conversation of a highly technical nature may require STI values above the specified range. Visual speech reading cues that result from seeing the face of the talker can provide the necessary increment. Specifically, speech reading cues for untrained observers are typically equivalent to a 3 to 6 dB improvement in signal-to-noise ratio (e.g., American National Standards Institute, 1970), which translates to STI increments of about 0.1 to 0.2.
An understanding of the determination of these STI values, as well as the other assump tions in this report, is facilitated by Figure 2. The curves show predicted STIs for various values of reverberation (T = 0.5 to 4 s) as a function of the signal-to-noise ratio (S/N) at the listener. The results assume that the listener is in the indirect field of the talker, i.e., that talker-tdistener separation exceeds a few meters. Consider first the rightmost points of each curve. These points indicate the limits on intelligibility due to the blurring caused by reverberation alone (Le., when S/N is very high, N has no effect). As T increases, STI decreases; for T = 1 s, STI approaches 0.6. Consider now the effect of decreasing the S/N. For any T, as S/N decreases, STI decreases nonlinearly. For a minimally acceptable STI = 0.45, and for T = 1 s, the results indicate that S/N at the listener should be at least +5 dB. The suggested noise limit of N = 55 dBA is then determined in two steps. First, an estimate of the talker’s indirect-field speech level (;.e., “S” at the listener) is needed. Assuming a root-mean-square direct-field speech level of 62 dBA at 1 m (a comfortable vocal effort), a talker directivity of 2 dB, and a critical distance of 1 m (consistent with T = 1 s and the tentative dimensions of the module, about 5 m diameter and 15 m length), the talker’s indirect-field level will be 60 dBA (e.g., sqe equations in Houtgast et al., 1980). Second, with S = 60 dBA and the required S/N = 5 dB, N should not exceed 60 - 5 = 55 dBA.
OTHER FACTORS
LISTENER CHARACTERISTICS
The above values will be inadequate for individuals with significant hearing loss or central perceptual deficits (e.g., as a result of aging) or who are listening to a nonnative language. Past research indicates that such individuals require substantially better listening conditions (higher S/Ns and lower Ts) to understand speech (e.g., Duquesnoy and Plomp, 1980; Duquesnoy, 1983; Harris and Reitz, 1985; National Research Council, 1987). Compre- hension will be limited even under ideal conditions (no noise or reverberation) for persons with sufficient losses. Certain projects may benefit from the unique talents of specific in- dividuals with communication deficiencies; consequently, rigid criteria for the selection of crew members may not be appropriate. Nevertheless, crew members should be evaluated using test conditions that simulate the space station acoustic environment to ensure that their communication abilities are adequate for their assigned tasks. Stricter requirements may apply to pilots than to mission specialists.
7
SPEECH TRANSMISSION INDEX (STI)
FIGURE 1 Predicted sentence intelligibility (Le., mean percentage-correct keyword identification) as a function of speech transmission index (STI) with the recommended range of values indicated with dashed lines and labels. Curve adapted from the articulation index (AI) for “sentences - first presentation to listeners” from Figure 15 of ANSI S3.5-1969 and by using the relation STI = AI + 0.1. Source: Houtgast et al. (1980).
/ /
/ I 15 .:
12
9
-9
-12
-15 -10 0 10 20 30
SIN AT LISTENER (dB)
FIGURE 2 Theoretical values of speech transmission index (STI as functions of reverberation time (the parameter for each curve, in s) and signal-to-noise ratio at the listener (adapted from Figure 13 of Houtgast et al., 1980). The STI value can also be interpreted as an equivalent signal-to-noise ratio (the right ordinate indicating an S/N with reverberation present. Recommended criteria have been selected to achieve STIs from 0.45 to 0.60 (equivalent S/Ns of -1.56 to +3 dB); these values should provide listening conditions that are “fair,” allowing about 95 percent intelligibility on sentences (see also Figure 1). Sources: Houtgast and Steeneken (1984); Horall and Jacobsen (1985).
8
INCREASED NOISE LEVELS
Individuals on the space station will need to work under conditions of greater noise at some locations than at others. Unaided communication is possible in noise levels up to about 85 dBA. As the noise level increases from 55 to 85 dBA, talkers naturally increase their vocal effort and talker-to-listener distance decreases as needed (Pearsons et al., 1977; Webster, 1984). While such compensatory mechanisms are adequate for relatively brief time periods, they cannot be maintained for the extended durations planned for the space station missions, and hence they were not considered in developing the overall guidance specified above. For noise levels above 90 dBA, aided communication will be required. Some guidelines for communication assistance requirements in high noise environments are available (Shipboard Aviation Maintenance Communications, 1972). Communication assistance, however, may be desirable for more moderate noise levels, (;.e., for talker and listener comfort), and a variety of assistive systems may need to be available, including relatively lightweight head-worn systems with either direct-wire or, if possible, remote (FM or infrared) links. Assistive systems may interact with, or be affected by, the general audio- communication system of the space station required for intermodule communication, alarm signals, etc. As part of the goal of providing a quiet and comfortable working environment, the designers of the system should recognize that it will amplify and distribute noise as well as speech signals at the input to both intended and unintended listeners. As a result, close-talking microphones may have to’be used in preference to open microphones. If open microphones are essential, they should be carefully controlled.
SPEECH RECOGNITION AND SPEECH SYNTHESIS
Automatic speech recognition systems for crew-to-machine communication are, at their present stage of development, extraordinarily sensitive to background noise, requiring input S/N = 15 dB or more (Braida et al., 1986). Until this sensitivity is reduced substantially, use of such systems on the space station will require that the talker use a close-talking head-worn microphone or be positioned close to a fixed microphone. Computer-synthesized speech systems (for machine-to-crew communication) and other artificial speech sources (e.g., squawk boxes) have unique speech qualities that have led some to speculate that they may have greater intelligibility and attention-getting value than natural speech. There has been relatively little research on this topic, however; recent results (Pisoni et al., 1985) indicate that (a) the best available systems are close, but not equal, to the intelligibility of the auditory component of natural speech (i.e., headphone listening with no visual cues) and (b) simple, low-cost systems are substantially poorer. Furthermore, understanding synthetic speech appears to require greater perceptual and cognitive effort from the listener. These results place important constraints on the use of such systems in conditions of high information load or in severe environments. For less demanding situations, such systems may be acceptable; however, they will require better listening conditions than suggested above in order to overcome their intrinsically poorer intelligibility and lack of visual cues.
1
I
Effects of Noise on Sleep
INTRODUCTION
Although noise in previous space missions has not been a major risk factor for physical health, it has been a source of annoyance. For example, several of the shuttle astronauts have complained that noise levels aboard the space craft are high enough to interfere with sleep. Furthermore, there is evidence both from space station simulation studies and from shuttle crew reports that noise-related annoyance may increase with mission duration. Responding to post-mission questionnaires, several of the shuttle astronauts indicated that current noise levels might prove unsatisfactory over longer missions, and one crew member stated that lower noise levels were “critical” for longer-duration missions. The Soviets experienced similar problems in Salyut 5 and 6. They observed that complaints of noise-related sleep disturbance and fatigue were especially likely to occur during long missions (Wilshire, 1984).
The relationships between noise and sleep disturbance are rather complex. A sound level that will cause awakening is a function of several variables including: (a) stimulus intensity, (b) stimulus quality, (c) stage of sleep, (d) accumulated sleep time, (e) individual differences in sensitivity, and (f) chronological age. Furthermore, if noise stimuli have no special meaning or signal value for the person, adaptation of the awakening response can occur over time. However, despite disappearance of the awakening response, autonomic nervous system reactions such as cardiac acceleration and peripheral vasoconstriction show little or no habituation to brief loud noises, even after 5-6 years of exposure (Lukas, 1975; Vallet and Francois, 1982).
Although sleep, rest, and relaxation are important for efficient performance and feelings of well-being, the biological reasons for sleep are not well understood. And, because the functional significance of sleep is not known, it is difficult to state unequivocally that any specific alteration of sleep is harmful. Typically, 8 hours of sleep per 24-hour period is required for efficient performance at work, but this sleep requirement varies from person to person. Short sleepers have been observed who require less than 5 hours of sleep per day, while long sleepers may need 10 hours or more. However long or short a person’s sleep requirement may be, the need can only be satisfied by sleeping; resting quietly in bed with eyes closed does not substitute for sleep.
Sleep occurs more quickly, lasts longer, and is disturbed less frequently when it is taken at a customary time. Sleep at unaccustomed times has longer latencies, shorter durations, and more frequent transient awakenings.
-
DEFINITION OF SLEEP
Sleep is a regularly occurring behavioral state characterized by relative quiescence, easy reversibility, and a considerable increase in response thresholds, but with no notable
9
10
decrease in sensitiviity of the sense organs. Presence or absence of sleep can be judged with reasonable reliability by trained observers or by assessment of activity level, but most reliably by polygraphic recordings of brain waves (EEG), eye movements, and muscle activity. Sleep is typically classified into stages defined by patterns observed in the EEG. Stage 1 is a transition state between waking and sleep, while stage 4, characterized by high-voltage slow waves in the EEG, is generally regarded as the deepest stage of sleep.
SLEEP DISTURBANCE
Everyday experience suggests that awakening from sleep should be easy to detect. Awake persons open their eyes, talk, and move about. However, awakening is a complex event that has been defined in several different ways: by brain wave responses such as appearance of the alpha rhythm, by motor responses such as pressing a switch, by verbal acknowledgment of waking, or by retrospective reports of awakenings after a night of dis- turbed sleep. The definition of sleep disturbance may be broadened to include transient physiological arousals signaled by briefly altered EEG rhythms, shifts from a deeper to a lighter stage of sleep, increases in heart rate and skin conductance, peripheral vasocon- striction, muscle tension, eye movements, and other central nervous system, autonomic, and neuromuscular events. Noise can cause any level of sleep disturbance, from these mi- croarousals to frank behavioral awakening. Obviously, specification of noise levels depends on one’s definition of sleep disturbance. Various physiological systems respond differently to noise levels. For example, cardiovascular responses and EEG responses known as K- complexes occur with lower noise intensities than electrodermal and behavioral responses. Cardiovascular responses to low-intensity noises, though large, reliable, and very persistent over time, occur without the sleeper’s awareness and thus do not affect self-assessments of sleep quality. The physiological cost, if any, of frequent and persistent cardiovascular arousal to sound during sleep is not known.
STIMULUS CHARACTERISTICS AND SLEEP DISTURBANCE
The relationships between stimulus characteristics and sleep disturbance are complex. Brief noises arising sharply out of rhythmic or continuous random noise are often much more disturbing than the background noise itself. Physical noise such as that produced by fans and pumps of a life support system is likely to be less disturbing than the noise of crew activities such as talking, working on a treadmill, flushing the toilet, or taking a shower. Loud, unexpected, strange, reverberating, or frightening sounds are more disturbing than anticipated familiar sounds.
STIMULUS INTENSITY
Despite these complexities, for relatively brief noises (Le., a minute or less) increases in stimulus intensity generally result in a monotonic increase in sleep disturbance. Analysis of several recent studies shows that if sleep disturbance is defined as a shift to a lighter sleep stage, then, on the average, a transient noise at 75 dBA has a 0.50 probability of disrupting sleep; for an A-weighted noise level of 60 dB, the average probability is 0.31; and for 45 dB, the probability is about 0.05. If sleep disturbance is defined as full behavioral awakening, then the corresponding average probabilities for 75 dBA, 60 dBA, and 45 dBA are 0.31, 0.17, and 0.00, respectively (Goldstein and Lukas, 1980). It should be understood that although these predictions are based on empirically derived relations, and are the best established to date, they are based on a relatively small body of scientific data.
I
11
STIMULUS QUALITY
People can learn to sleep through regularly occurring, meaningless noises such as intermittent, experimenter-produced pings that have intensities as high its 90 dB. Townsend et al. (1973) report on the sleep of young men exposed to pulsed 660 ms tones in the 3,000 to 4,000 Hz range. A tone occurred every 22 seconds, 24 hours per day, for 30 days with intensities ranging from 80 to 90 dB. The pings had no effect on sleep duration or on number of awakenings. 0 ther studies show that persons living near high-density airport or traffic noise experience much less awakening than would be predicted from laboratory research. Although behavioral awakening and EEG responses may show adaptation with prolonged noise exposure, cardiovascular responses elicited during sleep have so far shown no adaptation over many (5-6) years of noise exposure (Vallet and F'rancois, 1982).
Despite the increase in behavioral response thresholds typically found during sleep and evidence of adaptation of behavioral and EEG awakening with chronic noise exposure, sensory thresholds per se are not substantially raised during sleep. Sense organs appear to be just as sensitive during sleep as they are during wakefulness (Miller, 1974). Furthermore, a person awakens to an auditory stimulus not simply because of its intensity but because of its signal value, its meaning (Williams, 1966, 1973). In fact, a sudden silence may disturb sleep as much as a sudden loud noise. For example, if a continuous rhythmic background noise signals the smooth operation of an essential system such as the life support machinery on a space vehicle, termination of the noise will probably cause abrupt awakening of all sleeping crew members. A man asleep in a noisy environment may awaken abruptly to the softly spoken sound of his own name. In general, relatively weak stimuli that are novel or unexpected or have biological or psychological meaning for the sleeping person can cause rapid awakening. These observations imply that the brain mechanisms for transducing, transmitting, and interpreting acoustic signals are available and functional during sleep (Williams, 1973).
Some sounds can help to induce and maintain sleep. The hypnotic effects of a soothing lullaby or the steady hum of a fan or the rhythmic sounds of the surf are well known. Certain steady sounds such as a moderate level of broad band noise could be used to mask transient low-intensity noises that would otherwise disturb sleep.
STAGE OF SLEEP AND ACCUMULATED SLEEP TIME
For both neutral and meaningful acoustic stimuli, the likelihood of behavioral awakening is a decreasing function of EEG amplitude. For example, an impulse noise at 60 dBA is less likely to awaken a person from sleep stage 4 than from sleep stage 2. However, since high- voltage slow wave sleep occurs early in the night and lower-voltage stages predominate later in the night, the sleep stage effect is confounded with accumulated sleep time, or factors associated with circadian biological rhythms, or both. In general, behavioral responsiveness increases with increasing time asleep (Williams, 1966).
INDIVIDUAL DIFFERENCES IN SENSITIVITY
Most investigators have found that women are more easily awakened than men. Arous- ability increases with a person's age and, once awake, older persons have more difficulty returning to sleep than young adults or children (Lukas, 1975).
12
EFFECTS OF SLEEP LOSS AND SLEEP DISTURBANCE ON PERFORMANCE
ACUTE SLEEP DEPRIVATION
The effects of a night or two of acute sleep deprivation on performance can vary from no impairment at all on some tasks to almost total inability to perform on others. Performance on relatively boring tasks such as prolonged watchkeeping is particularly vulnerable to loss of sleep, whereas performance on intellectually challenging, interesting tasks can remain stable for as long as 60 hours of wakefulness.
In addition to variability in task sensitivity, there are wide differences among persons in their vulnerability to the effects of acute sleep loss. Some persons can maintain stable performance over 60 hours of sleep loss while others show gross impairment early in a vigil. No psychometric predictors of these individual differences have been identified, but subjects who showed large, task-related increases in muscle tension during baseline testing maintained relatively stable performance during sleep deprivation, compared with subjects who did not. Thus, measures of task-associated activation levels might be useful predictors of performance during a prolonged vigil (Wilkinson, 1961).
SELECTIVE DEPRIVATION OF SLEEP STAGES
Selective deprivation of a specific stage of sleep, such as stage 4, has not produced consistent effects on human performance. Apparently, total amount of sleep rather than type of sleep is the important variable for maintenance of daytime performance efficiency.
PARTIAL SLEEP DEPRIVATION
Partial sleep and sleep fragmentation can be tolerated for a considerable period of time (Le., as long as 8 weeks) if total sleep time per 24 hours does not become significantly less than 6 hours. Thus, volunteers who normally slept about 8 hours per night were able to maintain a 5-1/2 hour sleep regime for 8 weeks with no dramatic changes in performance or personality functioning. Chronic reduction of sleep time to 4 hours or less did impair both mood and performance on sensitive tasks such as prolonged watchkeeping (Webb, 1973; Johnson and MacLeod, 1972).
Despite such findings, it is evident that maintenance of optimal performance on a 5- to 6hour sleep regime requires considerable motivation and probably is accomplished only at some physiological cost. Laboratory studies show that the effects of a $hour regime on daytime sleepiness are cumulative. Volunteers become more and more sleepy as the regime continues. As sleepiness accumulates, performance on sensitive tasks will eventually decline (Carskadon and Dement, 1983).
SLEEP DISTURBANCE, SLEEP QUALITY, AND PERFORMANCE
The long-range consequences of chronic sleep disturbance and poor sleep quality have not been investigated. Shift work that produces disturbed sleep also can produce excessive sleepiness and reduced work efficiency. Sleep disturbance is especially likely when a worker goes to bed during the ascending phase of their diurnal body temperature curve. Decreased work efficiency shows up in the form of uneven performance and attentional lapses, especially in monotonous, routine tasks. Fatigue and sleepiness interact so that performance toward the end of a long shift may show considerable degradation. With accumulating drowsiness
I I
J
13
over a long work shift, the crew might not be able to respond efficiently to a sudden demand for continuous work, even to deal with an emergency.
Among healthy young adults, awakenings to meaningless noise are usually brief. How- ever, studies of noise annoyance in neighborhoods near airports or heavily traveled roads show that, as annoyance increases, noises that once evoked only transient sleep disturbance may now elicit prolonged waking. Annoying noises can cause anger and frustration, partic- ularly if the person feels that he or she has no control over their occurrence. Such emotional reactions are likely to be especially intense if the exposed person perceives poor sleep as the major cause of discomfort, fatigue, and lowered productivity at work. Therefore, working crew members should be instructed on the need to be sensitive to the potential annoyance of noisy activities for those crew members attempting to sleep.
SUMMARY AND RECOMMENDATIONS
Although the scientific literature on noise-induced sleep disturbance and its long-range consequences is small, some generalizations have emerged. The probability that a noise will disturb sleep depends not only on its physical characteristics but also on its meaning, on the motivation of the sleeping person to respond, on stage of sleep, and on subject variables such as gender and age. If sleep disturbances due to noise actually result in a reduction in total sleep time to less than 6 hours per 24-hour period, cumulative sleepiness will occur, eventually resulting in impaired performance. Performance impairment shows up as variable efficiency and slowed reaction time and in lapses of attention. Thus, boring tasks that require prolonged attention are particularly sensitive to sleepiness. Even if noises do not elicit behavioral awakening and reduce total sleep time, they can evoke transient autonomic perturbations that do not habituate after many weeks, months, and years of exposure. Whether these events incur any psychophysiological cost is not known.
Along with impaired efficiency, noise-induced sleep disturbance could lead to deteriora- tion of mood and motivation for work. The working group makes the following recommendations:
1. Individual sleeping compartments in which noise can be controlled should be available to crew members and should be separated from the work and recreation spaces.
2. Sleeping compartment noise levels ideally should be equal to or less than 40-45 dBA. However, levels less than 60 dBA would be acceptable.
3. A broad band noise could be employed in the sleeping compartment to mask unwanted background noise. However, the intensity and duration of the masking noise should be under the control of the crew member.
4. In the sleeping compartment, the crew member should be provided with a control switch to cut off or attenuate communication sounds. Some crew members may prefer to monitor communications even while they sleep. Others may prefer isolation from such sounds.
5. Properly managed, a 12-hour shift schedule on the space station is probably accept- able. However, if sleep is disturbed, a sharp performance decrement may occur toward the end of the work shift.
Effects of Noise on Hearing
PERMANENT CHANGES IN HEARING SENSITIVITY
Proposed limits for noise or acoustic energy that would represent a hazard to hearing began to emerge more than 60 years ago. A major factor motivating this development was economic: the courts had ruled that noise-induced hearing loss was a compensable occupational disease, even though there was no loss in wages or earning capacity. The earliest hazardous noise criteria were specified only in terms of sound levels and did not define the degree of hazard to hearing represented by the noise limits. As more information accumulated, the inadequacy of criteria designated solely in terms of noise levels became obvious. By 1950, the noise damage risk criteria were defined not only in terms of overall sound level but also in terms of spectral and temporal distribution of the noise exposure. The expected adverse effects on hearing represented by these noise exposures were stated in more detail, including what portions of the auditory frequency range would be affected, to what degree, and in what percentage of the population exposed. An excellent review of noise damage risk criteria proposed up to 1971 was reported by the National Institute of Occupational Safety and Health as a basis for their Criteria for a Recommended Standard Occupational Ezposute to Noise, published in 1972.
Regulatory application of noise criteria requires simplicity. Although accuracy is com- promised by the use of a single number as an index to noise hazard, the A-weighted sound level measurement has achieved more popular acceptance than more detailed noise limits specified in octave band levels. The A-weighted sound level has been shown to be relatively effective in rating noise hazard (Botsford, 1967; Passchier-Vermeer, 1974). Because of its simplicity and its efficacy in rating noise hazard, the A-weighted sound level has become the index of choice for describing noise environments.
Two of the best known and most widely applied noise exposure criteria in this country are the 90 dBA level designated as permissible for daily, 8-hour occupational noise expo- sures by the noise regulation of the Occupational Safety and Health Administration (OSHA) (U.S. Department of Labor, 1974), and the 70 dBA, 24-hour exposure deemed adequately protective by the U.S. Environmental Protection Agency (1974). The degree of protection afforded by these two limits differs considerably. The OSHA permissible noise level emerged from the American Conference of Governmental Industrial Hygienists. From this conference a committee was appointed consisting of representatives from the American Academy of Occupational Medicine, the American Academy of Ophthalmology and Otolaryngology, the American Conference of Governmental Industrial Hygienists, the Industrial Hygiene Asso- ciation, and the Industrial Medical Association. This committee estimated that exposure to 90 dBA for 8 hours per day, 5 days per week for the average work life would increase by only 10 percent the number of people who would have or would exceed an average hearing
14
15
level (loss) of 25 dB for the three frequencies 500,1,000, and 2,000 Hz. The EPA noise limit of 70 dBA was chosen to protect, with an adequate margin of safety, the entire population from a noise-induced hearing loss of 5 dB at any frequency in the auditory range. These are very different criteria1 objectives.
More recent investigation indicates that the protective estimates of both these noise criteria may be in error, the OSHA criterion being too high and the EPA criterion too low. OSHA (Federal Register 1974) estimates 20-25 percent of the population is at risk for exceeding a 25 dB fence at 500, 1,000, and 2,000 Hz as a consequence of exposure to various noise levels for a 40-year work life. The OSHA estimate exceeds the previously estimated 10 percent. These newer estimates make the 90 dBA criterion less protective and have caused OSHA to require implementation of effective hearing conservation programs for those people exposed to the equivalent of &hour exposures to 85 dBA (U.S. Department of Labor, 1981).
Information from three sources indicates that the EPA-recommended limiting noise exposure Leq24 of 70 dBA is too low and excessively restrictive. Ward, Cushing and Burns (1976) identified sound levels that functioned as “effective quiet.” Data regarding asymptotic threshold shift as a function of exposure intensity coming from Mills and his colleagues (1979, 1981) is the second relevant information source. The third source is the proposed international standard related to predicting the effects of noise on hearing sensitivity, ISO/DIS 1999.
EFFECTIVE QUIET
Ward et al. (1976) observed that the octave band levels that meet the criteria for designation as “effective quiet” are frequency dependent. The calculated effective quiet levels were reported to be 77 dB SPL for the octave band centered at 250 Hz, 76 dB for 500 Hz, 69 d B for 1,000 Hz, 68 dB for 2,000 Hz, and 65 dB for 4,000 Hz. The A-weighted level for such a noise would be 76 dB. Ward et al. indicate that these levels would appropriately represent the limits of the region of “effective quiet” for all but a small fraction of the most susceptible people.
The worst possible noise condition would be if the noise energy were concentrated in the 3,000 to 4,000 Hz range. If the objective were to protect the most susceptible ears from developing any measurable temporary threshold shift (TTS) regardless of the duration of the exposure under the worst case conditions, then 70 dBA would be an appropriate limit. Occupational noises rarely are tonal with energy primarily in the 3,000 to 4,000 Hz region. More frequently these noises exhibit decreasing intensity as the spectral frequency is increased or have relatively broad, flat spectral distribution. For more typical noise environments, the effective quiet level would be 76 dBA. Ward and his colleagues argue, quite reasonably, that showing some TTS following sound exposure is physiologically normal and therefore to propose noise limits that would permit no measurable TTS is not appropriate. This is particularly true when the error of measurement for audiometry is in the range of 5 dB. If a TTS measured at two minutes post-exposure (TTS2) of only 5 dB is the limiting exposure effect, then the predicted acceptable octave band noise levels would be 88 dB for the band centered at 250 Hz, 83 dB at 500 Hz, 78 dB at 1,000 Hz, 76 dB at 2,000 Hz, 74 dB at 4,000 Hz, and 80 dB at 8,000’Hz. The worst case in this instance would require a limit of 75 dBA.
16
ASYMPTOTIC THRESHOLD SHIFT
The magnitude of TTS depends on not only the intensity of the noise but also its duration. At the most severely affected frequencies, TTS increases during the first 8- 12 hours of exposure and then reaches a plateau. This plateau has become known as asymptotic threshold shift (ATS) (Mills et al., 1970). The major value of measures of ATS is in predicting the maximum permanent threshold shift produced by exposure to noise of a given spectrum and level. ATS has been hypothesized to represent the upper bound on noise-induced hearing loss that can be produced by a particular sound, regardless of the temporal characteristics of exposure. Mills et al. (1979, 1981) report that the relation between ATS and exposure level is linear. ATS for the frequencies most affected increases 1.7 dB for every dB above a “critical level.” Here, too, is an indication that the noise must exceed a given intensity before it will produce an auditory effect. Just as was the case with effective quiet, the critical level for development of ATS is frequency dependent and has been calculated to be 82 dB for the octave band centered at 500 and 1,000 Hz, 78 dB at 2,000 Hz, and 74 dB a t 4,000 Hz. For a wide-band noise, this level would be 78 dBA. These levels are similar to the levels that would produce 5 dB or less of TTS2 as estimated by Ward et al. (1976).
ISO DRAFT STANDARD 1999
The Draft International Standard ISO/DIS 1999-1982, Determination of Occupational Noise Exposure and Estimation of Noise-Induced Hearing Impairment, represents an im- portant advance in methods for calculating damage risk (International Organization for Standardization, 1982). This document provides a means for calculating distributions of noise-induced permanent threshold shifts (NIPTS) at all frequencies of interest in p o p ulations exposed to daily A-weighted noise exposure levels LeqB from 75 to 100 dB for durations from 0 to 40 years. The method applies to all types of noise-steady, inter- mittent, fluctuating-and even to impulsive noise with peak levels of 140 dB SPL. The equations contained in this document for calculating NIPTS indicate that there are noise levels that will not produce hearing loss regardless of exposure duration or the length of a person’s work life. These assumed innocuous octave band noise levels are 93 dB at 500 Hz, 89 dB at 1,000 Hz, 80 dB at 2,000 Hz, 77 dB at 3,000 Hz, 75 dB at 4,000 Hz, and 77 dB at 6,000 Hz. The worst-case noise environment again would be noise with energy concentrated in the 4,000 Hz frequency region. These noise limits indicate that a more appropriate level for protecting hearing from noise would be a 24-hour exposure (Leq24) of 75 dB rather than the 70 dB proposed by the EPA (U.S. Environmental Protection Agency, 1974).
The Draft International Standard JSO/DIS 1999-1982 represents an important advance in providing methods for quantifying the effects of noise on hearing that are simple, practical, and comprehensive. The standard is based primarily on data from Burns and Robinson (1970), Passchier-Vermeer (1974), Robinson and Shipton (1977), Thiessen (1977), and statistical treatments of data from these sources by Johnson (1973, 1978). This draft standard accepts as a fundamental assumption that the hazard of sound to hearing is most closely related to sound energy and therefore accepts the equal energy concept for equating noxiousness. This assumption does not make allowances for the temporal pattern of exposure. The equal-energy hypothesis is still controversial, but the 3 dB time-intensity trading relation inherent in this hypothesis is compatible with most of the occupational noise conditions; is more protective than the 4 or 5 dB exchange rate; and is technically more practical for monitoring. ISO/DIS 1999-1982 does not address criteria for significant hearing loss or hearing handicap. It provides formulas for calculating noise-induced permanent
i
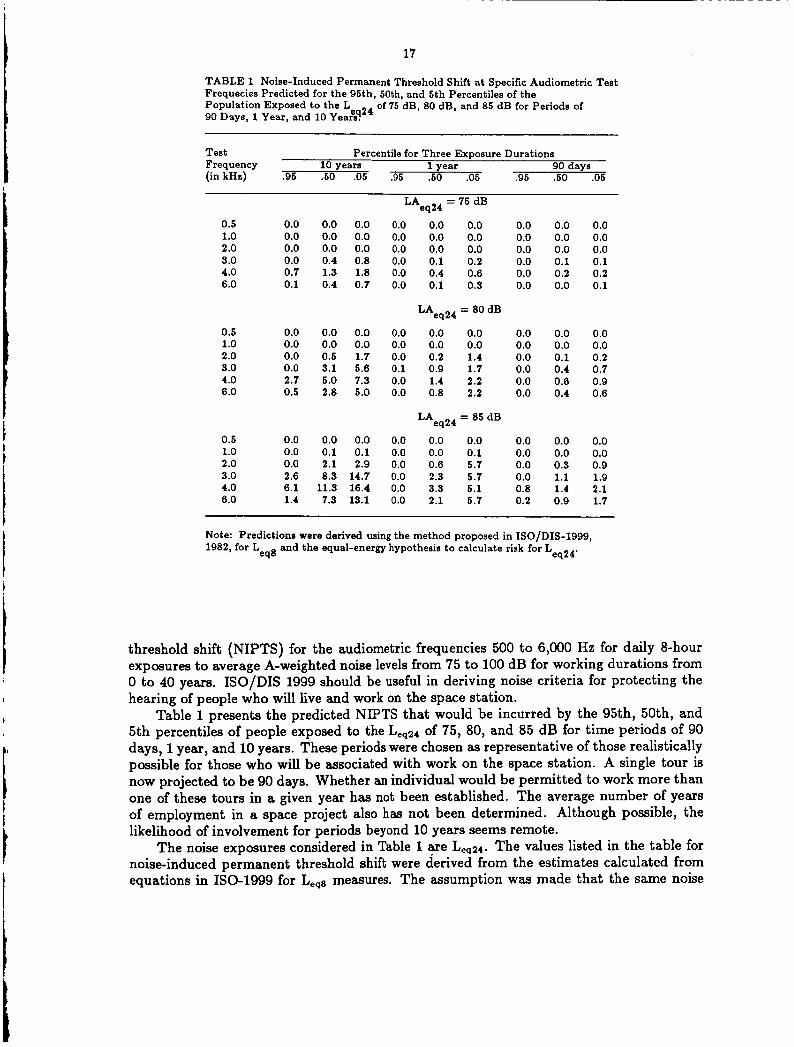
17
TABLE 1 Noise-Induced Permanent Threshold Shift at Specific Audiometric Test Frequecies Predicted for the 95th, 50th, and 5th Percentiles of the Population Exposed to the L 90 Days, 1 Year, and 10 Years.
of 75 dB, 80 dB, and 85 dB for Periods of eq24
Test Frequency 10 years 1 year 90 days (in kHz) .95 .50 .05 .95 .50 .05 .95 .50 .OS
Percentile for Three Exposure Durations
LAeq24 = 75 dB 0.5 0.0 1.0 0.0 2.0 0.0 3.0 0.0 4.0 0.7 6.0 0.1
0.5 0.0 1 .o 0.0 2 .o 0.0 3.0 0.0 4.0 2.7 6.0 0.5
0.5 0.0 1.0 0.0 2.0 0.0 3.0 2.6 4.0 6.1 6.0 1.4
0.0 0.0 0.0 0.0 0.0 0.0 0.0 0.0 0.0 0.0 0.0 0.0 0.0 0.0 0.0 0.4 0.8 0.0 0.1 0.2 1.3 1.8 0.0 0.4 0.6 0.4 0.7 0.0 0.1 0.3
LAeq24 = 80 dB
0.0 0.0 0.0 0.0 0.0 0.0 0.0 0.0 0.0 0.0 0.5 1.7 0.0 0.2 1.4 3.1 5.6 0.1 0.9 1.7 5.0 7.3 0.0 1.4 2.2 2.8 5.0 0.0 0.8 2.2
LAeq24 = 85 dB
0.0 0.0 0.0 0.0 0.0 0.1 0.1 0.0 0.0 0.1 2.1 2.9 0.0 0.6 5.7 8.3 14.7 0.0 2.3 5.7
11.3 16.4 0.0 3.3 5.1 7.3 13.1 0.0 2.1 5.7
0.0 0.0 0.0 0.0 0.0 0.0
0.0 0.0 0.0 0.0 0.0 0.0
0.0 0.0 0.0 0.0 0.8 0.2
0.0 0.0 0.0 0.1 0.2 0.0
0.0 0.0 0.1 0.4 0.6 0.4
0.0 0.0 0.3 1.1 1.4 0.9
0.0 0.0 0.0 0.1 0.2 0.1
0.0 0.0 0.2 0.7 0.9 0.6
0.0 0.0 0.9 1.9 2.1 1.7
Note: Predictions were derived using the method proposed in ISO/DIS-1999, 1982, for L
eq24' and the equal-energy hypothesis to calculate risk for L
eq8
threshold shift (NIPTS) for the audiometric frequencies 500 to 6,000 Hz for daily 8-hour exposures to average A-weighted noise levels from 75 to 100 dB for working durations from 0 to 40 years. ISO/DIS 1999 should be useful in deriving noise criteria for protecting the hearing of people who will live and work on the space station.
Table 1 presents the predicted NIPTS that would be incurred by the 95th, 50th, and 5th percentiles of people exposed to the Leq24 of 75, 80, and 85 dB for time periods of 90 days, 1 year, and 10 years. These periods were chosen as representative of those realistically possible for those who will be associated with work on the space station. A single tour is now projected to be 90 days. Whether an individual would be permitted to work more than one of these tours in a given year has not been established. The average number of years of employment in a space project also has not been determined. Although possible, the likelihood of involvement for periods beyond 10 years seems remote.
The noise exposures considered in Table 1 are Leq24. The values listed in the table for noise-induced permanent threshold shift were derived from the estimates calculated from equations in ISO-1999 for Leq8 measures. The assumption was made that the same noise
18
level measured for the Leq8 continued for an entire 24-hour day. The equal-energy, equal- hazard assumption would dictate that comparable effects on hearing would result from conditions that produce Leq24’s, which were 5 dB less than measures of Leq8. According to ISO/DIS 1999, an Leq8 of 80 dB would not produce a measurable NIPTS even after 10 years of experience. This condition would be equated to exposure to an average of 75 dBA for an entire 24-hour period. From these calculations a noise limit of Leq24 of 75 dB would protect everyone from any hearing loss of consequence, while an Leq24 of 80 would produce minimal amounts of hearing loss in a portion of the people exposed for the most sensitive frequencies 3,4, and 5 kHz, but only after an involvement of 10 years or more.
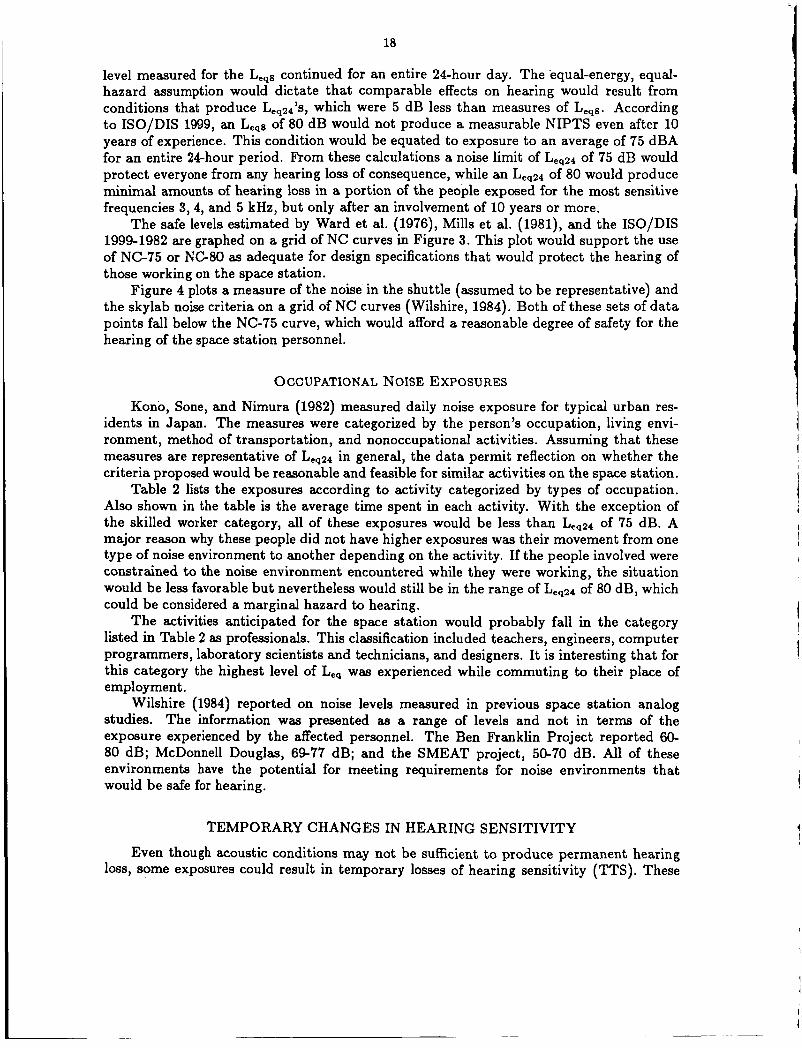
The safe levels estimated by Ward et al. (1976), Mills et al. (1981), and the ISO/DIS 1999-1982 are graphed on a grid of NC curves in Figure 3. This plot would support the use of NC-75 or NC-80 as adequate for design specifications that would protect the hearing of those working on the space station.
Figure 4 plots a measure of the noise in the shuttle (assumed to be representative) and the skylab noise criteria on a grid of NC curves (Wilshire, 1984). Both of these sets of data points fall below the NC-75 curve, which would afford a reasonable degree of safety for the hearing of the space station personnel.
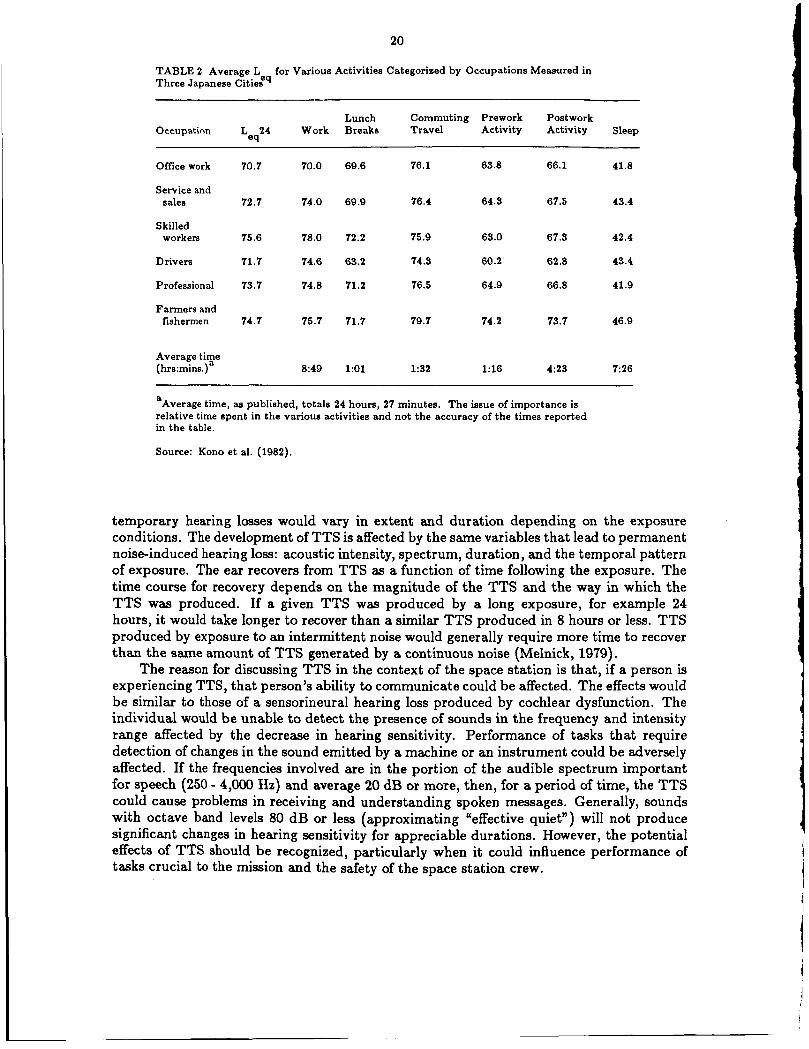
OCCUPATIONAL NOISE EXPOSURES Kono, Sone, and Nimura (1982) measured daily noise exposure for typical urban res-
idents in Japan. The measures were categorized by the person’s occupation, living envi- ronment, method of transportation, and nonoccupational activities. Assuming that these measures are representative of Leq24 in general, the data permit reflection on whether the criteria proposed would be reasonable and feasible for similar activities on the space station.
Table 2 lists the exposures according to activity categorized by types of occupation. Also shown in the table is the average time spent in each activity. With the exception of the skilled worker category, all of these exposures would be less than Leq24 of 75 dB. A major reason why these people did not have higher exposures was their movement from one type of noise environment to another depending on the activity. If the people involved were constrained to the noise environment encountered while they were working, the situation would be less favorable but nevertheless would still be in the range of Leq24 of 80 dB, which could be considered a marginal hazard to hearing.
The activities anticipated for the space station would probably fall in the category listed in Table 2 as professionals. This classification included teachers, engineers, computer programmers, laboratory scientists and technicians, and designers. It is interesting that for this category the highest level of Le, was experienced while commuting to their place of employment.
Wilshire (1984) reported on noise levels measured in previous space station analog studies. The information was presented as a range of levels and not in terms of the exposure experienced by the affected personnel. The Ben Franklin Project reported 60- 80 dB; McDonnell Douglas, 69-77 dB; and the SMEAT project, 50-70 dB. All of these environments have the potential for meeting requirements for noise environments that would be safe for hearing.
TEMPORARY CHANGES IN HEARING SENSITIVITY
Even though acoustic conditions may not be sufficient to produce permanent hearing loss, some exposures could result in temporary losses of hearing sensitivity (TTS). These
i
I
19
100
90
80
70 m 0 c. -I fn
60
50
41
1 A
NC -90 1
NC -85 - NC -80 0
NC -75
NC -70
NC -65
NC -60
0 -
NC -55
1 0 Ward et al. (5dB lTS 1
- 0 Mlllsetal.
A IS0 DIS 1999
I I I I I
250 500 1000 2000 4000 8000 0
FREQUENCY, H Z
FIGURE 3 Ehtimates of octave band levels that may be received for unlimited duration without producing significant changes in hearing sensitivity. These estimates are plotted on a grid of NC curves. Sources: Mills et al., (1979); Ward et a1.(1976); International Organization for Standardization.
1 NC 85
NC 80
NC 75
NC 70
NC 65
NC 60
NC 55
NC 50
0 Skylab Crltsrla
Shuttle Measur0
FIGURE 4 Representative octave band levels measured aboard shuttle STS-1 and noise criteria for skylab plotted on a grid of NC curves. Source: Wilshire (1984).
20
TABLE 2 Average L Three Japanese Citiezq
for Various Activities Categorieed by Occupations Measured in
Lunch Commuting Prework Postwork Occupation Leq24 Work Breaks Travel Activity Activity Sleep
Office work 70.7 70.0 69.6 76.1 63.8 66.1 41.8
Service and sales 72.7 74.0 69.9 76.4 64.3 67.5 43.4
Skilled workers 75.6 78.0 72.2 75.9 63.0 67.3 42.4
Drivers 71.7 74.6 63.2 74.3 60.2 62.8 43.4
Professional 73.7 74.8 71.2 76.5 64.9 66.8 41.9
Farmers and fishermen 74.7 75.7 71.7 79.7 74.2 73.7 46.9
Average time (hrs:mins.) a 8:49 1:Ol 1:32 1:16 4:23 7:26
aAverage time, as published, totals 24 hours, 27 minutes. The issue of importance is relative time spent in the various activities and not the accuracy of the times reported in the table.
Source: Kono et al. (1982).
temporary hearing losses would vary in extent and duration depending on the exposure conditions. The development of TTS is affected by the same variables that lead to permanent noise-induced hearing loss: acoustic intensity, spectrum, duration, and the temporal pattern of exposure. The ear recovers from TTS as a function of time following the exposure. The time course for recovery depends on the magnitude of the TTS and the way in which the TTS was produced. If a given TTS was produced by a long exposure, for example 24 hours, it would take longer to recover than a similar TTS produced in 8 hours or less. TTS produced by exposure to an intermittent noise would generally require more time to recover than the same amount of TTS generated by a continuous noise (Melnick, 1979).
The reason for discussing TTS in the context of the space station is that, if a person is experiencing TTS, that person’s ability to communicate could be affected. The effects would be similar to those of a sensorineural hearing loss produced by cochlear dysfunction. The individual would be unable to detect the presence of sounds in the frequency and intensity range affected by the decrease in hearing sensitivity. Performance of tasks that require detection of changes in the sound emitted by a machine or an instrument could be adversely affected. If the frequencies involved are in the portion of the audible spectrum important for speech (250 - 4,000 Hz) and average 20 dB or more, then, for a period of time, the TTS could cause problems in receiving and understanding spoken messages. Generally, sounds with octave band levels 80 dB or less (approximating “effective quiet”) will not produce significant changes in hearing sensitivity for appreciable durations. However, the potential effects of TTS should be recognized, particularly when it could influence performance of tasks crucial to the mission and the safety of the space station crew.
21
ANNOYANCE
An environment that has the capacity to produce annoyance has the potential for adversely influencing the morale and efficiency of people living in that environment. Sounds are capable of arousing annoyance. Long-duration space missions increase the likelihood that annoyance with sounds present in that environment will become a problem.
Acoustic annoyance is highly variable and depends on the individuals involved. This variability makes annoyance difficult to predict for a given person. Nevertheless, general relationships of acoustic factors to annoyance have been described (Moho , 1979). These relationships should serve as guidelines in the development and design of the space station. Acoustic factors that affect individual annoyance are sound level, frequency, duration, temporal pattern, and spectral complexity.
As the noise level increases, annoyance tends to increase. Noises beyond 80 dBA not only represent a potential hazard to hearing but also are more annoying. High-frequency noises tend to be more annoying than low frequencies. At equal sound pressure levels, noises in the 2,000 - 8,000 Hz range are most annoying. The effect of duration on annoyance depends on the noise level. In general, the longer the effective duration, the more annoying the noise. Noises with perceived individual tonal components tend to be more annoying than broad-band noises. Harmonic tonal complexes are less annoying than inharmonic complexes. Tonal components that “beat” are particularly annoying.
Fluctuating and intermittent noises are more annoying than continuous noises of equiv- alent sound energy. Annoyance produced by noises with time-varying sound levels can be reduced by maintaining an acceptable ambient sound background. Sudden impulsive noises and sounds with rapid rise times tend to be annoying. Sounds that are unexpected and irregular in occurrence tend to be distracting and more annoying than sounds that occur regularly and predictably. Psychological factors that affect individual annoyance are idiosyncratic and mainly involve feelings that the noise maker “doesn’t care” or is deliberately insensitive to the needs of coworkers for quiet and privacy.
Effects of Vibration
INTRODUCTION
There are no indications that would support the prediction that space station vibrations in the 1 to 100 Hz frequency range constitute a serious problem. There are no theoretical reasons or observations that would predict that reactions to and performance in vibration environments would be different in space than on earth (American National Standards Institute, 1980). The following assessment applies primarily to the frequency range 1 to 100 Hz. In the frequency range below 1 Hz, motion sickness symptoms, which are of a character quite different from the effects of higher-frequency vibration, become increasingly important. They are complicated primarily by the space adaptation syndrome and also by individual susceptibility and the relation between various sensory inputs. Above 100 Hz, symptoms become more and more localized and dependent on the specifics of the contact area. For these reasons, extrapolations to frequencies below 0.6 Hz and above 100 Hz can give very misleading results.
Since the space station is to be inhabited for work and rest for 90 days or more, it would appear that the same criteria as the ones used on earth for residential buildings and for work environments for different occupations and performance requirements should be valid (American National Standards Institute, 1983). There is, however, one big difference: under conditions of weightlessness, the coupling of the space crew to vibrating structures is different and hard to predict. It can vary from a crew member tightly coupled to a seat or structure by restraint, by foot restraints (suction or magnetic shoes to the “floor”), or by bracing against walls, to the free-floating, completely uncoupled condition. In the latter case, vibrations of the station would not be felt by the crew member. In the first case, the situation would be almost like on earth with only a minor change in the body’s response characteristic due to the weightlessness (von Gierke and Nixon, 1985; Vogt et al., 1968). Most of the situations will probably be somewhere in between these two extremes: the crew member is free-floating but is partly and for varying periods in contact with vibrating instrumentation or walls.
Assuming that during sleep and rest the crew is mostly decoupled from the walls, vibration levels for the space station will have to satisfy the performance capabilities required for the various experiments, tasks, and occupations. It is difficult to anticipate these task requirements without being told the most sensitive tasks or experimental conditions, particularly since i t must be assumed that for extremely sensitive tasks-visual observations of the earth’s surface or astronomical sightings-platforms specifically stabilized might be employed. In summary, such tasks should be analyzed individually and perhaps even simulated on earth to determine the vibration sensitivity of an operator-instrumentation system and the accuracy required. Data are available to determine the effects of vibration
22
23
on manual and visual performance when the relative motion between hand and control or eye and object are known. In the absence of specific task analysis, only general guidance with respect t o vibration not judged disturbing on earth for general living and working conditions can be proposed.
RECOMMENDATIONS
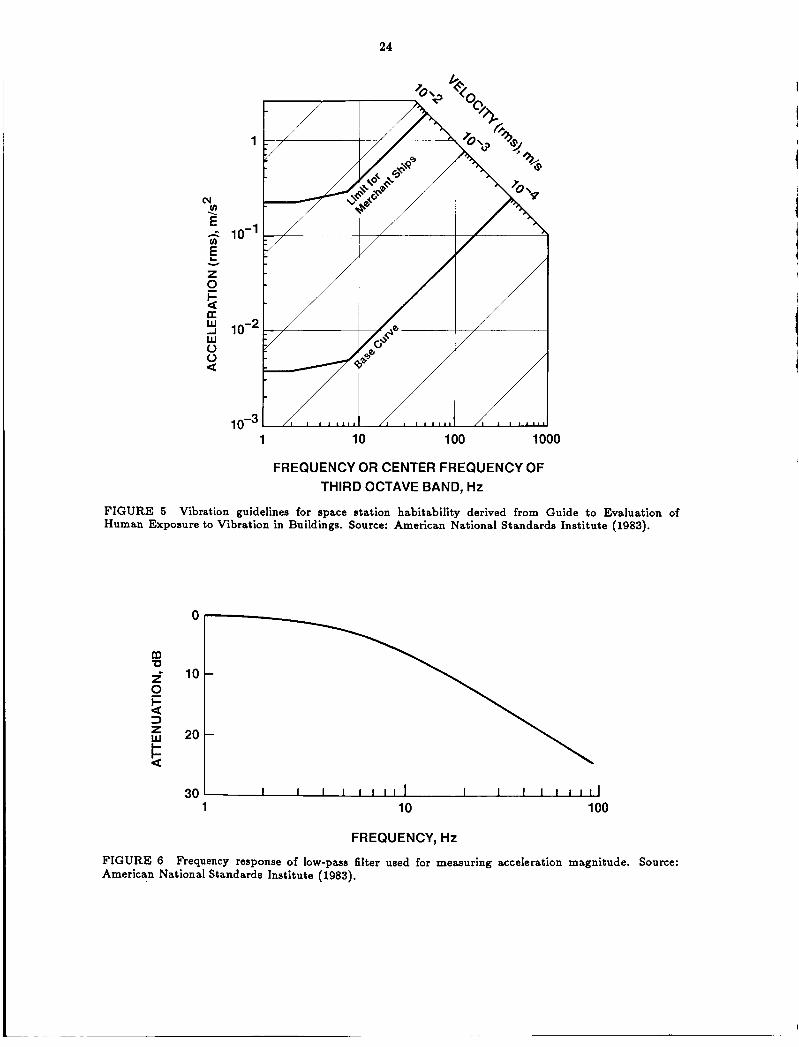
HABITABILITY It is proposed that the curves for exposure of humans to building vibrations be used as
general exposure guidelines for habitability. Although the frequency dependence for the 1 to 100 Hz range shown in Figure 5 is strictly valid only on earth under 1 g preload on the body and coupling to the vibrating surface, for the reasons discussed above i t is considered a reasonable (although conservative) approximation to the weightless condition. The curve is a compromise for exposure to vibration in all three linear axes, i.e., the position of the human with respect to vibration direction is unknown or changing with time. The lowest curve in Figure 5 is used on earth for critical working areas such as hospital surgery rooms or delicate assembly. For residential buildings, the curve is raised by a factor of 1.4 to 4, the lower value applying to nighttime exposure. For offices a factor of 4, and for shops a factor of 8 are proposed. The base curve shown in Figure 5 is below the threshold of perception for most subjects; the average threshold might have the same shape but start at 1 Hz at approximately 10-2m/sec2(10-Sg), i.e., by a factor of 3 higher. On merchant ships, vibration levels with 10 times higher values (10-’m/sec2) at 1 Hz are accepted without adverse comment (International Organization for Standardization, 1984) and the limit curve for sleeping quarters is raised by a factor of 60 compared with the base curve of Figure 5. Knowing that such levels are tolerated for several weeks without adverse comment or ill effects (but are not necessarily perceived as ‘comfortable’’), a curve between and 10-’m/sec2 rms is proposed for most permanently inhabited areas of a space station. For the frequency range below 1 Hz, constant sensitivity is frequently assumed to 0.63 Hz (International Organization for Standardization, 1984). However, below this frequency range, motion sickness symptoms become increasingly apparent in sensitive individuals. Although motion sickness is not simply related to the intensity, frequency, or duration of the provocative motion but depends on many other complicated factors such as individual susceptibility, visual input, and adaptation, the frequency range between 0.1 and 0.313 Hz is generally accepted as the frequency region of maximum susceptibility for longitudinal excitation. Vibrations in this frequency range are to be avoided. Motion sickness was observed in 10 percent of unscreened subjects (N = 306) exposed to 5 x 10⁻²m/sec2 at approximately 0.2 Hz. No motion sickness occurred at 2.5 x 10⁻²m/sec2 (O’Hanlon and McCauley, 1974).
In stating guidelines in terms of long-term rms values, a crest factor (peak to rms) of up to 6 is considered acceptable. This level might be assumed when including vibration from intermittently operated equipment and transients from crew motions and activities as part of the overall vibration environment.
TASK PERFORMANCE
With respect to hand manipulation/control F d vision, only very rough guidance can be given without detailed examination: (a) If head or finger control is required to an accuracy within 5 mm rms or 2.5 Newtons r m , the weighted acceleration magnitude (in any axis)
1
N v)
2 2 10-1 E
5
v)
v
z 0
K ; lo-* 0 0 a
1 o - ~ 1 10 100 1000
FREQUENCY OR CENTER FREQUENCY OF THIRD OCTAVE BAND, Hz
FIGURE 5 Human Exposure to Vibration in Buildings. Source: American National Standards Institute (1983).
Vibration guidelines for space station habitability derived from Guide to Evaluation of
I I I I I I l I l I I 1 I I I I I I
1 10 100
FREQUENCY, Hz
FIGURE 6 American National Standards Institute (1983).
Frequency response of low-pass filter used for measuring acceleration magnitude. Source:
25
should not exceed 5 x 10⁻³m/sec2. (The weighted acceleration is the acceleration between 1 and 100 Hz measured with a low-pass filter having a response of the inverse of Figure 5, shown in Figure 6). (b) To observe visual details that subtend less than 2 minutes of arc at the eye, the weighted acceleration magnitude should not exceed 5 x 10-sm/sec2. For every fi increase in the size of the detail, the vibration magnitude may be doubled. Depending on the performance capability necessary, these considerations might require reducing the vibration environment for some tasks and experiments to the order of or 10-4m/sec2. For an estimate of human performance capability/accuracy in these environments, the relative vibration at the human-object interface (and not only the vibration transmitted to the human) must be considered.
,
References
American National Standards Institute 1970
1980
1983
Method for the Calculation of the Articulation Index. ANSI S3.5-1969. New York: Acoustical Society of America. Guide for the Evaluation of Human Exposure to Whole-body Vibration. ANSI S.18-1979. New York: Acoustical Society of America. Guide to the Evaluation of Human Exposure to Vibration in Buildings. ANSI S.241983. New York: Acoustical Society of America.
Simple method for identifying acceptable noise exposure. J. Acoust. SOC. Am. 42:81@819.
Braida, L.D., Picheny, M.A., Cohen, J.R., Rabinowitz, W.M., and Perkell, J.S. Use of articulatory signals in automatic speech recognition. J. Acoust. SOC. Am. Suppl. 1 (80) :519.
Hearing and Noise in Industry. London: Her Majesty’s Stationery Office.
Cumulative effects of sleep restriction on daytime sleepiness. Psychophysiology 18 (2) : 107- 11 3.
Effect of a single interfering noise or speech source upon the binaural sentence intelligibility of aged persons. J. Acoust. SOC. Am. 74:739-743.
Effect of reverberation and noise on the intelligibility of sentences in cases of presbycusis. J. Acoust. SOC. A m . 68:537-544.
Noise and sleep: Information needs for noise control. In J.V. Tobias, G. Jansen, and W.D. Ward, eds., Noise as a Public Health Problem. ASHA Reports 10:442- 447. Rockville, Md.: American Speech and Hearing Association.
Effects of room reverberation and noise on speech discrimination by the elderly. Audiology 24:319-324.
RASTI Measurements: Demonstration of Different Applications. Bruel and Kjaer Application Notes 1-11. Bruel and Kjaer Instruments, Marlborough, Mass.
The modulation transfer function in room acoustics as a predictor of speech intelligibility. Acustica 28:66-73.
Botsford, J.H. 1967
1986
Burns, W., and Robinson, D.W.
Carskadon, M.A., and Dement, W.C. 1970
1983
Duquesnoy, A.J. 1983
Duquesnoy, A.J., and Plomp, R. 1980
Goldstein, J., and Lukas, J. 1980
Harris, R.W., and Reitz, M.L. 1985
Horall, T.R., and Jacobsen, T. 1985
Houtgast, T., and Steeneken, H.J.M. 1973
26
27
1984
1985
A multi-language evalution of the RASTI-method for estimating speech intelligi- bility in auditoria. Acustica 54:185199. A review of the MTF concept in room acoustics and its use for estimating speech intelligibility in auditoria. J. Acoust. SOC. A m . 77:1069-1077.
Predicting speech intelligibility in rooms from the modulation transfer function. I. General room acoustics. Acustica 4650-72.
Report on the RASTI Method for the Objective Rating of Speech Intelligibility in Auditoria. Draft IEC Publication 268: Sound System Equipment - Part 16. Geneva, Switzerland: International Electro-technical Commission.
Acoustics - Determination of Occupational Noise Exposure and Estimation of
Houtgast, T., Steeneken, H.J.M., and Plomp, R. 1980
International Electro-technical Commission 1984
International Organization for Standardization 1982
1984
Johnson, 1973
1978
Johnson, 1973
Noise-Induced Hearing Impairment.- Draft ISO/DIS 1999. Geneva, Switzerland: ISO. Evaluation of Human Exposure to Whole-body Vibration - Part 4: Evaluation of Crew Exposure to Vibration on Board Sea-going Ships (1-80 Hz). IS0 2631/4. Geneva, Switzerland: ISO. D.L. Prediction of NIPTS Due to Continuous Noise Exposure. Aerospace Medical Research Laboratory AMRGTR-73-91. Wright-Patterson Air Force Base, Ohio. Derivation of Presbycusis and Noise Induced Permanent Threshold Shift (NIPTS) to be Used for the Basis of a Standard on the Effects of Noise on Hearing. Aerospace Medical Research Laboratory AMRL-TR-78-128. Wright-Patterson Air Force Base, Ohio. L.C., and MacLeod, W.L. Sleep and awake behavior during gradual sleep reduction. Perceptual and Motor skills 36:a7-97.
Kono, S., Sone, T., and Nimura, T.
Lukas, J.S. 1982
1975
Personal reaction to daily noise exposure. Noise Control Engineering 19:4-16.
Noise and sleep: A literature review and a proposed criterion for assessing effect. J . Acouat. SOC. Am. 58(6):1232-1242.
Melnick, W. 1979 Hearing loss from noise exposure. Chapter 9 in C.M. Harris, ed., Handbook of
Noise Control. New York: McGraw-Hill.
Effects of noise on people. J. Acoust. SOC. A m . 3:729-763.
Temporary threshold shifts produced by wide-band noise. J. Acoust. SOC. Am. 70: 390-396.
Temporary threshold shifts in humans exposed to octave-bands of noise for 16-24 hours. J. Acoust. SOC. Am. 65:1238-1248.
Temporary changes of the auditory system due to exposure to noise for one or two days. J. Acoust. SOC. Am. 48:524-530.
Miller, J.D.
Mills, J.H., Adkins, W.Y., and Gilbert, R.M. 1974
1981
Mills, J.H. Gilbert, R.M., and Adkins, W.Y. 1979
Mills, J.H., Gengel, R., Watson, C.S. and Miller, J.D. 1970
28
Molino, J.A. 1979 Annoyance and noise. Chapter 17 in C.M. Harris, ed., Handbook of Noise Control.
New York: McGraw-Hill.
The Efects of Time-varying Noise on Speech Intelligibility Indoors. Committee on Hearing, Bioacoustics and Biomechanics, Commission on Behavioral and Social Sciences and Education. Washington, D.C.: National Academy Press. Degraded speech. Part VI11 in Speech Understanding and Aging. Committee on Hearing, Bioacoustics, and Biomechanics, Commission on Behavioral and Social Sciences and Education. Washington, D.C.: National Academy Press. Forthcom- ing.
Motion sickness incidence as a function of the frequency and the acceleration of the vertical sinusoidal motion. J. Aerospace and Environmental Medicine 45(4):366- 369.
Passchier-Vermeer , W. Hearing loss due to continuous exposure to steady-state broad-band noise. J. Acoust. SOC. A m . 56:1585-1593.
Speech Levels in Various Noise Environments. EPA-600/1-77-025. Washington,
National Research Council 1981
1987
O’Hanlon, J.F., and McCauley, M.E. 1974
1974
Pearsons, K.S., Bennett, R., and Fidell, S. 1977
’ D.C.: U.S. Environmental Protection Agency. Pisoni, D.B., Nusbaum, H.C., and Greene, B.G.
1985 Perception of synthetic speech generated by rule. Proceedings of IEEE 73( 11):1665- 1676.
Tables for Estimation of Noise-induced Hearing Loss. Report AC 61. Middlesex, England: National Physical Laboratory.
Communications Requirements. NAVSHIPS Report 0900-072-2010.
Hearing distribution in a population that has suffered hearing loss. J. Acoust. SOC. A m . 61:887-888.
Effects of long-term exposure to tone pulse noise on human sleep. Psychophysiology 10:364376.
Proposed requirements for occupational noise exposure. Occupational Safety and Health Administration, U.S. Department of Labor. Federal Register 39:207; 37773. Occupational Noise Exposure; Hearing Conservation Amendment. Occupational Safety and Health Administration, U.S. Department of Labor. Federal Register 46:ll; 4161.
Information on Levels of Environmental Noise Requisite to Protect Public Health and Welfare with an Adequate Margin of Safety. EPA report 55019-74-004.
Physiological and psychosociological assessment of sleep disturbances by aircraft noise [translation]. Trav. Hurnain 45:155-168.
Robinson, D. W ., and Shipton, M.S. 1977
Shipboard Aviation Maintenance Communications
Thiessen, G.J. 1972
1977
Townsend, R.E., Johnson, L.C., and Muzet, A. 1973
U.S. Department of Labor 1974
1981
U.S. Environmental Protection Agency 1974
Vallet, M., and Francois, J. 1982
29
t
Vogt, H.L., Coermann, R.R., and h s t , H.D. 1968 Mechanical impedance of the sitting human under sustained acceleration. Aero-
space Med. 39:675-679.
Vibration, noise and communication. In R. Dehart, ed., Fundamentals in Aero- space Medicine. Philadelphia: Lea and Febiger.
Effective quiet and moderate TTS: Implications for noise exposure standards. J. Acoust. SOC. A m . 59:160-165.
Selective and partial deprivation of sleep. Pp. 176-184 in W.P. Koella and P. Levin, eds., Sleep. Basel, Switzerland: Karger.
Noise and communication. Pp. 185-220 in D.M. Jones and A.J. Chapman, eds., Noise and Society. London: John Wiley and Sons.
Effects of sleep deprivation on performance and muscle tension. Pp. 329-336 in G.E.W. Wolstenholme and M. O’Connor, eds., The Nature of Sleep. Boston: Little, Brown and Co.
The problem of defining depth of sleep. Pp. 277-287 in S.S. Kety, E.V. Evarts, and H.L. Williams, eds., Sleep and Altered States of Consciousness. Baltimore: Williams and Wilkins. Information processing during sleep. Pp. 3642 in W.P. Koella and P. Levin, eds., Sleep. Basel, Switzerland: Karger.
Human Response to Vibrotactile Environments of Space Vehicles. NASA Technical Memorandum 86316. Hampton, VA: National Aeronautics and Space Adminis- tration, Langley Research Center.
von Gierke, H.E., and Nixon, C. W. 1985
Ward, W.D., Cushing, E.M., and Burns, E.M. 1976
Webb, W.B. 1973
Webster, J.C. 1984
Wilkinson, R.T. 1961
Williams, H.L. 1966
1973
Wilshire, K.F. 1984
Glossary
Term
Articulation index
Abbreviation or symbol Definition
AI A calculated measure that weights the difference between the speech signal and the background masking noise in an effort to estimate the proportion of normal speech signal that is available to a listener for communication purposes. The results for AI range from 0 to 1.0 where 1.0 is equated with 100 percent intelligibility.
A-weighted sound level LA
Equivalent sound level Le,
Noise criterion curves NC
Sound pressure level modified to deemphasize the low-frequency portions of sounds. It is one of several such weightings (A, B, C, D) found on a sound level meter, and it attempts to approximate the response of the human ear to sound. The unit of A-weighted sound level is the decibel and usually is designated as dBA.
The level of the A-weighted sound pressure when squared and averaged over some specific period of time. Leg* refers to equivalent sound level for 8 hours. Leq24 refers to the equivalent sound level for 24 hours.
Sets of octave band levels established to provide a single number rating for octave band noise spectra.
30
Noise exposure
Noise-induced permanent NIPTS threshold shift
Noise-induced temporary NITTS threshold shift
Reverberation Time T
Signal-to-noise ratio
Sound pressure level SPL
Speech Transmission Index STI
The cumulative acoustic stimulation reaching the ear of a person over a specified period of time (e.g., a work shift, a day, a working life, a lifetime).
Permanent threshold shift caused by noise exposure, corrected for the effect of aging (presbycusis).
Temporary threshold shift caused by noise exposure.
Time for the sound level within an enclosed space to decay 60 dB after cessation of a sound source.
The ratio of the signal energy to the background noise energy. It is usually reported in the number of decibels by which the signal exceeds the noise.
A logarithmic measure (in decibels) of the ratio of a sound pressure (P) relative to an explicitly stated reference sound pressure ( Pref). A widely used Pref, approximately equal to the human hearing threshold, is 20 u Pascals (0.00002 Newtons/meter) and is related to P according to the following formula: sPL(i, db) = 20 Log &. An index ranging from 0 to 1 indicating the quality of a speech communication channel. The index incorporates effects of speech signal strength, background noise, and room reverberation, and it can be predicted (given S/N and T) or measured objectively.
31
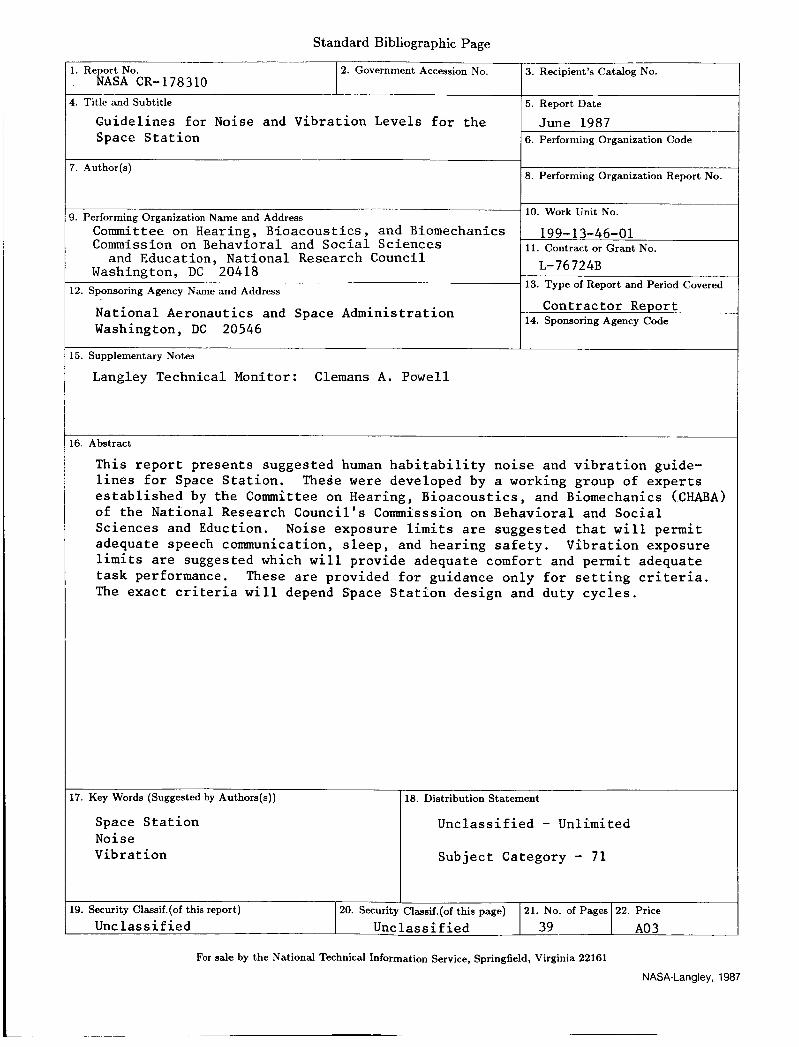
Standard Bibliographic Page
.. Report No. NASA CR-178310
2. Government Accession NO.
'. Author(s)
7. Key Words (Suggested by Authors(s))
I. Performing Organization Name and Address Committee on Hearing, Bioacoustics, and Biomechanics Commission on Behavioral and Social Sciences and Education, National Research Council
Washington, DC 20418 2. Sponsoring Agency Name and Address
18. Distribution Statement
National Aeronautics and Space Administration Washington, DC 20546
9. Security Classif.(of this report) Unclassified
3. Recipient'sCatalog No.
20. Security Classif.(of this page) 21. No. of Pages 22. Price
Unclassified 39 A0 3
5 . Report Date
June 1987 6. Performing Organization Code
8. Performing Organization Report No.
10. Work Unit No.
199-13-46-01 11. Contract or Grant No.
L- 76 72 4B 13. Type of Report and Period Covered
Contractor Report 14. Sponsoring Agency Code
5. Supplementary Notes
Langley Technical Monitor: Clemans A. Powell
6. Abstract
This report presents suggested human habitability noise and vibration guide- lines for Space Station. TheSe were developed by a working group of experts established by the Committee on Hearing, Bioacoustics, and Biomechanics (CHABA) of the National Research Council's Commisssion on Behavioral and Social Sciences and Eduction. Noise exposure limits are suggested that will permit adequate speech communication, sleep, and hearing safety. Vibration exposure limits are suggested which will provide adequate comfort and permit adequate task performance. These are provided for guidance only for setting criteria. The exact criteria will depend Space Station design and duty cycles.
Space Station Noise Vibration
Unclassified - Unlimited
Subject Category - 71
For sale by the National Technical Information Service, Springfield, Virginia 22161
NASA-Langley, 1987