Embed Size (px)
Citation preview
GUIDELINES FOR MEASURING CULTURAL PARTICIPATION
By Adolfo Morrone
UNESCO Institute for Statistics December 2006
UNESCO Institute for Statistics P.O. Box 6128 Succursale Centre-Ville Montreal, Quebec H3C 3J7 Canada Tel: (1 514) 343-6880 Fax: (1 514) 343-5740 Email: [email protected] http://www.uis.unesco.org © UNESCO-UIS 2006 Ref: UIS/TD/06-02 ISBN: 978-92-9189-059-0
The author is responsible for the choice and the presentation of facts in this concept paper and for the opinions expressed therein, which are not necessarily those of UNESCO and do not commit the Organization.
- 3 -
Table of contents Page 1. Measuring cultural participation in western countries ............................................5
1.1 Measuring cultural participation in Europe .................................................5 1.1.1 Cultural domains ............................................................................5 1.1.2 Types of cultural participation.........................................................6 1.1.3 Eurobarometer surveys ..................................................................7
1.1.3.1 Main indicators ................................................................9 1.1.3.2 Methodology ..................................................................10
1.1.4 Evaluation of Eurobarometer surveys ..........................................11 1.2 Measuring cultural participation of ethnic minorities in
western countries .....................................................................................11 1.2.1 Introduction...................................................................................11 1.2.2 Limits and perspectives of the existing experience ......................12 1.2.3 Conclusion....................................................................................16
2. Measuring cultural participation in non-western countries: Case studies ............18 2.1 Bhutan......................................................................................................18
2.1.1 The statistical system of Bhutan...................................................18 2.1.2 Statistics on cultural industries .....................................................21
2.2 Thailand ...................................................................................................22 2.2.1 The NSO data collection on cultural participation ........................22
2.2.1.1 Cultural Participation Activities Survey ..........................23 2.2.1.2 Time use survey ............................................................24 2.2.1.3 Conclusions ...................................................................26
2.3 The Uganda’s framework for culture statistics .........................................26 2.3.1 Background ..................................................................................26 2.3.2 Cultural domains ..........................................................................27 2.3.3 Measuring cultural participation in Uganda ..................................27
2.4 Supporting interest for cultural participation statistics ..............................28
3. Guidelines for measuring cultural participation ....................................................30 3.1 Toward a definition of cultural participation..............................................30 3.2 A revision of the European framework .....................................................32 3.3 Main information.......................................................................................35 3.4 Survey methodology ................................................................................36
3.4.1 Definition of population.................................................................37 3.4.2 Reference period..........................................................................37 3.4.3 Method of data collection .............................................................38 3.4.4 Sampling design...........................................................................38 3.4.5 Sample size..................................................................................39 3.4.6 Measurement errors .....................................................................39
References ...................................................................................................................41 Appendix A: Samples specifications of the Eurobarometer surveys ............................43 Appendix B: Main information collected by the Eurobarometer surveys ......................44 Appendix C: Main indicators on cultural participation in Europe...................................45 Appendix D: Data on Mäori cultural activity ..................................................................46

- 5 -
1. MEASURING CULTURAL PARTICIPATION IN WESTERN COUNTRIES
1.1 Measuring cultural participation in Europe
The leadership group on cultural statistics (LEG-Culture) was set up by the Statistical Programme Committee in March 1997 in response to a request from Member States with a mandate for building up a system of coherent and comparable information at EU level that could contribute to a better understanding of the links between culture and socio-economic development.
Member States asked to work in this area because of the lack of cultural statistics at EU level that was raised in various international fora (Paris, June 1995; Madrid, October 1995; and Urbino, May 1996) since 1995.
As a follow-up to these meetings of national experts in cultural statistics, the Council adopted, on 20 November 1995, a resolution on the promotion of statistics on culture and economic growth. This called on the Commission, in close co-operation with Member States, "to ensure that better use is made of existing statistical resources and that work on compiling cultural statistics proceeds smoothly".
In response to a request from Member States, namely Italy and France, the leadership group on cultural statistics (in the following LEG) was set up by the Statistical Programme Committee in March 1997. Financial support was guaranteed by the then Directorate-General XXII of the European Commission (currently DG Education and Culture). The LEG was given the status of a three-year pilot project with a mandate for building up, at EU level, a system of coherent and comparable information that could contribute to a better understanding of the links between culture and socio-economic development.
The LEG produced its final report in 1999 (European Commission, 2004a) presenting the approach followed, the main results and conclusions of the work done during the three years.
Even though in November 1999 the Statistical Programme Committee has adopted the conclusions and recommendations of the LEG, harmonised information in the Member States is still lacking. Up to now, each Member State uses different types of surveys with different periodicities to collect data on this domain and the objective to have yearly harmonised data at EU level is still far from being achieved.
To date, the only source of harmonised data on Europeans’ cultural involvement and their participation in different cultural activities are two Eurobarometer surveys carried out in 2001 and 2003 at request of the European Commission.
1.1.1 Cultural domains
The task of the LEG was not easy. The necessity to define a common basic framework entered into immediate conflict (at the theoretical level) with the inherent complexity of the subject and (at the practical level) with methods, traditions and interests that differed according to each of the participating countries.
- 6 -
The obvious starting point was the Framework devised by UNESCO in 1986 which proposed a classification of the categories to be considered when producing cultural statistics.
The LEG modified this framework. The inclusion or exclusion of certain areas in the LEG's common field was only partly a matter of theory. The first target was to select real cultural domains which could be not only analysed and compared but, more importantly, inserted into an operational framework which national and European policymakers could use immediately.
The modifications of the UNESCO framework thus resulted, firstly, from a practical choice and, secondly, from an effort to adapt the new conceptual framework to a fast-changing situation, at the same time trying to preserve a degree of compatibility among the interests of the different countries.
The revision of the UNESCO categories thus obeyed the need for consensus. Sport, environment, advertising, fashion, languages and games were excluded; visual arts were grouped together into a single visual arts category; and new domains such as architecture and new media were introduced.
Eight domains were chosen to act as a reference frame for the LEG’s work: 1. Artistic and monumental heritage:
o Historical monuments o Museums o Archaeological sites o Other heritage
2. Archives 3. Libraries 4. Books and press:
o Books o Newspapers and periodicals
5. Visual arts: o Visual arts (incl. design) o Photography o Multidisciplinary
6. Architecture 7. Performing arts:
o Music o Dance o Music theatre o Drama theatre o Multidisciplinary o Other (circus, pantomime, etc.)
8. Audio and visual media/multimedia: o Film o Radio o Television o Video o Audio records o Multimedia
1.1.2 Types of cultural participation
In the cultural domains defined above, three fundamental types of participation behaviours are identified:
• attending/receiving • performance/production by amateurs • interaction
“Attending/receiving“ occurs when there is a communicational process between external sources of information and a receiving subject. From a statistical point of view, it is useless to try to distinguish between an “active“ or “passive“ attending/receiving. This is a
- 7 -
psychological and motivational problem that is out of the aims and possibilities of a statistical approach to participation in cultural activities.
“Performance/production by amateurs“ involves subjects that build up or create material or nonmaterial cultural products, either for an audience or for a private pleasure or aim, either in organized or in not organized context (for example musical or theatre performances, handicraft, but also amateur activities that are very widely disseminated among people). Professional practices are excluded here.
The “interaction“ process is defined as a continuous feedback flow of communication between an external source and a receiving subject. The information and communication technologies are an example of interactive cultural participation. Through these technologies, the receiving subject is able to re-elaborate the messages and send them in a new form to the original source, building a new form of dialogue totally absent in traditional media. So, although we can say that in every kind of attending and reception of messages there is interaction, we face a new concept of interaction, a concept that puts in light a higher level of possibility for the receiving subject to change the forms and the contents of the material received from the source. Reading a book involves interaction in the reader's mind but not on the book while, when multimedia products are used, there is a new form of interaction, due to the fact that the receiving subject can change what s/he is reading, seeing, receiving.
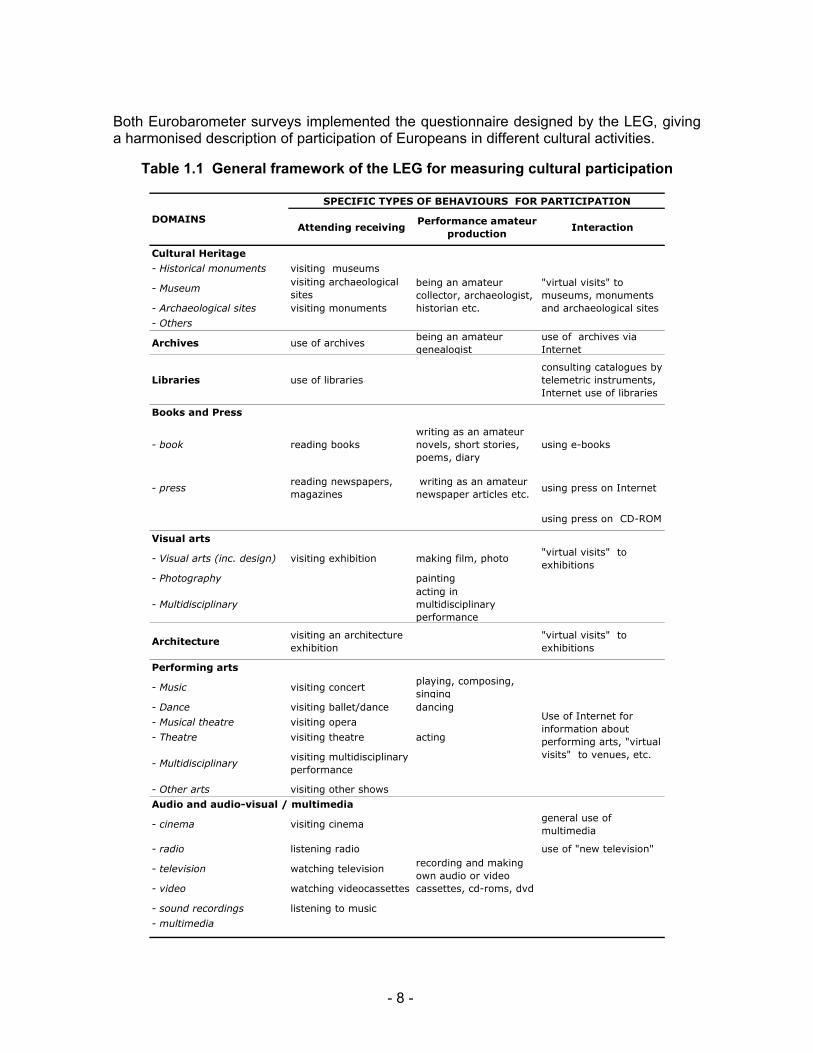
The LEG proposed a general framework (see Table 1.1) – crossing the eight cultural domains with the three specific types of participation – to be used as a guideline to design a harmonised set of questions and of indicators for measuring cultural participation in Europe.
1.1.3 Eurobarometer surveys
To collect harmonised data on Europeans’ participation in cultural activities and to experiment the applicability of the results of the LEG, the European Commission asked Eurobarometer to carry out two surveys implementing the list of questions and indicators designed using the framework of the LEG.
The first survey (in the following EU 56.0) was carried out during September 2001 at request of Eurostat by the European Opinion Research Group, a consortium between INRA (EUROPE) and GfK Worldwide, and was addressed to all EU countries. The results of this experiment have been published in April 20021.
The second survey (in the following EU 2003.1) – addressed to candidate countries – was carried out during the early spring of 2003 by the Gallup Organization Hungary at the joint request of the European Commission Directorate General for Press and Communication and Directorate General for Education and Culture.
The results of both these surveys are available on the Eurostat Education, Training and Culture statistics CIRCA site at the address: http://forum.europa.eu.int/Public/irc/dsis/edtcs/library?l=/public/culture/eurobarometerssurveysons
1 Eurobarometer (EB56.0), "Executive Summary: Europeans’ participation in cultural activities". Available at:
http://europa.eu.int/comm/public_opinion/archives/eb_special.htm.
- 8 -
Both Eurobarometer surveys implemented the questionnaire designed by the LEG, giving a harmonised description of participation of Europeans in different cultural activities.
Table 1.1 General framework of the LEG for measuring cultural participation
SPECIFIC TYPES OF BEHAVIOURS FOR PARTICIPATION
Attending receivingPerformance amateur
productionInteraction
Cultural Heritage
- Historical monuments visiting museums
- Museumvisiting archaeological sites
- Archaeological sites visiting monuments
- Others
Archives use of archivesbeing an amateur genealogist
use of archives via Internet
Libraries use of librariesconsulting catalogues by telemetric instruments, Internet use of libraries
Books and Press
- book reading bookswriting as an amateur novels, short stories, poems, diary
using e-books
- pressreading newspapers, magazines
writing as an amateur newspaper articles etc.
using press on Internet
using press on CD-ROM
Visual arts
- Visual arts (inc. design) visiting exhibition making film, photo"virtual visits" to exhibitions
- Photography painting
- Multidisciplinary acting in multidisciplinary performance
Architecturevisiting an architecture exhibition
"virtual visits" to exhibitions
Performing arts
- Music visiting concertplaying, composing, singing
- Dance visiting ballet/dance dancing
- Musical theatre visiting opera
- Theatre visiting theatre acting
- Multidisciplinaryvisiting multidisciplinary performance
- Other arts visiting other shows
Audio and audio-visual / multimedia
- cinema visiting cinemageneral use of multimedia
- radio listening radio use of "new television"
- television watching television
- video watching videocassettes
- sound recordings listening to music
- multimedia
DOMAINS
being an amateur collector, archaeologist, historian etc.
"virtual visits" to museums, monuments and archaeological sites
Use of Internet for information about performing arts, "virtual visits" to venues, etc.
recording and making own audio or video cassettes, cd-roms, dvd
- 9 -
1.1.3.1 Main indicators
The Eurobarometer surveys cover the population aged 15 years and over living in each Member State and Candidate Country. The questionnaire implemented the conclusions of the LEG, collecting information on the following domains2:
• possession of various objects and equipment of cultural relevance; • television; • radio; • computer and Internet usage; • reading habits; • music and concerts; • cultural activities; • artistic activities.
These surveys are designed to give – for each indicator – a separate estimation for each country and to calculate the Member States average (EU-15 average) and the average for Candidate Countries (CC-13 average).
For EU-15 average and CC-13 average, it is also possible to breakdown each indicator for the following demographic variables:
• Gender • Age bands (15-24, 25-39, 40-54, 55+) • Terminal education age
o respondents who left school at age 15 or younger o respondents who left school at ages 16 to 19 o respondents who stayed in school until they were aged 20 or older
• Main economic activity scale o Self-employed o Managers o Other white-collars o Manual workers o House persons o Unemployed o Retired o Still studying
• Size of locality o Rural area or village o Small- or middle-sized o Large town
The possibility to go in depth in the analysis of the socio-demographic differences is very important in order to understand the factors that influence participation in cultural activities.
2 See Appendix B for details on the information collected.
- 10 -
One of the biggest limits of the Eurobarometer surveys is in fact that the analysis of the socio-demographic differences is possible only at the level of EU-15 and CC-13 average. Due to the small sample sizes (see Appendix A for details), it is impossible to breakdown for socio-demographic variables an indicator for a specific country. For example, we can measure the differences between Internet usage of male and female in EU-15, but we cannot conclude in which country there are the biggest gender differences.
1.1.3.2 Methodology
The two Eurobarometer surveys on Europeans’ participation in cultural activities were carried out with an identical methodology.
These surveys cover citizens of each of the Member States (EU 56.0) and Candidate Countries (EU 2003.1) aged 15 and over.
The basic sample design applied is a multi-stage, random (probability) one. In each country, a number of sampling points were drawn with probability proportional to population size (for a total coverage of the country) and to population density.
For doing so, the points were drawn systematically from each of the "administrative regional units", after stratification by individual unit and type of area. They, thus, represent the whole territory of the Member States and Candidate Countries Region, according to the Eurostat NUTS 2 or equivalent regions and according to the distribution of the resident population of the respective nationalities in terms of metropolitan, urban and rural areas. In each of the selected sampling points, a starting address was selected at random. Further addresses were selected as every Nth address by standard random route procedures, from the initial address. In each household, the respondent was selected at random.
All interviews were face-to-face in people's home and in the appropriate national language. In countries with significant minorities, the respondents had a chance to respond in their mother tongue (for example in Estonia, Latvia and Lithuania in Russian, and in Romania in Hungarian).
For each country a comparison between the sample and the Universe was carried out. The Universe description was derived from population data from Eurostat for Member States and from national statistics for Candidate Countries.
For all countries a weighting procedure, using marginal and intercellular weighting, was carried out, based on this Universe description. This iteration procedure takes into account, for all countries, gender, age, region NUTS 2, settlement size, household size, and education level. For EU-15 average, INRA (EUROPE) applies the official population figures as provided by Eurostat; for CC-13 averages, Gallup applies the official population figures as provided by national statistics3.
3 See Appendix A for the total population figures used in the post-weighting procedure.
- 11 -
1.1.4 Evaluation of Eurobarometer surveys
Eurobarometer surveys have the advantage of being very flexible tools and giving harmonised results in a very short period of time. They represent an important starting point for further development.
These surveys were very useful to test the applicability of the questionnaire and the usefulness of the policy designed by the LEG. Moreover, the fact that the LEG questionnaire on cultural participation has been translated and is now available in all the different languages of the Member States and Candidate Countries represents a very important know-how for further experiments.
Nevertheless, the use of Eurobarometer surveys to collect data on cultural participation in Europe presents some problems. The Italian results from the Eurobarometer survey were compared with those produced by an official survey carried out by Istat showing that Italian data from the Eurobarometer survey were systematically higher than those of the Istat survey. The differences were caused mainly by the fact that in the Eurobarometer sample there was a higher percentage of young high-educated people with respect to the Istat sample that biases positively all indicators of cultural participation (European Commission, 2004b).
This problem is probably due to the fact that Eurobarometer fixes the sample size à priori and substitutes all individuals that refuse the interview, thus provoking an auto-selection of respondents. Elderly low-educated people – that more easily refuse an interview on cultural habits – are substituted with young high-educated people that have higher levels of cultural participation.
This and other methodological aspects should be investigated more in depth.
On the other hand, the questionnaire designed by the LEG and adopted by Eurobarometer is too centred on a European concept of cultural participation. To extend the measurement of this phenomenon to developing countries, it is necessary to reflect on the cultural domains that should be considered.
The core set of harmonised indicators identified by the LEG excludes important domains like sport, games, recreational activities and crafts.
1.2 Measuring cultural participation of ethnic minorities in western countries
1.2.1 Introduction
Since the 1960s, an interest for cultural participation has been associated with a notion that could be defined as an “ideology of democratization” (Provonost, 2202, 2). In this sense, cultural statistics cannot be considered as a perceptive, neutral or purely scientific interest. They would rather meet the requirement to single out eventual discriminations in cultural access, as well as suggest to public policy authorities means to eliminate those discriminations.
- 12 -
With this end in view, two noticeably different study approaches became firmly established: one of them focused mainly on cultural consumption, the so-called “elite” (visiting museums, classic music concerts, etc.) and the other aimed at expanding the concept of cultural consumption through including different forms of culture as compared to those traditional ones (ibid, 3).
Lately the nations of the first world have come to know forms and levels of multi-culture and multi-ethnicity that previous generations could not even imagine. During the post-war period, the subject of pluralism as well as that of the respect towards cultural diversities, was considered based on an international rather than intra-national approach (Stenou, 2004). In other words, the relationship between different cultures was an aspect of relations between different states, that, both from political and socio-cultural points of view, were conceptualized as units, regardless of their inner diversity. Major social transformations associated with complex trajectories of migratory fluxes exposed this initial statement to crisis having shifted the focus from tolerance between societies to the tolerance inside them (even more faceted and multi-ethnic).
In this new situation compliance with the tendency that stirred up the first surveys on cultural consumptions (ideology of democratization) would mean in-depth studies on cultural participation of ethnic minorities firmly settled in western countries.
1.2.2 Limits and perspectives of the existing experience
As far as defining the cultural consumption concept, the requirement could be met through adequate adoption of the second above-stated approach, i.e. through inclusion in the concept of cultural consumption the forms of culture alternative to traditional ones. Emphasis on cultural participation with limited attention to typically western forms of culture could actually result in systematic understatement of the importance of culture in daily life of those belonging to societies with living conditions and cultural traditions differing to a great extent from ours. Under the circumstances, redefining cultural participation as a survey problem would involve re-molding the classification both of cultural activities and possible forms of participation (Glade, 2003; Madden, 2004).
However, consideration of the subject of ethnic differences in cultural participation survey does not merely mean inclusion of cultural activities different from those traditional ones. An ulterior trend of interest is constituted by the analysis of the ethnic group as a social and demographic factor of different levels and forms of cultural participation.
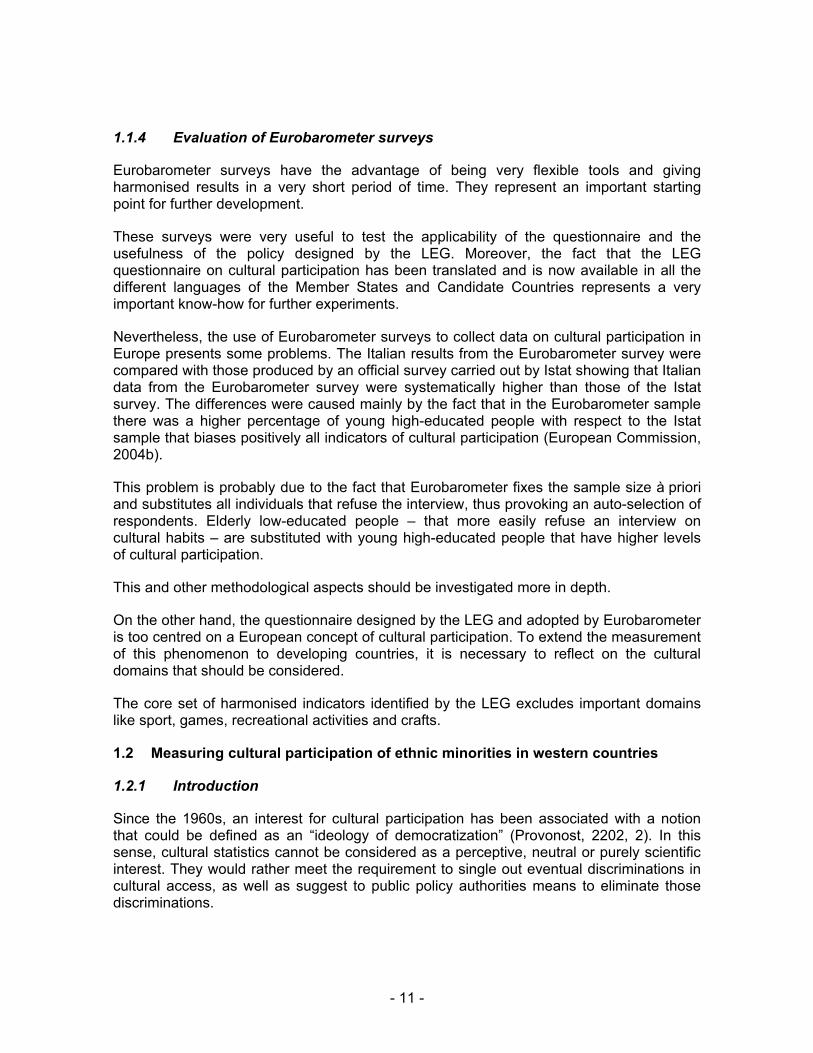
From this point of view, the experience of New Zealand could serve as a model. In the Cultural Experience Survey of 2002, the National Institute of Statistics of New Zealand pieced together information on cultural experience of citizens having added to traditional activities like reading, TV watching or going to concerts of various types a detailed list of cultural activities typical of Mäori culture. In the presentation of results, the participation rate of New Zealanders in those activities was aggregated in the category “Ethnic cultural activities” and systematically cross-tabulated with the main social and demographical characteristics of interviewees. For a detailed review of the results of these analyses, see Ongley (2003); we can observe that the interest shown in New Zealand for cultural activities identified as “ethnic” is spread almost like the interest for opera or musical and theatre plays. Thus, the case in point is that the ethnic cultural participation is drawing attention of social scientists (see Figure 1).
- 13 -
Figure 1.1 Adults experiencing most popular cultural activities (000's)
0
200
400
600
800
1000
1200
1400
Art galleries,museums
Popular livemusic
Purchasinghandmade
craft
Theatre Historicplaces
Opera,musicaltheatre
Marae Ethnicculturalactivity
Source: Ongley, 2003.
While exploring another way of studying ethnic groups and culture, a relation was established between ethnic affiliation of individuals and certain cultural participation patterns to analyse an extent of assimilation by minorities with trends proper for dominant ethnic groups, single out eventual discriminations in the access to cultural activities, as well as to reshape the causes of such discriminations, e.g. it was proved that low cultural participation level of Mäori is due to the lack of time firstly and only in the second place could be explained by the lack of information or insufficient geographical distribution of cultural activity centers (ibid, 12).
Cohabitation of different ethnic groups is one of the core features of the United States society. Therefore, it is quite likely for U.S. official statistics to systematically use ethnic group affiliation as a fundamental category for demographical and social analyses. On the website of the U.S. Census Bureau, a number of web pages could be found with in-depth statistical analyses on Hispanics, Afro-Americans, population of Asian origin, natives of Hawaii or other islands in the Pacific ocean, native Americans, etc4. For all of these communities, data relevant to territorial distribution, economic conditions and other specifically social aspects have been produced. Reviewed social characteristics cover a very heterogeneous group of themes like age structure, fertility, education, health, territorial mobility and voting. However, there is no specific reference to cultural participation within this wide range of subjects.
As compared to activities carried out in the United States, Canada shows great interest in the subject of cultural participation of ethnic minorities. The National Institute of Statistics in Canada has been producing two periodicals: Canadian Culture in Perspective: A Statistical Overview and Focus on Culture where monographs based on data from the Culture Statistics Program are published. Up to date, this program has been mainly focused on creation of culture rather than on cultural participation. It is possible to come across interesting references and analyses on cultural participation taking into account some different ethnic affiliations especially in Canadian Culture in Perspective.
4 See http://www.census.gov/pubinfo/www/hotlinks.html
- 14 -
However, these studies seem a specific manifestation of a general sensitivity to the subject of ethnic affiliation. In 2004, the Canadian Institute of Statistics arranged a symposium dedicated to perspectives and challenges posed by statistical surveys on ethnic minorities (Bizier, Kaddatz and Laroche, 2004).
In the meantime, what is happening in Europe? With the exception of official British statistics, the situation is everything but comforting. There could be found a notable interest of British scientists towards the role of ethnic affiliation in determining the forms and levels of cultural participation. In July 2003, the National Institute of Statistics in Great Britain published a preliminary analysis of data collected as a result of the Time Use Survey of 2000 (Sturgis and Jackson, 2003). Potential affiliation to an ethnic minority was included (alongside with traditional social and demographical variables) in a logistic regression model tending to single out factors that have a major effect on intensity of cultural participation. It could be noticed that specific ethnic group of affiliation were not considered in this analysis: only the generic belonging to any of ethnic group of minority was spotted. (ibid, 13). Multivariable analysis emphasised that ethnicity did not noticeably affect the levels of cultural participation.
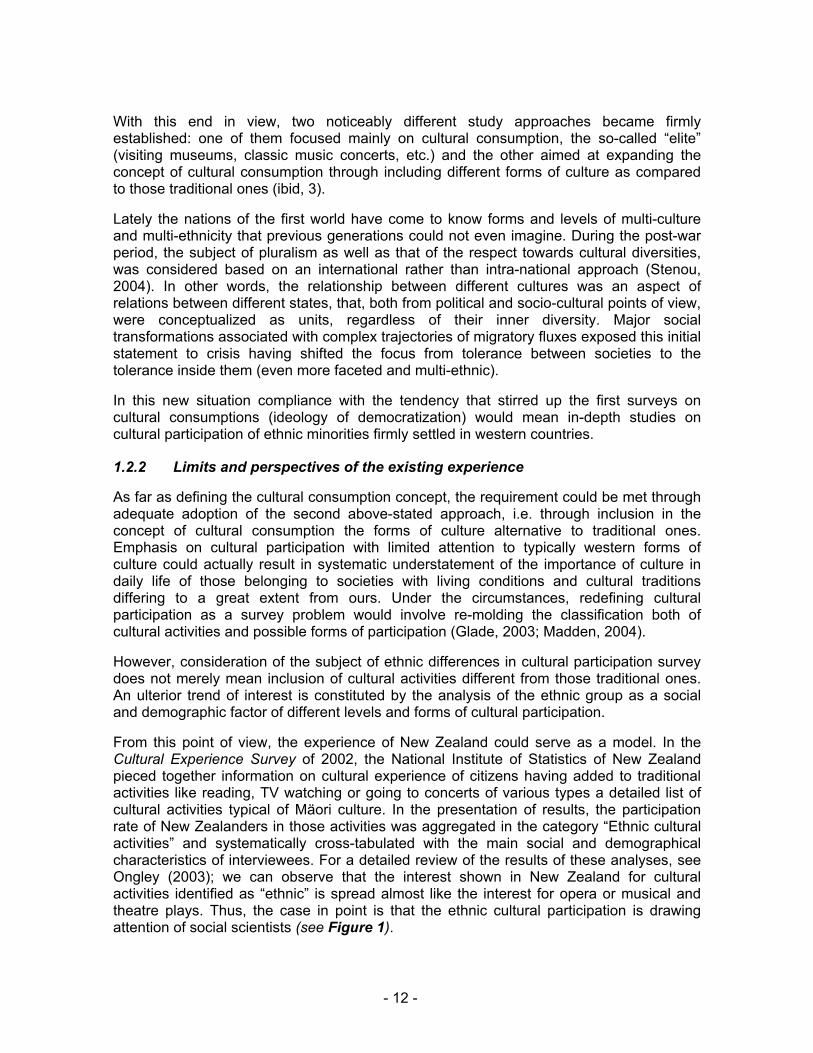
The above-stated analysis should not be considered as an individual case; analysing data relevant to Sport and Leisure of General Household Survey conducted in Great Britain in 2002, Fox and Rickards (2004) attempt an in-depth review of the influence of ethnic affiliation on the level of cultural participation (see Table 1.2) and, unlike Sturgis and Jackson, bring into focus specific situations of different ethnic minorities. For example, data produced show that keeping under statistical control the age factor a particularly low tendency to attend so-called “elite” performances is registered on Pakistani and Ceylonese.
Table 1.2 Participation in at least one specialized leisure activity in the 4 weeks before interview, by ethnic group: age-standardized.
Persons aged 16 and over. Year 2002.
Ethnic group
White british
Other white
Mixed back-
ground Indian
Pakistani and Ban-gladeshi
Other Asian back-
ground
Black Carib-bean
Black African
Other black back-
ground
Other ethic
groups
At least one specialized leisure activity*
Observed % 25 27 35 17 15 16 29 32 55 31Expected % 25 27 30 27 29 27 25 28 27 28Standardized ratio 101 103 119 62(a) 52(a) 57(a) 116 117 199(a) 112
Weigheted base (000's)=100% 37.496 1.349 277 581 496 216 437 363 68 499Unweigheted sample 13.375 445 90 204 165 71 142 110 22 158
* Comprises singing/playing an instrument, dancing, painting, writing stories/poetry and performing in a play(a) Ratio significantly different from 100 (p<0.05)
Leisure activity
- 15 -
However, it should be specified that in both of the reviewed surveys no attempt was made to classify forms of cultural participation through introduction of specifications associated with culture of ethnic minorities present in Great Britain.
In France, the relationship between ethnic groups and cultural participation fails to reflect a consolidated interest within official statistics. One of the few signs of this interest could be found in a working document where the influence of some traditional social and demographical characteristics (sex, age, education level, social and economical status, family status) on cultural and sporting participation (Muller, 2005) is studied. In classification of musical genres followed by the French there is a reference to ethnic music in a very general sense (reggae, salsa, etc.), while no interest is shown towards ethnic affiliation as a social characteristic that could influence the levels and forms of cultural participation.
Not even Denmark, Germany or the Netherlands seem to have launched any survey programmes on cultural participation of ethnic minorities at least in the framework of official statistics. When dealing with the cultural subject, the German Institute of Statistics seems to be predominantly aimed at conducting analysis on culture-related organizations and institutions, as well as on public funding of cultural activities. Obviously enough, there is no systematic interest in cultural statistics concerning citizens’ cultural participation.
Researchers of the Danish Institute of Statistics show a vivid interest both to ethnic diversity and cultural participation, although treating them as two separate subjects. In the Statistical Yearbook (publication with a periodic analysis on some priority-driven social and economical subjects) there is a section dedicated to Faroe Islands and Greenland; the two communities are methodically compared in this section with Denmark based on some classic indicators like employment ratio, fertility, age structure. No reference to cultural participation is made. There is an in-depth study of culture and education in the same publication; any systematic intention to distinguish activities based on ethnic matrix of origin is absent in the classification of cultural activities.
Like some other national institutes of statistics, the Dutch Institute allows to review data on utilization of time in the on-line mode5. Cultural activities with data to refer to are arranged based on traditional classification with no provision made for specific references to ethnic diversities: concerts (pop and classic), theaters, cinema and museums. Also, there is no ethnic group of affiliation among social and demographical characteristics which could be used to work out contingency tables.
Up to this point, the focus has been predominantly on the countries of the first world experiencing or having already experienced immigration periods. However, it could be interesting to trace how the subject of cultural participation of ethnic minorities is dealt within the countries (like New Zealand considered above) that, even if they are not reached by migration movement, are characterised by a complex social setting. In countries like Spain, Turkey and South Africa, social, cultural and political dynamics are deeply affected by cohabitation among populations/communities historically and aspiration-wise differing drastically from one another, and in some cases (like in the case of Spain) undergoing autonomous thrusts.
5 See http://statline.cbs.nl/statweb/start.asp?DM=SLen&LA=en&lp=applet&THEME=3890
- 16 -
How does this complex situation affect the study of cultural participation? As expected, official Spanish statistics consider the community to which one belongs as an important discriminating variable; as far as economical and social subjects are concerned, the data are disaggregated based on autonomous communities (Basque countries, Galicia, etc.). However, this profound statement does not manifest itself in the studies on cultural participation – the area still to be developed; cultural statistics in Spain have been mainly focused on culture-related organizations and institutions, as well as on public funding of cultural activities.
The same could be said about Turkey: cultural statistics basically analyse the production of books and films, publication of periodicals and diffusion of book stores. When the focus is shifted to individual participation, the classification system of cultural activities follow the western distinction between elite and mass cultures, and ethnic affiliation is not considered as a potential discriminating factor for the access to cultural proposal (AA.VV., 2005).
1.2.3 Conclusion
To conclude this excursus on the institutes of statistics in the countries of the so-called first world, it could be worth to review the way the subject of cultural participation of ethnic minorities is dealt with. Obviously, the review requires the prudence necessary when a study is in its exploratory stage and relies on empirical data obtained not a systematic method. One could think of the next stage of this work in which the concept of official statistics is made clearly explicit and operative and the interest towards cultural participation is evaluated and classified based on a survey form. However, some recurrent aspects, although resulting from an impressionistic preliminary survey, enable me to make some provisional evaluations.
Should the subject of ethnic differences be reviewed in statistic studies on cultural participation, we shall find ourselves only at the initial point of a long and uneven process. Almost all the countries of the first world reviewed here have a noticeable immigration background or could be characterised by a society based on cohabitation of ethnic groups with solid identity. However, in many of these countries an ethnic affiliation is not taken into consideration as a potential factor to affect the levels and forms of cultural participation.
As it was traced earlier, New Zealand and Great Britain are the best exceptions to this general lack of interest. Two different approaches can be found in official statistics of the two countries: on the one hand, “ethnicity” is reviewed as a two-class variable (belonging to a majority ethnic group/belonging to a minority ethnic group) and used in multivariate analysis alongside with traditional social and demographical variables: sex, age, education, employment, etc.; on the other hand, in-depth studies were attempted to specify more and more the conditions of ethnic minorities through analyses aimed at studies of the forms and levels of cultural participation experienced by different ethnic minority groups.
If ethnic affiliation appears as a potential independent variable in explanatory models of cultural participation, official statistics will show more resistance to consider the subject of ethnic differences as a criterion to work on definitions and classifications of cultural participation. With some exceptions, classifications used in the study of cultural participation derive from the traditional categories of western culture, as well as from the
- 17 -
classic distinction – prerequisites of which were stated above in this document – between elite and mass cultures.
Therefore one could say that generally some sensitivity has been developing towards the level of cultural participation of ethnic minorities, but unfortunately in this case cultural participation is intended in a restrictive sense: i.e. participation in western culture. However, the few exceptions to this general tendency are not always substantial: as it was seen above, when communicating data on the forms of cultural participation, the Institute of Statistics in New Zealand mostly groups in a single class the whole of ethnic cultural activities.
Finally this exploratory study could give a risk warning; the risk of replicating a western-oriented definition of culture in a social context different from western one, a definition that should be thoroughly reviewed to become explicable in non-western Countries. Actually the homogeneity of the classification of cultural activities in western countries could make this classification predetermined, and, for the sake of comparability, risks in ending up merely formal. One of the core risks associated with such statement lies in underestimation of cultural participation levels merely due to unavailability of necessary instruments to perceive it.
- 18 -
2. MEASURING CULTURAL PARTICIPATION IN NON-WESTERN COUNTRIES: CASE STUDIES
2.1 Bhutan
2.1.1 The statistical system of Bhutan
The National Statistical Bureau (NSB) of the Royal Government of Bhutan produces most of the statistics in Bhutan and is a key office for developing the production of data on culture. Currently, however, there is no integrated national statistical system in Bhutan.
The NSB is in charge for collecting and validating data from all Government, corporate, and private agencies as well as for carrying out sample surveys like the Bhutan Living Standard Survey (BLSS). Other important data collections are carried out by various offices like for example the Census Bureau (that carried out the last census) and the Ministry of Labour and Human Resources that is in charge of the Labour Force Survey. However, the NSB staff is deeply involved also in these activities as it is seconded to these institutions.
The overall staff of the NSB consists of 41 people which according to the director are not sufficient for the tasks the Bureau is responsible for. More resources are in particular needed to work with data collection and analysis for the social sector.
The National Statistical Bureau is in the process of developing a database that will be used to store all the data produced by the office. This project is undertaken with the support of the Asian Development Bank (ADB) who also provides technical assistance for other aspects of NSB’s work. Two main goals will be achieved with the establishment of this database: a) it will become possible to publish time series data, and b) information produced by the NSB will be accessible on-line.
No establishments survey has yet been undertaken in Bhutan and the informal character of the management of small cottage or household enterprises also means that these businesses are run without book keeping and cannot report accurate financial information for their production activities.
There is, however, some information available on industries – as published (since 1987) in NSB’s annual report “National Accounts Statistics of Bhutan”. The main objective of the report is to measure the annual economic performance of the country. The report presents the estimate of Gross Domestic Product (GDP) and related macro-economic aggregates like domestic consumption, investments, saving, etc. The data are collected by NSB from different Government organizations and private agencies and then validated.
The 2004 edition of the National Accounts Statistics of Bhutan was revised to bring the estimates in line with the United Nation System of National Accounts 1993 (SNA 93). The report publishes recent information available in line with the indication of SNA 93; in addition some sectors were further disaggregated into sub-sectors and presented separately in order to provide the users with more meaningful information.
- 19 -
The sectors and sub-sectors considered in the report include: agriculture; mining and quarrying; manufacturing; electricity and water supply; construction; wholesale and retail trade; restaurants and hotels; transport, storage and communication; finance; insurance and real estate; community and social services (government); private social and recreational services.
The NSB has also since 1987 published the Statistical Yearbook of Bhutan, a comprehensive and systematic compendium of basic statistical information on Bhutan, covering a wider range of statistics than the National Accounts Statistics of Bhutan, which similarly are derived from secondary data coming from various sources.
At the moment it is not possible for NSB to produce comparisons over time but with the development of a database system for the storage of the statistical data produced by the same NSB this will become possible.
The domains in the Statistical Yearbook of Bhutan cover population; health; education; human resources; land use and agriculture; industries; transport and communication; energy; tourism; foreign trade and balance of payments; money, banking and finance; public finance; plan outlays; gross domestic product; prices; crime.
Labour statistics have been collected since 1998 through a Labour Force Survey. This important survey was repeated in 2000 by the NSB. The third round of the Labour Force Survey (2001) was conducted by the Department of Employment and Labour. The fourth and the fifth round were carried out by the Department of Employment of the Ministry of Labour and Human Resources in 2003 and 2004, respectively. At the moment the future of this survey is uncertain and it is unclear whether the survey will be repeated or not. It may be more productive to integrate the labour survey with other surveys undertaken by the NSB.
As the survey has only been carried out once a year, it is not possible to estimate seasonal effects in the labour market.
Several recent activities have contributed to the upgrading of the national statistical capacity, as well as the compilation of important information. The most important of these is perhaps the undertaking of the Bhutan Living Standard Survey (BLSS) – a nation-wide survey of households carried out by the NSB in 2003. The BLSS followed the LSMS6 methodology developed by researchers at the World Bank (Grosh and Muñoz, 1996) and was carried out with the technical and financial support of the Asian Development Bank (ADB). The survey was carried out in the framework of a technical grant between ADB and NSB for the improvement of the statistical system of Bhutan. The main scope of this grant was to develop the technical capabilities of the NSB. The BLSS survey was carried out by NSB staff trained by ADB consultants who also supervised the different phases of the survey.
6 See: http://www.worldbank.org/LSMS/manage/manual.html
- 20 -
The NSB plans to repeat the survey in 2008. The new round will hopefully be financed by the government funding in recognition of the importance of the kind of data collected with this survey. It is difficult to evaluate the quality of the data without a deeper study but the response rate is an impressive 97% and the NSB seems very keen on improving the quality of the data in the next round of the survey.
The Bhutan Living Standard Survey 2003 was an improved version of the Pilot Household Income and Expenditure Survey (HIES) carried out in 2000.
The BLSS was designed to collect information on household consumptions expenditure in order to assess people’s well-being and to construct a poverty line for the country. Moreover, BLSS collected data on housing, employment, health status, fertility, education, access to public facilities, assets ownership, services provision, and prices of various commodities. The questionnaire form which is reprinted at the back of the publication indicates that the data is considerably richer than what is included in the publication.
The geographical coverage extended over the entire area of Bhutan except for two rural areas that were excluded for security reasons. The population coverage included all households in the country except for diplomatic and expatriate households; members of cohabitation situations (monasteries, nunneries, hospitals, etc.); barracks of military and para-military forces including the police.
In order to establish a representative sample, the entire country was divided into three regions based on the number of households and their geographic location. Each region was divided into seven strata (four urban and three rural). The final sample size for the survey was of 4,120 households.
The survey was carried out by a network of supervisors and enumerators who were trained in all aspects of the survey. This good preparation was reflected in the very low non-response rate of 2.7%.
As the Labour Force Survey only collects information on employed persons, the best source of data on the non-formal sector is probably again the BLLS. The 2003 BLSS questionnaire included questions that made possible to estimate, though very roughly, the percentage of households involved in non-formal cottage or household industries. The 2003 survey included a module (Block 10 – Home-produced non food items) on the production at home of items like textiles, bamboo products, wood products and cane products. The NSB did not publish the results for this module because of the poor quality of the data but the director is convinced that in the next round it will be possible to invest on this aspect to improve the quality of data and to make estimates concerning the amount of home-made products and their value.
As an output of the BLSS, the NSB has also published in 2004 a Poverty Analysis Report. Another major statistical achievement will be the completion of the Population Census, the findings of which will be published in 2006 (previous censuses were taken in 1969 and 1980). One of the main results of the Census will be the creation of a system that links geographical and statistical information. The system will provide a powerful tool for
- 21 -
designing accurate samples which in turn will improve the overall quality of data derived from sample surveys.
In the future, NSB plans to enrich the system with several kinds of data such as the location of enterprises and environmental data. The geographical system will become a powerful statistical tool for planning and monitoring the territory and environment of Bhutan, and for the socio-political development of the country. It could also become a powerful tool in the planning and mapping of cultural industries and in the implementation of cluster strategies.
2.1.2 Statistics on cultural industries
Importantly, culture is not represented as a domain per se in any of the surveys or publications mentioned above. According to the Director of NSB, it would be easy to add some statistical data on culture in the next edition of the Statistical Yearbook of Bhutan as such data are regularly collected by the Ministry of Home and Cultural Affairs. It seems very important to encourage collaboration between the NSB and the Ministry of Home and Cultural Affairs for the identification of the data available on the cultural domain, with the aim of inserting such data in the next edition of the Statistical Yearbook of Bhutan.
As part of the discussion on Gross National Happiness (GNH), attention may also be focused on the cultural domain. Hence, the UNDP has recently commissioned a study to the Centre for Bhutan Studies on the Operationalization of Gross National Happiness. The project aims at assisting the process of incorporating the concept of GNH into the day to day policy making process, among other through the identification of GNH indicators or the Bhutan Development Index. As culture is one of the four pillars of the Bhutanese development policy framework based on GNH, the cultural aspect of GNH will be researched and the intention is to identify indicators for their application to the development process. UNESCO is expected to cooperate in this research. The project is likely to focus on cultural participation as a key issue and it should not be confused with the efforts to produce internationally comparable data on cultural industries that is the goal of the Jodhpur Initiatives Framework for Statistics on Cultural Industries.
The Director of the Centre for Bhutan Studies is considering studying the cultural domain and its role in GNH in Bhutan through a Time Use Survey (TUS). A TUS is probably the best tool to collect information on everyday life. It is, however, both a very expensive survey and a very complex survey that requires very advanced skills in data collection, data imputation and codification and data analysis. To obtain interesting results on new domains it is very important to register the text of the daily diaries written by the interviewed. The text of the diaries represents a very important source of information but it is also very difficult to analyse; and for the specific characteristics of this survey the non-response rate is, in general, very high in particular among the less educated people. It would be very interesting if Bhutan were to undertake this study as it provides information on the cultural domain in non-western non-industrialized societies that could be interesting and relevant not only to Bhutan but also to other countries. However, as the survey is so costly and resource-demanding it would only with difficulty be repeated on a regular basis.
- 22 -
Considering all these problems, I think that the best tool to collect data on cultural participation on a regular base is a simpler survey like the BLLS. I think also that it is perfectly possible to define a-priori the cultural domains that the BLLS should cover with the cooperation of key persons like the director of the centre for Bhutan Studies.
In particular the BLLS will have a crucial role in measuring cultural participation in Bhutan for two main reasons:
1) on the methodological point of view this survey is very similar to those carried on at the European level;
2) the fact that the questionnaire is composed of different modules makes this survey a very flexible tool for the collection of data on new domains.
Considering these aspects I think it is possible to plan the introduction of a module on cultural participation in the next BLLS in 2008.
The director of NSB considers possible the introduction of a module on cultural participation in the 2008 round of the BLLS but he underlines that a financial support will be necessary. It will be very productive to use the same strategy adopted by the ADB giving at the same time financial resources and training to improve the skills of the staff of the NSB on measuring cultural participation in Bhutan.
2.2 Thailand
2.2.1 The NSO data collection on cultural participation
At present, Thailand has a decentralized statistical system. The National Statistical Office (NSO) is the core body. Its role is to collect basic statistical data while other agencies in other ministries and departments also issue their own statistical data which are mostly used for their internal affairs. The NSO coordinates with all the government’s agencies as well as with the users to produce statistics according to their needs.
The main duty of the NSO is to produce statistics on the social and economic structure of the country. The NSO carried out about 15 surveys each year and the data are collected according to international statistical standards. The NSO conducts also the censuses.
The NSO acts also as statistical information centre for the whole country while provincial statistical offices act as information centres for the provinces. The results of data collections are available in different formats (both electronic and paper) and are also available on the internet site of the NSO: http://www.nso.go.th
The NSO has a long tradition in collecting information on cultural participation. The NSO has carried out three rounds of the Cultural Participation Activities Survey (CAPS) in 1985, 1995 and 2005. Moreover, in 2004 the NSO has carried out also the Time Use Survey (TUS).
- 23 -
The results of these two surveys have been widely used by the government and for this reason the NSO plans to carry out both surveys more frequently. CAPS will be carried on in 2008 and it will be repeated every three years. TUS will be carried on in 2009 and it will be repeated every five years.
The UNESCO Office in Bangkok will provide a translation of the methodological information and of the questionnaire for both surveys (at the moment they are available only in Thai).
2.2.1.1 Cultural Participation Activities Survey
In 1985 and 1995, this survey collected information on cultural participation and religious practise. The main topics covered were:
Religious activities Social and cultural activities Offer food to monk Listening to radio and tapes Chanting Viewing television Observe religious precept Viewing cinema Meditation Practice Reading newspaper Attend sermon Reading book and magazine Dharma reading Sport and exercise
Meeting Window shopping Walking in the park Hobby
The sample allowed to breakdown these information for type of area (municipal and non-municipal), sex, age groups, education level and employment status. In 2005, because of the completion of the TUS, the module on cultural activities was dropped from the CAPS since, in the opinion of the NSO, this information was collected more in detail with the TUS.
The CAPS specialised on collecting information on:
• Religious activities: chanting, offer food to monk, gift for priest, observe religious precept, concentration, attend sermon, Dharma reading, place for listening sermon, prayer at home, prayer at mosque, pilgrim, going to church, money spent for religious activities and charity.
• Type and level of believing. • Type of behaviour which destroy Thai culture. • Opinion on how to protect Thai culture. • Evaluation of owns virtues. • Opinion about the values of Thai teenagers.
- 24 -
With this transformation the CAPS loses its central role in collecting information on cultural participation. At the moment this survey is centred on religious activities but it gives important information on the opinion of Thai people on issues like Thai system of values and the protection of Thai culture.
2.2.1.2 Time use survey
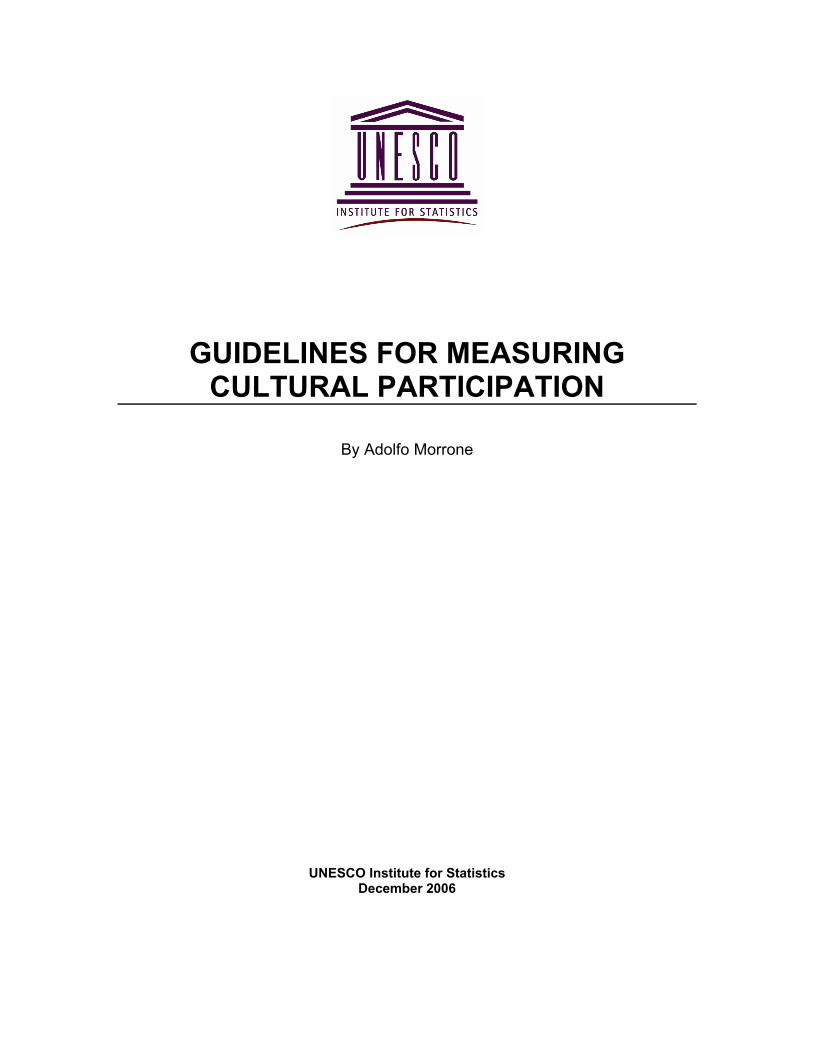
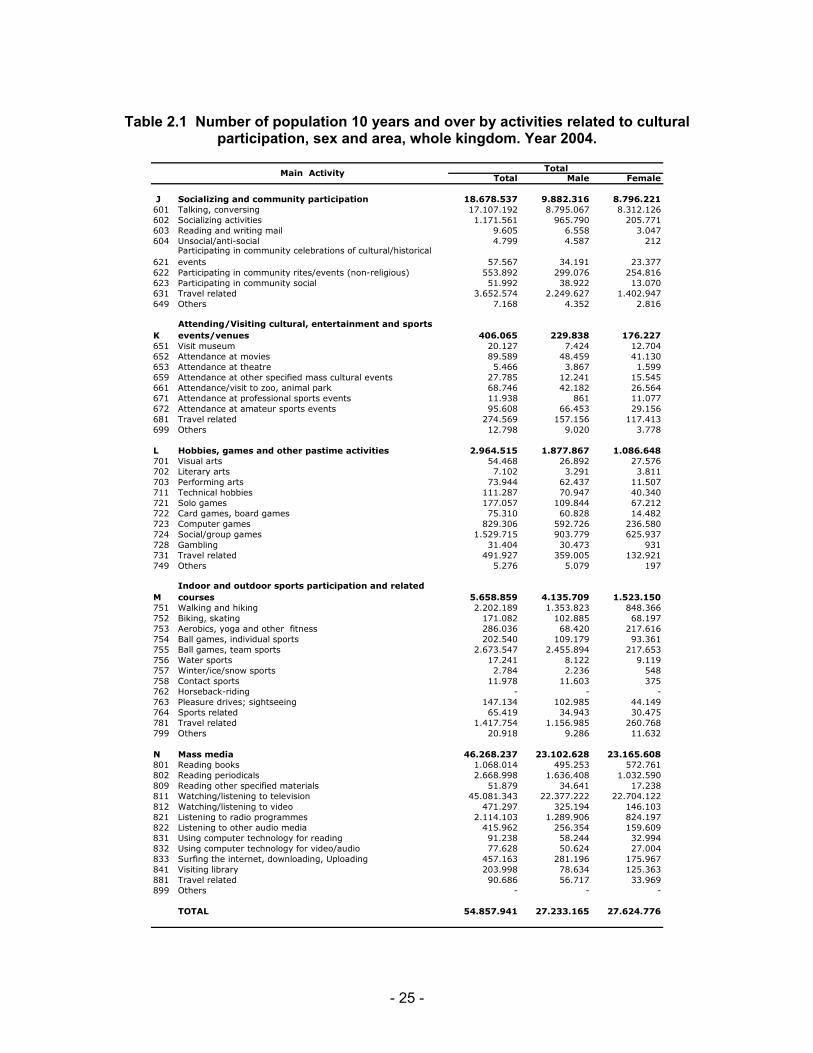
The TUS has been carried out for the first time in 2004. Table 2.1 shows the number of people aged 10 years and over involved in cultural activities in one day.
The activities monitored with the 2004 TUS survey are very close to the domains of the LEG framework and great importance is given to mass media and attending/visiting cultural events.
Participation in community celebrations of cultural/historical events (code 621), participation in community rites/events (non-religious) (code 622) and participation in community social (623) are the only activities that are not included in the European framework.
This survey is very useful to explore the domain of cultural participation in depth and in the next round it would be very useful if it would be possible to use this survey to have more details on community activities (code 621, 622, 623).
The results of this survey are difficult to compare with results of other surveys (e.g. Eurobarometer) because of the different reference period. In Europe, all indicators of cultural participation have the last 12 months as reference period. By consequence, no comparison is possible with the data shown in Table 2.1 that use one day as reference period.
To produce data useful for international comparison, Thailand should use the CAPS survey to measure cultural participation according to the 12 months reference period criterion. The TUS survey should be used to analyse in depth specific aspects of this domain.
- 25 -
Table 2.1 Number of population 10 years and over by activities related to cultural participation, sex and area, whole kingdom. Year 2004.
TotalTotal Male Female
J Socializing and community participation 18.678.537 9.882.316 8.796.221601 Talking, conversing 17.107.192 8.795.067 8.312.126602 Socializing activities 1.171.561 965.790 205.771603 Reading and writing mail 9.605 6.558 3.047604 Unsocial/anti-social 4.799 4.587 212
621Participating in community celebrations of cultural/historical events 57.567 34.191 23.377
622 Participating in community rites/events (non-religious) 553.892 299.076 254.816623 Participating in community social 51.992 38.922 13.070631 Travel related 3.652.574 2.249.627 1.402.947649 Others 7.168 4.352 2.816
KAttending/Visiting cultural, entertainment and sports events/venues 406.065 229.838 176.227
651 Visit museum 20.127 7.424 12.704652 Attendance at movies 89.589 48.459 41.130653 Attendance at theatre 5.466 3.867 1.599659 Attendance at other specified mass cultural events 27.785 12.241 15.545661 Attendance/visit to zoo, animal park 68.746 42.182 26.564671 Attendance at professional sports events 11.938 861 11.077672 Attendance at amateur sports events 95.608 66.453 29.156681 Travel related 274.569 157.156 117.413699 Others 12.798 9.020 3.778
L Hobbies, games and other pastime activities 2.964.515 1.877.867 1.086.648701 Visual arts 54.468 26.892 27.576702 Literary arts 7.102 3.291 3.811703 Performing arts 73.944 62.437 11.507711 Technical hobbies 111.287 70.947 40.340721 Solo games 177.057 109.844 67.212722 Card games, board games 75.310 60.828 14.482723 Computer games 829.306 592.726 236.580724 Social/group games 1.529.715 903.779 625.937728 Gambling 31.404 30.473 931731 Travel related 491.927 359.005 132.921749 Others 5.276 5.079 197
MIndoor and outdoor sports participation and related courses 5.658.859 4.135.709 1.523.150
751 Walking and hiking 2.202.189 1.353.823 848.366752 Biking, skating 171.082 102.885 68.197753 Aerobics, yoga and other fitness 286.036 68.420 217.616754 Ball games, individual sports 202.540 109.179 93.361755 Ball games, team sports 2.673.547 2.455.894 217.653756 Water sports 17.241 8.122 9.119757 Winter/ice/snow sports 2.784 2.236 548758 Contact sports 11.978 11.603 375762 Horseback-riding - - -763 Pleasure drives; sightseeing 147.134 102.985 44.149764 Sports related 65.419 34.943 30.475781 Travel related 1.417.754 1.156.985 260.768799 Others 20.918 9.286 11.632
N Mass media 46.268.237 23.102.628 23.165.608801 Reading books 1.068.014 495.253 572.761802 Reading periodicals 2.668.998 1.636.408 1.032.590809 Reading other specified materials 51.879 34.641 17.238811 Watching/listening to television 45.081.343 22.377.222 22.704.122812 Watching/listening to video 471.297 325.194 146.103821 Listening to radio programmes 2.114.103 1.289.906 824.197822 Listening to other audio media 415.962 256.354 159.609831 Using computer technology for reading 91.238 58.244 32.994832 Using computer technology for video/audio 77.628 50.624 27.004833 Surfing the internet, downloading, Uploading 457.163 281.196 175.967841 Visiting library 203.998 78.634 125.363881 Travel related 90.686 56.717 33.969899 Others - - -
TOTAL 54.857.941 27.233.165 27.624.776
Main Activity
- 26 -
2.2.1.3 Conclusions
The analysis of Thailand experiences in the field of measuring cultural participation deserves more attention. For instance, it would be useful to try and understand whether there are university research programmes that are coping with this problem on a theoretic level. The approach used in Thailand for measuring cultural participation is, on my opinion, too much influenced by the western concept of culture. In the TUS survey not enough attention is given to traditional activities which should be more detailed as it happens, on the contrary, in New Zealand survey on cultural activities of Maori. Currently, then, it is not possible to evaluate whether the image given by TUS reflects the real patterns of cultural participation of Thailand population or whether there are other relevant aspects that need to be taken into consideration.
On a technical point of view, the choice to use only TUS survey for measuring cultural participation makes it difficult to compare data at the international level. In order to calculate benchmark indicators comparable at the international level it is, in fact, necessary to measure cultural participation according to a reference period of twelve months. For this reason is highly advisable that the Thailand NSO inserts a module on cultural participation in the next round of CAPS survey which will be carried out in 2008. Naturally, the results of TUS survey carried out in 2004 will be highly useful for designing this module. 2.3 The Uganda’s framework for culture statistics
2.3.1 Background
The UNESCO Framework for Culture Statistics is being reviewed to modify categories and sub-categories and also to ensure that the needs of developing countries are integrated into the new framework. UNESCO selected Uganda to pilot this activity in Africa.
The Ministry of Gender, Labour and Social Development (MGLSD) constituted a task force to develop Uganda’s framework for culture statistics. The task force includes officials from the UNESCO Office in Uganda, MGLSD, Uganda Bureau of Statistics (UBOS) and the Ministry of Education and Sports. MGLSD is the lead agency for this activity.
The UBOS is in the process of designing the plan for national statistical development and the MGLSD is working in close cooperation with the UBOS to give relevance to the culture statistics sector in the plan for national statistical development.
Thanks to this work, in the next five years the culture statistical sector will receive a big impulse in Uganda that will became a lead country in the area for the culture statistical sector.
- 27 -
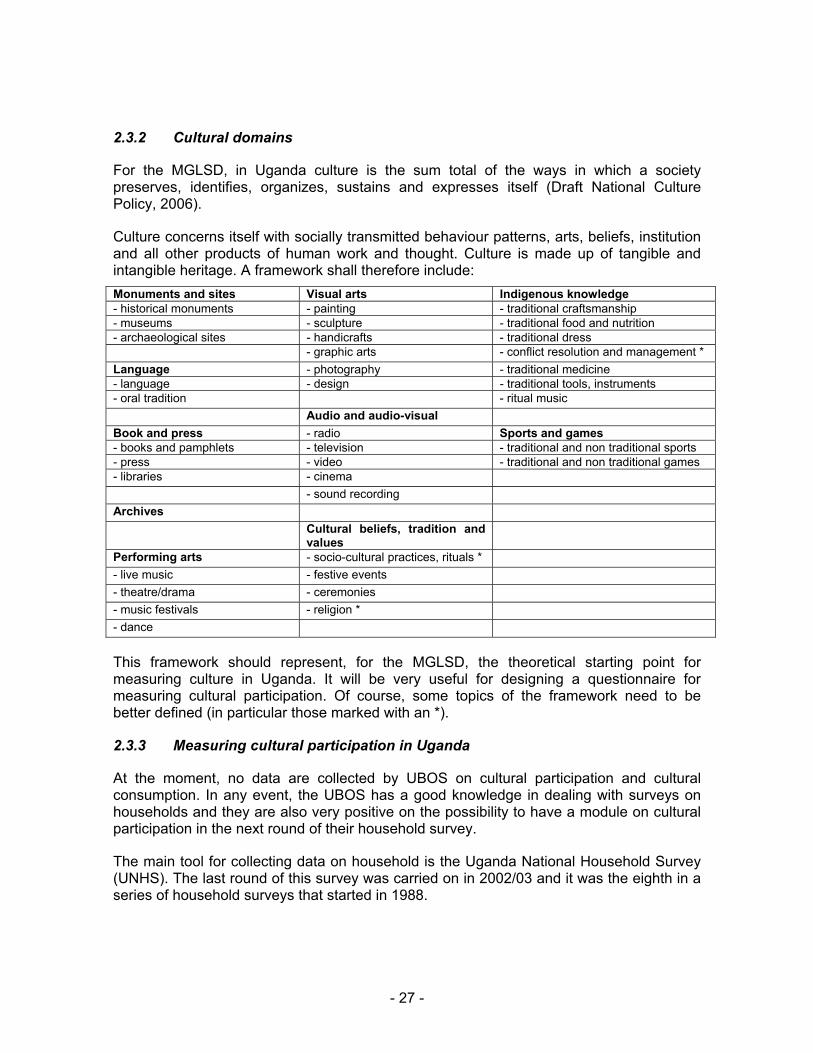
2.3.2 Cultural domains
For the MGLSD, in Uganda culture is the sum total of the ways in which a society preserves, identifies, organizes, sustains and expresses itself (Draft National Culture Policy, 2006).
Culture concerns itself with socially transmitted behaviour patterns, arts, beliefs, institution and all other products of human work and thought. Culture is made up of tangible and intangible heritage. A framework shall therefore include: Monuments and sites Visual arts Indigenous knowledge - historical monuments - painting - traditional craftsmanship - museums - sculpture - traditional food and nutrition - archaeological sites - handicrafts - traditional dress - graphic arts - conflict resolution and management * Language - photography - traditional medicine - language - design - traditional tools, instruments - oral tradition - ritual music
Audio and audio-visual Book and press - radio Sports and games - books and pamphlets - television - traditional and non traditional sports - press - video - traditional and non traditional games - libraries - cinema - sound recording Archives Cultural beliefs, tradition and
values
Performing arts - socio-cultural practices, rituals * - live music - festive events - theatre/drama - ceremonies - music festivals - religion * - dance
This framework should represent, for the MGLSD, the theoretical starting point for measuring culture in Uganda. It will be very useful for designing a questionnaire for measuring cultural participation. Of course, some topics of the framework need to be better defined (in particular those marked with an *).
2.3.3 Measuring cultural participation in Uganda
At the moment, no data are collected by UBOS on cultural participation and cultural consumption. In any event, the UBOS has a good knowledge in dealing with surveys on households and they are also very positive on the possibility to have a module on cultural participation in the next round of their household survey.
The main tool for collecting data on household is the Uganda National Household Survey (UNHS). The last round of this survey was carried on in 2002/03 and it was the eighth in a series of household surveys that started in 1988.
- 28 -
The UNHS 2002/03 collected information on the socio-economic characteristics at both the household and community levels. The main objective of the survey was to collect high quality data on population and socioeconomic characteristics of households for monitoring development performance.
The UNHS 2002/03 comprised of four modules namely the Socio-Economic, Labour Force, Informal Sector and Community modules.
The survey covered 55 districts of Uganda, with some parts of Gulu and Kitgum districts not fully covered due to insecurity. Pader District was not covered at all.
The UNHS sample was drawn through a stratified two-stage sampling design. The Enumeration Area (EA) was used as the first stage sampling unit and the household as the second stage-sampling unit. The sampling frame used for selection of first stage units (fsus) was the list of EAs with the number of households based on the cartographic work of the 2002 Population and Housing Census. A total of 972 EAs (565 in rural and 407 in urban areas) were covered. In order to select the second stage units, which are the households, a listing exercise using listing schedules was done in all selected EAs.
The sample size was determined by taking into consideration several factors, the three most important being: the degree of precision (reliability) desired for the survey estimates, the cost and operational limitations, and the efficiency of the design. UNHS 2002/03 covered a sample of 9,711 households.
This survey is a good tool for piloting a module on cultural participation. Its weakest point is the fact that only one member of the household is interviewed and gives information for all the member of the household. This technique could have the effect of underestimate the cultural participation level of the population because the interviewed person can be unaware of the cultural consumption of the member of the household.
2.4 Supporting interest for cultural participation statistics
The cultural sector in general and the cultural participation in particular are underrepresented in the statistical system of these countries. A significant obstacle impeding the development of more rigorous and useful measures and policies is the weak research and knowledge base that exist in the field. Among the reasons contributing to this weakness:
• The relative immaturity of cultural policy (or planning) and the lack of conceptual clarity as an interdisciplinary area of study and research.
• The low priority traditionally accorded to research funding by established cultural policy agencies.
• The lack of resources for systematic research by the agencies of civil society, such as non-governmental organizations.
• The weak linkages forged between universities and the broader cultural sectors in the development and resourcing of research agendas.
- 29 -
• The dramatic lack of research by agencies of local government in cultural planning and development, which is in part influenced by the national focus of much cultural policy and cultural policy research. (Kleberg, 1998).
On the contrary, all NSOs of these countries have the know-how and the statistical tools for implementing a data collection on cultural participation and, in general, to improve the statistical production on the whole culture sector.
In Asia, a major drive to the better and develop statistics on cultural industries comes from Jodhpur Initiatives. It is of fundamental importance that within this project the right significance will be given to statistics on cultural participation which are the moment are less developed since they are considered less relevant on a political point of view. According to my experience, continuous efforts are needed in order to adequately support the development of statistics on cultural participation in non-western countries.
As underlined by the UIS Regional Advisor for Asia and Pacific region, it is necessary to create and support a working group with the specific aim of developing and harmonising statistics on cultural participation. This group should include international and national experts of interested countries in order to study both content and methodology to implement data collection on cultural participation. At the same time, this group should also have the function to strengthen the importance of these data at the political level.
Finally, it is fundamental to act promptly since the following countries will carry out household surveys again between 2008 and 2009:
2008 Bhutan BLSS 2008 Thailand CAPS 2009 Thailand TUS 2008 Uganda UNHS
It will then be possible to test in many countries a harmonised module on cultural participation.
The areas of need and the modalities for support must necessarily differ from country to country and from situation to situation. However, the cultural participation sector development will only be successful if support is aimed at enabling local participation and decision-making.
The UIS (and other international agencies) could facilitate this process by providing technical assistance and advice, and liaise with potential funding agencies.
In a longer perspective, technical assistance could focus on more specific mechanisms for cultural participation statistics development through studies of specific issues and the establishment of baseline data for the sector.
- 30 -
3. GUIDELINES FOR MEASURING CULTURAL PARTICIPATION
3.1 Toward a definition of cultural participation
Everything can be regarded as culture, when we include within its range material culture (products, production techniques and technologies, etc.), social culture (production modes, institutions, social differentiation processes, social roles, educational procedures, behavioural patterns, social intercourses, play, leisure time activities, social rituals, etc.) and ideal culture (rules, consolidated values, knowledge, languages and communicative behaviours, symbols, expressions, etc.).
It is doubtless that the problem cannot be dealt with at such a general level. On the contrary, we need to find a definition of cultural participation that is operational and allows to collect comparable data though respecting each country’s cultural diversity.
We cannot forget, indeed, that the main aim of this work is to provide the criteria for collecting harmonised information on cultural participation in order to allow international comparability of the results obtained. Such an objective necessarily implies some choices that one hand might appear effortless but have the advantage of providing a common frame for measuring such a complex phenomenon. For this reason it is useful to refer, as far as possible, to the definition of cultural participation that was given by LEG for the European context, also for the sake of not missing the opportunity to compare data with European ones.
This definition has to refer on one hand to the art concept in order to give the better value to the domains that on the basis of each country’s history belong without any doubt to the cultural field. On the other hand, the definition has to take into consideration that cultural participation must embrace more than simply “arts plus media policies”. It should also take into account the ways in which cultural activities are knitted into the fabric of everyday life; of the ways in which ethnically-marked differences in cultural tastes, values and behaviours inform not just artistic and media preferences but are embedded in the daily rhythms of different ways of life; and of the ways in which these connect with other relevant social characteristics – those of class and gender, for example (Bennett, 2001).
Cultural participation is thus not limited to the consumption of products that belong to the so-called "elite" culture but is part of daily life and contributes strongly to the quality of life of a given community.
We then need to look at general cultural practices of people. The proposed division is based on the following three-folded classification: “culture d’appartement” (television, radio, listening to music, reading and so on), “culture de sortie“ (cinema, performing arts, visits to museums, monuments and archaeological sites) and “culture identitaire” (amateur practices, cultural associations, popular culture, ethnic cultures, youthful culture).
On the contrary, it is not useful to operate a distinction between high, middle and low cultural levels. The three-level distinction of culture is not useful in a statistical connection. Indeed, it can be dangerous because this distinction has no sense in a social, aesthetic or semiotic level.
- 31 -
Moreover, cultural participation is not only an active behaviour. If to participate is to create and invent, the analysis field will be the artistic and amateur field, but if to participate is principally to attend and watch something of cultural offer, the focus will be on tickets sales, on provisions, on households’ cultural expenditure, and so on.
Active versus passive opposition is, however, very hard to define: how can we define book or newspaper reading in terms of “activity” or “passivity“? When are we watching TV actively and when are we passive? Is it a cultural activity only if we are producing something? Or, on the other hand, are we doing something “cultural” when we re-elaborate (with more or less criticism) external stimuli coming from different external sources?
It seems to me that to limit the participation concept to the artistic and creative behaviours only is a choice that precludes taking into consideration important factors of cultural participation in everyday life.
Finally we need to underline that in many forms of cultural participation which are carried out at the community level it’s very difficult to distinguish between an active and a passive behaviour. For instance, considering the case of a festival that involves at various level of participation almost all the population of a village, how can we distinguish between who watches and who participates?
As a matter of fact, in the TUS survey carried out in Thailand only the category of participation is used with reference to cultural events that take place at the community level, since it would be impossible to distinguish between attendance and performing.
An effective definition of cultural participation has therefore to include the performing participation forms, the attending ones and the ones for which it would be useless to try and make such a distinction.
We have participation in cultural activities when:
in any context and through any channel, with a shared general code of communication, we have senders and receivers paying much attention to forms and contents of messages to increase their own informational and cultural baggage.
First of all it should be underlined that there are no particular places where participation should happen (participation can be in everyday life) and that the messages, the forms, the contents of cultural products can be transmitted by every kind of channel (paper, television, radio, CD, audio-videocassettes, live performances with voice, sound, images and so on).
Secondly, the receiver and the source both use a general shared code of communications. In more particular, it can happen that we have differences between the receiver’s code and the source’s code (with a creative tension to link the different codes in a new form), but in general we think that there is participation when, for example, one decides to use musical code and goes to a concert, one decides to activate visual code and goes to a painting exhibition, and so on. After, when one is listening to a concert, we have a shared musical
- 32 -
general code and, at the same time, different particular musical codes between source and receiver. So speaking about participation in this sense, receiver and sender pay much attention to forms and contents of communicating messages.
Finally, if there are 1) a shared general code; and 2) a lot of attention to forms and contents of communication, it appears obvious that participation implies that receiving subject is intentionally interested in a growth of own informational and cultural baggage. Hence, we have to clearly say that in order to talk of cultural participation, the main aim of who participates has to be that of augmenting its own informational and cultural baggage. Professional and working activities, thus, are not included in cultural participation.
This criterion might appear strapping but it is necessary to encircle clearly the object of study which would otherwise easily risk invading other subjects. In particular, some borderline areas as craftsman production are very difficult to classify. By the adoption of this definition it becomes simpler to define what cultural participation is and what it isn’t. For example, to go to a museum for visiting an exhibition is by no doubt a cultural participation activity while to work in a museum as a guide is a working activity.
To make pottery is a cultural participation activity if it’s a hobby carried out with the intention of enhancing one’s knowledge and skills but it isn’t if it’s done for raising one’s income. Naturally, even the working activity of the famous painter or actor has to be excluded from the cultural participation sphere
3.2 A revision of the European framework
The definition of the domains to be used in order to obtain harmonized data at the international level is a very difficult task. Therefore, this paragraph does not intend to illustrate exhaustively which domains have to be considered in a survey on cultural participation since to provide an adequate framework for all the countries is a utopian aim. The aim is rather to provide guidelines to obtain data on cultural participation that are the more comparable as possible among different contexts.
The beginning point is the framework that has been adopted by the European Union, reviewed on the basis of the elements provided by the framework designed by the Uganda’s Ministry of Gender, Labour and Social Development, by the Thailand TUS survey and by the New Zealand’ survey on cultural activities of Maori minority.
Table 3.1 presents domains that are common to the different sources and domains pertaining to a single source. Domains included in the European framework are certainly important for measuring cultural participation since they are included in almost all of the sources being considered. Archives, audio and audio-visual, book and press, cultural heritage, libraries, performing arts and visual arts are part of cultural participation and have to be measured even though levels of incidence of single items will vary largely from country to country.
The only domain that appears scarcely applicable on a vast scale, but in effect it is neglected also at the European level, is architecture. The indicator provided by LEG for this domain – visiting an architecture exhibition – can be considered of minor importance in developing countries.
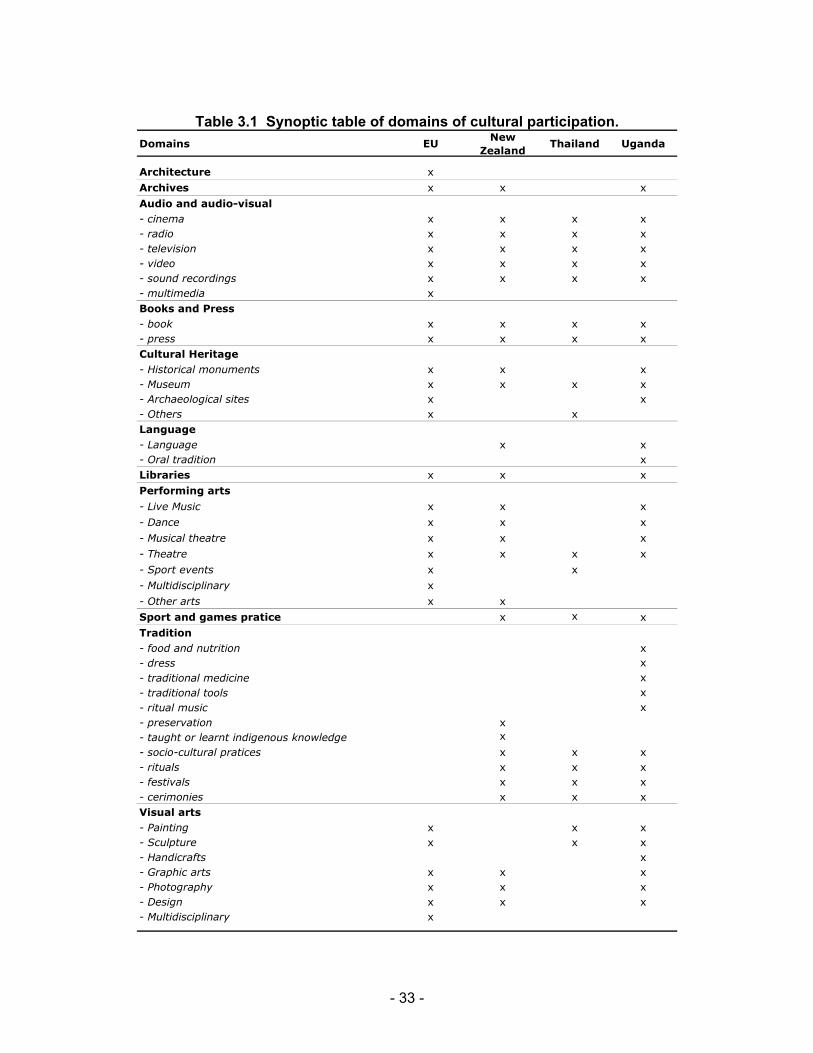
- 33 -
Table 3.1 Synoptic table of domains of cultural participation. Domains EU
New Zealand
Thailand Uganda
Architecture x
Archives x x x
Audio and audio-visual- cinema x x x x- radio x x x x- television x x x x- video x x x x- sound recordings x x x x- multimedia xBooks and Press- book x x x x- press x x x xCultural Heritage- Historical monuments x x x- Museum x x x x- Archaeological sites x x- Others x xLanguage- Language x x- Oral tradition xLibraries x x x
Performing arts
- Live Music x x x
- Dance x x x
- Musical theatre x x x
- Theatre x x x x
- Sport events x x
- Multidisciplinary x
- Other arts x x
Sport and games pratice x x x
Tradition- food and nutrition x- dress x- traditional medicine x- traditional tools x- ritual music x- preservation x- taught or learnt indigenous knowledge x
- socio-cultural pratices x x x- rituals x x x- festivals x x x- cerimonies x x xVisual arts - Painting x x x- Sculpture x x x- Handicrafts x- Graphic arts x x x- Photography x x x- Design x x x- Multidisciplinary x
- 34 -
Notwithstanding, the European framework appears insufficient when being considered in the light of experiences collected through the case studies. New domains that have to be taken into consideration are: language, sports and games and tradition.
Language, proposed by Uganda’s Ministry of Gender, Labour and Social Development, puts the emphasis on the linguistic heritage that represents an important part of the cultural richness of every country. Even if it is not included in the European framework, in the Italian survey on cultural participation big importance is given to the language and information is collected on the use of dialect and on the languages spoken by linguistic minorities.
It would be more difficult instead to measure oral tradition. It represents in some societies a privileged means of transmission on values and culture but it is also a very difficult phenomenon to define and measure.
Sports and games is a quite relevant domain which should be reintegrated even in the European framework. It is worth underlining, in fact, that the decision not to include sport among the domains of the European framework was a very discussed one, since many European countries including Italy consider it fully to be cultural participation.
If we want to measure cultural participation in developing countries it is essential to consider even sporting activities in order not to exclude a priori traditional activities which strongly connote some cultures (e.g. archery in Bhutan).
Similarly some games can be considered as a constituting element of a people culture (e.g. chess in Russia) and in fact TUS survey carried out in Thailand considers this domain broadly.
Tradition is a very broad domain that includes many items which are sound and simple to measure and other items that require a more precise definition. Participation to rituals, festivals and ceremonies is already enumerated by the TUS survey carried out in Thailand and doesn’t cause specific troubles.
Uganda considers among the domains of interest food and nutrition, traditional dress, traditional medicine, traditional tools and ritual music. Participation to events that need ritual music in order to take place might probably be surveyed within the area of participation to rituals, festivals and ceremonies, while the other items are much more difficult to measure.
Furthermore, beyond the problems that might be encountered concerning definitions and measures, surveying domains, such as tradition and cultural heritage, acquire a strategic significance for the study of cultural participation in non-western countries.
Section 1.2 shows that in western countries interest towards cultural participation of ethnic minorities it is not adequately backed by a process of re-thinking of the cultural participation concept; a process which is particularly needed since the same idea of culture might change according to the ethnic group. From this point of view, the design of an ad hoc survey for the study of cultural participation in non-western countries might set the pace in view of a potential renewal of traditional settings in western countries.
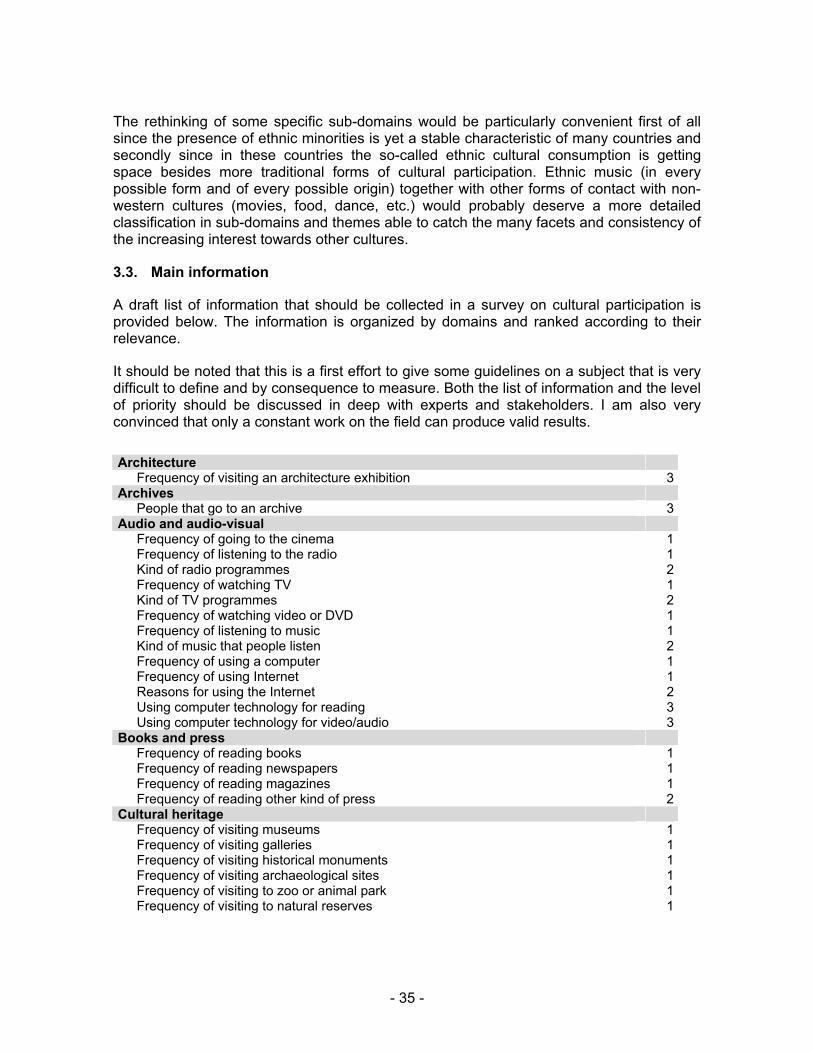
- 35 -
The rethinking of some specific sub-domains would be particularly convenient first of all since the presence of ethnic minorities is yet a stable characteristic of many countries and secondly since in these countries the so-called ethnic cultural consumption is getting space besides more traditional forms of cultural participation. Ethnic music (in every possible form and of every possible origin) together with other forms of contact with non-western cultures (movies, food, dance, etc.) would probably deserve a more detailed classification in sub-domains and themes able to catch the many facets and consistency of the increasing interest towards other cultures.
3.3. Main information
A draft list of information that should be collected in a survey on cultural participation is provided below. The information is organized by domains and ranked according to their relevance.
It should be noted that this is a first effort to give some guidelines on a subject that is very difficult to define and by consequence to measure. Both the list of information and the level of priority should be discussed in deep with experts and stakeholders. I am also very convinced that only a constant work on the field can produce valid results.
Architecture
Frequency of visiting an architecture exhibition 3Archives
People that go to an archive 3Audio and audio-visual
Frequency of going to the cinema 1Frequency of listening to the radio 1Kind of radio programmes 2Frequency of watching TV 1Kind of TV programmes 2Frequency of watching video or DVD 1Frequency of listening to music 1Kind of music that people listen 2Frequency of using a computer 1Frequency of using Internet 1Reasons for using the Internet 2Using computer technology for reading 3Using computer technology for video/audio 3
Books and press Frequency of reading books 1Frequency of reading newspapers 1Frequency of reading magazines 1Frequency of reading other kind of press 2
Cultural heritage Frequency of visiting museums 1Frequency of visiting galleries 1Frequency of visiting historical monuments 1Frequency of visiting archaeological sites 1Frequency of visiting to zoo or animal park 1Frequency of visiting to natural reserves 1
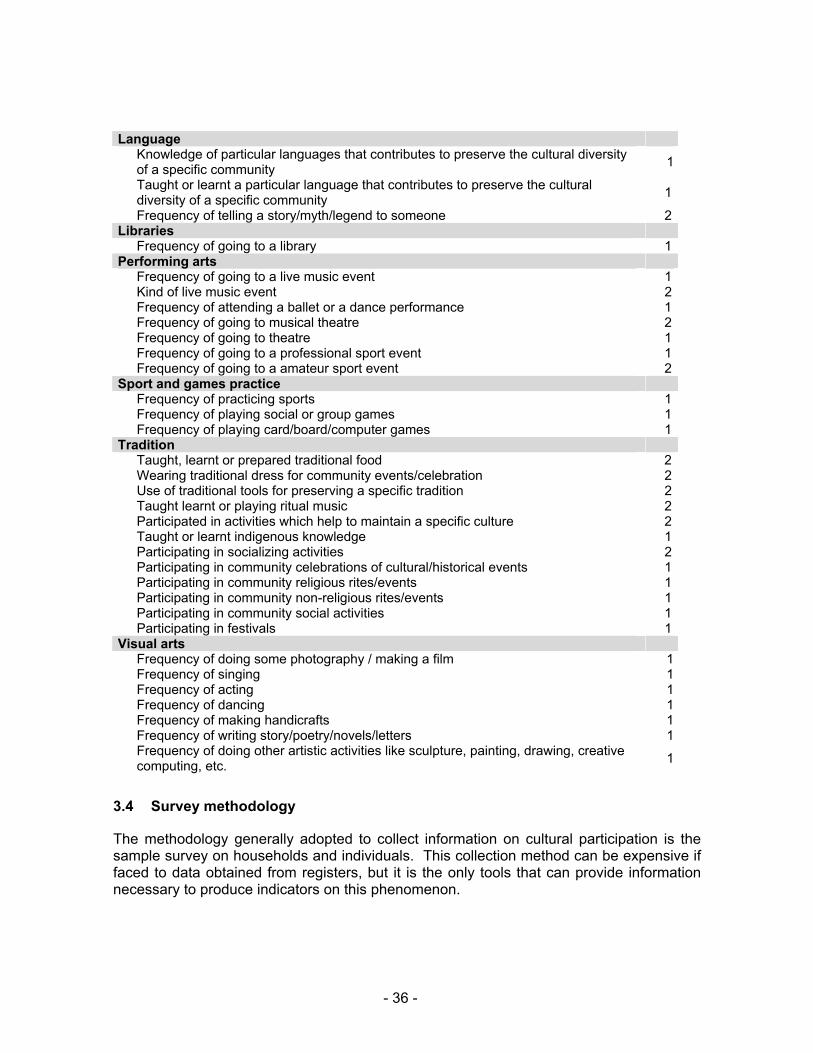
- 36 -
Language
Knowledge of particular languages that contributes to preserve the cultural diversity of a specific community 1
Taught or learnt a particular language that contributes to preserve the cultural diversity of a specific community 1
Frequency of telling a story/myth/legend to someone 2Libraries
Frequency of going to a library 1Performing arts
Frequency of going to a live music event 1Kind of live music event 2Frequency of attending a ballet or a dance performance 1Frequency of going to musical theatre 2Frequency of going to theatre 1Frequency of going to a professional sport event 1Frequency of going to a amateur sport event 2
Sport and games practice Frequency of practicing sports 1Frequency of playing social or group games 1Frequency of playing card/board/computer games 1
Tradition Taught, learnt or prepared traditional food 2Wearing traditional dress for community events/celebration 2Use of traditional tools for preserving a specific tradition 2Taught learnt or playing ritual music 2Participated in activities which help to maintain a specific culture 2Taught or learnt indigenous knowledge 1Participating in socializing activities 2Participating in community celebrations of cultural/historical events 1Participating in community religious rites/events 1Participating in community non-religious rites/events 1Participating in community social activities 1Participating in festivals 1
Visual arts Frequency of doing some photography / making a film 1Frequency of singing 1Frequency of acting 1Frequency of dancing 1Frequency of making handicrafts 1Frequency of writing story/poetry/novels/letters 1Frequency of doing other artistic activities like sculpture, painting, drawing, creative computing, etc. 1
3.4 Survey methodology
The methodology generally adopted to collect information on cultural participation is the sample survey on households and individuals. This collection method can be expensive if faced to data obtained from registers, but it is the only tools that can provide information necessary to produce indicators on this phenomenon.
- 37 -
Usually data from registers are devoid of structural information like sex, age or nationality. For example, when we buy a ticket at cinema, no information is collected about our sex, age and so on. The phenomenon cannot be analysed according to individual structural information and, by consequence, it is impossible to use register data to answer key questions like who in a given society is participating in what aspects of culture and why? Do youth behave differently than adults? Does everyone have equitable access to culture?
Moreover, it is difficult to build indicators on cultural participation because it is quite difficult to define the reference population. For example, it is impossible to use the number of ticket sold to access museums in Italy to build an indicators like the percentage of Italians that goes to museums because we don’t know how many tickets are sold to tourists from abroad.
This section focuses on general questions concerning survey methodology necessary to collect information on cultural participation and it intends to give useful guidelines for countries that want to implement a data collection on cultural participation.
3.4.1 Definition of population
The objective of a survey on cultural participation should be to give information on this subject in a very broad sense. This means that the survey should cover the population as a whole and not concentrate on specific population like the labour force only or adult and so on. To have a complete picture of the situation in a country a survey should cover the widest population possible.
In Italy, for example, cultural participation data cover population of 6 years and over and by consequence it is possible to compare the cultural participation level of very different age groups more important it is possible to compare the cultural participation patterns of young and elderly people that are involved in very different cultural activities.
The ideal situation is to focus on the 6 years and over population. Anyway, considering that this is an ambitious target, the recommendation is to focus at least on the population of 15-64 year olds. This would be the core sample which all participating countries should use but every country is free to widen the age bands if possible. Residents of institutions (like old people’s homes, prisons, etc.) are excluded.
3.4.2 Reference period
Generally estimation on cultural participation are produced using an annual reference period. This is the case of the Eurobarometer survey and other surveys considered earlier.
For this reason it is recommended that the reference period for reporting participation in cultural activities should be 12 months, which could either be the last 12 months or the previous calendar year.
A shorter reference period could lead to a better recall of cultural activities but there are serious disadvantages to such a solution as most respondents would probably not have participated in any activity over this period, limiting the analytical potential of the data, while the results would be strongly influenced by seasonal effects.
- 38 -
However, it is possible to use shorter reference periods for specific cases (e.g. for very frequent cultural activities like watching TV or listening to the radio) and longer reference periods for collecting some basic information so as to improve the dynamics of the data.
A harmonised reference period is a key element to make possible comparison between countries.
It is easier to compare data collected in different years but with the same reference period than data collected in the same year but with very different reference period. For example it is possible to compare data on cultural participation of Member States and candidate countries that were collected in different years (see Appendix C), but it is impossible to make comparison between Eurobarometer data collected using an annual reference period and data of the Thai TUS survey collected using a daily reference period.
3.4.3. Method of data collection
With a dedicated survey it will be possible to cover more of the variables known or suspected to be correlated to participation in cultural activities. The ideal proposal is to use the same data collection method in all countries in order to avoid possible method effects on comparability of the results.
Face-to-face interviews should be used as this would produce better data on participation in cultural activities (and related issues) than other data collection methods. Visual support such as show cards in face-to-face interviews would help in answering complex questions. Moreover the duration of the interview is not so critical in face-to-face interviews.
I strongly recommend not using computer-assisted telephone interview (CATI) because of evident population coverage problems in developing countries.
Computer-Assisted Personal Interviews (CAPI) should be used where possible also if we are aware that it is a very expensive data collection method. Computer-assisted interviewing can involve collection of information with multiple response pathways, while it makes it easier to use complex flows and built-in edits and checking rules. The use of computer assistance may require more time to plan and execute than traditional paper-and-pencil methods. However the post-interview time at the national level would be significantly shortened.
Proxy interviews should be avoided as much as possible in cultural participation surveys. Proxy answers on participation in cultural activities underestimate the phenomenon because the respondent doesn’t know all the cultural activities carried on by all the members of the household.
3.4.4 Sampling design
It is recommended that the final sampling unit should be the individual but each participating country should design its sample selection according to what is most efficient to that country.
- 39 -
It is possible to use a sample based on individuals as primary sampling units or a sample where the primary sampling units are represented by households and the second sampling units are all the actual components belonging to each household included in the sample.
The survey should be based on a probability sample from which results representative of the population at agreed age ranges could be derived. The recommendation is to use a stratified sample of individuals, at least according to age and gender.
It is also recommended that the survey should be carried out in all national languages or in the languages that cover the wide majority of the population.
3.4.5 Sample size
Calculation of sample sizes should take into account that this should be a survey with multiple objectives. It has to ensure representative results for all the estimates produced. In particular calculation of sample size should take into account that each statistics have to be tabulated by age, sex, education level, employment situation, geographical location and type of locality.
As budgets are limited, the design of study involves making trade-offs along various dimensions. Larger samples make it possible to analyse sub-groups in depth but every interview increases the cost of the survey.
The sample size should take into account the coverage of specific groups which would be the targets for analysis, like for example unemployed persons on various levels of educational attainment or gender or age. The proportion of those sub-groups in the population should be taken into account. However, as it is difficult to take into account the possible non-response rates in different countries in advance, a target of received responses (completed questionnaires) could be set.
The calculation of sample sizes should be based on precision requirements. On this basis countries should decide on sample design and calculate the sample sizes in order to receive estimates with sufficient quality.
On the basis of the previous considerations, it is suggested to adopt a mixed view, based on both cost and organizational criteria and on an evaluation of the sample errors of the main estimates on a national level and with reference to each of the territorial domains and to each of the breakdown variables of interest.
3.4.6 Measurement errors
Measurement errors can be reduced by ensuring that the questions are easily understood and that interviewing is done in a consistent standardised manner. Therefore testing and piloting of the questionnaire should be conducted in as many countries as possible.
Cognitive research methods such as focus groups (8-10 persons) and qualitative interviews can be used (even in countries which cannot do piloting because of time or other constraints) for better understanding of the ways respondents comprehend survey
- 40 -
instructions and questions, recall requested information, and how the word and question order can affect responses.
In this context, an agreement is necessary on the kind of cognitive, pre-testing and piloting methods to be used for the development of the outline and national questionnaires.
Another key element affecting the quality of the data is the fieldwork. Each country should strive to get experienced high quality interviewers. It is suggested, that a common outline training manual and common interviewer instructions are developed.
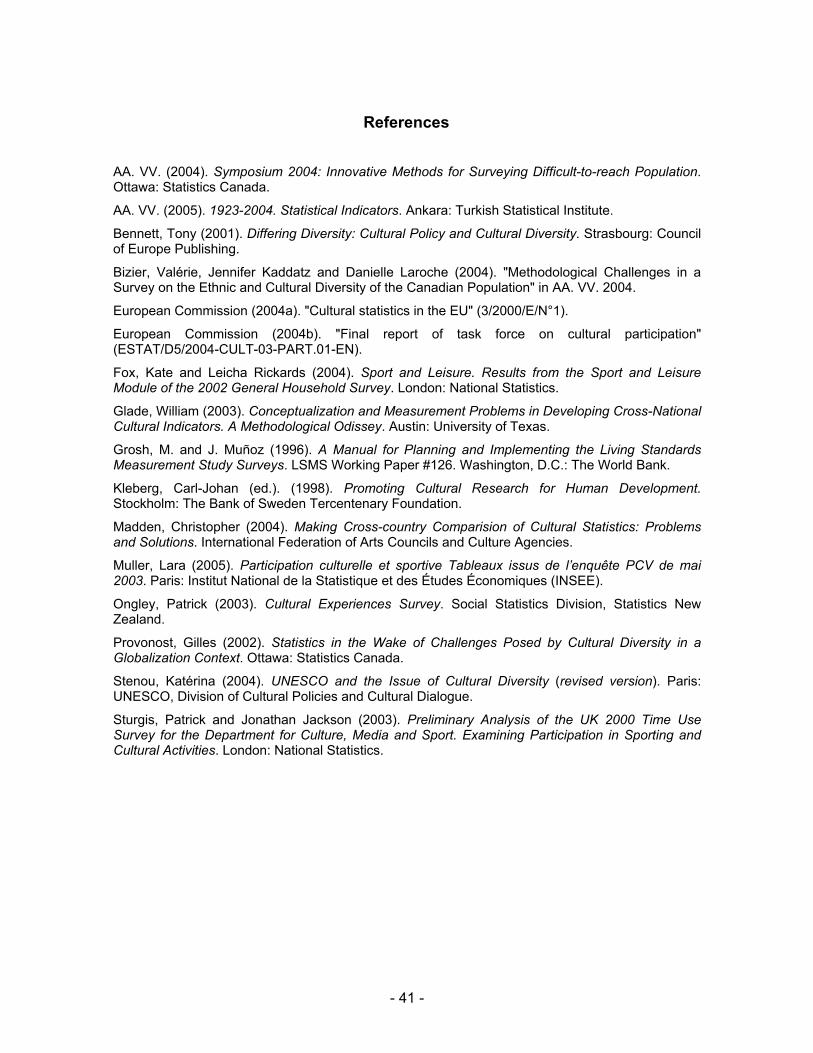
- 41 -
References AA. VV. (2004). Symposium 2004: Innovative Methods for Surveying Difficult-to-reach Population. Ottawa: Statistics Canada.
AA. VV. (2005). 1923-2004. Statistical Indicators. Ankara: Turkish Statistical Institute.
Bennett, Tony (2001). Differing Diversity: Cultural Policy and Cultural Diversity. Strasbourg: Council of Europe Publishing.
Bizier, Valérie, Jennifer Kaddatz and Danielle Laroche (2004). "Methodological Challenges in a Survey on the Ethnic and Cultural Diversity of the Canadian Population" in AA. VV. 2004.
European Commission (2004a). "Cultural statistics in the EU" (3/2000/E/N°1).
European Commission (2004b). "Final report of task force on cultural participation" (ESTAT/D5/2004-CULT-03-PART.01-EN).
Fox, Kate and Leicha Rickards (2004). Sport and Leisure. Results from the Sport and Leisure Module of the 2002 General Household Survey. London: National Statistics.
Glade, William (2003). Conceptualization and Measurement Problems in Developing Cross-National Cultural Indicators. A Methodological Odissey. Austin: University of Texas.
Grosh, M. and J. Muñoz (1996). A Manual for Planning and Implementing the Living Standards Measurement Study Surveys. LSMS Working Paper #126. Washington, D.C.: The World Bank.
Kleberg, Carl-Johan (ed.). (1998). Promoting Cultural Research for Human Development. Stockholm: The Bank of Sweden Tercentenary Foundation.
Madden, Christopher (2004). Making Cross-country Comparision of Cultural Statistics: Problems and Solutions. International Federation of Arts Councils and Culture Agencies.
Muller, Lara (2005). Participation culturelle et sportive Tableaux issus de l’enquête PCV de mai 2003. Paris: Institut National de la Statistique et des Études Économiques (INSEE).
Ongley, Patrick (2003). Cultural Experiences Survey. Social Statistics Division, Statistics New Zealand.
Provonost, Gilles (2002). Statistics in the Wake of Challenges Posed by Cultural Diversity in a Globalization Context. Ottawa: Statistics Canada.
Stenou, Katérina (2004). UNESCO and the Issue of Cultural Diversity (revised version). Paris: UNESCO, Division of Cultural Policies and Cultural Dialogue.
Sturgis, Patrick and Jonathan Jackson (2003). Preliminary Analysis of the UK 2000 Time Use Survey for the Department for Culture, Media and Sport. Examining Participation in Sporting and Cultural Activities. London: National Statistics.

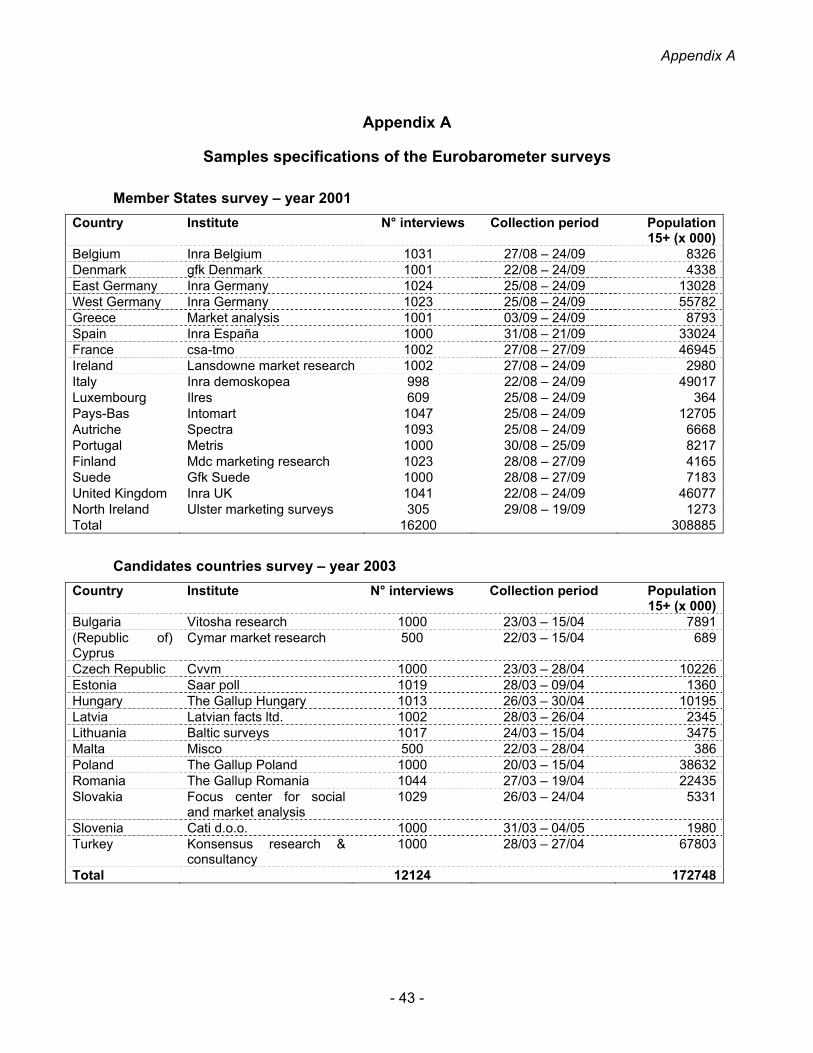
Appendix A
- 43 -
Appendix A
Samples specifications of the Eurobarometer surveys
Member States survey – year 2001 Country Institute N° interviews Collection period Population
15+ (x 000)Belgium Inra Belgium 1031 27/08 – 24/09 8326Denmark gfk Denmark 1001 22/08 – 24/09 4338East Germany Inra Germany 1024 25/08 – 24/09 13028West Germany Inra Germany 1023 25/08 – 24/09 55782Greece Market analysis 1001 03/09 – 24/09 8793Spain Inra España 1000 31/08 – 21/09 33024France csa-tmo 1002 27/08 – 27/09 46945Ireland Lansdowne market research 1002 27/08 – 24/09 2980Italy Inra demoskopea 998 22/08 – 24/09 49017Luxembourg Ilres 609 25/08 – 24/09 364Pays-Bas Intomart 1047 25/08 – 24/09 12705Autriche Spectra 1093 25/08 – 24/09 6668Portugal Metris 1000 30/08 – 25/09 8217Finland Mdc marketing research 1023 28/08 – 27/09 4165Suede Gfk Suede 1000 28/08 – 27/09 7183United Kingdom Inra UK 1041 22/08 – 24/09 46077North Ireland Ulster marketing surveys 305 29/08 – 19/09 1273Total 16200 308885
Candidates countries survey – year 2003 Country Institute N° interviews Collection period Population
15+ (x 000)Bulgaria Vitosha research 1000 23/03 – 15/04 7891(Republic of) Cyprus
Cymar market research 500 22/03 – 15/04 689
Czech Republic Cvvm 1000 23/03 – 28/04 10226Estonia Saar poll 1019 28/03 – 09/04 1360Hungary The Gallup Hungary 1013 26/03 – 30/04 10195Latvia Latvian facts ltd. 1002 28/03 – 26/04 2345Lithuania Baltic surveys 1017 24/03 – 15/04 3475Malta Misco 500 22/03 – 28/04 386Poland The Gallup Poland 1000 20/03 – 15/04 38632Romania The Gallup Romania 1044 27/03 – 19/04 22435Slovakia Focus center for social
and market analysis 1029 26/03 – 24/04 5331
Slovenia Cati d.o.o. 1000 31/03 – 04/05 1980Turkey Konsensus research &
consultancy 1000 28/03 – 27/04 67803
Total 12124 172748
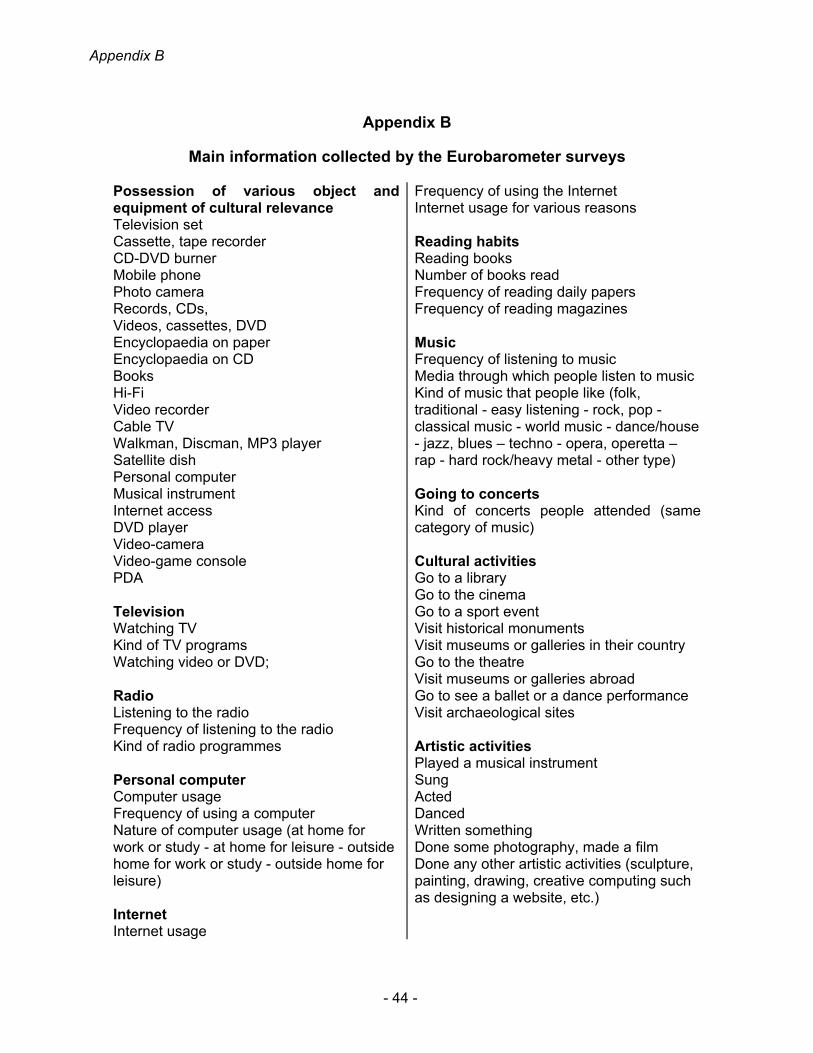
Appendix B
- 44 -
Appendix B
Main information collected by the Eurobarometer surveys Possession of various object and equipment of cultural relevance Television set Cassette, tape recorder CD-DVD burner Mobile phone Photo camera Records, CDs, Videos, cassettes, DVD Encyclopaedia on paper Encyclopaedia on CD Books Hi-Fi Video recorder Cable TV Walkman, Discman, MP3 player Satellite dish Personal computer Musical instrument Internet access DVD player Video-camera Video-game console PDA Television Watching TV Kind of TV programs Watching video or DVD; Radio Listening to the radio Frequency of listening to the radio Kind of radio programmes Personal computer Computer usage Frequency of using a computer Nature of computer usage (at home for work or study - at home for leisure - outside home for work or study - outside home for leisure) Internet Internet usage
Frequency of using the Internet Internet usage for various reasons Reading habits Reading books Number of books read Frequency of reading daily papers Frequency of reading magazines Music Frequency of listening to music Media through which people listen to music Kind of music that people like (folk, traditional - easy listening - rock, pop - classical music - world music - dance/house - jazz, blues – techno - opera, operetta – rap - hard rock/heavy metal - other type) Going to concerts Kind of concerts people attended (same category of music) Cultural activities Go to a library Go to the cinema Go to a sport event Visit historical monuments Visit museums or galleries in their country Go to the theatre Visit museums or galleries abroad Go to see a ballet or a dance performance Visit archaeological sites Artistic activities Played a musical instrument Sung Acted Danced Written something Done some photography, made a film Done any other artistic activities (sculpture, painting, drawing, creative computing such as designing a website, etc.)
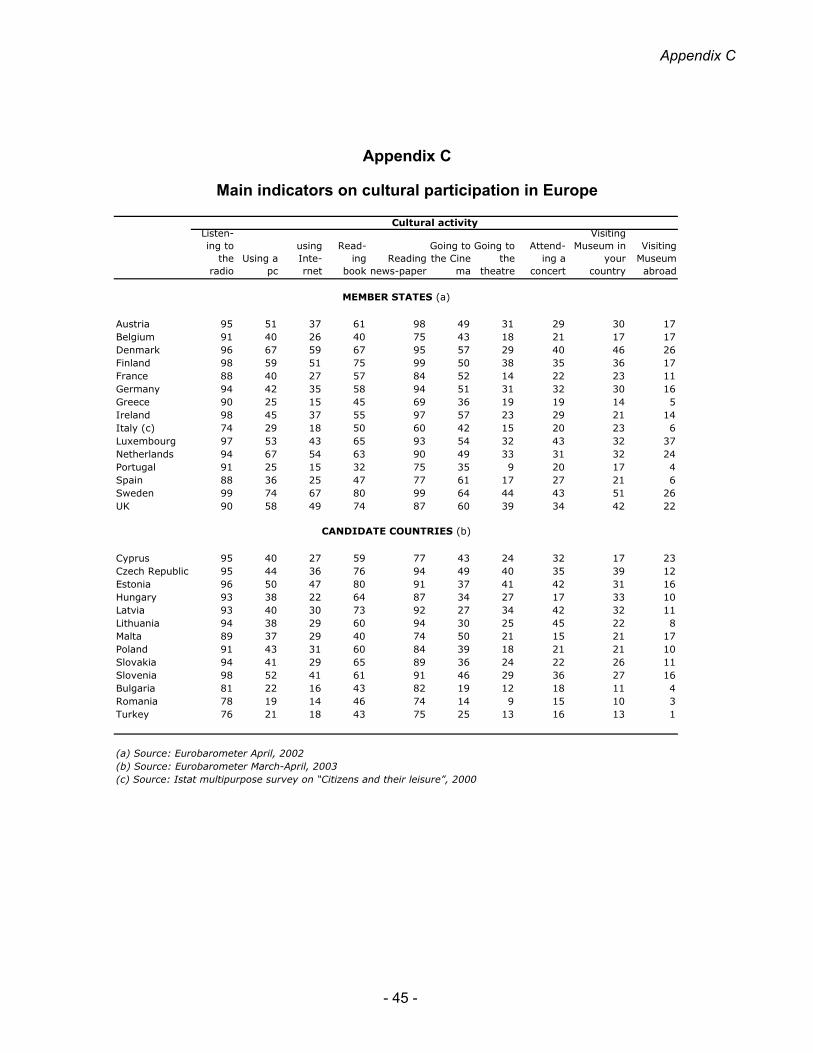
Appendix C
- 45 -
Appendix C
Main indicators on cultural participation in Europe
Cultural activityListen-ing to
the radio
Using a pc
using Inte-rnet
Read-ing
bookReading
news-paper
Going to the Cine
ma
Going to the
theatre
Attend-ing a
concert
Visiting Museum in
your country
Visiting Museum abroad
MEMBER STATES (a)
Austria 95 51 37 61 98 49 31 29 30 17Belgium 91 40 26 40 75 43 18 21 17 17Denmark 96 67 59 67 95 57 29 40 46 26Finland 98 59 51 75 99 50 38 35 36 17France 88 40 27 57 84 52 14 22 23 11Germany 94 42 35 58 94 51 31 32 30 16Greece 90 25 15 45 69 36 19 19 14 5Ireland 98 45 37 55 97 57 23 29 21 14Italy (c) 74 29 18 50 60 42 15 20 23 6Luxembourg 97 53 43 65 93 54 32 43 32 37Netherlands 94 67 54 63 90 49 33 31 32 24Portugal 91 25 15 32 75 35 9 20 17 4Spain 88 36 25 47 77 61 17 27 21 6Sweden 99 74 67 80 99 64 44 43 51 26UK 90 58 49 74 87 60 39 34 42 22
CANDIDATE COUNTRIES (b)
Cyprus 95 40 27 59 77 43 24 32 17 23Czech Republic 95 44 36 76 94 49 40 35 39 12Estonia 96 50 47 80 91 37 41 42 31 16Hungary 93 38 22 64 87 34 27 17 33 10Latvia 93 40 30 73 92 27 34 42 32 11Lithuania 94 38 29 60 94 30 25 45 22 8Malta 89 37 29 40 74 50 21 15 21 17Poland 91 43 31 60 84 39 18 21 21 10Slovakia 94 41 29 65 89 36 24 22 26 11Slovenia 98 52 41 61 91 46 29 36 27 16Bulgaria 81 22 16 43 82 19 12 18 11 4Romania 78 19 14 46 74 14 9 15 10 3Turkey 76 21 18 43 75 25 13 16 13 1
(a) Source: Eurobarometer April, 2002 (b) Source: Eurobarometer March-April, 2003 (c) Source: Istat multipurpose survey on “Citizens and their leisure”, 2000
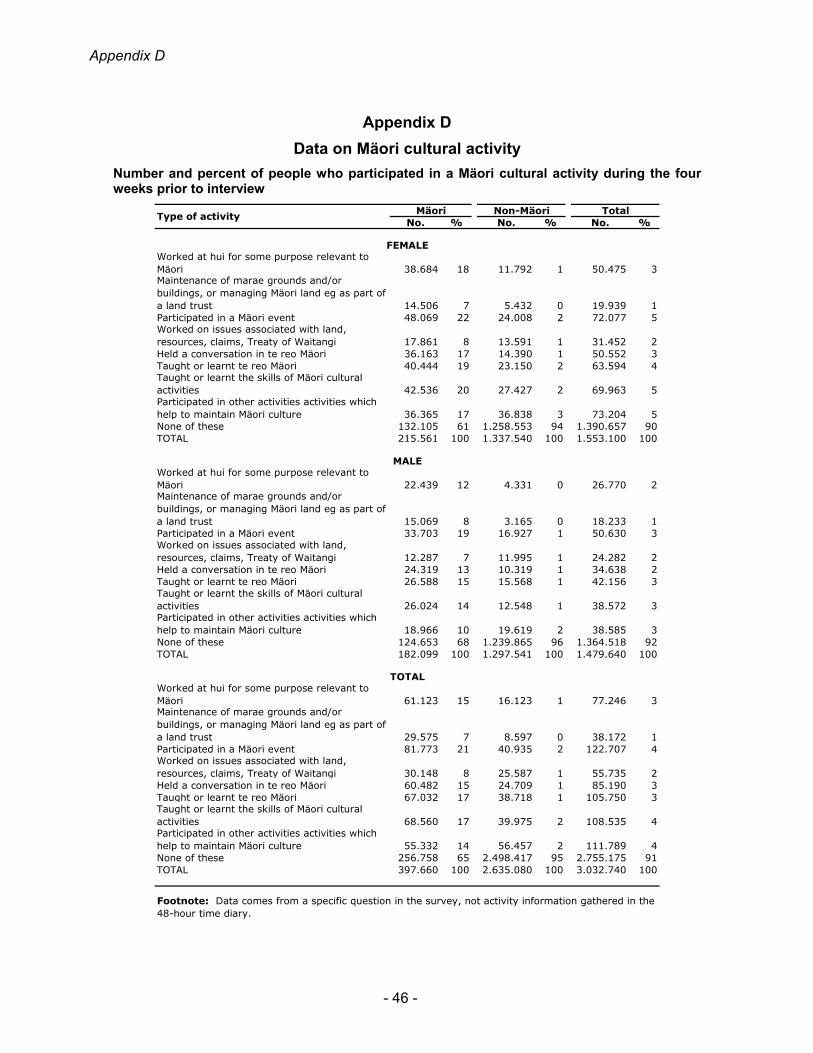
Appendix D
- 46 -
Appendix D Data on Mäori cultural activity
Number and percent of people who participated in a Mäori cultural activity during the four weeks prior to interview
No. % No. % No. %
FEMALEWorked at hui for some purpose relevant to Mäori 38.684 18 11.792 1 50.475 3Maintenance of marae grounds and/or buildings, or managing Mäori land eg as part of a land trust 14.506 7 5.432 0 19.939 1Participated in a Mäori event 48.069 22 24.008 2 72.077 5Worked on issues associated with land, resources, claims, Treaty of Waitangi 17.861 8 13.591 1 31.452 2Held a conversation in te reo Mäori 36.163 17 14.390 1 50.552 3Taught or learnt te reo Mäori 40.444 19 23.150 2 63.594 4Taught or learnt the skills of Mäori cultural activities 42.536 20 27.427 2 69.963 5Participated in other activities activities which help to maintain Mäori culture 36.365 17 36.838 3 73.204 5None of these 132.105 61 1.258.553 94 1.390.657 90TOTAL 215.561 100 1.337.540 100 1.553.100 100
MALEWorked at hui for some purpose relevant to Mäori 22.439 12 4.331 0 26.770 2Maintenance of marae grounds and/or buildings, or managing Mäori land eg as part of a land trust 15.069 8 3.165 0 18.233 1Participated in a Mäori event 33.703 19 16.927 1 50.630 3Worked on issues associated with land, resources, claims, Treaty of Waitangi 12.287 7 11.995 1 24.282 2Held a conversation in te reo Mäori 24.319 13 10.319 1 34.638 2Taught or learnt te reo Mäori 26.588 15 15.568 1 42.156 3Taught or learnt the skills of Mäori cultural activities 26.024 14 12.548 1 38.572 3Participated in other activities activities which help to maintain Mäori culture 18.966 10 19.619 2 38.585 3None of these 124.653 68 1.239.865 96 1.364.518 92TOTAL 182.099 100 1.297.541 100 1.479.640 100
TOTALWorked at hui for some purpose relevant to Mäori 61.123 15 16.123 1 77.246 3Maintenance of marae grounds and/or buildings, or managing Mäori land eg as part of a land trust 29.575 7 8.597 0 38.172 1Participated in a Mäori event 81.773 21 40.935 2 122.707 4Worked on issues associated with land, resources, claims, Treaty of Waitangi 30.148 8 25.587 1 55.735 2Held a conversation in te reo Mäori 60.482 15 24.709 1 85.190 3Taught or learnt te reo Mäori 67.032 17 38.718 1 105.750 3Taught or learnt the skills of Mäori cultural activities 68.560 17 39.975 2 108.535 4Participated in other activities activities which help to maintain Mäori culture 55.332 14 56.457 2 111.789 4None of these 256.758 65 2.498.417 95 2.755.175 91TOTAL 397.660 100 2.635.080 100 3.032.740 100
Type of activity
Footnote: Data comes from a specific question in the survey, not activity information gathered in the 48-hour time diary.
Mäori Non-Mäori Total