Embed Size (px)
Citation preview
Woodland Guidelines 1999
1
Guidelines for Enhancing Grassy Woodlands for the Vegetation Investment Project
October 1999
by David Freudenberger
CSIRO Wildlife & EcologyGPO Box 284CanberraACT 2601Email: [email protected]
A report commissioned by Greening Australia, ACT & SE NSW, Inc.
Woodland Guidelines 1999
2
ACKNOWLEDGMENTS
This project was funded by the Natural Heritage Trust though Greening Australia, ACT SE NSW, Inc. I thankMr Paul Fennell (Canberra Ornithologists Group), Mr James Watson (Australian Defence Force Academy), MrChris Davey and Mr Mark Clayton (CSIRO Wildlife and Ecology) for providing or obtaining the bird survey dataused in this focal species analysis. James Watson also provided the spatial attributes and measured habitat complexityscores for each of the 72 survey sites. Mr Bob Forrester and Dr Nick Nicholls provided statistical advice. MrRobert Palmer provided assistance in generating the many graphs required for the focal species analysis. Mrs AnnMilligan (Science Text Processors Canberra) provided technical editing and page layout services. The GeographyDept of the Australian Defence Force Academy (ADFA) shared in the cost of the SPOT satellite image. Mr DavePaull of ADFA assisted in his capacity as honours supervisor to James Watson and gave advice on spatial analysisof survey sites. Drs Julian Reid, Sue Briggs, Dick Schodde, John Ive, Allen Kearns, Peter Catling and Rob Lambeckprovided comments on preliminary data analysis or drafts of this report. Ms Alison Elvin (Greening Australia) wasinvaluable in supporting this project and helping to obtain access to survey sites on privately held land.
Our thanks also to Mr Toby Jones (Greening Australia) for giving CSIRO the opportunity to participate in theVegetation Investment Project.
CONTENTS
page 2 Acknowledgments 3 Summary 4 Introduction 4 Terms of reference 4 The focal species approach 5 Threats in the landscape 6 The use of birds 7 Methods 7 Bird surveys 7 Habitat complexity 7 Spatial data 8 Data analysis 9 Results 9 Survey sites 9 Species number10 Individual species11 Vulnerable species12 Discussion12 Candidate focal species13 Intermediate focal species13 Recommendations13 Landscape guidelines for regetation14 Priority areas for revegetation15 Plant species for use in revegetation16 Conclusions17 References18 Appendix 1. Report on the Action Planning Workshop22 Appendix 2. Bird survey data and statistics24 Appendix 3. Example of a score sheet for habitat complexity assessment25 Appendix 4. Graphs of presence or absence of woodland bird species
Woodland Guidelines 1999
3
CSIRO Wildlife and Ecology was contracted byGreening Australia to develop revegetationguidelines for the Vegetation Investment Project,which aims to buffer, link and revitalise patchesof remnant vegetation in the ACT/NSW region.
Bird survey data were collected from 72 wood-land remnants of varying age, condition andisolation. From these, CSIRO identified the birdspecies whose habitat was threatened by thesmallness of remnant vegetation patches, their lackof structural complexity and their isolation fromeach other. The Hooded Robin was the mostsensitive species (the focal species) for all threeof these threats. It requires woodland patches thatare greater than 100 ha in area, that are structurallycomplex and that are within about 1000 m of otherpatches. All other woodland birds were found insmaller and less complex patches of remnantvegetation than those needed by the HoodedRobin. However, many woodland birds requiredvegetation patches that were at least 10 ha in areaand had about a 20% cover of shrubs. Many birdspecies were more likely to be found in smallpatches of remnant vegetation (<10 ha) that werewithin about 1000 m of other remnants.
This focal species analysis resulted in thefollowing revegetation recommendations for theVegetation Investment Project.
1. Revegetate so that the areas of woodland patchesare increased to at least 10 ha, and introduce atleast a 20% shrub cover within each patch.
2. Enhance patches that are larger than 10 ha, firstby introducing or increasing shrub cover;second, by increasing the area of the patch; third,
by reducing the isolation of the patch by creatingintermediate patches within 500–1000 m(stepping stone analogy).
3. Revegetation should simultaneously address asmany threats to the environment as possible,such as dryland salinity and erosion, as well ashabitat loss.
4. Conservation of large (>100 ha) and structurallydiverse woodland remnants (abundant groundcover, a mixture of low shrubs, middle-sizeshrubs and wattles and eucalypt overstorey) isa high priority for vulnerable woodland birds.Enhancement of large patches of remnantvegetation by patch planting of shrubs may bewarranted.
5. A longer-term goal should be to create enoughstructurally diverse patches each larger than 10 haand within 500–1000 m of each other todevelop an effectively connected network ofpatches that function like a series of large andcomplex patches (>100 ha).
6. Linear plantings should have first priority alongriparian systems. Linear plantings should beof lower priority for connecting patches that arelarger than 10 ha. Linear plantings should be atleast 25 m wide and should contain a range oftree and shrub species
Implementation of these guidelines by the VegetationInvestment Project should provide useful habitatfor birds and other biota that cannot otherwisepersist in the existing paddock matrix of isolatedtrees and intensively grazed pastures typicallyfound in this region.
SUMMARY
Woodland Guidelines 1999
4
Greening Australia, ACT & SE NSW, Inc. hasreceived Natural Heritage Trust funding for aVegetation Investment Project (VIP) to protect,extend and enhance native remnant vegetation inrural areas surrounding the ACT. The VegetationInvestment Project has three objectives:
v to buffer, link and revitalise remnant vegetation;v to directly tackle the threats to biological
diversity;v to provide the backbone for strategic broad-
scale revegetation.
The project aims to safeguard native remnantvegetation, including native grasslands, byfencing-off the remnants and revegetating theareas around them to create buffer zones. Thisproject has funding for at least 95 ha ofrevegetation and 80 km of fencing, and three areasfor priority actions:
v O’Connor Ridge to the Molonglo River viaBlack Mountain and the Pinnacle,
v Majura Field Firing Range to Hall via MulligansFlat,
v Hall to the Murrumbidgee River Corridor.
Greening Australia contracted CSIRO Wildlifeand Ecology to develop revegetation guidelinesfor the project, based on the focal speciesframework of Lambeck (1999).
Terms of referenceThese services are to be provided by CSIRO:
1. determine the approximate habitat needs ofcandidate ‘focal species’ in each project zone,particularly in regard to their minimum habitatrequirements, the connection between habitatpatches and their vulnerability to threateningprocesses;
2. conduct a literature search and survey of expertknowledge to recommend where landscapefencing and planting will best be done, and withwhat species, to maximise the regionalconservation value of the on-ground activities;
3. help organise and run an Action PlanningWorkshop involving participants with localexpert knowledge of the habitat requirementsof key taxa;
4. provide a summary of workshop outcomeswithin five days of the meeting;
5. provide a project report which prescribes keyactions the Vegetation Investment Project cantake to form a framework for future vegetationmanagement activities;
6. participate actively throughout the three-yearproject as a member of the VegetationInvestment Project Steering Committee.
This report encompasses services 1–5. A summaryof the Action Planning Workshop (service 4), heldat the beginning of the consultancy, is attached(Appendix 1).
The focal species approach
To prevent the further loss of species fromlandscapes threatened by habitat loss,fragmentation, and habitat simplification, it isnecessary to determine the composition, quantityand configuration of habitats required to meet theneeds of those species that are still present.Lambeck (1997) presented an approach fordefining the landscape attributes required to meetthe needs of biota and the management regimesthat should be applied.
Lambeck’s approach identifies a suite ofsensitive species, each of which is used to definethe configuration and composition of habitatsthat must be present in the landscape. Thespecies which is identified as being mostsensitive to a threat in the landscape is termedthe ‘focal’ species. For example, the most area-limited species1 is used to define the minimumarea required for different habitat patches, andthe most dispersal-limited species2 defines theconfiguration of patches and the characteristicsof connecting vegetation. It is assumed thatbecause the most demanding species areselected, a landscape designed and managed tomeet their needs will encompass the requirementsof all other species. Lambeck (1999) uses this
I NTRODUCTION
1 the species that is found only in patches larger than a certain size (area)2 the species that is found only in patches separated by a certain minimum distance
Woodland Guidelines 1999
5
approach to define minimum areas forrevegetation and the need for increasedconnectivity in various regions of the WesternAustralian wheat–sheep zone. The focal speciesapproach has been used to develop therevegetation guidelines described below for theVegetation Investment Project.
Threats in the landscape
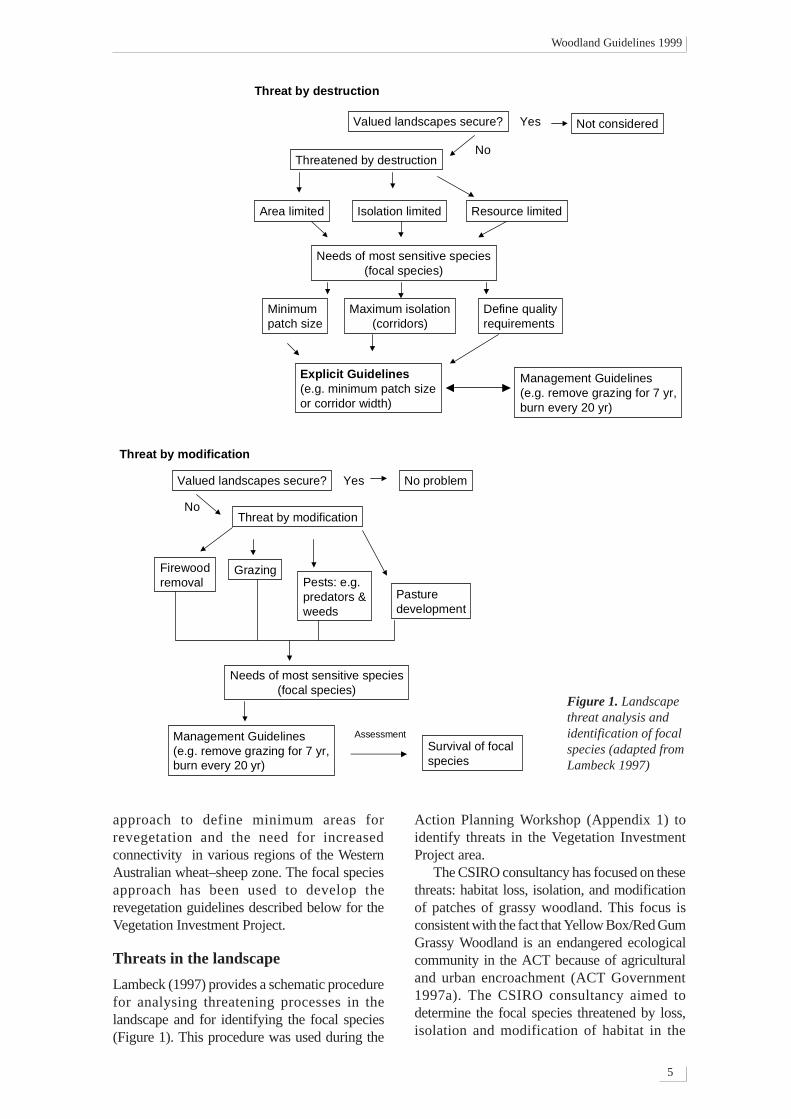
Lambeck (1997) provides a schematic procedurefor analysing threatening processes in thelandscape and for identifying the focal species(Figure 1). This procedure was used during the
Action Planning Workshop (Appendix 1) toidentify threats in the Vegetation InvestmentProject area.
The CSIRO consultancy has focused on thesethreats: habitat loss, isolation, and modificationof patches of grassy woodland. This focus isconsistent with the fact that Yellow Box/Red GumGrassy Woodland is an endangered ecologicalcommunity in the ACT because of agriculturaland urban encroachment (ACT Government1997a). The CSIRO consultancy aimed todetermine the focal species threatened by loss,isolation and modification of habitat in the
Figure 1. Landscapethreat analysis andidentification of focalspecies (adapted fromLambeck 1997)
Threat by destruction
Valued landscapes secure? Not considered
Threatened by destruction
Area limited Isolation limited Resource limited
Minimumpatch size
Maximum isolation(corridors)
Define qualityrequirements
Explicit Guidelines(e.g. minimum patch sizeor corridor width)
Management Guidelines(e.g. remove grazing for 7 yr,burn every 20 yr)
Yes
No
Needs of most sensitive species(focal species)
Threat by modification
Valued landscapes secure? No problem
Threat by modification
GrazingPests: e.g.predators &weeds
Pasturedevelopment
Management Guidelines(e.g. remove grazing for 7 yr,burn every 20 yr)
Yes
No
Firewoodremoval
Needs of most sensitive species(focal species)
AssessmentSurvival of focal species

Woodland Guidelines 1999
6
Vegetation Investment Project area. This hasproduced recommendations for the minimum-sizeareas that the Vegetation Investment Projectrevegetation initiative should aim to replant, andfor their placement and structural composition.
The use of birds
Lambeck (1999) and S. Briggs (pers. comm.) havefound birds to be useful focal species. Birds aremobile; they move across and use patches at theplanning scale — i.e. hectares (paddocks) andkilometres (properties). Birds are useful becausethey are relatively easy to survey, being abundantand visible during the day. Native mammals areexposed to similar landscape threats, but theirdensities are low and they are often difficult tosurvey. Bats, in particular, could be candidate focalspecies because they use landscapes at scalessimilar to those of birds (Lumsden et al. 1995),but they are more difficult to sample (e.g.nocturnal). Reptiles and invertebrates are potentialfocal species for identifying finer-scale threatscaused by loss of micro-habitats such as logs orbark. Plant species are less amenable to analysisof area loss and isolation, because little is knownabout the minimum viable space or maximumisolation that plants can tolerate. However, plants
are useful when the management required forhabitat patches must be determined, e.g. thecontrol of grazing or the use of fire.
Birds are also useful focal species because theyare placed well to the top of food chains. Manywoodland birds feed on a wide variety of insects(Ford 1986), which in turn require a mixture ofplant species and types. Thus, it is assumed thatthe habitat requirements of focal birds species willencompass the needs of a wide range of other biota.
Birds have been chosen as the focus of thisconsultancy because it is known that many of themhave become scarce in the ACT and its borderingNSW area. The Hooded Robin (Melanodryascucullata), Swift Parrot (Lathamus discolor),Superb Parrot (Polytelis swainsonii), BrownTreecreeper (Climacteris picumnus), PaintedHoneyeater (Grantiella picta) and the RegentHoneyeater (Xanthomyza phrygia) have beendeclared threatened species in the ACT (ACTGovernment 1997b–g). All these species arethreatened by the clearance of once-widespreadnative open forest and woodland, particularly Boxwoodlands, and by urban development that hasfragmented and degraded remaining viable habitatareas (ACT Government 1997a–g).
Woodland Guidelines 1999
7
Bird surveys
Presence and absence data were collected from72 sites in the northern ACT and in the sur-rounding region in NSW (Appendix 2, Table A5).The data were obtained from several sources.
Data from eight open-paddock sites weregleaned from an unpublished database held byC. Davey, CSIRO Wildlife and Ecology, Canberra.These data were collected over a three-year period,on an approximately monthly basis as part of aseparate study on rabbits. Presence data were usedonly from February–April 1995. Data from sevenwoodland sites were obtained from the CanberraOrnithologists Group. Five of these sites werefrom the group’s fixed woodland sites, surveyedduring March and April 1999. Data from two othersites (Black Mountain and Mt Majura) wereobtained from the Canberra Ornithologists Groupdatabase using data only from January–March1996–1998. Data from three sites were obtainedfrom Er (1995) who sampled Yellow Boxwoodlands in the ACT on a regular basis duringthe late summer and autumn of 1995. Data from29 sites were obtained from James Watson(Australian Defence Force Academy). Data froma final 27 sites were collected by Mark Clayton,CSIRO Wildlife and Ecology.
The data of Watson and Clayton werecollected in a consistent and uniform manner(Recher 1989). Each site was visited in eitherthe morning or the evening, on three occasionseach lasting 20 minutes. Only presence datawere recorded. Each site was actively searchedby walking through as much of it as possible inthe allotted time. Additional time was spent insites larger than 100 ha, to complete a thoroughsearch. Data were collected during 27 February–29 April 1999.
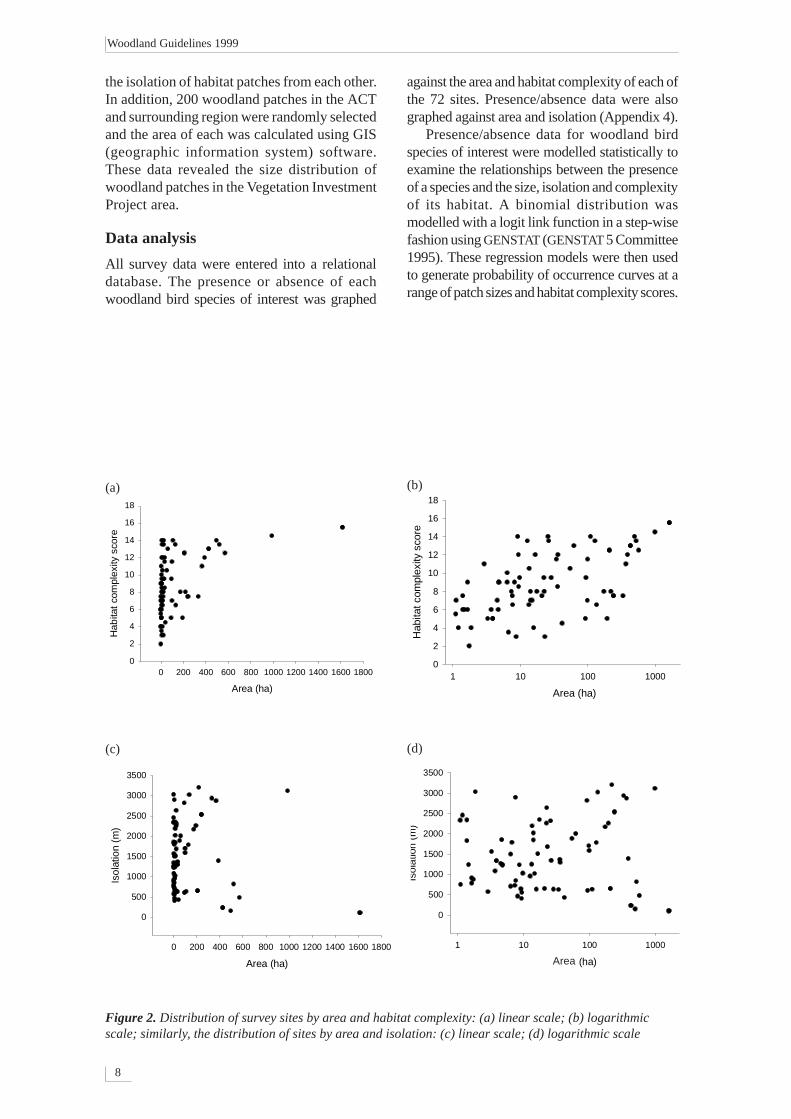
Survey sites covered an even range ofwoodland patch sizes on a logarithmic scale.Hence, there were fewer large sites and more smallsites (Figure 2). Site selection was constrainedby the difficulty of obtaining permission to surveyon privately held land, particularly in NSW whereit proved nearly impossible to obtain the namesand phone numbers of landholders with potential
survey sites. The majority of sites were on publicland. About half the sites were surrounded bysuburbia, and the other half were in rural areas.
Habitat complexity
The distribution and abundance of birds dependon landscape variables such as the size of a habitatpatch and its composition. The structural diversityof a patch — i.e. its canopy cover, its density ofshrubs and the amounts of litter and ground cover— has been shown to strongly influence thediversity of bird species in an area (Wiens 1989).
Structural diversity was measured using a rapidappraisal method first developed by Newsome andCatling (1979) to explain the diversity of mammalsfound in a wide range of habitats. At each site, ahabitat complexity score, modified from onedescribed by Catling and Burt (1995) was derivedon the basis of six features: tree canopy cover,tall shrub cover (2–4 m), short shrub cover (0.5–2 m), ground herbage cover, the relative amountsof logs and/or rocks, and the relative amount ofground litter (see Appendix 3 for a sample datasheet). Each feature was rated on a scale of 0–3,and the scores for the six features were totalled togive an overall score. A score below 5 representsa woodland with poor structure with nounderstorey shrubs and little ground cover. A scoreof 5–9 represents a grassy woodland withmoderate structure comprising > 20% shrubs and10–50% cover of ground herbage, logs and litter.A score greater than 10 describes a structurallycomplex woodland. The dominant tree species ateach site and any signs of recent disturbance (e.g.fire) were recorded.
Spatial data
A SPOT satellite image (April 1997) was obtainedfor the ACT/NSW region so that the area ofwoodland within each survey site could becalculated efficiently. SPOT images have aresolution of 10 m x 10 m. For each survey site,this image was also used to calculate the averagedistance to the nearest five patches of woodland>0.5 ha (the ‘isolation index’). R. Lambeck (pers.comm.) found this to be a useful measure of
METHODS
Woodland Guidelines 1999
8
Log area (ha)
1 10 100 1000
Isol
atio
n (m
)
0
500
1000
1500
2000
2500
3000
3500
the isolation of habitat patches from each other.In addition, 200 woodland patches in the ACTand surrounding region were randomly selectedand the area of each was calculated using GIS(geographic information system) software.These data revealed the size distribution ofwoodland patches in the Vegetation InvestmentProject area.
Data analysis
All survey data were entered into a relationaldatabase. The presence or absence of eachwoodland bird species of interest was graphed
against the area and habitat complexity of each ofthe 72 sites. Presence/absence data were alsographed against area and isolation (Appendix 4).
Presence/absence data for woodland birdspecies of interest were modelled statistically toexamine the relationships between the presenceof a species and the size, isolation and complexityof its habitat. A binomial distribution wasmodelled with a logit link function in a step-wisefashion using GENSTAT (GENSTAT 5 Committee1995). These regression models were then usedto generate probability of occurrence curves at arange of patch sizes and habitat complexity scores.
Figure 2. Distribution of survey sites by area and habitat complexity: (a) linear scale; (b) logarithmicscale; similarly, the distribution of sites by area and isolation: (c) linear scale; (d) logarithmic scale
Area (ha)
0 200 400 600 800 1000 1200 1400 1600 1800
Hab
itat
com
plex
ity s
core
0
2
4
6
8
10
12
14
16
18
Log Area (ha)
1 10 100 1000
Hab
itat c
ompl
exity
sco
re
0
2
4
6
8
10
12
14
16
18
Area (ha)
0 200 400 600 800 1000 1200 1400 1600 1800
Isol
atio
n (m
)
0
500
1000
1500
2000
2500
3000
3500
(a) (b)
(c) (d)
Area
Woodland Guidelines 1999
9
Survey sites
Data were obtained from sites that ranged in sizefrom 1.1 ha to 1617 ha, with a median size of20 ha (Figure 2). The isolation indexes (meandistance to five nearest neighbours) ranged from0.3 to 3.8 km, with a median isolation of 1.25 km.Habitat complexity scores ranged from 2 to 15.5,with a median score of 8. Patches of all sizes wereequally likely to be isolated from each other(Figure 2d), but there were no small (<10 ha)patches with a habitat complexity score >11.5, andno large (>100 ha) patches with a complexity score<5 (Figure 2b). There was a significant correlation(r = 0.56, p < 0.01) between habitat complexityscore and logarithm of the size of each site,indicating that small sites tended to be structurallysimple, and larger sites tended to be more complexin structure. There were no significant correlationsbetween isolation and complexity or area.
Nearly 70% of the 200 randomly selectedpatches were smaller than 20 ha, and only 10% ofthem were larger than 100 ha (Table 1).
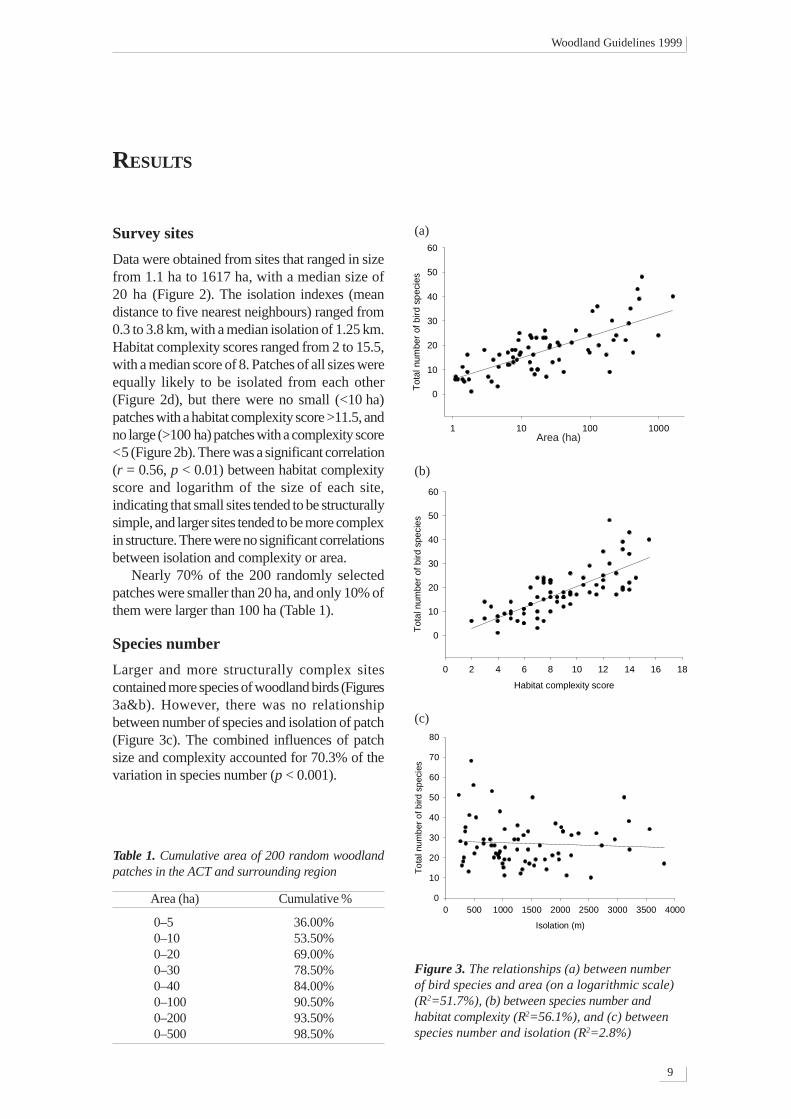
Species number
Larger and more structurally complex sitescontained more species of woodland birds (Figures3a&b). However, there was no relationshipbetween number of species and isolation of patch(Figure 3c). The combined influences of patchsize and complexity accounted for 70.3% of thevariation in species number (p < 0.001).
RESULTS
Figure 3. The relationships (a) between numberof bird species and area (on a logarithmic scale)(R2=51.7%), (b) between species number andhabitat complexity (R2=56.1%), and (c) betweenspecies number and isolation (R2=2.8%)
Table 1. Cumulative area of 200 random woodlandpatches in the ACT and surrounding region
Area (ha) Cumulative %
0–5 36.00% 0–10 53.50% 0–20 69.00% 0–30 78.50% 0–40 84.00% 0–100 90.50% 0–200 93.50% 0–500 98.50%
(c)
(b)
(a)
1 10 100 1000T
otal
num
ber
of b
ird
spec
ies
0
10
20
30
40
50
60
Area (ha)
Habitat complexity score
0 2 4 6 8 10 12 14 16 18
Tot
al n
umbe
r of
bird
spe
cies
0
10
20
30
40
50
60
Isolation (m)
0 500 1000 1500 2000 2500 3000 3500 4000
Tot
al n
umbe
r of
bird
spe
cies
0
10
20
30
40
50
60
70
80
Woodland Guidelines 1999
10
Log area (ha)
1 10 100 1000
Hab
itat c
ompl
exity
sco
re
0
2
4
6
8
10
12
14
16
18
Log area (ha)
1 10 100 1000
Isol
atio
n (m
)
0
500
1000
1500
2000
2500
3000
3500
4000
PresentAbsent
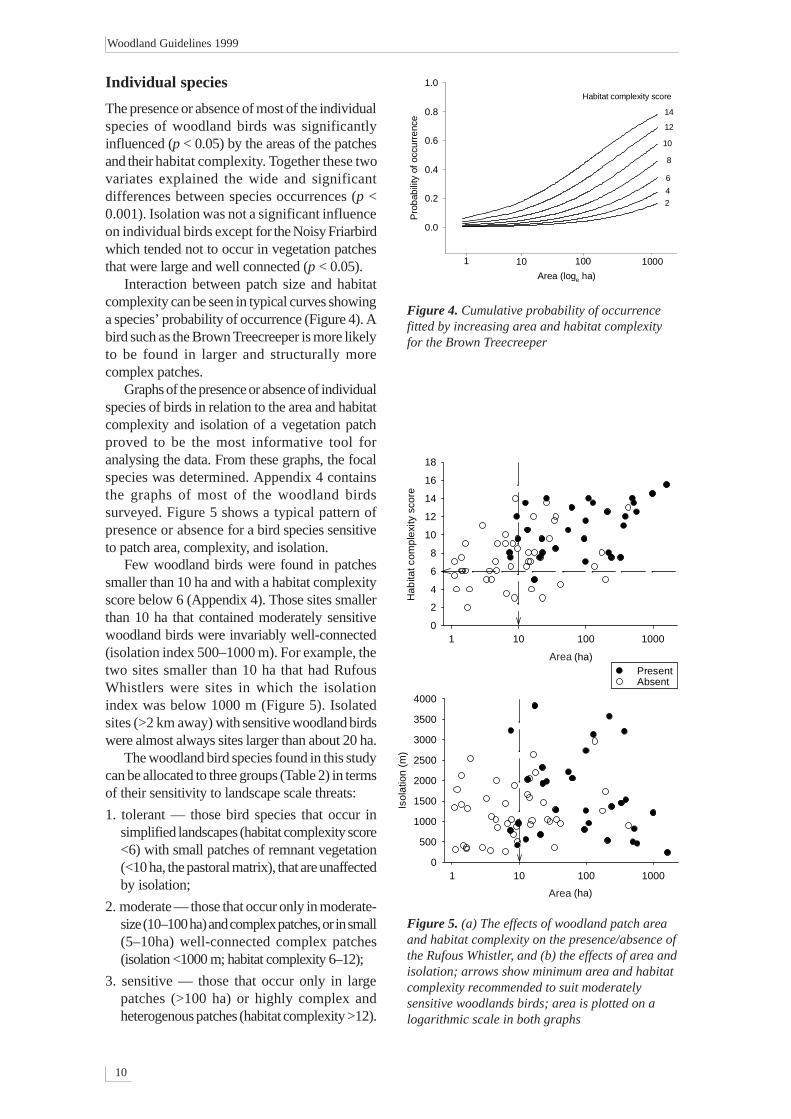
Individual species
The presence or absence of most of the individualspecies of woodland birds was significantlyinfluenced (p < 0.05) by the areas of the patchesand their habitat complexity. Together these twovariates explained the wide and significantdifferences between species occurrences (p <0.001). Isolation was not a significant influenceon individual birds except for the Noisy Friarbirdwhich tended not to occur in vegetation patchesthat were large and well connected (p < 0.05).
Interaction between patch size and habitatcomplexity can be seen in typical curves showinga species’ probability of occurrence (Figure 4). Abird such as the Brown Treecreeper is more likelyto be found in larger and structurally morecomplex patches.
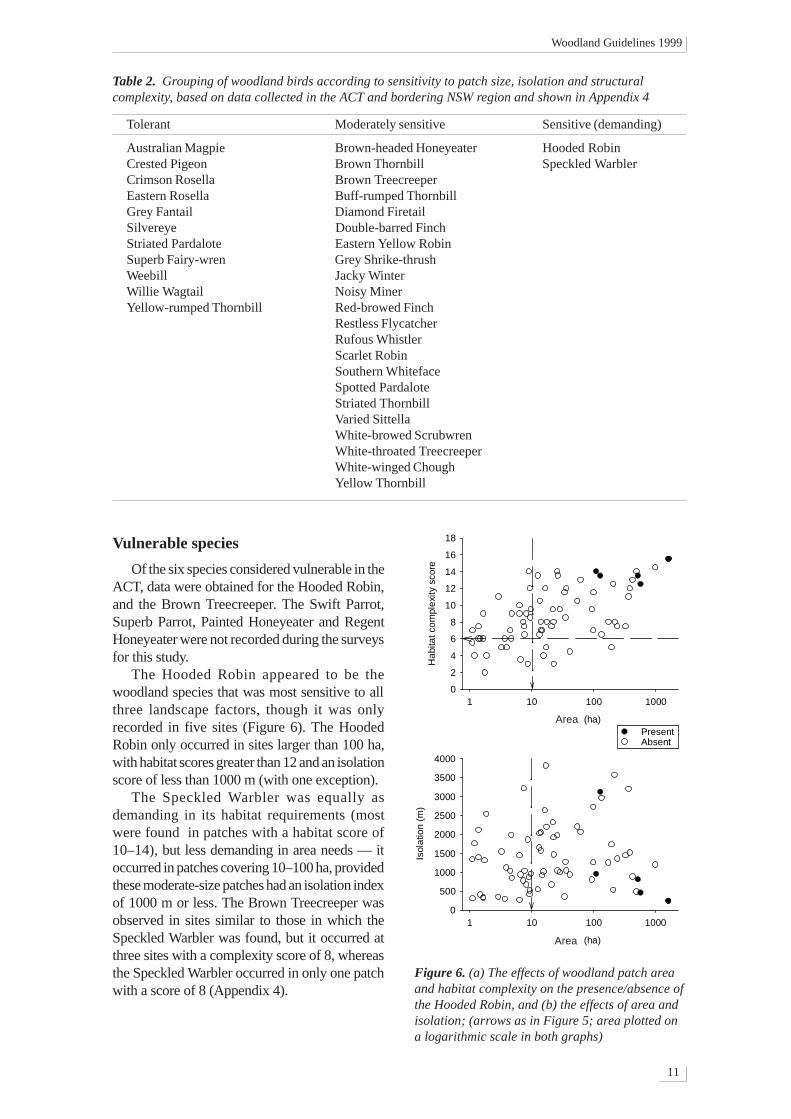
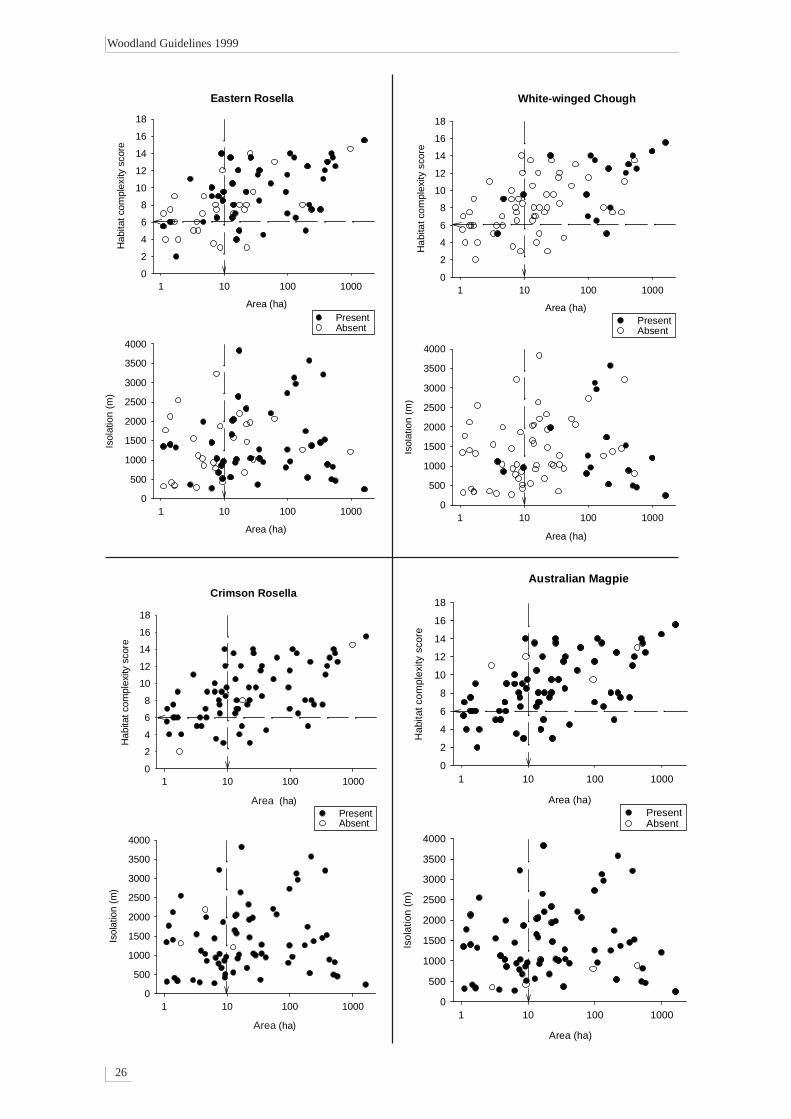
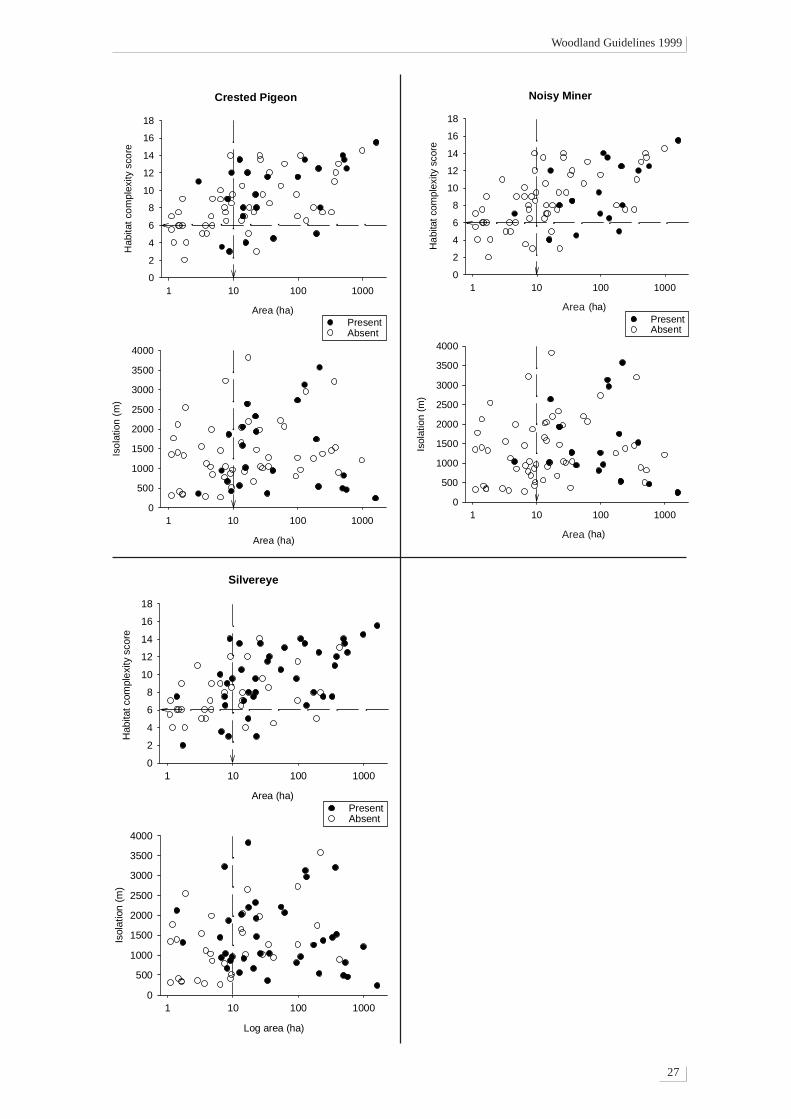
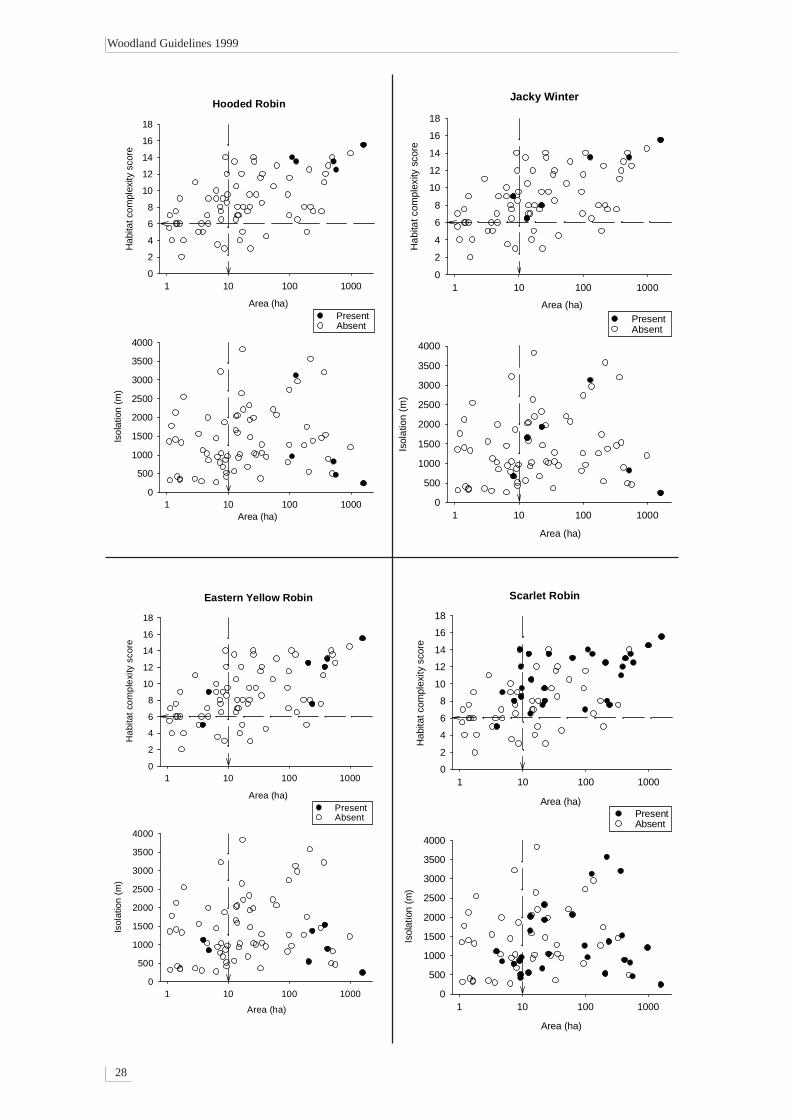
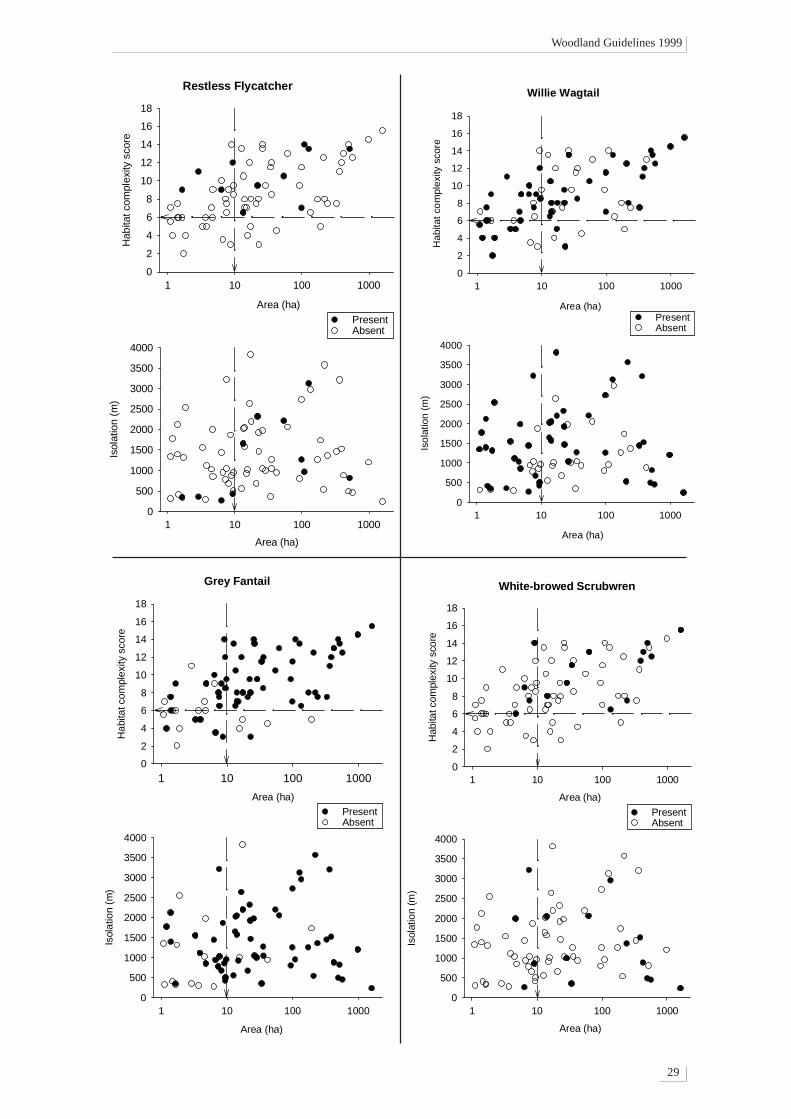
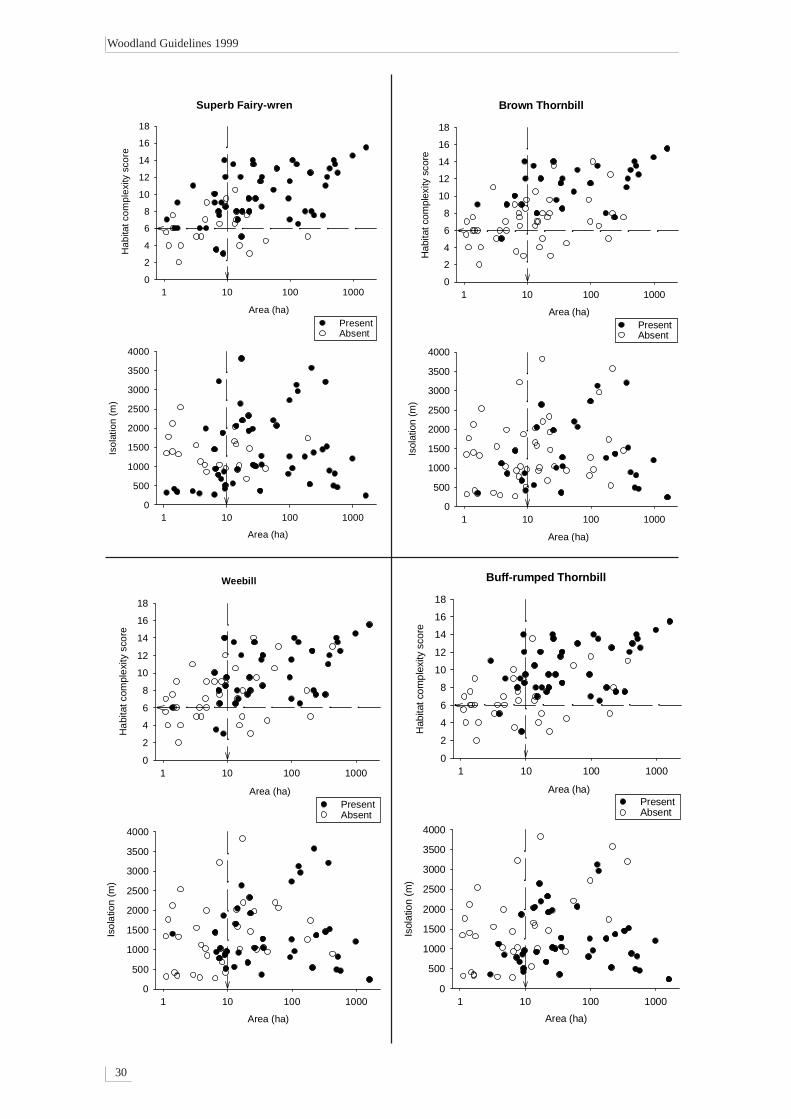
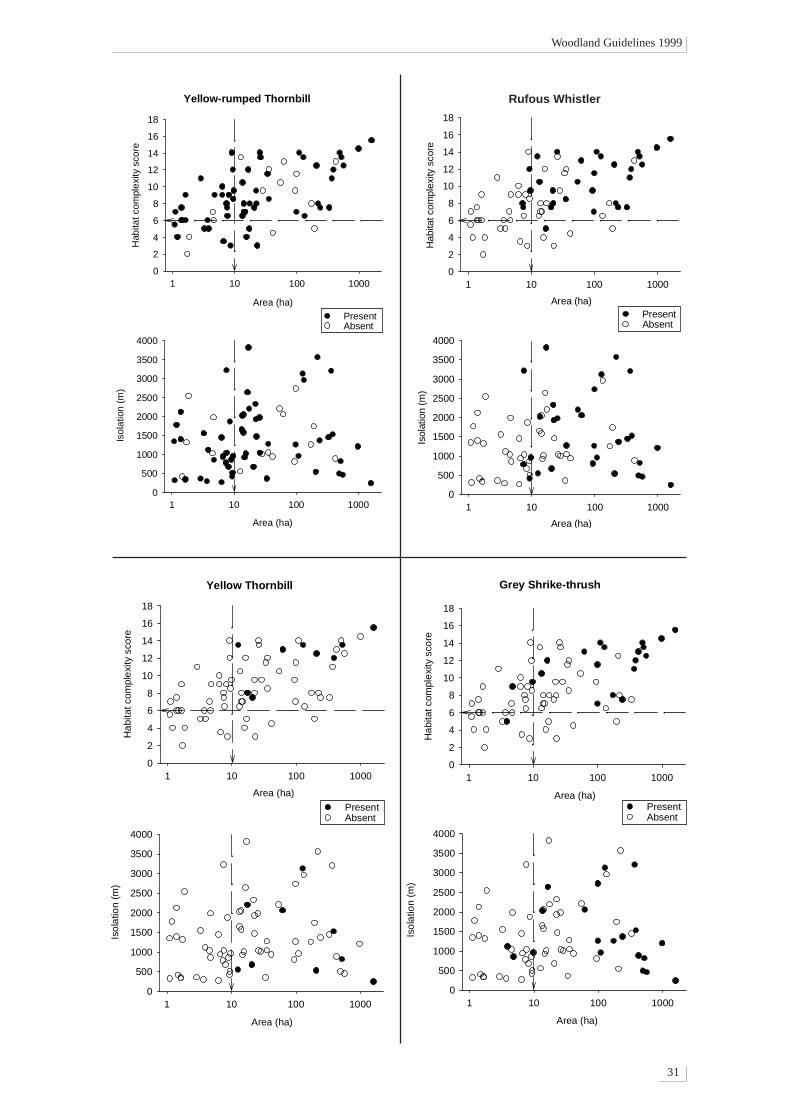
Graphs of the presence or absence of individualspecies of birds in relation to the area and habitatcomplexity and isolation of a vegetation patchproved to be the most informative tool foranalysing the data. From these graphs, the focalspecies was determined. Appendix 4 containsthe graphs of most of the woodland birdssurveyed. Figure 5 shows a typical pattern ofpresence or absence for a bird species sensitiveto patch area, complexity, and isolation.
Few woodland birds were found in patchessmaller than 10 ha and with a habitat complexityscore below 6 (Appendix 4). Those sites smallerthan 10 ha that contained moderately sensitivewoodland birds were invariably well-connected(isolation index 500–1000 m). For example, thetwo sites smaller than 10 ha that had RufousWhistlers were sites in which the isolationindex was below 1000 m (Figure 5). Isolatedsites (>2 km away) with sensitive woodland birdswere almost always sites larger than about 20 ha.
The woodland bird species found in this studycan be allocated to three groups (Table 2) in termsof their sensitivity to landscape scale threats:
1. tolerant — those bird species that occur insimplified landscapes (habitat complexity score<6) with small patches of remnant vegetation(<10 ha, the pastoral matrix), that are unaffectedby isolation;
2. moderate — those that occur only in moderate-size (10–100 ha) and complex patches, or in small(5–10ha) well-connected complex patches(isolation <1000 m; habitat complexity 6–12);
3. sensitive — those that occur only in largepatches (>100 ha) or highly complex andheterogenous patches (habitat complexity >12).
Figure 4. Cumulative probability of occurrencefitted by increasing area and habitat complexityfor the Brown Treecreeper
Figure 5. (a) The effects of woodland patch areaand habitat complexity on the presence/absence ofthe Rufous Whistler, and (b) the effects of area andisolation; arrows show minimum area and habitatcomplexity recommended to suit moderatelysensitive woodlands birds; area is plotted on alogarithmic scale in both graphs
Area (loge ha)
Pro
babi
lity
of o
ccur
renc
e
0.0
0.2
0.4
0.6
0.8
1.0Habitat complexity score
12
10
8
6
4
2
14
1 10 100 1000
Area
Area
Woodland Guidelines 1999
11
Log area (ha)
1 10 100 1000
Hab
itat c
ompl
exity
sco
re
0
2
4
6
8
10
12
14
16
18
Log area (ha)
1 10 100 1000
Isol
atio
n (m
)
0
500
1000
1500
2000
2500
3000
3500
4000
PresentAbsent
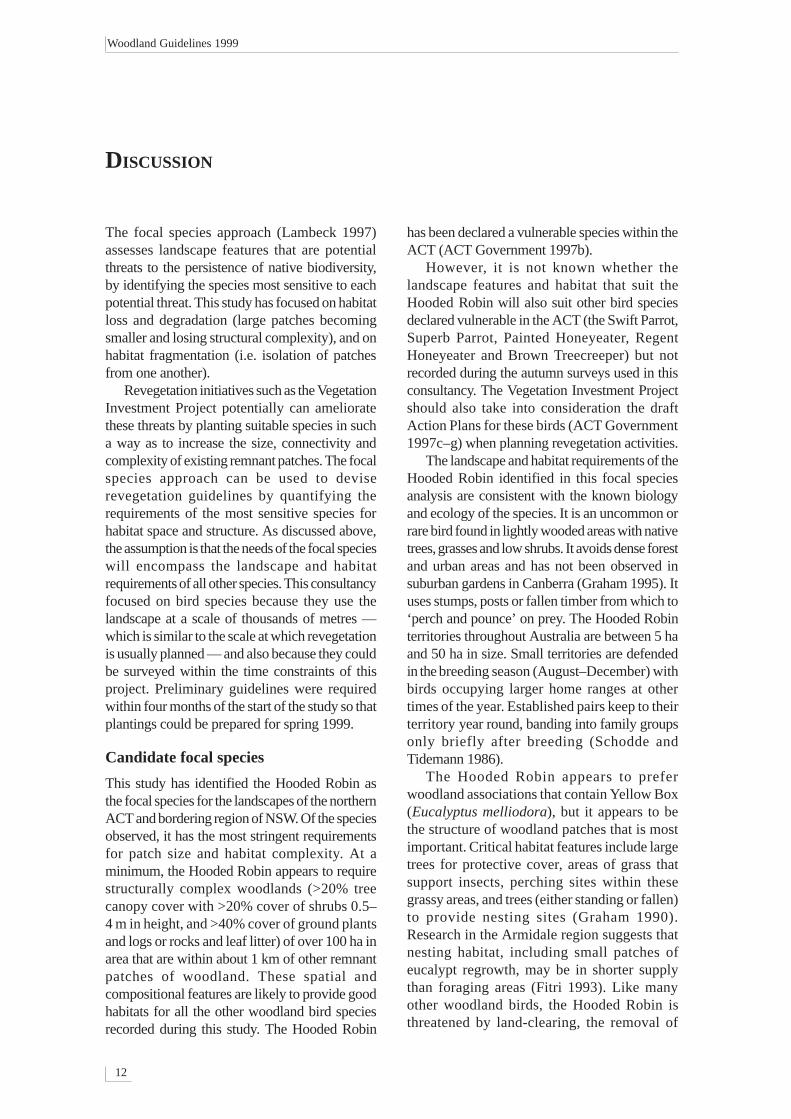
Vulnerable species
Of the six species considered vulnerable in theACT, data were obtained for the Hooded Robin,and the Brown Treecreeper. The Swift Parrot,Superb Parrot, Painted Honeyeater and RegentHoneyeater were not recorded during the surveysfor this study.
The Hooded Robin appeared to be thewoodland species that was most sensitive to allthree landscape factors, though it was onlyrecorded in five sites (Figure 6). The HoodedRobin only occurred in sites larger than 100 ha,with habitat scores greater than 12 and an isolationscore of less than 1000 m (with one exception).
The Speckled Warbler was equally asdemanding in its habitat requirements (mostwere found in patches with a habitat score of10–14), but less demanding in area needs — itoccurred in patches covering 10–100 ha, providedthese moderate-size patches had an isolation indexof 1000 m or less. The Brown Treecreeper wasobserved in sites similar to those in which theSpeckled Warbler was found, but it occurred atthree sites with a complexity score of 8, whereasthe Speckled Warbler occurred in only one patchwith a score of 8 (Appendix 4).
Table 2. Grouping of woodland birds according to sensitivity to patch size, isolation and structuralcomplexity, based on data collected in the ACT and bordering NSW region and shown in Appendix 4
Tolerant Moderately sensitive Sensitive (demanding)
Australian Magpie Brown-headed Honeyeater Hooded RobinCrested Pigeon Brown Thornbill Speckled WarblerCrimson Rosella Brown TreecreeperEastern Rosella Buff-rumped ThornbillGrey Fantail Diamond FiretailSilvereye Double-barred FinchStriated Pardalote Eastern Yellow RobinSuperb Fairy-wren Grey Shrike-thrushWeebill Jacky WinterWillie Wagtail Noisy MinerYellow-rumped Thornbill Red-browed Finch
Restless FlycatcherRufous WhistlerScarlet RobinSouthern WhitefaceSpotted PardaloteStriated ThornbillVaried SittellaWhite-browed ScrubwrenWhite-throated TreecreeperWhite-winged ChoughYellow Thornbill
Figure 6. (a) The effects of woodland patch areaand habitat complexity on the presence/absence ofthe Hooded Robin, and (b) the effects of area andisolation; (arrows as in Figure 5; area plotted ona logarithmic scale in both graphs)
Area
Area
Woodland Guidelines 1999
12
The focal species approach (Lambeck 1997)assesses landscape features that are potentialthreats to the persistence of native biodiversity,by identifying the species most sensitive to eachpotential threat. This study has focused on habitatloss and degradation (large patches becomingsmaller and losing structural complexity), and onhabitat fragmentation (i.e. isolation of patchesfrom one another).
Revegetation initiatives such as the VegetationInvestment Project potentially can amelioratethese threats by planting suitable species in sucha way as to increase the size, connectivity andcomplexity of existing remnant patches. The focalspecies approach can be used to deviserevegetation guidelines by quantifying therequirements of the most sensitive species forhabitat space and structure. As discussed above,the assumption is that the needs of the focal specieswill encompass the landscape and habitatrequirements of all other species. This consultancyfocused on bird species because they use thelandscape at a scale of thousands of metres —which is similar to the scale at which revegetationis usually planned — and also because they couldbe surveyed within the time constraints of thisproject. Preliminary guidelines were requiredwithin four months of the start of the study so thatplantings could be prepared for spring 1999.
Candidate focal species
This study has identified the Hooded Robin asthe focal species for the landscapes of the northernACT and bordering region of NSW. Of the speciesobserved, it has the most stringent requirementsfor patch size and habitat complexity. At aminimum, the Hooded Robin appears to requirestructurally complex woodlands (>20% treecanopy cover with >20% cover of shrubs 0.5–4 m in height, and >40% cover of ground plantsand logs or rocks and leaf litter) of over 100 ha inarea that are within about 1 km of other remnantpatches of woodland. These spatial andcompositional features are likely to provide goodhabitats for all the other woodland bird speciesrecorded during this study. The Hooded Robin
has been declared a vulnerable species within theACT (ACT Government 1997b).
However, it is not known whether thelandscape features and habitat that suit theHooded Robin will also suit other bird speciesdeclared vulnerable in the ACT (the Swift Parrot,Superb Parrot, Painted Honeyeater, RegentHoneyeater and Brown Treecreeper) but notrecorded during the autumn surveys used in thisconsultancy. The Vegetation Investment Projectshould also take into consideration the draftAction Plans for these birds (ACT Government1997c–g) when planning revegetation activities.
The landscape and habitat requirements of theHooded Robin identified in this focal speciesanalysis are consistent with the known biologyand ecology of the species. It is an uncommon orrare bird found in lightly wooded areas with nativetrees, grasses and low shrubs. It avoids dense forestand urban areas and has not been observed insuburban gardens in Canberra (Graham 1995). Ituses stumps, posts or fallen timber from which to‘perch and pounce’ on prey. The Hooded Robinterritories throughout Australia are between 5 haand 50 ha in size. Small territories are defendedin the breeding season (August–December) withbirds occupying larger home ranges at othertimes of the year. Established pairs keep to theirterritory year round, banding into family groupsonly briefly after breeding (Schodde andTidemann 1986).
The Hooded Robin appears to preferwoodland associations that contain Yellow Box(Eucalyptus melliodora), but it appears to bethe structure of woodland patches that is mostimportant. Critical habitat features include largetrees for protective cover, areas of grass thatsupport insects, perching sites within thesegrassy areas, and trees (either standing or fallen)to provide nesting sites (Graham 1990).Research in the Armidale region suggests thatnesting habitat, including small patches ofeucalypt regrowth, may be in shorter supplythan foraging areas (Fitri 1993). Like manyother woodland birds, the Hooded Robin isthreatened by land-clearing, the removal of
DISCUSSION
Woodland Guidelines 1999
13
fallen timber and litter, continuous grazing bylivestock, the use of fertilisers and pesticides,inappropriate fire regimes and other causes of ruraltree decline (ACT Government 1997b).
The landscape and habitat requirements ofthe Hooded Robin are demanding. Less than10% of a random selection of woodland patchesin the ACT region are larger than 100 ha (Table1). We do not know the proportion of these100 ha sites that have a habitat structurecomplex enough to meet the needs of theHooded Robin, though it is likely to be smallbecause of the ubiquity of grazing and firewoodcollection in the region. The creation of furthercomplex and large (>100 ha) woodland patchesshould be a long-term objective of theVegetation Investment Project.
Intermediate focal species
With the best intentions, the VegetationInvestment Project revegetation initiative willnot be able to create many 100 ha sites over thenext three years. The project sites may then takedecades to achieve sufficient density of fallentimber to meet the needs of the Hooded Robin.Clearly an intermediate objective is requiredfor the Vegetation Investment Project.
I suggest that an intermediate objective beadopted, to meet the needs of the large numberof moderately sensitive bird species (Table 2)in the region. These bird species appear to needvegetation patches at least 10 ha in size withmoderate habitat complexity (grassy woodlandwith >20% shrub cover and 10–50% cover ofground herbage, logs and litter). This shouldbe an achievable goal because the majority ofwoodland remnants in the region are smallerthan 10 ha (Table 1) and a suitable habitatcomplexity score of 6 can be rapidly createdby excluding livestock and planting shrubs tocover more than 20% of the ground.
I suggest that the Rufous Whistler beadopted as the focal species for thisintermediate objective. This is a relativelycommon and highly mobile bird, but in thisstudy it was infrequently found in woodlandpatches below 10 ha or in sites with littlestructural complexity. The bird generallymigrates to the north during April and May andreturns to the ACT region during early spring.It is colourful, and has a distinctive song(Schodde and Tidemann 1986). I predict thatthe presence of the bird in revegetated sites willbe an early indication of success.
RECOMMENDATIONS
This focal species analysis has been based onsurveys from only a single, non-breeding season.Ideally a spring (breeding season) survey shouldhave been included. The bird species encounteredin these autumn surveys probably had lessdemanding habitat requirements, because theywere not constrained by the energetic and time-consuming demands of reproduction. Some of thesites occupied in the autumn may not be suitablein the spring. Thus, the following revegetationrecommendations are minima. These guidelineswill enhance the probability that revegetated siteswill at some point be used by a wide range ofwoodland bird species, but they may not ensurethe breeding success and long-term viability ofall species with moderate landscape and habitatrequirements.
Landscape guidelines for revegetation
1. Revegetation should be directed towardsincreasing the area of individual woodlandpatches to at least 10 ha and introducing at leasta 20% shrub cover within these patches.
2. Enhancement actions for patches that arealready larger than 10 ha should be first tointroduce or increase the shrub cover; second,to increase the area of the patch; third, to reducethe isolation of the patch by creatingintermediate patches within 500–1000 m(stepping stone analogy).
3. Revegetation should simultaneously addressas many environmental threats as possible,including dryland salinity and erosion, aswell as habitat loss.
Woodland Guidelines 1999
14
4. Conservation of large (>100 ha) woodlandremnants with high structural diversity(abundant ground cover, low shrubs, midshrubs and wattles and eucalypt overstorey) isa high priority for vulnerable woodland birds.Enhancement of large remnant vegetationpatches through patch planting of shrubs maybe warranted.
5. A longer-term goal should be to create enoughstructurally diverse patches, each greater than10 ha and within 500–1000 m of each other, tocreate effectively connected networks ofpatches that function like a series of large andcomplex patches (>100 ha).
6. Linear plantings should have first priorityalong riparian systems. Linear plantings forconnecting patches that are larger than 10 hashould be of lower priority. Linear plantingsshould be at least 25 m wide and shouldcomprise a range of tree and shrub species.
I predict that implementation of the first tworecommendations will at least improve foraginghabitat for the majority of woodland birds. A focuson enhancing small patches will also allow manylandholders to be involved in the project becausesmall patches are very common in this region.
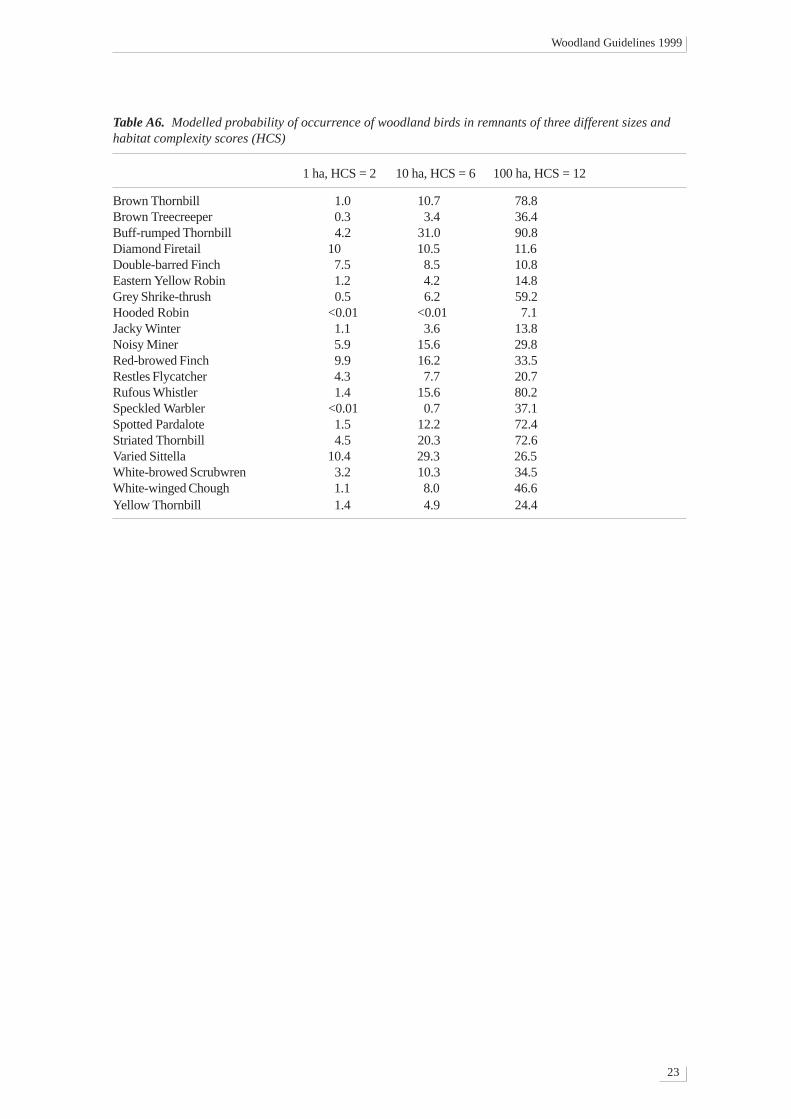
Enhancing remnants by increasing their sizeto 10 ha and establishing a 20% cover of under-storey shrubs will not guarantee the presence ofsensitive woodland birds; rather, it should increasethe probability of these birds occurring in suchremnants. For example, the modelled probabilityof the Rufous Whistler occurring in a 1 ha remnantwith no shrubby understorey is only 1.4%, butthere is a 15.6% chance that it will occur in a10 ha remnant with a 20% cover of understoreyof shrubs (Appendix 2, Table A6).
Enhancing remnants to a minimum shrubcover of 20% does not imply that an even scatterof shrubs is required. Instead, dense pockets ofshrubs within remnant woodlands may providebetter habitat for sensitive woodland birds.
These recommendations do not mention theobvious need for on-going management ofremnant vegetation. They do not mention thepossible need for control of predators, grazing orweeds, or the use of fire. The long-termmanagement of remnants enhanced by theVegetation Investment Project needs to beaddressed, but this was not within the scope ofthe consultancy.
These recommendations do not imply that allpatches of remnant vegetation need to be largeand complex. Birds of the open woodland orgrassland, such as the Red-rumped Parrot or the
Rufous Songlark, could be disadvantaged by alandscape dominated by complex (shrubby)woodlands. Neither should woodlands beexpanded at the expense of native grasslands.There are plenty of degraded remnants dominatedby an understorey of exotic grasses and forbs thatrequire enhancement.
I do not recommend linear plantings as a highpriority. The focal species analysis found thatisolation as a single factor was not statisticallyimportant, and that therefore it does not greatlyaffect the presence or absence of woodland birdspecies. However, an interaction between area andisolation was detected graphically (Figure 7).Moderate and large sites did not seem to beaffected by isolation in the surveyed landscapes,but moderately sensitive bird species were morelikely to be found in small sites (<10 ha) that wereclose (<1000 m) to other woodland patches, thanin isolated sites of similar size more than 1000 maway. I predict that the value of small patches canbe enhanced by making them larger and less isolated.
Linear plantings are only one means ofincreasing the connectivity of small sites. Irecommend ‘stepping-stone’ plantings, each of atleast 10 ha, as a more efficient way of increasingconnectivity, because they need less fencing. Over4 km of new fencing is required to enclose avegetation corridor 25 m wide totalling 10 ha,assuming a parallel fence already exists. A 10 hasquare patch in a corner of a paddock requiresonly 630 m of new fence assuming two fencesalready meet there. Even a free-standing square10 ha woodland patch needs only a 1.26 kmperimeter fence.
If the Vegetation Investment Project choosesto use linear plantings, they should be at least25 m wide. In recent PhD research in the centraltablelands of NSW, Cilla Kinross (pers. comm.)reports that woodland birds which normally onlyfrequent large patches of remnant vegetation ingood condition were much more likely to be foundin linear plantings that were wider than 27 m thanin narrower ones.
Priority areas for revegetation
The ACT and Sub-region Planning Strategy(Anonymous 1998) identified priority areas inwhich to develop links between existing remnantnative vegetation patches larger than 50 ha. Thisstrategy also identified broad-scale links alongrivers and streams, the latter mapped to a widthof 700 m. The Wildlife Research and MonitoringUnit of Environment ACT has recently refinedthe mapping of remnant vegetation in the ACT
Woodland Guidelines 1999
15
and has also highlighted networks for improvingconnectivity and habitat value (Environment ACT1999). Wherever possible, the VegetationInvestment Project should give priority to on-ground actions in these ‘enhancement corridors’.
Plant species for use in revegetation
The focal species analysis was based on 72 diversesites that included Yellow Box (Eucalyptusmelliodora), Red Gum (E. blakelyi), Stringy Bark(E. macrorhyncha), Apple Box (E. bridgesiana),and Scribbly Gum (E. rossii) eucalypt woodlands.The woodland type did not have a significanteffect on bird species presence or absence in apatch of vegetation. It was the structure of thewoodland patch and its size, rather than its plantspecies, that were the critical factors affecting birdspecies distribution.
Plant species composition may have been afactor causing bird species to be absent from sitesthat were otherwise big enough and complexenough to contain that species. For example, theYellow Thornbill occurred in less than half thesites that were >10 ha with a habitat complexityscore of >6. The Yellow Thornbill is frequentlyfound in association with bi-pinnate wattles, soabsence of these wattles may explain the absenceof this bird in sites that were otherwise suitable.
The activities of the Vegetation InvestmentProject should aim to enhance the criticalstructural elements of bird habitat: native groundcover, litter, logs, low shrubs, medium size shrubs(e.g. wattles) and overstorey trees. Appropriateplant species will need to be planted at each site
Area (loge ha)
Pro
bab
ility
of o
ccur
ren
ce
200
m
1000
m
2000
m
3000
m
0
1
0.5
1 10 100 1000
Figure 7. An example (White-throatedTreecreeper) of the interaction between area ofremnant and its isolation (mean distance to thefive nearest neighbours). This bird had auniformly low probability of occurring in verysmall remnants and a uniformly high probabilityof occurring in very large remnants. Withinintermediate-size remnants, this bird had a higherprobability of occurring when surroundingremnants were only 200–1000 m away.
to make up these structural elements. A mixtureof plant species, suited to the soils, topographyand aspect of each site will be best chosen withinput from local expertise and decision supportsystems such as SELECTOR (Ive 1997). The plantspecies that can be selected will obviously beconstrained by the availability of seed, its ease ofpropagation, its competitive ability, etc. No singleset of plant species will meet the fine-scale habitatrequirements of all woodland birds.
Woodland Guidelines 1999
16
Greening Australia (ACT & SE NSW) soughtinput from CSIRO to help develop revegetationguidelines based on the focal species approach ofLambeck (1997). At the beginning of the projectwe did not know if the focal species approach,developed in the wheat–sheep zone of WesternAustralia, could be usefully applied to thevariegated landscapes (MacIntyre and Barrett1992) of the Southern Tablelands of ACT andNew South Wales.
The focal species approach has clearlydemonstrated its utility. Using it as a framework,we were able to rapidly attain a large dataset,analyse it, and develop robust recommendationsbased on bird habitat needs within four months ofcommencing the consultancy. As soon as theserecommendations became available, they couldbe incorporated into the planning process forVegetation Investment Project activities.
The focal species approach has provided earlyindicators of success. I predict that moderatelysensitive birds such as the Rufous Whistler(Table 2) will return to woodland patches oncethey have been enlarged to at least 10 ha by theVegetation Investment Project, as soon as theplanted trees and shrubs provide sufficient coverand resources. This may occur within three yearsin some cases (C. Kinross, pers. comm).
We do not know how widely these recom-mendations, based on two focal species, can beextended beyond the survey area specific to theVegetation Investment Project. Preliminaryexperience in Western Australia has shown thatthe identity of the focal species varies from
CONCLUSIONS: USEFULNESS OF THE FOCAL SPECIES APPROACH
catchment to catchment. Hence, revegetationrecom-mendations also vary, but not greatly (RobLambeck, pers. comm.). A focal species analysisin progress in the mid-Lachlan indicates that, there,the focal species needs larger patches of remnantvegetation, but the need for understorey cover issimilar to that found for this Southern Tablelandsanalysis (S. Briggs, pers. comm.).
The next challenge is to learn how the focalspecies approach can be used on a regional scaleto help establish recommendations andbenchmarks that will be relevant to the wholecatchment. We do not know the scale over whichfocal species based guidelines can be applied. Wedo not know whether implementation of relativelysmallscale initiatives such as the VegetationInvestment Project will ensure the conservationof native biota, or whether the VegetationInvestment Project needs to be applied fromCootamundra to Goulburn. We do know thatthe implementation of these revegetationguidelines by the Vegetation Investment Projectwill provide useful habitat for birds and otherbiota that cannot otherwise persist in theexisting paddock matrix of isolated trees andintensively grazed exotic pastures.
The implementation of the VegetationInvestment Project will establish a landscape-scale experiment that will test the predictionsthat have come out of this focal species analysis.This experiment needs to be monitored andmaintained. CSIRO hopes to be able to continueits partnership with Greening Australia in thisendeavour.
Woodland Guidelines 1999
17
REFERENCES
ACT Government (1997a). Yellow Box/Red GumGrassy Woodland: an endangered ecologicalcommunity. Draft Action Plan No. 10. EnvironmentACT, Canberra.
ACT Government (1997b). Hooded Robin(Melanodryas cucullata): a vulnerable species.Draft Action Plan No. 15. Environment ACT,Canberra.
ACT Government (1997c). Superb Parrot (Polytelisswainsonii): a vulnerable species. Draft Action PlanNo. 17. Environment ACT, Canberra.
ACT Government (1997d). Regent Honeyeater(Xanthomyza phrygia): an endangered species.Draft Action Plan No. 20. Environment ACT,Canberra.
ACT Government (1997e). Swift Parrot (Lathamusdiscolor): a vulnerable species. Draft Action PlanNo. 16. Environment ACT, Canberra.
ACT Government (1997f). Brown Treecreeper(Climacteris picumnus): a vulnerable species. DraftAction Plan No. 18. Environment ACT, Canberra.
ACT Government (1997g). Painted Honeyeater(Grantiella picta): a vulnerable species. DraftAction Plan No. 19. Environment ACT, Canberra.
Anonymous (1998). ACT and Sub-region PlanningStrategy, ACT.
Catling, P.C. and Burt, R.J. (1995). Studies of ground-dwelling mammals of Eucalypt forests in southeastern NSW: the effect of habitat variables ondistribution and abundance. Wildlife Research 22,271–288.
Environment ACT (1999). Corridors for habitat andbiodiversity conservation in the ACT with links tothe region. A report to the Natural Heritage Trust.Environment ACT, Canberra.
Er, K.B.H. (1995). Maximisation of Bird SpeciesDiversity in Yellow Box–Blakely’s Red GumWoodland Remnants. Honours thesis, AustralianNational University.
Fitri, L.L. (1993). Ecology and Behaviour of HoodedRobins Melanodryas cucullata in the NorthernTablelands of New South Wales. Unpublished MScthesis, University of New England, Armidale.
Ford, H.A. (1986). Birds and Eucalypt dieback innorth-eastern NSW, pp.150–154 in H.A. Ford andD.C. Paton (Eds), The Dynamic Partnership: Birdsand Plants in Southern Australia. GovernmentPrinter, South Australia.
GENSAT 5 Committee (1995). GENSTAT for WindowsReference Manual Supplement. NumericalAlgorithms Group, Oxford.
Graham, B. (1990). Habitat requirements for two pairsof hooded robins near Canberra — a preliminaryreport. Canberra Bird Notes 15(2), 22–27.
Graham, B. (1995). Hooded Robin: bird of the yearfor 1991. Canberra Bird Notes 20(3), 49–58.
Ive, J.R. (1997). SELECTOR: a decision supportsystem for assisting in the selection of tree andshrubs to meet planting objectives, in T. Vercoeand B. Clarke (Eds), Tree Performance Databasesand Selection Systems. Canberra.
Lambeck, R.J. (1997). Focal species: a multi-speciesumbrella for nature conservation. ConservationBiology 11, 859.
Lambeck, R.J. (1999). Landscape planning forbiodiversity conservation in agricultural regions: acase study from the wheatbelt of Western Australia.Biodiversity Technical Paper, No.2. EnvironmentAustralia, Canberra.
Lumsden, L.F., Bennett, A.F., Krasna, S.P. andSilins, J.E. (1995). The conservation ofinsectivorous bats in rural landscapes ofnorthern Victoria, pp.142–158 in A. Bennett,G. Backhouse and T. Clark (Eds), People andNature Conservation: Perspectives on PrivateLand Use and Endangered Species Recovery.Royal Zoological Society of New South Wales,Sydney.
MacIntyre, S. and Barrett, G.W. (1992). Habitatvariegation, an alternative to fragmentation.Conservation Biology 6, 146–147.
Newsome, A.E. and Catling, P.C. (1979). Habitatpreferences of mammals inhabiting heathlands ofwarm temperate coastal, montane and alpineregions of southeastern Australia, pp.301–316 inR.L. Specht (Ed.), Heathlands and RelatedShrublands of the World: Descriptive Studies.Elsevier, Amsterdam.
Recher, H.F. (1989). Counting terrestrial birds: useand application of census procedures inAustralia. Aust. Zool. Rev. 1, 25–45.
Schodde, R. and Tidemann, S.C. (1986). CompleteBook of Australia Birds, p. 387. ReadersDigest, Sydney.
Wiens, J.A. (1989). The Ecology of Bird Communities,Cambridge University Press, Cambridge.
Woodland Guidelines 1999
18
IntroductionTwenty-eight people attended the workshop, froma wide range of community groups and agencieswith an interest in, or responsibility for,conservation (Table A1). Alison Elvin (GreeningAustralia Project Manager) began the workshopwith an overview of the project which has thefollowing objectives:v to buffer, link and revitalise remnant vegetation
to create viable patches and corridors;v to tackle the threats to biological diversity
through vegetation protection and enhancementin line with CSIRO’s focal species approach;
v to provide the backbone for the strategicdevelopment of broad-scale revegetation inadjacent rural areas surrounding the ACT.
The NHT funded project has support for at least
95 ha of revegetation and 80 km of fencing. Theproject has three areas for priority actions:vO’Connor Ridge to the Molonglo River via
Black Mountain and the Pinnacle,v Majura Field Firing Range to Hall via
Mulligans Flat,vHall to the Murrumbidgee River Corridor.Low elevation oblique aerial photos were shownto illustrate these areas.
The objectives of the workshop were to identify(i) patches of value in the project landscapes;(ii) threats to these patches by modification anddestruction; and (iii) specific actions requiredto reduce these threats.
A framework was presented for the analysisof threats and identification of specific actionsusing a focal species approach.
APPENDIX 1. REPORT ON THE ACTION PLANNING WORKSHOPfor Greening Australia’s Vegetation Investment Project; held at CSIRO Wildlife andEcology, Gungahlin, 8 March 1999, by David Freudenberger
Table A1. Workshop attendees
David Power ACT Planning and Land ManagementBruce Lindenmeyer Canberra Ornithologists GroupGeoff Robertson Friends of GrasslandsKerrin Styles Ranger and Agronomist, ACT Parks and Conservation ServiceJean Geue Friends of Aranda BushlandDavid Kelly Friends of Aranda BushlandBruce Gall Hall LandCare GroupDierk von Behrens Field Naturalists of the ACTMark Dunford Wildlife Research and Monitoring Unit, Environment ACTValerie Taylor Friends of Mt PainterKris Kowal ACT Bushcare CoordinatorPaul Hodgkinson Friends of GrasslandsAnthony Overs Canberra Ornithologists GroupHarold Adams ACT Rural Lessees AssociationOdile Arman Manager, Canberra Nature Park North, ACT Parks and Conservation ServiceKay Collins ACT Parks and Conservation ServiceReiner Rehwinkel NPWS Threatened Species UnitJames Watson Honours Student, ADFAChris Davey CSIRO Wildlife and Ecology, & Canberra Ornithologists GroupArt Langston Friends of Grasslands, & CSIRO Wildlife and EcologyDavid Shorthouse Manager, Wildlife Research and Monitoring Unit, Environment ACTMark Grayson Director of Planning, Yass Shire CouncilMark Clayton CSIRO Wildlife and Ecology, & Canberra Ornithologists GroupNick Gellie Comprehensive Regional Assessment Program, NPWSBrian Cumberland Program Manager, Greening AustraliaOwen Whitaker Fencing Incentives Officer, Greening AustraliaAlison Elvin Greening Australia Project ManagerDavid Freudenberger CSIRO Wildlife and Ecology
Woodland Guidelines 1999
19
Field trip
A brief visit was made to Mt Painter Nature Park(Belconnen) to discuss the threatening processesin the landscapes that can be viewed from thisvantage point. There was considerable discussionand expertise regarding the rehabilitation of theimmediate surrounding two hectares, but we haddifficulty coming to grips with the threats andpriority actions required in the broader scale fromthe Brindabellas, to the Molonglo and back up tothe Mt Painter–Pinnacle ridge.
Values
There was a wide range of values within thelandscapes of the project areas (Table A2). Ageneral theme of discussion was the maintenanceand enhancement of a range of different patchtypes that support a diversity of native biota. Thisvariety of patches is valued by a wide range ofpeople for many uses including aestheticenjoyment, active pursuits such as horse riding,and production gains from agriculture.
Threats
A wide range of landscape threats were identifiedthat are both modifying and destroying patchesof value (Table A3). Few of these threats are
localised, most are characteristic of any Australianlandscape on the edge of a growing city. Theidentification of specific threats requires analysisof specific parcels of land, as was done duringthe discussions at Mt. Painter. The VegetationInvestment Project will need to liaise closely withplanners in the ACT and the neighbouring twoShires because land tenure, and planninginstruments will continue to have a profoundimpact on the landscapes in the project areas.
Actions
A number of general principles emerged fromthese discussions (Table A4, see p.21).
1. A regional approach should be used to identifypriority areas and individual sites.
2. Priority should be given to protecting andenhancing high value patches (remnants).Corridors are only one means of enhancingpatches and reducing threats.
3. Fencing and revegetation techniques should beadapted to the specific requirements of eachselected site and use local provenances of plantswherever possible.
4. Revegetation and fencing should simultaneouslyreduce as many threatening processes aspossible.
Table A2. Valued patches and landscape elements within project areas
v Mosaics and heterogeneityv Ecosystem functionv Specific patches (Newline Quarry, Brooks Hill Reserve, Mulligans Flat, Castle Hill, Hall Cemetery,
Stirling Ridge, Gooroomon–Jeir Ponds, Crace grassland, etc)v Wide range of biodiversity and community alliancesv Diversity of birds and reptilesv Native orchidsv Functional grasslands and the indicator species they contain (e.g. native forbs)v Native legumesv Yellow Box trees and the birds they supportv Threatened species and communitiesv The urban–rural interface (‘Bush Capital’, the Australian ‘look’)v Accessibility and proximity of the bushv Topographic sequences (from Snow Gums, dry forests, grasslands to riparian zones)v Wetlandsv Few weedsv Habitat diversity and the invertebrates they supportv Diverse understoreyv Undeveloped hillsv Native fauna within urban–rural landscapesv Wildlife icons — kangaroos, Galahs, Kookaburras and rosellasv The urban forest (older neighbourhoods with large leafy blocks)v Privacy and isolation created by forest and bushlandv Recreation access, e.g. horses, bike and car ralliesv Production values: pines, livestock, horticulturev Indigenous values
Woodland Guidelines 1999
20
5. Whatever is done should be done well andwith good consultation, and should use thebest available knowledge and publicity.
Conclusions
There was general support for the objectives ofthe Vegetation Investment Project project. Thisworkshop identified a wide range of values, someof them potentially conflicting, that people wantprotected and enhanced. I conclude from thisworkshop that the project should not exclusivelyenhance any one type of patch (e.g. grassywoodland), with only one strategy (e.g. shelter-belt corridors), but rather enhance a range ofpatches, with strategies appropriate to each patchdepending on the existing values and threats in
Table A3. Threats
v Human population growth–urban expansion including impact of roads & utilitiesv Urban infill — ‘concreting the suburbs’v Global threats including climate changev Eutrophicationv Recreational impacts (e.g. mountain bikes, horses, 4WDs)v Changes in hydrology — salinisationv Inappropriate fire regimev Diebackv Rubbish dumpingv Pest plants and animals including latent pests (e.g. rabbits)v Pasture development (e.g. fertiliser and Phalaris)v Gully and sheet erosionv Habitat loss and fragmentation/isolationv Rural subdivision (rural residential)v Firewood collectionv Rock removalv Clearing, particularly for agricultural diversification (e.g. grapes)v Inappropriate grazing by domestic and native herbivoresv Inappropriate plantingsv Inappropriate balance of native species (e.g. currawongs, Noisy Miners, kangaroos, Mistletoe)v Lack of scientific knowledge (ecological understanding)v Lack of sufficient resources ($$)v Changing policies, attitudes and culturev Lack of consensus
each project area. There appeared to be aconsensus that protecting and enhancing existinghigh value patches should be a priority. Indicatorsof high value patches include the presence of adiversity of native biota in functional landscapeswith appropriate under- and overstoreys.
The workshop was unable to specificallyrecommend exactly where and how muchrevegetation and fencing are required. However,the attendees agreed that they would like to go onbeing involved in the project’s development asmembers of the project’s Reference Committee.
Finally, CSIRO and Greening Australiawarmly thank all the participants for their timeand willingness to participate so fully in theworkshop.
Woodland Guidelines 1999
21
Table A4. Actions and issues to consider
v Priority should be to buffer existing grasslands from invasion by exotic grasses like Phalaris.v Grasslands need to be managed to maintain open spaces between tussocks for native forbs.v Actions should be put in a regional context by using existing regional government policies and data
layers (Landsat TM, airphoto-CRA layer, Environment ACT survey of patches).v The objectives of the Vegetation Investment Project need to be re-visited on a regular basis; are the
objectives to increase biodiversity, connect patches, conserve patches or reduce threats to decliningspecies?
v Protect and extend existing high value patches.v Consider the use of an algorithm to determine priorities for revegetation.v Issue of on-going management must be addressed, i.e. weeds don’t respect fences.v The following principles should be considered. 1) Wherever possible, plant overstorey species on a
native understorey (e.g. secondary native grassland. 2) Need to address objectives at at least two scales:landscape (e.g. project area) and local scale (e.g. paddock). 3) Address human–ecosystemsustainability/viability.
v How much can fencing and revegetation technologies reduce these threats?v How can additional resources be found for this project (e.g. DLWC vegetation management fund)?v The type of fencing needs to be considered, i.e. to exclude domestic grazing, or vehicles, or rabbits, or
kangaroos?v Sub-divisional fencing may be warranted to allow tactical (rotational) grazing of native grasslands.v Fencing can be used for a range of purposes, e.g. excluding grazing around isolated trees to encourage
regeneration, fencing off small (2–3 m2) but high quality patches, rationalising boundaries, orincreasing remnant size.
v Proximity of watering points ought to be considered in terms of management of kangaroos.v Provision of alternative watering points will need to be considered when fencing off riparian zonesv Signage — sign of good management?v Scalping — removal of upper soil layer should be considered to reduce weed and nutrient levels, thus
allowing natural regeneration.v Successional plantings should be considered; wattles can quickly create a better understorey for
eucalypts and shrubs by shading out weeds and tying up nutrients, and can also provide habitat forinsects which provide cover and resources for birds such as thornbills.
v Burning and grazing should also be considered as revegetation tools — ‘horses for courses’.v Appropriate plantings in appropriate places; non-provenance plantings may be acceptable or required
where conditions have become too hostile for local provenances (e.g. E. blakelyi).v Appropriate and effective consultation is fundamental to the success of the project.v Vegetation management to enhance water quality should be considered.v Priorities within each project zone: 1) fence and revegetate drainage lines; 2) enhance the development
of upper, mid- and lower storeys of woodlands; 3) enhance other communities such as grasslands.v Protect, enhance and link habitats used or needed by threatened species, e.g. Regent Honeyeaters.v Consider historical records to help determine vegetation objectives and strategies.v Corridors should be provided to link high value patches.v The Vegetation Investment Project should seek maximum public exposure.v Actions the Vegetation Investment Project takes should be carried out as well as possible in one area
— it shouldn’t try and spread itself too thinly.v Each project site should simultaneously address as many threatening processes as possible, e.g.
conservation of biodiversity as well as reduction in erosion and improved hydrological cycling.v The scale, technologies and vision of the project should advance the ‘state of the art’.v The potential for on-going research should be considered.
Woodland Guidelines 1999
22
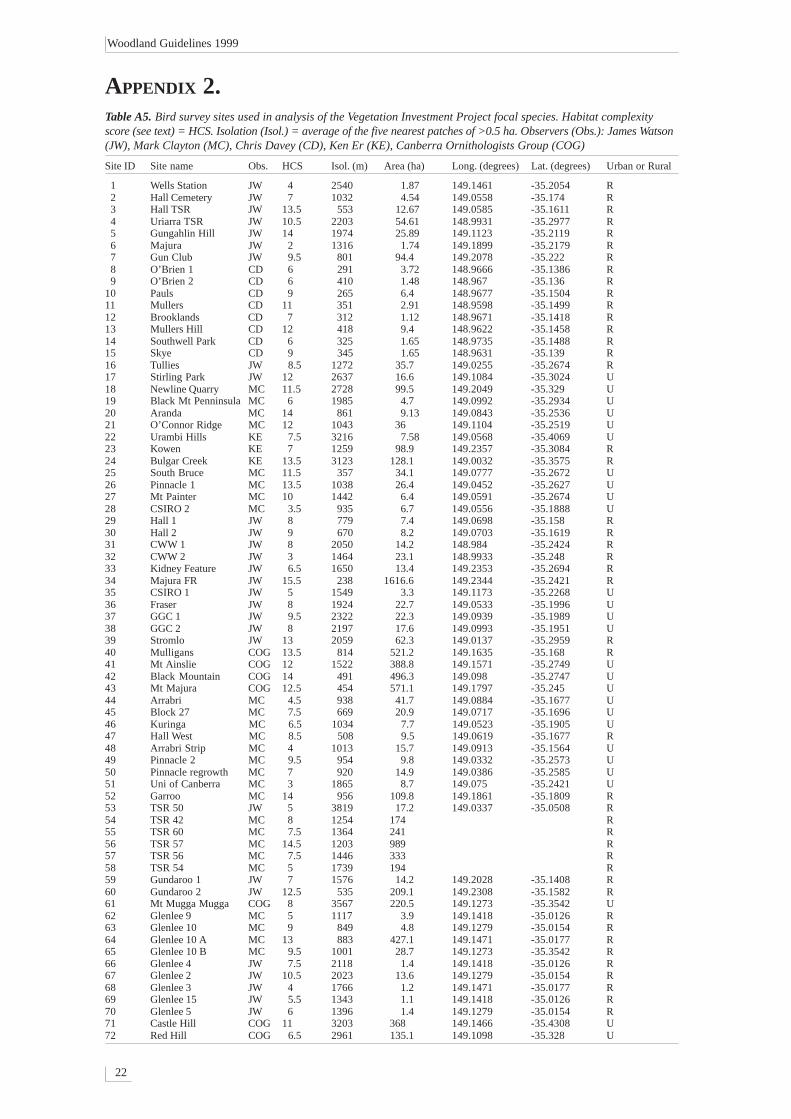
APPENDIX 2.Table A5. Bird survey sites used in analysis of the Vegetation Investment Project focal species. Habitat complexityscore (see text) = HCS. Isolation (Isol.) = average of the five nearest patches of >0.5 ha. Observers (Obs.): James Watson(JW), Mark Clayton (MC), Chris Davey (CD), Ken Er (KE), Canberra Ornithologists Group (COG)
Site ID Site name Obs. HCS Isol. (m) Area (ha) Long. (degrees) Lat. (degrees) Urban or Rural
1 Wells Station JW 4 2540 1.87 149.1461 -35.2054 R 2 Hall Cemetery JW 7 1032 4.54 149.0558 -35.174 R 3 Hall TSR JW 13.5 553 12.67 149.0585 -35.1611 R 4 Uriarra TSR JW 10.5 2203 54.61 148.9931 -35.2977 R 5 Gungahlin Hill JW 14 1974 25.89 149.1123 -35.2119 R 6 Majura JW 2 1316 1.74 149.1899 -35.2179 R 7 Gun Club JW 9.5 801 94.4 149.2078 -35.222 R 8 O’Brien 1 CD 6 291 3.72 148.9666 -35.1386 R 9 O’Brien 2 CD 6 410 1.48 148.967 -35.136 R10 Pauls CD 9 265 6.4 148.9677 -35.1504 R11 Mullers CD 11 351 2.91 148.9598 -35.1499 R12 Brooklands CD 7 312 1.12 148.9671 -35.1418 R13 Mullers Hill CD 12 418 9.4 148.9622 -35.1458 R14 Southwell Park CD 6 325 1.65 148.9735 -35.1488 R15 Skye CD 9 345 1.65 148.9631 -35.139 R16 Tullies JW 8.5 1272 35.7 149.0255 -35.2674 R17 Stirling Park JW 12 2637 16.6 149.1084 -35.3024 U18 Newline Quarry MC 11.5 2728 99.5 149.2049 -35.329 U19 Black Mt Penninsula MC 6 1985 4.7 149.0992 -35.2934 U20 Aranda MC 14 861 9.13 149.0843 -35.2536 U21 O’Connor Ridge MC 12 1043 36 149.1104 -35.2519 U22 Urambi Hills KE 7.5 3216 7.58 149.0568 -35.4069 U23 Kowen KE 7 1259 98.9 149.2357 -35.3084 R24 Bulgar Creek KE 13.5 3123 128.1 149.0032 -35.3575 R25 South Bruce MC 11.5 357 34.1 149.0777 -35.2672 U26 Pinnacle 1 MC 13.5 1038 26.4 149.0452 -35.2627 U27 Mt Painter MC 10 1442 6.4 149.0591 -35.2674 U28 CSIRO 2 MC 3.5 935 6.7 149.0556 -35.1888 U29 Hall 1 JW 8 779 7.4 149.0698 -35.158 R30 Hall 2 JW 9 670 8.2 149.0703 -35.1619 R31 CWW 1 JW 8 2050 14.2 148.984 -35.2424 R32 CWW 2 JW 3 1464 23.1 148.9933 -35.248 R33 Kidney Feature JW 6.5 1650 13.4 149.2353 -35.2694 R34 Majura FR JW 15.5 238 1616.6 149.2344 -35.2421 R35 CSIRO 1 JW 5 1549 3.3 149.1173 -35.2268 U36 Fraser JW 8 1924 22.7 149.0533 -35.1996 U37 GGC 1 JW 9.5 2322 22.3 149.0939 -35.1989 U38 GGC 2 JW 8 2197 17.6 149.0993 -35.1951 U39 Stromlo JW 13 2059 62.3 149.0137 -35.2959 R40 Mulligans COG 13.5 814 521.2 149.1635 -35.168 R41 Mt Ainslie COG 12 1522 388.8 149.1571 -35.2749 U42 Black Mountain COG 14 491 496.3 149.098 -35.2747 U43 Mt Majura COG 12.5 454 571.1 149.1797 -35.245 U44 Arrabri MC 4.5 938 41.7 149.0884 -35.1677 U45 Block 27 MC 7.5 669 20.9 149.0717 -35.1696 U46 Kuringa MC 6.5 1034 7.7 149.0523 -35.1905 U47 Hall West MC 8.5 508 9.5 149.0619 -35.1677 R48 Arrabri Strip MC 4 1013 15.7 149.0913 -35.1564 U49 Pinnacle 2 MC 9.5 954 9.8 149.0332 -35.2573 U50 Pinnacle regrowth MC 7 920 14.9 149.0386 -35.2585 U51 Uni of Canberra MC 3 1865 8.7 149.075 -35.2421 U52 Garroo MC 14 956 109.8 149.1861 -35.1809 R53 TSR 50 JW 5 3819 17.2 149.0337 -35.0508 R54 TSR 42 MC 8 1254 174 R55 TSR 60 MC 7.5 1364 241 R56 TSR 57 MC 14.5 1203 989 R57 TSR 56 MC 7.5 1446 333 R58 TSR 54 MC 5 1739 194 R59 Gundaroo 1 JW 7 1576 14.2 149.2028 -35.1408 R60 Gundaroo 2 JW 12.5 535 209.1 149.2308 -35.1582 R61 Mt Mugga Mugga COG 8 3567 220.5 149.1273 -35.3542 U62 Glenlee 9 MC 5 1117 3.9 149.1418 -35.0126 R63 Glenlee 10 MC 9 849 4.8 149.1279 -35.0154 R64 Glenlee 10 A MC 13 883 427.1 149.1471 -35.0177 R65 Glenlee 10 B MC 9.5 1001 28.7 149.1273 -35.3542 R66 Glenlee 4 JW 7.5 2118 1.4 149.1418 -35.0126 R67 Glenlee 2 JW 10.5 2023 13.6 149.1279 -35.0154 R68 Glenlee 3 JW 4 1766 1.2 149.1471 -35.0177 R69 Glenlee 15 JW 5.5 1343 1.1 149.1418 -35.0126 R70 Glenlee 5 JW 6 1396 1.4 149.1279 -35.0154 R71 Castle Hill COG 11 3203 368 149.1466 -35.4308 U72 Red Hill COG 6.5 2961 135.1 149.1098 -35.328 U
Woodland Guidelines 1999
23
Table A6. Modelled probability of occurrence of woodland birds in remnants of three different sizes andhabitat complexity scores (HCS)
1 ha, HCS = 2 10 ha, HCS = 6 100 ha, HCS = 12
Brown Thornbill 1.0 10.7 78.8Brown Treecreeper 0.3 3.4 36.4Buff-rumped Thornbill 4.2 31.0 90.8Diamond Firetail 10 10.5 11.6Double-barred Finch 7.5 8.5 10.8Eastern Yellow Robin 1.2 4.2 14.8Grey Shrike-thrush 0.5 6.2 59.2Hooded Robin <0.01 <0.01 7.1Jacky Winter 1.1 3.6 13.8Noisy Miner 5.9 15.6 29.8Red-browed Finch 9.9 16.2 33.5Restles Flycatcher 4.3 7.7 20.7Rufous Whistler 1.4 15.6 80.2Speckled Warbler <0.01 0.7 37.1Spotted Pardalote 1.5 12.2 72.4Striated Thornbill 4.5 20.3 72.6Varied Sittella 10.4 29.3 26.5White-browed Scrubwren 3.2 10.3 34.5White-winged Chough 1.1 8.0 46.6Yellow Thornbill 1.4 4.9 24.4
Woodland Guidelines 1999
24
An example of a data sheet for assessment of habitat complexity score, based on that of Catlingand Burt (1995).
Score 0 Score 1 Score 2 Score 3 Total0–10% cover 10–20% cover 20–50% cover >50% cover
Tree canopy ✔ 2
Tall shrub cover ✔ 1(2–4 m)
Short shrub cover ✔ 1(0.5–2 m)
0–10% cover 10–40% cover 40–70% cover >70% cover
Ground herbage ✔ 1
Logs/rocks ✔ 0
Litter ✔ 2
Habitat Complexity Score = 7
APPENDIX 3.
Woodland Guidelines 1999
25
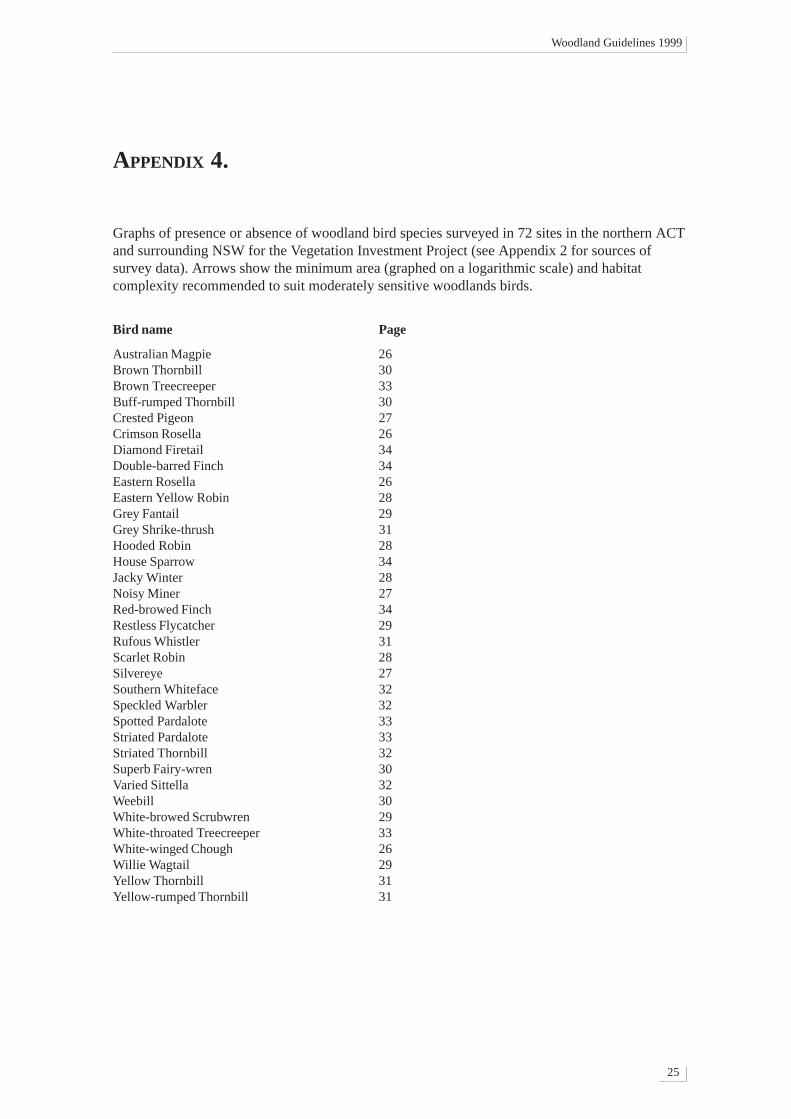
Graphs of presence or absence of woodland bird species surveyed in 72 sites in the northern ACTand surrounding NSW for the Vegetation Investment Project (see Appendix 2 for sources ofsurvey data). Arrows show the minimum area (graphed on a logarithmic scale) and habitatcomplexity recommended to suit moderately sensitive woodlands birds.
APPENDIX 4.
Bird name Page
Australian Magpie 26Brown Thornbill 30Brown Treecreeper 33Buff-rumped Thornbill 30Crested Pigeon 27Crimson Rosella 26Diamond Firetail 34Double-barred Finch 34Eastern Rosella 26Eastern Yellow Robin 28Grey Fantail 29Grey Shrike-thrush 31Hooded Robin 28House Sparrow 34Jacky Winter 28Noisy Miner 27Red-browed Finch 34Restless Flycatcher 29Rufous Whistler 31Scarlet Robin 28Silvereye 27Southern Whiteface 32Speckled Warbler 32Spotted Pardalote 33Striated Pardalote 33Striated Thornbill 32Superb Fairy-wren 30Varied Sittella 32Weebill 30White-browed Scrubwren 29White-throated Treecreeper 33White-winged Chough 26Willie Wagtail 29Yellow Thornbill 31Yellow-rumped Thornbill 31
Woodland Guidelines 1999
26
Eastern Rosella
PresentAbsent
Area (ha)
1 10 100 1000
Hab
itat c
ompl
exity
sco
re
0
2
4
6
8
10
12
14
16
18
Area (ha)
1 10 100 1000
Isol
atio
n (m
)
0
500
1000
1500
2000
2500
3000
3500
4000
Area (ha)
1 10 100 1000
Ha
bita
t co
mpl
exity
sco
re
0
2
4
6
8
10
12
14
16
18
Area (ha)
1 10 100 1000
Isol
atio
n (m
)
0
500
1000
1500
2000
2500
3000
3500
4000
White-winged Chough
PresentAbsent
Log area (ha)
1 10 100 1000
Isol
atio
n (m
)
0
500
1000
1500
2000
2500
3000
3500
4000
PresentAbsent
Crimson Rosella
Log area (ha)
1 10 100 1000
Hab
itat c
ompl
exity
sco
re
0
2
4
6
8
10
12
14
16
18
Area (ha)
1 10 100 1000
Hab
itat c
ompl
exity
sco
re
0
2
4
6
8
10
12
14
16
18
Area (ha)
1 10 100 1000
Isol
atio
n (m
)
0
500
1000
1500
2000
2500
3000
3500
4000
Australian Magpie
PresentAbsent
Area
Area
Woodland Guidelines 1999
27
Noisy Miner
Log area (ha)
1 10 100 1000
Isol
atio
n (m
)
0
500
1000
1500
2000
2500
3000
3500
4000
Log area (ha)
1 10 100 1000
Ha
bita
t co
mpl
exity
sco
re
0
2
4
6
8
10
12
14
16
18
PresentAbsent
Silvereye
Area (ha)
1 10 100 1000
Hab
itat c
ompl
exity
sco
re
0
2
4
6
8
10
12
14
16
18
Log area (ha)
1 10 100 1000
Isol
atio
n (m
)
0
500
1000
1500
2000
2500
3000
3500
4000
PresentAbsent
Area (ha)
1 10 100 1000
Hab
itat
com
plex
ity s
core
0
2
4
6
8
10
12
14
16
18
Area (ha)
1 10 100 1000
Iso
latio
n (m
)
0
500
1000
1500
2000
2500
3000
3500
4000
Crested Pigeon
PresentAbsent
Area
Area
Woodland Guidelines 1999
28
Area (ha)
1 10 100 1000
Ha
bita
t co
mp
lexi
ty s
core
0
2
4
6
8
10
12
14
16
18
Area (ha)
1 10 100 1000
Isol
atio
n (
m)
0
500
1000
1500
2000
2500
3000
3500
4000
Eastern Yellow Robin
PresentAbsent
Area (ha)
1 10 100 1000
Hab
itat c
ompl
exity
sco
re
0
2
4
6
8
10
12
14
16
18
Area (ha)1 10 100 1000
Isol
atio
n (m
)
0
500
1000
1500
2000
2500
3000
3500
4000
Hooded Robin
PresentAbsent
Area (ha)
1 10 100 1000
Ha
bita
t com
plex
ity s
core
0
2
4
6
8
10
12
14
16
18
Area (ha)
1 10 100 1000
Isol
atio
n (
m)
0
500
1000
1500
2000
2500
3000
3500
4000
Jacky Winter
PresentAbsent
Area (ha)
1 10 100 1000
Hab
itat c
ompl
exity
sco
re
0
2
4
6
8
10
12
14
16
18
Area (ha)
1 10 100 1000
Isol
atio
n (m
)
0
500
1000
1500
2000
2500
3000
3500
4000
Scarlet Robin
PresentAbsent
Woodland Guidelines 1999
29
Area (ha)
1 10 100 1000
Hab
itat c
ompl
exity
sco
re
0
2
4
6
8
10
12
14
16
18
Area (ha)
1 10 100 1000
Isol
atio
n (m
)
0
500
1000
1500
2000
2500
3000
3500
4000
Restless Flycatcher
PresentAbsent
Area (ha)
1 10 100 1000
Hab
itat c
ompl
exity
sco
re
0
2
4
6
8
10
12
14
16
18
Area (ha)
1 10 100 1000
Isol
atio
n (m
)
0
500
1000
1500
2000
2500
3000
3500
4000
Grey Fantail
PresentAbsent
Area (ha)
1 10 100 1000
Hab
itat c
ompl
exity
sco
re
0
2
4
6
8
10
12
14
16
18
Area (ha)
1 10 100 1000
Isol
atio
n (m
)
0
500
1000
1500
2000
2500
3000
3500
4000
White-browed Scrubwren
PresentAbsent
Area (ha)
1 10 100 1000
Hab
itat
com
plex
ity s
core
0
2
4
6
8
10
12
14
16
18
Area (ha)
1 10 100 1000
Iso
latio
n (m
)
0
500
1000
1500
2000
2500
3000
3500
4000
Willie Wagtail
PresentAbsent
Woodland Guidelines 1999
30
Area (ha)
1 10 100 1000
Hab
itat c
ompl
exity
sco
re
0
2
4
6
8
10
12
14
16
18
Area (ha)
1 10 100 1000
Isol
atio
n (m
)
0
500
1000
1500
2000
2500
3000
3500
4000
Superb Fairy-wren
PresentAbsent
Area (ha)
1 10 100 1000
Hab
itat c
ompl
exity
sco
re
0
2
4
6
8
10
12
14
16
18
Area (ha)
1 10 100 1000
Isol
atio
n (m
)
0
500
1000
1500
2000
2500
3000
3500
4000
PresentAbsent
Brown Thornbill
Area (ha)
1 10 100 1000
Ha
bita
t com
ple
xity
sco
re
0
2
4
6
8
10
12
14
16
18
Area (ha)
1 10 100 1000
Iso
latio
n (m
)
0
500
1000
1500
2000
2500
3000
3500
4000
Weebill
PresentAbsent
Area (ha)
1 10 100 1000
Hab
itat c
ompl
exity
sco
re
0
2
4
6
8
10
12
14
16
18
Area (ha)
1 10 100 1000
Isol
atio
n (m
)
0
500
1000
1500
2000
2500
3000
3500
4000
Buff-rumped Thornbill
PresentAbsent
Woodland Guidelines 1999
31
Area (ha)
1 10 100 1000
Hab
itat c
ompl
exity
sco
re
0
2
4
6
8
10
12
14
16
18
Area (ha)
1 10 100 1000
Isol
atio
n (m
)
0
500
1000
1500
2000
2500
3000
3500
4000
PresentAbsent
Rufous Whistler
Area (ha)
1 10 100 1000
Ha
bita
t com
ple
xity
sco
re
0
2
4
6
8
10
12
14
16
18
Area (ha)
1 10 100 1000
Iso
latio
n (m
)
0
500
1000
1500
2000
2500
3000
3500
4000
Grey Shrike-thrush
PresentAbsent
Area (ha)
1 10 100 1000
Hab
itat c
ompl
exity
sco
re
0
2
4
6
8
10
12
14
16
18
Yellow-rumped Thornbill
Area (ha)
1 10 100 1000
Isol
atio
n (m
)
0
500
1000
1500
2000
2500
3000
3500
4000
PresentAbsent
Area (ha)
1 10 100 1000
Ha
bita
t com
ple
xity
sco
re
0
2
4
6
8
10
12
14
16
18
Yellow Thornbill
Area (ha)
1 10 100 1000
Iso
latio
n (m
)
0
500
1000
1500
2000
2500
3000
3500
4000
PresentAbsent
Rufous Whistler
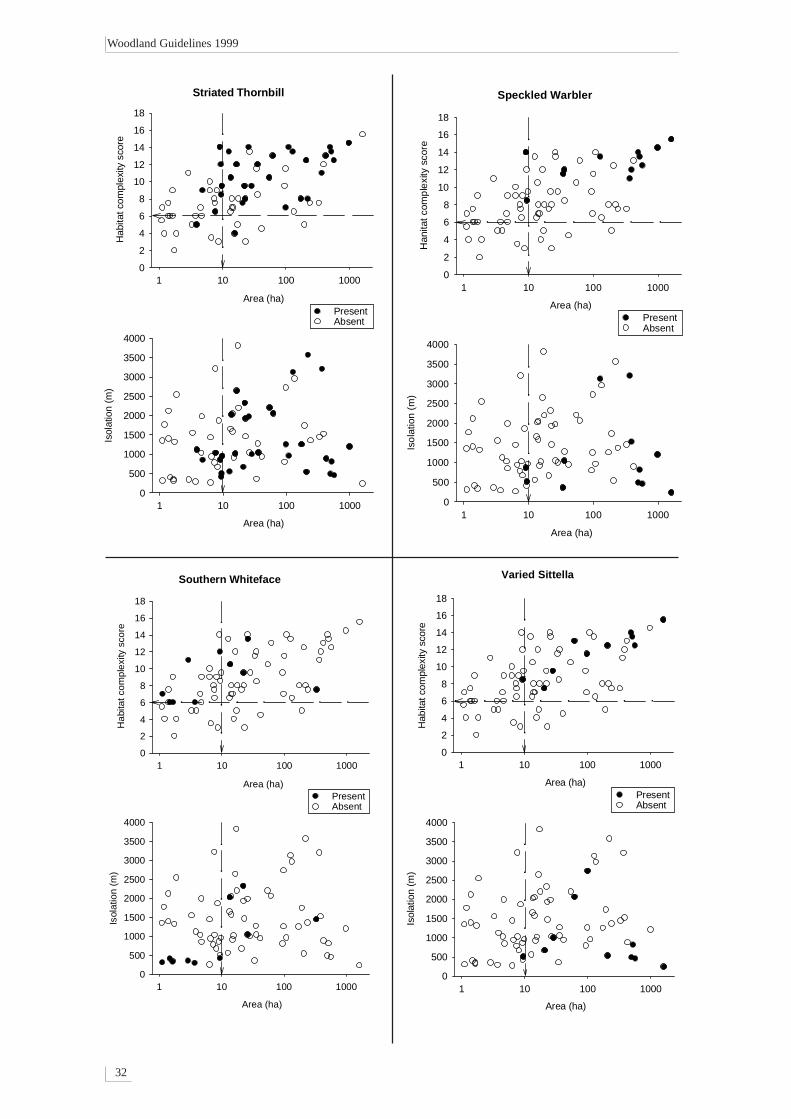
Woodland Guidelines 1999
32
Area (ha)
1 10 100 1000
Han
itat
com
ple
xity
sco
re
0
2
4
6
8
10
12
14
16
18
Area (ha)
1 10 100 1000
Iso
latio
n (
m)
0
500
1000
1500
2000
2500
3000
3500
4000
Speckled Warbler
PresentAbsent
Area (ha)
1 10 100 1000
Hab
itat c
ompl
exity
sco
re
0
2
4
6
8
10
12
14
16
18
Striated Thornbill
Area (ha)
1 10 100 1000
Isol
atio
n (m
)
0
500
1000
1500
2000
2500
3000
3500
4000
PresentAbsent
Area (ha)
1 10 100 1000
Hab
itat c
ompl
exity
sco
re
0
2
4
6
8
10
12
14
16
18
Southern Whiteface
Area (ha)
1 10 100 1000
Isol
atio
n (m
)
0
500
1000
1500
2000
2500
3000
3500
4000
PresentAbsent
Area (ha)
1 10 100 1000
Hab
itat c
ompl
exity
sco
re
0
2
4
6
8
10
12
14
16
18
Varied Sittella
Area (ha)
1 10 100 1000
Isol
atio
n (m
)
0
500
1000
1500
2000
2500
3000
3500
4000
PresentAbsent
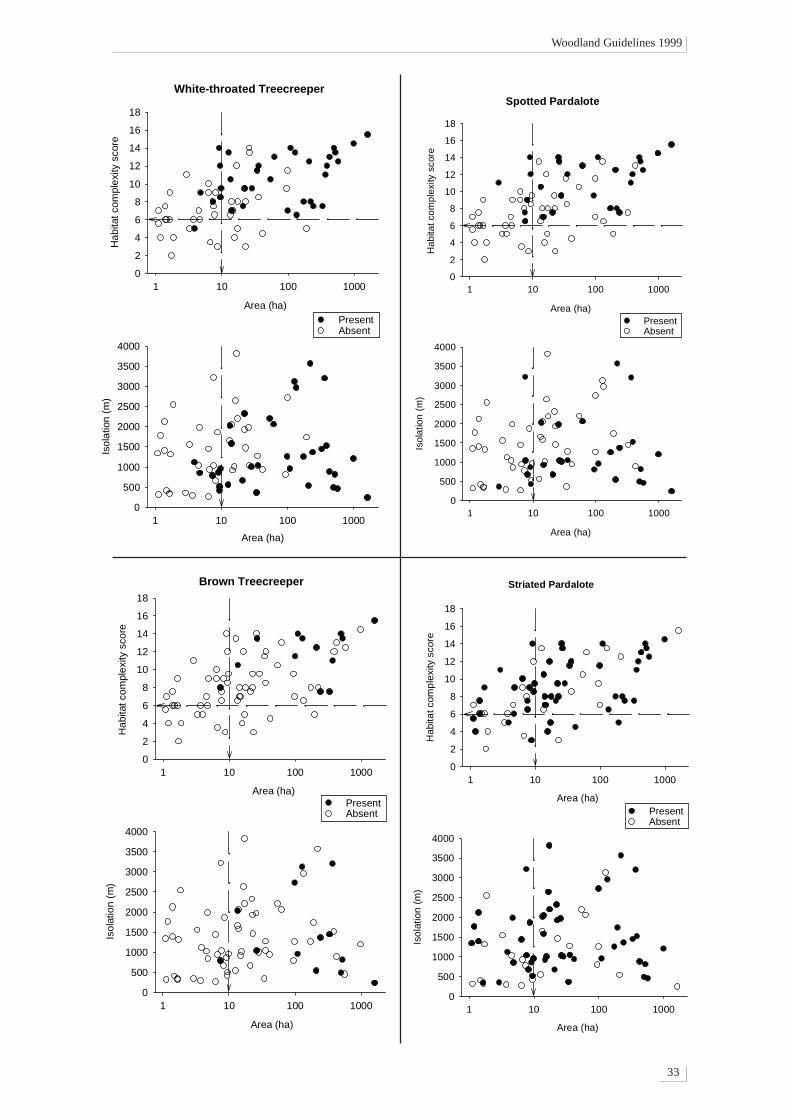
Woodland Guidelines 1999
33
Area (ha)
1 10 100 1000
Hab
itat c
ompl
exity
sco
re
0
2
4
6
8
10
12
14
16
18
White-throated Treecreeper
Area (ha)
1 10 100 1000
Isol
atio
n (m
)
0
500
1000
1500
2000
2500
3000
3500
4000
PresentAbsent
Area (ha)
1 10 100 1000
Hab
itat c
ompl
exity
sco
re
0
2
4
6
8
10
12
14
16
18
Brown Treecreeper
Area (ha)
1 10 100 1000
Isol
atio
n (m
)
0
500
1000
1500
2000
2500
3000
3500
4000
PresentAbsent
Striated Pardalote
Area (ha)
1 10 100 1000
Hab
itat c
omp
lexi
ty s
core
0
2
4
6
8
10
12
14
16
18
Area (ha)
1 10 100 1000
Iso
latio
n (
m)
0
500
1000
1500
2000
2500
3000
3500
4000
PresentAbsent
Area (ha)
1 10 100 1000
Hab
itat c
ompl
exity
sco
re
0
2
4
6
8
10
12
14
16
18
Area (ha)
1 10 100 1000
Isol
atio
n (m
)
0
500
1000
1500
2000
2500
3000
3500
4000
Spotted Pardalote
PresentAbsent
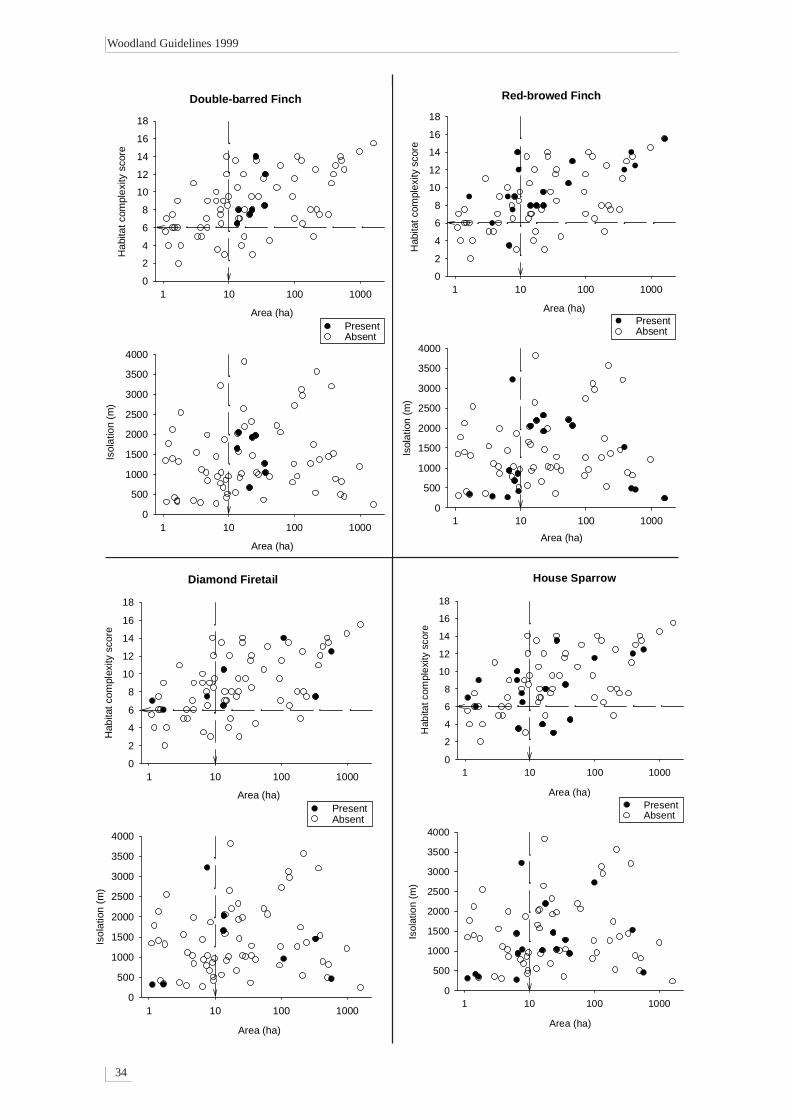
Woodland Guidelines 1999
34
Area (ha)
1 10 100 1000
Hab
itat c
ompl
exity
sco
re
0
2
4
6
8
10
12
14
16
18
Red-browed Finch
Area (ha)
1 10 100 1000
Isol
atio
n (m
)
0
500
1000
1500
2000
2500
3000
3500
4000
PresentAbsent
Area (ha)
1 10 100 1000
Hab
itat c
ompl
exity
sco
re
0
2
4
6
8
10
12
14
16
18
Diamond Firetail
Area (ha)
1 10 100 1000
Isol
atio
n (m
)
0
500
1000
1500
2000
2500
3000
3500
4000
PresentAbsent
Area (ha)
1 10 100 1000
Hab
itat c
ompl
exity
sco
re
0
2
4
6
8
10
12
14
16
18
Double-barred Finch
Area (ha)
1 10 100 1000
Isol
atio
n (m
)
0
500
1000
1500
2000
2500
3000
3500
4000
PresentAbsent
Area (ha)
1 10 100 1000
Hab
itat c
ompl
exi
ty s
core
0
2
4
6
8
10
12
14
16
18
Area (ha)
1 10 100 1000
Isol
atio
n (m
)
0
500
1000
1500
2000
2500
3000
3500
4000
House Sparrow
PresentAbsent