Embed Size (px)
Citation preview
The ASA GAISE Project:The ASA GAISE Project:The ASA GAISE Project:
Guidelines for Assessment and Instruction in Statistics Education
College ReportProfessor Jessica Utts
Department of StatisticsUniversity of California, Davis
Davis, California USAJapanese Joint Statistical Meeting
7 September 2006
GAISE College Group
Joan Garfield Univ. of Minnesota (Chair)Martha Aliaga ASA George Cobb Mt. Holyoke CollegeCarolyn Cuff Westminster CollegeRob Gould UCLARobin Lock St. Lawrence UniversityTom Moore Grinnell CollegeAllan Rossman Cal Poly San Luis ObispoBob Stephenson Iowa StateJessica Utts UC DavisPaul Velleman Cornell UniversityJeff Witmer Oberlin College
The Goal
Produce a set of recommendations and guidelines for instruction and
assessment in introductory statistics courses at the undergraduate level.
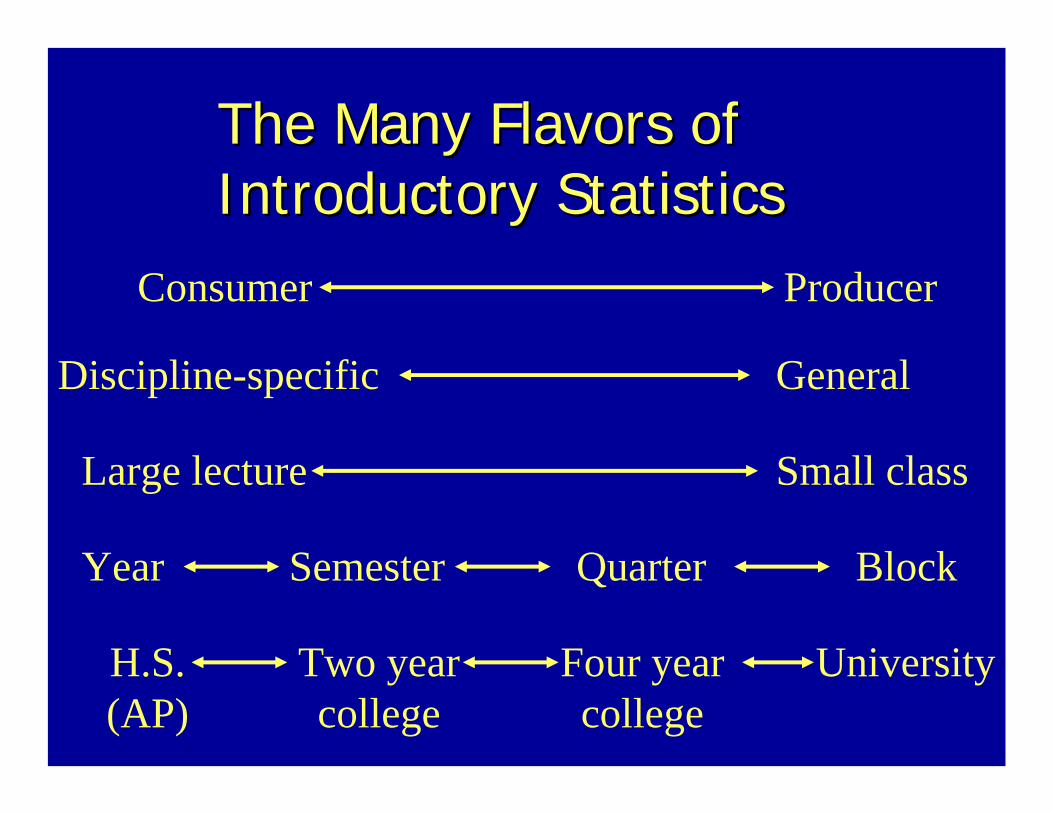
The Many Flavors of The Many Flavors of Introductory StatisticsIntroductory Statistics
Consumer Producer
GeneralDiscipline-specific
Large lecture Small class
Year BlockSemester Quarter
H.S. (AP)
UniversityTwo year college
Four year college
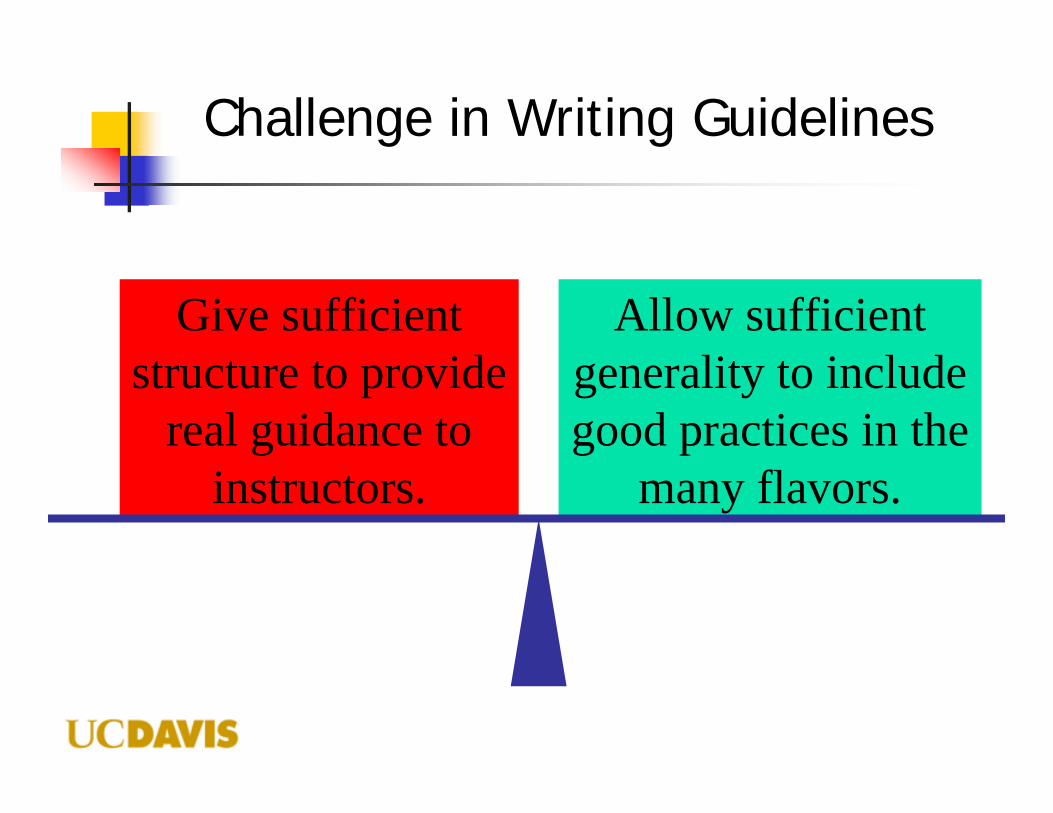
Challenge in Writing Guidelines
Give sufficient structure to provide
real guidance to instructors.
Allow sufficient generality to include good practices in the
many flavors.
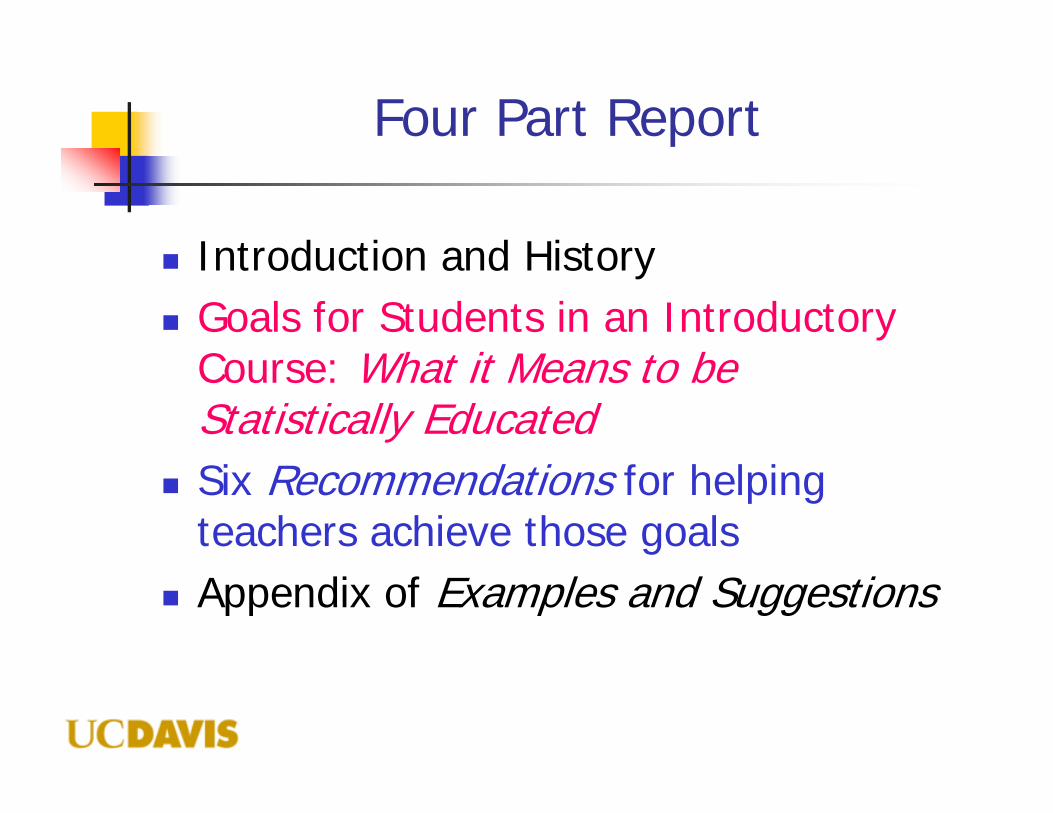
Four Part Report
Introduction and HistoryGoals for Students in an Introductory Course: What it Means to be Statistically EducatedSix Recommendations for helping teachers achieve those goalsAppendix of Examples and Suggestions
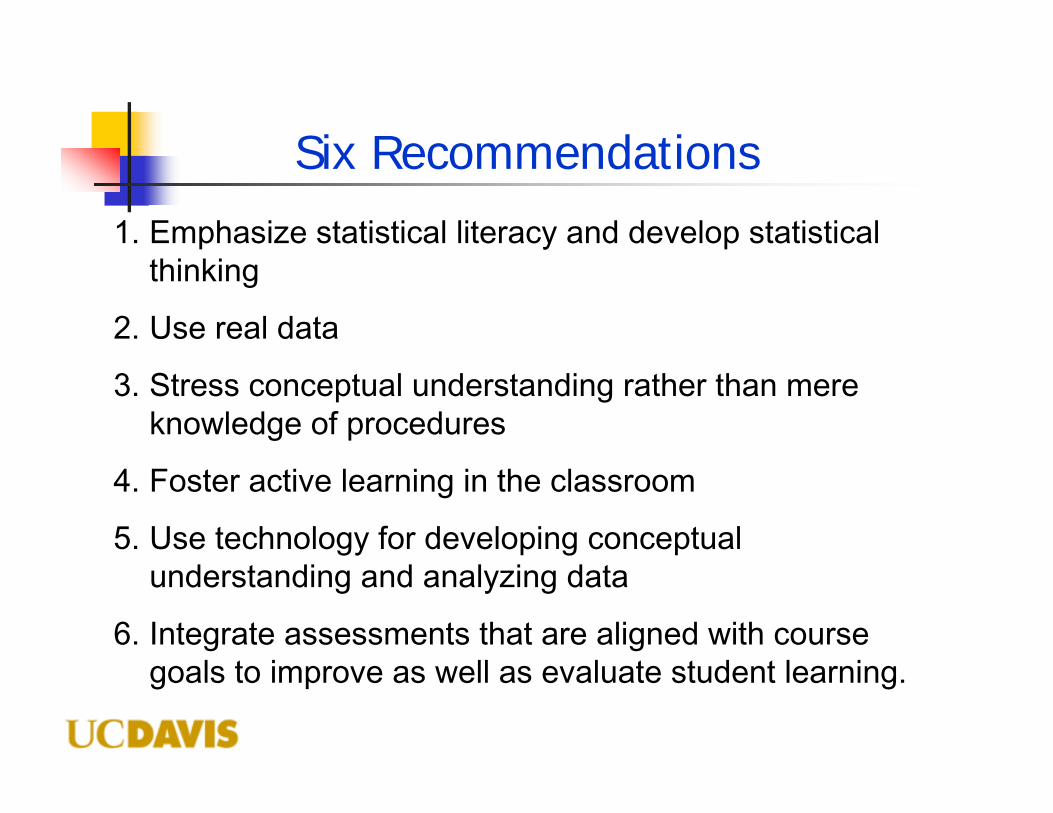
Six Recommendations1. Emphasize statistical literacy and develop statistical
thinking
2. Use real data
3. Stress conceptual understanding rather than mere knowledge of procedures
4. Foster active learning in the classroom
5. Use technology for developing conceptual understanding and analyzing data
6. Integrate assessments that are aligned with course goals to improve as well as evaluate student learning.
Recommendation #1
Emphasize statistical literacy and develop statistical thinking.
•Statistical literacy: understanding the language and ideas of statistics
•Statistical thinking: the thought process statisticians use to answer a scientific question with data
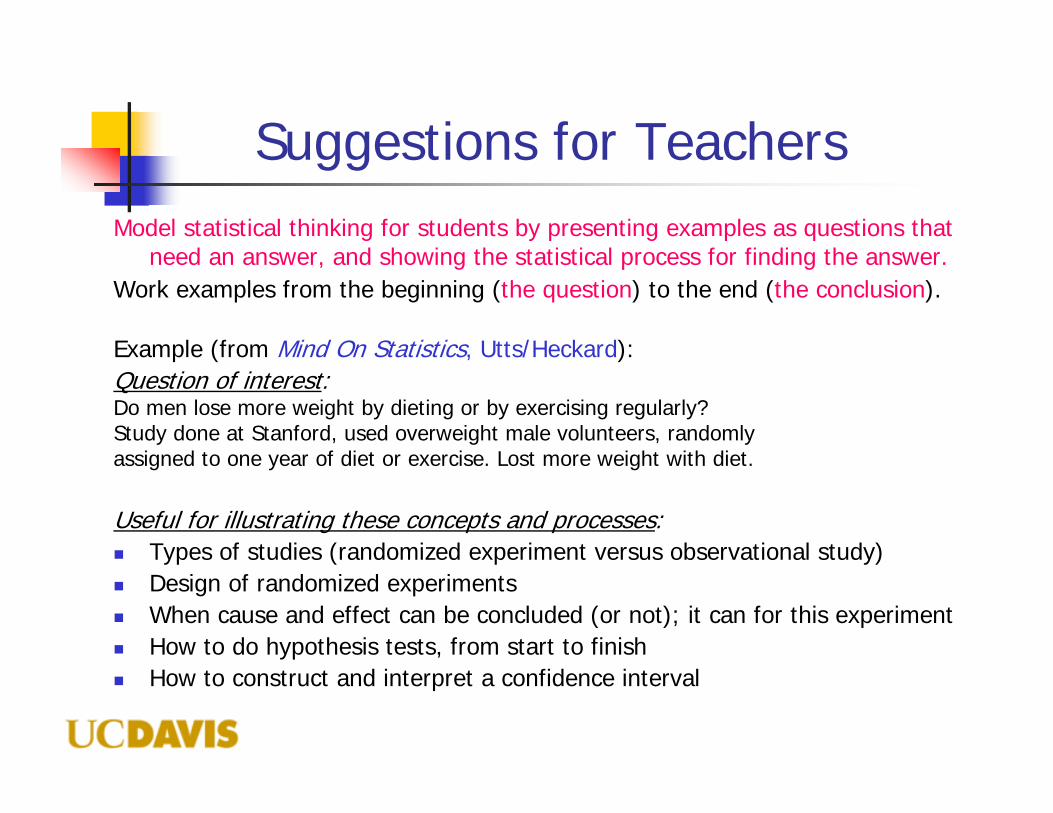
Model statistical thinking for students by presenting examples as questions that need an answer, and showing the statistical process for finding the answer.
Work examples from the beginning (the question) to the end (the conclusion).
Example (from Mind On Statistics, Utts/Heckard):Question of interest: Do men lose more weight by dieting or by exercising regularly? Study done at Stanford, used overweight male volunteers, randomlyassigned to one year of diet or exercise. Lost more weight with diet.
Useful for illustrating these concepts and processes:Types of studies (randomized experiment versus observational study)Design of randomized experimentsWhen cause and effect can be concluded (or not); it can for this experimentHow to do hypothesis tests, from start to finishHow to construct and interpret a confidence interval
Suggestions for Teachers
More Suggestions
Give students practice developing and using statistical thinking. This should include open-ended problems and projects.
Give students plenty of practice with choosing appropriate questions and techniques, rather than telling them which technique to use and merely having them implement it.
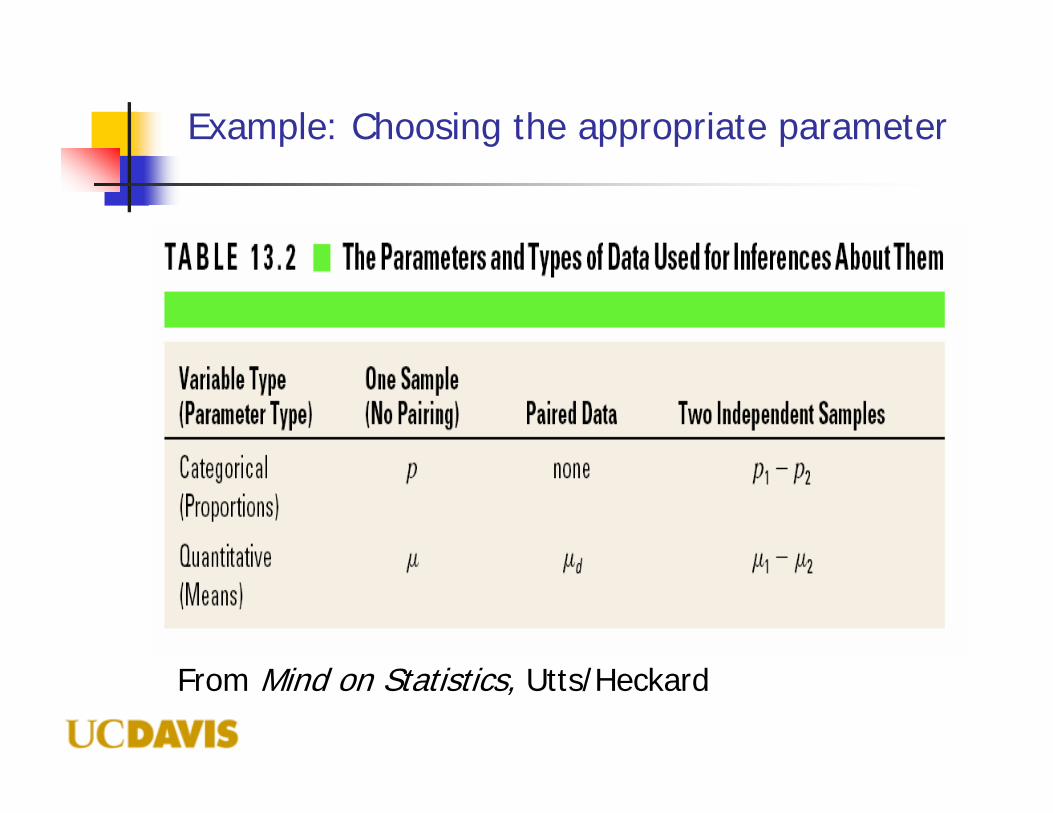
Example: Choosing the appropriate parameter
From Mind on Statistics, Utts/Heckard
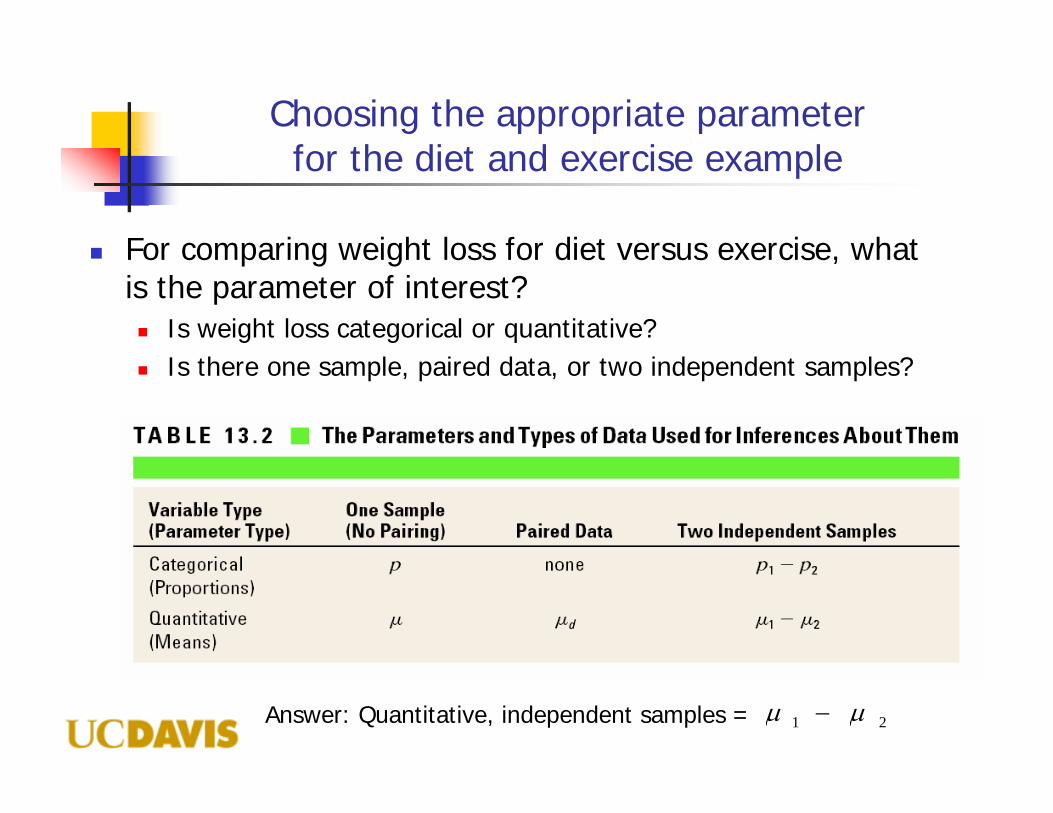
Choosing the appropriate parameter for the diet and exercise example
For comparing weight loss for diet versus exercise, what is the parameter of interest?
Is weight loss categorical or quantitative?Is there one sample, paired data, or two independent samples?
Answer: Quantitative, independent samples = 21 μμ −
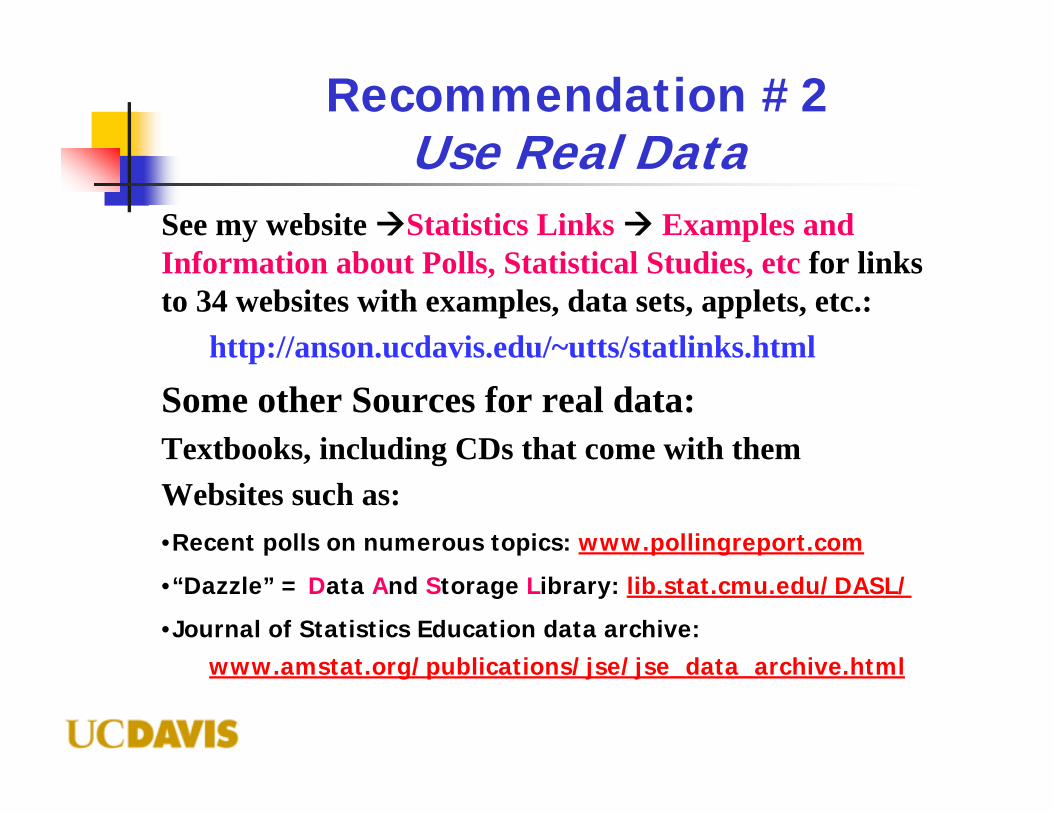
Recommendation #2Use Real Data
See my website Statistics Links Examples and Information about Polls, Statistical Studies, etc for links to 34 websites with examples, data sets, applets, etc.:
http://anson.ucdavis.edu/~utts/statlinks.html
Some other Sources for real data:Textbooks, including CDs that come with themWebsites such as:•Recent polls on numerous topics: www.pollingreport.com
•“Dazzle” = Data And Storage Library: lib.stat.cmu.edu/DASL/
•Journal of Statistics Education data archive:www.amstat.org/publications/jse/jse_data_archive.html
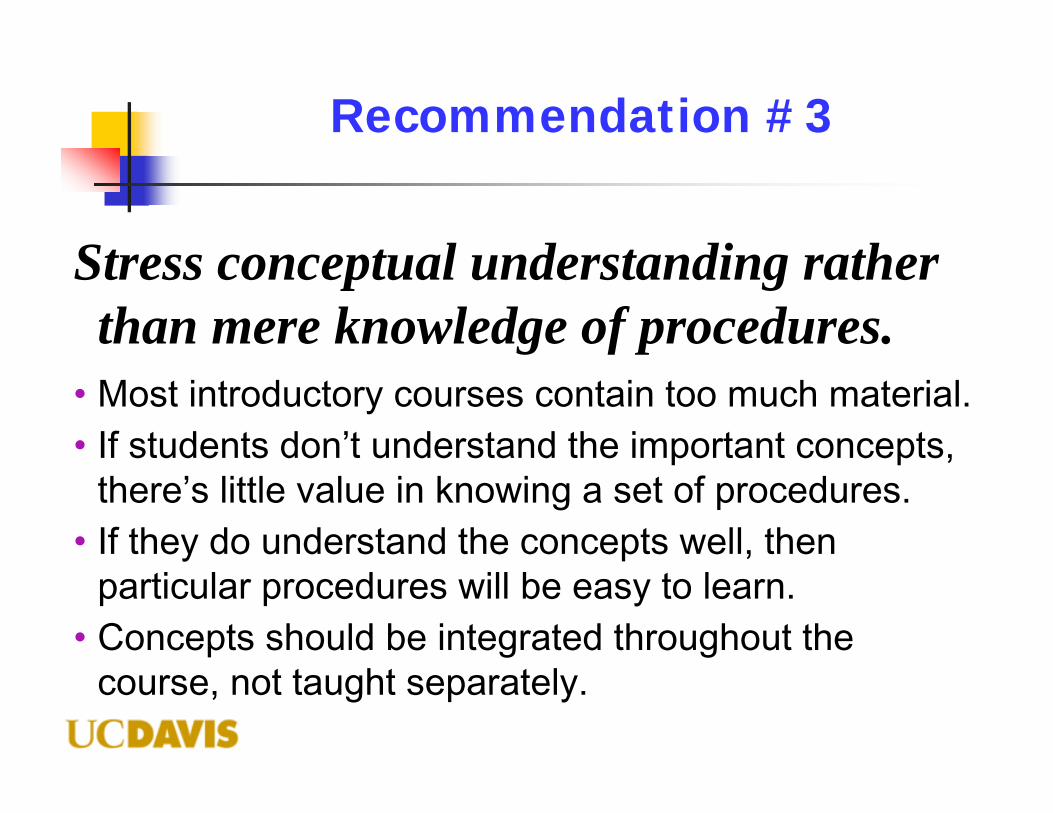
Recommendation #3
Stress conceptual understanding rather than mere knowledge of procedures.
• Most introductory courses contain too much material.• If students don’t understand the important concepts,
there’s little value in knowing a set of procedures. • If they do understand the concepts well, then
particular procedures will be easy to learn. • Concepts should be integrated throughout the
course, not taught separately.
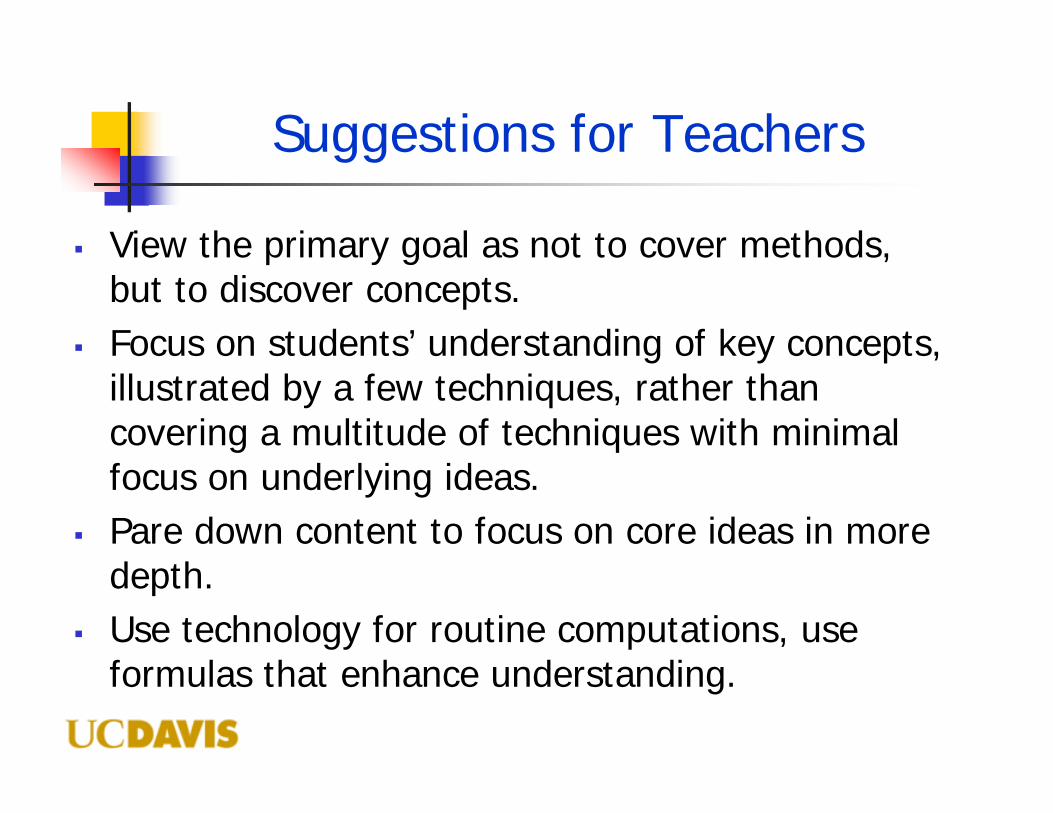
Suggestions for Teachers
View the primary goal as not to cover methods, but to discover concepts.Focus on students’ understanding of key concepts, illustrated by a few techniques, rather than covering a multitude of techniques with minimal focus on underlying ideas.Pare down content to focus on core ideas in more depth. Use technology for routine computations, use formulas that enhance understanding.
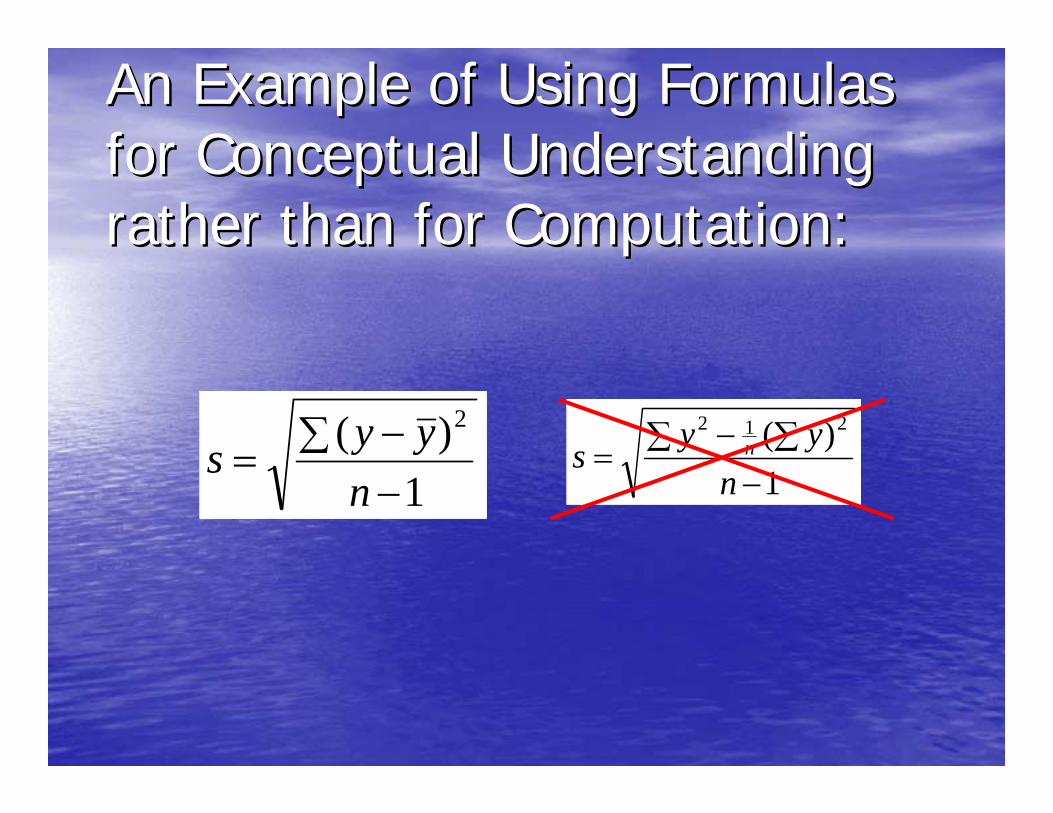
An Example of Using Formulas An Example of Using Formulas for Conceptual Understanding for Conceptual Understanding rather than for Computation:rather than for Computation:
1)( 2
−∑ −
=n
yys 1)( 212
−∑ ∑−
=n
yys n
Recommendation #4
Foster active learning in the classroom.
Types of active learning include:• Group or individual problem solving, activities and
discussion.• Lab activities (physical and computer-based).• Demonstrations based on data generated on the
spot from the students.
Some Basic Principles
Activities don't have to be physical, but they have to require thinking!! Activities with a prescribed "menu" of steps are not much use.Activities probably won't have one "right" way to do them... it's the thought process that counts!Activities should mimic a real-world situation. They should not seem like “busy work.” For instance, if you use coins or cards to conduct a binomial experiment, explain some real-world binomial experiments that they could represent.
Some Ideas for Involving Students
IN CLASSThought QuestionsHands-on Projects
AT HOME OR IN COMPUTER LABComputer Applets
Hands-on Projects
Some examples I use:Estimating the probability of “animal eye” landing so that it’s staring at you.Collecting and summarizing data of various types.
Two sources for in-class projects: Seeing Through Statistics, 3rd edition Activities Manual - 10 projects (Utts, 2005, Brooks/Cole)Instructors’ CD for Mind On Statistics, 3rd edition –35 projects (Utts/Heckard, 2006, Brooks/Cole)
Recommendation #5
Use technology for developing conceptual understanding and analyzing data.
• Graphing calculators • Statistical packages• Applets• Spreadsheets• Web-based resources including data sources, on-line
texts, and data analysis routines • Audience response systems (“clickers”)
Suggestions for teachers on ways to use technology effectively:
• Access large real data sets• Automate calculations• Generate and modify appropriate statistical
graphics in class• Perform simulations to illustrate abstract
concepts (after doing by-hand first)• Explore “what happens if…”- type questions
(example: applet in which student adds or moves points, and it updates correlation)
• Create reports
Recommendation #6
Integrate assessments that are aligned with course goals to improve as well as evaluate student learning.
• Students will value what you assess.• Assessments need to focus on understanding key ideas
and not just on skills, procedures, and computations. • Useful and timely feedback is essential for assessments
to lead to learning. • Various types of assessment may be more or less
practical in different types of courses. However, it is possible, even in large classes, to implement good assessments.
Some Types of Assessment
•Homework•Quizzes and exams•Projects•Activities•Oral Presentations•Written reports•Minute papers •Article critiques•Audience response systems (“clickers”)
Suggestions for Teachers
Integrate assessment into the course as a learning tool.Use a variety of assessment methods. Assess statistical literacy using assessments such as interpreting or critiquing articles and graphs in the news. Assess statistical thinking using assessments such as student projects and open-ended investigative tasks.For large classes
Use group projects instead of individual projectsUse peer reviewUse multiple choice questions that focus on choosing interpretations (e.g. of graphs and studies) or selecting appropriate statistical procedures.
Recommendations: Making It Happen
Start with small steps, for example:Add an activity to your courseHave your students do a small projectIntegrate an applet into a lectureDemonstrate the use of software to your studentsIncrease the use of real data setsAdd a case study (newspaper story <-> journal article)Choose one topic to delete from the list you currently try to cover and using the time saved to focus more on understanding concepts.
Recommendations: Making It Happen
Use online resources:GAISE Reports:GAISE Reports:
http://http://www.amstat.org/education/gaisewww.amstat.org/education/gaiseARTISTARTIST-- Assessment Resources:Assessment Resources:
https://https://app.gen.umn.eduapp.gen.umn.edu/artist//artist/CAUSEWebCAUSEWeb::
http://http://www.causeweb.orgwww.causeweb.orgMore Good Resources for Statistics Teachers:More Good Resources for Statistics Teachers:
http://http://anson.ucdavis.edu/~utts/statlinks.htmlanson.ucdavis.edu/~utts/statlinks.html
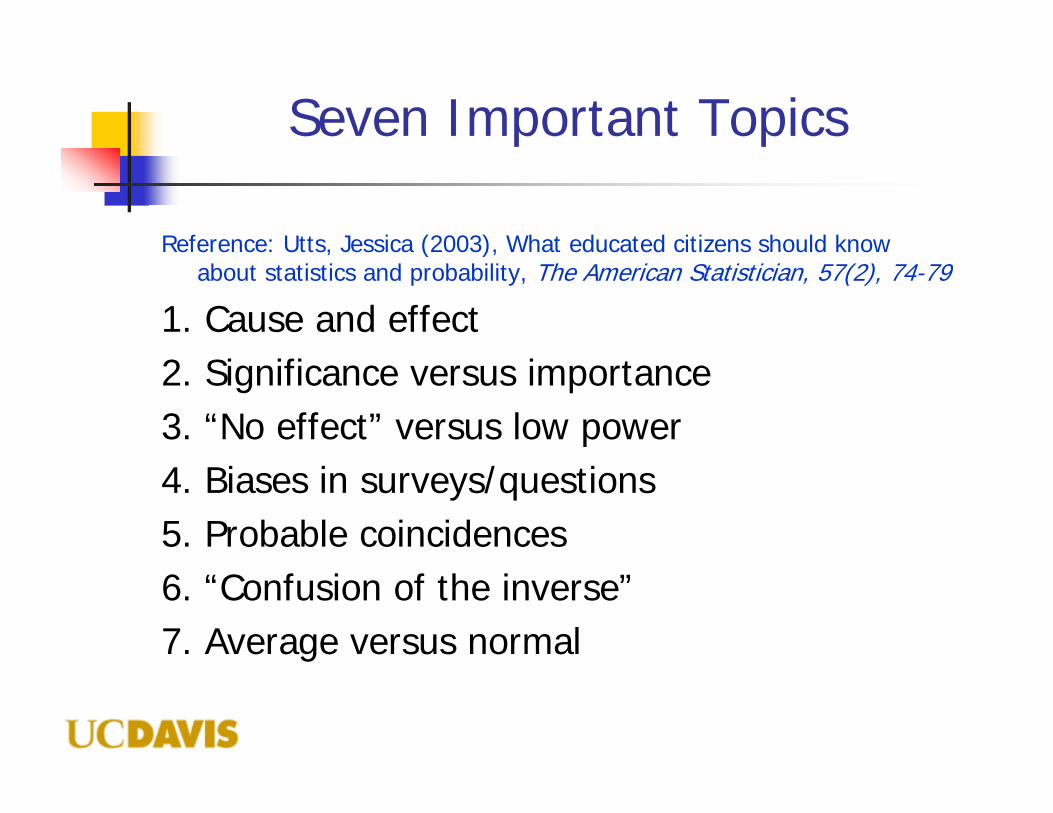
Seven Important Topics
Reference: Utts, Jessica (2003), What educated citizens should know about statistics and probability, The American Statistician, 57(2), 74-79
1. Cause and effect2. Significance versus importance3. “No effect” versus low power4. Biases in surveys/questions5. Probable coincidences6. “Confusion of the inverse”7. Average versus normal
QUESTIONS??