Embed Size (px)
Citation preview

The contents of this document were developed under an Enhanced Assessment Grant (#S368A120006) from the U.S. Department of Education.
However, the contents do not necessarily represent the policy of the U.S. Department of Education, and you should not assume endorsement by the Federal government.
Guidelines for Accessible
Assessments Project (GAAP)
Mathematics Audio Guidelines
Produced by the Measured Progress Innovation Lab and Maryland State Department of Education with funding from the U.S. Department of Education.

Guidelines for Accessible Assessments Project (GAAP) ii
WHAT ARE THE GAAP AUDIO GUIDELINES?The following document provides recommended guidelines for the audio representation of Common Core State Standards based assessment items. These guidelines are based on (1) research studies involving the read aloud accommodation, (2) preexisting state read aloud guidelines for standardized assessment, and (3) discussion and feedback from the 18 GAAP states, experts on accessibility, and content experts. WGBH’s National Center for Accessible Media (NCAM) provided information and guidance on the creation of these guidelines. The guidelines were made to inform decisions on scripting and tagging of mathematics items for computer-based delivery of the read aloud accommodation. The guidelines contained in this document are not intended to be rigid rules, but rather a guide to creating audio scripts and tags that best help students access the content in a standardized way, without violating the construct being measured.
The audio guidelines are presented in six sections: Presenting Items, Symbols, Numbers, Expressions/Operations, Graphs/Tables, and Diagrams/Figures/Keys. In each of these sections there are several content elements. For each content element, this document provides (1) audio guidelines, (2) item content examples, and (3) example audio script.
Who Will Use the Audio Guidelines?The target audience for the audio guidelines is item writers who are tasked with creating accessible audio representations of assessment content. Depending on whether the content is being created for summative, formative, or classroom based assessments, item writers could be educators, assessment vendor employees, or state department of education assessment specialists. Standard application of the GAAP audio guidelines across items and assessments will increase test reliability and comparability.
Which students will benefit from the audio guidelines? For content that contains visual elements beyond text, two types of audio guidelines are presented—“Text Only” and “Text and Graphics.” Students who only need words and numbers read aloud to them use the text only audio version. Examples of text only users include students with language processing needs and English Language Learners. Students who need descriptions of the graphics to access the content would use the text and graphics audio version. Text and graphics users include students with low vision and blind students. It should be noted that for students assigned to both Text Only and Text and Graphics, all words and numbers in the graphis and images should be available to be read on demand. For some items, text and graphics users require a tactile representation of the graphic along with audio support.

Mathematics Audio Guidelines iii
AUDIO GUIDELINE EXAMPLELess than (<)
Audio Guidelinea. Read as “is less than.”b. If there is more than one “less than” sign in an expression, read the whole relationship
together. Read the last part as “which is less than.”
Example 1:
Three is less than five.
Example 2:
X is less than y, which is less than z.
Strategy for Describing Graphics and Images Research on image description for STEM materials by the National Center for Accessible Media suggests these general principles for effective description:Brevity: Keep descriptions brief. Reading or listening to long image descriptions creates an unnecessary time burden for learners. Clarity: Make descriptions clear and easy to read. Present information in a consistent and logical order. Data: Focus on data and don’t describe extraneous visual elements. Check the text to assess the importance and meaning of data embedded in images. Drill-Down Organization: Provide a brief summary description followed by extended description and/or specific data. This allows a learner to skim the summary or continue on for more information.
Using these Guidelines with Text-to-SpeechUsing text to speech (TTS) software to provide audio support requires providing a script of content. The TTS software may contain settings that differ from these guidelines. Fractions, for example, can be read in a variety of ways, some of which may be confusing to the student. TTS could also read aloud dashes and differentiate between capital and lower case letters where it is not necessary to do so, making the description unnecessarily burdensome for the student. These audio guidelines should be used to make changes to the TTS scripts so that content is delivered to students in a reliable way, regardless of the speech mechanism used for delivery.
3<5
x<y<z

Guidelines for Accessible Assessments Project (GAAP) iv
Acknowledgements:
Lead State: Maryland State Department of EducationPartner States: Arizona Department of Education, Colorado Department of Education, Connecticut State Department of Education, Idaho State Department of Education, Kansas State Department of Education, Maine Department of Education, Michigan Department of Education, Minnesota Department of Education, Montana Office of Public Instruction, New Hampshire Department of Education, North Carolina Department of Public Instruction, Oregon Department of Education, Rhode Island Department of Education, South Carolina Department of Education, Utah State Office of Education, Vermont Department of Education, Washington Office of Superintendent of Public Instruction
Project Management Partner: Measured Progress Innovation LabEvaluation Partner: National Center for Educational OutcomesAudio Partner: WGBH’s National Center for Accessible MediaAdvisory Board Members: Larry Goldberg, Cara Laitusis, Steve Sireci, Deborah Willis, Lynn Shafer-WillnerRecommended Citation: Measured Progress Innovation Lab & MD State Department of Education (2014). Guidelines for Accessible Assessments (GAAP) English Language Arts Audio Guidelines. Retrieved [date] from: http://gaap.measuredprogress.org/gaap/
Mathematics Audio Guidelines v
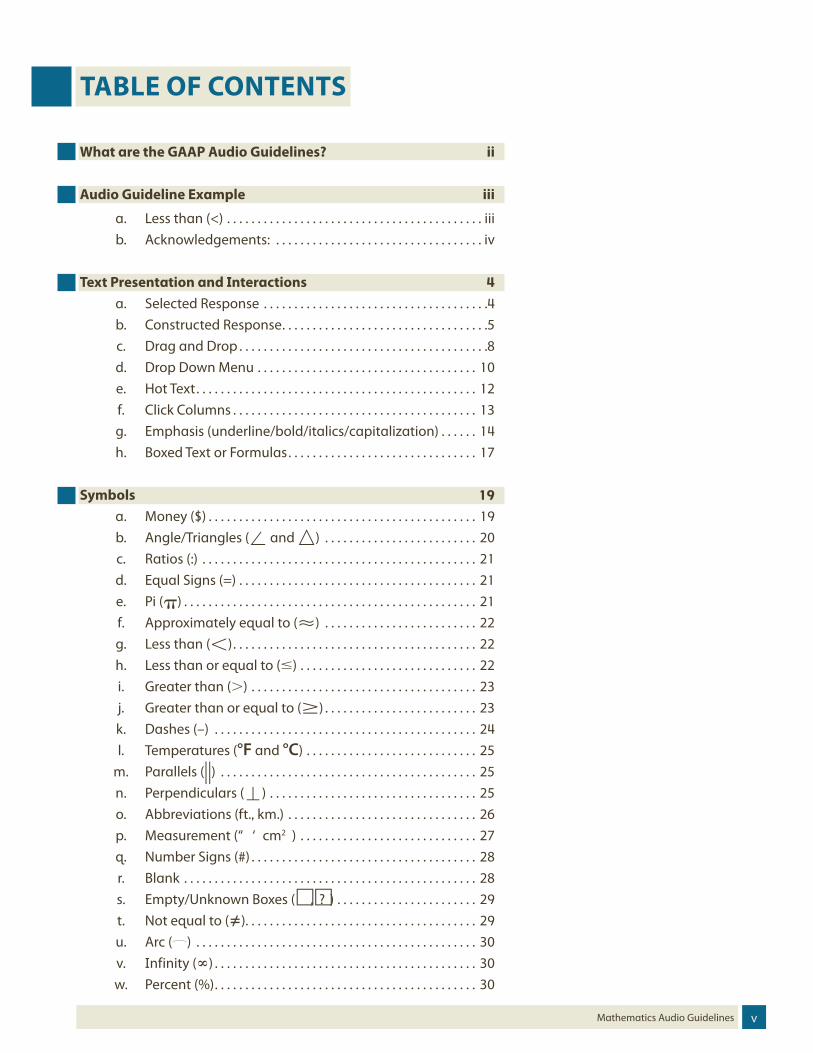
TABLE OF CONTENTS
What are the GAAP Audio Guidelines? ii
Audio Guideline Example iii
a. Less than (<) . . . . . . . . . . . . . . . . . . . . . . . . . . . . . . . . . . . . . . . . . . iiib. Acknowledgements: . . . . . . . . . . . . . . . . . . . . . . . . . . . . . . . . . . iv
Text Presentation and Interactions 4a. Selected Response . . . . . . . . . . . . . . . . . . . . . . . . . . . . . . . . . . . . .4b. Constructed Response . . . . . . . . . . . . . . . . . . . . . . . . . . . . . . . . . .5c. Drag and Drop . . . . . . . . . . . . . . . . . . . . . . . . . . . . . . . . . . . . . . . . .8d. Drop Down Menu . . . . . . . . . . . . . . . . . . . . . . . . . . . . . . . . . . . . 10e. Hot Text . . . . . . . . . . . . . . . . . . . . . . . . . . . . . . . . . . . . . . . . . . . . . . 12f. Click Columns . . . . . . . . . . . . . . . . . . . . . . . . . . . . . . . . . . . . . . . . 13g. Emphasis (underline/bold/italics/capitalization) . . . . . . 14h. Boxed Text or Formulas . . . . . . . . . . . . . . . . . . . . . . . . . . . . . . . 17
Symbols 19a. Money ($) . . . . . . . . . . . . . . . . . . . . . . . . . . . . . . . . . . . . . . . . . . . . 19b. Angle/Triangles ( and ) . . . . . . . . . . . . . . . . . . . . . . . . . 20c. Ratios (:) . . . . . . . . . . . . . . . . . . . . . . . . . . . . . . . . . . . . . . . . . . . . . 21d. Equal Signs (=) . . . . . . . . . . . . . . . . . . . . . . . . . . . . . . . . . . . . . . . 21e. Pi () . . . . . . . . . . . . . . . . . . . . . . . . . . . . . . . . . . . . . . . . . . . . . . . . 21f. Approximately equal to () . . . . . . . . . . . . . . . . . . . . . . . . . 22g. Less than () . . . . . . . . . . . . . . . . . . . . . . . . . . . . . . . . . . . . . . . . 22h. Less than or equal to () . . . . . . . . . . . . . . . . . . . . . . . . . . . . . 22i. Greater than () . . . . . . . . . . . . . . . . . . . . . . . . . . . . . . . . . . . . . 23j. Greater than or equal to () . . . . . . . . . . . . . . . . . . . . . . . . . 23k. Dashes (–) . . . . . . . . . . . . . . . . . . . . . . . . . . . . . . . . . . . . . . . . . . . 24l. Temperatures (°F and °C) . . . . . . . . . . . . . . . . . . . . . . . . . . . . 25
m. Parallels () . . . . . . . . . . . . . . . . . . . . . . . . . . . . . . . . . . . . . . . . . . 25n. Perpendiculars () . . . . . . . . . . . . . . . . . . . . . . . . . . . . . . . . . . 25o. Abbreviations (ft., km.) . . . . . . . . . . . . . . . . . . . . . . . . . . . . . . . 26p. Measurement (“ ‘ cm2 ) . . . . . . . . . . . . . . . . . . . . . . . . . . . . . 27q. Number Signs (#) . . . . . . . . . . . . . . . . . . . . . . . . . . . . . . . . . . . . . 28r. Blank . . . . . . . . . . . . . . . . . . . . . . . . . . . . . . . . . . . . . . . . . . . . . . . . 28s. Empty/Unknown Boxes (� ,? ) . . . . . . . . . . . . . . . . . . . . . . . 29t. Not equal to (). . . . . . . . . . . . . . . . . . . . . . . . . . . . . . . . . . . . . . 29u. Arc () . . . . . . . . . . . . . . . . . . . . . . . . . . . . . . . . . . . . . . . . . . . . . . 30v. Infinity () . . . . . . . . . . . . . . . . . . . . . . . . . . . . . . . . . . . . . . . . . . . 30w. Percent (%) . . . . . . . . . . . . . . . . . . . . . . . . . . . . . . . . . . . . . . . . . . . 30

Guidelines for Accessible Assessments Project (GAAP) vi
x. Lines: Line Segment, Line, and Ray ( CD, , ) . . . . . . . 31y. Similar to () . . . . . . . . . . . . . . . . . . . . . . . . . . . . . . . . . . . . . . . . 31z. Therefore ( ) . . . . . . . . . . . . . . . . . . . . . . . . . . . . . . . . . . . . . . . . 32
aa. Congruent () . . . . . . . . . . . . . . . . . . . . . . . . . . . . . . . . . . . . . . . 32ab. Factorial (!) . . . . . . . . . . . . . . . . . . . . . . . . . . . . . . . . . . . . . . . . . . . 32ac. Plus or Minus ( ) . . . . . . . . . . . . . . . . . . . . . . . . . . . . . . . . . . . . 33ad. Subscript ( Ai ) . . . . . . . . . . . . . . . . . . . . . . . . . . . . . . . . . . . . . . . . 33
Numbers 34a. Negative/Positive Numbers . . . . . . . . . . . . . . . . . . . . . . . . . . . 34b. Large Whole Numbers . . . . . . . . . . . . . . . . . . . . . . . . . . . . . . . . 35c. Fractions/Improper Fractions . . . . . . . . . . . . . . . . . . . . . . . . . 36d. Rational Expressions . . . . . . . . . . . . . . . . . . . . . . . . . . . . . . . . . 37e. Proportions . . . . . . . . . . . . . . . . . . . . . . . . . . . . . . . . . . . . . . . . . 38f. Probability . . . . . . . . . . . . . . . . . . . . . . . . . . . . . . . . . . . . . . . . . . 38g. Mixed Numbers . . . . . . . . . . . . . . . . . . . . . . . . . . . . . . . . . . . . . . 39h. Decimal Points . . . . . . . . . . . . . . . . . . . . . . . . . . . . . . . . . . . . . . . 39i. Roman Numerals . . . . . . . . . . . . . . . . . . . . . . . . . . . . . . . . . . . . 40j. Time . . . . . . . . . . . . . . . . . . . . . . . . . . . . . . . . . . . . . . . . . . . . . . . . . 41k. Date . . . . . . . . . . . . . . . . . . . . . . . . . . . . . . . . . . . . . . . . . . . . . . . . 42l. Coordinate Pairs . . . . . . . . . . . . . . . . . . . . . . . . . . . . . . . . . . . . . 43
Expressions/Equations/Operations 43a. Multiplication . . . . . . . . . . . . . . . . . . . . . . . . . . . . . . . . . . . . . . . . 43b. Addition . . . . . . . . . . . . . . . . . . . . . . . . . . . . . . . . . . . . . . . . . . . . . 44c. Subtraction . . . . . . . . . . . . . . . . . . . . . . . . . . . . . . . . . . . . . . . . . . 44d. Division . . . . . . . . . . . . . . . . . . . . . . . . . . . . . . . . . . . . . . . . . . . . . . 44e. Parentheses . . . . . . . . . . . . . . . . . . . . . . . . . . . . . . . . . . . . . . . . . . 45f. Mathematical Exponents . . . . . . . . . . . . . . . . . . . . . . . . . . . . . 46g. Variables/Letters . . . . . . . . . . . . . . . . . . . . . . . . . . . . . . . . . . . . . 47h. Logs . . . . . . . . . . . . . . . . . . . . . . . . . . . . . . . . . . . . . . . . . . . . . . . . . 48i. Radicals . . . . . . . . . . . . . . . . . . . . . . . . . . . . . . . . . . . . . . . . . . . . . 50j. Absolute Values . . . . . . . . . . . . . . . . . . . . . . . . . . . . . . . . . . . . . . 51k. Functions f(x) . . . . . . . . . . . . . . . . . . . . . . . . . . . . . . . . . . . . . . . . 51l. System of Equations/Inequalities . . . . . . . . . . . . . . . . . . . . . 52
m. Trigonometry . . . . . . . . . . . . . . . . . . . . . . . . . . . . . . . . . . . . . . . . 53

Mathematics Audio Guidelines vii
Graphs/Tables 54a. Tables . . . . . . . . . . . . . . . . . . . . . . . . . . . . . . . . . . . . . . . . . . . . . . . 54b. Coordinate Tables . . . . . . . . . . . . . . . . . . . . . . . . . . . . . . . . . . . . 57c. Tally Charts . . . . . . . . . . . . . . . . . . . . . . . . . . . . . . . . . . . . . . . . . . 58d. Bar Graphs . . . . . . . . . . . . . . . . . . . . . . . . . . . . . . . . . . . . . . . . . . . 59e. Histograms . . . . . . . . . . . . . . . . . . . . . . . . . . . . . . . . . . . . . . . . . . 61f. Line Graphs . . . . . . . . . . . . . . . . . . . . . . . . . . . . . . . . . . . . . . . . . . 64g. Box and Whisker Plots . . . . . . . . . . . . . . . . . . . . . . . . . . . . . . . . 67h. Scatter Plots . . . . . . . . . . . . . . . . . . . . . . . . . . . . . . . . . . . . . . . . . 70i. Coordinate Grids . . . . . . . . . . . . . . . . . . . . . . . . . . . . . . . . . . . . . 73j. Exponential/Linear Function Graphs . . . . . . . . . . . . . . . . . . 78
Diagrams/Figures/Keys 81a. Tree Diagram . . . . . . . . . . . . . . . . . . . . . . . . . . . . . . . . . . . . . . . . 81b. Keys . . . . . . . . . . . . . . . . . . . . . . . . . . . . . . . . . . . . . . . . . . . . . . . . . 82c. Line Plots . . . . . . . . . . . . . . . . . . . . . . . . . . . . . . . . . . . . . . . . . . . . 83d. Shaded Figures (Grids, Bars, and Shapes) . . . . . . . . . . . . . 84e. Pictographs . . . . . . . . . . . . . . . . . . . . . . . . . . . . . . . . . . . . . . . . . . 86f. Figures/Illustrations . . . . . . . . . . . . . . . . . . . . . . . . . . . . . . . . . 89g. Number Lines . . . . . . . . . . . . . . . . . . . . . . . . . . . . . . . . . . . . . . . . 92h. Spinners . . . . . . . . . . . . . . . . . . . . . . . . . . . . . . . . . . . . . . . . . . . . . 96i. Coins and Dollars . . . . . . . . . . . . . . . . . . . . . . . . . . . . . . . . . . . . 99j. Numbered/Step Diagrams . . . . . . . . . . . . . . . . . . . . . . . . . . 101k. Geometric Figures . . . . . . . . . . . . . . . . . . . . . . . . . . . . . . . . . . . 102l. Sectors . . . . . . . . . . . . . . . . . . . . . . . . . . . . . . . . . . . . . . . . . . . . . . 106
m. Clock Faces . . . . . . . . . . . . . . . . . . . . . . . . . . . . . . . . . . . . . . . . . 107n. Math Editors and Protractors . . . . . . . . . . . . . . . . . . . . . . . . 109o. Videos . . . . . . . . . . . . . . . . . . . . . . . . . . . . . . . . . . . . . . . . . . . . . . 110p. Visual Nets . . . . . . . . . . . . . . . . . . . . . . . . . . . . . . . . . . . . . . . . . . 111
References 112
Appendices 113a. Appendix A: Stem-and-Leaf Plots . . . . . . . . . . . . . . . . . . . 113b. Appendix B: Circle Graphs . . . . . . . . . . . . . . . . . . . . . . . . . . . 114c. Appendix C: Venn Diagrams . . . . . . . . . . . . . . . . . . . . . . . . . 117d. Appendix D: Matrices . . . . . . . . . . . . . . . . . . . . . . . . . . . . . . . 118

Guidelines for Accessible Assessments Project (GAAP) 4
TEXT PRESENTATION AND INTERACTIONSSelected Response
Audio GuidelineText Only
a. When reading a numbered item, say the number before each item. If the item is broken into multiple parts, read the label for each part.
b. If the item is a multiple-choice item, say the letter before each option.Text and Graphics
a. When reading a numbered item, say “number X” before each item. If the item is broken into multiple parts, read the label for each part.
b. If the item is a multiple-choice item, say “answer” and the letter before each option.
Example 1: Text Only
1. Which of the following three-dimensional shapes has 1 rectangular face and 4 triangular faces?
A. rectangular pyramid
B. triangular pyramid
C. rectangular prism
D. triangular prism
One. Which of the following three dimensional shapes has one rectangular face and four triangular faces? A, rectangular pyramid B, triangular pyramid C, rectangular prism D, triangular prism

Mathematics Audio Guidelines 5
Example 2: Text and Graphics
1. Which of the following three-dimensional shapes has 1 rectangular face and 4 triangular faces?
A. rectangular pyramid
B. triangular pyramid
C. rectangular prism
D. triangular prism
Number One. Which of the following three dimensional shapes has one rectangular face and four triangular faces? Answer A, rectangular pyramid Answer B, triangular pyramid Answer C, rectangular prism Answer D, triangular prism
Constructed Response
Audio GuidelineText Only
a. Read any directions referring to the type-in box.Text and Graphics
a. Read any directions referring to the type-in box. b. If there are no directions referring to the box, say, “use the keypad or type your answer
in the box.”c. If the box is labeled, tell the student what the label is.d. If the question asks the student to explain an answer, tell the student the size of the
response box.

Guidelines for Accessible Assessments Project (GAAP) 6
Example 1: Text and Graphics
Five friends ordered 3 large sandwiches. James ate 3/4 of a sandwich.Katya ate 1/4 of a sandwich.Ramon ate 3/4 of a sandwich.Sienna ate 2/4 of a sandwich.How much sandwich is left for Oscar?
Five friends ordered three large sandwiches. James ate three fourths of a sandwich. Katya ate one fourth of a sandwich. Ramon ate three fourths of a sandwich. Sienna ate two fourths of a sandwich. How much sandwich is left for Oscar? Type your answer in the box.

Mathematics Audio Guidelines 7
Example 2: Text and Graphics
A theatre sold 1,500 tickets. There were 852 adult tickets and the rest were child tickets. Each adult ticket was $7.00 and each child ticket was $3.50. How much money was made in ticket sales?
Use the keypad or type your answer in the box.
$
7 8 9
4 5 6
1 2 3
0 .
A theatre sold one thousand five hundred tickets. There were eight hundred fifty two adult tickets and the rest were child tickets. Each adult ticket was seven dollars and each child ticket was three dollars and fifty cents. How much money was made in ticket sales? Use the keypad or type your answer in the box. The box is labeled dollars.
Example 3: Text and Graphics
A rectangle is 6 feet long and has a perimeter of 20 feet. What is the width of this rectangle? Explain how you solved this problem.
A rectangle is six feet long and has a perimeter of twenty feet. What is the width of this rectangle? Explain how you solved this problem. A large box is provided.
Guidelines for Accessible Assessments Project (GAAP) 8
Drag and Drop
Audio GuidelineText Only
a. Allow for all numbers, text, and symbols to be available on demand.Text and Graphics
a. The description should begin with an overall description that names each of the areas and how they are linked.
b. If the item is long, repeat the directions at the end of the description.c. The description should include whether or not numbers can be used more than once.d. If the delivery system has the technological ability, provide feedback when a student
selects a number and when the number is dropped into place. If the numbers create a fraction, that fraction should be read aloud.
Example 1: Text and Graphics
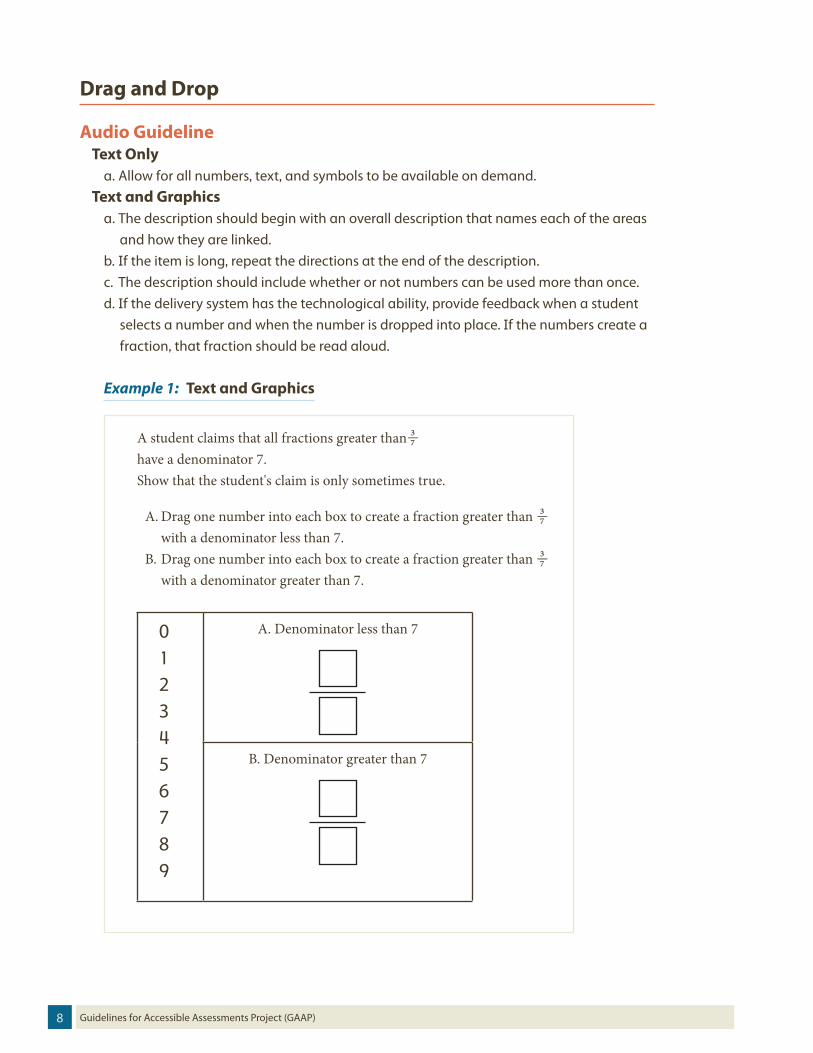
A student claims that all fractions greater than 3-7 have a denominator 7.Show that the student's claim is only sometimes true.
A. Drag one number into each box to create a fraction greater than 3-7 with a denominator less than 7.
B. Drag one number into each box to create a fraction greater than 3-7 with a denominator greater than 7.
0123456789
A. Denominator less than 7
B. Denominator greater than 7

Mathematics Audio Guidelines 9
A student claims that all fractions greater than three over seven have a denominator less than seven. Show that the student's claim is only sometimes true. Part A, drag one number into each box to create a fraction greater than three over seven with a denominator less than seven. Part B, drag one number into each box to create a fraction greater than three over seven with a denominator greater than seven. There are ten numbers on the left, zero, one, two, three, four, five, six, seven, eight, nine, to drag into four boxes. Each number can be used more than once.” Part A, Denominator less than seven. Empty box over empty box. Part B, Denominator greater than seven. Empty box over empty box. * Feedback: When students click a number, state the number's name. When a number is dropped in the top box, state the number and the box it is placed in. When dropping the second number, state the number, the box it is placed in, and the fraction as, x over y. When removing a number, state the box and that it is empty.

Guidelines for Accessible Assessments Project (GAAP) 10
Drop Down Menu
Audio GuidelineText Only
a. Read all text or number options within each drop down menu. Text and Graphics
a. Tell the student about the response area(s) by telling the type of response area (e.g. word in a sentence, create an equation), the number of drop down menus and the kind of options within them. Read the text that is with the drop down menus.
b. Read any text or number options within each drop down menu, pausing between each option.
Example 1: Text and Graphics
For a school field trip, 72 students will be traveling in 9 vans. Each van will hold an equal number of students. The equation shows a way to determine the number of students that will be in each van.
72 ÷ 9 = ?
The given equation can be written using a different operation.
Use the drop down menus to select the operation and the number to complete the equation.
9
72
?
9
72
?
+
×
−
÷
= 72
There are three drop down menus to create an equation that equals seventy two. The first has three options, the numbers nine, seventy two, and question mark. The second has four options, the operation symbols plus, multiply, minus, and divide. The third has three options, the numbers nine, seventy two, and question mark.

Mathematics Audio Guidelines 11
Example 2: Text and Graphics
Women in the study who drank green tea had a statistically significant lower rate of a certain disease than women who did not drink green tea.Use the drop-downs to complete a valid statement about the conclusion that can be made on the basis of the result of the study. From this study, it can be concluded that drinking green tea, a difference in the rates of the disease and this result of the study can be generalized to,
the women in the study only
non-smoking women in China aged 40 years and older only
all non-smoking women in China
.
causes
is associated with
There are two drop down menus to complete a sentence. From this study, it can be concluded that drinking green tea, first drop down menu with two options, the word causes, and the phrase, is associated with, a difference in the rates of the disease and this result of the study can be generalized to, second drop down menu with three options, the phrases the women in the study only, non-smoking women in China aged 40 years and older only, and all non-smoking women in China.

Guidelines for Accessible Assessments Project (GAAP) 12
Hot Text
Audio GuidelineText Only
a. Have any text or numbers on the hot text area available to be read on demand.Text and Graphics
a. Provide specific, step-by-step instructions for a student to use all the buttons on the graph.
b. If the delivery system has the technological ability to provide feedback, when the student selects a tool, that tool should read its name. Without violating the construct, the student should also receive feedback about where he or she is drawing in the hot text area.
Example 1: Text and Graphics
John and Kim wrote down two different functions that have the same rate of change. John’s function is represented by the table shown.
X Y-1 -51 -13 3
Use the Add Arrow tool to graph a function that could be Kim's function.
2 4 6 8
y
x-2-4-8 -6
2
-2
4
-4
-6
-8
6
8
Delete Add Point Add Arrow
A blank coordinate grid with x and y axes ranging from negative eight to eight. Buttons indicate a delete tool, an add point tool, and an add arrow tool. Add points to the graph and then add an arrow to connect them.

Mathematics Audio Guidelines 13
Click Columns
Audio GuidelineText Only
a. Allow for all text and numbers in the graphics and columns to be available on demand.Text and Graphics
a. Read the item directions referring to the type-in box. Describe the interaction area, including any column labels, column content, and answer space labels.
b. If the item is designed to measure place value, do not use words such as “hundreds,” “tens,” and “ones.”
c. If the delivery system has the technological ability to provide feedback, when a student selects a number anywhere but the ones column, that number should be read aloud. If the student selects a number in the ones column, the whole number should be read.
Example 1: Text and Graphics
Allen and his family are taking a trip in 12 weeks.
He begins a countdown calendar of the number of days until the trip.
Click numbers to show the number of days Allen and his family have until the trip.
Vacation Countdown
days0123456789
0123456789
8 40123456789
Click numbers to show the number of days Allen and his family have until the trip. The Vacation Countdown has an empty box labeled days. There are three columns of numbers representing hundreds, tens and ones. Each column lists numbers zero though nine. Select the correct number of days. Eighty four.
Guidelines for Accessible Assessments Project (GAAP) 14
Emphasis (underline/bold/italics/capitalization)
Audio GuidelineText Only
a. Emphasize words that are underlined, bolded, italicized, or capitalized in the prompt, question, or answers.
b. Pause before and after the emphasized word(s) in order to differentiate emphasis.c. Do not read differently or pause for italics, underline, or bold if they are being used for
the directions before a passage or item and are not part of the prompt, question, or answers.
d. Do not read differently or pause for letters in italics, such as variables and names of angles or sides.
Text and Graphicsa. Emphasize words that are underlined, bolded, italicized, or capitalized in the prompt,
question, or answers.b. Pause before and after the emphasized word(s) in order to differentiate emphasis.c. If an item refers specifically to an emphasized word(s), such as asking the meaning of
the emphasized word, read the word by saying the type of emphasis before it. d. Do not read differently or pause for italics, underline, or bold if they are being used for
the directions before a passage or item and are not part of the prompt, question, or answers.
e. Do not read differently or pause for letters in italics, such as variables and names of angles or sides.
Mathematics Audio Guidelines 15
Example 1: Text Only/Text and Graphics
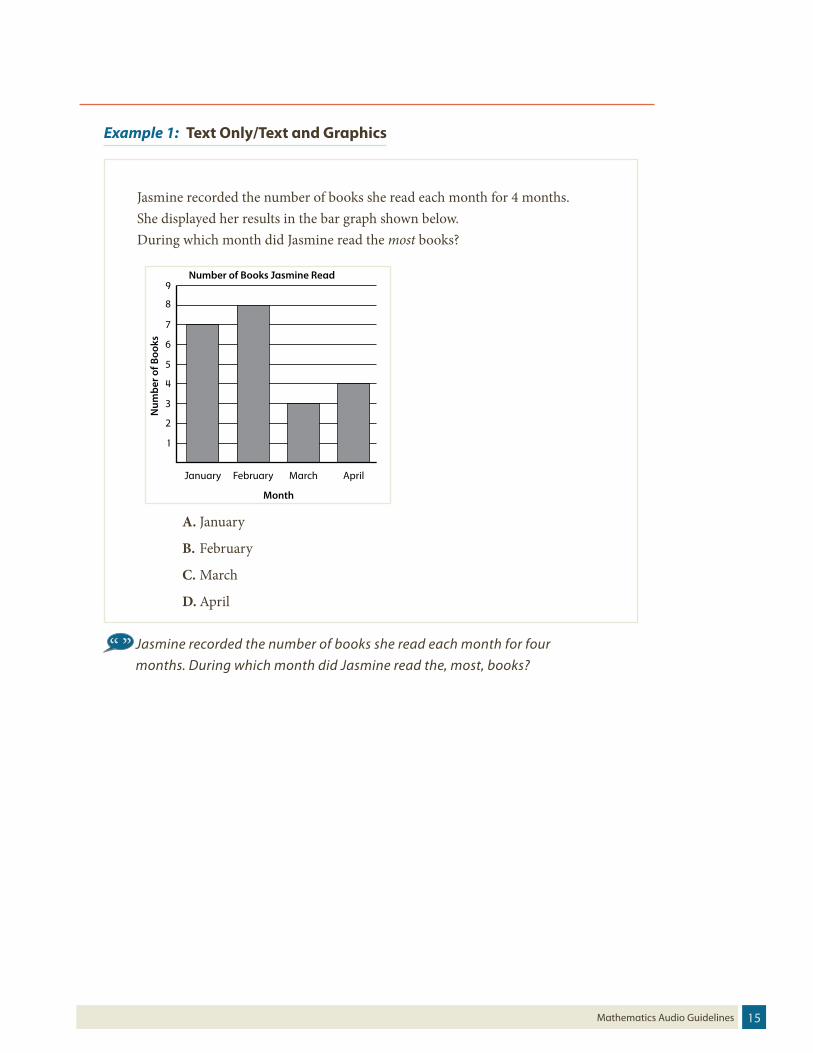
Jasmine recorded the number of books she read each month for 4 months. She displayed her results in the bar graph shown below.During which month did Jasmine read the most books?
Month
Num
ber o
f Boo
ks
January February March April
1
Number of Books Jasmine Read
2
3
4
5
6
7
8
9
A. January
B. February
C. March
D. April
Jasmine recorded the number of books she read each month for four months. During which month did Jasmine read the, most, books?

Guidelines for Accessible Assessments Project (GAAP) 16
Example 2: Text Only/Text and Graphics
This line plot shows the number of roses on each rosebush in Terry’s garden.
Roses in Terry’s Garden
Number of Roses
Each X represents 1 rosebush.
Key
How many rosebushes in Terry's garden have at least 7 roses?
A. 6
B. 8
C. 9
D. 15
How many rosebushes in Terry’s garden have at, least, seven roses?

Mathematics Audio Guidelines 17
Boxed Text or Formulas
Audio GuidelineText Only
a. Read the boxed sentence or word as is with a pause before and after to reflect a return to normal formatting.
Text and Graphicsa. Preface the boxed sentence or word by saying “begin box.”b. After reading the information in the box, say “end box.”
Example 1: Text and Graphics
Jeremy makes and sells wooden toy boats. For each boat, it costs him $2.00 for the wood and $1.00 for the materials to decorate it. He sells each boat for $7.50.Which of these expressions could represent the amount of money that Jeremy will make selling n boats after his costs to make each boat are deducted?
N = the number of boats sold
A. 7.5n – 3
B. 7.5n + 3
C. n(7.5 – 3)
D. n(7.5 + 3)
… Which of these expressions could represent the amount of money that Jeremy will make selling n boats after his costs to make each boat are deducted? Begin box, n equals number of boats sold. End box. Answer A …

Guidelines for Accessible Assessments Project (GAAP) 18
Example 2: Text and Graphics
Kyle was given a problem to solve. The problem and his work, are shown. Select the part of Kyle’s work that contains a mistake.
A company sells baseball gloves and bats. The gloves regularly cost $20, and the bats regularly cost ninety dollars. The gloves are on sale for four dollars off, and the bats are on sale for ten percent off. The goal is to sell one thousand two hundred dollars worth of bats and gloves each week. Last week, the store sold 14 gloves and 9 bats. Did the store meet its goal?
$30– $4$26
$26× 14$364
$90÷ 0.9$100
$100× 9
$900
$900+ $364$1264
1. 2. 3.
… Select the part of Kyle’s work that contains a mistake. Begin box, A company sells baseball gloves and bats. The gloves cost ninety dollars. The gloves are on sale for four dollars off, and the bats are on sale for ten percent off. The goal is to sell one thousand two hundred dollars worth of bats and gloves each week. Last week, the store sold fourteen gloves and nine bats. Did the store meet its goal? Step 1, step 2, step three, end box.

Mathematics Audio Guidelines 19
SYMBOLSMoney ($)
Audio GuidelineText Only/Text and Graphics
a. Read dollars and cents if there is a decimal point. b. Do not read shortcuts for numbers. For instance $.25 should be read as “twenty-five
cents” instead of “a quarter.”c. If the amount is less than one dollar, read “X cents” and do not read the zero ($0.35 is
“thirty-five cents” not “zero dollars and thirty-five cents”).d. Read the number place value unless the item is measuring place value (refer to the
large number section for details).
Example 1:
Four dollars and thirty-five cents
Example 2:
Two dollars and fifty cents
Example 3:
Five thousand three hundred ninety dollars
$4.35
$2.50
$5390

Guidelines for Accessible Assessments Project (GAAP) 20
Angle/Triangles ( and )
Audio GuidelineText Only/Text and Graphics
a. Read angles and shapes beginning with “angle,” “triangle,” etc. and then read each letter individually.
b. When reading a transformed or reflected angle or shape that uses “ ”, describe as “prime.”
c. Do not reference the case of the letter unless an item includes uppercase and lowercase letters. In this instance, make reference to the uppercase letters guideline.
Example 1:
Angle a b c
Example 2:
Triangle a b c
Example 3:
Triangle a prime b prime c prime
ABC
ABC
ABC

Mathematics Audio Guidelines 21
Ratios (:)
Audio GuidelineText Only/Text and Graphics
a. Read as “the ratio x to y.”b. Sometimes the ratio symbol is used for fractions. This can usually be determined by
context. If this is the case, refer to the fraction guideline. c. If “the ratio of” is used in the item, read as “x to y” to avoid being redundant.
Example 1:
The ratio three to two
Equal Signs (=)
Audio GuidelineText Only/Text and Graphics
a. Read as “equals.”b. When the symbol appears as part of an inequality, read as “is equal to.”
Example 1:
Two plus three equals five.
Pi ()
Audio GuidelineText Only/Text and Graphics
a. Read as “pi.”
Example 1:
pi
3:2
235

Guidelines for Accessible Assessments Project (GAAP) 22
Approximately equal to ()
Audio GuidelineText Only/Text and Graphics
a. Read as “is approximately equal to.”
Example 1:
Pi is approximately equal to three point one four one five nine.
Less than ()
Audio GuidelineText Only/Text and Graphics
a. Read as “is less than.”b. If there is more than one “less than” sign in an expression, read the whole relationship
together. Read the last part as “which is less than.”
Example 1:
Three is less than five.
Example 2:
X is less than y, which is less than z.
Less than or equal to ()
Audio GuidelineText Only/Text and Graphics
a. Read as “is less than or equal to.”
Example 1:
Two x is less than or equal to six.
3.14159
35
xyz
2x 6

Mathematics Audio Guidelines 23
Greater than ()
Audio GuidelineText Only/Text and Graphics
a. Read as “is greater than.”b. If there is more than one “greater than” sign read the whole relationship together. Read
the last part as “which is greater than.”
Example 1:
Seven is greater than five.
Example 2:
X is greater than y, which is greater than z.
Greater than or equal to ()
Audio GuidelineText Only/Text and Graphics
a. Read as “is greater than or equal to.”
Example 1:
Three x is greater than or equal to six.
75
xyz
3x 6

Guidelines for Accessible Assessments Project (GAAP) 24
Dashes (–)
Audio GuidelineText Only/Text and Graphics
a. When the dash is used to reference material or as a group of conditions use “through” for non-consecutive numbers and “and” for consecutive numbers.
b. When the dash is used for a range of data use the terminology “from x to y,” “x to y,” or “from x through y.”
Example 1:
Pages three through seven
Example 2:
87654321
�-60
61-7071-80
81-90
91-100
History Test Scores
Test Scores
Freq
uenc
y
How many students scored in the range 71-80?
How many students scored in the range seventy one through eighty?
Pages 3–7

Mathematics Audio Guidelines 25
Temperatures (°F and °C)
Audio Guidelinea. Read as “degrees Fahrenheit” and “degrees Celsius.”
Example 1:
Thirty five degrees Fahrenheit
Example 2:
Twenty five degrees Celsius
Parallels ()
Audio GuidelineText Only/Text and Graphics
a. Read as “is parallel to.”
Example 1:
Line segment AB is parallel to line segment DC.
Perpendiculars ()
Audio GuidelineText Only/Text and Graphics
a. Read as “is perpendicular to.”
Example 1:
Line segment BC is perpendicular to line segment DE.
35 °F
25 °C
AB CD
BC DE

Guidelines for Accessible Assessments Project (GAAP) 26
Abbreviations (ft., km.)
Audio GuidelineText Only/Text and Graphics
a. Present abbreviations by speaking the whole word the abbreviation represents.b. If the item measures the ability to identify the meaning of the abbreviation, then read
the abbreviation letter by letter. c. If speaking the abbreviation violates the construct being measured, then read letter by
letter.d. If the item has measurements that are all uppercase or lowercase, then it is not
necessary to reference the cases.
Example 1:
Three feet
Example 2:
What is the correct abbreviation for kilometer? A. kl
B. K
C. km
D. klm
What is the correct abbreviation for kilometer? Answer A, k l Answer B, upper case K Answer C, k m Answer D, k l m
3 ft.

Mathematics Audio Guidelines 27
Measurement (“ ‘ cm2 )
Audio Guidelinea. Present measurements by speaking the whole word the symbol represents.b. If speaking the abbreviation violates the construct being measured, then read letter by
letter.
Example 1:
Six inches
Example 2:
Twelve feet
Example 3:
Four square centimeters
Example 4:
Five cubic centimeters
6”
12’
4 cm2
5 cm3

Guidelines for Accessible Assessments Project (GAAP) 28
Number Signs (#)
Audio GuidelineText Only/Text and Graphics
a. Read as “number.”b. Rule refers only to when symbol is being used to signify “number” as opposed to other
non-mathematical uses of the symbol (for example, the pound key and the hash key).
Example 1:
Refer to step number five.
Blank
Audio GuidelineText Only
a. Pause for the blank line element to call attention to the absence of a word and then continue reading.
Text and Graphicsa. Read the blank element as “blank ” followed by a pause. b. If the space to be filled in has a question mark, read it as ‘question mark’.
Example 1: Text and Graphics
Twenty one plus seven equals blank, plus twenty one.
Refer to step #5.
21 7 __ 21

Mathematics Audio Guidelines 29
Empty/Unknown Boxes (� ,? )
Audio GuidelineText Only/Text and Graphics
a. Refer to an empty box in a formula or equation as “box.”b. Refer to a box with a question mark in it as “question mark.”
Example 1:
Four plus two x equals box.
Example 2:
Three plus y equals question mark.
Not equal to ()
Audio GuidelineText Only/Text and Graphics
a. Read as “is not equal to.”
Example 1:
Two x is not equal to seven.
4 �2x
3 �y ?
2x 7

Guidelines for Accessible Assessments Project (GAAP) 30
Arc ()
Audio GuidelineText Only/Text and Graphics
a. Read as “arc.”
Example 1:
Arc AC
Infinity ()
Audio GuidelineText Only/Text and Graphics
a. Read as “infinity.”
Example 1:
The number line shows limits of three and infinity.
Percent (%)
Audio GuidelineText Only/Text and Graphics
a. Read as “percent.”
Example 1:
Thirty five percent
A C
The number line shows limits of (3, )
35%

Mathematics Audio Guidelines 31
Lines: Line Segment, Line, and Ray ( CD, , )
Audio GuidelineText Only/Text and Graphics
a. Read as “line segment,” “line,” or “ray” when they appear above letters or numbers.
Example 1:
Line segment CD
Example 2:
Line AB
Example 3:
Ray AB
Similar to ()
Audio GuidelineText Only/Text and Graphics
a. Read as “is similar to.”
Example 1:
Triangle ABC is similar to triangle DEF.
CD
AB
AB
ABC DEF

Guidelines for Accessible Assessments Project (GAAP) 32
Therefore ( )
Audio GuidelineText Only/Text and Graphics
a. Read as “therefore.”
Example 1:
A equals B and B equals C, therefore A equals C.
Congruent ()
Audio GuidelineText Only/Text and Graphics
a. Read as “is congruent to.”
Example 1:
Angle ABC is congruent to Angle DEF.
Factorial (!)
Audio GuidelineText Only/Text and Graphics
a. Read as “factorial.”
Example 1:
Five factorial equals x.
A �B and B �C A �C
ABC DEF
5! �x

Mathematics Audio Guidelines 33
Plus or Minus ( )
Audio GuidelineText Only/Text and Graphics
a. Read as “plus or minus.”
Example 1:
The margin of error is four and five tenths plus or minus eight tenths.
Subscript ( Ai )
Audio GuidelineText Only/Text and Graphics
a. Read as “x subscript y.”
Example 1:
A subscript i represents the maximum amount of interest.
The margin of error is 4.5� .8
Ai represents the maximum amount of interest.

Guidelines for Accessible Assessments Project (GAAP) 34
NUMBERS Negative/Positive Numbers
Audio GuidelineText Only/Text and Graphics
a. Read as “negative.” Do not read the negative sign as a minus sign.b. In most cases, consecutive negatives that are intended to show the negative of a
negative will be represented with a set of parentheses. If this is the case, then refer to the parentheses section.
c. If the negative of a negative does not include parentheses, read as “negative (pause) negative.”
d. Two consecutive negatives should not be read as “negative negative x” if the operation is focused on subtraction. In this case, read as “minus negative x.”
e. If a positive sign precedes a number and is not part of an operation, then read as “positive.”
f. Read 0 as “zero”, not “oh.”g. Read numbers with place value, not as single numbers in isolation.
Example 1:
Negative four
Example 2:
Four minus negative five
Example 3:
What is the distance between positive four and negative three on the number line?
4
4 5
What is the distance between 4 and 3 on the number line?

Mathematics Audio Guidelines 35
Example 4:
Zero
Example 5:
Five hundred seventy nine
Large Whole Numbers
Audio GuidelineText Only/Text and Graphics
a. For items not measuring place value, read large numbers by referencing all of the number place values.
b. If the item measures place value knowledge, read the number digit by digit using commas.
c. If reading the number as a whole number violates the construct being measured, read the number digit by digit.
d. Numbers over 100 should not include the word “and” in the audio representation.
Example 1:
One hundred three thousand, four hundred fifty seven
0
579
103,457

Guidelines for Accessible Assessments Project (GAAP) 36
Example 2:
Virginia covers one hundred two thousand, five hundred fifty-eight square kilometers of land. Which shows this number?
A. 1,258
B. 12,558
C. 102,558
D. 1,200,558
Answer A, one comma two five eight Answer B, one two comma five five eight Answer C, one zero two comma five five eight Answer D, one comma two zero zero comma five five eight
Fractions/Improper Fractions
Audio GuidelineText Only/Text and Graphics
a. Read common fractions by presenting the numerator as the number it represents and the denominator as the ordinal number using two words for the whole presentation. This rule applies to fractions that have a numerator that is less than or equal to 19 and a denominator between 3 and 10, as well as denominators that are powers of ten. The exception to the above rule is 1
2, which should always be read as “one half”.
b. Read any fraction with a numerator greater than 19 and a denominator between 3 and 10 as “fraction with numerator x and denominator y.” Fractions that use variables should be read in this format.
c. Improper fractions should always be read in the format of “fraction with numerator x and denominator y.”
Example 1:
One half plus three eighths
12
38

Mathematics Audio Guidelines 37
Example 2:
Fraction with numerator six and denominator three.
Rational Expressions
Audio GuidelineText Only/Text and Graphics
a. When a fraction is complex (for example, has more than one number in the numerator/denominator, includes an arithmetic operation, or involves parentheses/exponents) denote the numerator and denominator using the language “fraction, with numerator x plus y, and denominator z.”
Example 1:
Fraction, with numerator three and denominator fourteen, plus fraction with numerator fifteen and denominator one hundred, minus fraction with numerator x and denominator two y.
Example 2:
Fraction with numerator three x plus y and denominator x.
63
15
100�
314
x2y
3x + yx

Guidelines for Accessible Assessments Project (GAAP) 38
Proportions
Audio GuidelineText Only/Text and Graphics
a. Read proportions following the rules for fractions. see page 36
Example 1:
Two thirds equals fraction with numerator one hundred twenty and denominator x.
Probability
Audio GuidelineText Only
a. Do not read “open parentheses”/ “closed parentheses”.b. Read as “P of,” then the word in parentheses, then read the equal sign as “is,” and the
text that follows. Text and Graphics
a. Do not read “open parentheses”/ “closed parentheses”.b. Read as “probability of,” then the word in parentheses, then read the equal sign as “is,”
and the text that follows.
Example 1: Text Only
P of orange is one-sixth.
Example 1: Text and Graphic
Probability of orange is one sixth.
�23
120x
P(orange) = 16
P(orange) = 16

Mathematics Audio Guidelines 39
Mixed Numbers
Audio GuidelineText Only/Text and Graphics
a. Read with “and” between the whole number and the fraction. b. Use fraction audio guideline for reading fraction portion of mixed numbers.
Example 1:
Four and three fourths
Example 2:
Five and fraction with numerator thirteen and denominator twenty eight
Decimal Points
Audio GuidelineText Only/Text and Graphics
a. Speak the numbers individually, using the word “point” to describe the decimal point.b. If there are repeating zeroes or numbers before or after the decimal point, use the
following rules:i. If there are three or fewer zeroes or repeating numbers, then read them as is.ii. If there are more than three zeroes or repeating numbers, then read them in
groups of three with pauses between each group. c. If there are many numbers in an item with a decimal point that are not zeroes and are
not repeating, then read all of them. d. Read “repeating” where “. . . “ represents the number of group of numbers that repeats.
Example 1:
Eight point two nine four five
4 34
5 1328
8.2945

Guidelines for Accessible Assessments Project (GAAP) 40
Example 2:
Forty point six five zero zero
Example 3:
Zero point one zero zero zero, zero zero
Example 4:
Zero point zero zero zero, zero zero zero, zero zero zero two
Example 5:
Zero point three repeating
Roman Numerals
Audio GuidelineText Only/Text and Graphics
a. If an item uses Roman Numerals but is not measuring knowledge of Roman Numerals, read the Roman Numeral using its Arabic numeral equivalent. For example, "Section X" would be read as "Section Ten.
b. If the item measures knowledge of Roman Numeral values, read “Roman Numeral” followed by the letters one at a time.
Example 1:
Find the point in quadrant two that is furthest from the origin.
40.6500
0.100000
0.0000000002
0.333. . .
Find the point in quadrant II that is furthest from the origin.

Mathematics Audio Guidelines 41
Example 2:
Question five. Three students walked to school taking different routes.
Example 3:
What is the numeric value of Roman Numeral V I I I?
Time
Audio GuidelineText Only/Text and Graphics
a. Read the time literally without using shortcuts or reading the time in reference to a different version of time (for example, noon, quarter of six, ten after five).
b. Read am and pm as is without adding language about the time of day (for example,” in the morning” or “at night”).
Example 1:
Six thirty
Example 2:
Nine a m
Example 3:
Five forty five
V. Three students walked to school taking different routes.
What is the numeric value of VIII?
6:30
9 AM
5:45

Guidelines for Accessible Assessments Project (GAAP) 42
Date
Audio GuidelineText Only/Text and Graphics
a. Read years as they would be read in plain language usage.b. Read months as the full name even if abbreviations are presented in text.c. Read days as you would when reading a date instead of reading the day
as a number (for example, “second” instead of “two,” “third” instead of “three,” or “fourth” instead of “four”).
Example 1:
Nineteen seventy six
Example 2:
February fifth, two thousand three
Example 3:
Nineteen hundred nine.
Example 4:
Two thousand thirteen
1976
Feb. 5, 2003
1909
2013

Mathematics Audio Guidelines 43
Coordinate Pairs
Audio GuidelineText Only/Text and Graphics
a. Read coordinate pairs as “x, comma y.” The comma is part of the standard interpretation of coordinate pairs, so it should not be omitted.
Example 1:
Point A is negative two comma four.
EXPRESSIONS/EQUATIONS/OPERATIONSMultiplication
Audio GuidelineText Only/Text and Graphics
a. Read the multiplication symbol as “times” when it appears in a math item. b. When a number, symbol, or another set of parentheses appears before a set of
parentheses read “times” to represent implied multiplication. c. If there are two variables or a variable and a number consecutively, do not read “times”
to represent implied multiplication.
Example 1:
Three times five equals y
Example 2:
x y plus four x equals ten.
Point A is (-2,4)
3 5 y
xy 4x 10

Guidelines for Accessible Assessments Project (GAAP) 44
Example 3:
Open parenthesis, three plus x, close parenthesis, open parenthesis, y, minus two, close parenthesis.
Addition
Audio GuidelineText Only/Text and Graphics
a. Read as “plus.”
Example 1:
Four plus two plus three
Subtraction
Audio Guidelinea. Read as “minus.”
Example 1:
Five minus three
Division
Audio GuidelineText Only/Text and Graphics
a. Read as “divided by.”b. If the item presents the remainder as “R” read as “remainder” unless the item is
measuring the meaning of “R.” In this case, read it as “R.”
(3 x)(y 2)
4 2 �3
5 �3

Mathematics Audio Guidelines 45
Example 1:
Twelve divided by four
Example 2:
What is 5745?
A. 10 R7
B. 11 R2
C. 12
What is fifty seven divided by five? Answer A, ten, remainder seven Answer B, eleven, remainder two Answer C, twelve
Example 3:
Seven hundred twenty five divided by forty eight.
Parentheses
Audio GuidelineText Only/Text and Graphics
a. Read the parentheses by referring to the opening and closing of the parentheses using the language “open parenthesis” and “close parenthesis.”
b. It is important to reference the close of the parentheses to be clear on when the parenthetical expression ends.
c. When reading an equation or expression with multiple parts and sets of parentheses, pause to help differentiate between sections.
d. Read brackets using the same language as parentheses, but with the word bracket (“open bracket” and “close bracket”).
12 4 4
48725

Guidelines for Accessible Assessments Project (GAAP) 46
Example 1:
Three, open parenthesis, x plus y, close parenthesis, equals six.
Example 2:
Two, open parenthesis, x plus three, close parenthesis, plus, the fraction with numerator open parenthesis, y minus two, close parenthesis, and denominator three, equals nine.
Example 3:
Open parenthesis x plus four close parenthesis, open bracket, open parenthesis x plus four close parenthesis minus open parenthesis x minus two close parenthesis, close bracket.
Mathematical Exponents
Audio Guideline Text Only/Text and Graphics
a. Read the base first – the base can be either a numeral or the variable.b. If the exponent has a value of 2, then read “squared,” if the exponent has a value of 3,
read “cubed,” otherwise read “to the xth power.”c. To indicate a return to the base, use a pause.d. Read all negative exponents as “y to the negative xth power.”e. Read fraction exponents following the fractions rule.
Example 1:
Y equals x squared.
3(x y) 6
2(x 3) (y 2)
3 �9
(x 4)(x 4) (x 2)
y x2
Example 1:
f(x) 5
Example 2:
f x 1
Example 3:
fgx
Example 4:
f-1x2 ��23 x2

Mathematics Audio Guidelines 47
Example 2:
Y equals four to the fifth power, plus two.
Example 3:
Y equals two to the x plus five power, plus three.
Example 4:
Sixteen to the fraction with numerator three and denominator two power equals eight squared.
Variables/Letters
Audio GuidelineText Only/Text and Graphics
a. Read lowercase variables in a math item without referring to case.b. If uppercase variables are used in a math item along with lowercase variables, then
specify both cases using the language “lowercase” and “uppercase.”c. If an uppercase variable appears in a math item without a lowercase variable, then do
not specify uppercase.d. A negative sign before a variable should be read as “the opposite of” where a negative
sign before a number and variable combination should be read as “negative.”
Example 1:
X plus y equals three.
y 45 2
y2x �5 �3
1632
82
x y 3

Guidelines for Accessible Assessments Project (GAAP) 48
Example 2:
In the triangle below, what is the measurement of Angle uppercase A that is opposite side lowercase a?
Example 3:
N plus four
Example 4:
The opposite of x
Example 5:
Negative two x
Logs
Audio GuidelineText Only/Text and Graphics
a. Read “log” followed by the base, the word “of,” and then the number or variable. b. If the log is shown without an explicit base, then read as “log” and the number or
variable shown. Do not interpret the implied base of 10 if it is not written. c. Read “ln x” as the “natural log of x.”
In the triangle below, what is the measurement of angle A that is opposite side a?
N �4
-x
-2x

Mathematics Audio Guidelines 49
Example 1:
Log base ten of one hundred equals two.
Example 2:
If log 20.301 and log 30.477, what is the approximate value of log 72?
A. 0.051
B. 0.778
C. 0.861
D. 1.857
If log two is approximately equal to zero point three zero one and log three is approximately equal to zero point four seven seven, what is the approximate value of log seventy two?
Example 3:
Natural log of x
Log101002
ln x

Guidelines for Accessible Assessments Project (GAAP) 50
Radicals
Audio GuidelineText Only/Text and Graphics
a. For radicals with an implied radical index of two, read as “the square root of x.”b. For radicals with a radical index of 3, read as “the cube root of x.”c. For radicals with a number for a radical index other than two or three, start by reading
the index as the “xth root of.”d. If the radical index is a variable read as the “x root of y.”
Example 1:
The square root of two
Example 2:
The fourth root of one hundred forty-four equals the x root of two hundred eighty-eight.
Example 3:
The m plus n root of x plus y
Example 4:
C equals, the square root of, a squared plus b squared.
2
4144 x288
m nx y
c=a2 �b2
Mathematics Audio Guidelines 51
Absolute Values
Audio GuidelineText Only/Text and Graphics
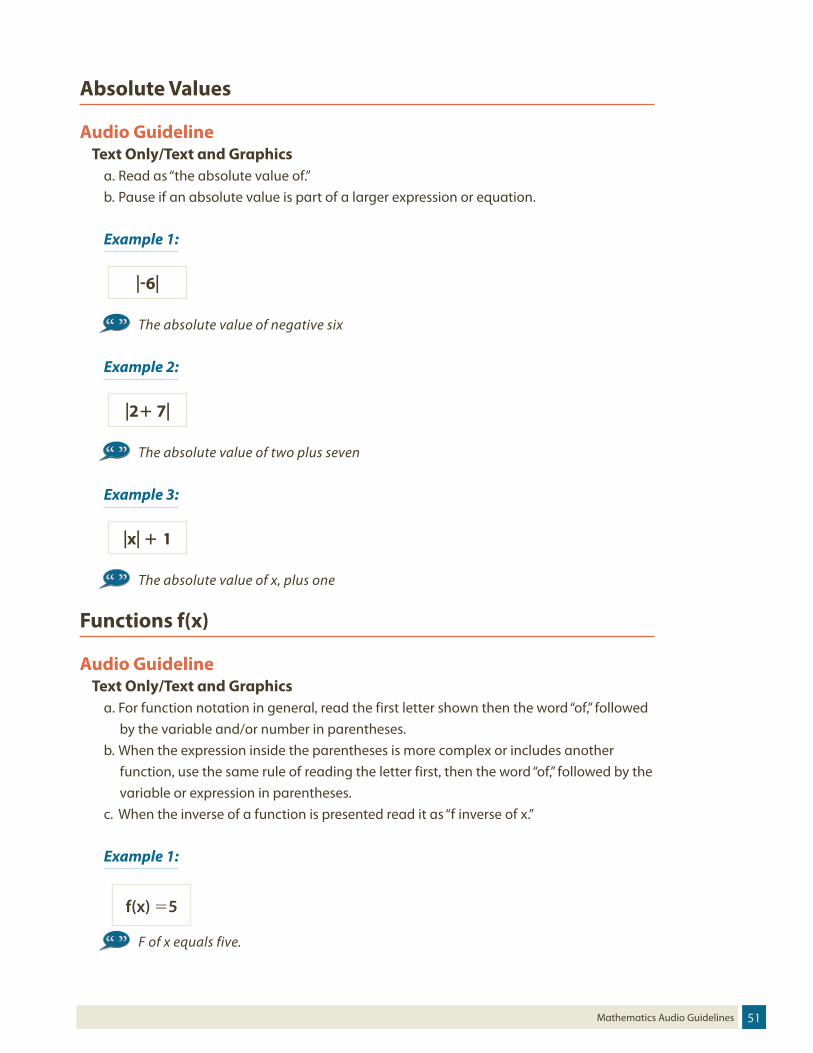
a. Read as “the absolute value of.”b. Pause if an absolute value is part of a larger expression or equation.
Example 1:
The absolute value of negative six
Example 2:
The absolute value of two plus seven
Example 3:
The absolute value of x, plus one
Functions f(x)
Audio GuidelineText Only/Text and Graphics
a. For function notation in general, read the first letter shown then the word “of,” followed by the variable and/or number in parentheses.
b. When the expression inside the parentheses is more complex or includes another function, use the same rule of reading the letter first, then the word “of,” followed by the variable or expression in parentheses.
c. When the inverse of a function is presented read it as “f inverse of x.”
Example 1:
F of x equals five.
-6
2 7
x �1
f(x) 5

Guidelines for Accessible Assessments Project (GAAP) 52
Example 2:
F of x plus one.
Example 3:
F of g of x.
Example 4:
F inverse of x equals negative two thirds x minus two.
System of Equations/Inequalities
Audio GuidelineText Only/Text and Graphics
a. Start by reading “system of x equations” or “system of x inequalities.” Then read the information in the system from top to bottom, referencing the row order.
b. Read equations and inequalities according to equation and inequality guidelines above.
Example 1:
A system of two equations, first row, x plus y equals four; second row, x minus y equals two.
f x 1
fgx
f -1x ��23 x2
xy4xy2
Mathematics Audio Guidelines 53
Example 2:
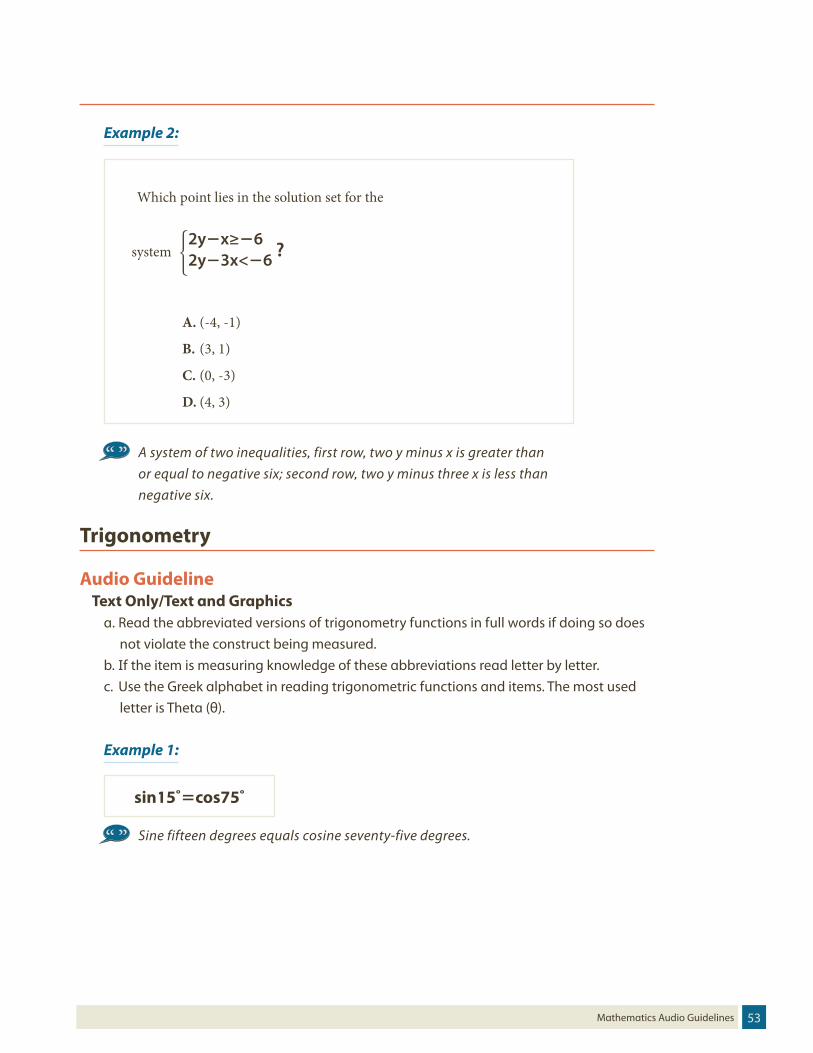
Which point lies in the solution set for the
2yx≥6 2y3x<6 ?
A. (-4, -1)
B. (3, 1)
C. (0, -3)
D. (4, 3)
system
A system of two inequalities, first row, two y minus x is greater than or equal to negative six; second row, two y minus three x is less than negative six.
Trigonometry
Audio GuidelineText Only/Text and Graphics
a. Read the abbreviated versions of trigonometry functions in full words if doing so does not violate the construct being measured.
b. If the item is measuring knowledge of these abbreviations read letter by letter. c. Use the Greek alphabet in reading trigonometric functions and items. The most used
letter is Theta (θ).
Example 1:
Sine fifteen degrees equals cosine seventy-five degrees.
sin15˚cos75˚

Guidelines for Accessible Assessments Project (GAAP) 54
GRAPHS/TABLESTables
Audio GuidelineText Only
a. Read the table title only. Allow for all content elements in the table to be read on demand.
Text and Graphicsa. Read the table title, and then describe the number of rows and columns. Then read the
column headings from left to right followed by reading the information in each row from left to right.
b. If the orientation of the table lends itself to reading table information column by column and this is a more logical manner to present the table, then do so.
c. Read the units of measure for each cell unless they are not specified in the table. d. When reading a data table that has blank cells, skip over them if they are unnecessary
to answer the question. Blank cells should be read as “blank” if this information is essential to answering the item or the student is expected to fill in the blank.
e. Remain consistent with the style of reading from table to table. Using a standardized version will help students better understand the patterns of the descriptions.
f. Many charts that are set up in a table format can be read in the above manner. Determine the layout of such charts before deciding the best way to read the information being presented.
g. In some cases of complicated tables, the header information may need to be repeated within the description. In this case, give an overview of the table, then read across the rows.
Example 1: Text and Graphics
Seashell Collection
Size Number of Seashells
Small 3Medium 6
Large 4
The table title is Seashell Collection. The table has two columns and three rows. The first column heading is Size, the second column heading is Number of Seashells; first row, Small, three seashells; second row, Medium, six seashells; third row, Large, four seashells.

Mathematics Audio Guidelines 55
Example 2: Text and Graphic
Rock Types
Shiny Air Holes Flat Layers FossilsMetamorphic X X X
Igneous X X
Sedimentary X X
The table title is Rock types. The table has four columns and three rows and shows the characteristics of different rock types. The first column heading is Shiny, the second column heading is Air Holes, the third column heading is Flat Layers, and the fourth column heading is Fossils; first row, Metamorphic, Shiny, Flat Layers, Fossils; second row, Igneous, Shiny, and Air Holes; third row, Sedimentary, Flat Layers, and Fossils.
Guidelines for Accessible Assessments Project (GAAP) 56
Example 3: Text and Graphic
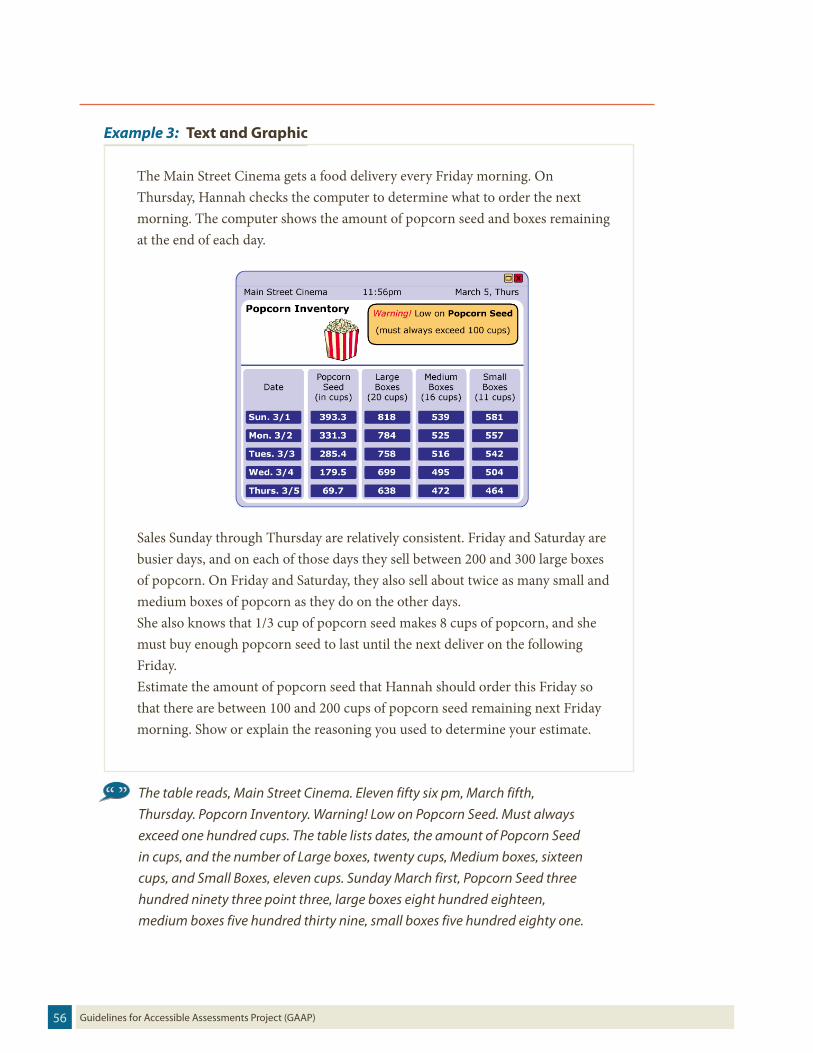
The Main Street Cinema gets a food delivery every Friday morning. On Thursday, Hannah checks the computer to determine what to order the next morning. The computer shows the amount of popcorn seed and boxes remaining at the end of each day.
14
TABLE – NEW EXAMPLE *Access to this item’s functionality is best provided via accessible interaction.
Note: The item itself is tricky since the popcorn seed is measured in cups, as is the popped corn in the boxes. However, the student must remember that it only takes 1/3 cup of seed to make 8 cups of popped corn. In addition, the student needs to refer to the column headers to double check how many cups of popped corn are in each size box. And they need to subtract numbers on different rows to find the usage for each day and makes notes about those values to use in calculations.
Sales Sunday through Thursday are relatively consistent. Friday and Saturday are busier days, and on each of those days they sell between 200 and 300 large boxes of popcorn. On Friday and Saturday, they also sell about twice as many small and medium boxes of popcorn as they do on the other days. She also knows that 1/3 cup of popcorn seed makes 8 cups of popcorn, and she must buy enough popcorn seed to last until the next deliver on the following Friday. Estimate the amount of popcorn seed that Hannah should order this Friday so that there are between 100 and 200 cups of popcorn seed remaining next Friday morning. Show or explain the reasoning you used to determine your estimate.
The table reads, Main Street Cinema. Eleven fifty six pm, March fifth, Thursday. Popcorn Inventory. Warning! Low on Popcorn Seed. Must always exceed one hundred cups. The table lists dates, the amount of Popcorn Seed in cups, and the number of Large boxes, twenty cups, Medium boxes, sixteen cups, and Small Boxes, eleven cups. Sunday March first, Popcorn Seed three hundred ninety three point three, large boxes eight hundred eighteen, medium boxes five hundred thirty nine, small boxes five hundred eighty one.

Mathematics Audio Guidelines 57
Monday March second, Popcorn Seed three hundred thirty one point three, large boxes seven hundred eighty four, medium boxes five hundred twenty five, small boxes five hundred fifty seven.
Tuesday March third, Popcorn Seed two hundred eighty five point four, large boxes seven hundred fifty eight, medium boxes five hundred sixteen, small boxes five hundred forty two.
Wednesday March fourth, Popcorn Seed one hundred seventy nine point five, large boxes six hundred ninety nine, medium boxes four hundred ninety five, small boxes five hundred four.
Thursday March fifth, Popcorn Seed sixty nine point seven, large boxes six hundred thirty eight, medium boxes four hundred seventy two, small boxes four hundred sixty four.
Coordinate Tables
Audio GuidelineText Only
a. Allow for all content elements in the table to be read on demand.Text and Graphics
a. Describe the x and y columns and number of rows. Then read the information in each row from left to right.
b. Blank cells should be read as “blank.”c. If there is more than one table, remain consistent with the style of reading from
table to table. Using a standardized version will help students better understand the patterns of the descriptions.

Guidelines for Accessible Assessments Project (GAAP) 58
Example 1: Text and Graphics
Study the table belowx y
1 -12 1
3 3
4 5
Which equation describes the relationship between the x and y values?A. y x 3
B. y x 3
C. y 2x 3
D. y 2x 3
Coordinate table with two columns and four rows. Column one x. Column two, y. One, negative one. Two, one. Three, three. Four, five.
Tally Charts
Audio GuidelineText Only
a. Read the tally chart title only. Allow for all content elements in the chart except for the tally marks to be read on demand.
Text and Graphicsa. Read the tally chart title, column headings, and row headings.b. Read the number of tally marks only if it does not violate the construct being
measured. If reading tally marks does violate the construct being measured, this item is not accessible to blind students and some low-vision students without tactile representation.

Mathematics Audio Guidelines 59
Example 1: Text and Graphics
Name Number of VotesTigers /��Rockets Sharks /��Bobcats
The tally chart has two columns and four rows. The first column heading is Name, and the second column heading is Number of Votes; first row, Tigers, six; second row, Rockets, three; third row, Sharks, seven; and fourth row, Bobcats, four.
Bar Graphs
Audio GuidelineText Only
a. Read the bar graph title. Allow for all words and numbers on the bar graph to be available to be read on demand.
Text and Graphics a. Read the bar graph title first, followed by the x-axis label and the y-axis label, as well as
the increments. If the axes are not labeled x and y, read as “horizontal” and “vertical.”b. Describe each bar, being careful to take into account the question, so as not to violate
the construct being measured. In each description, use the units of measure on the x- and y-axis labels if applicable.
c. If the item does not ask the student to estimate, and a bar is between two horizontal lines, then estimate or approximate the numbers. State that the data is approximate.
d. If the item asks the student to estimate, and a bar is between two horizontal lines, then do not estimate or approximate numbers. Instead, use more general language such as “just above,” “just below,” and “midway between.”
e. If the item measures the student’s ability to identify the number associated with the bar, then describe the graph without noting the heights of the bars. In this case, this item is not accessible to blind and some low-vision students without tactile representation.

Guidelines for Accessible Assessments Project (GAAP) 60
Example 1: Text and Graphics
76543210
Buttons in a Box
Color
Num
ber o
f But
tons
Yellow
RedBlack
BlueGreen
The bar graph title is Buttons in a Box. The horizontal label is Color and the vertical label is Number of Buttons; Yellow, five buttons; Red, six buttons; Black, five buttons; Blue, three buttons; and Green, two buttons.
Example 2: Text and Graphics(item specifically asks students to identify data associated with a bar)
76543210
Buttons in a Box
Color
Num
ber o
f But
tons
Yellow
RedBlack
BlueGreen
How many Red buttons are in the box?
The bar graph title is Buttons in a Box. The horizontal label is Color and shows five colors: Yellow, Red, Black, Blue, and Green. The vertical label is Number of Buttons.

Mathematics Audio Guidelines 61
Histograms
Audio GuidelineText Only
a. Read the histogram title. If the axes are not labeled X and Y, read as “horizontal” and “vertical.” Allow for all words and numbers on the histogram to be available to be read on demand.
Text and Graphicsa. Read the histogram title first, followed by the x-axis label and the y-axis label and
increments.b. Describe each bar range on the x-axis, being careful to take into account the question,
so as not to violate the construct being measured. In each description use the units of measure on the x- and y-axis labels if applicable.
c. If the item does not ask the student to estimate, and a bar is between two horizontal lines, then estimate or approximate the numbers. State that the data is approximate.
d. If the item asks the student to estimate, and a bar is between two horizontal lines, then do not estimate or approximate numbers. Instead, use more general language such as “just above,” “just below,” and “midway between.”
e. If the item measures the student’s ability to identify the number associated with the bar, then describe the graph without noting the heights of the bars. In this case, this item is not accessible to blind and some low-vision students without tactile representation.
f. If there are a large number of bars (more than 10) consider associating bars together or focusing on trends or more general frequency in your description.

Guidelines for Accessible Assessments Project (GAAP) 62
Example 1: Text and Graphics
242322212019181716151413121110
9876543210
Life Spans of 85 Brand X Light Bulbs
Number of Hours
Num
ber o
f Lig
ht B
ulbs
800 900 1000 1100 1200 1300
What was the total number of Brand X light bulbs that had life spans greater than or equal to 1000 hours?
a. 72b. 56c. 5d. 2
The histogram title is Life Spans of eighty five Brand X Light Bulbs. The horizontal label is Number of Hours and the vertical label is Number of Light Bulbs; bar one, eight hundred through eight hundred ninety nine hours, thirteen light bulbs; bar two, nine hundred through nine hundred ninety nine hours, sixteen light bulbs; bar three, one thousand through one thousand ninety nine hours, nineteen light bulbs; bar four, one thousand one hundred through one thousand one hundred ninety nine hours, twenty one light bulbs; bar five, one thousand two hundred through one thousand two hundred ninety nine hours, sixteen light bulbs.

Mathematics Audio Guidelines 63
Example 2: Text and Graphics(item specifically asks student to read information from one of the bars)
242322212019181716151413121110
9876543210
Life Spans of 85 Brand X Light Bulbs
Number of Hours
Num
ber o
f Lig
ht B
ulbs
800 900 1000 1100 1200 1300
How many light bulbs have a life span between 1000 and 1100?
The histogram title is Life Spans of eighty five Brand X Light Bulbs. The horizontal label is Number of Hours and the vertical label is Number of Light Bulbs. Five bars show the number of light bulbs with a life span of eight hundred through eight hundred ninety nine hours, nine hundred through nine hundred ninety nine hours, one thousand through one thousand ninety nine hours, one thousand one hundred through one thousand one hundred ninety nine hours, one thousand two hundred through one thousand two hundred ninety nine hours.

Guidelines for Accessible Assessments Project (GAAP) 64
Line Graphs
Audio GuidelineText Only
a. Read the graph title only. Allow for all words and numbers in the graph area to be available to be read on demand.
Text and Graphicsa. State that it is a line graph and read the title first.b. Read the Key title and then key section (refer to Key rule specifically).c. Read the axis labels. If the axes are not labeled x and y, read as “horizontal” and
“vertical.”d. Give the range for each axis and the increments that are labeled.e. When describing the graph, be as concise as possible while providing the necessary
information to understand and answer the question.f. If the item does not ask the student to estimate, and a line or point being described
falls between two marked x- or y-axis values, then estimate or approximate the numbers. State that the data is approximate.
g. If the item asks the student to estimate, and a line or point being described falls between two marked x- or y-axis values, then do not estimate or approximate numbers. Instead, use more general language such as “just above,” “just below,” and “midway between.”
h. It is not necessary to describe the visual attributes of the graph unless there is an explicit need, such as a key that references line types or an item referencing the attributes or if doing so would help the student in reading a tactile or a magnified version of the test.
i. If the description violates the construct being measured, then consider amending it to give less specific information. In this case, the item might not be accessible to blind/low-vision students without a tactile representation.
j. When possible, reference the starting and ending point of the line segments or starting points of rays to provide context to the student.

Mathematics Audio Guidelines 65
Example 1: Text and Graphics(item asks student to estimate)
350,000
300,000
250,000
200,000
150,000
100,000
Population of Denton
Year
Popu
latio
n
19501960
19701980
1990
A line graph titled Population of Denton. The horizontal label is Year. It starts at nineteen fifty and goes to nineteen ninety. The vertical label is Population. It starts at one hundred thousand and rises to three hundred fifty thousand in increments of fifty thousand. A line passes through the following points, nineteen fifty, one hundred thousand; nineteen sixty, two hundred thousand; nineteen seventy, midway between two hundred thousand and two hundred fifty thousand; nineteen eighty, midway between two hundred fifty thousand and three hundred thousand; nineteen ninety, three hundred fifty thousand.

Guidelines for Accessible Assessments Project (GAAP) 66
Example 2: Text and Graphics(item does not ask student to estimate)
110100
908070605040302010
Roller Rink Costs
Number of People
Cost
($)
20 4 6 8 10 12 14 16 18 20
KeyRoller Rink ARoller Rink B
x
y
A line graph titled Roller Rink Costs. Key, dashed line represents Roller Rink A, solid line represents Roller Rink B. The x axis is labeled Number of People. It starts at zero and goes to twenty. The y axis is labeled Cost, in dollars. It starts at zero and rises to one hundred ten. The dashed line starts at zero people, sixty dollars, and moves through thirteen people, ninety seven dollars, and fourteen people, one hundred two dollars. The solid line starts at zero people, ten dollars, and moves up through thirteen people, ninety seven dollars. The two lines intersect at thirteen people, ninety seven dollars.

Mathematics Audio Guidelines 67
Box and Whisker Plots
Audio GuidelineText Only
a. Read the box-and-whisker plot title. Allow for all words and numbers on the box-and-whisker plot to be available to be read on demand.
Text and Graphics a. Start by reading the title of the plot and reference that it is a box-and-whisker plot.
Read the box-and-whisker titles or any other words on the plot if applicable.b. Read the information along the bottom of the graph from left to right.c. If the item measures knowledge of a box-and-whisker plot or if description violates
the construct being measured, then describe the box-and-whisker plot without using specific terminology such as, whiskers, quartiles, or median. A more general description may be used, but the item may not be accessible to blind and some low-vision students without use of tactile representation.
d. If the item does not ask the student to estimate, and a line or point being described falls between two marked x- or y-axis values, then estimate or approximate the numbers. State that the data is approximate.
e. If the item asks the student to estimate, and a value being described falls between two marked values, then do not estimate or approximate numbers. Instead use more general language such as “just before,” “just past,” and “midway between.”
f. If c is not applicable, then describe the graph elements using specific box-and-whisker plot terminology, including whiskers, quartiles, box, and median.

Guidelines for Accessible Assessments Project (GAAP) 68
Example 1: Text and Graphics
The box-and-whisker plot below shows the distribution of the daily high temperatures, in degrees Fahrenheit, in the town of Clifton during the year 2004.
Daily High Temperatures (in degrees Fahrenheit)
30 35 40 45 50 55 60 65 70 75 80 90 95 10085
Based on the box-and-whisker plot, in which of the following intervals of temperatures is it most likely that exactly 50% of the daily high temperatures are located?
A. 38° to 54°
B. 38° to 81°
C. 54° to 72°
The title of the box and whisker plot is Daily High Temperatures, in degrees Fahrenheit. The number line ranges from thirty to one hundred degrees Fahrenheit in increments of five degrees. The whiskers range from thirty eight degrees to ninety six degrees and the box ranges from fifty four to eighty one degrees with a median of seventy two degrees.

Mathematics Audio Guidelines 69
Example 2: Text and Graphics
The box and whisker plot below represents the daily high temperatures at a beach in April.
Daily High Temperatures
60°F 70°F 80°F 90°F 100°F
What was the median daily high temperature?A. 68°F
B. 72°F
C. 78°F
D. 84°F
The title of the box and whisker plot is Daily High Temperatures. The number line ranges from sixty to one hundred degrees Fahrenheit in increments of ten degrees. The minimum value on the box and whisker is sixty two degrees, the maximum value is eighty four degrees, quartile one is at sixty eight degrees, quartile two is at seventy two degrees, and quartile three is at seventy eight degrees.

Guidelines for Accessible Assessments Project (GAAP) 70
Example 3: Text and Graphics
Look at the box-and-whisper plot of pumpkin weights.
8 10 12 14 16 18 20 22 24
Pumpkin Weights (lb)
What is the median pumpkin weight?A. 12 lb
B. 14 lb
C. 15 lb
D. 16 lb
The title of the box and whisker plot is Pumpkin Weights, in pounds. The number line ranges from eight pounds to twenty-four pounds, in increments of two pounds. The whiskers range from ten pounds to twenty four pounds and the box ranges from twelve pounds to sixteen pounds. There is a line in the middle of the box at fifteen pounds.
Scatter Plots
Audio GuidelineText Only
a. Read the title of the scatter plot. Allow for all words and numbers on the scatter plot to be available to be read on demand.
Text and Graphicsa. For scatter plots, start by reading the title and x-axis and y-axis labels. If the axes are
not labeled x and y, read as “horizontal” and “vertical.” Include the x- and y-axis ranges if necessary to access the item.
b. Give the range for each axis and the increments that are labeled.c. For a scatter plot with only a few data points (fewer than ten) reference each data
point. Include units of measure while describing data points only if deemed relevant.d. If the item does not ask the student to estimate, and a line or point being described
falls between two marked x- or y-axis values, then estimate or approximate the numbers. State that the data is approximate.

Mathematics Audio Guidelines 71
e. If the item asks the student to estimate, and a line or point being described falls between two marked x- or y-axis values do not estimate or approximate numbers. Instead use more general language such as “just above,” “just below,” and “midway between.”
f. If a scatter plot has many data points, then focus on the change of concentration. When possible, read at least a couple of data points (first and last preferably) to put the plot into context.
g. For some items with scatter plots, the item may not be accessible for blind/low-vision students without a tactile representation.
Example 1: Text and Graphics(item does not ask students to estimate)
Pairs of Shoes0 1 2 3 4 5 6 7 8 9 10
2468
1012141618202224
3234
262830
Ship
ping
Cos
t (do
llars
)
The scatter plot shows Pairs of Shoes on the horizontal axis ranging from zero to ten in increments of one and Shipping Cost, in dollars, on the vertical axis ranging from zero to thirty four in increments of two. The scatter plot has points at one pair, five dollars; two pairs, eight dollars; three pairs, eleven dollars; four pairs, fourteen dollars; five pairs, seventeen dollars; and six pairs, twenty dollars.

Guidelines for Accessible Assessments Project (GAAP) 72
Example 2: Text and Graphics
RAINFALL AND PLANT GROWTH
1000 2000 3000 4000
500
1000
2000
1500
0
2500
3000
Plan
t Tis
sue
Prod
ucti
on (g
/m2 p
er y
ear)
Average Rainfall (mm/year)
The graph is a scatter plot, titled Rainfall and Plant Growth. The horizontal label is Average Rainfall in millimeters per year and ranges from zero to four thousand, in increments of one thousand. The vertical label is Plant Tissue Production in grams per meter squared per year, ranging from zero to three thousand, in increments of five hundred. The graph has approximately eighty five points scattered in a pattern beginning in the lower left corner where Plant Tissue Production and Average Rainfall are the lowest. The pattern extends toward the upper right corner where Plant Tissue Production and Average Rainfall are the highest. The majority of points are concentrated in the lower left corner with less concentration as the pattern extends toward the upper right corner.

Mathematics Audio Guidelines 73
Coordinate Grids
Audio GuidelineText Only
a. Start by reading the title of the coordinate grid. Allow for all words and numbers on the coordinate grid to be available to be read on demand.
Text and Graphicsa. Read the title of the coordinate grid first.b. Read the range and increments of each axes. c. Read the points or words on the grid in a logical manner (clockwise, following the
listing of a shape, and so on) referencing their location on the grid. d. If the item does not ask the student to estimate, and a line or point being described
falls between two marked x- or y-axis values, then estimate or approximate the numbers. State that the data is approximate.
e. If the item asks the student to estimate, and a line or point being described falls between two marked x- or y-axis values do not estimate or approximate numbers. Instead use more general language such as “just above,” “just below,” and “midway between.”
f. If reading the location of the points violates the construct being measured, do not read the points, but describe the points in relation to their origin. If this cannot be done with out violating the construct being measured, the grid will have to be in a tactile format to make the item accessible to blind and low-vision students.
g. If there is a shape on the grid, then read the type of shape or name of it first, and then reference the axis points of all sides, if relevant. If referencing the axis points violates the construct being measured, then provide a description of the shape’s points in relation to their origin.
h. If an empty grid is presented in an item as part of the prompt, question, or answer, then read the title and the x- and y-axis scale.

Guidelines for Accessible Assessments Project (GAAP) 74
Example 1: Text and Graphics
Points Q, R, and W are plotted on the coordinate grid.
1
1
-1-1 2
2
-2
-2
3
3
-3
-3
4
4
-4
-4
5
5
-5
-5
6
6
-6
-6
Q
RW
Where should point Z be plotted so that parallelogram QRWZ is formed?
A. (-2, -6)
B. (-1, -3)
C. (3, -2)
D. (2, -1)
A coordinate grid with x and y axes ranging from negative six to six; there are three labeled points at the following locations: point Q, negative five, negative four; point R, negative three, two; and point W, one, three.

Mathematics Audio Guidelines 75
Example 2: Text and Graphics
Mr. Yang is driving to the school located at (2, 0) on the coordinate grid.
1
1
2
2
3
3
4
4
Lincoln
CedarCrest
5
5
6
6
Prarie View
Jackson
0
y
x
Which school is located at (2, 0)?
A. Cedar Crest
B. Jackson
C. Lincoln
D. Prarie View
A coordinate grid with x and y axes ranging from zero to six. The grid shows the location of the four schools. From the origin, Jackson is located five units to the right and four units up. Prairie View is located five units to the right and two units up. Cedar Crest is located two units to the right and zero units up. Lincoln is located zero units to the right and 2 units up.

Guidelines for Accessible Assessments Project (GAAP) 76
Example 3: Text and Graphics
Use the diagram below to answer question 7.
1 2 3
B
D
4
A
5
C
6
y
x-1
-1-2-3-4-5-6
1
2
-2
3
-3
4
-4
5
-5
6
-6
Which ordered pair identifies the location of vertex C?A. (-3, -2) * B. (-3, 3) vertex AC. (3, -2) vertex DD. (-2, -3) vertex C reversed
A coordinate grid with x and y axes ranging from negative six to six. Rectangle ABCD is shown on the grid. From the origin, Point B is three units to the right and three units up. Point D is located three units to the right and two units down. Point C is three units to the left and two units down. Point A is three units to the left and three units up.

Mathematics Audio Guidelines 77
Example 4: Text and Graphics
Two ordered pairs are shown on a coordinate grid.
Drag each ordered pair to its correct location on the coordinate grid. • (-a, -b)• (a, -b)• (-c, -d
(c, d)(a, b)
y
x
(a, -b)(-a, b) (-c, -d)
The coordinate grid shows two ordered pairs. From the origin, ordered pair a, comma, b, is located two units to the right and three units up. From the origin, ordered pair c, comma, d, is located four units to the left and two units up.

Guidelines for Accessible Assessments Project (GAAP) 78
Exponential/Linear Function Graphs
Audio GuidelineText Only
a. Start by reading the title of the graph. Allow for all words and numbers on the graph to be available to be read on demand.
Text and Graphicsa. Read the title of the graph first.b. Read the range and increments of each axis and any words or symbols that are on the
graph.c. Describe the shape of the graph. Use relevant points including starting and ending
points or x or y intersection points to aid the description.d. If the item does not ask the student to estimate, and a line or point being described
falls between two marked x- or y-axis values, then estimate or approximate the numbers. State that the data is approximate.
e. If the item asks the student to estimate, and a line or point being described falls between two marked x- or y-axis values do not estimate or approximate numbers. Instead use more general language such as “just above,” “just below,” and “midway between.”
f. If reading the location of any points violates the construct being measured, then do not read these points. If describing the shape or direction of the graph violates the construct, then do not read the details of the shape of the graph. In this case, the graph will have to be in a tactile format to make the item accessible to blind and low-vision students.

Mathematics Audio Guidelines 79
Example 1: Text and Graphics
The graph of the function f(x) is shown below.
1 2 3 4 5 6
y
x0-1
-2 -1-3
12
-2
3
-3
4
-4
y=f(x)
Which of the following is NOT a zero of f(x)?
A. -4
B. -3
C. 2
D. 6
A graph showing the function y equals f of x. The x axis ranges from negative three to six, and the y axis ranges from negative four to four. The graph is in the shape of a wave. The graph starts at negative three, zero, goes through zero, negative four, then two, zero, then four, three, then six, zero, and ends with an arrow signaling up.

Guidelines for Accessible Assessments Project (GAAP) 80
Example 2: Text and Graphics
Look at this graph of y=x^2.
2 4 6
y
x0-2-4-6
2
-2
4
-4
y=100
-6
6
If y=x-2 is graphed on the same coordinate plane, at how many points would the two graphs intersect?
A. 0
B. 1
C. 2
D. 3
A graph showing the equation y equals x squared. The x and y axes range from negative six to six. The bottom of the U shaped graph is at zero, zero with sides that go through two, four, and negative two, four.

Mathematics Audio Guidelines 81
DIAGRAMS/FIGURES/KEYSTree Diagram
Audio GuidelineText Only
a. Read the tree diagram title. Allow for all words and numbers on the tree diagram to be available to be read on demand.
Text and Graphicsa. Read the tree diagram title and brief description along with stating the direction of the
tree diagram. b. Start with the innermost parts of the tree and describe the different limbs in an order
that is easy to follow.c. Describe all of the elements of the tree diagram with standardized language.
Example 1: Text and Graphics
The tree diagram below shows all of the outfits Jay can choose to wear today. An outfit has one color of shirt, one color of pants, and one color of shoes.
Black Shoes
White Shoes
Black Shoes
White Shoes
Black Shoes
White Shoes
Black Shoes
White Shoes
Black Shoes
White Shoes
Black Shoes
White Shoes
Blue Pants
Black PantsTan Pants
Whi
te S
hirt
Red Shirt
Blue Pants
Black PantsTan Pants
What is the total number of possible outfits with a white shirt?A. 9
B. 6
C. 3
D. 1

Guidelines for Accessible Assessments Project (GAAP) 82
A Tree Diagram showing outfit combinations of shirts, pants, and shoes. The diagram displays information from left to right starting with shirts on the leftward branches. On the top half of the tree, white shirt branches to blue pants, black pants, and tan pants. Each of these pants branches stem to the outermost branches of white shoes and black shoes. On the bottom half of the tree, red shirt branches to blue pants, black pants, and tan pants. Each of these pants branches stem to the outermost branches of white shoes and black shoes.
Keys
Audio GuidelineText Only
a. Read the word Key after reading the graph/diagram title. Allow for all words and numbers in the key to be available to be read on demand.
Text and Graphicsa. Read the graph/diagram title and then the Key.b. Describe the key in detail, including shapes, shades, and so on. Use “represents” to
associate icon with text. (Example: ‘--- 10 miles’. “Dashed line represents ten miles.”)c. Read the graph/diagram using the key symbols (for example, May, white bar, two; May,
gray bar, a little less than one.)
Example 1: Text and Graphics
May
12345678
Jun Jul Aug Sep
Museum Visitors
= Art Museum Visitors
Key
= Science Museum VisitorsNum
er o
f Vis
itors
(tho
usan
ds)
The bar graph title is Museum Visitors. In the Key, the white bar represents Art Museum Visitors, the gray bar represents Science Museum Visitors. The horizontal axis shows five months; the vertical axis is labeled Number of Visitors, *in* thousands, May white bar, two; gray bar, one; June, four and seven and three tenths; July, seven and two tenths and six; August, five and two tenths and six, September, four and nine tenths and seven and two tenths.

Mathematics Audio Guidelines 83
Line Plots
Audio GuidelineText Only
a. Read the line plot title. Allow for all words and numbers on the line plot and on the key to be available to be read on demand.
Text and Graphicsa. Read the title of the line plot, the key, and then the x-axis title (refer to this as the
number line plot title if the term “axes” has not been taught in the grade being assessed).
b. Use the key symbol to describe the line plot instead of interpreting the symbol.c. If there are no x’s or symbols above a number, then read this as zero instead of
skipping it. d. Be careful not to violate the construct being measured. Read the range of numbers
on the x-axis without reading the data, if necessary. In this case, the item may not be accessible for blind/low-vision students without a tactile representation.
Example 1: Text and Graphics
1 2 3 4 5 6 7
Books We Read in May
Key
Number of Books
Represents 1 Student
The title of the line plot is Books We Read in May. The key shows that an x represents one student. The number line title is Number of Books and ranges from one to seven in increments of one; at line plot one, zero x’s are shown; at two, one x; at three, two x’s; at four, one x; at five, two x’s; at six, five x’s; and at seven, four x’s.

Guidelines for Accessible Assessments Project (GAAP) 84
Shaded Figures (Grids, Bars, and Shapes)
Audio GuidelineText Only
a. Read the title of the shaded figure. Allow for all words and numbers in the figure to be available to be read on demand.
Text and Graphicsa. Read the title if there is one, and then describe the dimensions of the figure first. If
possible, read the dimensions of the figure (Example: "ten by ten") instead of just the number of boxes.
b. Explain how many boxes are shaded, but do not use the terminology “x of y” boxes are shaded. This creates the fraction for the student and will often violate the construct being measured.
c. Do not state the total number of boxes shaded when information can be provided that students should use to determine the number of boxes shaded (for example, seven columns of ten boxes shaded, instead of seventy boxes).

Mathematics Audio Guidelines 85
Example 1: Text and Graphics
A fraction of the fish shown below are shaded gray.
Which grid is shaded to represent a fraction with the same value?
A.
B.
C.
D.

Guidelines for Accessible Assessments Project (GAAP) 86
A fraction of the fish shown below are shaded gray. The graphic shows four fish. Three of them are shaded gray. Which grid below is shaded gray to represent a fraction with the same value? Answer A, A ten by ten box grid, with seven and a half boxes shaded. Answer B, A ten by ten box grid, with three columns of ten boxes shaded. Answer C, A ten by ten box grid, with eight columns of ten boxes shaded and five additional boxes shaded. Answer D, A ten by ten box grid, with seven columns of ten boxes shaded and five additional boxes shaded.
Pictographs
Audio GuidelineText Only
a. Read the title of the pictograph. Allow for all words and numbers in the pictograph or key to be available to be read on demand.
Text and Graphicsa. State that it is a pictograph and read the title. b. Describe the columns and pictures. c. Read the key.d. Reference the picture being used in general terms without describing it in detail. Use
the key to read the pictograph without interpreting it. When reading the pictograph, reference “picture of x,” since the scale may not be one to one.
e. In some cases, an item with a pictograph may not be accessible for blind/low-vision students without a tactile representation.

Mathematics Audio Guidelines 87
Example 1: Text and Graphics
Look at this pictograph.
37NECAP_2007_Grade3_Math_Released
NECAP 2007 RELEASED ITEMSGRADE 3 MATH
DSP 2.1 Interprets a given representation (pictographs with one-to-one correspondence, line plots, tally charts, or tables) to answer questions related to the data, or to analyze the data to formulate conclusions. (IMPORTANT: Analyzes data consistent with concepts and skills in M(DSP)–2–2.)
ID:256021 MI617_dogpark.eps Common
Look at this pictograph.
Keyrepresents 1 dog
Type of Dog Number of Dogs
Beagle
Collie
Poodle
Dalmatian
Dogs at the Park
a. Write a word problem that can be answered using the information in this pictograph.
b. Answer the word problem you wrote.
A. Write a word problem that can be answered using the information in this pictograph.
B. Answer the word problem you wrote.
A pictograph titled Dogs at the Park. The pictograph is a table with two columns listing the type of dog and the number of dogs. In the number of dogs column, there are pictures of dogs. The Key shows a picture of a dog represents one dog. The table reads Beagle, picture of two dogs; Collie, picture of three dogs; Poodle, picture of one dog; Dalmatian, picture of four dogs.

Guidelines for Accessible Assessments Project (GAAP) 88
Example 2: Text and Graphics
Mark Sue Liz Tom
WEIGHT OF PUMPKINS
Key
= 2 pounds
A pictograph titled Weight of Pumpkins. The picture graph is a table that has four columns listing student’s names and, a number of pumpkin pictures. A key indicates that each pumpkin picture equals two pounds. The graph reads: Mark, four and a half pumpkin pictures. Sue, six pumpkin pictures. Liz, four pumpkin pictures. Tom, zero pumpkin pictures.

Mathematics Audio Guidelines 89
Figures/Illustrations
Audio GuidelineText Only
a. Read the title of the figure/illustration or any caption that is being used in title format. Allow for all words and numbers in the pictograph or key to be available to be read on demand.
Text and Graphicsb. Read the title of the figure or illustration. Include the caption in the description if it is
not included in the surrounding text.c. Read any scale before describing parts of the figure.d. Separate the information into pieces using sentences, bullet points, or lists.e. Use similar language to describe all parts of the diagram or illustration. Standardized
language will help ensure comprehension. f. Remember that the goal is to help the student understand the pertinent information
in the diagram. Try to include descriptions of all shapes and figures, but try not to overload the student with descriptions that are overly wordy or not needed to answer the question.
g. In some cases, an item with a figure or illustration may not be accessible for blind/low-vision students without a tactile representation.

Guidelines for Accessible Assessments Project (GAAP) 90
Example 1: Text and Graphics
Use the scale to find the actual dimensions, in feet, of the house.
Courtyard
2 1–2”
1–2”
1 1–4”
3 3–4” 3–4”House
3”
2 1–4”
Barn
Scale: 1 inch = 20 feet
Show or explain how you found your answer.
A drawing showing a rectangular plot of land is illustrated. The plot includes three shaded areas, a house, a courtyard, and a barn. The Scale shows that one inch equals twenty feet. The left and right sides of the plot are three and three fourths inches, and the top and bottom sides of the plot are two and a half inches. The rectangular house has side lengths of one and one fourth inches and three fourths of an inch. The Barn is a square, mostly outside the plot, with a shaded right triangle inside the plot. The hypotenuse of the right triangle and the side of the square inside the plot are the same line segment. One corner of the triangle is at the two and one fourth inch line at the bottom of the plot and another corner is at the three inch line on the side of the plot. The courtyard is a semi circle with a radius of one-half inch.

Mathematics Audio Guidelines 91
Example 2: Text and Graphics
Triangle PQR in the diagram below represents Pam’s trip across a river.
River
100 feet
60 feet
Q
R
P
In the diagram, PQ represents her planned trip across the river, and ¯PR represents her actual trip across the river.Based on the dimensions in the diagram, which of the following is closest to the length of PR ?
A. 104 feet
B. 117 feet
C. 120 feet
D. 160 feet
A diagram showing a rectangular section of a River is illustrated. Triangle PQR shows Pam’s trip across the river with all three points of the triangle touching a side of the river. Point P is on the left side of the river, and point Q and R are on the right side of the river. Point Q is the vertex of a right angle. The distance from P to Q is one hundred feet. The distance from Q to R is sixty feet.
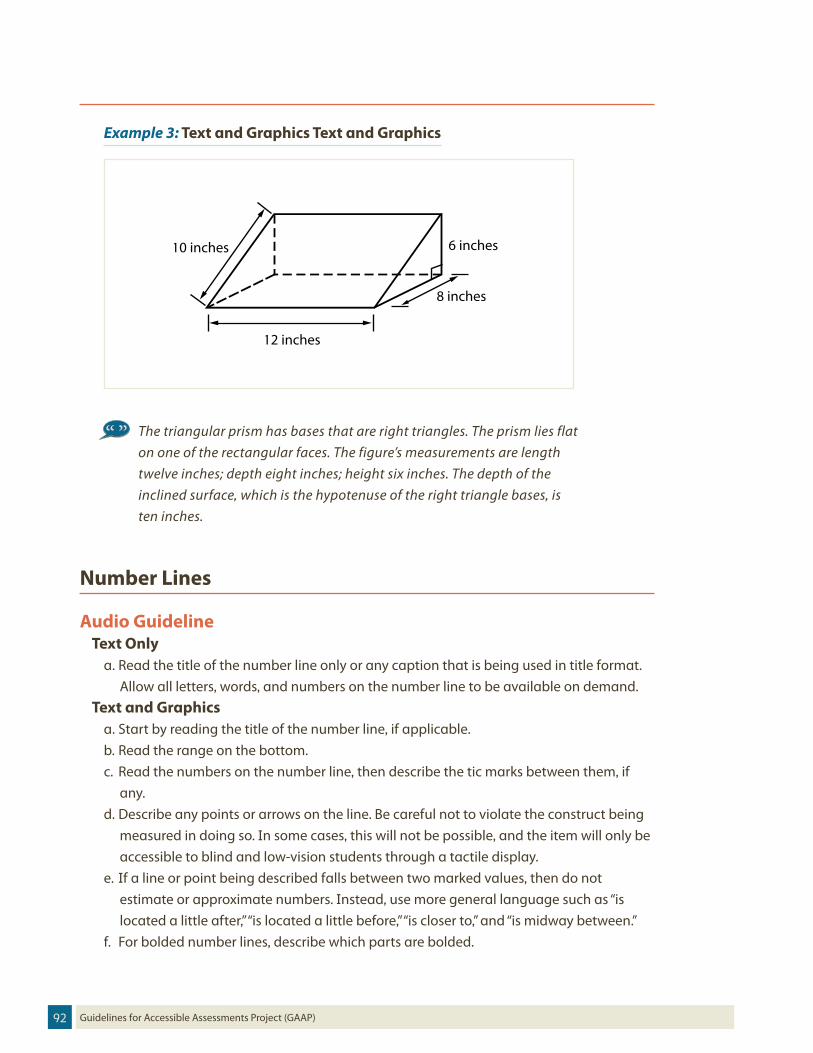
Guidelines for Accessible Assessments Project (GAAP) 92
Example 3: Text and Graphics Text and Graphics
12 inches
8 inches
6 inches10 inches
The triangular prism has bases that are right triangles. The prism lies flat on one of the rectangular faces. The figure’s measurements are length twelve inches; depth eight inches; height six inches. The depth of the inclined surface, which is the hypotenuse of the right triangle bases, is ten inches.
Number Lines
Audio GuidelineText Only
a. Read the title of the number line only or any caption that is being used in title format. Allow all letters, words, and numbers on the number line to be available on demand.
Text and Graphicsa. Start by reading the title of the number line, if applicable.b. Read the range on the bottom.c. Read the numbers on the number line, then describe the tic marks between them, if
any.d. Describe any points or arrows on the line. Be careful not to violate the construct being
measured in doing so. In some cases, this will not be possible, and the item will only be accessible to blind and low-vision students through a tactile display.
e. If a line or point being described falls between two marked values, then do not estimate or approximate numbers. Instead, use more general language such as “is located a little after,” “is located a little before,” “is closer to,” and “is midway between.”
f. For bolded number lines, describe which parts are bolded.

Mathematics Audio Guidelines 93
Example 1: Text and Graphics
Which point on the number line below best represents 0.8?
0 1
A B C D
A. point A
B. point B
C. point C
D. point D
A number line shows zero on the left and one on the right with three equally spaced tic marks in between. The points A, B, C, and D are shown. Point A is located between zero and the first tic mark, and is closer to zero; point B is located between the second and third tic marks, and is much closer to the second tic mark; while points C and D are located between the third tic mark and the value one; point C is closer to the third tic mark, and point D is closer to the value one.
Example 2: Text and Graphics
Look at this number line.
0 1–4 3–41–2 1
A
Point A is halfway between 1/2 and 3/4. What fraction does point A represent? Show your work or explain how you know.
A number line shows zero on the left and one on the right with one fourth, one half, and three fourths in between. Point A is marked midway between one half and three fourths.

Guidelines for Accessible Assessments Project (GAAP) 94
Example 3: Text and Graphics
The graph below is the solution of which of the following inequalities?
-20 20-15 15-10 10-5 50
E. |x|>10
F. |x|<10
G. x>10
H. x<-10
A number line shows negative twenty on the left and twenty on the right with negative fifteen, negative ten, negative five, zero, five, ten, and fifteen in between. There is an open circle at negative ten with a solid arrow pointing towards negative twenty and an open circle at ten with a solid arrow pointing towards twenty.

Mathematics Audio Guidelines 95
Example 4: Text and Graphics
Which number line shows the correct locations of all the given values?
, -4, -2 , 1
A.
B.
C.
D.
12
34
14
Which number line shows the correct locations of all the given values? The given values are, one half, negative 4, negative 2 and three fourths, and one and one fourth.
Answer A, A number line shows negative four on the left and positive two on the right. There are three equally spaced tic marks between each pair of numbers. There is a point at negative four, a point at the third tic mark to the left of negative two, a point at the second tic mark to the right of zero, and a point at the third tic mark to the left of two.
Answer B, A number line shows negative four on the left and positive two on the right. There are three equally spaced tic marks between each pair of numbers. There is a point at negative four, a point at the first tic mark to the left of negative two, a point at the second tic mark to the right of

Guidelines for Accessible Assessments Project (GAAP) 96
zero, and a point at the third tic mark to the left of two.
Answer C, A number line shows negative four on the left and positive two on the right. There are three equally spaced tic marks between each pair of numbers. There is a point at negative four, a point at the third tic mark to the right of negative two, a point at the second tic mark to the right of zero, and a point at the first tic mark to the right of two.
Answer D, A number line shows negative four on the left and positive two on the right. There are three equally spaced tic marks between each pair of numbers. There is a point at negative four, a point at the second tic mark to the left of zero, a point at the second tic mark to the right of zero, and a point at the third tic mark to the right of two.
Spinners
Audio GuidelineText Only
a. Read the title of the spinner only. Allow for all letters, words, and numbers on the spinner to be available on demand.
Text and Graphicsa. Read the title of the spinner and reference it as a spinner.b. Read any words, symbols, or numbers in the spinner, starting at the top and moving
clockwise.c. If necessary, describe the sizes of each section. Be sure not to violate the construct
being measured in doing so. In some cases, this will be not be possible and the item will only be accessible to blind and low-vision students through a tactile display.
d. When describing the size of sections, do not estimate or approximate specific size if it is not labeled. Instead, use more general language such as “less than,” “ more than,” and “half of.” Exceptions are for one-quarter, one-third, one-half, two-thirds, and three-quarters that are immediately apparent.
e. When there is more than one spinner, note the number of spinners, then describe each one. Each spinner’s description should be available individually on demand.

Mathematics Audio Guidelines 97
Example 1: Text and Graphics
Look at this spinner.
4
2
21
11
3
3
On what number is the arrow least likely to land?
A. 1
B. 2
C. 3
D. 4
A spinner divided into eight sections of the same size. There is a number in each section. From the top moving clockwise the sections read three, four, two, one, three, one, two, and one.

Guidelines for Accessible Assessments Project (GAAP) 98
Example 2: Text and Graphics
Look at these spinners.
yellow
Spinner A Spinner B Spinner C
red blue
yellow
red
blue
yellow
red blue
Julie, Greg, and Lori each used a different spinner to record the results of 40 spins.
a. This table shows Julie’s results. Julie's Spinner Results
Color Frequency
yellow 12
blue 14
red 14
Which spinner did Julie most likely use? Show your work or explain how you know.
b. This table shows Greg’s results.Greg's Spinner Results
Color Frequency
yellow 30
blue 5
red 5
Which spinner did Greg most likely use? Show your work or explain how you know.
c. Lori used the remaining spinner. Make a table to show the most likely results of Lori’s 40 spins. Explain your reasoning.

Mathematics Audio Guidelines 99
There are three spinners shown labeled Spinner A, Spinner B, and Spinner C. Each spinner is divided into three sections.
In Spinner A, one half of the spinner is labeled yellow, one fourth of the spinner is labeled blue, and one fourth of the spinner is labeled red. In Spinner B, three fourths of the spinner is labeled yellow, and the other fourth is divided evenly and labeled blue and red.
In Spinner C, about one third of the spinner is labeled yellow, about one third of the spinner is labeled red, and about one third of the spinner is labeled blue.
Coins and Dollars
Audio GuidelineText Only
a. Read title if applicable.Text and Graphics
a. Describe the money using standard language (penny, dime, quarter, or dollar). b. Be sure to read out each currency symbol as a symbol and not to interpret their value
(for example, 2 quarters instead of fifty cents, or 3 dimes instead of thirty cents).c. If reading the currency symbols violates the construct being measured, seek an
alternative for blind and low-vision students.

Guidelines for Accessible Assessments Project (GAAP) 100
Example 1: Text and Graphics
Cindy had $1.00. Then she bought a pencil for $0.37. How much money does she have now?
A.
B.
C.
D.
Answer A shows two quarters, one dime, and three pennies.
Answer B shows two quarters, two dimes, and three pennies.
Answer C shows three quarters, and two pennies.
Answer D shows one dollar bill, one quarter, one dime, and two pennies.

Mathematics Audio Guidelines 101
Numbered/Step Diagrams
Audio GuidelineText Only
a. Read the title of the diagram only. Allow for all letters, words and numbers on the diagram to be available to be read on demand.
Text and Graphicsa. Read the title of the diagram and a brief orientation of what the diagram shows. b. In logical order (left to right or top to bottom), read out the steps or diagram numbers
along with a description of the figures in each step.c. Describe the figures with enough detail to understand the item. Unless necessary, do
not detail the specific characteristics of the figures being used (for example, color, size, location shape, and so on).
d. If the description violates the construct being measured (for example, if the above question asked “How many circles are in step 1?”), then adjust the description to be vague. In this case, blind and low-vision students may need a tactile representation to access the item.
Example 1: Text and Graphics
Don made a pattern using circles and squares. The first four steps of his pattern are shown below.
Step 1 Step 2 Step 3 Step 4
If Don continues his pattern, what is the total number of circles he will need to make Step 10?
A. 30
B. 31
C. 38
D. 40
A diagram shows four steps of a pattern using circles and squares. Step one shows a square and four circles, step two shows two squares and seven circles, step three shows three squares and ten circles, and step four shows four squares and thirteen circles.

Guidelines for Accessible Assessments Project (GAAP) 102
Geometric Figures
Audio GuidelineText Only
a. Read the title of the shape(s) only. Allow for all labels of sides or angles to be available on demand.
Text and Graphicsa. Simple Shapes (any 2D shape with eight sides or less): Reference simple shapes as is,
unless the item is measuring identification of a shape. If the item contains a simple shape, reference it without description. If there are unique attributes to the shape, describe what type of shape it is in as few words as possible. Be sure to reference labels of sides, angles, and so on.
b. Three Dimensional Shapes/Figures: Reference the type of figure. If relevant and does not violate the construct being measured, describe the figure including the number of sides. In some cases, if a certain description would violate the construct, blind and low-vision students may need a tactile representation to access the item.
c. Be sure to reference labels of sides, angles, and so on.d. Refer to the coordinate grid section above for reading shapes on coordinate grids.
Example 1: Text and Graphics
These shapes are the 5 faces of a three-dimensional figure.
What is the three-dimensional figure?
A. cube
B. cone
C. prism
D. pyramid
A square and four equally-sized triangles are shown.

Mathematics Audio Guidelines 103
Example 2: Text and Graphics
Look at this diagram.
35°
1
What is the measure of 1?
A. 55°
B. 115°
C. 125°
D. 135°
A diagram shows a right triangle. The triangle shows a right angle in the left corner, a thirty five degree angle at the top, with no angle referenced in the bottom right corner. Outside the bottom right corner of the triangle there is a symbol for angle one, which arcs from the unknown angle in the triangle to touch the ray.

Guidelines for Accessible Assessments Project (GAAP) 104
Example 3: Text and Graphics
Look at these figures.
Figure P Figure Q
Figure R Figure S
Which two figures have the same number of faces?A. Figure P and Figure QB. Figure S and Figure RC. Figure P and Figure RD. Figure S and Figure Q
Four figures are shown. Figure P is a pentagonal five sided pyramid, Figure Q is a rectangular prism, Figure R is a triangular prism, and Figure S is a triangular pyramid.
Example 4: Text and Graphics
Brady started to fill the box shown with some unit cubes.
7
GEOMETRIC FIGURE – NEW EXAMPLE 1
Guidelines: Read the instructions and given information. Describe the figure. Description: The box contains some unit cubes, but is not full. The box is five unit cubes across, seven unit cubes deep, and six unit cubes tall. GAAP guidelines: Section 6k.
Enter the total number of unit cubes needed to completely fill the box. Include the unit cubes already shown in your total.

Mathematics Audio Guidelines 105
Brady started to fill the box shown with some unit cubes. The box contains some unit cubes, but is not full. The box is five unit cubes across, seven unit cubes deep, and six unit cubes tall. Enter the total number of unit cubes needed to completely fill the box. Include the unit cubes already shown in your total.
Example 5: Text and Graphics
The base of triangle ABC and the base of triangle DEF lie on line m, as shown in the diagram.
The measure of 4 is less than the measure of 8.For each comparison, select the symbol (<, >, =) that makes the relationship between the first quantity and the second quantity true.
The base of triangle ABC and the base of triangle DEF lie on line m, as shown in the diagram. The diagram shows Triangle ABC has base AC on line m. Triangle DEF has base DF on line m. Triangle ABC has angles 1, 2, and 3. Triangle DEF has angles 5, 6, and 7. On line m, exterior angle 4 makes a linear pair with angle 3 and exterior angle 8 makes a linear pair with angle 7. The diagram is not drawn to scale. The measure of angle 4 is less than the measure of angle 8. For each comparison, select the symbol, less than, greater than, or equal to, that makes the relationship between the first quantity and the second quantity true. There are two comparisons that show a relationship between quantities. Comparison 1, The measure of angle 3, less than, equal, or greater than, the measure of angle seven. Comparison 2, the measure of angle 7 plus the measure of angle 2, less than, equal, or greater than, the measure of angle 5 plus the measure of angle 6.

Guidelines for Accessible Assessments Project (GAAP) 106
Sectors
Audio GuidelineText Only
a. Allow for all labels of sides or angles to be available on demand.Text and Graphics
a. If the text of the item does not already do so, identify the diagram as a sector.b. Read the radius and arc.
Example 1: Text and Graphics
A sector of a circle is shown.
5 cm
6.28 cm
What is the area of the sector?A. 12.5 cm2
B. 15.7 cm2
C. 31.4 cm2
D. 78.5 cm2
A sector of a circle is shown. The sector has a radius of five centimeters and arc length six point two eight centimeters. What is the area of the sector? Use three point one four for pi.

Mathematics Audio Guidelines 107
Clock Faces
Audio GuidelineText Only
a. Allow for all numbers and labels of clocks to be available on demand.Text and Graphics
a. If the clock is labeled, read the label. If there is more than one clock, state how many clocks there are and read the labels.
b. If the clock face shows the hands pointing directly to an hour, or half way between two hours, describe the shorthand first.
c. If the clock face does not show a short hand pointing directly to the hour or half hour, describe the long hand first, then the short hand, telling how many tic marks away each hand is from the closest number.
Example 1: Text and Graphics
A circus started and ended at the times shown on these clocks.
12
6
9 3
12
457
8
1011
Start Time
12
6
9 3
12
457
8
1011
End Time
How many minutes did the circus last?A. 150 minutes
B. 130 minutes
A. 90 minutes
A. 30 minutes
A circus started and ended at the times shown on these clocks. Two clocks. The clock labeled Start Time shows the short hand pointing to seven and the long hand pointing to twelve. The clock labeled End Time shows the short hand pointing half way between eight and nine and the long hand pointing to six. How many minutes did the circus last? Answer A, one hundred fifty minutes …

Guidelines for Accessible Assessments Project (GAAP) 108
Example 2: Text and Graphics
Mai Ka starts reading a book at the time shown on the clock. .
12
6
9 3
12
457
8
1011
She stops reading one hour and twelve minutes later. What time does Mai Ka stop reading?
A. 4:08
B. 4:44
C. 5:04
D. 5:08
Mai Ka starts reading a book at the time shown on the clock. Clock with the long hand pointing to one tic mark after eleven, and the short hand pointing to a location slightly before four. She stops reading one hour and twelve minutes later. What time does Mai Ka stop reading? Answer A, Four oh eight. Answer B, Four forty four. Answer C, Five oh four. Answer D, Five oh eight.

Mathematics Audio Guidelines 109
Math Editors and Protractors
Audio GuidelineText Only
a. Allow for all numbers, text, and symbols to be available on demand.Text and Graphics
a. The student's assistive technology device, such as a screen reader, should be used to make the protractor and/or math editor accessible to the student.
Example 1:
• Drag the protractor to measure the angle.
• Then drag the numbers into the box to enter the measure of the angle, in degrees.
0 51 62 73 84 9
°

Guidelines for Accessible Assessments Project (GAAP) 110
Videos
Audio GuidelineText Only
a. If the video includes text that is not read aloud as part of the audio track, that text should be read.
Text and Graphicsa. Some items with videos embedded will be difficult for blind and visually impaired
students to answer, based on the soundtrack alone. Audio description track should be added.
b. If an item includes a time stamp, that time stamp should be included as part of the description.
c. Consult with the content specialist to decide if the use of technical math terms to describe the video is appropriate based on the grade level and standards. In some cases, a description cannot be provided without violating the construct. In these cases, replace the items containing videos with alternative items that do not have visual bias, as visual nets are too complex and cumbersome to describe.
* Refer to page 46 of the GAAP English Language Arts Audio Guidelines for video guideline example.

Mathematics Audio Guidelines 111
Visual Nets
Audio GuidelineText Only
a. Read the item text. Any labels in the graphic should read when clicked. Text and Graphics
a. Consult with the content specialist to decide if the use of technical math terms to describe the shapes is appropriate based on the grade level and standards. If the use of the technical math terms is not appropriate, replace items containing visual nets with alternative items that do not have visual bias, as visual nets are too complex and cumbersome to describe.
Example 1: Text and Graphics(For students who should have learned names of three-dimensional shapes.)
A net of a three-dimensional object is shown below.
When the net is folded, which object will it create?
A. B. C. D.
The net consists of a four pointed star shape with a square in the center. Each side of the square is also the base of an isosceles triangle that points away from the square. Answer A, a square pyramid Answer B, a triangular prism Answer C, a triangular pyramid Answer D, a square prism

Guidelines for Accessible Assessments Project (GAAP) 112
REFERENCESACT Algorithms Explained:
Chang, Lawrence. (1983). Handbook for Spoken Mathematics: Larry’s Speakeasy.
Connecticut: MAS Math
ETS Guidelines for a Test Reader
Georgia: Administering the CRCT and CRCT-M to Students with a read aloud accommodation
Interactives: Geometry 3D Shapes
MathSpeak Core Specification Grammar Rules
North Carolina: Accommodations Presentation_EC Conference_11.1.10.
Oregon: Oregon Math Read-Aloud Accommodation Guidelines and Examples
Oregon: Business Rules for Tagging Items for Text-to-Speech and Text-to-Braille (Word Document)
Rensselaer Polytechnic Institute (RPI). American Pronunciation of Mathematics.
Using English for Academic Purposes (UEFAP): Pronunciation of Mathematical Symbols
Virginia: Guidelines for Administering the Read-Aloud for Standards of Learning Assessments
WGBH: Effective Practices for Description of Science Content within Digital Talking Books.
WGBH: Describing Images for Enhanced Assessments.

Mathematics Audio Guidelines 113
APPENDICES The following audio guidelines are for content that is not intended to be measured through Common Core State Standards based tests, but may appear in classroom assessments.
Appendix A: Stem-and-Leaf Plots
Audio GuidelineText Only
a. Read the title of the stem-and-leaf plot. Allow for the key elements to be available to be read on demand.
Text and Graphics b. Start by reading the title of the graph and referencing that it is a stem-and-leaf plot.
Then read the key using the words “stem” and “leaf” in the key description.c. State the starting point and the direction of the content.d. Read each row within the graph from left to right, top to bottom. e. Read each row in the format “stem of x leaves of y, z.”
Example 1: Text and Graphics
This stem and leaf plot shows the temperature at 8 A.M. for 26 days of one month.
0 1 1 3 6 7 7 71 4 4 5 8 72 0 1 2 3 3 83 0 0 2 4 5 6 7 8
Temperature (°F)
Key0 3 represents 3° F
A. What is the mode of this data set?
The stem-and-leaf plot title is Temperature (degrees Fahrenheit). Key showing stem zero leaf three represents three degrees Fahrenheit. The plot shows stem zero, leaf one, one, three, six, seven, seven, seven; stem one, leaf four, four, five, eight, seven; stem two, leaf zero, one, two, three, three, eight; and stem three, leaf zero, zero, two, four, five, six, seven, eight.
Guidelines for Accessible Assessments Project (GAAP) 114
Appendix B: Circle Graphs
Audio GuidelineText Only
a. Read the circle graph title. Allow for all words and numbers on the circle graph or pie chart to be available to be read on demand.
Text and Graphicsb. Read the circle graph title first.c. Move clockwise from the top section reading the section label and the accompanying
number. If there is no number associated with a section, then describe the relative size of the section, if possible, without violating the construct being measured.
d. When describing the size of the section, do not estimate or approximate specific size if it is not labeled. Instead use more general language such as “less than,” “more than,” and “half of.” Exceptions are for one quarter, one third, one half, two thirds, and three quarters that are immediately apparent.
e. It is not necessary to describe the visual attributes of the circle graph/pie chart (for example, colors or bold lines) unless being aware of those attributes provides useful information for accessing an item or the student needs to know (or not know) something conveyed by the attributes.
f. Be sure to not read the values if doing so violates the construct being measured (for instance, Example 1: What percentage of money went to educational initiatives?). In this case, a tactile representation would be needed or else the item would not be suited for low-vision/blind students.

Mathematics Audio Guidelines 115
Example 1: Text and Graphics
30%
$68,660Educational Initiatives
$26,053Registry ParticipationInitiatives
12%
28%
$53,868Personnel
2%Program Supplies& Expenses$3,939
Registry Operation& Enhancements$63,820
28%
Program Expenses
The title of the circle graph is Program Expenses. The chart reads Educational Initiatives, sixty eight thousand six hundred sixty dollars, thirty percent; Registry Operation and Enhancements, sixty three thousand eight hundred twenty dollars, twenty eight percent; Program Supplies and Expenses, three thousand nine hundred thirty nine dollars, two percent; Personnel, fifty three thousand, eight hundred sixty eight dollars, twenty eight percent; and Registry Participation Initiatives, twenty six thousand fifty three dollars, twelve percent.
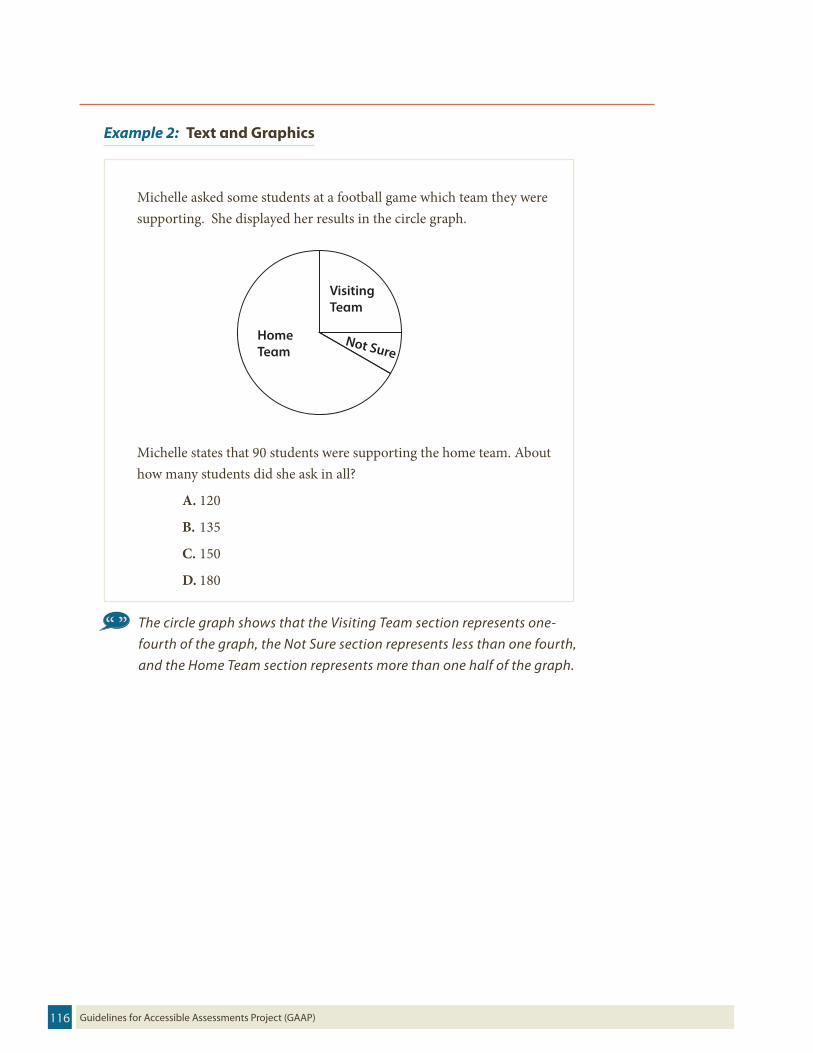
Guidelines for Accessible Assessments Project (GAAP) 116
Example 2: Text and Graphics
Michelle asked some students at a football game which team they were supporting. She displayed her results in the circle graph.
Visiting Team
Home Team
Not Sure
Michelle states that 90 students were supporting the home team. About how many students did she ask in all?
A. 120
B. 135
C. 150
D. 180
The circle graph shows that the Visiting Team section represents one-fourth of the graph, the Not Sure section represents less than one fourth, and the Home Team section represents more than one half of the graph.

Mathematics Audio Guidelines 117
Appendix C: Venn Diagrams
Audio GuidelineText Only
a. Read the Venn diagram title. Allow for all words and numbers on the Venn diagram to be available to be read on demand.
Text and Graphicsa. Start by reading the Venn diagram title.b. Present the different section labels in the Venn diagram and the number of circles. Then
present the data in each section in brief statements. c. Be careful not to violate the construct being measured in the description. (Example:
How many seventh grade students were in the band?)
Example 1: Text and Graphics
The Venn diagram below shows the number of seventh-grade students who are in the choir, in the band, in both the choir and the band, or in neither.
Seventh-Grade Students
NeitherChoir Band14
41 8 32
What is the total number of seventh-grade students who are not in the band?
A. 41
B. 55
C. 63
D. 95
The Venn diagram is titled Seventh-Grade Students. The Venn diagram shows two intersecting circles, one labeled Choir, forty one, and the other labeled Band, thirty two. The area of intersection is labeled eight. The area outside of the circles is labeled Neither, fourteen.

Guidelines for Accessible Assessments Project (GAAP) 118
Appendix D: Matrices
Audio GuidelineText Only
a. Read the title of the matrix if applicable. Have all of the words, symbols, and numbers available to be read on demand.
Text and Graphicsa. For all matrices start by reading the dimensions. b. Read the elements of the matrix from left to right top to bottom. Include references to
column and row location while reading.
Example 1: Text and Graphics
x + a x + b x + c y + a y + b y + c z + a z + b z + c� �
A three by three matrix is shown. From top to bottom: first row (pause), first column, x plus a; second column, x plus b; third column, x plus c (extended pause); second row (pause), first column, y plus a; second column, y plus b; third column, y plus c; (extended pause) third row (pause),first column, z plus a; second column, z plus b; third column, z plus c (pause); end matrix.