Embed Size (px)
Citation preview
1
GUIDELINE: HOW TO MAKE ENERGY VISIBLE THROUGH FEEDBACK
Abstract Energy-related feedback is about making the invisible visible, in other words making users understand how much energy they are using with their daily activities. The aim is often to make energy users take action and use energy in a desired way; either by reducing it or using it at different times of the day. Utilities that want to develop and implement energy feedback to their customers need to consider both benefits and potential challenges. This guideline provides advice and good examples on when and how feedback can be used in smart grid projects.
What is it? Feedback is the centrepiece of many smart grid projects. Making users aware of their energy consumption can support them in changing their energy-related behaviour, while helping utilities shave power peaks and shift consumption. The users themselves might also benefit through saving energy, decreasing environmental impact and reducing energy bills. The problem to be solved by feedback is often that users are not aware of the energy they are using due to its invisibility. Users perform different activities – doing the laundry, turning on the TV or lights, turn up the heat – where energy use is merely a side effect of their daily routines. To be able to change their energy consuming activities in a desirable manner, users need to understand the relation between activities and their energy use. Feedback supplies the user with information about their past or present energy consumption with the aim to change their energy-related behaviour. Usually, some kind of feedback is essential to make users adapt to smarter energy behaviour. To motivate this adaption, energy use is preferably translated into more accessible terms, for instance costs, environmental effects, or number of dishwashing cycles, depending on the target group. Feedback on energy use can be provided to users in many different ways. Some of the most common ways of providing feedback is via graphs, charts or symbols on displays or in energy bills.
When to use? Feedback can be of use whenever energy is used in an unsatisfactory manner – e.g. inefficiently or during power peaks, and where the ‘unwanted’ energy use is related to the behaviour of users. In other words, if there is a value in making the energy use more visible for users, it would be beneficial to introduce feedback as a motivation to users.
2
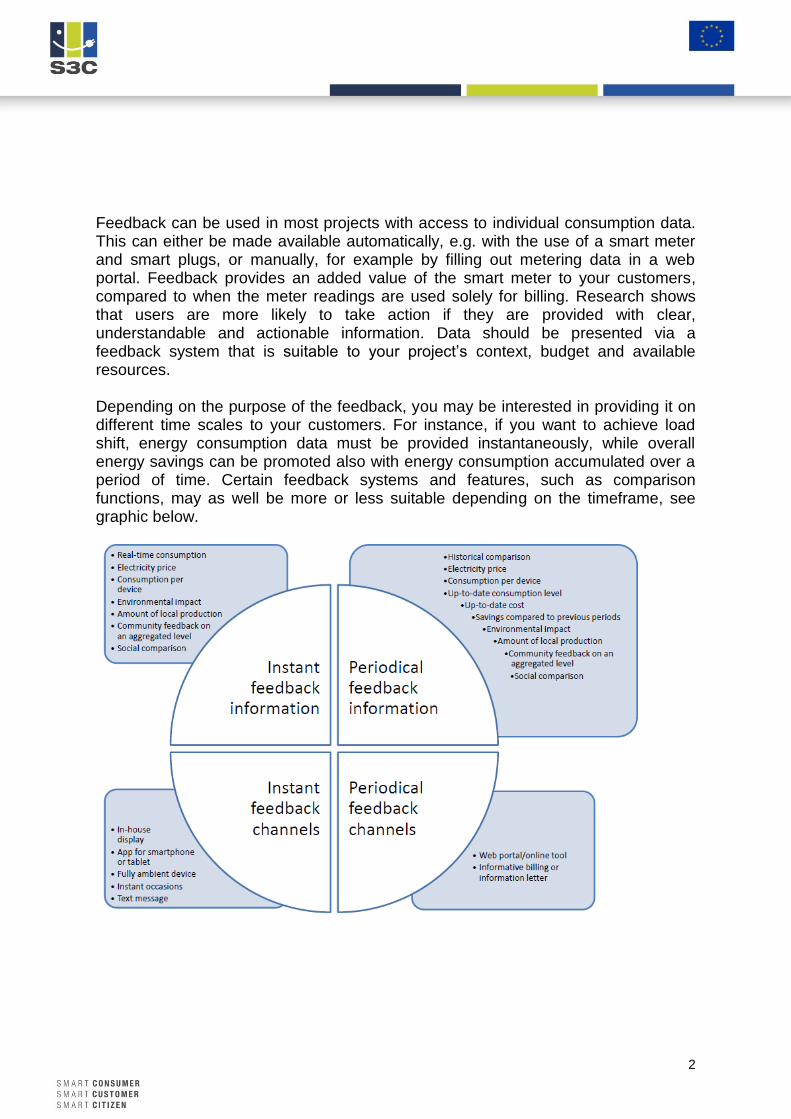
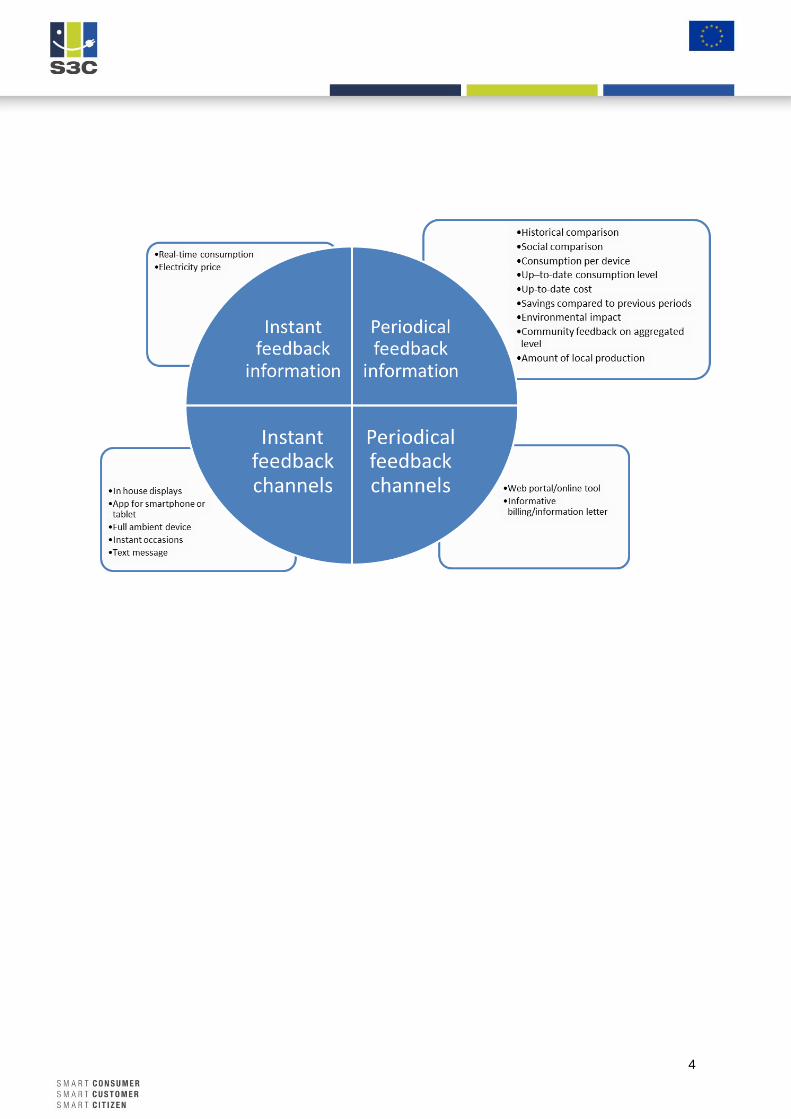
Feedback can be used in most projects with access to individual consumption data. This can either be made available automatically, e.g. with the use of a smart meter and smart plugs, or manually, for example by filling out metering data in a web portal. Feedback provides an added value of the smart meter to your customers, compared to when the meter readings are used solely for billing. Research shows that users are more likely to take action if they are provided with clear, understandable and actionable information. Data should be presented via a feedback system that is suitable to your project’s context, budget and available resources. Depending on the purpose of the feedback, you may be interested in providing it on different time scales to your customers. For instance, if you want to achieve load shift, energy consumption data must be provided instantaneously, while overall energy savings can be promoted also with energy consumption accumulated over a period of time. Certain feedback systems and features, such as comparison functions, may as well be more or less suitable depending on the timeframe, see graphic below.
3
Feedback channels App for smartphone or tablet With smartphone and tablet apps, customers have the possibility to receive feedback information on energy topics with easy access at any time. However, delivering deeper analysis of e.g. consumption data can be hard due to the compressed format.
In-house display (IHD) A display that can provide a variety of feedback information in many different ways, for example charts, symbols and colours. The display is usually located at a central point in a home, where the customer can easily access the information. However, using IHDs for feedback implies additional cost compared to using existing hardware such as smart phones or tablets, especially if the displays are only used for energy feedback.
Fully ambient device
Ambient devices do not provide specific consumption information but rather subtle signals to the customer. Thus, these devices do not enable any deeper analysis, only an easy-to-grasp image of the general level of energy consumption and/or a change in electricity prices. The ambient devices can take different forms and give signals through a large variety of ways. (See OfficeWise example below) Instant occasions
Feedback is sometimes not given through special devices, but rather as instant occasions. This
type of feedback is often negative and “punishes” the customer for example by shutting off
appliances when exceeding a certain pre-set power limit. Instant occasions could preferably be
combined with a positive incentive to encourage certain behaviour.
Push notification and text message
Push notifications and text messages used for feedback purposes contains short information, and
are often sent as alerts meant to notify the customer and provide a “warning”. This can be useful
for making customers aware of out of the ordinary situations, such as electricity prices above a
certain threshold, unusually high energy use on household level or consumption peaks liable to
affect the grid.
Web portal/online tool
Online tools or portals often provide feedback on energy use and costs. These instruments are
relatively easy and cheap information channels, giving customers the possibility to adjust
appliances in their home and providing a more detailed and thorough picture of energy
consumption than in-house displays and tablets. However, the need to log on to a computer to
get access to feedback makes the information more distant than information showed on displays
or in apps.
Informative billing or information letter
Informative billing refers to informing customers of their energy costs and consumption by paper
or digital format, preferably by supplying additional information such as comparison data or
visualizing graphics. There are examples indicating that users pay more attention to information
on paper compared to information on a digital format.
4
5
Feedback channels In-house display (IHD) A display that can provide a variety of feedback information in many different ways, for example charts, symbols and colours. The display is usually located at a central point in a home, where the customer can easily access the information.
App for smartphone or tablet With smartphone and tablet apps, customers have the possibility to receive feedback information on energy topics with easy access at any time. However, delivering deeper analysis of e.g. consumption data can be hard due to the compressed format.
Web portal/online tool
Online tools or portals often provide feedback on energy use and costs. These instruments are
relatively easy and cheap information channels, giving customers the possibility to adjust
appliances in their home and providing a more detailed and thorough picture of energy
consumption than in-house displays and tablets. However, the need to log on to a computer to
get access to feedback makes the information more distant than information showed on displays
or in apps.
Text message
Text messages used for feedback purposes contains short information, and are often sent as
alerts meant to notify the customer and provide warnings. This can be useful for making
customers aware of situations that are out of the ordinary, such as electricity prices above a
certain threshold, unusually high energy use on household level or consumption peaks liable to
affect the grid.
Fully ambient device
Ambient devices do not provide specific consumption information but rather subtle signals to the
customer. Thus, these devices do not enable any deeper analysis, only an easy-to-grasp image
of the general level of energy consumption and/or a change in electricity prices. The ambient
devices can take different forms and give signals through a large variety of ways. (See
OfficeWise example below)
Informative billing or information letter
Informative billing refers to informing customers of their energy costs and consumption by paper
or digital format, preferably by supplying additional information such as comparison data or
visualizing graphics.
Instant occasions
Feedback is sometimes not given through special devices, but rather as instant occasions. This
type of feedback is often negative and punishes the customer, for example by shutting off
appliances when exceeding a certain pre-set power limit.
6
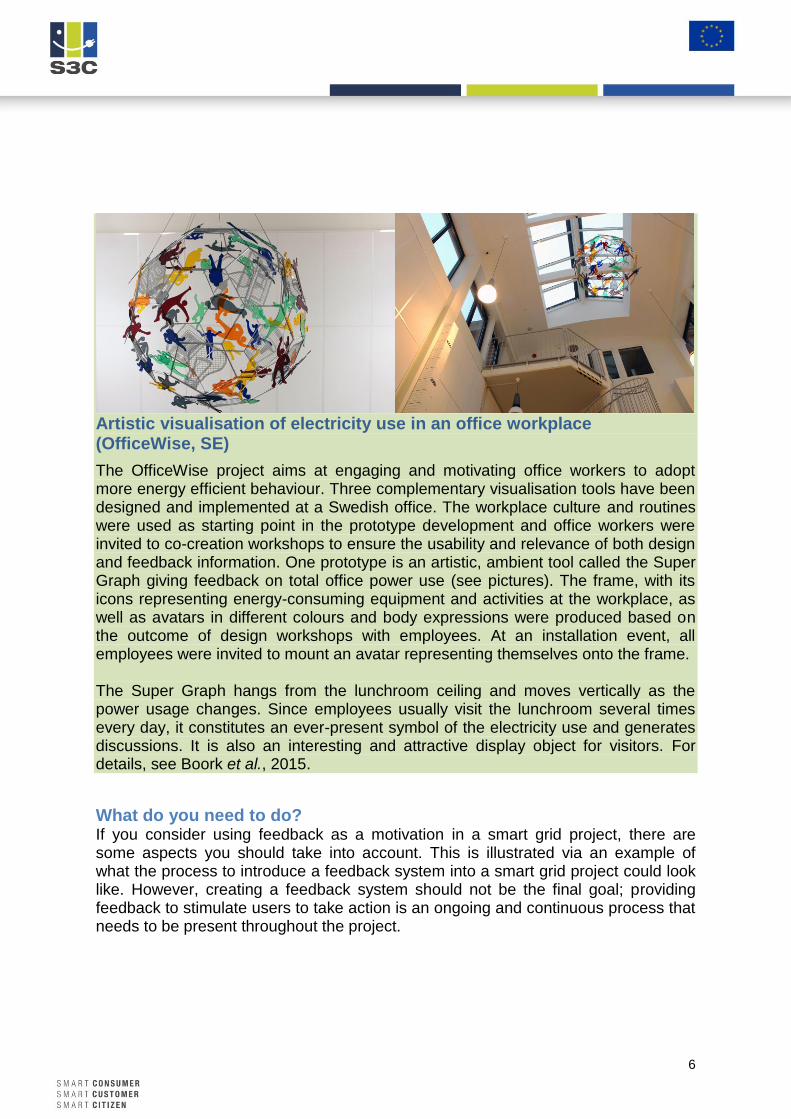
Artistic visualisation of electricity use in an office workplace (OfficeWise, SE)
The OfficeWise project aims at engaging and motivating office workers to adopt more energy efficient behaviour. Three complementary visualisation tools have been designed and implemented at a Swedish office. The workplace culture and routines were used as starting point in the prototype development and office workers were invited to co-creation workshops to ensure the usability and relevance of both design and feedback information. One prototype is an artistic, ambient tool called the Super Graph giving feedback on total office power use (see pictures). The frame, with its icons representing energy-consuming equipment and activities at the workplace, as well as avatars in different colours and body expressions were produced based on the outcome of design workshops with employees. At an installation event, all employees were invited to mount an avatar representing themselves onto the frame. The Super Graph hangs from the lunchroom ceiling and moves vertically as the power usage changes. Since employees usually visit the lunchroom several times every day, it constitutes an ever-present symbol of the electricity use and generates discussions. It is also an interesting and attractive display object for visitors. For details, see Boork et al., 2015.
What do you need to do? If you consider using feedback as a motivation in a smart grid project, there are some aspects you should take into account. This is illustrated via an example of what the process to introduce a feedback system into a smart grid project could look like. However, creating a feedback system should not be the final goal; providing feedback to stimulate users to take action is an ongoing and continuous process that needs to be present throughout the project.
7
1. Decide on what you want to achieve Within your smart grid project team, you should first of all determine what you want to achieve with introducing a feedback system to your customers. For instance, you might want the users to be aware of their energy use in order to cut power peaks in your grid, raise the general knowledge on energy and energy use among your customers or reduce the overall energy consumption. Remember to also make an inventory of your possibilities for designing, developing and introducing feedback to your customers. An internal brainstorm could allow the whole project team to contribute with input on what data is available, what this data could be used for, the budget and timeframe for developing a new feedback system or purchasing an existing one, available resources etc. 2. Involve your customers If your team has access to data and possibilities to introduce feedback in your smart grid project, it is important to design the feedback approach according to the needs of your customers. Therefore, getting to know your customers is crucial, see the S3C guideline Learning about target groups. Involving your customers in the design process via focus groups or co-creation workshops (for more information see our guideline Co-creation – collaborating to develop smart energy solutions) is an efficient way to get insight into their preferences. The interaction should focus on finding out what type of feedback that would motivate your customers to change their energy behaviour and what they consider to be added value of energy feedback. There are many aspects to take into consideration, some of the most important being:
- what feedback should be given? - how should the feedback be presented? - when and how often?
3. Develop a concept Based on the information you’ve gathered in previous steps, your project team should develop a concept for what feedback you’d like to introduce to your users, answering the questions of what, how and when. There are different concepts and approaches to choose from. A popular approach is visualisation of data, which aims at making energy use visible and data easier to access and understand for the costumer, for example by presenting energy use in graphs, economic or environmental terms or presenting it in relation to related information. Visualisation of instantaneous consumption data is often provided via in-house displays. It has been shown that feedback is more likely to encourage users to take action when it provides multiple options for signals to
choose from, has an interactive element, supplies data of high frequency, enables comparison to previous periods or other key figures such as similar households, or
8
gives a detailed breakdown of power usage by appliance. It should be noted that breakdown of power usage by appliance will imply extra hardware and thereby increase costs. Visualisation can also be provided via electricity bills or web sites, but then with a delay between the moment of energy consumption and the time when information reaches the user. See also the images of different visualisations in best practice examples. Once again, involve your customers by presenting the concept to a smaller group. Let them also give input to your concept, preferably in workshops where you could describe your concept through different scenarios and collect comments and suggestions from the future users. Make sure to modify the feedback concept accordingly, before moving on to the next step. 4. Develop a prototype and set up a pilot Once the final concept has been set, you should develop a feedback prototype to be tested in real situations by a small group of users. Again, make sure to gather reactions from the test group; do they understand the feedback and the information provided? Do they find the information relevant and the design appealing? Has their behaviour or mind-set been influenced? Modify the prototype accordingly. There might be a need for several workshops before the final prototype is established. If there is already a good and reasonably prices feedback system available on the market, you may consider purchasing this system instead and test it in a small group. Next, a pilot project should be set up to introduce the prototype to a wider group of users. This should be evaluated to improve the concept and prototype (if applicable) further before the wider implementation or roll out. Continuous improvements between the different prototypes and pilots can become more visible if you use check-ups, see our guideline How to improve your smart energy project through check-ups. 5. Renew your customers’ interest By introducing new features or events, your customers are more likely to keep interest in their feedback system over time. This will avoid fatigue effects. 6. Evaluate engagement To understand how your customers respond to the feedback, you need to evaluate your project and understand why some consumers are very engaged, while for others their engagement has stopped. This is not always bad news, for example lost engagement may indicate either that the users have lost interest in the feedback system, but it might also mean that they have learned from it and therefore no further
9
help from the feedback system is necessary. A guideline that could help you with setting up a good system for evaluating end user experiences is User-centred KPIs for the evaluation of smart grids.
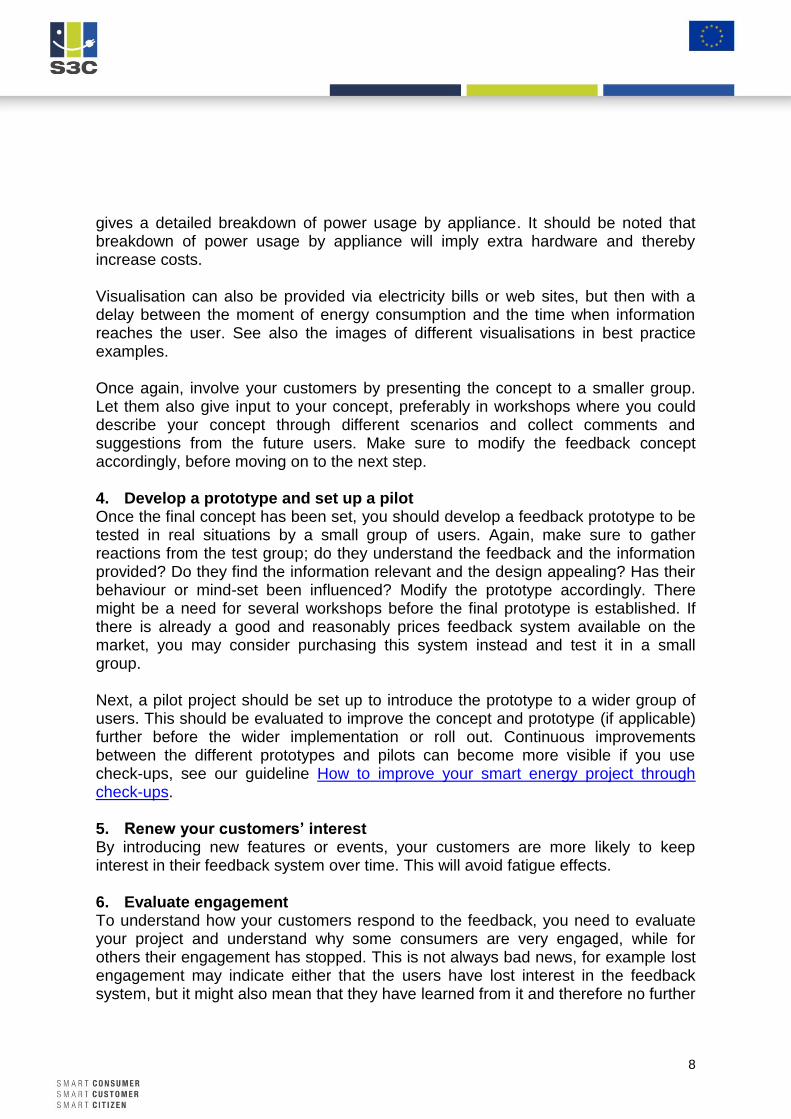
Remote control of appliances through re:dy Home Energy Management system The Portuguese utility EDP has implemented a Home Energy Management system called re:dy, that allows their customers to access and control energy information via a web portal and a smartphone app. Re:dy has a number of different features that informs the customers about their energy use, both in terms of real-time consumption data, social comparison and alerts. It further allows them to control equipment in their homes. For instance, household lighting can be managed remotely and be turned on to give the impression that someone is at home.
Some of the re:dy android app views. (source: EDP)
Do’s and don’ts Enable easy access. Users usually prefer energy feedback that is easy to
access, preferably on an in-house display, smartphone or tablet. For instance, in one pilot test, it was found that an easily accessible ambient display had a clear impact on the energy consumption of the participants, while information provided by other feedback systems such as a website was consulted much less as it required too much effort from the user to access the information.
Make the design attractive and intuitive. The visualisation of the feedback should be attractive and intuitive so that the users understand the feedback information well and can act upon it. For instance, involving a professional designer can be worthwhile. In the example below, the developers have clearly made an effort with making the design of the feedback system appealing to its users.
10
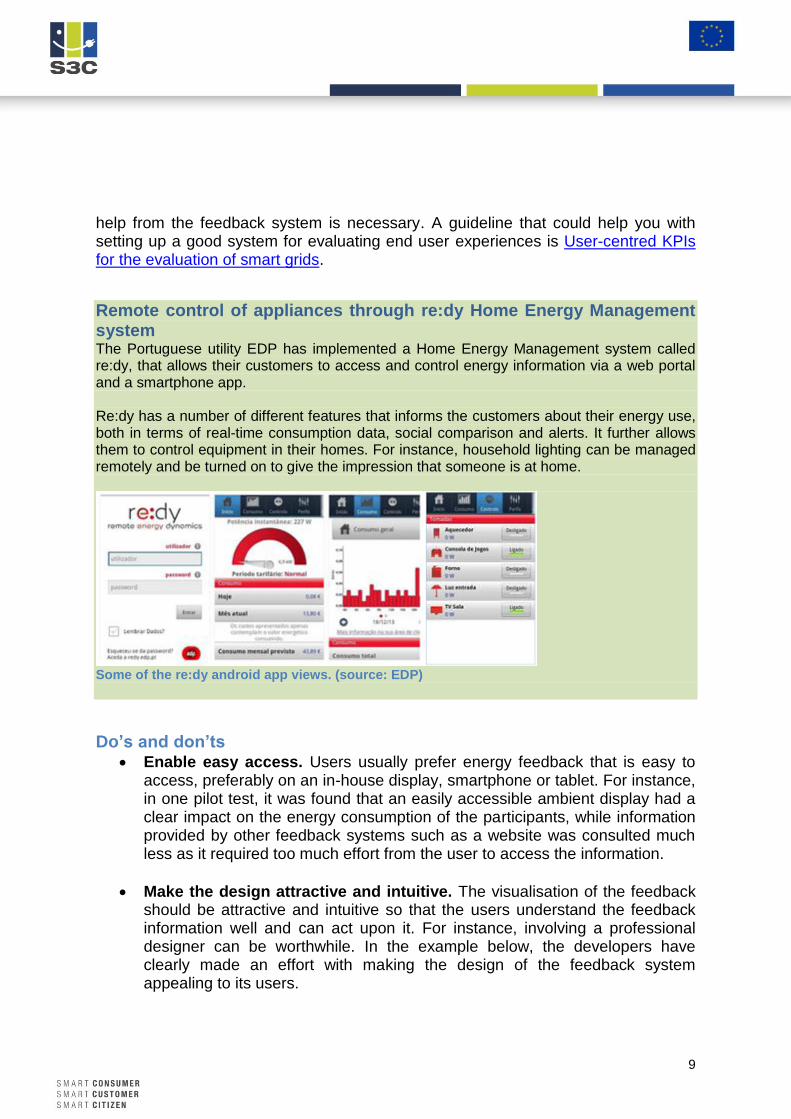
Integrating feedback into the everyday life of a user (PEEM, AT)
In the PEEM project, part of the Model region Salzburg, colour-coded information on an analogue clock called the FORE-watch indicated the effects of energy use in the coming hour. The intention was to improve communication of energy feedback through seamlessly integrating it into the environment of the user. The FORE-watch was designed so that the users should like to look at it. Thus, it should appeal to emotions and create interest. Most participants had chosen to position the FORE-watch in their kitchen as a kitchen clock substitute.
Displays of the FORE-watch. (source: Schrammel et al. 2012, p.7)
The display on the left shows in the outside ring of the analogue clock whether it is favourable to consume energy in the next 60 minutes (top) and the forecasted favourability for the next 24 hours (bars below). The display on the right shows the average consumption of the last week (top) and the consumption within the different price levels (bottom). This gave a comprehensive signal to participants when to consume energy and when not to. For
details, see S3C Deliverable 3.4 (Uyterlinde et al., 2014).
Enhance meaning through colours and symbols. Colours and symbols may enhance the meaning of the information provided. There are many good examples of this in existing smart grid projects. For instance, trophy icons can be displayed if energy behaviour is considered to be good. This has been tested in pilot projects and has made project participants feel encouraged by its appearance. Other smart grid projects have tested indicators of energy use resembling traffic light colour coding, which has also proved to be persuasive for participants. Nevertheless, be aware that colours used in un-conventional combinations may be confusing and take into account that some users may be colour-blind.
Use multi-functionality. A display with more than one purpose might trigger users to check it more often. For instance, you might want to present information about the production of solar power, the weather forecast, time-tables for buses as well as the energy consumption via the in-house display.
11
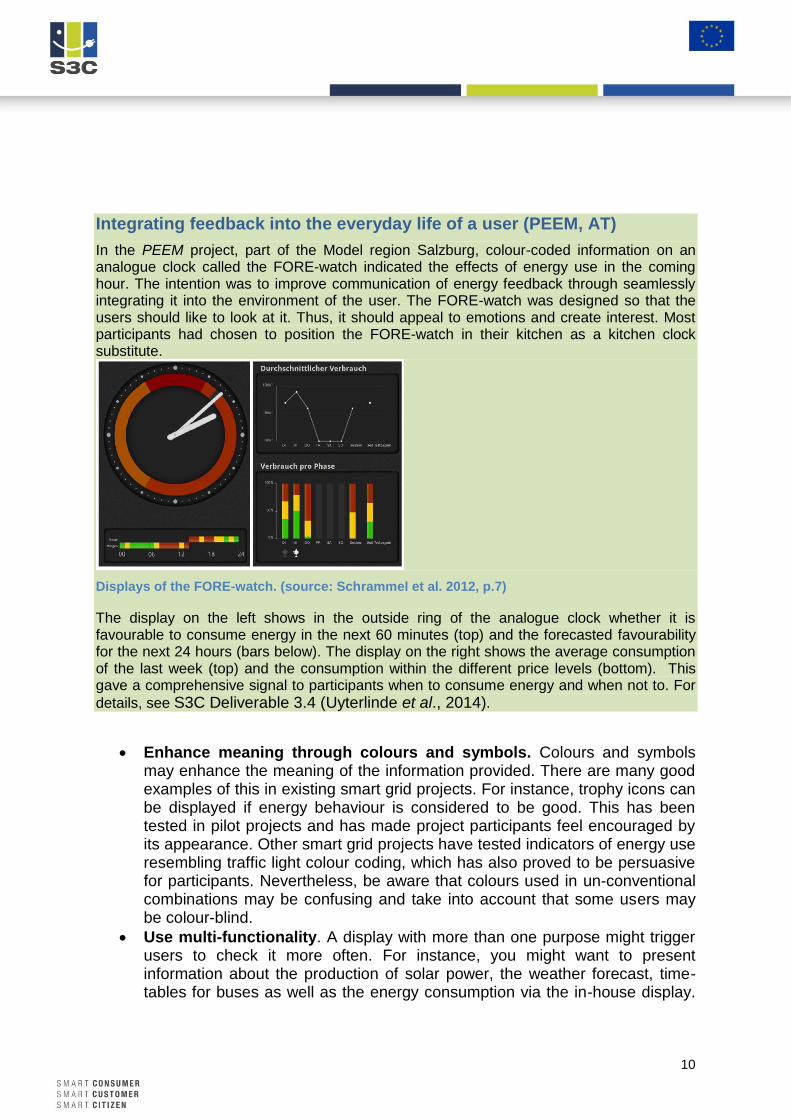
The example below describes a case where the in-house display had more than one function.
An attractive display catches the eye of the user (Jouw Energie Moment, NL)
The in-house displays tested in the project Jouw Energie Moment (NL) presented information about the production of solar power and the weather forecast as well as energy consumption. A depiction of the house, the participant’s PV panels and the electricity grid was shown on the display (see left picture below). Within the image arrows moved in the direction that the energy was flowing at that moment, and the speed of the arrows indicated how much electricity was either bought from or sold to the grid. Many users testified that they checked the display at set times, such as before going to bed. The reason for doing this would for instance be to check whether any appliances in the household were still turned on. This design resulted in participants looking at the display more often. For details, see S3C Deliverable 3.4 (Uyterlinde, M. et al., 2014).
Image of the display of Jouw Energie Moment (NL). Source: S3C Deliverable 3.4.
Use a mix feedback channels. As different feedback systems carry different pros and cons the complementary use of them is advised. For instance, you can combine an in-house display with text messages or e-mail alerts for occasional situations or introduce a combination of an ambient display and a more detailed webpage.
Make sure that information matches The information provided by different feedback channels should be comparable to avoid distrust among users. For instance, the monthly energy use on the IHD should be consistent with the consumption data from the energy bill.
12
Make it fun with games and competitions. Gaming functions such as
competitions can be added to make feedback more fun and appealing. The gaming can also add a social or networking dimension to the feedback, enabling users to interact with others and to compare their own energy use with themselves or others. When using gaming as a feedback format, easy access is important, otherwise users will most likely not apply the gaming features. For more information see Gamification – making energy fun and Motivating consumers with social comparison and competition.
Don’t just provide feedback in kWh. Since users are triggered by different incentives, sending various signals has shown to be beneficial in smart grid projects. This can be achieved by allowing individual settings for how feedback is presented, e.g. in economic, environmental or energy terms, but also by simultaneously presenting data in several different ways. Furthermore, the individual energy use may be combined with other energy related information, such as current grid load, renewable energy generation, CO2 emissions or cost of consumption.
Don’t forget that each smart grid project is different. Results from smart grid projects providing different types of feedback differ, depending on the design of the project and the features of the feedback. The context, location, size and goals of a project will affect the outcome. The feedback system, information, frequency, breakdown, presentation, inclusion of comparisons and combination with additional information and other instruments also have impact on the results.
Don’t believe that your feedback system is ever finished. Follow-ups, renewals and continuously reminding users of their feedback system are crucial, for example by introducing competitions or new features. If you introduce a feedback system and leave the users to use it on their own, they will most likely lose interest after a while.
Further reading S3C (2013). Deliverable 1.1: Report on state-of-the-art and theoretical
framework for end-user behaviour and market roles, 31 October 2013, http://www.s3c-project.eu/Down.asp?Name={HKDBOKAYPM-1128201312241-JMSBZVBBCK}.pdf
Uyterlinde, M. et al. (2014): S3C Deliverable 3.4, Report on case analyses, success factors and best practices. http://www.s3c-project.eu/Down.asp?Name={HYADKPEKMW-630201493832-FBPRIFTPZK}.pdf
13
Corinna Fischer: Influencing electricity consumption via consumer feedback: a review of experience. Proceedings from the ECEEE 2007 summer study, pages 1873-1884.
Hargreaves, T., Nye, M., Burgess, J. (2013). Keeping Energy Visible? Exploring how householders interact with feedback from smart energy monitors in the longer term. Energy Policy 52, 126-134.
Boork, M., Gustafsson, A., Dijkhuis, S., Katzeff, C. (2015). OfficeWise: Energy feedback in office workplaces. In Proceedings of ECEEE Summer Study 2015, Toulon/Hyères, France, 1-6 June 2015.
Darby, S. (2006). The effectiveness of feedback on energy consumption: A review for Defra of the literature on metering, billing and direct displays. Environmental Change Institute, University of Oxford.
Jönsson, L., Broms, L., Katzeff, C. (2010). Watt-Lite; Energy Statistics Made Tangible. In: DIS 2010, 18-20 August 2010, Arhus, Denmark. https://www.tii.se/groups/energydesign#eprints
Katzeff, C. (2010). Engaging Design for Energy Conservation in Households. Metering International Magazine. https://www.tii.se/groups/energydesign#eprints
Broms, L., Katzeff, C., Bång, M., Nyblom, Å. Ilstedt Hjelm, S., Ehrnberger, K. (2010). Coffee maker patterns and the design of energy feedback artefacts. In: DIS 2010, 16-20 August 2010, Arhus, Denmark. https://www.tii.se/groups/energydesign#eprints.
This guideline was developed in the S3C project, and is freely available from www.smartgrid-engagement-toolkit.eu. S3C paves the way for successful long-term end user engagement, by acknowledging that the "one” smart consumer does not exist and uniform solutions are not applicable when human nature is involved. Beyond acting as a passive consumer of energy, end users can take on different positions with respective responsibilities and opportunities. In order to promote cooperation between end users and the energy utility of the future, S3C addresses the end user on three roles. The smart consumer is mostly interested in lowering his/her energy bill, having stable or predictable energy bills over time and keeping comfort levels of energy services on an equal level. The smart customer takes up a more active role in future smart grid functioning, e.g. by becoming a producer of energy or a provider of energy services. The smart citizen values the development of smart grids as
an opportunity to realise “we-centred” needs or motivations, e.g. affiliation, self-acceptance or community. S3C (2012-2015) performed an extensive literature review and in-depth case study research on end user engagement in smart grids, resulting in the identification of best practices, success factors and pitfalls The analysis of collected data and experiences led to the development of a new, optimised set of tools and guidelines to be used for the successful engagement of either Smart Consumers, Smart Customers or Smart Citizens. The S3C guidelines and tools aim to provide support to utilities in the design of an engagement strategy for both household consumers and SMEs. The collection of guidelines and tools describe the various aspects that should be taken into account when engaging with consumers, customers and citizens. More information about S3C, as well as all project deliverables, can be found at www.s3c-project.eu.