Embed Size (px)
Citation preview
Guidebook on the Use of
Administrative Data in National
Accounts
(Draft, June 2014) __________________________________________________________________________________________
Compilation, Application and Practices Relevant to
African Countries
i
Table of Contents Chapter 1: Introduction …………………………………………………………………..1
Objective and Scope of the Guidebook …………………………………………………..1
Data Sources for Compiling National Accounts …………………………………………2
Administrative Data ……………………………………………………………………...3
Advantages of Using Administrative Data ……………………………………………....4
Disadvantages of Using Administrative Data ……………………………………………5
Administrative Statistics to National Accounts ………………………………………….6
Handbooks and Manuals from International Agencies ………………………………….8
Chapter 2: Use of Government Accounts for National Accounts……………………...10
Introduction ……………………………………………………………………………..10
Definition of Government ………………………………………………………………11
Coverage of Government ……………………………………………………………….12
Sources of Data for General Government Sector ……………………………………….13
Structure of Government Accounts ……………………………………………………..14
Certain Conceptual Issues ……………………………………………………………....16
Adjustments……………………………………………………………………………...22
Compilation of National Accounts from Government Accounts ……………………….28
Summary ………………………………………………………………………………...38
Chapter 3: Use of Financial Statements of Financial Corporations
in National Accounts ……………………………………………………………………..43
Introduction ……………………………………………………………………………..43
Financial Corporations in 2008 SNA …………………………………………………...45
Central Banks …………………………………………………………………………...46
Definition and Coverage …………………………………………………………..47
Sources of Data on Central Bank ……………………………………………..…...48
Structure ……………………………………………………………………….…..49
Conceptual Issues Specific to Central Banks ……………………………………...49
Adjustments ……………………………………………………………………......51
Bridge Table – National Accounts from Central Bank Accounts ………………....55
Commercial Banks …………………………………………………………………...….61
Concepts and Definitions Followed in SNA ……………………………………....61
Sources of Data …………………………………………………………………....62
Structure of Accounts …………………………………………………………...…62
ii
Conceptual Issues Specific to Banks ……………………………………………….63
Bridge Table – From Banks Accounts to National Accounts ……………………...68
Insurance Corporations …………………………………………………………………..84
Concepts and Definitions …………………………………………………………..84
Sources of Data ………………………………………………………………….....88
Structure …………………………………………………………………………....89
Conceptual Issues Specific to Insurance …………………………………………...89
Bridge Tables – National Accounts from Enterprise Accounts …………………....95
Summary …………………………………………………………………………..103
Chapter 4: Use of Financial Statements of Non-Financial Companies for National
Accounts……………………………………………………………………………...…...104
Introduction …………………………………………………………………………….104
Accounting System …………………………………………………………………….105
Financial Statements …………………………………………………………...…106
Principles and Rules of Accounting ………………………………………………107
National Accounts and Company Accounts – Practical Issues ………………………...108
Compilation of National Accounts from Company Accounts: Non-Financial
Corporations………………………………………………………………………….…114
Classifying the Items in the Income Statement into SNA Transactions ………….114
Elaborating the Bridge Tables …………………………………………………….116
Adjustment of Intermediate Accounts …………………………………………….117
Conceptual Adjustments ………………………………………………………...117
Adjustments to Achieve Coherence with the Accounts of Other Sectors ………121
Adjustments for Exhaustiveness ……………………………………….…….…122
Numerical Example …………………………………………………………...….122
Summary ……………………………………………………………………………….126
Chapter 5: Use of External Trade Statistics for National Accounts …………………127
Introduction …………………………………………………………………………….127
Accounting Principles and Concepts …………………………………………………..128
Data and Classifications ……………………………………………………………….131
The International Accounts ……………………………………………………………132
Current Account ………………………………………………………………….132
Capital and Financial Account …………………………………………………...134
Relationship of the Rest of the World Account to the International Account …………135
Rest of the World Account …………………………………………………………….137
Chapter 6: Use of Tax Data in National Accounts (Case Study: Zimbabwe) ……….143
iii
Introduction ……………………………………………………………………………143
The Calculation of GDP (2000-2005) …………………………………………………143
Derivation of a Weighted Exchange Rate ………………………………………..143
Calculation of GDP ………………………………………………………………143
Calculation of GDP for 2009 …………………………………………………………..144
Value Added Tax Method ………………………………………………………..144
Rough Check on the Validity of the GDP Figure ………………………………..147
Expenditure Tables ………………………………………………………………147
Calculation of CPI (USD) ……………………………………………………………..152
Introduction ……………………………………………………………………………152
Method of Calculating CPI and Rates of Inflation in Zimbabwe ………………..152
Annexes: Practices in African Countries…………………………………………………158
Annex A: Use of Government Accounts for National Accounts ……………………...158
Botswana …………………………………………………………………………158
Mauritius …………………………………………………………………………166
Mozambique ……………………………………………………………………..187
Niger ……………………………………………………………………………..190
South Africa ……………………………………………………………………...208
Annex B: Use of Financial Statements of Financial
Corporations in National Accounts ……………………………………………………238
Egypt ……………………………………………………………………………..240
Niger ……………………………………………………………………………...245
1
Chapter 1: Introduction
This chapter provides a brief description of objectives, scope and contents of the Guidebook
and also discusses the advantages in using administrative data in the compilation of national
accounts. The chapter also touches upon the sources of data that are normally used in the
compilation of national accounts, of which the administrative data is considered the most
important and cost effective.
Objectives and scope of the Guidebook
The main objective behind the preparation of this Guidebook has been to bring together
African country experiences and practices on use of administrative data in the compilation of
national accounts. These country experiences and best practices are expected to provide
guidance to the national accountants in Africa in transforming the information contained in
the administrative data to national accounts in their countries.
Administrative statistics cover a vast range of areas and their availability, accessibility,
contents, quality, periodicity and timeliness vary largely among the countries, especially so in
the African countries. This guidebook, therefore, aims to include only the main types of
administrative data such as the financial accounts and statements of government, non-
financial corporations, financial corporations (central bank, commercial banks, life insurance
and non-life insurance companies), tax data, customs records and balance of payments (BoP)
statistics. Though BoP statistics is also regarded as a statistical compilation and not an
administrative data just as the case with national accounts statistics, this has been included in
the Guidebook since BoP statistics is the main source for preparing rest of the world (ROW)
accounts in national accounts and is also used in preparing several national accounts
aggregates.
Besides putting together African country experiences in using administrative data in national
accounts, the Guidebook includes the standards and guidelines prescribed in the 1993/2008
System of National Accounts and several handbooks on national accounting brought out by
international agencies. Therefore, this Guidebook draws heavily material from the
1993/2008 SNA and the Handbooks.
Need for the Guidebook
The need for a guidebook on use of administrative data in national accounts was felt as data
from administrative sources is generally available, cost effective and can be efficiently used
to improve the national accounts and implement 2008 SNA. In fact, administrative sources
constitute a key component in national accounts compilation in most countries. In the context
2
of African countries, availability of administrative data is relatively better than that from
censuses and surveys. Several countries in the continent do not have a regular system of
conducting censuses and surveys that provide information for compiling national accounts.
Therefore, if statistical offices manage to access administrative data from the concerned
administrative functionaries in their countries, the guidebook will further support the national
accountants in translating these data to national accounts.
Currently, there is no single handbook from the international agencies that covers all major
administrative statistics and their use in national accounts. There are, however, handbooks
and manuals focusing on specific sectors. This guidebook is expected to fill this gap for the
African countries. Further, African country practices on national accounts differ from
country to country in using administrative statistics. For example, most countries use
government accounts, but fewer countries have been able to use the accounts of corporations
in the compilation of national accounts. There are some countries which use tax data
extensively in the national accounts. This guidebook is, therefore, also intended to present at
one place the best African country practices in each of the major types of administrative
statistics.
Data sources for compiling national accounts
The national accounts statistics are compiled from a large number of data sources that include
censuses and surveys; administrative statistics; records held by businesses or industry
associations; and, a large number of other ad hoc sources. These sources vary considerably
among the developing countries mainly on account of the administrative structure, procedures
and rules, internal priorities, availability of resources, and economic and political situation
prevailing in those countries. The SNA provides a framework for integrating these different
sources to compile a set of harmonized and consistent national accounts. Therefore, reliability
of national accounts depends largely on the quality and coverage of source data.
Among these data sources, censuses and surveys are normally conducted by statistical offices
and also generally take into account the national accounts data needs to some extent. While
censuses are conducted infrequently, surveys are expected to be conducted regularly and
cover the whole economy and also meet the timeliness and periodicity criteria of national
accounts compilations. However, this is not the real situation in most developing countries.
Conducting censuses (such as the economic census, agriculture and livestock census,
population census) is costly and time-consuming, periodicity ranges from 5 to 10 years and
results are available with considerable time-lag. Therefore, information coming from the
censuses is mostly used as a frame for conducting surveys and sometimes used for
benchmarking national accounts depending on the type of data gathered in these censuses.
The surveys and other datasets that feed into national accounts are mainly the Labour force,
household budget, investment, agricultural, enterprise/establishment (mining, industry and
3
services), construction, informal/household sector, and surveys on external sector
transactions. Just as in the case of censuses but to a lesser extent, conducting surveys is
costly and there is a long gestation period between the planning of a survey and the
availability of micro-data or results. Therefore, it is a common practice in most developing
countries that economic surveys, such as establishment surveys, household income
expenditure surveys and labour force surveys, are infrequent and their results actually get
used for benchmarking national accounts, rather than for the annual or quarterly national
accounts. Only a few developing countries have comprehensive quarterly or annual surveys
that provide information required for compiling quarterly and annual national accounts.
Moreover, such surveys would be able to incorporate only very few questions on economic
situation since the data is needed to be collected, processed, compiled and disseminated
quickly so that the results are available in time for use in the annual/quarterly national
accounts.
The other most important data source for national accounts is the administrative data. These
data are essentially collected by the administrative agencies in the countries as part of their
administrative functions, or as legal or taxation requirements, or as part of regulatory
functions, or for internal needs of policy making or sometimes the data gets generated as a
by-product of administrative functions of these agencies. The 2013 ECA survey on the use of
administrative data sources in the compilation of the national accounts in Africa showed that
administrative data sources are used far more often than statistical surveys by virtually all
African countries.
Administrative data
The United Nations Economic Commission for Europe (UNECE) handbook (2011), Using
Administrative and Secondary Sources for Official Statistics: A Handbook of Principles and
Practices defines administrative statistics as ―Administrative sources are data holdings
containing information which is not primarily collected for statistical purposes‖. According
to the OECD Glossary of Statistical Terms, it is defined as ―The administrative source is the
register of units and data associated with an administrative regulation (or group of
regulations), viewed as a source of statistical data‖.
The administrative data covers a wide range of areas and differs considerably among
countries. The list of administrative data can be very large, but the key datasets from the
national accounts perspective are:
Accounts of Government containing revenue and expenditure details;
Accounts of businesses (financial and non-financial companies);
databases and accounts of central bank;
Income tax data;
VAT data;
4
Customs statistics on imports and exports of goods;
Statistics compiled by industry associations, research institutions and other
professional bodies;
Other administrative statistics such as the building permits, hotel occupancy,
electricity sales, sales of manufactured goods (computers, consumer durables, etc.)
indicators on postal and telecommunication, net tonne kms and passenger kms (road,
water and air), cargo handled in ports, etc. ;
Social security records;
Employment registers.
The UNECE handbook mentioned above elaborates the advantages and disadvantages in
using administrative sources for official statistics. The handbook also discusses in detail the
quality issues and common problems while using these sources and offers suggestions to
overcome these problems.
Advantages of using administrative data
The UNECE handbook devotes an entire chapter to describe the advantages of using
administrative sources in official statistics, under 6 broad headings of cost, response burden,
frequency, coverage, timeliness, and public image,. The Eurostat handbook Essential SNA:
Building the basics, summarizes the advantages as:
1) They are ‘cheaper’ than other sources and often even free.
2) They provide complete, or almost complete, coverage of the population to which the
administrative process applies. Generally they have very high response rates, no
survey errors, providing more accurate and detailed estimates of sub-populations.
3) The timeliness of the statistical variables derived from administrative sources is
improved. This is particular the case for annual ad-hoc surveys, which are based on
administrative sources via the business register (however this does not apply to short-
term indicators).
4) They reduce the response burden on businesses.
5) They may increase business register quality, which are used for carrying out
statistical surveys, thus improving their quality.
Besides being available free of cost, regularly and timely, the main advantage of
administrative statistics is their acceptability, since they are mostly collected under statutory
provisions and, therefore, have a better public image and are considered to provide a true
situation of economy. For example, when economy is at a revival stage in a particular year, it
is reflected through the accounts of businesses in that year. On the other hand, surveys or
benchmark-indicator procedures may not be able to pick up such short-term signals. This is
because, administrative data captures new units coming into production much better than the
surveys which often miss out such units due to lack of updation of business registers or
5
sampling frames. Indicators (such as production index) provided by panel surveys also
normally miss out new units commencing production. Another advantage of using
administrative sources is the availability of micro-data of administrative records
electronically for the national accounts compilation, for example, the detailed government
accounts showing revenues and expenditures by items. This reduces considerable
computational workload on the part of national accountants, as they can prepare concordance
or bridge tables and incorporate necessary adjustments in the original database itself and
generate the sequence of accounts or national accounts aggregates directly.
Disadvantages in using administrative sources
Using administrative data in national accounts has its own disadvantages. The major
weakness in administrative data is its susceptibility to administrative changes and
introduction of new regulations. For example, changes made in taxation or insurance policies
may result in reporting bias. Units exempted from licensing requirements may stop
submitting returns. Similarly, units producing items exempted from taxation may not report
production data to tax authorities. In such cases, administrative data over the years may
become incomparable.
The Eurostat handbook lists some of the disadvantages in using administrative data as
follows:
1) The most important problem for a statistical office, and implicitly for national
accountants, is obtaining access to administrative sources. This may be because there
is no legal framework in place between the statistical office and the authority
gathering the data. Sometimes, it may respond to practical issues relating to data
transfer (formats, details, responsibilities, ways of collection, etc.). This problem can
be easily avoided if agreements and memoranda of understanding (clearly
establishing frequency, data format and any relevant information for data transfer)
are signed between the statistical office and the administrative authority.
2) The information used in administrative sources does not directly correspond to the
statistical indicator definitions.
3) The classification systems used within administrative sources may be different from
those used in the statistical world, or may be applied differently, depending on the
purpose of the administrative source. Where possible, it is preferable to rely on
several administrative data sources.
4) Another common problem relates to timeliness. Data may either not be available in
time to meet statistical needs or may refer to a period that does not coincide with that
required for statistical purposes, e.g. a tax year may not coincide with the calendar
year required for structural business statistics. In many countries timeliness is
particularly a problem with company accounts which are only finalized one or two
6
years after the end of the period. Data on company taxes are also one or two years
old in most cases.
5) Administrative sources are generally set up for the purpose of collecting taxes or
monitoring government policies. For this reason, they are susceptible to political
change. If a policy changes, administrative sources may be affected in terms of
coverage, definitions, thresholds etc., or possibly even abolished completely.
Since it is often found that the concepts and definitions of units and data items in the
administrative data do not exactly correspond to the national accounts concepts, national
accountants have to make necessary adjustments while translating these data to national
accounts and this becomes a major exercise. Another problem that arises while using
administrative sources is when the data is in conflict with those of other available sources and
surveys. For example, growth rates estimated from the accounts of businesses engaged in
manufacturing may be completely different from those estimated from the production index
or manufacturing surveys of statistical offices. Part of it, however, is attributable to concepts
and definitions of units and products adopted in different sources, but the differences still
need to be closely examined by the national accountants.
Despite these disadvantages, it is always preferable to use administrative data in the
compilation of national accounts, in view of their overwhelming advantages.
Administrative statistics to national accounts
Translating administrative data to national accounts requires good understanding of the
scope, coverage, definitions and concepts of the source data being used. Normally,
administrative agencies maintain or develop these databases principally for their own
administrative requirements or as part of their regulatory functions and, may not directly meet
the national accounts requirements. Therefore, sound understanding of the source data is
essential on the part of national accountants in order to prepare necessary transition accounts
and tables and make conceptual adjustments.
The 2008 SNA states, Business accounts, tax returns and other administrative records are
main sources of data for drawing up the national accounts. One should be aware, however,
that none of these necessarily satisfies the valuation requirements of the SNA and that
accordingly adjustments may have to be made. In particular, in the interest of prudence,
business accounting often adopts valuations that are not appropriate for the national
accounts. Similarly, valuations for tax purposes often serve objectives that differ from those
of macroeconomic analysis. For example, the depreciation methods favoured in business
accounting and those prescribed by tax authorities almost invariably deviate from the
concept of consumption of fixed capital employed in the SNA. (Para 3.140, 2008 SNA)
To a large extent, translation of administrative data to national accounts becomes easier if the
administrative data (especially in the case of government and business accounts) follows
7
certain national or international standards and classifications, as most international standards
are largely harmonized with national accounting principles. In this case, it is easier to
prepare bridge tables and incorporate standard adjustments to meet national accounts
requirements, in the databases of administrative agencies. However, this is often not the case,
as classifications and standards vary not only across the countries, but also even within the
countries. For examples, the codes used for recording revenues and expenditures in
government accounts may vary from one department to another department or from federal
government to provincial governments or local authorities even within a country. Similarly,
business accounting practices may vary from one company to another company. Some
companies may present very detailed accounts while others may only present a few
consolidated entries.
Therefore, it becomes essential for the national accountants to prepare ‗bridge tables‘ or
‗intermediate tables‘ for translating micro-data or consolidated data from administrative
sources to national accounts. Bridge tables are particularly relevant while using accounts of
government and corporations and balance of payments statistics. The Eurostat handbook
suggests the following six phases for translating administrative data to national accounts.
1) identification of administrative data sources;
2) analysis of content in respect of national accounting methodological requirements;
3) collection of data source indicators;
4) translation of each indicator from administrative data sources into national accounts
concepts;
5) application of adjustments to meet national accounting requirements;
6) estimation of the national accounts indicators.
For an efficient use of administrative data in national accounts, the national accounts
compiling agencies should establish a mechanism of having a continuous dialogue (and if
necessary through a memorandum of understandings to share administrative data with them)
with the administrative source data agencies, with the purpose of:
Understanding the scope, coverage, concepts, definitions and quality of administrative
data;
Sharing the administrative data, preferably the micro-data in electronic form;
Improving the timeliness and periodicity to match with national accounts releases;
Improving the content and quality of data in line with the recommended international
standards, such as International Accounting Standards and International Financial
Reporting Standards;
Giving a feedback to the source data agencies on how they have used the data in the
national accounts and compiled the economic variables. This will bring the source
data agencies getting involved in the national accounts compilation and in assessing
their contribution to the national economy.
8
Handbooks and manuals from international agencies
There are several handbooks and manuals that provide comprehensive guidance on use of
administrative data in national accounts for specific sectors. Some of these are:
1) UNECE Handbook of Using Administrative and Secondary Sources for Official
Statistics: A Handbook of Principles and Practices, 2011
2) UN Handbook: Links Between Business Accounting and National Accounting, Studies
in Methods, 2000
3) UN Handbook of National Accounting: Financial Production, Flows and Stocks in the
System of National Accounts, 2013
4) Guide méthodologique pour l’élaboration des comptes nationaux dans les états
membre d’Afristat, Afristat, Serie Méthodes No.4, 2001; Chapter II-III: ‘ Le comptes
des administrations publiques ’; chapter II-IV: ‘ Le commerce extérieur et la balance
des paiements ’; Chapters II-VII: ‘ Le traitement des données d’entreprises
5) Eurostat handbook Essential SNA: Building the basics, 2013
6) European Commission, IMF, OECD, UN, World Bank System of National Accounts,
1993 and 2008
7) United Nations, European Central Bank: Handbook of National Accounting:
Financial Production, Flows and Stocks in the System of National Accounts, 2014
8) UN Handbook of National Accounting National Accounts: A Practical Introduction:
Studies in Methods, 2003
9) OECD, IMF, ILO, CIS Stat (2002) Measuring the Non-Observed Economy: A
Handbook
10) IMF (2001): Government Finance Statistics Manual
11) IMF (2009): Balance of Payments and Investment Position, Sixth Edition;
12) United Nations (2010): International Merchandise Trade Statistics: Concepts and
Definitions
13) IAS Plus: Summaries of IFRSs and IASs at http://www.iasplus.
com/standard/standard.htm.
The most important one among these from the national accounts perspective is the UN
Handbook: Links Between Business Accounting and National Accounting, Studies in
Methods, 2000. This handbook deals with the subject exhaustively for the non-financial
sector and includes country practices of Canada, USA, France, Netherlands, Malaysia and
Latin American countries.
The UN, ECB Handbook of National Accounting: Financial Production, Flows and Stocks in
the System of National Accounts, 2014 deals with financial sector comprehensively and
includes a number of examples on computing FISIM and compiling full set of sequence of
accounts.
The Eurostat handbook Essential SNA: Building the basics, 2013 Chapter 5 covers major
administrative statistics of government, financial and non-financial sector, and balance of
9
payments and provides bridge tables between administrative data concerning these sectors
and the national accounts transactions. This handbook provides guidance mainly on
compiling output and value added estimates from the bridge tables.
The 1993/2008 SNA does not separately discuss the use of administrative data and their
translation to national accounts, though it highlights the areas of differences between business
accounting and economic accounting, in several chapters. However, 2008 SNA devotes an
entire chapter 22 for general government and public sector. Further, 2008 SNA mentions in
Chapter 1 that the accounting rules and procedures used in the SNA are based on those long
used in business accounting. In Chapter 22, it mentions that national accounts for
government units and public corporations are often derived directly from the micro-data in
government financial accounting databases. As a result, compilers of statistics for the
government units and public corporations usually draw more heavily on accounting
information than the results of statistical enquiries. In Chapter 26, SNA provides a
comparison between the international accounts and the SNA rest of the world accounts
Chapter 14 of the UN Handbook of National Accounting National Accounts: A Practical
Introduction: Studies in Methods Series F, No.85, discusses the types of accounts available
from the administrative sources and mentions the approaches and items that should be looked
for in these sources while estimating output and value added.
Structure of paper
The guidebook is structured as follows:
Chapter 1: Introduction provides a brief description of objectives, scope and contents of the
Guidebook and also discusses the advantages in using administrative data in the compilation
of national accounts.
Chapters 2 to 8 deal with a range of administrative statistics and their translation to national
accounts. These chapters also include a few country practices. Chapter 2 is on government
accounts, while chapters 3 and 4 deal with financial and non-financial corporations,
respectively. Chapter 5 discusses the transition from balance of payments statistics to
national accounts. Chapter 6 and 7 concern the value added tax and income tax respectively.
Country specific uses of administrative statistics are presented in Chapter 8.
An overview of national accounts is presented in Annex.
10
Chapter 2: Use of Government Accounts For National Accounts
This chapter describes the general structure of government accounts that includes revenue
and expenditure details; and provides a concordance between the government accounts and
national accounts classification of transactions. The text for this chapter has mainly been
sourced from the following three documents:
14) European Commission, IMF, OECD, UN, World Bank System of National Accounts,
1993 and 2008
15) IMF: Government Finance Statistics Manual 2014 Pre-publication Draft
16) Eurostat handbook Essential SNA: Building the basics, 2013
The chapter also presents a simplified method of estimating CFC when countries are not able
to compile the same according to perpetual inventory method (PIM) recommended in SNA
due to absence of long-term data on capital formation for general government. Finally, the
chapter includes few African country practices of using government accounts in national
accounts.
1. Introduction
In the compilation of national accounts concerning general government sector, source data
used is normally the government accounts (mainly available in the form of budget
documents) and rarely from any other alternative sources such as censuses or surveys.
Usually these data are available to the national accountants either in hard copies or in
electronic form. In some countries, government accounts show item level revenues and
expenditures in a very detailed manner and further for each ministry/department and again for
different levels of government. The extent of detailed data available from government
accounts determines the quality of national accounts for general government, as there are
several borderline cases where items of expenditures or revenues can be classified under
national accounts transactions one way or other. For example, some expenses can either be
categorised under compensation of employees or intermediate consumption. Some types of
fees and fines can be classified under different categories. Some expenditures under repairs
and maintenance can either be of current or capital nature. There are also borderline cases
between taxes and sales as also between subsidies and transfers. Therefore, availability of
detailed item level data in the government accounts helps in correctly classifying the
revenues and expenditures of government against national accounts transactions.
African countries mostly use government accounts to compile national accounts for general
government sector. The UNECA survey of December, 2013 on the sources and methods
used to compile national accounts in the 54 African member countries (47 countries
responded) showed that 43 countries have access to government accounts in some form. Of
these, 40 countries have access to government accounts in electronic form - either for
11
national government only (22 countries) or for both national and provincial levels (18
countries). Among these, 19 countries are compiling sequence of accounts for general
government from production account to use of income accounts, and 11 countries are able to
produce sequence of accounts up to financial account.
Concerning availability of details in the government accounts, the experience of African
countries has been diverse. Most countries are able to distinguish major economic categories
such as wages, transfers, and intermediate consumption from the source data. However, only
about 60 per cent of countries are able to distinguish expenditures by COFOG or by kind of
economic activity; in nine countries government accounts are not detailed enough to
distinguish between current and capital expenditures; in 13 countries the accounts do not
distinguish between different types of taxes and subsidies, or do not distinguish between
taxes and receipts from sales; and in 17 countries the accounts cannot be used to identify
subsidies, current transfers, and social benefits in kind.
Despite these limitations, government accounts constitute the single most important source
for preparing national accounts for the general government sector in Africa. The micro-data
available from government accounts helps in translating the government transactions to
national accounts directly through preparation of bridge tables and application of required
adjustments. A clear understanding of the underlying concepts, definitions, scope and
coverage of details provided in government accounts and their linkages with national
accounts is, therefore, essential on the part of national accountants. This is particularly
important as there are several borderline cases where government revenues and expenditures
could be treated differently in national accounts in the absence of detailed information, thus
impacting the quality of estimates of output, value added, capital formation and savings of
not only the general government sector but also of the overall economy.
2. Definition of government
Governments are mainly engaged in redistributing income and wealth among various sections
of the community through taxation, transfers and other revenue raising or welfare measures;
and produce non-market1 services that are either provided free or at economically
insignificant prices to the population either collectively or individually. Government has
been defined in the 2008 SNA and the 2014 GFSM (pre-publication draft) as follows:
According to the 2008 SNA, Government units are unique kinds of legal entities established
by political processes that have legislative, judicial or executive authority over other
institutional units within a given area. Viewed as institutional units, the principal functions of
government are to assume responsibility for the provision of goods and services to the
1 Non-market output of government consists of goods and individual or collective services produced by its units
that are supplied free, or at prices that are not economically significant, to other institutional units or the
community as a whole.
12
community or to individual households and to finance their provision out of taxation or other
incomes; to redistribute income and wealth by means of transfers; and to engage in non-
market production. (2008 SNA, para 4.9)
The Government Finance Statistics Manual 2014 (pre-publication draft) states ―The general
government sector consists of resident institutional units that fulfil the functions of
government as their primary activity. The function of government units, broadly described, is
to implement public policy through the provision of primarily nonmarket services and the
redistribution of income and wealth, with both activities supported mainly by compulsory
levies on other sectors. (2014 GFSM pre-publication draft, para 1.2)
Both the above definitions outline the principal characteristics of government units as:
Engage in non-market production;
Provide goods and services to the community or to individual households;
Redistribute income and wealth by means of transfers; and
Finance their activities through taxation or other incomes;
3. Coverage of government
The general government sector includes legal entities which have legislative, judicial or
executive authority over other institutional units. It covers the budgetary government units,
extra-budgetary units, social security funds and non-profit institutions that are controlled by
government units. The budgetary government units include the central government, state or
provincial governments and local governments.
• Budgetary units
– Central government that encompasses the fundamental activities of the
executive, legislative and judiciary powers. The political authority of central
government extends over the whole country.
• Most of the ministries, departments, agencies, boards, commissions,
judicial authorities, legislative bodies and other entities make up this
central government unit.
• Its revenues as well as its expenses are normally regulated and
controlled by a Ministry of Finance, by means of a general budget
approved by the Parliament.
– State/provincial or local governments
• The state or local government subsectors each have a budgetary
state/local government component that includes the principal
executive, legislative, and judicial powers for these levels of
government. Often, these budgets also need approval by the
legislatures/elected bodies.
13
• Extra-budgetary units
– General government entities with individual budgets not fully covered by the
general budget
– These entities operate under the authority or control of a central, state, or local
government.
– They may have their own revenue sources, which may be supplemented by
grants (transfers) from the general budget or from other sources.
– Even though their budgets may be subject to approval by the legislature,
similar to that of budgetary accounts, they have discretion over the volume
and composition of their spending.
– They are non-market producers established to carry out specific government
functions and are controlled by a government unit.
• Social security fund that is devoted to the operation of one or more social security
schemes2. In macroeconomic statistics, a social security fund is recognized if it meets
the criteria to be an institutional unit and if it:
– is organized and managed separately from the other activities of government
units;
– holds its assets and liabilities separately from other government units; and
– engages in financial transactions on its own account.
• NPIs that are non-market producers and controlled by a government. Controls could
be in the form of appointing officers, financing and other contractual arrangements.
The NPIs are normally included in the government units which control them.
4. Sources of data for general government sector
For the general government sector, the source data required for compiling statistics is usually
available. These mainly comprise budget documents; and accounts of extra-budgetary units,
social security funds and NPIs. The budget documents of central government are generally
prepared by the Ministry of Finance (MoF). Accounts of other general government units are
normally prepared by a designated administrative authority of these units.
The budget documents usually contain item-wise revenues and expenditures of government
under its major accounting heads, further disaggregated by ministries/departments and also
sometimes by states/provinces and local governments if the country is centrally governed. In
some countries, state/provincial governments and local governments may have their own set
2 Social security schemes are social insurance schemes covering the community as a whole, or large sections of
the community, and are imposed and controlled by government units. Social insurance schemes provide social
protection and require formal participation by the beneficiaries, evidenced by the payment of contributions
(actual or imputed).
14
of budget documents submitted to their legislatures or an elected body, where the governance
is decentralised. Similarly, in some countries, accounts of extra-budgetary units and NPIs
controlled by government units may also need to be submitted to the Parliament/legislatures,
depending on the legal and administrative arrangements and procedures in place in their
countries. In some countries their accounts may just be submitted to the concerned
ministry/department/state/local government which administers these units.
These detailed governments accounts by ministries/departments within the central
government and state/provincial governments and local governments constitute the micro-
data for use in national accounts. Unless such detailed data by ministries and departments are
available, it is difficult to correctly compile general government accounts and also its
functions according to the Classification of Functions of Government (COFOG) and allocate
general government activities to various industries. This is also essential for determining the
collective and individual consumption of government services and in preparing supply and
use tables.
From the national accounts point of view, irrespective of the type of accounting system
followed by the countries, it is important to ensure that micro-data from all general
government units are collected and there are no omissions. In some countries, local
governments or some of the NPIs or extra-budgetary units may not be covered in the general
government accounts due to lack of source data. This will result in under-coverage of general
government sector in national accounts.
5. Structure of government accounts
The type and structure of government accounts vary across the countries, depending upon
their political and administrative procedures and arrangements. Most countries normally
have a consolidated government account in the form of Finance Account or Annual Financial
Statement, which shows summary information on government revenues and expenditures
across its accounting heads and sub-accounts. The accounting heads are generally
categorised under revenue (further broken down by current and capital receipts), and
expenditure (broken down by current and capital expenditure). Some countries may also
have separate accounts for loans and advances, and public debt. There could be several other
models of government accounts in the African countries. The sub-accounts could be the
consolidated fund, charged fund3, development fund, etc. or country specific sub-accounts.
In a typical set of budget documents, information on budgeted amounts may be available for
the current fiscal year and actuals for the previous fiscal year.
3 Charged fund shows expenditures which are charged and not voted by the Parliament or legislatures. These
expenditures are generally towards constitutional positions such as judiciary and head of the nation.
15
In addition to the Finance Account or Annual Financial Statement which is prepared
normally by the Ministry of Finance, individual departments/ministries may also maintain
their own accounts showing receipts and expenditures, with more detailed information on the
types of receipts and expenses incurred by them. In some countries, these accounts are
termed as Demand for Grants and are also needed to be approved by the Parliament or
legislature before incurring expenditures. Expenditures of government are normally voted by
the Parliament or legislatures and some expenditures could be ‗charged’, which means the
expenses under this charge account are not required to be voted. The detailed information
available from the accounts of departments/ministries, and extra-budgetary units enables in
correctly classifying government transactions according to SNA concepts and also enables in
preparing general government expenditures according to COFOG and allocate them to
appropriate industry groups and products4.
The government accounts of most countries also follow certain standard accounting practices.
Individual revenues and expenditures are classified according to a set of standard ledger
codes, which sometimes can extend upto 15 digits5 and these are unique across the
ministries/departments of central government and state/provincial governments and local
governments. In such cases, it is easy for national accountants to prepare concordance tables
between the ledger codes and SNA transactions and generate national accounts aggregates
and sequence of accounts, in a simplified manner, after incorporating suitable adjustments
required to meet SNA concepts. However, in most countries these ledger codes may not be
standardised across various levels of government. In which case, national accountants have
to go through the detailed data on expenditures and revenues by items and allocate them to
appropriate SNA transactions on the basis of their descriptions, while preparing bridge tables.
This is often a very lengthy process, but if the micro-data is available electronically, the
process becomes easier.
Another feature of most government accounts is that they are normally recorded on cash
basis. SNA requires the data to be compiled on an accrual basis. It is important to prepare
national accounts for general government sector on accrual basis, as they have transactions
outside government, for example, with the corporations and households, which follow accrual
accounting. This results in inconsistency of the data across institutional sectors, if one
institutional sector follows cash accounting and others accrual accounting. For example,
Governments may issue bonds to corporations to be redeemed in future, and may not show
such expenditures in the current year in the government accounts. On the other hand,
corporations may show the bonds as receivables in their accounts in the current year.
In this context, para 22.13 of 2008 SNA states, ―The development in recent years of
International Public Sector Accounting Standards by the International Public Sector
Accounting Standards Board of the International Federation of Accountants has increased
the need for clear guidance on the compilation of government finance statistics so that the
4 Product level information is useful while compiling the supply and use tables.
5 Covering major head, minor head, detailed head, object code, etc.
16
detailed accounting data can be transposed correctly into the framework of the SNA. Such
guidance is especially important when the government financial accounts are compiled on a
cash basis and must be converted to an accrual basis to comply with the accounting basis of
the SNA‖.
6. Certain conceptual issues
The following are some of the characteristic features specific to the general government
(extracts from 2008 SNA).
General government consists of institutional units that, in addition to fulfilling their
political responsibilities and their role of economic regulation, produce services for
individual or collective consumption mainly on a non-market basis and redistribute
income and wealth. They consist mainly of central, state and local government units
together with social security funds imposed and controlled by those units. In addition, it
includes NPIs engaged in non-market production that are controlled by government units
or social security funds.
Social security schemes are run as part of the operation of general government. If separate
units are distinguished, their output is determined in the same way as all non-market
output as the sum of costs. If separate units are not distinguished, the output of social
security is included with the output of the level of government at which it operates.
Central bank when it is a separate institutional unit, is always allocated to the financial
corporations sector even if it is primarily a non-market producer and is treated as being
controlled by government, and produces collective services. These collective services
are, however, shown under government final consumption, as corporations do not have
final consumption expenditure and their purchases are only towards intermediate
consumption or compensation in kind.
Government accounting is usually on cash basis. The rules of consistency in the SNA
require that efforts should be undertaken for correcting them to accrual basis.
Within the general government accounts, current and capital transfers such as central
government grants to lower levels of government are usually consolidated.
Production, output, value added (Production account)
Government undertakes production (on non-market basis), accumulation and final
consumption on behalf of the population.
The SNA includes within the production boundary all goods or services provided free to
individual households or collectively to the community by government units.
The non-market output produced by government units that is supplied free, or at prices
that are not economically significant, to other institutional units or the community as a
17
whole is valued by total production costs, including consumption of fixed capital6, plus
other taxes (less other subsidies) on production.
Output of
government =
Intermediate consumption + Compensation of employees +
Consumption of fixed capital + Other taxes (less subsidies) on
production
Basic prices exclude any taxes on products the producer receives from the purchaser and
passes on to government but include any subsidies the producer receives from
government and uses to lower the prices charged to purchasers.
The value of market output of government is given by its receipts from sales of market
products, the value of its non-market output is obtained residually as the difference
between the values of its total output (estimated on non-market basis) and its market
output.
The net operating surplus for government units is zero7. By convention, no net return to
capital is included for non-market production.
Expenditures by government on goods or services produced by market producers that are
provided directly to households, without any further processing, are not included in
intermediate consumption (therefore, also non-market output). They constitute final
consumption expenditures by government or NPISHs. Such goods and services in
question are treated as social transfers in kind and enter into the actual consumption of
households.
In the production account, the resources side includes market and non-market output and
on the use side, the intermediate consumption. The balancing item is gross value added.
If consumption of fixed capital is excluded, the balancing item will be the net value
added.
The net value added of government equals compensation of employees, plus other taxes
less subsidies on production, if any.
Distribution of income (The generation of income account)
The resource side of this account has only one entry, the gross/net value added, which is
the balancing item of the production account.
The use side of generation of income account for government has only two entries –
compensation of employees and consumption of fixed capital, besides other taxes and
subsidies on production, if any.
The balancing item of this account, gross operating surplus, is equal to consumption of
fixed capital. Net operating surplus is zero.
6 Consumption of fixed capital is the decline, during the course of the accounting period, in the current value of
the stock of fixed assets owned and used by a producer as a result of physical deterioration, normal obsolescence
or normal accidental damage. 7 It is possible for some government units undertaking market production to have net operating surplus.
18
Distribution of income (The allocation of primary income account)
Resources in this account, apart from operating surplus8, are taxes on production and
imports, subsidies (shown as negative) and property income.
The uses are property income payable in the form of interest and rent. The balancing
item is gross/net balance of primary incomes.
Receipts from taxes on production and imports (less subsidies on production and imports)
are treated as primary incomes of governments. These taxes on production and imports
appear under resources only for the general government sector and the total economy,
apart from any such taxes payable to foreign governments. Taxes on production and
imports are referred to as indirect taxes in some countries.
Taxes are compulsory, unrequited payments, in cash or in kind, made by institutional
units to government units. They are described as unrequited because the government
provides nothing in return to the individual unit making the payment, although
governments may use the funds raised in taxes to provide goods or services to other units,
either individually or collectively, or to the community as a whole.
Receipts on account of fees are treated as taxes, if it involves little or no work on the part
of government or the fees charged is clearly out of all proportion to the costs of providing
the services, they are treated as taxes. Otherwise, they are treated as purchases of services
from government.
Payments by persons or households for licences to own or use vehicles, boats or aircraft
and for licences for recreational hunting, shooting or fishing are treated as current taxes.
Payments for all other kinds of licences (for example, driving or pilot‘s licences,
television or radio licences, firearm licences, etc.) or fees to government (for example,
payments for passports, airport fees, court fees, etc.) are treated as purchases of services
rendered by governments.
Leases granted by government units to other institutional units permitting them to extract
mineral deposits over a specified period of time in return for the payment of rent, are
treated as rent in SNA. Enterprises engaged in exploration may make payments to the
owners of surface land in exchange for the right to make test drillings or investigate by
other means the existence and location of subsoil resources. Such payments are also to be
treated as rent even though no extraction is taking place.
Subsidies are made to enterprises on the basis of the levels of their production activities
or the quantities or values of the goods or services that they produce, sell or import. They
are not paid to final consumers; current transfers that governments make directly to
households as consumers are treated as social benefits. Subsidies also do not include
grants that governments may make to enterprises. Subsidies have the same impact as
negative taxes on production. While taxes have the effect of raising prices, subsidies
have the effect to lower the prices.
Primary incomes do not include current transfers, especially, payments of social
contributions to social insurance schemes and the receipt of benefits from them, or the
current taxes on income, wealth, etc.
8 This can be expressed in gross or net terms, the difference between the two is consumption of fixed capital.
19
The balancing item of this account is the gross/net balance of primary income (national
income for the overall economy).
Redistribution of income (The secondary distribution of income account)
Resources under this account include current transfers in the form of (i) current taxes on
income, wealth, etc., (ii) net social contributions9 and (iii) other current transfers
10.
Current taxes on income, wealth, etc. consist mainly of taxes on the incomes of
households or profits of corporations and of taxes on wealth. These are also sometimes
referred to as direct taxes in some countries.
The uses side of this account include current transfers in the form of social benefits11
other than social transfers in kind including social assistance12
benefits in cash ; and other
current transfers.
Social contributions are actual or imputed payments to social insurance schemes. They
are paid by (i) employers on behalf of their employees and (ii) households in their
capacity as employed, self-employed or unemployed persons. The employers‘
contributions are recorded as compensation of employees and therefore, form part of
balance of primary incomes ; whereas both employers‘ and households contributions
towards these schemes are recorded as payable by households and receivable by the units
responsible for the social insurance schemes, in the secondary distribution of income
account.
As employers‘ social contributions are made for the benefit of their employees, their
value is recorded as one of the components of compensation of employees together with
wages and salaries in cash and in kind. The social contributions (together with their own
contributions) are then recorded as being paid by the employees as current transfers to the
social security schemes or other employment-related social insurance schemes.
The balancing item of this account is the gross/net disposable income.
Redistribution of income (The redistribution of income account)
The resources here is the balancing item from the secondary distribution of income
account, namely, the gross/net disposable income.
9 Net social contributions include (i) employers‘ actual social contributions, (ii) employers' imputed social
contributions, (iii) households' actual social contributions and (iv)households‘ imputed social contributions 10
Other current transfers consist of all current transfers between resident institutional units, or between residents
and non-residents, except for current taxes on income, wealth, etc. and social contributions and benefits. 11
Social benefits are current transfers received by households intended to provide for the needs that arise from
certain events or circumstances. Benefits are divided into two groups, the first consists of pensions and the
second of all other benefits, described as non-pension benefits. These cover, for example, payments due in
respect of sickness, unemployment, housing, education or family circumstances. Social benefits may be
provided under social insurance schemes or by social assistance. 12
Social assistance is distinguished from social security in that eligibility to receive social assistance benefits is
not dependent on having elected to participate as demonstrated by the payment of contributions. Usually all
members of resident households are entitled to apply for social assistance but the conditions under which it is
granted are often restrictive.
20
The uses in this account include social transfers in kind that include both non-market
production and purchased market production. The whole of individual consumption of
general government is treated as social transfers in kind.
The balancing item in this account is called adjusted disposable income. For households,
adjusted disposable income is higher than disposable income; for government and
NPISHs, it is lower.
Use of income (Use of disposable income account)
The use of income account shows how the disposable income is allocated between final
consumption and saving. This is the last account under current accounts.
The resource in this account is the balancing item from the secondary distribution of
income account, namely, the gross/net disposable income.
The use is final consumption expenditure13
, which is sub-divided actual individual
consumption14
and actual collective consumption15
.
Adjustment for the change in pension entitlements is also recorded as a use.
The collective consumption represented by monetary policy services is recorded as
expenditure by general government but government does not incur the costs incurred by
the central bank. Therefore a current transfer of the value of the non-market output should
be recorded as payable by the central bank and receivable by the general government to
cover the purchase of the non-market output of the central bank by government. The non-
market output consists of monetary policy services, which are regarded as collective
consumption.
Final consumption expenditure of government is derived as:
Final
consumption
expenditure
of
government =
Value of all types of output of general government - value of output
for own account capital formation - value of sales of goods and
services + value of goods and services purchased from market
producers for delivery to households free or at economically
insignificant prices
The final consumption expenditures of general government can be classified:
a) According to whether the goods or services have been produced by market or non-
market producers;
b) According to whether the expenditures are on collective services or individual
goods or services;
c) By function or purpose according to the classification of the functions of
government (COFOG); or
d) By type of good or service according to the CPC.
The balancing item in this account is gross/net saving.
13
Final consumption expenditure is the amount of expenditure on consumption goods and services. 14
Consumption expenditures incurred for the benefit of individual households (social transfers in kind). 15
Consumption expenditure incurred for the benefit of community as a whole or large sections of community.
21
Use of income (Use of adjusted disposable income account)
The resource in this account is the balancing item from the redistribution of income
account, namely, the adjusted disposable income.
The main entry in the use side of the account is actual final consumption16
.
Adjustment for the change in pension entitlements is also recorded as a use.
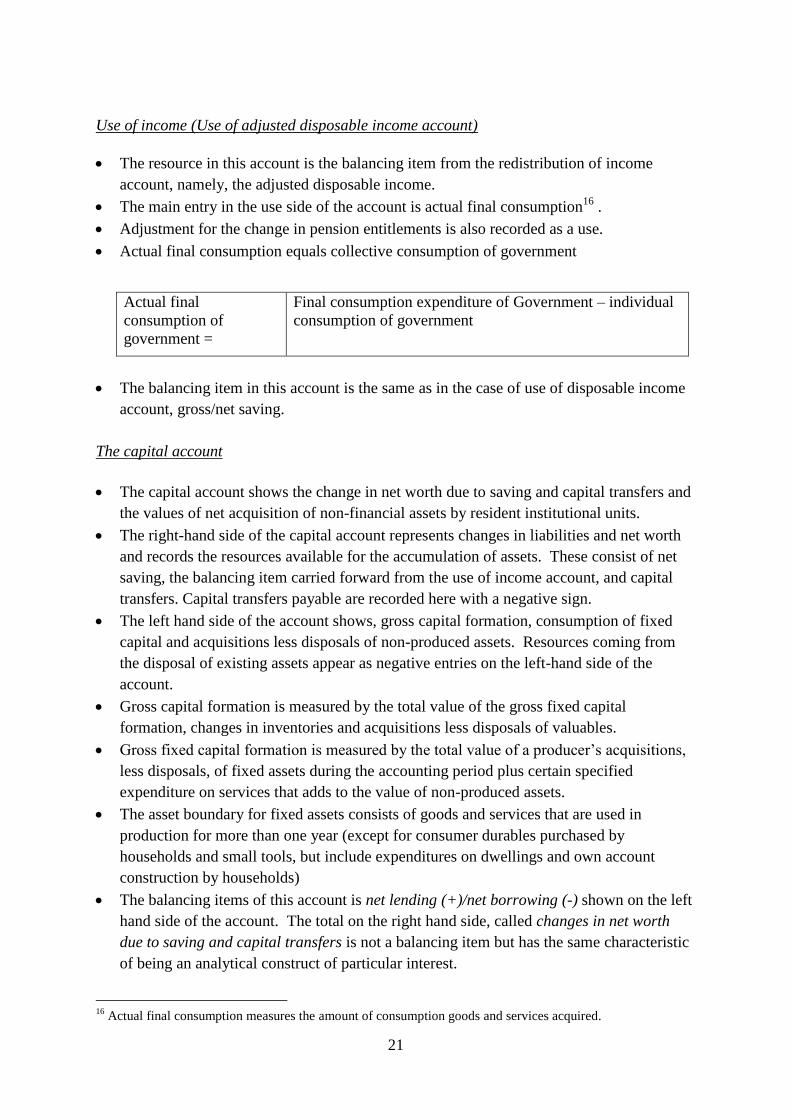
Actual final consumption equals collective consumption of government
Actual final
consumption of
government =
Final consumption expenditure of Government – individual
consumption of government
The balancing item in this account is the same as in the case of use of disposable income
account, gross/net saving.
The capital account
The capital account shows the change in net worth due to saving and capital transfers and
the values of net acquisition of non-financial assets by resident institutional units.
The right-hand side of the capital account represents changes in liabilities and net worth
and records the resources available for the accumulation of assets. These consist of net
saving, the balancing item carried forward from the use of income account, and capital
transfers. Capital transfers payable are recorded here with a negative sign.
The left hand side of the account shows, gross capital formation, consumption of fixed
capital and acquisitions less disposals of non-produced assets. Resources coming from
the disposal of existing assets appear as negative entries on the left-hand side of the
account.
Gross capital formation is measured by the total value of the gross fixed capital
formation, changes in inventories and acquisitions less disposals of valuables.
Gross fixed capital formation is measured by the total value of a producer‘s acquisitions,
less disposals, of fixed assets during the accounting period plus certain specified
expenditure on services that adds to the value of non-produced assets.
The asset boundary for fixed assets consists of goods and services that are used in
production for more than one year (except for consumer durables purchased by
households and small tools, but include expenditures on dwellings and own account
construction by households)
The balancing items of this account is net lending (+)/net borrowing (-) shown on the left
hand side of the account. The total on the right hand side, called changes in net worth
due to saving and capital transfers is not a balancing item but has the same characteristic
of being an analytical construct of particular interest.
16
Actual final consumption measures the amount of consumption goods and services acquired.
22
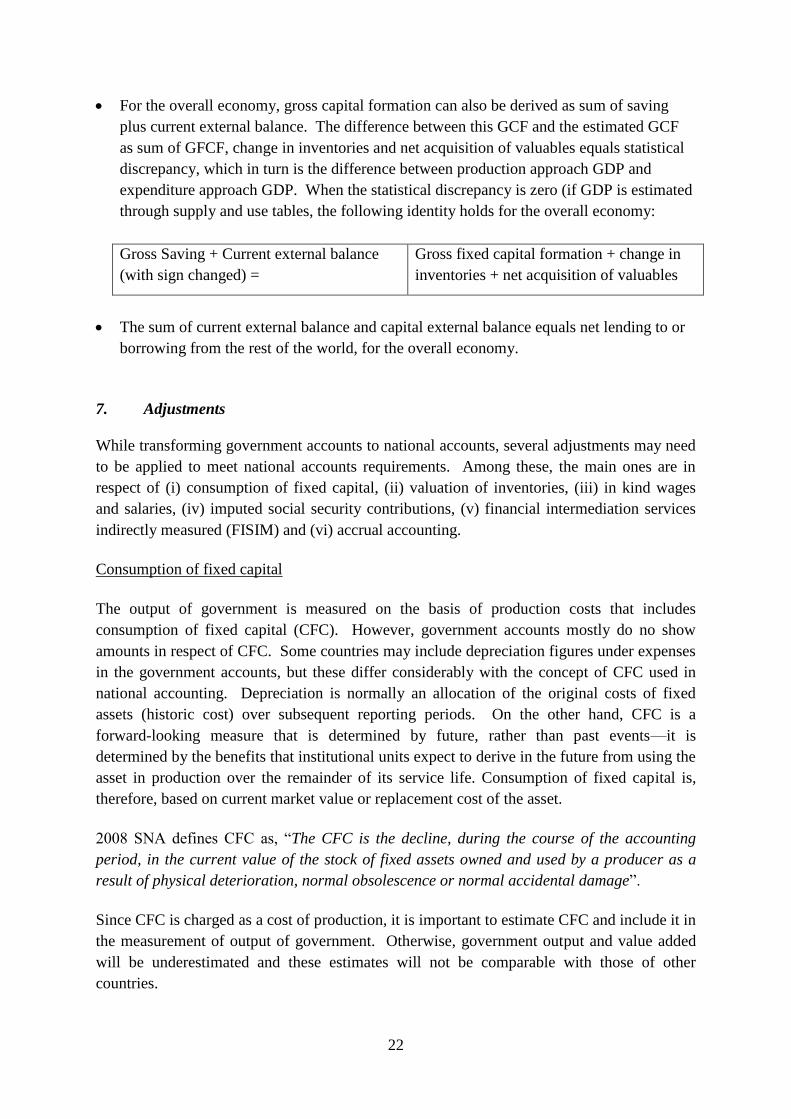
For the overall economy, gross capital formation can also be derived as sum of saving
plus current external balance. The difference between this GCF and the estimated GCF
as sum of GFCF, change in inventories and net acquisition of valuables equals statistical
discrepancy, which in turn is the difference between production approach GDP and
expenditure approach GDP. When the statistical discrepancy is zero (if GDP is estimated
through supply and use tables, the following identity holds for the overall economy:
Gross Saving + Current external balance
(with sign changed) =
Gross fixed capital formation + change in
inventories + net acquisition of valuables
The sum of current external balance and capital external balance equals net lending to or
borrowing from the rest of the world, for the overall economy.
7. Adjustments
While transforming government accounts to national accounts, several adjustments may need
to be applied to meet national accounts requirements. Among these, the main ones are in
respect of (i) consumption of fixed capital, (ii) valuation of inventories, (iii) in kind wages
and salaries, (iv) imputed social security contributions, (v) financial intermediation services
indirectly measured (FISIM) and (vi) accrual accounting.
Consumption of fixed capital
The output of government is measured on the basis of production costs that includes
consumption of fixed capital (CFC). However, government accounts mostly do no show
amounts in respect of CFC. Some countries may include depreciation figures under expenses
in the government accounts, but these differ considerably with the concept of CFC used in
national accounting. Depreciation is normally an allocation of the original costs of fixed
assets (historic cost) over subsequent reporting periods. On the other hand, CFC is a
forward-looking measure that is determined by future, rather than past events—it is
determined by the benefits that institutional units expect to derive in the future from using the
asset in production over the remainder of its service life. Consumption of fixed capital is,
therefore, based on current market value or replacement cost of the asset.
2008 SNA defines CFC as, ―The CFC is the decline, during the course of the accounting
period, in the current value of the stock of fixed assets owned and used by a producer as a
result of physical deterioration, normal obsolescence or normal accidental damage‖.
Since CFC is charged as a cost of production, it is important to estimate CFC and include it in
the measurement of output of government. Otherwise, government output and value added
will be underestimated and these estimates will not be comparable with those of other
countries.
23
CFC is estimated with respect to all fixed assets owned by government units, but not for
valuables (precious metals, precious stones, etc.), which are acquired precisely because their
value, in real terms, is not expected to decline over time. CFC also does not cover the
depletion or degradation of natural assets such as land, mineral or other deposits, coal, oil, or
natural gas, or contracts, leases, and licenses17
.
To compute CFC, fixed assets purchased in the past and still in use have to be revalued at the
average prices of the reference period and assumptions have to be made regarding the
remaining service lives of each asset and the rate at which their efficiency is expected to
diminish. Therefore, for estimating CFC, capital stock data are needed to be computed.
SNA recommends computing capital stock data indirectly through perpetual inventory
method (PIM). Basically the PIM writes down the value of all assets existing at the
beginning of the year in question by the reduction in their value during the year, eliminates
those assets that reach the end of their useful lives in the year and adds the written-down
value of assets acquired during the year. The computations include that the values of assets
are initially brought down to base year prices and after estimating capital stock using
information on average service lives at base year prices, are again revalued to the prices of
the current period by utilising appropriate price indices. Estimates of consumption of fixed
capital are obtained as a by-product of the PIM.
The steps involved in PIM are as follows:
Estimate what proportion of the fixed assets acquired in previous years has survived to
the current period. Average service lives, or survival functions, based on observations or
technical studies may be applied to past investments for this purpose.
Fixed assets purchased at different prices in the past have then to be revalued at the prices
of the current period by utilizing appropriate price indices for fixed assets.
The stock of fixed assets surviving from past investment and revalued at the purchasers‘
prices of the current period but before deduction of consumption of fixed capital is often
also described as the gross capital stock.
An approximate method of estimating CFC for general government in the absence of long
series data on capital formation with some assumptions, is presented in Annex.
The second issue regarding CFC is allocating the total CFC to different functions of
government. In these circumstances, approximations will have to be used. One possibility
may be to distribute consumption of fixed capital according to book value depreciation, if it is
available for detailed organizational units within government. Another approach would be to
distribute consumption of fixed capital among functions in proportion to the net acquisition
of fixed assets over a number of earlier years.
17
Changes in these assets are recorded in other changes in the volume of assets
24
Valuation of inventories
Inventories are produced assets that consist of goods and services, which came into existence
in the current period or in an earlier period, and that are held for sale, use in production or
other use at a later date. Changes in inventories are measured by the value of the entries into
inventories less the value of withdrawals and less the value of any recurrent losses of goods
held in inventories during the accounting period.
The Adjustments in the case of inventories relate to using the available data on inventories
(source data is usually on historic costs, i.e., at the price of the goods when they were
purchased) to estimate change in inventories and capital/holding gains/losses. This is because
in national accounting, a withdrawal from stock must be valued at the prevailing market price
at the time of withdrawal from inventories, since goods and services used for intermediate
consumption can come from market purchases or inventories and they all must be valued at
the same current market prices. Similarly, the output produced by the producer may either be
sold or otherwise disposed of or be transferred to inventories as finished products or work-in-
progress. In order to ensure that output is consistently valued, finished goods transferred into
inventories are valued as if they were sold at that time, while additions to work-in-progress
are given the value they have at the time they are added to inventories.
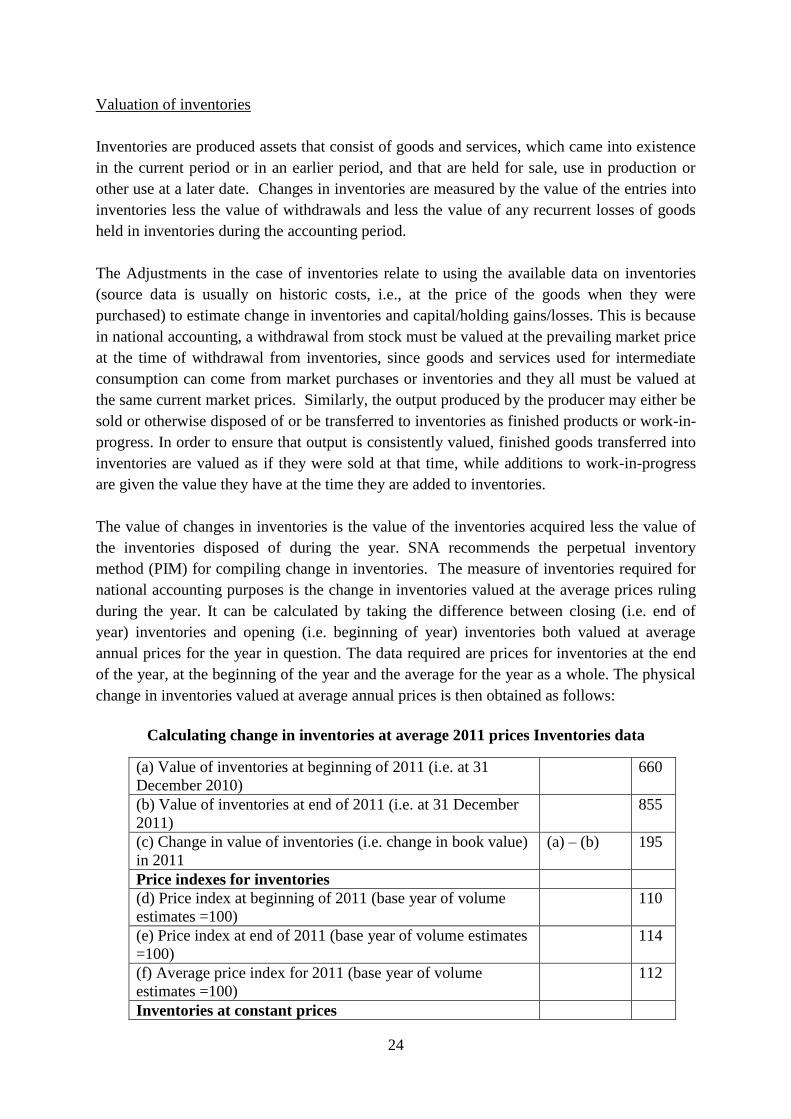
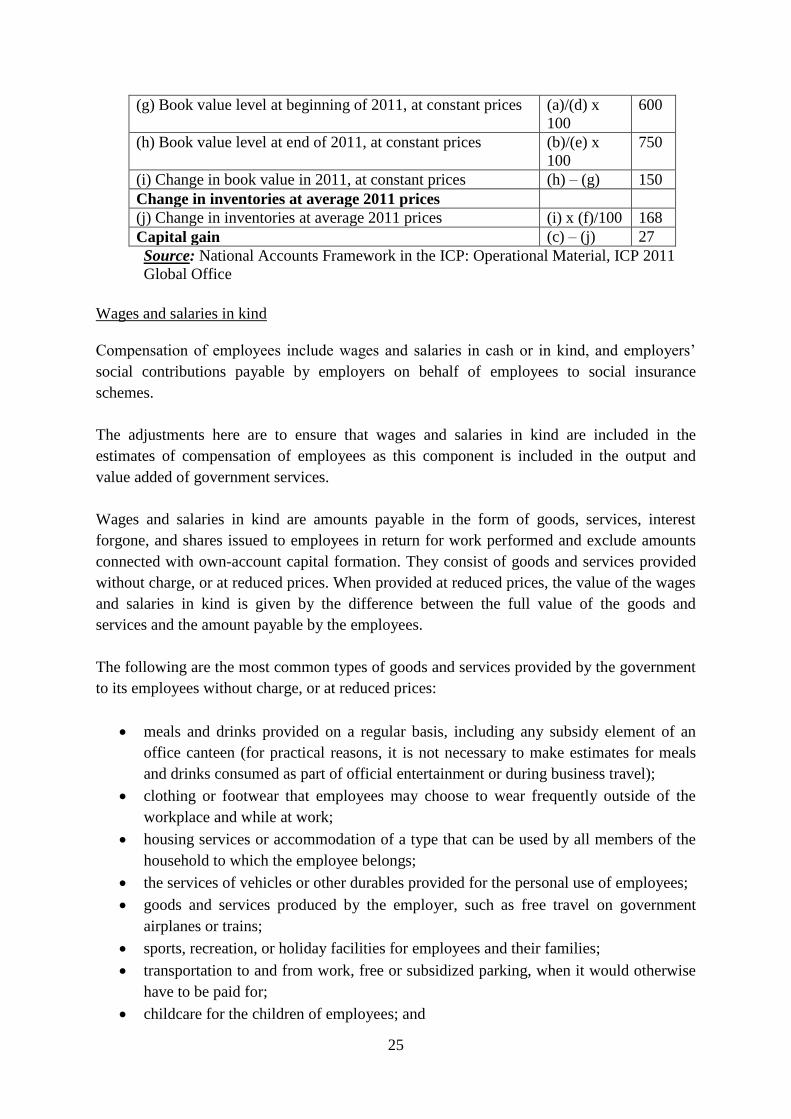
The value of changes in inventories is the value of the inventories acquired less the value of
the inventories disposed of during the year. SNA recommends the perpetual inventory
method (PIM) for compiling change in inventories. The measure of inventories required for
national accounting purposes is the change in inventories valued at the average prices ruling
during the year. It can be calculated by taking the difference between closing (i.e. end of
year) inventories and opening (i.e. beginning of year) inventories both valued at average
annual prices for the year in question. The data required are prices for inventories at the end
of the year, at the beginning of the year and the average for the year as a whole. The physical
change in inventories valued at average annual prices is then obtained as follows:
Calculating change in inventories at average 2011 prices Inventories data
(a) Value of inventories at beginning of 2011 (i.e. at 31
December 2010)
660
(b) Value of inventories at end of 2011 (i.e. at 31 December
2011)
855
(c) Change in value of inventories (i.e. change in book value)
in 2011
(a) – (b) 195
Price indexes for inventories
(d) Price index at beginning of 2011 (base year of volume
estimates =100)
110
(e) Price index at end of 2011 (base year of volume estimates
=100)
114
(f) Average price index for 2011 (base year of volume
estimates =100)
112
Inventories at constant prices
25
(g) Book value level at beginning of 2011, at constant prices (a)/(d) x
100
600
(h) Book value level at end of 2011, at constant prices (b)/(e) x
100
750
(i) Change in book value in 2011, at constant prices (h) – (g) 150
Change in inventories at average 2011 prices
(j) Change in inventories at average 2011 prices (i) x (f)/100 168
Capital gain (c) – (j) 27
Source: National Accounts Framework in the ICP: Operational Material, ICP 2011
Global Office
Wages and salaries in kind
Compensation of employees include wages and salaries in cash or in kind, and employers‘
social contributions payable by employers on behalf of employees to social insurance
schemes.
The adjustments here are to ensure that wages and salaries in kind are included in the
estimates of compensation of employees as this component is included in the output and
value added of government services.
Wages and salaries in kind are amounts payable in the form of goods, services, interest
forgone, and shares issued to employees in return for work performed and exclude amounts
connected with own-account capital formation. They consist of goods and services provided
without charge, or at reduced prices. When provided at reduced prices, the value of the wages
and salaries in kind is given by the difference between the full value of the goods and
services and the amount payable by the employees.
The following are the most common types of goods and services provided by the government
to its employees without charge, or at reduced prices:
meals and drinks provided on a regular basis, including any subsidy element of an
office canteen (for practical reasons, it is not necessary to make estimates for meals
and drinks consumed as part of official entertainment or during business travel);
clothing or footwear that employees may choose to wear frequently outside of the
workplace and while at work;
housing services or accommodation of a type that can be used by all members of the
household to which the employee belongs;
the services of vehicles or other durables provided for the personal use of employees;
goods and services produced by the employer, such as free travel on government
airplanes or trains;
sports, recreation, or holiday facilities for employees and their families;
transportation to and from work, free or subsidized parking, when it would otherwise
have to be paid for;
childcare for the children of employees; and
26
the value of the interest foregone by employers when they provide loans to employees
at reduced, or even zero rates of interest for purposes of buying houses, vehicles,
furniture, or other goods or services (these amounts are also recorded as interest
receivable).
Some of these services, such as transportation to and from work, parking, clothing, etc. are
provided because of the nature of the production process or the physical conditions under
which employees have to work. Such expenses are not wages in kind, but are intermediate
consumption of government.
Imputed social security contributions
Employers‘ social contributions are social contributions payable by employers, to social
security funds, employment-related pension funds, or other employment-related social
insurance schemes to obtain entitlement to social benefits for their employees. These include
(i) actual employers‘ social contributions and (ii) imputed employers‘ social contributions.
Such contributions form part of compensation of employees. Though these contributions are
not directly paid to employees, they are rerouted, first to the employees and then from the
employees to the social insurance schemes.
Imputed employers‘ social contributions are the amounts calculated and added to actual
contributions, sufficient to exactly match the increases in employees‘ social benefit
entitlements. These imputed employers‘ social contributions may relate to pension and to
non-pension benefits.
Some government units provide employment related non-pension social benefits directly to
their employees, former employees, or dependents out of their own resources without
involving an insurance enterprise. The values of these benefits during the current year should
be imputed based on de facto entitlements using actuarial methods that are normally used by
insurance enterprises to determine the levels of premiums charged. In practice, however, it
may be difficult to decide how large such imputed contributions should be. The government
sector unit may make estimates, perhaps on the basis of the contributions payable into similar
funded schemes, in order to calculate its likely liabilities in the future, and such estimates
may be used when available. Otherwise, the only practical alternative may be to use the
unfunded non-pension benefits payable by the unit during the same reporting period as an
estimate of the imputed expense that would be needed to cover the imputed contributions.
Imputed employers‘ social contributions to employment-related pension benefits depend
upon the type of pension scheme the government unit operates, especially in the case of
defined-benefit pension scheme. In this case the imputed contribution is equal to the increase
in benefits payable due to current period employment plus the costs of operating the scheme
minus the sum of the government‘s actual contribution and the sum of any contributions by
the employees. The level of the employer‘s contribution should be determined by assessing
the increase in the net present value of the pension entitlement the employee has earned in the
27
period in question, adding any costs charged by the pension fund for operating the scheme
and deducting the amount of any contribution the employee makes this amount. This amount
should be determined actuarially, taking into account only the life expectancy of the
employee and not any future earnings or the impact of any future pay increases on the
ultimate pension benefit.
Financial intermediation services indirectly measured (FISIM)
FISIM allocated to the general government sector forms part of its intermediate consumption.
Since this is an imputed estimate, these values may not be recorded in government accounts.
Therefore, FISIM allocated to general government sector needs to be included in the
intermediate consumption (and hence output) of government. Inclusion of FISIM, however,
does not alter the value added estimates of general government, as both intermediate
consumption and output are increased by the same amount of FISIM for non-market
producers.
The first stage in allocating FISIM to producers (industries/sectors) and final users is to
estimate the amount of FISIM earned by resident intermediaries payable by borrowers and
the amount payable by lenders. The 1993 SNA calculated FISIM as the difference between
property income receivable and interest payable. This method is still followed in several
countries. The 2008 SNA estimates the charges for FISIM as difference between the rate
paid to banks by borrowers and reference rate plus the difference between the reference rate
and the rate actually paid to depositors. The amounts of interest recorded in the SNA are
calculated as the reference rate times the level of loan or deposit in question (called SNA
interest). The difference between these amounts and the amounts actually paid to the
financial institution (called bank interest) are recorded as service charges paid by the
borrower or depositor to the financial institution. The implicit service charge is thus the sum
of the bank interest on loans less the SNA interest on the same loans plus the SNA interest on
deposits less the bank interest on the same deposits. The service charge is payable by or to the
unit in receipt of the loan or owning the deposit as appropriate.
The reference rate to be used in the calculation of SNA interest is a rate between bank interest
rates on deposits and loans. However, because there is no necessary equality between the
level of loans and deposits, it cannot be calculated as a simple average of the rates on loans or
deposits. The reference rate should contain no service element and reflect the risk and
maturity structure of deposits and loans. The rate prevailing for inter-bank borrowing and
lending may be a suitable choice as a reference rate.
FISIM is allocated to all institutional units borrowing from and lending to resident financial
intermediaries. The value of FISIM earned is in relation to interest. The value of FISIM
produced by resident financial intermediaries represents output and that coming from the rest
of the world represents imports. The total supply of FISIM is thus the total of these two
amounts. The FISIM paid by non-resident borrowers and lenders to resident financial
intermediaries represents exports. Payments by non-financial corporations, NPISHs and
28
general government represent intermediate consumption. No FISIM is consumed by financial
intermediaries themselves, though inter-bank lending could give rise to a non-zero allocation
of FISIM to financial corporations.
Accrual accounting
In many countries, government units still apply cash accounting. International statistical
guidelines and accounting standards have adopted the accrual basis of recording. Although an
increasing number of governments have adopted accrual recording, many countries still use
various mixes of source data based on cash- and accrual-based accounts. The differences in
time lags between the economic events and the associated cash flows could distort the
assessment of fiscal stance during a given year if a cash basis of accounting is mainly used. It
is, therefore, preferable that fiscal targets include both cash and accrual measures. If no
accrual source data are available, the African countries should agree on the methodology used
to estimate the adjustments to convert cash data into accrual data. In practice, the adjustments
required are especially relevant for taxes, social contributions, and interest.
8. Compilation of national accounts from government accounts
Government budgets/accounts include several sub-accounts (such as consolidated fund,
charge fund, development fund, etc.) categorised under different accounting heads (current
and capital receipts and current and capital expenditures, etc.). The detailed item-wise
revenues and expenses are shown against country specific ledger codes or simply under
different descriptive items. The extent of details available in the government accounts vastly
differs across countries. It is, therefore, difficult to identify a model budget that fits into all
African country practices for the purpose of illustrating the transformation of government
accounts to national accounts. In this chapter, the model budget used is from the publication
Eurostat handbook Essential SNA: Building the basics, 2013 (Chapter 5).
The government finance presentation consists of transactions that increase net worth leading
to an aggregate called revenue and transactions that decrease net worth leading to the
aggregate called expense. In addition there are two main balancing items, net operating
balance and net lending or net borrowing.
Broadly, revenues comprise, taxes, social contributions including grants, other current
revenue (property income, market sales of goods and services, fines, penalties and forfeits,
voluntary transfers, miscellaneous and unidentified revenue) and capital transfers receivable.
In addition there can be receipts from capital and financial operations. Expenses cover,
production expenses (compensation of employees, intermediate consumption and
consumption of fixed capital), interest payable, grants, social benefits, other current expenses
and capital transfers payable. In addition, there are can be expenses towards capital and
financial operations including loans or repayment of loans. Outlays is another item presented
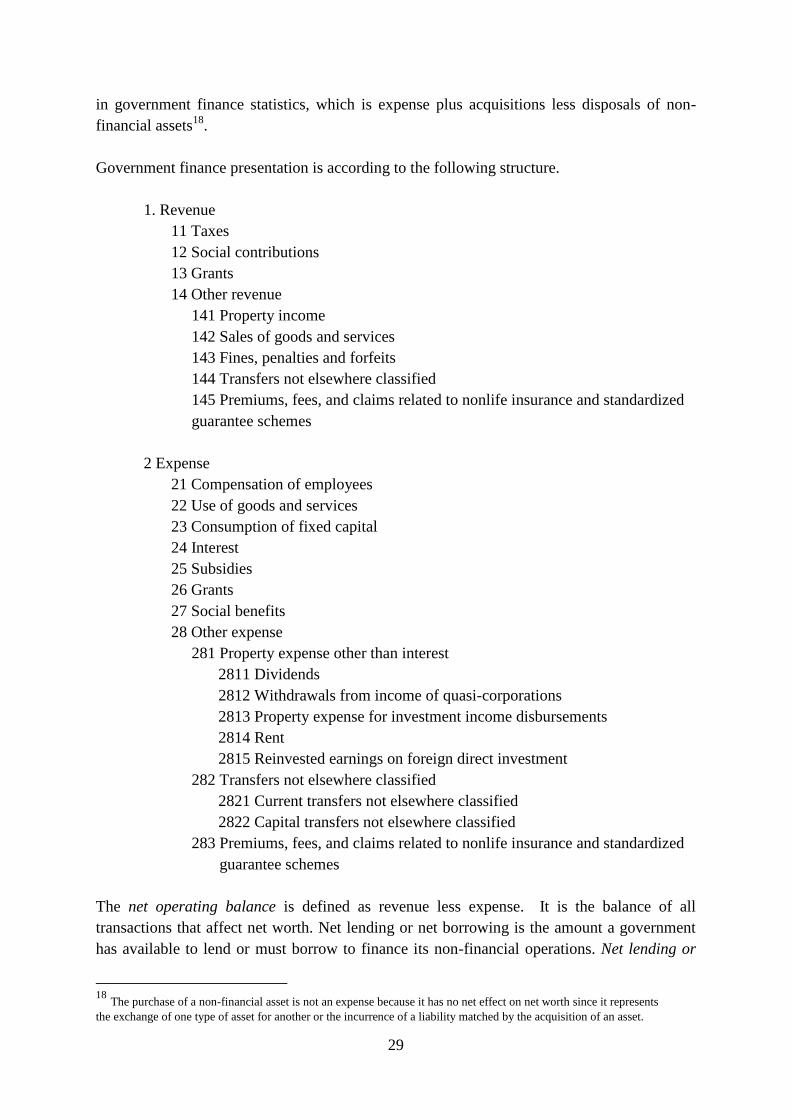
29
in government finance statistics, which is expense plus acquisitions less disposals of non-
financial assets18
.
Government finance presentation is according to the following structure.
1. Revenue
11 Taxes
12 Social contributions
13 Grants
14 Other revenue
141 Property income
142 Sales of goods and services
143 Fines, penalties and forfeits
144 Transfers not elsewhere classified
145 Premiums, fees, and claims related to nonlife insurance and standardized
guarantee schemes
2 Expense
21 Compensation of employees
22 Use of goods and services
23 Consumption of fixed capital
24 Interest
25 Subsidies
26 Grants
27 Social benefits
28 Other expense
281 Property expense other than interest
2811 Dividends
2812 Withdrawals from income of quasi-corporations
2813 Property expense for investment income disbursements
2814 Rent
2815 Reinvested earnings on foreign direct investment
282 Transfers not elsewhere classified
2821 Current transfers not elsewhere classified
2822 Capital transfers not elsewhere classified
283 Premiums, fees, and claims related to nonlife insurance and standardized
guarantee schemes
The net operating balance is defined as revenue less expense. It is the balance of all
transactions that affect net worth. Net lending or net borrowing is the amount a government
has available to lend or must borrow to finance its non-financial operations. Net lending or
18
The purchase of a non-financial asset is not an expense because it has no net effect on net worth since it represents
the exchange of one type of asset for another or the incurrence of a liability matched by the acquisition of an asset.
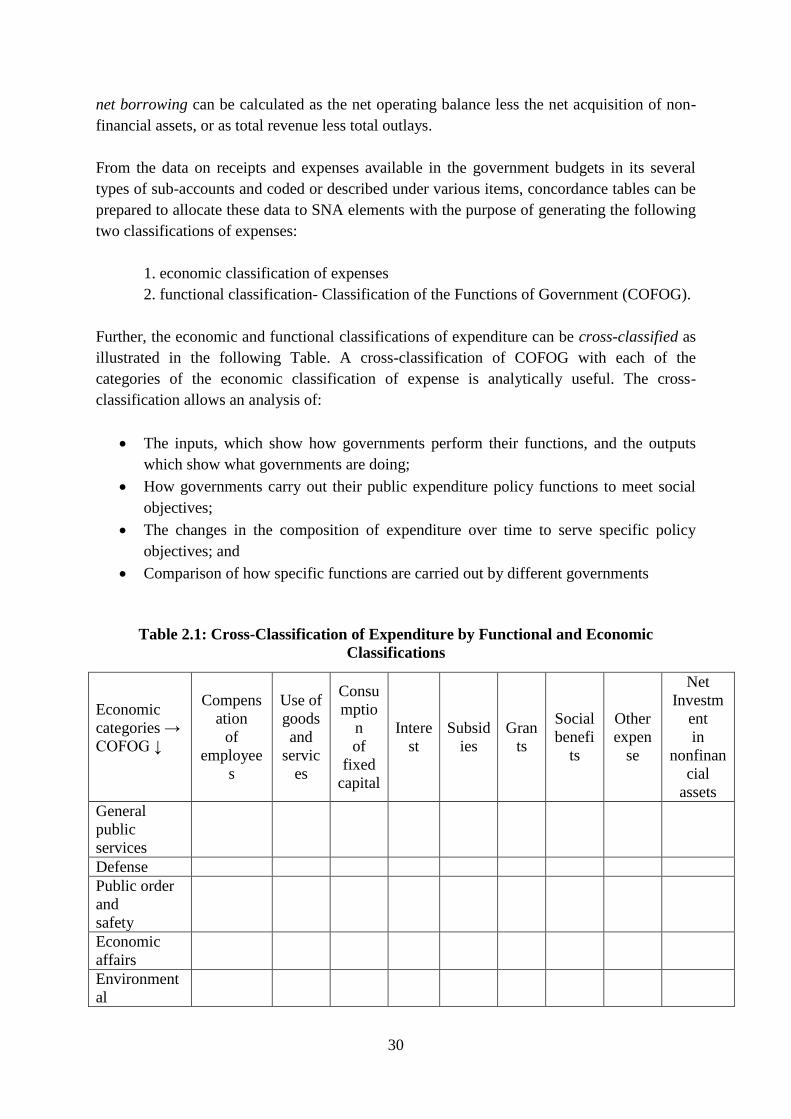
30
net borrowing can be calculated as the net operating balance less the net acquisition of non-
financial assets, or as total revenue less total outlays.
From the data on receipts and expenses available in the government budgets in its several
types of sub-accounts and coded or described under various items, concordance tables can be
prepared to allocate these data to SNA elements with the purpose of generating the following
two classifications of expenses:
1. economic classification of expenses
2. functional classification- Classification of the Functions of Government (COFOG).
Further, the economic and functional classifications of expenditure can be cross-classified as
illustrated in the following Table. A cross-classification of COFOG with each of the
categories of the economic classification of expense is analytically useful. The cross-
classification allows an analysis of:
The inputs, which show how governments perform their functions, and the outputs
which show what governments are doing;
How governments carry out their public expenditure policy functions to meet social
objectives;
The changes in the composition of expenditure over time to serve specific policy
objectives; and
Comparison of how specific functions are carried out by different governments
Table 2.1: Cross-Classification of Expenditure by Functional and Economic
Classifications
Economic
categories →
COFOG ↓
Compens
ation
of
employee
s
Use of
goods
and
servic
es
Consu
mptio
n
of
fixed
capital
Intere
st
Subsid
ies
Gran
ts
Social
benefi
ts
Other
expen
se
Net
Investm
ent
in
nonfinan
cial
assets
General
public
services
Defense
Public order
and
safety
Economic
affairs
Environment
al
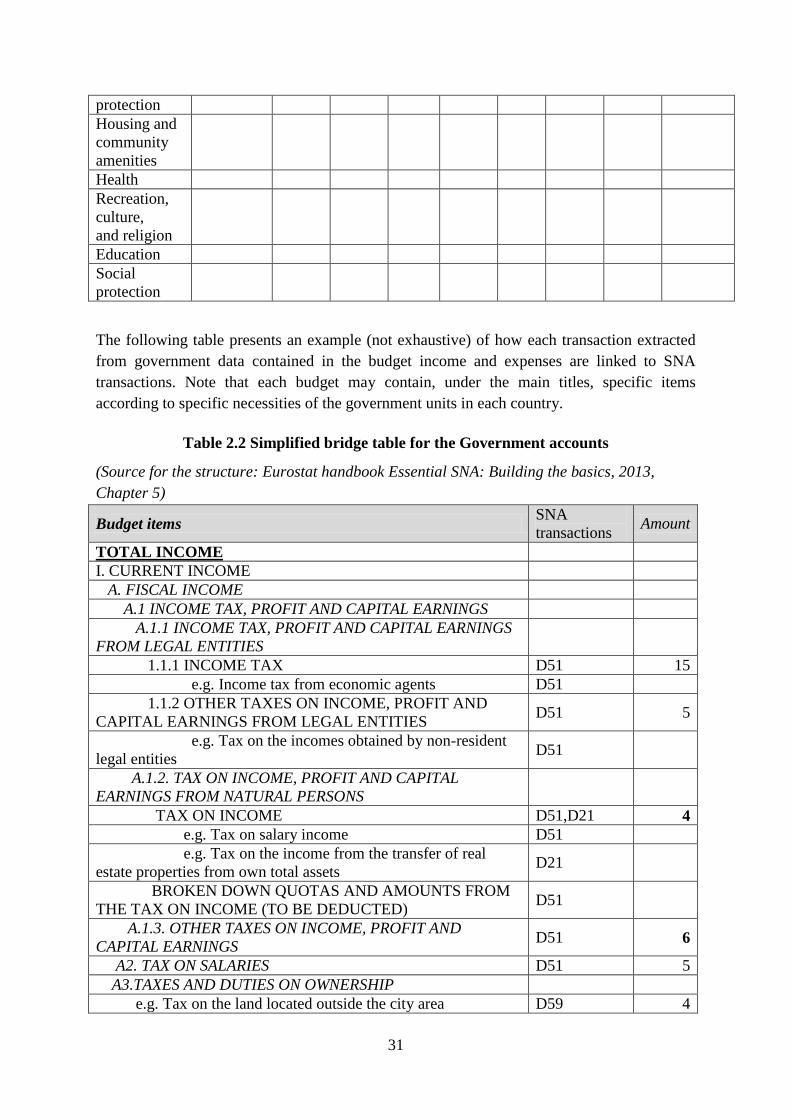
31
protection
Housing and
community
amenities
Health
Recreation,
culture,
and religion
Education
Social
protection
The following table presents an example (not exhaustive) of how each transaction extracted
from government data contained in the budget income and expenses are linked to SNA
transactions. Note that each budget may contain, under the main titles, specific items
according to specific necessities of the government units in each country.
Table 2.2 Simplified bridge table for the Government accounts
(Source for the structure: Eurostat handbook Essential SNA: Building the basics, 2013,
Chapter 5)
Budget items SNA
transactions Amount
TOTAL INCOME
I. CURRENT INCOME
A. FISCAL INCOME
A.1 INCOME TAX, PROFIT AND CAPITAL EARNINGS
A.1.1 INCOME TAX, PROFIT AND CAPITAL EARNINGS
FROM LEGAL ENTITIES
1.1.1 INCOME TAX D51 15
e.g. Income tax from economic agents D51
1.1.2 OTHER TAXES ON INCOME, PROFIT AND
CAPITAL EARNINGS FROM LEGAL ENTITIES D51 5
e.g. Tax on the incomes obtained by non-resident
legal entities D51
A.1.2. TAX ON INCOME, PROFIT AND CAPITAL
EARNINGS FROM NATURAL PERSONS
TAX ON INCOME D51,D21 4
e.g. Tax on salary income D51
e.g. Tax on the income from the transfer of real
estate properties from own total assets D21
BROKEN DOWN QUOTAS AND AMOUNTS FROM
THE TAX ON INCOME (TO BE DEDUCTED) D51
A.1.3. OTHER TAXES ON INCOME, PROFIT AND
CAPITAL EARNINGS D51 6
A2. TAX ON SALARIES D51 5
A3.TAXES AND DUTIES ON OWNERSHIP
e.g. Tax on the land located outside the city area D59 4
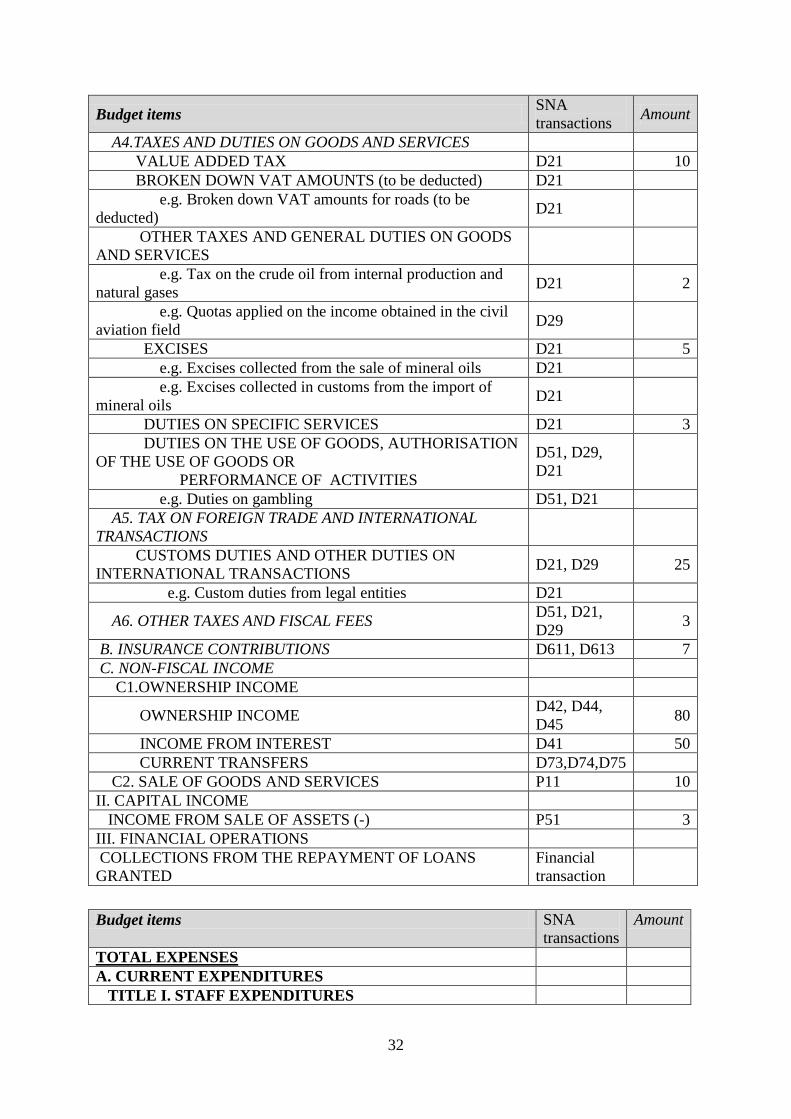
32
Budget items SNA
transactions Amount
A4.TAXES AND DUTIES ON GOODS AND SERVICES
VALUE ADDED TAX D21 10
BROKEN DOWN VAT AMOUNTS (to be deducted) D21
e.g. Broken down VAT amounts for roads (to be
deducted) D21
OTHER TAXES AND GENERAL DUTIES ON GOODS
AND SERVICES
e.g. Tax on the crude oil from internal production and
natural gases D21 2
e.g. Quotas applied on the income obtained in the civil
aviation field D29
EXCISES D21 5
e.g. Excises collected from the sale of mineral oils D21
e.g. Excises collected in customs from the import of
mineral oils D21
DUTIES ON SPECIFIC SERVICES D21 3
DUTIES ON THE USE OF GOODS, AUTHORISATION
OF THE USE OF GOODS OR
PERFORMANCE OF ACTIVITIES
D51, D29,
D21
e.g. Duties on gambling D51, D21
A5. TAX ON FOREIGN TRADE AND INTERNATIONAL
TRANSACTIONS
CUSTOMS DUTIES AND OTHER DUTIES ON
INTERNATIONAL TRANSACTIONS D21, D29 25
e.g. Custom duties from legal entities D21
A6. OTHER TAXES AND FISCAL FEES D51, D21,
D29 3
B. INSURANCE CONTRIBUTIONS D611, D613 7
C. NON-FISCAL INCOME
C1.OWNERSHIP INCOME
OWNERSHIP INCOME D42, D44,
D45 80
INCOME FROM INTEREST D41 50
CURRENT TRANSFERS D73,D74,D75
C2. SALE OF GOODS AND SERVICES P11 10
II. CAPITAL INCOME
INCOME FROM SALE OF ASSETS (-) P51 3
III. FINANCIAL OPERATIONS
COLLECTIONS FROM THE REPAYMENT OF LOANS
GRANTED
Financial
transaction
Budget items SNA
transactions
Amount
TOTAL EXPENSES
A. CURRENT EXPENDITURES
TITLE I. STAFF EXPENDITURES
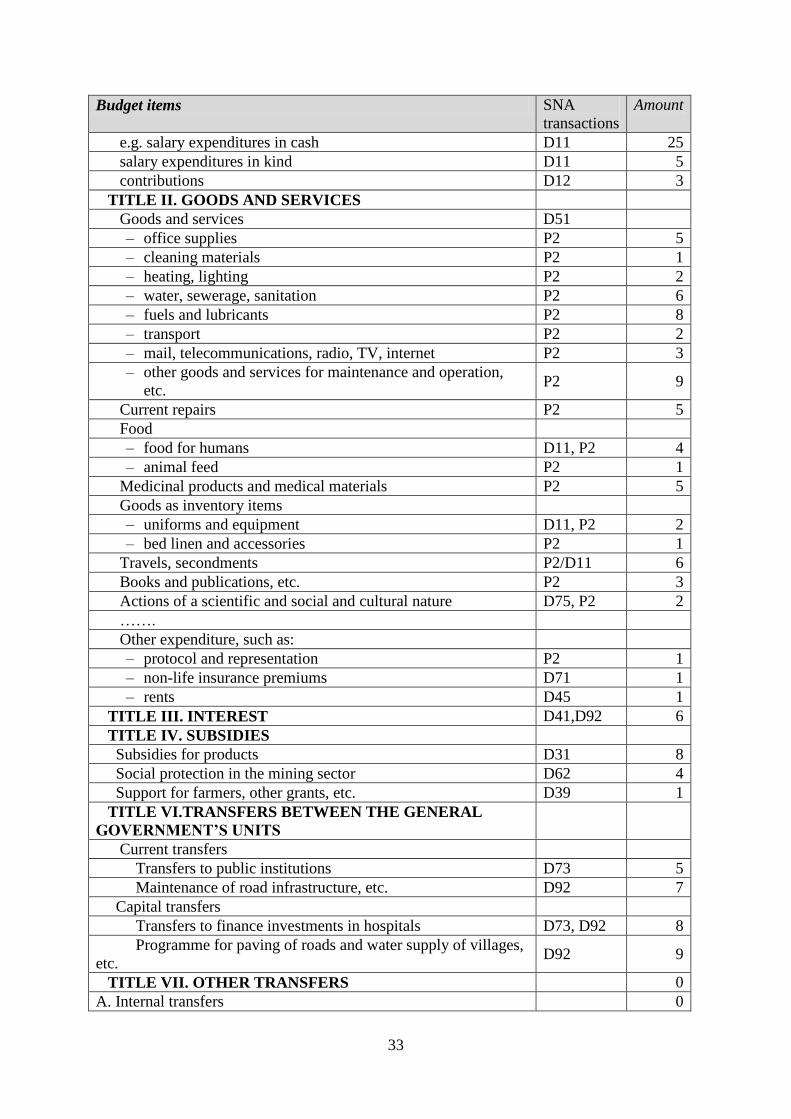
33
Budget items SNA
transactions
Amount
e.g. salary expenditures in cash D11 25
salary expenditures in kind D11 5
contributions D12 3
TITLE II. GOODS AND SERVICES
Goods and services D51
– office supplies P2 5
– cleaning materials P2 1
– heating, lighting P2 2
– water, sewerage, sanitation P2 6
– fuels and lubricants P2 8
– transport P2 2
– mail, telecommunications, radio, TV, internet P2 3
– other goods and services for maintenance and operation,
etc. P2 9
Current repairs P2 5
Food
– food for humans D11, P2 4
– animal feed P2 1
Medicinal products and medical materials P2 5
Goods as inventory items
– uniforms and equipment D11, P2 2
– bed linen and accessories P2 1
Travels, secondments P2/D11 6
Books and publications, etc. P2 3
Actions of a scientific and social and cultural nature D75, P2 2
…….
Other expenditure, such as:
– protocol and representation P2 1
– non-life insurance premiums D71 1
– rents D45 1
TITLE III. INTEREST D41,D92 6
TITLE IV. SUBSIDIES
Subsidies for products D31 8
Social protection in the mining sector D62 4
Support for farmers, other grants, etc. D39 1
TITLE VI.TRANSFERS BETWEEN THE GENERAL
GOVERNMENT’S UNITS
Current transfers
Transfers to public institutions D73 5
Maintenance of road infrastructure, etc. D92 7
Capital transfers
Transfers to finance investments in hospitals D73, D92 8
Programme for paving of roads and water supply of villages,
etc. D92 9
TITLE VII. OTHER TRANSFERS 0
A. Internal transfers 0
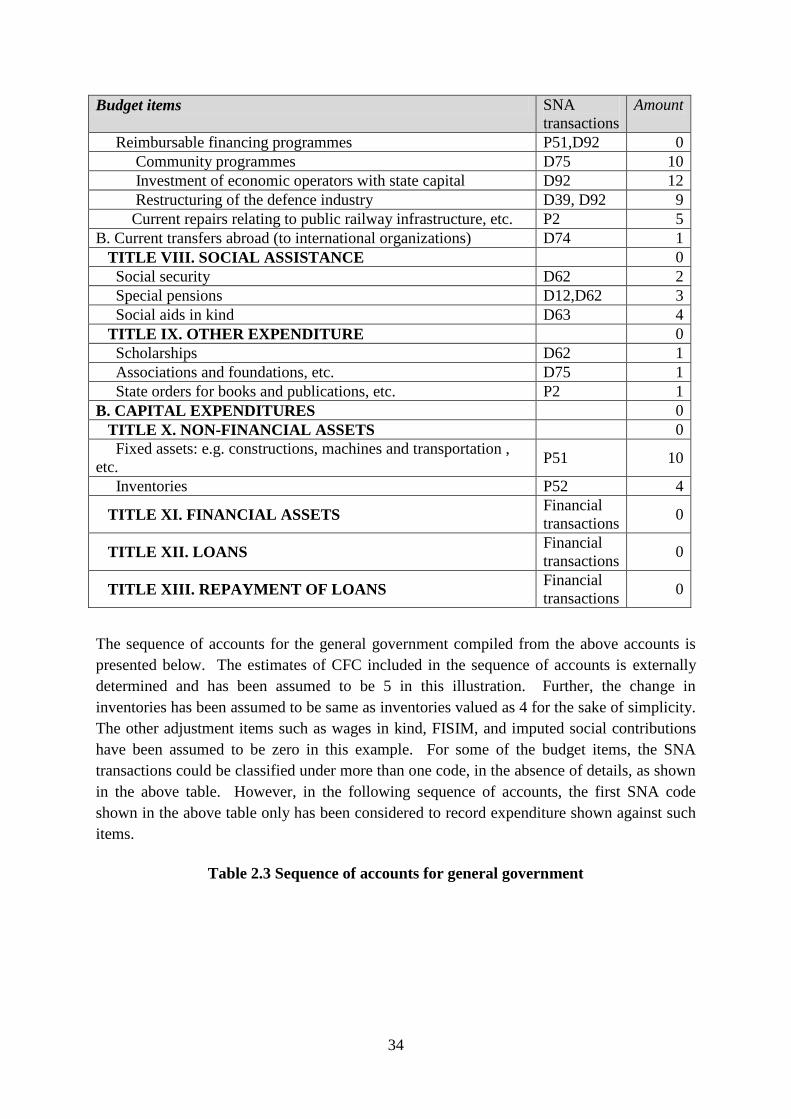
34
Budget items SNA
transactions
Amount
Reimbursable financing programmes P51,D92 0
Community programmes D75 10
Investment of economic operators with state capital D92 12
Restructuring of the defence industry D39, D92 9
Current repairs relating to public railway infrastructure, etc. P2 5
B. Current transfers abroad (to international organizations) D74 1
TITLE VIII. SOCIAL ASSISTANCE 0
Social security D62 2
Special pensions D12,D62 3
Social aids in kind D63 4
TITLE IX. OTHER EXPENDITURE 0
Scholarships D62 1
Associations and foundations, etc. D75 1
State orders for books and publications, etc. P2 1
B. CAPITAL EXPENDITURES 0
TITLE X. NON-FINANCIAL ASSETS 0
Fixed assets: e.g. constructions, machines and transportation ,
etc. P51 10
Inventories P52 4
TITLE XI. FINANCIAL ASSETS Financial
transactions 0
TITLE XII. LOANS Financial
transactions 0
TITLE XIII. REPAYMENT OF LOANS Financial
transactions 0
The sequence of accounts for the general government compiled from the above accounts is
presented below. The estimates of CFC included in the sequence of accounts is externally
determined and has been assumed to be 5 in this illustration. Further, the change in
inventories has been assumed to be same as inventories valued as 4 for the sake of simplicity.
The other adjustment items such as wages in kind, FISIM, and imputed social contributions
have been assumed to be zero in this example. For some of the budget items, the SNA
transactions could be classified under more than one code, in the absence of details, as shown
in the above table. However, in the following sequence of accounts, the first SNA code
shown in the above table only has been considered to record expenditure shown against such
items.
Table 2.3 Sequence of accounts for general government
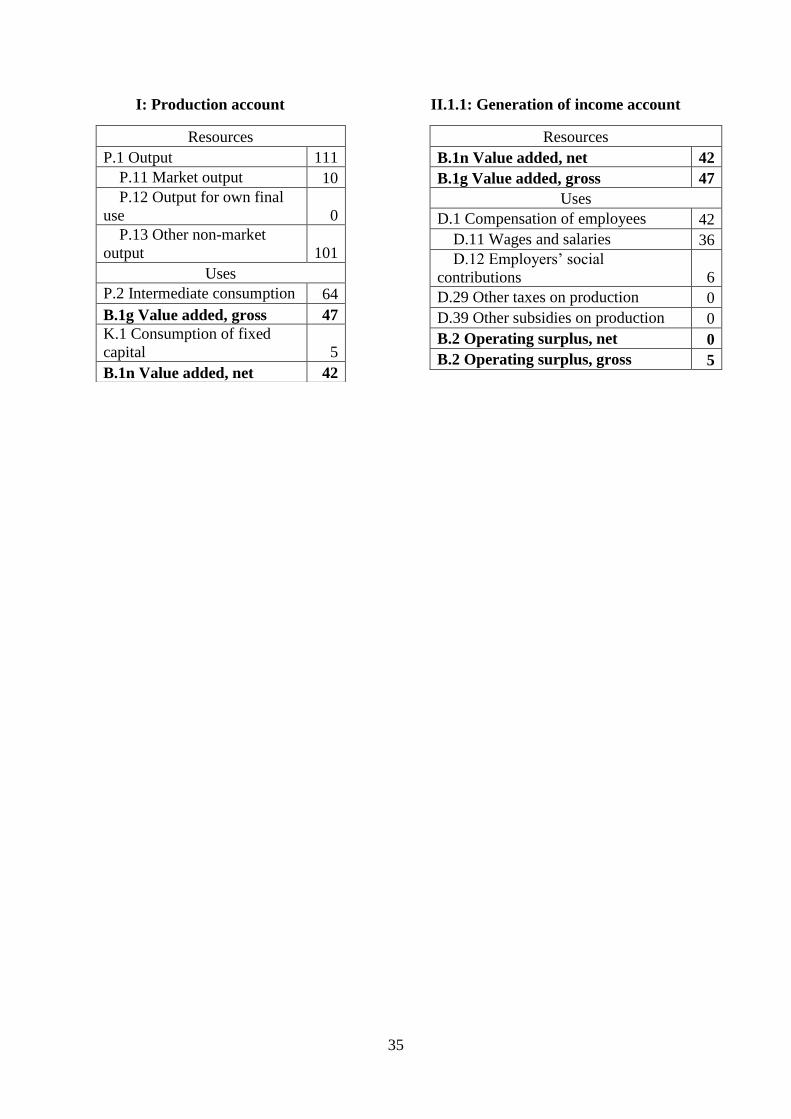
35
I: Production account
Resources
P.1 Output 111
P.11 Market output 10
P.12 Output for own final
use 0
P.13 Other non-market
output 101
Uses
P.2 Intermediate consumption 64
B.1g Value added, gross 47
K.1 Consumption of fixed
capital 5
B.1n Value added, net 42
II.1.1: Generation of income account
Resources
B.1n Value added, net 42
B.1g Value added, gross 47
Uses
D.1 Compensation of employees 42
D.11 Wages and salaries 36
D.12 Employers‘ social
contributions 6
D.29 Other taxes on production 0
D.39 Other subsidies on production 0
B.2 Operating surplus, net 0
B.2 Operating surplus, gross 5
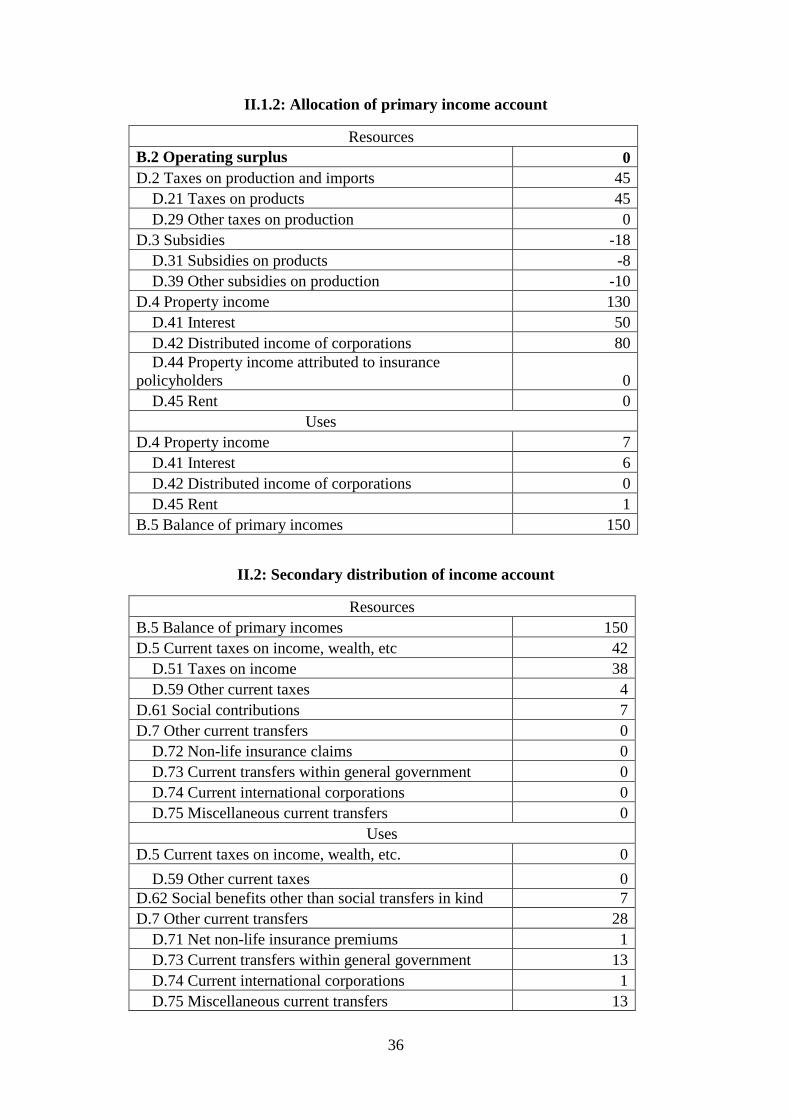
36
II.1.2: Allocation of primary income account
Resources
B.2 Operating surplus 0
D.2 Taxes on production and imports 45
D.21 Taxes on products 45
D.29 Other taxes on production 0
D.3 Subsidies -18
D.31 Subsidies on products -8
D.39 Other subsidies on production -10
D.4 Property income 130
D.41 Interest 50
D.42 Distributed income of corporations 80
D.44 Property income attributed to insurance
policyholders 0
D.45 Rent 0
Uses
D.4 Property income 7
D.41 Interest 6
D.42 Distributed income of corporations 0
D.45 Rent 1
B.5 Balance of primary incomes 150
II.2: Secondary distribution of income account
Resources
B.5 Balance of primary incomes 150
D.5 Current taxes on income, wealth, etc 42
D.51 Taxes on income 38
D.59 Other current taxes 4
D.61 Social contributions 7
D.7 Other current transfers 0
D.72 Non-life insurance claims 0
D.73 Current transfers within general government 0
D.74 Current international corporations 0
D.75 Miscellaneous current transfers 0
Uses
D.5 Current taxes on income, wealth, etc. 0
D.59 Other current taxes 0
D.62 Social benefits other than social transfers in kind 7
D.7 Other current transfers 28
D.71 Net non-life insurance premiums 1
D.73 Current transfers within general government 13
D.74 Current international corporations 1
D.75 Miscellaneous current transfers 13
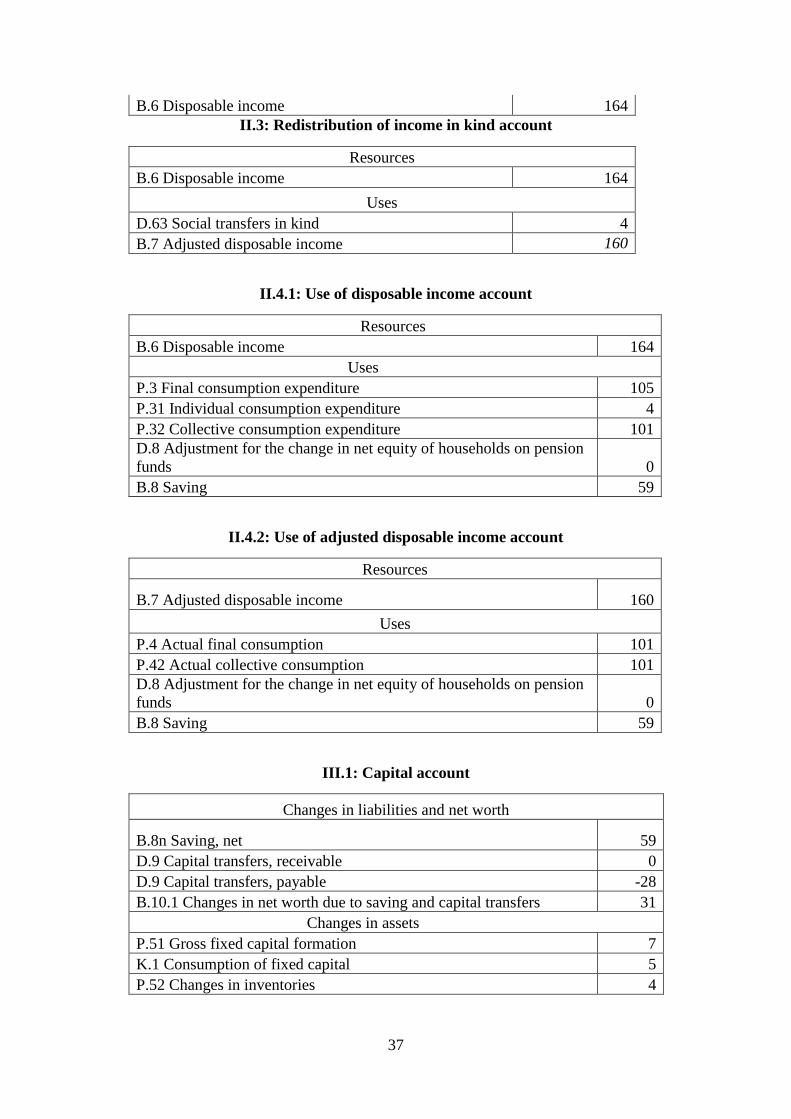
37
B.6 Disposable income 164
II.3: Redistribution of income in kind account
Resources
B.6 Disposable income 164
Uses
D.63 Social transfers in kind 4
B.7 Adjusted disposable income 160
II.4.1: Use of disposable income account
Resources
B.6 Disposable income 164
Uses
P.3 Final consumption expenditure 105
P.31 Individual consumption expenditure 4
P.32 Collective consumption expenditure 101
D.8 Adjustment for the change in net equity of households on pension
funds 0
B.8 Saving 59
II.4.2: Use of adjusted disposable income account
Resources
B.7 Adjusted disposable income 160
Uses
P.4 Actual final consumption 101
P.42 Actual collective consumption 101
D.8 Adjustment for the change in net equity of households on pension
funds 0
B.8 Saving 59
III.1: Capital account
Changes in liabilities and net worth
B.8n Saving, net 59
D.9 Capital transfers, receivable 0
D.9 Capital transfers, payable -28
B.10.1 Changes in net worth due to saving and capital transfers 31
Changes in assets
P.51 Gross fixed capital formation 7
K.1 Consumption of fixed capital 5
P.52 Changes in inventories 4
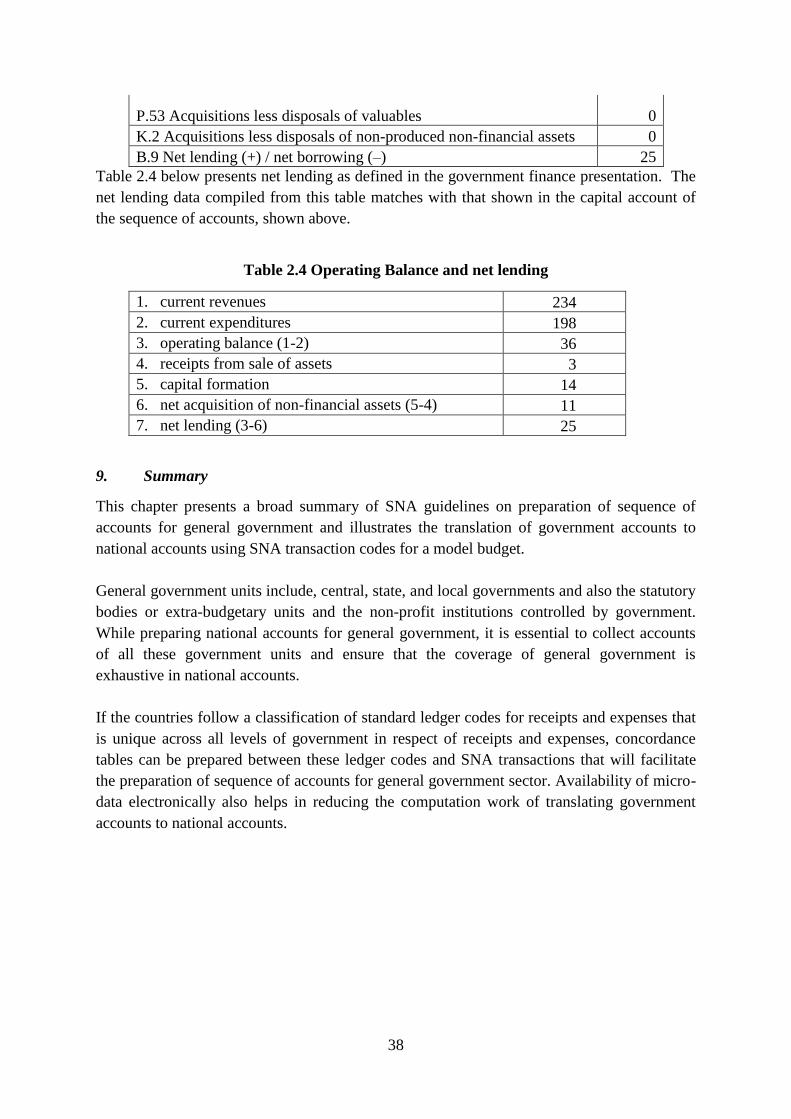
38
P.53 Acquisitions less disposals of valuables 0
K.2 Acquisitions less disposals of non-produced non-financial assets 0
B.9 Net lending (+) / net borrowing (–) 25
Table 2.4 below presents net lending as defined in the government finance presentation. The
net lending data compiled from this table matches with that shown in the capital account of
the sequence of accounts, shown above.
Table 2.4 Operating Balance and net lending
1. current revenues 234
2. current expenditures 198
3. operating balance (1-2) 36
4. receipts from sale of assets 3
5. capital formation 14
6. net acquisition of non-financial assets (5-4) 11
7. net lending (3-6) 25
9. Summary
This chapter presents a broad summary of SNA guidelines on preparation of sequence of
accounts for general government and illustrates the translation of government accounts to
national accounts using SNA transaction codes for a model budget.
General government units include, central, state, and local governments and also the statutory
bodies or extra-budgetary units and the non-profit institutions controlled by government.
While preparing national accounts for general government, it is essential to collect accounts
of all these government units and ensure that the coverage of general government is
exhaustive in national accounts.
If the countries follow a classification of standard ledger codes for receipts and expenses that
is unique across all levels of government in respect of receipts and expenses, concordance
tables can be prepared between these ledger codes and SNA transactions that will facilitate
the preparation of sequence of accounts for general government sector. Availability of micro-
data electronically also helps in reducing the computation work of translating government
accounts to national accounts.
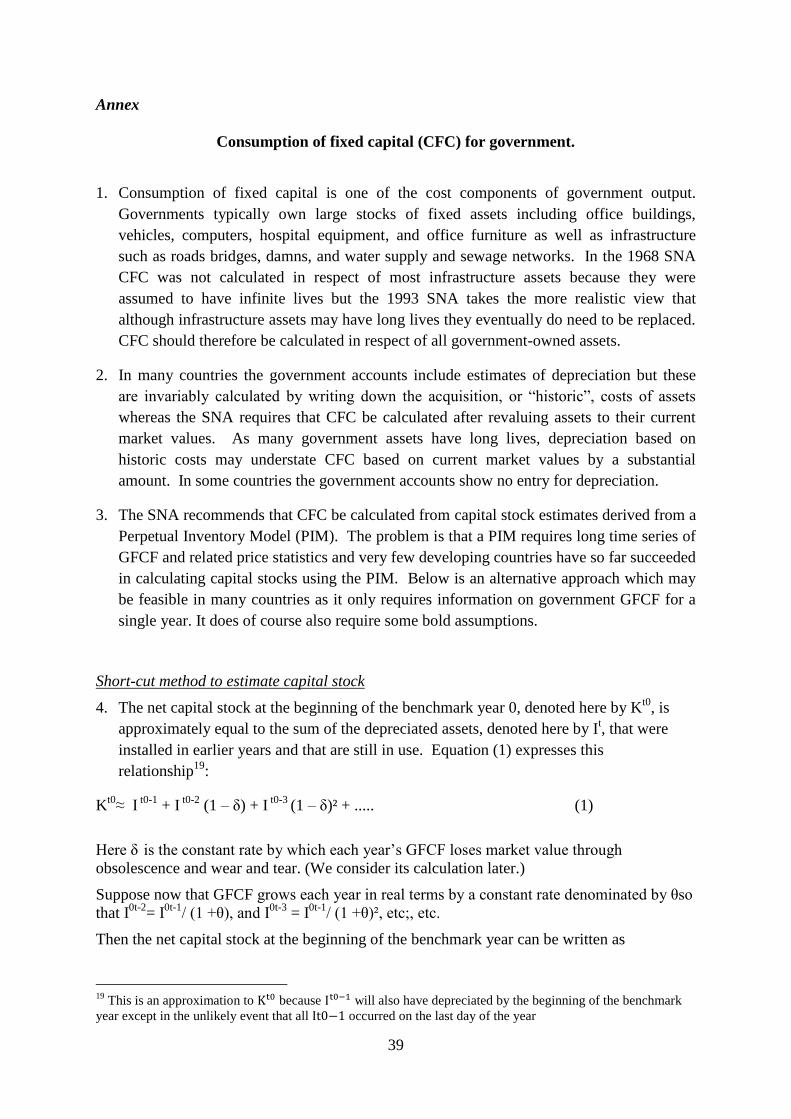
39
Annex
Consumption of fixed capital (CFC) for government.
1. Consumption of fixed capital is one of the cost components of government output.
Governments typically own large stocks of fixed assets including office buildings,
vehicles, computers, hospital equipment, and office furniture as well as infrastructure
such as roads bridges, damns, and water supply and sewage networks. In the 1968 SNA
CFC was not calculated in respect of most infrastructure assets because they were
assumed to have infinite lives but the 1993 SNA takes the more realistic view that
although infrastructure assets may have long lives they eventually do need to be replaced.
CFC should therefore be calculated in respect of all government-owned assets.
2. In many countries the government accounts include estimates of depreciation but these
are invariably calculated by writing down the acquisition, or ―historic‖, costs of assets
whereas the SNA requires that CFC be calculated after revaluing assets to their current
market values. As many government assets have long lives, depreciation based on
historic costs may understate CFC based on current market values by a substantial
amount. In some countries the government accounts show no entry for depreciation.
3. The SNA recommends that CFC be calculated from capital stock estimates derived from a
Perpetual Inventory Model (PIM). The problem is that a PIM requires long time series of
GFCF and related price statistics and very few developing countries have so far succeeded
in calculating capital stocks using the PIM. Below is an alternative approach which may
be feasible in many countries as it only requires information on government GFCF for a
single year. It does of course also require some bold assumptions.
Short-cut method to estimate capital stock
4. The net capital stock at the beginning of the benchmark year 0, denoted here by Kt0
, is
approximately equal to the sum of the depreciated assets, denoted here by It, that were
installed in earlier years and that are still in use. Equation (1) expresses this
relationship19
:
Kt0
≈ I t0-1
+ I t0-2
(1 – δ) + I t0-3
(1 – δ)² + ..... (1)
Here δ is the constant rate by which each year‘s GFCF loses market value through
obsolescence and wear and tear. (We consider its calculation later.)
Suppose now that GFCF grows each year in real terms by a constant rate denominated by θso
that I0t-2
= I0t-1
/ (1 +θ), and I0t-3
= I0t-1
/ (1 +θ)², etc;, etc.
Then the net capital stock at the beginning of the benchmark year can be written as
19
This is an approximation to because will also have depreciated by the beginning of the benchmark
year except in the unlikely event that all t0−1 occurred on the last day of the year
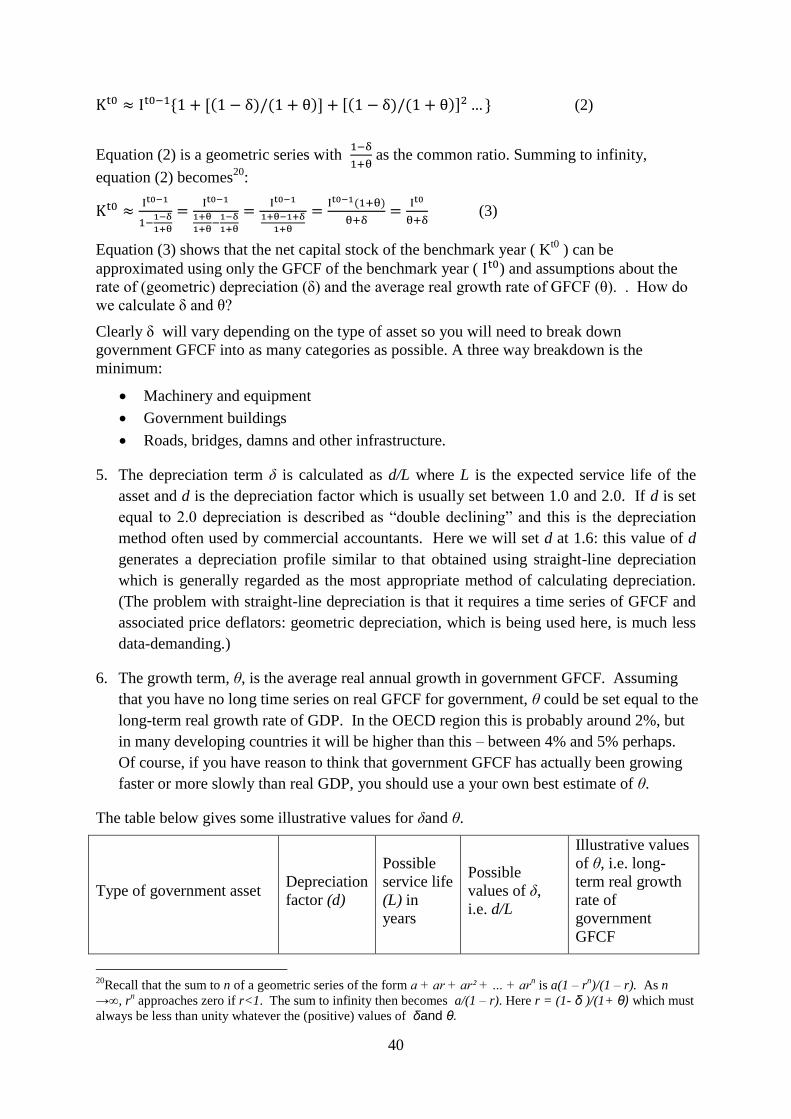
40
1 (1 − (1 (1 − (1 (2)
Equation (2) is a geometric series with
as the common ratio. Summing to infinity,
equation (2) becomes20
:
(
(3)
Equation (3) shows that the net capital stock of the benchmark year ( Kt0
) can be
approximated using only the GFCF of the benchmark year ( ) and assumptions about the
rate of (geometric) depreciation (δ) and the average real growth rate of GFCF (θ). . How do
we calculate δ and θ?
Clearly δ will vary depending on the type of asset so you will need to break down
government GFCF into as many categories as possible. A three way breakdown is the
minimum:
Machinery and equipment
Government buildings
Roads, bridges, damns and other infrastructure.
5. The depreciation term δ is calculated as d/L where L is the expected service life of the
asset and d is the depreciation factor which is usually set between 1.0 and 2.0. If d is set
equal to 2.0 depreciation is described as ―double declining‖ and this is the depreciation
method often used by commercial accountants. Here we will set d at 1.6: this value of d
generates a depreciation profile similar to that obtained using straight-line depreciation
which is generally regarded as the most appropriate method of calculating depreciation.
(The problem with straight-line depreciation is that it requires a time series of GFCF and
associated price deflators: geometric depreciation, which is being used here, is much less
data-demanding.)
6. The growth term, θ, is the average real annual growth in government GFCF. Assuming
that you have no long time series on real GFCF for government, θ could be set equal to the
long-term real growth rate of GDP. In the OECD region this is probably around 2%, but
in many developing countries it will be higher than this – between 4% and 5% perhaps.
Of course, if you have reason to think that government GFCF has actually been growing
faster or more slowly than real GDP, you should use a your own best estimate of θ.
The table below gives some illustrative values for δand θ.
Type of government asset Depreciation
factor (d)
Possible
service life
(L) in
years
Possible
values of δ,
i.e. d/L
Illustrative values
of θ, i.e. long-
term real growth
rate of
government
GFCF
20
Recall that the sum to n of a geometric series of the form a + ar + ar² + … + arn is a(1 – r
n)/(1 – r). As n
→∞, rn approaches zero if r<1. The sum to infinity then becomes a/(1 – r). Here r = (1- δ )/(1+ θ) which must
always be less than unity whatever the (positive) values of δand θ.
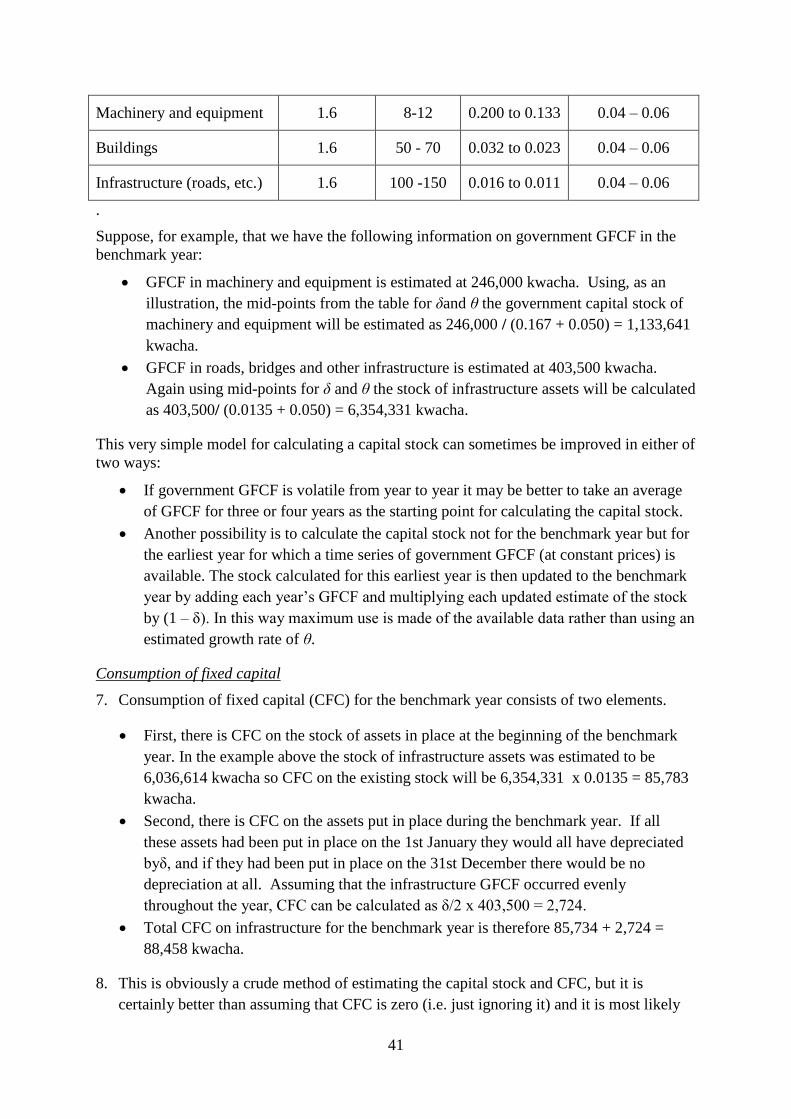
41
Machinery and equipment 1.6 8-12 0.200 to 0.133 0.04 – 0.06
Buildings 1.6 50 - 70 0.032 to 0.023 0.04 – 0.06
Infrastructure (roads, etc.) 1.6 100 -150 0.016 to 0.011 0.04 – 0.06
.
Suppose, for example, that we have the following information on government GFCF in the
benchmark year:
GFCF in machinery and equipment is estimated at 246,000 kwacha. Using, as an
illustration, the mid-points from the table for δand θ the government capital stock of
machinery and equipment will be estimated as 246,000 / (0.167 + 0.050) = 1,133,641
kwacha.
GFCF in roads, bridges and other infrastructure is estimated at 403,500 kwacha.
Again using mid-points for δ and θ the stock of infrastructure assets will be calculated
as 403,500/ (0.0135 + 0.050) = 6,354,331 kwacha.
This very simple model for calculating a capital stock can sometimes be improved in either of
two ways:
If government GFCF is volatile from year to year it may be better to take an average
of GFCF for three or four years as the starting point for calculating the capital stock.
Another possibility is to calculate the capital stock not for the benchmark year but for
the earliest year for which a time series of government GFCF (at constant prices) is
available. The stock calculated for this earliest year is then updated to the benchmark
year by adding each year‘s GFCF and multiplying each updated estimate of the stock
by (1 – δ). In this way maximum use is made of the available data rather than using an
estimated growth rate of θ.
Consumption of fixed capital
7. Consumption of fixed capital (CFC) for the benchmark year consists of two elements.
First, there is CFC on the stock of assets in place at the beginning of the benchmark
year. In the example above the stock of infrastructure assets was estimated to be
6,036,614 kwacha so CFC on the existing stock will be 6,354,331 x 0.0135 = 85,783
kwacha.
Second, there is CFC on the assets put in place during the benchmark year. If all
these assets had been put in place on the 1st January they would all have depreciated
byδ, and if they had been put in place on the 31st December there would be no
depreciation at all. Assuming that the infrastructure GFCF occurred evenly
throughout the year, CFC can be calculated as δ/2 x 403,500 = 2,724.
Total CFC on infrastructure for the benchmark year is therefore 85,734 + 2,724 =
88,458 kwacha.
8. This is obviously a crude method of estimating the capital stock and CFC, but it is
certainly better than assuming that CFC is zero (i.e. just ignoring it) and it is most likely

42
to be nearer the true figure for CFC than a depreciation estimate based on historic costs
that may be available from the government accounts
References:
Measuring Capital: OECD Manual, 2nd
Edition, (Pages. 130-131 deal with the estimation of
a capital stock using limited data. The method described here for estimating CFC for
government is based on this section of the Manual.) OECD, Paris 2009.
43
Chapter 3: Use of financial statements of financial corporations in national accounts
This chapter deals with the translation of administrative data of financial corporations
comprising their financial statements, to the national accounts. The financial corporations are
engaged in a large number of financial and insurance activities, the most important among
them being the central bank, commercial banks, life-insurance and non-life insurance. This
chapter focuses on the financial corporations engaged in these four activities.
The text for the chapter has mainly been sourced from the following three documents:
17) European Commission, IMF, OECD, UN, World Bank: System of National Accounts,
1993 and 2008 (referred to as 1993/2008 SNA)
18) United Nations, European Central Bank: Handbook of National Accounting:
Financial Production, Flows and Stocks in the System of National Accounts, 2014
(referred to as UN-ECB Handbook (2014)
19) Eurostat handbook Essential SNA: Building the basics, 2013 (referred to as Eurostat
Handbook (2013))
The chapter also includes few African country practices of using financial statements of
financial corporations in national accounts.
1. Introduction
Financial corporations are engaged in financial and insurance activities. The administrative
data for the financial corporations comprises the financial statements of individual companies
or the consolidated financial statements of all units provided by the regulatory/supervisory
agencies. Mostly, for the banking activities, the micro-data of individual financial
corporations is consolidated by the central bank, while for the insurance corporations, such
consolidated data is maintained by the insurance regulatory agencies. In some countries, the
regulatory agency for stock exchanges also maintains micro-data of financial statements of
companies listed on the stock exchanges.
In addition to the financial statements, the regulatory/supervisory agencies also conduct
surveys or prescribe returns to the financial corporations to collect statistics on financial and
insurance activities, mainly to serve the administrative/supervisory/regulatory functions of
these agencies.
All the above types of administrative data, namely, (a) micro-data of individual companies in
the form of their financial statements comprising income account (also known as profit and
loss account), balance sheet, cash flow statement and accounting policies and explanatory
notes; (b) consolidated financial statements of all companies engaged in same activity by the
regulatory or supervisory agencies; and (c) summarized financial and insurance data collected
44
through surveys or the returns prescribed by the regulatory or supervisory agencies, provide
the necessary information for compiling national accounts, with few adjustments. In general
these source data are detailed in terms of deposits, loans, debt securities and shares, with
corresponding breakdowns by original maturity, currency denomination and counterpart
sector, for the banking sector; and premiums, claims/benefits, reserves, etc. for the insurance
sector.
It is rarely the practice for national statistics offices to conduct surveys on financial and
insurance activities of corporations, though they may conduct surveys to collect information
on financial activities of households or when detailed information required for compilation of
national accounts is not available from the above sources.
The UNECA survey of December, 2013 on the sources and methods used to compile national
accounts in the 54 African member countries (47 countries responded) showed that countries
generally use accounts of financial corporations and banking and insurance statistics provided
by the regulatory/supervisory agencies, in the national accounts compilation.
Among the countries responded to the survey carried out by UNECA, it was observed that
Central banks on less than third of countries distinguish between their three activities of
monetary, supervisory/regulatory and banking, in their accounts. On the other hand, in about
a quarter of the countries no information is available on any central bank activities.
In two thirds of countries financial statements are available for each individual commercial
bank and consolidated accounts are available for about a quarter of countries. Although
consolidated data is sufficient for national accounts purposes, most national accounts
compilers would prefer statements for each individual bank so that they can identify and
verify any large movements from year to year.
FISIM allocation has proved difficult and many countries have not yet devised satisfactory
procedures for doing it. Information on loans and deposits is essential for any allocation
system, and only 19 countries have the detailed information required on loans and deposits
while 20 countries report that they have no information at all. This no doubt explains why
many countries are still not able to allocate FISM as recommended by 1993/2008 SNA.
Information from life and non-life insurance companies is required both to calculate the gross
output of insurance companies including premium supplements. Information on claims and
net premiums are also required for the sequence of accounts. About two-thirds of countries
have the necessary information for life insurance and three-quarters for non-life insurance.
On the other hand, eight countries have no data available for life insurance and four countries
have no data available for non-life insurance.
45
2. Financial corporations in 2008 SNA
The principal activity of financial corporations21
is to provide financial services. These
financial services cover financial intermediation services, insurance and pension fund
services, and the provision of activities that facilitate financial intermediation. The production
of financial services is the result of financial intermediation, financial risk management,
liquidity transformation or auxiliary financial activities.
In the UN International Standard Industrial Classification (ISIC) Rev 4.0, the activities
classified under financial services are:
64 Financial service activities, except insurance and pension funding
641 Monetary intermediation
6411 Central banking
6419 Other monetary intermediation
banks
savings banks
credit unions
642 Activities of holding companies
643 Trusts, funds and similar financial entities
649 Other financial service activities, except insurance and pension funding activities
65 Insurance, reinsurance and pension funding, except compulsory social
security
651 Insurance
6511 Life insurance
6512 Non-life insurance
652 Reinsurance
653 Pension funding
66 Activities auxiliary to financial service and insurance activities
661 Activities auxiliary to financial service activities, except insurance and pension
funding
662 Activities auxiliary to insurance and pension funding
663 Fund management activities
Financial corporations consist of (i) all resident corporations that are principally engaged in
providing financial services; (ii) branches of non-resident enterprises that are engaged in
financial activity on the economic territory on a long-term basis; and (iii) all resident non-
profit institutions (NPIs) that are market producers of financial services.
21
The corporations are divided between those mainly providing financial services and those mainly providing
goods and other services, which are respectively known as financial corporations and non-financial
corporations. The distinction is made in SNA because of the special role that financial corporations play in the
economy.
46
Financial corporations can be divided into three broad classes, namely,
Financial intermediaries;
Institutional units that incur liabilities on their own account for the purpose of
acquiring financial assets by engaging in financial transactions on the market.
They include insurance corporations and pension funds.
Financial auxiliaries;
Institutional units principally engaged in serving financial markets, but do not
take ownership of the financial assets and liabilities they handle.
Other financial corporations.
Institutional units providing financial services, where most of their assets or
liabilities are not available on open financial markets.
The financial corporations sector can be divided into nine subsectors according to its activity
in the market and the liquidity of its liabilities. These nine subsectors22
are shown below.
Subsector 6 corresponds to financial auxiliaries; subsector 7 corresponds to other financial
corporations. All the other subsectors are financial intermediaries of one sort or another.
S12 Financial corporations
S121 The central bank
S122 Deposit-taking corporations except the central bank
S123 Money market funds (MMFs)
S124 Non-MMF investment funds
S125 Other financial intermediaries except insurance corporations and pension funds
S126 Financial auxiliaries
S127 Captive financial institutions and money lenders
S128 Insurance corporations
S129 Pension funds
The following sections deal specifically with the use of administrative data concerning
central bank, commercial banks, life and non-life insurance, in national accounts.
3. Central Bank (S121)
Central banks carry out a number of functions, grouped under monetary policy, financial
intermediation and regulatory/supervisory services. These services fall under collective and
individual services and some of them are measured on non-market basis and some on market
basis, depending on the nature of functions and the income received from the services
provided. In the SNA, central bank transactions are recorded in a special manner, especially
in respect of those relating to collective consumption and interest receipts and payments.
22
The sectors are classified in SNA under S codes. S12 refers to financial sector.
47
3.1 Definition and coverage
The central bank is the national financial institution that exercises control over key aspects of
the financial system. It is the public financial corporation which is a monetary authority: that
is, which issues banknotes and sometimes coins and may hold all or part of the international
reserves of the country. The central bank also has liabilities in the form of demand or reserve
deposits of other depository corporations and often government deposits.
This sub-sector consists of the central bank together with any other agencies or bodies which
regulate or supervise financial corporations and which are themselves separate institutional
units.
In general, the following financial intermediaries are classified in this subsector:
a) The national central bank.
b) Currency boards or independent currency authorities that issue national currency that
is fully backed by foreign exchange reserves.
c) Central monetary agencies of essentially public origin (for example, agencies
managing foreign exchange or issuing bank notes and coin) that keep a complete set
of accounts but are not classified as part of central government.
Some important points to note here are:
Supervisory authorities that are separate institutional units are not included with the
central bank but are included with financial auxiliaries.
When the central bank is a separate institutional unit, it is always allocated to the
financial corporations sector even if it is primarily a non-market producer.
Many central banks also engage in some commercial banking. However, all activities
of central bank, including its commercial banking activities, are classified under
―central banks‖.
Some countries may not have central banks and their activities23
are performed by
government units under the direct control and supervision of central government.
Such government units are classified under government sector and not under financial
corporations.
Services produced by the central bank are broadly classified under the following three
groups:
Monetary policy services.
Monetary policy refers to measures or actions taken by the central bank to
influence the general price level and the level of liquidity in the economy. These
23
Such as issue of currency, the maintenance of international reserves and the operation of exchange
stabilization funds, and also transactions with the International Monetary Fund.
48
could include setting interest rates and determining the level of money supply in
the economy through various tools, such as increasing/decreasing the reserve
requirements. Monetary policy services are collective in nature, serving the
community as a whole, and thus represent non-market output of the central bank.
The output of these services is estimated on non-market basis.
Financial intermediation services.
Financial intermediation services are individual in nature and, in the absence of
policy intervention in the interest rates charged by the central banks, would be
treated as market production. The method to calculate the output of these
financial intermediation services is the same as the method to calculate FISIM.
Borderline cases, such as supervisory services.
The borderline cases, such as supervisory services, may be classified as market or
non-market services, depending on whether explicit fees are charged that are
sufficient to cover the costs of providing these services.
3.2 Sources of data on central bank
The source of data for compiling national accounts in respect of central bank activities is the
central bank itself. The central banks usually produce annual financial statements comprising
income statement (sometimes referred to as profit and loss account) and balance sheet and
publish them in their annual reports. These annual reports are generally public documents and
national accountants can have direct access to the financial statements included in these
reports.
However, the financial statements published in the annual report of central banks may not
provide the necessary details that are required for national accounts compilation, though they
may have been prepared in compliance with International Accounting Standard (IAS) /
International Financial Reporting Standard (IFRS) and also include explanatory notes to the
accounts. Moreover, in most developing countries, the financial statements of central banks
are presented together for all their activities, namely, the monetary policy, banking services
and supervisory services, but not separately. On the other hand, central banks in some
countries publish financial accounts separately for these services in respect of either profit
and loss account or balance sheet or both, in their annual reports. In summary, the data
available from central bank accounts that are placed in public domain is generally insufficient
for compiling national accounts.
Irrespective of country practices in releasing the financial statements, central banks internally
maintain detailed information (such as on establishment costs, purchases, travel and
transportation expenses, repair and maintenance, rent and rentals, capital expenses, financial
transactions, etc.) separately for different types of services (monetary policy, banking
49
activities, and supervisory services) provided by them. Therefore, the national accounts
compiling agency should establish a mechanism, whereby the central bank provides detailed
information separately for the three different services for use in the compilation of national
accounts. Such detailed information segregated by different functions of central bank is
necessary for the national accounts compilation, as methods to calculate output and other
economic variables is different for these services.
3.3 Structure
The central bank financial accounts generally follow the same structure as those of other
financial and non-financial enterprises. These financial accounts include (a) income
statement covering income and expenses transactions during the financial year, considered as
flow accounts; and (b) balance sheet showing the value of assets and liabilities (financial and
non-financial) at the end of the financial year, covering stock accounts. In addition, the
financial statements include a statement of significant accounting policies and notes to the
accounts24
(accounting policies and explanatory notes), which contain important information
on accounting methodologies used for recording and reporting transactions, and additional
information on the items included in the income statement and balance sheets. More detailed
data on the financial statements that is required for national accounts compilation would be
available with the central banks.
3.4 Conceptual issues specific to central banks
The following are some of the characteristic features specific to the central banks (extracts
from 2008 SNA and UN-ECB Handbook on Financial Production, Flows and Stock in SNA,
2014.
When the central bank is a separate institutional unit, it is always allocated to the financial
corporations sector even if it is primarily a non-market producer and produces collective
services.
If a country does not have a central bank and its functions are carried out by government
units, such units are classified under general government sector. They are not allocated to
the central bank sub-sector.
All central bank activities including its commercial banking activities, if any, are
classified under ―central banks‖.
As far as possible the three broad groups of central bank services, namely, the monetary
policy services, financial intermediation and regulatory/supervisory services should be
distinguished separately in national accounts owing to the differences in measuring their
output.
Production, output, value added (Production account)
24
These are also sometimes known as ‗footnotes to financial statements‘.
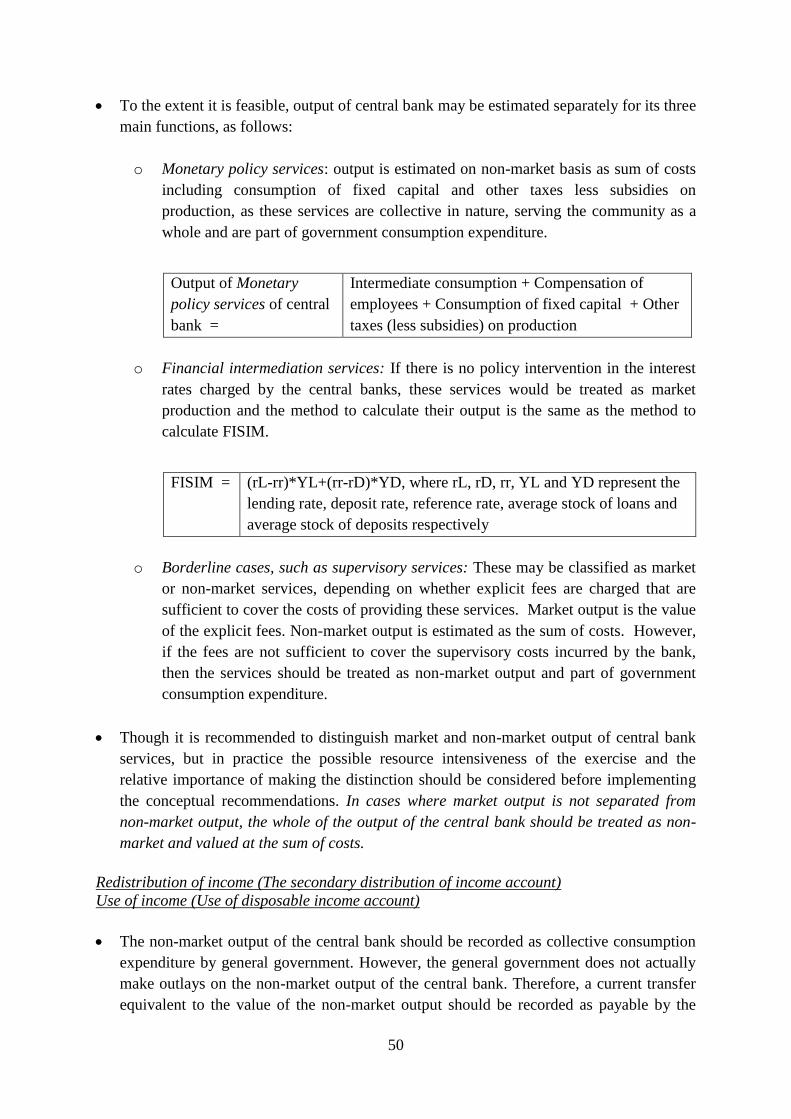
50
To the extent it is feasible, output of central bank may be estimated separately for its three
main functions, as follows:
o Monetary policy services: output is estimated on non-market basis as sum of costs
including consumption of fixed capital and other taxes less subsidies on
production, as these services are collective in nature, serving the community as a
whole and are part of government consumption expenditure.
Output of Monetary
policy services of central
bank =
Intermediate consumption + Compensation of
employees + Consumption of fixed capital + Other
taxes (less subsidies) on production
o Financial intermediation services: If there is no policy intervention in the interest
rates charged by the central banks, these services would be treated as market
production and the method to calculate their output is the same as the method to
calculate FISIM.
FISIM = (rL-rr)*YL+(rr-rD)*YD, where rL, rD, rr, YL and YD represent the
lending rate, deposit rate, reference rate, average stock of loans and
average stock of deposits respectively
o Borderline cases, such as supervisory services: These may be classified as market
or non-market services, depending on whether explicit fees are charged that are
sufficient to cover the costs of providing these services. Market output is the value
of the explicit fees. Non-market output is estimated as the sum of costs. However,
if the fees are not sufficient to cover the supervisory costs incurred by the bank,
then the services should be treated as non-market output and part of government
consumption expenditure.
Though it is recommended to distinguish market and non-market output of central bank
services, but in practice the possible resource intensiveness of the exercise and the
relative importance of making the distinction should be considered before implementing
the conceptual recommendations. In cases where market output is not separated from
non-market output, the whole of the output of the central bank should be treated as non-
market and valued at the sum of costs.
Redistribution of income (The secondary distribution of income account)
Use of income (Use of disposable income account)
The non-market output of the central bank should be recorded as collective consumption
expenditure by general government. However, the general government does not actually
make outlays on the non-market output of the central bank. Therefore, a current transfer
equivalent to the value of the non-market output should be recorded as payable by the
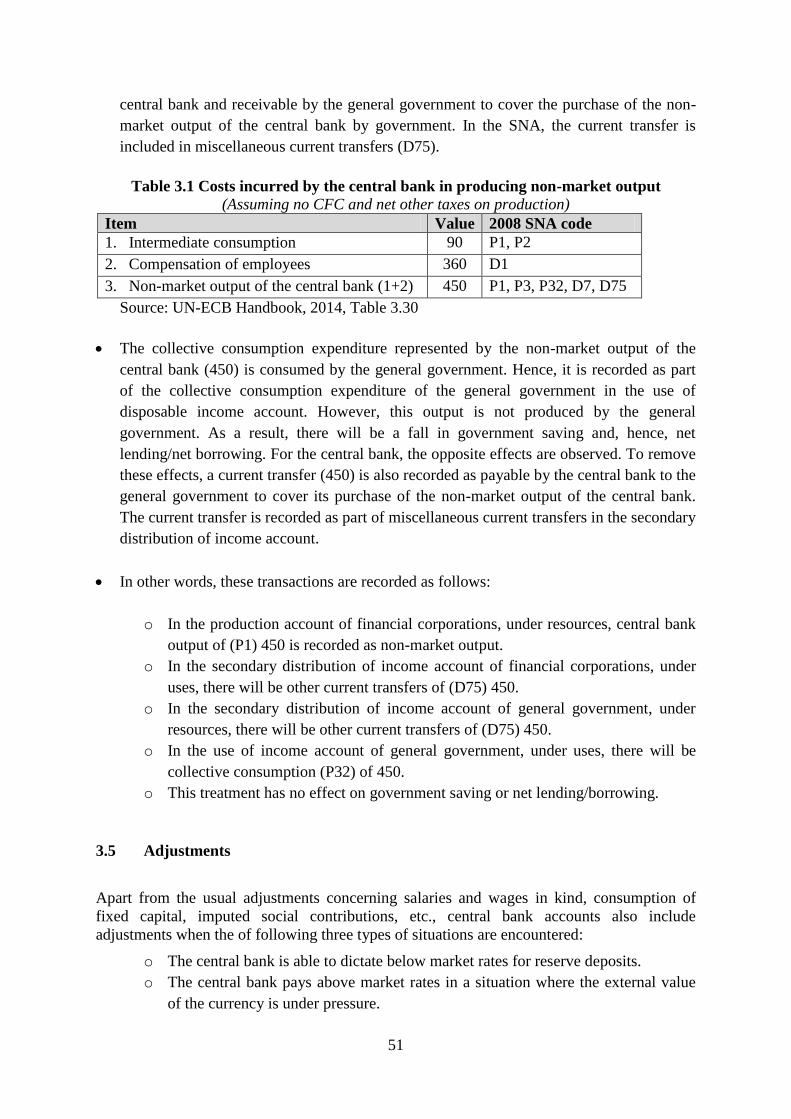
51
central bank and receivable by the general government to cover the purchase of the non-
market output of the central bank by government. In the SNA, the current transfer is
included in miscellaneous current transfers (D75).
Table 3.1 Costs incurred by the central bank in producing non-market output
(Assuming no CFC and net other taxes on production)
Item Value 2008 SNA code
1. Intermediate consumption 90 P1, P2
2. Compensation of employees 360 D1
3. Non-market output of the central bank (1+2) 450 P1, P3, P32, D7, D75
Source: UN-ECB Handbook, 2014, Table 3.30
The collective consumption expenditure represented by the non-market output of the
central bank (450) is consumed by the general government. Hence, it is recorded as part
of the collective consumption expenditure of the general government in the use of
disposable income account. However, this output is not produced by the general
government. As a result, there will be a fall in government saving and, hence, net
lending/net borrowing. For the central bank, the opposite effects are observed. To remove
these effects, a current transfer (450) is also recorded as payable by the central bank to the
general government to cover its purchase of the non-market output of the central bank.
The current transfer is recorded as part of miscellaneous current transfers in the secondary
distribution of income account.
In other words, these transactions are recorded as follows:
o In the production account of financial corporations, under resources, central bank
output of (P1) 450 is recorded as non-market output.
o In the secondary distribution of income account of financial corporations, under
uses, there will be other current transfers of (D75) 450.
o In the secondary distribution of income account of general government, under
resources, there will be other current transfers of (D75) 450.
o In the use of income account of general government, under uses, there will be
collective consumption (P32) of 450.
o This treatment has no effect on government saving or net lending/borrowing.
3.5 Adjustments
Apart from the usual adjustments concerning salaries and wages in kind, consumption of
fixed capital, imputed social contributions, etc., central bank accounts also include
adjustments when the of following three types of situations are encountered:
o The central bank is able to dictate below market rates for reserve deposits.
o The central bank pays above market rates in a situation where the external value
of the currency is under pressure.
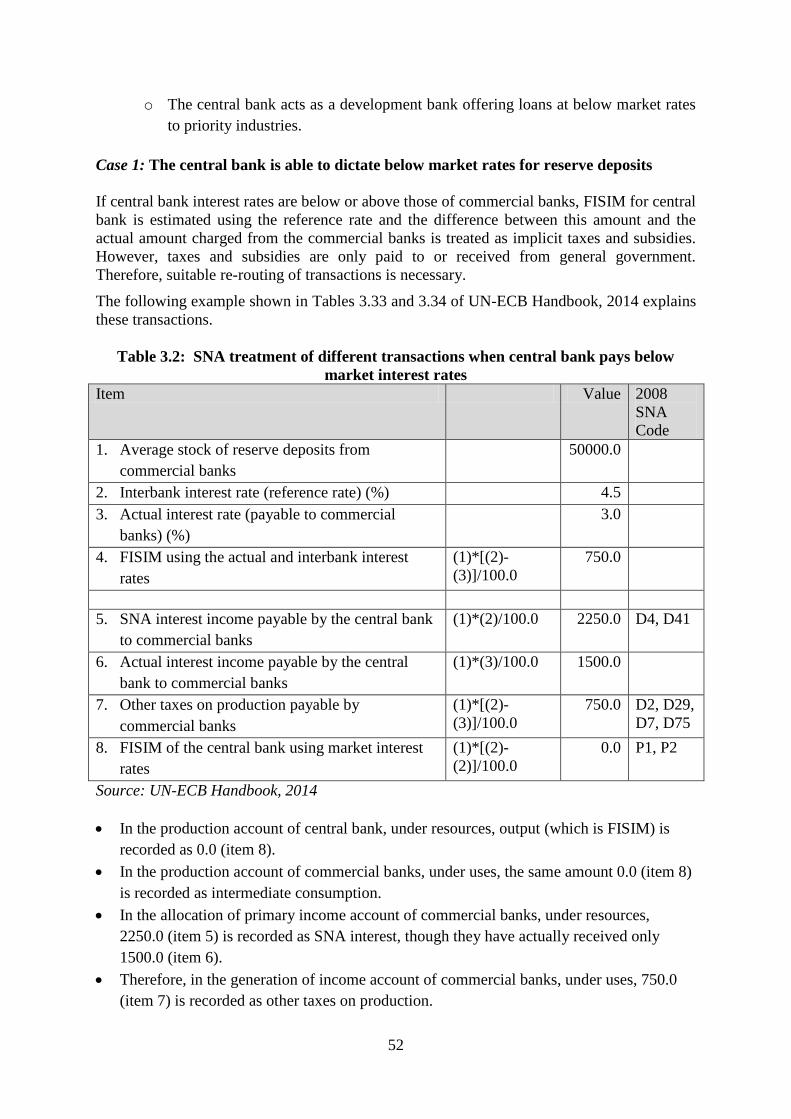
52
o The central bank acts as a development bank offering loans at below market rates
to priority industries.
Case 1: The central bank is able to dictate below market rates for reserve deposits
If central bank interest rates are below or above those of commercial banks, FISIM for central
bank is estimated using the reference rate and the difference between this amount and the
actual amount charged from the commercial banks is treated as implicit taxes and subsidies.
However, taxes and subsidies are only paid to or received from general government.
Therefore, suitable re-routing of transactions is necessary.
The following example shown in Tables 3.33 and 3.34 of UN-ECB Handbook, 2014 explains
these transactions.
Table 3.2: SNA treatment of different transactions when central bank pays below
market interest rates
Item Value 2008
SNA
Code
1. Average stock of reserve deposits from
commercial banks
50000.0
2. Interbank interest rate (reference rate) (%) 4.5
3. Actual interest rate (payable to commercial
banks) (%)
3.0
4. FISIM using the actual and interbank interest
rates
(1)*[(2)-
(3)]/100.0
750.0
5. SNA interest income payable by the central bank
to commercial banks
(1)*(2)/100.0 2250.0 D4, D41
6. Actual interest income payable by the central
bank to commercial banks
(1)*(3)/100.0 1500.0
7. Other taxes on production payable by
commercial banks
(1)*[(2)-
(3)]/100.0
750.0 D2, D29,
D7, D75
8. FISIM of the central bank using market interest
rates
(1)*[(2)-
(2)]/100.0
0.0 P1, P2
Source: UN-ECB Handbook, 2014
In the production account of central bank, under resources, output (which is FISIM) is
recorded as 0.0 (item 8).
In the production account of commercial banks, under uses, the same amount 0.0 (item 8)
is recorded as intermediate consumption.
In the allocation of primary income account of commercial banks, under resources,
2250.0 (item 5) is recorded as SNA interest, though they have actually received only
1500.0 (item 6).
Therefore, in the generation of income account of commercial banks, under uses, 750.0
(item 7) is recorded as other taxes on production.
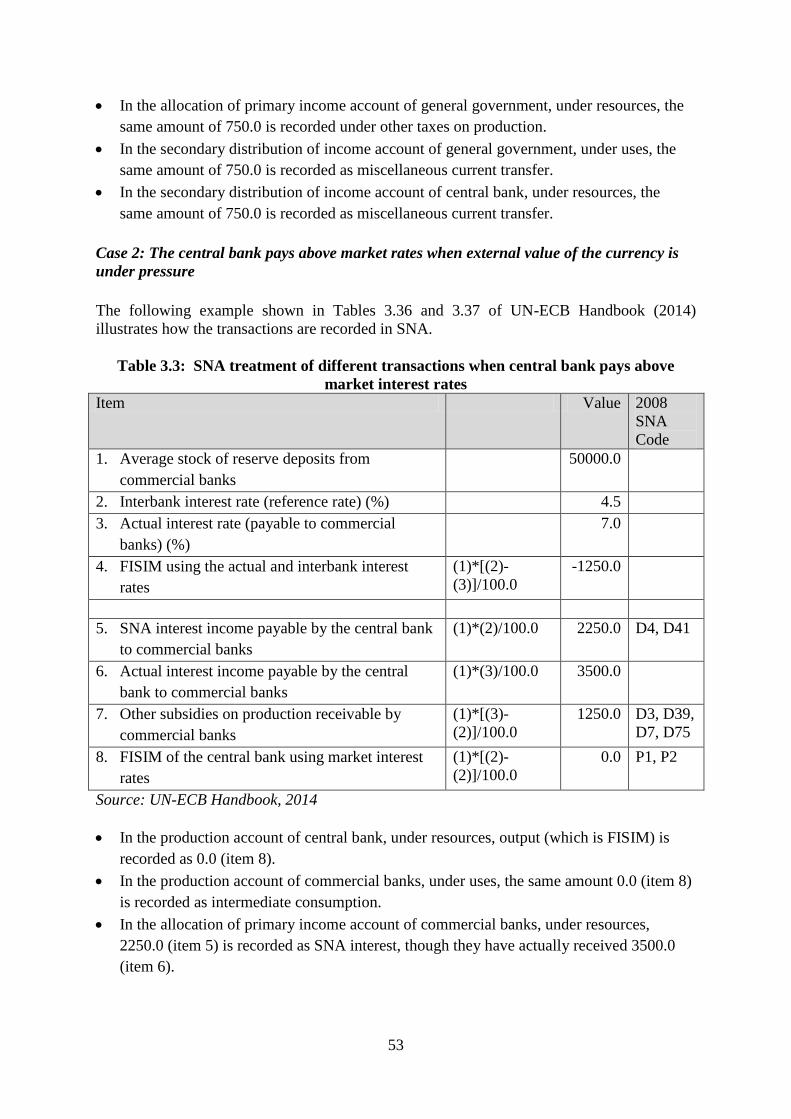
53
In the allocation of primary income account of general government, under resources, the
same amount of 750.0 is recorded under other taxes on production.
In the secondary distribution of income account of general government, under uses, the
same amount of 750.0 is recorded as miscellaneous current transfer.
In the secondary distribution of income account of central bank, under resources, the
same amount of 750.0 is recorded as miscellaneous current transfer.
Case 2: The central bank pays above market rates when external value of the currency is
under pressure
The following example shown in Tables 3.36 and 3.37 of UN-ECB Handbook (2014)
illustrates how the transactions are recorded in SNA.
Table 3.3: SNA treatment of different transactions when central bank pays above
market interest rates
Item Value 2008
SNA
Code
1. Average stock of reserve deposits from
commercial banks
50000.0
2. Interbank interest rate (reference rate) (%) 4.5
3. Actual interest rate (payable to commercial
banks) (%)
7.0
4. FISIM using the actual and interbank interest
rates
(1)*[(2)-
(3)]/100.0
-1250.0
5. SNA interest income payable by the central bank
to commercial banks
(1)*(2)/100.0 2250.0 D4, D41
6. Actual interest income payable by the central
bank to commercial banks
(1)*(3)/100.0 3500.0
7. Other subsidies on production receivable by
commercial banks
(1)*[(3)-
(2)]/100.0
1250.0 D3, D39,
D7, D75
8. FISIM of the central bank using market interest
rates
(1)*[(2)-
(2)]/100.0
0.0 P1, P2
Source: UN-ECB Handbook, 2014
In the production account of central bank, under resources, output (which is FISIM) is
recorded as 0.0 (item 8).
In the production account of commercial banks, under uses, the same amount 0.0 (item 8)
is recorded as intermediate consumption.
In the allocation of primary income account of commercial banks, under resources,
2250.0 (item 5) is recorded as SNA interest, though they have actually received 3500.0
(item 6).
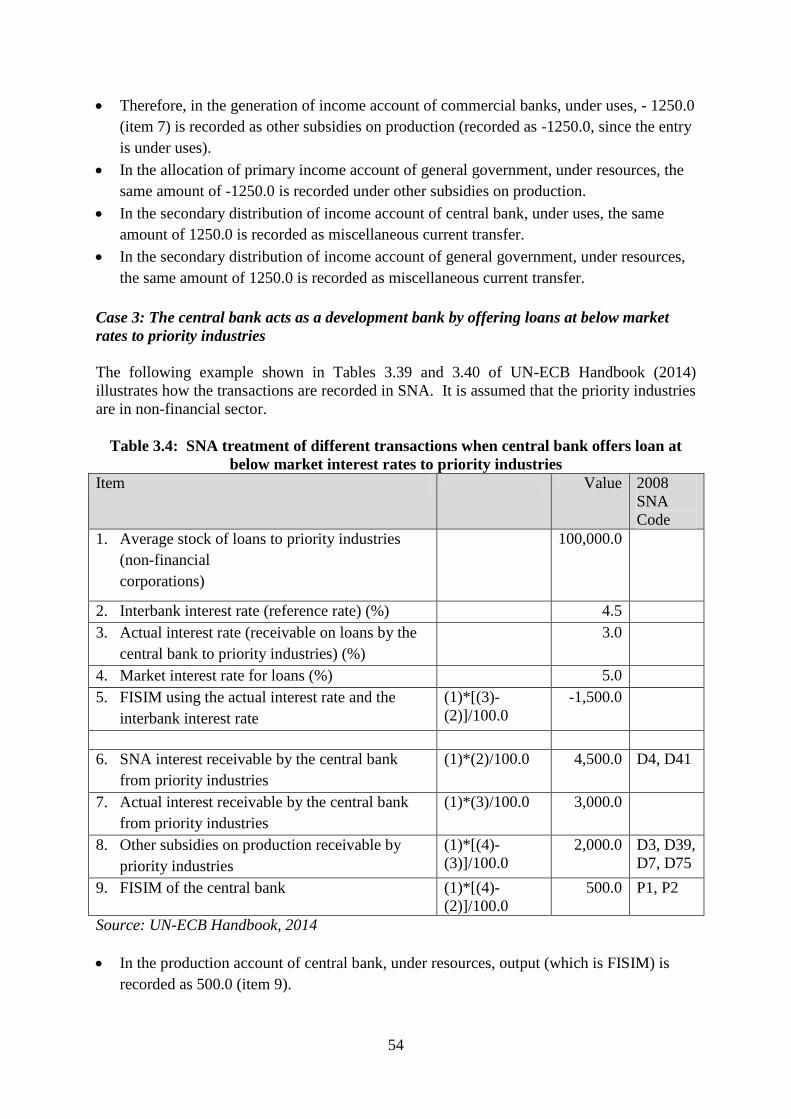
54
Therefore, in the generation of income account of commercial banks, under uses, - 1250.0
(item 7) is recorded as other subsidies on production (recorded as -1250.0, since the entry
is under uses).
In the allocation of primary income account of general government, under resources, the
same amount of -1250.0 is recorded under other subsidies on production.
In the secondary distribution of income account of central bank, under uses, the same
amount of 1250.0 is recorded as miscellaneous current transfer.
In the secondary distribution of income account of general government, under resources,
the same amount of 1250.0 is recorded as miscellaneous current transfer.
Case 3: The central bank acts as a development bank by offering loans at below market
rates to priority industries
The following example shown in Tables 3.39 and 3.40 of UN-ECB Handbook (2014)
illustrates how the transactions are recorded in SNA. It is assumed that the priority industries
are in non-financial sector.
Table 3.4: SNA treatment of different transactions when central bank offers loan at
below market interest rates to priority industries
Item Value 2008
SNA
Code
1. Average stock of loans to priority industries
(non-financial
corporations)
100,000.0
2. Interbank interest rate (reference rate) (%) 4.5
3. Actual interest rate (receivable on loans by the
central bank to priority industries) (%)
3.0
4. Market interest rate for loans (%) 5.0
5. FISIM using the actual interest rate and the
interbank interest rate
(1)*[(3)-
(2)]/100.0
-1,500.0
6. SNA interest receivable by the central bank
from priority industries
(1)*(2)/100.0 4,500.0 D4, D41
7. Actual interest receivable by the central bank
from priority industries
(1)*(3)/100.0 3,000.0
8. Other subsidies on production receivable by
priority industries
(1)*[(4)-
(3)]/100.0
2,000.0 D3, D39,
D7, D75
9. FISIM of the central bank (1)*[(4)-
(2)]/100.0
500.0 P1, P2
Source: UN-ECB Handbook, 2014
In the production account of central bank, under resources, output (which is FISIM) is
recorded as 500.0 (item 9).
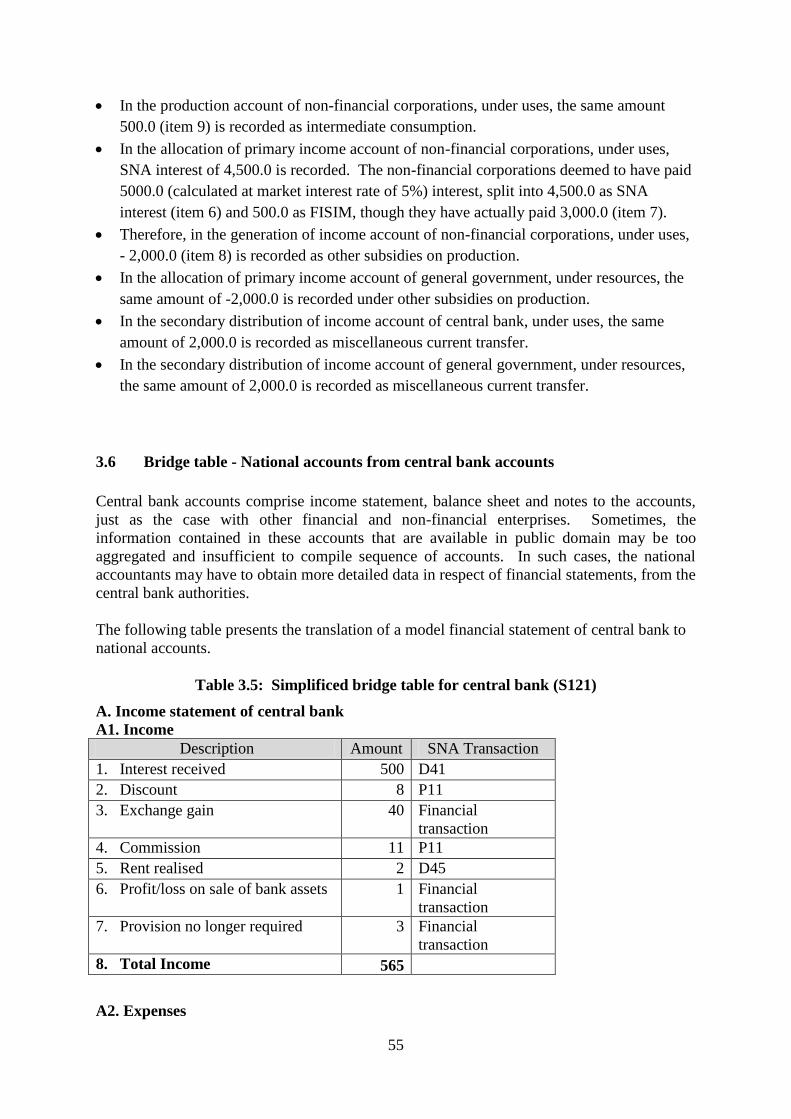
55
In the production account of non-financial corporations, under uses, the same amount
500.0 (item 9) is recorded as intermediate consumption.
In the allocation of primary income account of non-financial corporations, under uses,
SNA interest of 4,500.0 is recorded. The non-financial corporations deemed to have paid
5000.0 (calculated at market interest rate of 5%) interest, split into 4,500.0 as SNA
interest (item 6) and 500.0 as FISIM, though they have actually paid 3,000.0 (item 7).
Therefore, in the generation of income account of non-financial corporations, under uses,
- 2,000.0 (item 8) is recorded as other subsidies on production.
In the allocation of primary income account of general government, under resources, the
same amount of -2,000.0 is recorded under other subsidies on production.
In the secondary distribution of income account of central bank, under uses, the same
amount of 2,000.0 is recorded as miscellaneous current transfer.
In the secondary distribution of income account of general government, under resources,
the same amount of 2,000.0 is recorded as miscellaneous current transfer.
3.6 Bridge table - National accounts from central bank accounts
Central bank accounts comprise income statement, balance sheet and notes to the accounts,
just as the case with other financial and non-financial enterprises. Sometimes, the
information contained in these accounts that are available in public domain may be too
aggregated and insufficient to compile sequence of accounts. In such cases, the national
accountants may have to obtain more detailed data in respect of financial statements, from the
central bank authorities.
The following table presents the translation of a model financial statement of central bank to
national accounts.
Table 3.5: Simplificed bridge table for central bank (S121)
A. Income statement of central bank
A1. Income
Description Amount SNA Transaction
1. Interest received 500 D41
2. Discount 8 P11
3. Exchange gain 40 Financial
transaction
4. Commission 11 P11
5. Rent realised 2 D45
6. Profit/loss on sale of bank assets 1 Financial
transaction
7. Provision no longer required 3 Financial
transaction
8. Total Income 565
A2. Expenses
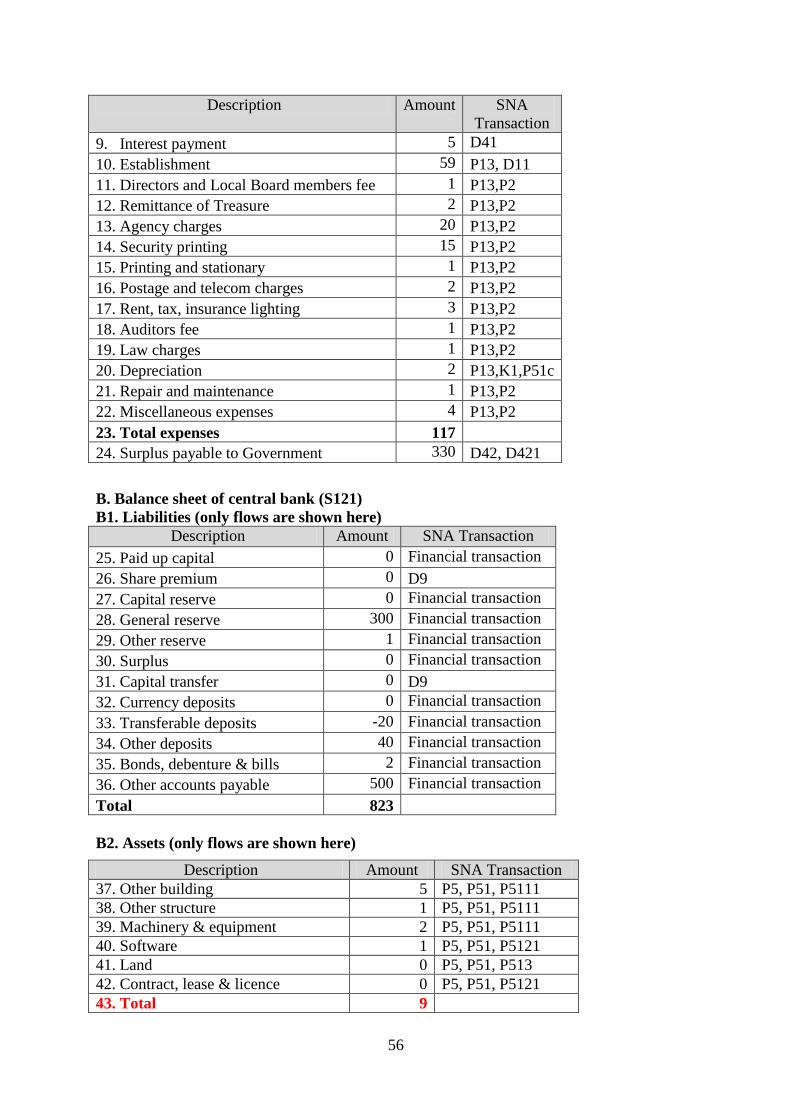
56
Description Amount SNA
Transaction
9. Interest payment 5 D41
10. Establishment 59 P13, D11
11. Directors and Local Board members fee 1 P13,P2
12. Remittance of Treasure 2 P13,P2
13. Agency charges 20 P13,P2
14. Security printing 15 P13,P2
15. Printing and stationary 1 P13,P2
16. Postage and telecom charges 2 P13,P2
17. Rent, tax, insurance lighting 3 P13,P2
18. Auditors fee 1 P13,P2
19. Law charges 1 P13,P2
20. Depreciation 2 P13,K1,P51c
21. Repair and maintenance 1 P13,P2
22. Miscellaneous expenses 4 P13,P2
23. Total expenses 117
24. Surplus payable to Government 330 D42, D421
B. Balance sheet of central bank (S121)
B1. Liabilities (only flows are shown here)
Description Amount SNA Transaction
25. Paid up capital 0 Financial transaction
26. Share premium 0 D9
27. Capital reserve 0 Financial transaction
28. General reserve 300 Financial transaction
29. Other reserve 1 Financial transaction
30. Surplus 0 Financial transaction
31. Capital transfer 0 D9
32. Currency deposits 0 Financial transaction
33. Transferable deposits -20 Financial transaction
34. Other deposits 40 Financial transaction
35. Bonds, debenture & bills 2 Financial transaction
36. Other accounts payable 500 Financial transaction
Total 823
B2. Assets (only flows are shown here)
Description Amount SNA Transaction
37. Other building 5 P5, P51, P5111
38. Other structure 1 P5, P51, P5111
39. Machinery & equipment 2 P5, P51, P5111
40. Software 1 P5, P51, P5121
41. Land 0 P5, P51, P513
42. Contract, lease & licence 0 P5, P51, P5121
43. Total 9
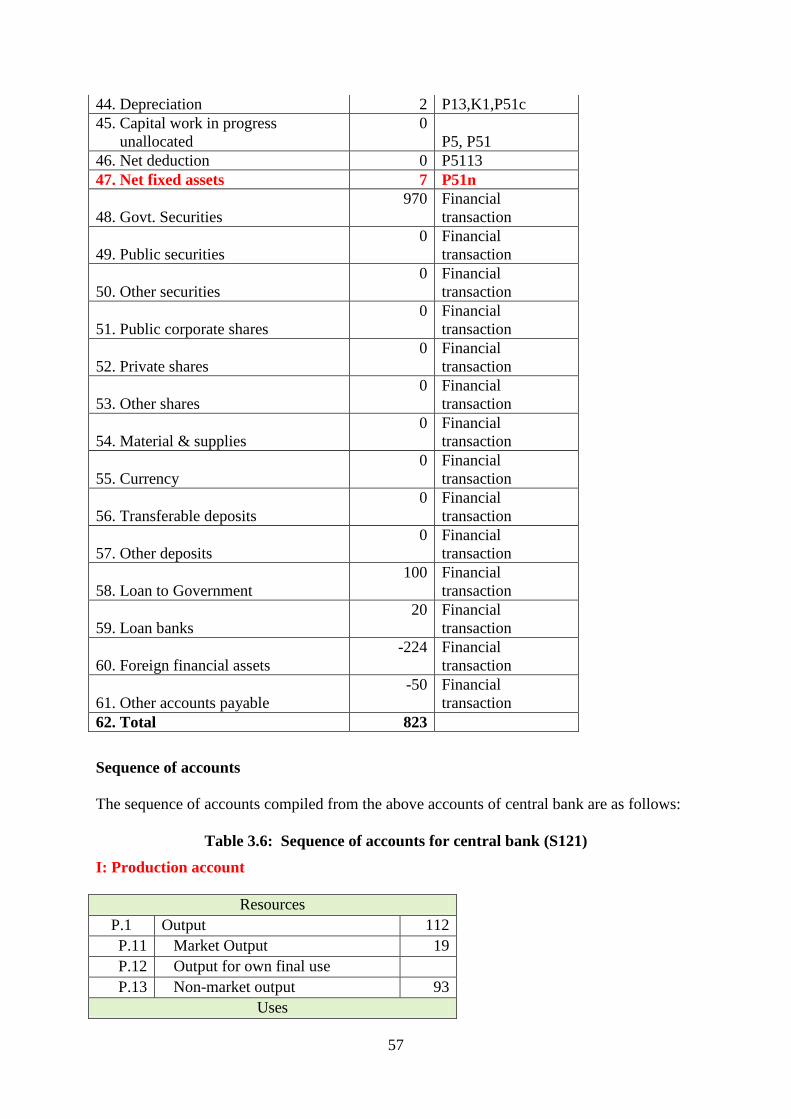
57
44. Depreciation 2 P13,K1,P51c
45. Capital work in progress
unallocated
0
P5, P51
46. Net deduction 0 P5113
47. Net fixed assets 7 P51n
48. Govt. Securities
970 Financial
transaction
49. Public securities
0 Financial
transaction
50. Other securities
0 Financial
transaction
51. Public corporate shares
0 Financial
transaction
52. Private shares
0 Financial
transaction
53. Other shares
0 Financial
transaction
54. Material & supplies
0 Financial
transaction
55. Currency
0 Financial
transaction
56. Transferable deposits
0 Financial
transaction
57. Other deposits
0 Financial
transaction
58. Loan to Government
100 Financial
transaction
59. Loan banks
20 Financial
transaction
60. Foreign financial assets
-224 Financial
transaction
61. Other accounts payable
-50 Financial
transaction
62. Total 823
Sequence of accounts
The sequence of accounts compiled from the above accounts of central bank are as follows:
Table 3.6: Sequence of accounts for central bank (S121)
I: Production account
Resources
P.1 Output 112
P.11 Market Output 19
P.12 Output for own final use
P.13 Non-market output 93
Uses
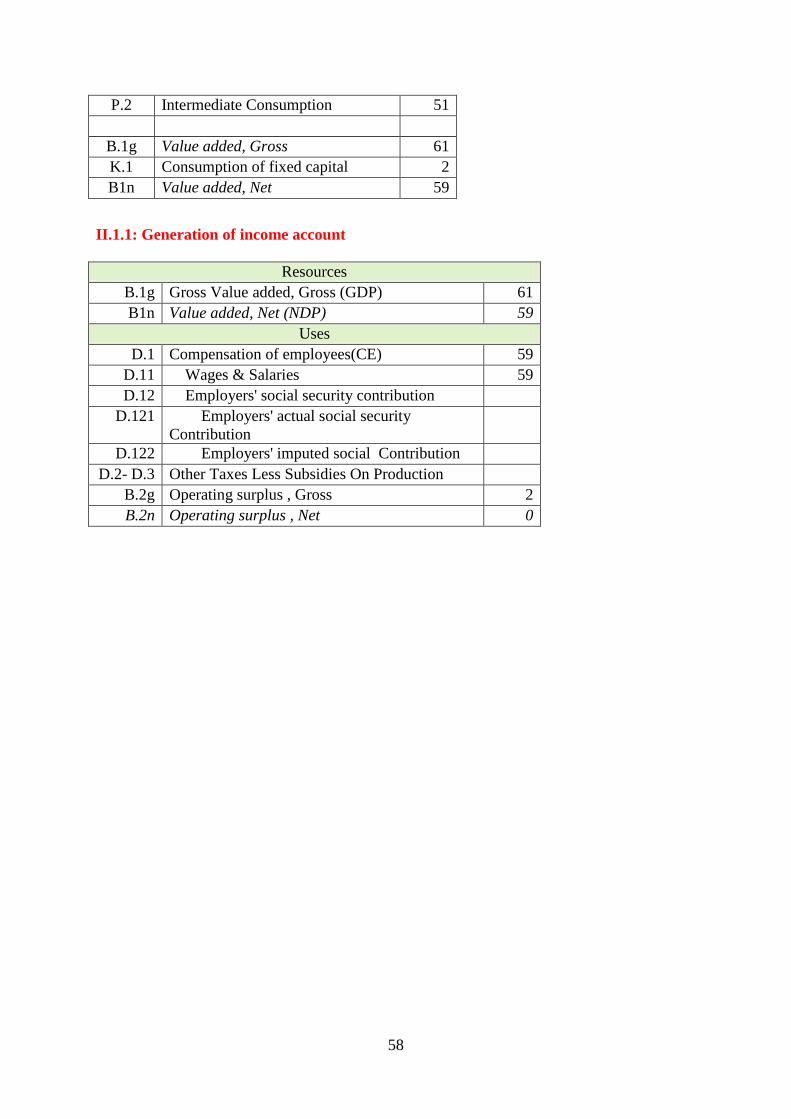
58
P.2 Intermediate Consumption 51
B.1g Value added, Gross 61
K.1 Consumption of fixed capital 2
B1n Value added, Net 59
II.1.1: Generation of income account
Resources
B.1g Gross Value added, Gross (GDP) 61
B1n Value added, Net (NDP) 59
Uses
D.1 Compensation of employees(CE) 59
D.11 Wages & Salaries 59
D.12 Employers' social security contribution
D.121 Employers' actual social security
Contribution
D.122 Employers' imputed social Contribution
D.2- D.3 Other Taxes Less Subsidies On Production
B.2g Operating surplus , Gross 2
B.2n Operating surplus , Net 0
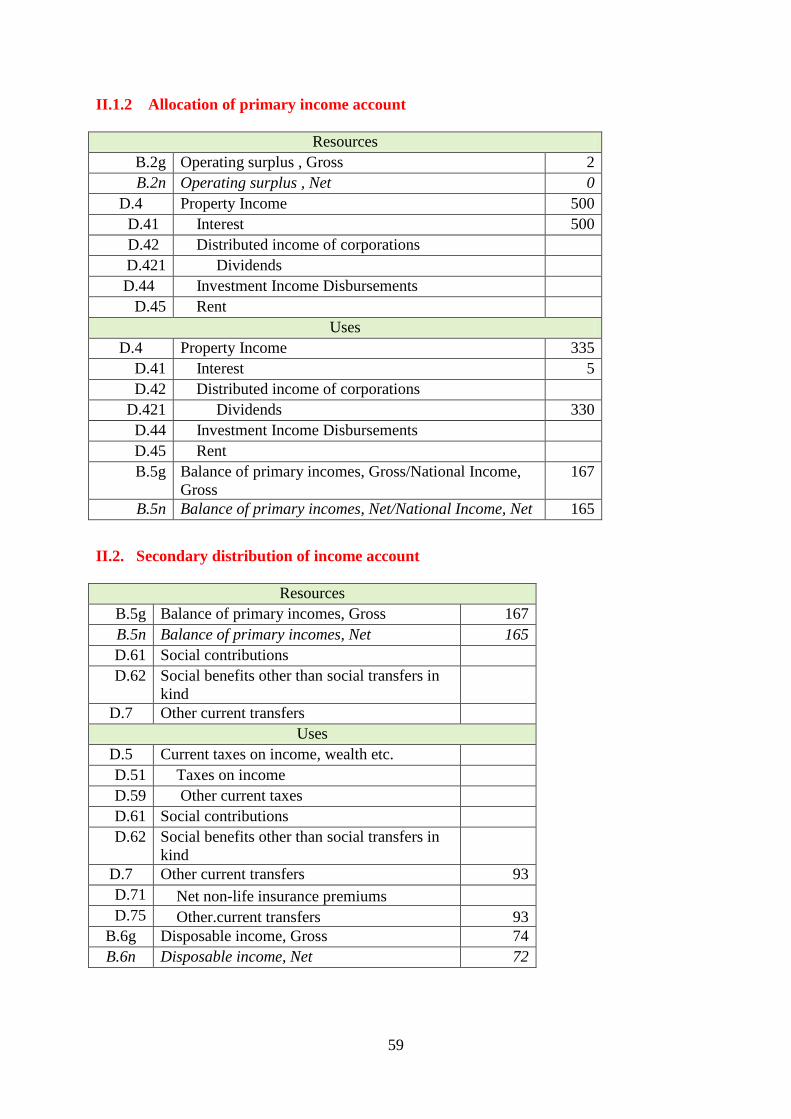
59
II.1.2 Allocation of primary income account
Resources
B.2g Operating surplus , Gross 2
B.2n Operating surplus , Net 0
D.4 Property Income 500
D.41 Interest 500
D.42 Distributed income of corporations
D.421 Dividends
D.44 Investment Income Disbursements
D.45 Rent
Uses
D.4 Property Income 335
D.41 Interest 5
D.42 Distributed income of corporations
D.421 Dividends 330
D.44 Investment Income Disbursements
D.45 Rent
B.5g Balance of primary incomes, Gross/National Income,
Gross
167
B.5n Balance of primary incomes, Net/National Income, Net 165
II.2. Secondary distribution of income account
Resources
B.5g Balance of primary incomes, Gross 167
B.5n Balance of primary incomes, Net 165
D.61 Social contributions
D.62 Social benefits other than social transfers in
kind
D.7 Other current transfers
Uses
D.5 Current taxes on income, wealth etc.
D.51 Taxes on income
D.59 Other current taxes
D.61 Social contributions
D.62 Social benefits other than social transfers in
kind
D.7 Other current transfers 93
D.71 Net non-life insurance premiums
D.75 Other.current transfers 93
B.6g Disposable income, Gross 74
B.6n Disposable income, Net 72
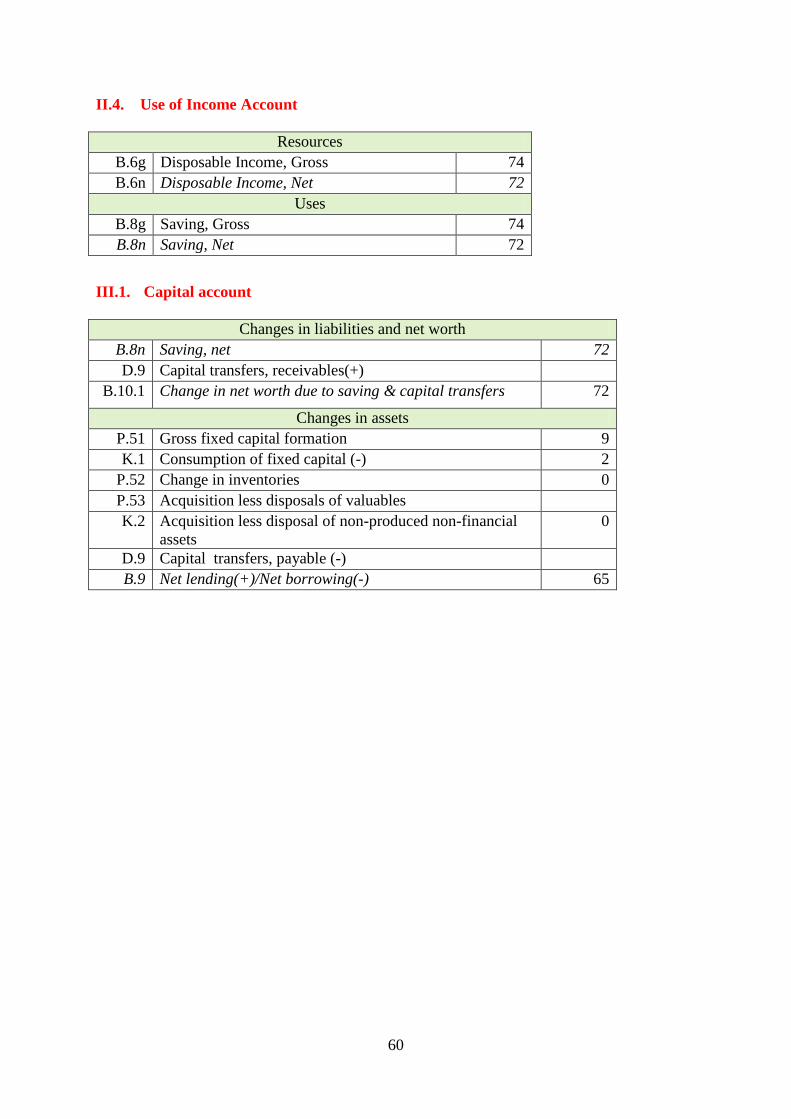
60
II.4. Use of Income Account
Resources
B.6g Disposable Income, Gross 74
B.6n Disposable Income, Net 72
Uses
B.8g Saving, Gross 74
B.8n Saving, Net 72
III.1. Capital account
Changes in liabilities and net worth
B.8n Saving, net 72
D.9 Capital transfers, receivables(+)
B.10.1 Change in net worth due to saving & capital transfers 72
Changes in assets
P.51 Gross fixed capital formation 9
K.1 Consumption of fixed capital (-) 2
P.52 Change in inventories 0
P.53 Acquisition less disposals of valuables
K.2 Acquisition less disposal of non-produced non-financial
assets
0
D.9 Capital transfers, payable (-)
B.9 Net lending(+)/Net borrowing(-) 65
61
4. Commercial Banks (S122)
The commercial banks are deposit-taking corporations categorised under financial
intermediaries in the financial corporations sector. The commercial banks sub-sector is the
most important and contributes to a major part of the services provided by the financial
corporations sector.
The main activity of banks is financial intermediation. In addition, they also carry out
secondary functions such as issue of traveller cheques, bank drafts, credit/debit cards,
accepting payments for utilities, etc., from which they derive explicit charges. The major part
of income of the banks, however, comes from the financial intermediation services in the
form of difference between interest receipts on loans and interest payments on deposits.
The banks do not charge for services they provide in arranging the financial intermediation
services to depositors and borrowers. For example, the money paid by a bank on a deposit is
described as interest by the bank but is not the amount recorded as interest in the SNA
because the amount paid by the bank is assumed to be a compound payment representing
interest as understood in the SNA less the service charges levied on the depositor for the costs
of operating the account. Therefore, these service charges are estimated indirectly in the
SNA.
Since these service charges are estimated indirectly, they are not shown as intermediate
consumption or final use by the user sectors and industries. Hence, the service charges of
banks estimated indirectly need to be allocated to the sectors/industries, which have availed
these financial intermediation services.
4.1 Concepts and definitions followed in SNA
Commercial banks are deposit-taking corporations that have financial intermediation25
as
their principal activity. These institutions accept deposits and give loans to businesses and
consumers, besides providing a number of financial services. They have liabilities in the
form of deposits or financial instruments (such as short-term certificates of deposit) that are
close substitutes for deposits and assets that include loans.
Financial services provided by banks charge for their services explicitly or implicitly, mainly:
a) Financial services provided in return for explicit charges;
b) Financial services provided in association with interest26
charges on loans and
deposits;
25
Financial intermediation involves financial risk management and liquidity transformation, activities in which
an institutional unit incurs financial liabilities for the purpose of acquiring mainly financial assets. Corporations
engaged in these activities obtain funds, not only by taking deposits but also by issuing bills, bonds or other
securities. They use these funds as well as own funds to acquire mainly financial assets not only by making
advances or loans to others but also by purchasing bills, bonds or other securities. 26
Interest is a form of income that is receivable by the owners of certain kinds of financial assets, namely:
deposits, debt securities, loans and (possibly) other accounts receivable for putting the financial asset at the
disposal of another institutional unit.
62
The explicit charges include fees paid for getting a bank draft, commissions charged for
services, annual fees for using certain types of banking services, etc.
Implicit charges arise from the financial services provided in association with interest charges
on loans and deposits and these are described in the SNA as FISIM.
4.2 Sources of data
In most countries, the functions of commercial banks are regulated by the central bank. As
part of compliance to these regulations, banks prepare their financial statements generally in
accordance with the standardised structure recommended in IAS27
/IFRS.
The financial statements of commercial banks that include income account and the balance
sheet are the basic sources for compiling SNA sequence of accounts in respect of commercial
banks. In addition, the central bank or the regulatory agency collects and consolidates the
financial statements of all commercial banks in the context of monetary policy and/or
supervisory functions. Moreover, the central bank and/or regulatory agency may also
prescribe returns or conduct surveys to collect information on banking activities.
Other possible data sources include surveys or censuses conducted by other government
agencies, surveys conducted by private enterprises and industry groups, or the
enterprise/establishment surveys of statistical offices in which the information on interest
payments and receipts are collected.
The above data sources facilitate compilation of output of commercial banks, the financial
services provided in association with deposits and loans, the interest that is to be recorded in
the SNA, and allocation of FISIM to user sectors and industries.
4.3 Structure of accounts
As in the case of non-financial corporations, the financial statements comprise the income
statement, balance sheet, cash flow statement and accounting policies and explanatory notes.
The income statement (also termed as profit and loss account) contains details on interest
earned, profit/loss on sale of investment, dividends earned, rent, commission/exchange/
brokerage/miscellaneous income, gain/loss on exchange, profit/loss on sale of assets, etc. on
the income side. On the expenditure side, the details include interest expended, rent,
depreciation, repair and maintenance, insurance, other office expenses (printing, advertising,
telephone, auditors‘ fees, etc.), payments to employees, dividends, taxes, transfers to
reserves, etc.
The balance sheet contains details on share capital, reserves, profit/loss from income account,
deposits (separately for domestic and foreign), borrowings, other liabilities, cash and bank
balances, investments in securities and companies (separately within and outside the
27
For details on IAS, please visit the link http://www.iasplus.com/en/standards/ias.
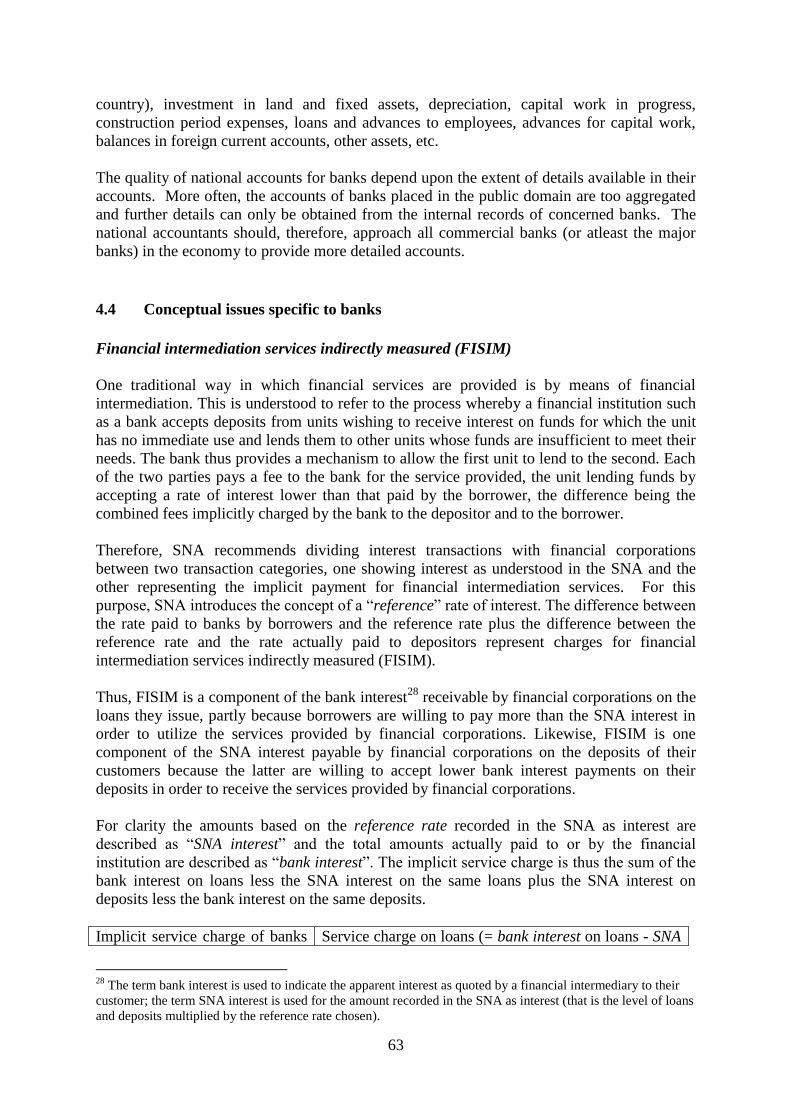
63
country), investment in land and fixed assets, depreciation, capital work in progress,
construction period expenses, loans and advances to employees, advances for capital work,
balances in foreign current accounts, other assets, etc.
The quality of national accounts for banks depend upon the extent of details available in their
accounts. More often, the accounts of banks placed in the public domain are too aggregated
and further details can only be obtained from the internal records of concerned banks. The
national accountants should, therefore, approach all commercial banks (or atleast the major
banks) in the economy to provide more detailed accounts.
4.4 Conceptual issues specific to banks
Financial intermediation services indirectly measured (FISIM)
One traditional way in which financial services are provided is by means of financial
intermediation. This is understood to refer to the process whereby a financial institution such
as a bank accepts deposits from units wishing to receive interest on funds for which the unit
has no immediate use and lends them to other units whose funds are insufficient to meet their
needs. The bank thus provides a mechanism to allow the first unit to lend to the second. Each
of the two parties pays a fee to the bank for the service provided, the unit lending funds by
accepting a rate of interest lower than that paid by the borrower, the difference being the
combined fees implicitly charged by the bank to the depositor and to the borrower.
Therefore, SNA recommends dividing interest transactions with financial corporations
between two transaction categories, one showing interest as understood in the SNA and the
other representing the implicit payment for financial intermediation services. For this
purpose, SNA introduces the concept of a ―reference‖ rate of interest. The difference between
the rate paid to banks by borrowers and the reference rate plus the difference between the
reference rate and the rate actually paid to depositors represent charges for financial
intermediation services indirectly measured (FISIM).
Thus, FISIM is a component of the bank interest28
receivable by financial corporations on the
loans they issue, partly because borrowers are willing to pay more than the SNA interest in
order to utilize the services provided by financial corporations. Likewise, FISIM is one
component of the SNA interest payable by financial corporations on the deposits of their
customers because the latter are willing to accept lower bank interest payments on their
deposits in order to receive the services provided by financial corporations.
For clarity the amounts based on the reference rate recorded in the SNA as interest are
described as ―SNA interest‖ and the total amounts actually paid to or by the financial
institution are described as ―bank interest‖. The implicit service charge is thus the sum of the
bank interest on loans less the SNA interest on the same loans plus the SNA interest on
deposits less the bank interest on the same deposits.
Implicit service charge of banks Service charge on loans (= bank interest on loans - SNA
28
The term bank interest is used to indicate the apparent interest as quoted by a financial intermediary to their
customer; the term SNA interest is used for the amount recorded in the SNA as interest (that is the level of loans
and deposits multiplied by the reference rate chosen).
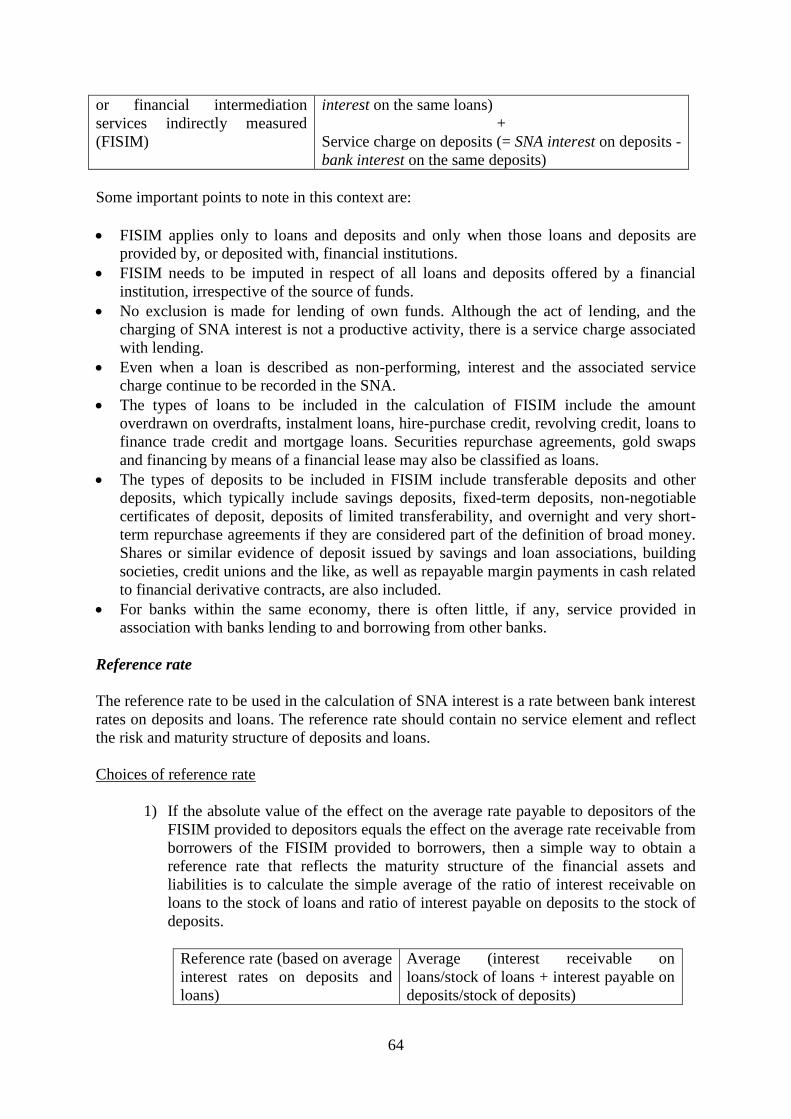
64
or financial intermediation
services indirectly measured
(FISIM)
interest on the same loans)
+
Service charge on deposits (= SNA interest on deposits -
bank interest on the same deposits)
Some important points to note in this context are:
FISIM applies only to loans and deposits and only when those loans and deposits are
provided by, or deposited with, financial institutions.
FISIM needs to be imputed in respect of all loans and deposits offered by a financial
institution, irrespective of the source of funds.
No exclusion is made for lending of own funds. Although the act of lending, and the
charging of SNA interest is not a productive activity, there is a service charge associated
with lending.
Even when a loan is described as non-performing, interest and the associated service
charge continue to be recorded in the SNA.
The types of loans to be included in the calculation of FISIM include the amount
overdrawn on overdrafts, instalment loans, hire-purchase credit, revolving credit, loans to
finance trade credit and mortgage loans. Securities repurchase agreements, gold swaps
and financing by means of a financial lease may also be classified as loans.
The types of deposits to be included in FISIM include transferable deposits and other
deposits, which typically include savings deposits, fixed-term deposits, non-negotiable
certificates of deposit, deposits of limited transferability, and overnight and very short-
term repurchase agreements if they are considered part of the definition of broad money.
Shares or similar evidence of deposit issued by savings and loan associations, building
societies, credit unions and the like, as well as repayable margin payments in cash related
to financial derivative contracts, are also included.
For banks within the same economy, there is often little, if any, service provided in
association with banks lending to and borrowing from other banks.
Reference rate
The reference rate to be used in the calculation of SNA interest is a rate between bank interest
rates on deposits and loans. The reference rate should contain no service element and reflect
the risk and maturity structure of deposits and loans.
Choices of reference rate
1) If the absolute value of the effect on the average rate payable to depositors of the
FISIM provided to depositors equals the effect on the average rate receivable from
borrowers of the FISIM provided to borrowers, then a simple way to obtain a
reference rate that reflects the maturity structure of the financial assets and
liabilities is to calculate the simple average of the ratio of interest receivable on
loans to the stock of loans and ratio of interest payable on deposits to the stock of
deposits.
Reference rate (based on average
interest rates on deposits and
loans)
Average (interest receivable on
loans/stock of loans + interest payable on
deposits/stock of deposits)
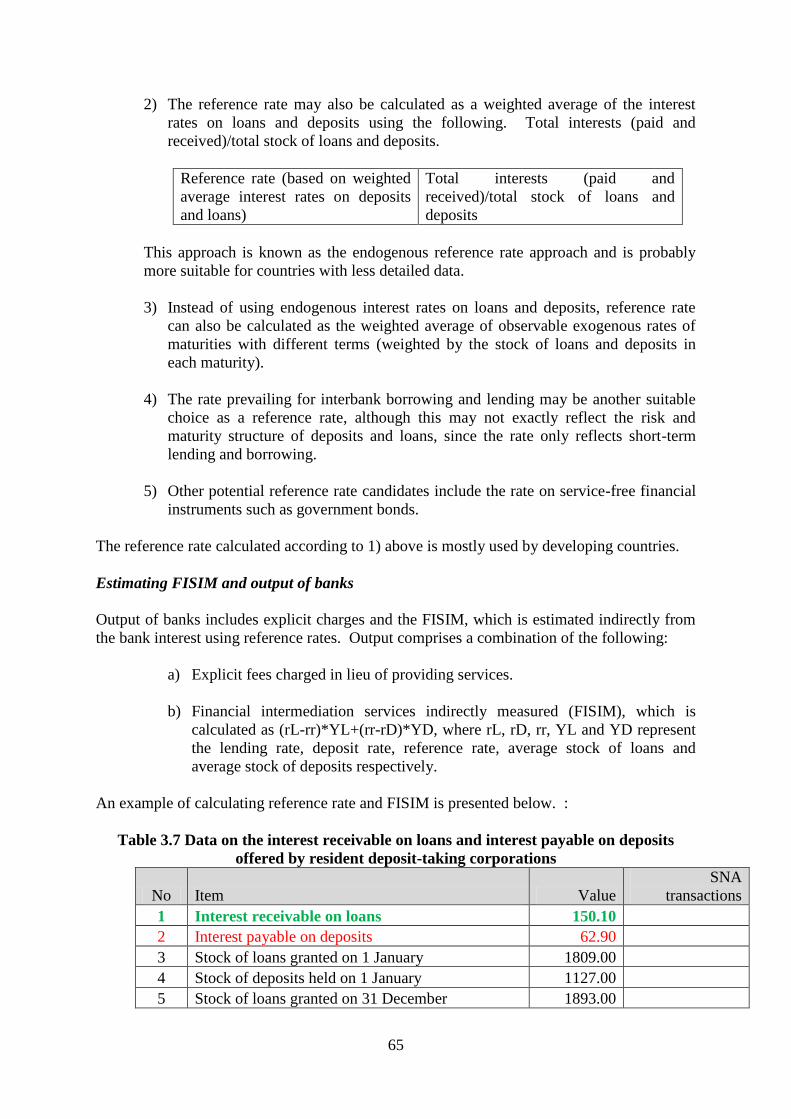
65
2) The reference rate may also be calculated as a weighted average of the interest
rates on loans and deposits using the following. Total interests (paid and
received)/total stock of loans and deposits.
Reference rate (based on weighted
average interest rates on deposits
and loans)
Total interests (paid and
received)/total stock of loans and
deposits
This approach is known as the endogenous reference rate approach and is probably
more suitable for countries with less detailed data.
3) Instead of using endogenous interest rates on loans and deposits, reference rate
can also be calculated as the weighted average of observable exogenous rates of
maturities with different terms (weighted by the stock of loans and deposits in
each maturity).
4) The rate prevailing for interbank borrowing and lending may be another suitable
choice as a reference rate, although this may not exactly reflect the risk and
maturity structure of deposits and loans, since the rate only reflects short-term
lending and borrowing.
5) Other potential reference rate candidates include the rate on service-free financial
instruments such as government bonds.
The reference rate calculated according to 1) above is mostly used by developing countries.
Estimating FISIM and output of banks
Output of banks includes explicit charges and the FISIM, which is estimated indirectly from
the bank interest using reference rates. Output comprises a combination of the following:
a) Explicit fees charged in lieu of providing services.
b) Financial intermediation services indirectly measured (FISIM), which is
calculated as (rL-rr)*YL+(rr-rD)*YD, where rL, rD, rr, YL and YD represent
the lending rate, deposit rate, reference rate, average stock of loans and
average stock of deposits respectively.
An example of calculating reference rate and FISIM is presented below. :
Table 3.7 Data on the interest receivable on loans and interest payable on deposits
offered by resident deposit-taking corporations
No Item Value
SNA
transactions
1 Interest receivable on loans 150.10
2 Interest payable on deposits 62.90
3 Stock of loans granted on 1 January 1809.00
4 Stock of deposits held on 1 January 1127.00
5 Stock of loans granted on 31 December 1893.00
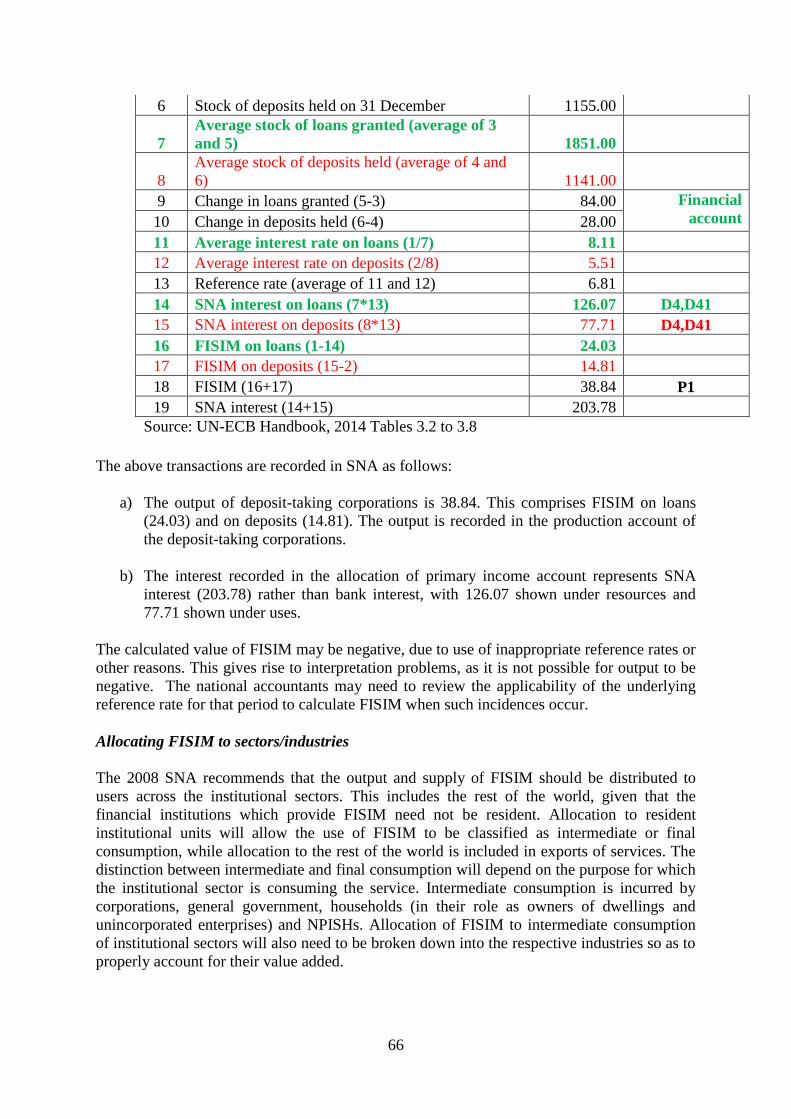
66
6 Stock of deposits held on 31 December 1155.00
7
Average stock of loans granted (average of 3
and 5) 1851.00
8
Average stock of deposits held (average of 4 and
6) 1141.00
9 Change in loans granted (5-3) 84.00 Financial
account 10 Change in deposits held (6-4) 28.00
11 Average interest rate on loans (1/7) 8.11
12 Average interest rate on deposits (2/8) 5.51
13 Reference rate (average of 11 and 12) 6.81
14 SNA interest on loans (7*13) 126.07 D4,D41
15 SNA interest on deposits (8*13) 77.71 D4,D41
16 FISIM on loans (1-14) 24.03
17 FISIM on deposits (15-2) 14.81
18 FISIM (16+17) 38.84 P1
19 SNA interest (14+15) 203.78
Source: UN-ECB Handbook, 2014 Tables 3.2 to 3.8
The above transactions are recorded in SNA as follows:
a) The output of deposit-taking corporations is 38.84. This comprises FISIM on loans
(24.03) and on deposits (14.81). The output is recorded in the production account of
the deposit-taking corporations.
b) The interest recorded in the allocation of primary income account represents SNA
interest (203.78) rather than bank interest, with 126.07 shown under resources and
77.71 shown under uses.
The calculated value of FISIM may be negative, due to use of inappropriate reference rates or
other reasons. This gives rise to interpretation problems, as it is not possible for output to be
negative. The national accountants may need to review the applicability of the underlying
reference rate for that period to calculate FISIM when such incidences occur.
Allocating FISIM to sectors/industries
The 2008 SNA recommends that the output and supply of FISIM should be distributed to
users across the institutional sectors. This includes the rest of the world, given that the
financial institutions which provide FISIM need not be resident. Allocation to resident
institutional units will allow the use of FISIM to be classified as intermediate or final
consumption, while allocation to the rest of the world is included in exports of services. The
distinction between intermediate and final consumption will depend on the purpose for which
the institutional sector is consuming the service. Intermediate consumption is incurred by
corporations, general government, households (in their role as owners of dwellings and
unincorporated enterprises) and NPISHs. Allocation of FISIM to intermediate consumption
of institutional sectors will also need to be broken down into the respective industries so as to
properly account for their value added.
67
Depending on the nature of the source data, the national accountants can consider two
approaches to allocate FISIM and related transactions to sectors. The first approach can be
described as the ―bottom-up‖ approach. This approach assumes that the data on interest
receivable on loans, interest payable on deposits and stocks of loans and deposits by
institutional sector (including the rest of the world) is available. Thus, it can directly compute
the FISIM and SNA interest on loans and deposits to be allocated to each sector. These
transactions are then summed up to obtain the economy-wide estimates. However, while
doing so, careful distinction should be made for households between those as owners of
dwellings, unincorporated enterprises and consumer households, since the allocation to
former two refer to intermediate consumption (to be recorded in production account of
sectors on the use side) and the allocation to the later refers to final consumption expenditure
(to be recorded in the use of income account of households on the use side).
However, it is likely that the input data may only be available without a sectoral breakdown,
especially in the case of developing countries. Consequently, the national accountants may
need to consider the use of the second approach, which can be described as the ―top-down‖
approach. In this approach, firstly the total FISIM, SNA interest and bank interest on loans
and deposits are calculated using the available data from the source agencies (as illustrated in
the above table). Secondly, the calculated data is allocated to user sectors using various
indicators such as loan/deposit balances or interest receivable/payable. Such information
may be available from various sources such as business accounts, government accounts,
enterprise and household surveys.
Further, resident institutional units are also likely to be clients of non-resident deposit-taking
corporations. Estimates of the total imports of FISIM, SNA interest and bank interest on
loans and deposits can be obtained directly from balance of payments statistics or through
estimation techniques. These estimates then need to be allocated to the resident institutional
sectors. This may be done either through information available from surveys and
administrative data or using various assumptions, for example, allocating the data in
proportion to the sectoral data on stocks of loans and deposits of resident deposit taking
corporations.
The allocation of FISIM to the intermediate consumption expenditure of these institutional
units will also need to be broken down into the respective industries so as to properly account
for their value added.
It is unlikely that the input data to calculate FISIM and SNA interest by industry will be
available at the industry level. Thus, it may not be possible to directly compute the FISIM
and SNA interest for each industry using the ―bottom-up‖ approach. Instead, the compiling
agency will need to allocate the intermediate consumption of domestically produced FISIM
to industries using the ―top-down‖ approach using indicators such as the shares of the stocks
of loans and deposits, gross value added, or the output of each industry. Generally, banks or
the central bank maintain information on stock of deposits and loans disaggregated by
industries and for sectors including consumer households. Another source for indicators to
allocate FISIM could be the various household and enterprise/establishment surveys
conducted by the statistical offices and the administrative data such as business and
government accounts. Generally, information on stock of loans and deposits and interest
received and paid is available in these sources.
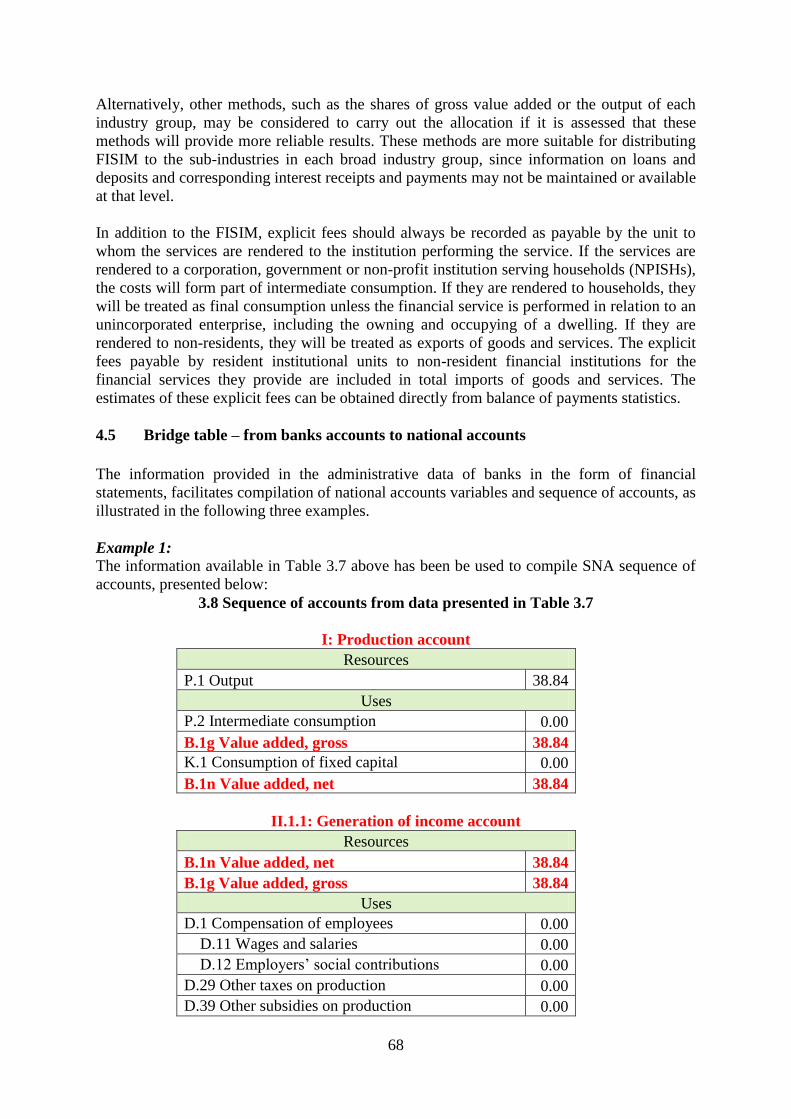
68
Alternatively, other methods, such as the shares of gross value added or the output of each
industry group, may be considered to carry out the allocation if it is assessed that these
methods will provide more reliable results. These methods are more suitable for distributing
FISIM to the sub-industries in each broad industry group, since information on loans and
deposits and corresponding interest receipts and payments may not be maintained or available
at that level.
In addition to the FISIM, explicit fees should always be recorded as payable by the unit to
whom the services are rendered to the institution performing the service. If the services are
rendered to a corporation, government or non-profit institution serving households (NPISHs),
the costs will form part of intermediate consumption. If they are rendered to households, they
will be treated as final consumption unless the financial service is performed in relation to an
unincorporated enterprise, including the owning and occupying of a dwelling. If they are
rendered to non-residents, they will be treated as exports of goods and services. The explicit
fees payable by resident institutional units to non-resident financial institutions for the
financial services they provide are included in total imports of goods and services. The
estimates of these explicit fees can be obtained directly from balance of payments statistics.
4.5 Bridge table – from banks accounts to national accounts
The information provided in the administrative data of banks in the form of financial
statements, facilitates compilation of national accounts variables and sequence of accounts, as
illustrated in the following three examples.
Example 1:
The information available in Table 3.7 above has been be used to compile SNA sequence of
accounts, presented below:
3.8 Sequence of accounts from data presented in Table 3.7
I: Production account
Resources
P.1 Output 38.84
Uses
P.2 Intermediate consumption 0.00
B.1g Value added, gross 38.84
K.1 Consumption of fixed capital 0.00
B.1n Value added, net 38.84
II.1.1: Generation of income account
Resources
B.1n Value added, net 38.84
B.1g Value added, gross 38.84
Uses
D.1 Compensation of employees 0.00
D.11 Wages and salaries 0.00
D.12 Employers‘ social contributions 0.00
D.29 Other taxes on production 0.00
D.39 Other subsidies on production 0.00
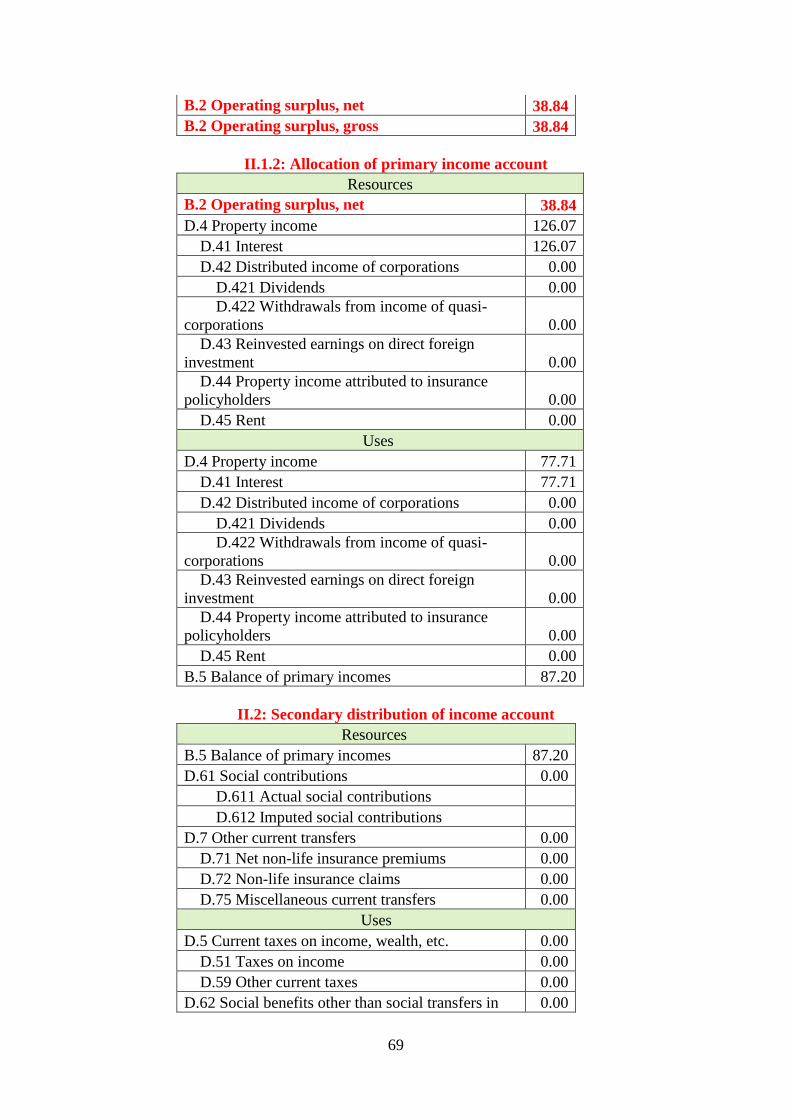
69
B.2 Operating surplus, net 38.84
B.2 Operating surplus, gross 38.84
II.1.2: Allocation of primary income account
Resources
B.2 Operating surplus, net 38.84
D.4 Property income 126.07
D.41 Interest 126.07
D.42 Distributed income of corporations 0.00
D.421 Dividends 0.00
D.422 Withdrawals from income of quasi-
corporations 0.00
D.43 Reinvested earnings on direct foreign
investment 0.00
D.44 Property income attributed to insurance
policyholders 0.00
D.45 Rent 0.00
Uses
D.4 Property income 77.71
D.41 Interest 77.71
D.42 Distributed income of corporations 0.00
D.421 Dividends 0.00
D.422 Withdrawals from income of quasi-
corporations 0.00
D.43 Reinvested earnings on direct foreign
investment 0.00
D.44 Property income attributed to insurance
policyholders 0.00
D.45 Rent 0.00
B.5 Balance of primary incomes 87.20
II.2: Secondary distribution of income account
Resources
B.5 Balance of primary incomes 87.20
D.61 Social contributions 0.00
D.611 Actual social contributions
D.612 Imputed social contributions
D.7 Other current transfers 0.00
D.71 Net non-life insurance premiums 0.00
D.72 Non-life insurance claims 0.00
D.75 Miscellaneous current transfers 0.00
Uses
D.5 Current taxes on income, wealth, etc. 0.00
D.51 Taxes on income 0.00
D.59 Other current taxes 0.00
D.62 Social benefits other than social transfers in 0.00
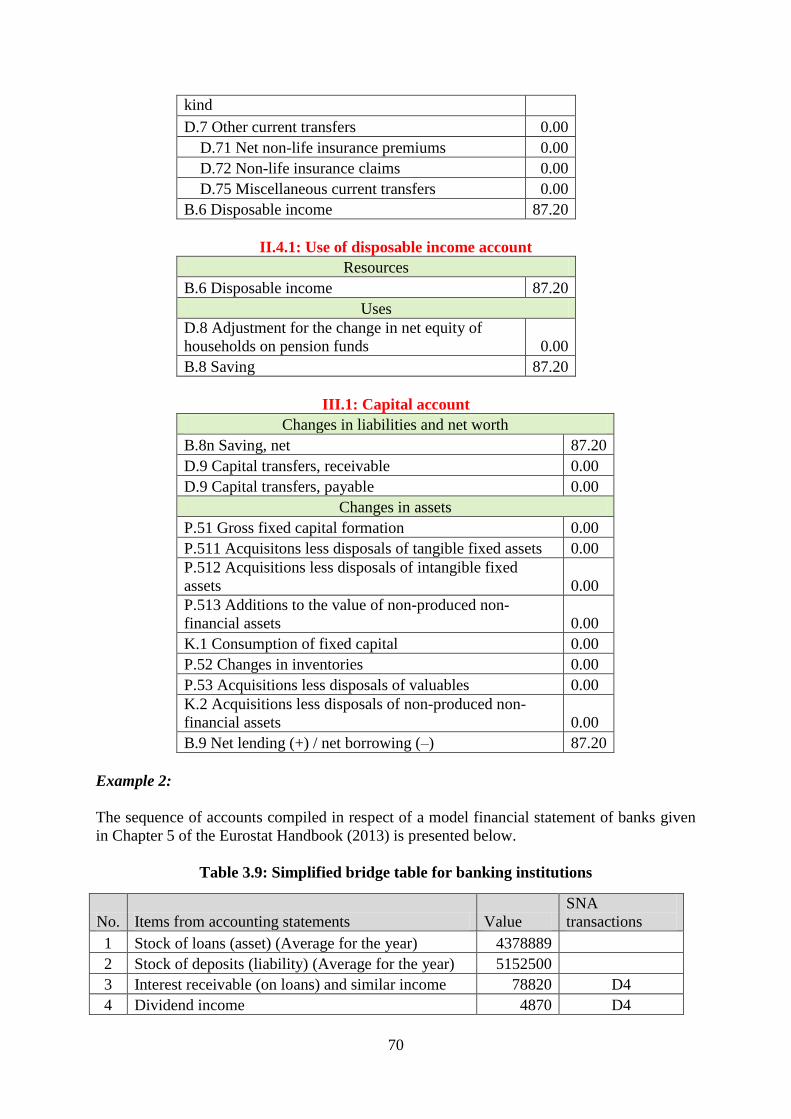
70
kind
D.7 Other current transfers 0.00
D.71 Net non-life insurance premiums 0.00
D.72 Non-life insurance claims 0.00
D.75 Miscellaneous current transfers 0.00
B.6 Disposable income 87.20
II.4.1: Use of disposable income account
Resources
B.6 Disposable income 87.20
Uses
D.8 Adjustment for the change in net equity of
households on pension funds 0.00
B.8 Saving 87.20
III.1: Capital account
Changes in liabilities and net worth
B.8n Saving, net 87.20
D.9 Capital transfers, receivable 0.00
D.9 Capital transfers, payable 0.00
Changes in assets
P.51 Gross fixed capital formation 0.00
P.511 Acquisitons less disposals of tangible fixed assets 0.00
P.512 Acquisitions less disposals of intangible fixed
assets 0.00
P.513 Additions to the value of non-produced non-
financial assets 0.00
K.1 Consumption of fixed capital 0.00
P.52 Changes in inventories 0.00
P.53 Acquisitions less disposals of valuables 0.00
K.2 Acquisitions less disposals of non-produced non-
financial assets 0.00
B.9 Net lending (+) / net borrowing (–) 87.20
Example 2:
The sequence of accounts compiled in respect of a model financial statement of banks given
in Chapter 5 of the Eurostat Handbook (2013) is presented below.
Table 3.9: Simplified bridge table for banking institutions
No. Items from accounting statements Value
SNA
transactions
1 Stock of loans (asset) (Average for the year) 4378889
2 Stock of deposits (liability) (Average for the year) 5152500
3 Interest receivable (on loans) and similar income 78820 D4
4 Dividend income 4870 D4
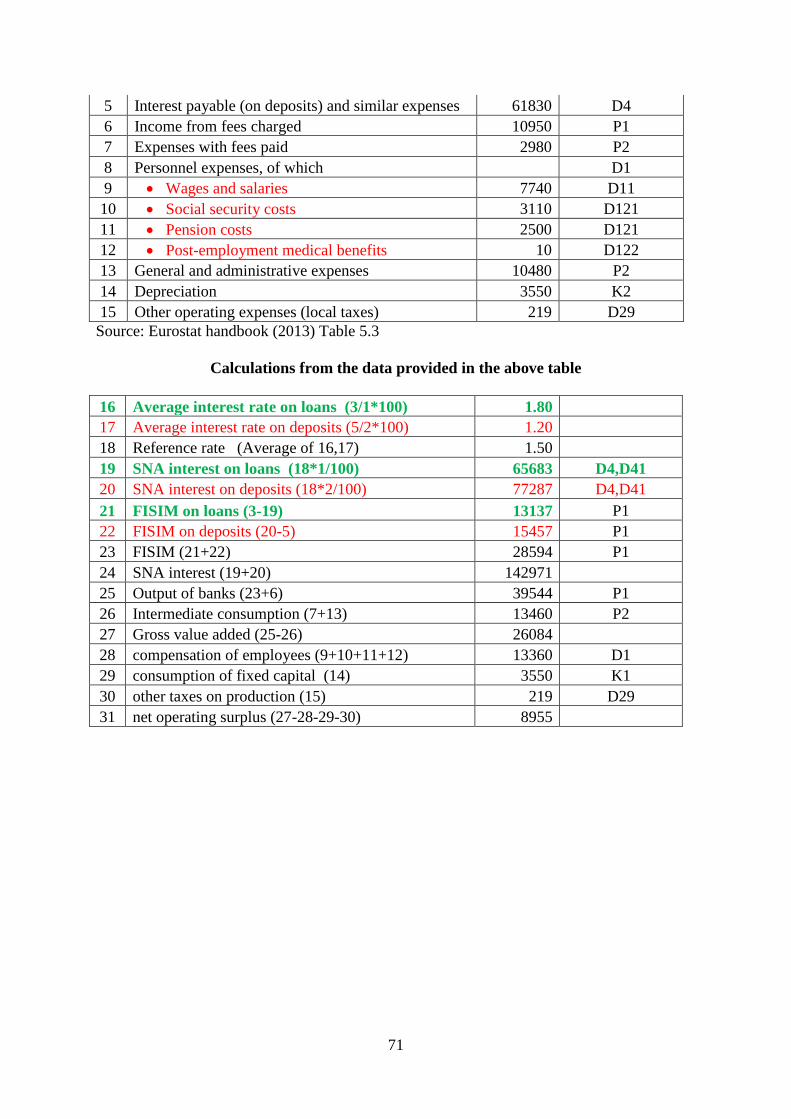
71
5 Interest payable (on deposits) and similar expenses 61830 D4
6 Income from fees charged 10950 P1
7 Expenses with fees paid 2980 P2
8 Personnel expenses, of which D1
9 Wages and salaries 7740 D11
10 Social security costs 3110 D121
11 Pension costs 2500 D121
12 Post-employment medical benefits 10 D122
13 General and administrative expenses 10480 P2
14 Depreciation 3550 K2
15 Other operating expenses (local taxes) 219 D29
Source: Eurostat handbook (2013) Table 5.3
Calculations from the data provided in the above table
16 Average interest rate on loans (3/1*100) 1.80
17 Average interest rate on deposits (5/2*100) 1.20
18 Reference rate (Average of 16,17) 1.50
19 SNA interest on loans (18*1/100) 65683 D4,D41
20 SNA interest on deposits (18*2/100) 77287 D4,D41
21 FISIM on loans (3-19) 13137 P1
22 FISIM on deposits (20-5) 15457 P1
23 FISIM (21+22) 28594 P1
24 SNA interest (19+20) 142971
25 Output of banks (23+6) 39544 P1
26 Intermediate consumption (7+13) 13460 P2
27 Gross value added (25-26) 26084
28 compensation of employees (9+10+11+12) 13360 D1
29 consumption of fixed capital (14) 3550 K1
30 other taxes on production (15) 219 D29
31 net operating surplus (27-28-29-30) 8955
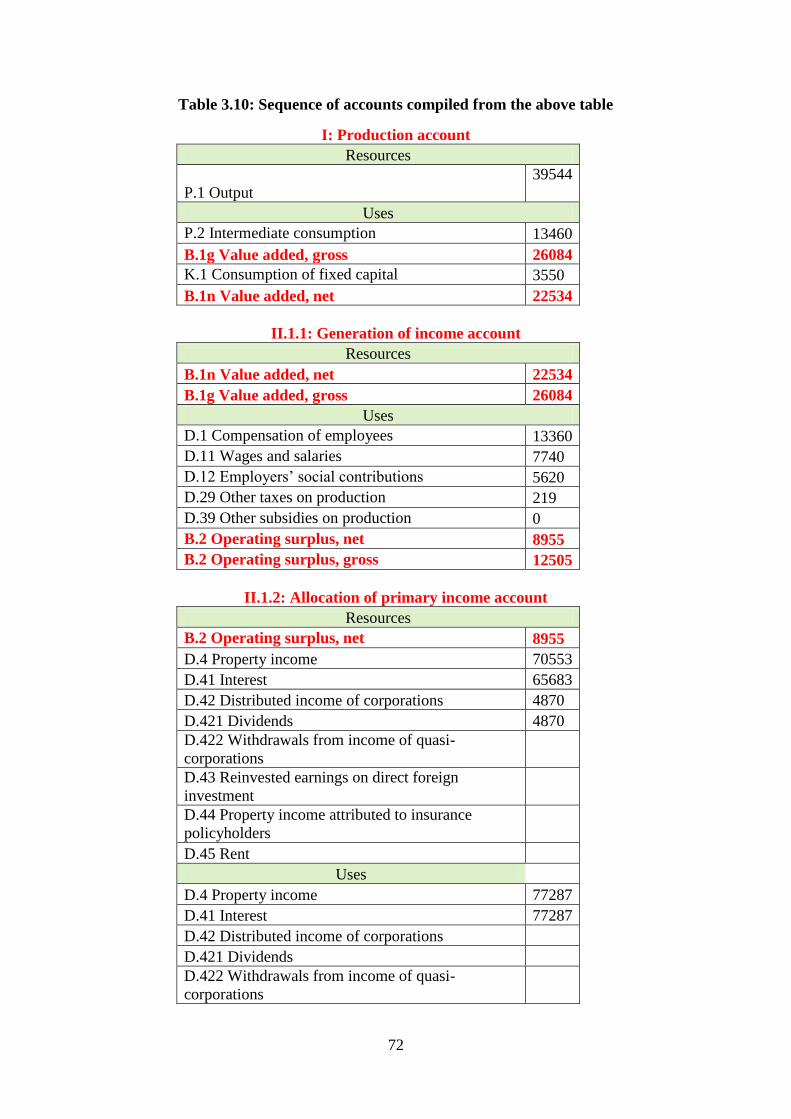
72
Table 3.10: Sequence of accounts compiled from the above table
I: Production account
Resources
P.1 Output
39544
Uses
P.2 Intermediate consumption 13460
B.1g Value added, gross 26084
K.1 Consumption of fixed capital 3550
B.1n Value added, net 22534
II.1.1: Generation of income account
Resources
B.1n Value added, net 22534
B.1g Value added, gross 26084
Uses
D.1 Compensation of employees 13360
D.11 Wages and salaries 7740
D.12 Employers‘ social contributions 5620
D.29 Other taxes on production 219
D.39 Other subsidies on production 0
B.2 Operating surplus, net 8955
B.2 Operating surplus, gross 12505
II.1.2: Allocation of primary income account
Resources
B.2 Operating surplus, net 8955
D.4 Property income 70553
D.41 Interest 65683
D.42 Distributed income of corporations 4870
D.421 Dividends 4870
D.422 Withdrawals from income of quasi-
corporations
D.43 Reinvested earnings on direct foreign
investment
D.44 Property income attributed to insurance
policyholders
D.45 Rent
Uses
D.4 Property income 77287
D.41 Interest 77287
D.42 Distributed income of corporations
D.421 Dividends
D.422 Withdrawals from income of quasi-
corporations
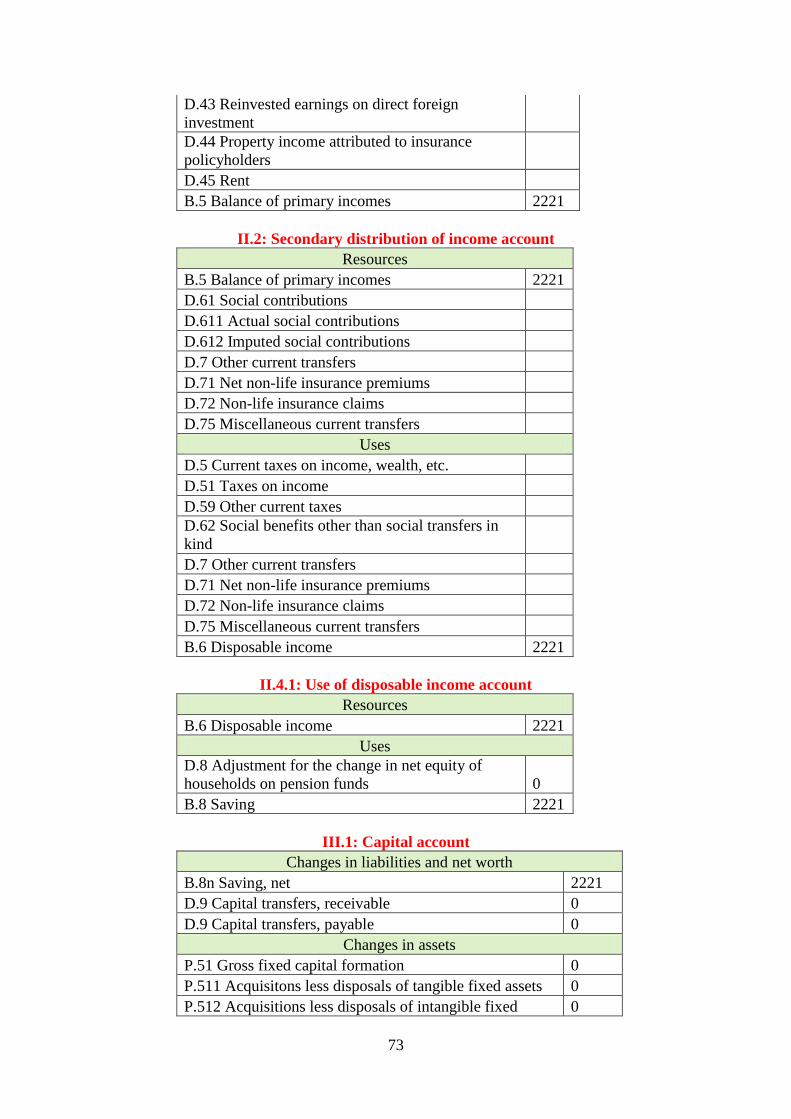
73
D.43 Reinvested earnings on direct foreign
investment
D.44 Property income attributed to insurance
policyholders
D.45 Rent
B.5 Balance of primary incomes 2221
II.2: Secondary distribution of income account
Resources
B.5 Balance of primary incomes 2221
D.61 Social contributions
D.611 Actual social contributions
D.612 Imputed social contributions
D.7 Other current transfers
D.71 Net non-life insurance premiums
D.72 Non-life insurance claims
D.75 Miscellaneous current transfers
Uses
D.5 Current taxes on income, wealth, etc.
D.51 Taxes on income
D.59 Other current taxes
D.62 Social benefits other than social transfers in
kind
D.7 Other current transfers
D.71 Net non-life insurance premiums
D.72 Non-life insurance claims
D.75 Miscellaneous current transfers
B.6 Disposable income 2221
II.4.1: Use of disposable income account
Resources
B.6 Disposable income 2221
Uses
D.8 Adjustment for the change in net equity of
households on pension funds 0
B.8 Saving 2221
III.1: Capital account
Changes in liabilities and net worth
B.8n Saving, net 2221
D.9 Capital transfers, receivable 0
D.9 Capital transfers, payable 0
Changes in assets
P.51 Gross fixed capital formation 0
P.511 Acquisitons less disposals of tangible fixed assets 0
P.512 Acquisitions less disposals of intangible fixed 0
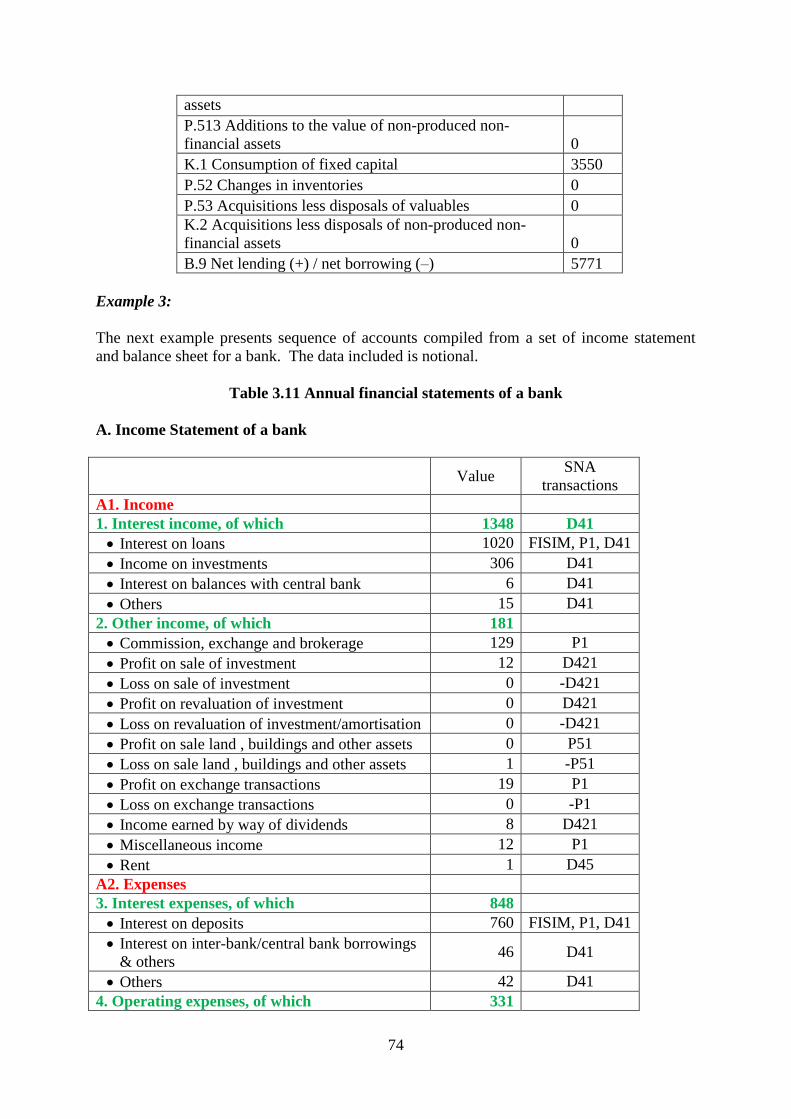
74
assets
P.513 Additions to the value of non-produced non-
financial assets 0
K.1 Consumption of fixed capital 3550
P.52 Changes in inventories 0
P.53 Acquisitions less disposals of valuables 0
K.2 Acquisitions less disposals of non-produced non-
financial assets 0
B.9 Net lending (+) / net borrowing (–) 5771
Example 3:
The next example presents sequence of accounts compiled from a set of income statement
and balance sheet for a bank. The data included is notional.
Table 3.11 Annual financial statements of a bank
A. Income Statement of a bank
Value
SNA
transactions
A1. Income
1. Interest income, of which 1348 D41
Interest on loans 1020 FISIM, P1, D41
Income on investments 306 D41
Interest on balances with central bank 6 D41
Others 15 D41
2. Other income, of which 181
Commission, exchange and brokerage 129 P1
Profit on sale of investment 12 D421
Loss on sale of investment 0 -D421
Profit on revaluation of investment 0 D421
Loss on revaluation of investment/amortisation 0 -D421
Profit on sale land , buildings and other assets 0 P51
Loss on sale land , buildings and other assets 1 -P51
Profit on exchange transactions 19 P1
Loss on exchange transactions 0 -P1
Income earned by way of dividends 8 D421
Miscellaneous income 12 P1
Rent 1 D45
A2. Expenses
3. Interest expenses, of which 848
Interest on deposits 760 FISIM, P1, D41
Interest on inter-bank/central bank borrowings
& others 46 D41
Others 42 D41
4. Operating expenses, of which 331
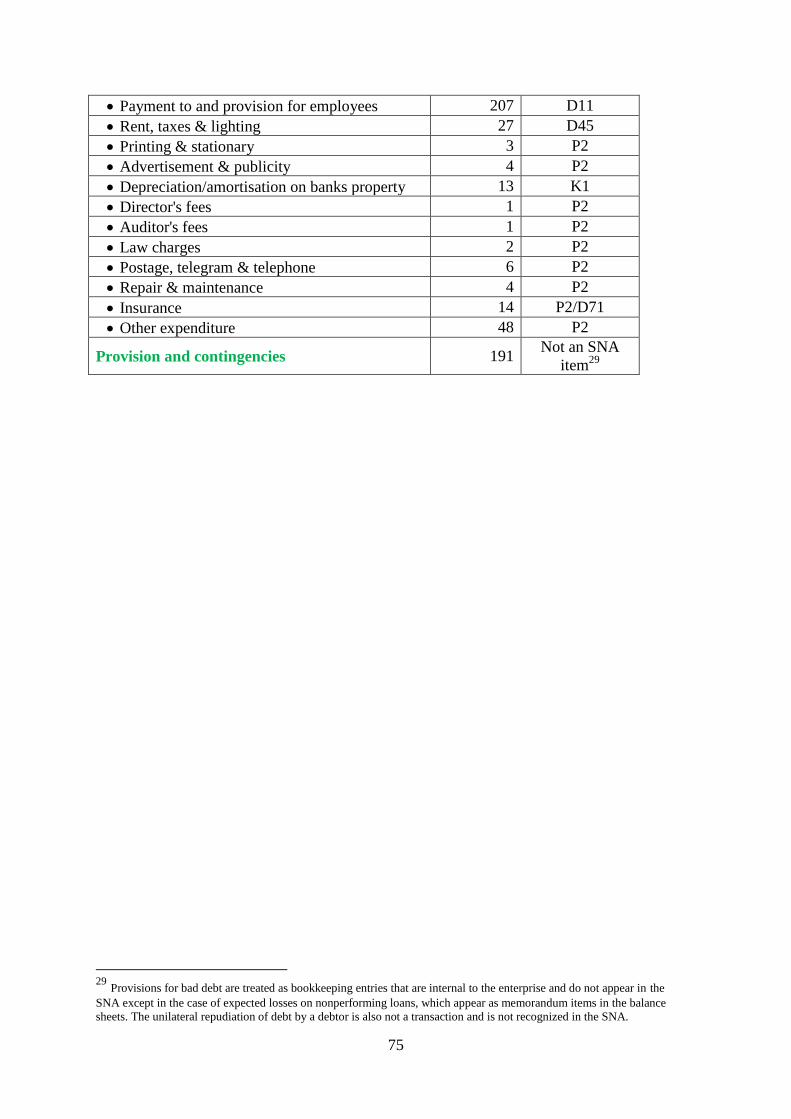
75
Payment to and provision for employees 207 D11
Rent, taxes & lighting 27 D45
Printing & stationary 3 P2
Advertisement & publicity 4 P2
Depreciation/amortisation on banks property 13 K1
Director's fees 1 P2
Auditor's fees 1 P2
Law charges 2 P2
Postage, telegram & telephone 6 P2
Repair & maintenance 4 P2
Insurance 14 P2/D71
Other expenditure 48 P2
Provision and contingencies 191 Not an SNA
item29
29
Provisions for bad debt are treated as bookkeeping entries that are internal to the enterprise and do not appear in the
SNA except in the case of expected losses on nonperforming loans, which appear as memorandum items in the balance
sheets. The unilateral repudiation of debt by a debtor is also not a transaction and is not recognized in the SNA.
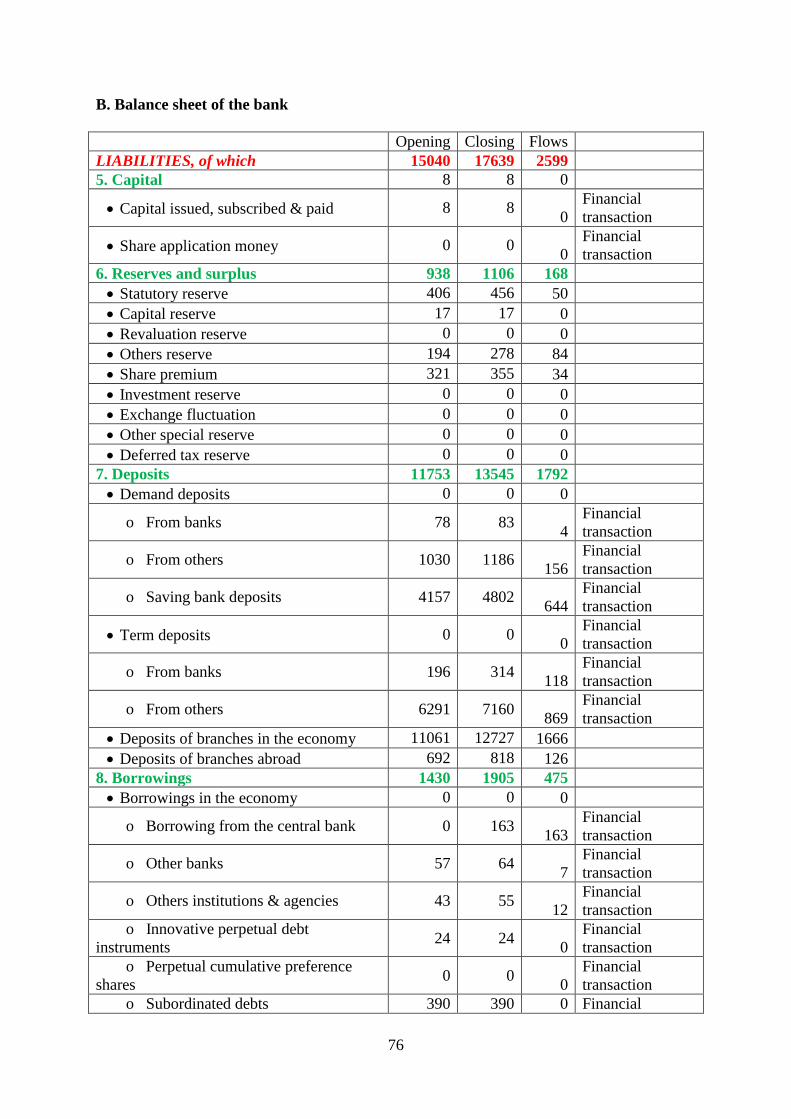
76
B. Balance sheet of the bank
Opening Closing Flows
LIABILITIES, of which 15040 17639 2599
5. Capital 8 8 0
Capital issued, subscribed & paid 8 8 0
Financial
transaction
Share application money 0 0 0
Financial
transaction
6. Reserves and surplus 938 1106 168
Statutory reserve 406 456 50
Capital reserve 17 17 0
Revaluation reserve 0 0 0
Others reserve 194 278 84
Share premium 321 355 34
Investment reserve 0 0 0
Exchange fluctuation 0 0 0
Other special reserve 0 0 0
Deferred tax reserve 0 0 0
7. Deposits 11753 13545 1792
Demand deposits 0 0 0
o From banks 78 83 4
Financial
transaction
o From others 1030 1186 156
Financial
transaction
o Saving bank deposits 4157 4802 644
Financial
transaction
Term deposits 0 0 0
Financial
transaction
o From banks 196 314 118
Financial
transaction
o From others 6291 7160 869
Financial
transaction
Deposits of branches in the economy 11061 12727 1666
Deposits of branches abroad 692 818 126
8. Borrowings 1430 1905 475
Borrowings in the economy 0 0 0
o Borrowing from the central bank 0 163 163
Financial
transaction
o Other banks 57 64 7
Financial
transaction
o Others institutions & agencies 43 55 12
Financial
transaction
o Innovative perpetual debt
instruments 24 24
0
Financial
transaction
o Perpetual cumulative preference
shares 0 0
0
Financial
transaction
o Subordinated debts 390 390 0 Financial
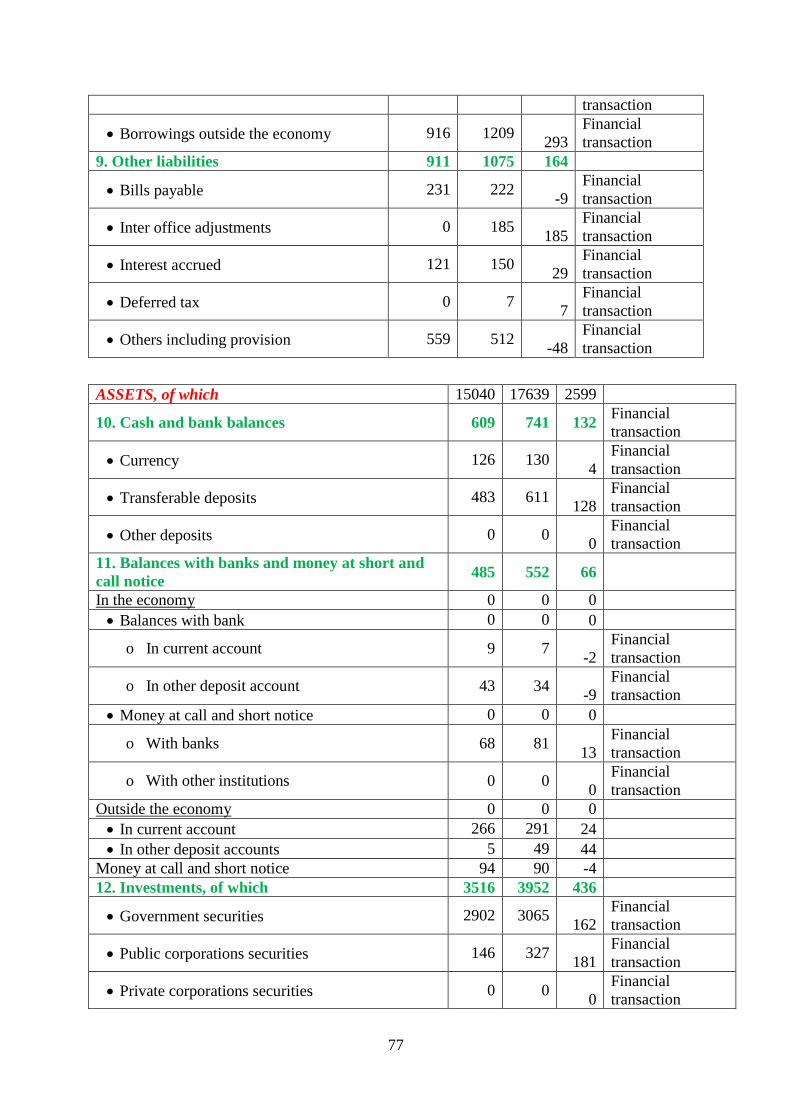
77
transaction
Borrowings outside the economy 916 1209 293
Financial
transaction
9. Other liabilities 911 1075 164
Bills payable 231 222 -9
Financial
transaction
Inter office adjustments 0 185 185
Financial
transaction
Interest accrued 121 150 29
Financial
transaction
Deferred tax 0 7 7
Financial
transaction
Others including provision 559 512 -48
Financial
transaction
ASSETS, of which 15040 17639 2599
10. Cash and bank balances 609 741 132 Financial
transaction
Currency 126 130 4
Financial
transaction
Transferable deposits 483 611 128
Financial
transaction
Other deposits 0 0 0
Financial
transaction
11. Balances with banks and money at short and
call notice 485 552 66
In the economy 0 0 0
Balances with bank 0 0 0
o In current account 9 7 -2
Financial
transaction
o In other deposit account 43 34 -9
Financial
transaction
Money at call and short notice 0 0 0
o With banks 68 81 13
Financial
transaction
o With other institutions 0 0 0
Financial
transaction
Outside the economy 0 0 0
In current account 266 291 24
In other deposit accounts 5 49 44
Money at call and short notice 94 90 -4
12. Investments, of which 3516 3952 436
Government securities 2902 3065 162
Financial
transaction
Public corporations securities 146 327 181
Financial
transaction
Private corporations securities 0 0 0
Financial
transaction
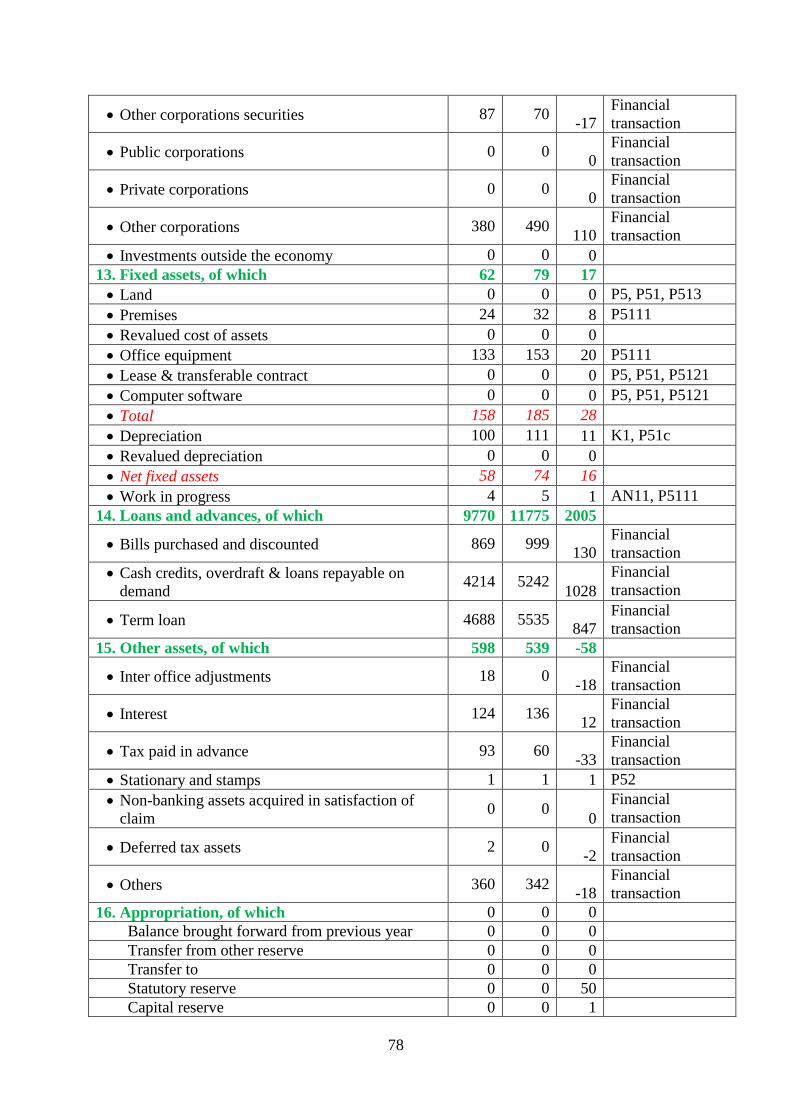
78
Other corporations securities 87 70 -17
Financial
transaction
Public corporations 0 0 0
Financial
transaction
Private corporations 0 0 0
Financial
transaction
Other corporations 380 490 110
Financial
transaction
Investments outside the economy 0 0 0
13. Fixed assets, of which 62 79 17
Land 0 0 0 P5, P51, P513
Premises 24 32 8 P5111
Revalued cost of assets 0 0 0
Office equipment 133 153 20 P5111
Lease & transferable contract 0 0 0 P5, P51, P5121
Computer software 0 0 0 P5, P51, P5121
Total 158 185 28
Depreciation 100 111 11 K1, P51c
Revalued depreciation 0 0 0
Net fixed assets 58 74 16
Work in progress 4 5 1 AN11, P5111
14. Loans and advances, of which 9770 11775 2005
Bills purchased and discounted 869 999 130
Financial
transaction
Cash credits, overdraft & loans repayable on
demand 4214 5242
1028
Financial
transaction
Term loan 4688 5535 847
Financial
transaction
15. Other assets, of which 598 539 -58
Inter office adjustments 18 0 -18
Financial
transaction
Interest 124 136 12
Financial
transaction
Tax paid in advance 93 60 -33
Financial
transaction
Stationary and stamps 1 1 1 P52
Non-banking assets acquired in satisfaction of
claim 0 0
0
Financial
transaction
Deferred tax assets 2 0 -2
Financial
transaction
Others 360 342 -18
Financial
transaction
16. Appropriation, of which 0 0 0
Balance brought forward from previous year 0 0 0
Transfer from other reserve 0 0 0
Transfer to 0 0 0
Statutory reserve 0 0 50
Capital reserve 0 0 1
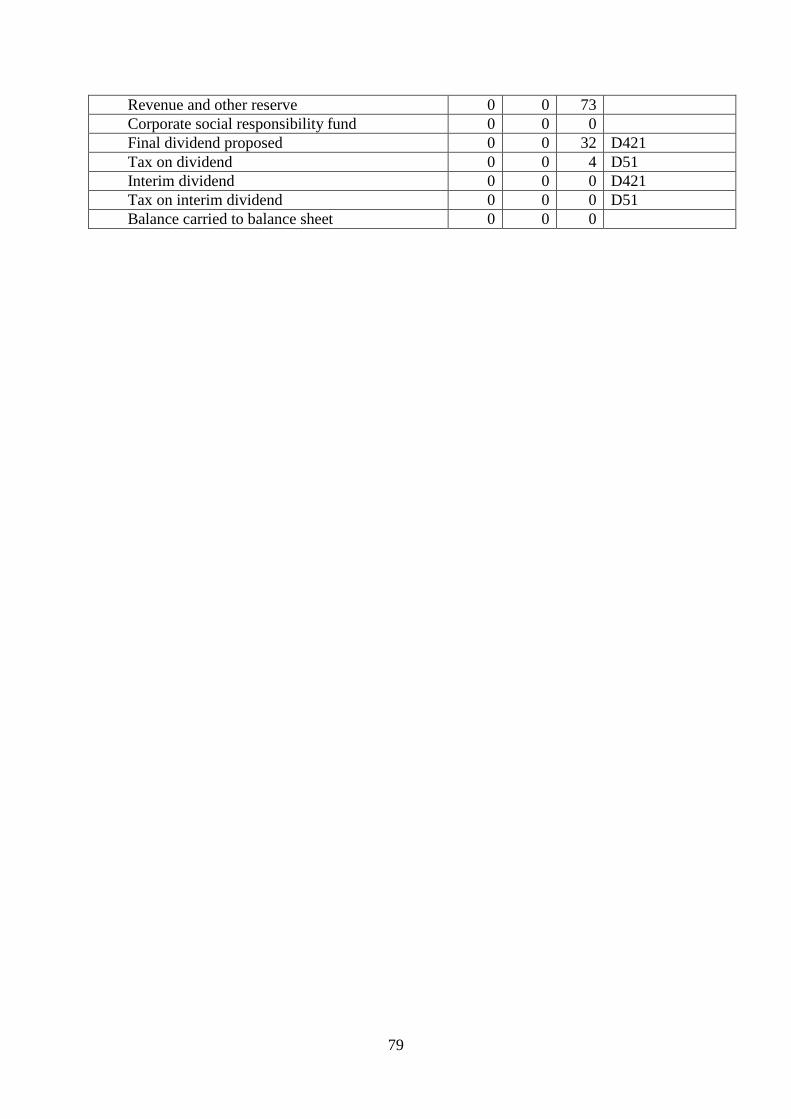
79
Revenue and other reserve 0 0 73
Corporate social responsibility fund 0 0 0
Final dividend proposed 0 0 32 D421
Tax on dividend 0 0 4 D51
Interim dividend 0 0 0 D421
Tax on interim dividend 0 0 0 D51
Balance carried to balance sheet 0 0 0
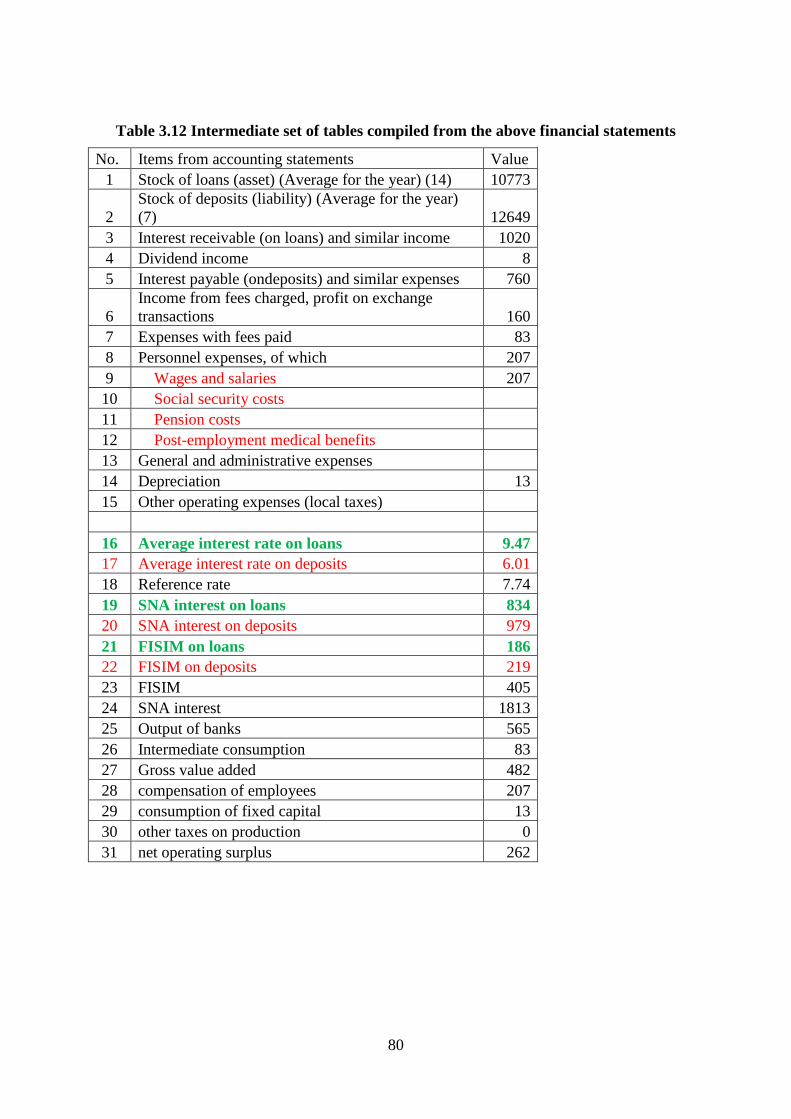
80
Table 3.12 Intermediate set of tables compiled from the above financial statements
No. Items from accounting statements Value
1 Stock of loans (asset) (Average for the year) (14) 10773
2
Stock of deposits (liability) (Average for the year)
(7) 12649
3 Interest receivable (on loans) and similar income 1020
4 Dividend income 8
5 Interest payable (ondeposits) and similar expenses 760
6
Income from fees charged, profit on exchange
transactions 160
7 Expenses with fees paid 83
8 Personnel expenses, of which 207
9 Wages and salaries 207
10 Social security costs
11 Pension costs
12 Post-employment medical benefits
13 General and administrative expenses
14 Depreciation 13
15 Other operating expenses (local taxes)
16 Average interest rate on loans 9.47
17 Average interest rate on deposits 6.01
18 Reference rate 7.74
19 SNA interest on loans 834
20 SNA interest on deposits 979
21 FISIM on loans 186
22 FISIM on deposits 219
23 FISIM 405
24 SNA interest 1813
25 Output of banks 565
26 Intermediate consumption 83
27 Gross value added 482
28 compensation of employees 207
29 consumption of fixed capital 13
30 other taxes on production 0
31 net operating surplus 262
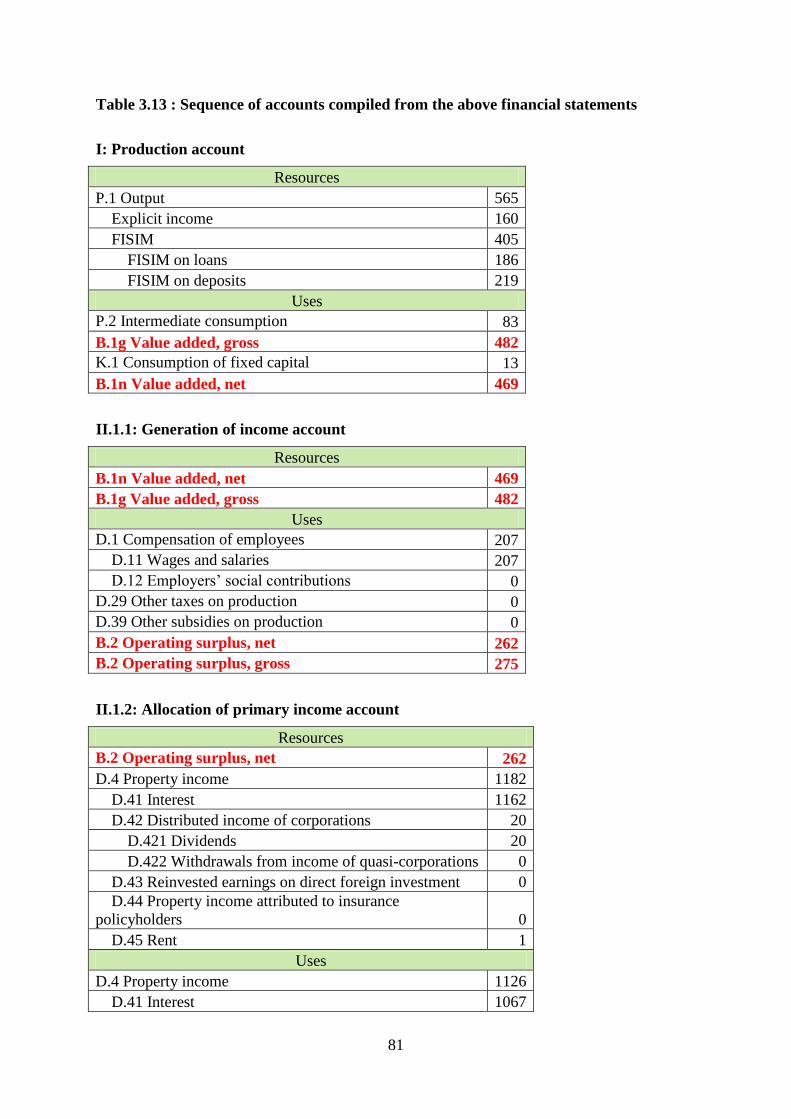
81
Table 3.13 : Sequence of accounts compiled from the above financial statements
I: Production account
Resources
P.1 Output 565
Explicit income 160
FISIM 405
FISIM on loans 186
FISIM on deposits 219
Uses
P.2 Intermediate consumption 83
B.1g Value added, gross 482
K.1 Consumption of fixed capital 13
B.1n Value added, net 469
II.1.1: Generation of income account
Resources
B.1n Value added, net 469
B.1g Value added, gross 482
Uses
D.1 Compensation of employees 207
D.11 Wages and salaries 207
D.12 Employers‘ social contributions 0
D.29 Other taxes on production 0
D.39 Other subsidies on production 0
B.2 Operating surplus, net 262
B.2 Operating surplus, gross 275
II.1.2: Allocation of primary income account
Resources
B.2 Operating surplus, net 262
D.4 Property income 1182
D.41 Interest 1162
D.42 Distributed income of corporations 20
D.421 Dividends 20
D.422 Withdrawals from income of quasi-corporations 0
D.43 Reinvested earnings on direct foreign investment 0
D.44 Property income attributed to insurance
policyholders 0
D.45 Rent 1
Uses
D.4 Property income 1126
D.41 Interest 1067
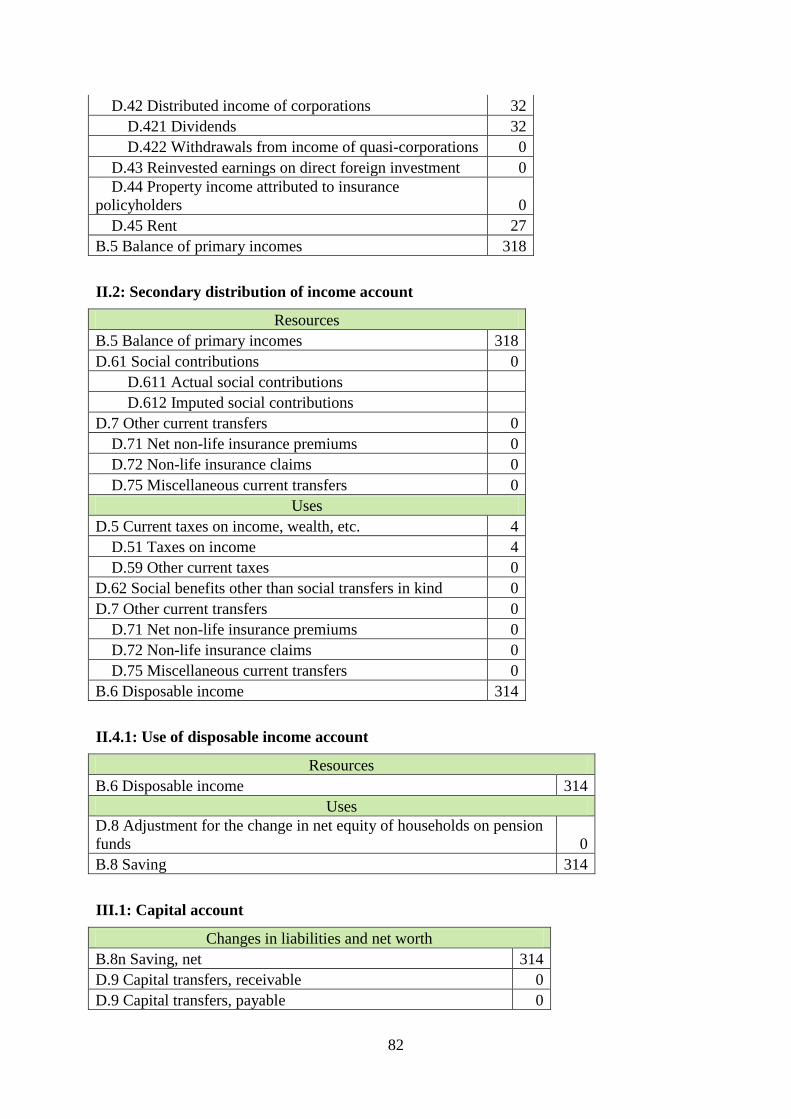
82
D.42 Distributed income of corporations 32
D.421 Dividends 32
D.422 Withdrawals from income of quasi-corporations 0
D.43 Reinvested earnings on direct foreign investment 0
D.44 Property income attributed to insurance
policyholders 0
D.45 Rent 27
B.5 Balance of primary incomes 318
II.2: Secondary distribution of income account
Resources
B.5 Balance of primary incomes 318
D.61 Social contributions 0
D.611 Actual social contributions
D.612 Imputed social contributions
D.7 Other current transfers 0
D.71 Net non-life insurance premiums 0
D.72 Non-life insurance claims 0
D.75 Miscellaneous current transfers 0
Uses
D.5 Current taxes on income, wealth, etc. 4
D.51 Taxes on income 4
D.59 Other current taxes 0
D.62 Social benefits other than social transfers in kind 0
D.7 Other current transfers 0
D.71 Net non-life insurance premiums 0
D.72 Non-life insurance claims 0
D.75 Miscellaneous current transfers 0
B.6 Disposable income 314
II.4.1: Use of disposable income account
Resources
B.6 Disposable income 314
Uses
D.8 Adjustment for the change in net equity of households on pension
funds 0
B.8 Saving 314
III.1: Capital account
Changes in liabilities and net worth
B.8n Saving, net 314
D.9 Capital transfers, receivable 0
D.9 Capital transfers, payable 0
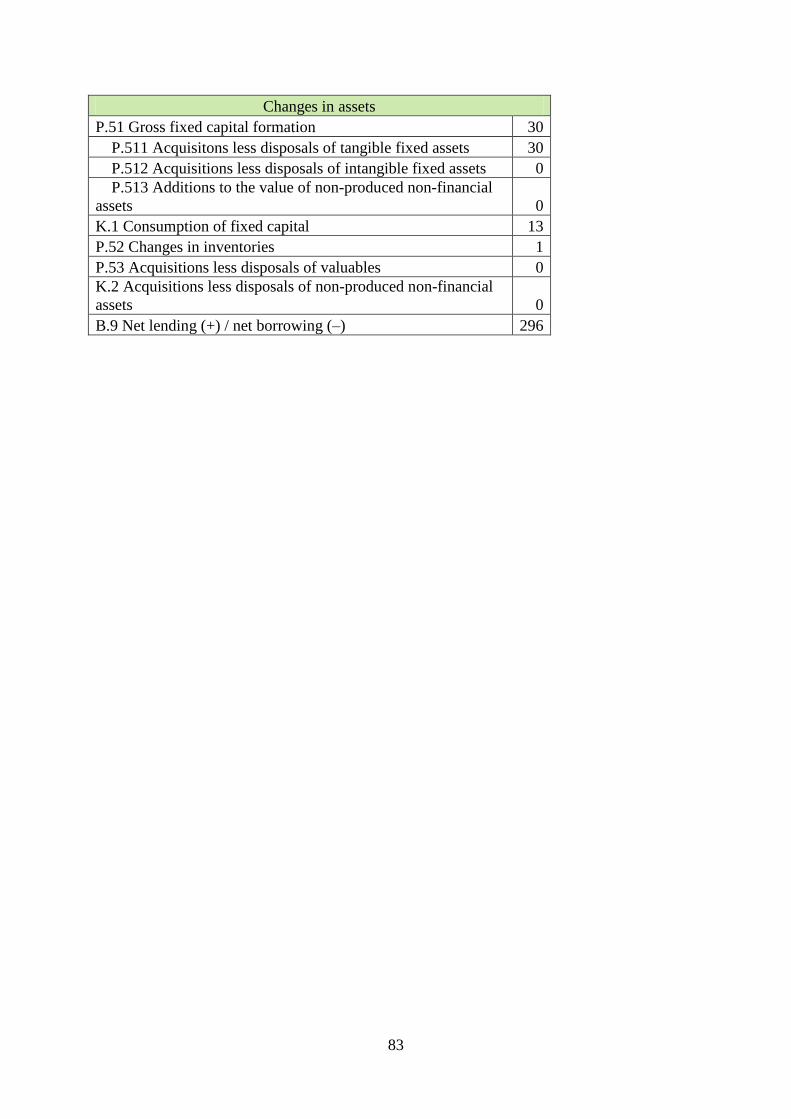
83
Changes in assets
P.51 Gross fixed capital formation 30
P.511 Acquisitons less disposals of tangible fixed assets 30
P.512 Acquisitions less disposals of intangible fixed assets 0
P.513 Additions to the value of non-produced non-financial
assets 0
K.1 Consumption of fixed capital 13
P.52 Changes in inventories 1
P.53 Acquisitions less disposals of valuables 0
K.2 Acquisitions less disposals of non-produced non-financial
assets 0
B.9 Net lending (+) / net borrowing (–) 296
84
5. Insurance corporations
Insurance schemes provide individual institutional units exposed to certain risks with
financial protection against the consequences of the occurrence of specified events. This
financial protection is provided by insurance corporations in the form of an insurance policy.
At its simplest, an insurance policy is an agreement between an insurance corporation and
another institutional unit, called the policyholder. Under the agreement, the policyholder
makes a payment (a premium) to the insurance corporation and, if or when the specified
event occurs, the insurance corporation makes a payment (claim in the case of non-life
insurance and benefit in the case of life insurance) to the policyholder. In this way, the
policyholder protects itself against certain forms of risk. On the other hand, by pooling the
risks of the policy holders, the insurance corporation aims to receive more from the receipt of
premiums than it has to pay out as claims. In addition, insurers often act as financial
intermediaries who invest funds collected from policyholders in financial or other assets to
meet future claims.
There are two types of insurance, namely, direct insurance and reinsurance.
Direct insurance is the most common form of insurance. In this type of insurance, policy is
issued by an insurance corporation to another type of institutional unit. Both life and non-
life insurance fall under this category.
The other type of insurance called reinsurance in which insurance is provided by one
insurance corporation to another insurance corporation. Sometimes, reinsurers take out
reinsurance policies with other insurance corporations to spread their risks further. This sort
of reinsurance is called retrocession.
The institutional units involved in direct insurance and reinsurance are pre-eminently
insurance corporations. Though it is possible for other enterprises to carry out insurance as a
non-principal activity, but the legal regulations that normally surround the conduct of
insurance mean that enterprises do need to keep a separate set of accounts covering all
aspects of the insurance. This leads to identifying a separate institutional unit in the SNA,
classified to the insurance corporations. Therefore, for practical purposes, it is assumed that
all insurance is carried out by insurance corporations, either resident or non-resident.
5.1 Concepts and Definitions
Insurance corporations consist of incorporated, mutual and other entities whose principal
function is to provide life, accident, sickness, fire or other forms of insurance to individual
institutional units or groups of units or reinsurance services to other insurance corporations.
Captive insurance is included, that is, an insurance company that serves only its owners.
Deposit insurers, issuers of deposit guarantees and other issuers of standardized guarantees
that are separate entities and act like insurers by charging premiums and have reserves, are
classified as insurance corporations.
Insurance corporations provide services of direct insurance, which includes life and non-life
insurance ; and reinsurance. These are further explained below
Life insurance
85
Life insurance is an activity whereby a policyholder makes regular payments to an insurer in
return for which the insurer guarantees to provide the policyholder (or in some cases another
nominated person) with an agreed sum, or an annuity, at a given date or earlier if the
policyholder dies beforehand.
There is little conditionality involved in life insurance, usually the fact that a payment will be
made is certain but the amount may be uncertain. Annuities are offered by insurance
corporations and are a means for an individual person to convert a lump sum into a stream of
payments in the future. The sum payable under the policy (known as benefit) may be fixed or
may vary to reflect the income earned from the investment of premiums during the period for
which the policy operates. For policies with varying returns, the terms ―with-profits‖ life
insurance or endowment policy are generally used. Although the date and sum may be
variable, a claim is always paid in respect of a life policy.
Essentially life insurance premiums and benefits are financial transactions and not current
transactions, as it mainly redistributes premiums paid over a period of time as benefits paid
later to the same policyholder.
Non-life insurance
Non-life insurance is an activity similar to life insurance except that the it covers all other
risks, accidents, sickness, fire, etc. Non-life insurance provides cover to the policyholder
against loss or damage suffered as a result of an accident. A premium is paid to the insurance
corporation and a claim is paid to the policyholder only if the event insured against occurs.
There is no uncertainty regarding the payments, as the maximum amount to be paid is
specified in the policy.
Term insurance, which provides a benefit in the case of death within a given period but in no
other circumstances, is regarded as non-life insurance because, as with other non-life
insurance, a claim is payable only if a specified contingency occurs and not otherwise. In
practice, because of the way in which insurance corporations keep their accounts, it may not
always be possible to separate term insurance from other life insurance. In these
circumstances, term insurance may have to be treated in the same way as life insurance for
purely practical reasons.
Commonalities and differences between life and non-life insurance
What life and non-life insurance have in common is that they both involve spreading risk.
Insurers receive many small regular payments of premiums from policyholders and pay much
larger sums to claimants when the contingencies covered by the policy occur.
For non-life insurance, the risks are spread over the whole population that takes out the
insurance policies. For an individual non-life policyholder there is no relationship between
the
premiums paid and the claims received, even in the long run, but the insurance corporation
establishes such a relationship for every class of non-life insurance on an yearly basis.
For life insurance, a relationship between premiums and claims over time is important both to
the policyholders and to the insurance corporation. For someone taking out a life policy, the
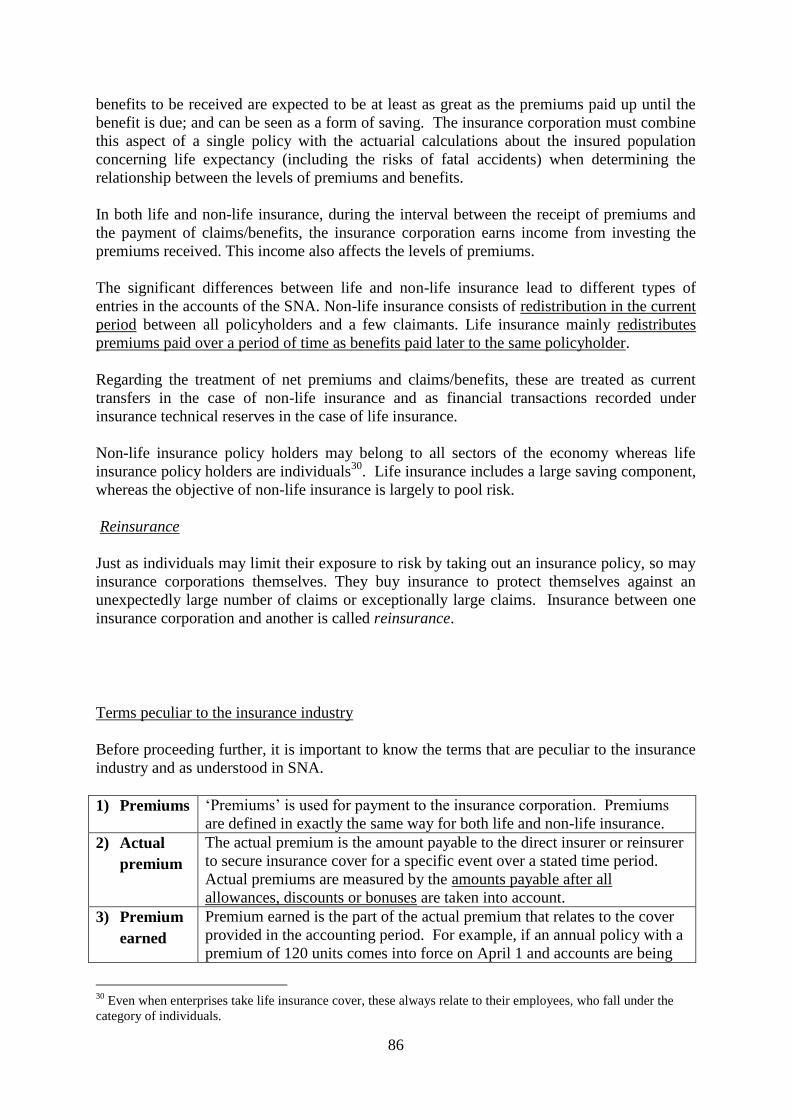
86
benefits to be received are expected to be at least as great as the premiums paid up until the
benefit is due; and can be seen as a form of saving. The insurance corporation must combine
this aspect of a single policy with the actuarial calculations about the insured population
concerning life expectancy (including the risks of fatal accidents) when determining the
relationship between the levels of premiums and benefits.
In both life and non-life insurance, during the interval between the receipt of premiums and
the payment of claims/benefits, the insurance corporation earns income from investing the
premiums received. This income also affects the levels of premiums.
The significant differences between life and non-life insurance lead to different types of
entries in the accounts of the SNA. Non-life insurance consists of redistribution in the current
period between all policyholders and a few claimants. Life insurance mainly redistributes
premiums paid over a period of time as benefits paid later to the same policyholder.
Regarding the treatment of net premiums and claims/benefits, these are treated as current
transfers in the case of non-life insurance and as financial transactions recorded under
insurance technical reserves in the case of life insurance.
Non-life insurance policy holders may belong to all sectors of the economy whereas life
insurance policy holders are individuals30
. Life insurance includes a large saving component,
whereas the objective of non-life insurance is largely to pool risk.
Reinsurance
Just as individuals may limit their exposure to risk by taking out an insurance policy, so may
insurance corporations themselves. They buy insurance to protect themselves against an
unexpectedly large number of claims or exceptionally large claims. Insurance between one
insurance corporation and another is called reinsurance.
Terms peculiar to the insurance industry
Before proceeding further, it is important to know the terms that are peculiar to the insurance
industry and as understood in SNA.
1) Premiums ‗Premiums‘ is used for payment to the insurance corporation. Premiums
are defined in exactly the same way for both life and non-life insurance.
2) Actual
premium
The actual premium is the amount payable to the direct insurer or reinsurer
to secure insurance cover for a specific event over a stated time period.
Actual premiums are measured by the amounts payable after all
allowances, discounts or bonuses are taken into account.
3) Premium
earned
Premium earned is the part of the actual premium that relates to the cover
provided in the accounting period. For example, if an annual policy with a
premium of 120 units comes into force on April 1 and accounts are being
30
Even when enterprises take life insurance cover, these always relate to their employees, who fall under the
category of individuals.
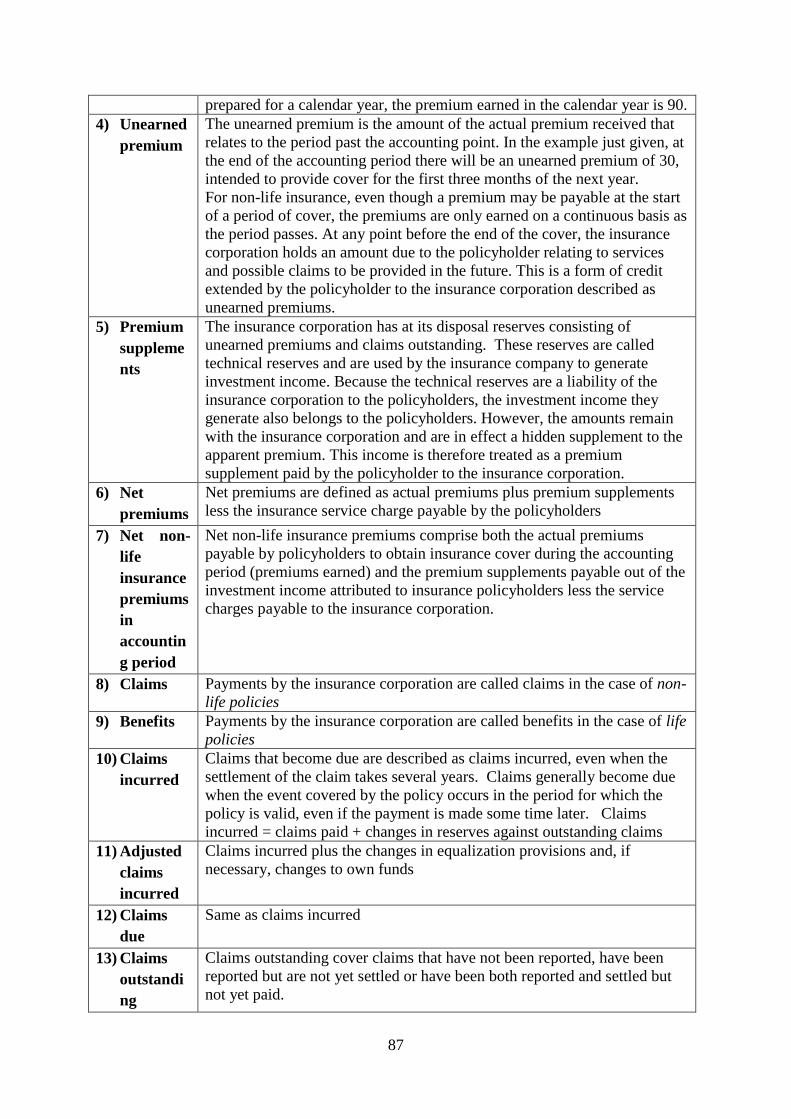
87
prepared for a calendar year, the premium earned in the calendar year is 90.
4) Unearned
premium
The unearned premium is the amount of the actual premium received that
relates to the period past the accounting point. In the example just given, at
the end of the accounting period there will be an unearned premium of 30,
intended to provide cover for the first three months of the next year.
For non-life insurance, even though a premium may be payable at the start
of a period of cover, the premiums are only earned on a continuous basis as
the period passes. At any point before the end of the cover, the insurance
corporation holds an amount due to the policyholder relating to services
and possible claims to be provided in the future. This is a form of credit
extended by the policyholder to the insurance corporation described as
unearned premiums.
5) Premium
suppleme
nts
The insurance corporation has at its disposal reserves consisting of
unearned premiums and claims outstanding. These reserves are called
technical reserves and are used by the insurance company to generate
investment income. Because the technical reserves are a liability of the
insurance corporation to the policyholders, the investment income they
generate also belongs to the policyholders. However, the amounts remain
with the insurance corporation and are in effect a hidden supplement to the
apparent premium. This income is therefore treated as a premium
supplement paid by the policyholder to the insurance corporation.
6) Net
premiums
Net premiums are defined as actual premiums plus premium supplements
less the insurance service charge payable by the policyholders
7) Net non-
life
insurance
premiums
in
accountin
g period
Net non-life insurance premiums comprise both the actual premiums
payable by policyholders to obtain insurance cover during the accounting
period (premiums earned) and the premium supplements payable out of the
investment income attributed to insurance policyholders less the service
charges payable to the insurance corporation.
8) Claims Payments by the insurance corporation are called claims in the case of non-
life policies
9) Benefits Payments by the insurance corporation are called benefits in the case of life
policies
10) Claims
incurred
Claims that become due are described as claims incurred, even when the
settlement of the claim takes several years. Claims generally become due
when the event covered by the policy occurs in the period for which the
policy is valid, even if the payment is made some time later. Claims
incurred = claims paid + changes in reserves against outstanding claims
11) Adjusted
claims
incurred
Claims incurred plus the changes in equalization provisions and, if
necessary, changes to own funds
12) Claims
due
Same as claims incurred
13) Claims
outstandi
ng
Claims outstanding cover claims that have not been reported, have been
reported but are not yet settled or have been both reported and settled but
not yet paid.
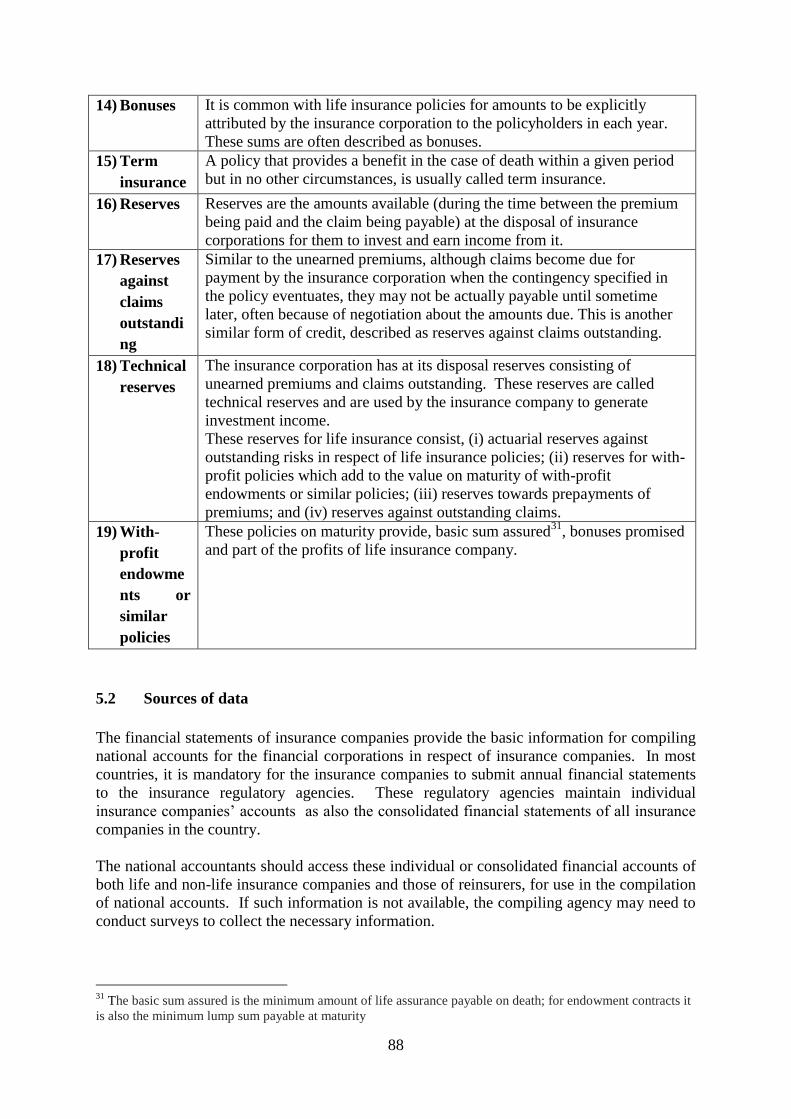
88
14) Bonuses It is common with life insurance policies for amounts to be explicitly
attributed by the insurance corporation to the policyholders in each year.
These sums are often described as bonuses.
15) Term
insurance
A policy that provides a benefit in the case of death within a given period
but in no other circumstances, is usually called term insurance.
16) Reserves Reserves are the amounts available (during the time between the premium
being paid and the claim being payable) at the disposal of insurance
corporations for them to invest and earn income from it.
17) Reserves
against
claims
outstandi
ng
Similar to the unearned premiums, although claims become due for
payment by the insurance corporation when the contingency specified in
the policy eventuates, they may not be actually payable until sometime
later, often because of negotiation about the amounts due. This is another
similar form of credit, described as reserves against claims outstanding.
18) Technical
reserves
The insurance corporation has at its disposal reserves consisting of
unearned premiums and claims outstanding. These reserves are called
technical reserves and are used by the insurance company to generate
investment income.
These reserves for life insurance consist, (i) actuarial reserves against
outstanding risks in respect of life insurance policies; (ii) reserves for with-
profit policies which add to the value on maturity of with-profit
endowments or similar policies; (iii) reserves towards prepayments of
premiums; and (iv) reserves against outstanding claims.
19) With-
profit
endowme
nts or
similar
policies
These policies on maturity provide, basic sum assured31
, bonuses promised
and part of the profits of life insurance company.
5.2 Sources of data
The financial statements of insurance companies provide the basic information for compiling
national accounts for the financial corporations in respect of insurance companies. In most
countries, it is mandatory for the insurance companies to submit annual financial statements
to the insurance regulatory agencies. These regulatory agencies maintain individual
insurance companies‘ accounts as also the consolidated financial statements of all insurance
companies in the country.
The national accountants should access these individual or consolidated financial accounts of
both life and non-life insurance companies and those of reinsurers, for use in the compilation
of national accounts. If such information is not available, the compiling agency may need to
conduct surveys to collect the necessary information.
31
The basic sum assured is the minimum amount of life assurance payable on death; for endowment contracts it
is also the minimum lump sum payable at maturity
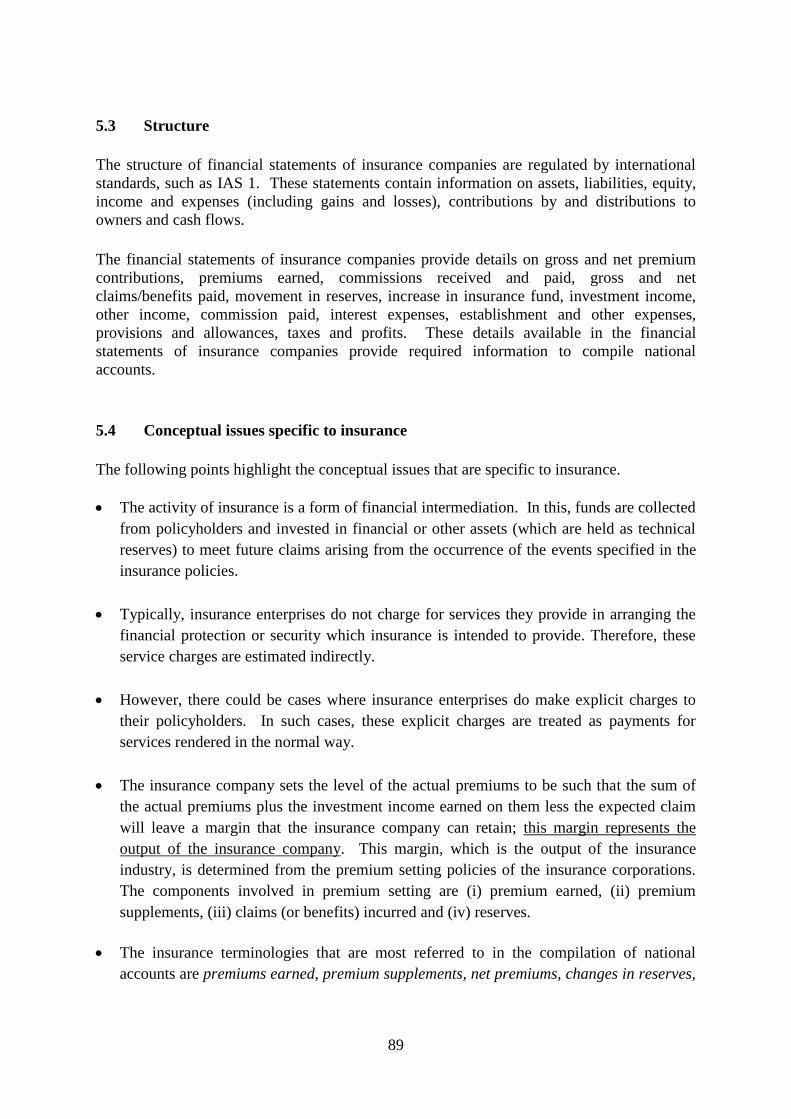
89
5.3 Structure
The structure of financial statements of insurance companies are regulated by international
standards, such as IAS 1. These statements contain information on assets, liabilities, equity,
income and expenses (including gains and losses), contributions by and distributions to
owners and cash flows.
The financial statements of insurance companies provide details on gross and net premium
contributions, premiums earned, commissions received and paid, gross and net
claims/benefits paid, movement in reserves, increase in insurance fund, investment income,
other income, commission paid, interest expenses, establishment and other expenses,
provisions and allowances, taxes and profits. These details available in the financial
statements of insurance companies provide required information to compile national
accounts.
5.4 Conceptual issues specific to insurance
The following points highlight the conceptual issues that are specific to insurance.
The activity of insurance is a form of financial intermediation. In this, funds are collected
from policyholders and invested in financial or other assets (which are held as technical
reserves) to meet future claims arising from the occurrence of the events specified in the
insurance policies.
Typically, insurance enterprises do not charge for services they provide in arranging the
financial protection or security which insurance is intended to provide. Therefore, these
service charges are estimated indirectly.
However, there could be cases where insurance enterprises do make explicit charges to
their policyholders. In such cases, these explicit charges are treated as payments for
services rendered in the normal way.
The insurance company sets the level of the actual premiums to be such that the sum of
the actual premiums plus the investment income earned on them less the expected claim
will leave a margin that the insurance company can retain; this margin represents the
output of the insurance company. This margin, which is the output of the insurance
industry, is determined from the premium setting policies of the insurance corporations.
The components involved in premium setting are (i) premium earned, (ii) premium
supplements, (iii) claims (or benefits) incurred and (iv) reserves.
The insurance terminologies that are most referred to in the compilation of national
accounts are premiums earned, premium supplements, net premiums, changes in reserves,
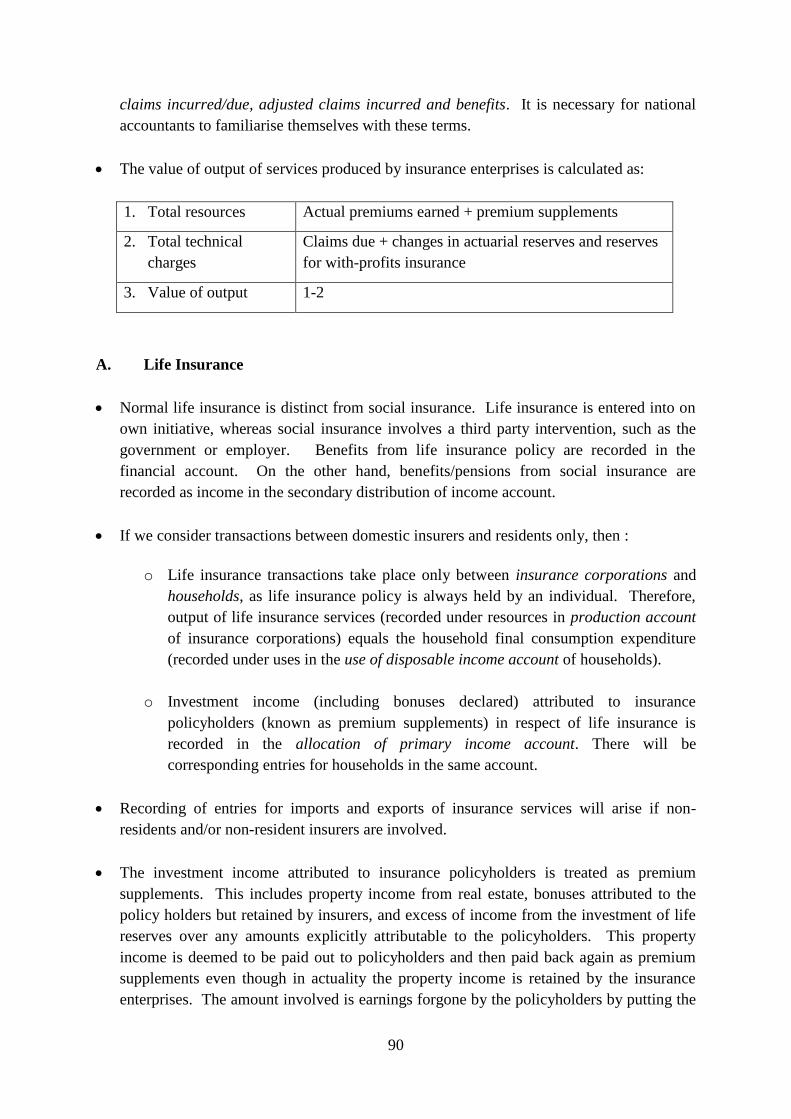
90
claims incurred/due, adjusted claims incurred and benefits. It is necessary for national
accountants to familiarise themselves with these terms.
The value of output of services produced by insurance enterprises is calculated as:
1. Total resources Actual premiums earned + premium supplements
2. Total technical
charges
Claims due + changes in actuarial reserves and reserves
for with-profits insurance
3. Value of output 1-2
A. Life Insurance
Normal life insurance is distinct from social insurance. Life insurance is entered into on
own initiative, whereas social insurance involves a third party intervention, such as the
government or employer. Benefits from life insurance policy are recorded in the
financial account. On the other hand, benefits/pensions from social insurance are
recorded as income in the secondary distribution of income account.
If we consider transactions between domestic insurers and residents only, then :
o Life insurance transactions take place only between insurance corporations and
households, as life insurance policy is always held by an individual. Therefore,
output of life insurance services (recorded under resources in production account
of insurance corporations) equals the household final consumption expenditure
(recorded under uses in the use of disposable income account of households).
o Investment income (including bonuses declared) attributed to insurance
policyholders (known as premium supplements) in respect of life insurance is
recorded in the allocation of primary income account. There will be
corresponding entries for households in the same account.
Recording of entries for imports and exports of insurance services will arise if non-
residents and/or non-resident insurers are involved.
The investment income attributed to insurance policyholders is treated as premium
supplements. This includes property income from real estate, bonuses attributed to the
policy holders but retained by insurers, and excess of income from the investment of life
reserves over any amounts explicitly attributable to the policyholders. This property
income is deemed to be paid out to policyholders and then paid back again as premium
supplements even though in actuality the property income is retained by the insurance
enterprises. The amount involved is earnings forgone by the policyholders by putting the
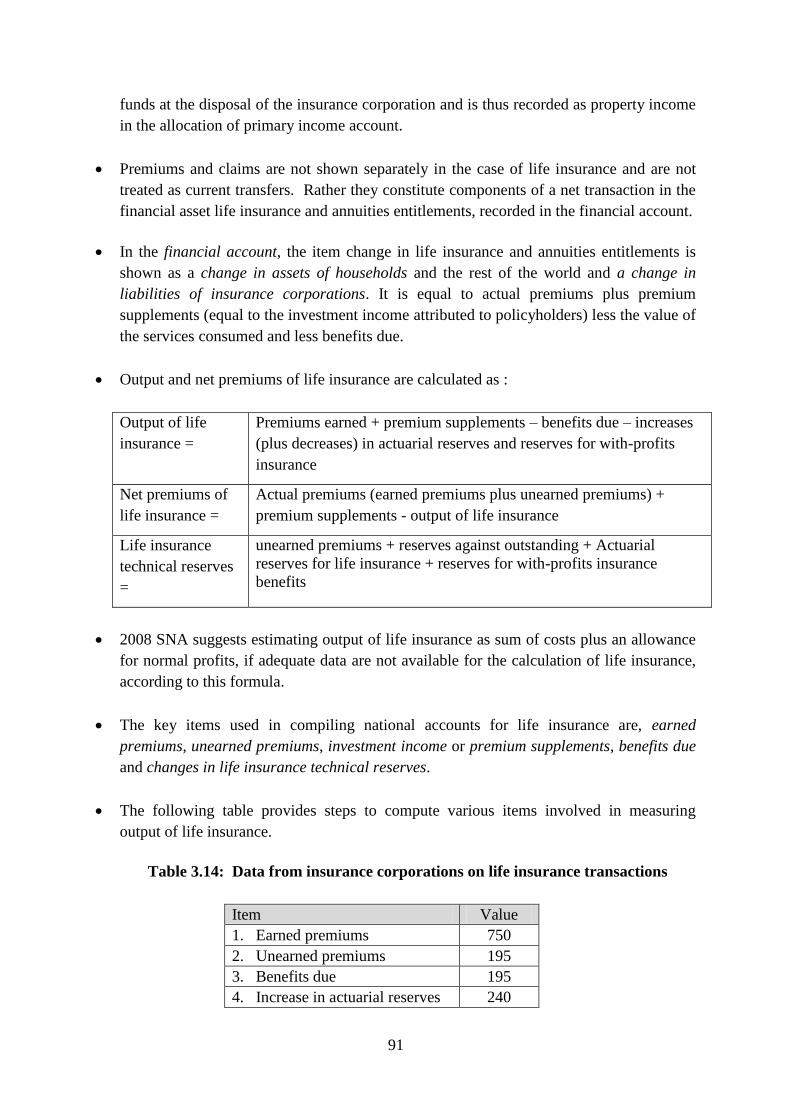
91
funds at the disposal of the insurance corporation and is thus recorded as property income
in the allocation of primary income account.
Premiums and claims are not shown separately in the case of life insurance and are not
treated as current transfers. Rather they constitute components of a net transaction in the
financial asset life insurance and annuities entitlements, recorded in the financial account.
In the financial account, the item change in life insurance and annuities entitlements is
shown as a change in assets of households and the rest of the world and a change in
liabilities of insurance corporations. It is equal to actual premiums plus premium
supplements (equal to the investment income attributed to policyholders) less the value of
the services consumed and less benefits due.
Output and net premiums of life insurance are calculated as :
Output of life
insurance =
Premiums earned + premium supplements – benefits due – increases
(plus decreases) in actuarial reserves and reserves for with-profits
insurance
Net premiums of
life insurance =
Actual premiums (earned premiums plus unearned premiums) +
premium supplements - output of life insurance
Life insurance
technical reserves
=
unearned premiums + reserves against outstanding + Actuarial
reserves for life insurance + reserves for with-profits insurance
benefits
2008 SNA suggests estimating output of life insurance as sum of costs plus an allowance
for normal profits, if adequate data are not available for the calculation of life insurance,
according to this formula.
The key items used in compiling national accounts for life insurance are, earned
premiums, unearned premiums, investment income or premium supplements, benefits due
and changes in life insurance technical reserves.
The following table provides steps to compute various items involved in measuring
output of life insurance.
Table 3.14: Data from insurance corporations on life insurance transactions
Item Value
1. Earned premiums 750
2. Unearned premiums 195
3. Benefits due 195
4. Increase in actuarial reserves 240
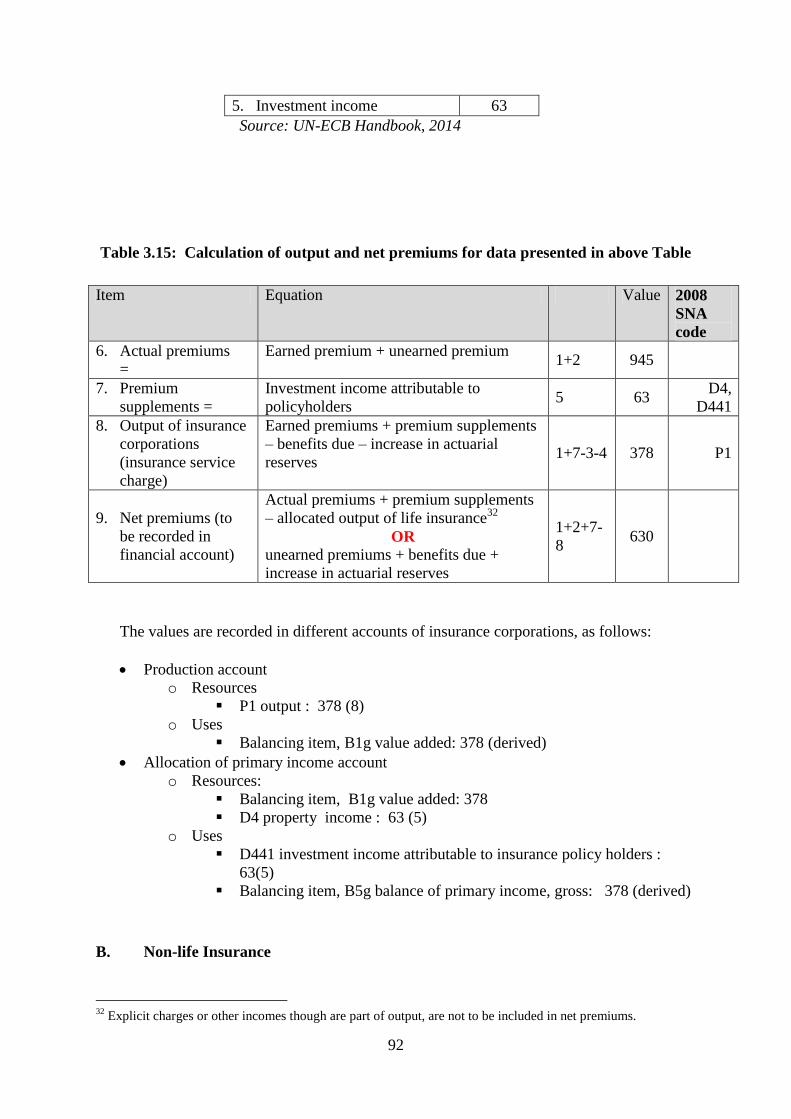
92
5. Investment income 63
Source: UN-ECB Handbook, 2014
Table 3.15: Calculation of output and net premiums for data presented in above Table
Item Equation Value 2008
SNA
code
6. Actual premiums
=
Earned premium + unearned premium 1+2 945
7. Premium
supplements =
Investment income attributable to
policyholders 5 63
D4,
D441
8. Output of insurance
corporations
(insurance service
charge)
Earned premiums + premium supplements
– benefits due – increase in actuarial
reserves 1+7-3-4 378 P1
9. Net premiums (to
be recorded in
financial account)
Actual premiums + premium supplements
– allocated output of life insurance32
OR
unearned premiums + benefits due +
increase in actuarial reserves
1+2+7-
8 630
The values are recorded in different accounts of insurance corporations, as follows:
Production account
o Resources
P1 output : 378 (8)
o Uses
Balancing item, B1g value added: 378 (derived)
Allocation of primary income account
o Resources:
Balancing item, B1g value added: 378
D4 property income : 63 (5)
o Uses
D441 investment income attributable to insurance policy holders :
63(5)
Balancing item, B5g balance of primary income, gross: 378 (derived)
B. Non-life Insurance
32
Explicit charges or other incomes though are part of output, are not to be included in net premiums.
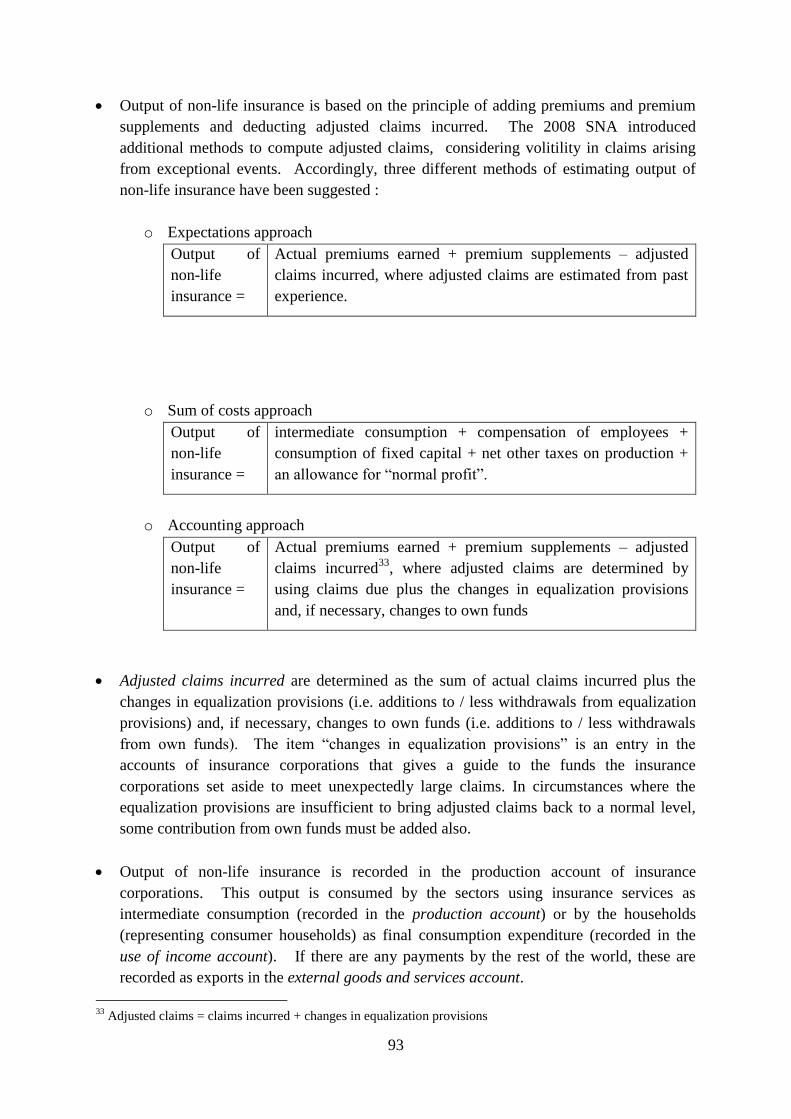
93
Output of non-life insurance is based on the principle of adding premiums and premium
supplements and deducting adjusted claims incurred. The 2008 SNA introduced
additional methods to compute adjusted claims, considering volitility in claims arising
from exceptional events. Accordingly, three different methods of estimating output of
non-life insurance have been suggested :
o Expectations approach
Output of
non-life
insurance =
Actual premiums earned + premium supplements – adjusted
claims incurred, where adjusted claims are estimated from past
experience.
o Sum of costs approach
Output of
non-life
insurance =
intermediate consumption + compensation of employees +
consumption of fixed capital + net other taxes on production +
an allowance for ―normal profit‖.
o Accounting approach
Output of
non-life
insurance =
Actual premiums earned + premium supplements – adjusted
claims incurred33
, where adjusted claims are determined by
using claims due plus the changes in equalization provisions
and, if necessary, changes to own funds
Adjusted claims incurred are determined as the sum of actual claims incurred plus the
changes in equalization provisions (i.e. additions to / less withdrawals from equalization
provisions) and, if necessary, changes to own funds (i.e. additions to / less withdrawals
from own funds). The item ―changes in equalization provisions‖ is an entry in the
accounts of insurance corporations that gives a guide to the funds the insurance
corporations set aside to meet unexpectedly large claims. In circumstances where the
equalization provisions are insufficient to bring adjusted claims back to a normal level,
some contribution from own funds must be added also.
Output of non-life insurance is recorded in the production account of insurance
corporations. This output is consumed by the sectors using insurance services as
intermediate consumption (recorded in the production account) or by the households
(representing consumer households) as final consumption expenditure (recorded in the
use of income account). If there are any payments by the rest of the world, these are
recorded as exports in the external goods and services account.
33
Adjusted claims = claims incurred + changes in equalization provisions
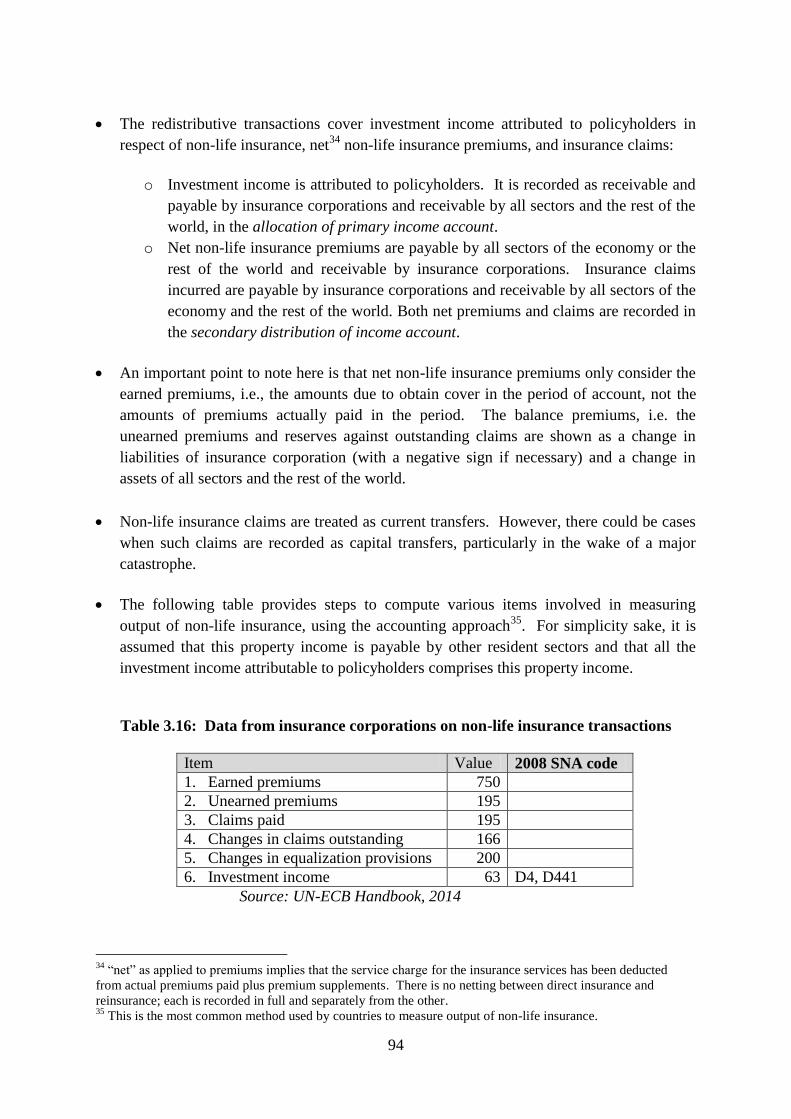
94
The redistributive transactions cover investment income attributed to policyholders in
respect of non-life insurance, net34
non-life insurance premiums, and insurance claims:
o Investment income is attributed to policyholders. It is recorded as receivable and
payable by insurance corporations and receivable by all sectors and the rest of the
world, in the allocation of primary income account.
o Net non-life insurance premiums are payable by all sectors of the economy or the
rest of the world and receivable by insurance corporations. Insurance claims
incurred are payable by insurance corporations and receivable by all sectors of the
economy and the rest of the world. Both net premiums and claims are recorded in
the secondary distribution of income account.
An important point to note here is that net non-life insurance premiums only consider the
earned premiums, i.e., the amounts due to obtain cover in the period of account, not the
amounts of premiums actually paid in the period. The balance premiums, i.e. the
unearned premiums and reserves against outstanding claims are shown as a change in
liabilities of insurance corporation (with a negative sign if necessary) and a change in
assets of all sectors and the rest of the world.
Non-life insurance claims are treated as current transfers. However, there could be cases
when such claims are recorded as capital transfers, particularly in the wake of a major
catastrophe.
The following table provides steps to compute various items involved in measuring
output of non-life insurance, using the accounting approach35
. For simplicity sake, it is
assumed that this property income is payable by other resident sectors and that all the
investment income attributable to policyholders comprises this property income.
Table 3.16: Data from insurance corporations on non-life insurance transactions
Item Value 2008 SNA code
1. Earned premiums 750
2. Unearned premiums 195
3. Claims paid 195
4. Changes in claims outstanding 166
5. Changes in equalization provisions 200
6. Investment income 63 D4, D441
Source: UN-ECB Handbook, 2014
34
―net‖ as applied to premiums implies that the service charge for the insurance services has been deducted
from actual premiums paid plus premium supplements. There is no netting between direct insurance and
reinsurance; each is recorded in full and separately from the other. 35
This is the most common method used by countries to measure output of non-life insurance.
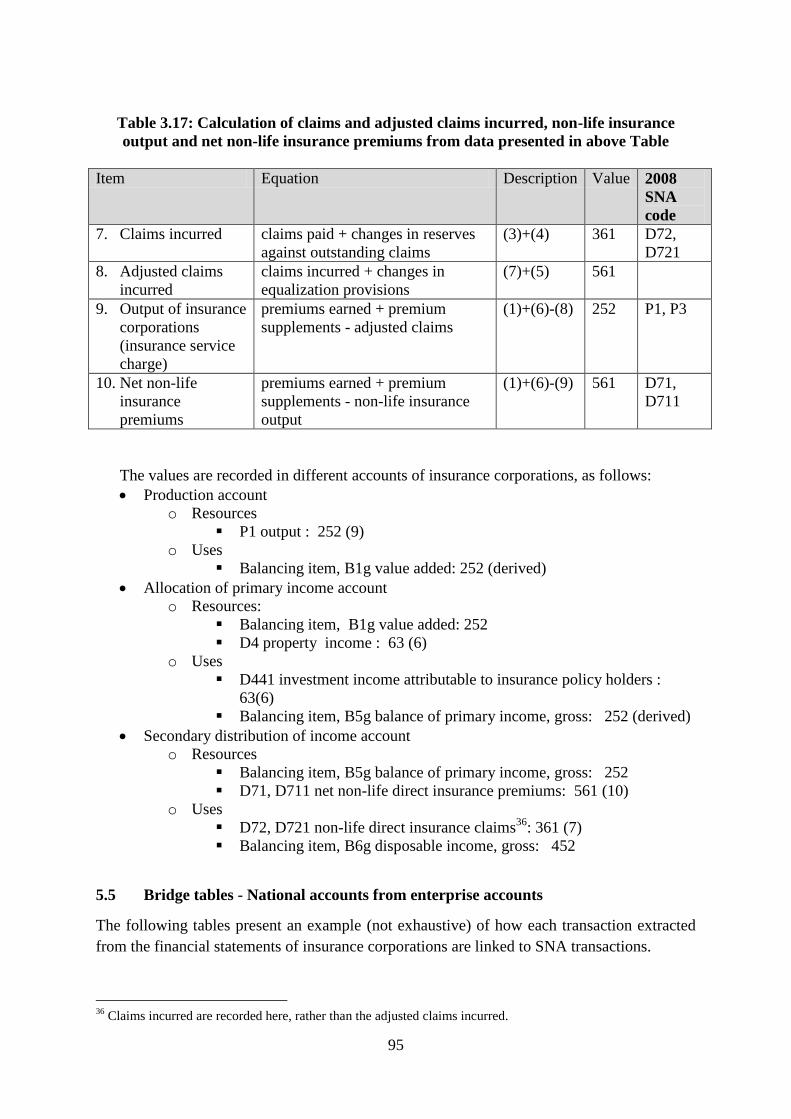
95
Table 3.17: Calculation of claims and adjusted claims incurred, non-life insurance
output and net non-life insurance premiums from data presented in above Table
Item Equation Description Value 2008
SNA
code
7. Claims incurred claims paid + changes in reserves
against outstanding claims
(3)+(4) 361 D72,
D721
8. Adjusted claims
incurred
claims incurred + changes in
equalization provisions
(7)+(5) 561
9. Output of insurance
corporations
(insurance service
charge)
premiums earned + premium
supplements - adjusted claims
(1)+(6)-(8) 252 P1, P3
10. Net non-life
insurance
premiums
premiums earned + premium
supplements - non-life insurance
output
(1)+(6)-(9) 561 D71,
D711
The values are recorded in different accounts of insurance corporations, as follows:
Production account
o Resources
P1 output : 252 (9)
o Uses
Balancing item, B1g value added: 252 (derived)
Allocation of primary income account
o Resources:
Balancing item, B1g value added: 252
D4 property income : 63 (6)
o Uses
D441 investment income attributable to insurance policy holders :
63(6)
Balancing item, B5g balance of primary income, gross: 252 (derived)
Secondary distribution of income account
o Resources
Balancing item, B5g balance of primary income, gross: 252
D71, D711 net non-life direct insurance premiums: 561 (10)
o Uses
D72, D721 non-life direct insurance claims36
: 361 (7)
Balancing item, B6g disposable income, gross: 452
5.5 Bridge tables - National accounts from enterprise accounts
The following tables present an example (not exhaustive) of how each transaction extracted
from the financial statements of insurance corporations are linked to SNA transactions.
36
Claims incurred are recorded here, rather than the adjusted claims incurred.
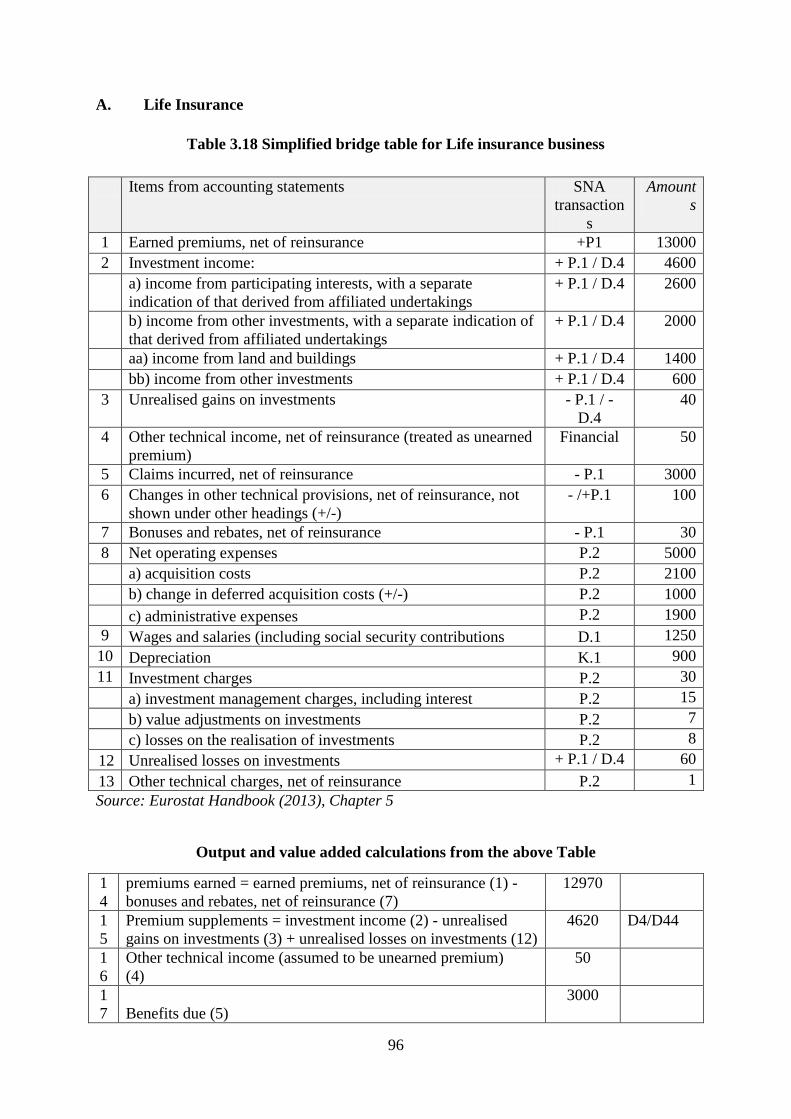
96
A. Life Insurance
Table 3.18 Simplified bridge table for Life insurance business
Items from accounting statements SNA
transaction
s
Amount
s
1 Earned premiums, net of reinsurance +P1 13000
2 Investment income: + P.1 / D.4 4600
a) income from participating interests, with a separate
indication of that derived from affiliated undertakings
+ P.1 / D.4 2600
b) income from other investments, with a separate indication of
that derived from affiliated undertakings
+ P.1 / D.4 2000
aa) income from land and buildings + P.1 / D.4 1400
bb) income from other investments + P.1 / D.4 600
3 Unrealised gains on investments - P.1 / -
D.4
40
4 Other technical income, net of reinsurance (treated as unearned
premium)
Financial 50
5 Claims incurred, net of reinsurance - P.1 3000
6 Changes in other technical provisions, net of reinsurance, not
shown under other headings (+/-)
- /+P.1 100
7 Bonuses and rebates, net of reinsurance - P.1 30
8 Net operating expenses P.2 5000
a) acquisition costs P.2 2100
b) change in deferred acquisition costs (+/-) P.2 1000
c) administrative expenses P.2 1900
9 Wages and salaries (including social security contributions D.1 1250
10 Depreciation K.1 900
11 Investment charges P.2 30
a) investment management charges, including interest P.2 15
b) value adjustments on investments P.2 7
c) losses on the realisation of investments P.2 8
12 Unrealised losses on investments + P.1 / D.4 60
13 Other technical charges, net of reinsurance P.2 1
Source: Eurostat Handbook (2013), Chapter 5
Output and value added calculations from the above Table
1
4
premiums earned = earned premiums, net of reinsurance (1) -
bonuses and rebates, net of reinsurance (7)
12970
1
5
Premium supplements = investment income (2) - unrealised
gains on investments (3) + unrealised losses on investments (12)
4620 D4/D44
1
6
Other technical income (assumed to be unearned premium)
(4)
50
1
7 Benefits due (5)
3000
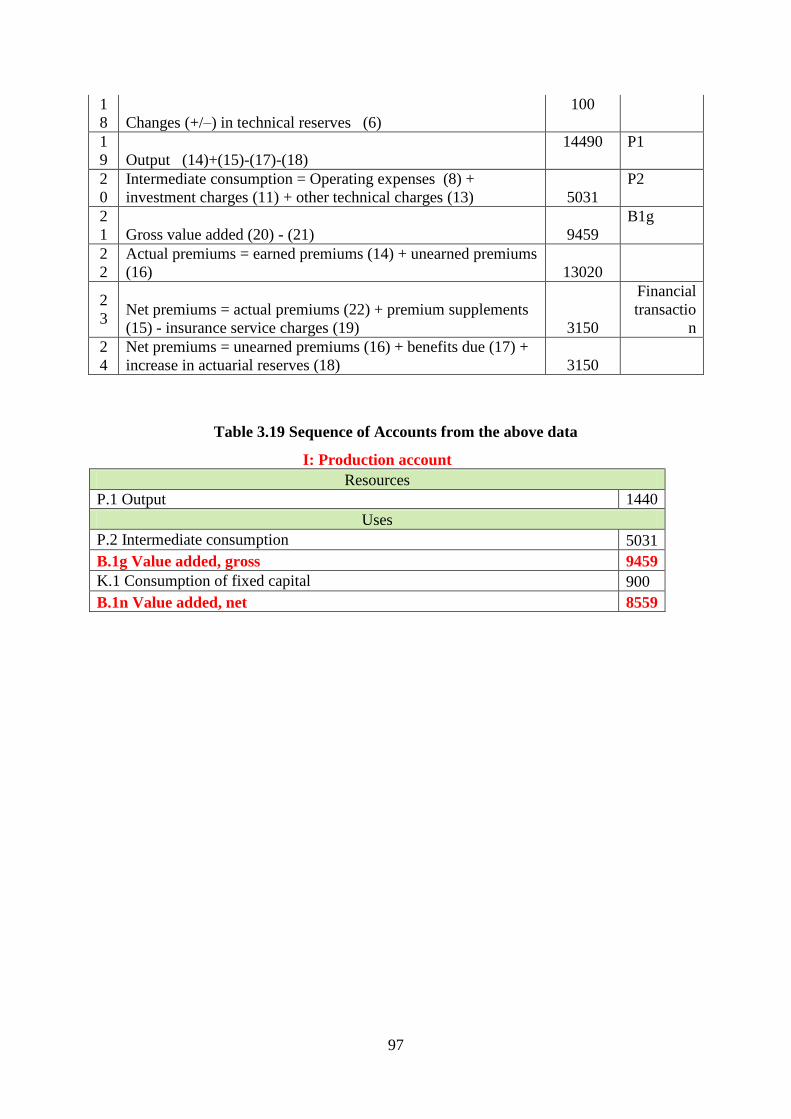
97
1
8 Changes (+/–) in technical reserves (6)
100
1
9 Output (14)+(15)-(17)-(18)
14490 P1
2
0
Intermediate consumption = Operating expenses (8) +
investment charges (11) + other technical charges (13) 5031
P2
2
1 Gross value added (20) - (21) 9459
B1g
2
2
Actual premiums = earned premiums (14) + unearned premiums
(16) 13020
2
3 Net premiums = actual premiums (22) + premium supplements
(15) - insurance service charges (19) 3150
Financial
transactio
n
2
4
Net premiums = unearned premiums (16) + benefits due (17) +
increase in actuarial reserves (18) 3150
Table 3.19 Sequence of Accounts from the above data
I: Production account
Resources
P.1 Output 1440
Uses
P.2 Intermediate consumption 5031
B.1g Value added, gross 9459
K.1 Consumption of fixed capital 900
B.1n Value added, net 8559
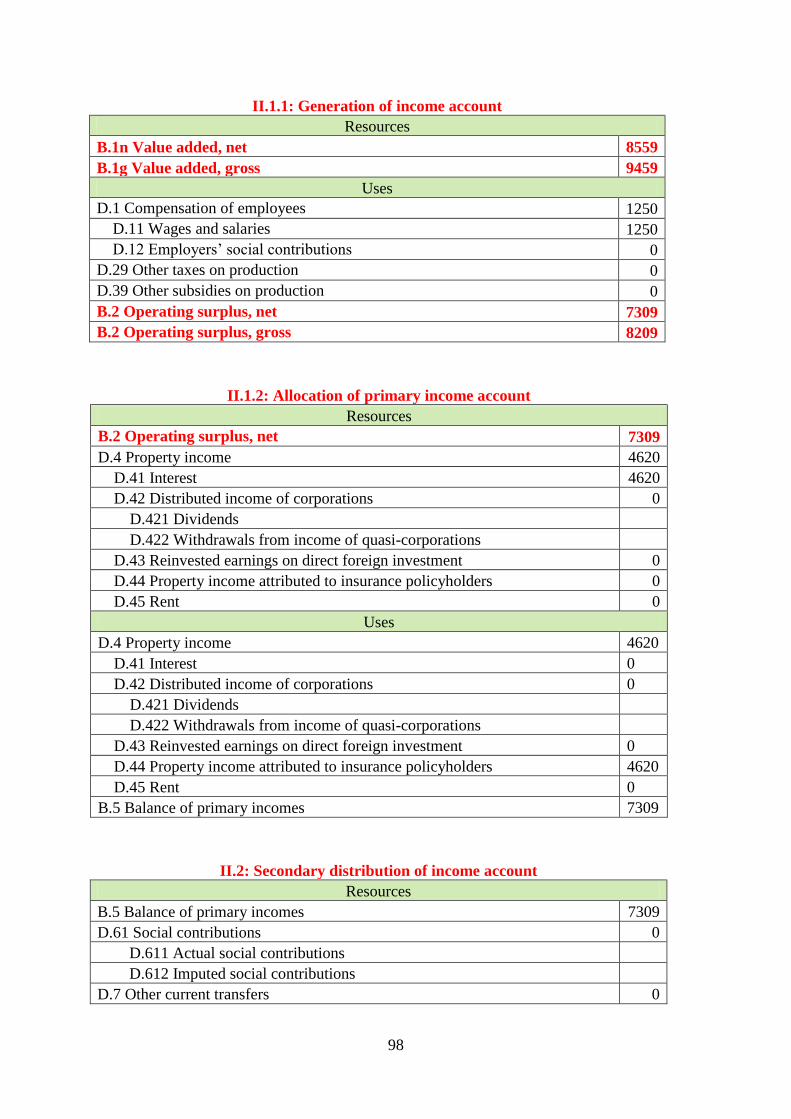
98
II.1.1: Generation of income account
Resources
B.1n Value added, net 8559
B.1g Value added, gross 9459
Uses
D.1 Compensation of employees 1250
D.11 Wages and salaries 1250
D.12 Employers‘ social contributions 0
D.29 Other taxes on production 0
D.39 Other subsidies on production 0
B.2 Operating surplus, net 7309
B.2 Operating surplus, gross 8209
II.1.2: Allocation of primary income account
Resources
B.2 Operating surplus, net 7309
D.4 Property income 4620
D.41 Interest 4620
D.42 Distributed income of corporations 0
D.421 Dividends
D.422 Withdrawals from income of quasi-corporations
D.43 Reinvested earnings on direct foreign investment 0
D.44 Property income attributed to insurance policyholders 0
D.45 Rent 0
Uses
D.4 Property income 4620
D.41 Interest 0
D.42 Distributed income of corporations 0
D.421 Dividends
D.422 Withdrawals from income of quasi-corporations
D.43 Reinvested earnings on direct foreign investment 0
D.44 Property income attributed to insurance policyholders 4620
D.45 Rent 0
B.5 Balance of primary incomes 7309
II.2: Secondary distribution of income account
Resources
B.5 Balance of primary incomes 7309
D.61 Social contributions 0
D.611 Actual social contributions
D.612 Imputed social contributions
D.7 Other current transfers 0
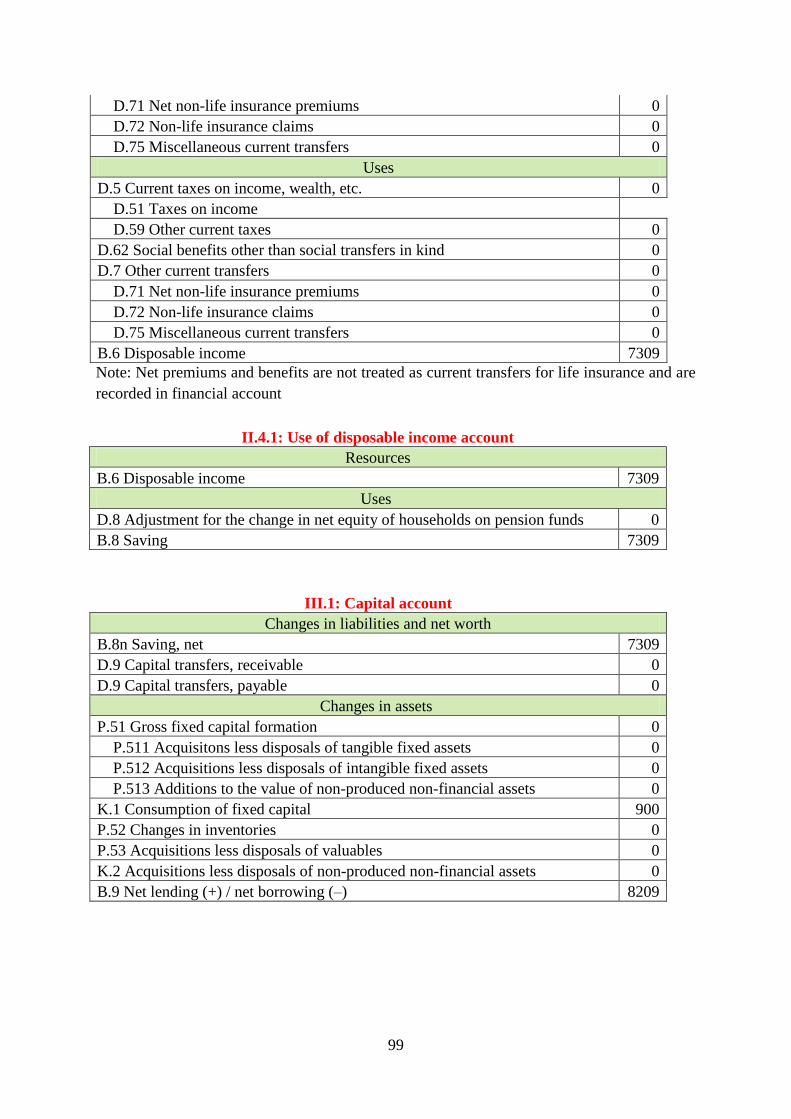
99
D.71 Net non-life insurance premiums 0
D.72 Non-life insurance claims 0
D.75 Miscellaneous current transfers 0
Uses
D.5 Current taxes on income, wealth, etc. 0
D.51 Taxes on income
D.59 Other current taxes 0
D.62 Social benefits other than social transfers in kind 0
D.7 Other current transfers 0
D.71 Net non-life insurance premiums 0
D.72 Non-life insurance claims 0
D.75 Miscellaneous current transfers 0
B.6 Disposable income 7309
Note: Net premiums and benefits are not treated as current transfers for life insurance and are
recorded in financial account
II.4.1: Use of disposable income account
Resources
B.6 Disposable income 7309
Uses
D.8 Adjustment for the change in net equity of households on pension funds 0
B.8 Saving 7309
III.1: Capital account
Changes in liabilities and net worth
B.8n Saving, net 7309
D.9 Capital transfers, receivable 0
D.9 Capital transfers, payable 0
Changes in assets
P.51 Gross fixed capital formation 0
P.511 Acquisitons less disposals of tangible fixed assets 0
P.512 Acquisitions less disposals of intangible fixed assets 0
P.513 Additions to the value of non-produced non-financial assets 0
K.1 Consumption of fixed capital 900
P.52 Changes in inventories 0
P.53 Acquisitions less disposals of valuables 0
K.2 Acquisitions less disposals of non-produced non-financial assets 0
B.9 Net lending (+) / net borrowing (–) 8209
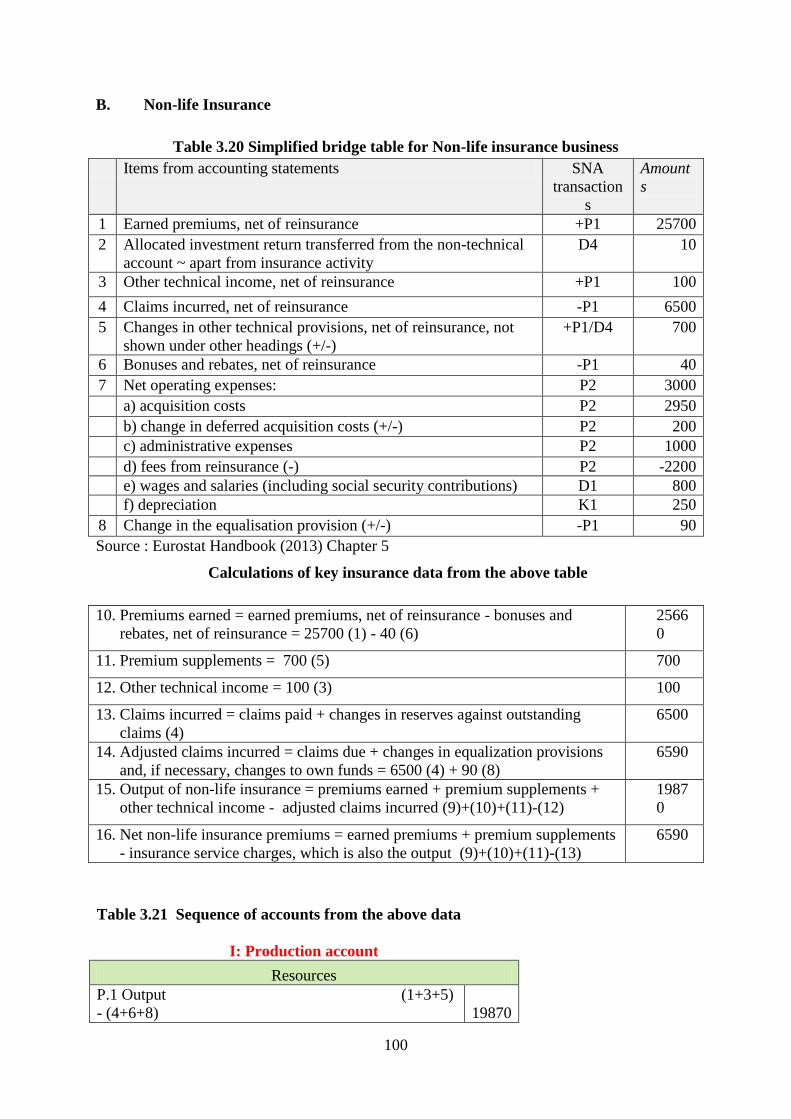
100
B. Non-life Insurance
Table 3.20 Simplified bridge table for Non-life insurance business
Items from accounting statements SNA
transaction
s
Amount
s
1 Earned premiums, net of reinsurance +P1 25700
2 Allocated investment return transferred from the non-technical
account ~ apart from insurance activity
D4 10
3 Other technical income, net of reinsurance +P1 100
4 Claims incurred, net of reinsurance -P1 6500
5 Changes in other technical provisions, net of reinsurance, not
shown under other headings (+/-)
+P1/D4 700
6 Bonuses and rebates, net of reinsurance -P1 40
7 Net operating expenses: P2 3000
a) acquisition costs P2 2950
b) change in deferred acquisition costs (+/-) P2 200
c) administrative expenses P2 1000
d) fees from reinsurance (-) P2 -2200
e) wages and salaries (including social security contributions) D1 800
f) depreciation K1 250
8 Change in the equalisation provision (+/-) -P1 90
Source : Eurostat Handbook (2013) Chapter 5
Calculations of key insurance data from the above table
10. Premiums earned = earned premiums, net of reinsurance - bonuses and
rebates, net of reinsurance = 25700 (1) - 40 (6)
2566
0
11. Premium supplements = 700 (5) 700
12. Other technical income = 100 (3) 100
13. Claims incurred = claims paid + changes in reserves against outstanding
claims (4)
6500
14. Adjusted claims incurred = claims due + changes in equalization provisions
and, if necessary, changes to own funds = 6500 (4) + 90 (8)
6590
15. Output of non-life insurance = premiums earned + premium supplements +
other technical income - adjusted claims incurred (9)+(10)+(11)-(12)
1987
0
16. Net non-life insurance premiums = earned premiums + premium supplements
- insurance service charges, which is also the output (9)+(10)+(11)-(13)
6590
Table 3.21 Sequence of accounts from the above data
I: Production account
Resources
P.1 Output (1+3+5)
- (4+6+8) 19870
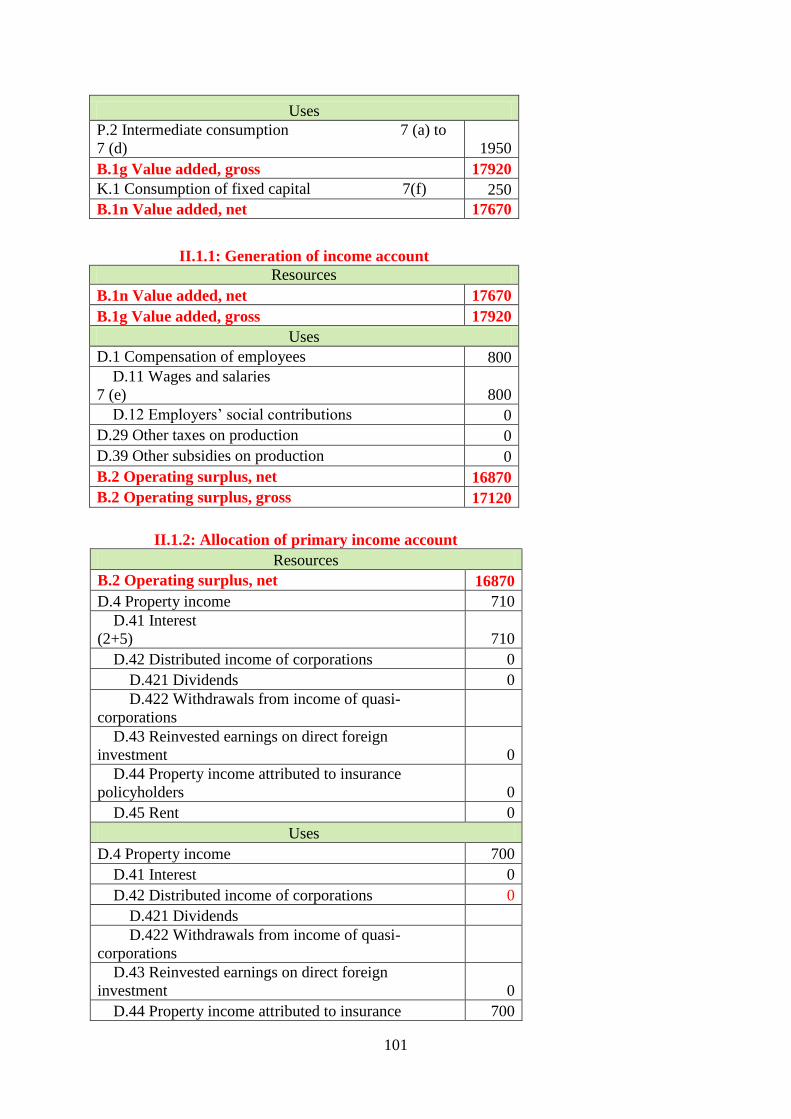
101
Uses
P.2 Intermediate consumption 7 (a) to
7 (d) 1950
B.1g Value added, gross 17920
K.1 Consumption of fixed capital 7(f) 250
B.1n Value added, net 17670
II.1.1: Generation of income account
Resources
B.1n Value added, net 17670
B.1g Value added, gross 17920
Uses
D.1 Compensation of employees 800
D.11 Wages and salaries
7 (e) 800
D.12 Employers‘ social contributions 0
D.29 Other taxes on production 0
D.39 Other subsidies on production 0
B.2 Operating surplus, net 16870
B.2 Operating surplus, gross 17120
II.1.2: Allocation of primary income account
Resources
B.2 Operating surplus, net 16870
D.4 Property income 710
D.41 Interest
(2+5) 710
D.42 Distributed income of corporations 0
D.421 Dividends 0
D.422 Withdrawals from income of quasi-
corporations
D.43 Reinvested earnings on direct foreign
investment 0
D.44 Property income attributed to insurance
policyholders 0
D.45 Rent 0
Uses
D.4 Property income 700
D.41 Interest 0
D.42 Distributed income of corporations 0
D.421 Dividends
D.422 Withdrawals from income of quasi-
corporations
D.43 Reinvested earnings on direct foreign
investment 0
D.44 Property income attributed to insurance 700
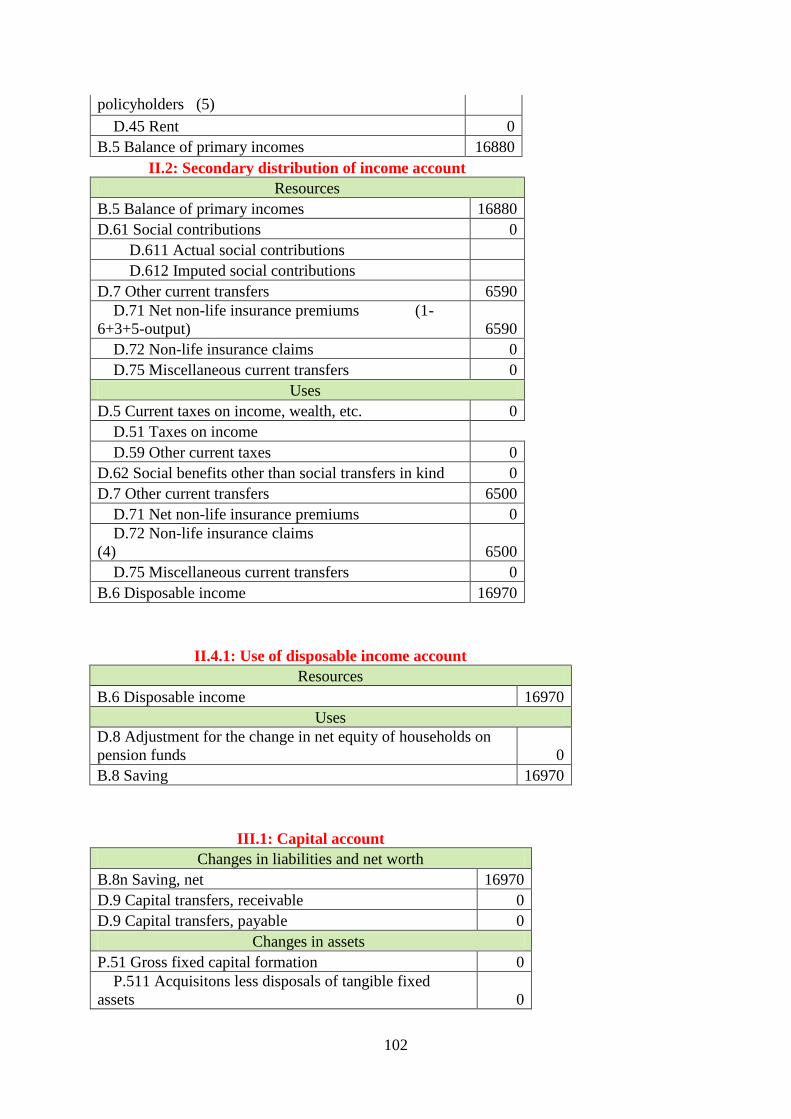
102
policyholders (5)
D.45 Rent 0
B.5 Balance of primary incomes 16880
II.2: Secondary distribution of income account
Resources
B.5 Balance of primary incomes 16880
D.61 Social contributions 0
D.611 Actual social contributions
D.612 Imputed social contributions
D.7 Other current transfers 6590
D.71 Net non-life insurance premiums (1-
6+3+5-output) 6590
D.72 Non-life insurance claims 0
D.75 Miscellaneous current transfers 0
Uses
D.5 Current taxes on income, wealth, etc. 0
D.51 Taxes on income
D.59 Other current taxes 0
D.62 Social benefits other than social transfers in kind 0
D.7 Other current transfers 6500
D.71 Net non-life insurance premiums 0
D.72 Non-life insurance claims
(4) 6500
D.75 Miscellaneous current transfers 0
B.6 Disposable income 16970
II.4.1: Use of disposable income account
Resources
B.6 Disposable income 16970
Uses
D.8 Adjustment for the change in net equity of households on
pension funds 0
B.8 Saving 16970
III.1: Capital account
Changes in liabilities and net worth
B.8n Saving, net 16970
D.9 Capital transfers, receivable 0
D.9 Capital transfers, payable 0
Changes in assets
P.51 Gross fixed capital formation 0
P.511 Acquisitons less disposals of tangible fixed
assets 0
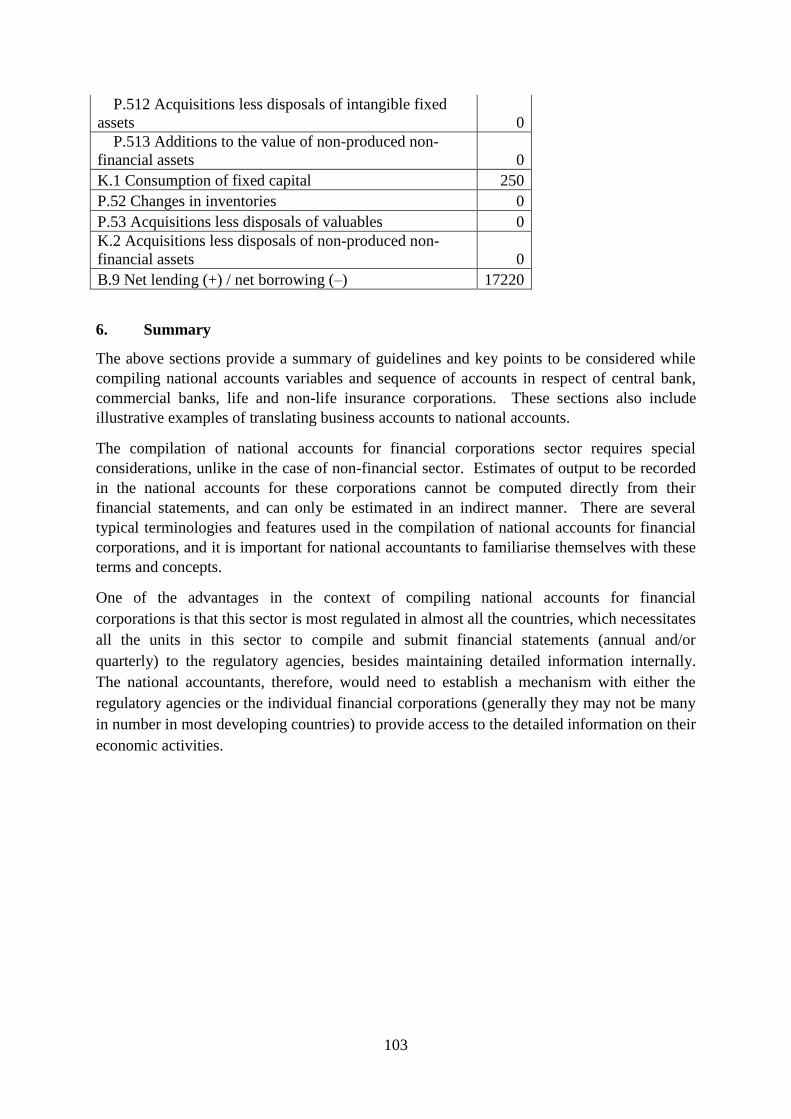
103
P.512 Acquisitions less disposals of intangible fixed
assets 0
P.513 Additions to the value of non-produced non-
financial assets 0
K.1 Consumption of fixed capital 250
P.52 Changes in inventories 0
P.53 Acquisitions less disposals of valuables 0
K.2 Acquisitions less disposals of non-produced non-
financial assets 0
B.9 Net lending (+) / net borrowing (–) 17220
6. Summary
The above sections provide a summary of guidelines and key points to be considered while
compiling national accounts variables and sequence of accounts in respect of central bank,
commercial banks, life and non-life insurance corporations. These sections also include
illustrative examples of translating business accounts to national accounts.
The compilation of national accounts for financial corporations sector requires special
considerations, unlike in the case of non-financial sector. Estimates of output to be recorded
in the national accounts for these corporations cannot be computed directly from their
financial statements, and can only be estimated in an indirect manner. There are several
typical terminologies and features used in the compilation of national accounts for financial
corporations, and it is important for national accountants to familiarise themselves with these
terms and concepts.
One of the advantages in the context of compiling national accounts for financial
corporations is that this sector is most regulated in almost all the countries, which necessitates
all the units in this sector to compile and submit financial statements (annual and/or
quarterly) to the regulatory agencies, besides maintaining detailed information internally.
The national accountants, therefore, would need to establish a mechanism with either the
regulatory agencies or the individual financial corporations (generally they may not be many
in number in most developing countries) to provide access to the detailed information on their
economic activities.
104
Chapter 4: Use of annual financial statements of non-financial companies for national
accounts
This chapter presents the translation of administrative data of non-financial corporations
comprising their financial statements, to the national accounts. .
The text for the chapter has mainly been sourced from the following three documents:
1) System of National Accounts, 2008, European Commission, IMF, OECD, UN, World
Bank, 2009
2) Links between business accounting and national accounts, United Nation, 2000;
3) Essential SNA: Building the basics, European Commission, 2013.
The chapter also includes few African country practices of using financial statements of
financial corporations in national accounts.
1. Introduction
The aim of the chapter is to presents the use of company accountants in the preparation of the
full sequence of accounts of the non-financial sector according to the 2008 System of
National Accounts (SNA). The sequence of accounts includes the production account, the
generation of income account, the allocation of primary income account, the secondary
distribution of income account, the use of disposable income account, the capital account, the
financial account and the balance sheet. Because there are many conceptual differences
between company accounts and national accounts, linking them would require many
adjustments: some may be carried out with information only from company accounts, but
others may be carried out only when taking the whole economy into consideration.
Some countries use company accounts indirectly through censuses and surveys of business or
tax returns; others use business financial reports directly. Many countries, however, combine
both direct and indirect uses. No matter how business data are obtained, it is important that
their content is well included in national accounts and the indicators are calculated based on
SNA methodological requirements. It is for this reason that this chapter is devoted to present
the links of accounting system to national accounts concepts. The linking requires a clear
understanding of company accounts, which is, more often, a handicap faced by national
accountants who are trained mainly in macroeconomics and not in business accounting. An
understanding of company accounts formats and the conceptual links between SNA and
company accounts would help national accountants to use financial data properly and to
obtain the needed information necessary for their calculations.
Since company accounts are the only or main source of information on corporate business
activities, it seems natural that a standardized format should be developed to link data from
company accounts to national accounts. Unfortunately, accounting standards, both in format
and content, may vary not only from one country to another but also from one business to
another; this makes it impossible to develop a standardized format for converting company
accounts to national accounts. National accountants, as a consequence, have to use their
judgement and understanding of the accounting practices in their countries to link company
accounts data to national accounts data with appropriate adjustments. Because of the
105
complication imposed by non-standardization, it is suggested that information from company
accounts should first be rearranged in the formats of national accounts - which are called
intermediate accounts - without any adjustments. Individual items in the intermediate
accounts are then adjusted to conform as much as possible to national accounts.
2. Accounting system
2.1 Financial statements
The development of the national accounts requires a successful cooperation between national
accountants and the company which provide the basic data and more extensive and close
cooperation with company accounting professions.
In order to extract the most useful information from company accounts it is necessary for
national accountants to develop a clear understanding of company accounting practices.
Therefore it would be advantageous for the National Accounts community to take a greater
interest in the development of international accounting standards for private corporations by
the International Accounting Standards Board (IASB).
It is important to note that while the national accounting has international standards shared
across every country in the world, the development and application of business accounting
have been different amongst countries. However, business accounting is moving to applying
shared international standards. Thus global financial reporting has ceased to be characterised
by numerous disparate national systems to the point at which there are today essentially only
two – IFRS (as issued by IASB) and US GAAP (as issued by FASB).
The IASB was previously known as the International Accounting Standards Committee
(IASC) until April 2001, when it became the IASB. The IASC was originally set up in 1973
and was the sole body to have both responsibility and authority to issue international
accounting standards. In 2001, when the IASB took over responsibility for international
financial reporting, it took on all of the IASC‘s standards. The IASB amended many of the
standards, but then began to issue its own standards, which were known as International
Financial Reporting Standards (IFRS). The term ‗IFRS‘ has become a somewhat generic term
that refers to all the standards (both IAS and IFRS).
Income statement
The income statement is one of the major financial statements used by accountants and
business owners. The other major financial statements are the balance sheet, statement of
cash flows, and the statement of changes in equity.
The income statement provides us an insight into the performance of the company for a
period of time. The balance sheet (also known as the statement of financial position) provides
us a snapshot of the business' financial position (assets, liabilities and equity) at the end of the
time period. The statement of cash flows and the statement of changes in equity provide
detail of how the company's financial position changed during the time period.
The format of the income statement or the profit and loss statement will vary according to the
complexity of the business activities.
Income statement can be prepared in either in the format of single-step income statement or
of multi-step income statement.
106
The expenses in an income statement are either classified by their nature or by their function.
An income statement by nature method is the one in which expenses are disclosed according
to their nature such as depreciation, transports costs, rent expense, wages and salaries etc.
There is no reallocation of these expenses to different functions of the entity (i.e. cost of
goods sold, selling costs, administrative costs and other expenses).
The statement in which the expenses are disclosed according with their nature is used in
single step income statement and it is usually employed by small businesses due to its
simplicity.
In the other case when the expenses are disclosed according with their functions and allowed
the calculation of gross profit and operating profit it is usually used in the multi-step format
of income statement. Most large and medium sized businesses use the function method of
expense disclosure.
Use of financial statements
In order that national accountants may use company accounts on a large scale, and not just in
isolated cases, a number of other conditions must be met.
The first condition is access to companies' accounts. Usually, the publication of accounts is
mandatory. All company accounts are publicly available, the level of information and
disclosed is dependent upon their size and whether they are classified as small, medium or
large. Databases are most often set up by private or public bodies, and it is important that
national accountants are able to access these.
Also, it is important to note that the different types of accounts and the detail available will
vary across private sector and public sector enterprises and between small, medium and large
enterprises.
The second condition is a minimum degree of standardisation of the accounting documents
published by enterprises, since this is a necessary condition for computerised processing. A
high level of standardisation is often associated with the existence of a body collecting
accounts from enterprises in this form. Collection may be organised on a voluntary basis, as
in the case of the body running a financial statements centre which performs analyses for its
members, or it may be made mandatory by law, as it is the case where the collecting body is
the tax authority. In both cases, the most advantageous situation is one in which the national
accountants are able to access and use the databases set up in this way.
Company accounts can be used even when the accounts are not compiled on a strictly
standardised basis. In fact, in most countries, there are sectors of the economy dominated by a
small number of very large enterprises, and it is therefore possible and useful to take an
individual look at the accounts of these large enterprises in order to make assessments on the
basis of these for the needs of the National Accounts.
Such analyses are also useful because a great deal of information is contained not in the
accounts themselves but in the notes to the accounts, allowing either access to useful detail or
the avoidance of errors in interpretation.
When the national accountants are unable to access company accounts directly, they have to
resort to surveys. But these only provide satisfactory results if the questions asked are
compatible with company accounting. It is, in effect, pointless to expect an enterprise to be
able to provide reliable information which is not based on that existing within its own internal
information system. However, surveys are generally essential, even in the best case when the

107
national accountants are able to access the accounting databases, as the information contained
in these databases is rarely detailed enough to meet all the needs of the national accountants.
2.2 Principles and rules of accounting
The following paragraphs present some of the general principles of national accounts and
company accounts.
Double entry and quadruple entry
In company accounts, each transaction of the company is recorded in at least two different
accounts, once in the debit side of one the accounts, and once in the credit side of another
accounts, for the same amount. Double entry book keeping is the process of recording each
transaction twice - as an asset and a liability - in order to be able to set out balances showing
the financial state of the business at a particular moment in time. This double entry principle,
which permits a check of the consistency of company accounts, is applied in the same way in
National Accounts for a unit or sector.
Additionally, in national accounts, the concept of quadruple entry is used to reflect that each
transaction between tow institutional units should be recorded twice by each of the two
transactors involved. The quadruple entry principle ensures the conceptual basis for the
consistency of the National Accounts.
Time of recording
Company accounts record operations when they take place, giving rise to claims and
obligations, independently of the payment. This time of recording is known as an accrual
principle (as opposed to a cash basis). Conceptually, National Accounts follow the same
principle as company accounts.
Valuation
In both company accounts and in National Accounts, transactions are recorded initially at the
actual price agreed upon by the transactors.
Business accounting is concerned with past events and it requires consistency and
comparability that is why it requires the accounting transactions to be recorded at their
historical costs. This is called historical cost concept. Historical cost is the value of a resource
given up or a liability incurred to acquire an asset/service at the time when the resource was
given up or the liability incurred. In subsequent periods when there is appreciation is value,
the value is not recognized as an increase in assets value except where allowed or required by
accounting standards.
Accounting standard setters (IASB and FASB) continue to turn to fair value as a relevant
measure of assets and liabilities for financial reporting purposes. IFRS 13 defines fair value
as the price that would be received to sell an asset or paid to transfer a liability in an orderly
transaction between market participants at the measurement date. This concept is close to the
SNA valuation principle for balance sheet items.
Overall, that IFRS guidance provides a framework for measuring assets and liabilities at fair
value as well as requiring robust disclosures around the judgments and inputs behind the
measurements.
108
3. National accounts and company accounts- Practical issues
a. Accounting year start and end dates
The start and end dates of the accounting year and must correspond with the reference period
of the National Accounts. For annual National Accounts, this is generally the calendar year.
Thus it is desirable in order to make best use of company accounts these enterprises start their
accounting year on 1 January and end on 31 December.
Enterprises are seldom subject to this type of obligation.
For operations corresponding to flows, it is often acceptable to recreate accounts on the basis
of the calendar year by combining two successive accounting years. This can be problematic
for companies involved in highly seasonal activity such as sales of gas and electricity. For
balance sheets, this method provides less satisfactory results, especially for items liable to
rapid fluctuations during the year.
With regard to the length of the accounting year, this is normally one year but when the
enterprise is established or closes down, shorter or longer periods are also possible with
adjustments then being necessary.
Large enterprises, for example with stock market listings have to compile interim statements
and for some companies even quarterly accounts. These are rarely collected on a systematic
basis, and provide very limited detail for compiling quarterly National Accounts.
b. Currencies
The impact and treatment of currency changes and conversions, especially for global
businesses can pose problems. For example, some company accounts (e.g. oil companies)
provide details in dollars, some of the details are made available in resident countries‘
currency and some details are not converted, thereby making interpretation and use more
difficult within the resident countries‘ National Accounts.
c. Estimation of profit/loss
The profit/loss calculated in company accounts has to take into account problems linked with
the breakdown of time in periods.
Consider the example of goods purchased by the enterprise for an amount of 100 and resold
for an amount of 140. The profit generated by this transaction is equal to 40 assuming that
there have been no additional costs. When this transaction relates to a number of accounting
years, with the purchase taking place during the first accounting year and the sale during the
second, the profit/loss calculated at the end of each accounting year is an irrelevance.
Therefore, the accounting system only calculates the profit/loss from this purchase/sale
transaction once it becomes certain, i.e. at the end of the second accounting year.
For doing that, it is not possible to directly record the purchase and sale in the second
accounting year, because the purchase, like any transaction, must first be recorded at the time
it takes place, in this case during the first accounting year. So there is a need to, in some way,
transfer the purchase from the first accounting year to the second. Two accounts are therefore
used, an income statement account, the changes in stocks account, and a balance sheet
account, the stocks account.
Generally speaking, the following equalities hold in terms of physical quantities for any
period:
Opening stock + purchases = Sales + closing stock.
109
This equality is simply an expression of the fact that goods can either come from the opening
stock or purchases and that either they are sold or they remain in the closing stock at the end
of the accounting year.
The equality can also be written as:
Sales = Purchases + Opening stock - Closing stock.
For this purpose, the changes in stocks account records on its debit side the opening stock and
on its credit side the closing stock. At balance sheet level, the stock account includes at the
start of the accounting year the balance from the previous accounting year, i.e. the opening
stock. It then records the symmetrical movements in the income statement, so that at its close
it only shows the closing stock.
In order that the profit/loss only appears at the time of the sale, it is necessary that the stocks
are valued at their costs of acquisition. This principle is easy to apply when the goods can be
identified individually. This is no longer the case when the goods held in stock are fully
interchangeable and acquired at different prices, and so a number of stock valuation methods
have been developed: First-In First-Out, (FIFO), Last-In First-Out (LIFO), etc. Since these
methods all provide different results, it is necessary that the national accountant knows which
method is used by the enterprise in order to correctly interpret the information on its stocks.
d. Fixed assets
There are differences in definition/coverage such that some items may be treated as current
expenditure in company accounts but as capital expenditure in National Accounts.
For example:
Items like computer software are often treated as current expenditure, sometimes even
small purchases like laptops do not feature in capital expenditure in company
accounts.
The National Accounts definition of GFCF covers ―….lasts for longer than a year‖,
this is different from ―…use over a number of accounting years‖.
In fact, some expenditure cannot be attributed to a single accounting year, and this is the case
in particular with buildings and equipment used by the enterprise over a number of years.
These purchases have to be removed from the calculation of the profit/loss for the accounting
year during which they take place in order to be spread over all the accounting years in which
the goods are used.
Otherwise, the purchase could result in a loss being shown at the time it took place.
Spreading the cost of acquisition over the various accounting years takes place on the basis of
the estimated reduction in value of the goods item during each accounting year of its period
of use.
Two models that are radically different in terms of valuation are possible. The first is based
on a conventional estimate which in practice translates as the drawing up of an amortisation
schedule, and the second is based on an assessment of the market value of the goods item. In
terms of the mechanics of accounting both methods are based on the same logic.
In both methods, the purchase of the goods item intended for use over a number of
accounting years is recorded at the time it takes place, in a fixed assets account which is a
balance sheet account. At the end of each accounting year, the reduction in value of the goods
item during the accounting year is deducted from the balance sheet in order to be carried over
to the income statement.
110
e. Consumption of fixed capital
A major difference commonly cited is in the treatment of depreciation: accounting for tax
purposes may apply a depreciation schedule allowed by tax authorities in order to reduce the
immediate payment of income taxes while accounting for business analysis focuses on the
true standing of a company with a different schedule of depreciation which reflects the nature
of the fixed assets. This, however, is not an important issue in national accounts, where the
concept of depreciation (or consumption of fixed capital) is not the same as in company
accounts. The SNA concept of consumption of fixed capital must reflect the cost of fixed
capital used up in production, which is measured at current market price. The consumption of
fixed capital is commonly calculated by the perpetual inventory method (PIM) to replace
depreciation used in business accounting in order to come closer to the actual cost of fixed
capital used in production. In many developing countries that are unable to calculate the SNA
consumption of fixed capital for lack of time series data on fixed capital formation, business
depreciation is used as a proxy.
f. Capitalised expenses
The balance sheet assets may include items that do not correspond to assets within the
meaning of National Accounts. In fact, expenses, for example advertising expenses (treated
as intermediate consumption in National Accounts), which are likely to have a positive
influence upon the enterprise for a number of accounting years, may be recorded in the
balance sheet as fixed assets are in order to be spread over a number of accounting years and
not charged solely to the accounting year in which they occur.
If the advertising expenditure in this case related to a number of years, then it could be treated
as current assets and held as a pre-payment for which the advertising related to future periods.
If the advertising expenditure would be capitalised in company accounts then it would be
open to an impairment review, where the capitalised amounts in the financial statement
would have to be demonstrated.
This possibility of capitalisation of expenses is not accepted by all accounting systems,
however, and in particular not by the IFRS standards.
g. Provisions (exceptional items)
The introduction of provisions is the result of the application of the principle of prudence.
When the enterprise envisages charges or recognises depreciation, it must show these in the
calculation of the profit/loss for the accounting year in progress, even if it is not yet able to
determine the value of these with certainty.
Two types of provisions can be identified:
Provisions for charges corresponding to an expense which the enterprise is certain to
have to incur but for an amount that it does not know precisely; and
Provisions for depreciation of assets corresponding to a reduction in value of assets
such as machines, buildings, stocks, and amounts receivable, the amount of which is
not known with any accuracy.
In the case of provisions for charges, the principle is as follows: the estimated charge is
entered in the income statement for the current accounting year. When the charge has actually
occurred, it is deducted from the income statement and replaced by its actual value.
Since the estimated value must appear for two accounting years, it is necessary to use the
balance sheet. Two accounts are necessary, and sometimes three accounts are used:
111
Two management accounts:
- the transfer to provisions account which records the amount of the provision;
and
- the write-back of provisions account which records its cancellation – this is not
always necessary.
One balance sheet account, the provisions account.
The write-back of provisions account does not always exist and, in this case the provision is
credited to the expense account from which it originated.
Provisions for depreciation of assets can follow the same system but in the balance sheet,
they appear most often as a liability in order to determine net values, i.e. cost less
accumulative depreciation (provision) as shown in the notes.
There are a number of different techniques that can be used to arrive at the best estimate of
the amount of a provision, where the creditor does not wish to settle and where there is no
market in obligations of the kind for which provision is being made. Assuming that it is
possible to specify all the possible outcomes and their associate probabilities, the amount to
be provided for an obligation could be estimated.
h. Consolidation of company accounts
Another issue of importance to national accounting is the consolidation of company accounts
of a parent company and its subsidiaries. When a corporation holds substantial voting rights
in another company (even with less than 50% ownership), the financial statements of the
parent and subsidiary may be combined into what are termed consolidated company
accounts. In the United States of America, consolidation of a Consolidation, however,
reduces the information available to national accountants since consolidated company
accounts of a parent corporation and its subsidiaries are not the sum of their elements. In the
consolidated income statement, revenues and expenses resulting from intercompany
transactions are netted out.
It is important for the purposes of compiling national accounts that unconsolidated company
accounts be the norm. This is the reason that SNA recommends in its paragraph 4.38 that
"each individual corporation should be treated as a separate institutional unit". Another
reason for the SNA to take this position is that groups of corporations and conglomerates are
heterogeneous in activities and their size and composition may be continually shifting over
time as a result of mergers and takeovers, thus changing the classification of an institutional
unit and, therefore, defeating the purpose of time series analysis. In order to study the
relationships between output and inputs, the netting out of intra-company transactions in
consolidated accounts would not be appropriate since it distorts the relationships between
output and inputs.
It is important to emphasize that accounts for the non-financial corporate sector cannot be
compiled independently. They must be compiled in an integrated manner with other sectors
of the economy.
The confrontation of data from other sectors would result in more reliable data. For example,
tax payable reported by the non-financial corporations must be confronted with the same data
received by the Government which should be taken as more reliable. The second case is
insurance expenses and claims. These are normally not reported separately in company
accounts since the amounts payable and receivable may not be significant; therefore the
112
information on insurance must be obtained from insurance companies. Similarly, data on
reported interest receivable and payable by business which are normally incomplete must be
confronted with
i. Holding gains/losses
Holding gains and losses represent one of the major difficulties in the transition from
company accounts to National Accounts. These stem from having to separate the profit/loss
arising from these gains or losses. They may appear whenever elements from the income
statement are deduced from elements valued in the balance sheet. For example, intermediate
consumption of raw materials originates from a purchase and/or from a withdrawal from
stock.
In National Accounts, the withdrawal from stock must be valued at market price at the time it
took place, while in company accounts no such rule would apply as it would be assumed that
the enterprise permanently monitors the change in prices of raw materials in the market. The
accounting system of the enterprise therefore values the withdrawal from stock at its
historical cost, i.e. at the price of the goods item at the time it was purchased. The difference
between the two prices is considered in National Accounts as a holding gain or a holding
loss.
Eliminating holding gains/losses on stocks is not easy as it requires the collection of
numerous pieces of mostly supplementary accounting information and the use of numerous
assumptions. The information collected must relate both to the nature of the products stocked
and the change in prices in the course of the year. Since the information available on the
nature of products tends to relate to sales and purchases rather than to the stocks themselves,
it is necessary to base the estimates on models with assumptions. Despite the imprecision,
this exercise is the price that has to be paid for being able to use the data from company
accounts.
The valuations of assets at fair value provide a better picture of the balance sheet than
valuations at historic cost but they also generate more data on holding gains/losses at the
income statement level since each year this must include revaluations of balance sheet assets
or liabilities.
j. Mergers and acquisitions
Corporate restructuring implies appearance and disappearance of certain financial assets and
liabilities. When a corporation disappears as an independent legal unit because it is absorbed
by one or more corporations, all financial assets/liabilities including shares and other equity
that existed between that corporation, and those that absorbed it, disappear from the system of
National Accounts. This disappearance has to be recorded as changes in sector classification
and structure in the other changes in the volume of assets accounts.
However, the purchase of shares and other equity of a corporation as part of a merger is to be
recorded as financial transaction between the purchasing corporation and the previous owner.
Replacement of existing shares by shares in the takeover or new corporation are to be
recorded as redemptions of shares accompanied by the issue of new shares. Financial
assets/liabilities that existed between the absorbed corporation and third parties remain
unchanged and pass to the absorbing corporation(s).
Similarly when a corporation is legally split up into two or more institutional units, any new
financial assets and liabilities (appearance of financial assets) are recorded as changes in
sector classification and structure.

113
k. Fines and penalties
Fines and penalties are examples which may result in a provision being made in company
accounts. For example, an enterprise causes pollution for which it has to pay a fine. As soon
as the enterprise is able to estimate with the amount of this fine, it must make a provision in
its accounts.
In National Accounts, a fine corresponds to a current transfer. Transfers must be recorded at
the date of their operative event. For example, compensation of employees is recorded on the
date that employees perform their work and not on the date when they are actually paid. In
the case of our example, the pollution can be considered as the operative event but at this
point the fine is not certain and a valuation of this is generally impossible. Other events can
be considered as operative events, for example the discovery of the pollution by the
authorities or a court ruling. In fact, National Accounts take the date of the fine as the
operative event.
The difference between the provision recorded in the accounts of the enterprise and the
recording in the National Accounts is therefore twofold: firstly there is a difference in the
date of recording and secondly there may be a difference between the estimated fine used to
make the provision and the actual sum used by National Accounts.
l. Contracts
Contracts are another example of how National Accounts and company accounts can diverge.
A contract entered into by two parties generates an obligation for at least one of the two
parties corresponding to a right of the other party. In company accounts, according to IFRS
standards, as soon as it is possible to accurately estimate the cost of cancelling the contract,
the obligation of the enterprise must be considered as a non-financial liability and recorded in
the accounts of the enterprise in the same way as a provision. Each obligation of an enterprise
will necessarily correspond to a right of another agent.
In company accounts this right is not considered as an asset by application of the principle of
prudence. An exclusivity contract made between two enterprises is an example of such a
contract. It must be recorded under the liabilities of the enterprise granting the exclusivity but
not under the assets of the enterprise benefiting from it.
The recording under assets and liabilities is therefore not symmetrical in company accounts
as only the liability is recorded.
In National Accounts, the situation is the reverse. In fact, the system does not recognise non-
financial liabilities, i.e. obligations from which it is possible to be released by making a
payment, even when these can be valued in a reliable manner. On the other hand, National
Accounts does acknowledge assets generated by contracts when these have a market value.
In National Accounts, obligations born out of a contract are only recorded in the accounts of
the agents benefiting from them and not in the accounts of those on whom they are
incumbent. The assets created on this occasion are considered by National Accounts as
intangible non-produced assets with no corresponding liability for another agent.
m. Globalisation
Globalisation is one of the major factors complicating the use of company accounts for the
purposes of preparing National Accounts. In fact, the accounts must be drawn up on a
national basis in order to be truly useful and this is not always the case, particularly when the
enterprises have establishments around the world.
114
When the activity of the enterprise extends beyond the national territory, adjustments are
necessary, and to be relevant these must be based on the company accounts. So it is necessary
that enterprises provide the body operating the accounting database either with accounts
prepared on a national basis or the details necessary to make adjustments. When the accounts
are collected from enterprises by the tax authority, the latter generally requires that the data
are provided on a national basis, this allows them to be able to calculate the tax on profit.
4. Compilation of national accounts from company accounts: non-financial
corporations
The financial statements provides almost all the information necessary for the compilation of
accounts for non-financial corporations in the SNA. Below the income statement is presented
in general formats in order to link it to 2008 SNA accounts.
The income statement is the main source of information for compiling production accounts,
primary and secondary distribution of income accounts of the corporate non-financial or
financial institutional sectors of the SNA. For the compilation of the SNA accounts, more
detailed information will be needed than is normally published for public consumption.
The procedure for compiling SNA accounts from company accounts is as follows:
1. First, classifying the items in the income statement into SNA transactions;
2. Second, assembling the reclassified items into intermediate accounts ( elaboration of
bridge tables) that are conceptually quite close to the SNA;
3. Third, adjusting the items in the intermediate accounts to make them fully compatible
with the SNA. This adjustment can be done only by national accountants on the basis
of information that is not usually available to business accountants.
4.1 Classifying the items in the income statement into SNA transactions
In terms of classifying items in business accounts into SNA transactions, identification and
estimation of the following SNA categories is most important:
(a) Output is an SNA concept and not a business accounting concept. It includes both
primary output and secondary outputs. Some secondary outputs such as rentals are
included in category for other income. All revenues that can be considered output by
the SNA must be assembled. To calculate main outputs from income statements, it is
necessary to net out the cost of goods bought for resale from net sales which is always
done in business accounts by including the cost of goods bought for resale as part of
the cost of goods sold.
Output can be roughly calculated as follows
Output = Output sold + Output held as inventory + Capitalised output + Sales of
goods bought for resale – Purchases of goods bought for resale + Changes in stocks
of finished and semi-finished products + Changes in stocks of goods bought for resale
+ Other operating income
Intra-enterprise transactions among their own establishments are normally not
regarded as revenues of the enterprise, but in the SNA, the outputs of establishments
must be estimated and added to the output of the enterprise. In order not to increase
115
value added, the same outputs are then treated as intermediate consumption of the
enterprise.
(b) Intermediate consumption requires one to identify in the cost of goods manufactured,
selling and general and other expenses, the intermediate input costs of goods and
services according to the SNA. Basically, the identification task requires removing
from the above expenses labour costs, depreciation, other taxes on production,
property income, current transfers, capital gains or losses.
Intermediate consumption = Purchases of raw materials and supplies – Changes in
stocks of raw materials and supplies + Other purchases and external charges + Other
operating costs
(c) Compensation of employees includes wages and salaries, and other compensation
relating to work and some payments by corporations which are not work-related such
as payments not involving any established funds for special needs of employees and
their dependents, such as educational allowances, health, death and accidents benefits,
pensions, etc.
(d) Depreciation and depletion must be identified since they are not treated as
intermediate consumption by the SNA.
(e) Other taxes on production include property taxes, levies on use of equipment,
payment for business licenses, stamp taxes, taxes on pollution, taxes on employment,
etc. Other subsidies on production are the opposite of the taxes mentioned above.
Business accounts are generally operated exclusive of deductible VAT so that the
information on input VAT and output VAT often only appears in the notes to the
accounts. Other production taxes and other production subsidies appear in the income
statement. The tax on profit paid during the course of the financial year may be found
either in the income statement of the previous financial year, or in the sources and
uses of funds statement for the financial year or in the appended tables.
(f) Current transfers include charitable contributions, insurance premiums, insurance
claims, fines and penalties. Current transfers may be classified in business accounts as
operating expenses, other income and extraordinary gains and loss. Minor
compensation payments not covered by insurance and awarded in or outside of court
are also included here.
(g) Capital transfers rarely appear in business accounts. However, in some developing
countries, they may appear, as corporations receive donations of equipment, or funds
to purchase equipment, large gifts or have debts written off voluntarily by creditors.
In developed countries, they include investment grants paid by central, state or local
governments to the enterprises; commercial debt cancellation by direct bilateral
agreement between enterprises or through indirect compensation paid by government.
Capital transfers should also include irregular and infrequent taxes on the values of
assets or net worth of corporations and on capital transfers. In addition, major
compensation payments for serious and extensive damage not covered by insurance
and awarded in or outside of court are included here.
116
(h) Property income includes interests, dividends, rents on non-produced assets, equity
earning. Interest received and paid appears in the income statement, and must be
adjusted for financial intermediation services indirectly measured (FISIM). Income
received from investment must also be increased by commission deducted at source.
Dividends received appear on the credit side of the income statement. Conversely,
dividends paid by an enterprise appear neither on the income statement, nor on the
balance sheet, and it is therefore necessary to consult another document such as the
sources and uses of funds statement. Reinvested earnings on direct foreign investment
cannot be gleaned directly from either the balance sheet or the income statement, and
can only be estimated on the basis of supplementary information about company
shareholders. Property income allocated to policyholders is deducted from insurance
premiums paid by an enterprise by applying a ratio calculated from the accounts of
insurance companies.
(i) Revaluation includes capital gains and loss, write-downs of inventories, bad-debt
write-offs when they result from a unilateral decision, if not they are recorded as
capital transfers.
(j) (Other changes in volume include depletion of natural resources.
4.2 Elaborating the bridge tables
The intermediate accounts derived from income statements are based on the bridge tables
realised and include mainly, production account and generation of income account and
provide information for the compilation of other accounts up to the use of disposable income
account.
The intermediate account consists of three parts: output at basic prices, intermediate
consumption in purchasers' prices and value added. Value added is calculated in two ways: as
the difference between output and intermediate consumption and as the sum of other
components in the business income statement. This is an important point as one can directly
compile value added and/or gross operating surplus for the intermediate account from the
income statement.
The format for the intermediate account of a non-financial corporation used here is generic
and has the following characteristics:
(a) The corporation is involved in both the production (or manufacturing) of goods and the
marketing and selling of its own products as well as products produced by others. Because of
the activity of reselling products produced by other producers, the output of this corporation
must include trade margins, which are calculated together with manufactured output by
deducting the cost of goods bought for resale from the net sales.
(b) Only the output of the corporation as a whole is of concern here and no attempt was made
to separate out its discrete outputs. Otherwise, the identification of trade margins would
require the separation of net sales of goods bought for resale from other net sales.
(c) Discontinued operations of segment and extraordinary gains or losses net of taxes are
assumed to be non-existent, otherwise the information from these two categories would have
to be broken down into various components and included in either other incomes, other
expenses, taxes on income or capital gains net of loss.
117
The setting up of the intermediate account can be more easily checked for errors if the
business income statement is rearranged in a T-account. Uses are shown on the left side and
resources are shown on the right side. Total uses have to be equal to total resources. When
items are moved from one side to another to form a particular part of the intermediate
account, the items will have to change signs. For example, when the cost of goods bought for
resale is brought to the right side to calculate output, its value becomes negative. If table T-
account is not prepared, another way to check for errors is to see whether value added
calculated by two different methods is the same.
4.3 Adjustment of intermediate accounts
After establishing the rough ‗bridge table‘, the transition from business accounting to national
accounting may be completed by making some adjustments to base data .These adjustments
can be categorised as follows:
Conceptual adjustments;
Adjustments to allow coherence with the accounts of other sectors; and
Adjustments for exhaustiveness.
4.3.1 Conceptual adjustments (required for output and intermediate consumption)
Conceptual adjustments are required because company accounts do not use the same concepts
as National Accounts and because where these concepts are close to each other, the valuation
methods are often different. These adjustments can differ in different countries as a function
of their specific characteristics and the chart of accounts adopted by their enterprises,
although it is possible to identify a number of these which will occur the most frequently.
Conceptual adjustments required for the calculation of output
It is important to note that output will exclude certain items. Some of which may be
included within the company‘s turnover or total income (which includes other operating
income) as recorded in company accounts, and will need adjustment, for example: grants
receivable, interest receivable and dividends receivable.
Adjustment for the transition to the basic prices
Turnover of enterprises is generally net of VAT but often includes some taxes on products.
Conversely, subsidies on products are rarely included in the turnover. It is therefore necessary
to make an adjustment to the data from company accounts by deducting taxes on products
and adding subsidies on products in order to arrive at the basic price. Often estimates on taxes
and subsidies on products are not available from company accounts.
Adjustment for deliveries between establishments of the same enterprise
Such deliveries are not usually the object of a sale and although they do not appear in the
accounts system of the enterprise they must nevertheless be recorded in the National
Accounts when they correspond to an output of one establishment delivered to another
establishment, forming intermediate consumption of the latter.
118
Adjustments for output reflecting margin earned on distribution type activity
Apart from the wholesale and retail distribution industries, certain activities such as travel
agencies have their output calculated in National Accounts using a margin concept. In this
case it is necessary to deduct from turnover the cost of sales.
Adjustments for own account output of software and other intellectual products
Own account output of software, databases, leisure, literary and artistic works, geological and
mining exploration is not recorded as output in company accounts. In this case, the
valuations must be carried out and added to the output recorded in the company accounts.
Adjustment for own account output of research and development, software and data
bases
The SNA includes in gross fixed capital formation (GFCF) the own account output of
research and development, software and data bases. When it is not recorded in company
accounts, a correction must be made. This will increase output, GVA and GFCF in the
National Accounts.
Adjustments for sales of land
The turnover of certain enterprises such as property developers includes sales of land and
these sales must be removed from the calculation of output based on SNA methodology.
Adjustment for inventory (stock) valuation
In company accounts, the changes in inventories are measured by the difference between the
closing stock value and the opening stock value. In National Accounts, the change in
inventories (stocks) corresponds to the difference between entries into and withdrawals from
stock, these being valued at the time they take place.
It is generally not possible to calculate the changes in stocks in this way but it is possible to
make an approximation based on a number of assumptions. In terms of physical quantities,
the following equation holds:
Opening stock + entries = Withdrawals + closing stock.
This identity simply means that, as resources, the goods can originate either from the opening
stock, or from entries and under uses they are either withdrawals or are in the closing stock.
This equality can also be written as:
Entries- withdrawals = Closing stock - opening stock.
This equality shows that if all its elements are valued at the same price then the calculation of
the changes in stocks by the difference between the closing stock and the opening stock gives
the same result as a calculation by the difference between the entries and withdrawals. In
other words, in the best case of a unique price, it is possible to deduce the changes in stocks
for National Accounts from that of company accounts.
Assuming that entries and withdrawals take place regularly during the accounting year, the
average price over the period of the entries and withdrawals is the same, offering the best
case scenario. In the case of output held as inventory, for example, the average price of
entries and withdrawals is also the average producer price. If the closing and opening stocks
taken from the balance sheets of enterprises are valued at the average producer price, it is
then possible to deduce from this the changes in stocks as the difference between these two
119
values. To do so it is necessary to know three prices: the prices of the closing and opening
stocks used by the company accountants, and the average basic producer price.
The prices used by the company accountants depend on the method used but in all cases, they
are valued at producer price whereas the basic price includes a profit element. An initial
adjustment must be made at this level. The second adjustment is connected with the fact that
prices have fluctuated during the year, so that the average price for the period is different
from the opening and closing prices. It is then necessary to deflate the stocks by price indices
in order to bring them back to the average prices. The main difficulty in applying this method
stems from the absence of a breakdown of stocks by products. A best estimate must therefore
be made of this from the available information. More often than not, no information is
directly available on prices at enterprise level and the problem has to be dealt with globally,
using price indices published by the NSIs.
Adjustment for capitalised output
Capitalised output is recorded in company accounts on the basis of the production costs. For
the transition to National Accounts, it is therefore necessary to add an element corresponding
to operating surplus. In some company accounts, the cost of production may include interest
which is not considered to be part of this variable in National Accounts.
Adjustment for ownership transfer costs
In company accounts, acquisitions of tangible or intangible fixed assets must be valued by
their cost, which will include various elements such as wages and salaries and intermediate
consumption. When the income statement is presented by nature, these costs are first
recorded on the debit side by nature and then transferred to the balance sheet through the
intermediary of a management account, the capitalised costs account. They are therefore
accounted for three times:
On the debit side of the income statement;
On the credit side of the income statement; and
On the debit side of the balance sheet as components of the capital cost.
In National Accounts, wages and salaries cannot directly add any value to assets as the gross
fixed capital formation is a use of production. All expenditure on personnel costs
corresponding to installation costs must therefore be considered as an own account
production of capitalised goods by the enterprise.
Conceptual adjustments for the calculation of intermediate consumption
Similar to the fact that certain exclusions are made to the National Accounts estimates of
output, the estimates of intermediate consumption exclude certain items which are included
within operating costs or expenditure side in company accounts, for example:
Labour costs;
Taxes on production and some taxes on products;
Bad debts;
Fines and penalties;
Depreciation;
120
Interest and dividends payable; and
Value of insurance premiums payable.
Adjustment for deliveries between establishments of the same enterprise
This was covered in previous section.
Adjustment for Insurance premiums
Insurance premiums payable by enterprises are part of their expenditure but National
Accounts require that these are split into three elements:
net premiums;
insurance service; and
premium supplements.
This distribution must be performed on the basis of the distribution taken from the accounts
of the insurance companies. Only the part corresponding to the service must be retained in
intermediate consumption and a correction must therefore be made in order to deduct the net
premiums and the premium supplements.
Adjustment for Leasing
Where the company accounts treats leasing like a rental an adjustment must be made to the
charges payable to the leasing companies in order to remove the part considered by the
National Accounts as a payment of interest and redemption of loans. In both National
Accounts and company accounts there is room for each of finance leasing and operating
leasing, although in some cases the treatment will not be the same. IFRS only treats as a
―financial operation‖ those leases which are, in substance, finance leases.
Adjustment for Commissions included in interest
Some commissions are included in the interest payable by enterprises or deducted from that
which they receive. The most important of these correspond to FISIM but it is also necessary
to take account of commissions deducted and interest payable by the collective investment
undertakings.
Adjustment for Land purchase
The expenditure of enterprises in certain activities such as property developers may involve
land purchase. Such land purchases must be removed from intermediate consumption.
Stock valuation adjustment
The changes in stocks of raw materials must be the subject of adjustments similar to those
made to the changes in stocks of finished products.
Adjustment for Costs associated with the acquisition of assets
In National Accounts, GFCF is valued at purchasers‘ prices, which include installation costs
and the ownership transfer costs. In company accounts, installation costs are generally
considered as incidental costs and are thus included in the purchasers‘ price of fixed assets.
As explained in the previous section on adjustments to output, these costs must normally be
considered as elements of the own account output of the enterprise. When the income
statement is presented by nature, expenses whose nature corresponds to intermediate
consumption are generally first recorded under charges before being transferred to the
121
balance sheet. Where this is not the case and these expenses are incorporated in the fixed
assets without passing through the balance sheet, they must be added to intermediate
consumption.
Adjustment for Bad debts
Other operating costs may include bad debts and therefore it is necessary to exclude them
from intermediate consumption.
4.3.2 Adjustments to achieve coherence with the accounts of other sectors
National Accounts require accounts of enterprises are coherent with those of the other
institutional sectors. As example, taxes and subsidies, valued on the basis of accounts of
enterprises must be coherent with those receivable by or payable by general government.
Taxes and subsidies
Company accounts are generally operated exclusive of deductible VAT so that the
information breaking down input VAT and output VAT are often not available.
Other taxes on production and other subsidies on production appear in the income statement
as appropriate. Company accounts do not distinguish between taxes on products from taxes
on production, and likewise for subsidies.
The tax on profit, for example corporation tax, shown in the income statement will only be
payable in the course of the following accounting year, i.e. more often than not the following
year. The income statement would show the tax payable inclusive of deferred tax and other
adjustments. The notes to the accounts would show the tax payable on the profits for the year,
and the cash flow statement would show the tax payable in the accounting period.
Property income
Interest receivable and payable appears in the income statement and must be adjusted for
FISIM. The income receivable by investment undertakings must also be increased by
commissions deducted at source.
Dividends receivable also appear on the credit side of the income statement. Conversely,
dividends payable by the enterprise appear neither in the income statement nor the balance
sheet. They are recorded on a cash basis under IFRS and differ from the principles of accrual
of national accounts.
Reinvested earnings on direct foreign investment cannot be found directly either from the
balance sheet or the income statement, and can only being estimated on the basis of
supplementary information on the shareholders in the enterprise.
Property income allocated to policy holders is deducted from insurance premiums payable by
the enterprise by application of the ratios taken from the accounts of the insurance
companies.
In practice, this is never achieved automatically for a number of reasons and so a rule is
needed in order to achieve this coherence. This is based on the fact that normally information
relating to general government is more reliable than that drawn from the statistics of
enterprises, and so it is the data drawn from company accounts that have to be adjusted.
This will apply to both output and intermediate consumption depending the tax and/or
subsidy.
122
4.3.3 Adjustments for exhaustiveness
In relation to enterprises, adjustments for exhaustiveness may be related to several causes
including: absence from statistical files; exemption from tax and social declarations; and
evasion. Examples of adjustments affecting output and intermediate consumption, as
appropriate, include:
Evasion regarding output sold and sale of goods for resale
Enterprises usually have an interest in underestimating their sales either for tax evasion
(which is illegal) or tax avoidance (by using strategies which are legal), and so an estimation
of this under-declaration is necessary which should be as far as possible based on information
provided by the tax offices. In some countries, underestimating the purchases will inhibit
businesses ability to reclaim VAT either on current expenditure and/or capital expenditure,
whether they are treated as exempt or not.
Income earned-in-kind
Income in kind corresponds to that part of their output that enterprises supply free of charge
to their employees although there may be a cost in terms of tax payable on the benefit
received for the employee. Similarly, there may be on-going costs to the employer for
providing the benefit.
When this income is not recorded in the company accounts, an adjustment must be made both
to the output and the compensation of employees. Where employees are housed free of
charge it is also necessary to estimate a property rentals output if this has not already been
taken into account in the company accounts.
Tips
When employees receive tips from customers of the enterprise these must be considered as
part of the turnover and thus output. So, that part of tips that is not recorded in the company
accounts must be subject to adjustment.
Evasion on purchases intended for intermediate consumption
In order to limit their tax burden enterprises have an interest in overstating their purchases.
However, as pointed out for purchases of goods, enterprises must also take into account that
fiscal controls are very often performed on the basis of ratios and that an understatement of
sales will be all the more credible if it goes hand in hand with an understatement of
purchases.
The national accountants must therefore take account of these two elements when assessing
the correction to be made to intermediate consumption.
Undeclared employment
A certain number of enterprises use undeclared workers who do not meet the criteria of
employees and must therefore be classed as self-employed persons. In this case the services
they provide for the enterprises must be considered as intermediate consumption.
4.4 Numerical example
The following tables present the translation of a model of financial statement of non-
financial companies to national accounts.
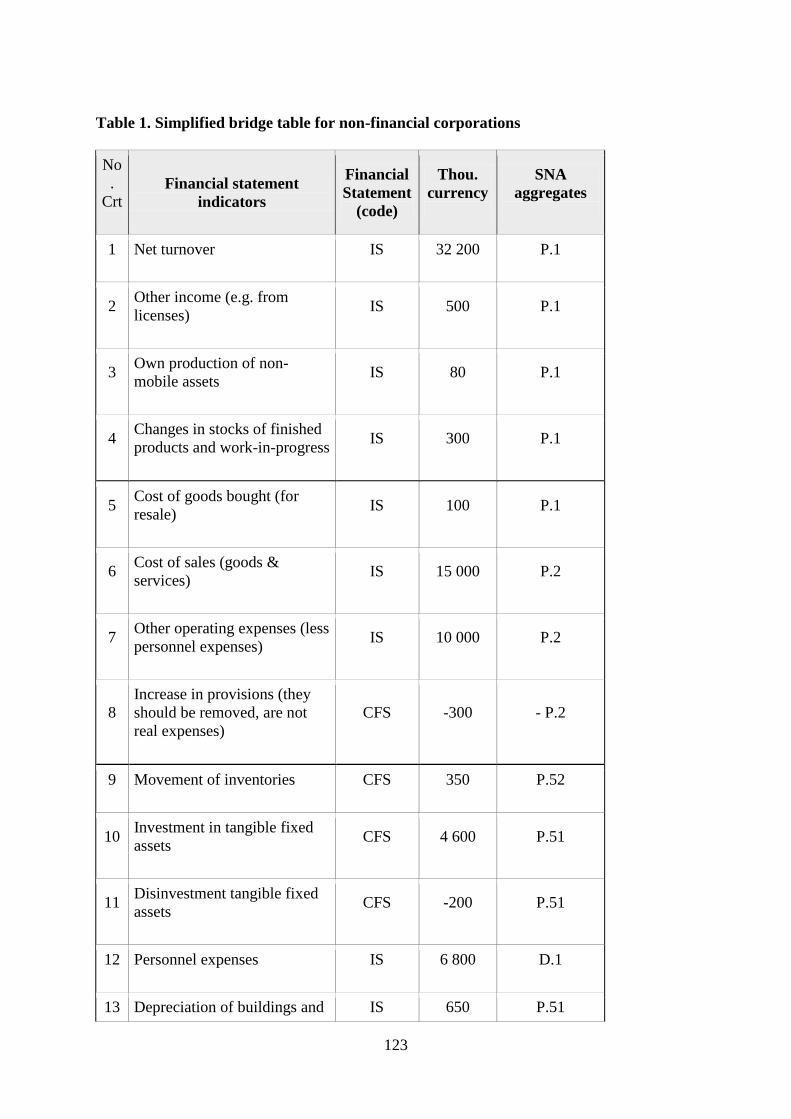
123
Table 1. Simplified bridge table for non-financial corporations
No
.
Crt
Financial statement
indicators
Financial
Statement
(code)
Thou.
currency
SNA
aggregates
1
Net turnover
IS
32 200
P.1
2
Other income (e.g. from
licenses)
IS
500
P.1
3
Own production of non-
mobile assets
IS
80
P.1
4
Changes in stocks of finished
products and work-in-progress
IS
300
P.1
5
Cost of goods bought (for
resale)
IS
100
P.1
6
Cost of sales (goods &
services)
IS
15 000
P.2
7
Other operating expenses (less
personnel expenses)
IS
10 000
P.2
8
Increase in provisions (they
should be removed, are not
real expenses)
CFS
-300
- P.2
9
Movement of inventories
CFS
350
P.52
10
Investment in tangible fixed
assets
CFS
4 600
P.51
11
Disinvestment tangible fixed
assets
CFS
-200
P.51
12
Personnel expenses
IS
6 800
D.1
13 Depreciation of buildings and IS 650 P.51
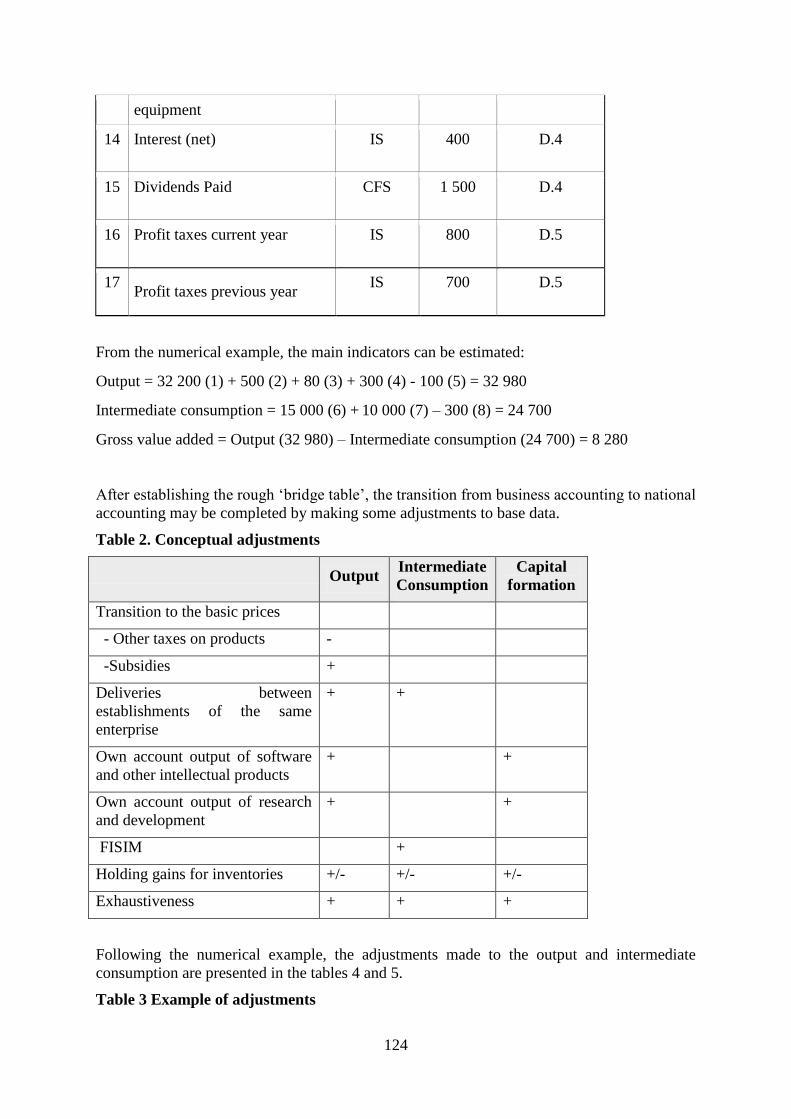
124
equipment
14
Interest (net)
IS
400
D.4
15
Dividends Paid
CFS
1 500
D.4
16
Profit taxes current year
IS
800
D.5
17
Profit taxes previous year
IS
700
D.5
From the numerical example, the main indicators can be estimated:
Output = 32 200 (1) + 500 (2) + 80 (3) + 300 (4) - 100 (5) = 32 980
Intermediate consumption = 15 000 (6) + 10 000 (7) – 300 (8) = 24 700
Gross value added = Output (32 980) – Intermediate consumption (24 700) = 8 280
After establishing the rough ‗bridge table‘, the transition from business accounting to national
accounting may be completed by making some adjustments to base data.
Table 2. Conceptual adjustments
Output
Intermediate
Consumption
Capital
formation
Transition to the basic prices
- Other taxes on products -
-Subsidies +
Deliveries between
establishments of the same
enterprise
+ +
Own account output of software
and other intellectual products
+ +
Own account output of research
and development
+ +
FISIM +
Holding gains for inventories +/- +/- +/-
Exhaustiveness + + +
Following the numerical example, the adjustments made to the output and intermediate
consumption are presented in the tables 4 and 5.
Table 3 Example of adjustments
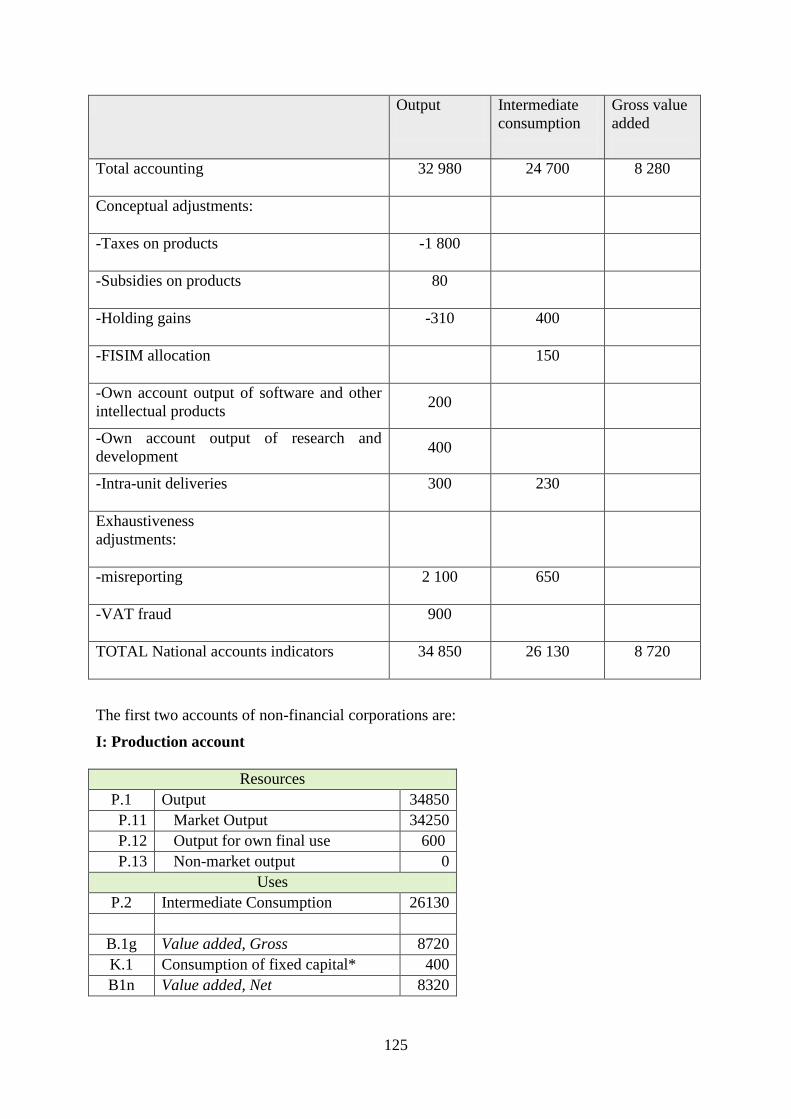
125
Output
Intermediate
consumption
Gross value
added
Total accounting
32 980
24 700
8 280
Conceptual adjustments:
-Taxes on products
-1 800
-Subsidies on products
80
-Holding gains
-310
400
-FISIM allocation
150
-Own account output of software and other
intellectual products 200
-Own account output of research and
development 400
-Intra-unit deliveries
300
230
Exhaustiveness
adjustments:
-misreporting
2 100
650
-VAT fraud
900
TOTAL National accounts indicators
34 850
26 130
8 720
The first two accounts of non-financial corporations are:
I: Production account
Resources
P.1 Output 34850
P.11 Market Output 34250
P.12 Output for own final use 600
P.13 Non-market output 0
Uses
P.2 Intermediate Consumption 26130
B.1g Value added, Gross 8720
K.1 Consumption of fixed capital* 400
B1n Value added, Net 8320
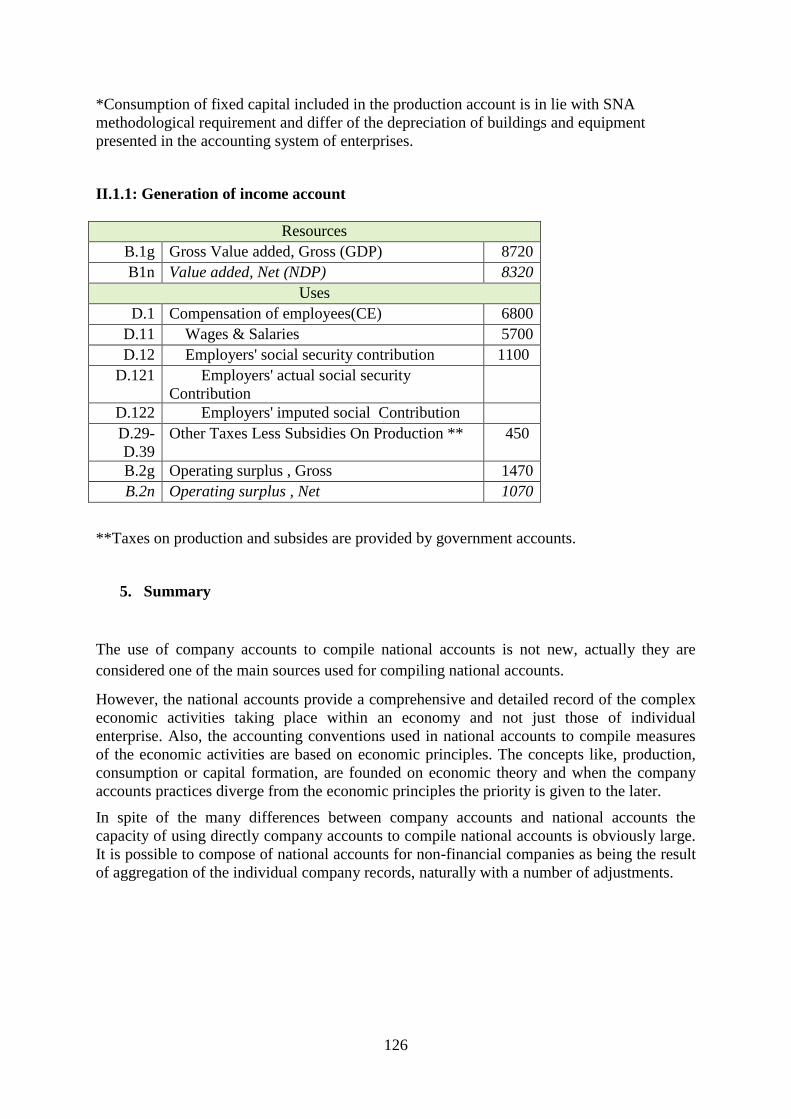
126
*Consumption of fixed capital included in the production account is in lie with SNA
methodological requirement and differ of the depreciation of buildings and equipment
presented in the accounting system of enterprises.
II.1.1: Generation of income account
Resources
B.1g Gross Value added, Gross (GDP) 8720
B1n Value added, Net (NDP) 8320
Uses
D.1 Compensation of employees(CE) 6800
D.11 Wages & Salaries 5700
D.12 Employers' social security contribution 1100
D.121 Employers' actual social security
Contribution
D.122 Employers' imputed social Contribution
D.29-
D.39
Other Taxes Less Subsidies On Production ** 450
B.2g Operating surplus , Gross 1470
B.2n Operating surplus , Net 1070
**Taxes on production and subsides are provided by government accounts.
5. Summary
The use of company accounts to compile national accounts is not new, actually they are
considered one of the main sources used for compiling national accounts.
However, the national accounts provide a comprehensive and detailed record of the complex
economic activities taking place within an economy and not just those of individual
enterprise. Also, the accounting conventions used in national accounts to compile measures
of the economic activities are based on economic principles. The concepts like, production,
consumption or capital formation, are founded on economic theory and when the company
accounts practices diverge from the economic principles the priority is given to the later.
In spite of the many differences between company accounts and national accounts the
capacity of using directly company accounts to compile national accounts is obviously large.
It is possible to compose of national accounts for non-financial companies as being the result
of aggregation of the individual company records, naturally with a number of adjustments.
127
Chapter 5 Use of external trade statistics for national accounts
This chapter describes the integration of external trade statistics in national accounts and
provides a correspondence between balance of payment and the rest of the world account.
The text for this chapter has mainly been sourced from the following documents:
4) The System of National Accounts 2008, European Commission, IMF, OECD, UN,
World Bank,2009
5) Balance of Payments and Investment Position, Sixth Edition, (BPM6) 2009,
International Monetary Fund;
6) International Merchandise Trade Statistics: Concepts and Definitions 2010, United
Nation
7) Essential SNA: Building the basics, European Commission, Eurostat ,2013
1. Introduction
A full implementation of the System of National Accounts 2008(2008 SNA) is based on
Information from the international accounts. The System of National Accounts measures the
activity within the domestic economy; in addition to it, the SNA records the exchanges
between the domestic economy and the rest of the world. The nonresident units engaged in
transactions with units resident in the domestic economy formed a distinct institutional sector
of the economy; the exchanges (flows) of all resident units with nonresident units (and claims
of one set of units on the other) are recorded in the Rest of the World (RoW) sector of
the2008 SNA.
International accounts are closely linked to the national accounts system; data on the balance
of payments (BoPs) are compiled first and subsequently incorporated in relevant external
account components of the SNA rest of the world account. This integration of the two
systems is made possible because the underlying accounting systems are identical though
different terminology and forms of presentation are sometimes used.
The main data source that describes the international transactions used for building accounts
for the rest of the world sector of SNA is the Balance of Payments .The 2008 SNA uses the
same macroeconomic framework as the ‗Balance of Payments and Investment Position
Manual‘ 6th edition (BPM6). Appendix 7 of BPM6 provides a summary account of the
complete concordance between the 2008 SNA and the BPM6 in respect to residence,
valuation, time of recording, conversion procedures, and coverage of flows and stocks.
Definition
The balance of payments is a statistical statement that summarizes transactions between
residents
and nonresidents during a period. It consists of the goods and services account, the primary
income account, the secondary income account, the capital account, and the financial
account.
128
Source: ―Balance of Payments and Investment Position Manual‖ 6th edition (BPM6), chapter
2 : Overview of the Framework.
2. Accounting principles and concepts
Economic territory
The economic territory represents the area under the effective economic control of a single
government. It includes the land area including islands, airspace, territorial waters and
territorial enclaves in the rest of the world (such as embassies, consulates, military bases,
scientific stations, information or immigration offices, that have immunity from the laws of
the host territory) physically located in other territories.
The economic territory includes also special zones as free trade zones and offshore financial
centres , which are under the control of the government even though different regulatory and
tax regimes may apply
The territory excludes international organizations and enclaves of other governments that are
physically located in the territory.
Economic territory has the dimensions of physical location as well as legal jurisdiction; so
that corporations created under the law of that jurisdiction are parts of that economy.
Residence
The accounts record transactions between residents and non-residents of a country. The
primary criterion for deciding whether a transaction belongs in the balance of payments is the
residency of the two actors involved in the transaction. The residency is different from
citizenship. As an example, transactions between two Tunisian citizens, one living in Tunis
and one abroad, are recorded in the balance of payments, but the transactions between a
Tunisian and a Moroccan citizen both residing in Tunis are not relevant for the balance of
payment.
Definition
The residence of each institutional unit is the economic territory with which it has the
strongest connection, expressed as its center of predominant economic interest.
Source: ―Balance of Payment and Investment Position Manual‖, 6th
edition, chapter 4:
Economic Territory, Units, Institutional Sectors and Residence.
An institutional unit is resident in an economic territory when there exists, within the
economic territory, some location, dwelling, place of production, or other premises on which
or from which the unit engages and intends to continue engaging, either indefinitely or over a
finite but long period of time, in economic activities and transactions on a significant scale.
The location need not be fixed so long as it remains within the economic territory. Each
institutional unit is a resident of one and only one economic territory determined by its center
129
of predominant economic interest. Specific criteria for determining residence are included in
the 2008 SNA (see chapter 4: Institutional units and sectors).
Institutional Units
The concept of an institutional unit is the same in the 2008 SNA and BPM6. Because of the
focus on the national economy, there are some special treatments of units in cross-border
situations. In some cases, legal entities are combined into a single institutional unit if they are
resident in the same economy, but are not combined if they are resident in different
economies. Similarly, a single legal entity may be split when it has substantial operations in
two or more economies. As a result of these treatments, the residence of the resulting units
concerned becomes more clear-cut and the concept of the economic territory is strengthened.
A legal entity that is resident in one jurisdiction is never combined with a legal entity resident
in another. As a result, special purpose entities (SPEs) and other similar corporate structures
owned by non-residents are considered to be resident of their territory of incorporation, even
though most or all of their owners and most or all of their assets are in another economy.
More information about institutional units is presented in chapter4:‖ Institutional units and
sectors‖ of the 2008 SNA.
Another institutional unit for interest is the notional resident unit. When land located in a
territory is owned by a non-resident entity, a notional unit that can be created and treated as
resident, being considered the owner of the land.
The notional resident unit treatment is also applied to associated buildings, structures and
other improvements on that land, leases of land for long periods, and ownership of natural
resources other than land. As a result of this treatment, the non-resident is owner of the
notional resident unit, rather than owning the land directly, so there is an equity liability to
the non-resident, but the land and other natural resources are always assets of the economy in
which they are located.
Ownership
The current account, which records transactions in goods and services, factor income flows
and transfers, is in principle compiled when ownership change takes place or service is
rendered. This payable/receivable guideline is in conformity with the other components of the
national accounts which are, in general, on an accrual rather than a cash payment basis.
There are no longer any exceptions to the recording basis of the change of economic
ownership. However, there is a different presentation in the case of merchanting. The
merchanting means that the owner buys and resells goods in the same condition without the
goods passing through the territory of the owner. The merchanting transactions are treated
as trade in goods. The acquisition of goods by the merchant in one country is shown under
goods as a negative export, while the sales are recorded as a positive export. The difference
between sales and purchases of goods under merchanting are recorded as net exports of goods
under merchanting in the country. If the goods are acquired in one period and not disposed
of until a subsequent period, they will appear in changes in inventories of the merchant even
though these inventories are held abroad.
Records
The accounts are constructed on the principle of double-entry book-keeping. Every
transaction involves a credit and debit entry. Credit entries carry a positive sign and cover the
export of real resources such as goods and services, investment income receipts, and transfers

130
received. In the capital account credit entries include the sale of assets to non-residents and
borrowings from non-residents. All credit entries represent inflows of funds. Debit entries,
which carry a negative sign, include imports of goods and services, investment income
payments and transfer payments; acquisitions of foreign assets and payments of liabilities are
debit entries and represent outflows of funds.
The main characteristic of vertical double-entry bookkeeping is that each transaction leads to
at least two corresponding entries, traditionally referred to as a credit entry and a debit entry,
in the books of the transactor. The international accounts for an economy are to be compiled
on a vertical double-entry bookkeeping basis from the perspective of the residents of that
economy. Because each transaction is either an exchange or a transfer, it requires two entries.
This principle ensures that the total of all credit entries and that of all debit entries for all
transactions are equal, thus permitting a check on consistency of accounts for a single unit.
Time of Recording of Flows
The time of recording could be determined on four bases: the accrual basis, the due-for
payment basis, the commitment basis, and the cash basis. The accrual basis is used in the
international accounts as well as in national accounts. Based on it, the flows are recorded at
the time when economic value is created, transformed, exchanged, transferred, or
extinguished. This means that flows that imply a change of economic ownership is recorded
when ownership passes and services are recorded when provided. In other words, the effects
of economic events are recorded in the period in which they occur, irrespective of whether
cash was received or paid or was due to be received or paid. When an economic event is
accompanied by a settlement at a later date, such as an import of goods with trade credit, the
time lag is bridged by recording each event separately, the corresponding entry at the time of
import being trade credit payable.
Valuation
The transactions in BoPs are valued at market prices. Market prices refer to current exchange
value, that is, the values at which goods and other assets, services, and labors are exchanged
or else could be exchanged for cash. They are also, the basis for valuation in the international
accounts.
Market prices for transactions are defined as amounts of money that willing buyers pay to
acquire something from willing sellers; the exchanges are made between independent parties
and on the basis of commercial considerations only—sometimes called ―at arm‘s length.‖
Thus, according to this strict definition, a market price refers only to the price for one specific
exchange under the stated conditions.
In the international accounts, the valuation of exports and imports of goods is a special case
where a uniform valuation point is used, namely the value at the customs frontier of the
exporting economy, means FOB-type valuation (free on board). This treatment brings about
consistent valuation between exporter and importer and provides for a consistent basis for
measurement in circumstances where the parties may have a wide range of different
contractual arrangements, from ―ex-works‖ at one extreme (where the importer is responsible
for arranging all transport and insurance) to ―delivered duty paid‖ at the other (where the
exporter is responsible for arranging all transport, insurance and any import duties). In
international transactions, there may be motivations for under- or over-invoicing in order to
evade taxes or exchange controls, so BPM6 provides guidance on how to develop market-
131
equivalent prices when these cases are identified, and how to make the necessary adjustments
needed to other items affected.
The 2008 SNA presents in chapter 14:‖The supply and use tables and goods and service
account‖ and chapter 28: ―Input-output and other matrix-based analysis” the main issues of
recording imports and exports.
3. Data and classifications
The main source of information for exports and imports of goods is the customs statistics
pertaining to the export and import of goods, with a very detailed breakdown by products.
However, these statistics are based on administrative registers, which usually records all
merchandise that crosses the border of a country, regardless of the type of transaction.
Therefore some adjustments may be necessary, e.g. for merchandise that crosses the border
without being imports (goods in transit, goods for embassies, military bases or other enclaves
within a country‘s borders, etc.), or for merchandise that does not cross the border but are
imports (e.g. goods purchased by a country's embassies, military bases or other enclaves in
other countries).
International standards for merchandise trade statistics can be found in the manual
International Merchandise Trade Statistics: Concepts and Definitions (IMTS) (United
Nations, 1998). IMTS uses a CIF-type (cost, insurance and freight) valuation for imports. It
should be noted that BPM6 uses a uniform FOB valuation for both exports and imports in the
BOP.
For exports and imports of goods there are a number of classifications relevant for national
accounts. The Standard International Trade Classification (SITC) has been in use since
196137
. It covers all goods that enter international trade. The classification structure consists
of five levels comprising 10 sections, 67 divisions, 261 groups, 1,033 subgroups, and 3,121
items at the five digit level. The SITC was last revised in 1986 with the release of SITC Rev.
3 and no further revisions are planned.
The Harmonized Commodity Description and Coding System (HS) or Harmonized System, as
it is commonly known, was introduced in 1988 by the World Customs Organization, as a
replacement for SITC. The HS is the system recommended by the United Nations Statistical
Commission for the compilation and dissemination of merchandise trade statistics and is now
widely used by most countries. The classification is revised frequently to take account of
changing conditions of international trade. In the HS, goods are classified primarily according
to the component material or the type of product, degree of processing, function, and
economic activity. Goods are classified under 21 main sections, which are further subdivided
into 97 chapters, 1,241 headings, and 5,113 subheadings. Descriptions are common across all
countries down to the six-digit level; however, for statistical or tariff purposes, countries are
allowed to include additional digits on a country specific basis.
The classification by Broad Economic Categories (BEC) classifies goods by economic
classes distinguishing food, industrial supplies, capital equipment, consumer durables, and
consumer non-durables. It was designed to convert goods classified by the SITC according to
the three broad end-use classes of consumption goods, intermediate goods, and capital goods
37
The information on classification for goods chiefly comes from Measuring Trade in Services, A training module produced
by WTO / OMC, November 2010
132
commonly used in compiling national accounts statistics. Like the SITC, the UN does not
expect to release additional updates of the BEC.
Data for exports and imports of services come from the BOP. In BPM6, the following 12
main service categories are identified and broken down into a list of standard and
supplementary components:
Manufacturing services on physical inputs owned by others
Maintenance and repair services not included elsewhere
Transport
Travel
Construction
Insurance and pension services
Financial services
Charges for the use of intellectual property not included elsewhere
Telecommunications, computer and information services
Other business services
Personal, cultural and recreational services
Government goods and services not included elsewhere
It should be noted that Travel is differs somewhat different from the other service categories.
Travel does not refer to a particular service and covers expenses for goods and services
(including accommodation, food, souvenirs, etc.) acquired by a person in the country visited.
The Extended Balance of Payments Services Classification (EBOPS, currently version 2010)
consists of a further breakdown of these BOP service components into more detailed sub-
items. Like the BPM6 services classification, EBOPS 2010 is primarily a product-based
classification.
4. The international accounts
International accounts cover accounts for current transactions (current accounts),
accumulation accounts and balance sheets. The three current accounts are the goods and
services account, the primary income account and the secondary income account. The
primary income account corresponds to the allocation of primary income accounts in the
SNA and the secondary income account corresponds to the secondary distribution of income
account in the SNA.
The current account records trade in goods and services, along with primary and secondary
income flows between residents and non-residents. The capital account includes acquisitions
and disposals of non-produced, non-financial assets, while the financial account records net
acquisitions of financial assets and net incurrence of liabilities. The transactions in the current
account and capital account are recorded in gross terms, while financial assets and liabilities
in the financial account are shown separately on a net basis.
(a) Current account
The current account measures the (i) flows of goods, services,(ii) primary income and
(iii)secondary income between residents and non-residents.
133
Goods and services account
The goods and services account records external transactions in goods and services. The goal
of this account is the point at which goods and services are exchanged between a resident and
a nonresident. Goods are physical, produced items over which ownership rights can be
established and whose economic ownership can be passed from one institutional unit to
another by engaging in transactions ( see BoPM6, chapter 10). They may be used to satisfy
the needs or wants of households or the community or used to produce other goods or
services.
Goods are shown in the account, separately from services. Services are the result of a
production activity that changes the conditions of the consuming units, or facilitates the
exchange of products or financial assets (see BoPM6, chapter 10). Services are not generally
separate items over which ownership rights can be established and cannot generally be
separated from their production.
International merchandise trade statistics (IMTS) are the main data source for general
merchandise in the goods and services account. The international standards for merchandise
trade data are set out in United Nations International merchandise trade statistics: Concepts
and Definitions (2010) closely linked to the BoPsM6. In practice, the data used as sources for
general merchandise include customs data, international transactions reporting systems, other
administrative data (including value-added tax systems), surveys of traders, or combinations.
Adjustments to source data may be needed to accounts for coverage, timing, valuation, and
classification that do not meet balance of payments guidelines. One adjustment is that the
standards for IMTS use a CIF-type (cost, insurance and freight) valuation for imports, while
the balance of payments use a uniform FOB valuation for both exports and imports. Another
adjustment is made for coverage and refers to the change of ownership principle in the BoPs
statistical system. Following this principle, goods sent abroad for processing without a
change of ownership are not covered in the goods account. On the other hand, for goods sold
under merchanting, although the goods involved have never been entered into the economy
where the owner resides in, they are recorded in the goods account of the owner‘s economy
given that there has been a change of ownership of the goods. While the goods sent abroad
for processing without a change of ownership are not covered in the goods account of an
economy, the manufacturing services performed on these goods by a processor in another
processing economy are covered in its services account. Other services cover a wide range of
economic activities, including transport, travel, insurance and pension, financial services, etc.
Primary income account
The primary income account shows the amounts receivable and payable abroad in return for
providing / obtaining use of labour, financial resources or natural resources to / from non-
residents. The concepts and definitions of primary income under the current account of the
BoPs are the same as those used in national accounts for the external primary income flows
under Gross National Income (GNI) in the system of national accounts. In the SNA, primary
distribution of income is recorded in two accounts, namely, the generation of income account
(which records primary income generated in the production process) and the allocation of
primary income account (which records primary income allocated to institutional units for the
provision of labor, financial assets, and natural resources). In the international accounts, all
primary income flows relate to the allocation of primary income account.
Primary income represents the return that accrues to institutional units for their contribution
to the production process or for the provision of financial assets and renting natural resources
to other institutional units. There are distinguished two types of primary income:
134
- Income associated with the production process: (i)compensation of employees, which
represents the income for the contribution of labor inputs to the production process;
(ii) taxes and subsidies on products and production, which are related to production,
too;
- Income associated with the ownership of financial and other non-produced assets as:
(i) property income which is the return for providing financial assets and renting
natural resources;(ii) investment income, the return for providing financial assets,
which consists of dividends and withdrawals from income of quasi corporations,
reinvested earnings, and interest.
The international accounts distinguish the following types of primary income:
- compensation of employees;
- dividends;
- reinvested earnings;
- interest;
- investment income attributable to policyholders in insurance, standardized
guarantees, and pension funds;
- rent;
- taxes and subsidies on products and production.
Secondary income account
The secondary income account records current transfers between residents and non-residents.
Current transfers are transactions in which real or financial resources that are likely to be
consumed immediately or shortly are provided without the receipt of equivalent economic
values in return. Examples include workers‘ remittances, donations, official assistance and
pensions. Current transfers are unilateral in nature and are offsetting entries in the BoPs
account for one-sided transactions. Credit entries in this account reflect offsetting entries to
the receipt of aforesaid real and financial resources from other economies. Conversely, debit
entries recorded are offsets to the provision of such real and financial resources to other
economies. Secondary income, together with primary income, affects gross national
disposable income which has a direct and immediate effect on an economy's pattern of
consumption in a specified period.
(b) Capital and financial account
The capital account measures external transactions in capital transfers, and the acquisition
and disposal of non-produced, non-financial assets (such as trademarks and brand names).
The capital account in the international accounts shows (i) capital transfers receivable and
payable between residents and nonresidents and (ii) the acquisition and disposal of non-
produced, non-financial assets between residents and nonresidents. Examples of capital
transfers include forgiveness of debts by creditors, and cash transfers involving the
acquisition or disposal of fixed assets.
The balance on the capital account shows the total credits less debits for capital transfers and
non-produced, non-financial assets. In addition, the sum of the current and capital account
135
balances can also be shown as a balancing item. The balancing item is labeled as net lending
(+)/net borrowing (–) from the capital and current accounts. That sum is also conceptually
equal to net lending (+)/net borrowing (-) from the financial account.
The current and capital accounts show nonfinancial transactions, with the balance requiring
net lending or net borrowing, while the financial account shows how net lending or
borrowing is allocated or financed.
The financial account records transactions in financial assets and liabilities between residents
and non-residents. It shows how an economy's external transactions are financed.
Transactions in the financial account are classified by function (i.e. the purpose of the
investment) into direct investment, portfolio investment, financial derivatives, and other
investment and reserve assets.
The capital account net balance is in principle equal but opposite in sign to the surplus or
deficit on current account and in the minds of many users is associated with the financing of
the exchange of goods and services. However, the account also reflects financial activity only
remotely connected with production and the current account. There may be considerable
capital movement for investment and speculative purposes. These may show up as offsetting
flows including foreign exchange reserve movements.
5. Relationship of the rest of the world account to the international accounts
International accounts are closely linked to the SNA, reinforced by the fact that data on the
balance of payments are compiled first and subsequently incorporated in relevant external
account components of the SNA rest of the world account. There is complete concordance
between the SNA and BPM6 with respect to the delineation of resident units, valuation, time
of recording, conversion procedures, and coverage of goods, services, income, capital
transfers, and foreign financial assets and liabilities.
A major difference exists in the presentation of the transactions: the international accounts
use functional categories as the primary level of classification for investment income and the
financial account, whereas the SNA uses instruments and sectors. The functional categories
are not applicable to domestic relationships. However, the instrument and institutional sector
detail in the international accounts allows the data to be converted or compared with SNA
data.
The resources in the 2008 SNA represent the credits of the balance of payments, and uses,
the debits. The SNA rest of the world accounts are presented from the point of view of the
nonresident units, whereas the balance of payments presents the same transactions from the
point of view of resident units. As an example, imports of an economy are shown as
resources in the SNA, that is, an outflow from the rest of the world and an inflow or use for
the resident units. Thus the BPM6 entries are the mirror image of the SNA entries.
In the BPM6, there is a balancing item for each account showing the excess of credits over
debits (or a net balance of the financial account) and the cumulative value of balancing items
is presented. The national accounts, only the cumulative balance is shown because the 2008
SNA records the balancing item on the use side of the previous account as the first entry on
the resource side of the subsequent account.
The balance of payments emphasizes the distinction between goods and services; goods are
presented at an aggregated level while services are covered in detail. The classification of
services in the 2008 SNA is strictly consistent with the Central Product Classification (CPC);
136
in BPM6, it differs from the CPC for a few products, i.e., travel, construction, and
government goods and services n.i.e., which are transactor-based (relating to the
provider/acquirer rather than product itself). The external balance on goods and services for
the rest of the world, which is part of the goods and services account, is mirrored by the
balance on goods and services in the international accounts.
The primary income account entries in the balance of payments largely represent the
compensation of employees and property income, as in the allocation of primary income
account of SNA. Other elements of the primary income account are the payments of taxes on
production payable by a resident to another government and subsidy receivable by a resident
from another government. Property income in the 2008 SNA is equal to investment income
in the balance of payments plus rent. Rent rarely arises in cross-border situations because all
land is deemed to be owned by residents, if necessary by creating a notional resident unit.
Example where rent may be recorded in the international accounts may be short-term fishing
rights in territorial waters provided to foreign fishing fleets.
Investment income in relation to cross-border transactions reflects the return to the financial
capital invested abroad and vice versa. Interest flows are measured on exactly the same basis
in both the BPM6 and the 2008 SNA. With effect from the BPM6, interest is adjusted for the
implicit service charge (known as Financial Intermediation Service Indirect Measurement-
FISIM) levied by deposit-taking corporations and treated by them as part of interest. FISIM is
treated as an import/export of financial services.
The reconciliation between investment income in the international accounts and in the 2008
SNA, is made using subcomponents below the level of the functional categories of
investment income. An example is the value for interest payments to and from the rest of the
world.
The balance on primary income, the balancing item of the primary income account in the
balance of payments, shows how Gross Domestic Product (GDP) is converted to the Gross
National Income (GNI) by payments of primary income to and from abroad. The cumulative
balancing item for this sequence of the international accounts is the balance on goods,
services, and primary income.
The entries in the secondary income account of the balance of payments are mainly current
transfers and correspond exactly to those in the secondary distribution of income account in
the 2008 SNA. For the balance of payments, current international cooperation and personal
transfers (remittances) sent by households in one economy to households in another economy
are particularly important. Insurance flows related to reinsurance can be of significant
importance internationally. The balance of payments records these flows in the same way as
the 2008 SNA, both as regards the separation of a financial service charge and the treatment
of direct insurance and reinsurance flows separately and not on a consolidated basis The
balance of payments also includes in the secondary income account an item known as the
adjustment for the change in pension entitlements. This appears in the use of income account
in the 2008 SNA, but this account does not exist in the BoPs.
The balancing item recorded at this point for the international accounts is the balance on
secondary income. The cumulative balance is the current account balance. The 2008 SNA
records disposable income as the cumulative balancing item on the secondary distribution
account. There is then another SNA account, the use of income account, for which there is no
corresponding account in the international accounts. The cumulative balancing item on the
use of income account is saving for the domestic economy and the current external balance
137
for the rest of the world. This item corresponds exactly to the current account balance from
the international accounts.
The elements of the capital account subject to international transactions contain fewer items
than those covered in the SNA. There are no transactions recording capital formation of
produced assets because the international accounts are not concerned with the final use of
products imported/exported. There are entries to cover acquisitions and disposals of non-
produced nonfinancial assets and capital transfers, although these are infrequent and for many
countries may not appear. The account also records capital transfers receivable by and
payable by the domestic economy, leading to a capital account balance.
6. Rest of the world account
The SNA includes the sectors accounts for all resident institutional units. Their relations with
the non-resident units are presented in the rest of the world account.
Definition
The rest of the world consists of all non-resident institutional units that enter into transactions
with resident units, or have other economic links with resident units.
Source: The 2008 SNA, European Commission, IMF, OECD, UN, World Bank, 2009,
Chapter 4: Institutional units and sectors, point 4.172.
The rest of the world is not a sector for which complete sets of accounts are kept. The
resident institutional units are grouped in more homogeneous categories concerning their
economic behavior, objectives and functions. This is not the case for the rest of the world
sector: for this sector, there are recorded the transactions and other flows of non-financial and
financial corporations, non-profit institutions, households and general government with non-
resident institutional units and other economic relationships between residents and non-
residents, e.g. claims by residents on non-residents. The rest of the world includes certain
institutional units that may be physically located within the geographic boundary of a
country; for example, foreign enclaves such as embassies, consulates or military bases, and
also international organizations
The accounts for the rest of the world include only transactions carried out between resident
institutional units and non-resident units, subject to the following exceptions:
- the services of transport (up to the border of the exporting country) provided by resident
units in respect of imported goods are shown in the rest of the world accounts with FOB
imports, even though they are produced by resident units;
- transactions in foreign assets between residents belonging to different sectors in the
domestic economy are shown in the detailed financial accounts for the rest of the world.
These transactions do not affect the country's financial position vis-à-vis the rest of the world;
they affect the financial relationships of individual sectors with the rest of the world;
- transactions in the country's liabilities between non-residents belonging to different
geographical zones are shown in the geographical breakdown of the rest of the world
accounts. Although these transactions do not affect the country's overall liability to the rest of
the world, they affect its liabilities to different parts of the world.
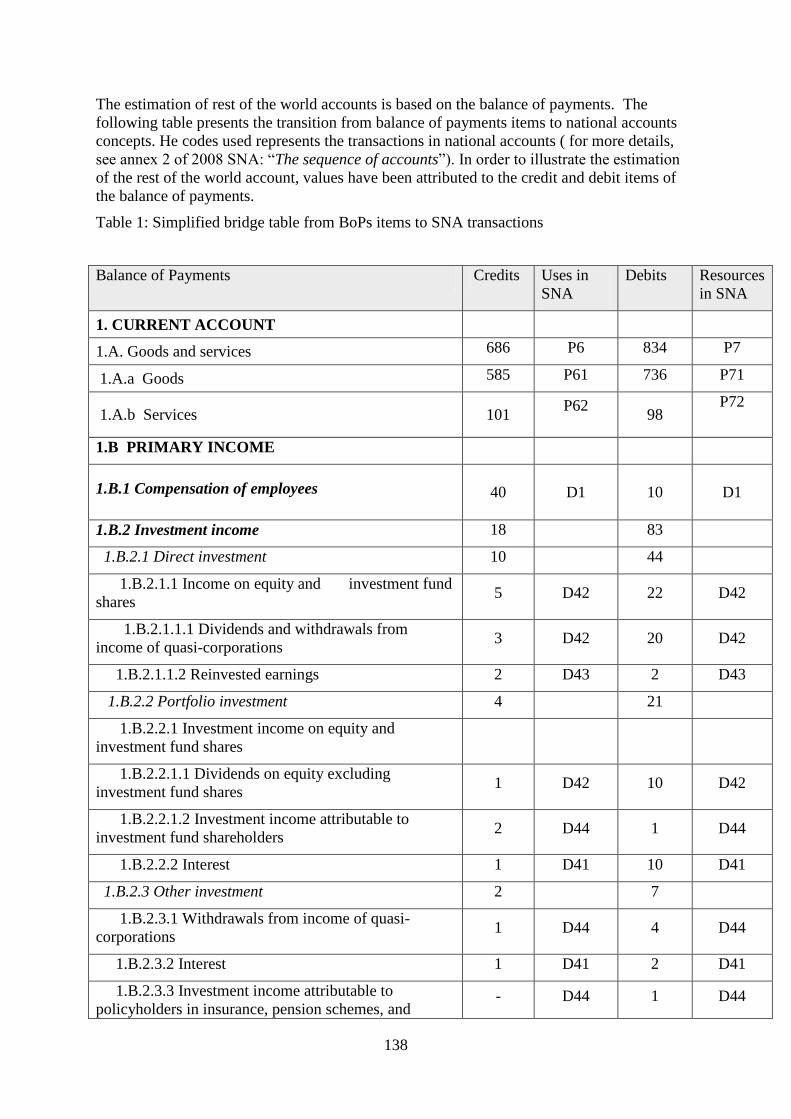
138
The estimation of rest of the world accounts is based on the balance of payments. The
following table presents the transition from balance of payments items to national accounts
concepts. He codes used represents the transactions in national accounts ( for more details,
see annex 2 of 2008 SNA: ―The sequence of accounts‖). In order to illustrate the estimation
of the rest of the world account, values have been attributed to the credit and debit items of
the balance of payments.
Table 1: Simplified bridge table from BoPs items to SNA transactions
Balance of Payments Credits Uses in
SNA
Debits Resources
in SNA
1. CURRENT ACCOUNT
1.A. Goods and services 686 P6 834 P7
1.A.a Goods 585 P61 736 P71
1.A.b Services 101 P62
98
P72
1.B PRIMARY INCOME
1.B.1 Compensation of employees 40
D1
10 D1
1.B.2 Investment income 18 83
1.B.2.1 Direct investment 10 44
1.B.2.1.1 Income on equity and investment fund
shares 5 D42 22 D42
1.B.2.1.1.1 Dividends and withdrawals from
income of quasi-corporations 3 D42 20 D42
1.B.2.1.1.2 Reinvested earnings 2 D43 2 D43
1.B.2.2 Portfolio investment 4 21
1.B.2.2.1 Investment income on equity and
investment fund shares
1.B.2.2.1.1 Dividends on equity excluding
investment fund shares 1 D42 10 D42
1.B.2.2.1.2 Investment income attributable to
investment fund shareholders 2 D44 1 D44
1.B.2.2.2 Interest 1 D41 10 D41
1.B.2.3 Other investment 2 7
1.B.2.3.1 Withdrawals from income of quasi-
corporations 1 D44 4 D44
1.B.2.3.2 Interest 1 D41 2 D41
1.B.2.3.3 Investment income attributable to
policyholders in insurance, pension schemes, and - D44 1 D44
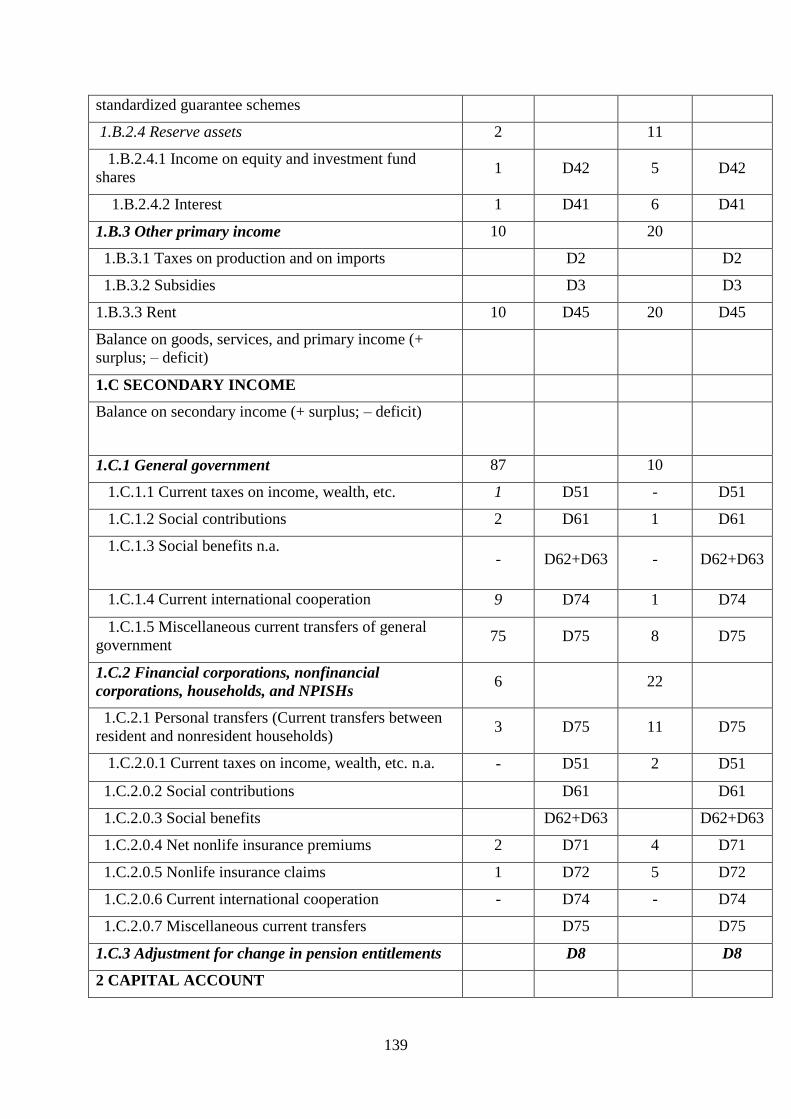
139
standardized guarantee schemes
1.B.2.4 Reserve assets 2 11
1.B.2.4.1 Income on equity and investment fund
shares 1 D42 5 D42
1.B.2.4.2 Interest 1 D41 6 D41
1.B.3 Other primary income 10 20
1.B.3.1 Taxes on production and on imports D2 D2
1.B.3.2 Subsidies D3 D3
1.B.3.3 Rent 10 D45 20 D45
Balance on goods, services, and primary income (+
surplus; – deficit)
1.C SECONDARY INCOME
Balance on secondary income (+ surplus; – deficit)
1.C.1 General government 87 10
1.C.1.1 Current taxes on income, wealth, etc. 1 D51 - D51
1.C.1.2 Social contributions 2 D61 1 D61
1.C.1.3 Social benefits n.a.
- D62+D63 - D62+D63
1.C.1.4 Current international cooperation 9 D74 1 D74
1.C.1.5 Miscellaneous current transfers of general
government 75 D75 8 D75
1.C.2 Financial corporations, nonfinancial
corporations, households, and NPISHs 6 22
1.C.2.1 Personal transfers (Current transfers between
resident and nonresident households) 3 D75 11 D75
1.C.2.0.1 Current taxes on income, wealth, etc. n.a. - D51 2 D51
1.C.2.0.2 Social contributions D61 D61
1.C.2.0.3 Social benefits D62+D63 D62+D63
1.C.2.0.4 Net nonlife insurance premiums 2 D71 4 D71
1.C.2.0.5 Nonlife insurance claims 1 D72 5 D72
1.C.2.0.6 Current international cooperation - D74 - D74
1.C.2.0.7 Miscellaneous current transfers D75 D75
1.C.3 Adjustment for change in pension entitlements D8 D8
2 CAPITAL ACCOUNT
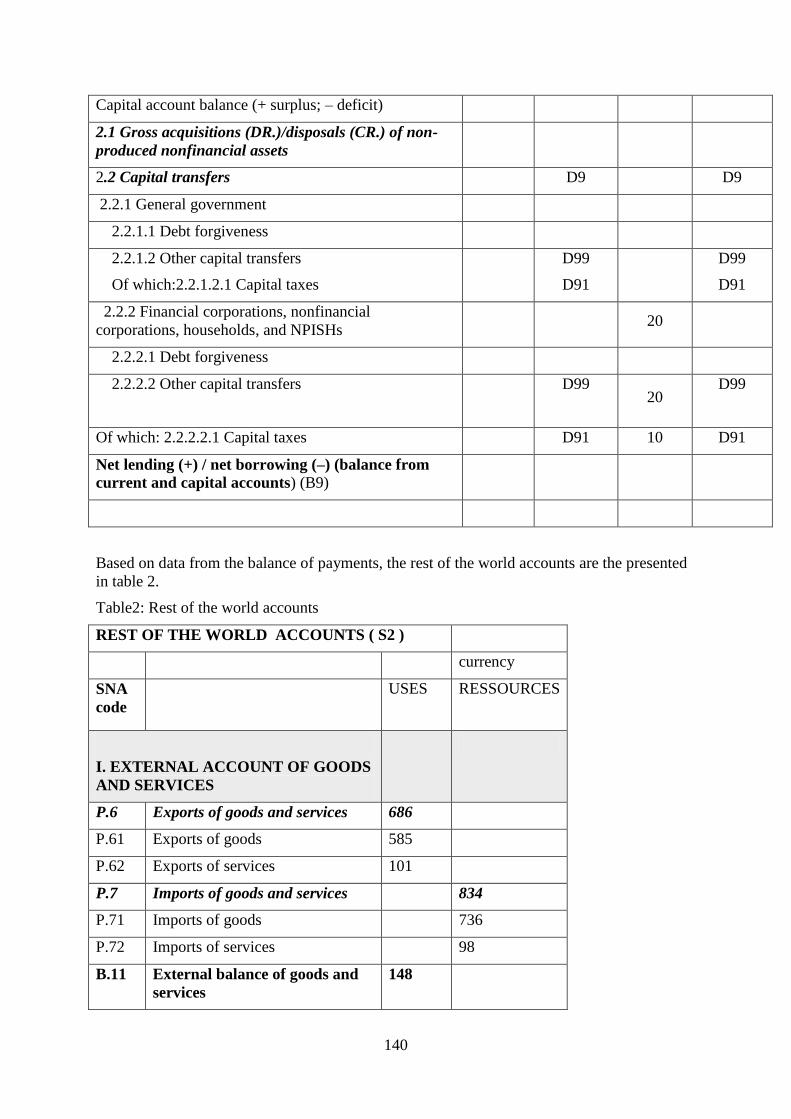
140
Capital account balance (+ surplus; – deficit)
2.1 Gross acquisitions (DR.)/disposals (CR.) of non-
produced nonfinancial assets
2.2 Capital transfers D9 D9
2.2.1 General government
2.2.1.1 Debt forgiveness
2.2.1.2 Other capital transfers
Of which:2.2.1.2.1 Capital taxes
D99
D91
D99
D91
2.2.2 Financial corporations, nonfinancial
corporations, households, and NPISHs 20
2.2.2.1 Debt forgiveness
2.2.2.2 Other capital transfers
D99
20
D99
Of which: 2.2.2.2.1 Capital taxes D91 10 D91
Net lending (+) / net borrowing (–) (balance from
current and capital accounts) (B9)
Based on data from the balance of payments, the rest of the world accounts are the presented
in table 2.
Table2: Rest of the world accounts
REST OF THE WORLD ACCOUNTS ( S2 )
currency
SNA
code
USES RESSOURCES
I. EXTERNAL ACCOUNT OF GOODS
AND SERVICES
P.6 Exports of goods and services 686
P.61 Exports of goods 585
P.62 Exports of services 101
P.7 Imports of goods and services 834
P.71 Imports of goods 736
P.72 Imports of services 98
B.11 External balance of goods and
services
148
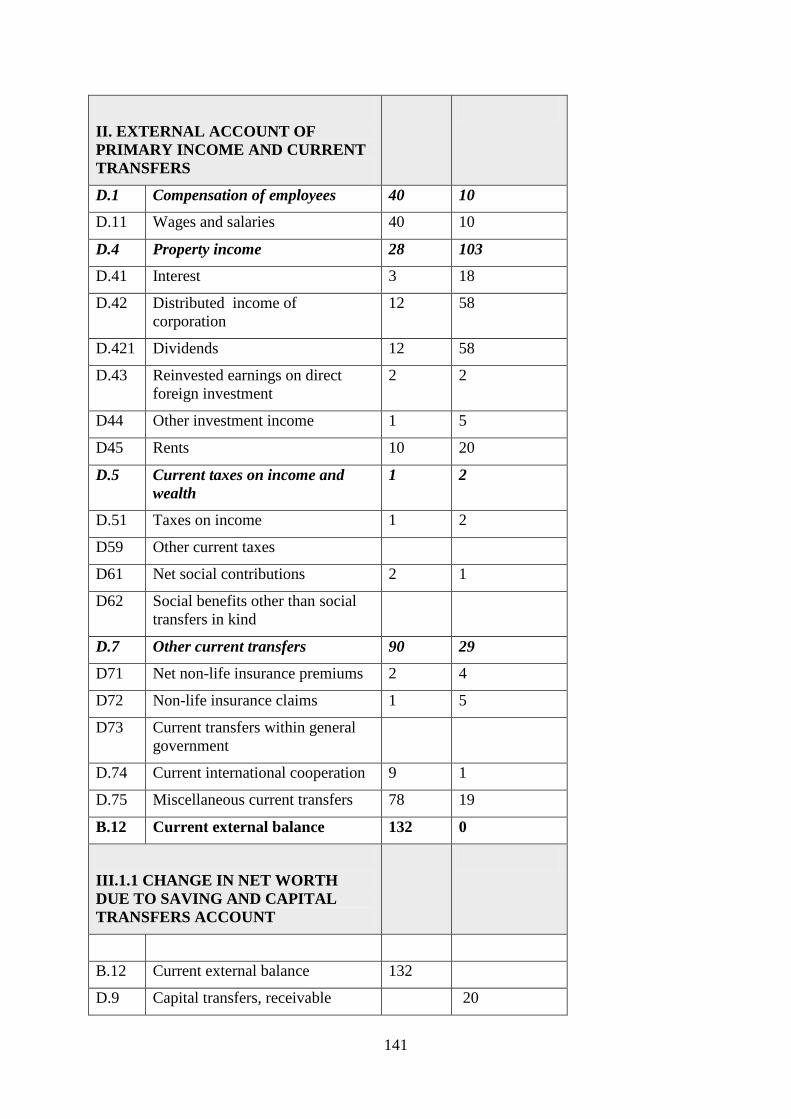
141
II. EXTERNAL ACCOUNT OF
PRIMARY INCOME AND CURRENT
TRANSFERS
D.1 Compensation of employees 40 10
D.11 Wages and salaries 40 10
D.4 Property income 28 103
D.41 Interest 3 18
D.42 Distributed income of
corporation
12 58
D.421 Dividends 12 58
D.43 Reinvested earnings on direct
foreign investment
2 2
D44 Other investment income 1 5
D45 Rents 10 20
D.5 Current taxes on income and
wealth
1 2
D.51 Taxes on income 1 2
D59 Other current taxes
D61 Net social contributions 2 1
D62 Social benefits other than social
transfers in kind
D.7 Other current transfers 90 29
D71 Net non-life insurance premiums 2 4
D72 Non-life insurance claims 1 5
D73 Current transfers within general
government
D.74 Current international cooperation 9 1
D.75 Miscellaneous current transfers 78 19
B.12 Current external balance 132 0
III.1.1 CHANGE IN NET WORTH
DUE TO SAVING AND CAPITAL
TRANSFERS ACCOUNT
B.12 Current external balance 132
D.9 Capital transfers, receivable 20
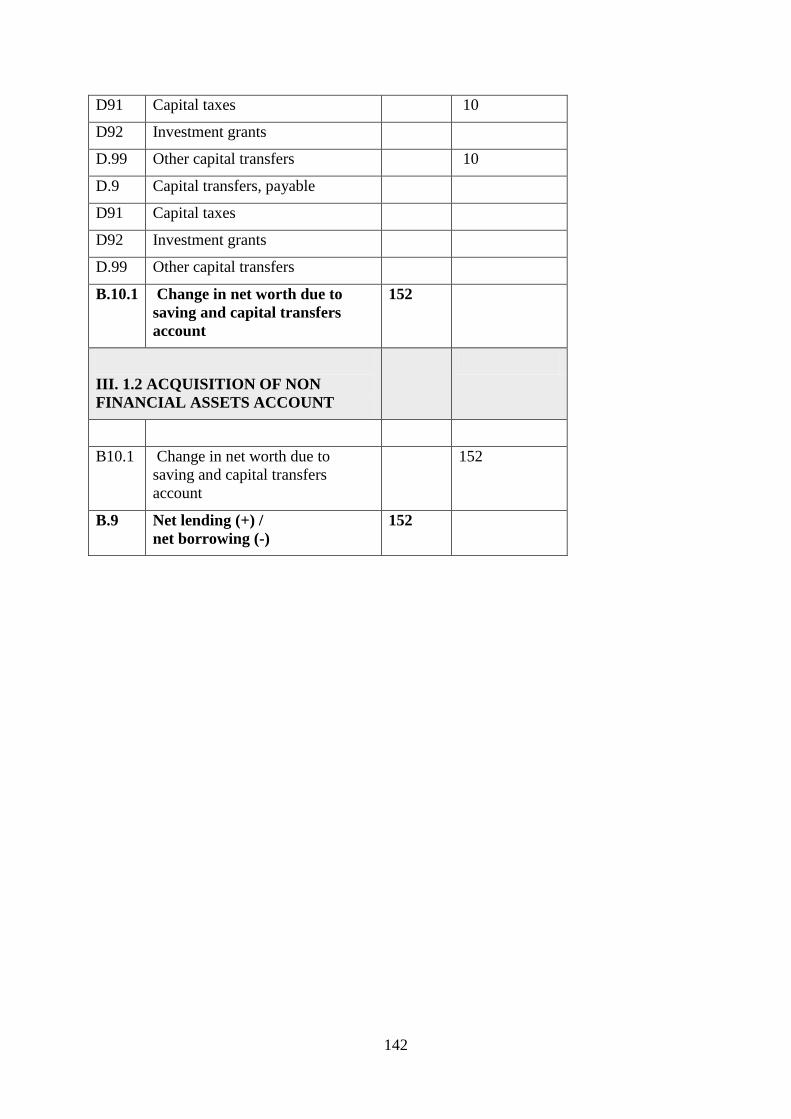
142
D91 Capital taxes 10
D92 Investment grants
D.99 Other capital transfers 10
D.9 Capital transfers, payable
D91 Capital taxes
D92 Investment grants
D.99 Other capital transfers
B.10.1 Change in net worth due to
saving and capital transfers
account
152
III. 1.2 ACQUISITION OF NON
FINANCIAL ASSETS ACCOUNT
B10.1 Change in net worth due to
saving and capital transfers
account
152
B.9 Net lending (+) /
net borrowing (-)
152
143
Chapter 6: Use of Tax data in National Accounts (Case Study: Zimbabwe)
1. Introduction
The production account is compiled for fourteen industries according to the International
Standard Industrial Classification (ISIC Revision 3) adopted by the Zimbabwean economy.
Under normal circumstances main sources of data are economic censuses carried out yearly
for agriculture, manufacturing, mining and quarrying, construction, and, water and electricity;
annual surveys for services industries (used to determine cost structures); central and local
government accounts; sales taxes; and employment statistics on numbers of employees and
earnings as well as annual reports of public enterprises.
Of late, due to inadequate funding for statistics, major economic surveys were carried only
until 2005. Due to this and many other challenges that were being experienced in the
economy, alternative methods based on using some proxy indicators have been adopted to
compile national accounts.
2.0 The Calculation of Gross Domestic Product 2000- 2005
2.1 Derivation of a weighted exchange rate
For 2005 the amount of goods imported using the official exchange rates and imported using
parallel market exchange rate were used as weights for deriving unitary exchange rate. This
rate was used to convert the 2005 current price GDP in the Zimbabwean Dollar terms to GDP
in US dollar terms for that year.
2.2 Calculation of Gross Domestic Product
The detailed formula is described below:
A weighted exchange rate was found using the following formula: 0.4* Official
exchange rate + 0.6 * parallel exchange rate. The formula is adopted following the
assumption that 40% of the transactions were done on the formal market and 60%
were done on the parallel market.
2005 was used as a benchmark, so the weighted exchange rate for the year was used
to divide the nominal GDP for the same year to come up with the GDP in US dollars.
144
To project backwards the following formula was used: USDGDPyto *
GDPkytoZIMGDPkytZIM
$1$
,
Where y stands for the year, and k stands for constant.
This was done for all the years backwards
For the years after 2005, the following formula was used:
USDGDPyto *GDPkytoZIM
nGDPkytiZIM$
$
This method assumes that the movement in the GDP deflator is the same as those in the
unitary exchange rate. This in turn implies that the GDP deflation for the GDP in US dollar is
one each year i.e. there is no GDP inflation in US dollars.
If the movements in CPI were equal to the movement to the GDP deflator then all the
movements will be the same as movements in unitary exchange rates
If such a scenario arises where CPI movement is the same as movement of the GDP deflator
and movement in unitary exchange rates, then there is no inflation in US dollar terms
3.0 Compilation GDP for 2009
3.1 Value added Tax Method
Value Added tax (VAT) is a fraction deductible from value addition. In Zimbabwe VAT
constitute 15% of the taxable industries‘ value addition. The total VAT collected for 2009 is
equal to $370, 443,408.65. Therefore the total value addition for the industries is
$370, 443,408.65*15
100= 2,469,622,720
This figure was allocated proportionally to the contribution of each industry to VAT
Non-taxable industries estimates were derived from recent surveys and production accounts
as given in the account overleaf:
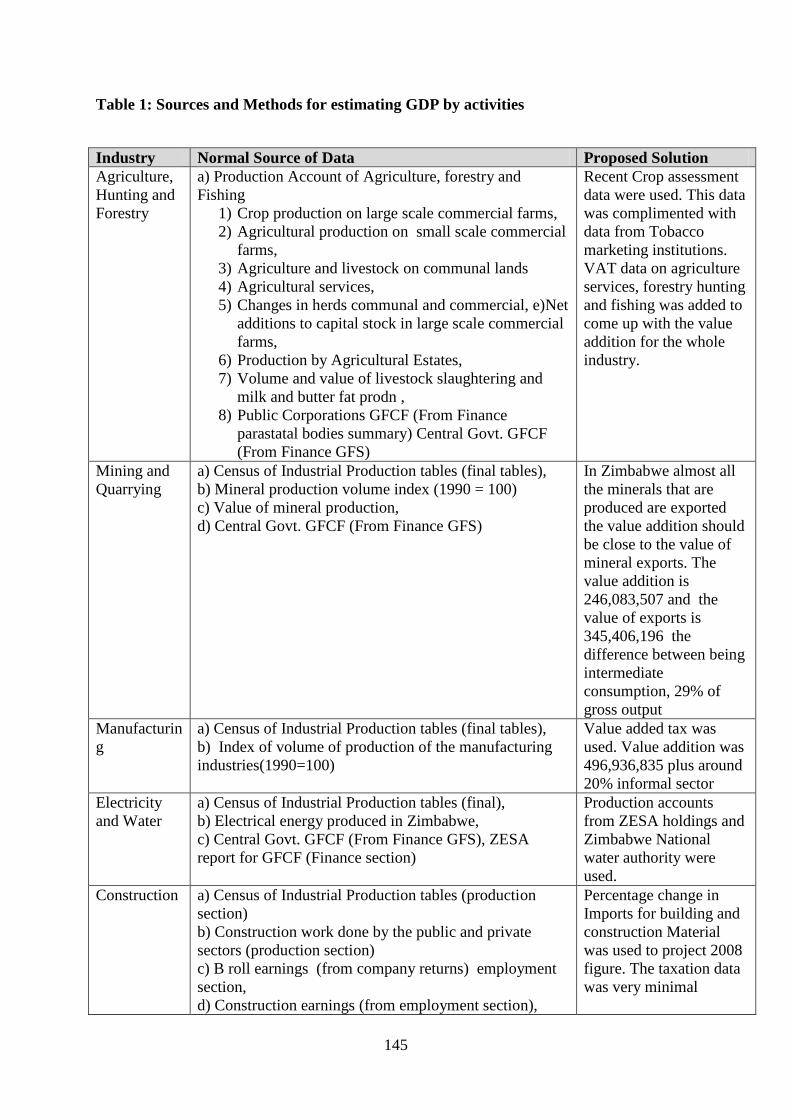
145
Table 1: Sources and Methods for estimating GDP by activities
Industry Normal Source of Data Proposed Solution
Agriculture,
Hunting and
Forestry
a) Production Account of Agriculture, forestry and
Fishing
1) Crop production on large scale commercial farms,
2) Agricultural production on small scale commercial
farms,
3) Agriculture and livestock on communal lands
4) Agricultural services,
5) Changes in herds communal and commercial, e)Net
additions to capital stock in large scale commercial
farms,
6) Production by Agricultural Estates,
7) Volume and value of livestock slaughtering and
milk and butter fat prodn ,
8) Public Corporations GFCF (From Finance
parastatal bodies summary) Central Govt. GFCF
(From Finance GFS)
Recent Crop assessment
data were used. This data
was complimented with
data from Tobacco
marketing institutions.
VAT data on agriculture
services, forestry hunting
and fishing was added to
come up with the value
addition for the whole
industry.
Mining and
Quarrying
a) Census of Industrial Production tables (final tables),
b) Mineral production volume index (1990 = 100)
c) Value of mineral production,
d) Central Govt. GFCF (From Finance GFS)
In Zimbabwe almost all
the minerals that are
produced are exported
the value addition should
be close to the value of
mineral exports. The
value addition is
246,083,507 and the
value of exports is
345,406,196 the
difference between being
intermediate
consumption, 29% of
gross output
Manufacturin
g
a) Census of Industrial Production tables (final tables),
b) Index of volume of production of the manufacturing
industries(1990=100)
Value added tax was
used. Value addition was
496,936,835 plus around
20% informal sector
Electricity
and Water
a) Census of Industrial Production tables (final),
b) Electrical energy produced in Zimbabwe,
c) Central Govt. GFCF (From Finance GFS), ZESA
report for GFCF (Finance section)
Production accounts
from ZESA holdings and
Zimbabwe National
water authority were
used.
Construction
a) Census of Industrial Production tables (production
section)
b) Construction work done by the public and private
sectors (production section)
c) B roll earnings (from company returns) employment
section,
d) Construction earnings (from employment section),
Percentage change in
Imports for building and
construction Material
was used to project 2008
figure. The taxation data
was very minimal
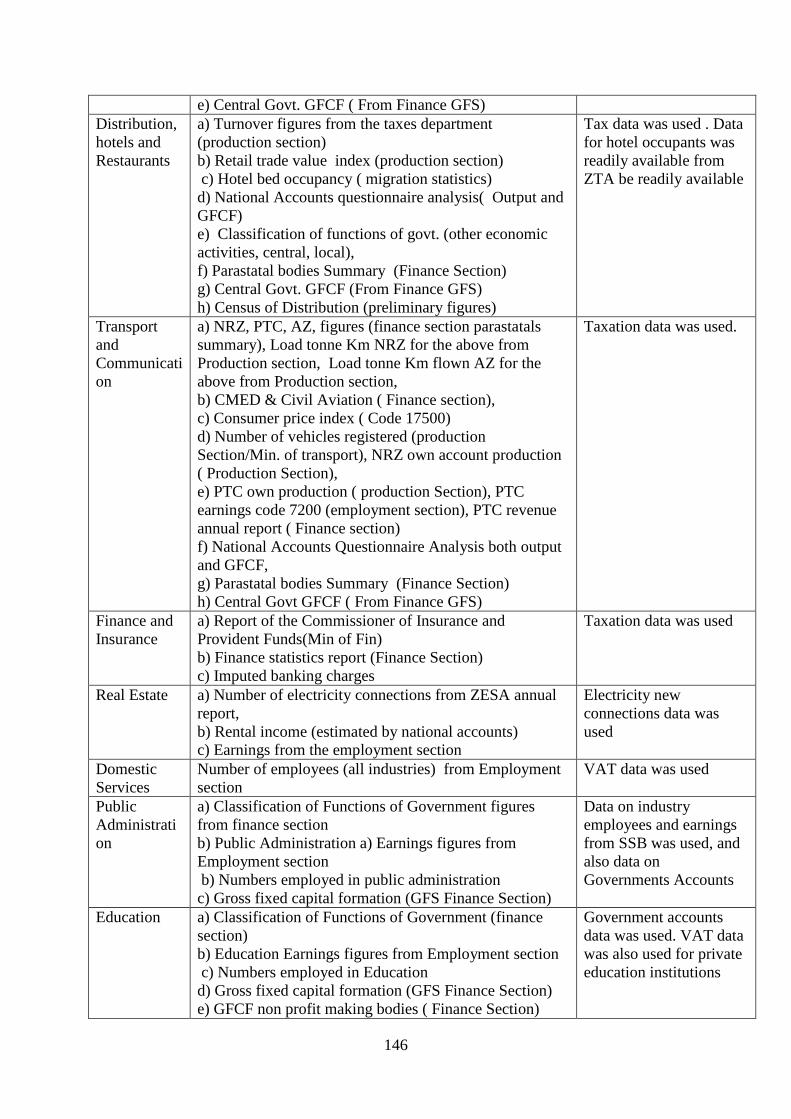
146
e) Central Govt. GFCF ( From Finance GFS)
Distribution,
hotels and
Restaurants
a) Turnover figures from the taxes department
(production section)
b) Retail trade value index (production section)
c) Hotel bed occupancy ( migration statistics)
d) National Accounts questionnaire analysis( Output and
GFCF)
e) Classification of functions of govt. (other economic
activities, central, local),
f) Parastatal bodies Summary (Finance Section)
g) Central Govt. GFCF (From Finance GFS)
h) Census of Distribution (preliminary figures)
Tax data was used . Data
for hotel occupants was
readily available from
ZTA be readily available
Transport
and
Communicati
on
a) NRZ, PTC, AZ, figures (finance section parastatals
summary), Load tonne Km NRZ for the above from
Production section, Load tonne Km flown AZ for the
above from Production section,
b) CMED & Civil Aviation ( Finance section),
c) Consumer price index ( Code 17500)
d) Number of vehicles registered (production
Section/Min. of transport), NRZ own account production
( Production Section),
e) PTC own production ( production Section), PTC
earnings code 7200 (employment section), PTC revenue
annual report ( Finance section)
f) National Accounts Questionnaire Analysis both output
and GFCF,
g) Parastatal bodies Summary (Finance Section)
h) Central Govt GFCF ( From Finance GFS)
Taxation data was used.
Finance and
Insurance
a) Report of the Commissioner of Insurance and
Provident Funds(Min of Fin)
b) Finance statistics report (Finance Section)
c) Imputed banking charges
Taxation data was used
Real Estate
a) Number of electricity connections from ZESA annual
report,
b) Rental income (estimated by national accounts)
c) Earnings from the employment section
Electricity new
connections data was
used
Domestic
Services
Number of employees (all industries) from Employment
section
VAT data was used
Public
Administrati
on
a) Classification of Functions of Government figures
from finance section
b) Public Administration a) Earnings figures from
Employment section
b) Numbers employed in public administration
c) Gross fixed capital formation (GFS Finance Section)
Data on industry
employees and earnings
from SSB was used, and
also data on
Governments Accounts
Education
a) Classification of Functions of Government (finance
section)
b) Education Earnings figures from Employment section
c) Numbers employed in Education
d) Gross fixed capital formation (GFS Finance Section)
e) GFCF non profit making bodies ( Finance Section)
Government accounts
data was used. VAT data
was also used for private
education institutions
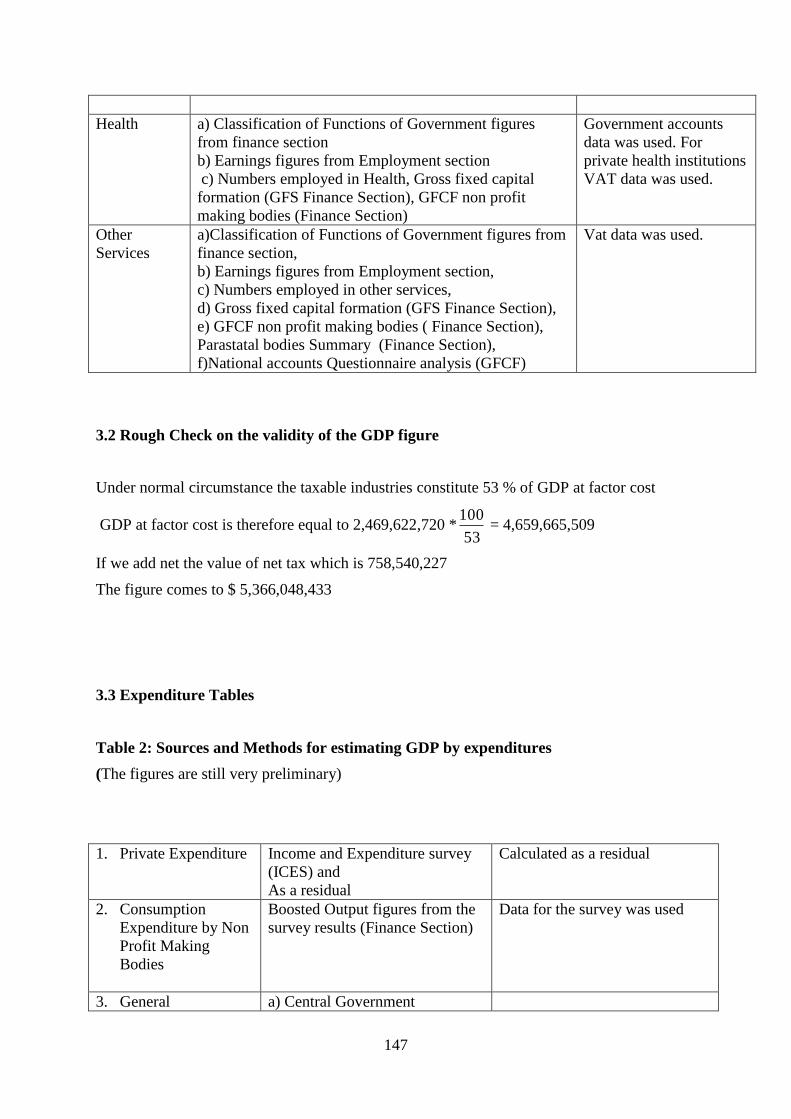
147
Health
a) Classification of Functions of Government figures
from finance section
b) Earnings figures from Employment section
c) Numbers employed in Health, Gross fixed capital
formation (GFS Finance Section), GFCF non profit
making bodies (Finance Section)
Government accounts
data was used. For
private health institutions
VAT data was used.
Other
Services
a)Classification of Functions of Government figures from
finance section,
b) Earnings figures from Employment section,
c) Numbers employed in other services,
d) Gross fixed capital formation (GFS Finance Section),
e) GFCF non profit making bodies ( Finance Section),
Parastatal bodies Summary (Finance Section),
f)National accounts Questionnaire analysis (GFCF)
Vat data was used.
3.2 Rough Check on the validity of the GDP figure
Under normal circumstance the taxable industries constitute 53 % of GDP at factor cost
GDP at factor cost is therefore equal to 2,469,622,720 *53
100 = 4,659,665,509
If we add net the value of net tax which is 758,540,227
The figure comes to $ 5,366,048,433
3.3 Expenditure Tables
Table 2: Sources and Methods for estimating GDP by expenditures
(The figures are still very preliminary)
1. Private Expenditure Income and Expenditure survey
(ICES) and
As a residual
Calculated as a residual
2. Consumption
Expenditure by Non
Profit Making
Bodies
Boosted Output figures from the
survey results (Finance Section)
Data for the survey was used
3. General a) Central Government
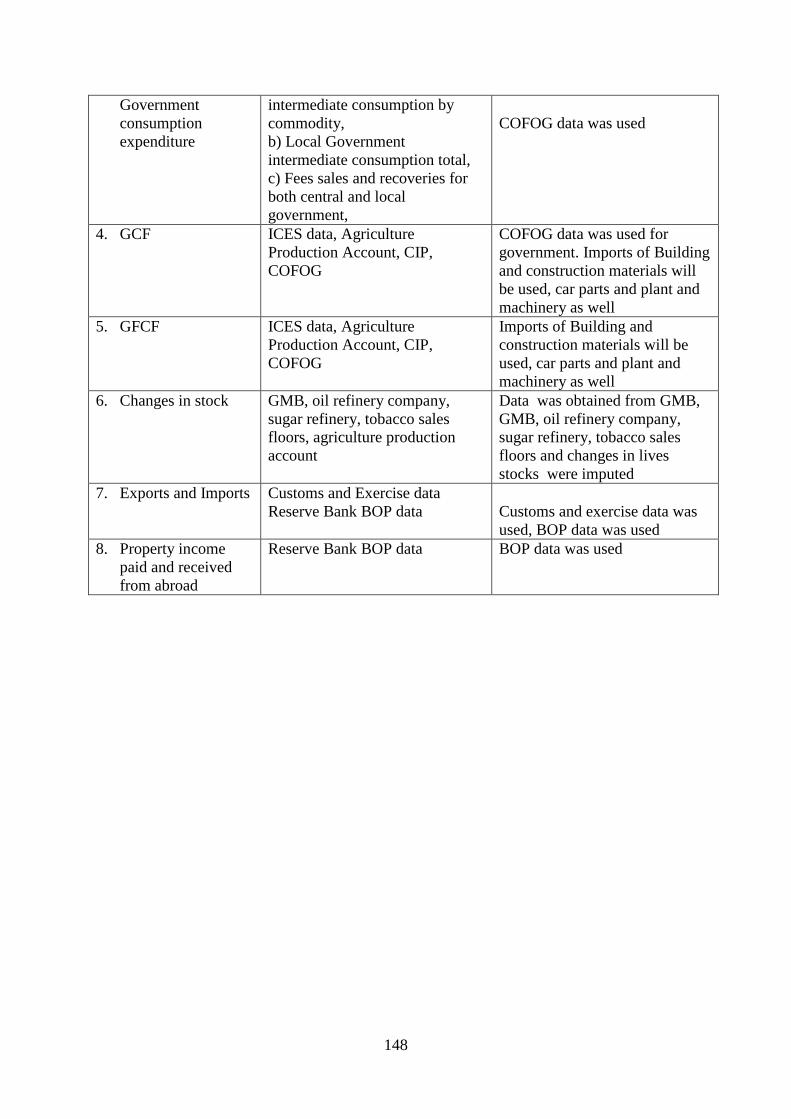
148
Government
consumption
expenditure
intermediate consumption by
commodity,
b) Local Government
intermediate consumption total,
c) Fees sales and recoveries for
both central and local
government,
COFOG data was used
4. GCF ICES data, Agriculture
Production Account, CIP,
COFOG
COFOG data was used for
government. Imports of Building
and construction materials will
be used, car parts and plant and
machinery as well
5. GFCF ICES data, Agriculture
Production Account, CIP,
COFOG
Imports of Building and
construction materials will be
used, car parts and plant and
machinery as well
6. Changes in stock GMB, oil refinery company,
sugar refinery, tobacco sales
floors, agriculture production
account
Data was obtained from GMB,
GMB, oil refinery company,
sugar refinery, tobacco sales
floors and changes in lives
stocks were imputed
7. Exports and Imports Customs and Exercise data
Reserve Bank BOP data
Customs and exercise data was
used, BOP data was used
8. Property income
paid and received
from abroad
Reserve Bank BOP data BOP data was used
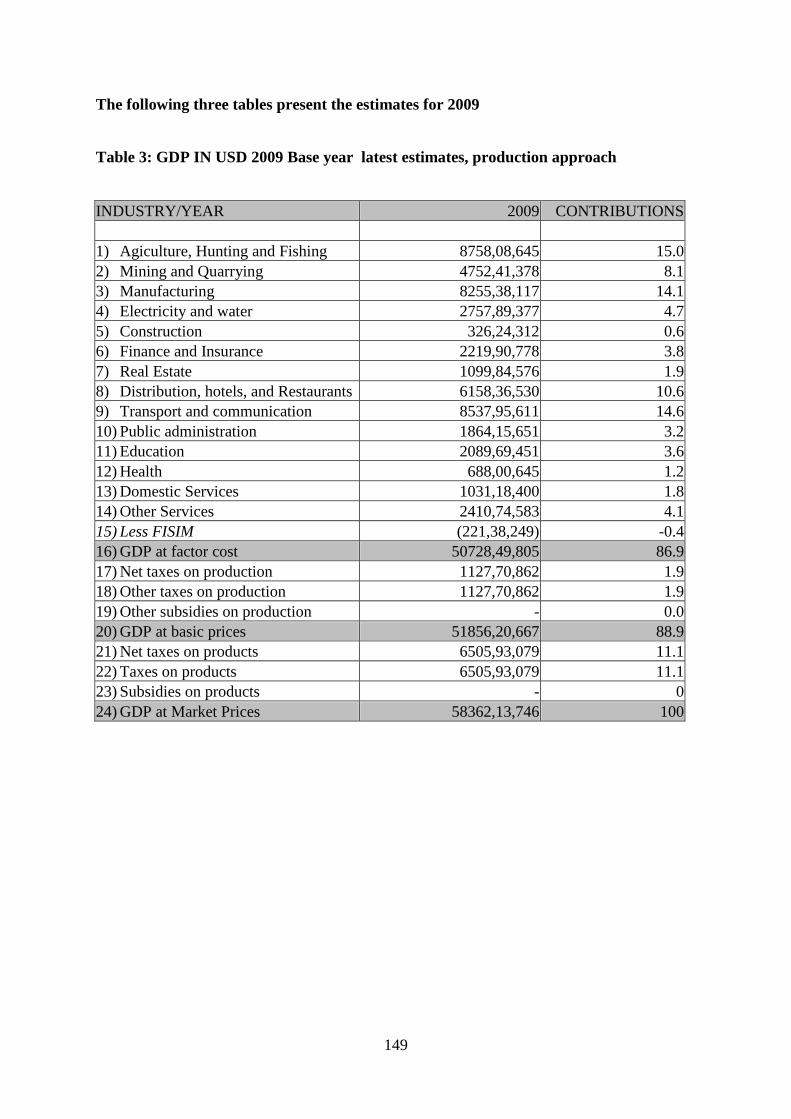
149
The following three tables present the estimates for 2009
Table 3: GDP IN USD 2009 Base year latest estimates, production approach
INDUSTRY/YEAR 2009 CONTRIBUTIONS
1) Agiculture, Hunting and Fishing 8758,08,645 15.0
2) Mining and Quarrying 4752,41,378 8.1
3) Manufacturing 8255,38,117 14.1
4) Electricity and water 2757,89,377 4.7
5) Construction 326,24,312 0.6
6) Finance and Insurance 2219,90,778 3.8
7) Real Estate 1099,84,576 1.9
8) Distribution, hotels, and Restaurants 6158,36,530 10.6
9) Transport and communication 8537,95,611 14.6
10) Public administration 1864,15,651 3.2
11) Education 2089,69,451 3.6
12) Health 688,00,645 1.2
13) Domestic Services 1031,18,400 1.8
14) Other Services 2410,74,583 4.1
15) Less FISIM (221,38,249) -0.4
16) GDP at factor cost 50728,49,805 86.9
17) Net taxes on production 1127,70,862 1.9
18) Other taxes on production 1127,70,862 1.9
19) Other subsidies on production - 0.0
20) GDP at basic prices 51856,20,667 88.9
21) Net taxes on products 6505,93,079 11.1
22) Taxes on products 6505,93,079 11.1
23) Subsidies on products - 0
24) GDP at Market Prices 58362,13,746 100
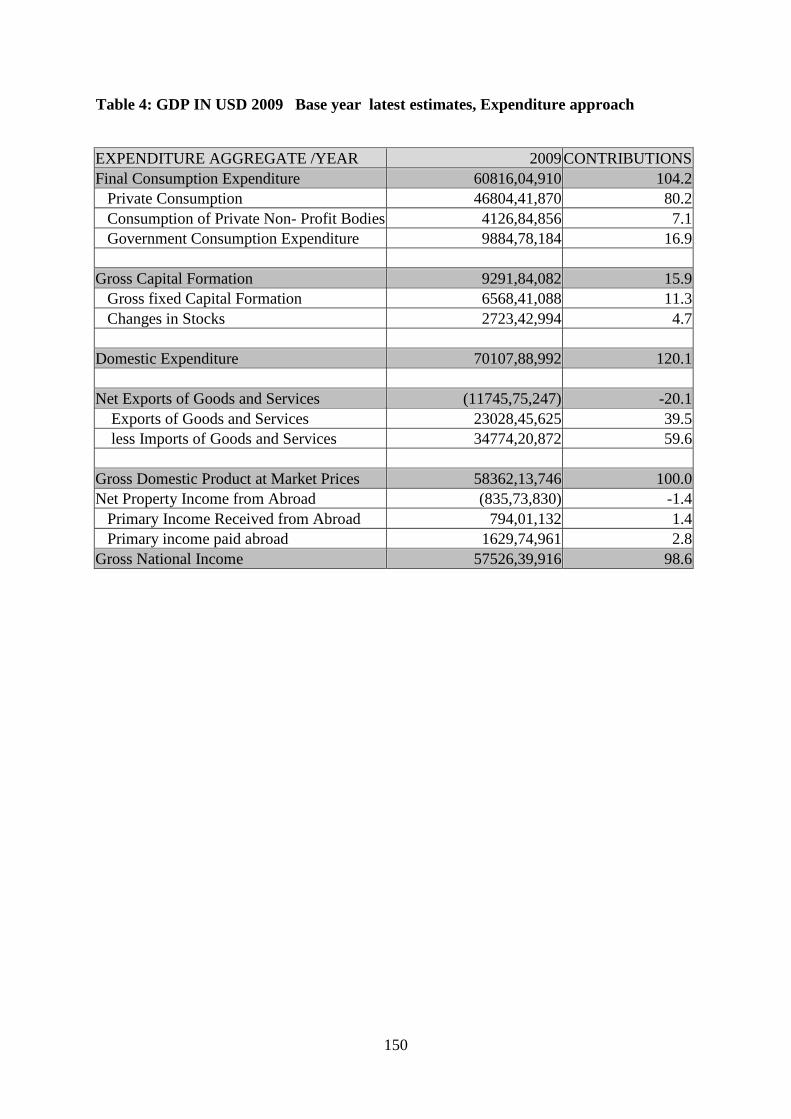
150
Table 4: GDP IN USD 2009 Base year latest estimates, Expenditure approach
EXPENDITURE AGGREGATE /YEAR 2009 CONTRIBUTIONS
Final Consumption Expenditure 60816,04,910 104.2
Private Consumption 46804,41,870 80.2
Consumption of Private Non- Profit Bodies 4126,84,856 7.1
Government Consumption Expenditure 9884,78,184 16.9
Gross Capital Formation 9291,84,082 15.9
Gross fixed Capital Formation 6568,41,088 11.3
Changes in Stocks 2723,42,994 4.7
Domestic Expenditure 70107,88,992 120.1
Net Exports of Goods and Services (11745,75,247) -20.1
Exports of Goods and Services 23028,45,625 39.5
less Imports of Goods and Services 34774,20,872 59.6
Gross Domestic Product at Market Prices 58362,13,746 100.0
Net Property Income from Abroad (835,73,830) -1.4
Primary Income Received from Abroad 794,01,132 1.4
Primary income paid abroad 1629,74,961 2.8
Gross National Income 57526,39,916 98.6
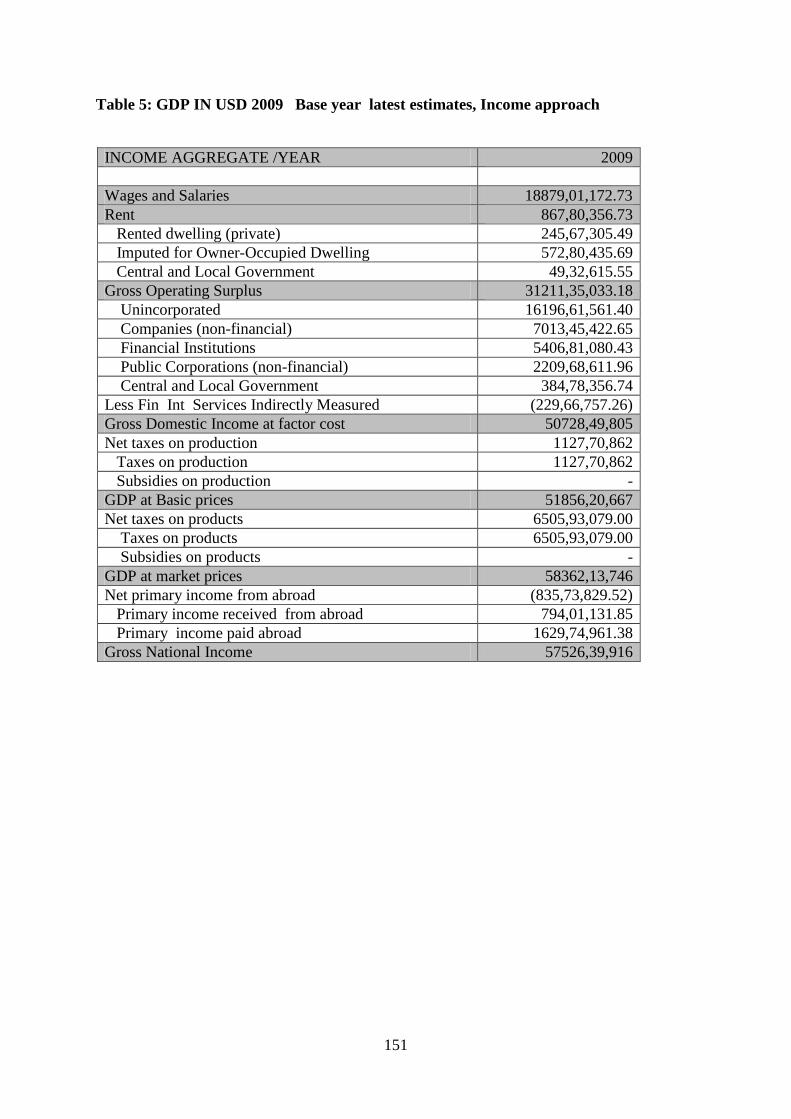
151
Table 5: GDP IN USD 2009 Base year latest estimates, Income approach
INCOME AGGREGATE /YEAR 2009
Wages and Salaries 18879,01,172.73
Rent 867,80,356.73
Rented dwelling (private) 245,67,305.49
Imputed for Owner-Occupied Dwelling 572,80,435.69
Central and Local Government 49,32,615.55
Gross Operating Surplus 31211,35,033.18
Unincorporated 16196,61,561.40
Companies (non-financial) 7013,45,422.65
Financial Institutions 5406,81,080.43
Public Corporations (non-financial) 2209,68,611.96
Central and Local Government 384,78,356.74
Less Fin Int Services Indirectly Measured (229,66,757.26)
Gross Domestic Income at factor cost 50728,49,805
Net taxes on production 1127,70,862
Taxes on production 1127,70,862
Subsidies on production -
GDP at Basic prices 51856,20,667
Net taxes on products 6505,93,079.00
Taxes on products 6505,93,079.00
Subsidies on products -
GDP at market prices 58362,13,746
Net primary income from abroad (835,73,829.52)
Primary income received from abroad 794,01,131.85
Primary income paid abroad 1629,74,961.38
Gross National Income 57526,39,916
152
4.0 Calculation of CPI in United States Dollars
4.1 Introduction
The Central Statistical Office of Zimbabwe produces a consumer price index (CPI) and the
month on month and year on year rates of inflation for the whole country once every month.
The CPI is based on price observations from across the country covering both urban and rural
outlets and weights obtained from the latest Income Consumption and Expenditure Survey
(ICES).
As the economic situation characterized by hyperinflation deteriorated in 2007 and 2008
many products became scarce or unavailable in the country. The number of observations per
month of the prices of the products used for computing the CPI similarly decreased. Under
normal circumstances on average, close to 1500 observations of prices of all products were
made every month. However, less than 500 observations per month were being made in the
last half of 2008.
The period was also characterized by an increase in the number of domestic transactions that
were conducted in foreign currency. This began unofficially, as parallel or black market
activities, then there was a mixture of both official (some shops were licensed to sell in
foreign currency) and unofficial domestic transactions in foreign currency, until early in 2009
all transactions were permitted to be conducted in foreign currency.
It thus became necessary to construct a CPI of transactions in foreign currency. Although the
office had begun observing prices both in foreign and local currency from the middle of
2008, there were very few recorded observations of prices in foreign currency until December
2008 when a total of 283 observations were recorded.
This paper describes how the challenges of constructing a new foreign currency based CPI,
without conducting an ICES and faced with having to start with a few products that were
available and accommodating an increasing number of products as they reappeared in the
market, were handled. The techniques employed were similar to those used when the number
of products available in the market was decreasing.
The normal method of calculating the CPI and rates of inflation in Zimbabwe
(i) Index
Every month prices of about 385 products are observed from outlets across the country in
both rural and urban areas. The work is organized by province and for each province a
geometric mean price for each item is calculated every month. The mean price is calculated
for those items for which there are matching observations of prices, outlet by outlet in the
current and previous month. A geometric mean price ratio of current to previous month prices
is also calculated for each item, each province. National weighted mean prices and weighted
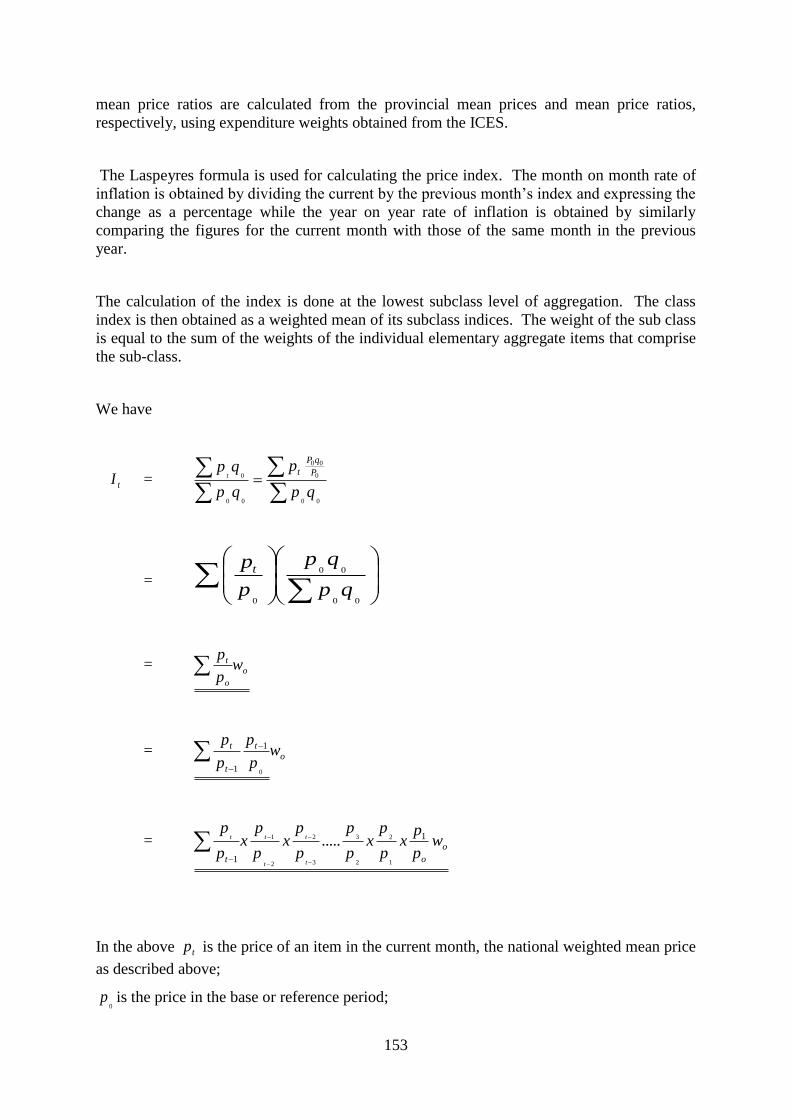
153
mean price ratios are calculated from the provincial mean prices and mean price ratios,
respectively, using expenditure weights obtained from the ICES.
The Laspeyres formula is used for calculating the price index. The month on month rate of
inflation is obtained by dividing the current by the previous month‘s index and expressing the
change as a percentage while the year on year rate of inflation is obtained by similarly
comparing the figures for the current month with those of the same month in the previous
year.
The calculation of the index is done at the lowest subclass level of aggregation. The class
index is then obtained as a weighted mean of its subclass indices. The weight of the sub class
is equal to the sum of the weights of the individual elementary aggregate items that comprise
the sub-class.
We have
tI =
00
0
00
00
0
qp
p
qp
qp P
qP
tt
=
00
00
0qp
qp
p
pt
= o
o
t wp
p
= ot
t
t wp
p
p
p
0
1
1
= o
ot
wp
px
p
px
p
p
p
px
p
px
p
p
t
t
t
tt 1
1 1
2
2
3
3
2
2
1 .....
In the above tp is the price of an item in the current month, the national weighted mean price
as described above;
0p is the price in the base or reference period;
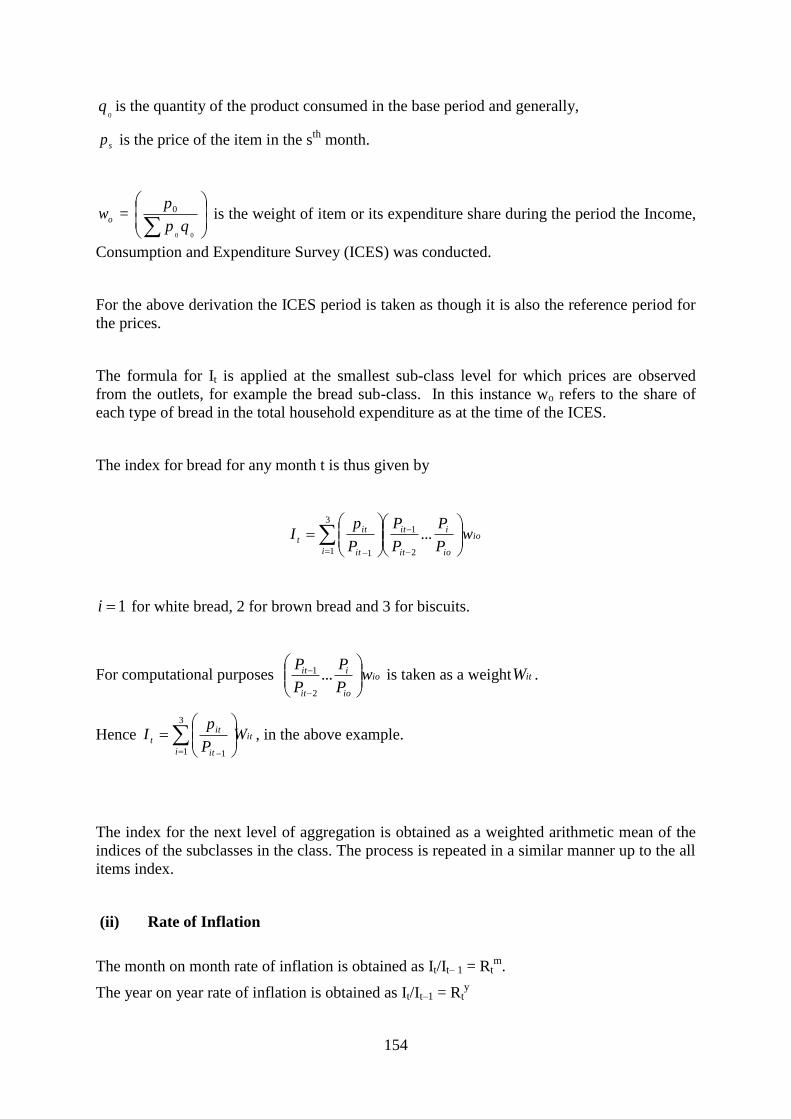
154
0q is the quantity of the product consumed in the base period and generally,
sp is the price of the item in the sth
month.
ow =
00
0
qp
p is the weight of item or its expenditure share during the period the Income,
Consumption and Expenditure Survey (ICES) was conducted.
For the above derivation the ICES period is taken as though it is also the reference period for
the prices.
The formula for It is applied at the smallest sub-class level for which prices are observed
from the outlets, for example the bread sub-class. In this instance wo refers to the share of
each type of bread in the total household expenditure as at the time of the ICES.
The index for bread for any month t is thus given by
io
io
i
it
it
i it
it
t wP
P
P
P
P
pI
...2
13
1 1
1i for white bread, 2 for brown bread and 3 for biscuits.
For computational purposes io
io
i
it
it wP
P
P
P
...2
1 is taken as a weight itW .
Hence it
i it
it
t WP
pI
3
1 1
, in the above example.
The index for the next level of aggregation is obtained as a weighted arithmetic mean of the
indices of the subclasses in the class. The process is repeated in a similar manner up to the all
items index.
(ii) Rate of Inflation
The month on month rate of inflation is obtained as It/It– 1 = Rtm
.
The year on year rate of inflation is obtained as It/It–1 = Rty
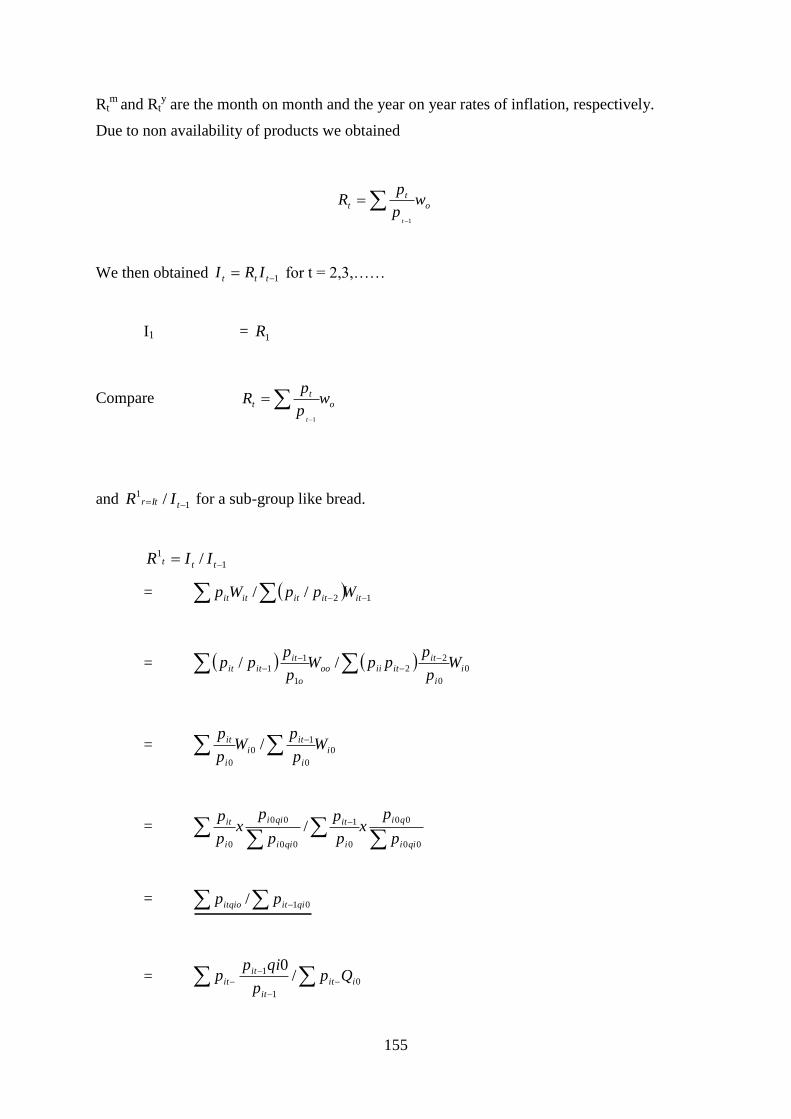
155
Rtm
and Rty are the month on month and the year on year rates of inflation, respectively.
Due to non availability of products we obtained
o
t
t wp
pR
t
1
We then obtained 1 ttt IRI for t = 2,3,……
I1 = 1R
Compare o
t
t wp
pR
t
1
and 1
1 / tItr IR for a sub-group like bread.
1
1 / ttt IIR
= 12// ititititit WppWp
= 0
0
2
2
1
1
1 // i
i
it
itiioo
o
it
itit Wp
pppW
p
ppp
= 0
0
1
0
0
/ i
i
it
i
i
it Wp
pW
p
p
=
00
00
0
1
00
00
0
/qii
qi
i
it
qii
qii
i
it
p
px
p
p
p
px
p
p
= 01/ qiititqio pp
= 0
1
1 /0
iit
it
it
it Qpp
qipp
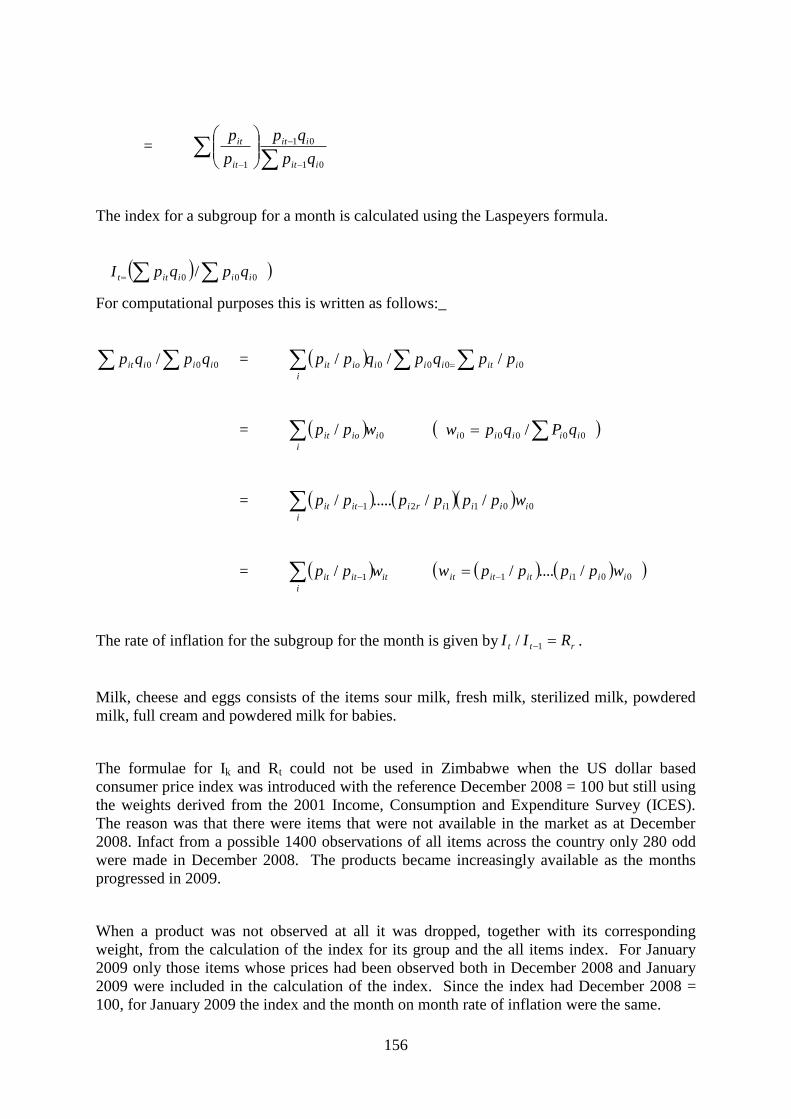
156
=
01
01
1 iit
iit
it
it
qp
qp
p
p
The index for a subgroup for a month is calculated using the Laspeyers formula.
000 / iiiitt qpqpI
For computational purposes this is written as follows:_
000 / iiiit qpqp = 0000 /// iitiii
i
ioit ppqpqpp
= 0/ i
i
ioit wpp 00000 / iiiii qPqpw
= 001121 //...../ iiiiri
i
itit wpppppp
= it
i
itit wpp 1/ 0011 /..../ iiiititit wppppw
The rate of inflation for the subgroup for the month is given by rtt RII 1/ .
Milk, cheese and eggs consists of the items sour milk, fresh milk, sterilized milk, powdered
milk, full cream and powdered milk for babies.
The formulae for Ik and Rt could not be used in Zimbabwe when the US dollar based
consumer price index was introduced with the reference December 2008 = 100 but still using
the weights derived from the 2001 Income, Consumption and Expenditure Survey (ICES).
The reason was that there were items that were not available in the market as at December
2008. Infact from a possible 1400 observations of all items across the country only 280 odd
were made in December 2008. The products became increasingly available as the months
progressed in 2009.
When a product was not observed at all it was dropped, together with its corresponding
weight, from the calculation of the index for its group and the all items index. For January
2009 only those items whose prices had been observed both in December 2008 and January
2009 were included in the calculation of the index. Since the index had December 2008 =
100, for January 2009 the index and the month on month rate of inflation were the same.
157
An item whose price had not been observed in December 2008, had to have its prices
observed for at least two consecutive month before it was included in the calculation of the
index and rate of inflation.
The usual computational technique of calculating ititt WpikpI 1 as described above,
could not be applied directly because it required knowledge or an estimate of
201013221 ... pppppppp itiiitititit , which did not exist because pio did not exist.
However an index with the previous month = 100 including all items whose prices had been
observed both in the current and previous month. The month indices are also the month on
month rates of inflation.
By chaining such indices, an estimate of the index for the current month with December 2008
= 100 was obtained.
Hence 1,1,20,1 ... ttxIxxII .
158
Annexes: Practices in African Countries
Annex A: Use of Government Accounts for National Accounts
Botswana: Compilation of General Government Accounts for Botswana’s National
Account Statistics
1. Introduction
Government accounts are prepared by Statistics Botswana, an autonomous body formed the
Statistics Act of 2009. Botswana‘s national accounts statistics are based on the 1993 System
of National Accounts (1993 SNA) and are compiled on annual and quarterly basis. Annual
accounts are released nine months after the reference year, and in detail in the annual report
entitled ―National Accounts Statistics of Botswana‖. Quarterly accounts are released ninety
(90) days after the reference quarter.
2. Coverage
Government is defined as all units responsible for the implementation of public policies
through the provision of primarily non-marketed services and the transfer of income
supported by compulsory levies on other services. Botswana Government is divided into
Central and Local government. Central government includes all units that are instruments to
Botswana‘s central authority, whose jurisdiction extends to all parts of the country. Local
government consists of government units which exercise an independent function in various
cities, towns and districts. There are currently 16 local authorities and 12 land boards.
Government owned enterprises are excluded from the production side and included in the
respective industrial sectors.
3. Source of data
The main source of data for Government accounts are government financial statements
compiled by the Ministry of Finance and Development Planning (MFDP) under the office of
the Accountant General. The accounts are available for each ministry and department. The
financial statements are compiled on monthly and annual basis. Monthly financial statements
become available on the 15th
of each month while annual accounts are published within eight
months after the end of financial year (March). Botswana government accounts are based on
the international accounting standards, currently the government is working on the
development of International Public Sector Standards (IPSAS).
The accounts are prepared using an automated system known as Government Account and
Budgeting System (GABS). The monthly reports are posted on the MFDP intranet while
annual accounts are published in a report entitled ―Annual Statements of Accounts‖. The
coding structure for the item-wise expenditure and revenue are based on the national coding
structure which is not based on any international classification.
The accounts are prepared on cash basis. The Botswana government is in the process of
moving from cash to accrual and it is hoped that this will be ready by 2019.
Within the MFDP there is a section called cash flow which is responsible for compiling the
following tables classified in accordance with GFS 1986 manual, revenue, expense and
expense by function of government. Monthly financial statements, annual statements of
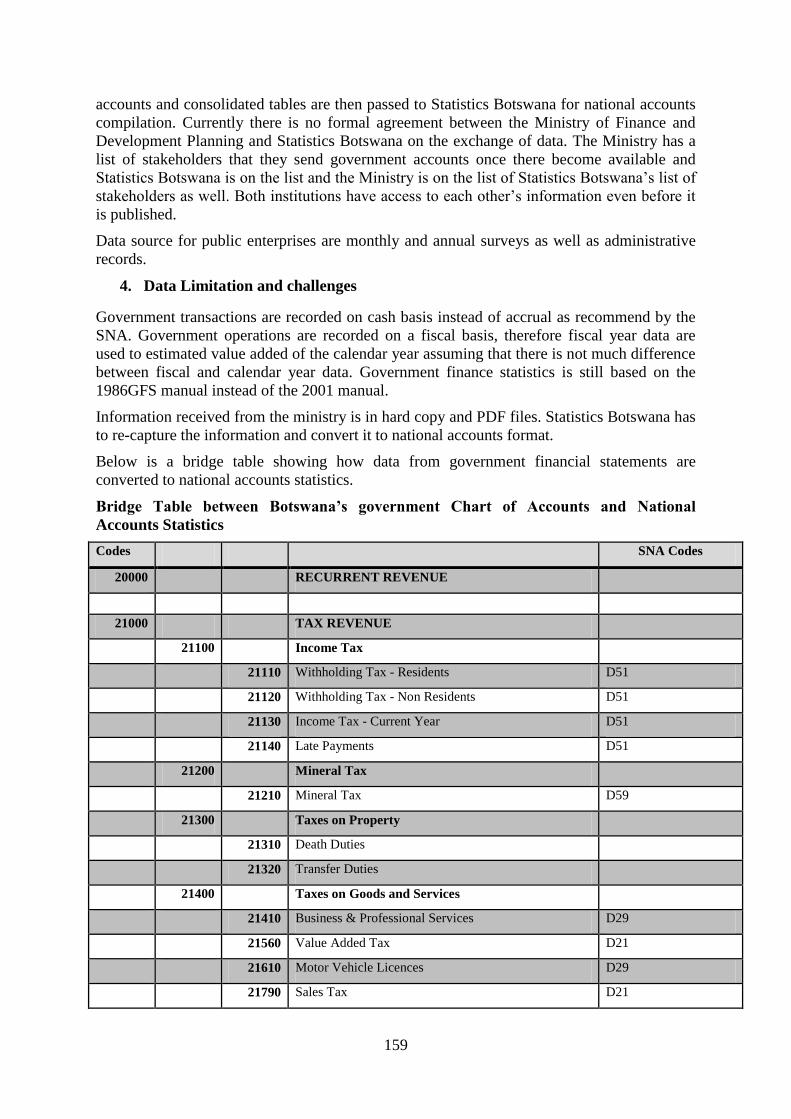
159
accounts and consolidated tables are then passed to Statistics Botswana for national accounts
compilation. Currently there is no formal agreement between the Ministry of Finance and
Development Planning and Statistics Botswana on the exchange of data. The Ministry has a
list of stakeholders that they send government accounts once there become available and
Statistics Botswana is on the list and the Ministry is on the list of Statistics Botswana‘s list of
stakeholders as well. Both institutions have access to each other‘s information even before it
is published.
Data source for public enterprises are monthly and annual surveys as well as administrative
records.
4. Data Limitation and challenges
Government transactions are recorded on cash basis instead of accrual as recommend by the
SNA. Government operations are recorded on a fiscal basis, therefore fiscal year data are
used to estimated value added of the calendar year assuming that there is not much difference
between fiscal and calendar year data. Government finance statistics is still based on the
1986GFS manual instead of the 2001 manual.
Information received from the ministry is in hard copy and PDF files. Statistics Botswana has
to re-capture the information and convert it to national accounts format.
Below is a bridge table showing how data from government financial statements are
converted to national accounts statistics.
Bridge Table between Botswana’s government Chart of Accounts and National
Accounts Statistics
Codes SNA Codes
20000 RECURRENT REVENUE
21000 TAX REVENUE
21100 Income Tax
21110 Withholding Tax - Residents D51
21120 Withholding Tax - Non Residents D51
21130 Income Tax - Current Year D51
21140 Late Payments D51
21200 Mineral Tax
21210 Mineral Tax D59
21300 Taxes on Property
21310 Death Duties
21320 Transfer Duties
21400 Taxes on Goods and Services
21410 Business & Professional Services D29
21560 Value Added Tax D21
21610 Motor Vehicle Licences D29
21790 Sales Tax D21

160
Codes SNA Codes
21800 Taxes On International Trade & Transactions
21810 Customs Duties D21
21820 Excise Duty D21
21840 Export Duties D21
21900 Other Taxes
21910 Stamp Duties D29
21920 Other Taxes D29
22000 NON TAX REVENUE
22200 Interest
22110 Profits From Public Enterprises D42
22200 Interest D41
22210 Interest : Parastatals (DDF) D41
22360 Interest: Local Authorities D41
22380 Interest: Deposits D41
22500 Mineral Royalties/Dividend
22500 Mineral Royalties/Dividend D42
22600 Rent of Land
22600 Rent of Land D45
22700 Administration Fees and Charges
22710 Rent of Buildings & Equipment D45
23010 Sale of Goods & Services P11
23210 Other Fees and Charges D29/D45/D44
23510 Fines & Forfeits D11/D21/D29
23560 Loan Repayment: Principal (DDF) - Parastatals F4
23630 Loan Repayment: Principal (DDF) - Local Authorities F4
23680 Other Revenue D45/F4
24000 CAPITAL REVENUE
24100 Sale of Fixed Capital
24100 Sale of Fixed Capital P51
24200 Sale of Land
24200 Sale of Land P51
24300 IMF Transactions (Revenue)
24300 IMF Transactions (Revenue) F1
24400 Sale of Livestock
24400 Sale of Livestock P51/P11
25000 GRANTS
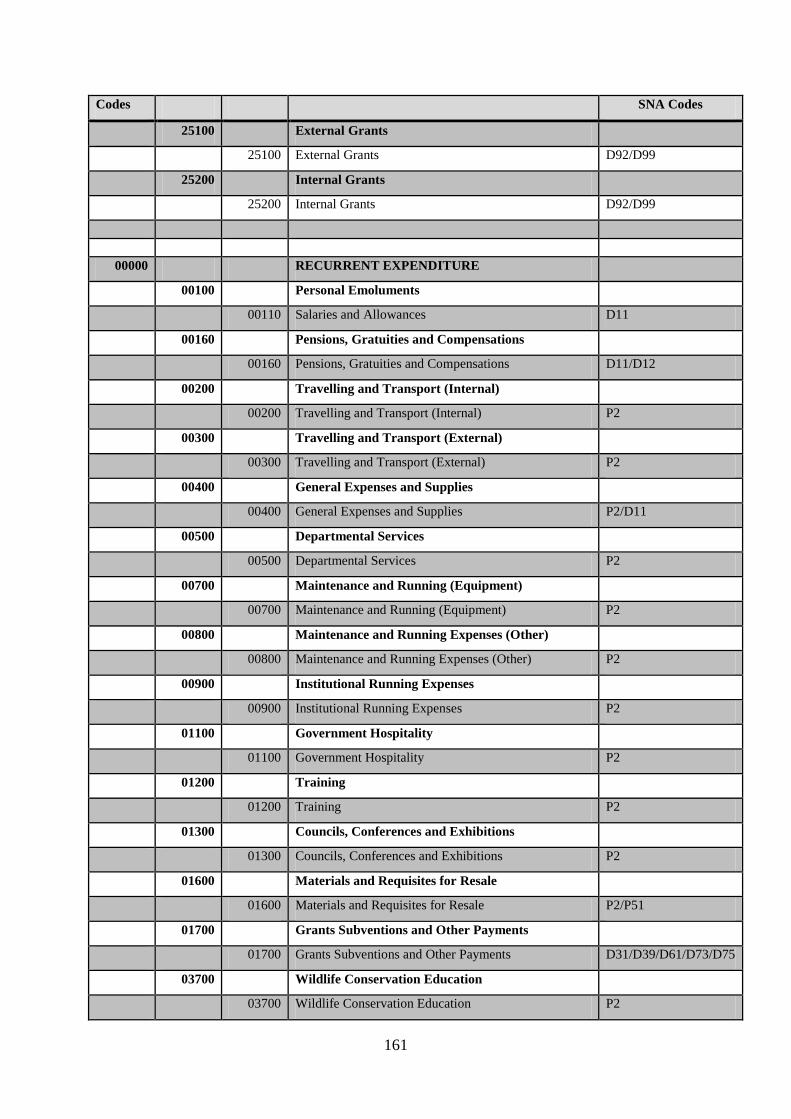
161
Codes SNA Codes
25100 External Grants
25100 External Grants D92/D99
25200 Internal Grants
25200 Internal Grants D92/D99
00000 RECURRENT EXPENDITURE
00100 Personal Emoluments
00110 Salaries and Allowances D11
00160 Pensions, Gratuities and Compensations
00160 Pensions, Gratuities and Compensations D11/D12
00200 Travelling and Transport (Internal)
00200 Travelling and Transport (Internal) P2
00300 Travelling and Transport (External)
00300 Travelling and Transport (External) P2
00400 General Expenses and Supplies
00400 General Expenses and Supplies P2/D11
00500 Departmental Services
00500 Departmental Services P2
00700 Maintenance and Running (Equipment)
00700 Maintenance and Running (Equipment) P2
00800 Maintenance and Running Expenses (Other)
00800 Maintenance and Running Expenses (Other) P2
00900 Institutional Running Expenses
00900 Institutional Running Expenses P2
01100 Government Hospitality
01100 Government Hospitality P2
01200 Training
01200 Training P2
01300 Councils, Conferences and Exhibitions
01300 Councils, Conferences and Exhibitions P2
01600 Materials and Requisites for Resale
01600 Materials and Requisites for Resale P2/P51
01700 Grants Subventions and Other Payments
01700 Grants Subventions and Other Payments D31/D39/D61/D73/D75
03700 Wildlife Conservation Education
03700 Wildlife Conservation Education P2
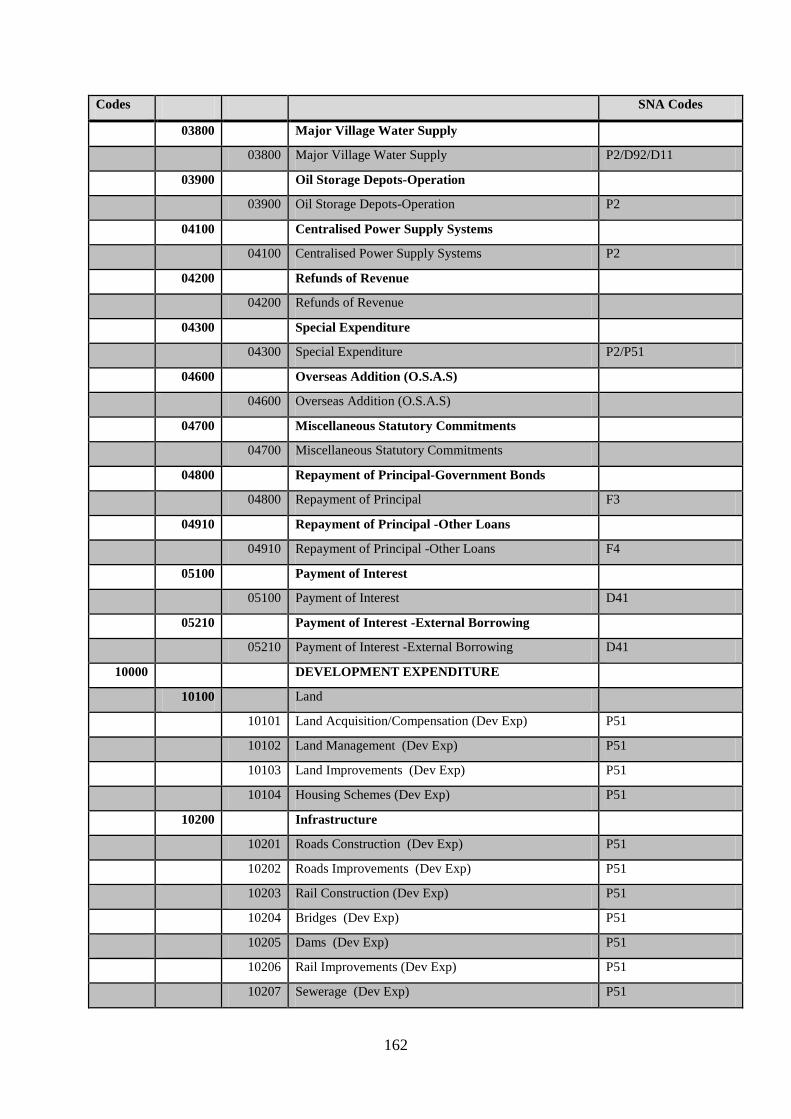
162
Codes SNA Codes
03800 Major Village Water Supply
03800 Major Village Water Supply P2/D92/D11
03900 Oil Storage Depots-Operation
03900 Oil Storage Depots-Operation P2
04100 Centralised Power Supply Systems
04100 Centralised Power Supply Systems P2
04200 Refunds of Revenue
04200 Refunds of Revenue
04300 Special Expenditure
04300 Special Expenditure P2/P51
04600 Overseas Addition (O.S.A.S)
04600 Overseas Addition (O.S.A.S)
04700 Miscellaneous Statutory Commitments
04700 Miscellaneous Statutory Commitments
04800 Repayment of Principal-Government Bonds
04800 Repayment of Principal F3
04910 Repayment of Principal -Other Loans
04910 Repayment of Principal -Other Loans F4
05100 Payment of Interest
05100 Payment of Interest D41
05210 Payment of Interest -External Borrowing
05210 Payment of Interest -External Borrowing D41
10000 DEVELOPMENT EXPENDITURE
10100 Land
10101 Land Acquisition/Compensation (Dev Exp) P51
10102 Land Management (Dev Exp) P51
10103 Land Improvements (Dev Exp) P51
10104 Housing Schemes (Dev Exp) P51
10200 Infrastructure
10201 Roads Construction (Dev Exp) P51
10202 Roads Improvements (Dev Exp) P51
10203 Rail Construction (Dev Exp) P51
10204 Bridges (Dev Exp) P51
10205 Dams (Dev Exp) P51
10206 Rail Improvements (Dev Exp) P51
10207 Sewerage (Dev Exp) P51
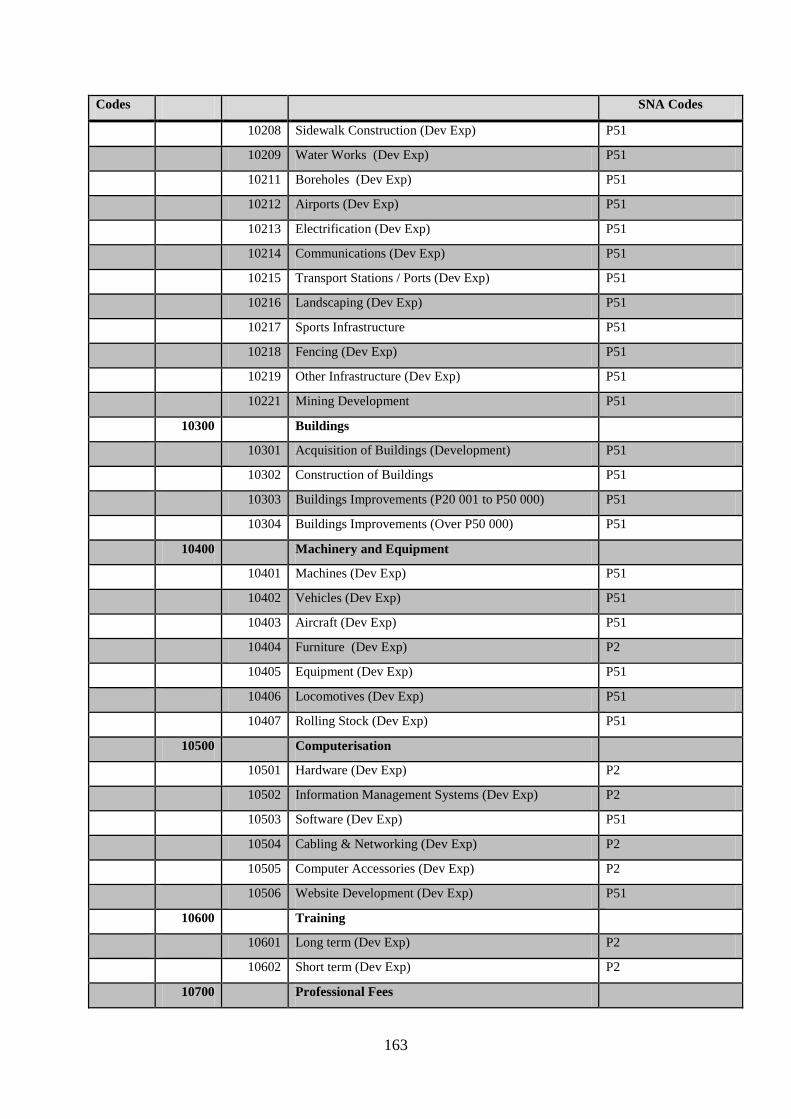
163
Codes SNA Codes
10208 Sidewalk Construction (Dev Exp) P51
10209 Water Works (Dev Exp) P51
10211 Boreholes (Dev Exp) P51
10212 Airports (Dev Exp) P51
10213 Electrification (Dev Exp) P51
10214 Communications (Dev Exp) P51
10215 Transport Stations / Ports (Dev Exp) P51
10216 Landscaping (Dev Exp) P51
10217 Sports Infrastructure P51
10218 Fencing (Dev Exp) P51
10219 Other Infrastructure (Dev Exp) P51
10221 Mining Development P51
10300 Buildings
10301 Acquisition of Buildings (Development) P51
10302 Construction of Buildings P51
10303 Buildings Improvements (P20 001 to P50 000) P51
10304 Buildings Improvements (Over P50 000) P51
10400 Machinery and Equipment
10401 Machines (Dev Exp) P51
10402 Vehicles (Dev Exp) P51
10403 Aircraft (Dev Exp) P51
10404 Furniture (Dev Exp) P2
10405 Equipment (Dev Exp) P51
10406 Locomotives (Dev Exp) P51
10407 Rolling Stock (Dev Exp) P51
10500 Computerisation
10501 Hardware (Dev Exp) P2
10502 Information Management Systems (Dev Exp) P2
10503 Software (Dev Exp) P51
10504 Cabling & Networking (Dev Exp) P2
10505 Computer Accessories (Dev Exp) P2
10506 Website Development (Dev Exp) P51
10600 Training
10601 Long term (Dev Exp) P2
10602 Short term (Dev Exp) P2
10700 Professional Fees
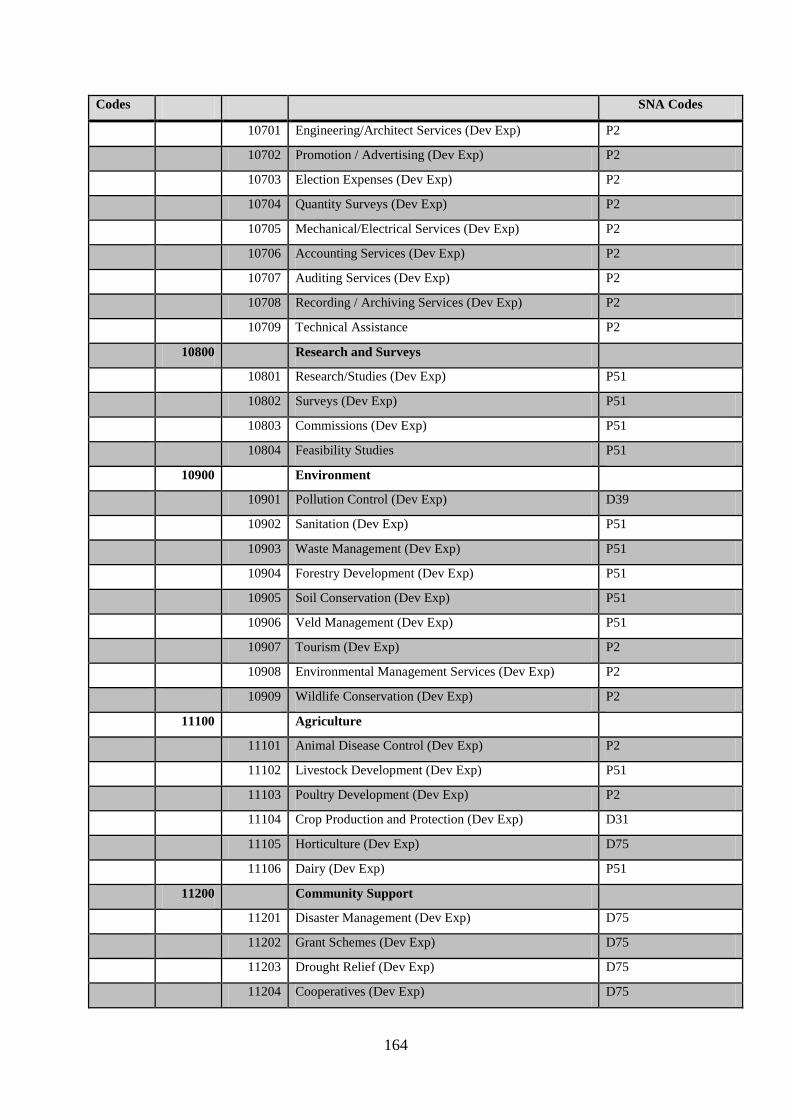
164
Codes SNA Codes
10701 Engineering/Architect Services (Dev Exp) P2
10702 Promotion / Advertising (Dev Exp) P2
10703 Election Expenses (Dev Exp) P2
10704 Quantity Surveys (Dev Exp) P2
10705 Mechanical/Electrical Services (Dev Exp) P2
10706 Accounting Services (Dev Exp) P2
10707 Auditing Services (Dev Exp) P2
10708 Recording / Archiving Services (Dev Exp) P2
10709 Technical Assistance P2
10800 Research and Surveys
10801 Research/Studies (Dev Exp) P51
10802 Surveys (Dev Exp) P51
10803 Commissions (Dev Exp) P51
10804 Feasibility Studies P51
10900 Environment
10901 Pollution Control (Dev Exp) D39
10902 Sanitation (Dev Exp) P51
10903 Waste Management (Dev Exp) P51
10904 Forestry Development (Dev Exp) P51
10905 Soil Conservation (Dev Exp) P51
10906 Veld Management (Dev Exp) P51
10907 Tourism (Dev Exp) P2
10908 Environmental Management Services (Dev Exp) P2
10909 Wildlife Conservation (Dev Exp) P2
11100 Agriculture
11101 Animal Disease Control (Dev Exp) P2
11102 Livestock Development (Dev Exp) P51
11103 Poultry Development (Dev Exp) P2
11104 Crop Production and Protection (Dev Exp) D31
11105 Horticulture (Dev Exp) D75
11106 Dairy (Dev Exp) P51
11200 Community Support
11201 Disaster Management (Dev Exp) D75
11202 Grant Schemes (Dev Exp) D75
11203 Drought Relief (Dev Exp) D75
11204 Cooperatives (Dev Exp) D75
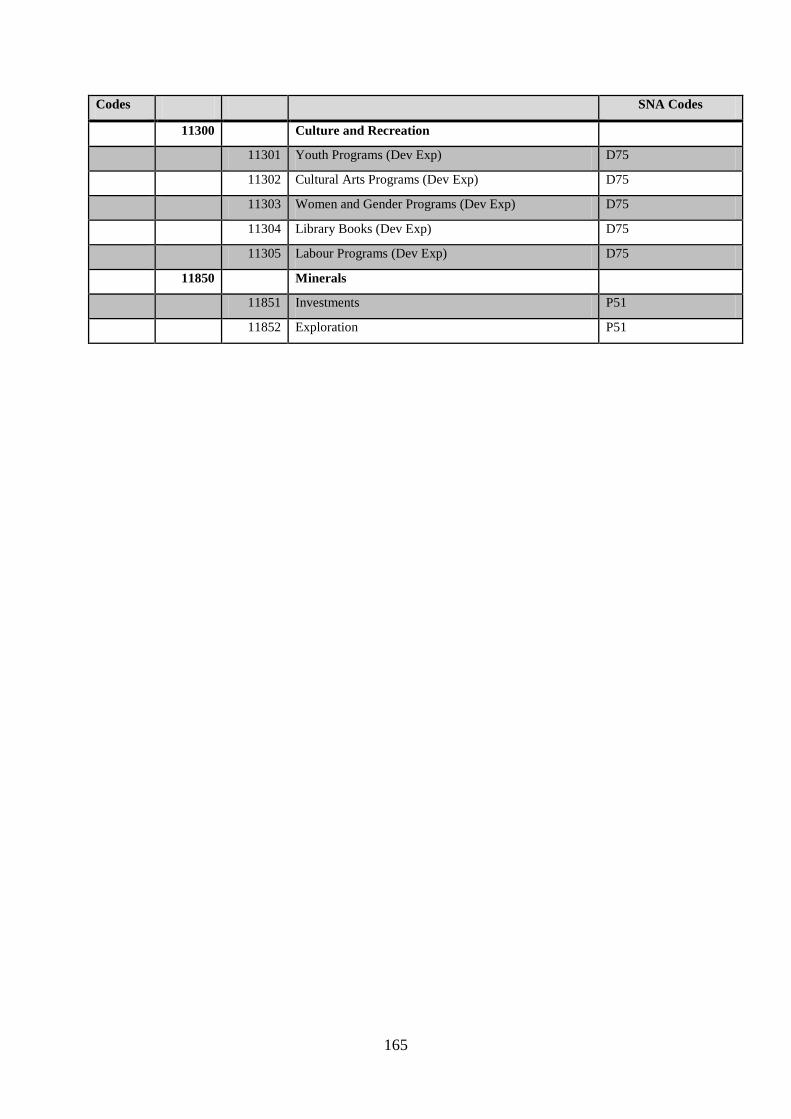
165
Codes SNA Codes
11300 Culture and Recreation
11301 Youth Programs (Dev Exp) D75
11302 Cultural Arts Programs (Dev Exp) D75
11303 Women and Gender Programs (Dev Exp) D75
11304 Library Books (Dev Exp) D75
11305 Labour Programs (Dev Exp) D75
11850 Minerals
11851 Investments P51
11852 Exploration P51
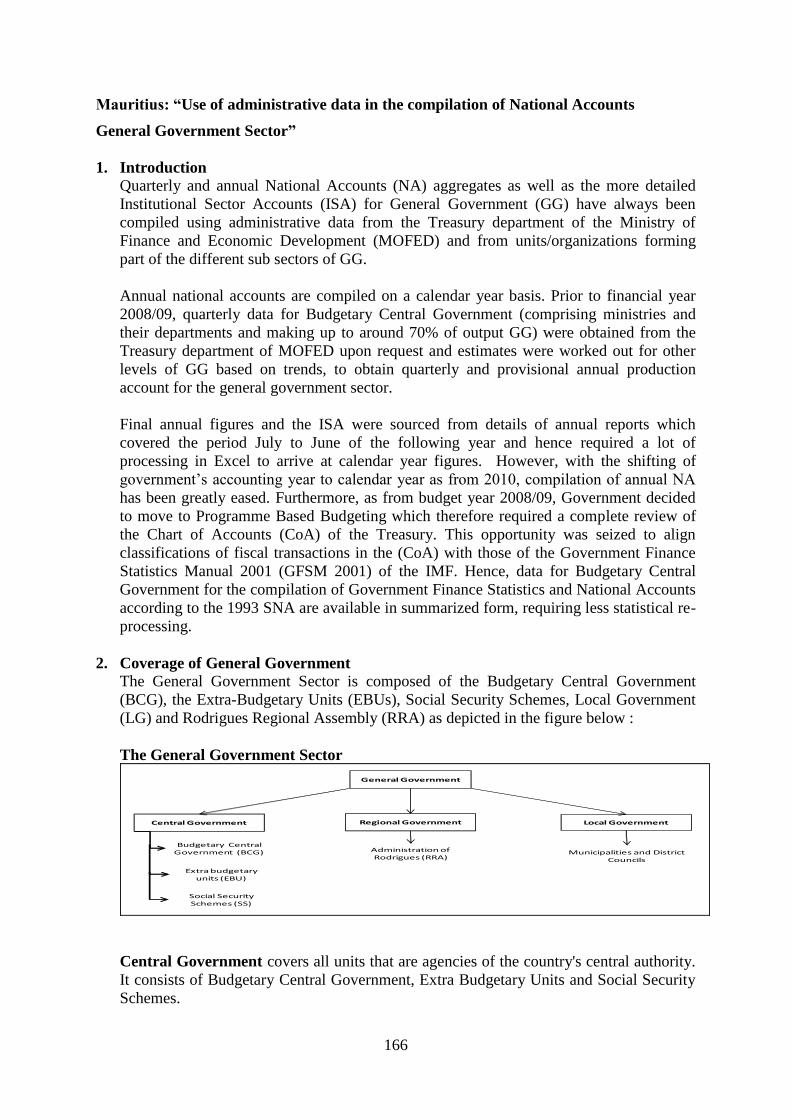
166
Mauritius: “Use of administrative data in the compilation of National Accounts
General Government Sector”
1. Introduction
Quarterly and annual National Accounts (NA) aggregates as well as the more detailed
Institutional Sector Accounts (ISA) for General Government (GG) have always been
compiled using administrative data from the Treasury department of the Ministry of
Finance and Economic Development (MOFED) and from units/organizations forming
part of the different sub sectors of GG.
Annual national accounts are compiled on a calendar year basis. Prior to financial year
2008/09, quarterly data for Budgetary Central Government (comprising ministries and
their departments and making up to around 70% of output GG) were obtained from the
Treasury department of MOFED upon request and estimates were worked out for other
levels of GG based on trends, to obtain quarterly and provisional annual production
account for the general government sector.
Final annual figures and the ISA were sourced from details of annual reports which
covered the period July to June of the following year and hence required a lot of
processing in Excel to arrive at calendar year figures. However, with the shifting of
government‘s accounting year to calendar year as from 2010, compilation of annual NA
has been greatly eased. Furthermore, as from budget year 2008/09, Government decided
to move to Programme Based Budgeting which therefore required a complete review of
the Chart of Accounts (CoA) of the Treasury. This opportunity was seized to align
classifications of fiscal transactions in the (CoA) with those of the Government Finance
Statistics Manual 2001 (GFSM 2001) of the IMF. Hence, data for Budgetary Central
Government for the compilation of Government Finance Statistics and National Accounts
according to the 1993 SNA are available in summarized form, requiring less statistical re-
processing.
2. Coverage of General Government
The General Government Sector is composed of the Budgetary Central Government
(BCG), the Extra-Budgetary Units (EBUs), Social Security Schemes, Local Government
(LG) and Rodrigues Regional Assembly (RRA) as depicted in the figure below :
The General Government Sector
General Government
Central Government Regional Government Local Government
Budgetary Central Government (BCG)
Extra budgetaryunits (EBU)
Social SecuritySchemes (SS)
Administration of Rodrigues (RRA)
Municipalities and District Councils
Central Government covers all units that are agencies of the country's central authority.
It consists of Budgetary Central Government, Extra Budgetary Units and Social Security
Schemes.
167
Budgetary Central Government (BCG) includes all ministries and departments.
Extra Budgetary Units (EBUs) are agencies responsible for the performance of
specialized governmental functions in such fields as health, education, social welfare,
construction and so on, under the authority of BCG. They are fully financed by BCG.
Social Security Schemes (SS) are schemes imposed, controlled or financed by the public
authorities for the purpose of providing social security benefits for the community. The
National Pensions Scheme and the Civil Service Family Protection Scheme are included
here.
Regional Government (RG) consists of the administration of the island of Rodrigues
which is part of the Republic of Mauritius.
Local Government (LG) consists of municipalities and district councils exercising an
independent competence as government units.
3. Sources of data
3.1 Budgetary Central Government (BCG)
The Treasury Department of the Ministry of Finance and Economic Development is
responsible for compiling and publishing Government Accounts for Budgetary Central
Government (BCG) based on a centralized computerized Treasury Accounting System
(TAS) where all financial transactions of ministries and their departments are recorded.
The finance sections of all ministries and their departments are linked to the TAS. A
brief description and the function of TAS are given in Annex I.
Data needed for compiling Government Finance Statistics and National Accounts for
BCG are obtained from two different reports (known as TRY2 and TRY6) downloaded
from the TAS. TRY2 provides detailed expenditure classified by budget programme
while TRY 6 gives detailed transactions on revenue, expenditure and financing.
The TAS is a web based window which is protected with a username and password to
avoid unauthorized access. Permission for access to the TAS is granted by the
department of the Treasury. SM has access to the TAS.
The TAS allows the user to download reports in Microsoft Excel format. It is a database
providing monthly budgeted and actual figures of BCG revenue, expenditure and
financing items. The TAS is dynamic and is updated in real time. Data from TRY2 and
TRY6 are available two months after the reference month or year. Quarterly data can be
obtained by summing figures for the corresponding months.
3.2 Extra Budgetary Units (EBUs), Social Security Schemes (SS), Regional Government
(RG) and Local Government (LG)
Data for Extra Budgetary Units and Local Government are not centralized and are
available only in the annual reports of the individual organizations which are published 6-
8 months after the reference accounting period. Printed copies of these reports are
available upon formal request.
Data for Social Security Schemes are available in excel format upon request.
Data for Regional Government (Island of Rodrigues) are collected from the
administrative department of the island in the form of excel tables similar to TRY2 and
TRY6.
168
4. Procedures for compiling Government Finance Statistics (GFS)
4.1 Budgetary Central Government
Details on Budgetary Central Government Revenue, Expense, Acquisition of
Nonfinancial assets, Acquisition of Financial Assets and Incurrence of Liabilities are
extracted from TRY6. All these items are coded using an 8-digits economic classification
code in the TAS. This coding structure is based on the recommended classifications in the
Government Finance Statistics Manual 2001 (GFSM 2001) of the IMF. In TRY2 each
expenditure item is displayed with its programme code and the economic classification
code to which it belongs. Based on the programme and classification codes, detailed
tables on Revenue, Expense, Expenditure by function, and transactions in assets and
liabilities for the Budgetary Central Government are compiled directly from TRY 2 and
TRY 6.
4.2 Extra Budgetary Units (EBUs), Social Security Schemes (SS), Regional Government
(RG) and Local Government (LG)
The data supplied for Regional Government are similar to those of TRY 2 and TRY 6.
Compilation of GFS data for Regional Government is therefore straightforward as for
Budgetary Central Government.
Extra Budgetary Units and Social Security Schemes use the International Public Sector
Accounting Standards (IPSAS) when compiling their accounts. The final accounts of
Local Government are based on Generally Accepted Accounting Principles (GAAP).
Hence, final detailed transactions in the annual accounts have to be re-coded for GFS and
NA purposes. The coded items are then input in an excel worksheet for reclassifications
and tabulation.
4.3 Consolidation
Once GFS data for the different levels of General Government are ready, they are
consolidated. For GFS purposes, transactions between the sub levels of general
government have to be eliminated.
5. Translating item-wise revenue and expenditure compiled for GFS into National
Accounts
5.1 Inputs from GFS and other separately calculated variables
Compilation of SNA accounts is to a very large extent based on data already compiled for
GFS purposes, as the GFSM 2001 is in line with SNA 93 with a few exceptions. Hence,
most of the items required for the General Government sector can be obtained from the
GFS tables already compiled at General Government level. Please see Table 1.
However, there are items like Financial Intermediation Services Indirectly Measured
(FISIM) and Gross Fixed Capital Formation (GFCF) that are not available in the GFS
system and need to be computed separately. The Consumption of Fixed Capital (CFC) is
another item which is not yet compiled in GFS because of lack of information from
administrative records of Government. The methodologies for computing FISIM, GFCF
and CFC for NA purposes are shown at Annex II.
Most items in the SNA accounts can be directly bridged from corresponding item in the
GFS tables. Examples are Compensation of Employees, Subsidies, Current transfers and
169
Taxes on Products. For Intermediate Consumption, purchase and sales of goods and
services and transfer in kinds from GFS are used and adjustments made for FISIM.
It is to be noted that transfers from one level of government to another have been
eliminated in GFS due to consolidation and therefore are not available in the ISA for
general government. Some more work is needed to be able to show these intra
government transactions as required by SNA.
5.2 Translating Government Finance Statistics to SNA accounts – Mauritius Example
The attached example shows how tables compiled for Government Finance Statistics
(GFS) are translated to SNA‘s Institutional Sector Accounts. Table 2 shows how the
items in GFS are bridged to the items in SNA and how the production account, generation
of income account, allocation of primary income account, secondary distribution account,
use of income account and the capital account are produced for the General Government
sector. Table 2a shows how items that are not available from GFS are computed for the
purpose of National Accounts. Table 3 gives the sequence of accounts compiled from
these data.
5.3 National Accounts by Industry and Function
Production Account and Generation of Income Account for General Government are also
compiled by industry group, based on the National Standard Industrial Classification
(NSIC), which is an adapted version of the UN International Standard Industrial
Classification (ISIC). General Government Current Expenditure is also compiled by
function based on the Classification of Functions of Government (COFOG). The
programme codes in the TAS have been designed to allow for easy mapping of
expenditure items to NSIC and COFOG using Microsoft Excel functions and pivot tables.
An extract of the mapping table is shown at Annex III.
6. Conclusion
Compilation of GFS and NA at BCG level has been immensely facilitated with coming
into operation of the new CoA, which has taken on board statistical requirements.
For the remaining units of the General Government, numbering around 120, data are
sourced from their final accounts. The final accounts of these units are scrutinized and
coded according to required statistical classifications and then input in Excel for further
processing. The problems with the final accounts are lack of details for statistical
purposes and unavailability in soft copies.
Action has been initiated to incorporate GFS classification codes in the accounting system
of the 12 municipalities and district councils forming part of local government. However,
there have not been any results up to now.
Annex I
The Treasury Accounting System (TAS)
The Treasury Department of Mauritius uses a system known as the Treasury Accounting
system for the processing and recording of the financial transactions of Government and for
the preparation of annual financial statements and other financial reports. The TAS
comprises a Chart of Accounts (COA), which defines the format in which financial data is
captured and the reports that can be generated. The TAS
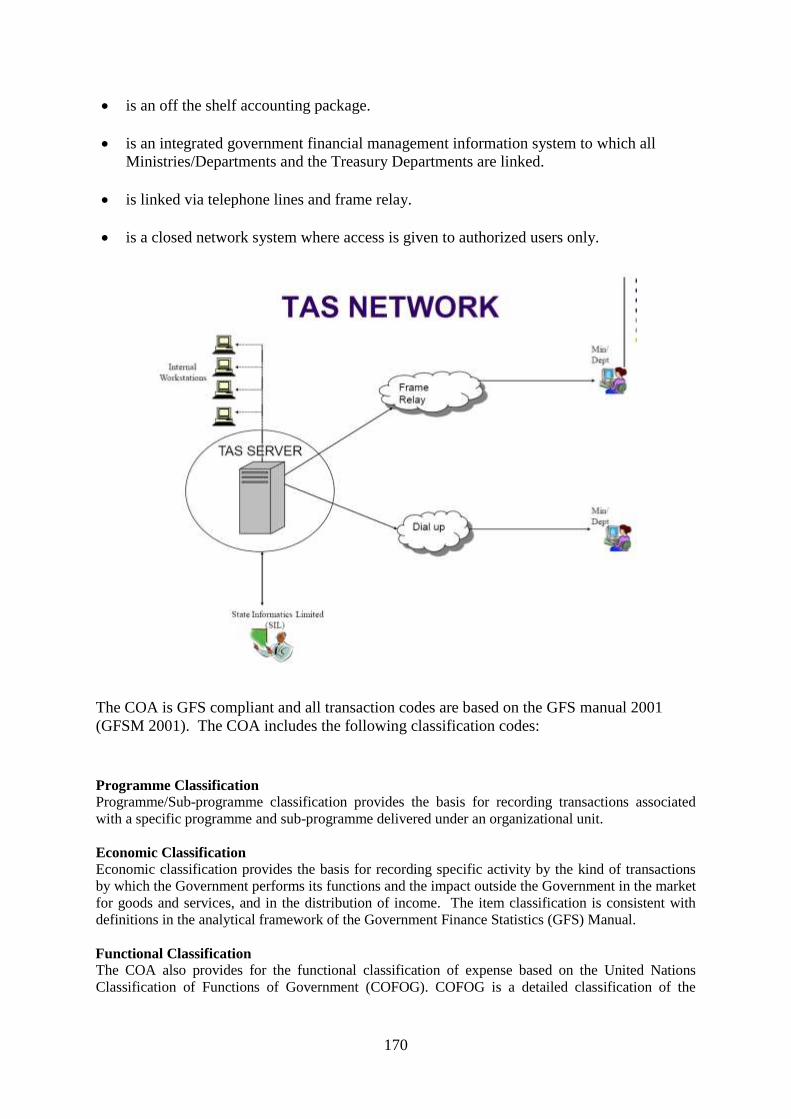
170
is an off the shelf accounting package.
is an integrated government financial management information system to which all
Ministries/Departments and the Treasury Departments are linked.
is linked via telephone lines and frame relay.
is a closed network system where access is given to authorized users only.
The COA is GFS compliant and all transaction codes are based on the GFS manual 2001
(GFSM 2001). The COA includes the following classification codes:
Programme Classification
Programme/Sub-programme classification provides the basis for recording transactions associated
with a specific programme and sub-programme delivered under an organizational unit.
Economic Classification
Economic classification provides the basis for recording specific activity by the kind of transactions
by which the Government performs its functions and the impact outside the Government in the market
for goods and services, and in the distribution of income. The item classification is consistent with
definitions in the analytical framework of the Government Finance Statistics (GFS) Manual.
Functional Classification
The COA also provides for the functional classification of expense based on the United Nations
Classification of Functions of Government (COFOG). COFOG is a detailed classification of the
171
functions, or socio-economic objectives, that Ministries/Departments aim to achieve through various
kinds of outlays.
A functional classification organizes government activities according to their purpose (agriculture,
defence, education, intergovernmental transfers, etc.) and is independent of the government‘s
organizational structure. This classification provides for the analysis of the allocation of resources
among sectors and is important for monitoring macro budget policy objectives.
The system provides for an automatic allocation of sub-programmes to sub-functions of government
as per the COFOG standard. For this purpose, the oracle tool called the Financial Statement
Generator (FSG) is used. Sub-programmes are mapped to their corresponding sub-functions, thus
allowing for each transaction to be captured under their appropriate function code. Accordingly, users
would not need to allocate, at input stage, each and every transaction to respective functional codes.
Annex II
Methodologies for calculating FISIM, GFCF and CFC
Method for calculation of government FISIM
FISIM for government, which is an intermediate cost, is calculated for the General
Government level. Data on stock of deposits and loans and the prevailing rate of interest as
published in the monthly statistical bulletin of Bank of Mauritius are used to calculate the
actual interest paid. To estimate the SNA interest, the reference rate used is the bank rate as
determined by the Monetary Policy Committee of the Bank of Mauritius every quarter.
Compilation of Gross Fixed Capital Formation (GFCF)
Different sources are used for the valuation of capital formation, based essentially on the
commodity approach. Information on investment is collected and compiled on a calendar
year basis. These data are classified by type of capital goods namely residential buildings,
non residential buildings, other construction works, transport equipment and other machinery
and equipment and by industrial activity.
Building and construction
Investment on residential buildings is obtained from the National Housing Development
Company (NHDC), the Mauritius Housing Corporation. However, investment by
government in residential buildings is considered mostly as private because beneficiaries
become owners of the housing units.
Costs of large construction projects are estimated from data obtained from various
administrative sources as well as the budget and the Public Sector Investment Programme.
Other construction works
All other construction works not included above are grouped under ―Other construction
works‖. These include outlays on road constructions, dams, reservoirs, pipe laying,
electricity distribution networks, land improvement and reclamation and all other civil
engineering works. Information on such construction works is obtained from administrative
sources as well as the budget and the Public Sector Investment Programme.
Estimates in building and construction works are updated following meeting with concerned
bodies and are cross checked with expenditure incurred by government.
Transport Equipment
172
For road transport equipment, the main source is the National Transport Authority, where all
purchase of vehicles, new or second hand, have to be registered together with the name of the
buyer. For aircraft and vessels, external trade statistics are used.
Other Machinery and Equipment
External Trade Statistics are the main source of data as most of the machines are imported. A
list of imported machinery and equipment, identified as capital goods, is prepared. These
imported goods are at c.i.f. value and are brought to purchasers' prices by the addition of
taxes on imports, landing cost, transportation cost, wholesale and retail margins and in some
cases, installation cost. They are then classified by industrial use. These are however cross
checked against capital expenditure data from the government reports.
Adjustments – accrual and cash flows
Given that GFCF is estimated on an accrual basis and expenditure incurred are cash flows
adjustments are made to exclude any advance payment made and retention money on
projects. These advance payments are included wholly in the year when acquisitions of the
goods are made. Retention money, if any, is included in the year of completion of the
project.
Compilation of Consumption of Fixed Capital
Consumption of Fixed Capital (CFC) is a cost of production. It may be defined in general
terms as the decline, during the course of the accounting period, in the current value of the
stock of fixed assets owned and used by a producer as a result of physical deterioration,
normal obsolescence or normal accidental damage.
From the Gross Domestic Fixed Capital Formation (GDFCF) of government every year, the
consumption of fixed capital is compiled for each industrial activity in which Government is
involved.
The Perpetual Inventory Method (PIM) is used to produce estimates of the value of the stock
of capital assets used in the production process. Capital assets refer to tangible reproducible
fixed assets which include building (excluding land), infrastructural work, machinery and
equipment. The PIM requires current price estimates of GDFCF and price indices over many
years, and assumptions about the expected lifetime of the respective assets as shown at 4.3.1
below.
The PIM produces annual estimates of gross and net capital stock at constant and current
prices by accumulating past flows of expenditure on GDFCF.
Gross capital stock is the accumulation of past investment flows less retirements before
deduction of any allowances for consumption of fixed capital.
Net capital stock is gross capital stock less accumulated capital consumption on items
forming the gross capital stock.
Annual estimates of consumption of fixed capital are derived using the Straight Line Method.
The straight line depreciation function assumes a linear decline in efficiency, that is, it
exhibits the same loss every year until the service life ends when efficiency declines to zero.
173
Assumptions used for mean asset life by type:
Type of asset Mean asset life
A .Construction Work Age
Residential building 30 years
Non residential building 40 years
Other construction work 60 years
B. Transport equipment according to type / sector
Motor car 8 years
Other transport equipment
Air / Sea Transport 20 years
C. Other machinery and equipment by sector
Agriculture 15 years
Manufacturing 8 years
Financial services 5 years
Public utilities 20 years
Other sectors 12 years
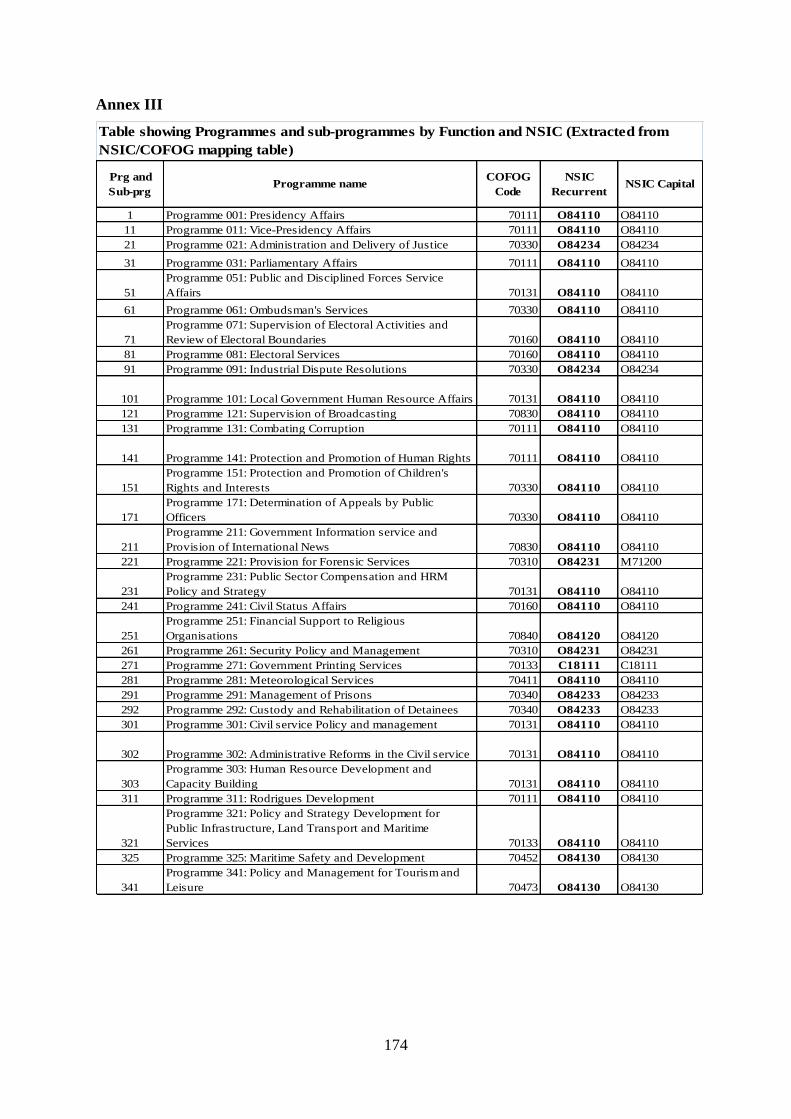
174
Annex III
1 Programme 001: Presidency Affairs 70111 O84110 O84110
11 Programme 011: Vice-Presidency Affairs 70111 O84110 O84110
21 Programme 021: Administration and Delivery of Justice 70330 O84234 O84234
31 Programme 031: Parliamentary Affairs 70111 O84110 O84110
51
Programme 051: Public and Disciplined Forces Service
Affairs 70131 O84110 O84110
61 Programme 061: Ombudsman's Services 70330 O84110 O84110
71
Programme 071: Supervision of Electoral Activities and
Review of Electoral Boundaries 70160 O84110 O84110
81 Programme 081: Electoral Services 70160 O84110 O84110
91 Programme 091: Industrial Dispute Resolutions 70330 O84234 O84234
101 Programme 101: Local Government Human Resource Affairs 70131 O84110 O84110
121 Programme 121: Supervision of Broadcasting 70830 O84110 O84110
131 Programme 131: Combating Corruption 70111 O84110 O84110
141 Programme 141: Protection and Promotion of Human Rights 70111 O84110 O84110
151
Programme 151: Protection and Promotion of Children's
Rights and Interests 70330 O84110 O84110
171
Programme 171: Determination of Appeals by Public
Officers 70330 O84110 O84110
211
Programme 211: Government Information service and
Provision of International News 70830 O84110 O84110
221 Programme 221: Provision for Forensic Services 70310 O84231 M71200
231
Programme 231: Public Sector Compensation and HRM
Policy and Strategy 70131 O84110 O84110
241 Programme 241: Civil Status Affairs 70160 O84110 O84110
251
Programme 251: Financial Support to Religious
Organisations 70840 O84120 O84120
261 Programme 261: Security Policy and Management 70310 O84231 O84231
271 Programme 271: Government Printing Services 70133 C18111 C18111
281 Programme 281: Meteorological Services 70411 O84110 O84110
291 Programme 291: Management of Prisons 70340 O84233 O84233
292 Programme 292: Custody and Rehabilitation of Detainees 70340 O84233 O84233
301 Programme 301: Civil service Policy and management 70131 O84110 O84110
302 Programme 302: Administrative Reforms in the Civil service 70131 O84110 O84110
303
Programme 303: Human Resource Development and
Capacity Building 70131 O84110 O84110
311 Programme 311: Rodrigues Development 70111 O84110 O84110
321
Programme 321: Policy and Strategy Development for
Public Infrastructure, Land Transport and Maritime
Services 70133 O84110 O84110
325 Programme 325: Maritime Safety and Development 70452 O84130 O84130
341
Programme 341: Policy and Management for Tourism and
Leisure 70473 O84130 O84130
Table showing Programmes and sub-programmes by Function and NSIC (Extracted from
NSIC/COFOG mapping table)
Prg and
Sub-prg
COFOG
CodeProgramme name
NSIC
RecurrentNSIC Capital
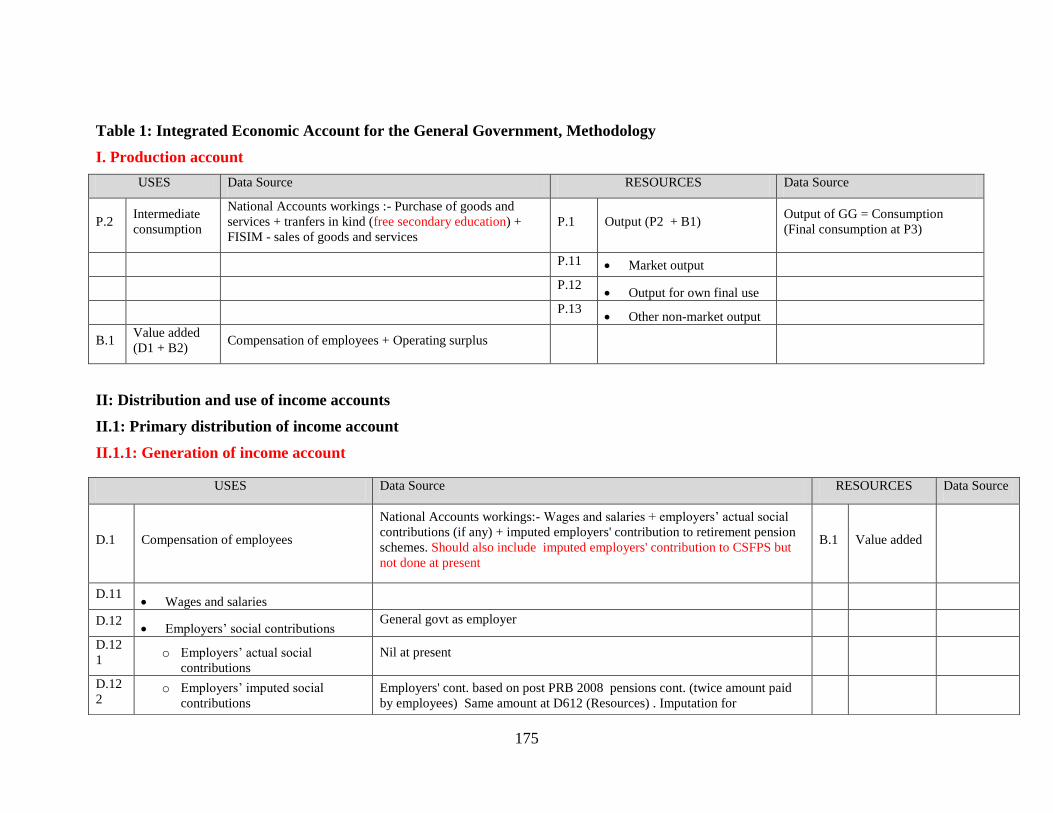
175
Table 1: Integrated Economic Account for the General Government, Methodology
I. Production account
USES Data Source RESOURCES Data Source
P.2 Intermediate
consumption
National Accounts workings :- Purchase of goods and
services + tranfers in kind (free secondary education) +
FISIM - sales of goods and services
P.1 Output (P2 + B1) Output of GG = Consumption
(Final consumption at P3)
P.11 Market output
P.12 Output for own final use
P.13 Other non-market output
B.1 Value added
(D1 + B2) Compensation of employees + Operating surplus
II: Distribution and use of income accounts
II.1: Primary distribution of income account
II.1.1: Generation of income account
USES Data Source RESOURCES Data Source
D.1 Compensation of employees
National Accounts workings:- Wages and salaries + employers‘ actual social
contributions (if any) + imputed employers' contribution to retirement pension
schemes. Should also include imputed employers' contribution to CSFPS but
not done at present
B.1 Value added
D.11 Wages and salaries
D.12 Employers‘ social contributions
General govt as employer
D.12
1 o Employers‘ actual social
contributions
Nil at present
D.12
2 o Employers‘ imputed social
contributions
Employers' cont. based on post PRB 2008 pensions cont. (twice amount paid
by employees) Same amount at D612 (Resources) . Imputation for
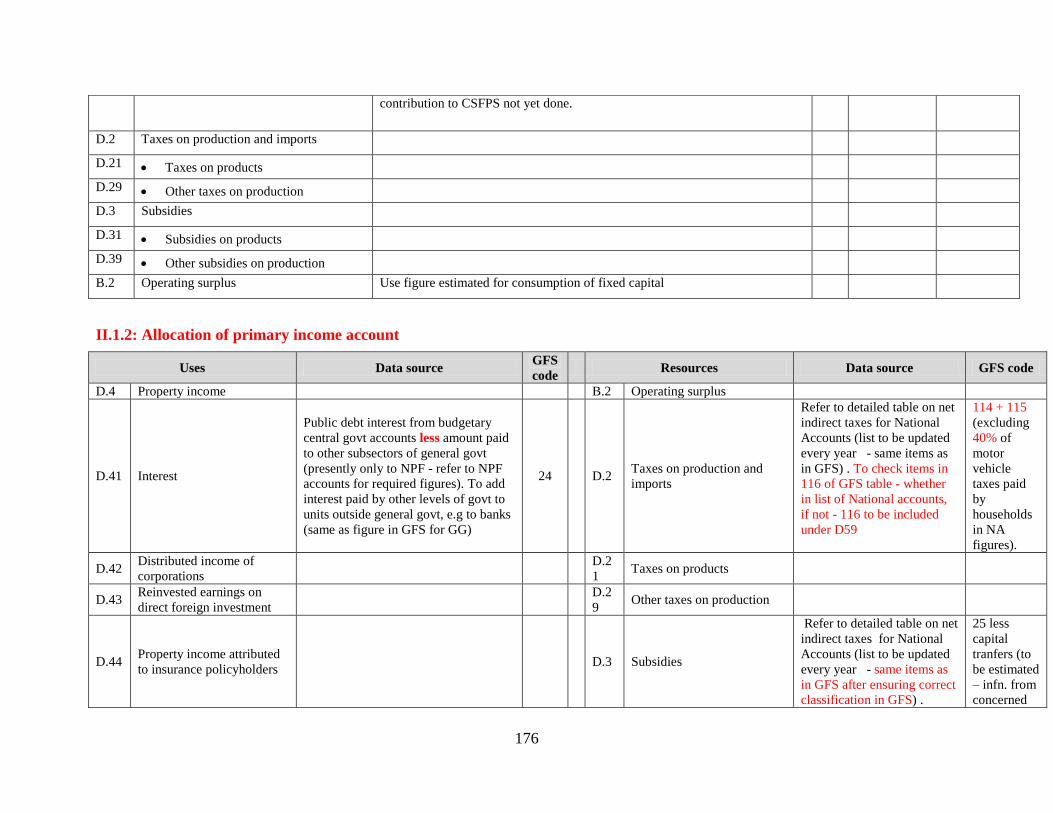
176
II.1.2: Allocation of primary income account
Uses Data source GFS
code Resources Data source GFS code
D.4 Property income B.2 Operating surplus
D.41 Interest
Public debt interest from budgetary
central govt accounts less amount paid
to other subsectors of general govt
(presently only to NPF - refer to NPF
accounts for required figures). To add
interest paid by other levels of govt to
units outside general govt, e.g to banks
(same as figure in GFS for GG)
24 D.2 Taxes on production and
imports
Refer to detailed table on net
indirect taxes for National
Accounts (list to be updated
every year - same items as
in GFS) . To check items in
116 of GFS table - whether
in list of National accounts,
if not - 116 to be included
under D59
114 + 115
(excluding
40% of
motor
vehicle
taxes paid
by
households
in NA
figures).
D.42 Distributed income of
corporations
D.2
1 Taxes on products
D.43 Reinvested earnings on
direct foreign investment
D.2
9 Other taxes on production
D.44 Property income attributed
to insurance policyholders D.3 Subsidies
Refer to detailed table on net
indirect taxes for National
Accounts (list to be updated
every year - same items as
in GFS after ensuring correct
classification in GFS) .
25 less
capital
tranfers (to
be estimated
– infn. from
concerned
contribution to CSFPS not yet done.
D.2 Taxes on production and imports
D.21 Taxes on products
D.29 Other taxes on production
D.3 Subsidies
D.31 Subsidies on products
D.39 Other subsidies on production
B.2 Operating surplus Use figure estimated for consumption of fixed capital
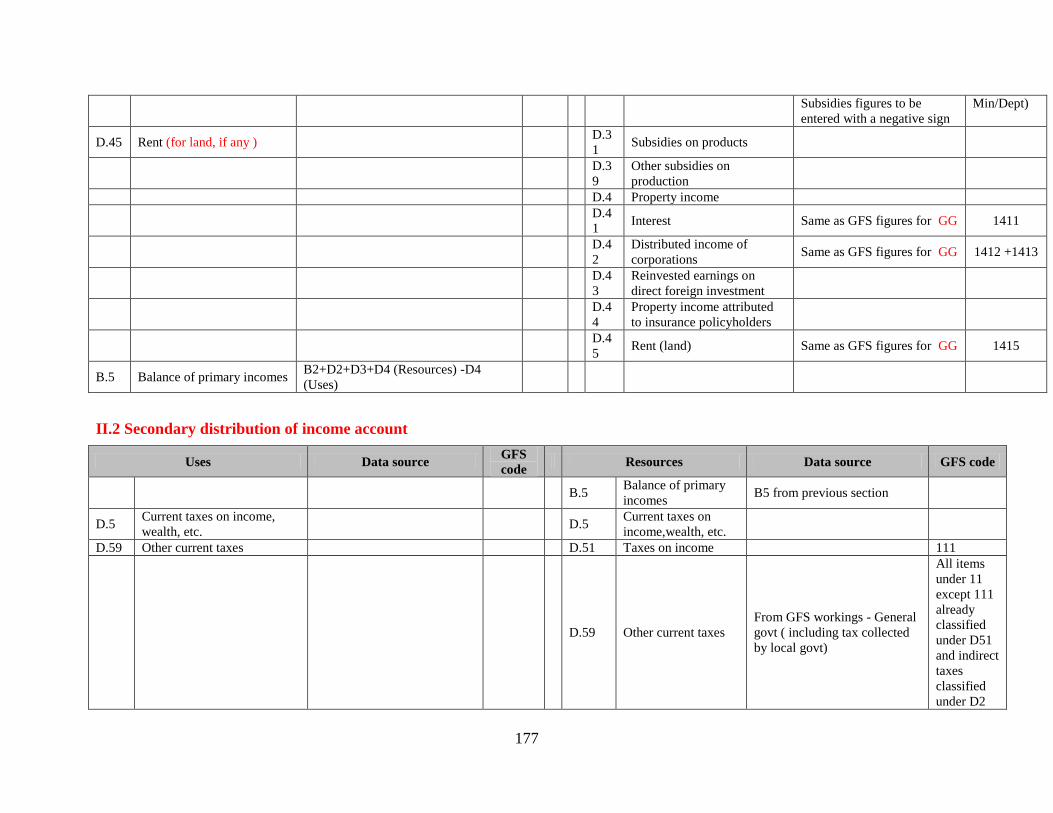
177
Subsidies figures to be
entered with a negative sign
Min/Dept)
D.45 Rent (for land, if any ) D.3
1 Subsidies on products
D.3
9
Other subsidies on
production
D.4 Property income
D.4
1 Interest Same as GFS figures for GG 1411
D.4
2
Distributed income of
corporations Same as GFS figures for GG 1412 +1413
D.4
3
Reinvested earnings on
direct foreign investment
D.4
4
Property income attributed
to insurance policyholders
D.4
5 Rent (land) Same as GFS figures for GG 1415
B.5 Balance of primary incomes B2+D2+D3+D4 (Resources) -D4
(Uses)
II.2 Secondary distribution of income account
Uses Data source GFS
code Resources Data source GFS code
B.5
Balance of primary
incomes B5 from previous section
D.5 Current taxes on income,
wealth, etc. D.5
Current taxes on
income,wealth, etc.
D.59 Other current taxes D.51 Taxes on income 111
D.59 Other current taxes
From GFS workings - General
govt ( including tax collected
by local govt)
All items
under 11
except 111
already
classified
under D51
and indirect
taxes
classified
under D2
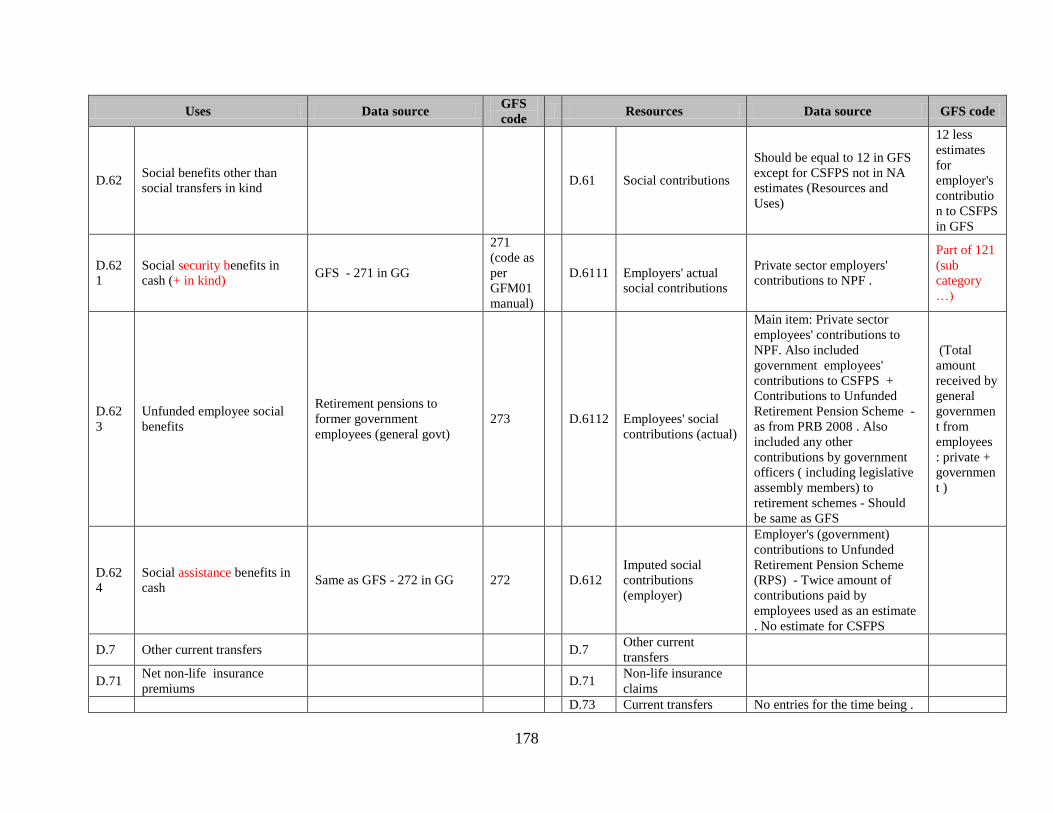
178
Uses Data source GFS
code Resources Data source GFS code
D.62 Social benefits other than
social transfers in kind D.61 Social contributions
Should be equal to 12 in GFS
except for CSFPS not in NA
estimates (Resources and
Uses)
12 less
estimates
for
employer's
contributio
n to CSFPS
in GFS
D.62
1
Social security benefits in
cash (+ in kind) GFS - 271 in GG
271
(code as
per
GFM01
manual)
D.6111
Employers' actual
social contributions
Private sector employers'
contributions to NPF .
Part of 121
(sub
category
…)
D.62
3
Unfunded employee social
benefits
Retirement pensions to
former government
employees (general govt)
273 D.6112
Employees' social
contributions (actual)
Main item: Private sector
employees' contributions to
NPF. Also included
government employees'
contributions to CSFPS +
Contributions to Unfunded
Retirement Pension Scheme -
as from PRB 2008 . Also
included any other
contributions by government
officers ( including legislative
assembly members) to
retirement schemes - Should
be same as GFS
(Total
amount
received by
general
governmen
t from
employees
: private +
governmen
t )
D.62
4
Social assistance benefits in
cash Same as GFS - 272 in GG 272 D.612
Imputed social
contributions
(employer)
Employer's (government)
contributions to Unfunded
Retirement Pension Scheme
(RPS) - Twice amount of
contributions paid by
employees used as an estimate
. No estimate for CSFPS
D.7 Other current transfers D.7 Other current
transfers
D.71 Net non-life insurance
premiums D.71
Non-life insurance
claims
D.73 Current transfers No entries for the time being .
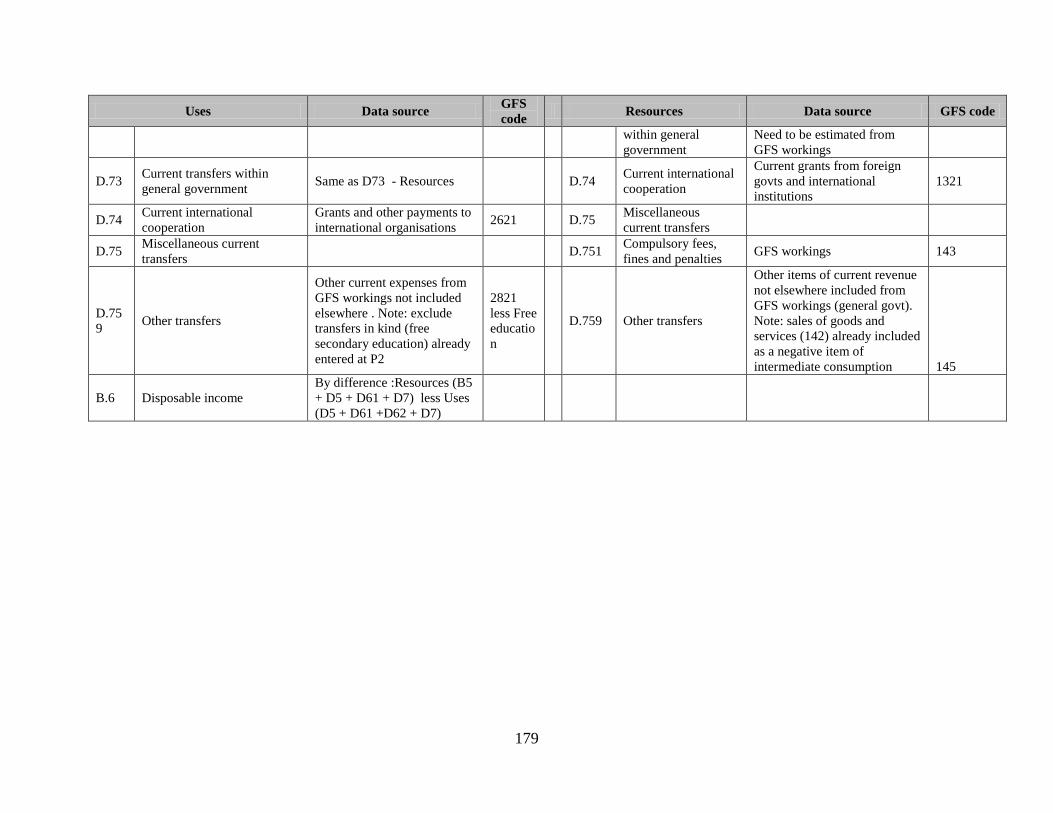
179
Uses Data source GFS
code Resources Data source GFS code
within general
government
Need to be estimated from
GFS workings
D.73 Current transfers within
general government Same as D73 - Resources D.74
Current international
cooperation
Current grants from foreign
govts and international
institutions
1321
D.74 Current international
cooperation
Grants and other payments to
international organisations 2621 D.75
Miscellaneous
current transfers
D.75 Miscellaneous current
transfers D.751
Compulsory fees,
fines and penalties GFS workings 143
D.75
9 Other transfers
Other current expenses from
GFS workings not included
elsewhere . Note: exclude
transfers in kind (free
secondary education) already
entered at P2
2821
less Free
educatio
n
D.759 Other transfers
Other items of current revenue
not elsewhere included from
GFS workings (general govt).
Note: sales of goods and
services (142) already included
as a negative item of
intermediate consumption 145
B.6 Disposable income
By difference :Resources (B5
+ D5 + D61 + D7) less Uses
(D5 + D61 +D62 + D7)
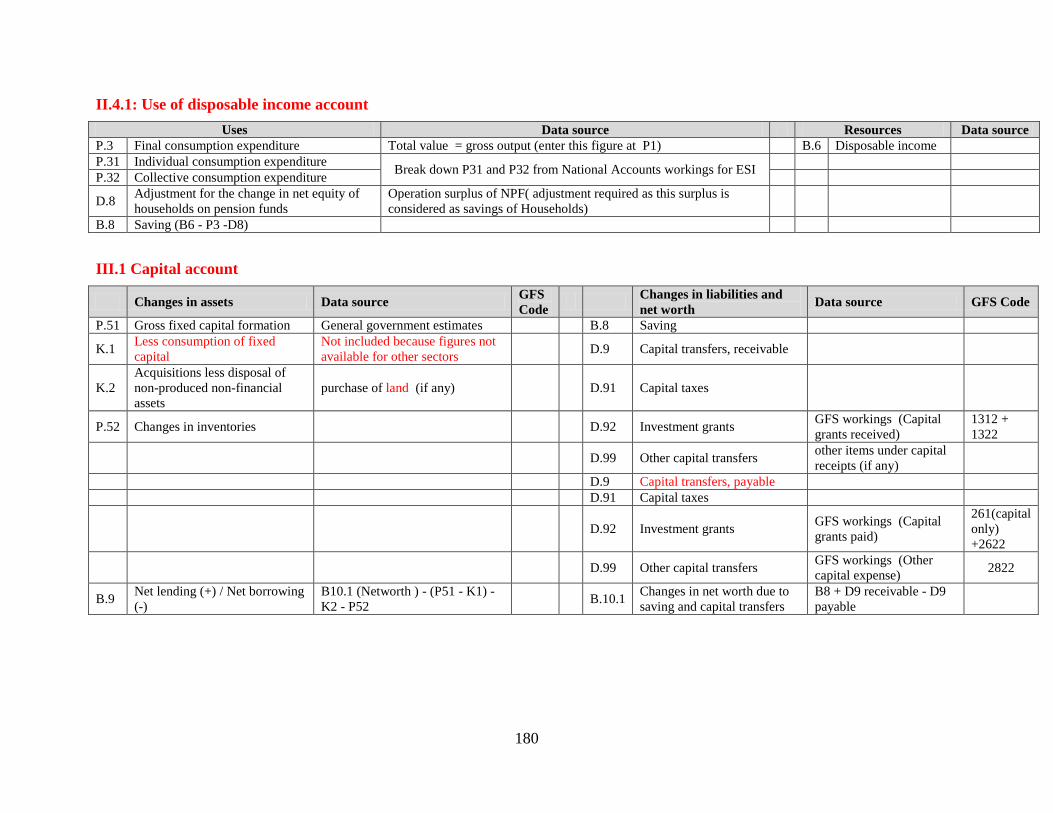
180
II.4.1: Use of disposable income account
Uses Data source Resources Data source
P.3 Final consumption expenditure Total value = gross output (enter this figure at P1) B.6 Disposable income
P.31 Individual consumption expenditure Break down P31 and P32 from National Accounts workings for ESI
P.32 Collective consumption expenditure
D.8 Adjustment for the change in net equity of
households on pension funds
Operation surplus of NPF( adjustment required as this surplus is
considered as savings of Households)
B.8 Saving (B6 - P3 -D8)
III.1 Capital account
Changes in assets Data source GFS
Code
Changes in liabilities and
net worth Data source GFS Code
P.51 Gross fixed capital formation General government estimates B.8 Saving
K.1 Less consumption of fixed
capital
Not included because figures not
available for other sectors D.9 Capital transfers, receivable
K.2
Acquisitions less disposal of
non-produced non-financial
assets
purchase of land (if any) D.91 Capital taxes
P.52 Changes in inventories D.92 Investment grants GFS workings (Capital
grants received)
1312 +
1322
D.99 Other capital transfers other items under capital
receipts (if any)
D.9 Capital transfers, payable
D.91 Capital taxes
D.92 Investment grants GFS workings (Capital
grants paid)
261(capital
only)
+2622
D.99 Other capital transfers GFS workings (Other
capital expense) 2822
B.9 Net lending (+) / Net borrowing
(-)
B10.1 (Networth ) - (P51 - K1) -
K2 - P52 B.10.1
Changes in net worth due to
saving and capital transfers
B8 + D9 receivable - D9
payable
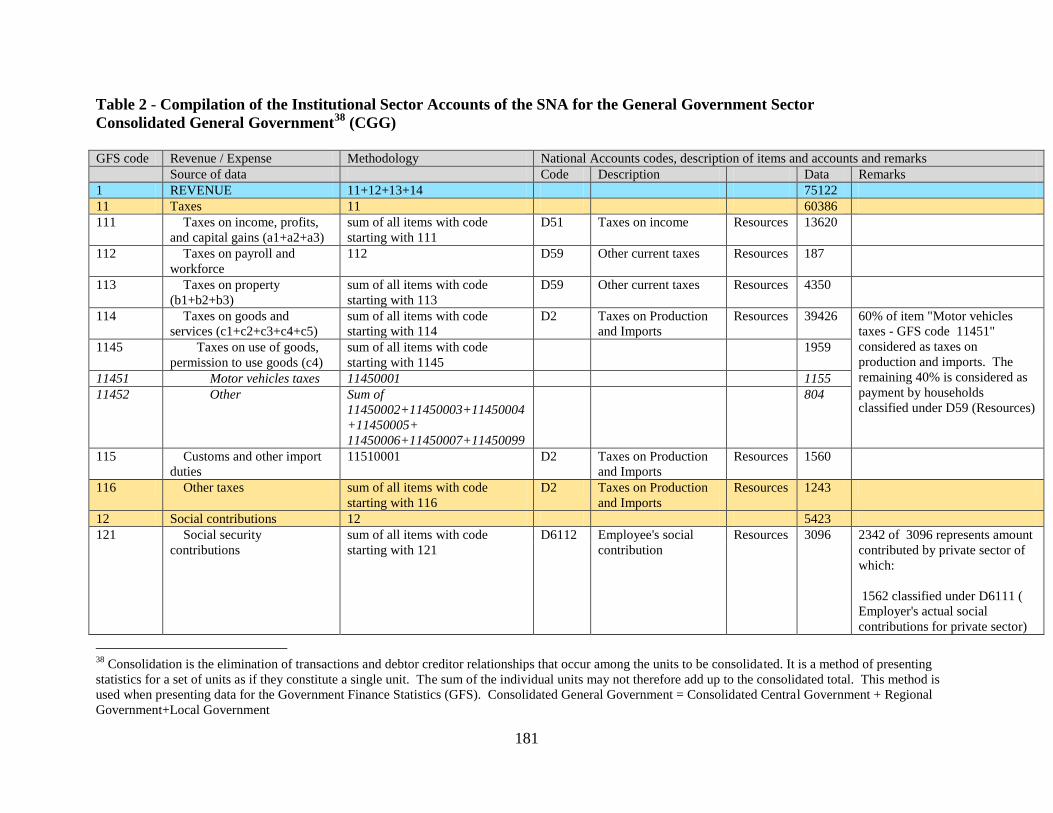
181
Table 2 - Compilation of the Institutional Sector Accounts of the SNA for the General Government Sector
Consolidated General Government38
(CGG)
GFS code Revenue / Expense Methodology National Accounts codes, description of items and accounts and remarks
Source of data Code Description Data Remarks
1 REVENUE 11+12+13+14 75122
11 Taxes 11 60386
111 Taxes on income, profits,
and capital gains (a1+a2+a3)
sum of all items with code
starting with 111
D51 Taxes on income Resources 13620
112 Taxes on payroll and
workforce
112 D59 Other current taxes Resources 187
113 Taxes on property
(b1+b2+b3)
sum of all items with code
starting with 113
D59 Other current taxes Resources 4350
114 Taxes on goods and
services (c1+c2+c3+c4+c5)
sum of all items with code
starting with 114
D2 Taxes on Production
and Imports
Resources 39426 60% of item "Motor vehicles
taxes - GFS code 11451"
considered as taxes on
production and imports. The
remaining 40% is considered as
payment by households
classified under D59 (Resources)
1145 Taxes on use of goods,
permission to use goods (c4)
sum of all items with code
starting with 1145
1959
11451 Motor vehicles taxes 11450001 1155
11452 Other Sum of
11450002+11450003+11450004
+11450005+
11450006+11450007+11450099
804
115 Customs and other import
duties
11510001 D2 Taxes on Production
and Imports
Resources 1560
116 Other taxes sum of all items with code
starting with 116
D2 Taxes on Production
and Imports
Resources 1243
12 Social contributions 12 5423
121 Social security
contributions
sum of all items with code
starting with 121
D6112 Employee's social
contribution
Resources 3096 2342 of 3096 represents amount
contributed by private sector of
which:
1562 classified under D6111 (
Employer's actual social
contributions for private sector)
38
Consolidation is the elimination of transactions and debtor creditor relationships that occur among the units to be consolidated. It is a method of presenting
statistics for a set of units as if they constitute a single unit. The sum of the individual units may not therefore add up to the consolidated total. This method is
used when presenting data for the Government Finance Statistics (GFS). Consolidated General Government = Consolidated Central Government + Regional
Government+Local Government
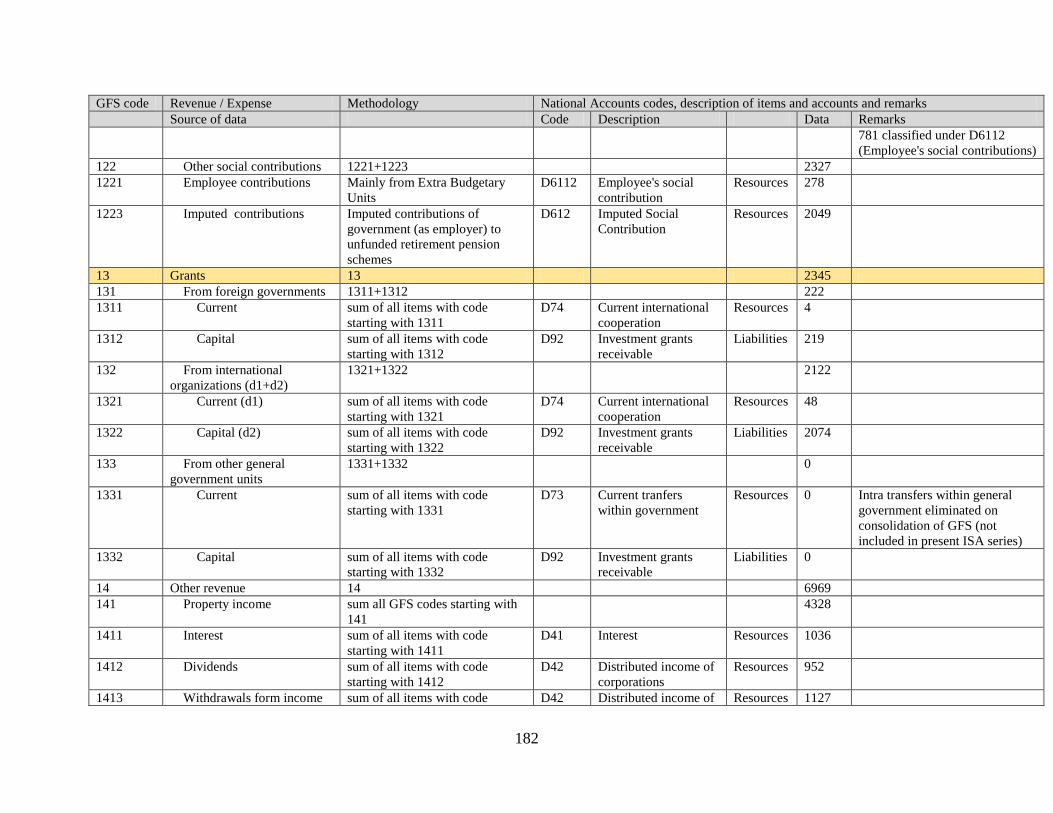
182
GFS code Revenue / Expense Methodology National Accounts codes, description of items and accounts and remarks
Source of data Code Description Data Remarks
781 classified under D6112
(Employee's social contributions)
122 Other social contributions 1221+1223 2327
1221 Employee contributions Mainly from Extra Budgetary
Units
D6112 Employee's social
contribution
Resources 278
1223 Imputed contributions Imputed contributions of
government (as employer) to
unfunded retirement pension
schemes
D612 Imputed Social
Contribution
Resources 2049
13 Grants 13 2345
131 From foreign governments 1311+1312 222
1311 Current sum of all items with code
starting with 1311
D74 Current international
cooperation
Resources 4
1312 Capital sum of all items with code
starting with 1312
D92 Investment grants
receivable
Liabilities 219
132 From international
organizations (d1+d2)
1321+1322 2122
1321 Current (d1) sum of all items with code
starting with 1321
D74 Current international
cooperation
Resources 48
1322 Capital (d2) sum of all items with code
starting with 1322
D92 Investment grants
receivable
Liabilities 2074
133 From other general
government units
1331+1332 0
1331 Current sum of all items with code
starting with 1331
D73 Current tranfers
within government
Resources 0 Intra transfers within general
government eliminated on
consolidation of GFS (not
included in present ISA series)
1332 Capital sum of all items with code
starting with 1332
D92 Investment grants
receivable
Liabilities 0
14 Other revenue 14 6969
141 Property income sum all GFS codes starting with
141
4328
1411 Interest sum of all items with code
starting with 1411
D41 Interest Resources 1036
1412 Dividends sum of all items with code
starting with 1412
D42 Distributed income of
corporations
Resources 952
1413 Withdrawals form income sum of all items with code D42 Distributed income of Resources 1127
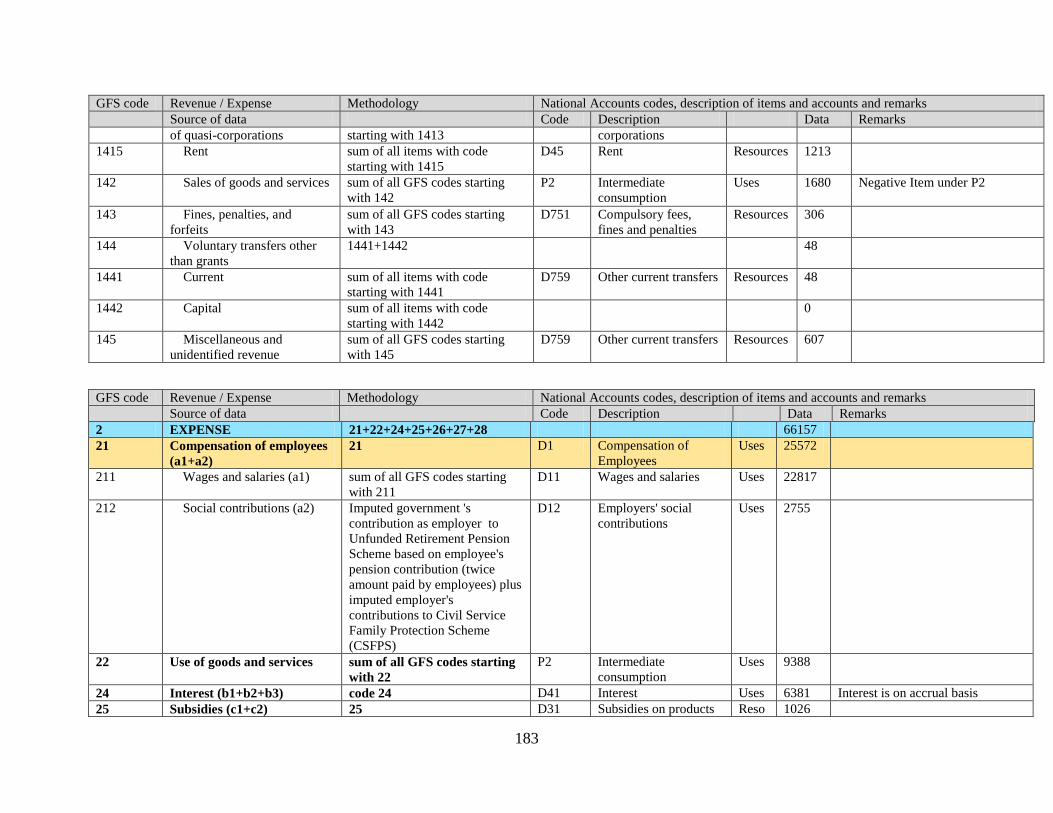
183
GFS code Revenue / Expense Methodology National Accounts codes, description of items and accounts and remarks
Source of data Code Description Data Remarks
of quasi-corporations starting with 1413 corporations
1415 Rent sum of all items with code
starting with 1415
D45 Rent Resources 1213
142 Sales of goods and services sum of all GFS codes starting
with 142
P2 Intermediate
consumption
Uses 1680 Negative Item under P2
143 Fines, penalties, and
forfeits
sum of all GFS codes starting
with 143
D751 Compulsory fees,
fines and penalties
Resources 306
144 Voluntary transfers other
than grants
1441+1442 48
1441 Current sum of all items with code
starting with 1441
D759 Other current transfers Resources 48
1442 Capital sum of all items with code
starting with 1442
0
145 Miscellaneous and
unidentified revenue
sum of all GFS codes starting
with 145
D759 Other current transfers Resources 607
GFS code Revenue / Expense Methodology National Accounts codes, description of items and accounts and remarks
Source of data Code Description Data Remarks
2 EXPENSE 21+22+24+25+26+27+28 66157
21 Compensation of employees
(a1+a2)
21 D1 Compensation of
Employees
Uses 25572
211 Wages and salaries (a1) sum of all GFS codes starting
with 211
D11 Wages and salaries Uses 22817
212 Social contributions (a2) Imputed government 's
contribution as employer to
Unfunded Retirement Pension
Scheme based on employee's
pension contribution (twice
amount paid by employees) plus
imputed employer's
contributions to Civil Service
Family Protection Scheme
(CSFPS)
D12 Employers' social
contributions
Uses 2755
22 Use of goods and services sum of all GFS codes starting
with 22
P2 Intermediate
consumption
Uses 9388
24 Interest (b1+b2+b3) code 24 D41 Interest Uses 6381 Interest is on accrual basis
25 Subsidies (c1+c2) 25 D31 Subsidies on products Reso 1026
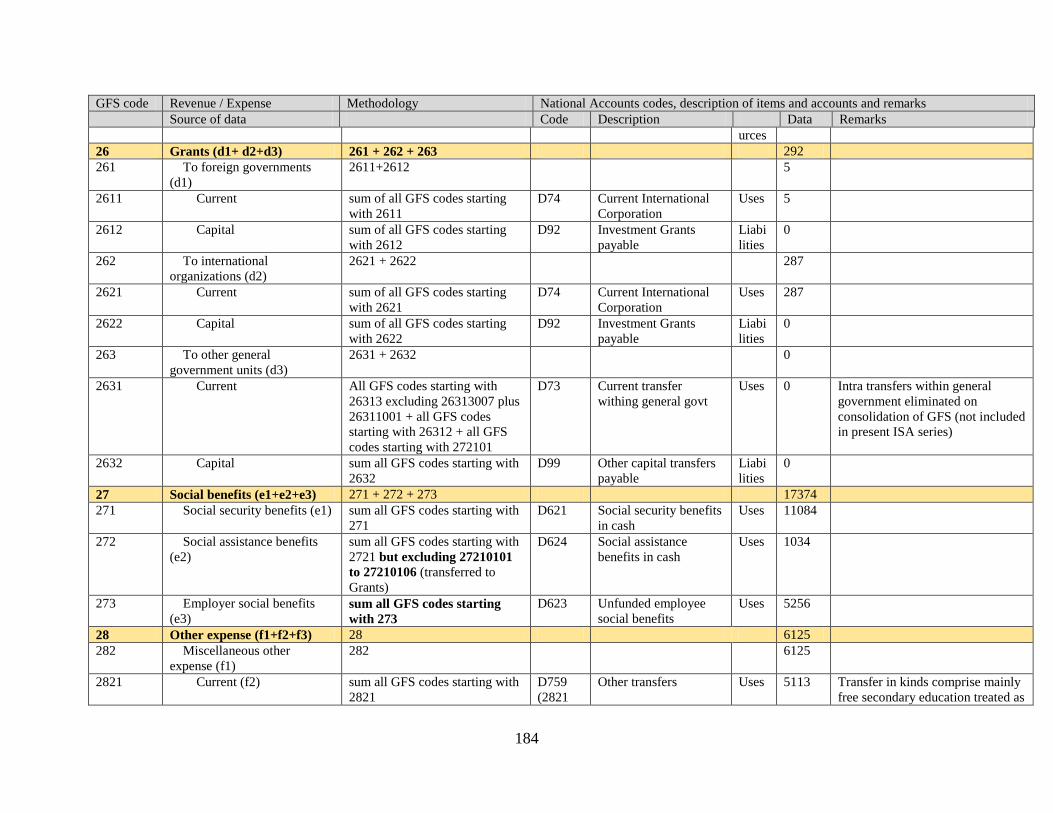
184
GFS code Revenue / Expense Methodology National Accounts codes, description of items and accounts and remarks
Source of data Code Description Data Remarks
urces
26 Grants (d1+ d2+d3) 261 + 262 + 263 292
261 To foreign governments
(d1)
2611+2612 5
2611 Current sum of all GFS codes starting
with 2611
D74 Current International
Corporation
Uses 5
2612 Capital sum of all GFS codes starting
with 2612
D92 Investment Grants
payable
Liabi
lities
0
262 To international
organizations (d2)
2621 + 2622 287
2621 Current sum of all GFS codes starting
with 2621
D74 Current International
Corporation
Uses 287
2622 Capital sum of all GFS codes starting
with 2622
D92 Investment Grants
payable
Liabi
lities
0
263 To other general
government units (d3)
2631 + 2632 0
2631 Current All GFS codes starting with
26313 excluding 26313007 plus
26311001 + all GFS codes
starting with 26312 + all GFS
codes starting with 272101
D73 Current transfer
withing general govt
Uses 0 Intra transfers within general
government eliminated on
consolidation of GFS (not included
in present ISA series)
2632 Capital sum all GFS codes starting with
2632
D99 Other capital transfers
payable
Liabi
lities
0
27 Social benefits (e1+e2+e3) 271 + 272 + 273 17374
271 Social security benefits (e1) sum all GFS codes starting with
271
D621 Social security benefits
in cash
Uses 11084
272 Social assistance benefits
(e2)
sum all GFS codes starting with
2721 but excluding 27210101
to 27210106 (transferred to
Grants)
D624 Social assistance
benefits in cash
Uses 1034
273 Employer social benefits
(e3) sum all GFS codes starting
with 273
D623 Unfunded employee
social benefits
Uses 5256
28 Other expense (f1+f2+f3) 28 6125
282 Miscellaneous other
expense (f1)
282 6125
2821 Current (f2) sum all GFS codes starting with
2821
D759
(2821
Other transfers Uses 5113 Transfer in kinds comprise mainly
free secondary education treated as
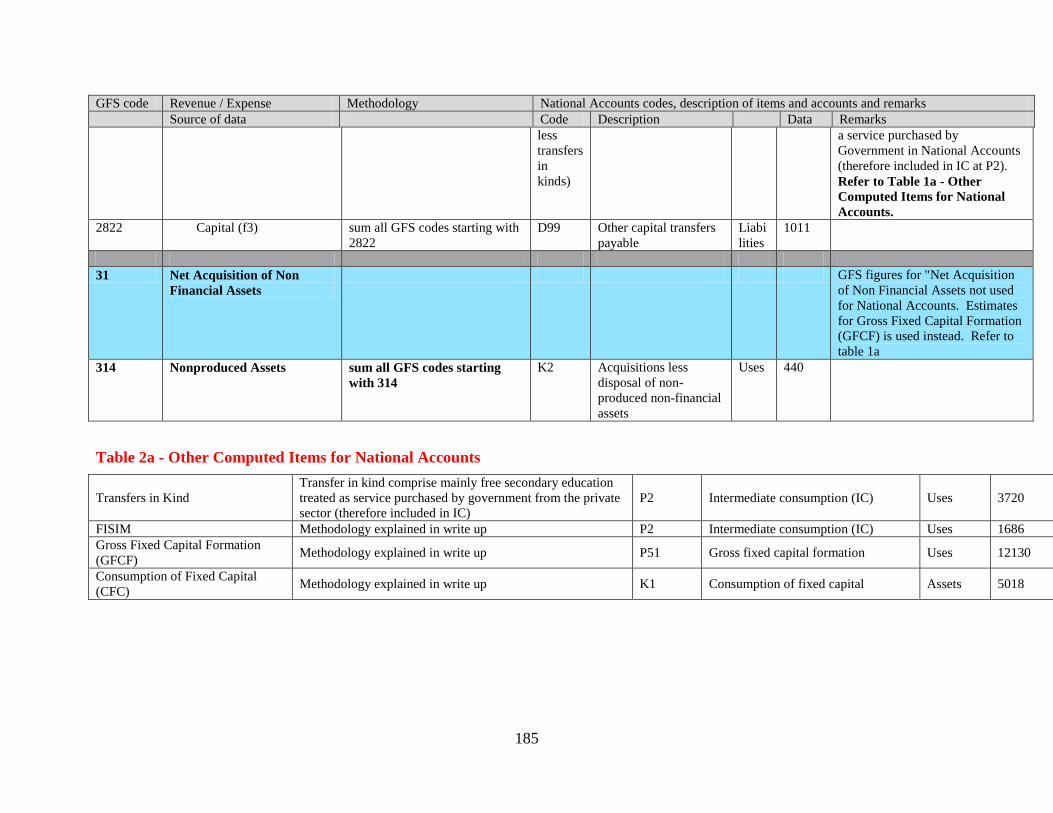
185
GFS code Revenue / Expense Methodology National Accounts codes, description of items and accounts and remarks
Source of data Code Description Data Remarks
less
transfers
in
kinds)
a service purchased by
Government in National Accounts
(therefore included in IC at P2).
Refer to Table 1a - Other
Computed Items for National
Accounts.
2822 Capital (f3) sum all GFS codes starting with
2822
D99 Other capital transfers
payable
Liabi
lities
1011
31 Net Acquisition of Non
Financial Assets
GFS figures for "Net Acquisition
of Non Financial Assets not used
for National Accounts. Estimates
for Gross Fixed Capital Formation
(GFCF) is used instead. Refer to
table 1a
314 Nonproduced Assets sum all GFS codes starting
with 314
K2 Acquisitions less
disposal of non-
produced non-financial
assets
Uses 440
Table 2a - Other Computed Items for National Accounts
Transfers in Kind
Transfer in kind comprise mainly free secondary education
treated as service purchased by government from the private
sector (therefore included in IC)
P2 Intermediate consumption (IC) Uses 3720
FISIM Methodology explained in write up P2 Intermediate consumption (IC) Uses 1686
Gross Fixed Capital Formation
(GFCF) Methodology explained in write up P51 Gross fixed capital formation Uses 12130
Consumption of Fixed Capital
(CFC) Methodology explained in write up K1 Consumption of fixed capital Assets 5018
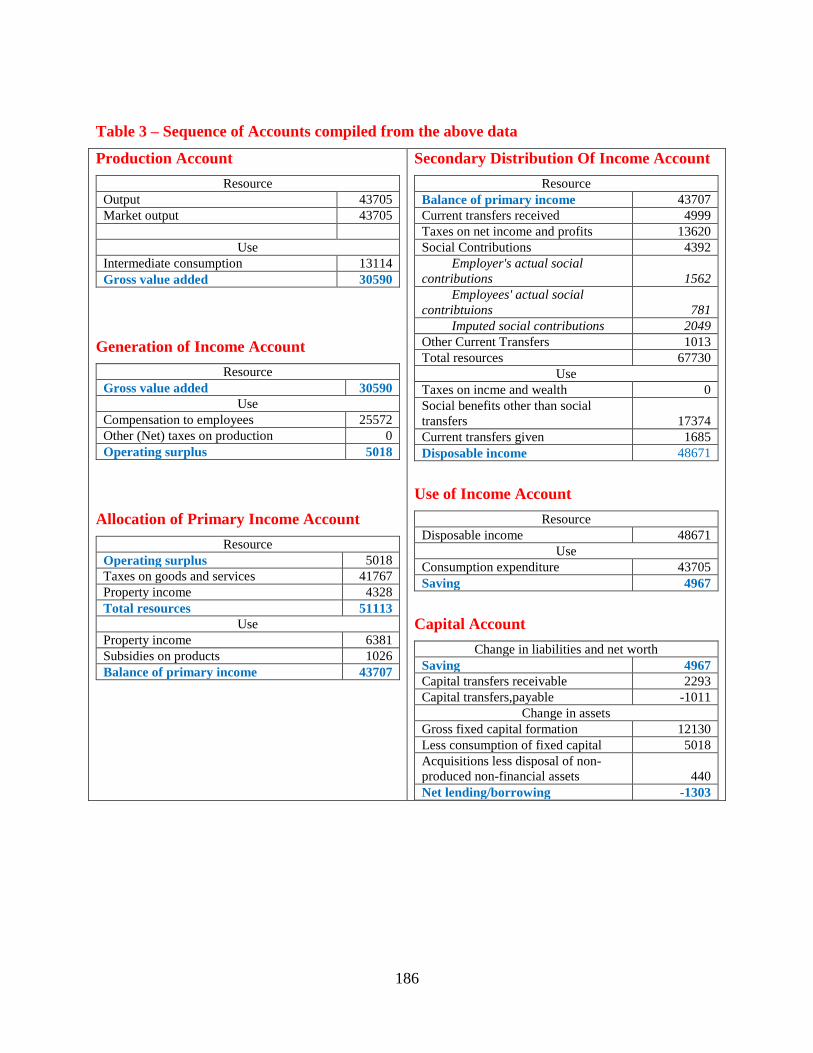
186
Table 3 – Sequence of Accounts compiled from the above data
Production Account
Resource
Output 43705
Market output 43705
Use
Intermediate consumption 13114
Gross value added 30590
Generation of Income Account
Resource
Gross value added 30590
Use
Compensation to employees 25572
Other (Net) taxes on production 0
Operating surplus 5018
Allocation of Primary Income Account
Resource
Operating surplus 5018
Taxes on goods and services 41767
Property income 4328
Total resources 51113
Use
Property income 6381
Subsidies on products 1026
Balance of primary income 43707
Secondary Distribution Of Income Account
Resource
Balance of primary income 43707
Current transfers received 4999
Taxes on net income and profits 13620
Social Contributions 4392
Employer's actual social
contributions 1562
Employees' actual social
contribtuions 781
Imputed social contributions 2049
Other Current Transfers 1013
Total resources 67730
Use
Taxes on incme and wealth 0
Social benefits other than social
transfers 17374
Current transfers given 1685
Disposable income 48671
Use of Income Account
Resource
Disposable income 48671
Use
Consumption expenditure 43705
Saving 4967
Capital Account
Change in liabilities and net worth
Saving 4967
Capital transfers receivable 2293
Capital transfers,payable -1011
Change in assets
Gross fixed capital formation 12130
Less consumption of fixed capital 5018
Acquisitions less disposal of non-
produced non-financial assets 440
Net lending/borrowing -1303
187
Mozambique: “The use of data sources for compiling National Accounts”
Introduction
Mozambique compiles national accounts according to the United Nations procedures since 1991.
Before, for historical reasons was not possible to accomplish with the SNA requirements.
Since the country decided to engage on the SNA, with the assistance of the UN experts in
National accounts, we follow the recommendations as much as possible according to what we
have available in terms of statistical data.
The National Institute of Statistics is by law, the producer of official statistics. It conducts census
and surveys. The periodicity depends on the nature of the operation and it can be monthly, yearly
and every ten years.
Besides the Census and surveys, we do use administrative data for our compilations. Every
report produced by the ministries (example, annual fishing report; Reports on cotton production;
Annual reports on mineral resources, etc.), has to be send to the National institute of statistics
and is incorporates in the accounts.
Specific studies that are of the importance for statistics are also utilized in the NSI.
Government accounts
For the case of Mozambique, Government sector accounts are composed by the Central
Government sector accounts, S131, Local Administration accounts, S132 and Social Security
funds account, S133.
Central Government Sector (S131)
The main data sources for the compilation of government accounts are the Annual State Budget
Report and the General State Account. Both reports belong to the Ministry of Finance.
The Budget Report is an official document that describes the execution of the state budget
and the finance activity result for the year in reference.
This, constitutes the guarantee for the definitive information regarding what was done for certain
period of time by the state (nation)
It is composed by four parts:
The first one, is in charge to do the general analysis of different polices from the various
areas of development of the country; it establishes parallelism with the global context.
Further, it analysis data regarding management and budget equilibrium, the revenues
(comparing with the annual forecasting and the collection in the same period of previous year
and showing clearly the revenues coming from the diverse services and distrital
administration), Financing the deficit by the source and nature, Operation expenditures,
Financial operations, among others;
The second is composed by Budget execution maps , subdivided into global maps, state
revenue maps and maps for the financing deficit , summary maps for the operational
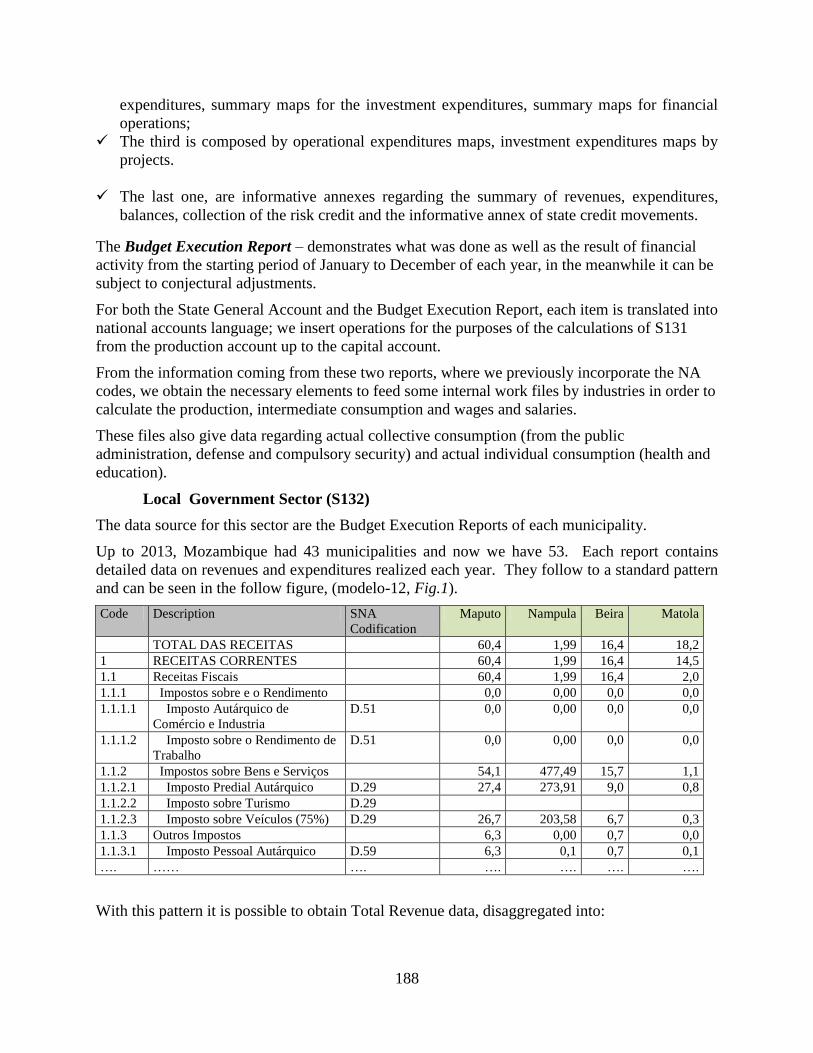
188
expenditures, summary maps for the investment expenditures, summary maps for financial
operations;
The third is composed by operational expenditures maps, investment expenditures maps by
projects.
The last one, are informative annexes regarding the summary of revenues, expenditures,
balances, collection of the risk credit and the informative annex of state credit movements.
The Budget Execution Report – demonstrates what was done as well as the result of financial
activity from the starting period of January to December of each year, in the meanwhile it can be
subject to conjectural adjustments.
For both the State General Account and the Budget Execution Report, each item is translated into
national accounts language; we insert operations for the purposes of the calculations of S131
from the production account up to the capital account.
From the information coming from these two reports, where we previously incorporate the NA
codes, we obtain the necessary elements to feed some internal work files by industries in order to
calculate the production, intermediate consumption and wages and salaries.
These files also give data regarding actual collective consumption (from the public
administration, defense and compulsory security) and actual individual consumption (health and
education).
Local Government Sector (S132)
The data source for this sector are the Budget Execution Reports of each municipality.
Up to 2013, Mozambique had 43 municipalities and now we have 53. Each report contains
detailed data on revenues and expenditures realized each year. They follow to a standard pattern
and can be seen in the follow figure, (modelo-12, Fig.1).
Code Description SNA
Codification
Maputo Nampula Beira Matola
TOTAL DAS RECEITAS 60,4 1,99 16,4 18,2
1 RECEITAS CORRENTES 60,4 1,99 16,4 14,5
1.1 Receitas Fiscais 60,4 1,99 16,4 2,0
1.1.1 Impostos sobre e o Rendimento 0,0 0,00 0,0 0,0
1.1.1.1 Imposto Autárquico de
Comércio e Industria
D.51 0,0 0,00 0,0 0,0
1.1.1.2 Imposto sobre o Rendimento de
Trabalho
D.51 0,0 0,00 0,0 0,0
1.1.2 Impostos sobre Bens e Serviços 54,1 477,49 15,7 1,1
1.1.2.1 Imposto Predial Autárquico D.29 27,4 273,91 9,0 0,8
1.1.2.2 Imposto sobre Turismo D.29
1.1.2.3 Imposto sobre Veículos (75%) D.29 26,7 203,58 6,7 0,3
1.1.3 Outros Impostos 6,3 0,00 0,7 0,0
1.1.3.1 Imposto Pessoal Autárquico D.59 6,3 0,1 0,7 0,1
…. …… …. …. …. …. ….
With this pattern it is possible to obtain Total Revenue data, disaggregated into:
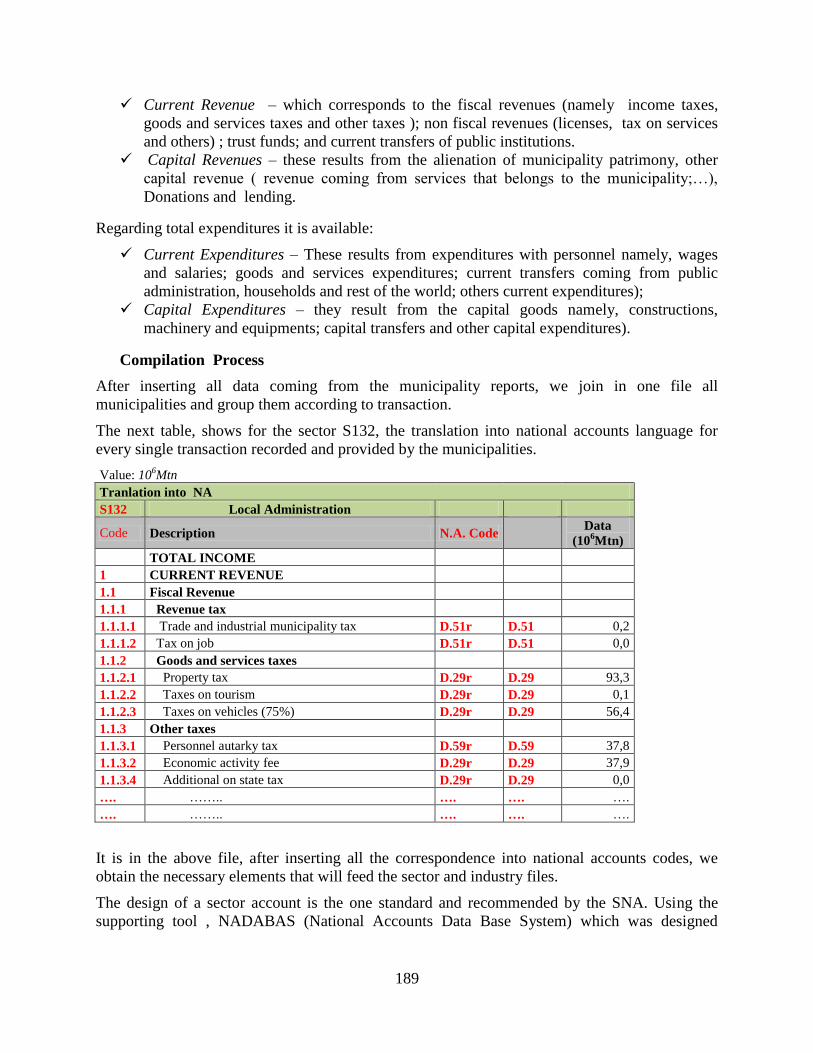
189
Current Revenue – which corresponds to the fiscal revenues (namely income taxes,
goods and services taxes and other taxes ); non fiscal revenues (licenses, tax on services
and others) ; trust funds; and current transfers of public institutions.
Capital Revenues – these results from the alienation of municipality patrimony, other
capital revenue ( revenue coming from services that belongs to the municipality;…),
Donations and lending.
Regarding total expenditures it is available:
Current Expenditures – These results from expenditures with personnel namely, wages
and salaries; goods and services expenditures; current transfers coming from public
administration, households and rest of the world; others current expenditures);
Capital Expenditures – they result from the capital goods namely, constructions,
machinery and equipments; capital transfers and other capital expenditures).
Compilation Process
After inserting all data coming from the municipality reports, we join in one file all
municipalities and group them according to transaction.
The next table, shows for the sector S132, the translation into national accounts language for
every single transaction recorded and provided by the municipalities.
Value: 106Mtn
Tranlation into NA
S132 Local Administration
Code Description N.A. Code
Data
(106Mtn)
TOTAL INCOME
1 CURRENT REVENUE
1.1 Fiscal Revenue
1.1.1 Revenue tax
1.1.1.1 Trade and industrial municipality tax D.51r D.51 0,2
1.1.1.2 Tax on job D.51r D.51 0,0
1.1.2 Goods and services taxes
1.1.2.1 Property tax D.29r D.29 93,3
1.1.2.2 Taxes on tourism D.29r D.29 0,1
1.1.2.3 Taxes on vehicles (75%) D.29r D.29 56,4
1.1.3 Other taxes
1.1.3.1 Personnel autarky tax D.59r D.59 37,8
1.1.3.2 Economic activity fee D.29r D.29 37,9
1.1.3.4 Additional on state tax D.29r D.29 0,0
…. …….. …. …. ….
…. …….. …. …. ….
It is in the above file, after inserting all the correspondence into national accounts codes, we
obtain the necessary elements that will feed the sector and industry files.
The design of a sector account is the one standard and recommended by the SNA. Using the
supporting tool , NADABAS (National Accounts Data Base System) which was designed
190
especially for crossing a lot of files with, the national accounts technicians work on industrial
and institutional sector files. Any adjustment is done directly in the file.
Niger: “Use of Administrative Data Sources in the Compilation of National Accounts
Introduction
Niger has a long experience in elaborating national accounts. Since the transformation of the
Directorate of Statistics and National Accounts into the National Institute of Statistics (NIS) in
2004, important improvements have been made in the compilation of national accounts both in
terms of quality and regularity. Since then, the annual national accounts are published twice a
year, first in April (quick accounts for year n-1) and then in November (final accounts for year n-
2, forecasts for year n-1, and estimations for the on-going year). Each of these publications
includes principal tables recommended by the United Nations. These publications are available
at the website: www.ins.ne.
Niger uses the 1993 SNA with some adaptations for the local economic realities, but staying in
the global framework recommended by AFRISTAT and ECOWAS. Supply data is provided by
institutional sectors, while supply-use equilibriums are provided by principal products. In
particular, the Division of National Accounts is in charge of compiling national accounts.
In addition, Niger is continuing exploring quarterly accounts that have not yet been published.
It should be noted that the Law Nb. 2004-011 regarding the organisation of economic activities
obliges public and private organisations to forward their statistical and accounting data by 30
April of every n year for the exercise covering year n-1.
The present document summarises the methodologies used by Niger to compile national
accounts, in particular, by using the following administrative sources:
1. General government;
2. Financial enterprises;
3. Non-financial enterprises;
4. Balance of payments.

191
I. GENERAL GOVERNMENT
General government accounts are usually produced according to the nature of the following
available data sources:
General budget of the state;
State Finance Operations Tables (SFOT);
National treasury;
State investment budget;
Local governments‘ accounting documents;
Documents from the national social security fund;
Documents from the national pension fund;
Accounting documents of administrative public institutions;
Documents of the non-profit institutions serving households (NPISHs).
These documents are provided in paper form, apart from the general budget that is provided by
the Directorate General of Budget in both paper and electronic format. The budget has the
advantage of giving more details about both the revenues and the expenses, while the SFOT is
more exhaustive but les detailed than the budget. Therefore, the data is harmonised each year.
Regarding the delays in the transmission of data, even if it is easy to acquire the budget or the
SFOT within reasonable deadline, this is not the case for the local governments and public
institutions, where the non-response rate is fairly high – sometimes reaching 60%. Therefore,
adjustments are made for these local authorities and institutions.
The coding of revenue and expense operations is similar to the working framework used in the
ERETES module, which is in line with the 1993 SNA.
The administrative public institutions (called special accounts of the Treasury) are entities
receiving transfers and subsidies from the state, but their accounts are not detailed in the budget.
Their objectives are in the public‘s interest and not profit-seeking, and consequently, they are
treated as non-commercial entities with zero net operating income.
The detailed bridging tables show how the aggregates are transformed from public accounting to
national accounting.
192
Apart from these entities, non-profit institutions serving households should be also added.
Special surveys carried out on a sample of these institutions help to estimate the whole of the
NPISHs sector.
The strong mobility of NGOs and associations and the difficulty to get their accounting files
makes difficult to evaluate this sub-sector. With AfDB funds, two surveys conducted with a
sample from this sector were carried out. Even though they resulted in accounting data for
certain NGOs and associations, they did not allow collecting an exhaustive database, nor
accounts that are credible enough for this sub-sector, mainly due to the very limited resources to
carry out the surveys.
Particular cases:
Fixed capital consumption is calculated by a method consisting of a long series of gross
fixed capital formation (GFCF – at current and constant prices) with their indexes,
assuming average lifetime and low price variation and by deducing the arithmetic mean
of GFCF.
Capital expenses are calculated according to a spreading method obtained based on a
certain number of projects with known activities included in the document called ―state
investment budget‖. This is partly about external aid (reimbursable and non-reimbursable
aid) in line with the 1993 SNA. Also, this procedure includes for each different type of
aid measures, the calculation of shares that finance investments, operating costs and
human resource costs. Nevertheless, the management of the projects out of state-control
(directly managed projects) complicate the accounting task of understanding the whole of
external aid-related activities.
II. FINANCIAL ENTERPRISES
Financial enterprises provide banking and insurance services.
In Niger, Central Bank accounts are not integrated in the compilation of the GDP. Despite
multiple actions undertaken by the NIS to obtain the accounting data of the National Agency of
the Central Bank of West African States for Niger, no progress has been made yet.
Regarding commercial banks, banking services include banking commissions and financial
intermediation services that are measured by the difference between the received and paid
interests. The consumption of financial intermediation services is attributed to a fictive branch.
193
In the case of these banks, the individual documents are collected by the NIS each year, often,
with considerable delay. The bridging method is attached. It should be noted, however, that the
accounting documents are not always presented at the same way, and they are not detailed – for
example in the case of credit grants by activity branch, that could serve eventually to the division
of the indirectly measured financial intermediation services (SIFIM). In addition, a large part of
micro finance companies do not reply or only reply with the partial statistical information that
would be necessary for the compilation of capital accounts. For all these reasons, the accounts
are adjusted by estimating the non-replies by the help of certain tendency indicators or by the
help of an average account for the institutions that have not replied.
The accounting documents of insurance companies are collected directly by the NIS from the
companies. Insurance production is estimated on the basis of primes obtained, net revenues from
the placement of reserves, due claims, and the variation in the life insurance reserves. Here as
well there are non-responses and we proceed the same way as with the commercial banks.
It should be noted that the Ministry of Finance is a precious source for accounting information
about financial enterprises, even though the documents arrive to NIS with delay. But they have
the advantage of providing an exhaustive global picture that helps to recalculate certain
estimations or make some adjustments.
III. NON-FINANCIAL ENTERPRISES
The data is achieved by processing companies‘ accounting documents collected by the NIS and
that are in line with the West African Accounting System.
However may be the performance of a statistical services, it is not possible to obtain all the
information concerning the companies. Therefore, companies in bankruptcy are estimated by
certain number of evolving indicators by activity branch for a sample of companies who replied
for year n-1 and n. The retained criterion is the output or revenue and the extreme values are
removed.
Enterprises of the modern sector are characterized by strong mobility (establishment,
disappearance). Despite the existence of an enterprise repertory, giving the right number of
companies who carry out a given activity during a year is a major challenge, due to the eternal
problem of non-response, principal activities, and the inaccurate filling of accounting documents
of certain companies.

194
The data about non-financial companies are obtained essentially by companies‘ accounting
documents. In all the ECOWAS Member States, a correspondence has been established between
the categories of corporate accounting and national accounting.
IV. BALANCE OF PAYMENTS
External transactions are treated with the balance of payments, provided by the Central Bank, by
using a joint bridge table. For the balance of products the detailed external trade statistics of the
NIS are used. The data is harmonised with the Central Bank data, which has the advantage of
including the non-registered external trade. Balance of payments data are provided in the form of
both hard and soft copy.
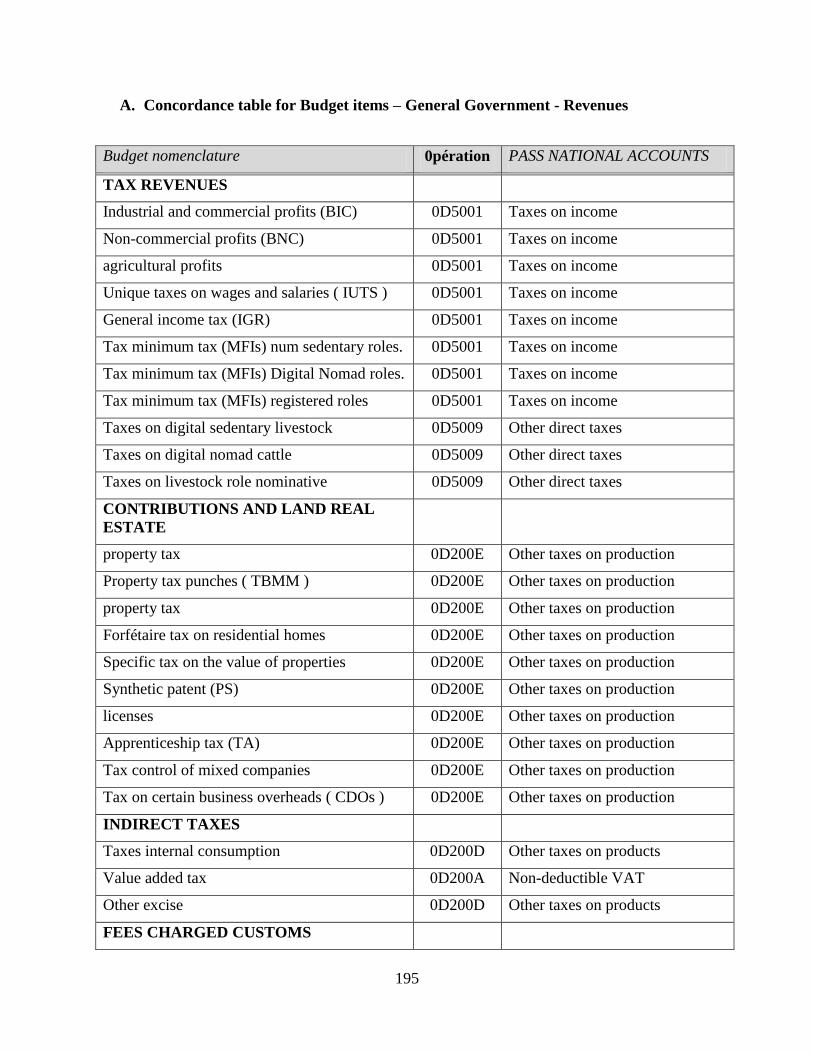
195
A. Concordance table for Budget items – General Government - Revenues
Budget nomenclature 0pération PASS NATIONAL ACCOUNTS
TAX REVENUES
Industrial and commercial profits (BIC) 0D5001 Taxes on income
Non-commercial profits (BNC) 0D5001 Taxes on income
agricultural profits 0D5001 Taxes on income
Unique taxes on wages and salaries ( IUTS ) 0D5001 Taxes on income
General income tax (IGR) 0D5001 Taxes on income
Tax minimum tax (MFIs) num sedentary roles. 0D5001 Taxes on income
Tax minimum tax (MFIs) Digital Nomad roles. 0D5001 Taxes on income
Tax minimum tax (MFIs) registered roles 0D5001 Taxes on income
Taxes on digital sedentary livestock 0D5009 Other direct taxes
Taxes on digital nomad cattle 0D5009 Other direct taxes
Taxes on livestock role nominative 0D5009 Other direct taxes
CONTRIBUTIONS AND LAND REAL
ESTATE
property tax 0D200E Other taxes on production
Property tax punches ( TBMM ) 0D200E Other taxes on production
property tax 0D200E Other taxes on production
Forfétaire tax on residential homes 0D200E Other taxes on production
Specific tax on the value of properties 0D200E Other taxes on production
Synthetic patent (PS) 0D200E Other taxes on production
licenses 0D200E Other taxes on production
Apprenticeship tax (TA) 0D200E Other taxes on production
Tax control of mixed companies 0D200E Other taxes on production
Tax on certain business overheads ( CDOs ) 0D200E Other taxes on production
INDIRECT TAXES
Taxes internal consumption 0D200D Other taxes on products
Value added tax 0D200A Non-deductible VAT
Other excise 0D200D Other taxes on products
FEES CHARGED CUSTOMS
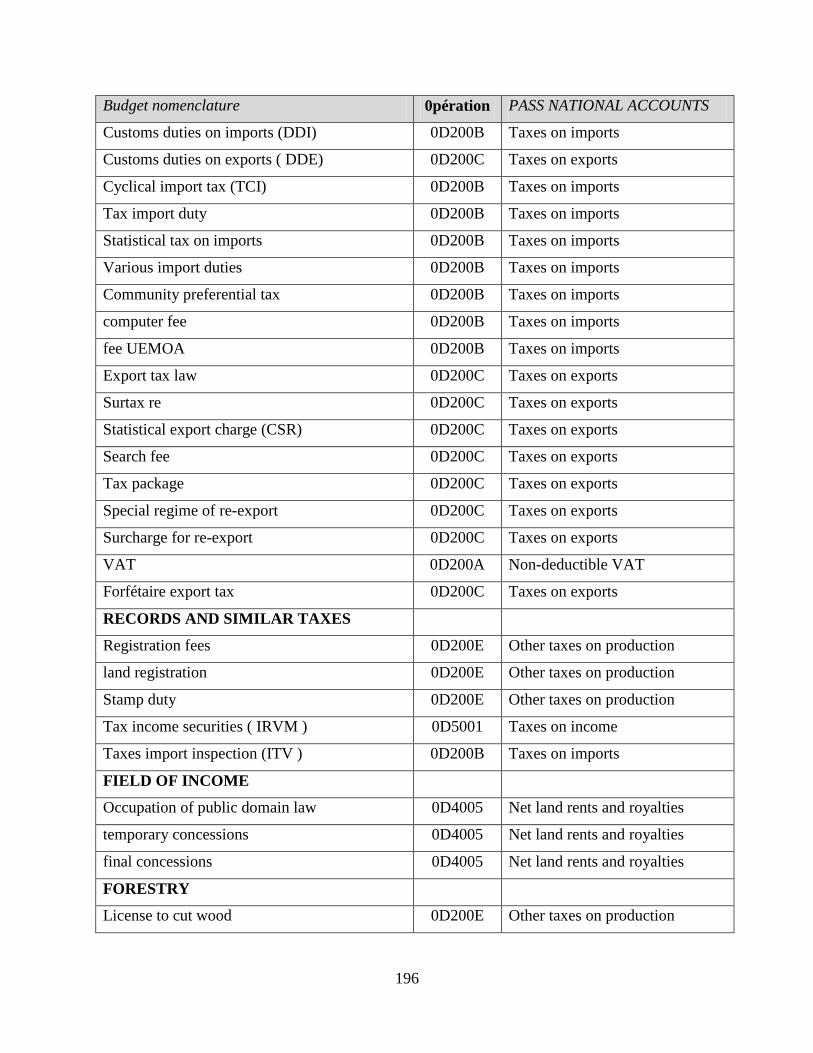
196
Budget nomenclature 0pération PASS NATIONAL ACCOUNTS
Customs duties on imports (DDI) 0D200B Taxes on imports
Customs duties on exports ( DDE) 0D200C Taxes on exports
Cyclical import tax (TCI) 0D200B Taxes on imports
Tax import duty 0D200B Taxes on imports
Statistical tax on imports 0D200B Taxes on imports
Various import duties 0D200B Taxes on imports
Community preferential tax 0D200B Taxes on imports
computer fee 0D200B Taxes on imports
fee UEMOA 0D200B Taxes on imports
Export tax law 0D200C Taxes on exports
Surtax re 0D200C Taxes on exports
Statistical export charge (CSR) 0D200C Taxes on exports
Search fee 0D200C Taxes on exports
Tax package 0D200C Taxes on exports
Special regime of re-export 0D200C Taxes on exports
Surcharge for re-export 0D200C Taxes on exports
VAT 0D200A Non-deductible VAT
Forfétaire export tax 0D200C Taxes on exports
RECORDS AND SIMILAR TAXES
Registration fees 0D200E Other taxes on production
land registration 0D200E Other taxes on production
Stamp duty 0D200E Other taxes on production
Tax income securities ( IRVM ) 0D5001 Taxes on income
Taxes import inspection (ITV ) 0D200B Taxes on imports
FIELD OF INCOME
Occupation of public domain law 0D4005 Net land rents and royalties
temporary concessions 0D4005 Net land rents and royalties
final concessions 0D4005 Net land rents and royalties
FORESTRY
License to cut wood 0D200E Other taxes on production
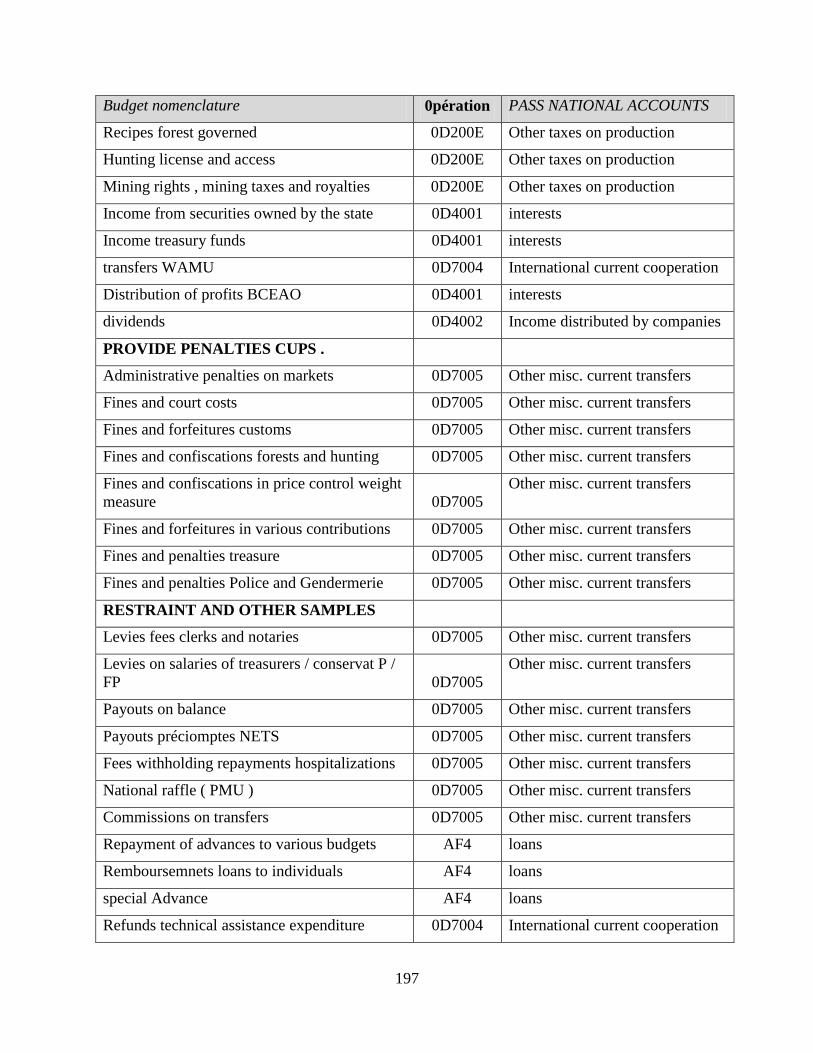
197
Budget nomenclature 0pération PASS NATIONAL ACCOUNTS
Recipes forest governed 0D200E Other taxes on production
Hunting license and access 0D200E Other taxes on production
Mining rights , mining taxes and royalties 0D200E Other taxes on production
Income from securities owned by the state 0D4001 interests
Income treasury funds 0D4001 interests
transfers WAMU 0D7004 International current cooperation
Distribution of profits BCEAO 0D4001 interests
dividends 0D4002 Income distributed by companies
PROVIDE PENALTIES CUPS .
Administrative penalties on markets 0D7005 Other misc. current transfers
Fines and court costs 0D7005 Other misc. current transfers
Fines and forfeitures customs 0D7005 Other misc. current transfers
Fines and confiscations forests and hunting 0D7005 Other misc. current transfers
Fines and confiscations in price control weight
measure 0D7005
Other misc. current transfers
Fines and forfeitures in various contributions 0D7005 Other misc. current transfers
Fines and penalties treasure 0D7005 Other misc. current transfers
Fines and penalties Police and Gendermerie 0D7005 Other misc. current transfers
RESTRAINT AND OTHER SAMPLES
Levies fees clerks and notaries 0D7005 Other misc. current transfers
Levies on salaries of treasurers / conservat P /
FP 0D7005
Other misc. current transfers
Payouts on balance 0D7005 Other misc. current transfers
Payouts préciomptes NETS 0D7005 Other misc. current transfers
Fees withholding repayments hospitalizations 0D7005 Other misc. current transfers
National raffle ( PMU ) 0D7005 Other misc. current transfers
Commissions on transfers 0D7005 Other misc. current transfers
Repayment of advances to various budgets AF4 loans
Remboursemnets loans to individuals AF4 loans
special Advance AF4 loans
Refunds technical assistance expenditure 0D7004 International current cooperation
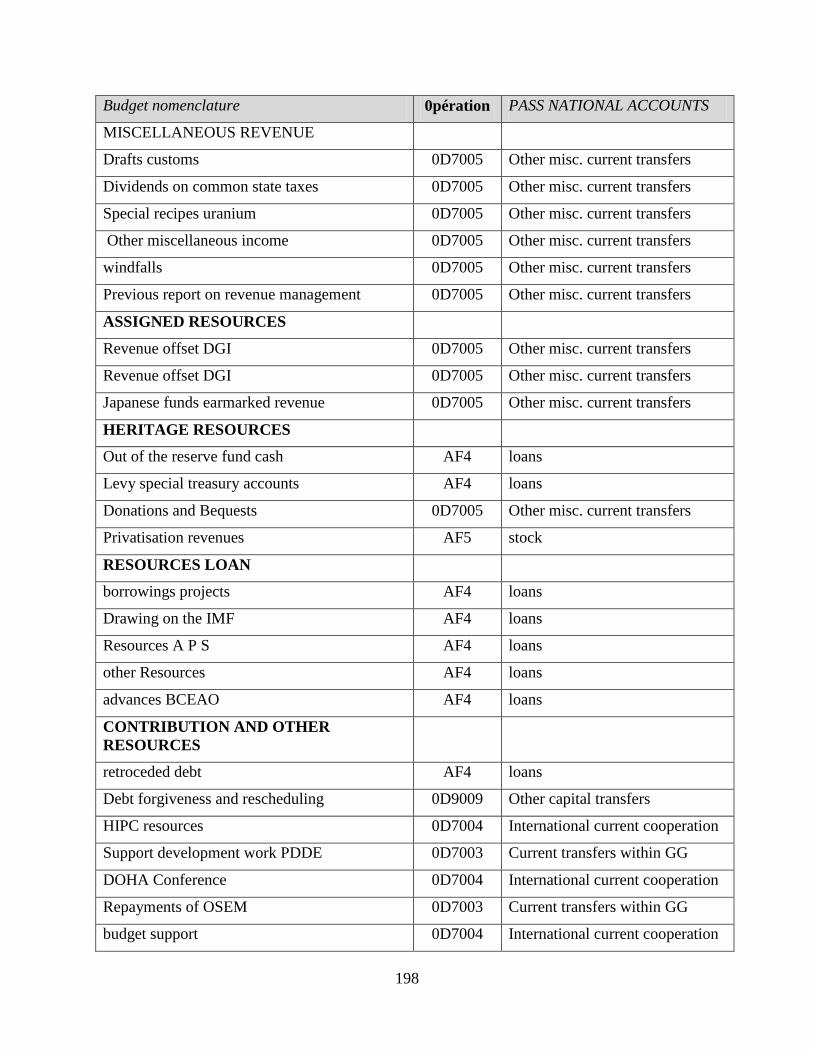
198
Budget nomenclature 0pération PASS NATIONAL ACCOUNTS
MISCELLANEOUS REVENUE
Drafts customs 0D7005 Other misc. current transfers
Dividends on common state taxes 0D7005 Other misc. current transfers
Special recipes uranium 0D7005 Other misc. current transfers
Other miscellaneous income 0D7005 Other misc. current transfers
windfalls 0D7005 Other misc. current transfers
Previous report on revenue management 0D7005 Other misc. current transfers
ASSIGNED RESOURCES
Revenue offset DGI 0D7005 Other misc. current transfers
Revenue offset DGI 0D7005 Other misc. current transfers
Japanese funds earmarked revenue 0D7005 Other misc. current transfers
HERITAGE RESOURCES
Out of the reserve fund cash AF4 loans
Levy special treasury accounts AF4 loans
Donations and Bequests 0D7005 Other misc. current transfers
Privatisation revenues AF5 stock
RESOURCES LOAN
borrowings projects AF4 loans
Drawing on the IMF AF4 loans
Resources A P S AF4 loans
other Resources AF4 loans
advances BCEAO AF4 loans
CONTRIBUTION AND OTHER
RESOURCES
retroceded debt AF4 loans
Debt forgiveness and rescheduling 0D9009 Other capital transfers
HIPC resources 0D7004 International current cooperation
Support development work PDDE 0D7003 Current transfers within GG
DOHA Conference 0D7004 International current cooperation
Repayments of OSEM 0D7003 Current transfers within GG
budget support 0D7004 International current cooperation
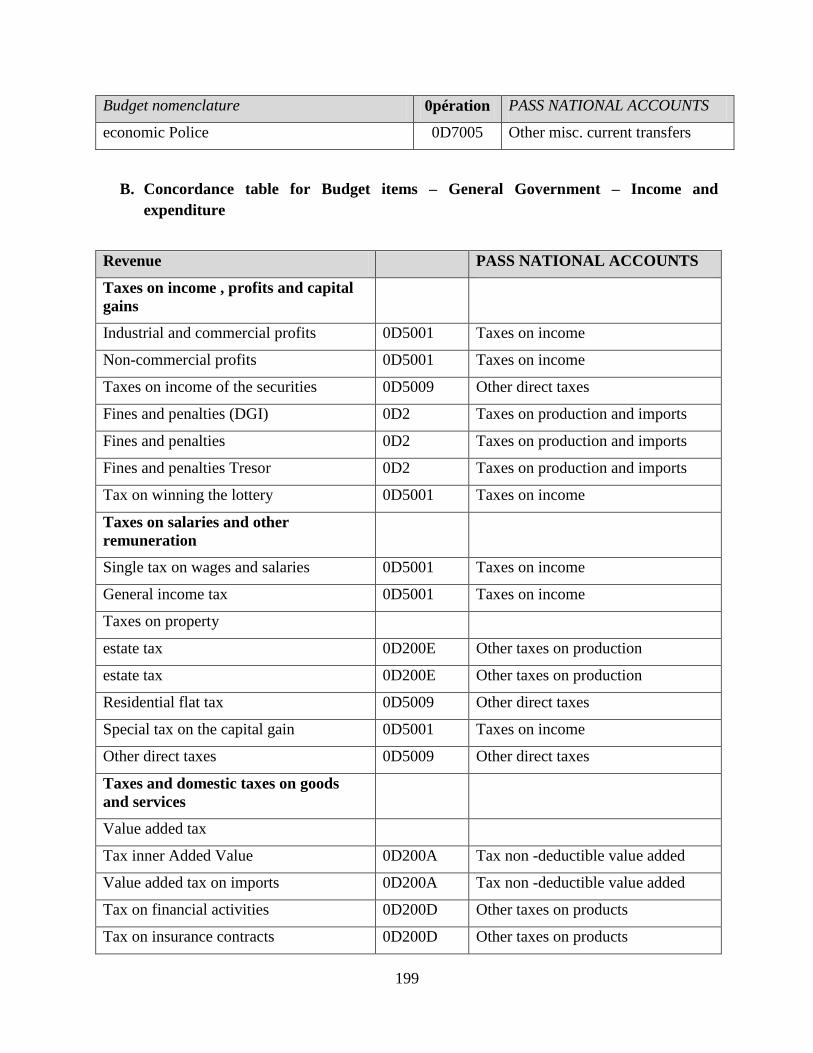
199
Budget nomenclature 0pération PASS NATIONAL ACCOUNTS
economic Police 0D7005 Other misc. current transfers
B. Concordance table for Budget items – General Government – Income and
expenditure
Revenue
PASS NATIONAL ACCOUNTS
Taxes on income , profits and capital
gains
Industrial and commercial profits 0D5001 Taxes on income
Non-commercial profits 0D5001 Taxes on income
Taxes on income of the securities 0D5009 Other direct taxes
Fines and penalties (DGI) 0D2 Taxes on production and imports
Fines and penalties 0D2 Taxes on production and imports
Fines and penalties Tresor 0D2 Taxes on production and imports
Tax on winning the lottery 0D5001 Taxes on income
Taxes on salaries and other
remuneration
Single tax on wages and salaries 0D5001 Taxes on income
General income tax 0D5001 Taxes on income
Taxes on property
estate tax 0D200E Other taxes on production
estate tax 0D200E Other taxes on production
Residential flat tax 0D5009 Other direct taxes
Special tax on the capital gain 0D5001 Taxes on income
Other direct taxes 0D5009 Other direct taxes
Taxes and domestic taxes on goods
and services
Value added tax
Tax inner Added Value 0D200A Tax non -deductible value added
Value added tax on imports 0D200A Tax non -deductible value added
Tax on financial activities 0D200D Other taxes on products
Tax on insurance contracts 0D200D Other taxes on products
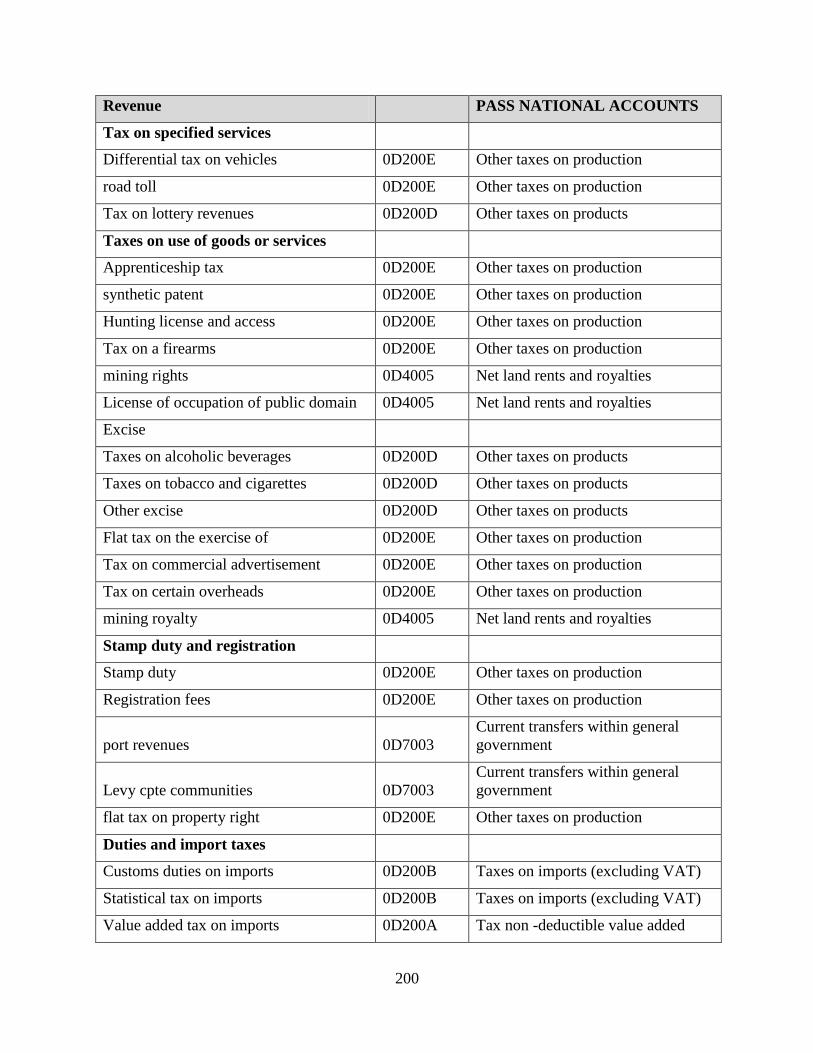
200
Revenue
PASS NATIONAL ACCOUNTS
Tax on specified services
Differential tax on vehicles 0D200E Other taxes on production
road toll 0D200E Other taxes on production
Tax on lottery revenues 0D200D Other taxes on products
Taxes on use of goods or services
Apprenticeship tax 0D200E Other taxes on production
synthetic patent 0D200E Other taxes on production
Hunting license and access 0D200E Other taxes on production
Tax on a firearms 0D200E Other taxes on production
mining rights 0D4005 Net land rents and royalties
License of occupation of public domain 0D4005 Net land rents and royalties
Excise
Taxes on alcoholic beverages 0D200D Other taxes on products
Taxes on tobacco and cigarettes 0D200D Other taxes on products
Other excise 0D200D Other taxes on products
Flat tax on the exercise of 0D200E Other taxes on production
Tax on commercial advertisement 0D200E Other taxes on production
Tax on certain overheads 0D200E Other taxes on production
mining royalty 0D4005 Net land rents and royalties
Stamp duty and registration
Stamp duty 0D200E Other taxes on production
Registration fees 0D200E Other taxes on production
port revenues 0D7003
Current transfers within general
government
Levy cpte communities 0D7003
Current transfers within general
government
flat tax on property right 0D200E Other taxes on production
Duties and import taxes
Customs duties on imports 0D200B Taxes on imports (excluding VAT)
Statistical tax on imports 0D200B Taxes on imports (excluding VAT)
Value added tax on imports 0D200A Tax non -deductible value added
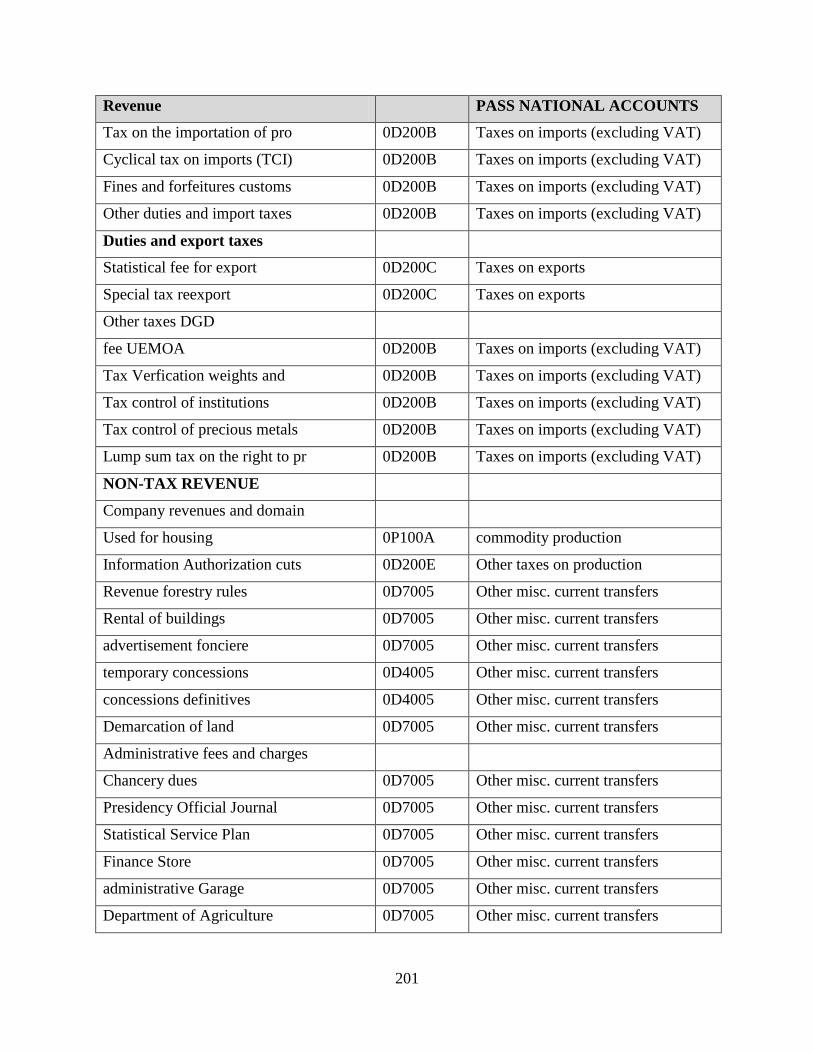
201
Revenue
PASS NATIONAL ACCOUNTS
Tax on the importation of pro 0D200B Taxes on imports (excluding VAT)
Cyclical tax on imports (TCI) 0D200B Taxes on imports (excluding VAT)
Fines and forfeitures customs 0D200B Taxes on imports (excluding VAT)
Other duties and import taxes 0D200B Taxes on imports (excluding VAT)
Duties and export taxes
Statistical fee for export 0D200C Taxes on exports
Special tax reexport 0D200C Taxes on exports
Other taxes DGD
fee UEMOA 0D200B Taxes on imports (excluding VAT)
Tax Verfication weights and 0D200B Taxes on imports (excluding VAT)
Tax control of institutions 0D200B Taxes on imports (excluding VAT)
Tax control of precious metals 0D200B Taxes on imports (excluding VAT)
Lump sum tax on the right to pr 0D200B Taxes on imports (excluding VAT)
NON-TAX REVENUE
Company revenues and domain
Used for housing 0P100A commodity production
Information Authorization cuts 0D200E Other taxes on production
Revenue forestry rules 0D7005 Other misc. current transfers
Rental of buildings 0D7005 Other misc. current transfers
advertisement fonciere 0D7005 Other misc. current transfers
temporary concessions 0D4005 Other misc. current transfers
concessions definitives 0D4005 Other misc. current transfers
Demarcation of land 0D7005 Other misc. current transfers
Administrative fees and charges
Chancery dues 0D7005 Other misc. current transfers
Presidency Official Journal 0D7005 Other misc. current transfers
Statistical Service Plan 0D7005 Other misc. current transfers
Finance Store 0D7005 Other misc. current transfers
administrative Garage 0D7005 Other misc. current transfers
Department of Agriculture 0D7005 Other misc. current transfers
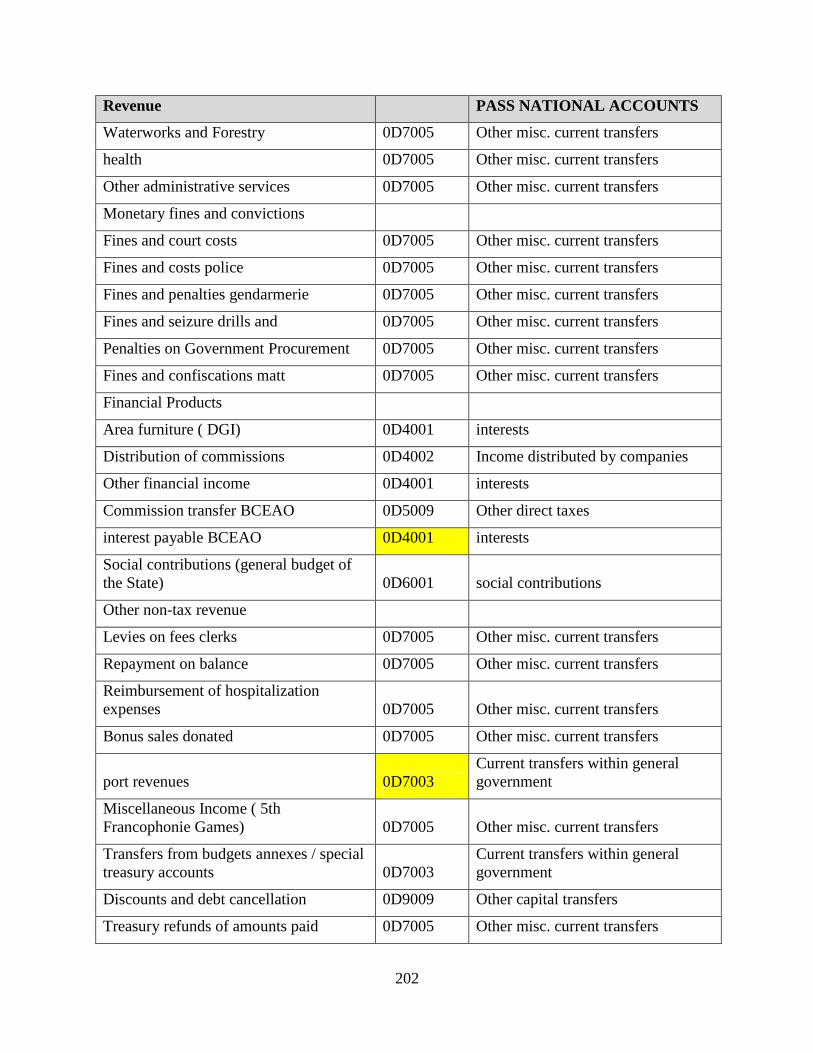
202
Revenue
PASS NATIONAL ACCOUNTS
Waterworks and Forestry 0D7005 Other misc. current transfers
health 0D7005 Other misc. current transfers
Other administrative services 0D7005 Other misc. current transfers
Monetary fines and convictions
Fines and court costs 0D7005 Other misc. current transfers
Fines and costs police 0D7005 Other misc. current transfers
Fines and penalties gendarmerie 0D7005 Other misc. current transfers
Fines and seizure drills and 0D7005 Other misc. current transfers
Penalties on Government Procurement 0D7005 Other misc. current transfers
Fines and confiscations matt 0D7005 Other misc. current transfers
Financial Products
Area furniture ( DGI) 0D4001 interests
Distribution of commissions 0D4002 Income distributed by companies
Other financial income 0D4001 interests
Commission transfer BCEAO 0D5009 Other direct taxes
interest payable BCEAO 0D4001 interests
Social contributions (general budget of
the State) 0D6001 social contributions
Other non-tax revenue
Levies on fees clerks 0D7005 Other misc. current transfers
Repayment on balance 0D7005 Other misc. current transfers
Reimbursement of hospitalization
expenses 0D7005 Other misc. current transfers
Bonus sales donated 0D7005 Other misc. current transfers
port revenues 0D7003
Current transfers within general
government
Miscellaneous Income ( 5th
Francophonie Games) 0D7005 Other misc. current transfers
Transfers from budgets annexes / special
treasury accounts 0D7003
Current transfers within general
government
Discounts and debt cancellation 0D9009 Other capital transfers
Treasury refunds of amounts paid 0D7005 Other misc. current transfers
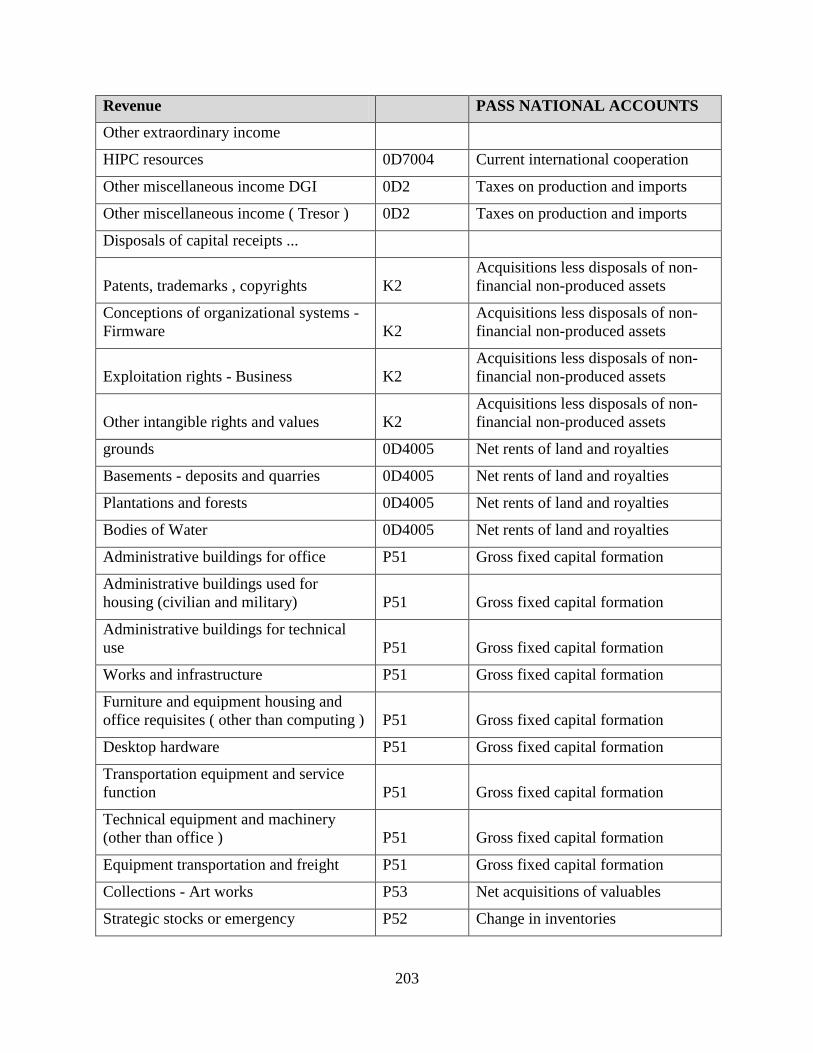
203
Revenue
PASS NATIONAL ACCOUNTS
Other extraordinary income
HIPC resources 0D7004 Current international cooperation
Other miscellaneous income DGI 0D2 Taxes on production and imports
Other miscellaneous income ( Tresor ) 0D2 Taxes on production and imports
Disposals of capital receipts ...
Patents, trademarks , copyrights K2
Acquisitions less disposals of non-
financial non-produced assets
Conceptions of organizational systems -
Firmware K2
Acquisitions less disposals of non-
financial non-produced assets
Exploitation rights - Business K2
Acquisitions less disposals of non-
financial non-produced assets
Other intangible rights and values K2
Acquisitions less disposals of non-
financial non-produced assets
grounds 0D4005 Net rents of land and royalties
Basements - deposits and quarries 0D4005 Net rents of land and royalties
Plantations and forests 0D4005 Net rents of land and royalties
Bodies of Water 0D4005 Net rents of land and royalties
Administrative buildings for office P51 Gross fixed capital formation
Administrative buildings used for
housing (civilian and military) P51 Gross fixed capital formation
Administrative buildings for technical
use P51 Gross fixed capital formation
Works and infrastructure P51 Gross fixed capital formation
Furniture and equipment housing and
office requisites ( other than computing ) P51 Gross fixed capital formation
Desktop hardware P51 Gross fixed capital formation
Transportation equipment and service
function P51 Gross fixed capital formation
Technical equipment and machinery
(other than office ) P51 Gross fixed capital formation
Equipment transportation and freight P51 Gross fixed capital formation
Collections - Art works P53 Net acquisitions of valuables
Strategic stocks or emergency P52 Change in inventories
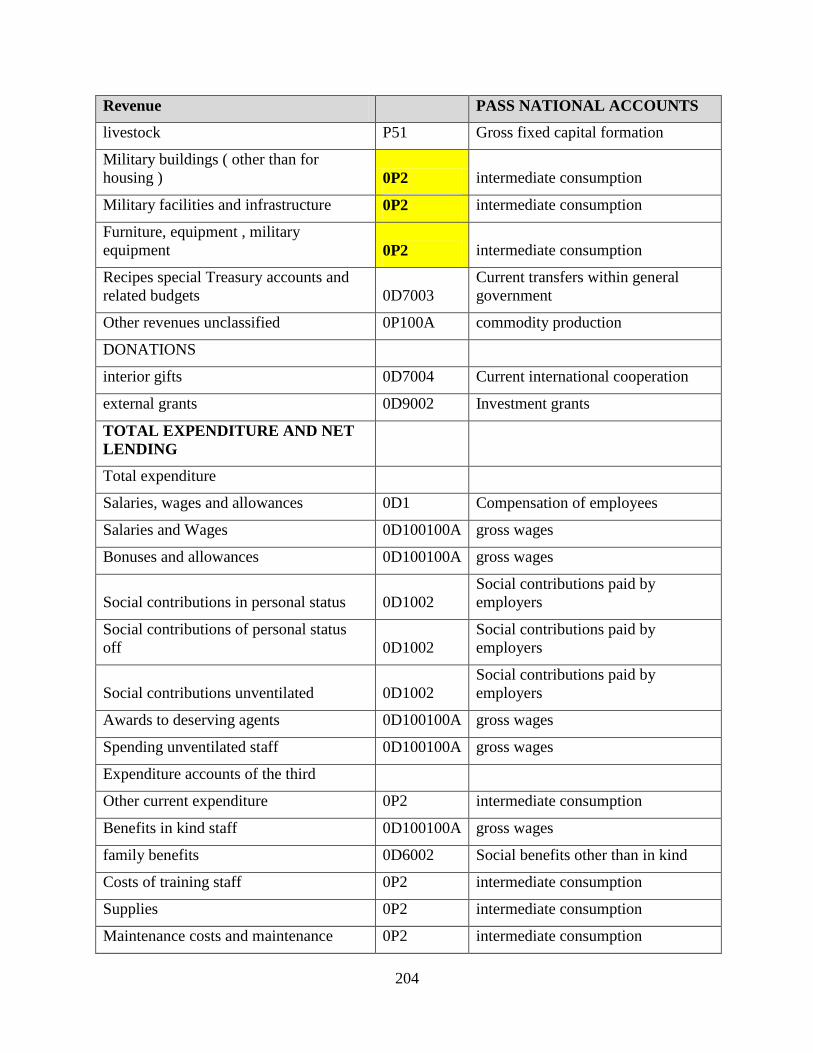
204
Revenue
PASS NATIONAL ACCOUNTS
livestock P51 Gross fixed capital formation
Military buildings ( other than for
housing ) 0P2 intermediate consumption
Military facilities and infrastructure 0P2 intermediate consumption
Furniture, equipment , military
equipment 0P2 intermediate consumption
Recipes special Treasury accounts and
related budgets 0D7003
Current transfers within general
government
Other revenues unclassified 0P100A commodity production
DONATIONS
interior gifts 0D7004 Current international cooperation
external grants 0D9002 Investment grants
TOTAL EXPENDITURE AND NET
LENDING
Total expenditure
Salaries, wages and allowances 0D1 Compensation of employees
Salaries and Wages 0D100100A gross wages
Bonuses and allowances 0D100100A gross wages
Social contributions in personal status 0D1002
Social contributions paid by
employers
Social contributions of personal status
off 0D1002
Social contributions paid by
employers
Social contributions unventilated 0D1002
Social contributions paid by
employers
Awards to deserving agents 0D100100A gross wages
Spending unventilated staff 0D100100A gross wages
Expenditure accounts of the third
Other current expenditure 0P2 intermediate consumption
Benefits in kind staff 0D100100A gross wages
family benefits 0D6002 Social benefits other than in kind
Costs of training staff 0P2 intermediate consumption
Supplies 0P2 intermediate consumption
Maintenance costs and maintenance 0P2 intermediate consumption
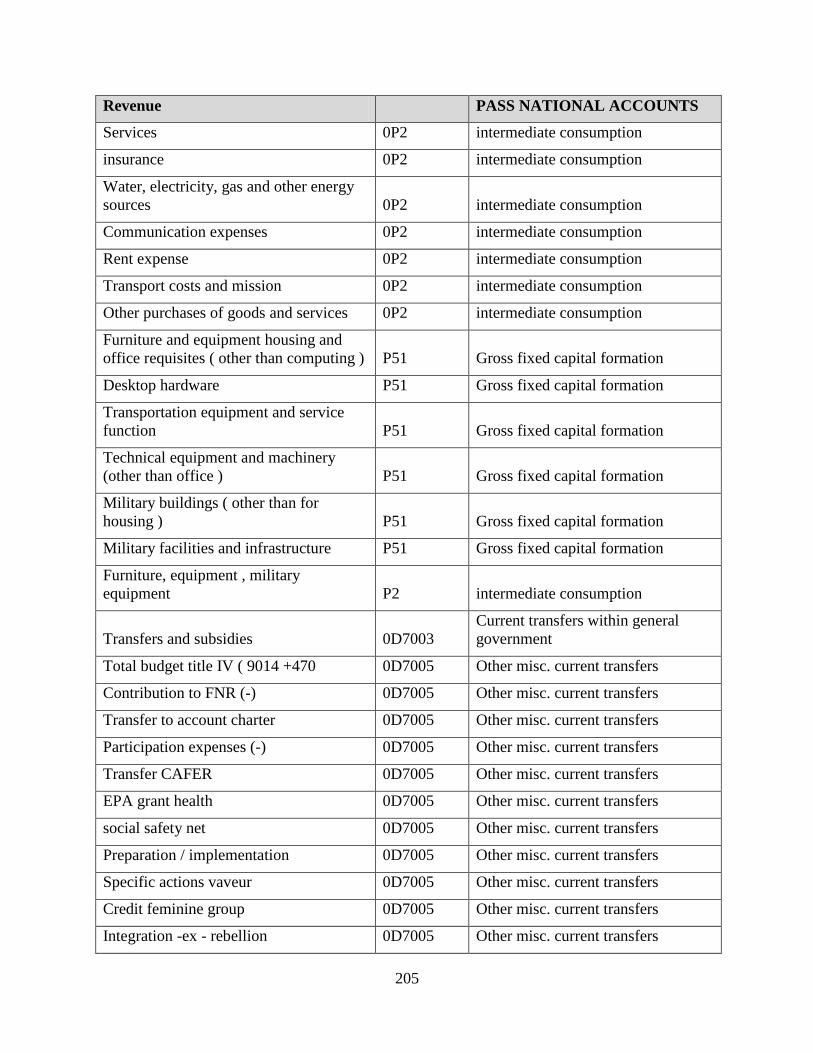
205
Revenue
PASS NATIONAL ACCOUNTS
Services 0P2 intermediate consumption
insurance 0P2 intermediate consumption
Water, electricity, gas and other energy
sources 0P2 intermediate consumption
Communication expenses 0P2 intermediate consumption
Rent expense 0P2 intermediate consumption
Transport costs and mission 0P2 intermediate consumption
Other purchases of goods and services 0P2 intermediate consumption
Furniture and equipment housing and
office requisites ( other than computing ) P51 Gross fixed capital formation
Desktop hardware P51 Gross fixed capital formation
Transportation equipment and service
function P51 Gross fixed capital formation
Technical equipment and machinery
(other than office ) P51 Gross fixed capital formation
Military buildings ( other than for
housing ) P51 Gross fixed capital formation
Military facilities and infrastructure P51 Gross fixed capital formation
Furniture, equipment , military
equipment P2 intermediate consumption
Transfers and subsidies 0D7003
Current transfers within general
government
Total budget title IV ( 9014 +470 0D7005 Other misc. current transfers
Contribution to FNR (-) 0D7005 Other misc. current transfers
Transfer to account charter 0D7005 Other misc. current transfers
Participation expenses (-) 0D7005 Other misc. current transfers
Transfer CAFER 0D7005 Other misc. current transfers
EPA grant health 0D7005 Other misc. current transfers
social safety net 0D7005 Other misc. current transfers
Preparation / implementation 0D7005 Other misc. current transfers
Specific actions vaveur 0D7005 Other misc. current transfers
Credit feminine group 0D7005 Other misc. current transfers
Integration -ex - rebellion 0D7005 Other misc. current transfers
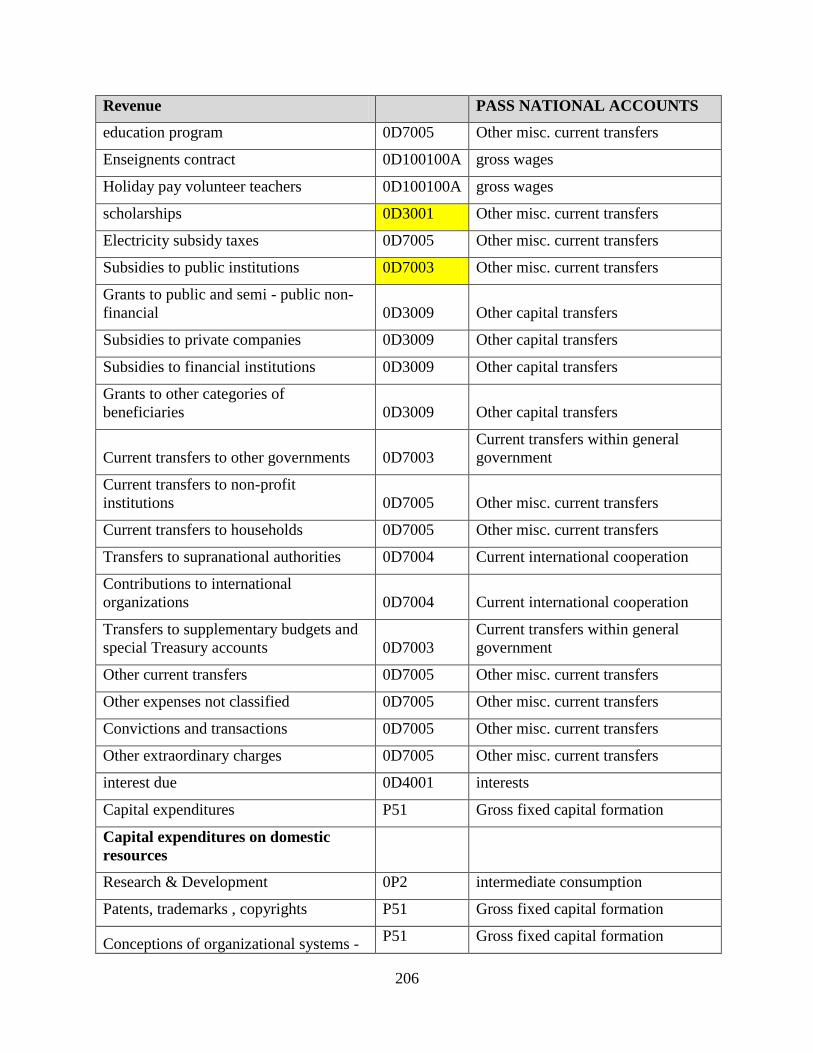
206
Revenue
PASS NATIONAL ACCOUNTS
education program 0D7005 Other misc. current transfers
Enseignents contract 0D100100A gross wages
Holiday pay volunteer teachers 0D100100A gross wages
scholarships 0D3001 Other misc. current transfers
Electricity subsidy taxes 0D7005 Other misc. current transfers
Subsidies to public institutions 0D7003 Other misc. current transfers
Grants to public and semi - public non-
financial 0D3009 Other capital transfers
Subsidies to private companies 0D3009 Other capital transfers
Subsidies to financial institutions 0D3009 Other capital transfers
Grants to other categories of
beneficiaries 0D3009 Other capital transfers
Current transfers to other governments 0D7003
Current transfers within general
government
Current transfers to non-profit
institutions 0D7005 Other misc. current transfers
Current transfers to households 0D7005 Other misc. current transfers
Transfers to supranational authorities 0D7004 Current international cooperation
Contributions to international
organizations 0D7004 Current international cooperation
Transfers to supplementary budgets and
special Treasury accounts 0D7003
Current transfers within general
government
Other current transfers 0D7005 Other misc. current transfers
Other expenses not classified 0D7005 Other misc. current transfers
Convictions and transactions 0D7005 Other misc. current transfers
Other extraordinary charges 0D7005 Other misc. current transfers
interest due 0D4001 interests
Capital expenditures P51 Gross fixed capital formation
Capital expenditures on domestic
resources
Research & Development 0P2 intermediate consumption
Patents, trademarks , copyrights P51 Gross fixed capital formation
Conceptions of organizational systems - P51 Gross fixed capital formation
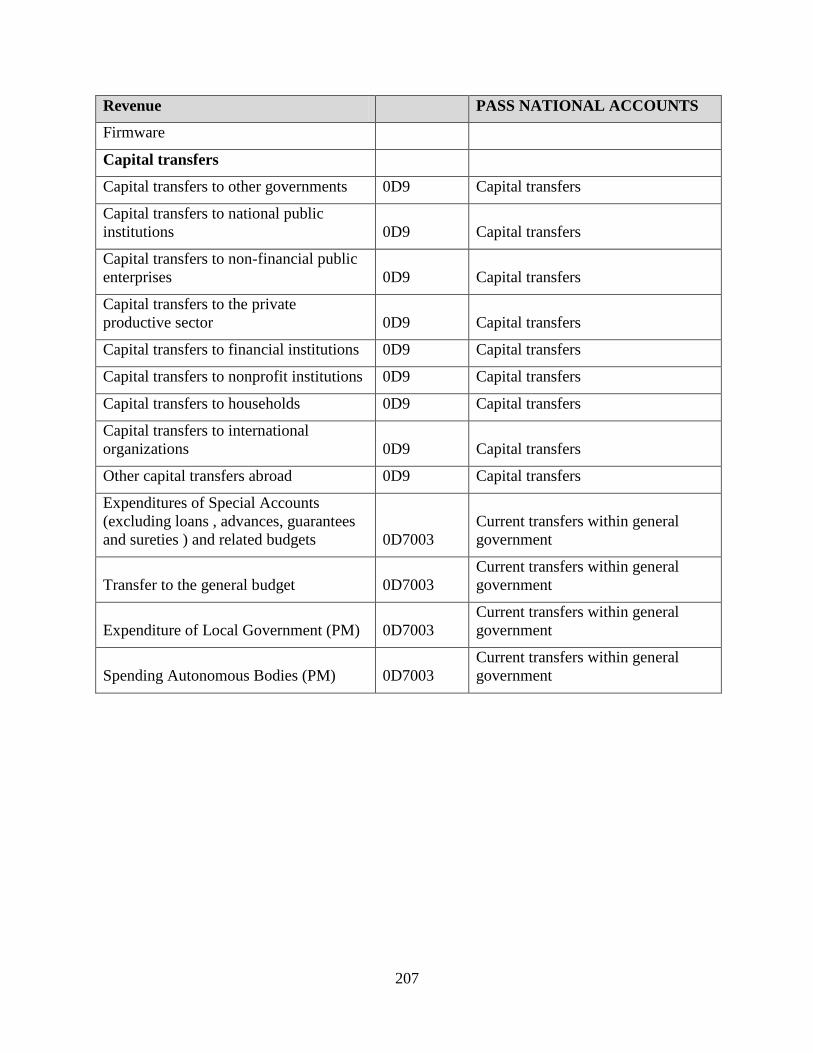
207
Revenue
PASS NATIONAL ACCOUNTS
Firmware
Capital transfers
Capital transfers to other governments 0D9 Capital transfers
Capital transfers to national public
institutions 0D9 Capital transfers
Capital transfers to non-financial public
enterprises 0D9 Capital transfers
Capital transfers to the private
productive sector 0D9 Capital transfers
Capital transfers to financial institutions 0D9 Capital transfers
Capital transfers to nonprofit institutions 0D9 Capital transfers
Capital transfers to households 0D9 Capital transfers
Capital transfers to international
organizations 0D9 Capital transfers
Other capital transfers abroad 0D9 Capital transfers
Expenditures of Special Accounts
(excluding loans , advances, guarantees
and sureties ) and related budgets 0D7003
Current transfers within general
government
Transfer to the general budget 0D7003
Current transfers within general
government
Expenditure of Local Government (PM) 0D7003
Current transfers within general
government
Spending Autonomous Bodies (PM) 0D7003
Current transfers within general
government
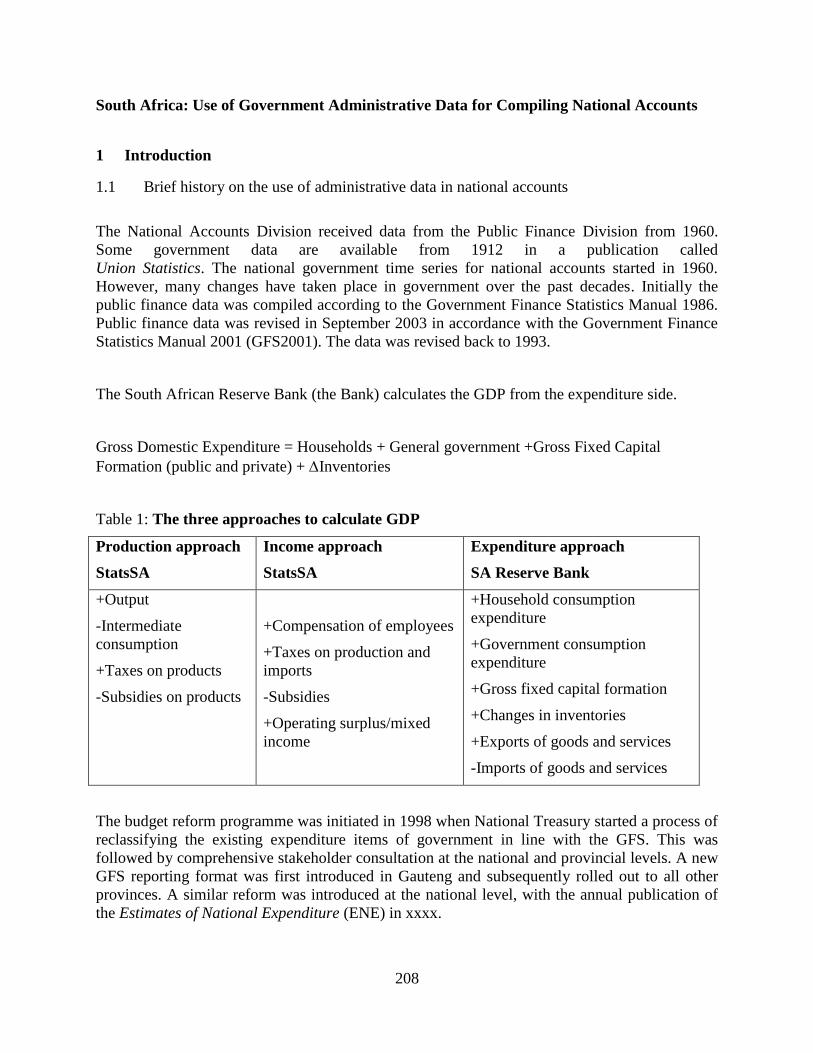
208
South Africa: Use of Government Administrative Data for Compiling National Accounts
1 Introduction
1.1 Brief history on the use of administrative data in national accounts
The National Accounts Division received data from the Public Finance Division from 1960.
Some government data are available from 1912 in a publication called
Union Statistics. The national government time series for national accounts started in 1960.
However, many changes have taken place in government over the past decades. Initially the
public finance data was compiled according to the Government Finance Statistics Manual 1986.
Public finance data was revised in September 2003 in accordance with the Government Finance
Statistics Manual 2001 (GFS2001). The data was revised back to 1993.
The South African Reserve Bank (the Bank) calculates the GDP from the expenditure side.
Gross Domestic Expenditure = Households + General government +Gross Fixed Capital
Formation (public and private) + Inventories
Table 1: The three approaches to calculate GDP
Production approach
StatsSA
Income approach
StatsSA
Expenditure approach
SA Reserve Bank
+Output
-Intermediate
consumption
+Taxes on products
-Subsidies on products
+Compensation of employees
+Taxes on production and
imports
-Subsidies
+Operating surplus/mixed
income
+Household consumption
expenditure
+Government consumption
expenditure
+Gross fixed capital formation
+Changes in inventories
+Exports of goods and services
-Imports of goods and services
The budget reform programme was initiated in 1998 when National Treasury started a process of
reclassifying the existing expenditure items of government in line with the GFS. This was
followed by comprehensive stakeholder consultation at the national and provincial levels. A new
GFS reporting format was first introduced in Gauteng and subsequently rolled out to all other
provinces. A similar reform was introduced at the national level, with the annual publication of
the Estimates of National Expenditure (ENE) in xxxx.
209
The process culminated on 1 April 2004, when the new Expenditure Reporting Format (ERF)
and Standard Chart of Accounts (SCOA) were introduced. Departments were required to submit
their 2004 budget in line with the new format to ensure that correctly classified budget data could
be loaded onto the system for the 2004/05 financial year. Since then, ERF and SCOA have been
fully operational and used by all national and provincial departments.
Although the implementation process proceeded smoothly, as the accounting and reporting
requirements evolved and with the pending introduction of the Integrated Financial Management
System (IFMS), areas of improvement were identified and appropriate amendments were
proposed. This led to the review of ERF and SCOA, which took place in 2007. The revised
versions were implemented on 1 April 2008. The most important change was the addition of two
new segments to SCOA, as well as the standardisation of most segments of SCOA. There were
also some additions to the list of capital assets and some improvements to the definitions. These
changes are explained in this updated guideline.
The link between ERF and SCOA
It might be useful to explain the link between ERF and SCOA in more detail.
ERF is the high-level presentation format of the Economic Classification of all government
receipt and payment items for reporting purposes. It provides meaningful information to
parliamentarians, financial practitioners, economic analysts and other users of government
financial data. ERF is supported at the more detailed level by SCOA, which serves as a data
entry or collection tool, where each detailed item is recorded at the posting level.
SCOA comprises the coding of items used for classification, budgeting, recording and reporting
of receipts and payments within the financial system. It serves to facilitate and systematise the
recording of all transactions and is directly linked to ERF, in fact, the posting level items roll up
to the ERF reporting format.
Together, these are used to record and report on all transactions of government, whether it is in
the budget, in-year financial reports or departments‘ annual financial statements.
A copy of the latest release of the chart is available on the National Treasury SCOA website:
www.treasury.gov.za, treasury links, Standard Chart of Accounts (SCOA).
1.2 Structure of paper
The structure of the paper starts with the discussion of the agencies responsible for government
accounts and what constitutes the operation of general government covers. Secondly it deals with
the sources and institutional arrangements for access of government accounts. Thirdly, the
coding structure of the accounts for Government Finance statistics and national accounts is
210
discussed. Finally it then deals with departmental enterprises, discusses bridging tables and deals
with compilation issues.
2 Sources and institutional arrangements for access of government accounts
The agencies responsible for the government accounts are the National Treasury of South Africa,
Statistics South Africa (StatsSA) and the South African Reserve Bank. The scope and coverage
of the government accounts are according the System of National Accounts Manual 1993 (SNA)
prescribed by the United Nations and the Government Finance Statistics manual (GFSM2001)
prescribed by the International Monetary Fund.
2.1 Agencies responsible for government accounts
The National Treasury (data producing agency) has the legal authority to collect data to compile
statistics and is governed by the Public Finance Management Act. The Bank (correspondent to
the IMF for SDDS) is governed by the South African Reserve Bank Act, No. 90 of 1989. In 1996
the Minister of Finance pledged that South Africa would adhere to the SDDS of the IMF, as such
the Bank was mandated by the government to report to the IMF. Accordingly, the Head of the
Research Department at the Bank was appointed to co-ordinate all aspects related to the SDDS to
the IMF. A note of confidentiality is stipulated in the survey form that information collected will
be aggregated and disseminated in the Quarterly Bulletin of the Bank and on the website
(www.reservebank.co.za). All information is treated as confidential and no individual
institution's statistics is disclosed separately. The Bank has published statistics in its Quarterly
Bulletin since 8 October 1946 as a service to the public.
All the data are published in accordance with the GFSM2001 and is disseminated to the public at
large on all categories of fiscal data. The only exception is when data is not available and it is
denoted by … as a general note in the Quarterly Bulletin.
Statistics compiled by the National Treasury are governed by the Public Finance Management
Act (PFMA), Act 1 of 1999 as amended. Before 1 April 2000 the reports were governed by the
Exchequer Act, No 66 of 1975. All statistics are compiled according to Section 32(1) of the Act
and requires that ―Within 30 days after the end of each month, the National Treasury publish in
the National Government Gazette a statement of actual revenue and expenditure with regard to
the National Revenue Fund‖.
The financial statistics of consolidated general government are published annually by StatsSA as
a Statistical Release, with key findings on the different categories of receipts, payments,
investment in non-financial assets. Local government statistics are compiled by StatsSA and
governed by the Municipal Finance Management Act No. 56 of 2003. This information is
compared to the quarterly data published by the Bank in the Quarterly Bulletin. A consultative
meeting is held annually between National Treasury, StatsSA and the Bank to iron out the
211
differences in the data. Discrepancies in the data at different levels of general government are
discussed and corrected where possible.
2.2 Scope of government accounts
The general government data are the data of the consolidated central government (i.e. budgetary
central government accounts, social security funds and extra-budgetary units), provincial and the
local governments. Institutional sectors are defined in accordance with the System of National
Accounts 1993 and the GFSM2001.
The national government and provincial government operate on a cash basis while the social
security funds, extra-budgetary units and local governments operate on an accrual basis.
Therefore, the information published in the Quarterly Bulletin is only the Statement of Sources
and Uses of Cash. However, annually the Statement of Government Operations for all levels of
government is sent to the IMF for the GFS Yearbook. For national and provincial government
the cash is used as a proxy of the accrual data for the latest years and for earliest/prior years
audited financial statements data is used for both cash and accrual. Consumption of fixed capital
is used from the analysis by national accounts. At this juncture, the Bank does not publish
Balance Sheets for government nor a Statement of Other Economic Flows for the GFS. The
National Accounts Division publishes government data in the following tables in the Quarterly
Bulletin:
- Production, distribution and accumulation accounts of SA: General Government.
- Financing of gross capital formation: Saving of General government.
- Expenditure of gross domestic product: Final consumption expenditure by general
government.
Government saving data is also published in the National Financial Account: Flow of Funds.
The quarterly analysis of general government presents revenue, expense, net lending/borrowing,
(cash deficit/surplus) and financing broken down by debt instrument, broadly defined and
classified according to the IMF's "Government Finance Statistics Manual, 2001". GFS data is
provided separately for the central government, provincial governments, local governments, and
for consolidated general government.
Data are disseminated in millions of local currency (rand) on general government operations.
The fiscal year begins on April 1 and ends on March 31 the following year.
212
2.2.1 Coverage (central, provincial, local bodies and autonomous government
institutions)
The three institutions, National Treasury, StatsSA, and the Bank formed the Public Sector
Classification Committee (PSCC) though a Memorandum of Understanding (MOU) dated 01
April 2009 to coordinate the classification of the public sector institutional units and subsectors
for purposes of reporting to national and international stakeholders.
2.2.1.1 The operations of general government covers:
The national government: The budgetary accounts of national government (or main budget
accounts) comprising 38 government departments, standing appropriations and statutory
payments.
Social security funds: The social security funds consists of four funds namely the
Compensation Commissioner for Occupational Diseases, Unemployment Insurance Fund,
the Workmen's Compensation Fund, and the Road Accident Fund.
Extra-budgetary units: The extra-budgetary units consist of about 170 including Sector
Education and Training Authorities (SETAS) units as well as 23 Universities of Technology
and Technicons. The Universities, Universities of Technology, and Technicons of South
Africa qualify as extra-budgetary units according to the definition set out in the IMF's
"Government Finance Statistics Manual, 2001".
Provincial governments: The financial accounts of the 9 provinces of the Republic of South
Africa are included in the analysis of the general government as well as provincial public
entities and business enterprises.
Local governments: Prior to the December 2000 elections, there were 843 local authorities.
There are currently 278 units, with financial reporting based on the new structures, taking
effect from July 1, 2001. The Municipal Finance Management Act No. 56 of 2003 (MFMA)
was introduced by National Treasury to enhance financial management reforms across
government; this became effective in July 2004. Generally Recognized Accounting Practices
(GRAP) /Generally Accepted Municipal Accounting Practices (GAMAP) reporting standard
are currently being implemented in a phased approach.
No legal mandate exists for the Bank to collect data on government accounts. However other
institutional arrangement exists such as Memorandums of Understanding for accessing
government accounts. Data is shared in electronic format and printed form. Data is available to
the national accounts division 30 days after month-end or quarter-end in electronic format and
hard copy.
213
3 Structure of government accounts that are provided for national accounts compilation
3.1 The coding structure
The coding structure is standardised across all levels of government (central, provincial, local)
and departments. The coding structure for item-wise revenues and expenditures (transactions)
that are given in the accounts is according to the GFSM2001 as published by the IMF:
Revenue: 1000, Expenditure: 2000, Non-financial assets: 3100, Financial assets: 3200 and
Liabilities: 3300
For national accounts purposes, internationally established codes are being used; classification of
institutional sectors in 1993 SNA and classifications of transactions and other flows.
3.2 Departmental enterprises
In the public finance division the data for government enterprises of local government is not split
as the balance sheet information for these enterprises is not available on a quarterly basis. In the
GFS, local general government services and local government business enterprises are added
together. This issue is currently under investigation as to how best to present these numbers.
However, in the national accounts division, government business enterprises are calculated
separately and are not treated as part of general government services. Departmental enterprises
are treated as market enterprises for estimating output and losses if any are to be treated as
imputed subsidies in national accounts.
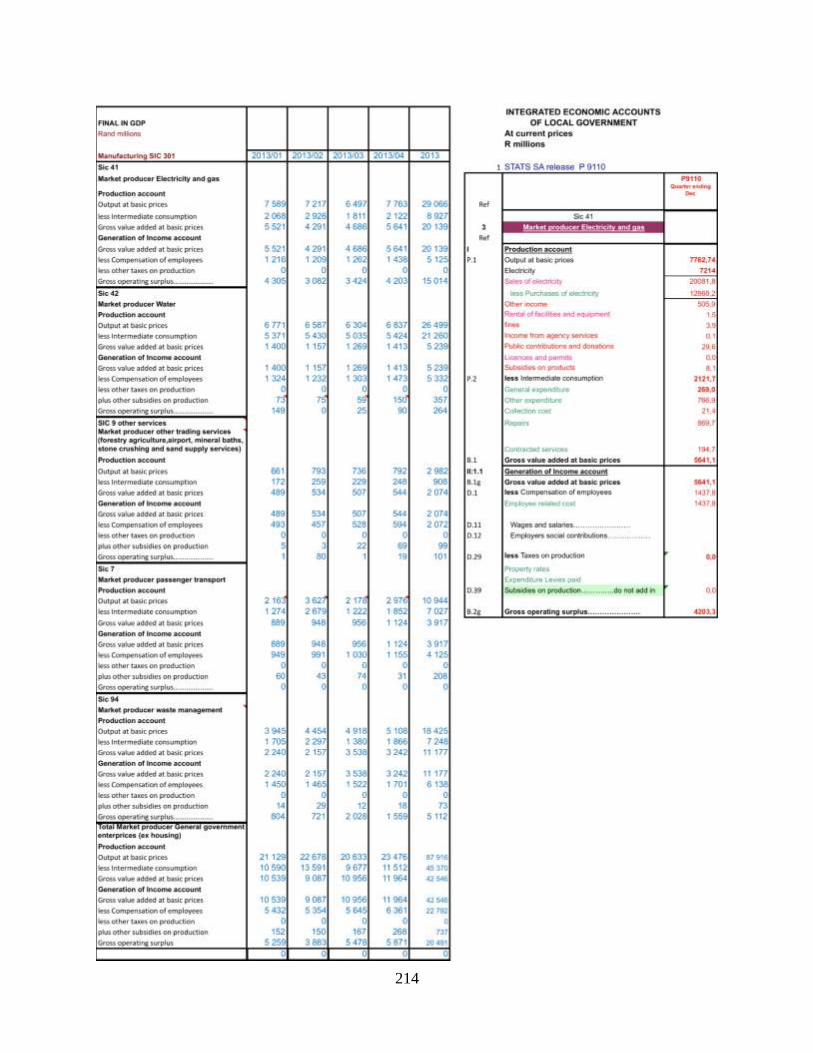
214
215
4 Translating the item-wise revenues and expenditures shown in government accounts to
national accounts
4.1 Formats or bridge tables prepared to link the transactions with SNA codes
The bridge tables have been created by the National accounts division
(see Annexure 3). Classification codes are assigned according to the SNA manual for
compensation of employees, intermediate consumption, current transfers, taxes on products, etc.
The functional classification coding system (as in COFOG or country specific) is not used in the
SNA. ……………..However, the COFOG classification codes are used in the GFS division.
Functional outlays:
Data on the functional outlays as published in the Bank‘s Quarterly Bulletin on page
S-76 do not agree with Stats SA figures for methodological reasons. The source of the
information in the bulletin is based on the analysis done by Stats SA. The main reason for the
differences between the Bank‘s cash data and the functional information as published by Stats
SA is their recording principles of local government. Stats SA records only the general
government services of local government, whereas the Bank includes trading services as part of
local government.
4.2 Adjustments made in the source data
Government operates on a cash basis or adjusted cash basis. This information is forwarded to
National accounts without any adjustments. Because national accounts and the rest of the
economy operate on an accrual basis, adjustments need to be made to the cash data.
4.3 Translating the government account data to SNA account data
A ―Statement of Sources and uses of Cash‖ is compiled by the Public Finance Division
according to the GFSM2001. The coding structure use is according to the GFSM2001. National
accounts assign a code to the data from G1-G24. A bridging table of current income and
expenditure of general government (at current prices) is created with a national accounting code
attached to each line item (Annexure 3). Because GFS data is on a cash basis, consumption of
fixed capital is not included. Consumption of fixed capital is included in national accounts
government accounts and is derived from gross fixed capital formation using the straight line
method.
4.4 Calculation of Consumption of Fixed Capital
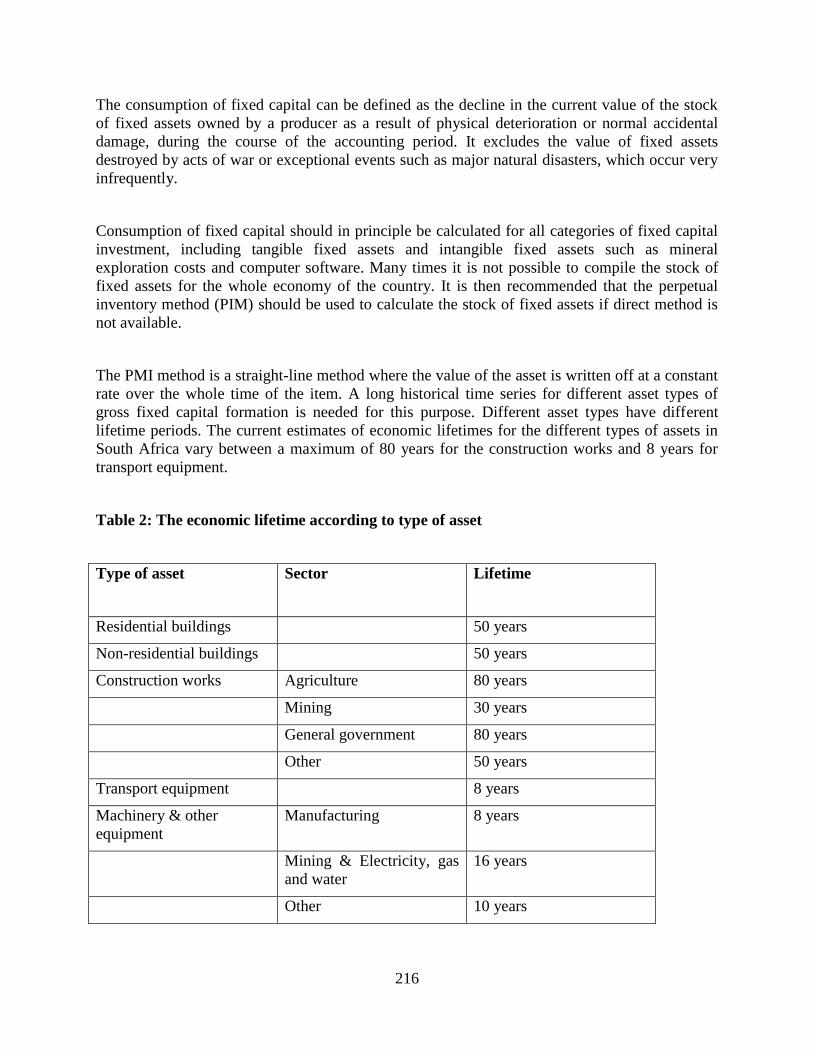
216
The consumption of fixed capital can be defined as the decline in the current value of the stock
of fixed assets owned by a producer as a result of physical deterioration or normal accidental
damage, during the course of the accounting period. It excludes the value of fixed assets
destroyed by acts of war or exceptional events such as major natural disasters, which occur very
infrequently.
Consumption of fixed capital should in principle be calculated for all categories of fixed capital
investment, including tangible fixed assets and intangible fixed assets such as mineral
exploration costs and computer software. Many times it is not possible to compile the stock of
fixed assets for the whole economy of the country. It is then recommended that the perpetual
inventory method (PIM) should be used to calculate the stock of fixed assets if direct method is
not available.
The PMI method is a straight-line method where the value of the asset is written off at a constant
rate over the whole time of the item. A long historical time series for different asset types of
gross fixed capital formation is needed for this purpose. Different asset types have different
lifetime periods. The current estimates of economic lifetimes for the different types of assets in
South Africa vary between a maximum of 80 years for the construction works and 8 years for
transport equipment.
Table 2: The economic lifetime according to type of asset
Type of asset
Sector Lifetime
Residential buildings 50 years
Non-residential buildings 50 years
Construction works Agriculture 80 years
Mining 30 years
General government 80 years
Other 50 years
Transport equipment 8 years
Machinery & other
equipment
Manufacturing 8 years
Mining & Electricity, gas
and water
16 years
Other 10 years
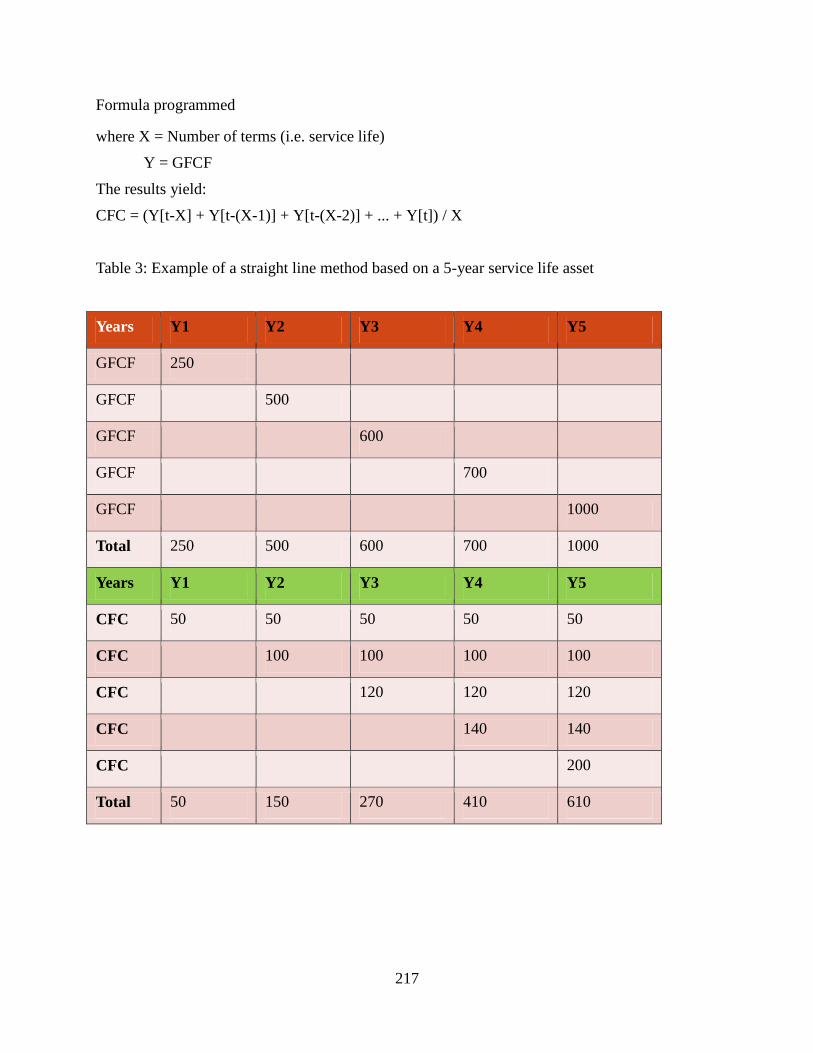
217
Formula programmed
where X = Number of terms (i.e. service life)
Y = GFCF
The results yield:
CFC = (Y[t-X] + Y[t-(X-1)] + Y[t-(X-2)] + ... + Y[t]) / X
Table 3: Example of a straight line method based on a 5-year service life asset
Years Y1 Y2 Y3 Y4 Y5
GFCF 250
GFCF 500
GFCF 600
GFCF 700
GFCF 1000
Total 250 500 600 700 1000
Years Y1 Y2 Y3 Y4 Y5
CFC 50 50 50 50 50
CFC 100 100 100 100
CFC 120 120 120
CFC 140 140
CFC 200
Total 50 150 270 410 610
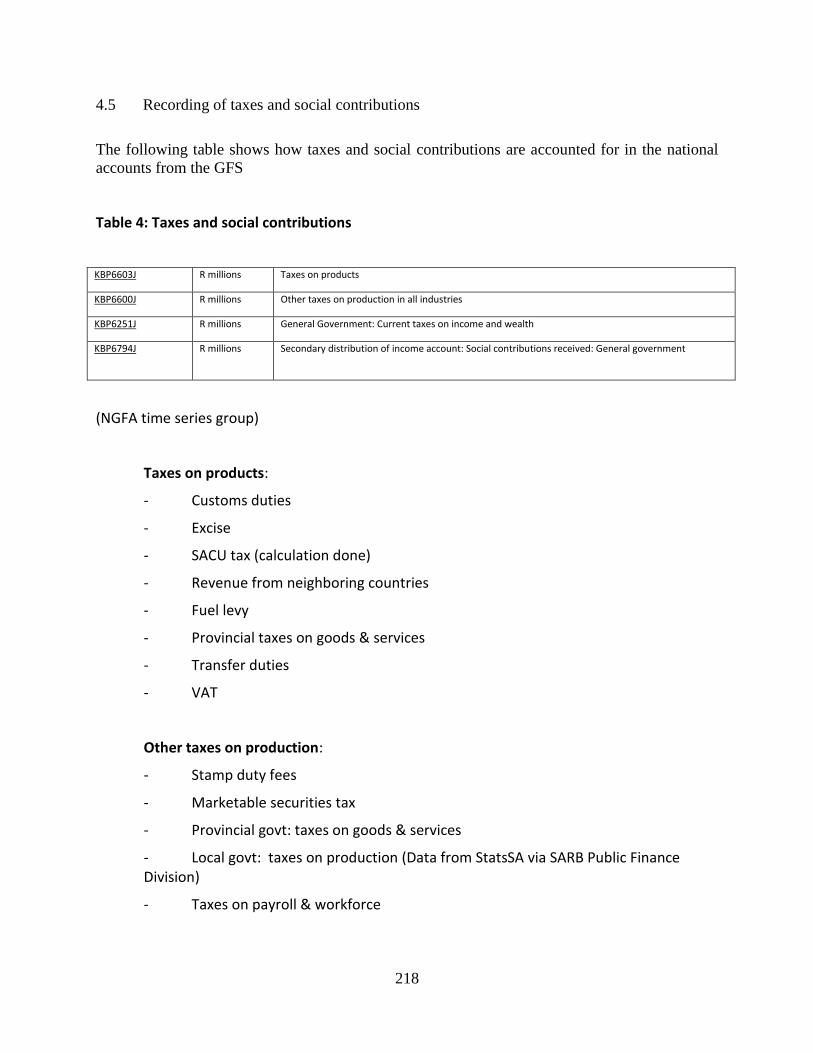
218
4.5 Recording of taxes and social contributions
The following table shows how taxes and social contributions are accounted for in the national
accounts from the GFS
Table 4: Taxes and social contributions
KBP6603J R millions Taxes on products
KBP6600J R millions Other taxes on production in all industries
KBP6251J R millions General Government: Current taxes on income and wealth
KBP6794J R millions Secondary distribution of income account: Social contributions received: General government
(NGFA time series group)
Taxes on products:
- Customs duties
- Excise
- SACU tax (calculation done)
- Revenue from neighboring countries
- Fuel levy
- Provincial taxes on goods & services
- Transfer duties
- VAT
Other taxes on production:
- Stamp duty fees
- Marketable securities tax
- Provincial govt: taxes on goods & services
- Local govt: taxes on production (Data from StatsSA via SARB Public Finance Division)
- Taxes on payroll & workforce
219
- Extra-budgetary institutions: Other taxes (Data from SARB Public Finance Division survey)
Current taxes on income and wealth
- Provincial govt: vehicle taxes
- Income tax from companies
- Income tax from individuals
- Secondary tax on companies
- Interest on overdue income tax
- Extra budgetary institutions: Other taxes (Data from SARB Public Finance Division survey)
- Other taxes on goods & services
- Withholding tax (Departure tax)
- Unallocated tax
Secondary distribution of income account: Social contributions received by Govt
Social security agencies: Social contributions from business enterprises (Data from SARB Public Finance Division survey)
Social security agencies: Social contributions from households (Data from SARB Public Finance Division survey)
5 Issues in using the data and concluding remarks about the best practices followed and
lessons that are relevant for other African countries
5.1 Departmental enterprises and autonomous government institutions
South Africa does not have departmental enterprises and autonomous government institutions
that are fully funded and are not included in government account. However, we have a sub-sector
called extra-budgetary institutions that are autonomous and partly or fully funded by
government. These institutions are included in the general government analysis.

220
Annexure 1
National government analysis
Statistics compiled by the National Treasury are governed by the Public Finance Management Act
(PFMA), Act 1 of 1999 as amended. Before 1 April 2000 the reports were governed by the Exchequer
Act, No 66 of 1975. Local government statistics are compiled by Statistics South Africa (Stats SA) and
governed by the Municipal Finance Management Act No. 56 of 2003.
All statistics are compiled Section 32(1) of the Public Finance Management Act (Act no.1 of 1999)
(PFMA) requires that ―Within 30 days after the end of each month, the National Treasury publish in the
National Government Gazette a statement of actual revenue and expenditure with regard to the National
Revenue Fund‖.
In terms of section 32(3), this publication must specify the following amounts and compare those
amounts in each instance with the corresponding budgeted amounts for the relevant financial year:
(a) The actual revenue for the relevant period, and for the financial year up to the end of that period;
(b) The actual expenditure per vote (distinguishing between capital and current expenditure) for that
period, and for the financial year up to the end of that period; and
(c) Actual borrowings for that period, and for the financial year up to the end of that period.
In terms of section 32(4), the National Treasury may determine:
(a) The format of the statement of revenue and expenditure; and
(b) Any other detail the statement must contain.
To meet the abovementioned requirements of the PFMA this Office publishes the following on monthly
within 30 working days:
• Summary Table;
• Table 1: Revenue;
• Table 2: Expenditure;
• Table 3: Revenue Fund receipts and Direct Exchequer payments;
• Table 4: Financing; and
• Table 5: Summary of Cash Flow
The summary statement summarise revenue less expenditure and the funding of the deficit through the
various financing papers.

221
National government revenue and expenditure are detailed in tables 1 and 2, respectively. The tables
indicate revenue and expenditure for the reporting month, together with comparable figures for the
previous year.
Table 1 figures are received from SARS in the layout as determined by the Estimates of National
Expenditure.
Table 2 figures are extracted from the Vulindlela system. On an annual basis a practice note is issued
determining the month end closure procedures for departments to meet the reporting requirements in
terms section 32 of the PFMA. Month end closure dates are normally about the 7th of a month where after
the expenditure figures are extracted via the Vulindlela system.
Table 3 contains information on extraordinary receipts and payments that are not included as revenue or
expenditure.
Table 4 sets out the net financing for the reporting month compared with the audited outcome for the
same reporting month in the previous year. Table 4 information is received from the Asset and Liability
Management division.
A cash flow schedule for the Exchequer Account is included as table 5, summarising exchequer revenue
to and departmental requisitions from the National Revenue Fund. These flows differ from the actual
receipts and outlays in tables 1 and 2, mainly because of timing differences between the cashbook
transactions of departments and the South African Revenue Service.
On an annual basis a section 32 year planner is compiled for the fiscal year ahead. This determines the
dates for when information must be received by the respective role players namely:
• Asset and Liability Management;
• South African Revenue Services (SARS); and
• The data warehouse system of government – namely Vulindlela
Provincial governments‘ analysis
Monthly In-year Management, Monitoring and Reporting (IYM) by Provincial Departments to Provincial
Treasuries and to National Treasury
Introduction
Section 32 of the PFMA states that National Treasury must publish in the national Government Gazette
within 30 days of the end of each month a statement of actual revenue and expenditure with regard to the
National Revenue Fund. Furthermore, at least quarterly, provincial treasuries have to submit such reports

222
to National Treasury. On quarterly basis a statement of provincial funds is released to the public through a
press release, and the information uploaded to the National Treasury website.
The basis for publishing the required information is the In-Year Management, Monitoring and Reporting
system (IYM). On a monthly basis, the nine provincial treasuries will submit information on their revenue
and expenditure in a form of an IYM Model in excel format in terms of Section 40(4)(b) and (c). The
purpose of the IYM Model is to prescribe the manner in which provincial departments report on their:
• current level of revenue and expenditure against budget
• projections of revenues and expenditure for the remainder of the year
• reasons for deviations from plan, and any remedial steps that need to be taken.
This information is checked for misclassifications of items and double-checked with information
contained in Vulindlela, a National Treasury web based application that incorporates financial (BAS) and
personnel (Persal) systems used by provincial departments.
The information from the nine provincial treasuries in the form of the IYM model is then consolidated
into one provincial dataset, through an automated process.
The activity enables National Treasury to exercise oversight of provincial departments‘ implementation of
their budgets and monthly revenues and expenditure, with a view to being able to pro-actively identify
and manage any serious financial difficulties provinces may encounter during the course of the fiscal
year.
Provincial departments are instructed in terms of the Division of Revenue Act (DoRA) to submit a report
to national departments and respective provincial treasuries within 15 days after the end of each month
regarding amounts received, amounts delayed, actual expenditure, the extent of compliance with
conditions and an explanation of problems and deviations for, among other things, conditional grants.
National departments administering conditional grants are to submit a report to the National Treasury
within 20 days after the end of each month including information on the amounts transferred, the amount
of funds delayed and actual expenditure incurred by their provincial counterparts.
Provincial treasuries must within 22 days after the end of each month report on actual transfers received
from national, actual expenditure and any problems of compliance with the provisions of the DoRA, and
the steps taken to deal with such problems.
In-year Management, Monitoring and Reporting (IYM) Model overview
One standard model, also known as the IYM model, has been developed for provincial departments,
national departments administering conditional grants and provincial treasuries. The model consists of
two files namely IYM model and a Data file. The Data file is used to transfer data between entities
without recapturing data.
223
The numbers captured in the model are programmatically copied to the Data file that will be created
automatically. The use of a Data file eliminates recapturing of data which is very time consuming,
ineffective and may influence the integrity of data. The IYM model automatically makes provision for the
amount of departments and programmes, and conditional grants as captured in the annual Estimates of
Provincial Revenue and Expenditure, and Division of Revenue Act.
Conditional grants reporting
On completion of conditional grants information on the model, the provincial department will create a
Data file that has to be sent (emailed) through to the applicable national department. This is done by
clicking the "Create Data File" on the ―C-Grants‖ sheet. On completion the user will be informed that the
process has been completed. The user must save the datasheet created.
There are ―two types‖ of Data files that could be created, one for the relevant provincial treasury of which
the button is on the ―General‖ sheet; and a Data file for the relevant national department administering
conditional grants of which the button is on the ―C-Grants‖ sheet. It is important to note that the Data file
for national departments administering conditional grants MUST BE CREATED FROM THE ―C-Grants‖
SHEET!
The "Data Sheet" has to be e-mailed to the applicable national department administering the relevant
conditional grants. Users at national departments have a similar model also known as the Conditional
Grants model. The model has been developed in a way that will enable the user to import data from
reports (―Data files‖) received from provincial departments.
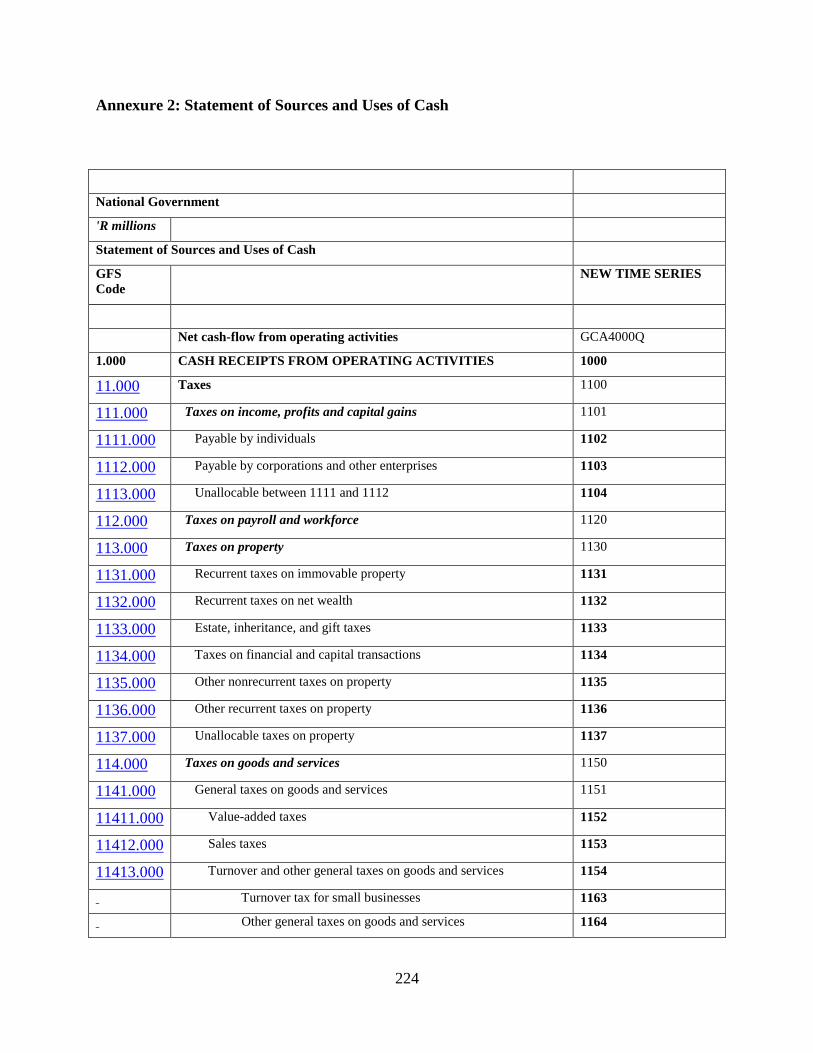
224
Annexure 2: Statement of Sources and Uses of Cash
National Government
'R millions
Statement of Sources and Uses of Cash
GFS
Code
NEW TIME SERIES
Net cash-flow from operating activities GCA4000Q
1.000 CASH RECEIPTS FROM OPERATING ACTIVITIES 1000
11.000
Taxes 1100
111.000
Taxes on income, profits and capital gains 1101
1111.000
Payable by individuals 1102
1112.000
Payable by corporations and other enterprises 1103
1113.000
Unallocable between 1111 and 1112 1104
112.000
Taxes on payroll and workforce 1120
113.000
Taxes on property 1130
1131.000
Recurrent taxes on immovable property 1131
1132.000
Recurrent taxes on net wealth 1132
1133.000
Estate, inheritance, and gift taxes 1133
1134.000
Taxes on financial and capital transactions 1134
1135.000
Other nonrecurrent taxes on property 1135
1136.000
Other recurrent taxes on property 1136
1137.000
Unallocable taxes on property 1137
114.000
Taxes on goods and services 1150
1141.000
General taxes on goods and services 1151
11411.000
Value-added taxes 1152
11412.000
Sales taxes 1153
11413.000
Turnover and other general taxes on goods and services 1154
Turnover tax for small businesses 1163
Other general taxes on goods and services 1164
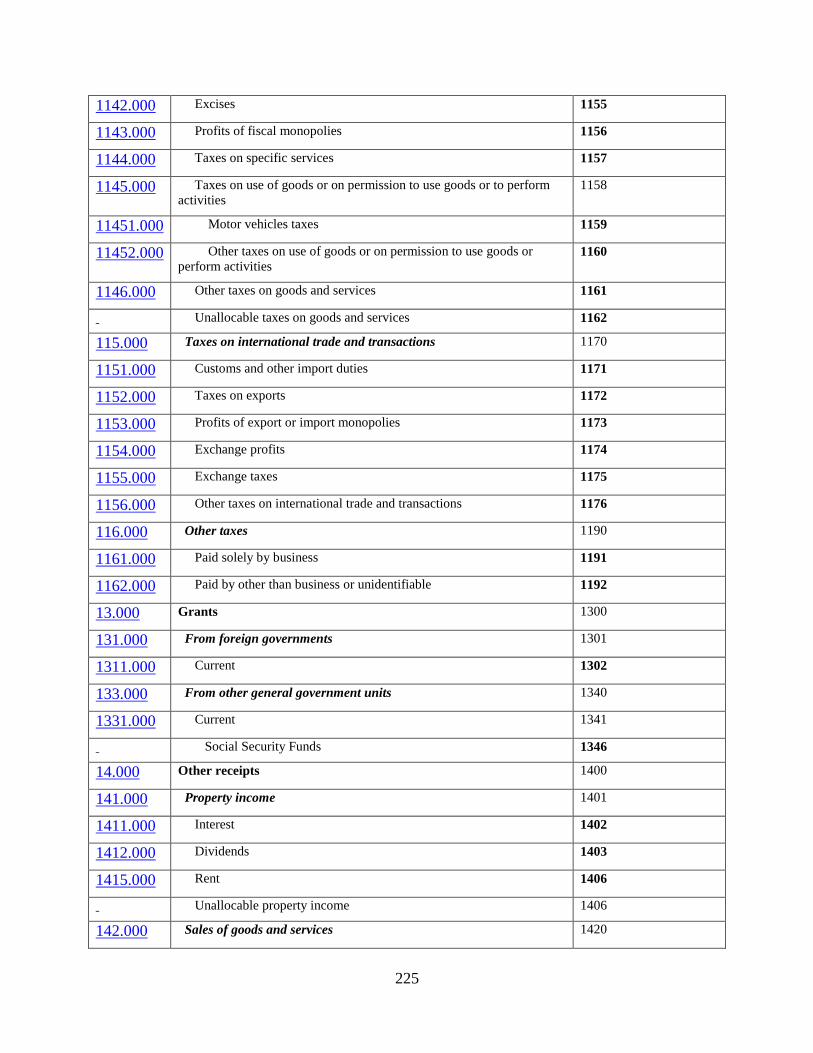
225
1142.000
Excises 1155
1143.000
Profits of fiscal monopolies 1156
1144.000
Taxes on specific services 1157
1145.000
Taxes on use of goods or on permission to use goods or to perform
activities
1158
11451.000
Motor vehicles taxes 1159
11452.000
Other taxes on use of goods or on permission to use goods or
perform activities 1160
1146.000
Other taxes on goods and services 1161
Unallocable taxes on goods and services 1162
115.000
Taxes on international trade and transactions 1170
1151.000
Customs and other import duties 1171
1152.000
Taxes on exports 1172
1153.000
Profits of export or import monopolies 1173
1154.000
Exchange profits 1174
1155.000
Exchange taxes 1175
1156.000
Other taxes on international trade and transactions 1176
116.000
Other taxes 1190
1161.000
Paid solely by business 1191
1162.000
Paid by other than business or unidentifiable 1192
13.000
Grants 1300
131.000
From foreign governments 1301
1311.000
Current 1302
133.000
From other general government units 1340
1331.000
Current 1341
Social Security Funds 1346
14.000
Other receipts 1400
141.000
Property income 1401
1411.000
Interest 1402
1412.000
Dividends 1403
1415.000
Rent 1406
Unallocable property income 1406
142.000
Sales of goods and services 1420
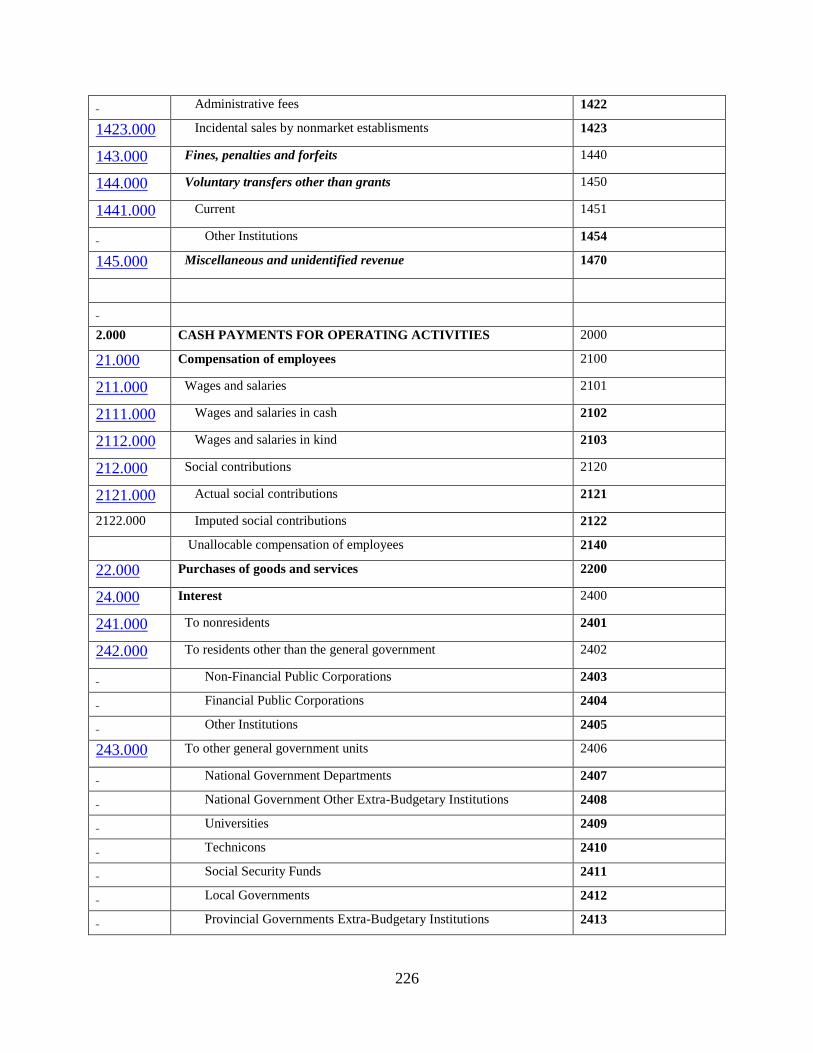
226
Administrative fees 1422
1423.000
Incidental sales by nonmarket establisments 1423
143.000
Fines, penalties and forfeits 1440
144.000
Voluntary transfers other than grants 1450
1441.000
Current 1451
Other Institutions 1454
145.000
Miscellaneous and unidentified revenue 1470
2.000 CASH PAYMENTS FOR OPERATING ACTIVITIES 2000
21.000
Compensation of employees 2100
211.000
Wages and salaries 2101
2111.000
Wages and salaries in cash 2102
2112.000
Wages and salaries in kind 2103
212.000
Social contributions 2120
2121.000
Actual social contributions 2121
2122.000 Imputed social contributions 2122
Unallocable compensation of employees 2140
22.000
Purchases of goods and services 2200
24.000
Interest 2400
241.000
To nonresidents 2401
242.000
To residents other than the general government 2402
Non-Financial Public Corporations 2403
Financial Public Corporations 2404
Other Institutions 2405
243.000
To other general government units 2406
National Government Departments 2407
National Government Other Extra-Budgetary Institutions 2408
Universities 2409
Technicons 2410
Social Security Funds 2411
Local Governments 2412
Provincial Governments Extra-Budgetary Institutions 2413
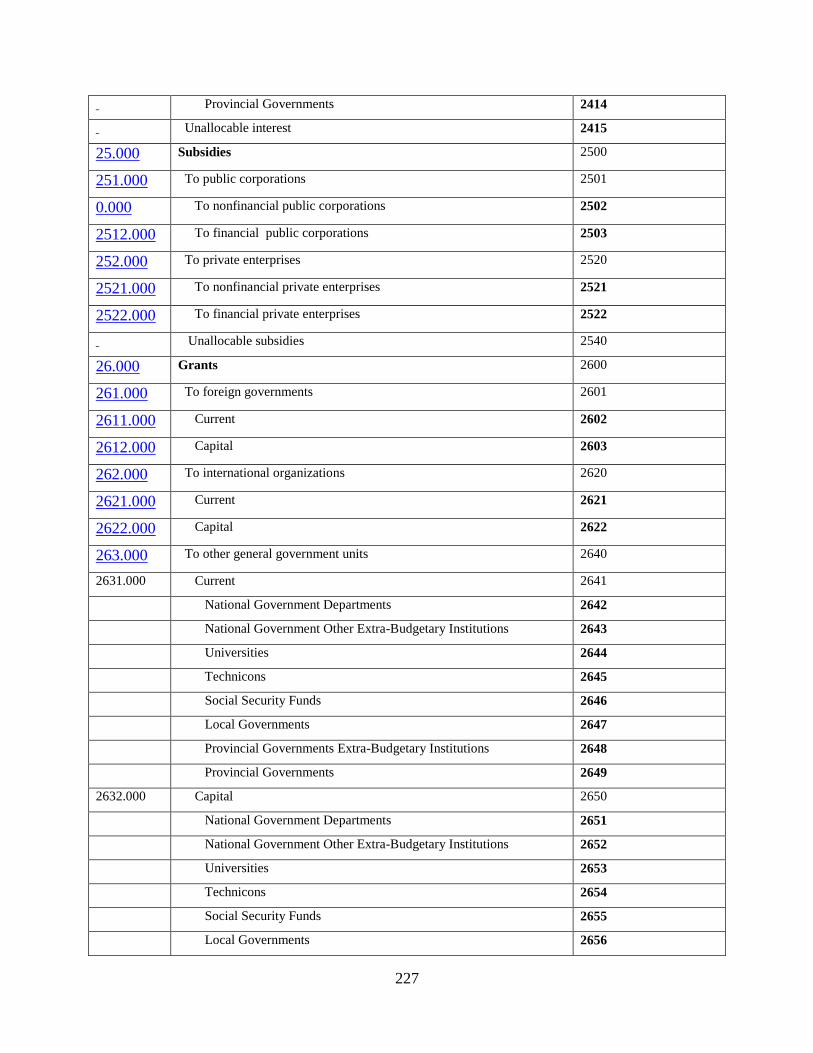
227
Provincial Governments 2414
Unallocable interest 2415
25.000
Subsidies 2500
251.000
To public corporations 2501
0.000
To nonfinancial public corporations 2502
2512.000
To financial public corporations 2503
252.000
To private enterprises 2520
2521.000
To nonfinancial private enterprises 2521
2522.000
To financial private enterprises 2522
Unallocable subsidies 2540
26.000
Grants 2600
261.000
To foreign governments 2601
2611.000
Current 2602
2612.000
Capital 2603
262.000
To international organizations 2620
2621.000
Current 2621
2622.000
Capital 2622
263.000
To other general government units 2640
2631.000 Current 2641
National Government Departments 2642
National Government Other Extra-Budgetary Institutions 2643
Universities 2644
Technicons 2645
Social Security Funds 2646
Local Governments 2647
Provincial Governments Extra-Budgetary Institutions 2648
Provincial Governments 2649
2632.000 Capital 2650
National Government Departments 2651
National Government Other Extra-Budgetary Institutions 2652
Universities 2653
Technicons 2654
Social Security Funds 2655
Local Governments 2656
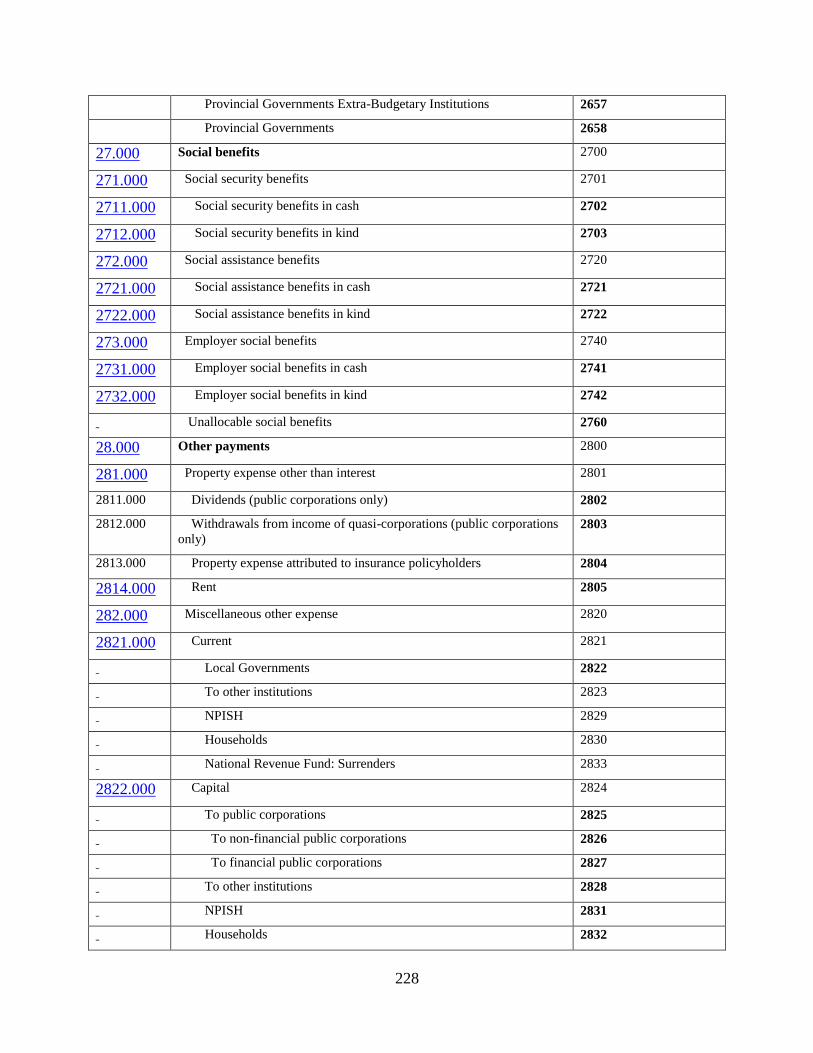
228
Provincial Governments Extra-Budgetary Institutions 2657
Provincial Governments 2658
27.000
Social benefits 2700
271.000
Social security benefits 2701
2711.000
Social security benefits in cash 2702
2712.000
Social security benefits in kind 2703
272.000
Social assistance benefits 2720
2721.000
Social assistance benefits in cash 2721
2722.000
Social assistance benefits in kind 2722
273.000
Employer social benefits 2740
2731.000
Employer social benefits in cash 2741
2732.000
Employer social benefits in kind 2742
Unallocable social benefits 2760
28.000
Other payments 2800
281.000
Property expense other than interest 2801
2811.000 Dividends (public corporations only) 2802
2812.000 Withdrawals from income of quasi-corporations (public corporations
only) 2803
2813.000 Property expense attributed to insurance policyholders 2804
2814.000
Rent 2805
282.000
Miscellaneous other expense 2820
2821.000
Current 2821
Local Governments 2822
To other institutions 2823
NPISH 2829
Households 2830
National Revenue Fund: Surrenders 2833
2822.000
Capital 2824
To public corporations 2825
To non-financial public corporations 2826
To financial public corporations 2827
To other institutions 2828
NPISH 2831
Households 2832
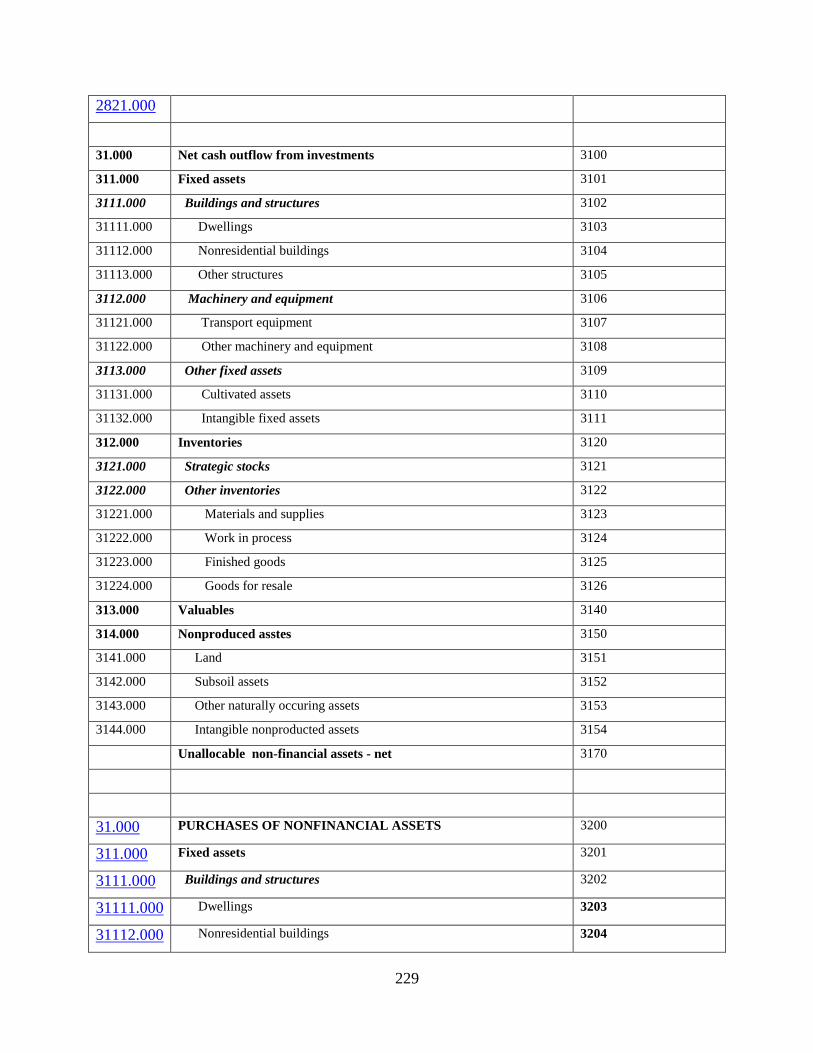
229
2821.000
31.000 Net cash outflow from investments 3100
311.000 Fixed assets 3101
3111.000 Buildings and structures 3102
31111.000 Dwellings 3103
31112.000 Nonresidential buildings 3104
31113.000 Other structures 3105
3112.000 Machinery and equipment 3106
31121.000 Transport equipment 3107
31122.000 Other machinery and equipment 3108
3113.000 Other fixed assets 3109
31131.000 Cultivated assets 3110
31132.000 Intangible fixed assets 3111
312.000 Inventories 3120
3121.000 Strategic stocks 3121
3122.000 Other inventories 3122
31221.000 Materials and supplies 3123
31222.000 Work in process 3124
31223.000 Finished goods 3125
31224.000 Goods for resale 3126
313.000 Valuables 3140
314.000 Nonproduced asstes 3150
3141.000 Land 3151
3142.000 Subsoil assets 3152
3143.000 Other naturally occuring assets 3153
3144.000 Intangible nonproducted assets 3154
Unallocable non-financial assets - net 3170
31.000
PURCHASES OF NONFINANCIAL ASSETS 3200
311.000
Fixed assets 3201
3111.000
Buildings and structures 3202
31111.000
Dwellings 3203
31112.000
Nonresidential buildings 3204
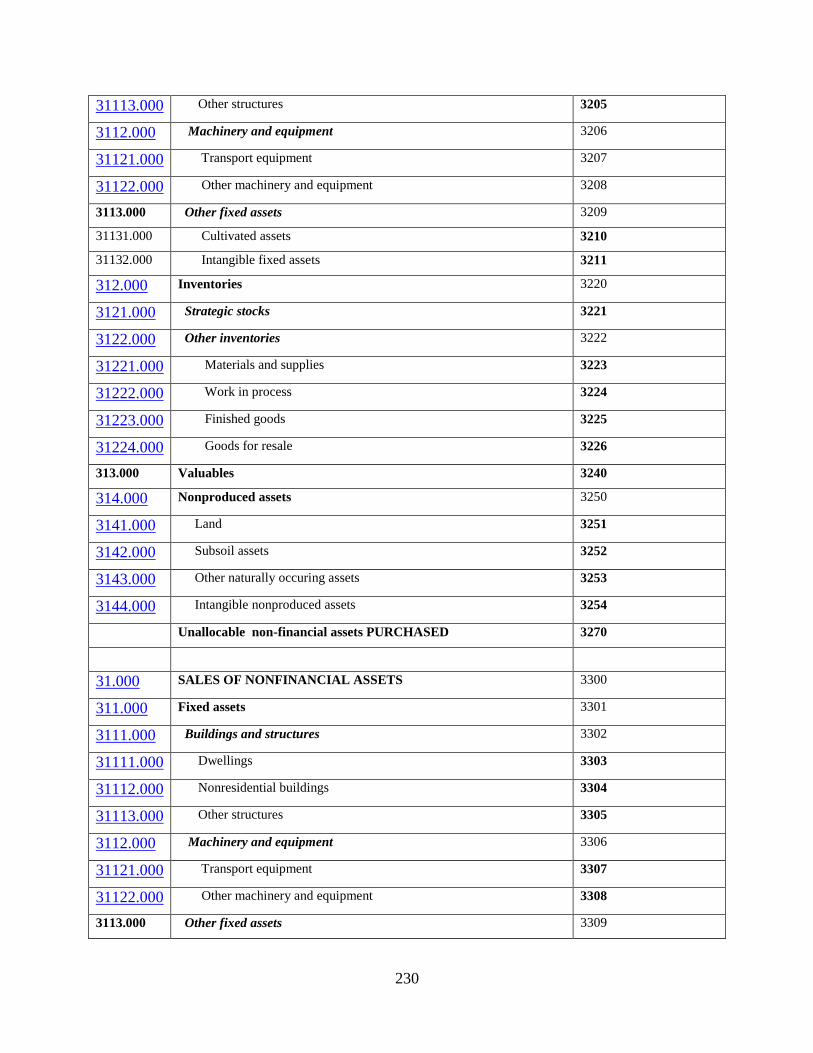
230
31113.000
Other structures 3205
3112.000
Machinery and equipment 3206
31121.000
Transport equipment 3207
31122.000
Other machinery and equipment 3208
3113.000 Other fixed assets 3209
31131.000 Cultivated assets 3210
31132.000 Intangible fixed assets 3211
312.000
Inventories 3220
3121.000
Strategic stocks 3221
3122.000
Other inventories 3222
31221.000
Materials and supplies 3223
31222.000
Work in process 3224
31223.000
Finished goods 3225
31224.000
Goods for resale 3226
313.000 Valuables 3240
314.000
Nonproduced assets 3250
3141.000
Land 3251
3142.000
Subsoil assets 3252
3143.000
Other naturally occuring assets 3253
3144.000
Intangible nonproduced assets 3254
Unallocable non-financial assets PURCHASED 3270
31.000
SALES OF NONFINANCIAL ASSETS 3300
311.000
Fixed assets 3301
3111.000
Buildings and structures 3302
31111.000
Dwellings 3303
31112.000
Nonresidential buildings 3304
31113.000
Other structures 3305
3112.000
Machinery and equipment 3306
31121.000
Transport equipment 3307
31122.000
Other machinery and equipment 3308
3113.000 Other fixed assets 3309
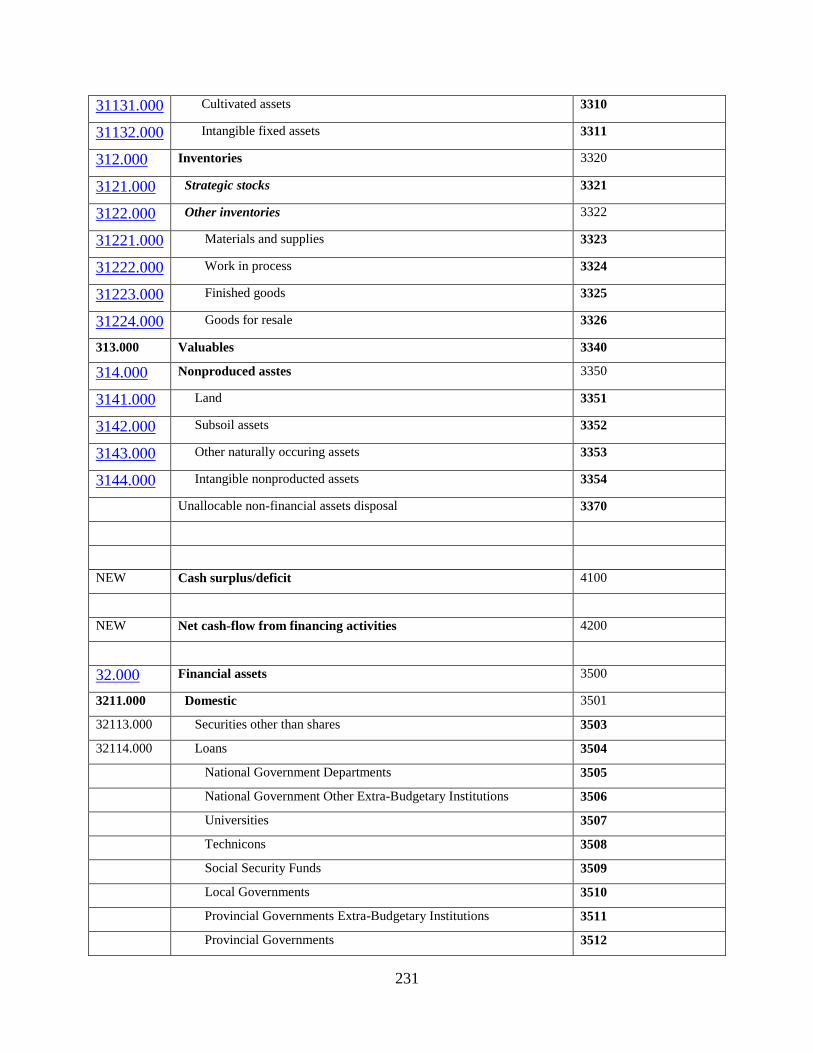
231
31131.000
Cultivated assets 3310
31132.000
Intangible fixed assets 3311
312.000
Inventories 3320
3121.000
Strategic stocks 3321
3122.000
Other inventories 3322
31221.000
Materials and supplies 3323
31222.000
Work in process 3324
31223.000
Finished goods 3325
31224.000
Goods for resale 3326
313.000 Valuables 3340
314.000
Nonproduced asstes 3350
3141.000
Land 3351
3142.000
Subsoil assets 3352
3143.000
Other naturally occuring assets 3353
3144.000
Intangible nonproducted assets 3354
Unallocable non-financial assets disposal 3370
NEW Cash surplus/deficit 4100
NEW Net cash-flow from financing activities 4200
32.000
Financial assets 3500
3211.000 Domestic 3501
32113.000 Securities other than shares 3503
32114.000 Loans 3504
National Government Departments 3505
National Government Other Extra-Budgetary Institutions 3506
Universities 3507
Technicons 3508
Social Security Funds 3509
Local Governments 3510
Provincial Governments Extra-Budgetary Institutions 3511
Provincial Governments 3512
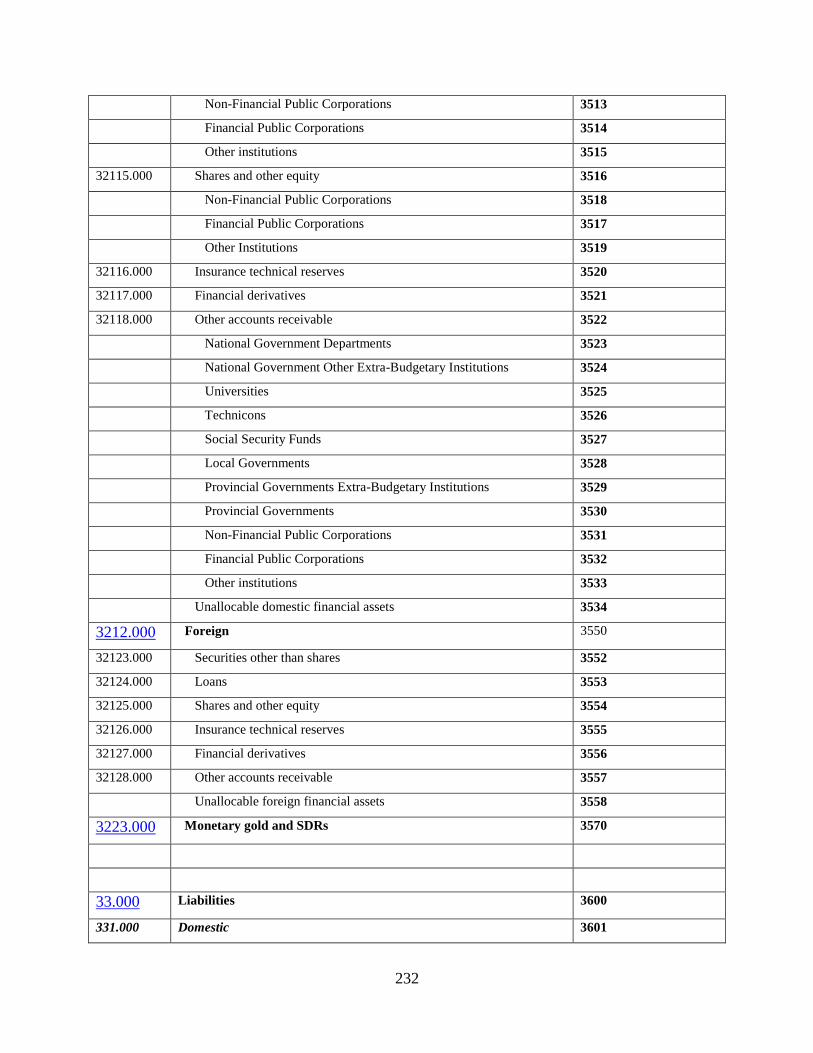
232
Non-Financial Public Corporations 3513
Financial Public Corporations 3514
Other institutions 3515
32115.000 Shares and other equity 3516
Non-Financial Public Corporations 3518
Financial Public Corporations 3517
Other Institutions 3519
32116.000 Insurance technical reserves 3520
32117.000 Financial derivatives 3521
32118.000 Other accounts receivable 3522
National Government Departments 3523
National Government Other Extra-Budgetary Institutions 3524
Universities 3525
Technicons 3526
Social Security Funds 3527
Local Governments 3528
Provincial Governments Extra-Budgetary Institutions 3529
Provincial Governments 3530
Non-Financial Public Corporations 3531
Financial Public Corporations 3532
Other institutions 3533
Unallocable domestic financial assets 3534
3212.000
Foreign 3550
32123.000 Securities other than shares 3552
32124.000 Loans 3553
32125.000 Shares and other equity 3554
32126.000 Insurance technical reserves 3555
32127.000 Financial derivatives 3556
32128.000 Other accounts receivable 3557
Unallocable foreign financial assets 3558
3223.000
Monetary gold and SDRs 3570
33.000
Liabilities 3600
331.000 Domestic 3601
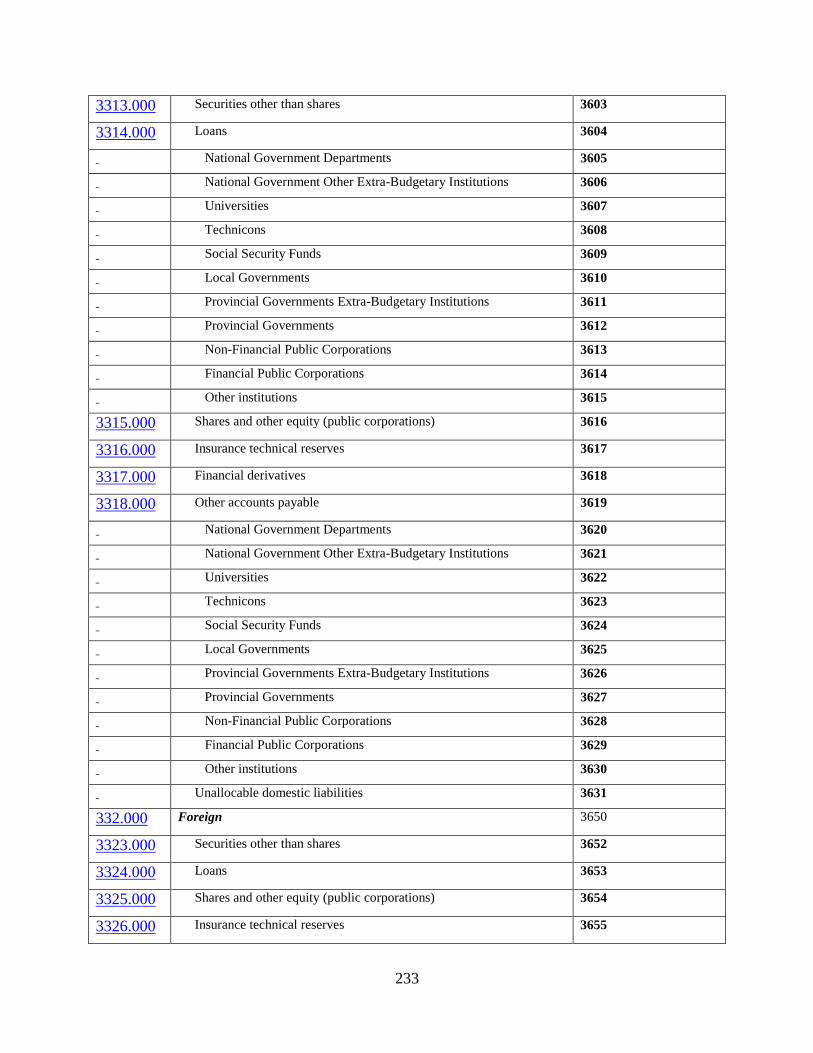
233
3313.000
Securities other than shares 3603
3314.000
Loans 3604
National Government Departments 3605
National Government Other Extra-Budgetary Institutions 3606
Universities 3607
Technicons 3608
Social Security Funds 3609
Local Governments 3610
Provincial Governments Extra-Budgetary Institutions 3611
Provincial Governments 3612
Non-Financial Public Corporations 3613
Financial Public Corporations 3614
Other institutions 3615
3315.000
Shares and other equity (public corporations) 3616
3316.000
Insurance technical reserves 3617
3317.000
Financial derivatives 3618
3318.000
Other accounts payable 3619
National Government Departments 3620
National Government Other Extra-Budgetary Institutions 3621
Universities 3622
Technicons 3623
Social Security Funds 3624
Local Governments 3625
Provincial Governments Extra-Budgetary Institutions 3626
Provincial Governments 3627
Non-Financial Public Corporations 3628
Financial Public Corporations 3629
Other institutions 3630
Unallocable domestic liabilities 3631
332.000
Foreign 3650
3323.000
Securities other than shares 3652
3324.000
Loans 3653
3325.000
Shares and other equity (public corporations) 3654
3326.000
Insurance technical reserves 3655
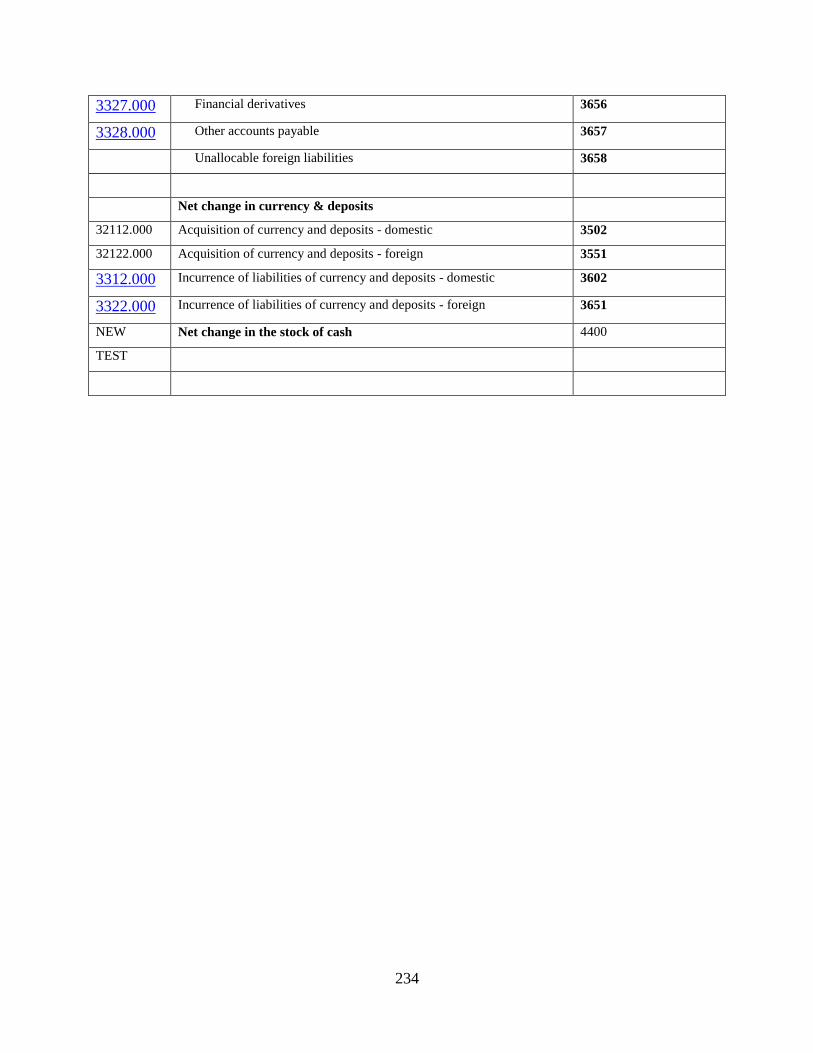
234
3327.000
Financial derivatives 3656
3328.000
Other accounts payable 3657
Unallocable foreign liabilities 3658
Net change in currency & deposits
32112.000 Acquisition of currency and deposits - domestic 3502
32122.000 Acquisition of currency and deposits - foreign 3551
3312.000
Incurrence of liabilities of currency and deposits - domestic 3602
3322.000
Incurrence of liabilities of currency and deposits - foreign 3651
NEW Net change in the stock of cash 4400
TEST

235
Annexure 3: Bridging table
Bridging Table:
Production, distribution and accumulation accounts of SA – General government and Government finance
statistics of consolidated general government – Statement of sources and uses of cash.
Purpose: To reconciliate items and to explain the reasons for differences in data.
National Accounts (NA): The Production, distribution and accumulation accounts of SA for General
government table provides a snapshot of all the flows to and from the government sector in a calendar
year.
Government Finance Statistics (GFS): The Government finance statistics of consolidated general
government – Statement of sources and uses of cash table is a quarterly view of government‘s netted out
cash flows.
Notes:
-Annual totals in the GFS table represents fiscal years whereas the NA table indicates calendar years.
Calendar year totals of the GFS table items were obtained from the mainframe using the KBP time series
numbers.
-The GFS table is based on the cash principle whereas the NA table is compiled on the accrual principle.
-Items in both the NA and GFS table are reconciled with StatsSA publications (Financial statistics of
consolidated general government, P9119.4) and will be equal on a fiscal year i.e. Compensation of
employees and Taxes.
-Both the NA and GFS tables include:
•National government, Extra Budgetary institutions (including universities) and Social Security agencies.
•Provincial government
•Local government but the NA table also includes Local business enterprises.
-Note 1: Social benefits contributions received by government‘s social security agencies from households
and corporations
-Note 2: The NA table does not include the item ―Grants
For the item ―Grants‖ in the GFS table all grants between levels of government have been netted out. The
figure in the table represents grants to and from foreign governments. The foreign grants are included in
the total for Miscellaneous transfers from govt in the NA table (D75)
-Note 3: No corresponding item in NA table
-Note 4: The NA table includes compensation of local government enterprises whereas the GFA table
does not.

236
-Note 5: Due to classification differences pertaining to capital transfers, miscellaneous transfers, subsidies
etc, certain items may differ in the two tables i.e. items G11 and D31 and D39.
-Note 6: Social benefits paid by government‘s social security agencies to households.
-Note 7: The item other expense (G14) in the GFS table refers to dividends paid, maintenance on
buildings and miscellaneous running costs.
-Note 8: The items ―Purchases of non-financial assets‖ (G16) and ―Sales of non-financial assets‖ (G17) in
the GFS table include purchases/sales of land which the corresponding item: Gross fixed capital
formation (P51) in the NA table excludes.
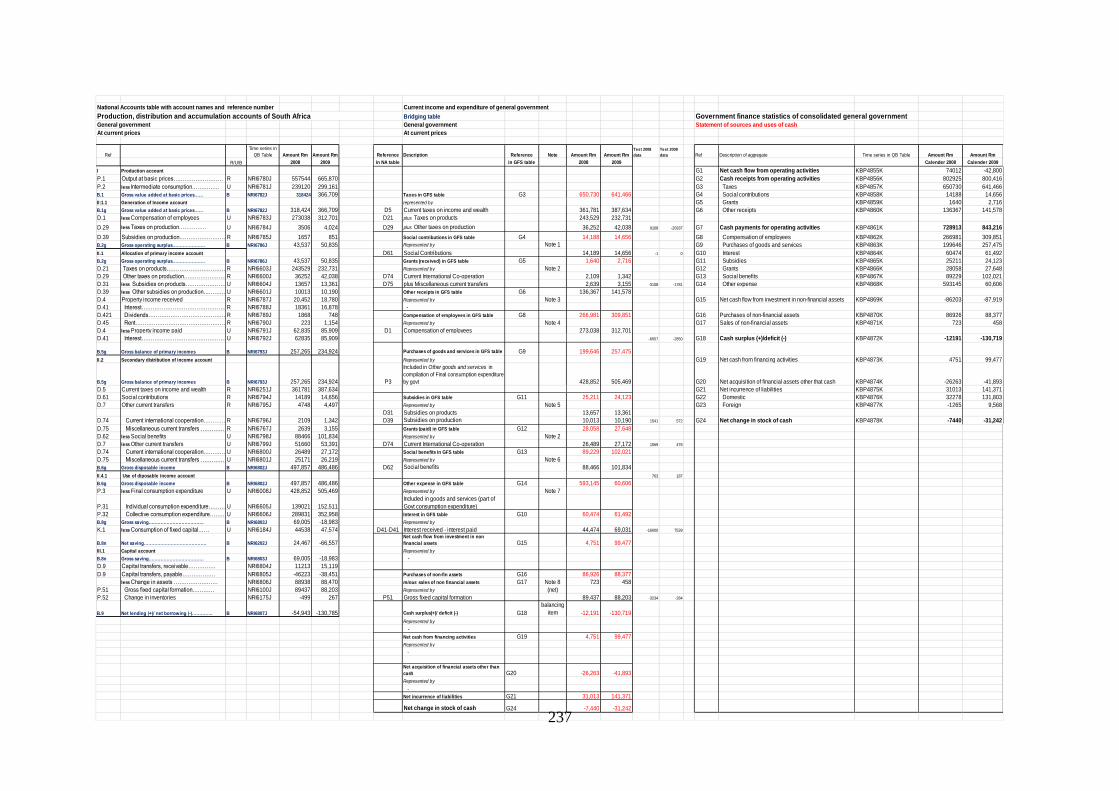
237
National Accounts table with account names and reference number
Bridging table Government finance statistics of consolidated general governmentGeneral government General government Statement of sources and uses of cash
At current prices At current prices
Ref
Time series in
QB Table Amount Rm Amount Rm Reference Description Reference Note Amount Rm Amount RmTest 2008
data
Test 2009
data Ref Description of aggregate Time series in QB Table Amount Rm Amount Rm
R/U/B 2008 2009 in NA table in GFS table 2008 2009 Calender 2008 Calender 2009
I Production account G1 Net cash flow from operating activities KBP4855K 74012 -42,800
P.1 Output at basic prices……………………… R NRI6780J 557544 665,870 G2 Cash receipts from operating activities KBP4856K 802925 800,416
P.2 less Intermediate consumption…………… U NRI6781J 239120 299,161 G3 Taxes KBP4857K 650730 641,466
B.1 Gross value added at basic prices…… B NRI6782J 318424 366,709 Taxes in GFS table G3 650,730 641,466 G4 Social contributions KBP4858K 14188 14,656
II:1.1 Generation of Income account represented by G5 Grants KBP4859K 1640 2,716
B.1g Gross value added at basic prices…… B NRI6782J 318,424 366,709 D5 Current taxes on income and wealth 361,781 387,634 G6 Other receipts KBP4860K 136367 141,578
D.1 less Compensation of employees U NRI6783J 273038 312,701 D21 plus Taxes on products 243,529 232,731
D.29 less Taxes on production…………… U NRI6784J 3506 4,024 D29 plus Other taxes on production 36,252 42,038 9168 -20937 G7 Cash payments for operating activities KBP4861K 728913 843,216
D.39 Subsidies on production…………………………..R NRI6785J 1657 851 Social contributions in GFS table G4 14,188 14,656 G8 Compensation of employees KBP4862K 266981 309,851
B.2g Gross operating surplus…………………. B NRI6786J 43,537 50,835 Represented by Note 1 G9 Purchases of goods and services KBP4863K 199646 257,475
II.1 Allocation of primary income account D61 Social Contributions 14,189 14,656 -1 0 G10 Interest KBP4864K 60474 61,492
B.2g Gross operating surplus…………………. B NRI6786J 43,537 50,835 Grants (received) in GFS table G5 1,640 2,716 G11 Subsidies KBP4865K 25211 24,123
D.21 Taxes on products………………………………..R NRI6603J 243529 232,731 Represented by Note 2 G12 Grants KBP4866K 28058 27,648
D.29 Other taxes on production……………………………..R NRI6600J 36252 42,038 D74 Current International Co-operation 2,109 1,342 G13 Social benefits KBP4867K 89229 102,021
D.31 less Subsidies on products……………………U NRI6604J 13657 13,361 D75 plus Miscellaneous current transfers 2,639 3,155 -3108 -1781 G14 Other expense KBP4868K 593145 60,606
D.39 less Other subsidies on production…………………U NRI6601J 10013 10,190 Other receipts in GFS table G6 136,367 141,578
D.4 Property income received R NRI6787J 20,452 18,780 Represented by Note 3 G15 Net cash flow from investment in non-financial assets KBP4869K -86203 -87,919
D.41 Interest…………………………………………….R NRI6788J 18361 16,878 -
D.421 Dividends…………………………………… R NRI6789J 1868 748 Compensation of employees in GFS table G8 266,981 309,851 G16 Purchases of non-financial assets KBP4870K 86926 88,377
D.45 Rent………………………………………………..R NRI6790J 223 1,154 Represented by Note 4 G17 Sales of non-financial assets KBP4871K 723 458
D.4 less Property income paid U NRI6791J 62,835 85,909 D1 Compensation of employees 273,038 312,701
D.41 Interest…………………………………………….U NRI6792J 62835 85,909 -6057 -2850 G18 Cash surplus (+)/deficit (-) KBP4872K -12191 -130,719
B.5g Gross balance of primary incomes B NRI6793J 257,265 234,924 Purchases of goods and services in GFS table G9 199,646 257,475
II.2 Secondary distribution of income account Represented by G19 Net cash from financing activities KBP4873K 4751 99,477
B.5g Gross balance of primary incomes B NRI6793J 257,265 234,924 P3
Included in Other goods and services in
compilation of Final consumption expenditure
by govt 428,852 505,469 G20 Net acquisition of financial assets other that cash KBP4874K -26263 -41,893
D.5 Current taxes on income and wealth R NRI6251J 361781 387,634 G21 Net incurrence of liabilities KBP4875K 31013 141,371
D.61 Social contributions R NRI6794J 14189 14,656 Subsidies in GFS table G11 25,211 24,123 G22 Domestic KBP4876K 32278 131,803
D.7 Other current transfers R NRI6795J 4748 4,497 Represented by Note 5 G23 Foreign KBP4877K -1265 9,568
D31 Subsidies on products 13,657 13,361
D.74 Current international cooperation……………..R NRI6796J 2109 1,342 D39 Subsidies on production 10,013 10,190 1541 572 G24 Net change in stock of cash KBP4878K -7440 -31,242
D.75 Miscellaneous current transfers ……………….R NRI6767J 2639 3,155 Grants (paid) in GFS table G12 28,058 27,648
D.62 less Social benefits U NRI6798J 88466 101,834 Represented by Note 2
D.7 less Other current transfers U NRI6799J 51660 53,391 D74 Current International Co-operation 26,489 27,172 1569 476
D.74 Current international cooperation……………..U NRI6800J 26489 27,172 Social benefits in GFS table G13 89,229 102,021
D.75 Miscellaneous current transfers ……………….U NRI6801J 25171 26,219 Represented by Note 6
B.6g Gross disposable income B NRI6802J 497,857 486,486 D62 Social benefits 88,466 101,834
II.4.1 Use of diposable income account 763 187
B.6g Gross disposable income B NRI6802J 497,857 486,486 Other expense in GFS table G14 593,145 60,606
P.3 less Final consumption expenditure U NRI6008J 428,852 505,469 Represented by Note 7
P.31 Individual consumption expenditure…………….U NRI6605J 139021 152,511
Included in goods and services (part of
Govt consumption expenditure)
P.32 Collective consumption expenditure……………U NRI6606J 289831 352,958 Interest in GFS table G10 60,474 61,492
B.8g Gross saving………………………………. B NRI6803J 69,005 -18,983 Represented by
K.1 less Consumption of fixed capital…… U NRI6184J 44538 47,574 D41-D41 Interest received - interest paid 44,474 69,031 -16000 7539
B.8n Net saving…………………………………… B NRI6202J 24,467 -66,557Net cash flow from investment in non
financial assets G15 4,751 99,477
III.1 Capital account Represented by
B.8n Gross saving………………………………. B NRI6803J 69,005 -18,983 -
D.9 Capital transfers, receivable…………… NRI6804J 11213 15,119
D.9 Capital transfers, payable……………… NRI6805J -46223 -38,451 Purchases of non-fin assets G16 86,926 88,377
less Change in assets …………………… NRI6806J 88938 88,470 minus sales of non financial assets G17 Note 8 723 458
P.51 Gross fixed capital formation………… NRI6100J 89437 88,203 Represented by (net)
P.52 Change in inventories NRI6175J -499 267 P51 Gross fixed capital formation 89,437 88,203 -3234 -284
B.9 Net lending (+)/ net borrowing (-)………….. B NRI6807J -54,943 -130,785 Cash surplus(+)/ deficit (-) G18
balancing
item -12,191 -130,719
Represented by
-
Net cash from financing activities G19 4,751 99,477
Represented by
-
Net acquisition of financial assets other than
cash G20 -26,263 -41,893
Represented by
-
Net incurrence of liabilities G21 31,013 141,371
Net change in stock of cash G24 -7,440 -31,242
Current income and expenditure of general government
Production, distribution and accumulation accounts of South Africa

238
Annex B: Use of Financial Statements of Financial Corporations in National Accounts
Egypt: “Financial Sectors”

239
Case Study: Egypt on Financial sectors
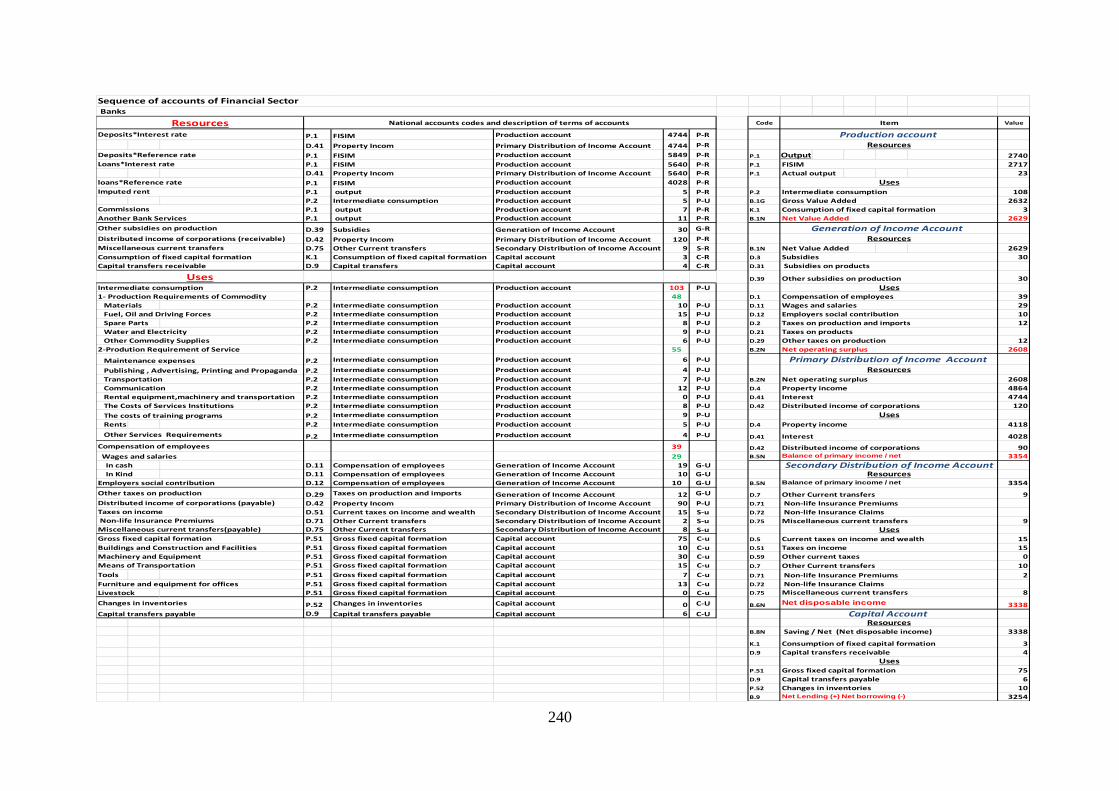
240
Code Value
P.1 FISIM Production account 4744 P-R
D.41 Property Incom Primary Distribution of Income Account 4744 P-R
P.1 FISIM Production account 5849 P-R P.1 Output 2740
P.1 FISIM Production account 5640 P-R P.1 2717
D.41 Property Incom Primary Distribution of Income Account 5640 P-R P.1 Actual output 23
P.1 FISIM Production account 4028 P-R
P.1 output Production account 5 P-R P.2 108
P.2 Intermediate consumption Production account 5 P-U B.1G 2632
P.1 output Production account 7 P-R K.1 3
Another Bank Services P.1 output Production account 11 P-R B.1N 2629
D.39 Subsidies Generation of Income Account 30 G-R
D.42 Property Incom Primary Distribution of Income Account 120 P-R
D.75 Other Current transfers Secondary Distribution of Income Account 9 S-R B.1N Net Value Added 2629
K.1 Consumption of fixed capital formation Capital account 3 C-R D.3 30
D.9 Capital transfers Capital account 4 C-R D.31
D.39 30
Intermediate consumption P.2 Intermediate consumption Production account 103 P-U
1- Production Requirements of Commodity 48 D.1 39
Materials P.2 Intermediate consumption Production account 10 P-U D.11 29
Fuel, Oil and Driving Forces P.2 Intermediate consumption Production account 15 P-U D.12 10
Spare Parts P.2 Intermediate consumption Production account 8 P-U D.2 12
Water and Electricity P.2 Intermediate consumption Production account 9 P-U D.21
Other Commodity Supplies P.2 Intermediate consumption Production account 6 P-U D.29 12
2-Prodution Requirement of Service 55 B.2N 2608
Maintenance expenses P.2 Intermediate consumption Production account 6 P-U
Publishing , Advertising, Printing and Propaganda P.2 Intermediate consumption Production account 4 P-U
Transportation P.2 Intermediate consumption Production account 7 P-U B.2N 2608
Communication P.2 Intermediate consumption Production account 12 P-U D.4 4864
Rental equipment,machinery and transportation P.2 Intermediate consumption Production account 0 P-U D.41 4744
The Costs of Services Institutions P.2 Intermediate consumption Production account 8 P-U D.42 120
The costs of training programs P.2 Intermediate consumption Production account 9 P-U
Rents P.2 Intermediate consumption Production account 5 P-U D.4 4118
P.2 Intermediate consumption Production account 4 P-U D.41 4028
39 D.42 90
Wages and salaries 29 B.5N 3354
In cash D.11 Compensation of employees Generation of Income Account 19 G-U
In Kind D.11 Compensation of employees Generation of Income Account 10 G-U
D.12 Compensation of employees Generation of Income Account 10 G-U B.5N 3354
D.29 Taxes on production and imports Generation of Income Account 12 G-U D.7 9
D.42 Property Incom Primary Distribution of Income Account 90 P-U D.71
D.51 Current taxes on income and wealth Secondary Distribution of Income Account 15 S-u D.72
D.71 Other Current transfers Secondary Distribution of Income Account 2 S-u D.75 9
D.75 Other Current transfers Secondary Distribution of Income Account 8 S-u
Gross fixed capital formation P.51 Gross fixed capital formation Capital account 75 C-u D.5 15
Buildings and Construction and Facilities P.51 Gross fixed capital formation Capital account 10 C-u D.51 15
Machinery and Equipment P.51 Gross fixed capital formation Capital account 30 C-u D.59 0
Means of Transportation P.51 Gross fixed capital formation Capital account 15 C-u D.7 10
Tools P.51 Gross fixed capital formation Capital account 7 C-u D.71 2
Furniture and equipment for offices P.51 Gross fixed capital formation Capital account 13 C-u D.72
Livestock P.51 Gross fixed capital formation Capital account 0 C-u D.75 8
P.52 Changes in inventories Capital account 0 C-U B.6N 3338
Capital transfers payable D.9 Capital transfers payable Capital account 6 C-U
B.8N 3338
K.1 3
D.9 4
P.51 75
D.9 6
P.52 10
B.9 3254
Uses
Other Services Requirements
Compensation of employees
Other taxes on production
Sequence of accounts of Financial Sector Banks
Consumption of fixed capital formation
Imputed rent
National accounts codes and description of terms of accounts
Deposits*Reference rate
Loans*Interest rate
loans*Reference rate
Commissions
ResourcesDeposits*Interest rate
Distributed income of corporations (receivable)
Other subsidies on production
Miscellaneous current transfers
Capital transfers receivable
Item
Production accountResources
FISIM
Uses
Intermediate consumption
Gross Value Added
Consumption of fixed capital formation
Net Value Added
Generation of Income Account Resources
Subsidies
Subsidies on products
Other subsidies on production
UsesCompensation of employees
Wages and salaries
Employers social contribution
Taxes on production and imports
Taxes on products
Other taxes on production
Net operating surplus
Primary Distribution of Income AccountResources
Net operating surplus
Property income
Interest
Distributed income of corporations
Uses
Property income
Balance of primary income / net
Interest
Distributed income of corporations
Secondary Distribution of Income Account
Consumption of fixed capital formation
Capital transfers receivable
UsesGross fixed capital formation
Balance of primary income / net
Other Current transfers
Miscellaneous current transfers
Net disposable income
Capital Account Resources
Saving / Net (Net disposable income)
Taxes on income
Other current taxes
Other Current transfers
Non-life Insurance Premiums
Changes in inventories
Changes in inventories
Capital transfers payable
Net Lending (+) Net borrowing (-)
Resources
Non-life Insurance Claims
Non-life Insurance Premiums
Non-life Insurance Claims
Miscellaneous current transfers
UsesCurrent taxes on income and wealth
Distributed income of corporations (payable)
Taxes on income
Non-life Insurance Premiums
Miscellaneous current transfers(payable)
Employers social contribution
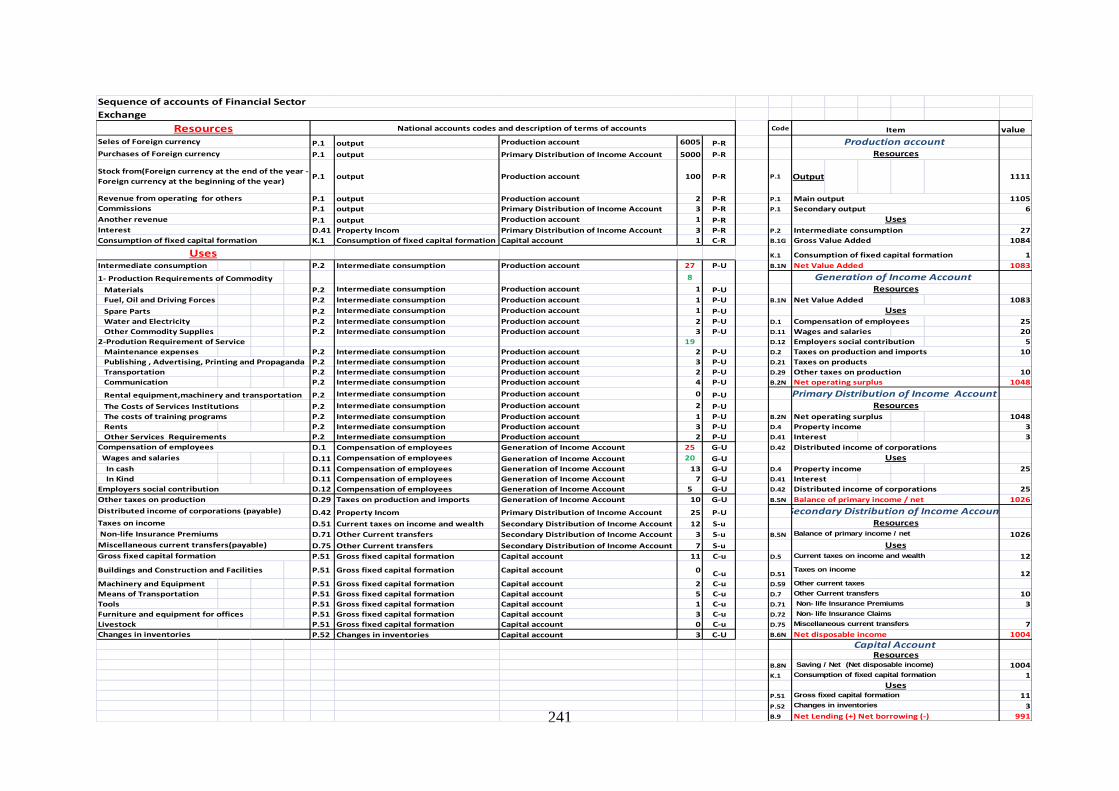
241
Code value
P.1 output Production account 6005 P-R
P.1 output Primary Distribution of Income Account 5000 P-R
P.1 output Production account 100 P-R P.1 Output 1111
P.1 output Production account 2 P-R P.1 1105
P.1 output Primary Distribution of Income Account 3 P-R P.1 6
P.1 output Production account 1 P-R
D.41 Property Incom Primary Distribution of Income Account 3 P-R P.2 27
K.1 Consumption of fixed capital formation Capital account 1 C-R B.1G 1084
K.1 1
Intermediate consumption P.2 Intermediate consumption Production account 27 P-U B.1N 1083
1- Production Requirements of Commodity 8
Materials P.2 Intermediate consumption Production account 1 P-U
Fuel, Oil and Driving Forces P.2 Intermediate consumption Production account 1 P-U B.1N Net Value Added 1083
Spare Parts P.2 Intermediate consumption Production account 1 P-U
Water and Electricity P.2 Intermediate consumption Production account 2 P-U D.1 Compensation of employees 25
Other Commodity Supplies P.2 Intermediate consumption Production account 3 P-U D.11 Wages and salaries 20
2-Prodution Requirement of Service 19 D.12 Employers social contribution 5
Maintenance expenses P.2 Intermediate consumption Production account 2 P-U D.2 Taxes on production and imports 10
Publishing , Advertising, Printing and Propaganda P.2 Intermediate consumption Production account 3 P-U D.21
Transportation P.2 Intermediate consumption Production account 2 P-U D.29 10
Communication P.2 Intermediate consumption Production account 4 P-U B.2N 1048
Rental equipment,machinery and transportation P.2 Intermediate consumption Production account 0 P-U
The Costs of Services Institutions P.2 Intermediate consumption Production account 2 P-U
The costs of training programs P.2 Intermediate consumption Production account 1 P-U B.2N Net operating surplus 1048
Rents P.2 Intermediate consumption Production account 3 P-U D.4 Property income 3
P.2 Intermediate consumption Production account 2 P-U D.41 Interest 3
D.1 Compensation of employees Generation of Income Account 25 G-U D.42 Distributed income of corporations
Wages and salaries D.11 Compensation of employees Generation of Income Account 20 G-U
In cash D.11 Compensation of employees Generation of Income Account 13 G-U D.4 Property income 25
In Kind D.11 Compensation of employees Generation of Income Account 7 G-U D.41 Interest
D.12 Compensation of employees Generation of Income Account 5 G-U D.42 Distributed income of corporations 25
D.29 Taxes on production and imports Generation of Income Account 10 G-U B.5N 1026
D.42 Property Incom Primary Distribution of Income Account 25 P-U
D.51 Current taxes on income and wealth Secondary Distribution of Income Account 12 S-u
D.71 Other Current transfers Secondary Distribution of Income Account 3 S-u B.5N 1026
D.75 Other Current transfers Secondary Distribution of Income Account 7 S-u
P.51 Gross fixed capital formation Capital account 11 C-u D.5 12
Buildings and Construction and Facilities P.51 Gross fixed capital formation Capital account 0 C-u D.51 12
Machinery and Equipment P.51 Gross fixed capital formation Capital account 2 C-u D.59
Means of Transportation P.51 Gross fixed capital formation Capital account 5 C-u D.7 10
Tools P.51 Gross fixed capital formation Capital account 1 C-u D.71 3
Furniture and equipment for offices P.51 Gross fixed capital formation Capital account 3 C-u D.72
Livestock P.51 Gross fixed capital formation Capital account 0 C-u D.75 7
P.52 Changes in inventories Capital account 3 C-U B.6N 1004
B.8N 1004
K.1 1
P.51 11
P.52 3
B.9 991
Primary Distribution of Income Account
Uses
Resources
Current taxes on income and wealth
Gross fixed capital formation
Balance of primary income / net
Secondary Distribution of Income AccountResources
Uses
Balance of primary income / net
Changes in inventories
Net Lending (+) Net borrowing (-)
Secondary output
Uses
Taxes on income
Other current taxes
Other Current transfers
Non-life Insurance Premiums
Non-life Insurance Claims
Resources Saving / Net (Net disposable income)
Consumption of fixed capital formation
Uses
Miscellaneous current transfers
Net disposable income
Capital Account
Other taxes on production
Net operating surplus
Taxes on products
Resources
Intermediate consumption
Gross Value Added
Consumption of fixed capital formation
Net Value Added
Generation of Income Account
Item
Production accountResources
Main output
Uses
Purchases of Foreign currency
Commissions
Consumption of fixed capital formation
Changes in inventories
Sequence of accounts of Financial Sector
Exchange
Resources National accounts codes and description of terms of accounts
Seles of Foreign currency
Other Services Requirements
Stock from(Foreign currency at the end of the year -
Foreign currency at the beginning of the year)
Revenue from operating for others
Another revenue
Interest
Uses
Miscellaneous current transfers(payable)
Gross fixed capital formation
Compensation of employees
Employers social contribution
Other taxes on production
Distributed income of corporations (payable)
Taxes on income
Non-life Insurance Premiums
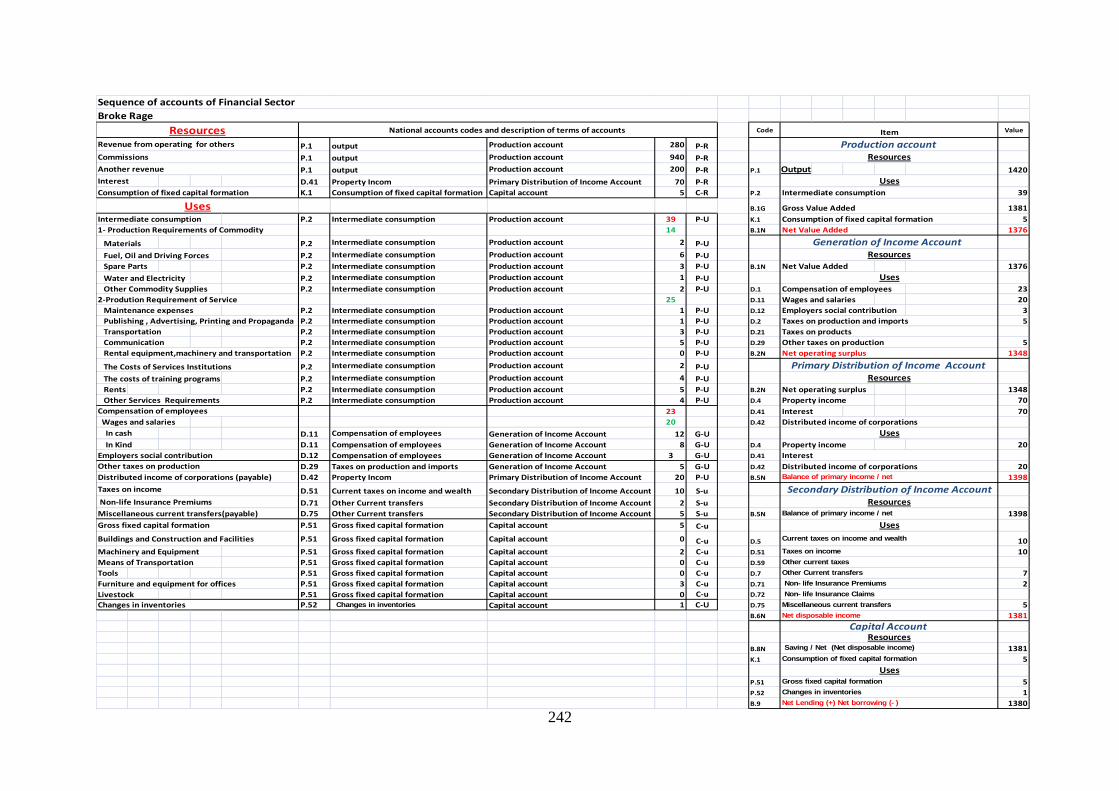
242
Code Value
P.1 output Production account 280 P-R
P.1 output Production account 940 P-R
P.1 output Production account 200 P-R P.1 Output 1420
Interest D.41 Property Incom Primary Distribution of Income Account 70 P-R
K.1 Consumption of fixed capital formation Capital account 5 C-R P.2 39
B.1G 1381
Intermediate consumption P.2 Intermediate consumption Production account 39 P-U K.1 5
1- Production Requirements of Commodity 14 B.1N 1376
Materials P.2 Intermediate consumption Production account 2 P-U
Fuel, Oil and Driving Forces P.2 Intermediate consumption Production account 6 P-U
Spare Parts P.2 Intermediate consumption Production account 3 P-U B.1N Net Value Added 1376
Water and Electricity P.2 Intermediate consumption Production account 1 P-U
Other Commodity Supplies P.2 Intermediate consumption Production account 2 P-U D.1 Compensation of employees 23
2-Prodution Requirement of Service 25 D.11 Wages and salaries 20
Maintenance expenses P.2 Intermediate consumption Production account 1 P-U D.12 Employers social contribution 3
Publishing , Advertising, Printing and Propaganda P.2 Intermediate consumption Production account 1 P-U D.2 Taxes on production and imports 5
Transportation P.2 Intermediate consumption Production account 3 P-U D.21
Communication P.2 Intermediate consumption Production account 5 P-U D.29 5
Rental equipment,machinery and transportation P.2 Intermediate consumption Production account 0 P-U B.2N 1348
The Costs of Services Institutions P.2 Intermediate consumption Production account 2 P-U
The costs of training programs P.2 Intermediate consumption Production account 4 P-U
Rents P.2 Intermediate consumption Production account 5 P-U B.2N Net operating surplus 1348
P.2 Intermediate consumption Production account 4 P-U D.4 Property income 70
23 D.41 Interest 70
Wages and salaries 20 D.42 Distributed income of corporations
In cash D.11 Compensation of employees Generation of Income Account 12 G-U
In Kind D.11 Compensation of employees Generation of Income Account 8 G-U D.4 Property income 20
D.12 Compensation of employees Generation of Income Account 3 G-U D.41
D.29 Taxes on production and imports Generation of Income Account 5 G-U D.42 20
D.42 Property Incom Primary Distribution of Income Account 20 P-U B.5N 1398
D.51 Current taxes on income and wealth Secondary Distribution of Income Account 10 S-u
D.71 Other Current transfers Secondary Distribution of Income Account 2 S-u
D.75 Other Current transfers Secondary Distribution of Income Account 5 S-u B.5N 1398
P.51 Gross fixed capital formation Capital account 5 C-u
Buildings and Construction and Facilities P.51 Gross fixed capital formation Capital account 0 C-u D.5 10
Machinery and Equipment P.51 Gross fixed capital formation Capital account 2 C-u D.51 10
Means of Transportation P.51 Gross fixed capital formation Capital account 0 C-u D.59
Tools P.51 Gross fixed capital formation Capital account 0 C-u D.7 7
Furniture and equipment for offices P.51 Gross fixed capital formation Capital account 3 C-u D.71 2
Livestock P.51 Gross fixed capital formation Capital account 0 C-u D.72
P.52 Changes in inventories Capital account 1 C-U D.75 5
B.6N 1381
B.8N 1381
K.1 5
P.51 5
P.52 1
B.9 1380
Changes in inventories
Net Lending (+) Net borrowing (-)
Primary Distribution of Income AccountResources
Uses
Secondary Distribution of Income AccountResources
Uses
Balance of primary income / net
Current taxes on income and wealth
Taxes on income
Gross fixed capital formation
Capital Account Resources
Saving / Net (Net disposable income)
Consumption of fixed capital formation
Uses
Other Current transfers
Non-life Insurance Premiums
Non-life Insurance Claims
Miscellaneous current transfers
Net disposable income
Other current taxes
Distributed income of corporationsBalance of primary income / net
Interest
Net operating surplus
Taxes on products
Other taxes on production
Uses
Gross Value Added
Consumption of fixed capital formation
Net Value Added
Generation of Income Account Resources
Item
Production accountResources
Uses
Intermediate consumption
Sequence of accounts of Financial Sector
Broke Rage
Resources National accounts codes and description of terms of accounts
Revenue from operating for others
Miscellaneous current transfers(payable)
Gross fixed capital formation
Changes in inventories
Commissions
Compensation of employees
Employers social contribution
Other taxes on production
Distributed income of corporations (payable)
Taxes on income
Non-life Insurance Premiums
Consumption of fixed capital formation
Uses
Other Services Requirements
Another revenue
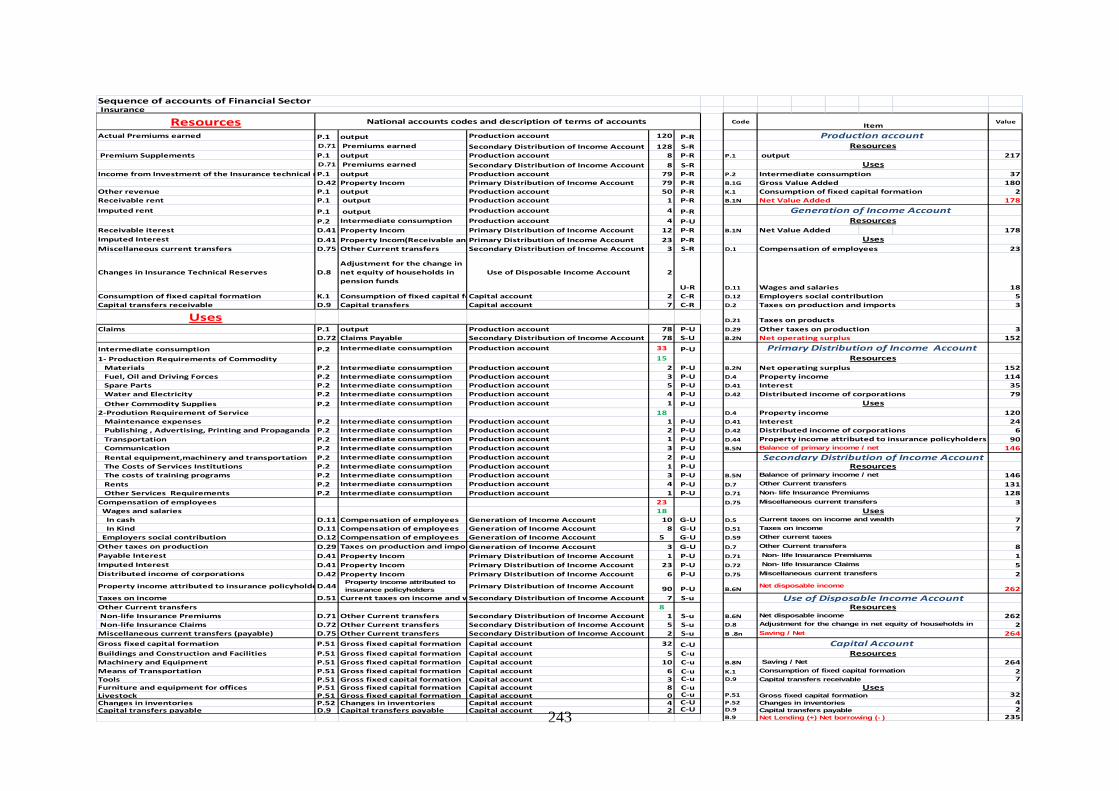
243
Resources Code Value
Actual Premiums earned P.1 output Production account 120 P-R
D.71 Premiums earned Secondary Distribution of Income Account 128 S-R
Premium Supplements P.1 output Production account 8 P-R P.1 217
D.71 Premiums earned Secondary Distribution of Income Account 8 S-R
Income from Investment of the Insurance technical reservesP.1 output Production account 79 P-R P.2 37
D.42 Property Incom Primary Distribution of Income Account 79 P-R B.1G 180
Other revenue P.1 output Production account 50 P-R K.1 2
Receivable rent P.1 output Production account 1 P-R B.1N 178
Imputed rent P.1 output Production account 4 P-R
P.2 Intermediate consumption Production account 4 P-U
Receivable iterest D.41 Property Incom Primary Distribution of Income Account 12 P-R B.1N Net Value Added 178
Imputed Interest D.41 Property Incom(Receivable and Payable)Primary Distribution of Income Account 23 P-R
Miscellaneous current transfers D.75 Other Current transfers Secondary Distribution of Income Account 3 S-R D.1 23
Changes in Insurance Technical Reserves D.8
Adjustment for the change in
net equity of households in
pension funds
Use of Disposable Income Account 2
U-R D.11 18
Consumption of fixed capital formation K.1 Consumption of fixed capital formationCapital account 2 C-R D.12 5
Capital transfers receivable D.9 Capital transfers Capital account 7 C-R D.2 3
Uses D.21
Claims P.1 output Production account 78 P-U D.29 3
D.72 Claims Payable Secondary Distribution of Income Account 78 S-U B.2N 152
Intermediate consumption P.2 Intermediate consumption Production account 33 P-U
1- Production Requirements of Commodity 15
Materials P.2 Intermediate consumption Production account 2 P-U B.2N 152
Fuel, Oil and Driving Forces P.2 Intermediate consumption Production account 3 P-U D.4 114
Spare Parts P.2 Intermediate consumption Production account 5 P-U D.41 35
Water and Electricity P.2 Intermediate consumption Production account 4 P-U D.42 79
Other Commodity Supplies P.2 Intermediate consumption Production account 1 P-U
2-Prodution Requirement of Service 18 D.4 120
Maintenance expenses P.2 Intermediate consumption Production account 1 P-U D.41 24
Publishing , Advertising, Printing and Propaganda P.2 Intermediate consumption Production account 2 P-U D.42 6
Transportation P.2 Intermediate consumption Production account 1 P-U D.44 Property income attributed to insurance policyholders 90
Communication P.2 Intermediate consumption Production account 3 P-U B.5N 146
Rental equipment,machinery and transportation P.2 Intermediate consumption Production account 2 P-U
The Costs of Services Institutions P.2 Intermediate consumption Production account 1 P-U
The costs of training programs P.2 Intermediate consumption Production account 3 P-U B.5N 146
Rents P.2 Intermediate consumption Production account 4 P-U D.7 131
Other Services Requirements P.2 Intermediate consumption Production account 1 P-U D.71 128
Compensation of employees 23 D.75 3
Wages and salaries 18
In cash D.11 Compensation of employees Generation of Income Account 10 G-U D.5 7
In Kind D.11 Compensation of employees Generation of Income Account 8 G-U D.51 7
Employers social contribution D.12 Compensation of employees Generation of Income Account 5 G-U D.59
Other taxes on production D.29 Taxes on production and importsGeneration of Income Account 3 G-U D.7 8
Payable Interest D.41 Property Incom Primary Distribution of Income Account 1 P-U D.71 1
Imputed Interest D.41 Property Incom Primary Distribution of Income Account 23 P-U D.72 5
Distributed income of corporations D.42 Property Incom Primary Distribution of Income Account 6 P-U D.75 2
Property income attributed to insurance policyholdersD.44Property income attributed to insurance policyholders
Primary Distribution of Income Account 90 P-U B.6N 262
Taxes on income D.51 Current taxes on income and wealthSecondary Distribution of Income Account 7 S-u
Other Current transfers 8
Non-life Insurance Premiums D.71 Other Current transfers Secondary Distribution of Income Account 1 S-u B.6N 262
Non-life Insurance Claims D.72 Other Current transfers Secondary Distribution of Income Account 5 S-u D.8 2
Miscellaneous current transfers (payable) D.75 Other Current transfers Secondary Distribution of Income Account 2 S-u B .8n 264
Gross fixed capital formation P.51 Gross fixed capital formation Capital account 32 C-U
Buildings and Construction and Facilities P.51 Gross fixed capital formation Capital account 5 C-u
Machinery and Equipment P.51 Gross fixed capital formation Capital account 10 C-u B.8N 264
Means of Transportation P.51 Gross fixed capital formation Capital account 6 C-u K.1 2Tools P.51 Gross fixed capital formation Capital account 3 C-u D.9 7
Furniture and equipment for offices P.51 Gross fixed capital formation Capital account 8 C-uLivestock P.51 Gross fixed capital formation Capital account 0 C-u P.51 32
Changes in inventories P.52 Changes in inventories Capital account 4 C-U P.52 4Capital transfers payable D.9 Capital transfers payable Capital account 2 C-U D.9 2
B.9 235
Gross Value Added
Uses
Resources
National accounts codes and description of terms of accounts
Consumption of fixed capital formation
Net Value Added
Generation of Income Account
Item
Production accountResources
output
Intermediate consumption
Uses
Employers social contribution
Taxes on production and imports
Interest
Taxes on products
Other taxes on production
Net operating surplus
Primary Distribution of Income AccountResources
Net operating surplus
Property income
Interest
Distributed income of corporations
Uses
Net disposable income
Taxes on income
Balance of primary income / net
Secondary Distribution of Income AccountResources
Balance of primary income / net
Resources Saving / Net
Consumption of fixed capital formation
Use of Disposable Income AccountResources
Net disposable income
Adjustment for the change in net equity of households in pension fundsSaving / Net
Capital Account
Net Lending (+) Net borrowing (-)
Changes in inventoriesCapital transfers payable
Capital transfers receivable
UsesGross fixed capital formation
Sequence of accounts of Financial Sector Insurance
Non-life Insurance Claims
Miscellaneous current transfers
Miscellaneous current transfers
UsesCurrent taxes on income and wealth
Other Current transfers
Non-life Insurance Premiums
Other current taxes
Other Current transfers
Non-life Insurance Premiums
Property income
Distributed income of corporations
Compensation of employees
Wages and salaries
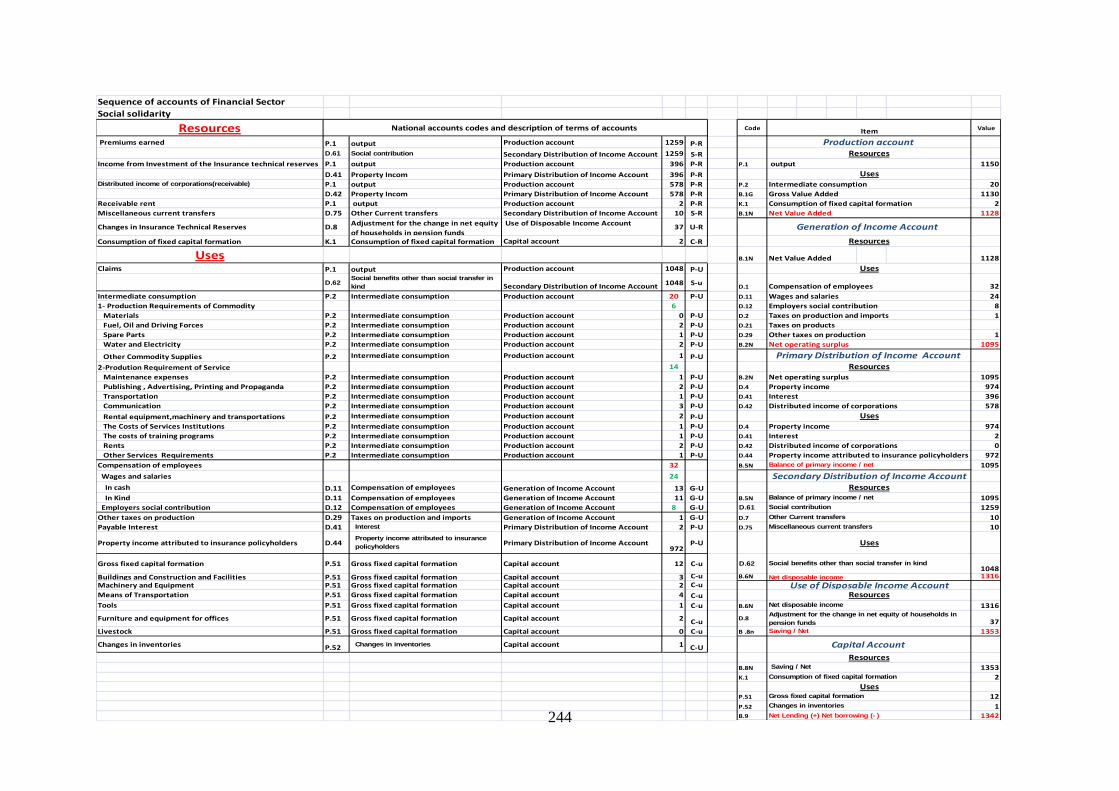
244
Sequence of accounts of Financial Sector
Social solidarity
Resources Code Value
Premiums earned P.1 output Production account 1259 P-R
D.61 Social contribution Secondary Distribution of Income Account 1259 S-R
Income from Investment of the Insurance technical reserves P.1 output Production account 396 P-R P.1 1150
D.41 Property Incom Primary Distribution of Income Account 396 P-RDistributed income of corporations(receivable) P.1 output Production account 578 P-R P.2 20
D.42 Property Incom Primary Distribution of Income Account 578 P-R B.1G 1130
Receivable rent P.1 output Production account 2 P-R K.1 2
Miscellaneous current transfers D.75 Other Current transfers Secondary Distribution of Income Account 10 S-R B.1N 1128
Changes in Insurance Technical Reserves D.8Adjustment for the change in net equity
of households in pension funds
Use of Disposable Income Account37 U-R
Consumption of fixed capital formation K.1 Consumption of fixed capital formation Capital account 2 C-R
Uses B.1N Net Value Added 1128
Claims P.1 output Production account 1048 P-U
D.62Social benefits other than social transfer in kind Secondary Distribution of Income Account 1048 S-u
D.1 32
Intermediate consumption P.2 Intermediate consumption Production account 20 P-U D.11 24
1- Production Requirements of Commodity 6 D.12 8
Materials P.2 Intermediate consumption Production account 0 P-U D.2 1
Fuel, Oil and Driving Forces P.2 Intermediate consumption Production account 2 P-U D.21
Spare Parts P.2 Intermediate consumption Production account 1 P-U D.29 1
Water and Electricity P.2 Intermediate consumption Production account 2 P-U B.2N 1095
Other Commodity Supplies P.2 Intermediate consumption Production account 1 P-U
2-Prodution Requirement of Service 14
Maintenance expenses P.2 Intermediate consumption Production account 1 P-U B.2N 1095
Publishing , Advertising, Printing and Propaganda P.2 Intermediate consumption Production account 2 P-U D.4 974
Transportation P.2 Intermediate consumption Production account 1 P-U D.41 396
Communication P.2 Intermediate consumption Production account 3 P-U D.42 578
Rental equipment,machinery and transportations P.2 Intermediate consumption Production account 2 P-U
The Costs of Services Institutions P.2 Intermediate consumption Production account 1 P-U D.4 974
The costs of training programs P.2 Intermediate consumption Production account 1 P-U D.41 2
Rents P.2 Intermediate consumption Production account 2 P-U D.42 0
Other Services Requirements P.2 Intermediate consumption Production account 1 P-U D.44 Property income attributed to insurance policyholders 972
Compensation of employees 32 B.5N 1095
Wages and salaries 24
In cash D.11 Compensation of employees Generation of Income Account 13 G-U
In Kind D.11 Compensation of employees Generation of Income Account 11 G-U B.5N 1095
Employers social contribution D.12 Compensation of employees Generation of Income Account 8 G-U D.61 1259
Other taxes on production D.29 Taxes on production and imports Generation of Income Account 1 G-U D.7 10
Payable Interest D.41 Interest Primary Distribution of Income Account 2 P-U D.75 10
Property income attributed to insurance policyholders D.44Property income attributed to insurance policyholders Primary Distribution of Income Account
972P-U
Gross fixed capital formation P.51 Gross fixed capital formation Capital account 12 C-u D.621048
Buildings and Construction and Facilities P.51 Gross fixed capital formation Capital account 3 C-u B.6N 1316
Machinery and Equipment P.51 Gross fixed capital formation Capital account 2 C-u
Means of Transportation P.51 Gross fixed capital formation Capital account 4 C-u
Tools P.51 Gross fixed capital formation Capital account 1 C-u B.6N 1316
Furniture and equipment for offices P.51 Gross fixed capital formation Capital account 2 C-uD.8
37
Livestock P.51 Gross fixed capital formation Capital account 0 C-u B .8n 1353
Changes in inventories P.52 Changes in inventories Capital account 1 C-U
B.8N 1353
K.1 2
P.51 12
P.52 1
B.9 1342
National accounts codes and description of terms of accounts Item
Production accountResources
output
Taxes on production and imports
Uses
Intermediate consumption
Gross Value Added
Consumption of fixed capital formation
Net Value Added
Generation of Income Account
Resources
Uses
Compensation of employees
Wages and salaries
Employers social contribution
Interest
Taxes on products
Other taxes on production
Net operating surplus
Primary Distribution of Income AccountResources
Net operating surplus
Property income
Interest
Distributed income of corporations
Uses
Property income
Other Current transfers
Use of Disposable Income Account
Capital Account
Distributed income of corporations
Balance of primary income / net
Secondary Distribution of Income AccountResources
Balance of primary income / net
Resources
Resources
Net Lending (+) Net borrowing (-)
Social contribution
Net disposable income
Adjustment for the change in net equity of households in pension fundsSaving / Net
Changes in inventories
UsesGross fixed capital formation
Saving / Net
Consumption of fixed capital formation
Miscellaneous current transfers
Uses
Social benefits other than social transfer in kind
Net disposable income
245
Niger
INTRODUCTION
Niger has a long experience in elaborating national accounts. Since the transformation of the
Directorate of Statistics and National Accounts into the National Institute of Statistics (NIS)
in 2004, important improvements have been made in the compilation of national accounts
both in terms of quality and regularity. Since then, the annual national accounts are published
twice a year, first in April (quick accounts for year n-1) and then in November (final accounts
for year n-2, forecasts for year n-1, and estimations for the on-going year). Each of these
publications includes principal tables recommended by the United Nations. These
publications are available at the website: www.ins.ne.
Niger uses the 1993 SNA with some adaptations for the local economic realities, but staying
in the global framework recommended by AFRISTAT and ECOWAS. Supply data is
provided by institutional sectors, while supply-use equilibriums are provided by principal
products. In particular, the Division of National Accounts is in charge of compiling national
accounts.
In addition, Niger is continuing exploring quarterly accounts that have not yet been
published.
It should be noted that the Law Nb. 2004-011 regarding the organisation of economic
activities obliges public and private organisations to forward their statistical and accounting
data by 30 April of every n year for the exercise covering year n-1.
The present document summarises the methodologies used by Niger to compile national
accounts, in particular, by using the following administrative sources:
5. General government;
6. Financial enterprises;
7. Non-financial enterprises;
8. Balance of payments.
246
I. GENERAL GOVERNMENT
General government accounts are usually produced according to the nature of the following
available data sources:
General budget of the state;
State Finance Operations Tables (SFOT);
National treasury;
State investment budget;
Local governments‘ accounting documents;
Documents from the national social security fund;
Documents from the national pension fund;
Accounting documents of administrative public institutions;
Documents of the non-profit institutions serving households (NPISHs).
These documents are provided in paper form, apart from the general budget that is provided
by the Directorate General of Budget in both paper and electronic format. The budget has the
advantage of giving more details about both the revenues and the expenses, while the SFOT
is more exhaustive but les detailed than the budget. Therefore, the data is harmonised each
year.
Regarding the delays in the transmission of data, even if it is easy to acquire the budget or the
SFOT within reasonable deadline, this is not the case for the local governments and public
institutions, where the non-response rate is fairly high – sometimes reaching 60%. Therefore,
adjustments are made for these local authorities and institutions.
The coding of revenue and expense operations is similar to the working framework used in
the ERETES module, which is in line with the 1993 SNA.
The administrative public institutions (called special accounts of the Treasury) are entities
receiving transfers and subsidies from the state, but their accounts are not detailed in the
budget. Their objectives are in the public‘s interest and not profit-seeking, and consequently,
they are treated as non-commercial entities with zero net operating income.
The detailed bridging tables show how the aggregates are transformed from public
accounting to national accounting.
Apart from these entities, non-profit institutions serving households should be also added.
Special surveys carried out on a sample of these institutions help to estimate the whole of the
NPISHs sector.
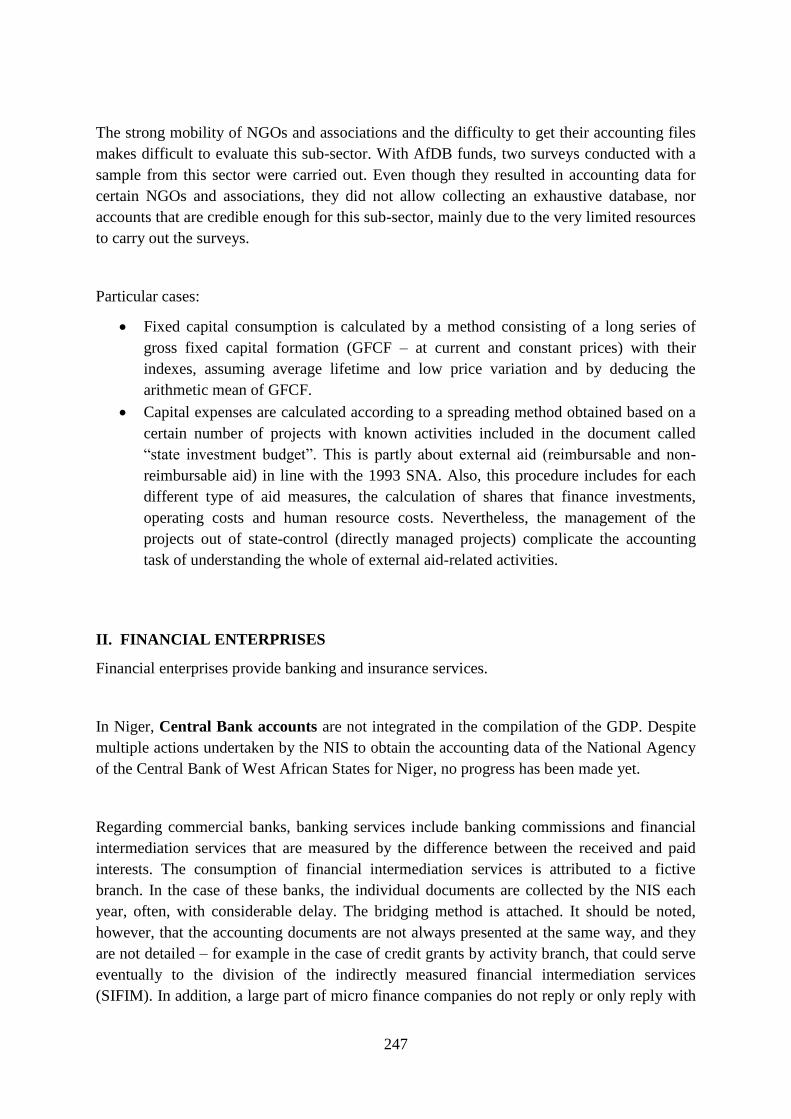
247
The strong mobility of NGOs and associations and the difficulty to get their accounting files
makes difficult to evaluate this sub-sector. With AfDB funds, two surveys conducted with a
sample from this sector were carried out. Even though they resulted in accounting data for
certain NGOs and associations, they did not allow collecting an exhaustive database, nor
accounts that are credible enough for this sub-sector, mainly due to the very limited resources
to carry out the surveys.
Particular cases:
Fixed capital consumption is calculated by a method consisting of a long series of
gross fixed capital formation (GFCF – at current and constant prices) with their
indexes, assuming average lifetime and low price variation and by deducing the
arithmetic mean of GFCF.
Capital expenses are calculated according to a spreading method obtained based on a
certain number of projects with known activities included in the document called
―state investment budget‖. This is partly about external aid (reimbursable and non-
reimbursable aid) in line with the 1993 SNA. Also, this procedure includes for each
different type of aid measures, the calculation of shares that finance investments,
operating costs and human resource costs. Nevertheless, the management of the
projects out of state-control (directly managed projects) complicate the accounting
task of understanding the whole of external aid-related activities.
II. FINANCIAL ENTERPRISES
Financial enterprises provide banking and insurance services.
In Niger, Central Bank accounts are not integrated in the compilation of the GDP. Despite
multiple actions undertaken by the NIS to obtain the accounting data of the National Agency
of the Central Bank of West African States for Niger, no progress has been made yet.
Regarding commercial banks, banking services include banking commissions and financial
intermediation services that are measured by the difference between the received and paid
interests. The consumption of financial intermediation services is attributed to a fictive
branch. In the case of these banks, the individual documents are collected by the NIS each
year, often, with considerable delay. The bridging method is attached. It should be noted,
however, that the accounting documents are not always presented at the same way, and they
are not detailed – for example in the case of credit grants by activity branch, that could serve
eventually to the division of the indirectly measured financial intermediation services
(SIFIM). In addition, a large part of micro finance companies do not reply or only reply with
248
the partial statistical information that would be necessary for the compilation of capital
accounts. For all these reasons, the accounts are adjusted by estimating the non-replies by the
help of certain tendency indicators or by the help of an average account for the institutions
that have not replied.
The accounting documents of insurance companies are collected directly by the NIS from the
companies. Insurance production is estimated on the basis of primes obtained, net revenues
from the placement of reserves, due claims, and the variation in the life insurance reserves.
Here as well there are non-responses and we proceed the same way as with the commercial
banks.
It should be noted that the Ministry of Finance is a precious source for accounting
information about financial enterprises, even though the documents arrive to NIS with delay.
But they have the advantage of providing an exhaustive global picture that helps to
recalculate certain estimations or make some adjustments.
III. NON-FINANCIAL ENTERPRISES
The data is achieved by processing companies‘ accounting documents collected by the NIS
and that are in line with the West African Accounting System.
However may be the performance of a statistical services, it is not possible to obtain all the
information concerning the companies. Therefore, companies in bankruptcy are estimated by
certain number of evolving indicators by activity branch for a sample of companies who
replied for year n-1 and n. The retained criterion is the output or revenue and the extreme
values are removed.
Enterprises of the modern sector are characterized by strong mobility (establishment,
disappearance). Despite the existence of an enterprise repertory, giving the right number of
companies who carry out a given activity during a year is a major challenge, due to the
eternal problem of non-response, principal activities, and the inaccurate filling of accounting
documents of certain companies.
The data about non-financial companies are obtained essentially by companies‘ accounting
documents. In all the ECOWAS Member States, a correspondence has been established
between the categories of corporate accounting and national accounting.

249
IV. BALANCE OF PAYMENTS
External transactions are treated with the balance of payments, provided by the Central Bank,
by using a joint bridge table. For the balance of products the detailed external trade statistics
of the NIS are used. The data is harmonised with the Central Bank data, which has the
advantage of including the non-registered external trade. Balance of payments data are
provided in the form of both hard and soft copy.
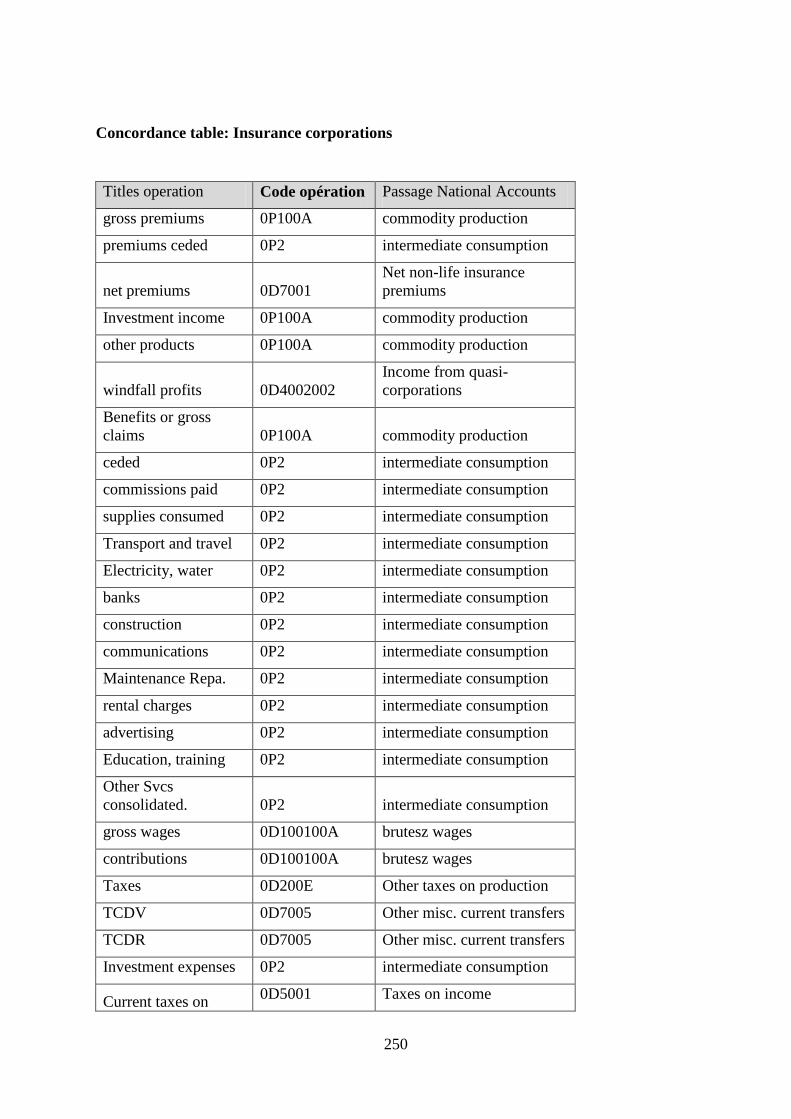
250
Concordance table: Insurance corporations
Titles operation Code opération Passage National Accounts
gross premiums 0P100A commodity production
premiums ceded 0P2 intermediate consumption
net premiums 0D7001
Net non-life insurance
premiums
Investment income 0P100A commodity production
other products 0P100A commodity production
windfall profits 0D4002002
Income from quasi-
corporations
Benefits or gross
claims 0P100A commodity production
ceded 0P2 intermediate consumption
commissions paid 0P2 intermediate consumption
supplies consumed 0P2 intermediate consumption
Transport and travel 0P2 intermediate consumption
Electricity, water 0P2 intermediate consumption
banks 0P2 intermediate consumption
construction 0P2 intermediate consumption
communications 0P2 intermediate consumption
Maintenance Repa. 0P2 intermediate consumption
rental charges 0P2 intermediate consumption
advertising 0P2 intermediate consumption
Education, training 0P2 intermediate consumption
Other Svcs
consolidated. 0P2 intermediate consumption
gross wages 0D100100A brutesz wages
contributions 0D100100A brutesz wages
Taxes 0D200E Other taxes on production
TCDV 0D7005 Other misc. current transfers
TCDR 0D7005 Other misc. current transfers
Investment expenses 0P2 intermediate consumption
Current taxes on 0D5001 Taxes on income

251
income
exceptional losses 0D4002002
Income from quasi-
corporations
net assets P51
Gross fixed capital
formation
workforce 0E1001001 Number of employees
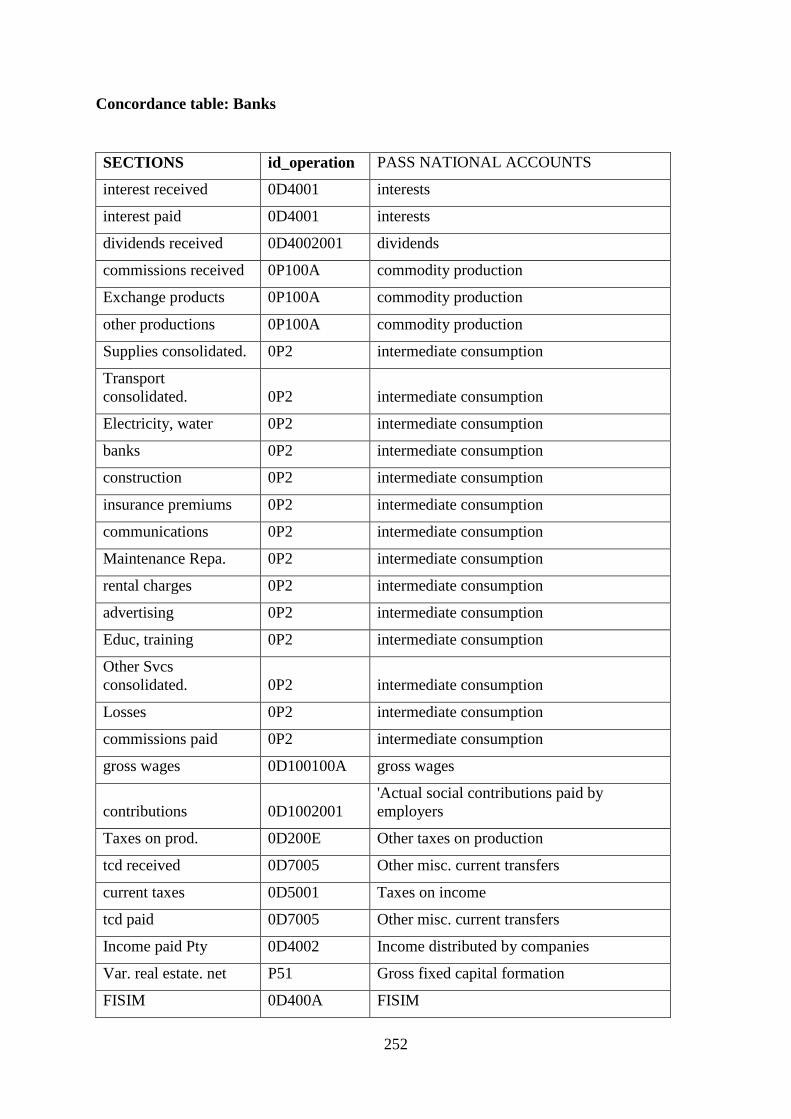
252
Concordance table: Banks
SECTIONS id_operation PASS NATIONAL ACCOUNTS
interest received 0D4001 interests
interest paid 0D4001 interests
dividends received 0D4002001 dividends
commissions received 0P100A commodity production
Exchange products 0P100A commodity production
other productions 0P100A commodity production
Supplies consolidated. 0P2 intermediate consumption
Transport
consolidated. 0P2 intermediate consumption
Electricity, water 0P2 intermediate consumption
banks 0P2 intermediate consumption
construction 0P2 intermediate consumption
insurance premiums 0P2 intermediate consumption
communications 0P2 intermediate consumption
Maintenance Repa. 0P2 intermediate consumption
rental charges 0P2 intermediate consumption
advertising 0P2 intermediate consumption
Educ, training 0P2 intermediate consumption
Other Svcs
consolidated. 0P2 intermediate consumption
Losses 0P2 intermediate consumption
commissions paid 0P2 intermediate consumption
gross wages 0D100100A gross wages
contributions 0D1002001
'Actual social contributions paid by
employers
Taxes on prod. 0D200E Other taxes on production
tcd received 0D7005 Other misc. current transfers
current taxes 0D5001 Taxes on income
tcd paid 0D7005 Other misc. current transfers
Income paid Pty 0D4002 Income distributed by companies
Var. real estate. net P51 Gross fixed capital formation
FISIM 0D400A FISIM

253
effective employees 0E1001001 Number of employees
FISIM 0P100A commodity production