Embed Size (px)
Citation preview

successionadvisoryservices.com
GUIDE TO THE SUCCESSION INVESTMENT MATRIX

2Succession Advisory Services
Contents
Introduction 3Investment Philosophy 4The Succession Key Principles 5Investment Matrix Construction 6Defining the Succession Risk Parameters 8Risk Profiling Tools 9 Sample Portfolios 10 Compare to other market data 10The Parameters 11Parameter Indicator Guide 12 Volatility 12 Maximum Loss 12 Performance 12The Succession Risk Categories 13The Investment Matrix – Core Solutions 14 Core Fund Selection Process 14 The Funds 15 DFM Solutions Selection Process 15Ongoing Monitoring 18 Investment Committee 18 Joint Relationship Board 18 Monthly Monitoring 18 Quarterly Review Meetings 19Understanding the Reports 20 Core Funds Performance Master 20 Ex Core Funds Perf Master 20 [Month] Core Funds 20 [Month] Ex Core Funds 20 Core Funds – Sector Comparison 20 Monthly Figures – MMP 20 Succession Monthly Stats Positioning Document 20 Quarterly Reports 21Risk Rated Fund List 22Rayner Spencer Mills Research Process 23Appendices 24 Appendix 1 – Succession Risk Mapping and Matrix Parameters 24 Appendix 2 - ATR Tools fit within Succession Risk Categories 24 Appendix 3 – Aligning Risk Profilers 25

The Succession Investment Matrix is at the core of the advice process for Succession planners. It details all the core investment choices available to planners split into the five Succession risk profiles, thereby enabling Wealth Planners to see at a glance the core choices available to them.
The Succession Investment Matrix provides: — A wide coverage of investment choices to help meet a broad
range of clients’ aims and objectives — A robust governance process for all investment solutions
contained within the matrix — Ongoing due diligence and monitoring of investment solutions
to reduce the workloads of Wealth Planners and Para Planners
This document forms a comprehensive guide as to how the Investment Matrix was constructed, its philosophy and the research behind it. Furthermore, this document links the Investment Matrix to the wider Succession Proposition.
3Succession Advisory Services

4
— Asset allocation aided by a robust process for fund selection
— Modern Portfolio Theory at the heart of all solutions contained within the Investment Matrix
Succession believes that the majority of returns stem from asset allocation aided by a robust process for fund selection. The selection of the core solutions aims to reflect this investment philosophy whilst allowing the flexibility to mix other investment styles within the full Investment Matrix. This is demonstrated in a disciplined investment process and a robust asset allocation model for each of the solutions used.
One of the key tenets in this philosophy is that the selected investment solutions should acknowledge Modern Portfolio Theory, as defined initially by Markowitz and amended and refined by various academics such as Black and Litterman and William Sharpe. Markowitz, a Nobel Prize Winner in Economics, asserted that diversity reduces risk and that assets should be evaluated not by their individual characteristics but by their effect on a portfolio. Investors should have access to the broadest range of assets for diversification purposes and hold assets that are uncorrelated for less volatile returns. In today’s terms this means embracing the wider investment powers typically offered by UCITS III and NURS legislation. Debate continues as to how effective diversification is during periods
of high correlation, with some recent research suggesting a more concentrated approach might prove more profitable, but Succession believe that asset diversification is a sensible long-term solution for the average investor.
The selection process used when the Investment Matrix was first introduced was relatively ground-breaking, using multi asset solutions as the core of the proposition. Today this is very much the norm for many planners given the ramifications of the Retail Distribution Review (RDR). Multi asset solutions are simply diversified portfolios with a wider remit and greater range of asset classes as more choices have evolved in the last decade. The solutions on the Matrix are intended to provide a range of choices using different strategies and styles but all focused on the longer term. Most of the solutions are risk assessed to the Matrix parameters but are not risk targeted (invested to stay within the Matrix parameters) except for the in-house discretionary portfolios currently run by LGT Vestra, 7IM and RSMR Portfolio Service. These portfolios have been designed by Succession and the three investment managers to match the Succession risk and return parameters and will therefore be tailored to the financial planning process.
Investment Philosophy
Succession Advisory Services

Succession Advisory Services 5
The Investment Matrix was constructed using several key principles. With a client’s investment desires at the heart of the Investment Matrix, it was believed Succession should employ the use of client focused principles when considering how the Investment Matrix should look. These principles intended to serve a client’s investment desires in a responsible manner by ensuring each investment solution in the matrix adheres as closely as possible to them.
At the very heart of the investment matrix is the company’s view that the principal role of a Wealth Planner is to help frame a client’s objectives within sensible risk parameters. Crucially the value is not in selecting funds or trying to choose the best performing fund manager, it is in selecting the most appropriate investment solution that will achieve the client’s objectives within an agreed risk profile.
The Matrix was constructed relying on the following principles:
SOLUTIONS NOT INDIVIDUAL FUNDSThe investment universe available has been filtered down to a manageable number of choices focusing on multi-asset investment solutions. Whilst a range of solutions is preferred, single funds from an existing manager can be used if they improve Matrix coverage.
PROGRESSIVEThe Investment Matrix will develop over time to meet the needs of Succession, adapting to changes within the financial services landscape, within capital markets and to ensure it provides ongoing investment solutions for a high percentage of Wealth Planner needs.
MODERN PORTFOLIO THEORYAll the investment solutions embrace years of academic research which determines that investors can construct portfolios to maximise expected returns on a given level of market risk. Modern Portfolio Theory explains how risk-averse investors can construct portfolios to optimise or maximise expected returns on a given level of market risk. It emphasises that risk is an inherent part of higher reward. All solutions within the Matrix embrace Modern Portfolio Theory to a greater or lesser degree through the diversity of holdings and asset class mix.
INVESTMENT ST YLESThe investment solutions are designed to give Wealth Planners optimal asset allocation models according to the style of investment. This may be active/passive; multi asset/traditional or a blend of styles using a core and satellite approach, etc.
INSTITUTIONAL STRENGTHThe investment solutions will have ongoing independent and stringent due diligence applied to them that will place a high level of weighting on the financial security of the underlying investments as well as the fund management house. The resources of the fund manager and the ability to adapt to changing market conditions will also be carefully considered.
REBAL ANCING STR ATEGYThe core investment solutions are all monitored regularly with the majority having a formal strategy of rebalancing to ensure that the benefits of asset allocation (and the appropriate risk level) are adhered to at all times. The traditional management styles do not automatically rebalance focusing on achieving added value returns from tactical decisions.
PROCES S DRIVEN, NOT STAR FUND MANAGERSThe investment solutions are based on robust and repeatable processes that satisfy the TCF requirements and create a greater consistency in investment approach across similar types of clients.
RETURNSTo maintain the theme of consistency, guidance will be given on the likely return outcomes for the various risk ranges as well as anticipated maximum loss figures to aid selection and risk matching to clients.
PRICINGAll investment solutions will have a competitive pricing stucture, with Succession negotiating the best possible charging structure. The total DFM charge & underlying fund investment is reported inline with MiFID II regulation. It is made up of the Annual Management Charge (AMC) and other costs (previously undisclosed) associated with the running of the fund, such as transactional costs.
ONGOING MONITORINGSuccession will be a major client to all the fund managers on the Matrix. Ongoing monitoring is performed by an Investment Committee with representation from internal and external members maintaining a tight supervisory role, by assessing on a monthly basis fund returns and volatility, financial and compliance data, marketing supporting and other relevant criteria.
Succession will use these robust selection criteria in order to provide investment choices which have security of company as well as fund selection.
The Succession Key Principles

Succession Advisory Services 6
A fundamental requirement behind the construction of the Investment Matrix was that it had to accommodate any number of advisory firms, and the risk profiling tools (or other methods of assessing risk) that they use. The Matrix would then become a common reference point, which Wealth Planners could use to advise clients, taking a longer-term perspective on the likely returns and volatility of the investment solutions they are selecting. Over time it was anticipated that various businesses would adopt the central profiling tool recommended by Succession.
In order to achieve these objectives, common ground had to be found across a range of typical risk profiling tools, so that they could be ‘mapped together’ in a sensible and robust way. The Succession risk profiles would then reflect these and provide fixed parameters by which to measure the likely risk and reward of each profile. Appropriate investment solutions would then be placed
in each risk profile – thereby forming the Investment Matrix.The Succession Investment Matrix needs to link together a number of typical risk profiling tools and align them to the Succession Risk Profiles. This is done by defining certain performance / risk outcome ranges which are set out as the Succession Parameters, and then aligning output from the various risk profiling tools to them. This is of course an oversimplification of this part of the process as the Succession Risk Profiles need to be based on robust research and reflect the characteristics of the risk profiling tools, as well as be capable of being mapped to them. A margin of error also needs to be allowed for Wealth Planner discretion, hence the reason it should always be seen as a guide and not a definitive map. It is also the reason why on occasion there is more than one possible ‘map’ for several the risk outcomes.
The overall process can be summarised as follows:
Investment Matrix Construction
Succession Investment
Matrix
Succession Investment Solutions
Succession Risk ProfilesRisk profiling tools
Matrix Parameters
Find common ground amongst data sources /
sense check
Industry studies(eg Barclays Equity
and Gilt Study)
Back test data
IA Sector DataRisk profiling tools Set up portfolios based
on output (asset allocation of each)

7
“ THE INVESTMENT MATRIX IS A SUITE OF INVESTMENT SOLUTIONS WITH NO PARTICULAR STYLE/MANAGEMENT BIAS DESIGNED TO GIVE CONSISTENT RETURNS, WITHOUT THE RISK OF SHOOTING THE LIGHTS OUT TO MATCH A CLIENT’S FINANCIAL PLANNING NEEDS. IT’S ABOUT RELIABILITY AND CONSISTENCY.”
Succession Advisory Services
Succession Wealth Planner

Succession Advisory Services 8
The first part of the process (as shown in the top half of the diagram on the previous page) defines the risk parameters to which the Investment Matrix operates. The risk parameters are fundamental to the risk profiling process used by Wealth Planners and to the investment solutions as shown on the Investment Matrix. The Risk Parameters were constructed based initially on a series of key principles alongside a significant amount of data analysis. The parameters’ key principles are as follows:
— The parameters aim to fit in with the key principles of the Matrix including the provisions of both active and passive solutions as well as multi-asset and multi manager options.
— The process also acknowledges the underlying premise of Modern Portfolio Theory in the development of the Matrix.
— The methodology utilises the risk and return data over a minimum of ten years on a discrete and rolling basis. This information was used to build a pattern of data which facilitated the building of the parameters for the 1-5 Risk Profiles.
— The data derived from the back testing of the risk profiling tool asset allocations was contrasted with the data derived from the mixed asset sectors which aimed to provide a peer group context for the risk and return data from the tools.
— This was also overlaid with longer term asset return data from studies such as the Barclays Equity and Gilt study and Credit Suisse Yearbook. These studies provide inflation adjusted data on returns from the five core asset classes, cash, gilts, corporate bonds, index linked and equities from 1899.
— The asset allocation of the various tools was compared to the knowledge of the above data as a cross check against any short-term anomalies that may skew the parameters. In particular, the 2008 Global Financial Crisis and other shocks can move short term risk data significantly, hence should not bias the longer-term perspective.
— The resulting parameters were created to act as a longer-term guide as, over shorter-term periods, this may mean investment solutions may exceed the various parameters. The Matrix is aimed at delivering a longer-term perspective
on risk and return on a minimum 5-year view. — The parameters are based on long-term strategic
positioning rather than short-term tactical positioning. No parameter can factor in tactical allocation tilts that the underlying fund managers can take between the various asset classes.
— Volatility is deemed to be the standard measure of risk and is used in this analysis as a core element measuring the range of returns of a fund compared to its average return over a set period.
— Maximum loss is also used to provide a context for an investor of the likely potential loss for a portfolio in a given risk range. It represents the worst return over a set period in this case is annualised.
Defining the Succession Risk Parameters
THE RISK PARAMETERS ARE FUNDAMENTAL TO THE RISK PROFILING PROCESS USED BY WEALTH PLANNERS AND TO THE INVESTMENT SOLUTIONS AS SHOWN ON THE INVESTMENT MATRIX
Risk Parameters: The expected values a fund or model should operate within in terms of Performance, Volatility and Maximum Loss based on long-term asset and sector data. The parameters relate to each specific risk category and vary between themselves to accommodate client’s differing risk profiles.

Succession Advisory Services 9
Risk Profiling Tools
Before joining Succession, advisory firms use several different risk profiling propositions. It was felt that it would be extremely difficult to develop a process for combining them into a single set of solutions. The answer was to take several of the most commonly used profiling tools and provide a guide as to where these solutions would map onto a centralised set of investment risk parameters. The risk profiling tools selected were three of the leading providers – all of which covered varying risk profiles.
It was agreed that the most appropriate risk profile range for Succession was one which had the lowest number of profiles whilst being usable for a reasonable range of clients. The 1-5 risk profile range was agreed as there are very few, if any, systems or methodologies which offer a smaller range of choices. It was felt that it would be simpler to illustrate how a wider range of options could be linked into a smaller range, based on the risk and return parameters selected.
There are several important points to note which are fundamental to this process:
— Firstly, the mapping was intended to act as a guide rather than a set of fixed parameters that all solutions operated within. As each of the risk profiling solutions uses a very different approach and asset allocation, any mapping process has to have flexibility in the way that it deals with the grey areas that exist between the different outcomes. The final positioning for each of the risk profiles on the Matrix has to include some degree of qualitative interpretation and this subjectivity means it can only act as a guide. Planners are still expected to make sure a client’s overall portfolio of assets fits their risk profile.
— Secondly, the mapping was based on using a range of data but with the emphasis on the final parameters being on the longer term allowing any solutions to revert to their mean levels of risk and return – a point emphasised by all of the risk profiling tools. The term we took to best reflect this was 5 years which we felt gave most solutions the time to demonstrate a normalised risk / return profile.
— Thirdly, the process for mapping was only able to use data for back testing the profiling tools using broad indices (rather than the asset allocation of the solution) meaning that each investment solution from the managers (SEI, Jupiter etc.) is not directly mapped to the tools. The reason for this is that the actual allocation will change over time giving potentially different outcomes. Each investment solution is mapped to the Succession Parameters, but it is always worth checking with the profiling tool where the solution would sit if that is possible.
— Finally, when the fund solutions are then aligned to the Investment Matrix we have to accept that, with the exception of the discretionary solutions, these fund solutions are not being managed to the parameters set by the Matrix but to the objectives of the fund and are characterised by the manager’s style and fund controls.
Each of the three systems provide different outputs in terms of risk profiling but all finally produce an asset allocation for each of the risk profiles (Appendix 2) and it is this that we can compare to get an idea of which risk profiles can be matched. The three systems clearly do not generate exactly matching asset allocations, so they are compared according to their nearest asset allocation. This is further complicated by the fact that the systems do not always combine the same assets, for example one of the systems does not use property. To add more accuracy to the mapping process we consider the risk outputs of each of the portfolios and make sure that the mapping process provides a sensible match in this area as well.
The asset allocation matching can only be an approximation across the risk ranges as each of the models uses its own weightings and provides different levels of detail when dissecting the assets. One solution for example uses eleven asset types (cash, gilts, property etc.) whilst another uses five.
The first stage in the process of defining the Risk Parameters was to review a number of the most popular risk profiling methodologies and look at the asset allocations linked to each risk profile (i.e. the output from the risk profiling process). By doing this, it was possible to broadly identify how different risk profiling tools mapped to each other. Again, care is needed to emphasise that this process cannot be definitive given the differences in the construction of the range of profiling tools.
Succession Advisory Services 10
Sample Portfolios
Sample portfolios were then set up using indices to represent the asset allocation of the various risk profiles. These portfolios could then be back tested to provide risk and reward data, which meant that the risk profiles could be more clearly mapped together based on this data, and broad parameters could be defined for the Succession Risk Profiles.
Compare to other market data
The next stage was to consider this data in the context of other market data and refine the Succession Risk Parameters as necessary. In order to do this, IA sector average data was looked at. The Mixed Investment sectors can be considered as reasonably representative of the range of multi asset funds, and so longer-term risk and reward data for these was also considered. The final data source was industry studies – such as the Barclays Equity & Gilt Study, and the Credit Suisse Yearbook. These studies provided far longer-term data which could be used to sense check the conclusions drawn from the other data sources and ensure that any anomalies in the shorter-term data were understood.
The Risk Parameters are reviewed on a five-yearly basis* to ensure they remain relevant and appropriate for guidance, and the Succession Investment Committee will monitor the return and volatility characteristics for the investment solutions on a monthly basis, which will highlight any issues with the suitability of the parameters.
*�The�most�recent�five-year�review�was�completed�in�2015�and�the�conclusions fully supported the continued use of the current parameters

Succession Advisory Services 11
It should be noted that we have deliberately focused on the longer-term data rather than shorter term as we believe this illustrates more realistic risk and return profiles. We do not want to ignore unusual periods such as the Global Financial Crisis but using it to forecast loss for example would provide an unrealistic data set for normal periods of market behaviour. There will always be anomalies to longer term trend data, but we believe this can be factored in when analysing the returns on a quarterly basis rather than allowing managers to work within boundaries that are rarely reached.
In building the parameters, it was felt that simply using volatility as a measure of risk was not robust enough for the current regulatory regime, and so maximum loss was also included to illustrate the potential downside for the different risk profiles. This reflects the potential loss to a client and helps to put each risk profile into context. This range of figures reflects a time frame of one year which is how we believe most investors consider potential loss (Appendix 1).
The Succession Parameters were developed from historic data sources, but investor’s expectations are looking to the future and to reflect this, we focused on the longer term where data sets tend to revert to their mean. There are no really robust methods for predicting future risk and returns but there is near certainty that there will be changing levels of volatility along the way and that potentially, at any single point in time, the parameters will be exceeded by some of the investment solutions, such as in the 2008 Global Financial Crisis. There is an element of forward-looking research in the process which is in the selection of the fund solutions to fit the Matrix based on the key principles and the qualitative information coming from the due diligence process.
The data analysis applied to this mapping process is approximate and includes a qualitative overlay using our experience in the practical application of these tools, all of which results in a Matrix which can act as a reasonable guide in the transition and monitoring process.
The risk parameters chosen have been based on removing the extremes, and are not intended to be tight bands, as this would inevitably lead to the solutions being outside of this
band. It has been the intention to deliver a set of reasonable parameters that the overall asset allocations will adhere to, accepting that the higher up the risk scale the investor goes, then the less accurate the predictions can become at any one point. The timescales for the risk evaluation periods do vary in each process we have mapped but in general the minimum period of time the client is expected to invest their portfolio in a specific investment solution is 5 years. This will reduce the effect of cyclicality and allow the extremes to be smoothed more effectively. It cannot however remove the possibility that the five-year term ends at an inflection point such as we had in the last quarter of 2008 when the financial markets imploded.
The Parameters
The Parameters of maximum loss and volatility represent what we would expect funds of this risk profile to return during an average five-year view for volatility and a one-year view for loss.
THE PARAMETERS WERE DEVELOPED FROM HISTORIC DATA SOURCES, BUT INVESTORS’ EXPECTATIONS ARE LOOKING TO THE FUTURE AND TO REFLECT THIS, WE FOCUSED ON THE LONGER TERM WHERE DATA SETS TEND TO REVERT TO THEIR MEAN.

Succession Advisory Services 12
Parameter Indicator Guide
Volatility
Volatility refers to a measure of dispersion around the average return of an investment. This shows how tight the value of an investment is grouped together. Volatility is measured by standard deviation and linked to performance. It presents an important assessment of risk, high levels of volatility results in higher risk and a greater chance of a lower than expected return. Price movements with increased standard deviation show above average strength or weakness.
Maximum Loss
Maximum loss refers to the worst running return over a one-year period, this will highlight the longest running consecutive loss without making a gain. It is essential to understand the level of maximum loss within a portfolio as part of addressing a client’s attitude to risk.
Performance
Performance refers to the total return on a portfolio over a given time period. Investments are typically measured over a five-year time horizon to generate a long-term view of client capital. Performance is measured in percentage (%) of increases or decreases the investment has made.
When analysing perfromance, it is necessary to account for the costs linked to the relevant fund to establish the clients real gain. Performance figures provided by SAS IC are inclusive of investment charges.

Succession Advisory Services 13
The Succession Risk Categories
Defensive A defensive investor has a very low appetite for risk and is not prepared to accept large fluctuations in capital values. Investments will generally be in secure assets such as cash and fixed interest securities which should not, under most circumstances, suffer capital loss, but will only be expected to offer relatively low levels of growth. It is possible that when taking inflation into account, a defensive portfolio may not increase in capital value. The primary objective of this portfolio is to preserve client capital.
Moderately Adventurous Moderately Adventurous investors are willing to accept a higher level of risk and portfolio fluctuation on the basis that there is potential for higher return over the medium to long term. Investors will be more confident in investing in a broad range of assets to achieve this. Investors will probably be prepared to accept higher fluctuations in the shorter term for the longer-term goal. The investments carry a higher degree of risk for loss of capital but also greater potential for capital growth. There will be an increased exposure to higher-risk assets such as overseas equities and a greater level of volatility within the portfolio. The primary objective of this portfolio is to achieve above average capital growth.
Adventurous
Adventurous investors are likely to be more experienced and aware of the balance between risk and reward when making investments. Adventurous investors have a greater propensity for risk in their investments and are able to accept greater fluctuations in their capital values. Investors will be prepared to invest most assets into the higher risk asset classes and to be wholly invested in equities. The assets will be more volatile and will have a higher potential for loss or gain in the shorter term. The primary objective of this portfolio is to achieve high levels of capital growth.
Balanced
Balanced investors are willing to invest in assets that can produce an above average return over the medium term by investing in a variety of assets including equity, property and fixed interest. The investor will be looking for a balance between risk and reward and will accept that their investment will fluctuate but do not want it to do so significantly. The investments will have exposure to a higher potential for capital loss but with greater capital growth potential over the medium to long term. There will be an increased exposure to higher risk assets within the portfolios including overseas equities. The primary objective of this portfolio is to achieve capital growth in excess of inflation.
CautiousA cautious investor is one wanting a return above that of cash accounts over the longer term and is willing to place some investments into assets that will be exposed to fluctuations in capital value. The portfolio is likely to be invested primarily in defensive areas, such as cash and fixed interest securities, with modest exposure to equities. These investments should be exposed to a lower level of risk, with an emphasis on secure consistent growth and a bias towards lower risk assets. The overall return should have the potential for real growth over the medium term but may compare unfavourably with that achievable from a higher risk approach. The primary objective of this portfolio is to achieve a moderate level of capital growth.
There are 5 possible Risk Categories a client may be placed within following completion of the Attitude to Risk Questionnaire and risk discussions with their Wealth Planner.
1 4
5
3
2

Succession Advisory Services 14
The Investment Matrix is core to the overall consolidation process of the various businesses in the Succession Group and has to cater for a diverse range of business models and has therefore been designed to included a reasonable level of flexibility. It has been built to deliver a wide enough selection of investment styles and managers to match the Succession business. The Succession Investment Matrix is displayed in Appendix 1. The table also reflects a simpler and more flexible comparison of different risk profiling scales and how they fit into the Investment Matrix.
The research requirements for the core solutions on the Succession Matrix are defined in the key principles and based on the belief that fund management is a specialised skill that most if not all Wealth Planners will need support with.
The selection of funds is based on the premise that the core funds should be representative of the Succession philosophy but should offer a reasonable range of selections based on the alternative interpretations of the theoretical models. In practical terms this leads to the use of both active and passive investing as a core strategy be it in asset allocation, funds selection or both. The Matrix offers these choices by delivering options in each of the possible combinations.
Passive investing is now a widely used philosophy but there are planners and investors who require greater flexibility or have greater conviction in more active investment approaches. It is impossible to predict which of the theories or combinations of theories will provide the greatest future returns and so the Matrix is not a restrictive solution as it is backed up by traditional alternatives as well as a range of specialist fund selections to accommodate individual portfolio characteristics.
Core fund selection process
The philosophy for the core investment solutions in the retail market is based on multi asset class investing – this has been around for some time particularly in the institutional marketplace and in some of the larger and successful endowment funds such as Yale and Harvard. New legislation has opened up other possibilities and UCITs III and NURS funds have much wider investment powers and we have also seen the increase in popularity and availability of such products as ETFs.
Succession have conducted specific tailored research to evaluate whether a range of these managers are appropriate. This research has established whether the funds are fit for purpose in the provision of investment solutions for the various elements of the Matrix. The research has looked at both quantitative and qualitative factors to determine suitability, including the factors outlined below:
QUALITATIVE ; PERFORMANCE
Some of the funds that can offer a multi asset approach have a limited track record and it is not always possible to provide the same detailed performance analysis as on traditional funds. Where this is the case, we can make use of back testing information to use as a guide and also look at other funds, perhaps offshore, that use the same process. This allows us to look at the likely characteristics of the funds and provide a comparison to the peer group and sector.
RISK
The other aspect of the quantitative analysis is to consider the risk of the funds and the measures taken again have to accommodate a more restricted data set which may also include some back tested data and mirror funds if applicable. The measures are intended to help understand the likely volatility of the funds and therefore which risk bands they are likely to fit into.
The Investment Matrix – Core Solutions
Core solutions are monitored against the Matrix Parameters over the long-term, but only Succession Model Portfolios are managed to perform in line with the parameters over the long terms.

Succession Advisory Services 15
QUALITATIVE
The statistical evidence should be supported by an understanding of the structure, process, personnel, philosophy and investment process – and all this should be understood for each of the offerings to ensure that this fits in with the requirements of the Matrix. This is evidenced through a questionnaire which is completed by the managers as well as meetings to allow any challenges or for the provision of further information, if required.
The analysis of any funds which are selected for the approved lists is detailed in the RSMR methodology document and covers the quantitative and qualitative process that is applied to the research process.
The due diligence performed on the funds involves:
— A completed questionnaire covering the key areas of the investment process and the underlying investment philosophy.
— Information on the details of the managers, their history and the background to the financial strength of the company.
— The support systems and information flow as well as the decision-making processes are also covered.
— In addition to this with core solutions we hold face to face meetings with each of the managers at their own offices in order to meet the full management team. The information on the funds are held on our data base for reference.
Once the due diligence is completed on a fund manager, and the investment solutions are found to be acceptable for inclusion on the Investment Matrix each individual fund has to be assessed for its risk positioning. This is undertaken by comparing an individual fund’s performance and risk data with that of the investment parameters Matrix and then allocating each fund to the fund solution Matrix. In doing this, we look at the longest set of data available and will review back tested data if the fund has only a short track record. Finally, we overlay the qualitative information we have gained from the due diligence process to ensure we have taken into account the fund’s process and objective. This will include reviewing external risk analysis (such as DT risk ratings) as well as referral to the investment manager to ensure they accept our risk positioning. In most cases the additions to the Matrix involve a fund range rather than a single fund and although the process looks at each fund individually it also takes account of how the range is expected to work together.
All the data that supports this selection is documented and held by RSMR. This is a reference point for any data that is required to demonstrate that due diligence has been applied from a fund selection perspective. The philosophy of the group is represented in these selections with the flexibility of offering other managed and specialist solutions to suit the needs of individual clients who require specific tailoring.
The core solutions best represent Succession’s central investment philosophy while allowing flexibility to mix other investment styles within the full Matrix.
The Funds
The core range is intended to reflect the investment methodology and considerations made in the key principles. This is not just a top quartile ‘best of breed’ filtering process but one that addresses the investment philosophy of the organisation which is to provide consistent long-term solutions. The funds are split to provide both traditional and multi asset alternatives on the basis that this is the most flexible way to access a variety of potential future investment conditions. There are no certainties about which methodology will prevail over the next investment cycle it is however prudent to assume that a professionally managed diversified solution offers the most likely way of capturing a share of the growth potential. The decision to use managed solutions reflects the fact that the investment review and market timing processes are best dealt with by the fund managers allowing Wealth Planners more time to focus on delivering to needs.
Each of the default solutions reflects the Key Principles and provide investment options which represent different risk categories. The managers have been selected as strong choices within their peer group reflecting the traditional and multi-asset methods of investment.
The solutions are intended to be the base of most portfolios, but it is recognised that existing clients will have mixed portfolios, and, in any transition period, may need to adapt their portfolios using satellite funds. It is therefore anticipated that a list of funds based on selected IA sectors will complement this core range. The Investment Matrix shows where each investment solution sits within the 1 to 5 Succession risk profile range.
DFM Solutions Selection Process
The Key Principles set by Succession remain core to the way that the investment process works, and so the same philosophy is used for the discretionary research, but with some flexibility added to reflect this marketplace. These managers are not operating to the same principles and restrictions that often restrict fund groups and therefore do not seek to benchmark to IA sectors or to specific peer groups. They are of course aware of the performance of these alternatives but do not manage funds to compete with them. The funds are not unitised and so do not have sector rules or investment range restrictions that some unit trusts or OEIC funds may have. There are therefore a number of differences in the way the funds are managed but also significant similarities which means that the judgement of whether to use them or not depends on similar research criteria.
The factors involved in assessing the discretionary managers are similar to those used for funds with some amendments and additional requirements. The most important factors we believe are indicated on the next page.

Succession Advisory Services 16
— Capital Adequacy — Investment Approach — Key Personnel — Risk Controls — Performance — Charges and costs — Capital Adequacy — Accessibility — Investment Team — Investment Objectives
These are the core areas for assessing an investment house irrespective of the type of investment that is being made. In the case of the discretionary providers it is particularly important that the ownership and capital structure of the firm is secure to ensure that the firm can continue to support Succession over the longer term.
CAPITAL ADEQUACY AND OWNERSHIP
If the company is privately owned then the information is not as clearly available but a good understanding of who the key owners of the business are, and the financial backing for the company would be sensible prior to committing fund flows. Limited companies can be considered through accounts and an understanding of major shareholders. These are often key business members and so can help to clarify the levels of commitment and support.
INVESTMENT APPROACH
Where possible this is a combination of RSMR and external research if available. The investment style and the investment process are core to understanding what the fund is aiming to do and whether this fits with its objectives. The stock holdings and the investment bias as well as factors such as turnover and buy and sell disciplines help to build the qualitative view of the manager and the process and is the same as that for a unitised fund, and having a documented philosophy and process provides the basis for fund assessment and monitoring.
KEY PERSONNEL
It is beneficial to understand who the key personnel are and how they are tied in or financially rewarded by the company. The structure of the management hierarchy may also illustrate how the investment process will work in reality.
RISK CONTROLS
These are important to assess as part of the ongoing investment process and provide an understanding of the way in which the manager handles their exposure to risk and what controls are in place.
PERFORMANCE
Performance is a key attribute for any manager, which should be measured against the objective of the model and how it is invested as well against more commercial benchmarks. Discretionary managers should still be able to match themselves against unitised alternatives over the longer term, even if shorter term objectives are perhaps different. Information is often more difficult to get hold of for DFMs but if managers are reluctant to provide the information then this is clearly a sign to avoid them in the final selection assessment.
CHARGES AND COSTS
Here we must ensure that the manager is competitive in the discretionary market. The market is tight in this area and so any margins that are too high will be easily identified. Turnover is important in this respect as an excessive level suggests transactional commission may be more important than perhaps it should be.
Discretionary model managers operate in slightly different ways to traditional unitised fund managers, but the principles of assessment remain the same. A well-capitalised company with a documented process and philosophy remains a strong starting point for any selection.

17Succession Advisory Services
“ IT GIVES ME A DISTINCT ADVANTAGE OVER IFA COMPETITORS SPECIFICALLY THOSE TIED OR RESTRICTED. IT PROVIDES PEACE OF MIND KNOWING IT IS STRUCTURED AROUND AN INVESTMENT COMMITTEE WITH EXTERNAL INVESTMENT RESEARCH. SPECIALISTS.”
17
Succession Wealth Planner

Succession Advisory Services 18
Investment Committee
The most important element of the monitoring process is the oversight delivered by the Succession Investment Committee. This is a committee drawn from both internal and external sources to monitor and challenge the information gathered on the Matrix solutions. The current committee has external consultants who sit alongside representatives from the internal investment team, compliance and the advisory business.
The Investment Committee meet monthly to discuss the data and any qualitative information related to the Matrix solutions. The committee also review the solutions in more detail on a quarterly basis based on a quarterly review report from external consultants (RSMR). Each meeting considers the macro investment climate and relates this to the return and volatility data from each of the solutions on the Matrix.
When a question or challenge cannot be resolved in the meeting it will be referred for further investigation with an action to resolve within a specified time scale.
The Committee is responsible for reviewing potential new solutions against the Key Principles before approving them for inclusion on the Matrix. The committee further approve new funds to be added to the matrix against the Succession Key Principles in order to ensure their appropriateness within the Investment Matrix.
Joint Relationship Board
The Succession Model Portfolios have an additional level of governance and monitoring delivered by the Joint Relationship Board. This committee is drawn from internal and external Succession sources along with the outsourced investment partners for the Succession Model Portfolios. The current board has external consultants who sit alongside representatives from the internal investment team and compliance.
The board meet biannually to review the following: — the performance against the Succession Investment
Mandate — the performance against the ARC Indices (as a
representation of the discretionary fund management industry)
— model rebalances — changes made within team structures
Monthly Monitoring
Each month several reports are produced which detail the performance and volatility of each of the core solutions Multimanager Funds (MMF) and Managed Model Portfolios (MMP) (discretionary solutions) over the preceding three years and twelve months with priority given to the longer-term three-year data.
The reports are compiled in time for discussion at the monthly investment committee and show how the solutions have performed in relation to their risk bandings on the Matrix, with the statistics being colour coded according to their relative performance. The data can be split into two types – Multimanager Funds and Managed Model Portfolios.
MULTIMANAGER FUNDS (MMF )
Multimanager Funds refer to the Core Matrix solutions. The data for these funds is obtained from FE Analytics, and includes performance and volatility measured over one, three, five and eight years (up to the previous month-end). The clean share classes of the relevant funds are used, with Succession specifying the share class for reporting purposes.
Ongoing Monitoring
THE COMMITTEE REGULARLY EVALUATE THE PLACE OF EACH SOLUTION ON THE MATRIX AND CONSIDER WHETHER ANY NEW SOLUTIONS SHOULD BE ADDED OR REMOVED.

Succession Advisory Services 19
Quarterly Review Meetings
The Succession investment team further meet with each Matrix fund manager on a quarterly basis. Meetings have a flexible agenda to allow for all parties to address relevant and topical discussion points. These meetings include an update from both parties in relation to current and upcoming changes within the respective business and their interpretation of current and upcoming market changes.
The primary objective of these meetings is to ensure the Investment Matrix undergoes constant review. As part of the ongoing governance of the Matrix, Succession endeavors to gain the best terms from each Matrix fund manager in order to reduce investment costs for clients.
Company updates are a constant agenda point, this allows Succession and the Matrix fund manager to reveal any changes within the business or company structure that might affect the other party. Succession work with each of the Matrix fund managers to ensure that there is a clear understanding of the wider Matrix proposition and Matrix fund managers are introduced to all Planners.
These meetings help to strengthen and maintain our relationships with all Matrix fund managers.
MANAGED MODEL PORTFOLIOS (MMP)
Managed Model Portfolios refer to Succession MPS ranges powered by respective investment houses. Information on the MMPs is sourced directly from the model managers, and again includes one and three-year performance and volatility (measured up to the previous month end). This is obtained through contacts at each model manager by asking them to complete the following template:
TABLES
This information is then entered into the master spreadsheets which show all the data collected over the previous twelve months, and colour coding is applied to indicate where the solutions are in relation to the Succession Matrix Parameters. The colour coding works as follows:
Vola
tility
Ban
d
1 ye
arC
umul
ativ
e Pe
rfor
man
ce
1 ye
ar A
nnua
lised
Cum
ulat
ive
Vola
tility
3 ye
ar A
nnua
lised
Cum
ulat
ive
Perf
orm
ance
3 ye
ar A
nnua
lised
Cum
ulat
ive
Vola
tility
5 ye
ar A
nnua
lised
Cum
ulat
ive
Perf
orm
ance
5 ye
ar A
nnua
lised
Cum
ulat
ive
Vola
tility
7 ye
ar A
nnua
lised
Cum
ulat
ive
Perf
orm
ance
7 ye
ar A
nnua
lised
Cum
ulat
ive
Vola
tility
8 ye
ar A
nnua
lised
Cum
ulat
ive
Perf
orm
ance
8 ye
ar A
nnua
lised
Cum
ulat
ive
Vola
tility
Cur
rent
Yie
ld %
Model Name 1
Model Name 2
Model Name 3
Model Name 4
Model Name 5
Performance Volatility
More�than�1%�below�parameters More�than�1%�below�parameters
Within�1%�below�parameters Within�1%�below�parameters
Within parameters Within parameters
Within 1% above parameters Within 1% above parameters
More than 1% above parameters More than 1% above parameters
As many of the MMP are relatively new, 10-year data has not been available for review. Data presentation is with industry standard of 1, 3, 5 and 7 year data shown. The 8 year column will be increased every year until 10 year data is available.
Succession Advisory Services 20
Several spreadsheets are produced each month. These are as follows:
Core Funds Performance Master
This report provides performance and volatility data on all core funds within the matrix for the IC to review. This report includes several spreadsheets comparing the performance and volatility data of the solutions to the matrix parameters, and then showing some of this information graphically. The spreadsheets are as follows:
— 1YR MMP (MMP, one-year data) — 3YR MMP (MMP, three-year data) — 5YR MMP (MMP, five-year data) — 7YR MMP (MMP, seven-year data) — 8YR MMP (MMP, eight-year data) — 1YR MMF (MMF, one-year data) — 3YR MMF (MMF, three-year data) — 5YR MMF (MMF, five-year data) — 7YR MMF (MMF, seven-year data) — 8YR MMF (MMF,eight-year data) — 1YR Income (Income Funds, one-year data) — 3YR Income (Income Funds, three-year data) — 5YR Income (Income Funds, five-year data) — 7YR Income (Income Funds, seven-year data) — 8YR Income (Income Funds, eight-year data) — Band One / Two / Three etc. – these graphs show the
rolling annualised % change of all the funds with one graph representing each risk band.
— Scatter 1 / 2 / 3 etc. – these graphs shows the performance and volatility measured over one year to the previous month end of the funds with one graph representing each risk band.
Ex Core Funds Perf Master
This report mirrors the data above but for MMF and MMP which have been removed from the Matrix but which require ongoing monitoring.
[Month] Core Funds
This report shows the same information as the Core Funds Perf Master document detailed above but includes only the data for the previous month (not the previous 12 months). None of the charts are included in this version.
[Month] Ex Core Funds
This report mirrors the data above but for MMF and MMP which have been removed from the Matrix but which require ongoing monitoring, however only includes data from the previous month. The following spreadsheets are included:
— 1YR MMP (MMP, one-year data) — 3YR MMP (MMP, three-year data) — 1YR MMF (MMF, one-year data) — 3YR MMF (MMF, three-year data)
Core Funds – Sector Comparison
This report shows the MMF solutions compared to an appropriate IA sector average. Again, performance and volatility are shown, and the data is provided on a 1, 3, 5, 7 and 8 year basis
Monthly Figures – MMP
This spreadsheet shows the monthly performance figures for the MMP solutions going back to mid 2012.
Succession Monthly Stats Positioning Document
This document is prepared by RSMR and provides comment on any MMF or MMP which is outside of the Parameters by more than 1% over the previous month for 3 year data
The statistics compiled as described above are sent for circulation prior to the Investment Committee (IC) meeting.
A senior member of the RSMR investment team will attend the IC meeting and will provide an overview of the markets together with highlighting any issues with any of the Matrix fund managers.
Understanding the Reports

Succession Advisory Services 21
Quarterly Reports
Each quarter, RSMR provide two documents – one is a generic Investment Bulletin which provides an overview of the world markets, and the second is a bespoke review for Succession looking at the core Matrix solutions.
The Investment Bulletin highlights the state of play within all major asset classes and the effect of recent news events on those assets’ classes.
The bespoke review provides information on all core solutions, providing commentary on their performance over the quarter together with details of any key changes that have been made.
RSMR also provide the wording for a client facing version of the Investment Bulletin – Investor Insight, which Succession currently use as part of the client valuation pack.
The following process is the governance provided by RSMR.
“ IT REMOVES THE BURDEN OF DUE DILIGENCE AND ONGOING MONITORING OF SOLUTIONS FREEING MY TIME TO LOOK AFTER CLIENTS.”Succession Wealth Planner
Succession Advisory Services 22
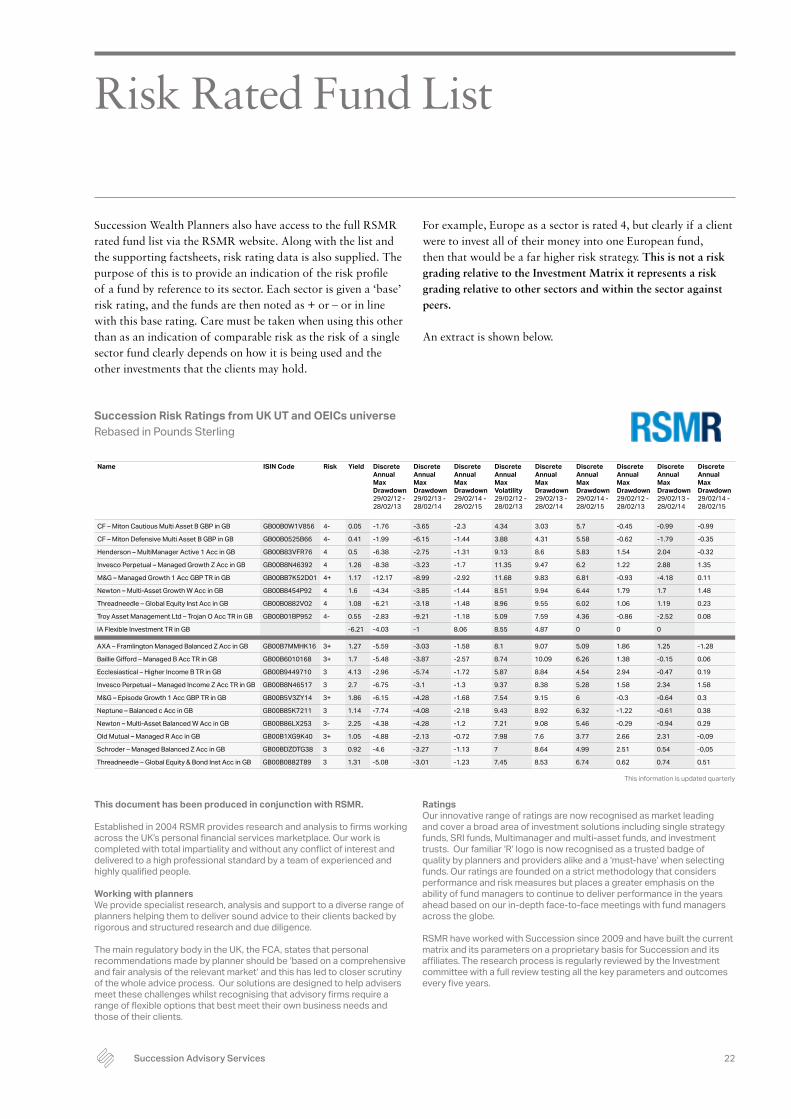
Risk Rated Fund List
Succession Wealth Planners also have access to the full RSMR rated fund list via the RSMR website. Along with the list and the supporting factsheets, risk rating data is also supplied. The purpose of this is to provide an indication of the risk profile of a fund by reference to its sector. Each sector is given a ‘base’ risk rating, and the funds are then noted as + or – or in line with this base rating. Care must be taken when using this other than as an indication of comparable risk as the risk of a single sector fund clearly depends on how it is being used and the other investments that the clients may hold.
For example, Europe as a sector is rated 4, but clearly if a client were to invest all of their money into one European fund, then that would be a far higher risk strategy. This is not a risk grading relative to the Investment Matrix it represents a risk grading relative to other sectors and within the sector against peers.
An extract is shown below.
This information is updated quarterly
Name ISIN Code Risk Yield Discrete Annual Max Drawdown 29/02/12�-�28/02/13
Discrete Annual Max Drawdown 29/02/13�-�28/02/14
Discrete Annual Max Drawdown 29/02/14�-�28/02/15
Discrete Annual Max Volatility 29/02/12�-�28/02/13
Discrete Annual Max Drawdown 29/02/13�-�28/02/14
Discrete Annual Max Drawdown 29/02/14�-�28/02/15
Discrete Annual Max Drawdown 29/02/12�-�28/02/13
Discrete Annual Max Drawdown 29/02/13�-�28/02/14
Discrete Annual Max Drawdown 29/02/14�-�28/02/15
CF – Miton Cautious Multi Asset B GBP in GB GB00B0W1V856 4- 0.05 -1.76 -3.65 -2.3 4.34 3.03 5.7 -0.45 -0.99 -0.99
CF – Miton Defensive Multi Asset B GBP in GB GB00B0525B66 4- 0.41 -1.99 -6.15 -1.44 3.88 4.31 5.58 -0.62 -1.79 -0.35
Henderson – MultiManager Active 1 Acc in GB GB00B83VFR76 4 0.5 -6.38 -2.75 -1.31 9.13 8.6 5.83 1.54 2.04 -0.32
Invesco�Perpetual�–�Managed�Growth�Z�Acc�in�GB GB00B8N46392 4 1.26 -8.38 -3.23 -1.7 11.35 9.47 6.2 1.22 2.88 1.35
M&G�–�Managed�Growth�1�Acc�GBP�TR�in�GB GB00BB7K52D01 4+ 1.17 -12.17 -8.99 -2.92 11.68 9.83 6.81 -0.93 -4.18 0.11
Newton�–�Multi-Asset�Growth�W�Acc�in�GB GB00B8454P92 4 1.6 -4.34 -3.85 -1.44 8.51 9.94 6.44 1.79 1.7 1.48
Threadneedle – Global Equity Inst Acc in GB GB00B0882V02 4 1.08 -6.21 -3.18 -1.48 8.96 9.55 6.02 1.06 1.19 0.23
Troy Asset Management Ltd – Trojan O Acc TR in GB GB00B01BP952 4- 0.55 -2.83 -9.21 -1.18 5.09 7.59 4.36 -0.86 -2.52 0.08
IA Flexible Investment TR in GB -6.21 -4.03 -1 8.06 8.55 4.87 0 0 0
AXA�–�Framlington�Managed�Balanced�Z�Acc�in�GB GB00B7MMHK16 3+ 1.27 -5.59 -3.03 -1.58 8.1 9.07 5.09 1.86 1.25 -1.28
Baillie�Gifford�–�Managed�B�Acc�TR�in�GB GB00B6010168 3+ 1.7 -5.48 -3.87 -2.57 8.74 10.09 6.26 1.38 -0.15 0.06
Ecclesiastical – Higher Income B TR in GB GB00B9449710 3 4.13 -2.96 -5.74 -1.72 5.87 8.84 4.54 2.94 -0.47 0.19
Invesco�Perpetual�–�Managed�Income�Z�Acc�TR�in�GB GB00B8N46517 3 2.7 -6.75 -3.1 -1.3 9.37 8.38 5.28 1.58 2.34 1.58
M&G�–�Episode�Growth�1�Acc�GBP�TR�in�GB GB00B5V3ZY14 3+ 1.86 -6.15 -4.28 -1.68 7.54 9.15 6 -0.3 -0.64 0.3
Neptune – Balanced c Acc in GB GB00B85K7211 3 1.14 -7.74 -4.08 -2.18 9.43 8.92 6.32 -1.22 -0.61 0.38
Newton�–�Multi-Asset�Balanced�W�Acc�in�GB GB00B86LX253 3- 2.25 -4.38 -4.28 -1.2 7.21 9.08 5.46 -0.29 -0.94 0.29
Old Mutual – Managed R Acc in GB GB00B1XG9K40 3+ 1.05 -4.88 -2.13 -0.72 7.98 7.6 3.77 2.66 2.31 -0,09
Schroder�–�Managed�Balanced�Z�Acc�in�GB GB00BDZDTG38 3 0.92 -4.6 -3.27 -1.13 7 8.64 4.99 2.51 0.54 -0,05
Threadneedle – Global Equity & Bond Inst Acc in GB GB00B0882T89 3 1.31 -5.08 -3.01 -1.23 7.45 8.53 6.74 0.62 0.74 0.51
Succession Risk Ratings from UK UT and OEICs universe Rebased in Pounds Sterling
This document has been produced in conjunction with RSMR.
Established�in�2004�RSMR�provides�research�and�analysis�to�firms�working�across�the�UK’s�personal�financial�services�marketplace.�Our�work�is�completed�with�total�impartiality�and�without�any�conflict�of�interest�and�delivered to a high professional standard by a team of experienced and highly�qualified�people.
Working with plannersWe�provide�specialist�research,�analysis�and�support�to�a�diverse�range�of�planners helping them to deliver sound advice to their clients backed by rigorous and structured research and due diligence.
The�main�regulatory�body�in�the�UK,�the�FCA,�states�that�personal�recommendations made by planner should be ‘based on a comprehensive and fair analysis of the relevant market’ and this has led to closer scrutiny of�the�whole�advice�process.� Our�solutions�are�designed�to�help�advisers�meet�these�challenges�whilst�recognising�that�advisory�firms�require�a�range�of�flexible�options�that�best�meet�their�own�business�needs�and�those of their clients.
RatingsOur�innovative�range�of�ratings�are�now�recognised�as�market�leading�and cover a broad area of investment solutions including single strategy funds,�SRI�funds,�Multimanager�and�multi-asset�funds,�and�investment�trusts.� Our�familiar�‘R’�logo�is�now�recognised�as�a�trusted�badge�of�quality�by�planners�and�providers�alike�and�a�‘must-have’�when�selecting�funds. Our ratings are founded on a strict methodology that considers performance and risk measures but places a greater emphasis on the ability of fund managers to continue to deliver performance in the years ahead�based�on�our�in-depth�face-to-face�meetings�with�fund�managers�across the globe.
RSMR�have�worked�with�Succession�since�2009�and�have�built�the�current�matrix and its parameters on a proprietary basis for Succession and its affiliates.�The�research�process�is�regularly�reviewed�by�the�Investment�committee�with�a�full�review�testing�all�the�key�parameters�and�outcomes�every�five�years.�

Succession Advisory Services 23
Rayner Spencer Mills Research Process
Compare performance and risk of fund to relevant IA sector
Qualitative research includes completion of detailed fund questionnaire and a face to face meeting�with�fund�manager�if�deemed�worthy�of�more�in-depth�analysis
Qualitative and quantitative measures ensure performance and risk statistics produced in robudt process and by a strong management team.
Compare performance and risk of fund to relevant IA sector.
Performance compared against the average�for�its�IA�sector,�its�own�benchmark�and other comparable funds. Anomalies both positive and negative are investigated to�understand�how�a�fund�is�likely�to�perform under certain market conditions.
Considered areas: — Fund�technical�data�(objective,�sector�and�asset�allocation,�charges,�etc)
— Range of investable assets — Team structures and CVs — Management incentives — Macro�and�micro�influences — Decision making process — Buy and sell processes — Buy and sell disciplines — Company visits — Turnover — Attribution analysis — Risk monitoring — Fund style — Fund�differentiators — Research tools
Volatility,�Sharpe�ratio,�Information�ratios,�VaR,�maximum�loss�and�Maximum�drawdown
Risk statistics are considered in relation to their�benchmark,�sector�and�objectives.
General rule: £50m sizeException: Sector funds – £30m sizeNot a restrictive policy so can consider newly�launched�funds�etc.
Analysis of OCF based on their asset class exposure,�aims,�objectives�and�investment�strategy.
Consideration of fund size and purchasing power
Funds�requiring�more�in-depth�analysis�will�complete a detailed fund questionnaire.
Qualitative�screening�to�establish�how�a�fund operates
Judgement on relevant experience of�management�and�team,�roles�and�responsibilities and resources available. If�fund�manager�leaves,�as�assessment�is�made�as�to�how�that�will�affect�the�fund.
Is research brought into the company? Fund managers responsibilities. Is the Fund Manager responsible or inputting heavily into other funds?
Understanding�how�fund�is�managed,�what�triggers�a�buy�or�sell,�what�are�they�looking�for�in�the�stocks�they�hold,�sector,�region,�style,�market�cap,�the�risk�management�process.
Research into fund management
Manager resources
Fund management ProcessesRisk controlsSustainability�and�ethical�factors,�including�SRI passive Funds
Review�and�monitoring�process
Internal checks and balances and the formal and informal fund parameters
If�applicable,�what�is�the�specific�criteria�of SRI?
Quantitative analysis conducted through FE�Analytics�and�combined�with�other�external data sources
RSMR�will�also�look�and�a�fund�manager�or management team’s performance in previous roles (possibly at other companies) in addition to their current position�to�provide�a�longer-term�picture.

Succession Advisory Services 24
Appendix 1 – Succession Risk Mapping and Matrix Parameters
Appendices
Succession Portfolio Expected Parameters
Risk level Volatility (%) – 5 YearsAnnualised* Return (%) –
5 Years Annualised Maximum Loss (%)
1 – Defensive 2 to 4.75 2 to 4.5 -5
2 – Cautious 4 to 7 3.5 to 6 -8
3 – Balanced 5 to 9 4.2 to 7.5 -12
4 – Moderately Adventurous 8 to 13 5 to 8 -15
5 – Adventurous 10 to 16 6 to 10 -18
Risk (1-7) Fits with Succession Matrix Range
1 1
2 1/2
3 2/3
4 3/4
5 4/5
6 4/5
7 5
Appendix 2 – ATR Tools fit within Succession Risk Categories
Risk (1-10) Fits with Succession Matrix Range
1 1
2 1
3 1/2
4 2/3
5 3/4
6 4/5
7 4/5
8 5
9 -
10 -
*� �The�annual�data�is�based�on�a�five�year�view�so�clients�should�be�aware�that�in�any�specific�annual�period�the�return�or�volatility�may�exceed�these�parameters�but�should�fall�within�the�parameters�over�the�longer�term.
���Maximum�loss�is�viewed�over�an�annual�period�as�it�indicates�the�maximum�potential�loss�of�capital�for�each�risk�profile�in�a falling market.
Source RSMR Oct 2015
Source RSMR Oct 2015

Succession Advisory Services 25
Appendix 3 – Aligning Risk Profilers
Each of the three systems provide different outputs in terms of risk profiling but all finally produce an asset allocation for each of the risk profiles and it is this that we can compare to get an idea of which risk profiles can be matched. The three systems clearly do not generate exactly matching asset allocations, so they are compared according to their nearest asset allocation. This is further complicated by the fact that the systems do not always combine the same assets, for example one of the systems does not use property. To add more accuracy to the mapping process we consider the risk outputs of each of the portfolios and make sure that the mapping process provides a sensible match in this area as well.
Portfolio Process Asset Allocation %
Cash Global High Yield Bond
UK Corporate Bonds
UK Gilts Int Bond UK Index Linked Gilts
UK Equities
NAmerican Eq
Japan Eq Pacific Ex Jap Eq
Emerging Markets Eq
European Equities
UK Property
1 RP1 100
RP2 39 49 12
RP3 10 60 30
2 RP1 41 5 13 13 6 5 12 5
RP2 17 55 18 5 5
RP3 10 55 25 10
3 RP1 10 6 20 16 7 7 16 10 8
RP2 58 22 10 10
RP3 5 50 25 15 5
4 RP1 5 6 27 8 5 22 9 5 5 8
RP2 42 28 15 15
RP3 40 30 20 10
5 RP1 5 24 5 28 14 5 6 5 7
RP2 27 33 20 20
RP3 35 25 25 15
6 RP1 5 15 5 29 11 6 9 9 6 5
RP2 21 39 25 15
RP3 30 20 30 20
7 RP1 5 8 34 9 6 14 15 5 5
RP2 16 39 35 10
RP3 20 20 35 25
8 RP1 28 5 5 19 28 5 5
RP2 11 39 45 5
RP3 10 20 40 30
9 RP1 21 5 5 26 38 5
RP2 8 42 50
RP3 5 15 45 35
10 RP1 7 5 32 58
RP2 45 55
RP3 5 5 50 40
11 RP3 50 50

Succession Advisory Services 26
Succession Advisory ServicesDrake�Building,�15�Davy�RoadPlymouth Science ParkDerriford,�Plymouth,�PL6�8BY
Phone 01752 968 500Email [email protected] successionadvisoryservices.com
FP�2019-073