Embed Size (px)
Citation preview
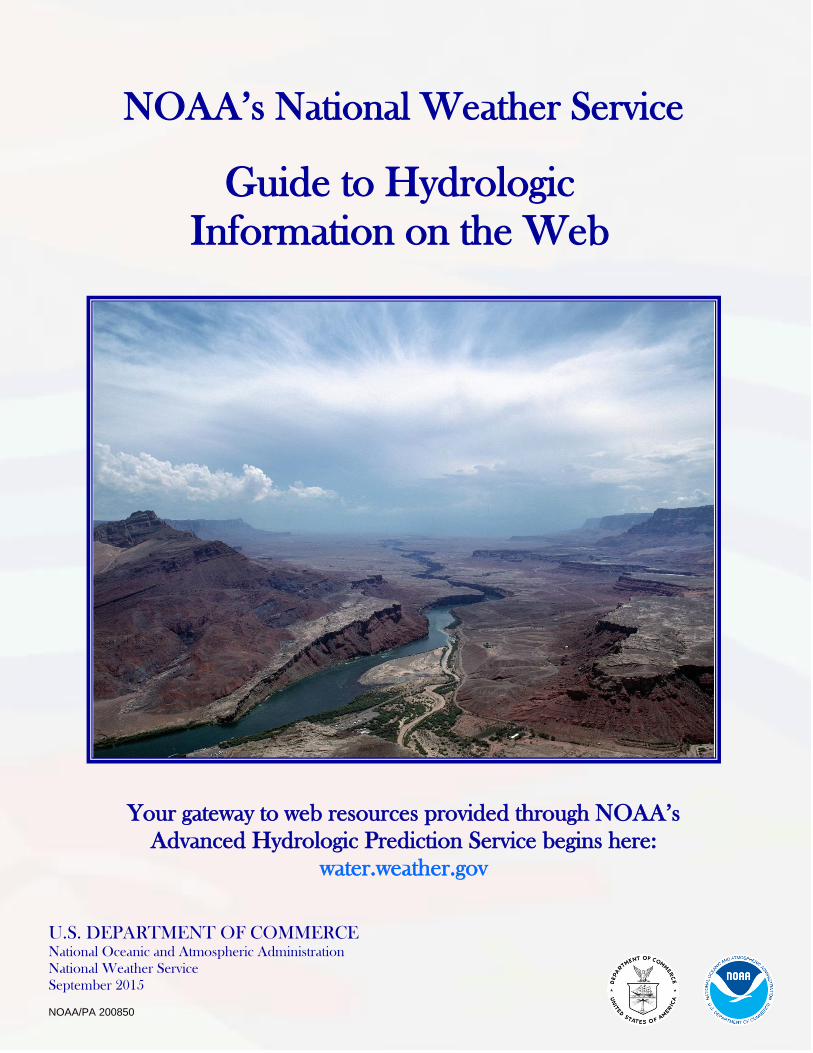
NOAA’s National Weather Service
Your gateway to web resources provided through NOAA’s
Advanced Hydrologic Prediction Service begins here:
water.weather.gov
Guide to Hydrologic
Information on the Web
Prediction Services
NOAA/PA 200850
U.S. DEPARTMENT OF COMMERCE National Oceanic and Atmospheric Administration
National Weather Service
September 2015
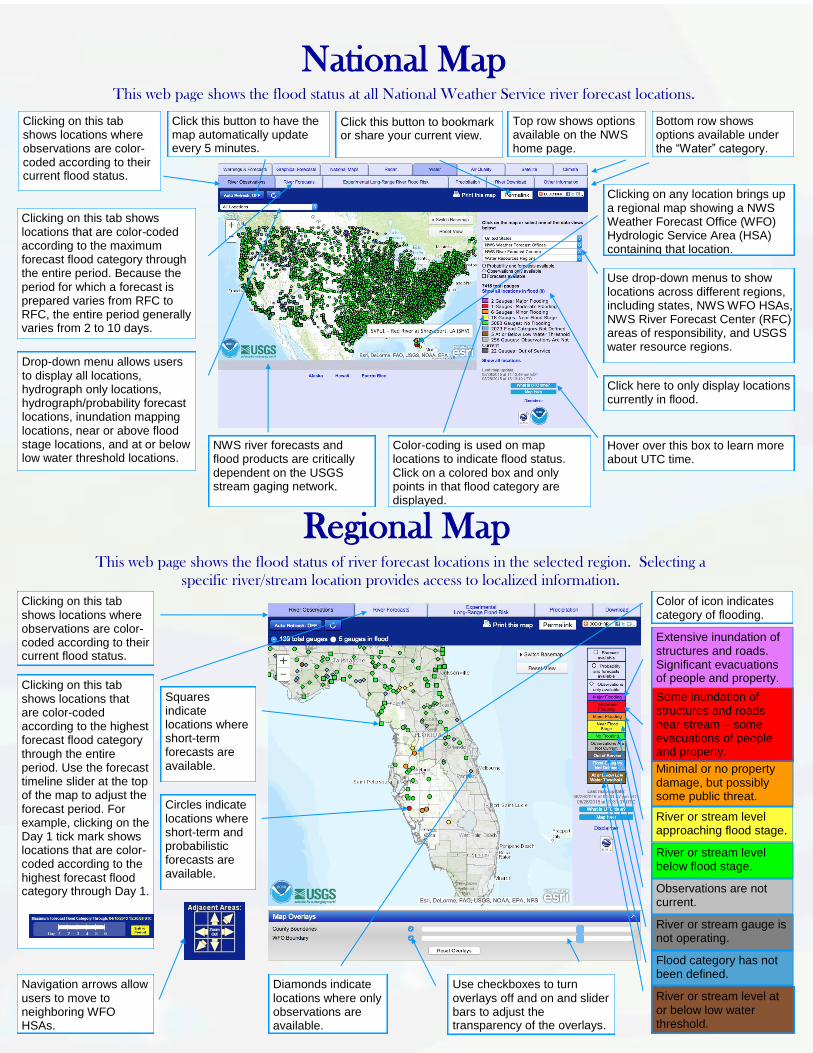
Click this button to bookmark or share your current view.
National Map This web page shows the flood status at all National Weather Service river forecast locations.
Regional Map This web page shows the flood status of river forecast locations in the selected region. Selecting a
specific river/stream location provides access to localized information.
River or stream gauge is not operating.
Observations are not current.
River or stream level below flood stage.
River or stream level approaching flood stage.
Minimal or no property damage, but possibly some public threat.
Some inundation of structures and roads near stream – some evacuations of people and property.
Extensive inundation of structures and roads. Significant evacuations of people and property.
Color of icon indicates category of flooding.
Clicking on any location brings up a regional map showing a NWS Weather Forecast Office (WFO) Hydrologic Service Area (HSA) containing that location.
Clicking on this tab shows locations where observations are color-coded according to their current flood status.
NWS river forecasts and flood products are critically dependent on the USGS stream gaging network.
Clicking on this tab shows locations that are color-coded according to the highest forecast flood category through the entire period. Use the forecast timeline slider at the top of the map to adjust the forecast period. For example, clicking on the Day 1 tick mark shows locations that are color-coded according to the highest forecast flood category through Day 1.
Clicking on this tab shows locations where observations are color-coded according to their current flood status.
Color-coding is used on map locations to indicate flood status. Click on a colored box and only points in that flood category are displayed.
Drop-down menu allows users to display all locations, hydrograph only locations, hydrograph/probability forecast locations, inundation mapping locations, near or above flood stage locations, and at or below low water threshold locations.
Clicking on this tab shows locations that are color-coded according to the maximum forecast flood category through the entire period. Because the period for which a forecast is prepared varies from RFC to RFC, the entire period generally varies from 2 to 10 days.
Use drop-down menus to show locations across different regions, including states, NWS WFO HSAs, NWS River Forecast Center (RFC) areas of responsibility, and USGS water resource regions.
Bottom row shows options available under the “Water” category.
Click this button to have the map automatically update every 5 minutes.
Top row shows options available on the NWS home page.
Navigation arrows allow users to move to neighboring WFO HSAs.
Use checkboxes to turn overlays off and on and slider bars to adjust the transparency of the overlays.
Click here to only display locations currently in flood.
Hover over this box to learn more about UTC time.
Squares indicate locations where short-term forecasts are available.
Circles indicate locations where short-term and probabilistic forecasts are available.
Flood category has not been defined.
Diamonds indicate locations where only observations are available.
River or stream level at or below low water threshold.
Hydrograph
Weekly Chance of Exceeding Levels
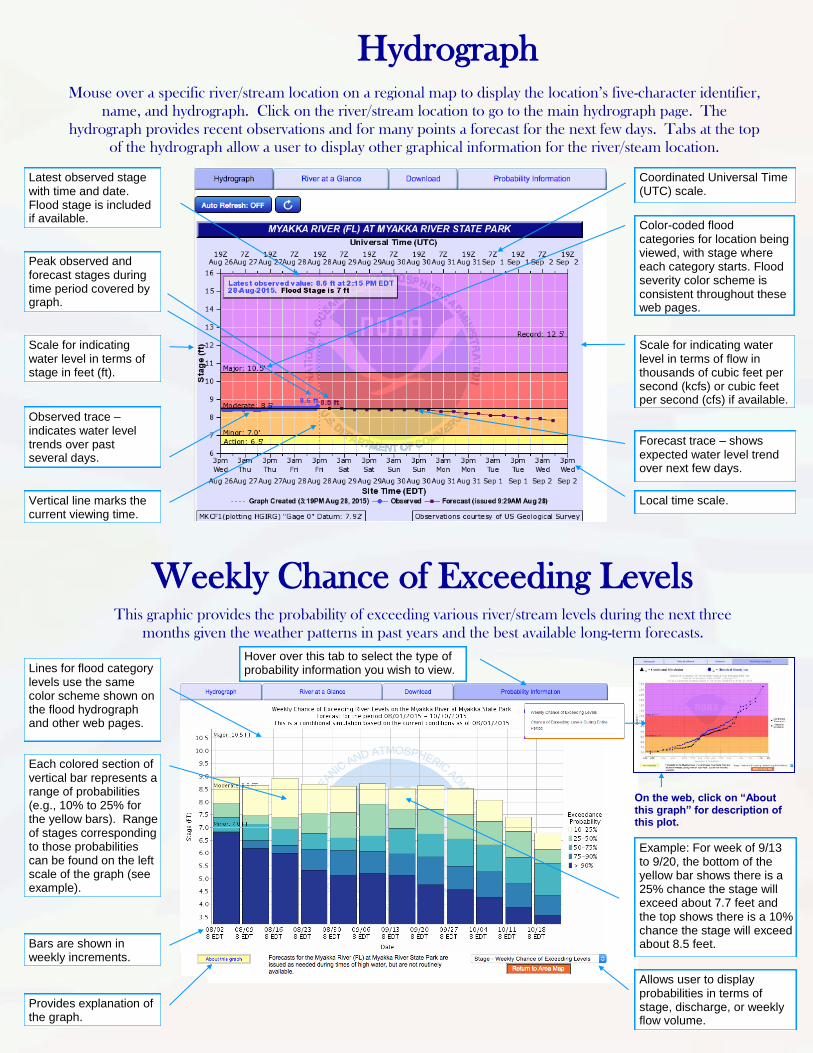
Mouse over a specific river/stream location on a regional map to display the location’s five-character identifier,
name, and hydrograph. Click on the river/stream location to go to the main hydrograph page. The
hydrograph provides recent observations and for many points a forecast for the next few days. Tabs at the top
of the hydrograph allow a user to display other graphical information for the river/steam location.
This graphic provides the probability of exceeding various river/stream levels during the next three
months given the weather patterns in past years and the best available long-term forecasts.
On the web, click on “About this graph” for description of this plot.
Color-coded flood categories for location being viewed, with stage where each category starts. Flood severity color scheme is consistent throughout these web pages.
Forecast trace – shows expected water level trend over next few days.
Vertical line marks the current viewing time.
Observed trace – indicates water level trends over past several days.
Scale for indicating water level in terms of stage in feet (ft).
Peak observed and forecast stages during time period covered by graph.
Each colored section of vertical bar represents a range of probabilities (e.g., 10% to 25% for the yellow bars). Range of stages corresponding to those probabilities can be found on the left scale of the graph (see example).
Bars are shown in weekly increments.
Provides explanation of the graph.
Example: For week of 9/13 to 9/20, the bottom of the yellow bar shows there is a 25% chance the stage will exceed about 7.7 feet and the top shows there is a 10% chance the stage will exceed about 8.5 feet.
Allows user to display probabilities in terms of stage, discharge, or weekly flow volume.
Scale for indicating water level in terms of flow in thousands of cubic feet per second (kcfs) or cubic feet per second (cfs) if available.
Latest observed stage with time and date. Flood stage is included if available.
Lines for flood category levels use the same color scheme shown on the flood hydrograph and other web pages.
Hover over this tab to select the type of probability information you wish to view.
Local time scale.
Coordinated Universal Time (UTC) scale.
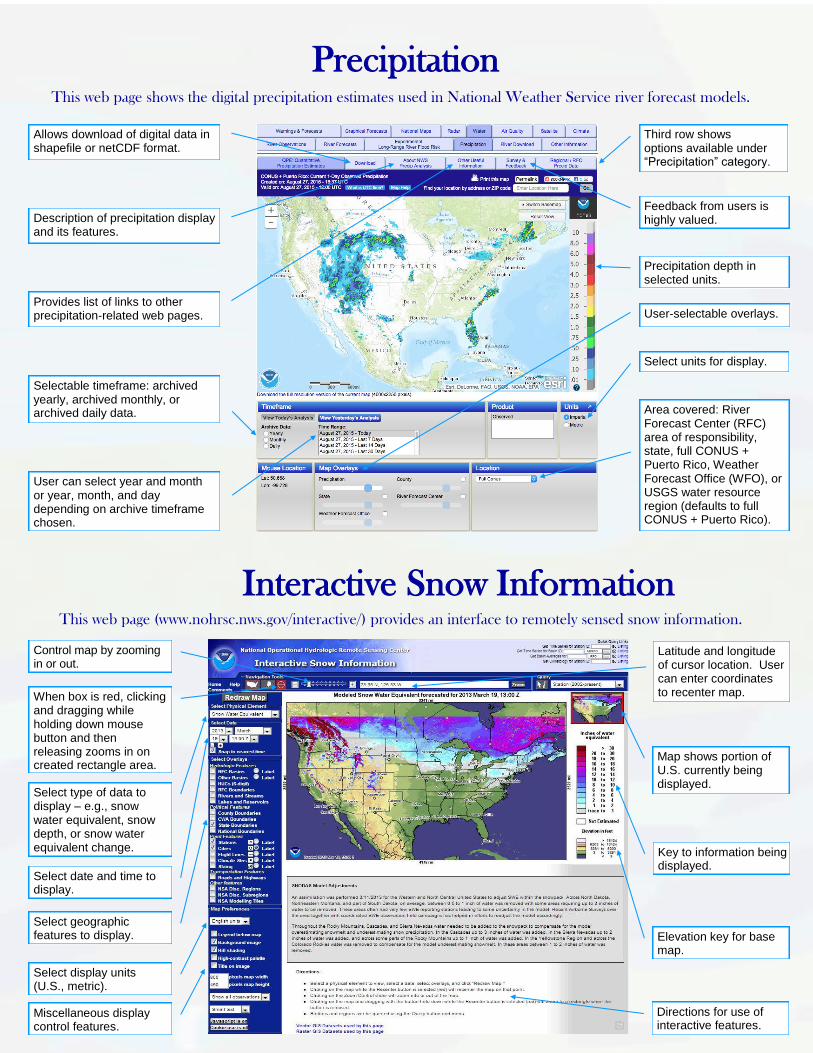
Precipitation
Directions for use of interactive features.
Select geographic features to display.
Interactive Snow Information
Miscellaneous display control features.
This web page shows the digital precipitation estimates used in National Weather Service river forecast models.
This web page (www.nohrsc.nws.gov/interactive/) provides an interface to remotely sensed snow information.
Select display units (U.S., metric).
Select date and time to display.
Select type of data to display – e.g., snow water equivalent, snow depth, or snow water equivalent change. qqq
When box is red, clicking and dragging while holding down mouse button and then releasing zooms in on created rectangle area.
Control map by zooming in or out.
Map shows portion of U.S. currently being displayed.
Key to information being displayed.
Elevation key for base map.
Description of precipitation display and its features.
Allows download of digital data in shapefile or netCDF format.
Provides list of links to other precipitation-related web pages.
Area covered: River Forecast Center (RFC) area of responsibility, state, full CONUS + Puerto Rico, Weather Forecast Office (WFO), or USGS water resource region (defaults to full CONUS + Puerto Rico).
Select units for display.
User-selectable overlays.
Precipitation depth in selected units.
Third row shows options available under “Precipitation” category.
Feedback from users is highly valued.
Latitude and longitude of cursor location. User can enter coordinates to recenter map.
Selectable timeframe: archived yearly, archived monthly, or archived daily data.
User can select year and month or year, month, and day depending on archive timeframe chosen.
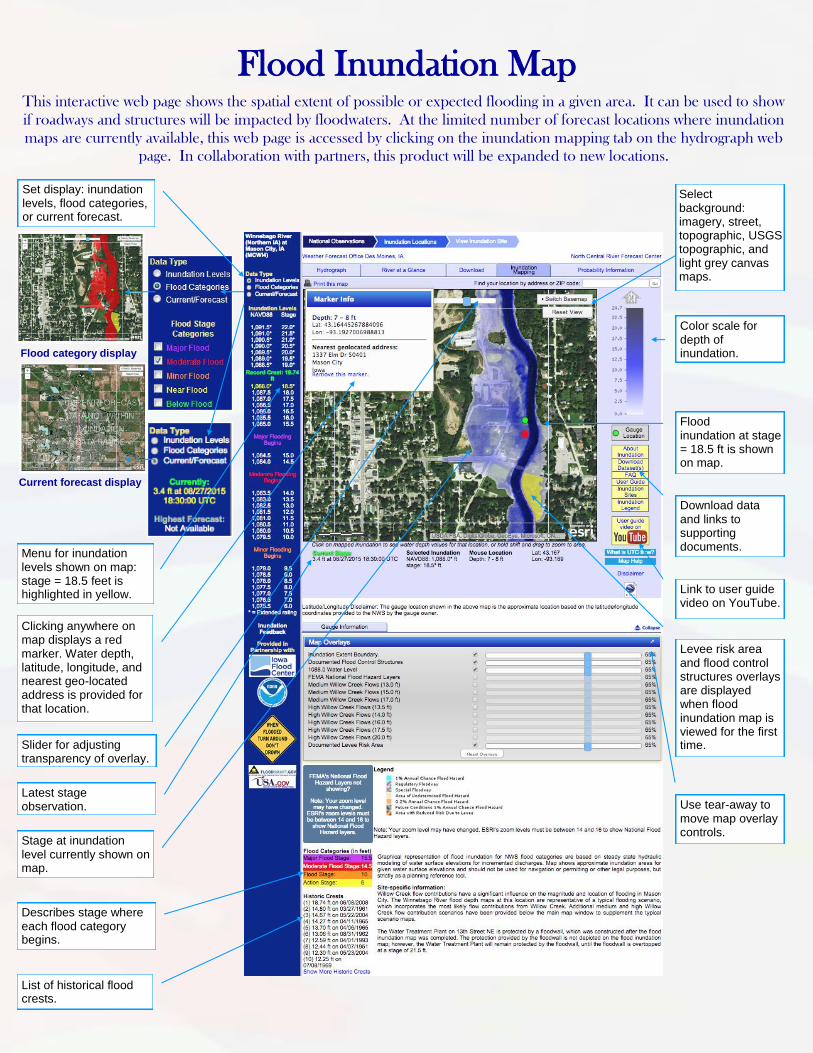
Flood Inundation Map
Describes stage where each flood category begins.
List of historical flood crests.
Flood category display
Current forecast display
This interactive web page shows the spatial extent of possible or expected flooding in a given area. It can be used to show
if roadways and structures will be impacted by floodwaters. At the limited number of forecast locations where inundation
maps are currently available, this web page is accessed by clicking on the inundation mapping tab on the hydrograph web
page. In collaboration with partners, this product will be expanded to new locations.
Set display: inundation levels, flood categories, or current forecast.
Slider for adjusting transparency of overlay.
Stage at inundation level currently shown on map.
Select background: imagery, street, topographic, USGS topographic, and light grey canvas maps.
Color scale for depth of inundation.
Menu for inundation levels shown on map: stage = 18.5 feet is highlighted in yellow.
Flood inundation at stage = 18.5 ft is shown on map.
Link to user guide video on YouTube.
Latest stage observation.
Download data and links to supporting documents.
Use tear-away to move map overlay controls.
Levee risk area and flood control structures overlays are displayed when flood inundation map is viewed for the first time.
Clicking anywhere on map displays a red marker. Water depth, latitude, longitude, and nearest geo-located address is provided for that location.

Experimental Long-Range River Flood Risk Map
This interactive web page shows the long-range (3-month) risk of minor, moderate and major river flooding at locations
where probabilistic forecasts are produced. The risk information is based on NWS Ensemble Streamflow (ESP)
forecasts which are generated for thousands of river and stream forecast locations across the nation.
Clicking on this tab shows locations where there is a greater than 50% chance of exceeding minor, moderate, and major flooding.
Click on the map to display a regional map of the WFO HSA containing that location.
Allows user to choose values of greater than 5, 10, 25, 50, 75, 90, or 95% chance of exceeding river flood levels during a 3-month period.
On a regional map, click on a point to view the Chance of Exceeding Levels During Entire Period graphic for that location.
Use the dropdown menus to view four types of regional maps, including state, WFO HSA, NWS RFC area of responsibility, or USGS water resource region.
Allows user to select the 3-month period of interest. Through the 28th day of the current month, the 3-month period defaults to the current month, current month + 1 month, current month + 2 months. After the 28th day of the current month, the 3-month period defaults to the current month + 1 month, current month + 2 months, current month + 3 months.
The Advanced Hydrologic Prediction Service, or AHPS, is a program in
NOAA’s National Weather Service designed to provide improved river and
flood forecasting and water information. AHPS provides a suite of graphical
and numeric products over the Internet to assist community leaders and
emergency managers in making better life- and cost-saving decisions about
evacuations and movement of property before flooding occurs.
To access the water information in this brochure, see:
water.weather.gov
Feedback on these web pages is welcome at:
weather.gov/contact
NOAA/PA 200850