Embed Size (px)
Citation preview
Guide to Creating an Effective Marketing Plan
Guide to Creating An
Effective Marketing Plan
May 1, 2007

Guide to Creating an Effective Marketing Plan
Guide to Creating an Effective Marketing Plan
TABLE OF CONTENTS
INTRODUCTION ..................................................................................................... 1 What does marketing have to do with highways? .................................................... 1 What does marketing really mean? ........................................................................... 2 The key to an effective plan ........................................................................................ 3
SECTION ONE: PRELIMINARY TASKS ................................................................ 4 1.1 Building your team and plan your retreat ............................................................ 4 1.2 Identify your target audience(s) ........................................................................... 5 1.3 Market research ..................................................................................................... 6 1.4 Develop innovation description and mission ..................................................... 6 1.5 Background development ..................................................................................... 7 1.6 Brainstorm marketing strategy and tactics ......................................................... 7 1.7 Brainstorm marketing goals ................................................................................. 8 1.8 Identify methods of monitoring/measuring progress and measurable
milestones .............................................................................................................. 8 1.9 Determine budget/availability of marketing funds .............................................. 9
SECTION TWO: BUILD YOUR OUTLINE ......................................................................... 9 2.1 Sample outline ........................................................................................................ 9
SECTION THREE: DEVELOP A DRAFT OR PRELIMINARY PLAN .................... 10
SECTION FOUR: CONDUCT YOUR TEAM RETREAT ........................................ 12 4.1 Blueprint for two-day team retreat / action plan workshop ............................. 12 4.2 Follow up .............................................................................................................. 14
SECTION FIVE: MODIFY YOUR PLAN ................................................................. 14 5.1 Post-retreat modifications .................................................................................. 14 5.2 Ongoing reviews and updates ............................................................................ 14
SECTION SIX: APPENDIX OF EXAMPLES OF MARKETING PLANS ................ 14 6.1 Prefabricated Bridge Elements and Systems 6.2 Road Safety Audits 6.3 Making Work Zones Work Better

Guide to Creating an Effective Marketing Plan
Guide to Creating an Effective Marketing Plan 1
INTRODUCTION WHAT DOES MARKETING HAVE TO DO WITH HIGHWAYS?
Our highway system is a national treasure. Not only is it the backbone of our economy, handling 70%1 of the total value of all shipped goods, the freedom of movement it provides is a mark of our open society. And it’s a critical element in national security: After 9/11, it was the highway system that the Nation relied upon to move about, and during the 2004 hurricane season, it provided evacuation routes for tens of thousands of Gulf State residents.
But this treasure is no longer pristine, and it’s no longer operating at the level it once did. Highways are built to last 20 to 25 years; bridges about twice that. Much of this valuable infrastructure, begun in the middle of the last century, is crumbling. A headline in the May 9, 2007 issue of The Wall Street Journal summed it up: “U.S. Infrastructure Found to Be in Disrepair.” And, even where the structural integrity has remained, the system’s designs may not be up to current safety standards.
How do you bring a vast highway system up to modern standards? , It is estimated that, using current practices and technologies, federal, state and local expenditures would have to increase by more than $11 billion annually from now to 2020 just to maintain the highways and bridges at current levels. The transportation agencies of this country are now attempting to do just that, but the techniques being used often cause as many problems as they alleviate. For example, widening a highway to meet the demands of congestion often means making congestion worse through the very process of construction. And both construction workers and motorists are subjected to increased safety hazards in work zones.
Yet, there now exist dozens of innovations and technologies which, if implemented, would result in noticeably faster construction, and higher levels of safety. And, by using them, we would end up with longer life-cycles for highways, often at lower cost than traditional methods. Unfortunately, the process of getting those new approaches moved from state-of-the-art to state-of-the-practice is painfully slow.
It was with that in mind that Congress authorized a pilot program called Highways for LIFE. The “LIFE” in the name is an acronym designed to call to mind the benefits of those new approaches: Long-lasting, Innnovative, Fast construction, Efficient, and Safe. Highways for LIFE is focused on getting everyone in the highway community to be open to applying innovative technologies much quicker. The program uses a variety of means to make that happen, including funding for projects which include innovative approaches, training
1Bureau of Transportation Statistics, According to the composite estimates, trucking as a single mode was the most frequently used mode, accounting for an estimated 70 percent of the total value, 60 percent of the weight, and 34 percent of the ton-miles. www.bts.gov/publications/freight_in_america/html/nations_freight.html
Guide to Creating an Effective Marketing Plan 2
“Innovation isn’t what innovators do…it’s what customers and clients adopt.”
- Micheal Schrage, MIT
programs for highway professionals, and publicity aimed at raising awareness among both the highway community and the driving public.
One tool that has proven helpful is an effort focused on how to deploy specific innovations faster. For this effort, three innovations with national significance were selected as pilots and designated “vanguard technologies” because of the innovative groundbreaking approach they were to take. For each of the technologies, a dedicated deployment team was established, using individuals from throughout the Federal Highway Administration as partners. The teams’ first task was to develop a marketing plan, complete with their first year’s strategies and budget. The approach to developing a marketing plan came from that effort.
WHAT DOES MARKETING REALLY MEAN?
Most people think that marketing is only about the advertising and/or personal selling of goods and services. Advertising and personal selling, however, are just two of many activities that fall under marketing.
The new definition of marketing, as released by the American Marketing Association, is: “Marketing is an organizational function and a set of processes for creating, communicating and delivering value to customers and for managing customer relationships in ways that benefit the organization and its stakeholders.” In general, marketing is identifying the particular wants and needs of a target audience, and then going about satisfying their needs. More simply: marketing is finding a need and filling it. This involves identifying and doing market research on your target audience(s), analyzing their needs, and then determining strategies and allocating resources to mesh your innovation with solving their problem.
In many organizations, it's easy for marketing to be seen as a service function. Non-marketers sometimes think, "We'll do the work; you make it pretty." But marketing is much more than creating a brochure. In reality, marketing focuses on discovering what's important to the customer and then positioning products or services, based on those distinct needs.
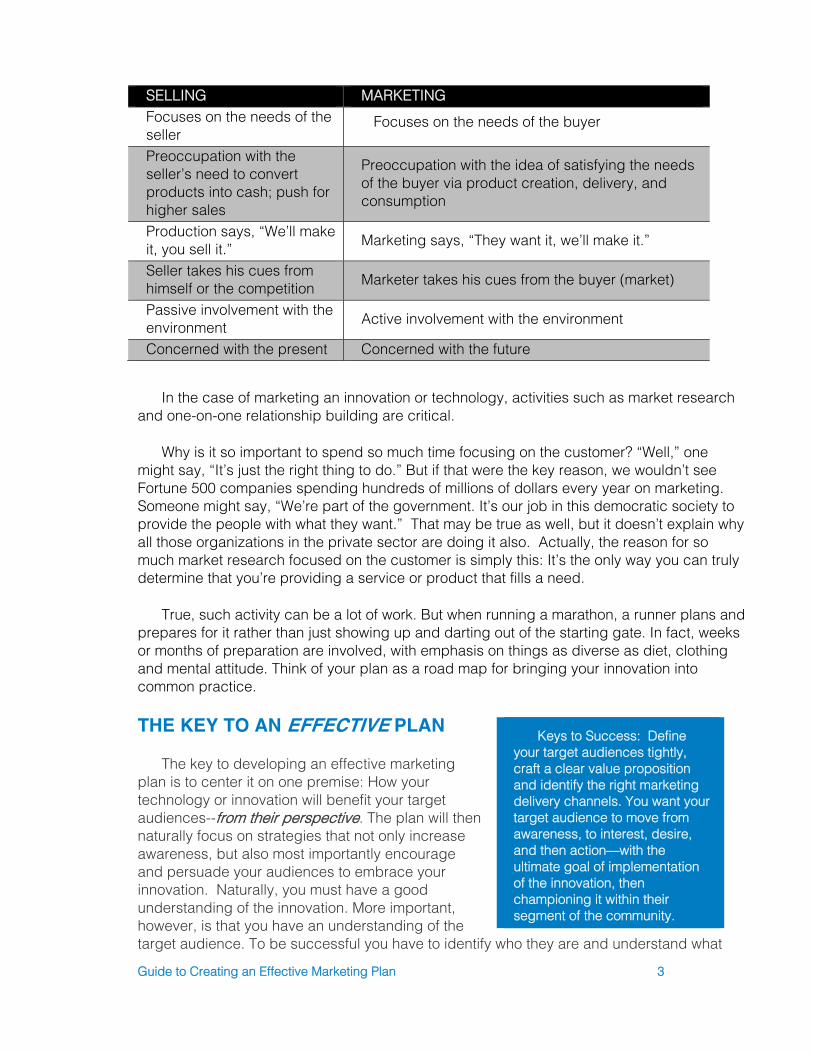
That’s the major difference between the concepts of “selling” and “marketing.” Take a look at the following chart, and put it in the perspective of, say, an automobile company. Having a “selling” focus, as opposed to a “marketing” focus would reveal the following attributes:
Guide to Creating an Effective Marketing Plan 3
Keys to Success: Define your target audiences tightly, craft a clear value proposition and identify the right marketing delivery channels. You want your target audience to move from awareness, to interest, desire, and then action—with the ultimate goal of implementation of the innovation, then championing it within their segment of the community.
In the case of marketing an innovation or technology, activities such as market research and one-on-one relationship building are critical.
Why is it so important to spend so much time focusing on the customer? “Well,” one might say, “It’s just the right thing to do.” But if that were the key reason, we wouldn’t see Fortune 500 companies spending hundreds of millions of dollars every year on marketing. Someone might say, “We’re part of the government. It’s our job in this democratic society to provide the people with what they want.” That may be true as well, but it doesn’t explain why all those organizations in the private sector are doing it also. Actually, the reason for so much market research focused on the customer is simply this: It’s the only way you can truly determine that you’re providing a service or product that fills a need.
True, such activity can be a lot of work. But when running a marathon, a runner plans and prepares for it rather than just showing up and darting out of the starting gate. In fact, weeks or months of preparation are involved, with emphasis on things as diverse as diet, clothing and mental attitude. Think of your plan as a road map for bringing your innovation into common practice.
THE KEY TO AN EFFECTIVE PLAN
The key to developing an effective marketing plan is to center it on one premise: How your technology or innovation will benefit your target audiences--from their perspective. The plan will then naturally focus on strategies that not only increase awareness, but also most importantly encourage and persuade your audiences to embrace your innovation. Naturally, you must have a good understanding of the innovation. More important, however, is that you have an understanding of the target audience. To be successful you have to identify who they are and understand what
SELLING MARKETING Focuses on the needs of the seller
Focuses on the needs of the buyer
Preoccupation with the seller’s need to convert products into cash; push for higher sales
Preoccupation with the idea of satisfying the needs of the buyer via product creation, delivery, and consumption
Production says, “We’ll make it, you sell it.”
Marketing says, “They want it, we’ll make it.”
Seller takes his cues from himself or the competition Marketer takes his cues from the buyer (market)
Passive involvement with the environment Active involvement with the environment
Concerned with the present Concerned with the future
Guide to Creating an Effective Marketing Plan 4
they require and how the solution is going to fit into their environment. It's not enough to have a great idea; the key is focusing on how that idea (or technology) diffuses throughout the transportation community or at least your targeted segment. Ideally, what are the benefits of your innovation to your customer? Your marketing plan will chart the course.
SECTION ONE: PRELIMINARY TASKS The following tasks will lead you through the meat of plan development. They will help
you think through important aspects of your plan, then provide you with the critical elements that will comprise your living document.
1.1 BUILDING YOUR TEAM
Initially, either you or another highly respected, motivated individual needs to be identified as the team leader. Next, bring people from different highly specialized areas together to address a shared goal, which will build a powerful foundation for successful marketing of your innovation. Key stakeholders and champions should be identified to drive the creation and on-going development of an effective marketing plan. A team should include not only leaders in the organizational area in which the technology falls, but also those individuals who will be asked to deliver the technology. The classic example is the one in which a case of brochures promoting a particular technology mysteriously shows up at a field office with no prior indication of what they are or how they are to be used. More appropriate would be to have included the field specialists in the team, or at least in progress updates on developing the marketing plan as it goes along. Expertise in market research, marketing plan development, and marketing communications tools is also required on the team.
For marketing professionals, it is critical to partner closely with R&D/field colleagues, sit in on staff and concept meetings and spend a lot of time with engineers learning about their work and their challenges. Marketing professionals can listen in order to understand the thinking behind the engineers' decisions and ideas, and help them think through how target audiences will be most likely to apply/adopt the new technology. As marketers, a passion and ability to collaborate with engineers, CEOs and stakeholders is critical. As engineers, researchers or project managers, the recognition of the invaluable skills the marketer brings to your effort will pay huge dividends. Marry the two, and your plan’s likelihood of success is much greater. Planning and implementing an effective marketing plan requires collaboration of people with both marketing and technical expertise.
The FHWA Resource Center and the Highways for LIFE program staff can also provide assistance in identifying stakeholders/potential champions, as well as other critical marketing resources/support.
BRINGING THE TEAM TOGETHER
A team gathering in a comfortable, informal setting should be the initial step toward getting the individuals to begin operating as a team. After brief introductions and a statement of commitment from a key leader within the organization, a discussion should be undertaken
Guide to Creating an Effective Marketing Plan 5
on the innovation itself and how it responds to the particular need. Following that should be a discussion of exactly what the overall goal of the effort should be. Goals should not be simply the easily obtainable, but rather have a degree of difficulty in them.
Other discussions should focus on the organization’s commitment to the effort, the level of funding available, and the time available to accomplish the work.
DEVELOPING THE PRELIMINARY MARKETING PLAN
Over the next several weeks, it will be the task of the team leader and the marketing specialist to come up with a preliminary marketing plan. Much of this effort will involve market research to determine details about the various attributes of the target audience, needs for training or workshops, potential requirements for the team in terms of delivering the technology, and so forth. This preliminary plan should not be merely an overview, but a full-blown plan, complete with goals, description of the technology, target audience, proposed communications/promotional tools and their costs, and activities which need to be done by team members to assure faster deployment.
PLANNING YOUR TEAM RETREAT
Once a “straw-man” marketing plan has been developed, this is sent to each team member, and then the entire team is brought together for a two-day, off-site, face-to-face meeting. This meeting will serve to validate the assumptions and information compiled during the development of the preliminary marketing plan. The result of the meeting should be a clear set of goals and objectives, identified target audiences and an action plan with responsible parties assigned to each task.
The most crucial part of planning a strategy session is an agenda. Prior to the retreat, all players must have a “game plan” on the purpose, objectives, roles and projected outcomes of the meeting. In addition, it is helpful to have any background information (i.e., previous project reviews, research, etc.) for the team to review prior to the retreat. This will allow the team to digest the information and come to the retreat prepared with feedback.
NOTE: For a team retreat blueprint, see section 4.1
1.2 IDENTIFY AND DEFINE TARGET AUDIENCES
Determine target audiences for your innovation and describe them. Identify who are the beneficiaries and users of the innovation and who are the authorized decision-makers whom you have to convince to adopt the innovation. Next, develop a table that illustrates market demographics. Useful table headers may include:
• Audience. • Characteristics (education level, occupation). • Obstacles/issues. • Opportunities/needs. • Targeted message.
Guide to Creating an Effective Marketing Plan 6
“Innovations that are perceived by individuals as having greater relative advantage, compatibility, trialability, observability, and less complexity will be adopted more rapidly than other innovations.” – Everett M. Rogers
NOTE: Typically the opinion leader is held in high esteem by those in their field of expertise. Opinion leadership tends to be subject specific, that is, a person that is an opinion leader in one area may be a follower in another. In order to get others’ buy in, you want the opinion leader(s) in your segment/target audience as your champions.
• Messenger (should they be contacted by you or a strategic partner/champion?). • Strategies (face-to-face meetings? conference presentations? workshops?).
1.3 MARKET RESEARCH
Collect, organize and document information about target audience(s) that will benefit from your innovation, as well as industry conditions. Some areas to consider:
• Transportation market dynamics, patterns and trends. • Customers - demographics, target markets (primary
& secondary), positioning. • Current practices or processes - What's out there now
relative to your innovation? • Identify previous or planned uses of your innovation. • Applicable innovation benchmarks in the transportation industry. • Obstacles to adoption of innovation – talk with potential target audience members in their
language about their issues. For example, how the right technology solutions could help them, where the obstacles lie, and what it would take to remove those obstacles. Even if you’ve worked with them or known them for many years, you may not have had the opportunity to uncover the true issues that stand in their way of adopting new technologies.
• Opportunities in the industry that create a favorable climate for adoption of your innovation/technology
• Strategic Partners/potential champions from which to illicit support (who are the opinion leaders within your target audience?)
Note: Primary and secondary data are two general categories of market research information.
Primary Data: Information that you personally collect for the purpose of solving a particular problem or investigating a specific issue. This information might be gathered by survey, interview, observation or controlled experiment.
Secondary Data: Information that has been collected or published by other people or organizations.
1.4 INNOVATION DESCRIPTION AND MISSION
Describe the Innovation
• How does the innovation relate to the industry and target audience(s)?
• Where and how has the innovation already been used?
Guide to Creating an Effective Marketing Plan 7
• How does it improve upon current practices or processes? • What problem does it solve for your target market(s) and the industry? • What will motivate your target audience to adopt your innovation/technology? • In addition to the obvious benefits your innovation will provide brainstorm other
incentives such as funding, recognition (personal and/or for their organization). In the transportation industry, it is perceived that rewards may consist of a pat on the back, while one could loose their job over making an error. The key is to communicate in the target audience’s language, not yours. Also, you need to know how your innovation is going to impact their operation as a whole even if your innovation is targeted in one area. Your understanding of the interrelationship of all their activities will go a long way in building trust. You may have to help them sell the solution to their superiors. They may need someone to help them justify what they already know from a technical standpoint. They know the technical justification for buying a solution, but they still need to sell it internally.
Be prepared to have tools/resources available to assist your customer in promoting the innovation internally.
Write a concise mission statement (one to three sentences that state):
• Primary audience - who benefits from your innovation, who will use it and who will make the decision to adopt it.
• Contribution – how the innovation solves a problem, addresses a need or improves upon practices
• Distinction – key attributes and benefits of your innovation (i.e., saves time, reduces cost, reduces fatalities, meets new reporting requirements)
Example Mission Statement: Highways for LIFE (HfL) is focused on accelerating the adoption of innovations in the highway community. Its purpose is to advance longer-lasting highway infrastructure using innovations to accomplish the fast construction of efficient and safe highways and bridges.
1.5 BACKGROUND DEVELOPMENT
Target markets, including vendors, media and strategic partners, will want background information that provides details of your industry/segment and the history or path that led to the technology or innovation. This helps tell your story, as well as equipping key audiences and opinion leaders with information that helps them understand the full picture and arms them to persuade others. Also, consider using charts, diagrams, and flow charts, which are appealing to people who learn visually.
1.6 BRAINSTORM MARKETING STRATEGY
Your marketing strategy should focus on ‘where we are now’, ‘where we want to be’, and ‘how we’re going to get there.’ Under the umbrella of the marketing strategy, your plan will outline the tactics (or activities) that detail specifically how you will get there. When
Guide to Creating an Effective Marketing Plan 8
putting together the marketing plan, the litmus test for the tactics/activities should be, ‘is this in line with our strategy?’ Will this help us achieve our objectives?
MARKETING TACTICS / TOOLS (OR MARKETING ACTIVITIES)/VEHICLES Brainstorm and document marketing tactics and delivery channels that are (1) in line with your marketing strategy; (2) will provide the most efficient means to reach your target audience; and (3) will most effectively help you achieve your objectives. Example tactics include:
• Networking - Go where your audience is • Direct marketing – Targeted and customized letters, brochures, flyers • Advertising - print media (ads in trade publications), trade directories • Presentations - to increase awareness (workshops, conferences) • Demonstrations – Incorporate the technology into a project and host field visits • Peer-to-peer exchanges for lead state teams • Publish - Write articles, give advice, become known as an expert • Interpersonal – face-to-face meetings with key opinion leaders/potential champions,
strategic partners and targeted individuals • Publicity - press releases, news conferences, media relations • Displays/booths at trade shows, conferences • Web site (and promotion of)
Keep in mind that any of these activities that deal with media, publications, and publicity efforts must be cleared with the Agency’s Public Affairs Office prior to any dissemination.
Note: A Technology Showcase is a well-advertised gathering of representatives from interested agencies to learn more about one or more technologies and to observe demonstrations. This is also often referred to as a demonstration workshop.
1.7 BRAINSTORM MARKETING GOALS
Brainstorm and draft quantifiable, measurable marketing goals. For instance, your goals might be to gain at least five strategic partners/champions to help diffuse your innovation during the first six months to have successful implementation of your innovation/technology by X number of target organizations. Your goals might include X face-to-face visits with target audience members by a certain date, a certain number of exposures in trade publications, or a certain number of presentations at workshops, showcases or conferences.
1.8 IDENTIFY HOW YOU WILL MONITOR YOUR RESULTS
Determine how you will monitor your results so you can identify the strategies that are working (i.e., surveys, regular meetings with team and champions, track information flow with target audiences, tracking visitors to your web site, percent of responses). Identify important external and internal metrics. Using the experience of your core team, identify
Guide to Creating an Effective Marketing Plan 9
the most important external and internal performance indicators to measure. Be sure to include appropriate metrics for every major element of your marketing mix (such as meetings, publicity, and so forth), so that all members of the team can track their progress and contribution to the team’s success. Gain agreement on what and how to measure. Obtain buy-in from key stakeholders once metrics are identified (post your team retreat).
Note: Activities such as measurement and potential adjustment of marketing activities is should be a cost consideration when determining your budget in the next section.
1.9 DETERMINE BUDGET / AVAILABILITY OF FUNDS
Budget your available marketing project dollars.
What tactics/activities can you afford?
What can you do in house, what do you need to outsource (i.e, web site support, display materials)?
Can you obtain/qualify for funding from other organizations/programs?
Does your innovation qualify for a Highways for LIFE project or Partnership contract?
Do you have funding for customer training and technical support? (Keep in mind to identify who will conduct the development, delivery and the schedule of training)
If you have limited marketing resources, make sure your target market is not too broad. Find the segments of the broader transportation community that will most benefit from your technology. Who will be most receptive? Prioritize your audiences so that you enter the most fertile segment first without spreading your resources too thin.
SECTION TWO: BUILD YOUR OUTLINE
Now that you’ve worked through the preliminary items in section 1.0, you’re ready to build your plan outline. The following is a suggested Marketing Plan outline, which may be modified, based on your specific technology and needs. Developing your plan outline at this stage allows you to more easily incorporate information you’ve already developed, task out and/or collaborate with core team members on certain areas, and track your plan development progress.
SAMPLE MARKETING PLAN OUTLINE
1.0 Executive Summary 2.0 Situation Analysis 2.1 Market Summary 2.2 Market Demographics 2.2.1 Market Needs 2.2.2 Market Trends 3.0 Filling the Need: Technology/Innovation Description and Mission
Guide to Creating an Effective Marketing Plan 10
4.0 Target Audiences 4.1 Primary 4.2 Secondary 5.0 Positioning 6.0 Marketing Goals 7.0 Opportunities 8.0 Obstacles 9.0 Marketing Strategy 9.1 Marketing Objectives 9.2 Personnel 9.3 Channels of distribution 9.4 Action Plans with timelines and personnel assignments 10.0 Financials/Budget (recommend moving this after contingency planning) 11.0 Program reviews and evaluation 12.0 Implementation 13.0 Contingency Planning 14.0 Appendices
SECTION THREE: DEVELOP A DRAFT OR PRELIMINARY PLAN
Below are general descriptions and guidelines for the composition of various sections that you may include in your preliminary plan.
Executive Summary. A summary of your overall plan; although this will be the first section in your final document, it is often best to write this upon completion of your first draft.
Situation Analysis (Market Summary, Market Issues and Needs, Market Trends). This section is an evaluation of the situation and trends in the transportation industry and your particular segment. It should function as a snapshot of where things stand at the time the plan is presented. You will want to include the market demographics table you developed in section 1.4 and information from section 1.6. Also, describe market issues and needs as well as applicable market trends as subsections.
Filling the Need: Technology/Innovation Description and Mission. This is also commonly called the Product Analysis section. Describe your innovation and include where and how it has already been used with descriptive visuals when possible.
Target Markets. In this section, include a bulleted list of your primary and secondary targeted audiences (beneficiaries, users and decision-makers). This list may be refined based on the discussion from your Team Retreat. You may also want to reference your market demographics table included in the previous section.
Positioning. Write a concise statement that specifies the need(s) you are fulfilling, benefits your innovation/technology offers, and features that deliver those benefits.
Guide to Creating an Effective Marketing Plan 11
Program Goals. What are the overarching goals of your innovation? Include training and implementation goals with specific years for each. Reference any industry or headquarter requirement(s) that your innovation will help fulfill.
Opportunities. Describe the opportunities that create a favorable climate for your target audience to adopt your innovation.
Challenges. Describe the obstacles that may make it difficult for your target audience to adopt your innovation.
Marketing Objectives. The objective of your marketing plan should be to identify various strategies ands activities that will result in meeting the goals you identify.
Marketing Tactics and channels. Marketing activities that support your marketing strategy and define the general approach you will take to meet your objective. The channels are the means of delivering your message to your defined target audience. Prioritize activities based on potential impacts and timing (some may need to occur before others can be implemented).
Financials/Budget. Describe funding sources and dollars that are currently secured for the implementation of your plan, and describe other potential resources (if applicable). Include a concise summary of your overall budget. The action plan table/spreadsheet developed at the Team Retreat will also indicate a breakdown of the budget required. Plan to modify as needed and communicate with core team members.
Controls/Measures. Include the information you compiled during the preliminary tasks (section 1.9) delineating how you will measure the success of your plan. Consider how often your team will need to come together for progress reports—both via teleconference/ interactive television and face-to-face.
Implementation. This section illustrates timelines and identifies those responsible for performing tasks; information for this section should come from the action plan formulated at your Team Retreat.
Contingency Planning. Detail how you will change your course if your original action plan falls short. How often will you meet with your team to review progress? Will you modify the plan throughout the effort if strategies do not work?
Appendices. Include resources in this section that you will need to refer to during implementation of your plan. Examples include: success stories; publicity; list of current leadership (and contact information) of your primary target audiences; feedback or survey results.
Guide to Creating an Effective Marketing Plan 12
SECTION FOUR: CONDUCT A TEAM RETREAT
BLUEPRINT FOR TWO DAY WORKSHOP / ACTION PLAN DEVELOPMENT
While it may seem exhaustive, the following process will build rapport, foster input and ownership among team members. This off site meeting will also serve to validate the assumptions and information you have already compiled, resulting in a concise plan with responsible parties assigned to each task, a clear set of goals and objectives and identified target audiences. To ensure a successful workshop, it is very important that all of the participants have read and considered the background information and preliminary plan documents in advance of the retreat. Also, ensure they know explicitly what will be expected of them at the retreat. NOTE: It will be very helpful if you can obtain a facilitator who is familiar with the transportation industry and that has the skills to keep your team on track; having one or more note-takers will also alleviate that burden off of your team. Your note-takers can also take digital photos of all lists for future reference and documentation.
I. Introductions. Introduce the team leader and identify his credentials and experience. Ask team members to introduce themselves and give a brief synopsis of their role and/or interest in the initiative. II. Setting the stage. Provide introduction of the innovation/technology, history, uses and developments to date. Present any marketing tools (i.e., videos, news clips) that may already exist. III. Brainstorm opportunities and obstacles. Divide team into two or more groups, with no more than six people in any group (Group A, B, etc.) and ask each group to brainstorm opportunities and obstacles to the adoption of the innovation; make sure to ask them to tie opportunities and opportunities to the various established program goals. Record all items on separate white tablet sheets (it will be easier if you get the tablets that already have “post-it” adhesive on the back of the sheets) to be posted for all to see.
IV. Consolidate and Categorize. Bring two groups back together; facilitator to talk the groups through their lists. As a group, agree on and compile a new list of categories of obstacles and opportunities. Post these sheets in a visible location.
V. Readjust and Prioritize. Facilitator will then review categorized lists with team to clarify and adjust wording as necessary. Next, instruct each of your team members that they have ten ‘votes’ to apply to what they think is most important on both the categorized opportunities and obstacles lists---five for obstacles, and five votes for opportunities. They may also apply multiple votes to one in particular. (Note: It will be helpful if you have the adhesive dots for your team members to use to indicate their votes.) The top five opportunities and top five obstacles will be assigned recommendations. Ask facilitator to record the top five priorities
Guide to Creating an Effective Marketing Plan 13
(of both obstacles and opportunity lists) on separate posted sheets before moving onto the next task.
NOTE: The following are some good questions to consider asking your team in order to stimulate conversation when prioritizing primary and secondary opportunities.
• Will the resources and time be available even if the innovation makes sense?
• Will the risk be perceived as being too high?
• Will the technology make their job easier or will it be perceived as making their job more difficult? (In order for them to consider adopting your innovation, the benefits must outweigh 'changing the course').
VI. Develop Recommendations. Split back into two groups and each generate recommendations as to how to tackle each top five opportunities and obstacles.
VII. Merge recommendations. Bring the groups back together; go over group A’s recommendations for both the obstacles and opportunities lists; ask Group B (and C, if there is one) if they have anything to add or modify based on their group’s discussion. Post in visible location.
VIII. Ask Team to Invest. Give each team member $100 or $1000 in ‘monopoly money’ that they can place on the opportunities or obstacle recommendations they want to invest in. (Place lists flat on table during voting.) This method ‘forces’ team members to think hard about what they believe are the most important actions.
NOTE: By using either $100 or $1000, you will easily be able to identify percentages.
VIIII. Brainstorm and record action plan to include the following for each recommendation: date to be completed, type of activity, location (where activity will take place---origin of the work), target audience, person responsible and approx. cost. (Note: Be sure to assign only one lead for each action item. Remember, if it’s everyone’s responsibility, then it won’t get done. Make sure one person is ultimately responsible for shepherding the task, and assign others to support or participate.) Have facilitator record during session (with note-takers recording discussion and comments), and then later create a table/spreadsheet or flowchart to include in your marketing plan.
X. Go back through original opportunities & obstacles categories lists. If time permits, this final exercise will ensure that an important thought or point is not lost. The facilitator can also discern if all of the original categories of opportunities and obstacles can be connected to the prioritized top five in each area.
XI. Use some mechanism (informal vote) to identify general acceptance of the workshop products.
Guide to Creating an Effective Marketing Plan 14
FOLLOW UP
Compile a report based on the discussions and outcomes of the two-day retreat, and send to team members, along with the action plan table/spreadsheet or flowchart.
SECTION FIVE: MODIFY YOUR PLAN
POST-RETREAT MODIFICATIONS
Upon the completion of your team retreat and your action plan, use the notes and report to validate the assumptions and information you compiled, or modify as necessary. Use the results of the meeting to adjust your goals and objectives, situation analysis, identified target audiences and other sections of your plan.
Distribute the edited documents from your retreat to all of the participants for review comments and finalize the documents by addressing comments. This will build ownership of the products.
ONGOING REVIEWS AND UPDATES
Lastly, remember that your marketing plan is always a work in progress. It may be current, but it is never "done." It should be a living document, constantly being amended and fine-tuned.
SECTION SIX: APPENDICES
Sample Marketing Plans:
• Prefabricated Bridge Elements and Systems
• Road Safety Audits
• Making Work Zones Work Better
Marketing Plan for Prefabricated Bridge Elements and Systems (PBES) 1
Marketing Plan
Prefabricated Bridge Elements and Systems (PBES)
December 2006

Marketing Plan for Prefabricated Bridge Elements and Systems (PBES) 1
Marketing Plan for Prefabricated Bridge Elements and Systems (PBES) 2
TABLE OF CONTENTS
EXECUTIVE SUMMARY ............................................................................................. 1 SITUATION ANALYSIS .............................................................................................. 1 FILLING THE NEED ................................................................................................... 2 The AASHTO Technology Implementation Group .................................................. 3 MARKET ANALYSIS .................................................................................................. 4 The Current Bridge Inventory ................................................................................. 4 Product Line Analysis ............................................................................................. 5 What Exactly is a Prefabricated Bridge System? .................................................... 5 How Does PBES Compare with Other Methods? ................................................... 6 Elements and Systems ........................................................................................... 7 Pricing Analysis ...................................................................................................... 8 CUSTOMER-TARGET MARKET ANALYSIS ............................................................. 11 State Transportation Agencies ............................................................................ 11
State Bridge Engineer .......................................................................................... 12 State Transportation Agency CEO ....................................................................... 13 Highway Users ..................................................................................................... 15 ANALYSIS OF INTERNAL MARKETS AND ENVIRONMENT .................................... 15 Corporate Philosophies ........................................................................................ 15 Internal Organization ............................................................................................ 17 OTHER TARGET MARKETS ..................................................................................... 18 Construction Contractors ...................................................................................... 18 Trade Associations ............................................................................................... 19 Other Groups ........................................................................................................ 19 MARKETING STRATEGY ......................................................................................... 19 Marketing Objectives ............................................................................................ 19 Current Status ....................................................................................................... 19 Measure ............................................................................................................... 20 Marketing Personnel ............................................................................................. 20 CHANNELS OF DISTRIBUTION .............................................................................. 20 Existing Channels of Distribution .......................................................................... 20 New Channels of Distribution ............................................................................... 22 MARKETING STRATEGY: YEAR ONE ..................................................................... 22 Targets for FY2007 ............................................................................................... 22 Marketing Strategies ............................................................................................ 22 Identification of PBES Opportunities and Obstacles ............................................. 23
Prioritized Recommendations to Implement Opportunities & Address Obstacles ...... 23 PBES Action Plan for 2007, 2008, and 2009, Including Budgets .......................... 25 Reviews and Evaluation ........................................................................................ 27 APPENDIX A .......................................................................................................... A-1 APPENDIX B .......................................................................................................... B-1 APPENDIX C.......................................................................................................... C-1

Marketing Plan for Prefabricated Bridge Elements and Systems (PBES) 3
Marketing Plan for Prefabricated Bridge Elements and Systems (PBES) 1
EXECUTIVE SUMMARY
The current condition of the Nation’s highway system, and its bridges in particular, demands a major effort for upgrading. Yet, using traditional approaches would require an enormous cost, create major congestion problems and have significant safety challenges associated with it. A relatively new approach called Prefabricated Bridge Elements and Systems offers a solution to many of the bridge challenges highway agencies are facing. This marketing plan describes the current status of the bridge system, describes PBES, and outlines a comprehensive approach for getting state bridge engineers to consider, learn about, and ultimately try this approach when situations are appropriate for its use.
SITUATION ANALYSIS
When the U.S. Interstate Highway System was first conceived and promoted, it was with the vision that one day Americans would be able to drive from coast to coast without stopping for a traffic signal. In the 50 years since President Eisenhower launched the system with the signing of the Federal Aid Highway Act of 1956, drivers in this country have seen that vision realized. To achieve the goal required the construction of a complex system of highways, bridges, interchanges, drainage systems, traffic controls, landscaping, and lighting systems. Today, the National Highway System (NHS) encompasses some 160,000 miles of roadway.
Although the NHS makes up only 4 percent of America’s roads, it carries more than 40 percent of all highway traffic, 75 percent of all heavy truck traffic, and 90 percent of tourist traffic. It has become the very backbone of the American economy, serving as the primary means of moving goods throughout the country. The NHS serves 198 ports, 207 airports, 67 Amtrak train stations, 190 rail/truck terminals, 82 intercity bus terminals, 307 public transit stations, 37 ferry terminals, 58 pipeline terminals, and 20 multipurpose passenger terminals. It is literally the thing that holds the Nation’s entire transportation system together.
Unfortunately, the NHS is not without its problems. First, it’s overcrowded. By the year 2020, ninety percent of all urban Interstate highways will be at or exceeding capacity. Five years ago, the Texas Transportation Institute put the cost of congestion in the Nation’s 75 largest urban areas at $67.5 billion, and each traveler in those areas sits in traffic for 62 hours a year.
Second, NHS pavements are not lasting as long as they should. Highways built to last 25 years take such a pounding from the amount and the weight of traffic that they rarely stay in optimum condition that long. Today, more than 11,000 miles of pavement on the NHS are in poor condition. Almost a quarter of all bridges in the country—some 146,000—are either structurally deficient or functionally obsolete. Yet, many highway engineers agree that 50-year pavements and 100-year bridges should be attainable using current technology.
Third, we’re not building highways safe enough. Every year for the past decade, some 43,000 people die on America’s highways. Over half of these fatalities have occurred on two-lane roads that carry only 25 percent of the total NHS traffic. Some 15,000 fatalities are ascribed directly to substandard road conditions, obsolete designs, or roadside hazards.
Marketing Plan for Prefabricated Bridge Elements and Systems (PBES) 2
The list goes on and on. Truly, America’s highway system needs help. But how do we bring the system up to the level of quality the traveling public deserves?
That’s the challenge the Nation faces at the beginning of a new century. To be sure, many leaders have thought long and hard about solutions. For some, the automatic response to such a challenge is simply to throw money at the problem. Certainly, having the funds to complete necessary road and bridge projects has long been an issue with highway agencies at all governmental levels. But according to organizations such as The Road Information Program (TRIP) and the American Public Transportation Association (APTA), not only is the idea of funding such a massive reconstruction effort unrealistic, the very future of highway funding is in jeopardy.
The average car now gets nearly a third more miles per gallon than it did 20 years ago. Ten years ago, a report from the National Cooperative Highway Research Program (NCHRP) warned that with increasing fuel efficiency (and an expected move toward electric and hybrid vehicles), drivers would be buying less gas in the future, and that would reduce the amount of tax money available for improving roadways. In 2003, a report from the Brookings Institution confirmed those projections and indicated that states are already seeing declines in their tax revenues.
Indeed, as gasoline prices have risen, the public has focused more on conservation, vehicles with higher fuel economy, and vehicles powered with alternative fuels. This has meant less money paid into gasoline taxes. The result is a deep concern that both states and the Federal Government will have to find alternative means for funding highway projects. Toll roads are becoming more and more prevalent, and concepts such as equipping vehicles with on-board computers which calculate mileage and automatically bill the vehicle owner a tax-per-mile fee are getting serious consideration. Several times, Congressional leaders have introduced bills which would provide drivers with a “temporary gas tax holiday,” a move which, while appealing to some, would result in severely decreased funds for maintaining the highway system.
Yet, even if the funds were available, a massive effort to rebuild the entire highway system using current practices would be inconceivable today. The public would not stand for the congestion it would bring with it. In 2001, a study analyzing three national surveys of the driving public showed clearly that the public already equates highway construction—any highway construction—with congestion. Increasing construction levels, even if it is intended to ultimately cut congestion levels by adding lanes, only exacerbates the public’s perception that “the shortest distance between two points is always under construction.”
FILLING THE NEED
How does one bring the existing highway system up to the level of quality the public wants, yet do so without the congestion headache that such construction invariably causes?
The solution is to find ways to do as much of the work as possible at times and in locations that minimize interference with the driving public, and for that portion of the work that does require such interference, to do it as quickly and safely as possible. These innovative approaches should also result in facilities that are safer, last longer, and are of better quality overall than what was there previously.
Marketing Plan for Prefabricated Bridge Elements and Systems (PBES) 3
Currently, there are numerous innovations that, if implemented nationwide, would have just such a dramatic impact on the driving experience of the motorist. Congestion levels would be reduced, especially in construction work zones. In addition, because construction schedules would be shortened, overall congestion would decrease. Safety levels would be heightened, both in work zones and, because of enhanced designs, on the everyday sections of highway. Highways and bridges would last longer, and as a result, there would be less frequent road closures due to construction. Additionally, roadways would cost less, both in initial cost, and in the entire life cycle of the highway or bridge.
The question is, then, what innovations exist today for bridge design, construction, and maintenance?
THE AASHTO TECHNOLOGY IMPLEMENTATION GROUP
At the beginning of the new millennium, the American Association of State Highway Transportation Officials (AASHTO) recognized that a few states were having good success with the concept of building bridges offsite, away from the flow of traffic and the hazards and congestion associated with it, and then bringing the structure, either in pieces or fully completed, to the site. The key concept was that, although the actual building of the bridge might take as long or longer as it would have onsite, that wasn’t how the highway user viewed it. In the public’s perception, the bridge went up almost instantaneously, since they measured the construction period based on the amount of time it impacted traffic circulation, not the actual project schedule. Other benefits were found for such an approach, such as increased safety for construction crews, and better quality of construction, due to contractors’ being able to build components in a more controlled environment.
In 2001, the AASHTO Technology Implementation Group (TIG) selected the technology known as “Prefabricated Bridge Elements and Systems,” or “PBES,” as a focus technology. In May of 2002, the TIG PBES team issued a marketing plan. The plan’s primary objectives were focused on building awareness and stimulating nationwide use of the PBES technology. The TIG PBES team produced two brochures and a video, populated a website, gave presentations and wrote papers, and sponsored a number of workshops. Much of the focus of the marketing plan you are now reading owes its impetus to that plan and the individuals who produced it.
Scanning Tour In April 2004, a team of bridge engineers, sponsored by the Federal Highway
Administration (FHWA), AASHTO, and NCHRP visited Japan and Europe to investigate innovations in prefabricated bridge building technology. A number of useful technologies were identified on that trip. Most relevant to the PBES effort was the discovery of self-propelled modular transporters (SPMTs), which are multi-axle devices that can be manipulated in very limited spaces to move complete prefabricated bridge systems into position. Previously, the use of prefabricated systems was limited by the size of loads that could be carried on highways or moved into position with traditional methods (cranes, hoists, etc.). It is now possible to construct very large systems at a staging area near the job site but away from traffic, and then position them with precision into their final location using SPMTs. A prefabricated bridge system can even be lifted and transported by SPMTs from a staging area to barges, floated on the barges to the bridge site, and then lifted into position for connection.
Marketing Plan for Prefabricated Bridge Elements and Systems (PBES) 4
Largely through the efforts of the scanning team, the market for SPMTs was opened up in this hemisphere, and several firms have made the tools available. Most notable, as of this writing, are the Dutch firm Mammoet, a host of the 2004 scan, with its multiple bridge moves in the United States, and the Sarens Group, headquartered in Belgium and also a host of the 2004 scan, with its first bridge move in the United States planned for late 2007. In addition, Barnhart Crane & Rigging has recently purchased SPMTs for bridge moves, and Bigge Crane and Rigging Co. has used SPMTs on a recent West Coast bridge project. Today, there are a sufficient number of firms for construction competition demands.
An excellent example of the difference SPMTs have made is the 5.4-mile I-10 twin span trestle bridge near Slidell, Louisiana. The bridge was originally constructed in 1963 using 260-ton prestressed concrete slabs. The bridge was severely damaged by Hurricane Katrina in 2005. Using barge-mounted SPMTs, one of the twin spans was brought back into service in just weeks. While smaller bridges, such as the single-span Mitchell Gulch Bridge near Denver, Colorado, could be replaced in a weekend using cranes, the technology of SPMTs is required to make this possible on larger structures. A number of other projects in Louisiana used SPMTs to restore damaged bridges after Katrina.
Now, structures carrying multi-lane Interstate highways across busy roadways and waterways, even in the middle of metropolitan areas, can be replaced overnight. The ironic aspect is that, while such amazing work can be done without major interruptions to traffic, the impact of such efforts are largely unappreciated by the public because they don’t see the congestion that not using the innovation would have caused. And because highway agencies and their employees are public servants and it has not been their approach in the past to ballyhoo their efforts as a private corporation promoting a product might, these innovative efforts go largely unheralded. This is unfortunate for several reasons: For one, the effort and those who achieved it get little recognition. More important, the public is uneducated on the value of such approaches and does not pressure decision-makers to use them more frequently.
If, for example, a particular urban bridge were successfully replaced using PBES and SPMTs in a few hours, and that project received national attention, citizens of other locales, hearing about the project, might influence locals to use the approach in their communities. Thus, the public would have a stronger hand in technology deployment. As important, the overall education of the general public on highway work would be enhanced, and the level of discussions at future public hearings and public debate would be enhanced.
MARKET ANALYSIS
Bridge projects are one of the most notorious culprits for traffic delay. In many cases, a bridge provides the only passage across a geographic barrier. Taking such facilities out of service for any length of time can mean alternatives that cause great delay and that take drivers many miles out of their way. Also, because of the limited construction work space on bridge projects, safety hazard levels for construction workers and motorists are much higher than those of roadway projects.
THE CURRENT BRIDGE INVENTORY
Today there are more than 595,000 bridge structures on the National Highway System. These include bridges made of steel, concrete, wood, aluminum, and masonry. Current
Marketing Plan for Prefabricated Bridge Elements and Systems (PBES) 5
thinking is that decks should be able to last at least 100 years, and while there still exist functioning bridges that were built more than 100 years ago, the average life of a bridge deck is between 20 and 25 years. For details on the number and types of bridges in each state, see the charts in Appendix A.
PRODUCT LINE ANALYSIS
As previously noted, there are all sorts of design approaches and technologies currently being used in bridge construction. These include the bridges built with steel girders, concrete girders, and even timber. There are cable-stayed bridges, bridges built on piers, and many other approaches. It’s important to note that PBES-type construction is not based on the materials used or the structural principles employed to keep the bridge in place. Rather, PBES bridges are merely bridges which can have all or part of their construction done offsite and then erected at the site in a much shortened time period from a bridge built in situ.
WHAT EXACTLY IS A PREFABRICATED BRIDGE SYSTEM?
Prefabricated bridge systems include superstructure systems (composite units, truss spans), substructure systems (abutments, caps/columns, piers), and totally prefabricated bridges. Examples of prefabricated bridge elements include full-depth deck panels and substructure caps. Using prefabricated bridge elements and systems can facilitate meeting several key needs:
• Reduces on-site construction time
• Minimizes traffic impacts of bridge construction projects
• Improves construction work zone safety
• Makes construction less disruptive for the environment
• Improves constructability
• Increases quality and lowers life cycle costs
Traffic and environmental impacts are reduced; constructability and safety are improved because more of the work is moved away from the bridge site, minimizing the need for lane closures, detours, and use of narrowed lanes. Prefabrication of bridge elements and systems can be accomplished in a controlled environment without concern for job-site limitations, and that, in turn, can increase product quality and lower costs. Prefabricated bridge elements and systems especially tend to reduce costs where use of sophisticated techniques would be needed for cast-in-place techniques, such as in long water crossings or high-elevated structures, like multi-level interchanges.
As the December 2004 issue of the FHWA publication Focus notes,
For highway agencies, the use of pre-fabricated bridge elements and systems, ranging from substructures to entire bridges, is proving to be not only a best practice but good business. Prefabrication can also lower costs by eliminating the need to perform the
Marketing Plan for Prefabricated Bridge Elements and Systems (PBES) 6
construction in a restrictive sequence of operations. Instead, the work can be done ahead of time, reducing the risks posed by bad weather and other variables.1
A number of completed PBES projects, including contact names and some contract documents, can be found at www.fhwa.dot.gov/bridge/prefab/projects.htm. In addition, an Accelerated Bridge Construction List, which includes several examples where PBES was used, can be found at www.fhwa.dot.gov/bridge/accelerated/abclist.htm.
HOW DOES PBES COMPARE WITH OTHER METHODS? Prefabricated bridge elements and systems offer bridge designers and contractors
significant advantages in terms of onsite construction time, safety, environmental impact, constructability, and cost.
Minimize Traffic Impacts of Bridge Construction Projects Using prefabricated bridge elements and systems means that time-consuming
formwork, concrete curing, and other tasks associated with fabrication can be done offsite in a controlled environment without affecting traffic.
Improve Construction Zone Safety Because prefabrication moves so much of the preparation work for bridge construction
offsite, the amount of time that workers are required to operate onsite, frequently in or near traffic or at high elevations or over water, is greatly diminished. Job site hazards and constraints such as nearby power lines are minimized when workers can complete most of their construction offsite.
Make Construction Less Disruptive for the Environment Bringing prefabricated superstructures and substructures to the site ready for
installation reduces disturbance to the land surface at the site, and it reduces the amount of time required onsite for heavy equipment. Keeping equipment out of sensitive environments is less disruptive for those environments.
Improve Constructability Many job sites impose difficult constraints on the constructability of bridge designs—
heavy traffic on an Interstate highway that runs under the bridge being constructed, difficult elevations, long stretches over water, or restricted work areas due to adjacent properties, to name a few. Using prefabricated bridge elements and systems relieves such constructability pressures.
Increase Quality and Lower Life Cycle Costs Prefabricating bridge elements and systems takes them out of the critical path of
the project schedule: work can be done ahead of time, using as much time as necessary, in a controlled environment. This reduces dependence on weather and increases quality control of the resulting bridge elements and systems. All projects that
1 “Prefabricated Bridges Deliver Quality, Safety, and Savings,” Focus, December 2004, published by the Federal Highway Administration, publication number FHWA-HRT-05-022.
Marketing Plan for Prefabricated Bridge Elements and Systems (PBES) 7
use prefabricated bridge elements and systems increase the quality of their components; most also lower life cycle costs.
ELEMENTS AND SYSTEMS Rapidly expanding technologies associated with innovative materials and equipment
have made it possible to prefabricate the components of bridges—and sometimes even entire bridges. Increasingly, bridge engineers are turning to prefabrication of the following bridge elements and systems to save money, to solve project-specific challenges, and to increase the quality of bridges by conducting fabrication in a controlled environment.
Superstructure: Decks Prefabrication offers exceptional advantages for deck construction, particularly for
removing deck placement from the critical path of bridge construction schedules, for cost to place the deck, and for quality of the deck. Partial-depth prefabricated deck panels act as stay-in-place forms to speed construction and allow more controlled construction for a more durable deck than fully cast-in-place decks. Full-depth prefabricated bridge decks facilitate and speed construction, and bridge designers are finding innovative ways to connect full-depth panels to ensure durable connection details.
Superstructure: Total Superstructure Systems Increasingly, innovative bridge designers and builders are finding ways to prefabricate
entire superstructures. Preconstructed composite units may include steel or concrete girders prefabricated with a composite deck, cast off the project site and then lifted into place in one operation. Truss spans also can be prefabricated. Prefabrication on this scale offers tremendous potential advantages in terms of constructability, onsite construction time, and the need to have equipment on the construction site.
Substructure: Bent Caps Cast-in-place bent caps require sequential construction processes, including extensive
formwork erection and removal, as well as concrete curing time. If they are fabricated offsite, these sequential processes are not a factor. As a result, bridge owners and contractors are turning to prefabricated bent caps:
• For over-water bridges, they reduce the amount of time that workers need to operate over water.
• For bridges over existing roadways, they reduce the disruption to traffic on the lower roadway.
• For bridges with job-site constraints, such as power lines that affect work zone safety, they limit the amount of time that workers are at risk.
Substructure: Pier Columns Bridge construction times can be greatly reduced by using prefabricated columns.
Columns can be steel or concrete (segmental, post-tensioned, either hollow or concrete-filled).
Marketing Plan for Prefabricated Bridge Elements and Systems (PBES) 8
Substructure: Total Substructure Systems A total substructure system may consist of individual pier(s) or prefabricated bent cap
supported by prefabricated column(s) or prefabricated footings.
Totally Prefabricated Bridges Totally prefabricated bridge systems offer maximum advantages for rapid construction
and depend on a range of prefabricated bridge elements and systems that are transported to the work site and assembled in a rapid-construction process.
PRICING ANALYSIS
Prefabricated bridge elements and systems can be the most cost-effective solution in terms of both initial and life cycle costs. This cost competitiveness results from the speed of onsite construction and the improved quality that can be obtained with prefabrication.
Construction Costs Prefabricated components typically have lower unit costs relative to conventional cast-
in-place construction due to economy of scale (e.g., fabricators’ fixed costs such as steel forms are spread over a large number of bridges). In addition, shortening the construction time at the bridge site by quickly installing larger prefabricated systems can further reduce construction costs, as listed below:
• Reduced costs for traffic control (including costs for traffic control devices and their maintenance, lighting, and flagging and other traffic control personnel)
• Reduced owner overhead costs to staff projects with construction engineering and inspection support
• Reduced contractor overhead costs to staff projects with construction crews, etc. • Reduced liability insurance and surety bonding costs to contractors based on the
reduced number of days that coverage is required • Reduced maintenance requirements for detour routes subjected to increased volumes
of traffic • Potential for elimination of temporary roadways • Innovative contracting strategies and other considerations also can improve the cost-
effectiveness of prefabricated bridge construction, as detailed below: • Use contracting strategies to provide the contractor with a financial reason to complete
the project as quickly as possible. These include incentive/disincentive for delivery before/after a time set in the contract; A+B bidding, the cost of contract bid items (A) plus the time bid for construction multiplied by daily user cost (B); lane rentals for lanes taken out of service during temporary lane closures for construction; and no-excuse bonus with no time adjustment for problems such as delays due to weather or utility conflicts.
• Reduce the perception of risk by increasing the options available to contractors for rapid onsite construction, thereby allowing them to optimize construction activities around the strengths of their operations, while ensuring that agency goals are met.
Marketing Plan for Prefabricated Bridge Elements and Systems (PBES) 9
• Consider bundling multiple bridges into one project to allow the contractor to sequentially use specialized equipment such as SPMTs to spread the cost over a larger number of bridges.
• Consider stockpiling standardized prefabricated components to further increase economy of scale, either prior to contract award for a specific project or for future use, independent of a specific project.
Lower Life Cycle Costs Prefabricated bridge components are built offsite or near-site in controlled
environments. Improved quality of materials and construction is achieved due to reduced weather impacts and established materials suppliers and standardized plant operations for consistent quality of materials and production. In addition, the off-the-critical-path construction allows adequate time for curing to obtain more durable concrete. Provided the connections between the prefabricated components are properly designed and constructed, prefabricated systems can be expected to provide extended service life with reduced maintenance requirements.
Delay-related User Costs The reduced duration of onsite construction time that is possible with prefabricated
bridge construction also will result in a reduction in delay-related user costs. Delay-related user costs are real costs to the traveling public in terms of hours of lost productivity and increased gasoline and maintenance costs for their vehicles as they wait in traffic queues and travel additional miles on detours. Increasingly, user costs are being considered in determining contracting strategies, and often they are the basis for the magnitude of incentive/disincentive on a project.
Examples of Cost-effective Prefabricated Accelerated Bridge Construction A number of examples are available to show the construction cost savings that can be
achieved using prefabricated bridge elements and systems on accelerated construction projects. Three such projects are described below. For each project, cost savings are defined as awarded bid price minus engineer’s estimate. These three projects saved a total of $23.2M in construction costs and significant onsite construction time.
Lewis and Clark Bridge Deck Replacement in Washington State
In 2004, a total of 18,000 vehicles per day crossed the mile-long Lewis and Clark Bridge on State Route 433 over the Columbia River between Washington and Oregon. The shortest detour route is 40 miles, necessitating the use of full-depth prefabricated panels and an innovative accelerated installation procedure to replace its deteriorated deck. Using SPMTs and a specially designed frame, 3,900 feet of deck were replaced during 124 night closures plus 3 weekend closures. Conventional cast-in-place deck construction was not a viable option, as it would have required 4 years and significant impact to traffic. The full-width prefabricated deck system combined with innovative construction equipment allowed the bridge deck to be replaced with no impact to rush-hour traffic.
The Washington State Department of Transportation (DOT) used A+B+C bidding, where “A” was the bid items for contractor payment. “B” and “C” were only used to determine the lowest responsible bidder, where “B” was the total number of bridge closures established by the bidder to complete the work multiplied by a closure rental cost
Marketing Plan for Prefabricated Bridge Elements and Systems (PBES) 10
and “C” was the total number of single lane closures established by the bidder to complete the work multiplied by a single-lane rental cost. An incentive was included for early completion. Incentives and disincentives were included for reduced and increased closures, respectively.
The low bid of $18.0M was 38 percent ($10.8M) below the engineer’s estimate of $28.8M. The contractor also received the $100,000 early-completion incentive and additional incentives for reduced closures, for a total incentive payment of $185,000. The Washington State DOT obtained the new deck ahead of schedule with no impact to rush-hour traffic.
I-95 Bridge over James River Superstructure Replacement in Virginia
In 1997, a total of 110,000 vehicles per day crossed the twin 4,185-ft-long Interstate 95 bridges over the James River in Richmond, Virginia. With such a large traffic volume, conventional construction was not an option for replacement of the deteriorated superstructures. In 2002, after soliciting the preferences of the public, the existing spans were removed and new prefabricated segments of half the roadway width were installed using high-capacity cranes and conventional flatbed trailers during night operations. The 102 spans were replaced in 137 nights during 17 months, with no impact to rush-hour traffic. Conventional construction would have required 24 to 36 months and significant impact to traffic.
The Virginia DOT used A+B bidding, where “A” was the bid items and “B” was the number of calendar days with nighttime lane closures, with bids greater than 240 days considered to be non-responsive. An incentive and disincentive of $30,000 per day was included for early completion not to exceed $2.0M and late completion with no dollar limit, respectively. An additional disincentive that accumulated up to $250,000 per day was included for not having all lanes of the bridge open to traffic on time.
The low bid of $43.4M was 11 percent ($5.1M) less than the engineer’s estimate of $48.5M. The contractor bid 179 days to replace the spans and completed the work in 137 night closures, receiving $30,000 for each of 42 nights, for a $1.3M incentive. The Virginia DOT obtained a new superstructure ahead of schedule with no impact to rush-hour traffic.
State Highway 66 Bridge over Lake Ray Hubbard Precast Bent Caps in Texas
Unlike the above two projects, in which the owner agencies required the use of prefabricated bridge components because of traffic needs, the twin State Highway 66 bridges over Lake Ray Hubbard northeast of Dallas was bid with conventional cast-in-place substructures. After award of the project, the contractor proposed a field change for precast reinforced concrete bent caps on the 4,360-ft-long, 40-ft-wide eastbound bridge to reduce the handling of formwork and materials over water and to minimize the construction workers’ exposure to high-voltage transmission lines that ran adjacent to the bridge. The Texas DOT approved the contractor’s proposal to prefabricate the caps with no change in funding. The contract did not include incentives or disincentives. Precasting the 43 identical caps saved 5 to 7 days per cap, for a total of 215 days. Conventional bent caps would have required 7 days of critical path activity per cap for forming, concrete placement, and curing, totaling an additional 9 months of construction time. Prefabricating the caps off the critical path also allowed the use of normal-strength high performance
Marketing Plan for Prefabricated Bridge Elements and Systems (PBES) 11
concrete with its greater durability but slower strength gain due to the 35 percent replacement of cement with ground-granulated blast-furnace slag.
The low bid of $40.9M was 15 percent ($7.3M) less than the engineer’s estimate of $48.2M. The Texas DOT obtained a more durable bridge ahead of schedule.
CUSTOMER-TARGET MARKET ANALYSIS
One can categorize the audience or target market for PBES into the following nine categories:
• State Transportation Agencies (including Chief Executive Officers [CEOs], Chief
Engineers, State Bridge Engineers, District Administrators, District Engineers, District
Bridge Engineers, Environmental Specialists, and Design and Construction Teams)
• Users (including the Driving Public, Commercial Carriers, Neighbors, Mass Media)
• Local Transportation Agencies (including Counties, Cities, and Townships/Parishes)
• Metropolitan Planning Organizations (MPOs)
• FHWA (including Division Offices, Area Engineers, Division Administrators, Bridge
Engineers, Resource Center, and Environmental Specialists)
• Federal Lands Highway Divisions (including Directors of Project Delivery, Bridge
Engineers, Project Managers, Design and Construction Team, Environmental
Specialists)
• Industry (including Consultants, Fabricators, Suppliers, Contractors, Producers, and
Trade/Professional Associations)
• Educators (Academia, National Highway Institute [NHI], Local Technical Assistance
Programs [LTAP] and Tribal Technical Assistance Programs [TTAP])
• Researchers (individuals from any of the above categories who are focused on the
specific aspect of finding better ways of building bridges through research)
This chapter provides a brief analysis of two of the largest markets—state transportation agencies and highway users.
STATE TRANSPORTATION AGENCIES In the United States, the decisions regarding what type of bridge gets built where are
made primarily within the State DOTs; therefore, this organizational type is the primary focus of the PBES marketing effort. Although there are almost half a dozen types of “customers” considered in the category of State Transportation Agencies, this marketing effort focuses primarily on two key customer types: the state bridge engineer and the CEO.
Marketing Plan for Prefabricated Bridge Elements and Systems (PBES) 12
THE STATE BRIDGE ENGINEER
The state bridge engineer is responsible for planning, designing, and constructing bridges within the state. He or she is the key technical professional having impact on the decision-making process of whether to make the use of prefabricated bridge elements and systems a standard approach. Therefore, it is critical to know how these individuals feel about PBES as a concept, what prevents them from using PBES on a regular basis, and what actions might eliminate those barriers.
In April 2005, in a meeting at Woods Hole, Massachusetts, a focus group of 18 state bridge engineers discussed those very topics. The group found six barriers to using the technology and six needs that, if filled, would eliminate those barriers.
Lack of Education, Training, and Experience Because of the relative newness of this technology, most of these state bridge
engineers felt that extensive training was needed for both the DOT staff and contractor personnel. One engineer noted that contractors are reluctant to bid on technologies, methods, or equipment with which they are unfamiliar. Another pointed out that part of that education and experience would be having access to specialty firms that have done such work before.
How does one remove that barrier? Of course, a formal course and workshops were mentioned, but also, as one bridge engineer noted, on-the-job experience would be very helpful. The State DOT “needs to work through the issues with a small demonstration project.”
Lack of Standards and Specifications A majority of the group felt that standards and specifications were critical elements as
well. The types of standards and specifications the group requested include design considerations, foundation requirements, development of construction specifications to administer the project, project planning guidance early in the schedule to facilitate obtaining adequate right-of-way to build the bridge off the alignment, guidance in speed of installation of foundations, inspection requirements, and an incentive guide specification for PBES. Hauling and transportation of PBES can be an issue as well.
Concerns about Durability or Details One bridge engineer noted that a barrier for installing PBES routinely in hours or days is
the need for testing to ensure the final product meets the state’s seismic potential loss of continuity performance requirements.
Another bridge engineer stated that he had concern for the potential loss of continuity and the smoothness of the riding surface that can be achieved with conventional concrete cast-in-place construction.
Another noted that, “durability of joints and connections in prefab components remains a concern,” and another bridge engineer agreed, saying that connection details (footings to columns and columns to caps) in seismic areas are a concern.
One bridge engineer was concerned about bridge demolition and site preparation time. He said that, “Whereas a prefab bridge itself can be erected quickly, it usually has to go
Marketing Plan for Prefabricated Bridge Elements and Systems (PBES) 13
where an existing bridge is located. Therefore, the road must be shut down for a considerable amount of time to demolish the existing bridge and prep the site for the new bridge. This then forces us to do staged construction or erect temporary bridges. If the incremental time savings is so small versus total project time, there is no incentive to go prefab bridge routinely.”
What did these state bridge engineers want to allay their concerns about durability of details? They felt that more research and testing are needed. One suggested seismic testing of unconventional details and systems. Another wanted more information addressing bridge demolition and site preparation, and others suggested additional research to ensure that adequate ductility can be achieved in connections for PBES.
Higher Cost and Limited Resources Exactly half of the engineers in the group stated that they perceive PBES to have a
higher price tag than conventional approaches. One stated that most of the prefabricated elements used by his state are manufactured out of state, so transportation costs are higher than conventional approaches. Another said that the costs of using SPMTs or other heavy lifting subcontractors can add 15 to 20 percent to the project cost. Although much has been said about PBES saving initial cost funds, it is clear from the responses of this key group of state bridge engineers that PBES projects to date have not consistently achieved lower initial costs, and that it is important to use PBES effectively such that the projects have competitive initial costs.
Lack of Perceived Need for Speed Several state bridge engineers questioned whether being able to build fast was really
necessary, since there were still other items on a project schedule’s critical path that might negate any benefits. Others noted that, in many projects, there was not an alternative route available so that traffic could be even temporarily shunted to another location. As far as what would help most in facilitating this challenge, the responses indicated that adequate evaluation was needed in the planning stage to ensure benefit from the use of PBES. The responses also seemed to imply that PBES should be looked upon as not being simply as way of building fast, but a way of building better.
Construction Industry not Geared up for Prefab Concerns were voiced over contractors’ ability to staff up for projects and then having
to lay people off after a project is completed. Also, lack of a large enough number of heavy lifting contractors to compete for projects and lower cost was a concern. One bridge engineer noted a lack of prefab manufacturing facilities in his state or even nearby states.
THE STATE TRANSPORTATION AGENCY CEO
Next in importance is the chief executive officer of the State DOT. Naturally, as the top administrator of the agency, this person can play a major role in the decision-making process for the use of PBES technology.
From the middle to the latter part of the 20th century, the typical State DOT was managed by a leadership staff comprised of civil engineers who answered to a commission appointed by the governor of the state. Commissioners would meet periodically, usually once a month, to provide general direction for the agency and to approve the development of major highways and programs. This approach worked for a few key reasons. First, it allowed the
Marketing Plan for Prefabricated Bridge Elements and Systems (PBES) 14
department and staff to operate based on engineering needs and buffered it from political pressures. Second, it allowed the governor to appoint individuals who had good business sense and who would manage according to the governor’s political leanings. It also relieved the commissioners of the day-to-day aspects of design, construction, maintenance, personnel management, and other operational tasks.
It was common to develop agency leaders internally over many years. Agencies would hire college engineering students during the summer months. Later, after they’d received their degrees, these new engineers would have jobs waiting for them at the agency. It was quite normal for a man to work for an agency from his college years, right through to retirement.
While some state DOT heads today are engineers with many years of experience in project work, the picture is changing. With the ever-increasing size of projects, in terms of their construction costs, their complexity, and their impact on the public, newly elected governors have become very much aware of the impact that success or failure of a transportation project or program can have on their administrations. Many of them have appointed their own people to head the state’s transportation agency. Typically, the individual selected is a successful business person or political operative who actively supports the governor’s agenda. Thus, for the new agency head, concern with the media and the political ramifications of a decision can be as critical as the actual transportation engineering ones.
This practice of appointing non-transportation professionals has gotten so prevalent in recent years that AASHTO has scheduled week-long training camps to bring these new executives up to speed on what running a state’s transportation program is all about. By definition, these individuals have an eye on the political implications of transportation decisions and, because their term of office is frequently no longer than that of the governor who appoints them, they look for approaches that have fast results—in months or, at most, a very few years.
Exactly how many state DOTs have such leadership? An Internet search in early 2006 showed some remarkable statistics. Out of 50 states and the District of Columbia, only 19—less than 40—are headed by engineers. This is down dramatically from the numbers of just 5 years ago. Moreover, several of those listed as engineers have their expertise in non-highway related areas, such as mining or forestry. Only 21 DOT heads were agency employees prior to getting the job of CEO. (A chart of the results is found in Appendix B.)
Additional support is found in a mail survey of the heads of state DOTs, undertaken in 2003. Of the 32 respondents, 17 had civil engineering degrees. The other 15 had degrees in topics as diverse as law, psychology, journalism, history, and environmental policy. The group was asked, if they could somehow acquire additional expertise overnight, in order to enhance their role as the leader of their organization, what sort of expertise might it be? In response, 14 said business management, 12 said economics and finance, 9 said marketing and public affairs, 8 said human resources, and only 7 mentioned engineering.
Given the major differences between the engineers and the new type of CEO, it is clear that there need to be at least two marketing approaches in dealing with state transportation agencies, one focused on the engineering, technical aspects, and another focused on areas such as financials, safety and civic responsibility.
Marketing Plan for Prefabricated Bridge Elements and Systems (PBES) 15
HIGHWAY USERS One might argue that there is no reason to go outside the highway community in order
to attain success with PBES. However, those outside the highway community play a critical role in the success of the PBES technology. The foremost reason for involving the public is that the laws, regulations and traditions of our society demand involvement of the public in governmental affairs. Also, of course, it is public funds that support the entire program. And, it is important to note, the impact of PBES extends to areas that influence the public. The cost of congestion, for example, in terms of lost hours and the cost to the national economy are things that impact everyone.
ANALYSIS OF INTERNAL MARKETS AND ENVIRONMENT
CORPORATE PHILOSOPHIES
Both the highway community as a whole and the FHWA in particular have been diligent in seeking out innovative solutions to highway challenges. As noted earlier, each year, teams of engineers, planners, and other professionals scan the globe, looking for potential innovations for highway facilities. The result of those trips is an increase in understanding of what the technology could provide the bridges on the Nation’s highway system. A lack of innovation, however, has not been the problem. Rather, the challenge has been in getting those innovations moved from state-of-the-art to state-of-the-practice. Two key factors need to be addressed to improve implementation time.
First, there needs to be a standardized systems approach for deploying technologies. There is a need for a specific system for tracking where in the process an innovation is at any one time, and for getting technologies delivered to state DOTs that might use them. Ensuring that technologies are communicated to and understood by all stakeholders are key objectives.
Prior to 1999, FHWA maintained a central organizational unit responsible for moving technologies into the marketplace—“technology transfer,” as it is called. The Office of Technology Applications (OTA) included engineers and communications specialists whose job it was to coordinate the process from “market ready” to state-of-the-practice throughout the highway community. But with the restructuring of the agency that year, OTA was dissolved and the individual program offices were given the funds and the responsibilities for marketing technologies within their own program areas. The result has been inconsistent and uncoordinated.
Second, the culture of the highway community must be changed so that it sees the benefit in trying new innovations. Because of the way many agencies are set-up, very often a project manager prefers to use the “tried-and-true” approach of the past rather than using an innovative approach, even when it has been proven in other locations. This is in part due to the continuing reduction of the state DOT workforce while work volume remains constant or increases, making it difficult to allocate the additional time required to implement new approaches. Also, the lack of a motivating device such as awards and bonuses, or simply an environment that praises innovation, can mean that trying something new is simply not worth the risk.
The consequence of not taking these two necessary steps is a very slow process for delivery of innovations. The effort creeps along, often taking years, or even decades,
Marketing Plan for Prefabricated Bridge Elements and Systems (PBES) 16
before an innovation is accepted on a nationwide basis. What is needed is to “leap, not creep” in this effort.
How is that brought about? One approach is to simply set up a systematic process for technology deployment. But merely setting up a new, untried process will not be sufficient. What is needed is a commitment by management to the process, as well as support to assist with the implementation and examples of innovations that have been successfully delivered using that process, so that others can see the benefits of using such an approach.
Therefore, in the areas of infrastructure, safety, and operations, the FHWA selected three example innovations for deployment using a systems approach that would be common to all:
• Infrastructure: Prefabricated Bridge Elements and Systems (PBES)
• Safety: Road Safety Audits (RSAs)
• Operations: “Making Work Zones Work Better,” which includes a suite of innovations focused on construction work zones
These innovations were chosen for their potential for making a significant impact on the current state of the highway system. They provide the diversity needed to demonstrate that a common approach will work for virtually any innovation. Although this marketing plan focuses on PBES, because it is to serve as a model approach for getting technologies adopted in the future, the plan is intentionally fairly exhaustive in its approach.
The FHWA Innovation Delivery Process Model The model calls for a marketing team comprised of representatives from the
responsible Headquarters Program Office(s), the Resource Center, one or more of the Federal-aid Highway Division Offices, and the Federal Lands Highway Divisions. Among the team’s members are specialists with expertise in the innovation itself, Federal-aid program delivery, Federal Lands Highways program delivery, and marketing. The Highways for LIFE (HfL) program provides coordination and administration services for the team.
The team will be responsible for the development, implementation, and management of a marketing plan for the innovation that includes the following:
• A clear, concise and thoroughly researched statement of the national need • A detailed description of the innovation itself and its applications • A comparison of the innovation with the traditional approaches it hopes to replace • An assessment of the current situation from the perspective of the business
environment, the need, and the innovation • Identification of the target audience/customers within State DOTs, industry, and FHWA • Identification of the national goal(s) for the innovation and time frame for its acceptance • Identification of a strategic plan to deliver and deploy the innovation, including
Determination of the core messages Promotional items Schedule of activities such as training, special events, one-on-one meetings
Marketing Plan for Prefabricated Bridge Elements and Systems (PBES) 17
Assignments of specific personnel to handle key activities Metrics to evaluate the progress of the strategic plan Identification of time sequenced resource needs
• An evaluation process for the success of the overall marketing plan
Resources For the innovation marketing team to be successful, it will require several specific types
of resources, specifically funding, staffing, and commitment from management. Management commitment includes both the senior management of the agency and the immediate supervisors of the staffers who will be called on to work on the innovation team. This approach provides a means for getting innovations to state DOTs faster and with a higher potential of being implemented. A training module will be developed as one means of addressing this matter, which will specifically show highway engineers and other employees how to access a variety of resources where such innovations are described. The training also will provide guidance on how individuals can develop innovative approaches to the challenges they face in developing new highway or bridge projects.
A critical element of the process will be the assignment of specific tasks to individuals, along with timeframes in which those tasks are to be completed. Without such personal accountability, schedules are not likely to be met.
Finally, it is critical to have sufficient financial resources to fund communications materials, travel, and training curriculum development. Two sources for funding have been identified: the HfL program has agreed to provide significant initial funding, and bridge program funds can supplement that.
INTERNAL ORGANIZATION
Attached is an organization chart of FHWA. It is noteworthy that bridge engineers populate every aspect of the agency: Headquarters (including both those in the Nassif Building and at the Turner-Fairbank Highway Research Center), the Resource Center, the division offices, and the Federal Lands Highway offices. Thus, unlike many areas of the agency, it is possible to have a “champion” of PBES in virtually every office of FHWA. As one of the FHWA bridge engineering websites notes,
FHWA's partners and senior managers expect FHWA bridge engineers to aid them in the deployment of emerging technologies and practices that reduce the number of deficient bridges, construction time, and construction and maintenance costs, while improving work zone and traffic safety. FHWA bridge engineers must possess superior technical skills and have a comprehensive understanding of “best-practices” in bridge engineering to be able to accommodate our agency's strategic goals and support the “Vital Few.”2
FHWA’s Bridge Leadership Council has committed to serving as a champion as well. As that website notes, through the efforts of the council, “FHWA bridge engineers will be
2 For details on this, see the agency’s intranet discussion at staffnet.fhwa.dot.gov/bridge/blc/enhance.htm.
Marketing Plan for Prefabricated Bridge Elements and Systems (PBES) 18
able to lead the mainstreaming of new technologies and strategies to assess and preserve bridges, which reduce the construction time and impacts on congestion.” This organization should be enlisted to provide resources, whether it’s assistance in communicating with others within the agency, or financial assistance.
The various roles of FHWA units in implementing PBES are as follows:
• R&T Leadership Team: Establish PBES as an FHWA priority, set the national goal for
PBES, agree to full agency support and participation to achieve the goal, agency
accountability for achieving the goal
• Program Office: Champion PBES, provide technical and goal direction, funding
• Resource Center: PBES technology delivery and technical assistance
• Division Offices: Mobilize staff to deploy PBES with their state DOTs and industry
• Federal Lands: Adopt PBES as a standard, build demonstration projects, support
demonstrations and documentation
• National Highway Institute: Training development and delivery
• PBES Implementation Team: Lead deployment effort, develop and implement marketing
plan, monitor and report on progress toward goal.
OTHER TARGET MARKETS
CONSTRUCTION CONTRACTORS
As the focus group interviews with state bridge engineers noted, the relative comfort that contractors feel in using PBES will play a critical role in the technology’s acceptance. Therefore, activities are needed to reduce the contractors’ perception of higher risk with the use of PBES. Such activities may include evaluation in the project planning stage to ensure effective use of PBES, the development of standard design plans and specifications, the continued use of demonstration projects and workshops, training for both owners and contractors, and the use of contracting strategies that provide the contractor with a financial incentive to meet the owner’s reduced onsite construction timelines.
TRADE ASSOCIATIONS
Trade associations have long played a key role in getting highway innovations adopted. Often, an association’s research group can aid in the development or refinement of a technology. Likewise, their communications groups can be key informants to their thousands of members throughout the world. Civil Engineering magazine is an excellent example. The publication has long been recognized as a resource for obtaining details on new technologies and how they have been applied to specific projects. The publication has an international readership of professional engineers throughout a wide range of areas, including government agencies, research programs, consulting firms, and academia. Partnering with such trade associations provides an important ally to the team charged with
Marketing Plan for Prefabricated Bridge Elements and Systems (PBES) 19
getting a new technology implemented. To the association itself, it provides an entrée to details of the technology, a valuable aid in serving its membership.
OTHER GROUPS
While other markets and audiences are important (e.g., local transportation agencies, MPOs, educators, researchers), most of them can be reached, either through secondary communication with the above noted markets, or through including them with the communications efforts to state DOTs.
MARKETING STRATEGY
MARKETING OBJECTIVES
The objective of the PBES initiative is that, by the year 2010, all State DOTs and the three Federal Lands Highway Divisions will consider the use of PBES to be a standard practice for bridge design and construction. The long-term vision is to have stockpiled PBES superstructure and substructure components which are standardized, inexpensive, durable, and rapidly erected. To achieve this goal, the PBES implementation team determined where it should be going between now and 2009:
• Look at the “opportunity” states Raj’s spreadsheet Bridge program volume Future needs based on the National Bridge Inventory [NBI]
• Look at states with no accelerated bridge construction (ABC) projects • Progressive states that choose non-risk projects • Convince states that they will save money on first costs • Action plans to achieve consideration of PBES as standard practice by 2010 • Focus on replacement versus new construction • Tools to define cost-effectiveness (first cost/user cost/life cycle cost) • Mobilize FHWA Division Offices • Continue developing needed tools, both technical and marketing • Example contracting specifications to states to get short timelines
MEASURE The measure for success in a particular area is framed in the following question: Does
the state DOT or Federal Lands Highway Division have a PBES policy and specification?
CURRENT STATUS Three states (New York, Texas, and Washington) each have built more than 20 PBES
bridges. Alabama, Connecticut, Florida, Illinois, Indiana, New Jersey, Pennsylvania, and Virginia are actively pursuing PBES as a standard practice.
MARKETING PERSONNEL The core PBES marketing team includes the following members (listed alphabetically):
Marketing Plan for Prefabricated Bridge Elements and Systems (PBES) 20
• Kathleen Bergeron, Marketing Specialist, HfL • Hala Elgaaly, Bridge Engineer, Federal Lands Highways • Shoukry Elnahal, Structures Technical Service Team Leader, FHWA Resource Center • Vasant Mistry, Senior Bridge Engineer, Office of Bridge Technology • Benjamin Tang, Bridge Team Leader, Office of Bridge Technology
CHANNELS OF DISTRIBUTION
EXISTING CHANNELS OF DISTRIBUTION The PBES implementation team developed the following list of approaches to
customers and technology transfer:
• One-on-one assistance – most important! • Training (formal classroom), including on manuals and decision-making framework • Activities based on customer feedback • Funding • Marketing tools (e.g., toolkit CDs) • Open houses/showcases/demonstration workshops, including contractor participation • Technical tools (e.g., manuals)
Connection details, user-cost models, contracting methods • Mini-scan tours between states • Trade shows • CDs/DVDs, including videos of construction • Website • Presentations • Articles, papers, brochures • Emphasize lessons learned and important aspects • Interaction with the ones doing the work • Marketing to CEOs
The team will identify federal and state champions and bring a diverse group of experts
together, including experts in hydraulics, maintenance, right of way, and utilities, for a systems-based approach to design and construction. See Appendix C for contact information for key state and federal transportation officials.
There are several key methods for getting information to the state DOTs:
• One-on-one meetings. This is the most critical of any of the tools under consideration. This allows the other person to actually get involved in a dialog, rather than simply reading a brochure or listening to a speaker at a conference or workshop. It also allows the FHWA representative to probe into reasons why a DOT employee would resist using a new technology. Is it because of the technology itself? Is there something inherent in the agency’s culture? Whatever the case, one-on-one meetings are marvelous tools for ferreting out answers while creating personal relationships. Further, any hesitation to using a new technology can be overcome better because the other person is there to
Marketing Plan for Prefabricated Bridge Elements and Systems (PBES) 21
reassure and the provide encouragement. Goals of the one-on-one meetings include building a relationship and partnership with the state DOT and obtaining buy-in to the technology; care will be taken to ensure that the technology is not perceived as an FHWA mandate.
• Training programs. Formal classes and workshops reinforce the one-on-one meetings because they can graphically demonstrate that the individual new to a technology may become quite conversant in it in a very short time. Also, because such programs use success stories to illustrate how the technology is applied, potential users who might otherwise feel that they are not able to apply the technology in their states are put at ease. Not to be minimized is the importance of providing a certificate to individuals who attend classes and workshops. It is vitally important that those individuals are told—not just orally, but also in print—that they are now recognized as being capable of applying the new technology. Their attendance in the classroom is not merely a review of information but rather an actual instructional effort with the desired outcome that graduates will be able to leave the classroom fully capable of putting the technology to work in their jobs.
• Presentations. Meetings of bridge engineers, as well as the leaders of highway agencies, are excellent vehicles for delivering a message on PBES technology. While less effective that either of the previous channels of communication, presentations at meetings are excellent ways of making an initial impression. Graduates of the training programs mentioned above should be armed with basic tools for providing presentations to their staffs, once they return to their workplaces in their home state DOTs.
• Open Houses/Showcases. These special events are focused around projects that are being constructed using the particular technology under consideration. For example, if one state is building a bridge using PBES, it becomes an excellent opportunity to bring bridge engineers from other states to see the process as it develops. They get a chance to discuss aspects of the project with the project engineer as the work is being done.
• Marketing Communication Tools. Such tools as videos, brochures, PowerPoint presentations, and websites can be used as vehicles for delivering the message on a technology. However, care must be taken not to rely on them to carry the message alone. Using a short video as part of a presentation, for example, is much more effective that simply sending it to everyone via the mail. Even such often derided items as give-a-ways can be used effectively in gaining support for the technology. Items such as lapel pins or stickers for hard hats, promoting the innovation, can send the message that the wearer is a supporter of the technology and can encourage others to “join the team.”
NEW CHANNELS OF DISTRIBUTION
Weblogs (“blogs”) (use example of GM’s CEO and how he participates in web blogs, talking with customers across the country, the world, in discussing his firm’s products. Not
Marketing Plan for Prefabricated Bridge Elements and Systems (PBES) 22
only does it clarify the organization’s vision to the customer, it keeps that CEO up to date on what some of his customers are thinking and needing.
MARKETING STRATEGY: YEAR ONE
TARGETS FOR FY2007
During the 2006 fiscal year, the PBES implementation team’s goal was to have 15 additional states try PBES on one or more projects, with 8 of them determining that PBES will be their standard approach to bridge design, with “stick-built” being used only when PBES is not appropriate.
Also, participation in the PBES implementation effort needs to include others within the highway community, so at least four industry groups and associations were targeted during the first year of the program. A key device for measuring an organization’s commitment to PBES was having their primary member publication publish a positive article on PBES, with a commitment to encourage the use of the technology by their members.
MARKETING STRATEGIES
The PBES implementation team will meet and discuss which states are most liable to go to PBES as a standard approach and target them first. The idea is that, as more and more states adopt PBES, eventually a “tipping point” will be reached, after which other states which might not be inclined toward PBES now, would be more so inclined.
Once these “opportunity states” have been identified, appointments will be made for bridge specialists on the team to travel to the appropriate division offices, there to meet with the division administrator [DA], give an all-hands presentation on the technology, and then to accompany the DA to the state DOT offices. At the DOT offices, the bridge specialist from the marketing team and the DA would meet with the CEO, with the state bridge engineer from the DOT in attendance. At that meeting, the bridge specialist from the marketing team would show a short (1 to 3 minutes) video on the technology, focusing on the bottom line benefits. Once that meeting was over, the bridge specialist from the implementation team would give more details to the state bridge engineer, perhaps showing a longer, more technical version of the video to the entire bridge design staff in the state DOT. The bridge specialist from the implementation team would leave behind a copy of the video, a brochure for each bridge person on the staff, and an advertising specialty item that was selected to tie in somehow with PBES. There would also be invitations provided to upcoming open houses/showcases or formal training sessions. Opportunities would be made for holding a training session there in that city.
National and regional workshops, conferences, and open houses/showcases also will be held throughout the year, and individuals from the targeted “opportunity states” will be invited to attend. Special travel scholarships will be made available for those same individuals, so that they can be sure to attend. Ultimately, the goal would be that, once an opportunity state has implemented PBES (and then later institutes PBES as the standard), DOT staff members will serve as champions for the technology to their peers. They will be asked to represent their state on panels at the annual meeting of the Transportation Research Board (TRB) and other prestigious conferences, as well as to accompany PBES implementation team members on
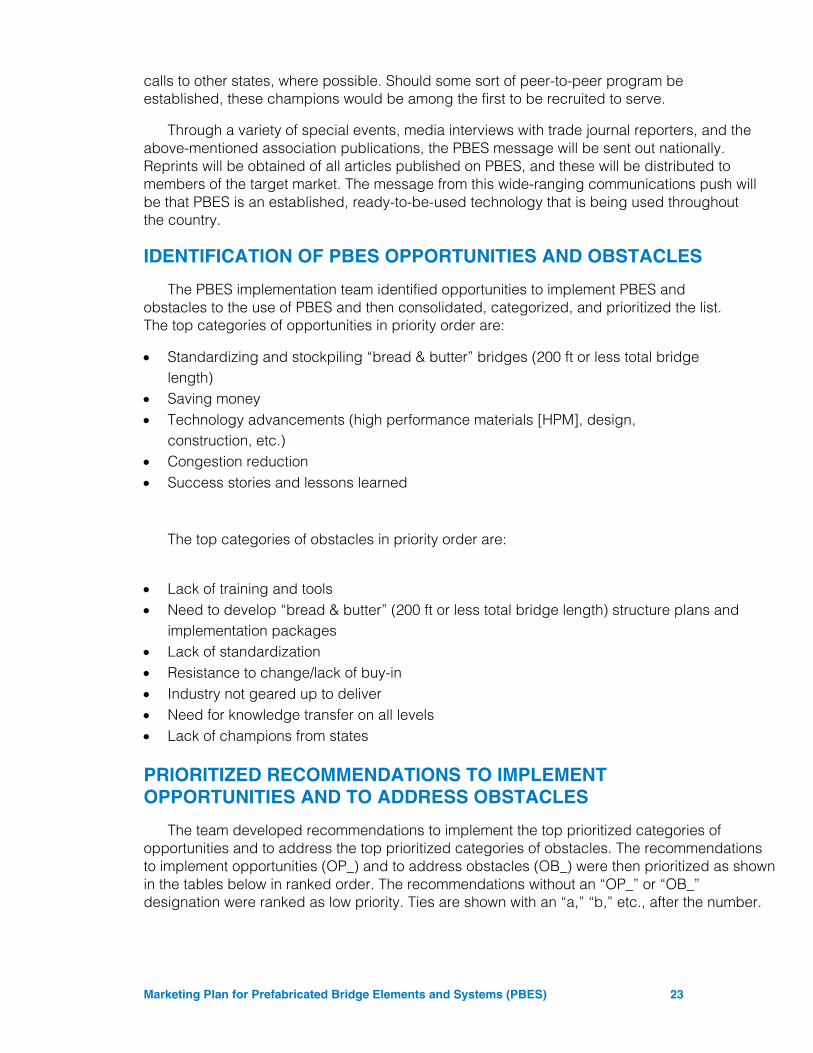
Marketing Plan for Prefabricated Bridge Elements and Systems (PBES) 23
calls to other states, where possible. Should some sort of peer-to-peer program be established, these champions would be among the first to be recruited to serve.
Through a variety of special events, media interviews with trade journal reporters, and the above-mentioned association publications, the PBES message will be sent out nationally. Reprints will be obtained of all articles published on PBES, and these will be distributed to members of the target market. The message from this wide-ranging communications push will be that PBES is an established, ready-to-be-used technology that is being used throughout the country.
IDENTIFICATION OF PBES OPPORTUNITIES AND OBSTACLES
The PBES implementation team identified opportunities to implement PBES and obstacles to the use of PBES and then consolidated, categorized, and prioritized the list. The top categories of opportunities in priority order are:
• Standardizing and stockpiling “bread & butter” bridges (200 ft or less total bridge length)
• Saving money • Technology advancements (high performance materials [HPM], design,
construction, etc.) • Congestion reduction • Success stories and lessons learned
The top categories of obstacles in priority order are:
• Lack of training and tools • Need to develop “bread & butter” (200 ft or less total bridge length) structure plans and
implementation packages • Lack of standardization • Resistance to change/lack of buy-in • Industry not geared up to deliver • Need for knowledge transfer on all levels • Lack of champions from states
PRIORITIZED RECOMMENDATIONS TO IMPLEMENT OPPORTUNITIES AND TO ADDRESS OBSTACLES
The team developed recommendations to implement the top prioritized categories of opportunities and to address the top prioritized categories of obstacles. The recommendations to implement opportunities (OP_) and to address obstacles (OB_) were then prioritized as shown in the tables below in ranked order. The recommendations without an “OP_” or “OB_” designation were ranked as low priority. Ties are shown with an “a,” “b,” etc., after the number.
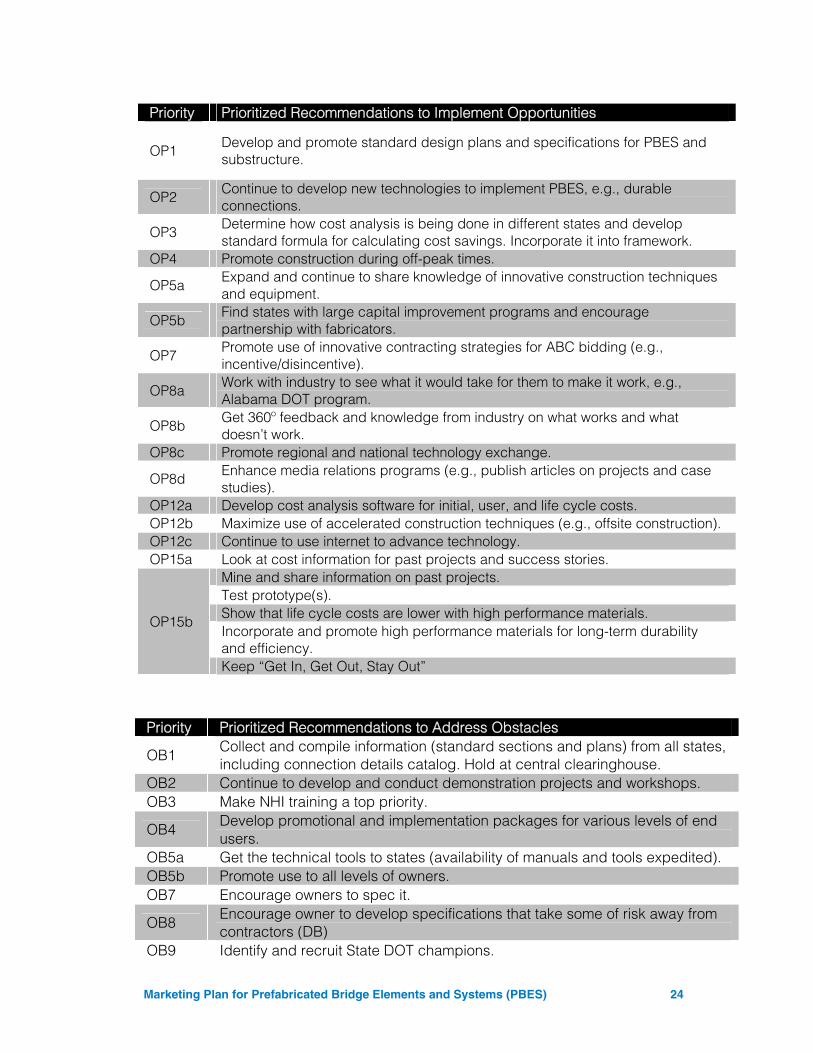
Marketing Plan for Prefabricated Bridge Elements and Systems (PBES) 24
Priority Prioritized Recommendations to Implement Opportunities
OP1 Develop and promote standard design plans and specifications for PBES and substructure.
OP2 Continue to develop new technologies to implement PBES, e.g., durable connections.
OP3 Determine how cost analysis is being done in different states and develop standard formula for calculating cost savings. Incorporate it into framework.
OP4 Promote construction during off-peak times.
OP5a Expand and continue to share knowledge of innovative construction techniques and equipment.
OP5b Find states with large capital improvement programs and encourage partnership with fabricators.
OP7 Promote use of innovative contracting strategies for ABC bidding (e.g., incentive/disincentive).
OP8a Work with industry to see what it would take for them to make it work, e.g., Alabama DOT program.
OP8b Get 360º feedback and knowledge from industry on what works and what doesn’t work.
OP8c Promote regional and national technology exchange.
OP8d Enhance media relations programs (e.g., publish articles on projects and case studies).
OP12a Develop cost analysis software for initial, user, and life cycle costs. OP12b Maximize use of accelerated construction techniques (e.g., offsite construction). OP12c Continue to use internet to advance technology. OP15a Look at cost information for past projects and success stories.
OP15b
Mine and share information on past projects. Test prototype(s). Show that life cycle costs are lower with high performance materials. Incorporate and promote high performance materials for long-term durability and efficiency. Keep “Get In, Get Out, Stay Out”
Priority Prioritized Recommendations to Address Obstacles
OB1 Collect and compile information (standard sections and plans) from all states, including connection details catalog. Hold at central clearinghouse.
OB2 Continue to develop and conduct demonstration projects and workshops. OB3 Make NHI training a top priority.
OB4 Develop promotional and implementation packages for various levels of end users.
OB5a Get the technical tools to states (availability of manuals and tools expedited). OB5b Promote use to all levels of owners. OB7 Encourage owners to spec it.
OB8 Encourage owner to develop specifications that take some of risk away from contractors (DB)
OB9 Identify and recruit State DOT champions.
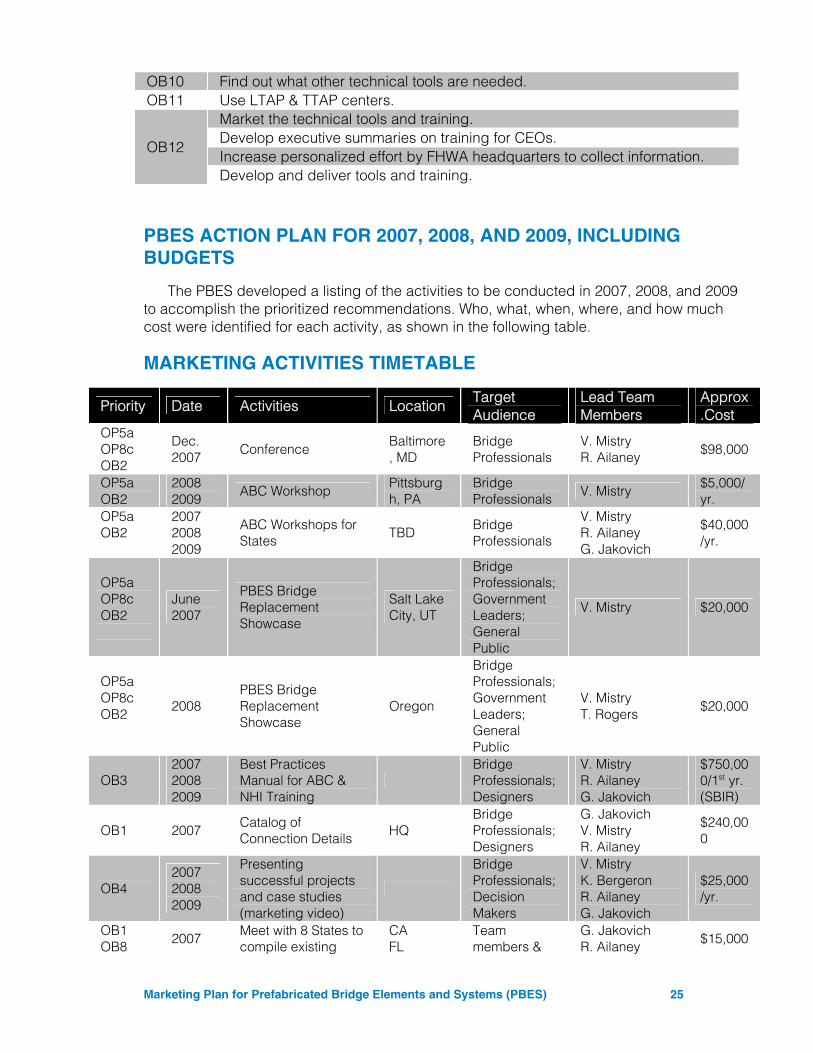
Marketing Plan for Prefabricated Bridge Elements and Systems (PBES) 25
PBES ACTION PLAN FOR 2007, 2008, AND 2009, INCLUDING BUDGETS
The PBES developed a listing of the activities to be conducted in 2007, 2008, and 2009 to accomplish the prioritized recommendations. Who, what, when, where, and how much cost were identified for each activity, as shown in the following table.
MARKETING ACTIVITIES TIMETABLE
Priority Date Activities Location Target Audience
Lead Team Members
Approx.Cost
OP5a OP8c OB2
Dec. 2007 Conference
Baltimore, MD
Bridge Professionals
V. Mistry R. Ailaney $98,000
OP5a OB2
2008 2009
ABC Workshop Pittsburgh, PA
Bridge Professionals V. Mistry
$5,000/yr.
OP5a OB2
2007 2008 2009
ABC Workshops for States
TBD Bridge Professionals
V. Mistry R. Ailaney G. Jakovich
$40,000/yr.
OP5a OP8c OB2
June 2007
PBES Bridge Replacement Showcase
Salt Lake City, UT
Bridge Professionals; Government Leaders; General Public
V. Mistry $20,000
OP5a OP8c OB2
2008 PBES Bridge Replacement Showcase
Oregon
Bridge Professionals; Government Leaders; General Public
V. Mistry T. Rogers
$20,000
OB3 2007 2008 2009
Best Practices Manual for ABC & NHI Training
Bridge Professionals; Designers
V. Mistry R. Ailaney G. Jakovich
$750,000/1st yr. (SBIR)
OB1 2007 Catalog of Connection Details HQ
Bridge Professionals; Designers
G. Jakovich V. Mistry R. Ailaney
$240,000
OB4 2007 2008 2009
Presenting successful projects and case studies (marketing video)
Bridge Professionals; Decision Makers
V. Mistry K. Bergeron R. Ailaney G. Jakovich
$25,000/yr.
OB1 OB8 2007 Meet with 8 States to
compile existing CA FL
Team members &
G. Jakovich R. Ailaney $15,000
OB10 Find out what other technical tools are needed. OB11 Use LTAP & TTAP centers.
OB12
Market the technical tools and training. Develop executive summaries on training for CEOs. Increase personalized effort by FHWA headquarters to collect information. Develop and deliver tools and training.
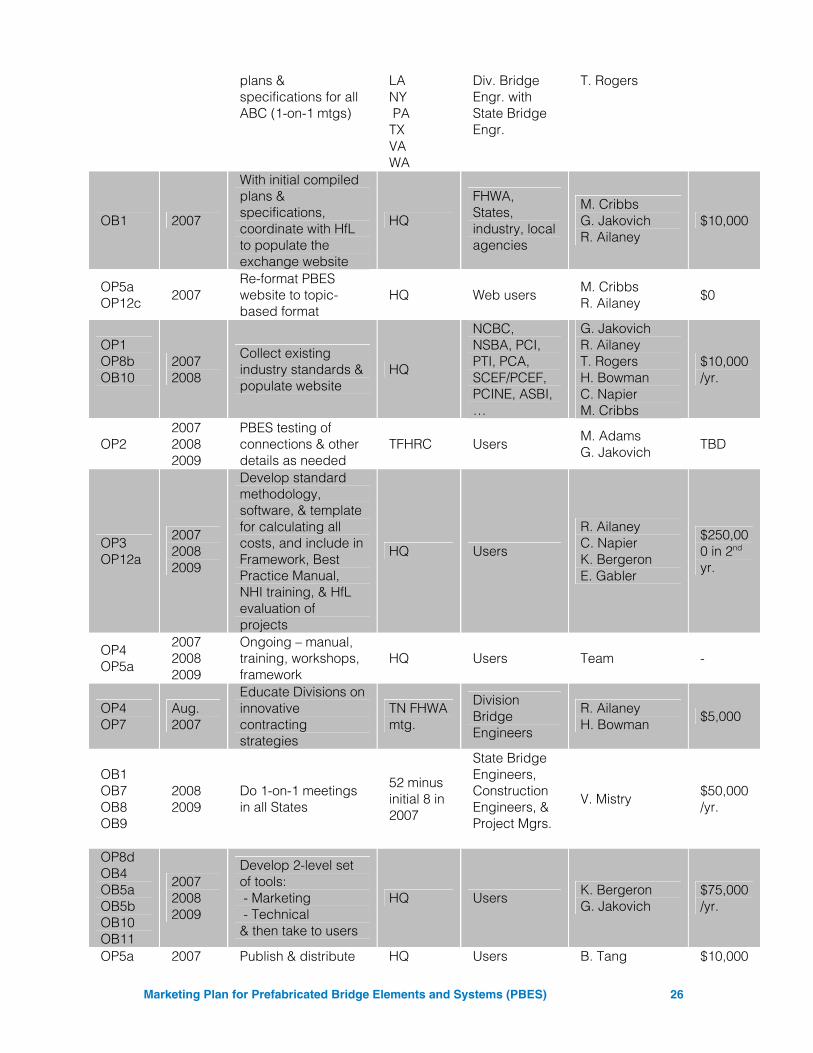
Marketing Plan for Prefabricated Bridge Elements and Systems (PBES) 26
plans & specifications for all ABC (1-on-1 mtgs)
LA NY PA TX VA WA
Div. Bridge Engr. with State Bridge Engr.
T. Rogers
OB1 2007
With initial compiled plans & specifications, coordinate with HfL to populate the exchange website
HQ
FHWA, States, industry, local agencies
M. Cribbs G. Jakovich R. Ailaney
$10,000
OP5a OP12c 2007
Re-format PBES website to topic-based format
HQ Web users M. Cribbs R. Ailaney $0
OP1 OP8b OB10
2007 2008
Collect existing industry standards & populate website
HQ
NCBC, NSBA, PCI, PTI, PCA, SCEF/PCEF, PCINE, ASBI, …
G. Jakovich R. Ailaney T. Rogers H. Bowman C. Napier M. Cribbs
$10,000/yr.
OP2 2007 2008 2009
PBES testing of connections & other details as needed
TFHRC Users M. Adams G. Jakovich
TBD
OP3 OP12a
2007 2008 2009
Develop standard methodology, software, & template for calculating all costs, and include in Framework, Best Practice Manual, NHI training, & HfL evaluation of projects
HQ Users
R. Ailaney C. Napier K. Bergeron E. Gabler
$250,000 in 2nd yr.
OP4 OP5a
2007 2008 2009
Ongoing – manual, training, workshops, framework
HQ Users Team -
OP4 OP7
Aug. 2007
Educate Divisions on innovative contracting strategies
TN FHWA mtg.
Division Bridge Engineers
R. Ailaney H. Bowman
$5,000
OB1 OB7 OB8 OB9
2008 2009
Do 1-on-1 meetings in all States
52 minus initial 8 in 2007
State Bridge Engineers, Construction Engineers, & Project Mgrs.
V. Mistry $50,000/yr.
OP8d OB4 OB5a OB5b OB10 OB11
2007 2008 2009
Develop 2-level set of tools: - Marketing - Technical & then take to users
HQ Users K. Bergeron G. Jakovich
$75,000/yr.
OP5a 2007 Publish & distribute HQ Users B. Tang $10,000
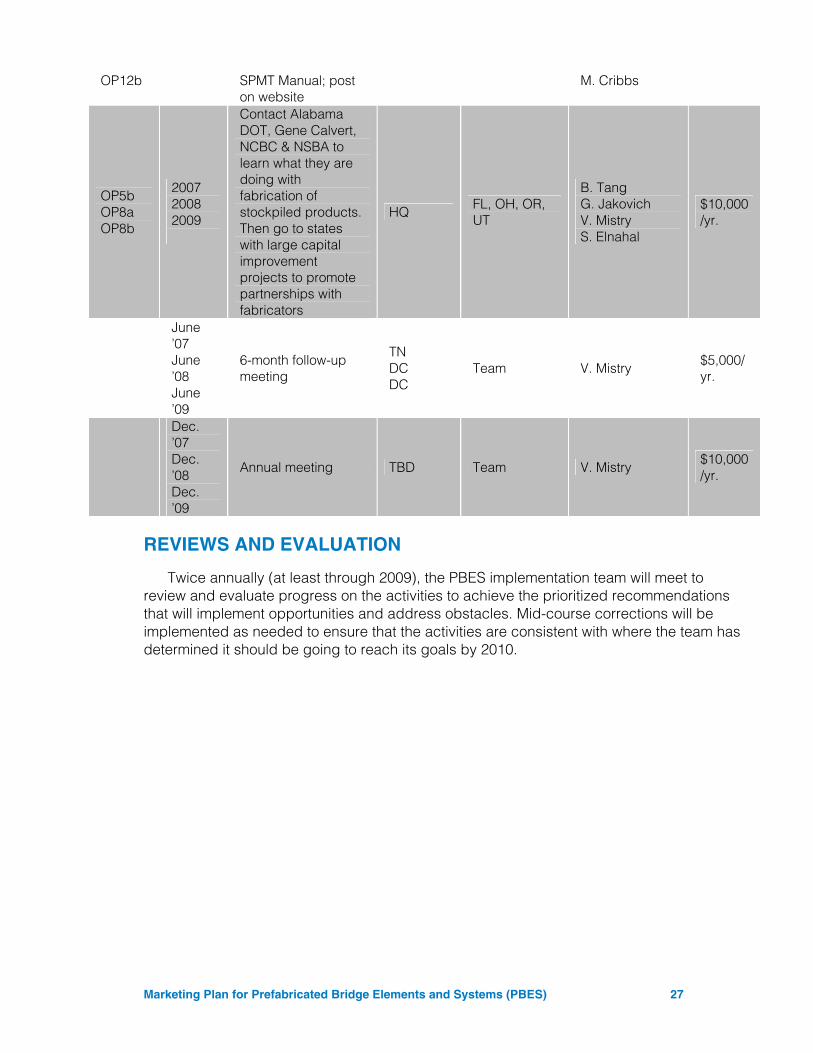
Marketing Plan for Prefabricated Bridge Elements and Systems (PBES) 27
OP12b SPMT Manual; post on website
M. Cribbs
OP5b OP8a OP8b
2007 2008 2009
Contact Alabama DOT, Gene Calvert, NCBC & NSBA to learn what they are doing with fabrication of stockpiled products. Then go to states with large capital improvement projects to promote partnerships with fabricators
HQ FL, OH, OR, UT
B. Tang G. Jakovich V. Mistry S. Elnahal
$10,000/yr.
June ’07 June ’08 June ’09
6-month follow-up meeting
TN DC DC
Team V. Mistry $5,000/yr.
Dec. ’07 Dec. ’08 Dec. ’09
Annual meeting TBD Team V. Mistry $10,000/yr.
REVIEWS AND EVALUATION
Twice annually (at least through 2009), the PBES implementation team will meet to review and evaluate progress on the activities to achieve the prioritized recommendations that will implement opportunities and address obstacles. Mid-course corrections will be implemented as needed to ensure that the activities are consistent with where the team has determined it should be going to reach its goals by 2010.
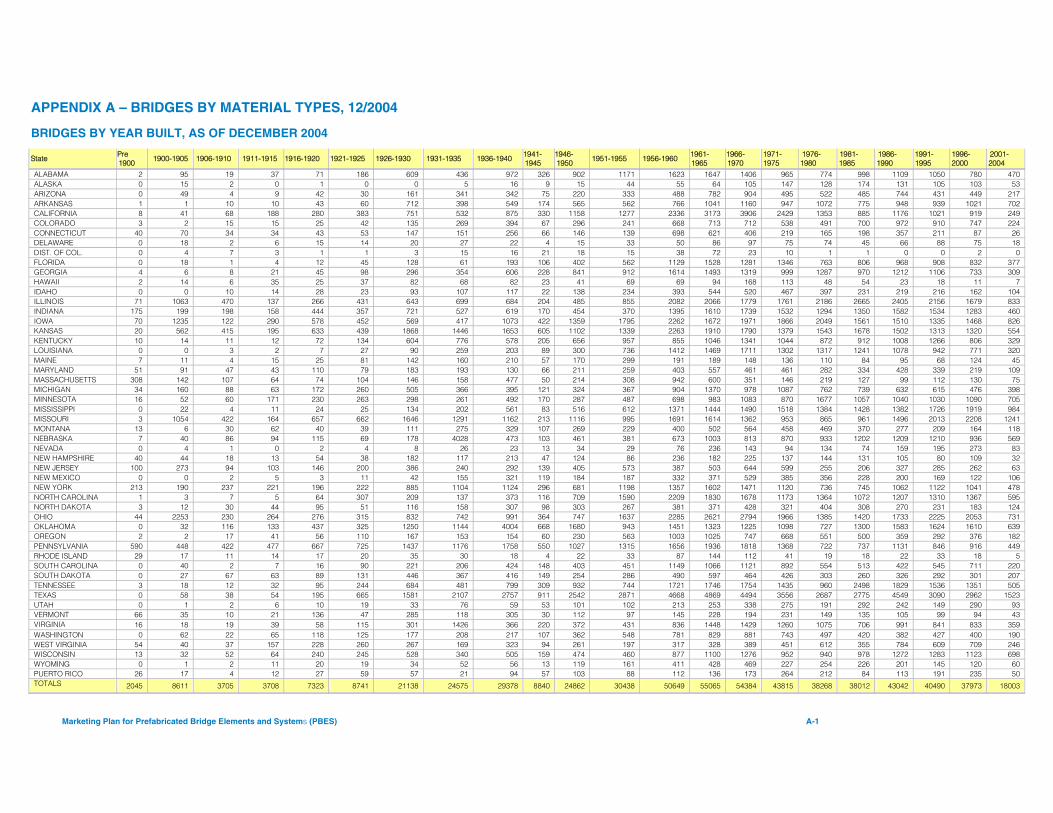
Marketing Plan for Prefabricated Bridge Elements and Systems (PBES) A-1
APPENDIX A – BRIDGES BY MATERIAL TYPES, 12/2004
BRIDGES BY YEAR BUILT, AS OF DECEMBER 2004
State Pre 1900
1900-1905 1906-1910 1911-1915 1916-1920 1921-1925 1926-1930 1931-1935 1936-1940 1941-1945
1946-1950
1951-1955 1956-1960 1961-1965
1966-1970
1971-1975
1976-1980
1981-1985
1986-1990
1991-1995
1996-2000
2001-2004
ALABAMA 2 95 19 37 71 186 609 436 972 326 902 1171 1623 1647 1406 965 774 998 1109 1050 780 470 ALASKA 0 15 2 0 1 0 0 5 16 9 15 44 55 64 105 147 128 174 131 105 103 53 ARIZONA 0 49 4 9 42 30 161 341 342 75 220 333 488 782 904 495 522 485 744 431 449 217 ARKANSAS 1 1 10 10 43 60 712 398 549 174 565 562 766 1041 1160 947 1072 775 948 939 1021 702 CALIFORNIA 8 41 68 188 280 383 751 532 875 330 1158 1277 2336 3173 3906 2429 1353 885 1176 1021 919 249 COLORADO 3 2 15 15 25 42 135 269 394 67 296 241 668 713 712 538 491 700 972 910 747 224 CONNECTICUT 40 70 34 34 43 53 147 151 256 66 146 139 698 621 406 219 165 198 357 211 87 26 DELAWARE 0 18 2 6 15 14 20 27 22 4 15 33 50 86 97 75 74 45 66 88 75 18 DIST. OF COL. 0 4 7 3 1 1 3 15 16 21 18 15 38 72 23 10 1 1 0 0 2 0 FLORIDA 0 18 1 4 12 45 128 61 193 106 402 562 1129 1528 1281 1346 763 806 968 908 832 377 GEORGIA 4 6 8 21 45 98 296 354 606 228 841 912 1614 1493 1319 999 1287 970 1212 1106 733 309 HAWAII 2 14 6 35 25 37 82 68 82 23 41 69 69 94 168 113 48 54 23 18 11 7 IDAHO 0 0 10 14 28 23 93 107 117 22 138 234 393 544 520 467 397 231 219 216 162 104 ILLINOIS 71 1063 470 137 266 431 643 699 684 204 485 855 2082 2066 1779 1761 2186 2665 2405 2156 1679 833 INDIANA 175 199 198 158 444 357 721 527 619 170 454 370 1395 1610 1739 1532 1294 1350 1582 1534 1283 460 IOWA 70 1235 122 290 578 452 569 417 1073 422 1359 1795 2262 1672 1971 1866 2049 1561 1510 1335 1468 826 KANSAS 20 562 415 195 633 439 1868 1446 1653 605 1102 1339 2263 1910 1790 1379 1543 1678 1502 1313 1320 554 KENTUCKY 10 14 11 12 72 134 604 776 578 205 656 957 855 1046 1341 1044 872 912 1008 1266 806 329 LOUISIANA 0 0 3 2 7 27 90 259 203 89 300 736 1412 1469 1711 1302 1317 1241 1078 942 771 320 MAINE 7 11 4 15 25 81 142 160 210 57 170 299 191 189 148 136 110 84 95 68 124 45 MARYLAND 51 91 47 43 110 79 183 193 130 66 211 259 403 557 461 461 282 334 428 339 219 109 MASSACHUSETTS 308 142 107 64 74 104 146 158 477 50 214 308 942 600 351 146 219 127 99 112 130 75 MICHIGAN 34 160 88 63 172 260 505 366 395 121 324 367 904 1370 978 1087 762 739 632 615 476 398 MINNESOTA 16 52 60 171 230 263 298 261 492 170 287 487 698 983 1083 870 1677 1057 1040 1030 1090 705 MISSISSIPPI 0 22 4 11 24 25 134 202 561 83 516 612 1371 1444 1490 1518 1384 1428 1382 1726 1919 984 MISSOURI 3 1054 422 164 657 662 1646 1291 1162 213 1116 995 1691 1614 1362 953 865 961 1496 2013 2208 1241 MONTANA 13 6 30 62 40 39 111 275 329 107 269 229 400 502 564 458 469 370 277 209 164 118 NEBRASKA 7 40 86 94 115 69 178 4028 473 103 461 381 673 1003 813 870 933 1202 1209 1210 936 569 NEVADA 0 4 1 0 2 4 8 26 23 13 34 29 76 236 143 94 134 74 159 195 273 83 NEW HAMPSHIRE 40 44 18 13 54 38 182 117 213 47 124 86 236 182 225 137 144 131 105 80 109 32 NEW JERSEY 100 273 94 103 146 200 386 240 292 139 405 573 387 503 644 599 255 206 327 285 262 63 NEW MEXICO 0 0 2 5 3 11 42 155 321 119 184 187 332 371 529 385 356 228 200 169 122 106 NEW YORK 213 190 237 221 196 222 885 1104 1124 296 681 1198 1357 1602 1471 1120 736 745 1062 1122 1041 478 NORTH CAROLINA 1 3 7 5 64 307 209 137 373 116 709 1590 2209 1830 1678 1173 1364 1072 1207 1310 1367 595 NORTH DAKOTA 3 12 30 44 95 51 116 158 307 98 303 267 381 371 428 321 404 308 270 231 183 124 OHIO 44 2253 230 264 276 315 832 742 991 364 747 1637 2285 2621 2794 1966 1385 1420 1733 2225 2053 731 OKLAHOMA 0 32 116 133 437 325 1250 1144 4004 668 1680 943 1451 1323 1225 1098 727 1300 1583 1624 1610 639 OREGON 2 2 17 41 56 110 167 153 154 60 230 563 1003 1025 747 668 551 500 359 292 376 182 PENNSYLVANIA 590 448 422 477 667 725 1437 1176 1758 550 1027 1315 1656 1936 1818 1368 722 737 1131 846 916 449 RHODE ISLAND 29 17 11 14 17 20 35 30 18 4 22 33 87 144 112 41 19 18 22 33 18 5 SOUTH CAROLINA 0 40 2 7 16 90 221 206 424 148 403 451 1149 1066 1121 892 554 513 422 545 711 220 SOUTH DAKOTA 0 27 67 63 89 131 446 367 416 149 254 286 490 597 464 426 303 260 326 292 301 207 TENNESSEE 3 18 12 32 95 244 684 481 799 309 932 744 1721 1746 1754 1435 960 2498 1829 1536 1351 505 TEXAS 0 58 38 54 195 665 1581 2107 2757 911 2542 2871 4668 4869 4494 3556 2687 2775 4549 3090 2962 1523 UTAH 0 1 2 6 10 19 33 76 59 53 101 102 213 253 338 275 191 292 242 149 290 93 VERMONT 66 35 10 21 136 47 285 118 305 30 112 97 145 228 194 231 149 135 105 99 94 43 VIRGINIA 16 18 19 39 58 115 301 1426 366 220 372 431 836 1448 1429 1260 1075 706 991 841 833 359 WASHINGTON 0 62 22 65 118 125 177 208 217 107 362 548 781 829 881 743 497 420 382 427 400 190 WEST VIRGINIA 54 40 37 157 228 260 267 169 323 94 261 197 317 328 389 451 612 355 784 609 709 246 WISCONSIN 13 32 52 64 240 245 528 340 505 159 474 460 877 1100 1276 952 940 978 1272 1283 1123 698 WYOMING 0 1 2 11 20 19 34 52 56 13 119 161 411 428 469 227 254 226 201 145 120 60 PUERTO RICO 26 17 4 12 27 59 57 21 94 57 103 88 112 136 173 264 212 84 113 191 235 50 TOTALS 2045 8611 3705 3708 7323 8741 21138 24575 29378 8840 24862 30438 50649 55065 54384 43815 38268 38012 43042 40490 37973 18003
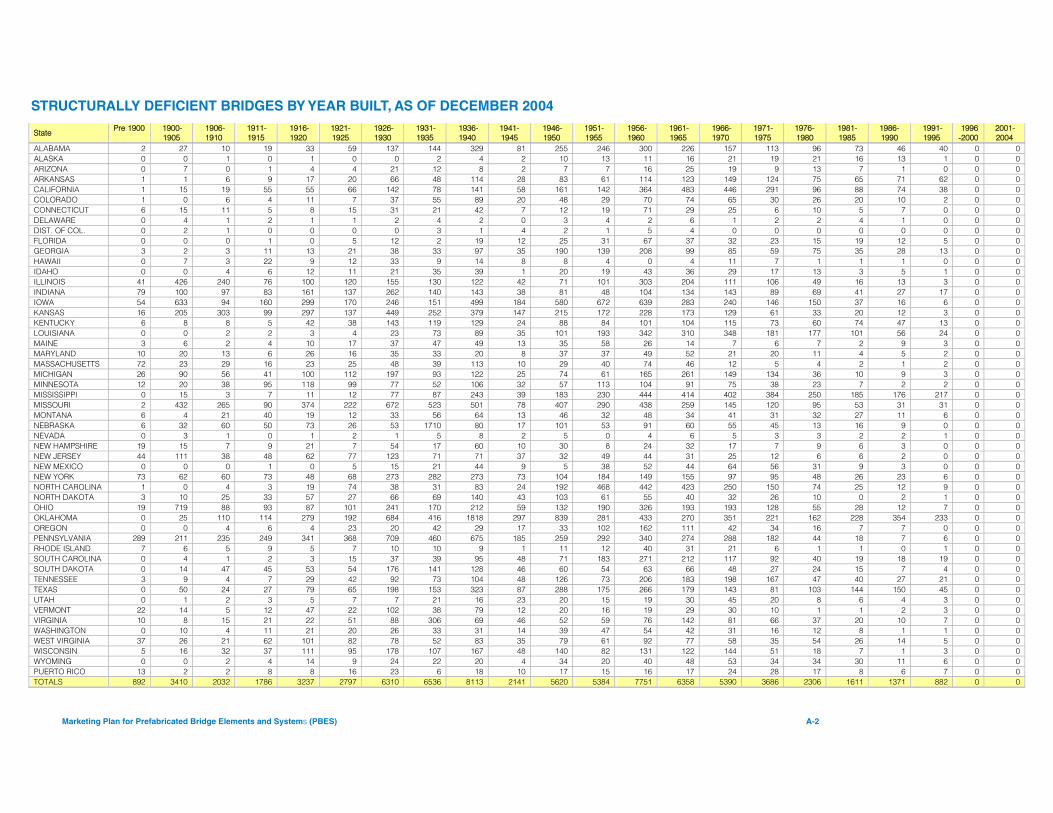
Marketing Plan for Prefabricated Bridge Elements and Systems (PBES) A-2
STRUCTURALLY DEFICIENT BRIDGES BY YEAR BUILT, AS OF DECEMBER 2004
State Pre 1900 1900-
1905 1906-1910
1911-1915
1916-1920
1921-1925
1926-1930
1931-1935
1936-1940
1941-1945
1946-1950
1951-1955
1956-1960
1961-1965
1966-1970
1971-1975
1976-1980
1981-1985
1986-1990
1991-1995
1996-2000
2001-2004
ALABAMA 2 27 10 19 33 59 137 144 329 81 255 246 300 226 157 113 96 73 46 40 0 0 ALASKA 0 0 1 0 1 0 0 2 4 2 10 13 11 16 21 19 21 16 13 1 0 0 ARIZONA 0 7 0 1 4 4 21 12 8 2 7 7 16 25 19 9 13 7 1 0 0 0 ARKANSAS 1 1 6 9 17 20 66 48 114 28 83 61 114 123 149 124 75 65 71 62 0 0 CALIFORNIA 1 15 19 55 55 66 142 78 141 58 161 142 364 483 446 291 96 88 74 38 0 0 COLORADO 1 0 6 4 11 7 37 55 89 20 48 29 70 74 65 30 26 20 10 2 0 0 CONNECTICUT 6 15 11 5 8 15 31 21 42 7 12 19 71 29 25 6 10 5 7 0 0 0 DELAWARE 0 4 1 2 1 1 2 4 2 0 3 4 2 6 1 2 2 4 1 0 0 0 DIST. OF COL. 0 2 1 0 0 0 0 3 1 4 2 1 5 4 0 0 0 0 0 0 0 0 FLORIDA 0 0 0 1 0 5 12 2 19 12 25 31 67 37 32 23 15 19 12 5 0 0 GEORGIA 3 2 3 11 13 21 38 33 97 35 190 139 208 99 85 59 75 35 28 13 0 0 HAWAII 0 7 3 22 9 12 33 9 14 8 8 4 0 4 11 7 1 1 1 0 0 0 IDAHO 0 0 4 6 12 11 21 35 39 1 20 19 43 36 29 17 13 3 5 1 0 0 ILLINOIS 41 426 240 76 100 120 155 130 122 42 71 101 303 204 111 106 49 16 13 3 0 0 INDIANA 79 100 97 83 161 137 262 140 143 38 81 48 104 134 143 89 69 41 27 17 0 0 IOWA 54 633 94 160 299 170 246 151 499 184 580 672 639 283 240 146 150 37 16 6 0 0 KANSAS 16 205 303 99 297 137 449 252 379 147 215 172 228 173 129 61 33 20 12 3 0 0 KENTUCKY 6 8 8 5 42 38 143 119 129 24 88 84 101 104 115 73 60 74 47 13 0 0 LOUISIANA 0 0 2 2 3 4 23 73 89 35 101 193 342 310 348 181 177 101 56 24 0 0 MAINE 3 6 2 4 10 17 37 47 49 13 35 58 26 14 7 6 7 2 9 3 0 0 MARYLAND 10 20 13 6 26 16 35 33 20 8 37 37 49 52 21 20 11 4 5 2 0 0 MASSACHUSETTS 72 23 29 16 23 25 48 39 113 10 29 40 74 46 12 5 4 2 1 2 0 0 MICHIGAN 26 90 56 41 100 112 197 93 122 25 74 61 165 261 149 134 36 10 9 3 0 0 MINNESOTA 12 20 38 95 118 99 77 52 106 32 57 113 104 91 75 38 23 7 2 2 0 0 MISSISSIPPI 0 15 3 7 11 12 77 87 243 39 183 230 444 414 402 384 250 185 176 217 0 0 MISSOURI 2 432 265 90 374 222 672 523 501 78 407 290 438 259 145 120 95 53 31 31 0 0 MONTANA 6 4 21 40 19 12 33 56 64 13 46 32 48 34 41 31 32 27 11 6 0 0 NEBRASKA 6 32 60 50 73 26 53 1710 80 17 101 53 91 60 55 45 13 16 9 0 0 0 NEVADA 0 3 1 0 1 2 1 5 8 2 5 0 4 6 5 3 3 2 2 1 0 0 NEW HAMPSHIRE 19 15 7 9 21 7 54 17 60 10 30 8 24 32 17 7 9 6 3 0 0 0 NEW JERSEY 44 111 38 48 62 77 123 71 71 37 32 49 44 31 25 12 6 6 2 0 0 0 NEW MEXICO 0 0 0 1 0 5 15 21 44 9 5 38 52 44 64 56 31 9 3 0 0 0 NEW YORK 73 62 60 73 48 68 273 282 273 73 104 184 149 155 97 95 48 26 23 6 0 0 NORTH CAROLINA 1 0 4 3 19 74 38 31 83 24 192 468 442 423 250 150 74 25 12 9 0 0 NORTH DAKOTA 3 10 25 33 57 27 66 69 140 43 103 61 55 40 32 26 10 0 2 1 0 0 OHIO 19 719 88 93 87 101 241 170 212 59 132 190 326 193 193 128 55 28 12 7 0 0 OKLAHOMA 0 25 110 114 279 192 684 416 1818 297 839 281 433 270 351 221 162 228 354 233 0 0 OREGON 0 0 4 6 4 23 20 42 29 17 33 102 162 111 42 34 16 7 7 0 0 0 PENNSYLVANIA 289 211 235 249 341 368 709 460 675 185 259 292 340 274 288 182 44 18 7 6 0 0 RHODE ISLAND 7 6 5 9 5 7 10 10 9 1 11 12 40 31 21 6 1 1 0 1 0 0 SOUTH CAROLINA 0 4 1 2 3 15 37 39 95 48 71 183 271 212 117 92 40 19 18 19 0 0 SOUTH DAKOTA 0 14 47 45 53 54 176 141 128 46 60 54 63 66 48 27 24 15 7 4 0 0 TENNESSEE 3 9 4 7 29 42 92 73 104 48 126 73 206 183 198 167 47 40 27 21 0 0 TEXAS 0 50 24 27 79 65 198 153 323 87 288 175 266 179 143 81 103 144 150 45 0 0 UTAH 0 1 2 3 5 7 7 21 16 23 20 15 19 30 45 20 8 6 4 3 0 0 VERMONT 22 14 5 12 47 22 102 38 79 12 20 16 19 29 30 10 1 1 2 3 0 0 VIRGINIA 10 8 15 21 22 51 88 306 69 46 52 59 76 142 81 66 37 20 10 7 0 0 WASHINGTON 0 10 4 11 21 20 26 33 31 14 39 47 54 42 31 16 12 8 1 1 0 0 WEST VIRGINIA 37 26 21 62 101 82 78 52 83 35 79 61 92 77 58 35 54 26 14 5 0 0 WISCONSIN 5 16 32 37 111 95 178 107 167 48 140 82 131 122 144 51 18 7 1 3 0 0 WYOMING 0 0 2 4 14 9 24 22 20 4 34 20 40 48 53 34 34 30 11 6 0 0 PUERTO RICO 13 2 2 8 8 16 23 6 18 10 17 15 16 17 24 28 17 8 6 7 0 0 TOTALS 892 3410 2032 1786 3237 2797 6310 6536 8113 2141 5620 5384 7751 6358 5390 3686 2306 1611 1371 882 0 0
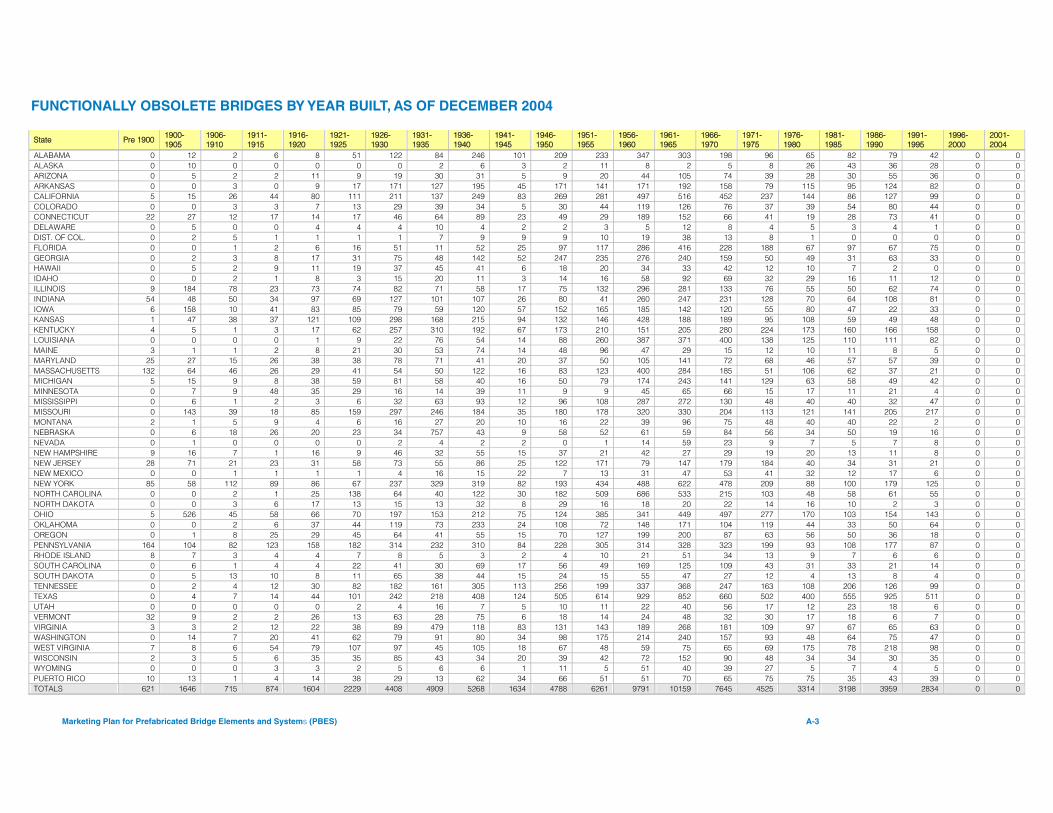
Marketing Plan for Prefabricated Bridge Elements and Systems (PBES) A-3
FUNCTIONALLY OBSOLETE BRIDGES BY YEAR BUILT, AS OF DECEMBER 2004
State Pre 1900 1900-1905
1906-1910
1911-1915
1916-1920
1921-1925
1926-1930
1931-1935
1936-1940
1941-1945
1946-1950
1951-1955
1956-1960
1961-1965
1966-1970
1971-1975
1976-1980
1981-1985
1986-1990
1991-1995
1996-2000
2001-2004
ALABAMA 0 12 2 6 8 51 122 84 246 101 209 233 347 303 198 96 65 82 79 42 0 0 ALASKA 0 10 0 0 0 0 0 2 6 3 2 11 8 2 5 8 26 43 36 28 0 0 ARIZONA 0 5 2 2 11 9 19 30 31 5 9 20 44 105 74 39 28 30 55 36 0 0 ARKANSAS 0 0 3 0 9 17 171 127 195 45 171 141 171 192 158 79 115 95 124 82 0 0 CALIFORNIA 5 15 26 44 80 111 211 137 249 83 269 281 497 516 452 237 144 86 127 99 0 0 COLORADO 0 0 3 3 7 13 29 39 34 5 30 44 119 126 76 37 39 54 80 44 0 0 CONNECTICUT 22 27 12 17 14 17 46 64 89 23 49 29 189 152 66 41 19 28 73 41 0 0 DELAWARE 0 5 0 0 4 4 4 10 4 2 2 3 5 12 8 4 5 3 4 1 0 0 DIST. OF COL. 0 2 5 1 1 1 1 7 9 9 9 10 19 38 13 8 1 0 0 0 0 0 FLORIDA 0 0 1 2 6 16 51 11 52 25 97 117 286 416 228 188 67 97 67 75 0 0 GEORGIA 0 2 3 8 17 31 75 48 142 52 247 235 276 240 159 50 49 31 63 33 0 0 HAWAII 0 5 2 9 11 19 37 45 41 6 18 20 34 33 42 12 10 7 2 0 0 0 IDAHO 0 0 2 1 8 3 15 20 11 3 14 16 58 92 69 32 29 16 11 12 0 0 ILLINOIS 9 184 78 23 73 74 82 71 58 17 75 132 296 281 133 76 55 50 62 74 0 0 INDIANA 54 48 50 34 97 69 127 101 107 26 80 41 260 247 231 128 70 64 108 81 0 0 IOWA 6 158 10 41 83 85 79 59 120 57 152 165 185 142 120 55 80 47 22 33 0 0 KANSAS 1 47 38 37 121 109 298 168 215 94 132 146 428 188 189 95 108 59 49 48 0 0 KENTUCKY 4 5 1 3 17 62 257 310 192 67 173 210 151 205 280 224 173 160 166 158 0 0 LOUISIANA 0 0 0 0 1 9 22 76 54 14 88 260 387 371 400 138 125 110 111 82 0 0 MAINE 3 1 1 2 8 21 30 53 74 14 48 96 47 29 15 12 10 11 8 5 0 0 MARYLAND 25 27 15 26 38 38 78 71 41 20 37 50 105 141 72 68 46 57 57 39 0 0 MASSACHUSETTS 132 64 46 26 29 41 54 50 122 16 83 123 400 284 185 51 106 62 37 21 0 0 MICHIGAN 5 15 9 8 38 59 81 58 40 16 50 79 174 243 141 129 63 58 49 42 0 0 MINNESOTA 0 7 9 48 35 29 16 14 39 11 9 9 45 65 66 15 17 11 21 4 0 0 MISSISSIPPI 0 6 1 2 3 6 32 63 93 12 96 108 287 272 130 48 40 40 32 47 0 0 MISSOURI 0 143 39 18 85 159 297 246 184 35 180 178 320 330 204 113 121 141 205 217 0 0 MONTANA 2 1 5 9 4 6 16 27 20 10 16 22 39 96 75 48 40 40 22 2 0 0 NEBRASKA 0 6 18 26 20 23 34 757 43 9 58 52 61 59 84 56 34 50 19 16 0 0 NEVADA 0 1 0 0 0 0 2 4 2 2 0 1 14 59 23 9 7 5 7 8 0 0 NEW HAMPSHIRE 9 16 7 1 16 9 46 32 55 15 37 21 42 27 29 19 20 13 11 8 0 0 NEW JERSEY 28 71 21 23 31 58 73 55 86 25 122 171 79 147 179 184 40 34 31 21 0 0 NEW MEXICO 0 0 1 1 1 1 4 16 15 22 7 13 31 47 53 41 32 12 17 6 0 0 NEW YORK 85 58 112 89 86 67 237 329 319 82 193 434 488 622 478 209 88 100 179 125 0 0 NORTH CAROLINA 0 0 2 1 25 138 64 40 122 30 182 509 686 533 215 103 48 58 61 55 0 0 NORTH DAKOTA 0 0 3 6 17 13 15 13 32 8 29 16 18 20 22 14 16 10 2 3 0 0 OHIO 5 526 45 58 66 70 197 153 212 75 124 385 341 449 497 277 170 103 154 143 0 0 OKLAHOMA 0 0 2 6 37 44 119 73 233 24 108 72 148 171 104 119 44 33 50 64 0 0 OREGON 0 1 8 25 29 45 64 41 55 15 70 127 199 200 87 63 56 50 36 18 0 0 PENNSYLVANIA 164 104 82 123 158 182 314 232 310 84 228 305 314 328 323 199 93 108 177 87 0 0 RHODE ISLAND 8 7 3 4 4 7 8 5 3 2 4 10 21 51 34 13 9 7 6 6 0 0 SOUTH CAROLINA 0 6 1 4 4 22 41 30 69 17 56 49 169 125 109 43 31 33 21 14 0 0 SOUTH DAKOTA 0 5 13 10 8 11 65 38 44 15 24 15 55 47 27 12 4 13 8 4 0 0 TENNESSEE 0 2 4 12 30 82 182 161 305 113 256 199 337 368 247 163 108 206 126 99 0 0 TEXAS 0 4 7 14 44 101 242 218 408 124 505 614 929 852 660 502 400 555 925 511 0 0 UTAH 0 0 0 0 0 2 4 16 7 5 10 11 22 40 56 17 12 23 18 6 0 0 VERMONT 32 9 2 2 26 13 63 28 75 6 18 14 24 48 32 30 17 18 6 7 0 0 VIRGINIA 3 3 2 12 22 38 89 479 118 83 131 143 189 268 181 109 97 67 65 63 0 0 WASHINGTON 0 14 7 20 41 62 79 91 80 34 98 175 214 240 157 93 48 64 75 47 0 0 WEST VIRGINIA 7 8 6 54 79 107 97 45 105 18 67 48 59 75 65 69 175 78 218 98 0 0 WISCONSIN 2 3 5 6 35 35 85 43 34 20 39 42 72 152 90 48 34 34 30 35 0 0 WYOMING 0 0 0 3 3 2 5 6 6 1 11 5 51 40 39 27 5 7 4 5 0 0 PUERTO RICO 10 13 1 4 14 38 29 13 62 34 66 51 51 70 65 75 75 35 43 39 0 0 TOTALS 621 1646 715 874 1604 2229 4408 4909 5268 1634 4788 6261 9791 10159 7645 4525 3314 3198 3959 2834 0 0
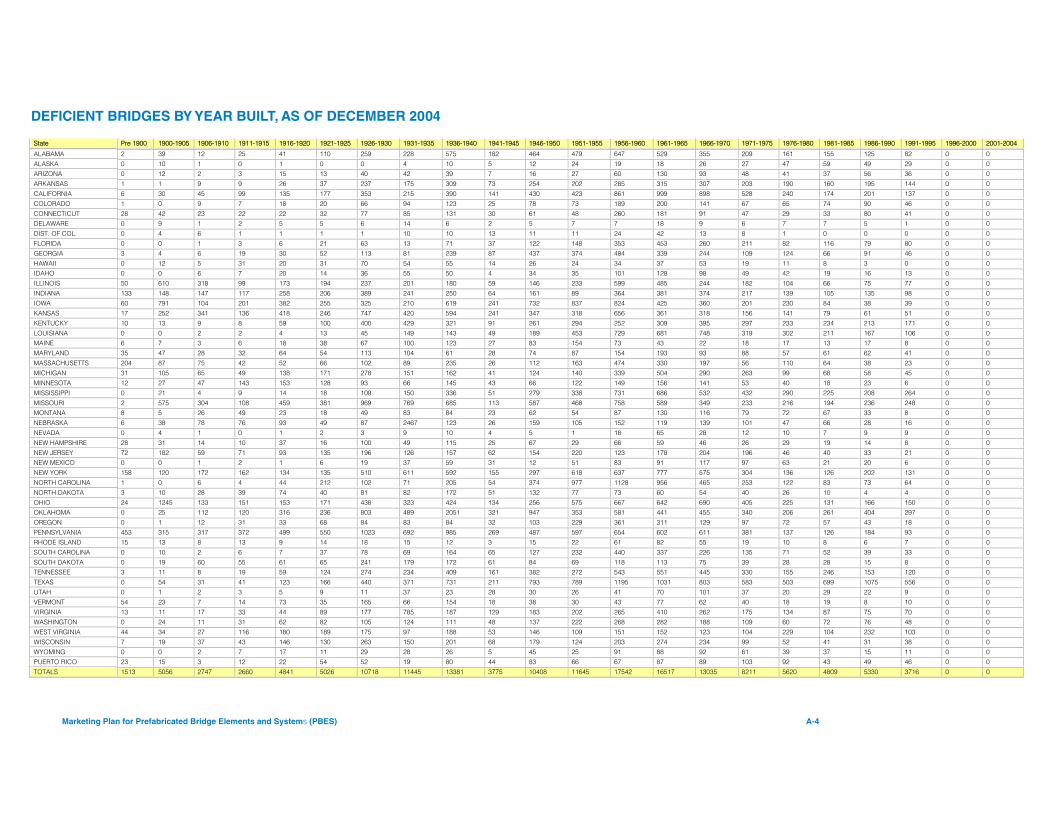
Marketing Plan for Prefabricated Bridge Elements and Systems (PBES) A-4
DEFICIENT BRIDGES BY YEAR BUILT, AS OF DECEMBER 2004
State Pre 1900 1900-1905 1906-1910 1911-1915 1916-1920 1921-1925 1926-1930 1931-1935 1936-1940 1941-1945 1946-1950 1951-1955 1956-1960 1961-1965 1966-1970 1971-1975 1976-1980 1981-1985 1986-1990 1991-1995 1996-2000 2001-2004
ALABAMA 2 39 12 25 41 110 259 228 575 182 464 479 647 529 355 209 161 155 125 82 0 0
ALASKA 0 10 1 0 1 0 0 4 10 5 12 24 19 18 26 27 47 59 49 29 0 0 ARIZONA 0 12 2 3 15 13 40 42 39 7 16 27 60 130 93 48 41 37 56 36 0 0
ARKANSAS 1 1 9 9 26 37 237 175 309 73 254 202 285 315 307 203 190 160 195 144 0 0
CALIFORNIA 6 30 45 99 135 177 353 215 390 141 430 423 861 999 898 528 240 174 201 137 0 0
COLORADO 1 0 9 7 18 20 66 94 123 25 78 73 189 200 141 67 65 74 90 46 0 0
CONNECTICUT 28 42 23 22 22 32 77 85 131 30 61 48 260 181 91 47 29 33 80 41 0 0 DELAWARE 0 9 1 2 5 5 6 14 6 2 5 7 7 18 9 6 7 7 5 1 0 0
DIST. OF COL. 0 4 6 1 1 1 1 10 10 13 11 11 24 42 13 8 1 0 0 0 0 0
FLORIDA 0 0 1 3 6 21 63 13 71 37 122 148 353 453 260 211 82 116 79 80 0 0
GEORGIA 3 4 6 19 30 52 113 81 239 87 437 374 484 339 244 109 124 66 91 46 0 0
HAWAII 0 12 5 31 20 31 70 54 55 14 26 24 34 37 53 19 11 8 3 0 0 0 IDAHO 0 0 6 7 20 14 36 55 50 4 34 35 101 128 98 49 42 19 16 13 0 0
ILLINOIS 50 610 318 99 173 194 237 201 180 59 146 233 599 485 244 182 104 66 75 77 0 0
INDIANA 133 148 147 117 258 206 389 241 250 64 161 89 364 381 374 217 139 105 135 98 0 0
IOWA 60 791 104 201 382 255 325 210 619 241 732 837 824 425 360 201 230 84 38 39 0 0
KANSAS 17 252 341 136 418 246 747 420 594 241 347 318 656 361 318 156 141 79 61 51 0 0
KENTUCKY 10 13 9 8 59 100 400 429 321 91 261 294 252 309 395 297 233 234 213 171 0 0
LOUISIANA 0 0 2 2 4 13 45 149 143 49 189 453 729 681 748 319 302 211 167 106 0 0 MAINE 6 7 3 6 18 38 67 100 123 27 83 154 73 43 22 18 17 13 17 8 0 0
MARYLAND 35 47 28 32 64 54 113 104 61 28 74 87 154 193 93 88 57 61 62 41 0 0
MASSACHUSETTS 204 87 75 42 52 66 102 89 235 26 112 163 474 330 197 56 110 64 38 23 0 0
MICHIGAN 31 105 65 49 138 171 278 151 162 41 124 140 339 504 290 263 99 68 58 45 0 0
MINNESOTA 12 27 47 143 153 128 93 66 145 43 66 122 149 156 141 53 40 18 23 6 0 0
MISSISSIPPI 0 21 4 9 14 18 109 150 336 51 279 338 731 686 532 432 290 225 208 264 0 0
MISSOURI 2 575 304 108 459 381 969 769 685 113 587 468 758 589 349 233 216 194 236 248 0 0 MONTANA 8 5 26 49 23 18 49 83 84 23 62 54 87 130 116 79 72 67 33 8 0 0
NEBRASKA 6 38 78 76 93 49 87 2467 123 26 159 105 152 119 139 101 47 66 28 16 0 0
NEVADA 0 4 1 0 1 2 3 9 10 4 5 1 18 65 28 12 10 7 9 9 0 0
NEW HAMPSHIRE 28 31 14 10 37 16 100 49 115 25 67 29 66 59 46 26 29 19 14 8 0 0
NEW JERSEY 72 182 59 71 93 135 196 126 157 62 154 220 123 178 204 196 46 40 33 21 0 0 NEW MEXICO 0 0 1 2 1 6 19 37 59 31 12 51 83 91 117 97 63 21 20 6 0 0
NEW YORK 158 120 172 162 134 135 510 611 592 155 297 618 637 777 575 304 136 126 202 131 0 0
NORTH CAROLINA 1 0 6 4 44 212 102 71 205 54 374 977 1128 956 465 253 122 83 73 64 0 0
NORTH DAKOTA 3 10 28 39 74 40 81 82 172 51 132 77 73 60 54 40 26 10 4 4 0 0
OHIO 24 1245 133 151 153 171 438 323 424 134 256 575 667 642 690 405 225 131 166 150 0 0 OKLAHOMA 0 25 112 120 316 236 803 489 2051 321 947 353 581 441 455 340 206 261 404 297 0 0
OREGON 0 1 12 31 33 68 84 83 84 32 103 229 361 311 129 97 72 57 43 18 0 0
PENNSYLVANIA 453 315 317 372 499 550 1023 692 985 269 487 597 654 602 611 381 137 126 184 93 0 0
RHODE ISLAND 15 13 8 13 9 14 18 15 12 3 15 22 61 82 55 19 10 8 6 7 0 0
SOUTH CAROLINA 0 10 2 6 7 37 78 69 164 65 127 232 440 337 226 135 71 52 39 33 0 0
SOUTH DAKOTA 0 19 60 55 61 65 241 179 172 61 84 69 118 113 75 39 28 28 15 8 0 0 TENNESSEE 3 11 8 19 59 124 274 234 409 161 382 272 543 551 445 330 155 246 153 120 0 0
TEXAS 0 54 31 41 123 166 440 371 731 211 793 789 1195 1031 803 583 503 699 1075 556 0 0
UTAH 0 1 2 3 5 9 11 37 23 28 30 26 41 70 101 37 20 29 22 9 0 0
VERMONT 54 23 7 14 73 35 165 66 154 18 38 30 43 77 62 40 18 19 8 10 0 0
VIRGINIA 13 11 17 33 44 89 177 785 187 129 183 202 265 410 262 175 134 87 75 70 0 0
WASHINGTON 0 24 11 31 62 82 105 124 111 48 137 222 268 282 188 109 60 72 76 48 0 0
WEST VIRGINIA 44 34 27 116 180 189 175 97 188 53 146 109 151 152 123 104 229 104 232 103 0 0
WISCONSIN 7 19 37 43 146 130 263 150 201 68 179 124 203 274 234 99 52 41 31 38 0 0 WYOMING 0 0 2 7 17 11 29 28 26 5 45 25 91 88 92 61 39 37 15 11 0 0
PUERTO RICO 23 15 3 12 22 54 52 19 80 44 83 66 67 87 89 103 92 43 49 46 0 0
TOTALS 1513 5056 2747 2660 4841 5026 10718 11445 13381 3775 10408 11645 17542 16517 13035 8211 5620 4809 5330 3716 0 0
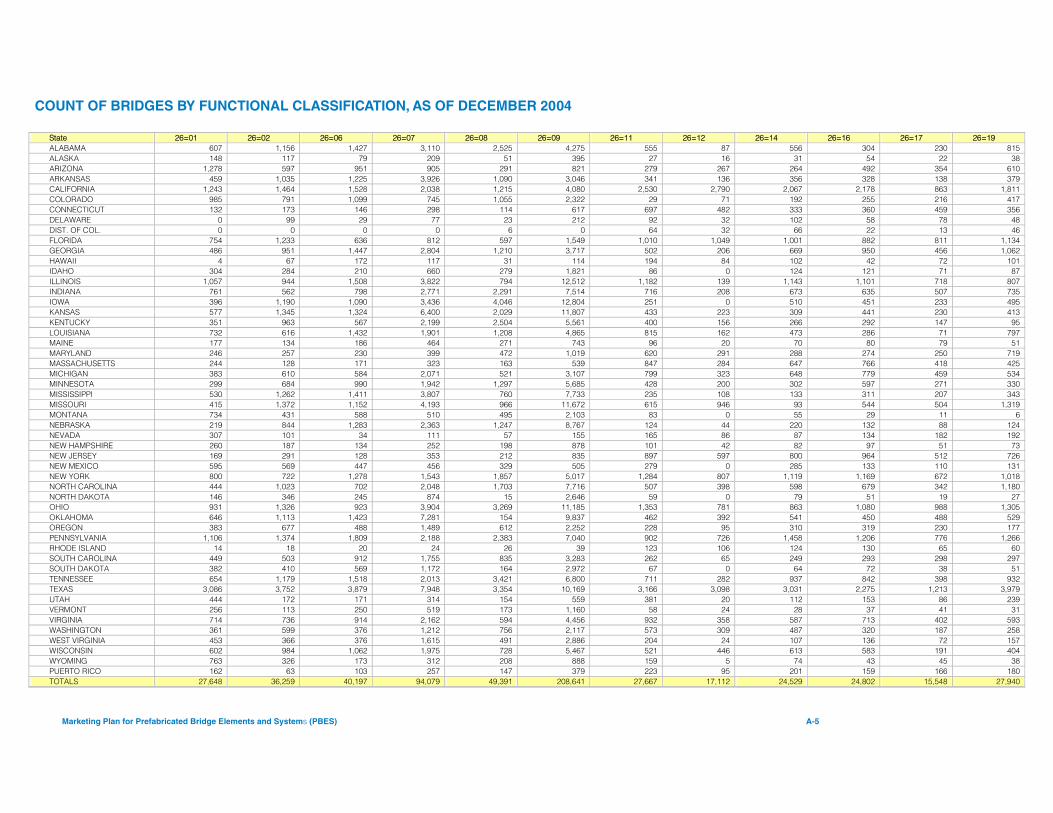
Marketing Plan for Prefabricated Bridge Elements and Systems (PBES) A-5
COUNT OF BRIDGES BY FUNCTIONAL CLASSIFICATION, AS OF DECEMBER 2004
State 26=01 26=02 26=06 26=07 26=08 26=09 26=11 26=12 26=14 26=16 26=17 26=19 ALABAMA 607 1,156 1,427 3,110 2,525 4,275 555 87 556 304 230 815 ALASKA 148 117 79 209 51 395 27 16 31 54 22 38 ARIZONA 1,278 597 951 905 291 821 279 267 264 492 354 610 ARKANSAS 459 1,035 1,225 3,926 1,090 3,046 341 136 356 328 138 379 CALIFORNIA 1,243 1,464 1,528 2,038 1,215 4,080 2,530 2,790 2,067 2,178 863 1,811 COLORADO 985 791 1,099 745 1,055 2,322 29 71 192 255 216 417 CONNECTICUT 132 173 146 298 114 617 697 482 333 360 459 356 DELAWARE 0 99 29 77 23 212 92 32 102 58 78 48 DIST. OF COL. 0 0 0 0 6 0 64 32 66 22 13 46 FLORIDA 754 1,233 636 812 597 1,549 1,010 1,049 1,001 882 811 1,134 GEORGIA 486 951 1,447 2,804 1,210 3,717 502 206 669 950 456 1,062 HAWAII 4 67 172 117 31 114 194 84 102 42 72 101 IDAHO 304 284 210 660 279 1,821 86 0 124 121 71 87 ILLINOIS 1,057 944 1,508 3,822 794 12,512 1,182 139 1,143 1,101 718 807 INDIANA 761 562 798 2,771 2,291 7,514 716 208 673 635 507 735 IOWA 396 1,190 1,090 3,436 4,046 12,804 251 0 510 451 233 495 KANSAS 577 1,345 1,324 6,400 2,029 11,807 433 223 309 441 230 413 KENTUCKY 351 963 567 2,199 2,504 5,561 400 156 266 292 147 95 LOUISIANA 732 616 1,432 1,901 1,208 4,865 815 162 473 286 71 797 MAINE 177 134 186 464 271 743 96 20 70 80 79 51 MARYLAND 246 257 230 399 472 1,019 620 291 288 274 250 719 MASSACHUSETTS 244 128 171 323 163 539 847 284 647 766 418 425 MICHIGAN 383 610 584 2,071 521 3,107 799 323 648 779 459 534 MINNESOTA 299 684 990 1,942 1,297 5,685 428 200 302 597 271 330 MISSISSIPPI 530 1,262 1,411 3,807 760 7,733 235 108 133 311 207 343 MISSOURI 415 1,372 1,152 4,193 966 11,672 615 946 93 544 504 1,319 MONTANA 734 431 588 510 495 2,103 83 0 55 29 11 6 NEBRASKA 219 844 1,283 2,363 1,247 8,767 124 44 220 132 88 124 NEVADA 307 101 34 111 57 155 165 86 87 134 182 192 NEW HAMPSHIRE 260 187 134 252 198 878 101 42 82 97 51 73 NEW JERSEY 169 291 128 353 212 835 897 597 800 964 512 726 NEW MEXICO 595 569 447 456 329 505 279 0 285 133 110 131 NEW YORK 800 722 1,278 1,543 1,857 5,017 1,284 807 1,119 1,169 672 1,018 NORTH CAROLINA 444 1,023 702 2,048 1,703 7,716 507 398 598 679 342 1,180 NORTH DAKOTA 146 346 245 874 15 2,646 59 0 79 51 19 27 OHIO 931 1,326 923 3,904 3,269 11,185 1,353 781 863 1,080 988 1,305 OKLAHOMA 646 1,113 1,423 7,281 154 9,837 462 392 541 450 488 529 OREGON 383 677 488 1,489 612 2,252 228 95 310 319 230 177 PENNSYLVANIA 1,106 1,374 1,809 2,188 2,383 7,040 902 726 1,458 1,206 776 1,266 RHODE ISLAND 14 18 20 24 26 39 123 106 124 130 65 60 SOUTH CAROLINA 449 503 912 1,755 835 3,283 262 65 249 293 298 297 SOUTH DAKOTA 382 410 569 1,172 164 2,972 67 0 64 72 38 51 TENNESSEE 654 1,179 1,518 2,013 3,421 6,800 711 282 937 842 398 932 TEXAS 3,086 3,752 3,879 7,948 3,354 10,169 3,166 3,098 3,031 2,275 1,213 3,979 UTAH 444 172 171 314 154 559 381 20 112 153 86 239 VERMONT 256 113 250 519 173 1,160 58 24 28 37 41 31 VIRGINIA 714 736 914 2,162 594 4,456 932 358 587 713 402 593 WASHINGTON 361 599 376 1,212 756 2,117 573 309 487 320 187 258 WEST VIRGINIA 453 366 376 1,615 491 2,886 204 24 107 136 72 157 WISCONSIN 602 984 1,062 1,975 728 5,467 521 446 613 583 191 404 WYOMING 763 326 173 312 208 888 159 5 74 43 45 38 PUERTO RICO 162 63 103 257 147 379 223 95 201 159 166 180 TOTALS 27,648 36,259 40,197 94,079 49,391 208,641 27,667 17,112 24,529 24,802 15,548 27,940
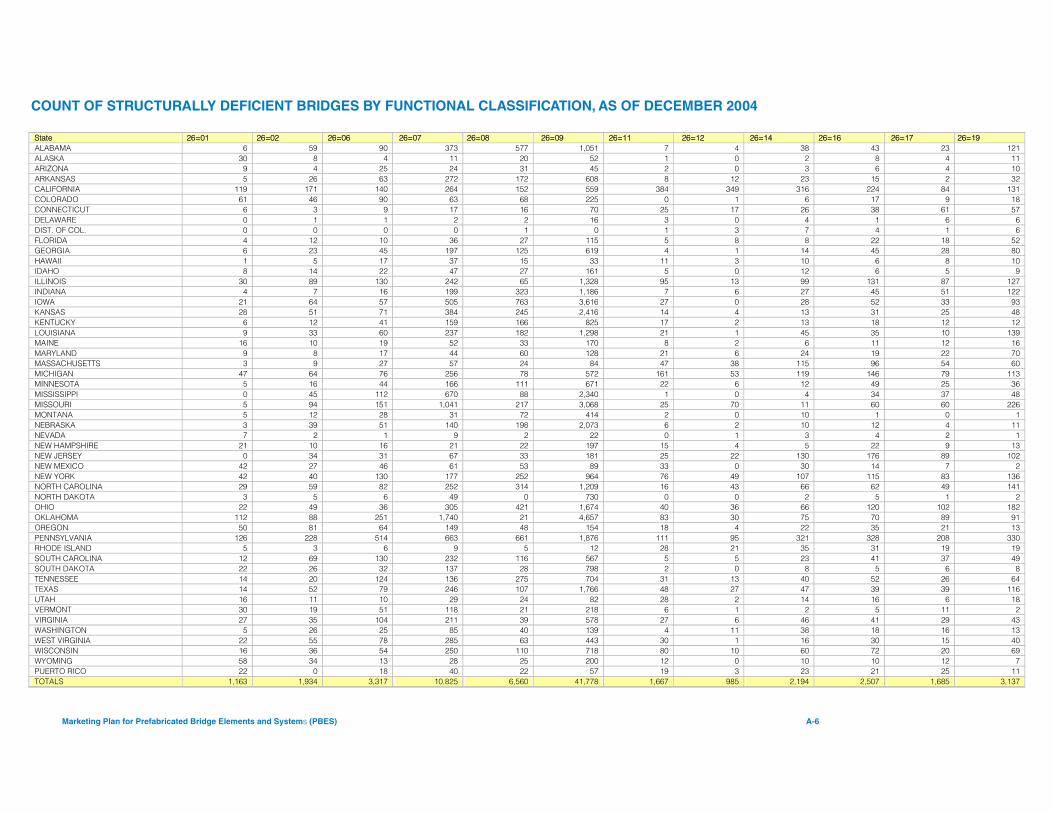
Marketing Plan for Prefabricated Bridge Elements and Systems (PBES) A-6
COUNT OF STRUCTURALLY DEFICIENT BRIDGES BY FUNCTIONAL CLASSIFICATION, AS OF DECEMBER 2004
State 26=01 26=02 26=06 26=07 26=08 26=09 26=11 26=12 26=14 26=16 26=17 26=19 ALABAMA 6 59 90 373 577 1,051 7 4 38 43 23 121 ALASKA 30 8 4 11 20 52 1 0 2 8 4 11 ARIZONA 9 4 25 24 31 45 2 0 3 6 4 10 ARKANSAS 5 26 63 272 172 608 8 12 23 15 2 32 CALIFORNIA 119 171 140 264 152 559 384 349 316 224 84 131 COLORADO 61 46 90 63 68 225 0 1 6 17 9 18 CONNECTICUT 6 3 9 17 16 70 25 17 26 38 61 57 DELAWARE 0 1 1 2 2 16 3 0 4 1 6 6 DIST. OF COL. 0 0 0 0 1 0 1 3 7 4 1 6 FLORIDA 4 12 10 36 27 115 5 8 8 22 18 52 GEORGIA 6 23 45 197 125 619 4 1 14 45 28 80 HAWAII 1 5 17 37 15 33 11 3 10 6 8 10 IDAHO 8 14 22 47 27 161 5 0 12 6 5 9 ILLINOIS 30 89 130 242 65 1,328 95 13 99 131 87 127 INDIANA 4 7 16 199 323 1,186 7 6 27 45 51 122 IOWA 21 64 57 505 763 3,616 27 0 28 52 33 93 KANSAS 28 51 71 384 245 2,416 14 4 13 31 25 48 KENTUCKY 6 12 41 159 166 825 17 2 13 18 12 12 LOUISIANA 9 33 60 237 182 1,298 21 1 45 35 10 139 MAINE 16 10 19 52 33 170 8 2 6 11 12 16 MARYLAND 9 8 17 44 60 128 21 6 24 19 22 70 MASSACHUSETTS 3 9 27 57 24 84 47 38 115 96 54 60 MICHIGAN 47 64 76 256 78 572 161 53 119 146 79 113 MINNESOTA 5 16 44 166 111 671 22 6 12 49 25 36 MISSISSIPPI 0 45 112 670 88 2,340 1 0 4 34 37 48 MISSOURI 5 94 151 1,041 217 3,068 25 70 11 60 60 226 MONTANA 5 12 28 31 72 414 2 0 10 1 0 1 NEBRASKA 3 39 51 140 198 2,073 6 2 10 12 4 11 NEVADA 7 2 1 9 2 22 0 1 3 4 2 1 NEW HAMPSHIRE 21 10 16 21 22 197 15 4 5 22 9 13 NEW JERSEY 0 34 31 67 33 181 25 22 130 176 89 102 NEW MEXICO 42 27 46 61 53 89 33 0 30 14 7 2 NEW YORK 42 40 130 177 252 964 76 49 107 115 83 136 NORTH CAROLINA 29 59 82 252 314 1,209 16 43 66 62 49 141 NORTH DAKOTA 3 5 6 49 0 730 0 0 2 5 1 2 OHIO 22 49 36 305 421 1,674 40 36 66 120 102 182 OKLAHOMA 112 88 251 1,740 21 4,657 83 30 75 70 89 91 OREGON 50 81 64 149 48 154 18 4 22 35 21 13 PENNSYLVANIA 126 228 514 663 661 1,876 111 95 321 328 208 330 RHODE ISLAND 5 3 6 9 5 12 28 21 35 31 19 19 SOUTH CAROLINA 12 69 130 232 116 567 5 5 23 41 37 49 SOUTH DAKOTA 22 26 32 137 28 798 2 0 8 5 6 8 TENNESSEE 14 20 124 136 275 704 31 13 40 52 26 64 TEXAS 14 52 79 246 107 1,766 48 27 47 39 39 116 UTAH 16 11 10 29 24 82 28 2 14 16 6 18 VERMONT 30 19 51 118 21 218 6 1 2 5 11 2 VIRGINIA 27 35 104 211 39 578 27 6 46 41 29 43 WASHINGTON 5 26 25 85 40 139 4 11 38 18 16 13 WEST VIRGINIA 22 55 78 285 63 443 30 1 16 30 15 40 WISCONSIN 16 36 54 250 110 718 80 10 60 72 20 69 WYOMING 58 34 13 28 25 200 12 0 10 10 12 7 PUERTO RICO 22 0 18 40 22 57 19 3 23 21 25 11 TOTALS 1,163 1,934 3,317 10,825 6,560 41,778 1,667 985 2,194 2,507 1,685 3,137
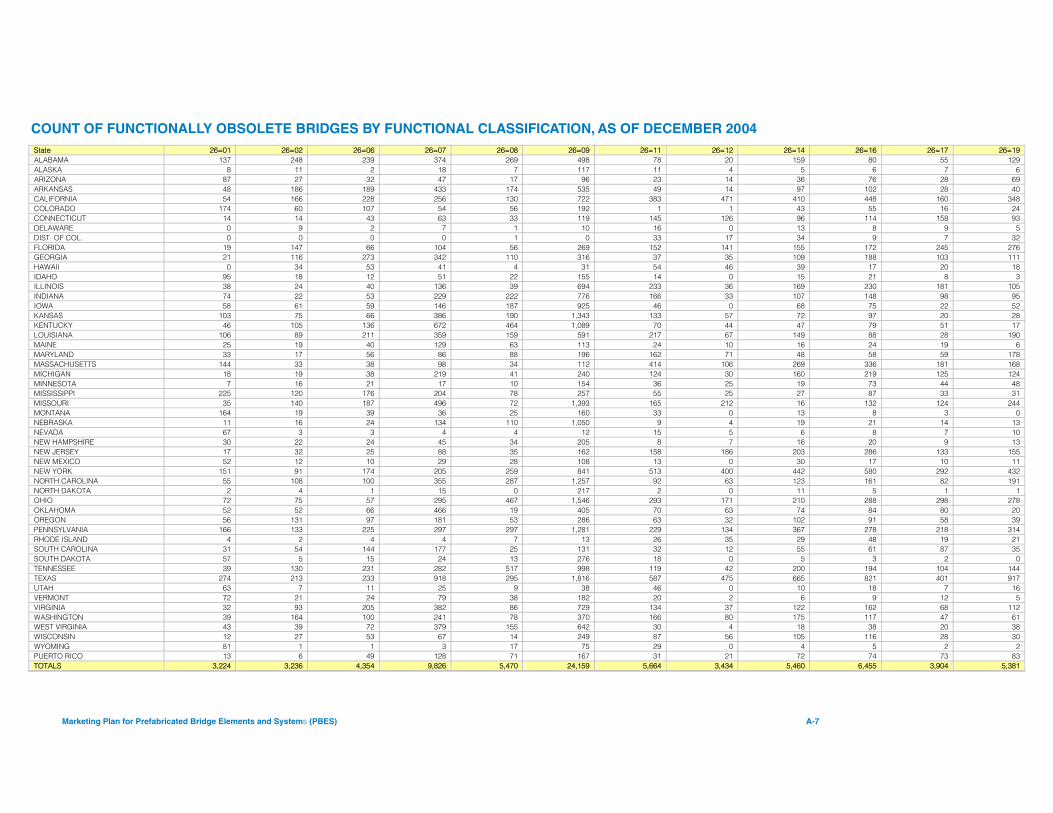
Marketing Plan for Prefabricated Bridge Elements and Systems (PBES) A-7
COUNT OF FUNCTIONALLY OBSOLETE BRIDGES BY FUNCTIONAL CLASSIFICATION, AS OF DECEMBER 2004 State 26=01 26=02 26=06 26=07 26=08 26=09 26=11 26=12 26=14 26=16 26=17 26=19 ALABAMA 137 248 239 374 269 498 78 20 159 80 55 129 ALASKA 8 11 2 18 7 117 11 4 5 6 7 6 ARIZONA 87 27 32 47 17 96 23 14 36 76 28 69 ARKANSAS 48 186 189 433 174 535 49 14 97 102 28 40 CALIFORNIA 54 166 228 256 130 722 383 471 410 448 160 348 COLORADO 174 60 107 54 56 192 1 1 43 55 16 24 CONNECTICUT 14 14 43 63 33 119 145 126 96 114 158 93 DELAWARE 0 9 2 7 1 10 16 0 13 8 9 5 DIST. OF COL. 0 0 0 0 1 0 33 17 34 9 7 32 FLORIDA 19 147 66 104 56 269 152 141 155 172 245 276 GEORGIA 21 116 273 342 110 316 37 35 109 188 103 111 HAWAII 0 34 53 41 4 31 54 46 39 17 20 18 IDAHO 95 18 12 51 22 155 14 0 15 21 8 3 ILLINOIS 38 24 40 136 39 694 233 36 169 230 181 105 INDIANA 74 22 53 229 222 776 166 33 107 148 98 95 IOWA 58 61 59 146 187 925 46 0 68 75 22 52 KANSAS 103 75 66 386 190 1,343 133 57 72 97 20 28 KENTUCKY 46 105 136 672 464 1,089 70 44 47 79 51 17 LOUISIANA 106 89 211 359 159 591 217 67 149 88 28 190 MAINE 25 19 40 129 63 113 24 10 16 24 19 6 MARYLAND 33 17 56 86 88 196 162 71 48 58 59 178 MASSACHUSETTS 144 33 38 98 34 112 414 106 269 336 181 168 MICHIGAN 18 19 38 219 41 240 124 30 160 219 125 124 MINNESOTA 7 16 21 17 10 154 36 25 19 73 44 48 MISSISSIPPI 225 120 176 204 78 257 55 25 27 87 33 31 MISSOURI 35 140 187 496 72 1,393 165 212 16 132 124 244 MONTANA 164 19 39 36 25 160 33 0 13 8 3 0 NEBRASKA 11 16 24 134 110 1,050 9 4 19 21 14 13 NEVADA 67 3 3 4 4 12 15 5 6 8 7 10 NEW HAMPSHIRE 30 22 24 45 34 205 8 7 16 20 9 13 NEW JERSEY 17 32 25 88 35 162 158 186 203 286 133 155 NEW MEXICO 52 12 10 29 28 108 13 0 30 17 10 11 NEW YORK 151 91 174 205 259 841 513 400 442 580 292 432 NORTH CAROLINA 55 108 100 355 287 1,257 92 63 123 161 82 191 NORTH DAKOTA 2 4 1 15 0 217 2 0 11 5 1 1 OHIO 72 75 57 295 467 1,546 293 171 210 288 298 278 OKLAHOMA 52 52 66 466 19 405 70 63 74 84 80 20 OREGON 56 131 97 181 53 286 63 32 102 91 58 39 PENNSYLVANIA 166 133 225 297 297 1,281 229 134 367 278 218 314 RHODE ISLAND 4 2 4 4 7 13 26 35 29 48 19 21 SOUTH CAROLINA 31 54 144 177 25 131 32 12 55 61 87 35 SOUTH DAKOTA 57 5 15 24 13 276 18 0 5 3 2 0 TENNESSEE 39 130 231 282 517 998 119 42 200 194 104 144 TEXAS 274 213 233 918 295 1,816 587 475 665 821 401 917 UTAH 63 7 11 25 9 38 46 0 10 18 7 16 VERMONT 72 21 24 79 38 182 20 2 6 9 12 5 VIRGINIA 32 93 205 382 86 729 134 37 122 162 68 112 WASHINGTON 39 164 100 241 78 370 166 80 175 117 47 61 WEST VIRGINIA 43 39 72 379 155 642 30 4 18 38 20 38 WISCONSIN 12 27 53 67 14 249 87 56 105 116 28 30 WYOMING 81 1 1 3 17 75 29 0 4 5 2 2 PUERTO RICO 13 6 49 128 71 167 31 21 72 74 73 83 TOTALS 3,224 3,236 4,354 9,826 5,470 24,159 5,664 3,434 5,460 6,455 3,904 5,381
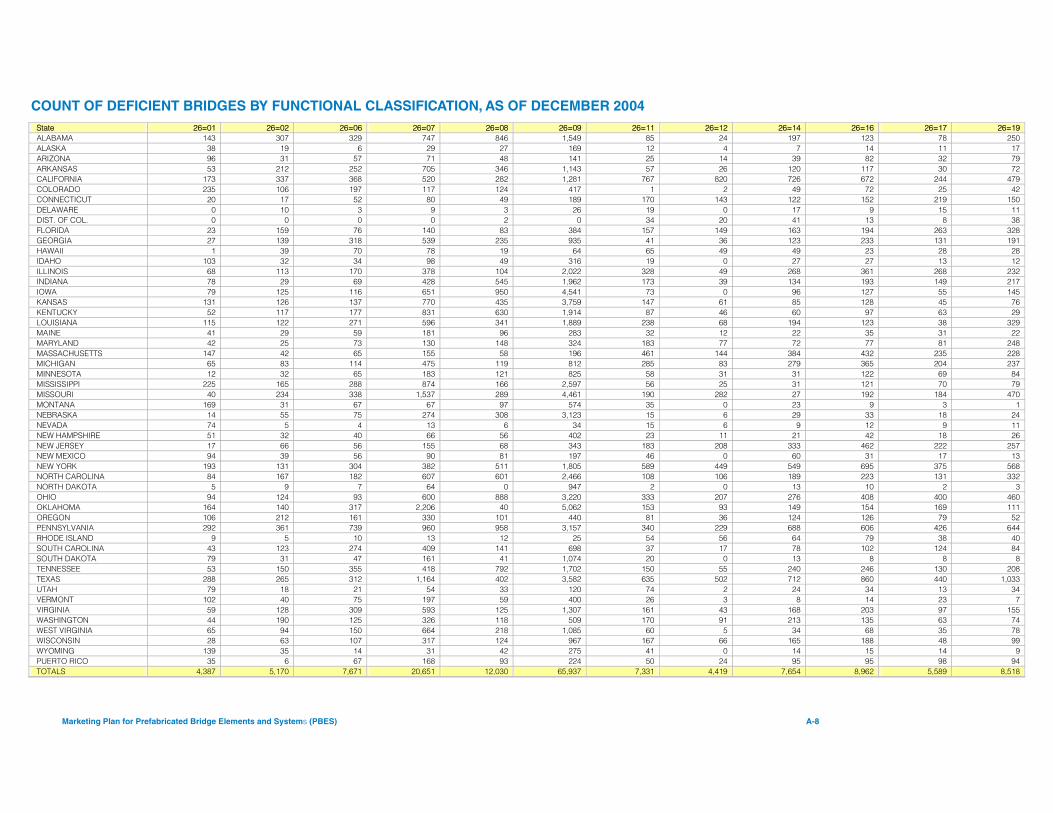
Marketing Plan for Prefabricated Bridge Elements and Systems (PBES) A-8
COUNT OF DEFICIENT BRIDGES BY FUNCTIONAL CLASSIFICATION, AS OF DECEMBER 2004 State 26=01 26=02 26=06 26=07 26=08 26=09 26=11 26=12 26=14 26=16 26=17 26=19 ALABAMA 143 307 329 747 846 1,549 85 24 197 123 78 250 ALASKA 38 19 6 29 27 169 12 4 7 14 11 17 ARIZONA 96 31 57 71 48 141 25 14 39 82 32 79 ARKANSAS 53 212 252 705 346 1,143 57 26 120 117 30 72 CALIFORNIA 173 337 368 520 282 1,281 767 820 726 672 244 479 COLORADO 235 106 197 117 124 417 1 2 49 72 25 42 CONNECTICUT 20 17 52 80 49 189 170 143 122 152 219 150 DELAWARE 0 10 3 9 3 26 19 0 17 9 15 11 DIST. OF COL. 0 0 0 0 2 0 34 20 41 13 8 38 FLORIDA 23 159 76 140 83 384 157 149 163 194 263 328 GEORGIA 27 139 318 539 235 935 41 36 123 233 131 191 HAWAII 1 39 70 78 19 64 65 49 49 23 28 28 IDAHO 103 32 34 98 49 316 19 0 27 27 13 12 ILLINOIS 68 113 170 378 104 2,022 328 49 268 361 268 232 INDIANA 78 29 69 428 545 1,962 173 39 134 193 149 217 IOWA 79 125 116 651 950 4,541 73 0 96 127 55 145 KANSAS 131 126 137 770 435 3,759 147 61 85 128 45 76 KENTUCKY 52 117 177 831 630 1,914 87 46 60 97 63 29 LOUISIANA 115 122 271 596 341 1,889 238 68 194 123 38 329 MAINE 41 29 59 181 96 283 32 12 22 35 31 22 MARYLAND 42 25 73 130 148 324 183 77 72 77 81 248 MASSACHUSETTS 147 42 65 155 58 196 461 144 384 432 235 228 MICHIGAN 65 83 114 475 119 812 285 83 279 365 204 237 MINNESOTA 12 32 65 183 121 825 58 31 31 122 69 84 MISSISSIPPI 225 165 288 874 166 2,597 56 25 31 121 70 79 MISSOURI 40 234 338 1,537 289 4,461 190 282 27 192 184 470 MONTANA 169 31 67 67 97 574 35 0 23 9 3 1 NEBRASKA 14 55 75 274 308 3,123 15 6 29 33 18 24 NEVADA 74 5 4 13 6 34 15 6 9 12 9 11 NEW HAMPSHIRE 51 32 40 66 56 402 23 11 21 42 18 26 NEW JERSEY 17 66 56 155 68 343 183 208 333 462 222 257 NEW MEXICO 94 39 56 90 81 197 46 0 60 31 17 13 NEW YORK 193 131 304 382 511 1,805 589 449 549 695 375 568 NORTH CAROLINA 84 167 182 607 601 2,466 108 106 189 223 131 332 NORTH DAKOTA 5 9 7 64 0 947 2 0 13 10 2 3 OHIO 94 124 93 600 888 3,220 333 207 276 408 400 460 OKLAHOMA 164 140 317 2,206 40 5,062 153 93 149 154 169 111 OREGON 106 212 161 330 101 440 81 36 124 126 79 52 PENNSYLVANIA 292 361 739 960 958 3,157 340 229 688 606 426 644 RHODE ISLAND 9 5 10 13 12 25 54 56 64 79 38 40 SOUTH CAROLINA 43 123 274 409 141 698 37 17 78 102 124 84 SOUTH DAKOTA 79 31 47 161 41 1,074 20 0 13 8 8 8 TENNESSEE 53 150 355 418 792 1,702 150 55 240 246 130 208 TEXAS 288 265 312 1,164 402 3,582 635 502 712 860 440 1,033 UTAH 79 18 21 54 33 120 74 2 24 34 13 34 VERMONT 102 40 75 197 59 400 26 3 8 14 23 7 VIRGINIA 59 128 309 593 125 1,307 161 43 168 203 97 155 WASHINGTON 44 190 125 326 118 509 170 91 213 135 63 74 WEST VIRGINIA 65 94 150 664 218 1,085 60 5 34 68 35 78 WISCONSIN 28 63 107 317 124 967 167 66 165 188 48 99 WYOMING 139 35 14 31 42 275 41 0 14 15 14 9 PUERTO RICO 35 6 67 168 93 224 50 24 95 95 98 94 TOTALS 4,387 5,170 7,671 20,651 12,030 65,937 7,331 4,419 7,654 8,962 5,589 8,518
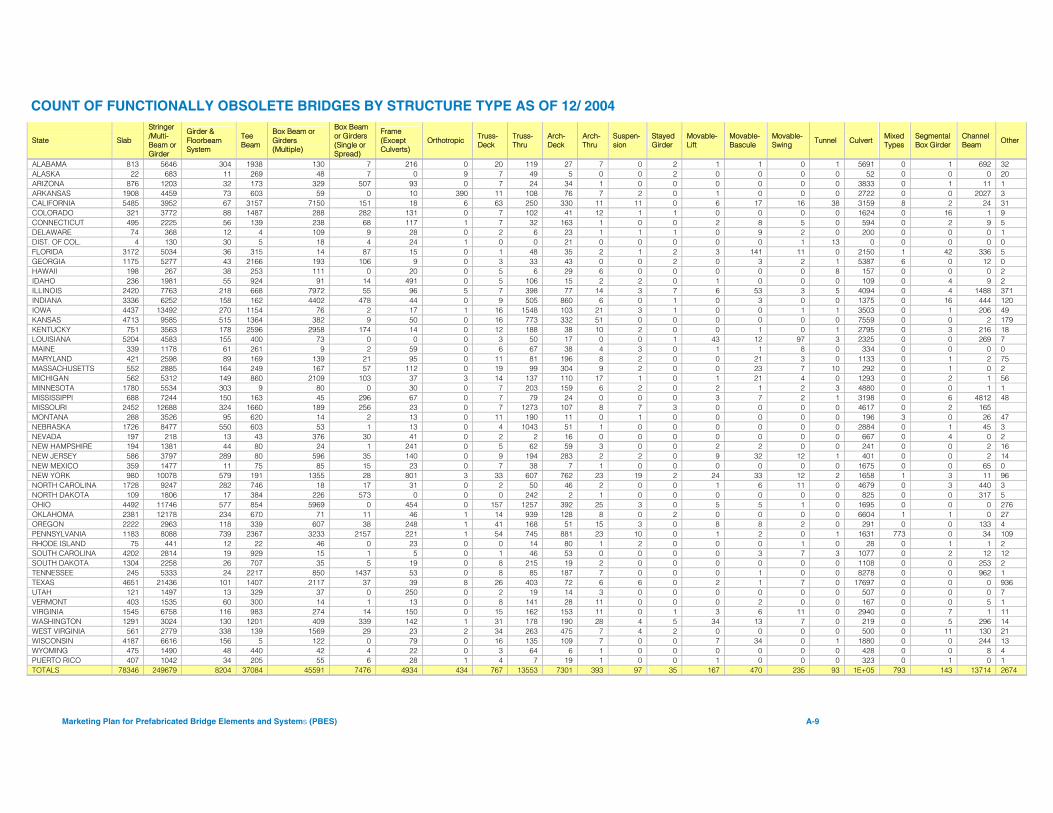
Marketing Plan for Prefabricated Bridge Elements and Systems (PBES) A-9
COUNT OF FUNCTIONALLY OBSOLETE BRIDGES BY STRUCTURE TYPE AS OF 12/ 2004
State Slab
Stringer /Multi-Beam or Girder
Girder & Floorbeam System
Tee Beam
Box Beam or Girders (Multiple)
Box Beam or Girders (Single or Spread)
Frame (Except Culverts)
Orthotropic Truss-Deck
Truss-Thru
Arch-Deck
Arch-Thru
Suspen-sion
Stayed Girder
Movable-Lift
Movable-Bascule
Movable-Swing Tunnel Culvert Mixed
Types Segmental Box Girder
Channel Beam Other
ALABAMA 813 5646 304 1938 130 7 216 0 20 119 27 7 0 2 1 1 0 1 5691 0 1 692 32 ALASKA 22 683 11 269 48 7 0 9 7 49 5 0 0 2 0 0 0 0 52 0 0 0 20 ARIZONA 876 1203 32 173 329 507 93 0 7 24 34 1 0 0 0 0 0 0 3833 0 1 11 1 ARKANSAS 1908 4459 73 603 59 0 10 390 11 108 76 7 2 0 1 0 0 0 2722 0 0 2027 3 CALIFORNIA 5485 3952 67 3157 7150 151 18 6 63 250 330 11 11 0 6 17 16 38 3159 8 2 24 31 COLORADO 321 3772 88 1487 288 282 131 0 7 102 41 12 1 1 0 0 0 0 1624 0 16 1 9 CONNECTICUT 495 2225 56 139 238 68 117 1 7 32 163 1 0 0 2 8 5 0 594 0 2 9 5 DELAWARE 74 368 12 4 109 9 28 0 2 6 23 1 1 1 0 9 2 0 200 0 0 0 1 DIST. OF COL. 4 130 30 5 18 4 24 1 0 0 21 0 0 0 0 0 1 13 0 0 0 0 0 FLORIDA 3172 5034 36 315 14 87 15 0 1 48 35 2 1 2 3 141 11 0 2150 1 42 336 5 GEORGIA 1175 5277 43 2166 193 106 9 0 3 33 43 0 0 2 0 3 2 1 5387 6 0 12 0 HAWAII 198 267 38 253 111 0 20 0 5 6 29 6 0 0 0 0 0 8 157 0 0 0 2 IDAHO 236 1981 55 924 91 14 491 0 5 106 15 2 2 0 1 0 0 0 109 0 4 9 2 ILLINOIS 2420 7763 218 668 7972 55 96 5 7 398 77 14 3 7 6 53 3 5 4094 0 4 1488 371 INDIANA 3336 6252 158 162 4402 478 44 0 9 505 860 6 0 1 0 3 0 0 1375 0 16 444 120 IOWA 4437 13492 270 1154 76 2 17 1 16 1548 103 21 3 1 0 0 1 1 3503 0 1 206 49 KANSAS 4713 9585 515 1364 382 9 50 0 16 773 332 51 0 0 0 0 0 0 7559 0 0 2 179 KENTUCKY 751 3563 178 2596 2958 174 14 0 12 188 38 10 2 0 0 1 0 1 2795 0 3 216 18 LOUISIANA 5204 4583 155 400 73 0 0 0 3 50 17 0 0 1 43 12 97 3 2325 0 0 269 7 MAINE 339 1178 61 261 9 2 59 0 6 67 38 4 3 0 1 1 8 0 334 0 0 0 0 MARYLAND 421 2598 89 169 139 21 95 0 11 81 196 8 2 0 0 21 3 0 1133 0 1 2 75 MASSACHUSETTS 552 2885 164 249 167 57 112 0 19 99 304 9 2 0 0 23 7 10 292 0 1 0 2 MICHIGAN 562 5312 149 860 2109 103 37 3 14 137 110 17 1 0 1 21 4 0 1293 0 2 1 56 MINNESOTA 1780 5534 303 9 80 0 30 0 7 203 159 6 2 0 2 1 2 3 4880 0 0 1 1 MISSISSIPPI 688 7244 150 163 45 296 67 0 7 79 24 0 0 0 3 7 2 1 3198 0 6 4812 48 MISSOURI 2452 12688 324 1660 189 256 23 0 7 1273 107 8 7 3 0 0 0 0 4617 0 2 165 MONTANA 288 3526 95 620 14 2 13 0 11 190 11 0 1 0 0 0 0 0 196 3 0 26 47 NEBRASKA 1726 8477 550 603 53 1 13 0 4 1043 51 1 0 0 0 0 0 0 2884 0 1 45 3 NEVADA 197 218 13 43 376 30 41 0 2 2 16 0 0 0 0 0 0 0 667 0 4 0 2 NEW HAMPSHIRE 194 1381 44 80 24 1 241 0 5 62 59 3 0 0 2 2 0 0 241 0 0 2 16 NEW JERSEY 586 3797 289 80 596 35 140 0 9 194 283 2 2 0 9 32 12 1 401 0 0 2 14 NEW MEXICO 359 1477 11 75 85 15 23 0 7 38 7 1 0 0 0 0 0 0 1675 0 0 65 0 NEW YORK 980 10078 579 191 1355 28 801 3 33 607 762 23 19 2 24 33 12 2 1658 1 3 11 96 NORTH CAROLINA 1728 9247 282 746 18 17 31 0 2 50 46 2 0 0 1 6 11 0 4679 0 3 440 3 NORTH DAKOTA 109 1806 17 384 226 573 0 0 0 242 2 1 0 0 0 0 0 0 825 0 0 317 5 OHIO 4492 11746 577 854 5969 0 454 0 157 1257 392 25 3 0 5 5 1 0 1695 0 0 0 276 OKLAHOMA 2381 12178 234 670 71 11 46 1 14 939 128 8 0 2 0 0 0 0 6604 1 1 0 27 OREGON 2222 2963 118 339 607 38 248 1 41 168 51 15 3 0 8 8 2 0 291 0 0 133 4 PENNSYLVANIA 1183 8088 739 2367 3233 2157 221 1 54 745 881 23 10 0 1 2 0 1 1631 773 0 34 109 RHODE ISLAND 75 441 12 22 46 0 23 0 0 14 80 1 2 0 0 0 1 0 28 0 1 1 2 SOUTH CAROLINA 4202 2814 19 929 15 1 5 0 1 46 53 0 0 0 0 3 7 3 1077 0 2 12 12 SOUTH DAKOTA 1304 2258 26 707 35 5 19 0 8 215 19 2 0 0 0 0 0 0 1108 0 0 253 2 TENNESSEE 245 5333 24 2217 850 1437 53 0 8 85 187 7 0 0 0 1 0 0 8278 0 0 962 1 TEXAS 4651 21436 101 1407 2117 37 39 8 26 403 72 6 6 0 2 1 7 0 17697 0 0 0 936 UTAH 121 1497 13 329 37 0 250 0 2 19 14 3 0 0 0 0 0 0 507 0 0 0 7 VERMONT 403 1535 60 300 14 1 13 0 8 141 28 11 0 0 0 2 0 0 167 0 0 5 1 VIRGINIA 1545 6758 116 983 274 14 150 0 15 162 153 11 0 1 3 6 11 0 2940 0 7 1 11 WASHINGTON 1291 3024 130 1201 409 339 142 1 31 178 190 28 4 5 34 13 7 0 219 0 5 296 14 WEST VIRGINIA 561 2779 338 139 1569 29 23 2 34 263 475 7 4 2 0 0 0 0 500 0 11 130 21 WISCONSIN 4187 6616 156 5 122 0 79 0 16 135 109 7 0 0 7 34 0 1 1880 0 0 244 13 WYOMING 475 1490 48 440 42 4 22 0 3 64 6 1 0 0 0 0 0 0 428 0 0 8 4 PUERTO RICO 407 1042 34 205 55 6 28 1 4 7 19 1 0 0 1 0 0 0 323 0 1 0 1 TOTALS 78346 249679 8204 37084 45591 7476 4934 434 767 13553 7301 393 97 35 167 470 235 93 1E+05 793 143 13714 2674
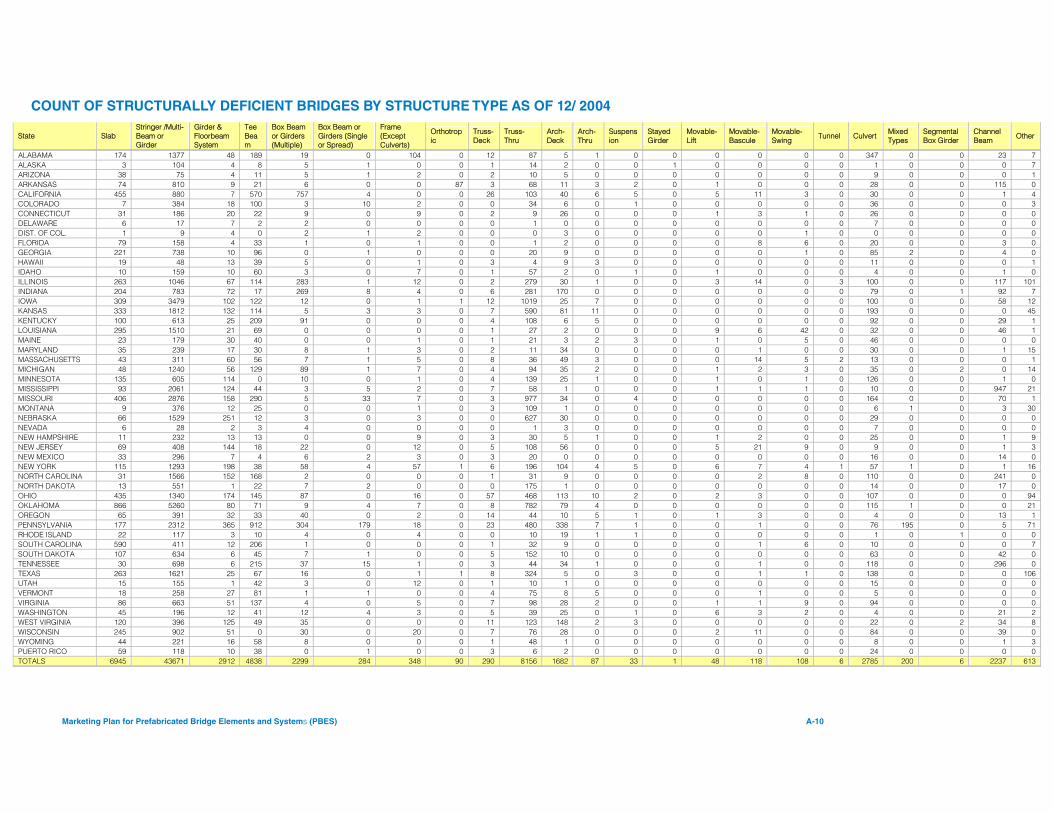
Marketing Plan for Prefabricated Bridge Elements and Systems (PBES) A-10
COUNT OF STRUCTURALLY DEFICIENT BRIDGES BY STRUCTURE TYPE AS OF 12/ 2004
State Slab Stringer /Multi-Beam or Girder
Girder & Floorbeam System
Tee Beam
Box Beam or Girders (Multiple)
Box Beam or Girders (Single or Spread)
Frame (Except Culverts)
Orthotropic
Truss-Deck
Truss-Thru
Arch-Deck
Arch-Thru
Suspension
Stayed Girder
Movable-Lift
Movable-Bascule
Movable-Swing
Tunnel Culvert Mixed Types
Segmental Box Girder
Channel Beam
Other
ALABAMA 174 1377 48 189 19 0 104 0 12 87 5 1 0 0 0 0 0 0 347 0 0 23 7 ALASKA 3 104 4 8 5 1 0 0 1 14 2 0 0 1 0 0 0 0 1 0 0 0 7 ARIZONA 38 75 4 11 5 1 2 0 2 10 5 0 0 0 0 0 0 0 9 0 0 0 1 ARKANSAS 74 810 9 21 6 0 0 87 3 68 11 3 2 0 1 0 0 0 28 0 0 115 0 CALIFORNIA 455 880 7 570 757 4 0 0 26 103 40 6 5 0 5 11 3 0 30 0 0 1 4 COLORADO 7 384 18 100 3 10 2 0 0 34 6 0 1 0 0 0 0 0 36 0 0 0 3 CONNECTICUT 31 186 20 22 9 0 9 0 2 9 26 0 0 0 1 3 1 0 26 0 0 0 0 DELAWARE 6 17 7 2 2 0 0 0 0 1 0 0 0 0 0 0 0 0 7 0 0 0 0 DIST. OF COL. 1 9 4 0 2 1 2 0 0 0 3 0 0 0 0 0 1 0 0 0 0 0 0 FLORIDA 79 158 4 33 1 0 1 0 0 1 2 0 0 0 0 8 6 0 20 0 0 3 0 GEORGIA 221 738 10 96 0 1 0 0 0 20 9 0 0 0 0 0 1 0 85 2 0 4 0 HAWAII 19 48 13 39 5 0 1 0 3 4 9 3 0 0 0 0 0 0 11 0 0 0 1 IDAHO 10 159 10 60 3 0 7 0 1 57 2 0 1 0 1 0 0 0 4 0 0 1 0 ILLINOIS 263 1046 67 114 283 1 12 0 2 279 30 1 0 0 3 14 0 3 100 0 0 117 101 INDIANA 204 783 72 17 269 8 4 0 6 281 170 0 0 0 0 0 0 0 79 0 1 92 7 IOWA 309 3479 102 122 12 0 1 1 12 1019 25 7 0 0 0 0 0 0 100 0 0 58 12 KANSAS 333 1812 132 114 5 3 3 0 7 590 81 11 0 0 0 0 0 0 193 0 0 0 45 KENTUCKY 100 613 25 209 91 0 0 0 4 108 6 5 0 0 0 0 0 0 92 0 0 29 1 LOUISIANA 295 1510 21 69 0 0 0 0 1 27 2 0 0 0 9 6 42 0 32 0 0 46 1 MAINE 23 179 30 40 0 0 1 0 1 21 3 2 3 0 1 0 5 0 46 0 0 0 0 MARYLAND 35 239 17 30 8 1 3 0 2 11 34 0 0 0 0 1 0 0 30 0 0 1 15 MASSACHUSETTS 43 311 60 56 7 1 5 0 8 36 49 3 0 0 0 14 5 2 13 0 0 0 1 MICHIGAN 48 1240 56 129 89 1 7 0 4 94 35 2 0 0 1 2 3 0 35 0 2 0 14 MINNESOTA 135 605 114 0 10 0 1 0 4 139 25 1 0 0 1 0 1 0 126 0 0 1 0 MISSISSIPPI 93 2061 124 44 3 5 2 0 7 58 1 0 0 0 1 1 1 0 10 0 0 947 21 MISSOURI 406 2876 158 290 5 33 7 0 3 977 34 0 4 0 0 0 0 0 164 0 0 70 1 MONTANA 9 376 12 25 0 0 1 0 3 109 1 0 0 0 0 0 0 0 6 1 0 3 30 NEBRASKA 66 1529 251 12 3 0 3 0 0 627 30 0 0 0 0 0 0 0 29 0 0 0 0 NEVADA 6 28 2 3 4 0 0 0 0 1 3 0 0 0 0 0 0 0 7 0 0 0 0 NEW HAMPSHIRE 11 232 13 13 0 0 9 0 3 30 5 1 0 0 1 2 0 0 25 0 0 1 9 NEW JERSEY 69 408 144 18 22 0 12 0 5 108 56 0 0 0 5 21 9 0 9 0 0 1 3 NEW MEXICO 33 296 7 4 6 2 3 0 3 20 0 0 0 0 0 0 0 0 16 0 0 14 0 NEW YORK 115 1293 198 38 58 4 57 1 6 196 104 4 5 0 6 7 4 1 57 1 0 1 16 NORTH CAROLINA 31 1566 152 168 2 0 0 0 1 31 9 0 0 0 0 2 8 0 110 0 0 241 0 NORTH DAKOTA 13 551 1 22 7 2 0 0 0 175 1 0 0 0 0 0 0 0 14 0 0 17 0 OHIO 435 1340 174 145 87 0 16 0 57 468 113 10 2 0 2 3 0 0 107 0 0 0 94 OKLAHOMA 866 5260 80 71 9 4 7 0 8 782 79 4 0 0 0 0 0 0 115 1 0 0 21 OREGON 65 391 32 33 40 0 2 0 14 44 10 5 1 0 1 3 0 0 4 0 0 13 1 PENNSYLVANIA 177 2312 365 912 304 179 18 0 23 480 338 7 1 0 0 1 0 0 76 195 0 5 71 RHODE ISLAND 22 117 3 10 4 0 4 0 0 10 19 1 1 0 0 0 0 0 1 0 1 0 0 SOUTH CAROLINA 590 411 12 206 1 0 0 0 1 32 9 0 0 0 0 1 6 0 10 0 0 0 7 SOUTH DAKOTA 107 634 6 45 7 1 0 0 5 152 10 0 0 0 0 0 0 0 63 0 0 42 0 TENNESSEE 30 698 6 215 37 15 1 0 3 44 34 1 0 0 0 1 0 0 118 0 0 296 0 TEXAS 263 1621 25 67 16 0 1 1 8 324 5 0 3 0 0 1 1 0 138 0 0 0 106 UTAH 15 155 1 42 3 0 12 0 1 10 1 0 0 0 0 0 0 0 15 0 0 0 0 VERMONT 18 258 27 81 1 1 0 0 4 75 8 5 0 0 0 1 0 0 5 0 0 0 0 VIRGINIA 86 663 51 137 4 0 5 0 7 98 28 2 0 0 1 1 9 0 94 0 0 0 0 WASHINGTON 45 196 12 41 12 4 3 0 5 39 25 0 1 0 6 3 2 0 4 0 0 21 2 WEST VIRGINIA 120 396 125 49 35 0 0 0 11 123 148 2 3 0 0 0 0 0 22 0 2 34 8 WISCONSIN 245 902 51 0 30 0 20 0 7 76 28 0 0 0 2 11 0 0 84 0 0 39 0 WYOMING 44 221 16 58 8 0 0 0 1 48 1 0 0 0 0 0 0 0 8 0 0 1 3 PUERTO RICO 59 118 10 38 0 1 0 0 3 6 2 0 0 0 0 0 0 0 24 0 0 0 0 TOTALS 6945 43671 2912 4838 2299 284 348 90 290 8156 1682 87 33 1 48 118 108 6 2785 200 6 2237 613
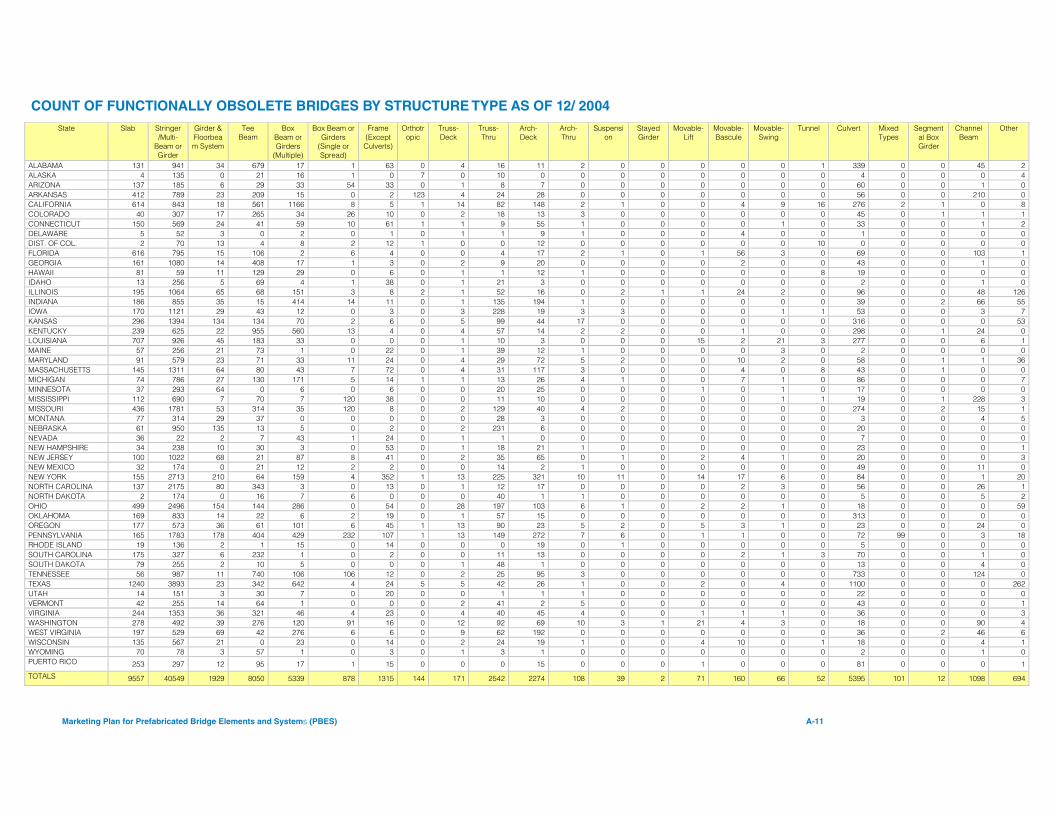
Marketing Plan for Prefabricated Bridge Elements and Systems (PBES) A-11
COUNT OF FUNCTIONALLY OBSOLETE BRIDGES BY STRUCTURE TYPE AS OF 12/ 2004 State Slab Stringer
/Multi-Beam or Girder
Girder & Floorbeam System
Tee Beam
Box Beam or Girders
(Multiple)
Box Beam or Girders
(Single or Spread)
Frame (Except Culverts)
Orthotropic
Truss-Deck
Truss-Thru
Arch-Deck
Arch-Thru
Suspension
Stayed Girder
Movable-Lift
Movable-Bascule
Movable-Swing
Tunnel Culvert Mixed Types
Segmental Box Girder
Channel Beam
Other
ALABAMA 131 941 34 679 17 1 63 0 4 16 11 2 0 0 0 0 0 1 339 0 0 45 2 ALASKA 4 135 0 21 16 1 0 7 0 10 0 0 0 0 0 0 0 0 4 0 0 0 4 ARIZONA 137 185 6 29 33 54 33 0 1 8 7 0 0 0 0 0 0 0 60 0 0 1 0 ARKANSAS 412 789 23 209 15 0 2 123 4 24 28 0 0 0 0 0 0 0 56 0 0 210 0 CALIFORNIA 614 843 18 561 1166 8 5 1 14 82 148 2 1 0 0 4 9 16 276 2 1 0 8 COLORADO 40 307 17 265 34 26 10 0 2 18 13 3 0 0 0 0 0 0 45 0 1 1 1 CONNECTICUT 150 569 24 41 59 10 61 1 1 9 55 1 0 0 0 0 1 0 33 0 0 1 2 DELAWARE 5 52 3 0 2 0 1 0 1 1 9 1 0 0 0 4 0 0 1 0 0 0 0 DIST. OF COL. 2 70 13 4 8 2 12 1 0 0 12 0 0 0 0 0 0 10 0 0 0 0 0 FLORIDA 616 795 15 106 2 6 4 0 0 4 17 2 1 0 1 56 3 0 69 0 0 103 1 GEORGIA 161 1080 14 408 17 1 3 0 2 9 20 0 0 0 0 2 0 0 43 0 0 1 0 HAWAII 81 59 11 129 29 0 6 0 1 1 12 1 0 0 0 0 0 8 19 0 0 0 0 IDAHO 13 256 5 69 4 1 38 0 1 21 3 0 0 0 0 0 0 0 2 0 0 1 0 ILLINOIS 195 1064 65 68 151 3 8 2 1 52 16 0 2 1 1 24 2 0 96 0 0 48 126 INDIANA 186 855 35 15 414 14 11 0 1 135 194 1 0 0 0 0 0 0 39 0 2 66 55 IOWA 170 1121 29 43 12 0 3 0 3 228 19 3 3 0 0 0 1 1 53 0 0 3 7 KANSAS 296 1394 134 134 70 2 6 0 5 99 44 17 0 0 0 0 0 0 316 0 0 0 53 KENTUCKY 239 625 22 955 560 13 4 0 4 57 14 2 2 0 0 1 0 0 298 0 1 24 0 LOUISIANA 707 926 45 183 33 0 0 0 1 10 3 0 0 0 15 2 21 3 277 0 0 6 1 MAINE 57 256 21 73 1 0 22 0 1 39 12 1 0 0 0 0 3 0 2 0 0 0 0 MARYLAND 91 579 23 71 33 11 24 0 4 29 72 5 2 0 0 10 2 0 58 0 1 1 36 MASSACHUSETTS 145 1311 64 80 43 7 72 0 4 31 117 3 0 0 0 4 0 8 43 0 1 0 0 MICHIGAN 74 786 27 130 171 5 14 1 1 13 26 4 1 0 0 7 1 0 86 0 0 0 7 MINNESOTA 37 293 64 0 6 0 6 0 0 20 25 0 0 0 1 0 1 0 17 0 0 0 0 MISSISSIPPI 112 690 7 70 7 120 38 0 0 11 10 0 0 0 0 0 1 1 19 0 1 228 3 MISSOURI 436 1781 53 314 35 120 8 0 2 129 40 4 2 0 0 0 0 0 274 0 2 15 1 MONTANA 77 314 29 37 0 0 0 0 0 28 3 0 0 0 0 0 0 0 3 0 0 4 5 NEBRASKA 61 950 135 13 5 0 2 0 2 231 6 0 0 0 0 0 0 0 20 0 0 0 0 NEVADA 36 22 2 7 43 1 24 0 1 1 0 0 0 0 0 0 0 0 7 0 0 0 0 NEW HAMPSHIRE 34 238 10 30 3 0 53 0 1 18 21 1 0 0 0 0 0 0 23 0 0 0 1 NEW JERSEY 100 1022 68 21 87 8 41 0 2 35 65 0 1 0 2 4 1 0 20 0 0 0 3 NEW MEXICO 32 174 0 21 12 2 2 0 0 14 2 1 0 0 0 0 0 0 49 0 0 11 0 NEW YORK 155 2713 210 64 159 4 352 1 13 225 321 10 11 0 14 17 6 0 84 0 0 1 20 NORTH CAROLINA 137 2175 80 343 3 0 13 0 1 12 17 0 0 0 0 2 3 0 56 0 0 26 1 NORTH DAKOTA 2 174 0 16 7 6 0 0 0 40 1 1 0 0 0 0 0 0 5 0 0 5 2 OHIO 499 2496 154 144 286 0 54 0 28 197 103 6 1 0 2 2 1 0 18 0 0 0 59 OKLAHOMA 169 833 14 22 6 2 19 0 1 57 15 0 0 0 0 0 0 0 313 0 0 0 0 OREGON 177 573 36 61 101 6 45 1 13 90 23 5 2 0 5 3 1 0 23 0 0 24 0 PENNSYLVANIA 165 1783 178 404 429 232 107 1 13 149 272 7 6 0 1 1 0 0 72 99 0 3 18 RHODE ISLAND 19 136 2 1 15 0 14 0 0 0 19 0 1 0 0 0 0 0 5 0 0 0 0 SOUTH CAROLINA 175 327 6 232 1 0 2 0 0 11 13 0 0 0 0 2 1 3 70 0 0 1 0 SOUTH DAKOTA 79 255 2 10 5 0 0 0 1 48 1 0 0 0 0 0 0 0 13 0 0 4 0 TENNESSEE 56 987 11 740 106 106 12 0 2 25 95 3 0 0 0 0 0 0 733 0 0 124 0 TEXAS 1240 3893 23 342 642 4 24 5 5 42 26 1 0 0 2 0 4 0 1100 0 0 0 262 UTAH 14 151 3 30 7 0 20 0 0 1 1 1 0 0 0 0 0 0 22 0 0 0 0 VERMONT 42 255 14 64 1 0 0 0 2 41 2 5 0 0 0 0 0 0 43 0 0 0 1 VIRGINIA 244 1353 36 321 46 4 23 0 4 40 45 4 0 0 1 1 1 0 36 0 0 0 3 WASHINGTON 278 492 39 276 120 91 16 0 12 92 69 10 3 1 21 4 3 0 18 0 0 90 4 WEST VIRGINIA 197 529 69 42 276 6 6 0 9 62 192 0 0 0 0 0 0 0 36 0 2 46 6 WISCONSIN 135 567 21 0 23 0 14 0 2 24 19 1 0 0 4 10 0 1 18 0 0 4 1 WYOMING 70 78 3 57 1 0 3 0 1 3 1 0 0 0 0 0 0 0 2 0 0 1 0 PUERTO RICO 253 297 12 95 17 1 15 0 0 0 15 0 0 0 1 0 0 0 81 0 0 0 1
TOTALS 9557 40549 1929 8050 5339 878 1315 144 171 2542 2274 108 39 2 71 160 66 52 5395 101 12 1098 694
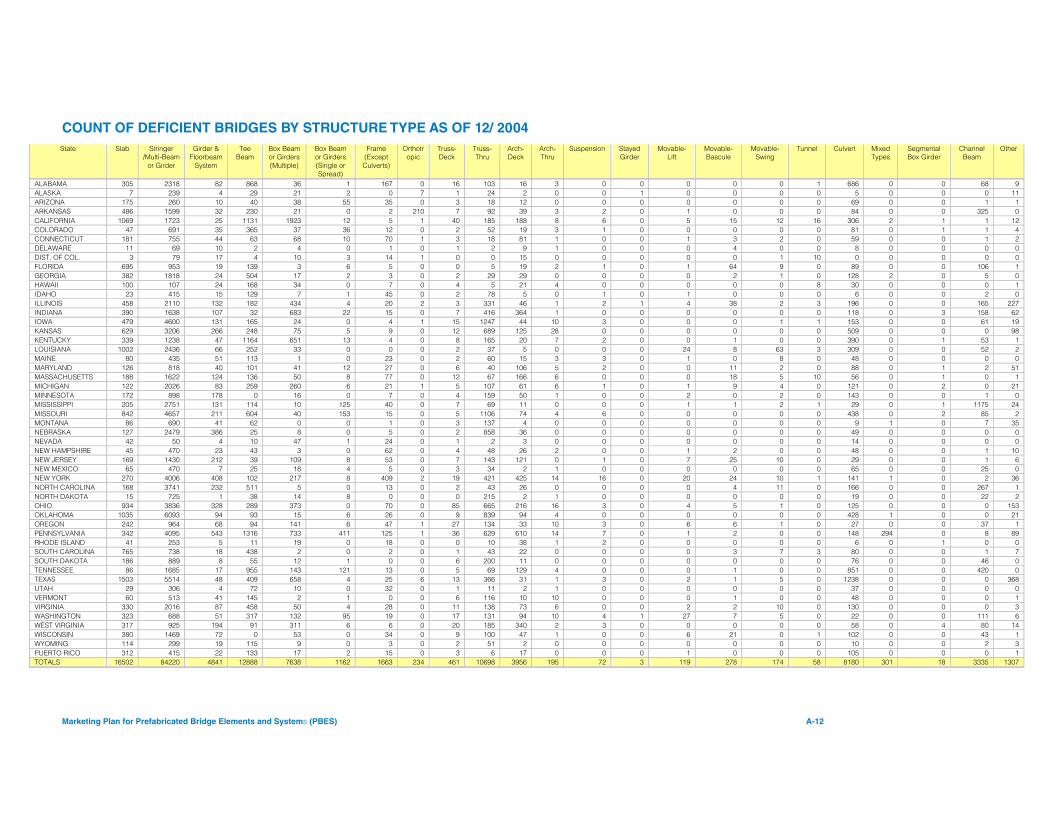
Marketing Plan for Prefabricated Bridge Elements and Systems (PBES) A-12
COUNT OF DEFICIENT BRIDGES BY STRUCTURE TYPE AS OF 12/ 2004 State Slab Stringer
/Multi-Beam or Girder
Girder & Floorbeam
System
Tee Beam
Box Beam or Girders (Multiple)
Box Beam or Girders (Single or Spread)
Frame (Except Culverts)
Orthotropic
Truss-Deck
Truss-Thru
Arch-Deck
Arch-Thru
Suspension Stayed Girder
Movable-Lift
Movable-Bascule
Movable-Swing
Tunnel Culvert Mixed Types
Segmental Box Girder
Channel Beam
Other
ALABAMA 305 2318 82 868 36 1 167 0 16 103 16 3 0 0 0 0 0 1 686 0 0 68 9 ALASKA 7 239 4 29 21 2 0 7 1 24 2 0 0 1 0 0 0 0 5 0 0 0 11 ARIZONA 175 260 10 40 38 55 35 0 3 18 12 0 0 0 0 0 0 0 69 0 0 1 1 ARKANSAS 486 1599 32 230 21 0 2 210 7 92 39 3 2 0 1 0 0 0 84 0 0 325 0 CALIFORNIA 1069 1723 25 1131 1923 12 5 1 40 185 188 8 6 0 5 15 12 16 306 2 1 1 12 COLORADO 47 691 35 365 37 36 12 0 2 52 19 3 1 0 0 0 0 0 81 0 1 1 4 CONNECTICUT 181 755 44 63 68 10 70 1 3 18 81 1 0 0 1 3 2 0 59 0 0 1 2 DELAWARE 11 69 10 2 4 0 1 0 1 2 9 1 0 0 0 4 0 0 8 0 0 0 0 DIST. OF COL. 3 79 17 4 10 3 14 1 0 0 15 0 0 0 0 0 1 10 0 0 0 0 0 FLORIDA 695 953 19 139 3 6 5 0 0 5 19 2 1 0 1 64 9 0 89 0 0 106 1 GEORGIA 382 1818 24 504 17 2 3 0 2 29 29 0 0 0 0 2 1 0 128 2 0 5 0 HAWAII 100 107 24 168 34 0 7 0 4 5 21 4 0 0 0 0 0 8 30 0 0 0 1 IDAHO 23 415 15 129 7 1 45 0 2 78 5 0 1 0 1 0 0 0 6 0 0 2 0 ILLINOIS 458 2110 132 182 434 4 20 2 3 331 46 1 2 1 4 38 2 3 196 0 0 165 227 INDIANA 390 1638 107 32 683 22 15 0 7 416 364 1 0 0 0 0 0 0 118 0 3 158 62 IOWA 479 4600 131 165 24 0 4 1 15 1247 44 10 3 0 0 0 1 1 153 0 0 61 19 KANSAS 629 3206 266 248 75 5 9 0 12 689 125 28 0 0 0 0 0 0 509 0 0 0 98 KENTUCKY 339 1238 47 1164 651 13 4 0 8 165 20 7 2 0 0 1 0 0 390 0 1 53 1 LOUISIANA 1002 2436 66 252 33 0 0 0 2 37 5 0 0 0 24 8 63 3 309 0 0 52 2 MAINE 80 435 51 113 1 0 23 0 2 60 15 3 3 0 1 0 8 0 48 0 0 0 0 MARYLAND 126 818 40 101 41 12 27 0 6 40 106 5 2 0 0 11 2 0 88 0 1 2 51 MASSACHUSETTS 188 1622 124 136 50 8 77 0 12 67 166 6 0 0 0 18 5 10 56 0 1 0 1 MICHIGAN 122 2026 83 259 260 6 21 1 5 107 61 6 1 0 1 9 4 0 121 0 2 0 21 MINNESOTA 172 898 178 0 16 0 7 0 4 159 50 1 0 0 2 0 2 0 143 0 0 1 0 MISSISSIPPI 205 2751 131 114 10 125 40 0 7 69 11 0 0 0 1 1 2 1 29 0 1 1175 24 MISSOURI 842 4657 211 604 40 153 15 0 5 1106 74 4 6 0 0 0 0 0 438 0 2 85 2 MONTANA 86 690 41 62 0 0 1 0 3 137 4 0 0 0 0 0 0 0 9 1 0 7 35 NEBRASKA 127 2479 386 25 8 0 5 0 2 858 36 0 0 0 0 0 0 0 49 0 0 0 0 NEVADA 42 50 4 10 47 1 24 0 1 2 3 0 0 0 0 0 0 0 14 0 0 0 0 NEW HAMPSHIRE 45 470 23 43 3 0 62 0 4 48 26 2 0 0 1 2 0 0 48 0 0 1 10 NEW JERSEY 169 1430 212 39 109 8 53 0 7 143 121 0 1 0 7 25 10 0 29 0 0 1 6 NEW MEXICO 65 470 7 25 18 4 5 0 3 34 2 1 0 0 0 0 0 0 65 0 0 25 0 NEW YORK 270 4006 408 102 217 8 409 2 19 421 425 14 16 0 20 24 10 1 141 1 0 2 36 NORTH CAROLINA 168 3741 232 511 5 0 13 0 2 43 26 0 0 0 0 4 11 0 166 0 0 267 1 NORTH DAKOTA 15 725 1 38 14 8 0 0 0 215 2 1 0 0 0 0 0 0 19 0 0 22 2 OHIO 934 3836 328 289 373 0 70 0 85 665 216 16 3 0 4 5 1 0 125 0 0 0 153 OKLAHOMA 1035 6093 94 93 15 6 26 0 9 839 94 4 0 0 0 0 0 0 428 1 0 0 21 OREGON 242 964 68 94 141 6 47 1 27 134 33 10 3 0 6 6 1 0 27 0 0 37 1 PENNSYLVANIA 342 4095 543 1316 733 411 125 1 36 629 610 14 7 0 1 2 0 0 148 294 0 8 89 RHODE ISLAND 41 253 5 11 19 0 18 0 0 10 38 1 2 0 0 0 0 0 6 0 1 0 0 SOUTH CAROLINA 765 738 18 438 2 0 2 0 1 43 22 0 0 0 0 3 7 3 80 0 0 1 7 SOUTH DAKOTA 186 889 8 55 12 1 0 0 6 200 11 0 0 0 0 0 0 0 76 0 0 46 0 TENNESSEE 86 1685 17 955 143 121 13 0 5 69 129 4 0 0 0 1 0 0 851 0 0 420 0 TEXAS 1503 5514 48 409 658 4 25 6 13 366 31 1 3 0 2 1 5 0 1238 0 0 0 368 UTAH 29 306 4 72 10 0 32 0 1 11 2 1 0 0 0 0 0 0 37 0 0 0 0 VERMONT 60 513 41 145 2 1 0 0 6 116 10 10 0 0 0 1 0 0 48 0 0 0 1 VIRGINIA 330 2016 87 458 50 4 28 0 11 138 73 6 0 0 2 2 10 0 130 0 0 0 3 WASHINGTON 323 688 51 317 132 95 19 0 17 131 94 10 4 1 27 7 5 0 22 0 0 111 6 WEST VIRGINIA 317 925 194 91 311 6 6 0 20 185 340 2 3 0 0 0 0 0 58 0 4 80 14 WISCONSIN 380 1469 72 0 53 0 34 0 9 100 47 1 0 0 6 21 0 1 102 0 0 43 1 WYOMING 114 299 19 115 9 0 3 0 2 51 2 0 0 0 0 0 0 0 10 0 0 2 3 PUERTO RICO 312 415 22 133 17 2 15 0 3 6 17 0 0 0 1 0 0 0 105 0 0 0 1 TOTALS 16502 84220 4841 12888 7638 1162 1663 234 461 10698 3956 195 72 3 119 278 174 58 8180 301 18 3335 1307
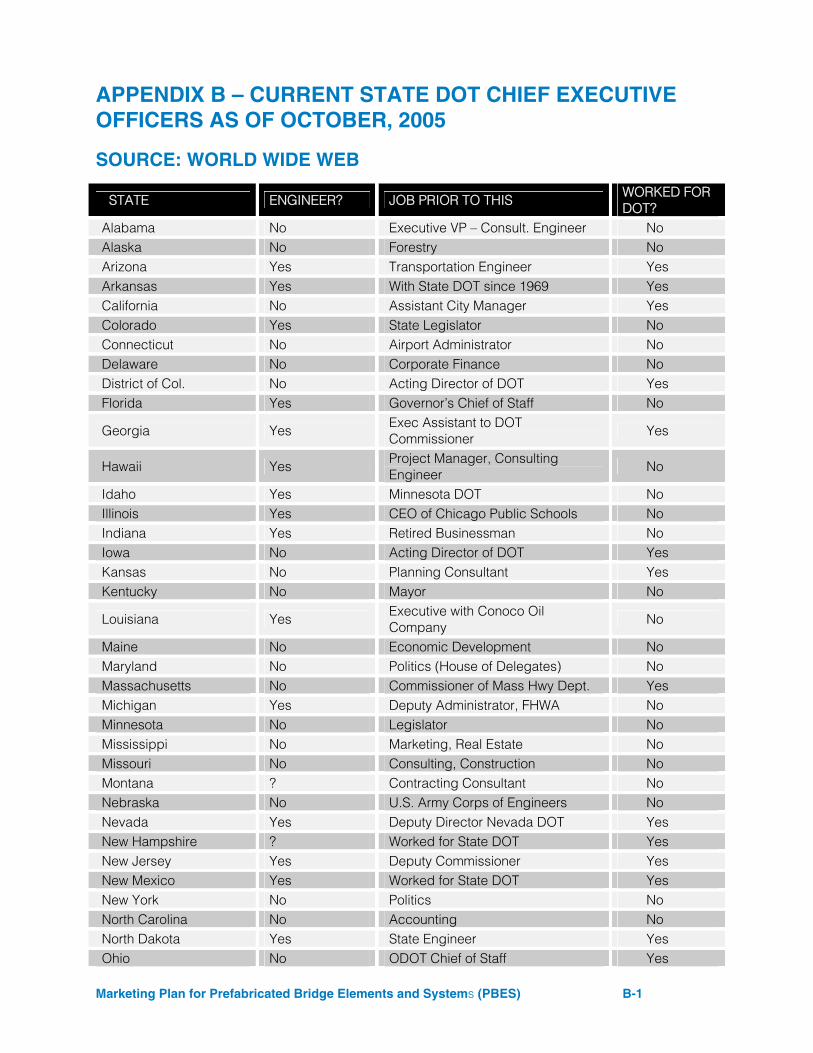
Marketing Plan for Prefabricated Bridge Elements and Systems (PBES) B-1
APPENDIX B – CURRENT STATE DOT CHIEF EXECUTIVE OFFICERS AS OF OCTOBER, 2005
SOURCE: WORLD WIDE WEB
STATE ENGINEER? JOB PRIOR TO THIS WORKED FOR DOT?
Alabama No Executive VP – Consult. Engineer No Alaska No Forestry No Arizona Yes Transportation Engineer Yes Arkansas Yes With State DOT since 1969 Yes California No Assistant City Manager Yes Colorado Yes State Legislator No Connecticut No Airport Administrator No Delaware No Corporate Finance No District of Col. No Acting Director of DOT Yes Florida Yes Governor’s Chief of Staff No
Georgia Yes Exec Assistant to DOT Commissioner Yes
Hawaii Yes Project Manager, Consulting Engineer
No
Idaho Yes Minnesota DOT No Illinois Yes CEO of Chicago Public Schools No Indiana Yes Retired Businessman No Iowa No Acting Director of DOT Yes Kansas No Planning Consultant Yes Kentucky No Mayor No
Louisiana Yes Executive with Conoco Oil Company
No
Maine No Economic Development No Maryland No Politics (House of Delegates) No Massachusetts No Commissioner of Mass Hwy Dept. Yes Michigan Yes Deputy Administrator, FHWA No Minnesota No Legislator No Mississippi No Marketing, Real Estate No Missouri No Consulting, Construction No Montana ? Contracting Consultant No Nebraska No U.S. Army Corps of Engineers No Nevada Yes Deputy Director Nevada DOT Yes New Hampshire ? Worked for State DOT Yes New Jersey Yes Deputy Commissioner Yes New Mexico Yes Worked for State DOT Yes New York No Politics No North Carolina No Accounting No North Dakota Yes State Engineer Yes Ohio No ODOT Chief of Staff Yes
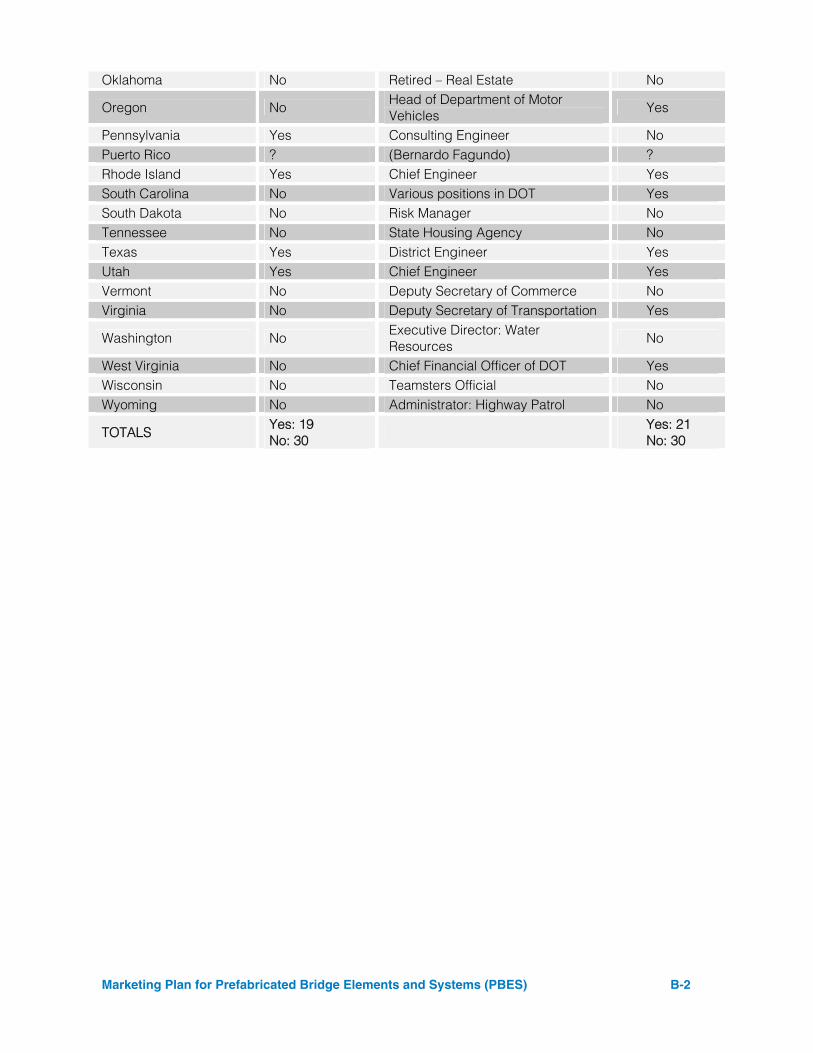
Marketing Plan for Prefabricated Bridge Elements and Systems (PBES) B-2
Oklahoma No Retired – Real Estate No
Oregon No Head of Department of Motor Vehicles
Yes
Pennsylvania Yes Consulting Engineer No Puerto Rico ? (Bernardo Fagundo) ? Rhode Island Yes Chief Engineer Yes South Carolina No Various positions in DOT Yes South Dakota No Risk Manager No Tennessee No State Housing Agency No Texas Yes District Engineer Yes Utah Yes Chief Engineer Yes Vermont No Deputy Secretary of Commerce No Virginia No Deputy Secretary of Transportation Yes
Washington No Executive Director: Water Resources
No
West Virginia No Chief Financial Officer of DOT Yes Wisconsin No Teamsters Official No Wyoming No Administrator: Highway Patrol No
TOTALS Yes: 19 No: 30
Yes: 21 No: 30
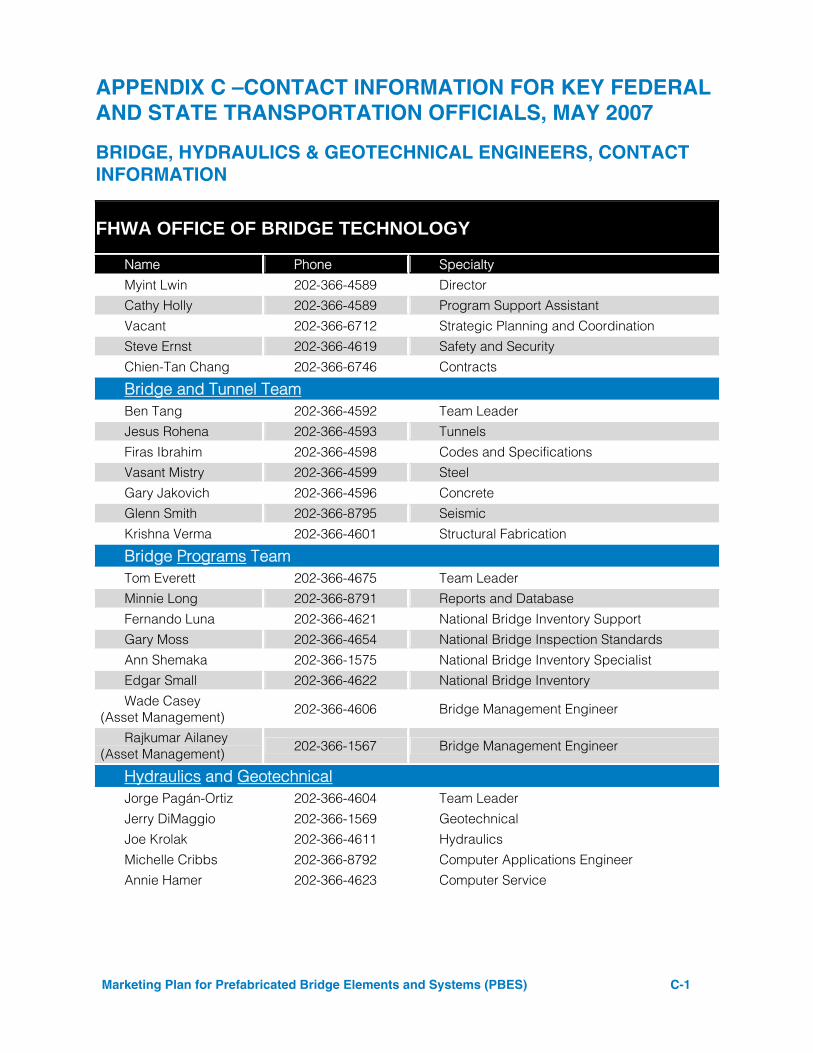
Marketing Plan for Prefabricated Bridge Elements and Systems (PBES) C-1
APPENDIX C –CONTACT INFORMATION FOR KEY FEDERAL AND STATE TRANSPORTATION OFFICIALS, MAY 2007
BRIDGE, HYDRAULICS & GEOTECHNICAL ENGINEERS, CONTACT INFORMATION
FHWA OFFICE OF BRIDGE TECHNOLOGY
Name Phone Specialty
Myint Lwin 202-366-4589 Director Cathy Holly 202-366-4589 Program Support Assistant
Vacant 202-366-6712 Strategic Planning and Coordination Steve Ernst 202-366-4619 Safety and Security
Chien-Tan Chang 202-366-6746 Contracts
Bridge and Tunnel Team Ben Tang 202-366-4592 Team Leader Jesus Rohena 202-366-4593 Tunnels
Firas Ibrahim 202-366-4598 Codes and Specifications Vasant Mistry 202-366-4599 Steel
Gary Jakovich 202-366-4596 Concrete Glenn Smith 202-366-8795 Seismic
Krishna Verma 202-366-4601 Structural Fabrication
Bridge Programs Team Tom Everett 202-366-4675 Team Leader Minnie Long 202-366-8791 Reports and Database
Fernando Luna 202-366-4621 National Bridge Inventory Support Gary Moss 202-366-4654 National Bridge Inspection Standards
Ann Shemaka 202-366-1575 National Bridge Inventory Specialist Edgar Small 202-366-4622 National Bridge Inventory
Wade Casey (Asset Management)
202-366-4606 Bridge Management Engineer
Rajkumar Ailaney (Asset Management) 202-366-1567 Bridge Management Engineer
Hydraulics and Geotechnical Jorge Pagán-Ortiz 202-366-4604 Team Leader
Jerry DiMaggio 202-366-1569 Geotechnical Joe Krolak 202-366-4611 Hydraulics
Michelle Cribbs 202-366-8792 Computer Applications Engineer Annie Hamer 202-366-4623 Computer Service
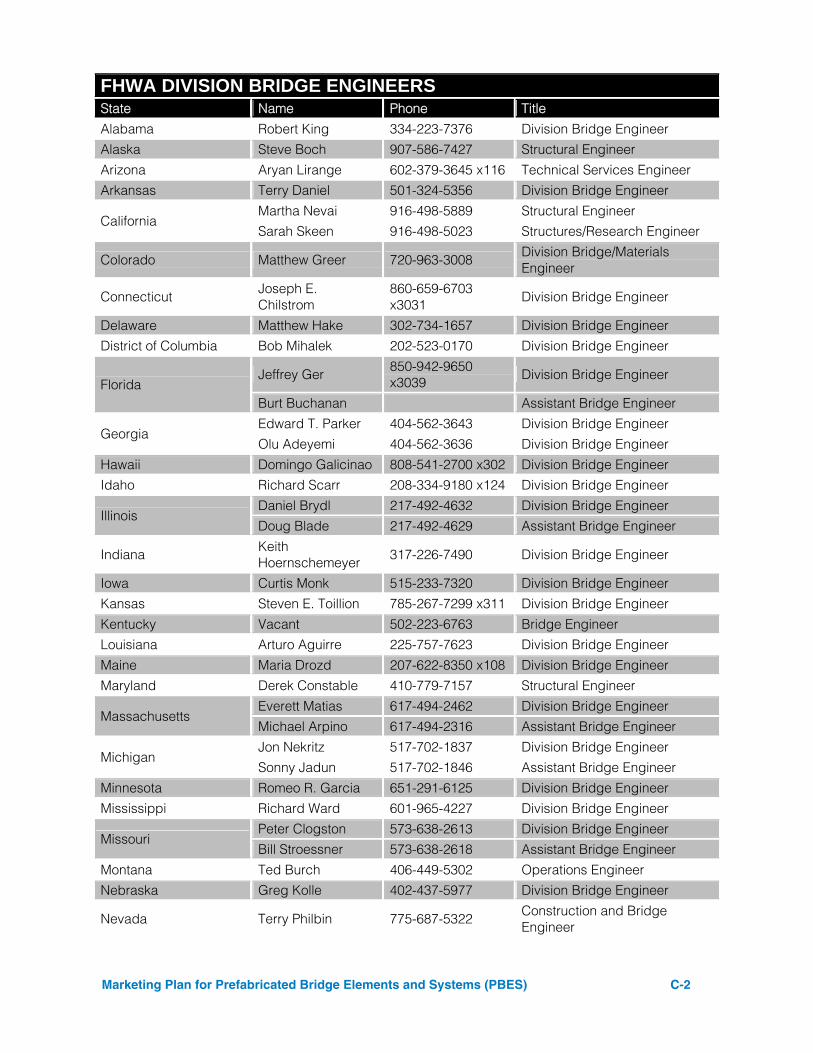
Marketing Plan for Prefabricated Bridge Elements and Systems (PBES) C-2
FHWA DIVISION BRIDGE ENGINEERSState Name Phone Title
Alabama Robert King 334-223-7376 Division Bridge Engineer Alaska Steve Boch 907-586-7427 Structural Engineer
Arizona Aryan Lirange 602-379-3645 x116 Technical Services Engineer Arkansas Terry Daniel 501-324-5356 Division Bridge Engineer
California Martha Nevai 916-498-5889 Structural Engineer Sarah Skeen 916-498-5023 Structures/Research Engineer
Colorado Matthew Greer 720-963-3008 Division Bridge/Materials Engineer
Connecticut Joseph E. Chilstrom
860-659-6703 x3031 Division Bridge Engineer
Delaware Matthew Hake 302-734-1657 Division Bridge Engineer District of Columbia Bob Mihalek 202-523-0170 Division Bridge Engineer
Florida Jeffrey Ger 850-942-9650
x3039 Division Bridge Engineer
Burt Buchanan Assistant Bridge Engineer
Georgia Edward T. Parker 404-562-3643 Division Bridge Engineer Olu Adeyemi 404-562-3636 Division Bridge Engineer
Hawaii Domingo Galicinao 808-541-2700 x302 Division Bridge Engineer Idaho Richard Scarr 208-334-9180 x124 Division Bridge Engineer
Illinois Daniel Brydl 217-492-4632 Division Bridge Engineer Doug Blade 217-492-4629 Assistant Bridge Engineer
Indiana Keith Hoernschemeyer 317-226-7490 Division Bridge Engineer
Iowa Curtis Monk 515-233-7320 Division Bridge Engineer Kansas Steven E. Toillion 785-267-7299 x311 Division Bridge Engineer
Kentucky Vacant 502-223-6763 Bridge Engineer Louisiana Arturo Aguirre 225-757-7623 Division Bridge Engineer
Maine Maria Drozd 207-622-8350 x108 Division Bridge Engineer Maryland Derek Constable 410-779-7157 Structural Engineer
Massachusetts Everett Matias 617-494-2462 Division Bridge Engineer Michael Arpino 617-494-2316 Assistant Bridge Engineer
Michigan Jon Nekritz 517-702-1837 Division Bridge Engineer Sonny Jadun 517-702-1846 Assistant Bridge Engineer
Minnesota Romeo R. Garcia 651-291-6125 Division Bridge Engineer Mississippi Richard Ward 601-965-4227 Division Bridge Engineer
Missouri Peter Clogston 573-638-2613 Division Bridge Engineer Bill Stroessner 573-638-2618 Assistant Bridge Engineer
Montana Ted Burch 406-449-5302 Operations Engineer Nebraska Greg Kolle 402-437-5977 Division Bridge Engineer
Nevada Terry Philbin 775-687-5322 Construction and Bridge Engineer
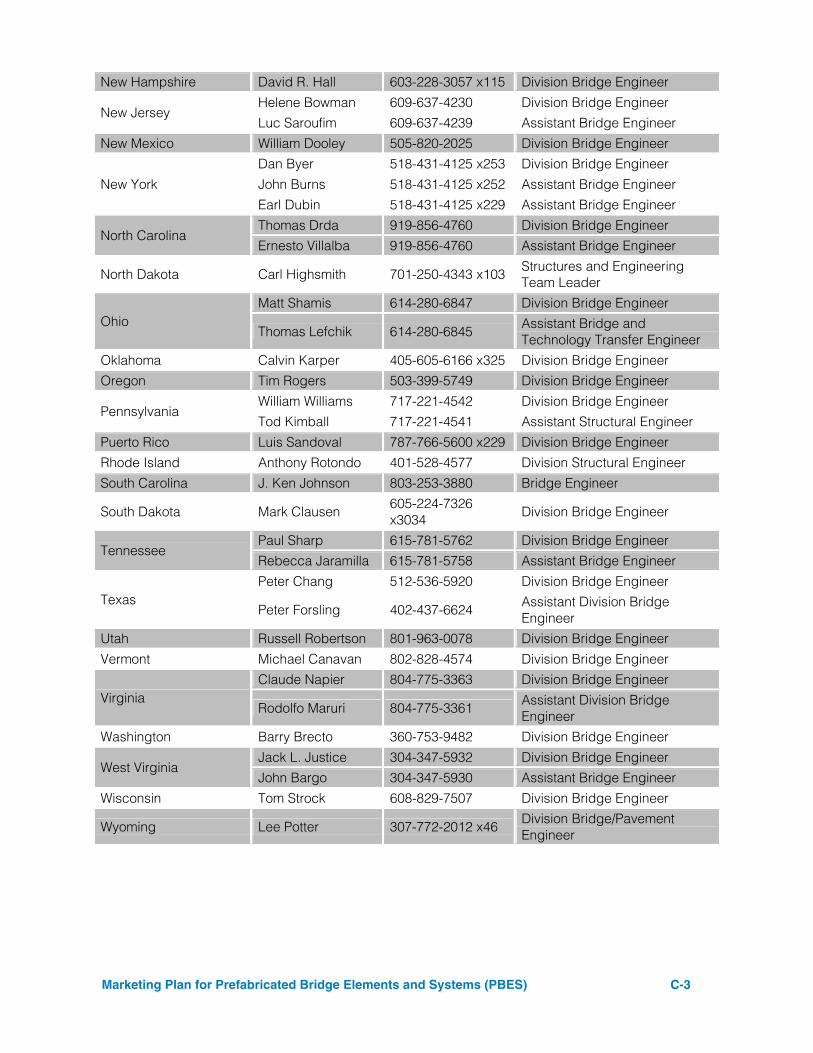
Marketing Plan for Prefabricated Bridge Elements and Systems (PBES) C-3
New Hampshire David R. Hall 603-228-3057 x115 Division Bridge Engineer
New Jersey Helene Bowman 609-637-4230 Division Bridge Engineer Luc Saroufim 609-637-4239 Assistant Bridge Engineer
New Mexico William Dooley 505-820-2025 Division Bridge Engineer
New York
Dan Byer 518-431-4125 x253 Division Bridge Engineer
John Burns 518-431-4125 x252 Assistant Bridge Engineer Earl Dubin 518-431-4125 x229 Assistant Bridge Engineer
North Carolina Thomas Drda 919-856-4760 Division Bridge Engineer Ernesto Villalba 919-856-4760 Assistant Bridge Engineer
North Dakota Carl Highsmith 701-250-4343 x103 Structures and Engineering Team Leader
Ohio Matt Shamis 614-280-6847 Division Bridge Engineer
Thomas Lefchik 614-280-6845 Assistant Bridge and Technology Transfer Engineer
Oklahoma Calvin Karper 405-605-6166 x325 Division Bridge Engineer Oregon Tim Rogers 503-399-5749 Division Bridge Engineer
Pennsylvania William Williams 717-221-4542 Division Bridge Engineer Tod Kimball 717-221-4541 Assistant Structural Engineer
Puerto Rico Luis Sandoval 787-766-5600 x229 Division Bridge Engineer Rhode Island Anthony Rotondo 401-528-4577 Division Structural Engineer
South Carolina J. Ken Johnson 803-253-3880 Bridge Engineer
South Dakota Mark Clausen 605-224-7326 x3034 Division Bridge Engineer
Tennessee Paul Sharp 615-781-5762 Division Bridge Engineer Rebecca Jaramilla 615-781-5758 Assistant Bridge Engineer
Texas Peter Chang 512-536-5920 Division Bridge Engineer
Peter Forsling 402-437-6624 Assistant Division Bridge Engineer
Utah Russell Robertson 801-963-0078 Division Bridge Engineer
Vermont Michael Canavan 802-828-4574 Division Bridge Engineer
Virginia Claude Napier 804-775-3363 Division Bridge Engineer
Rodolfo Maruri 804-775-3361 Assistant Division Bridge Engineer
Washington Barry Brecto 360-753-9482 Division Bridge Engineer
West Virginia Jack L. Justice 304-347-5932 Division Bridge Engineer John Bargo 304-347-5930 Assistant Bridge Engineer
Wisconsin Tom Strock 608-829-7507 Division Bridge Engineer
Wyoming Lee Potter 307-772-2012 x46 Division Bridge/Pavement Engineer
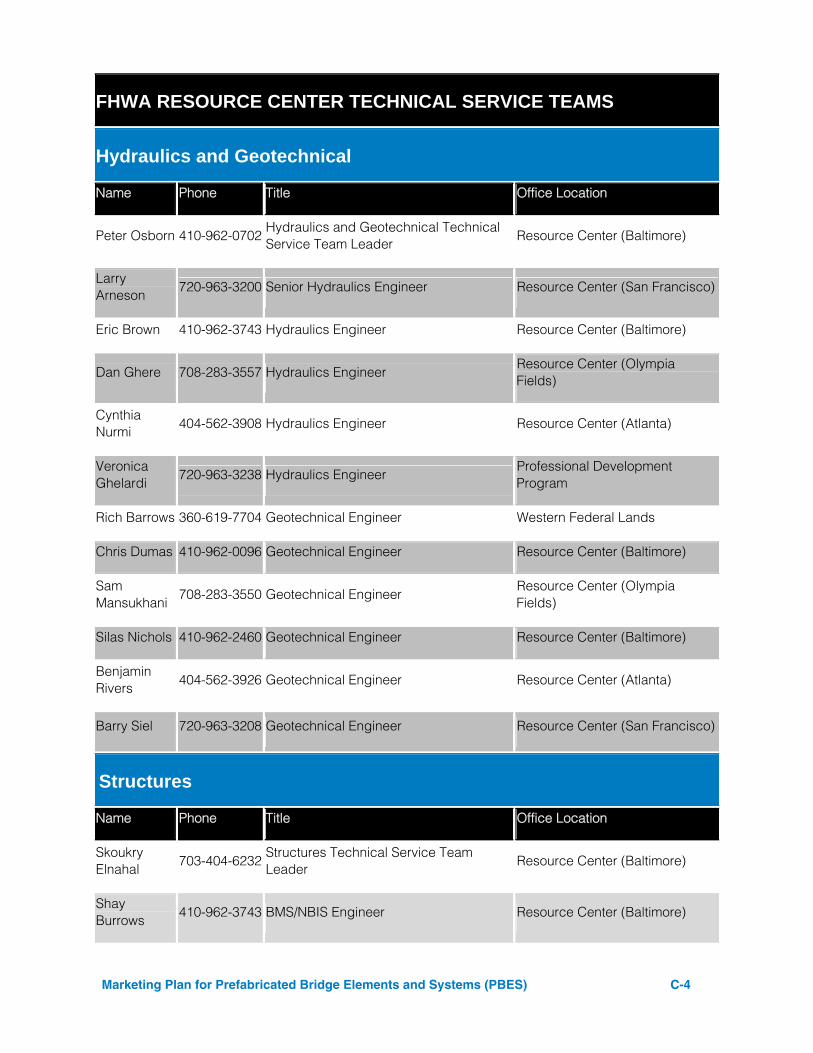
Marketing Plan for Prefabricated Bridge Elements and Systems (PBES) C-4
FHWA RESOURCE CENTER TECHNICAL SERVICE TEAMS
Hydraulics and Geotechnical
Name Phone Title Office Location
Peter Osborn 410-962-0702 Hydraulics and Geotechnical Technical Service Team Leader
Resource Center (Baltimore)
Larry Arneson
720-963-3200 Senior Hydraulics Engineer Resource Center (San Francisco)
Eric Brown 410-962-3743 Hydraulics Engineer Resource Center (Baltimore)
Dan Ghere 708-283-3557 Hydraulics Engineer Resource Center (Olympia Fields)
Cynthia Nurmi
404-562-3908 Hydraulics Engineer Resource Center (Atlanta)
Veronica Ghelardi
720-963-3238 Hydraulics Engineer Professional Development Program
Rich Barrows 360-619-7704 Geotechnical Engineer Western Federal Lands
Chris Dumas 410-962-0096 Geotechnical Engineer Resource Center (Baltimore)
Sam Mansukhani
708-283-3550 Geotechnical Engineer Resource Center (Olympia Fields)
Silas Nichols 410-962-2460 Geotechnical Engineer Resource Center (Baltimore)
Benjamin Rivers
404-562-3926 Geotechnical Engineer Resource Center (Atlanta)
Barry Siel 720-963-3208 Geotechnical Engineer Resource Center (San Francisco)
Structures
Name Phone Title Office Location
Skoukry Elnahal
703-404-6232 Structures Technical Service Team Leader
Resource Center (Baltimore)
Shay Burrows
410-962-3743 BMS/NBIS Engineer Resource Center (Baltimore)
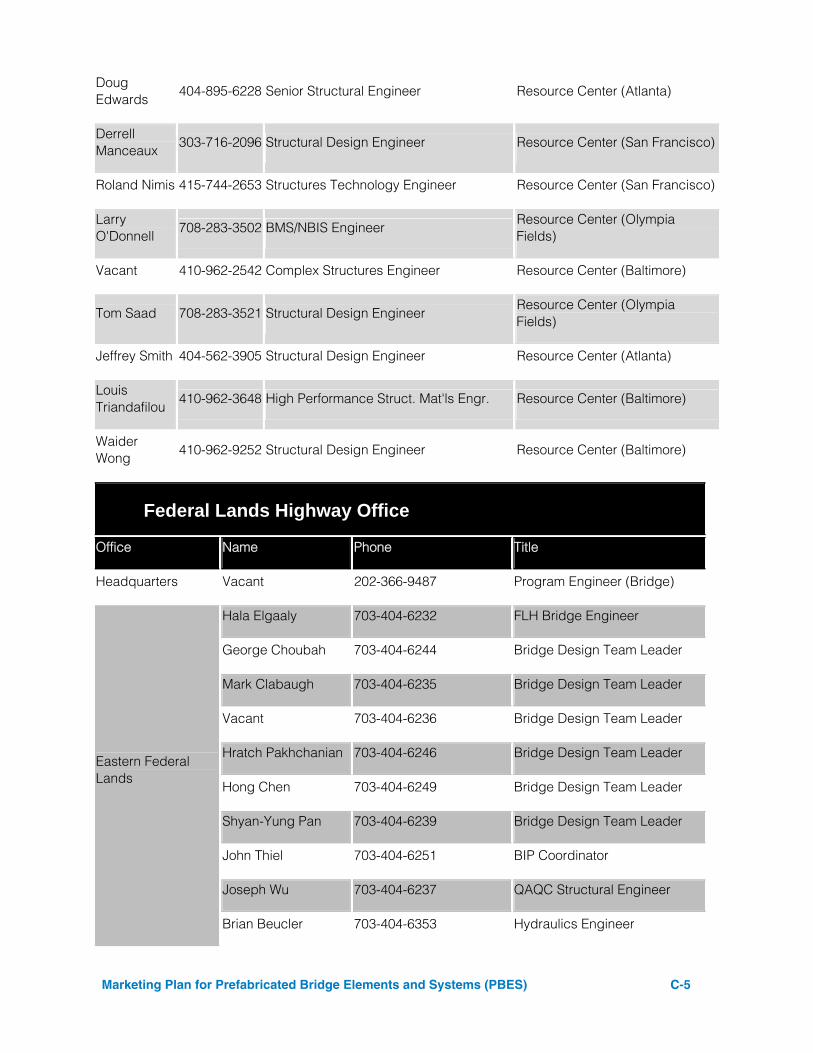
Marketing Plan for Prefabricated Bridge Elements and Systems (PBES) C-5
Doug Edwards
404-895-6228 Senior Structural Engineer Resource Center (Atlanta)
Derrell Manceaux
303-716-2096 Structural Design Engineer Resource Center (San Francisco)
Roland Nimis 415-744-2653 Structures Technology Engineer Resource Center (San Francisco)
Larry O'Donnell
708-283-3502 BMS/NBIS Engineer Resource Center (Olympia Fields)
Vacant 410-962-2542 Complex Structures Engineer Resource Center (Baltimore)
Tom Saad 708-283-3521 Structural Design Engineer Resource Center (Olympia Fields)
Jeffrey Smith 404-562-3905 Structural Design Engineer Resource Center (Atlanta)
Louis Triandafilou
410-962-3648 High Performance Struct. Mat'ls Engr. Resource Center (Baltimore)
Waider Wong
410-962-9252 Structural Design Engineer Resource Center (Baltimore)
Federal Lands Highway Office
Office Name Phone Title
Headquarters Vacant 202-366-9487 Program Engineer (Bridge)
Eastern Federal Lands
Hala Elgaaly 703-404-6232 FLH Bridge Engineer
George Choubah 703-404-6244 Bridge Design Team Leader
Mark Clabaugh 703-404-6235 Bridge Design Team Leader
Vacant 703-404-6236 Bridge Design Team Leader
Hratch Pakhchanian 703-404-6246 Bridge Design Team Leader
Hong Chen 703-404-6249 Bridge Design Team Leader
Shyan-Yung Pan 703-404-6239 Bridge Design Team Leader
John Thiel 703-404-6251 BIP Coordinator
Joseph Wu 703-404-6237 QAQC Structural Engineer
Brian Beucler 703-404-6353 Hydraulics Engineer
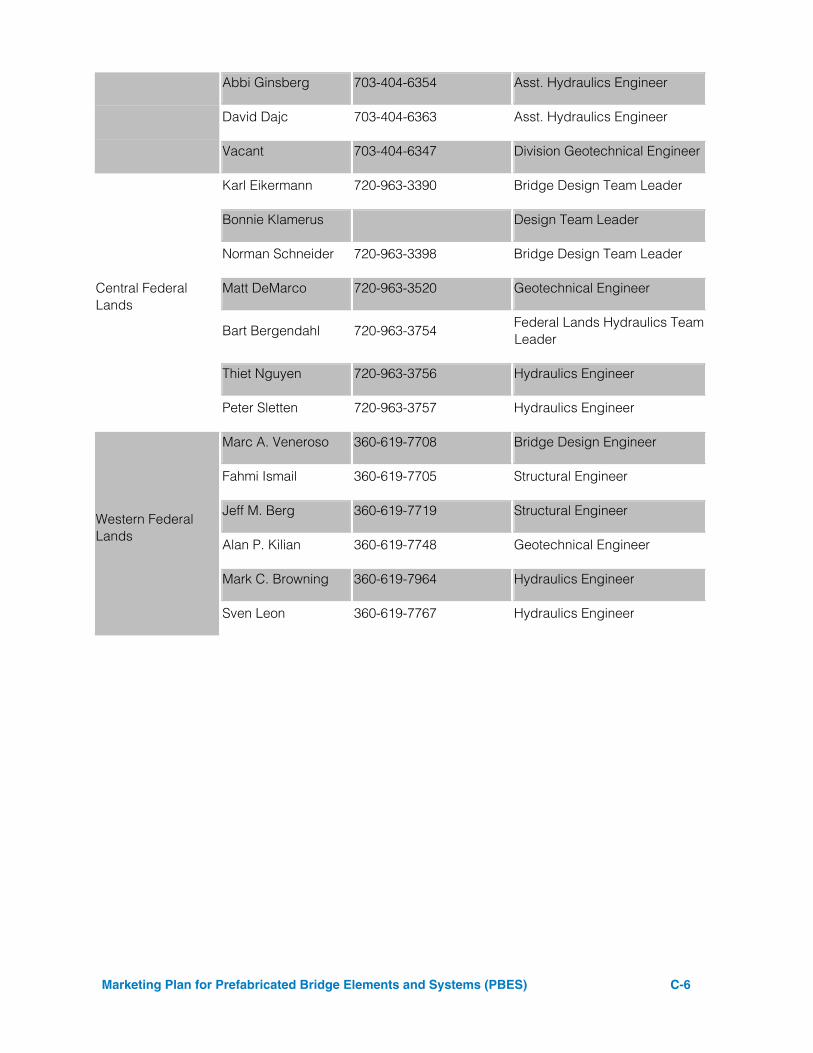
Marketing Plan for Prefabricated Bridge Elements and Systems (PBES) C-6
Abbi Ginsberg 703-404-6354 Asst. Hydraulics Engineer
David Dajc 703-404-6363 Asst. Hydraulics Engineer
Vacant 703-404-6347 Division Geotechnical Engineer
Central Federal Lands
Karl Eikermann 720-963-3390 Bridge Design Team Leader
Bonnie Klamerus Design Team Leader
Norman Schneider 720-963-3398 Bridge Design Team Leader
Matt DeMarco 720-963-3520 Geotechnical Engineer
Bart Bergendahl 720-963-3754 Federal Lands Hydraulics Team Leader
Thiet Nguyen 720-963-3756 Hydraulics Engineer
Peter Sletten 720-963-3757 Hydraulics Engineer
Western Federal Lands
Marc A. Veneroso 360-619-7708 Bridge Design Engineer
Fahmi Ismail 360-619-7705 Structural Engineer
Jeff M. Berg 360-619-7719 Structural Engineer
Alan P. Kilian 360-619-7748 Geotechnical Engineer
Mark C. Browning 360-619-7964 Hydraulics Engineer
Sven Leon 360-619-7767 Hydraulics Engineer
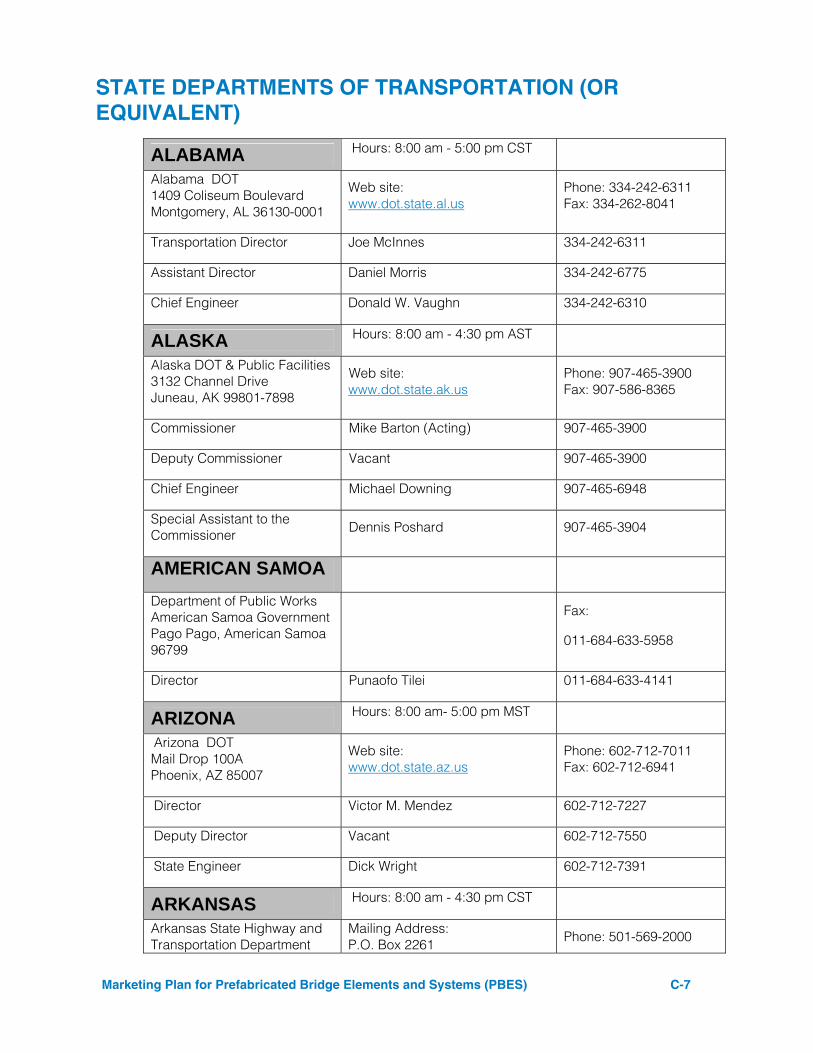
Marketing Plan for Prefabricated Bridge Elements and Systems (PBES) C-7
STATE DEPARTMENTS OF TRANSPORTATION (OR EQUIVALENT)
ALABAMA Hours: 8:00 am - 5:00 pm CST
Alabama DOT 1409 Coliseum Boulevard Montgomery, AL 36130-0001
Web site: www.dot.state.al.us
Phone: 334-242-6311 Fax: 334-262-8041
Transportation Director Joe McInnes 334-242-6311
Assistant Director Daniel Morris 334-242-6775
Chief Engineer Donald W. Vaughn 334-242-6310
ALASKA Hours: 8:00 am - 4:30 pm AST
Alaska DOT & Public Facilities 3132 Channel Drive Juneau, AK 99801-7898
Web site: www.dot.state.ak.us
Phone: 907-465-3900 Fax: 907-586-8365
Commissioner Mike Barton (Acting) 907-465-3900
Deputy Commissioner Vacant 907-465-3900
Chief Engineer Michael Downing 907-465-6948
Special Assistant to the Commissioner Dennis Poshard 907-465-3904
AMERICAN SAMOA
Department of Public Works American Samoa Government Pago Pago, American Samoa 96799
Fax:
011-684-633-5958
Director Punaofo Tilei 011-684-633-4141
ARIZONA Hours: 8:00 am- 5:00 pm MST
Arizona DOT Mail Drop 100A Phoenix, AZ 85007
Web site: www.dot.state.az.us
Phone: 602-712-7011 Fax: 602-712-6941
Director Victor M. Mendez 602-712-7227
Deputy Director Vacant 602-712-7550
State Engineer Dick Wright 602-712-7391
ARKANSAS Hours: 8:00 am - 4:30 pm CST
Arkansas State Highway and Transportation Department
Mailing Address: P.O. Box 2261 Phone: 501-569-2000
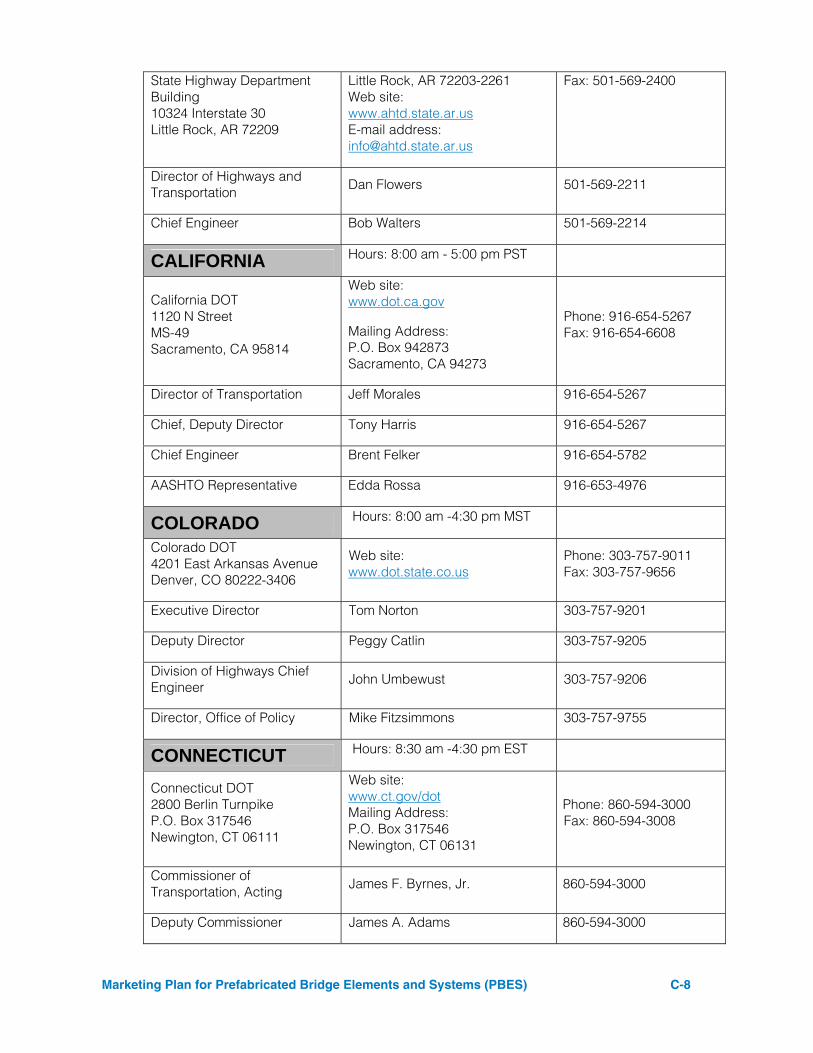
Marketing Plan for Prefabricated Bridge Elements and Systems (PBES) C-8
State Highway Department Building 10324 Interstate 30 Little Rock, AR 72209
Little Rock, AR 72203-2261 Web site: www.ahtd.state.ar.us E-mail address: [email protected]
Fax: 501-569-2400
Director of Highways and Transportation Dan Flowers 501-569-2211
Chief Engineer Bob Walters 501-569-2214
CALIFORNIA Hours: 8:00 am - 5:00 pm PST
California DOT 1120 N Street MS-49 Sacramento, CA 95814
Web site: www.dot.ca.gov
Mailing Address: P.O. Box 942873 Sacramento, CA 94273
Phone: 916-654-5267 Fax: 916-654-6608
Director of Transportation Jeff Morales 916-654-5267
Chief, Deputy Director Tony Harris 916-654-5267
Chief Engineer Brent Felker 916-654-5782
AASHTO Representative Edda Rossa 916-653-4976
COLORADO Hours: 8:00 am -4:30 pm MST
Colorado DOT 4201 East Arkansas Avenue Denver, CO 80222-3406
Web site: www.dot.state.co.us
Phone: 303-757-9011 Fax: 303-757-9656
Executive Director Tom Norton 303-757-9201
Deputy Director Peggy Catlin 303-757-9205
Division of Highways Chief Engineer
John Umbewust 303-757-9206
Director, Office of Policy Mike Fitzsimmons 303-757-9755
CONNECTICUT Hours: 8:30 am -4:30 pm EST
Connecticut DOT 2800 Berlin Turnpike P.O. Box 317546 Newington, CT 06111
Web site: www.ct.gov/dot Mailing Address: P.O. Box 317546 Newington, CT 06131
Phone: 860-594-3000 Fax: 860-594-3008
Commissioner of Transportation, Acting
James F. Byrnes, Jr. 860-594-3000
Deputy Commissioner James A. Adams 860-594-3000
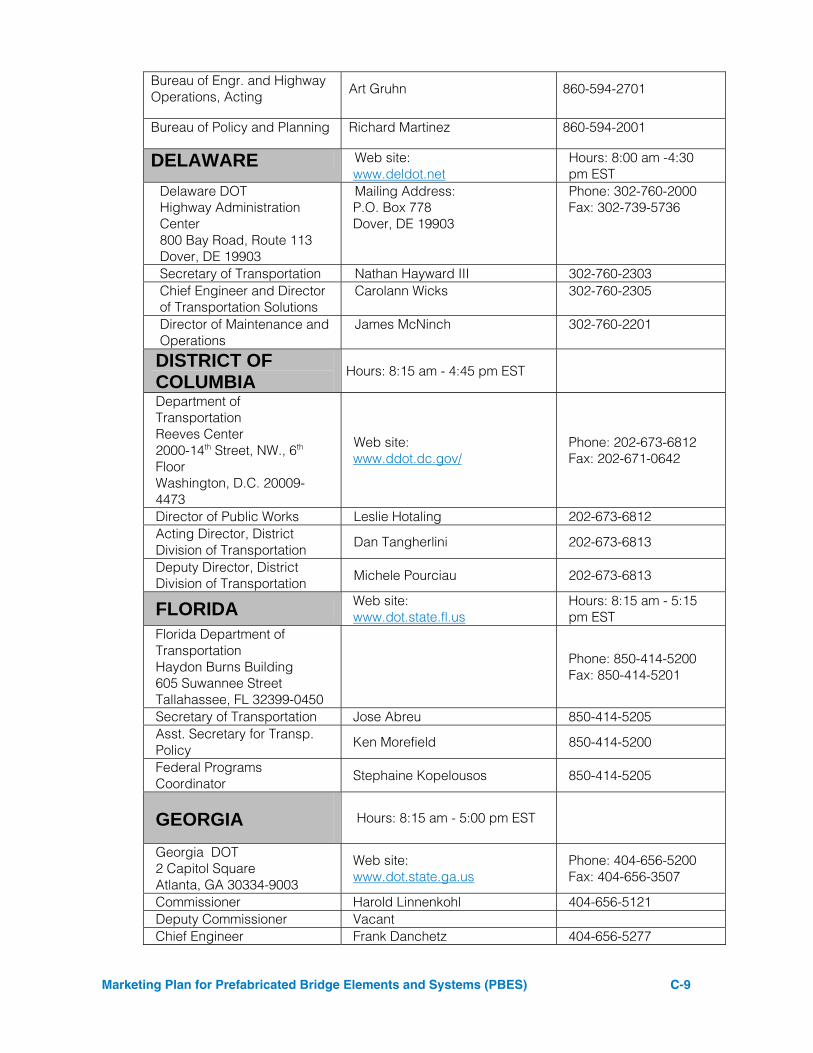
Marketing Plan for Prefabricated Bridge Elements and Systems (PBES) C-9
Bureau of Engr. and Highway Operations, Acting Art Gruhn 860-594-2701
Bureau of Policy and Planning Richard Martinez 860-594-2001
DELAWARE Web site: www.deldot.net
Hours: 8:00 am -4:30 pm EST
Delaware DOT Highway Administration Center 800 Bay Road, Route 113 Dover, DE 19903
Mailing Address: P.O. Box 778 Dover, DE 19903
Phone: 302-760-2000 Fax: 302-739-5736
Secretary of Transportation Nathan Hayward III 302-760-2303 Chief Engineer and Director of Transportation Solutions
Carolann Wicks 302-760-2305
Director of Maintenance and Operations
James McNinch 302-760-2201
DISTRICT OF COLUMBIA
Hours: 8:15 am - 4:45 pm EST
Department of Transportation Reeves Center 2000-14th Street, NW., 6th Floor Washington, D.C. 20009-4473
Web site: www.ddot.dc.gov/
Phone: 202-673-6812 Fax: 202-671-0642
Director of Public Works Leslie Hotaling 202-673-6812 Acting Director, District Division of Transportation Dan Tangherlini 202-673-6813
Deputy Director, District Division of Transportation Michele Pourciau 202-673-6813
FLORIDA Web site: www.dot.state.fl.us
Hours: 8:15 am - 5:15 pm EST
Florida Department of Transportation Haydon Burns Building 605 Suwannee Street Tallahassee, FL 32399-0450
Phone: 850-414-5200 Fax: 850-414-5201
Secretary of Transportation Jose Abreu 850-414-5205 Asst. Secretary for Transp. Policy Ken Morefield 850-414-5200
Federal Programs Coordinator
Stephaine Kopelousos 850-414-5205
GEORGIA Hours: 8:15 am - 5:00 pm EST
Georgia DOT 2 Capitol Square Atlanta, GA 30334-9003
Web site: www.dot.state.ga.us
Phone: 404-656-5200 Fax: 404-656-3507
Commissioner Harold Linnenkohl 404-656-5121 Deputy Commissioner Vacant Chief Engineer Frank Danchetz 404-656-5277
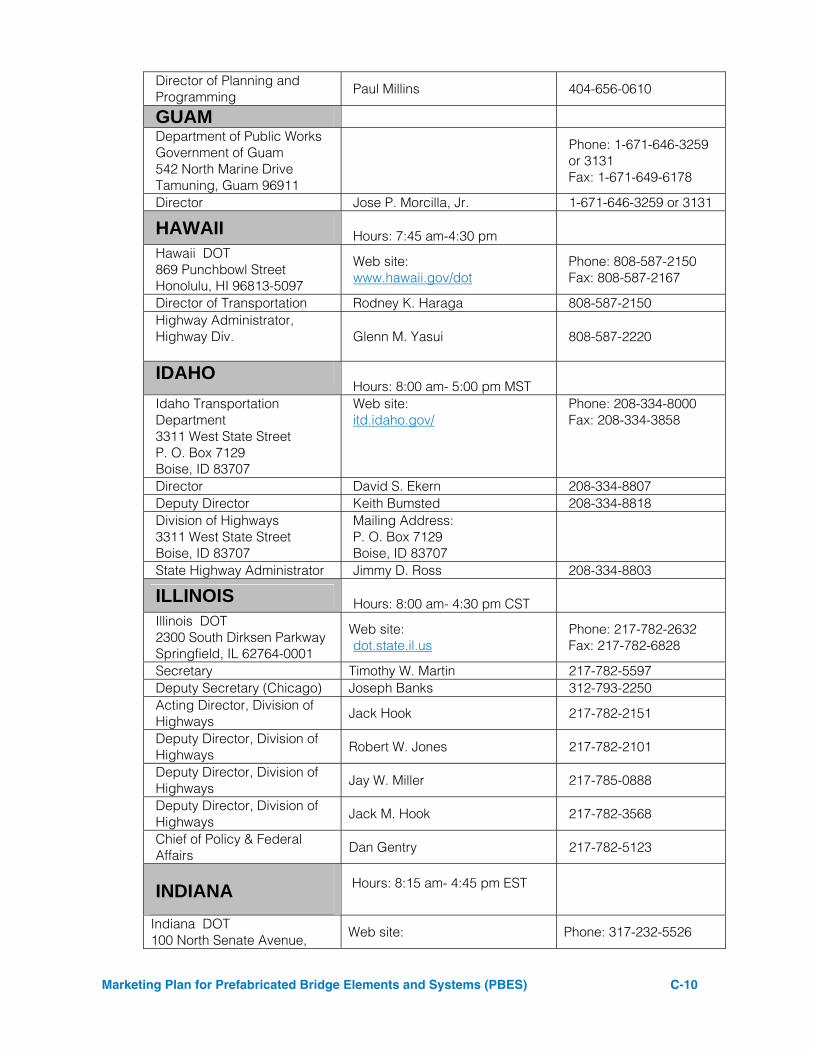
Marketing Plan for Prefabricated Bridge Elements and Systems (PBES) C-10
Director of Planning and Programming Paul Millins 404-656-0610
GUAM Department of Public Works Government of Guam 542 North Marine Drive Tamuning, Guam 96911
Phone: 1-671-646-3259 or 3131 Fax: 1-671-649-6178
Director Jose P. Morcilla, Jr. 1-671-646-3259 or 3131
HAWAII Hours: 7:45 am-4:30 pm
Hawaii DOT 869 Punchbowl Street Honolulu, HI 96813-5097
Web site: www.hawaii.gov/dot
Phone: 808-587-2150 Fax: 808-587-2167
Director of Transportation Rodney K. Haraga 808-587-2150 Highway Administrator, Highway Div.
Glenn M. Yasui 808-587-2220
IDAHO Hours: 8:00 am- 5:00 pm MST
Idaho Transportation Department 3311 West State Street P. O. Box 7129 Boise, ID 83707
Web site: itd.idaho.gov/
Phone: 208-334-8000 Fax: 208-334-3858
Director David S. Ekern 208-334-8807 Deputy Director Keith Bumsted 208-334-8818 Division of Highways 3311 West State Street Boise, ID 83707
Mailing Address: P. O. Box 7129 Boise, ID 83707
State Highway Administrator Jimmy D. Ross 208-334-8803
ILLINOIS Hours: 8:00 am- 4:30 pm CST
Illinois DOT 2300 South Dirksen Parkway Springfield, IL 62764-0001
Web site: dot.state.il.us
Phone: 217-782-2632 Fax: 217-782-6828
Secretary Timothy W. Martin 217-782-5597 Deputy Secretary (Chicago) Joseph Banks 312-793-2250 Acting Director, Division of Highways
Jack Hook 217-782-2151
Deputy Director, Division of Highways Robert W. Jones 217-782-2101
Deputy Director, Division of Highways Jay W. Miller 217-785-0888
Deputy Director, Division of Highways
Jack M. Hook 217-782-3568
Chief of Policy & Federal Affairs Dan Gentry 217-782-5123
INDIANA Hours: 8:15 am- 4:45 pm EST
Indiana DOT 100 North Senate Avenue,
Web site: Phone: 317-232-5526
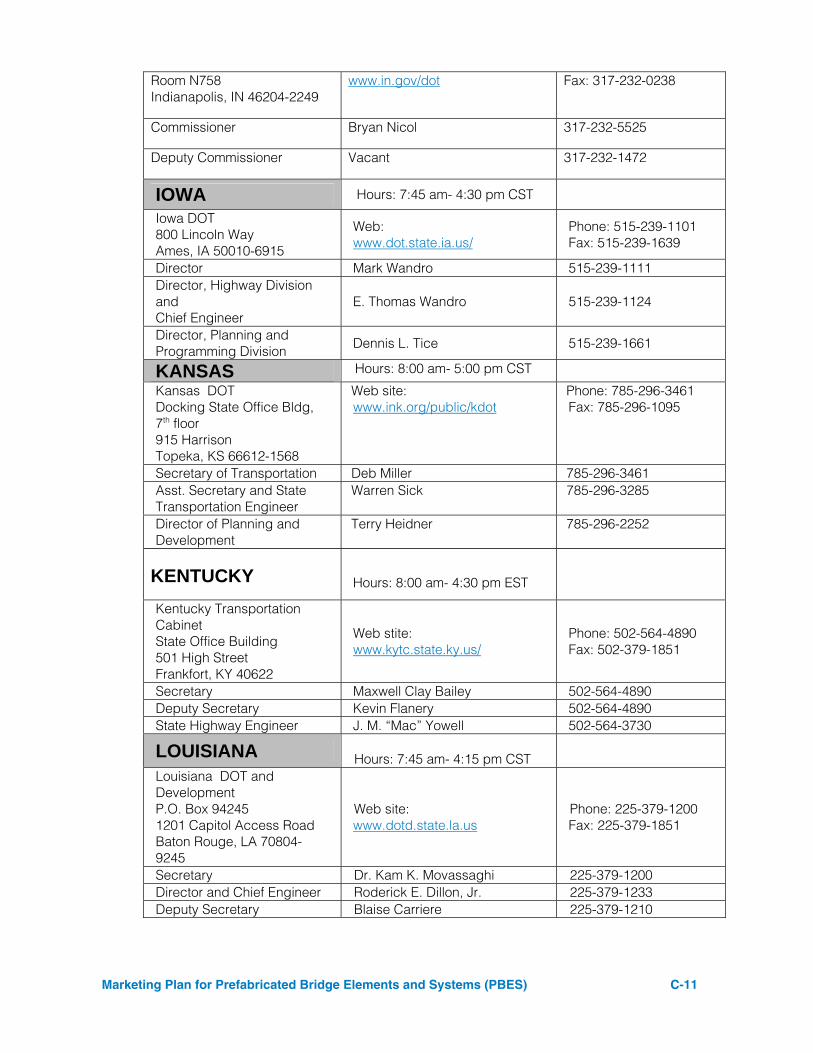
Marketing Plan for Prefabricated Bridge Elements and Systems (PBES) C-11
Room N758 Indianapolis, IN 46204-2249
www.in.gov/dot Fax: 317-232-0238
Commissioner Bryan Nicol 317-232-5525
Deputy Commissioner Vacant 317-232-1472
IOWA Hours: 7:45 am- 4:30 pm CST
Iowa DOT 800 Lincoln Way Ames, IA 50010-6915
Web: www.dot.state.ia.us/
Phone: 515-239-1101 Fax: 515-239-1639
Director Mark Wandro 515-239-1111 Director, Highway Division and Chief Engineer
E. Thomas Wandro 515-239-1124
Director, Planning and Programming Division Dennis L. Tice 515-239-1661
KANSAS Hours: 8:00 am- 5:00 pm CST Kansas DOT Docking State Office Bldg, 7th floor 915 Harrison Topeka, KS 66612-1568
Web site: www.ink.org/public/kdot
Phone: 785-296-3461 Fax: 785-296-1095
Secretary of Transportation Deb Miller 785-296-3461 Asst. Secretary and State Transportation Engineer
Warren Sick 785-296-3285
Director of Planning and Development
Terry Heidner 785-296-2252
KENTUCKY Hours: 8:00 am- 4:30 pm EST
Kentucky Transportation Cabinet State Office Building 501 High Street Frankfort, KY 40622
Web stite: www.kytc.state.ky.us/
Phone: 502-564-4890 Fax: 502-379-1851
Secretary Maxwell Clay Bailey 502-564-4890 Deputy Secretary Kevin Flanery 502-564-4890 State Highway Engineer J. M. “Mac” Yowell 502-564-3730
LOUISIANA Hours: 7:45 am- 4:15 pm CST
Louisiana DOT and Development P.O. Box 94245 1201 Capitol Access Road Baton Rouge, LA 70804-9245
Web site: www.dotd.state.la.us
Phone: 225-379-1200 Fax: 225-379-1851
Secretary Dr. Kam K. Movassaghi 225-379-1200 Director and Chief Engineer Roderick E. Dillon, Jr. 225-379-1233 Deputy Secretary Blaise Carriere 225-379-1210
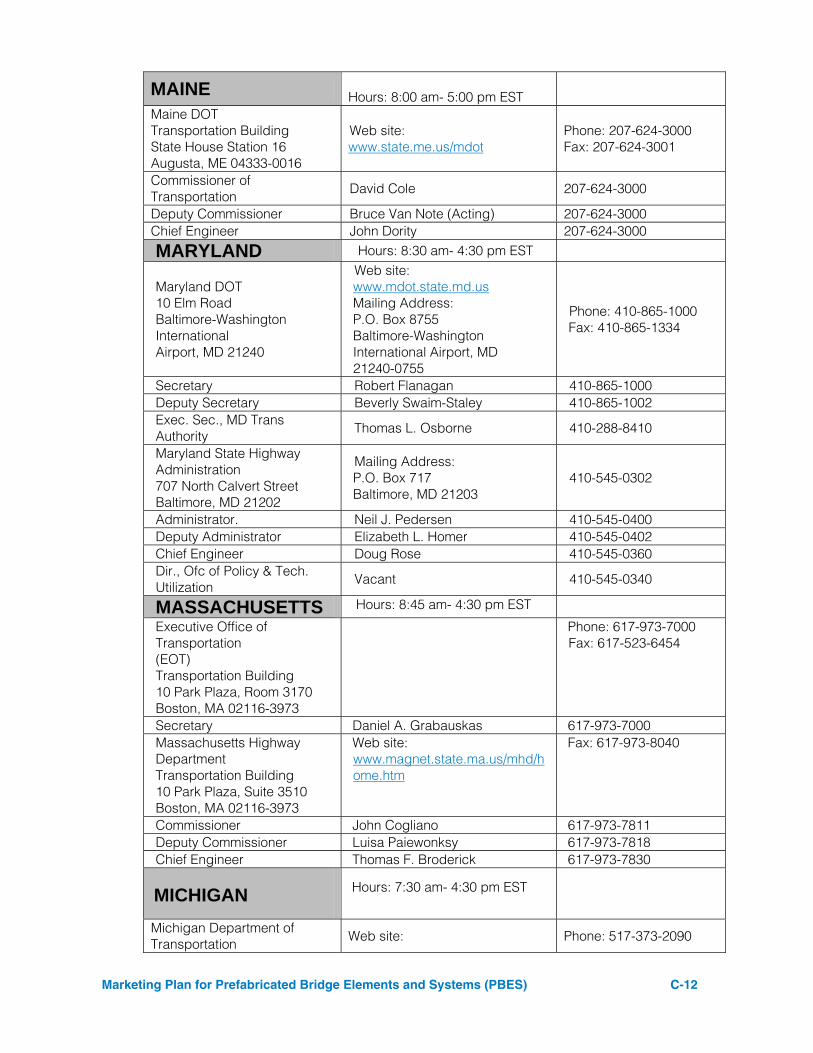
Marketing Plan for Prefabricated Bridge Elements and Systems (PBES) C-12
MAINE Hours: 8:00 am- 5:00 pm EST
Maine DOT Transportation Building State House Station 16 Augusta, ME 04333-0016
Web site: www.state.me.us/mdot
Phone: 207-624-3000 Fax: 207-624-3001
Commissioner of Transportation David Cole 207-624-3000
Deputy Commissioner Bruce Van Note (Acting) 207-624-3000 Chief Engineer John Dority 207-624-3000
MARYLAND Hours: 8:30 am- 4:30 pm EST
Maryland DOT 10 Elm Road Baltimore-Washington International Airport, MD 21240
Web site: www.mdot.state.md.us Mailing Address: P.O. Box 8755 Baltimore-Washington International Airport, MD 21240-0755
Phone: 410-865-1000 Fax: 410-865-1334
Secretary Robert Flanagan 410-865-1000 Deputy Secretary Beverly Swaim-Staley 410-865-1002 Exec. Sec., MD Trans Authority Thomas L. Osborne 410-288-8410
Maryland State Highway Administration 707 North Calvert Street Baltimore, MD 21202
Mailing Address: P.O. Box 717 Baltimore, MD 21203
410-545-0302
Administrator. Neil J. Pedersen 410-545-0400 Deputy Administrator Elizabeth L. Homer 410-545-0402 Chief Engineer Doug Rose 410-545-0360 Dir., Ofc of Policy & Tech. Utilization
Vacant 410-545-0340
MASSACHUSETTS Hours: 8:45 am- 4:30 pm EST Executive Office of Transportation (EOT) Transportation Building 10 Park Plaza, Room 3170 Boston, MA 02116-3973
Phone: 617-973-7000 Fax: 617-523-6454
Secretary Daniel A. Grabauskas 617-973-7000 Massachusetts Highway Department Transportation Building 10 Park Plaza, Suite 3510 Boston, MA 02116-3973
Web site: www.magnet.state.ma.us/mhd/home.htm
Fax: 617-973-8040
Commissioner John Cogliano 617-973-7811 Deputy Commissioner Luisa Paiewonksy 617-973-7818 Chief Engineer Thomas F. Broderick 617-973-7830
MICHIGAN Hours: 7:30 am- 4:30 pm EST
Michigan Department of Transportation Web site: Phone: 517-373-2090
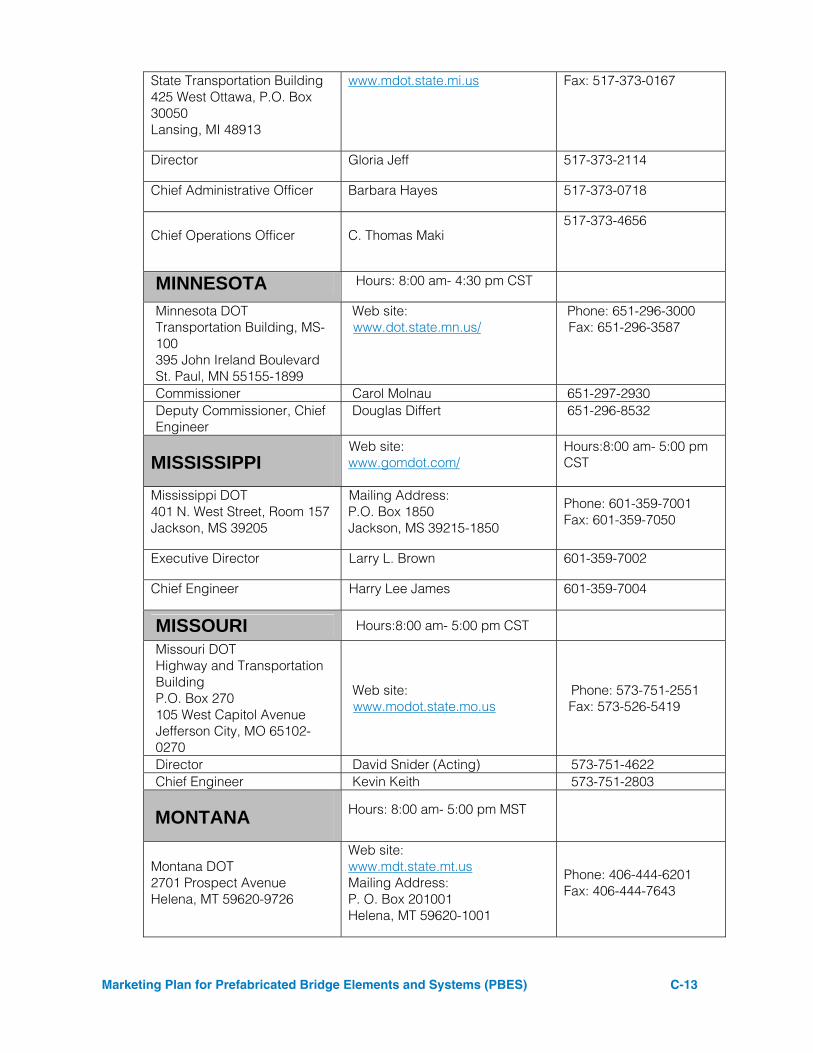
Marketing Plan for Prefabricated Bridge Elements and Systems (PBES) C-13
State Transportation Building 425 West Ottawa, P.O. Box 30050 Lansing, MI 48913
www.mdot.state.mi.us Fax: 517-373-0167
Director Gloria Jeff 517-373-2114
Chief Administrative Officer Barbara Hayes 517-373-0718
Chief Operations Officer C. Thomas Maki 517-373-4656
MINNESOTA Hours: 8:00 am- 4:30 pm CST
Minnesota DOT Transportation Building, MS-100 395 John Ireland Boulevard St. Paul, MN 55155-1899
Web site: www.dot.state.mn.us/
Phone: 651-296-3000 Fax: 651-296-3587
Commissioner Carol Molnau 651-297-2930 Deputy Commissioner, Chief Engineer
Douglas Differt 651-296-8532
MISSISSIPPI Web site: www.gomdot.com/
Hours:8:00 am- 5:00 pm CST
Mississippi DOT 401 N. West Street, Room 157 Jackson, MS 39205
Mailing Address: P.O. Box 1850 Jackson, MS 39215-1850
Phone: 601-359-7001 Fax: 601-359-7050
Executive Director Larry L. Brown 601-359-7002
Chief Engineer Harry Lee James 601-359-7004
MISSOURI Hours:8:00 am- 5:00 pm CST
Missouri DOT Highway and Transportation Building P.O. Box 270 105 West Capitol Avenue Jefferson City, MO 65102-0270
Web site: www.modot.state.mo.us
Phone: 573-751-2551 Fax: 573-526-5419
Director David Snider (Acting) 573-751-4622 Chief Engineer Kevin Keith 573-751-2803
MONTANA Hours: 8:00 am- 5:00 pm MST
Montana DOT 2701 Prospect Avenue Helena, MT 59620-9726
Web site: www.mdt.state.mt.us Mailing Address: P. O. Box 201001 Helena, MT 59620-1001
Phone: 406-444-6201 Fax: 406-444-7643
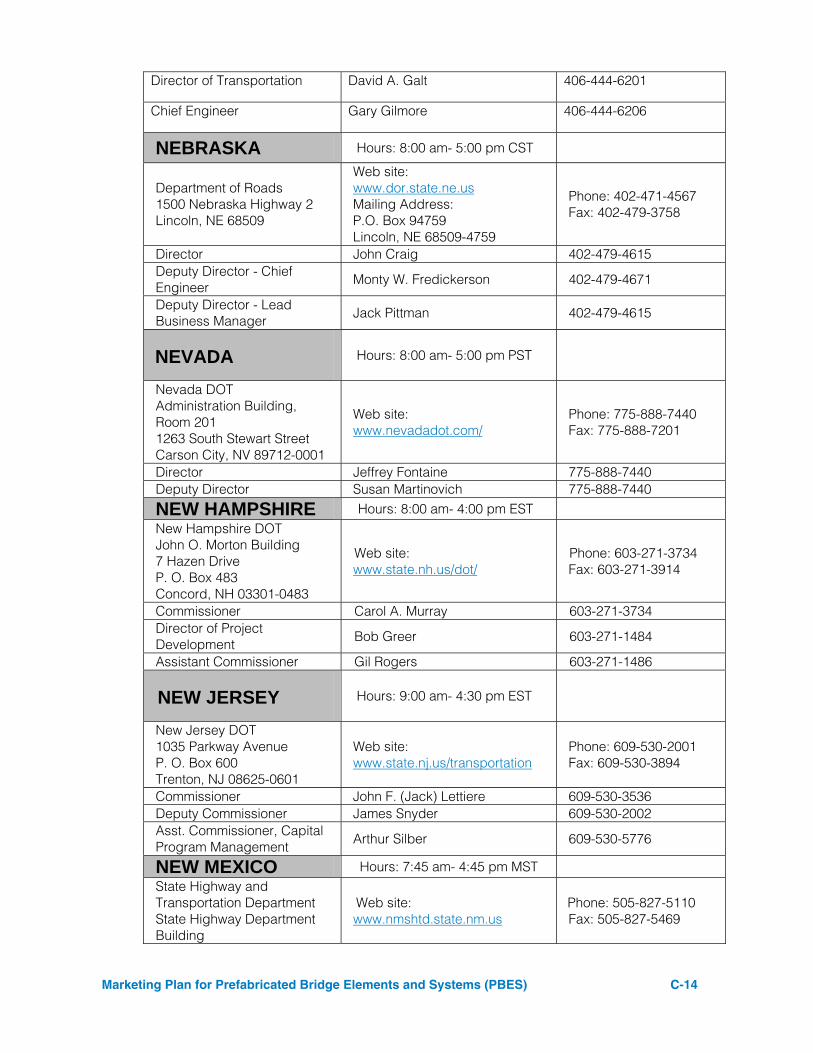
Marketing Plan for Prefabricated Bridge Elements and Systems (PBES) C-14
Director of Transportation David A. Galt 406-444-6201
Chief Engineer Gary Gilmore 406-444-6206
NEBRASKA Hours: 8:00 am- 5:00 pm CST
Department of Roads 1500 Nebraska Highway 2 Lincoln, NE 68509
Web site: www.dor.state.ne.us Mailing Address: P.O. Box 94759 Lincoln, NE 68509-4759
Phone: 402-471-4567 Fax: 402-479-3758
Director John Craig 402-479-4615 Deputy Director - Chief Engineer
Monty W. Fredickerson 402-479-4671
Deputy Director - Lead Business Manager Jack Pittman 402-479-4615
NEVADA Hours: 8:00 am- 5:00 pm PST
Nevada DOT Administration Building, Room 201 1263 South Stewart Street Carson City, NV 89712-0001
Web site: www.nevadadot.com/
Phone: 775-888-7440 Fax: 775-888-7201
Director Jeffrey Fontaine 775-888-7440 Deputy Director Susan Martinovich 775-888-7440
NEW HAMPSHIRE Hours: 8:00 am- 4:00 pm EST New Hampshire DOT John O. Morton Building 7 Hazen Drive P. O. Box 483 Concord, NH 03301-0483
Web site: www.state.nh.us/dot/
Phone: 603-271-3734 Fax: 603-271-3914
Commissioner Carol A. Murray 603-271-3734 Director of Project Development Bob Greer 603-271-1484
Assistant Commissioner Gil Rogers 603-271-1486
NEW JERSEY Hours: 9:00 am- 4:30 pm EST
New Jersey DOT 1035 Parkway Avenue P. O. Box 600 Trenton, NJ 08625-0601
Web site: www.state.nj.us/transportation
Phone: 609-530-2001 Fax: 609-530-3894
Commissioner John F. (Jack) Lettiere 609-530-3536 Deputy Commissioner James Snyder 609-530-2002 Asst. Commissioner, Capital Program Management Arthur Silber 609-530-5776
NEW MEXICO Hours: 7:45 am- 4:45 pm MST State Highway and Transportation Department State Highway Department Building
Web site: www.nmshtd.state.nm.us
Phone: 505-827-5110 Fax: 505-827-5469
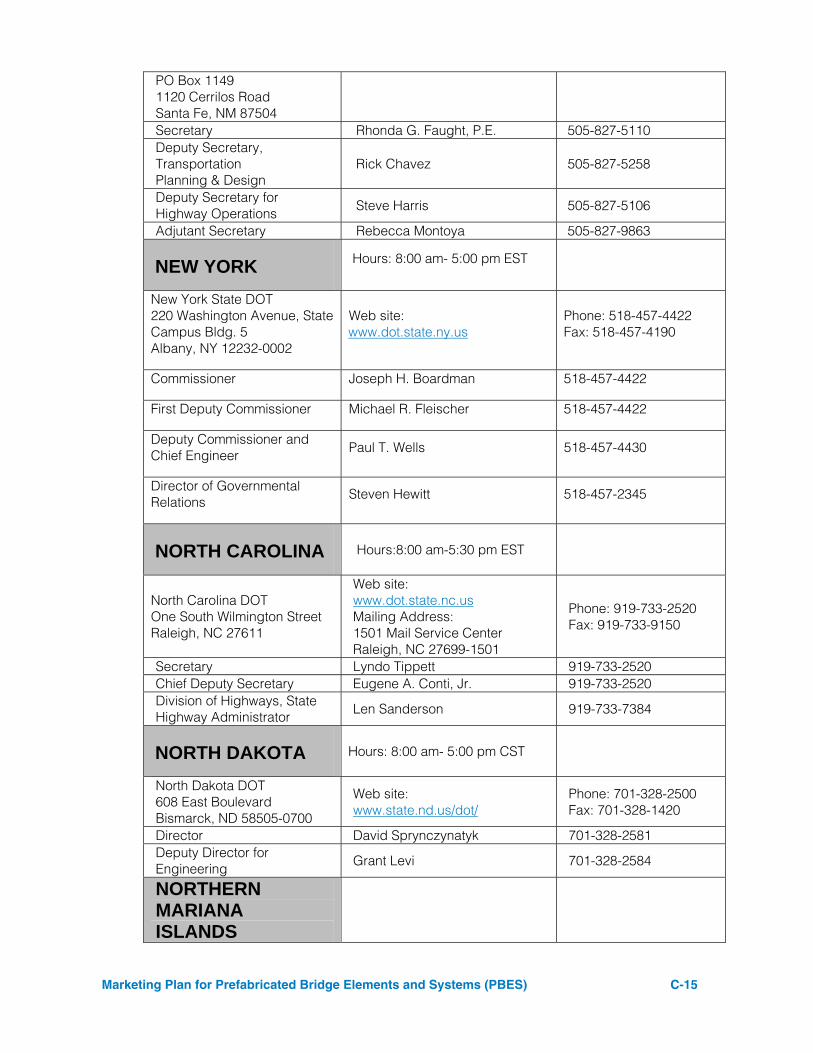
Marketing Plan for Prefabricated Bridge Elements and Systems (PBES) C-15
PO Box 1149 1120 Cerrilos Road Santa Fe, NM 87504 Secretary Rhonda G. Faught, P.E. 505-827-5110 Deputy Secretary, Transportation Planning & Design
Rick Chavez 505-827-5258
Deputy Secretary for Highway Operations Steve Harris 505-827-5106
Adjutant Secretary Rebecca Montoya 505-827-9863
NEW YORK Hours: 8:00 am- 5:00 pm EST
New York State DOT 220 Washington Avenue, State Campus Bldg. 5 Albany, NY 12232-0002
Web site: www.dot.state.ny.us
Phone: 518-457-4422 Fax: 518-457-4190
Commissioner Joseph H. Boardman 518-457-4422
First Deputy Commissioner Michael R. Fleischer 518-457-4422
Deputy Commissioner and Chief Engineer Paul T. Wells 518-457-4430
Director of Governmental Relations
Steven Hewitt 518-457-2345
NORTH CAROLINA Hours:8:00 am-5:30 pm EST
North Carolina DOT One South Wilmington Street Raleigh, NC 27611
Web site: www.dot.state.nc.us Mailing Address: 1501 Mail Service Center Raleigh, NC 27699-1501
Phone: 919-733-2520 Fax: 919-733-9150
Secretary Lyndo Tippett 919-733-2520 Chief Deputy Secretary Eugene A. Conti, Jr. 919-733-2520 Division of Highways, State Highway Administrator Len Sanderson 919-733-7384
NORTH DAKOTA Hours: 8:00 am- 5:00 pm CST
North Dakota DOT 608 East Boulevard Bismarck, ND 58505-0700
Web site: www.state.nd.us/dot/
Phone: 701-328-2500 Fax: 701-328-1420
Director David Sprynczynatyk 701-328-2581 Deputy Director for Engineering
Grant Levi 701-328-2584
NORTHERN MARIANA ISLANDS
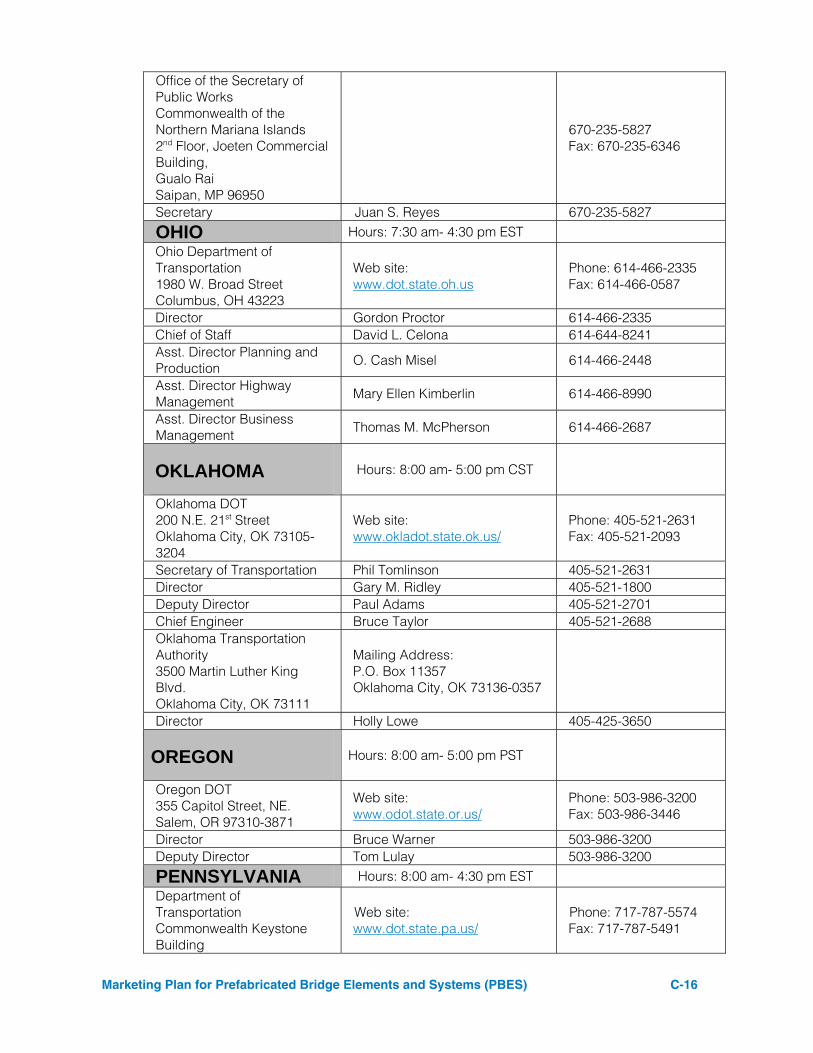
Marketing Plan for Prefabricated Bridge Elements and Systems (PBES) C-16
Office of the Secretary of Public Works Commonwealth of the Northern Mariana Islands 2nd Floor, Joeten Commercial Building, Gualo Rai Saipan, MP 96950
670-235-5827 Fax: 670-235-6346
Secretary Juan S. Reyes 670-235-5827
OHIO Hours: 7:30 am- 4:30 pm EST Ohio Department of Transportation 1980 W. Broad Street Columbus, OH 43223
Web site: www.dot.state.oh.us
Phone: 614-466-2335 Fax: 614-466-0587
Director Gordon Proctor 614-466-2335 Chief of Staff David L. Celona 614-644-8241 Asst. Director Planning and Production O. Cash Misel 614-466-2448
Asst. Director Highway Management
Mary Ellen Kimberlin 614-466-8990
Asst. Director Business Management Thomas M. McPherson 614-466-2687
OKLAHOMA Hours: 8:00 am- 5:00 pm CST
Oklahoma DOT 200 N.E. 21st Street Oklahoma City, OK 73105-3204
Web site: www.okladot.state.ok.us/
Phone: 405-521-2631 Fax: 405-521-2093
Secretary of Transportation Phil Tomlinson 405-521-2631 Director Gary M. Ridley 405-521-1800 Deputy Director Paul Adams 405-521-2701 Chief Engineer Bruce Taylor 405-521-2688 Oklahoma Transportation Authority 3500 Martin Luther King Blvd. Oklahoma City, OK 73111
Mailing Address: P.O. Box 11357 Oklahoma City, OK 73136-0357
Director Holly Lowe 405-425-3650
OREGON Hours: 8:00 am- 5:00 pm PST
Oregon DOT 355 Capitol Street, NE. Salem, OR 97310-3871
Web site: www.odot.state.or.us/
Phone: 503-986-3200 Fax: 503-986-3446
Director Bruce Warner 503-986-3200 Deputy Director Tom Lulay 503-986-3200
PENNSYLVANIA Hours: 8:00 am- 4:30 pm EST Department of Transportation Commonwealth Keystone Building
Web site: www.dot.state.pa.us/
Phone: 717-787-5574 Fax: 717-787-5491
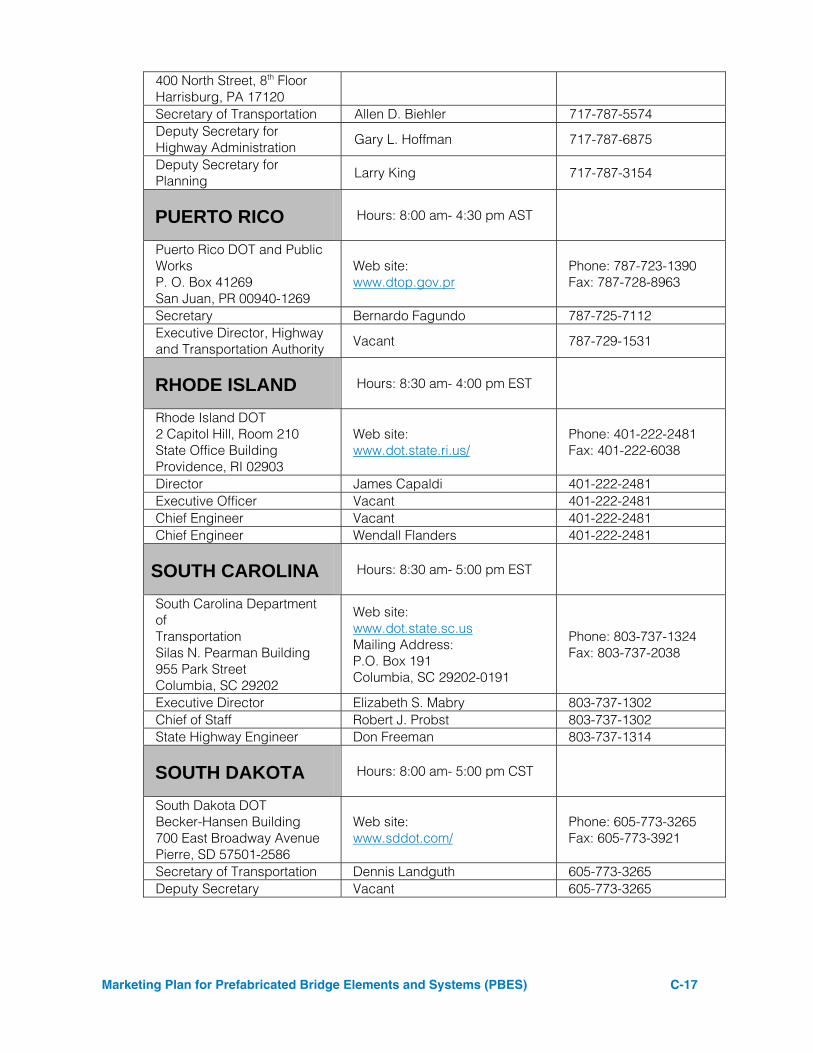
Marketing Plan for Prefabricated Bridge Elements and Systems (PBES) C-17
400 North Street, 8th Floor Harrisburg, PA 17120 Secretary of Transportation Allen D. Biehler 717-787-5574 Deputy Secretary for Highway Administration
Gary L. Hoffman 717-787-6875
Deputy Secretary for Planning Larry King 717-787-3154
PUERTO RICO Hours: 8:00 am- 4:30 pm AST
Puerto Rico DOT and Public Works P. O. Box 41269 San Juan, PR 00940-1269
Web site: www.dtop.gov.pr
Phone: 787-723-1390 Fax: 787-728-8963
Secretary Bernardo Fagundo 787-725-7112 Executive Director, Highway and Transportation Authority Vacant 787-729-1531
RHODE ISLAND Hours: 8:30 am- 4:00 pm EST
Rhode Island DOT 2 Capitol Hill, Room 210 State Office Building Providence, RI 02903
Web site: www.dot.state.ri.us/
Phone: 401-222-2481 Fax: 401-222-6038
Director James Capaldi 401-222-2481 Executive Officer Vacant 401-222-2481 Chief Engineer Vacant 401-222-2481 Chief Engineer Wendall Flanders 401-222-2481
SOUTH CAROLINA Hours: 8:30 am- 5:00 pm EST
South Carolina Department of Transportation Silas N. Pearman Building 955 Park Street Columbia, SC 29202
Web site: www.dot.state.sc.us Mailing Address: P.O. Box 191 Columbia, SC 29202-0191
Phone: 803-737-1324 Fax: 803-737-2038
Executive Director Elizabeth S. Mabry 803-737-1302 Chief of Staff Robert J. Probst 803-737-1302 State Highway Engineer Don Freeman 803-737-1314
SOUTH DAKOTA Hours: 8:00 am- 5:00 pm CST
South Dakota DOT Becker-Hansen Building 700 East Broadway Avenue Pierre, SD 57501-2586
Web site: www.sddot.com/
Phone: 605-773-3265 Fax: 605-773-3921
Secretary of Transportation Dennis Landguth 605-773-3265 Deputy Secretary Vacant 605-773-3265
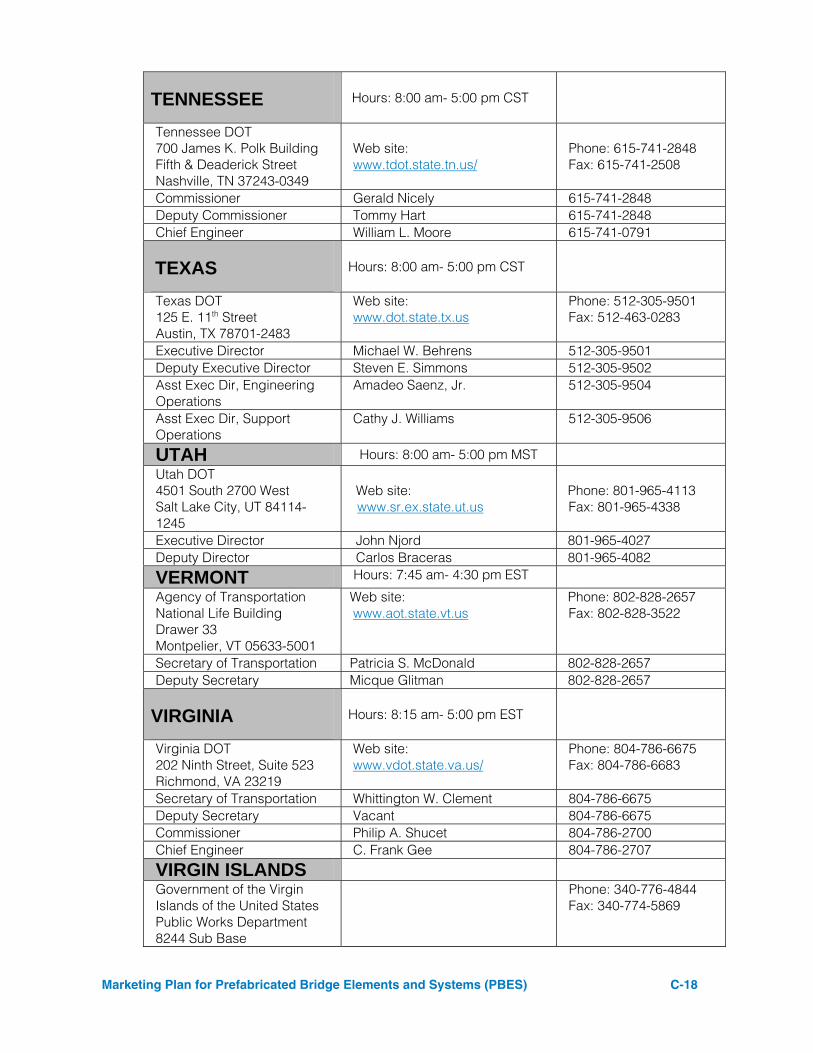
Marketing Plan for Prefabricated Bridge Elements and Systems (PBES) C-18
TENNESSEE Hours: 8:00 am- 5:00 pm CST
Tennessee DOT 700 James K. Polk Building Fifth & Deaderick Street Nashville, TN 37243-0349
Web site: www.tdot.state.tn.us/
Phone: 615-741-2848 Fax: 615-741-2508
Commissioner Gerald Nicely 615-741-2848 Deputy Commissioner Tommy Hart 615-741-2848 Chief Engineer William L. Moore 615-741-0791
TEXAS Hours: 8:00 am- 5:00 pm CST
Texas DOT 125 E. 11th Street Austin, TX 78701-2483
Web site: www.dot.state.tx.us
Phone: 512-305-9501 Fax: 512-463-0283
Executive Director Michael W. Behrens 512-305-9501 Deputy Executive Director Steven E. Simmons 512-305-9502 Asst Exec Dir, Engineering Operations
Amadeo Saenz, Jr. 512-305-9504
Asst Exec Dir, Support Operations
Cathy J. Williams 512-305-9506
UTAH Hours: 8:00 am- 5:00 pm MST
Utah DOT 4501 South 2700 West Salt Lake City, UT 84114-1245
Web site: www.sr.ex.state.ut.us
Phone: 801-965-4113 Fax: 801-965-4338
Executive Director John Njord 801-965-4027 Deputy Director Carlos Braceras 801-965-4082
VERMONT Hours: 7:45 am- 4:30 pm EST Agency of Transportation National Life Building Drawer 33 Montpelier, VT 05633-5001
Web site: www.aot.state.vt.us
Phone: 802-828-2657 Fax: 802-828-3522
Secretary of Transportation Patricia S. McDonald 802-828-2657 Deputy Secretary Micque Glitman 802-828-2657
VIRGINIA Hours: 8:15 am- 5:00 pm EST
Virginia DOT 202 Ninth Street, Suite 523 Richmond, VA 23219
Web site: www.vdot.state.va.us/
Phone: 804-786-6675 Fax: 804-786-6683
Secretary of Transportation Whittington W. Clement 804-786-6675 Deputy Secretary Vacant 804-786-6675 Commissioner Philip A. Shucet 804-786-2700 Chief Engineer C. Frank Gee 804-786-2707
VIRGIN ISLANDS
Government of the Virgin Islands of the United States Public Works Department 8244 Sub Base
Phone: 340-776-4844 Fax: 340-774-5869
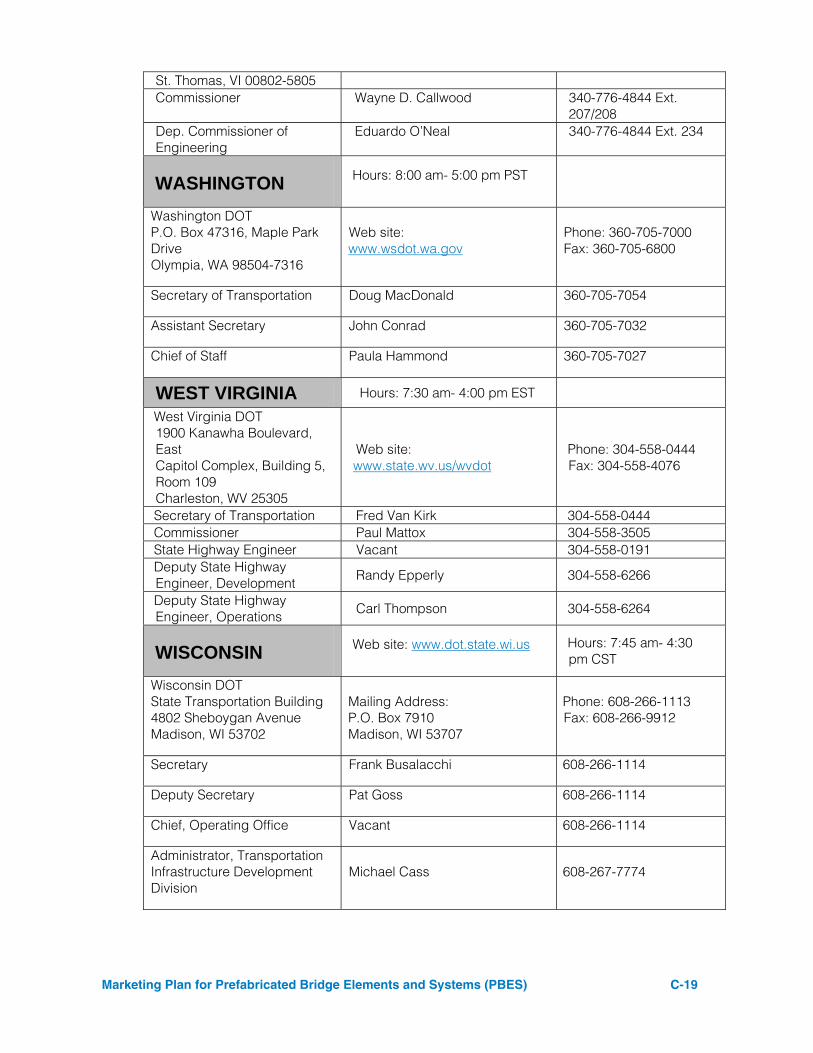
Marketing Plan for Prefabricated Bridge Elements and Systems (PBES) C-19
St. Thomas, VI 00802-5805 Commissioner Wayne D. Callwood 340-776-4844 Ext.
207/208 Dep. Commissioner of Engineering
Eduardo O’Neal 340-776-4844 Ext. 234
WASHINGTON Hours: 8:00 am- 5:00 pm PST
Washington DOT P.O. Box 47316, Maple Park Drive Olympia, WA 98504-7316
Web site: www.wsdot.wa.gov
Phone: 360-705-7000 Fax: 360-705-6800
Secretary of Transportation Doug MacDonald 360-705-7054
Assistant Secretary John Conrad 360-705-7032
Chief of Staff Paula Hammond 360-705-7027
WEST VIRGINIA Hours: 7:30 am- 4:00 pm EST
West Virginia DOT 1900 Kanawha Boulevard, East Capitol Complex, Building 5, Room 109 Charleston, WV 25305
Web site: www.state.wv.us/wvdot
Phone: 304-558-0444 Fax: 304-558-4076
Secretary of Transportation Fred Van Kirk 304-558-0444 Commissioner Paul Mattox 304-558-3505 State Highway Engineer Vacant 304-558-0191 Deputy State Highway Engineer, Development Randy Epperly 304-558-6266
Deputy State Highway Engineer, Operations
Carl Thompson 304-558-6264
WISCONSIN Web site: www.dot.state.wi.us Hours: 7:45 am- 4:30 pm CST
Wisconsin DOT State Transportation Building 4802 Sheboygan Avenue Madison, WI 53702
Mailing Address: P.O. Box 7910 Madison, WI 53707
Phone: 608-266-1113 Fax: 608-266-9912
Secretary Frank Busalacchi 608-266-1114
Deputy Secretary Pat Goss 608-266-1114
Chief, Operating Office Vacant 608-266-1114
Administrator, Transportation Infrastructure Development Division
Michael Cass 608-267-7774

Marketing Plan for Prefabricated Bridge Elements and Systems (PBES) C-20
WYOMING Hours: 8:00 am- 5:00 pm MST
Wyoming DOT 5300 Bishop Boulevard Cheyenne, WY 82009
E-mail address: [email protected] Web site: dot.state.wy.us/
Phone: 307-777-4375 Fax: 307-777-4163
Director Sleeter C. Dover 307-777-4484
Chief Engineer Delbert McOmie 307-777-4484

Marketing Plan for Prefabricated Bridge Elements and Systems (PBES)

U.S. Department of Transportation
Federal Highway Administration
Highways for LIFE
1200 New Jersey Ave, SE
Washington, DC 20590
www.fhwa.dot.gov/hfl
Phone 202.366.5508
Road Safety Audit Marketing Plan A-1
August 2007
Marketing Plan
Road Safety Audit

Road Safety Audit Marketing Plan
Road Safety Audit Marketing Plan 3
TABLE OF CONTENTS
EXECUTIVE SUMMARY ...................................................................................... 1
INTRODUCTION ................................................................................................... 2
CORPORATE PHILOSOPHY ............................................................................... 3
RSA MISSION AND PROGRAM GOALS ............................................................ 4
PRODUCT ANALYSIS ......................................................................................... 5
Costs and Benefits of RSAs ............................................................................ 7
Funding for RSAs ............................................................................................. 8
SITUATION ANALYSIS ...................................................................................... 9
Market Summary ........................................................................................... 10
Market Analysis .............................................................................................. 11
How to Leverage Additional Resources/Partners ....................................... 11
Market Trends ................................................................................................ 13
CHALLENGES .................................................................................................... 14
MARKETING STRATEGY ................................................................................. 14
RSA Implementation Process ....................................................................... 17
FINANCIALS ...................................................................................................... 18
CONTROLS ....................................................................................................... 18
Implementation ............................................................................................... 18
Marketing Organization ................................................................................ 21
APPENDICES
I. Traditional Road Safety Reviews vs. RSAs ………………………. A-1
II. Opportunity and Focus States ………………………………………. A-2
III. RSA Experience ………………………………………………………… A-4
IV. RSA Legal Issues ………………………………………………………. A-9
V. RSA Technical Resources …………………………………………… A-11

Road Safety Audit Marketing Plan 4
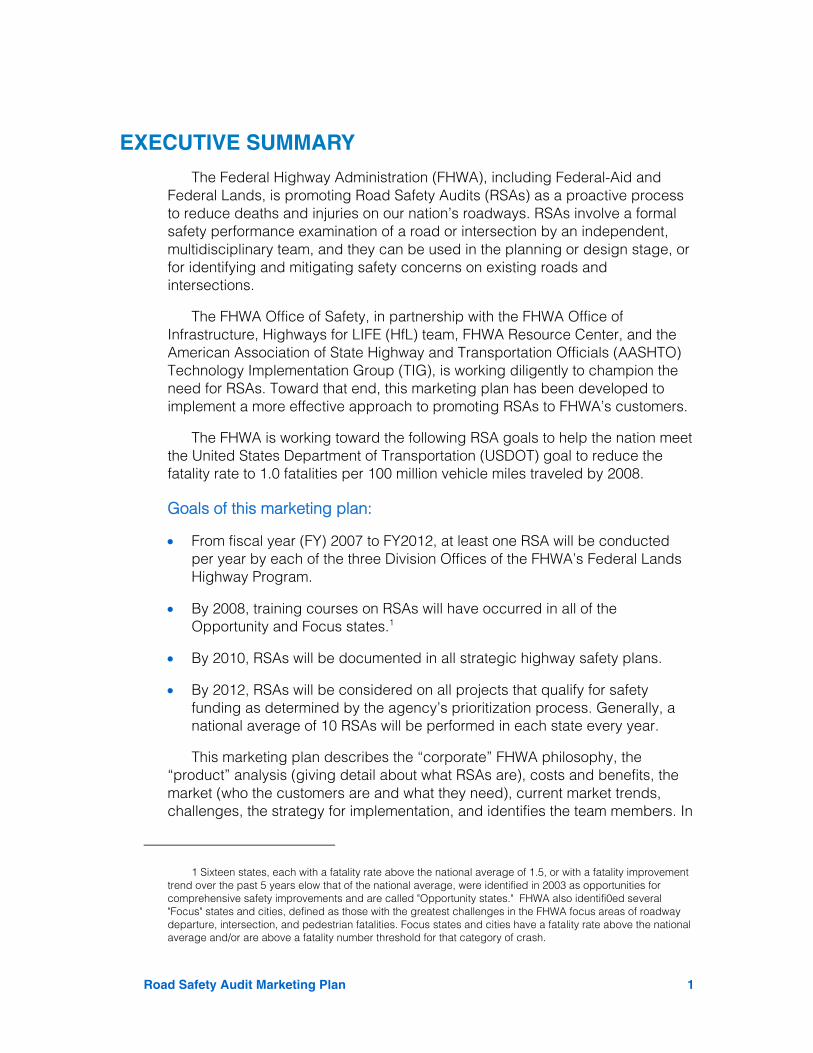
Road Safety Audit Marketing Plan 1
EXECUTIVE SUMMARY
The Federal Highway Administration (FHWA), including Federal-Aid and Federal Lands, is promoting Road Safety Audits (RSAs) as a proactive process to reduce deaths and injuries on our nation’s roadways. RSAs involve a formal safety performance examination of a road or intersection by an independent, multidisciplinary team, and they can be used in the planning or design stage, or for identifying and mitigating safety concerns on existing roads and intersections.
The FHWA Office of Safety, in partnership with the FHWA Office of Infrastructure, Highways for LIFE (HfL) team, FHWA Resource Center, and the American Association of State Highway and Transportation Officials (AASHTO) Technology Implementation Group (TIG), is working diligently to champion the need for RSAs. Toward that end, this marketing plan has been developed to implement a more effective approach to promoting RSAs to FHWA’s customers.
The FHWA is working toward the following RSA goals to help the nation meet the United States Department of Transportation (USDOT) goal to reduce the fatality rate to 1.0 fatalities per 100 million vehicle miles traveled by 2008.
Goals of this marketing plan:
• From fiscal year (FY) 2007 to FY2012, at least one RSA will be conducted per year by each of the three Division Offices of the FHWA’s Federal Lands Highway Program.
• By 2008, training courses on RSAs will have occurred in all of the Opportunity and Focus states.1
• By 2010, RSAs will be documented in all strategic highway safety plans.
• By 2012, RSAs will be considered on all projects that qualify for safety funding as determined by the agency’s prioritization process. Generally, a national average of 10 RSAs will be performed in each state every year.
This marketing plan describes the “corporate” FHWA philosophy, the “product” analysis (giving detail about what RSAs are), costs and benefits, the market (who the customers are and what they need), current market trends, challenges, the strategy for implementation, and identifies the team members. In
1 Sixteen states, each with a fatality rate above the national average of 1.5, or with a fatality improvement trend over the past 5 years elow that of the national average, were identified in 2003 as opportunities for comprehensive safety improvements and are called "Opportunity states." FHWA also identifi0ed several "Focus" states and cities, defined as those with the greatest challenges in the FHWA focus areas of roadway departure, intersection, and pedestrian fatalities. Focus states and cities have a fatality rate above the national average and/or are above a fatality number threshold for that category of crash.
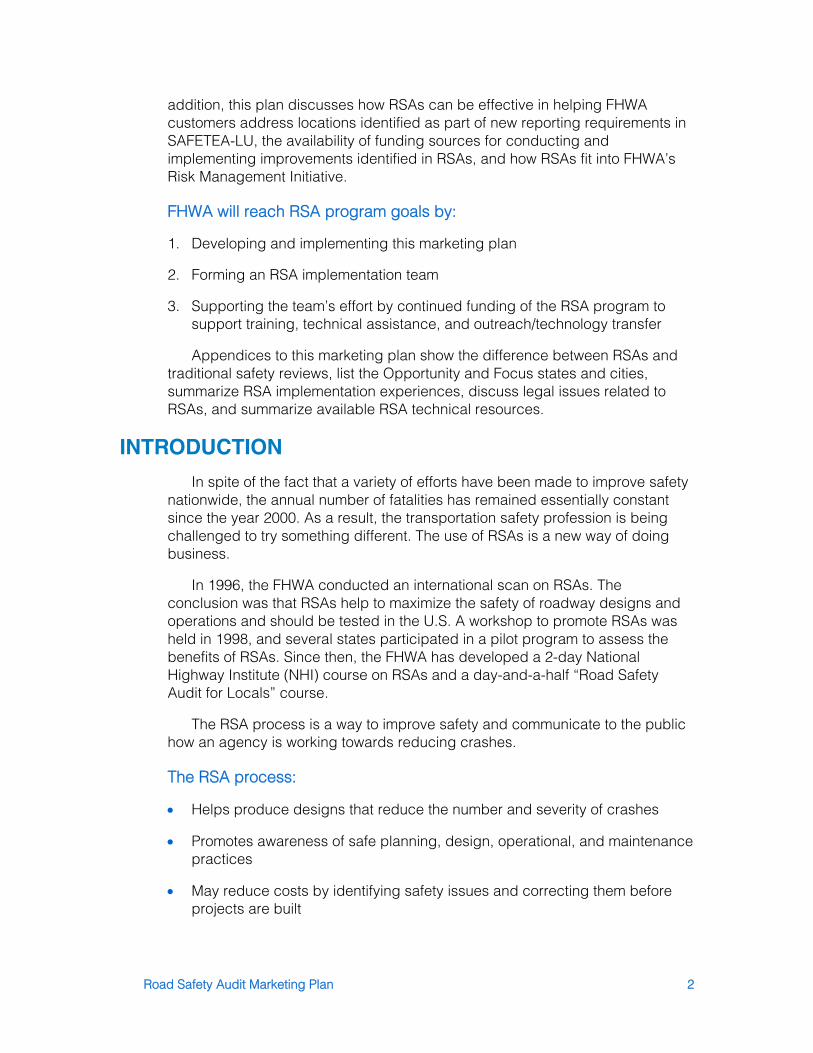
Road Safety Audit Marketing Plan 2
addition, this plan discusses how RSAs can be effective in helping FHWA customers address locations identified as part of new reporting requirements in SAFETEA-LU, the availability of funding sources for conducting and implementing improvements identified in RSAs, and how RSAs fit into FHWA’s Risk Management Initiative.
FHWA will reach RSA program goals by:
1. Developing and implementing this marketing plan
2. Forming an RSA implementation team
3. Supporting the team’s effort by continued funding of the RSA program to support training, technical assistance, and outreach/technology transfer
Appendices to this marketing plan show the difference between RSAs and traditional safety reviews, list the Opportunity and Focus states and cities, summarize RSA implementation experiences, discuss legal issues related to RSAs, and summarize available RSA technical resources.
INTRODUCTION
In spite of the fact that a variety of efforts have been made to improve safety nationwide, the annual number of fatalities has remained essentially constant since the year 2000. As a result, the transportation safety profession is being challenged to try something different. The use of RSAs is a new way of doing business.
In 1996, the FHWA conducted an international scan on RSAs. The conclusion was that RSAs help to maximize the safety of roadway designs and operations and should be tested in the U.S. A workshop to promote RSAs was held in 1998, and several states participated in a pilot program to assess the benefits of RSAs. Since then, the FHWA has developed a 2-day National Highway Institute (NHI) course on RSAs and a day-and-a-half “Road Safety Audit for Locals” course.
The RSA process is a way to improve safety and communicate to the public how an agency is working towards reducing crashes.
The RSA process:
• Helps produce designs that reduce the number and severity of crashes
• Promotes awareness of safe planning, design, operational, and maintenance practices
• May reduce costs by identifying safety issues and correcting them before projects are built
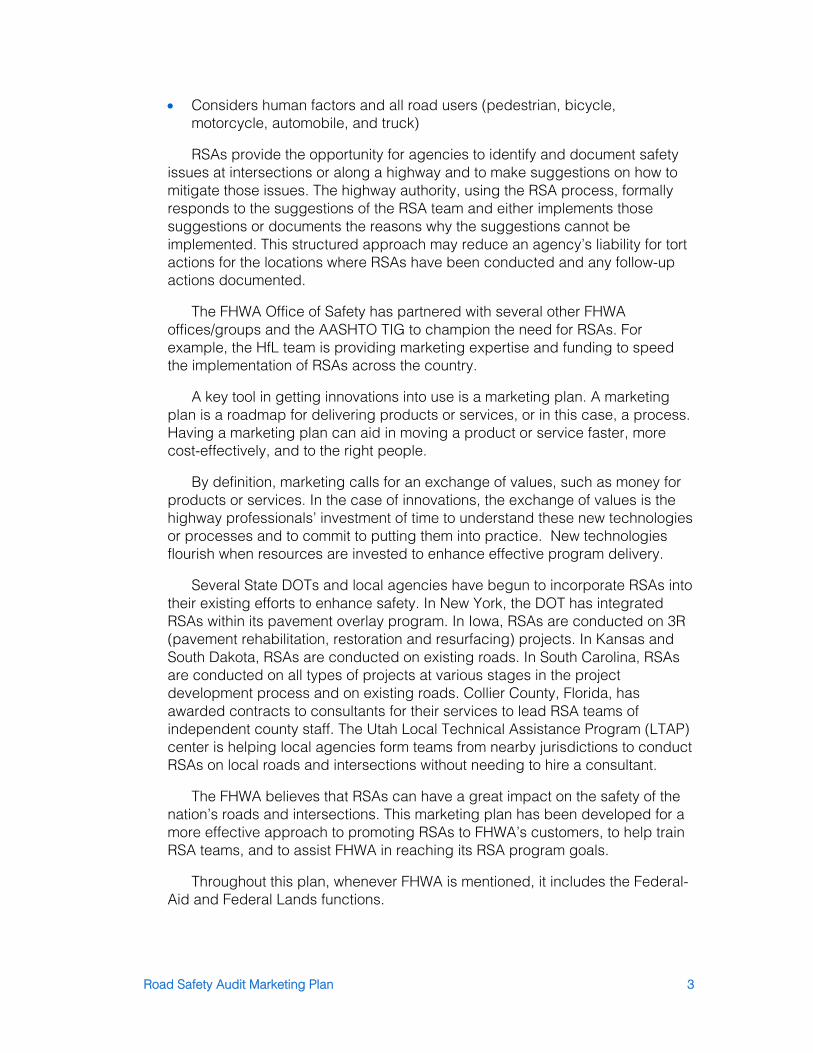
Road Safety Audit Marketing Plan 3
• Considers human factors and all road users (pedestrian, bicycle, motorcycle, automobile, and truck)
RSAs provide the opportunity for agencies to identify and document safety issues at intersections or along a highway and to make suggestions on how to mitigate those issues. The highway authority, using the RSA process, formally responds to the suggestions of the RSA team and either implements those suggestions or documents the reasons why the suggestions cannot be implemented. This structured approach may reduce an agency’s liability for tort actions for the locations where RSAs have been conducted and any follow-up actions documented.
The FHWA Office of Safety has partnered with several other FHWA offices/groups and the AASHTO TIG to champion the need for RSAs. For example, the HfL team is providing marketing expertise and funding to speed the implementation of RSAs across the country.
A key tool in getting innovations into use is a marketing plan. A marketing plan is a roadmap for delivering products or services, or in this case, a process. Having a marketing plan can aid in moving a product or service faster, more cost-effectively, and to the right people.
By definition, marketing calls for an exchange of values, such as money for products or services. In the case of innovations, the exchange of values is the highway professionals’ investment of time to understand these new technologies or processes and to commit to putting them into practice. New technologies flourish when resources are invested to enhance effective program delivery.
Several State DOTs and local agencies have begun to incorporate RSAs into their existing efforts to enhance safety. In New York, the DOT has integrated RSAs within its pavement overlay program. In Iowa, RSAs are conducted on 3R (pavement rehabilitation, restoration and resurfacing) projects. In Kansas and South Dakota, RSAs are conducted on existing roads. In South Carolina, RSAs are conducted on all types of projects at various stages in the project development process and on existing roads. Collier County, Florida, has awarded contracts to consultants for their services to lead RSA teams of independent county staff. The Utah Local Technical Assistance Program (LTAP) center is helping local agencies form teams from nearby jurisdictions to conduct RSAs on local roads and intersections without needing to hire a consultant.
The FHWA believes that RSAs can have a great impact on the safety of the nation’s roads and intersections. This marketing plan has been developed for a more effective approach to promoting RSAs to FHWA’s customers, to help train RSA teams, and to assist FHWA in reaching its RSA program goals.
Throughout this plan, whenever FHWA is mentioned, it includes the Federal-Aid and Federal Lands functions.
Road Safety Audit Marketing Plan 4
CORPORATE PHILOSOPHY
The highway community as a whole, and the FHWA in particular, has been seeking out and evaluating innovative solutions to highway safety challenges. Each year, teams of engineers, planners, and other professionals scan the globe, looking for potential innovations to improve highway facilities. In 1996, a team visited Australia and New Zealand to learn about the RSA process and interview officials undertaking and overseeing RSA programs in their countries. The result of those trips was an increase in understanding of how the process could benefit the safety of the nation’s highway system. A lack of innovation has not been the problem; rather, the challenge has been in getting those innovations moved from state-of-the-art to state-of-the-practice.
In 2002, the national highway fatality rate was 1.5 deaths per 100 million vehicle miles traveled. Former Secretary of Transportation Norman Mineta established a goal to reduce that number to 1.0 deaths per 100 million vehicle miles travel traveled by 2008. Approximately 9,000 lives would be saved each year.
In announcing his goal to reduce fatalities, Secretary Mineta made it clear that “there’s not one silver bullet that will drive the fatality rate down.” Major improvements in highway safety require a comprehensive and coordinated approach that addresses drivers response, vehicle design, and the roadway itself. RSAs are a comprehensive tool that can address driver behavior as well as the roadway. The Strategic Highway Safety Plans (SHSPs) or Comprehensive Highway Safety Plans (CHSPs) that are now required by law to be developed by each state are an avenue to adopt RSAs statewide and address safety in a strategic fashion.
The FHWA has the overall lead in engaging highway agencies to improve the safety of the nation’s roadways, and it has identified safety as a priority among the “vital few” focus areas targeted for greater attention and resources. To achieve the Department’s safety goal, the FHWA is committed to and reliant upon working with other federal, state, territory, local, and tribal governments to improve the safety of America’s roadways and roadsides through a collaborative and comprehensive approach to safety.
RSA MISSION AND PROGRAM GOALS
As mentioned previously, the mission of the FHWA RSA program is to contribute to the overall FHWA and national goals to proactively reduce deaths and injuries on our nation’s roadways while providing a long-term value-added
Pennsylvania DOT has found that RSAs are a valuable, low-cost tool that enhances the safety of a project by providing unbiased early recommendations for the project based on safety and multimodal needs. We intend to make RSAs an easily and frequently used tool in the design process.
-Girish (Gary) N. Modi, P.E. Chief, Safety Management Division Bureau of Highway Safety and Transportation Engineering Pennsylvania DOT
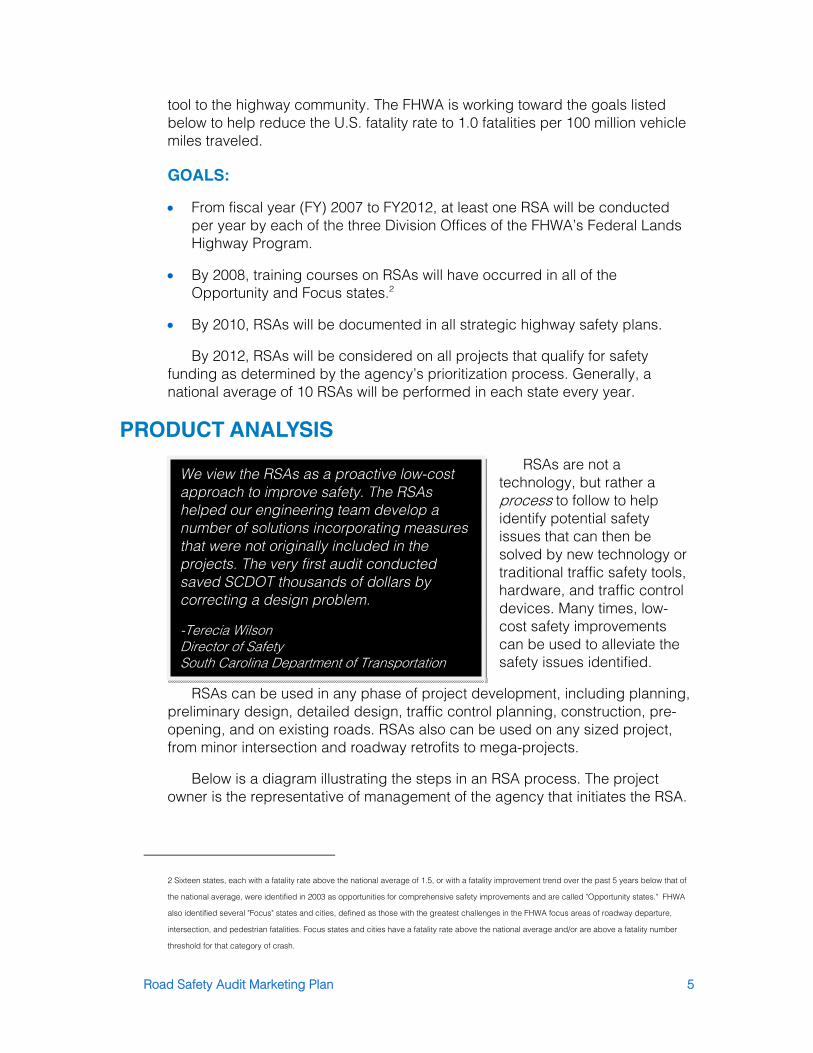
Road Safety Audit Marketing Plan 5
tool to the highway community. The FHWA is working toward the goals listed below to help reduce the U.S. fatality rate to 1.0 fatalities per 100 million vehicle miles traveled.
GOALS:
• From fiscal year (FY) 2007 to FY2012, at least one RSA will be conducted per year by each of the three Division Offices of the FHWA’s Federal Lands Highway Program.
• By 2008, training courses on RSAs will have occurred in all of the Opportunity and Focus states.2
• By 2010, RSAs will be documented in all strategic highway safety plans.
By 2012, RSAs will be considered on all projects that qualify for safety funding as determined by the agency’s prioritization process. Generally, a national average of 10 RSAs will be performed in each state every year.
PRODUCT ANALYSIS
RSAs are not a technology, but rather a process to follow to help identify potential safety issues that can then be solved by new technology or traditional traffic safety tools, hardware, and traffic control devices. Many times, low-cost safety improvements can be used to alleviate the safety issues identified.
RSAs can be used in any phase of project development, including planning, preliminary design, detailed design, traffic control planning, construction, pre-opening, and on existing roads. RSAs also can be used on any sized project, from minor intersection and roadway retrofits to mega-projects.
Below is a diagram illustrating the steps in an RSA process. The project owner is the representative of management of the agency that initiates the RSA.
2 Sixteen states, each with a fatality rate above the national average of 1.5, or with a fatality improvement trend over the past 5 years below that of
the national average, were identified in 2003 as opportunities for comprehensive safety improvements and are called "Opportunity states." FHWA
also identified several "Focus" states and cities, defined as those with the greatest challenges in the FHWA focus areas of roadway departure,
intersection, and pedestrian fatalities. Focus states and cities have a fatality rate above the national average and/or are above a fatality number
threshold for that category of crash.
We view the RSAs as a proactive low-cost approach to improve safety. The RSAs helped our engineering team develop a number of solutions incorporating measures that were not originally included in the projects. The very first audit conducted saved SCDOT thousands of dollars by correcting a design problem.
-Terecia Wilson Director of Safety South Carolina Department of Transportation
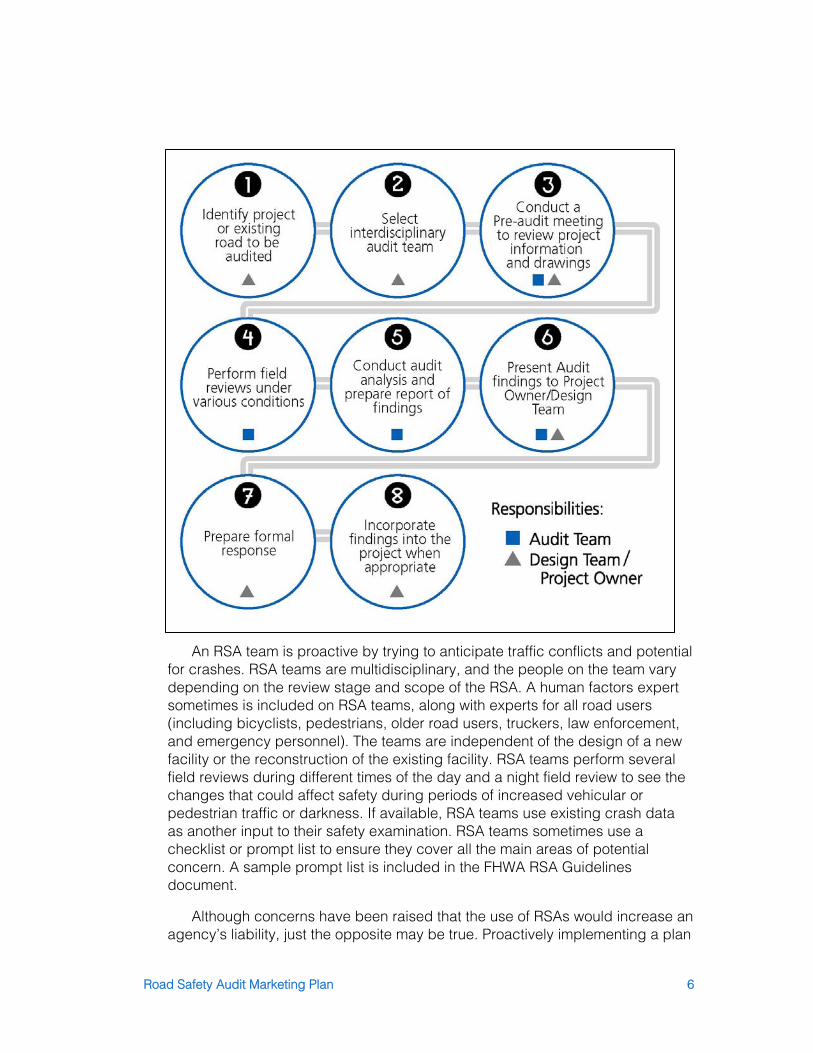
Road Safety Audit Marketing Plan 6
An RSA team is proactive by trying to anticipate traffic conflicts and potential for crashes. RSA teams are multidisciplinary, and the people on the team vary depending on the review stage and scope of the RSA. A human factors expert sometimes is included on RSA teams, along with experts for all road users (including bicyclists, pedestrians, older road users, truckers, law enforcement, and emergency personnel). The teams are independent of the design of a new facility or the reconstruction of the existing facility. RSA teams perform several field reviews during different times of the day and a night field review to see the changes that could affect safety during periods of increased vehicular or pedestrian traffic or darkness. If available, RSA teams use existing crash data as another input to their safety examination. RSA teams sometimes use a checklist or prompt list to ensure they cover all the main areas of potential concern. A sample prompt list is included in the FHWA RSA Guidelines document.
Although concerns have been raised that the use of RSAs would increase an agency’s liability, just the opposite may be true. Proactively implementing a plan
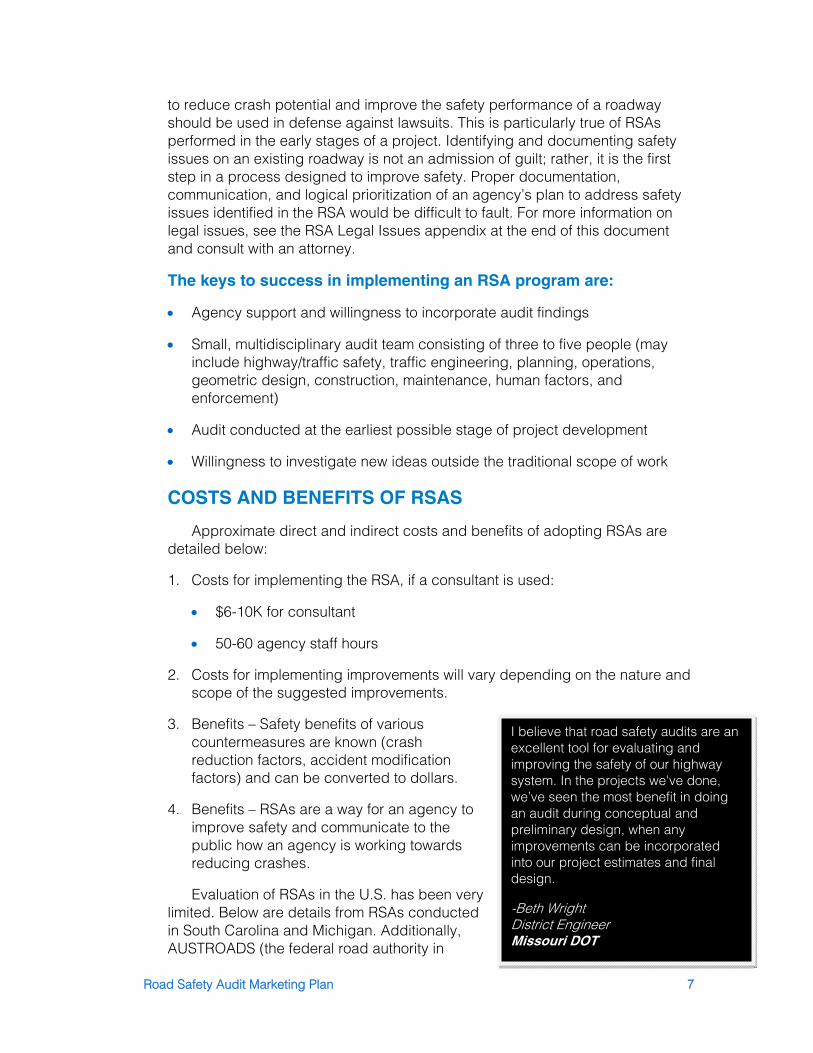
Road Safety Audit Marketing Plan 7
to reduce crash potential and improve the safety performance of a roadway should be used in defense against lawsuits. This is particularly true of RSAs performed in the early stages of a project. Identifying and documenting safety issues on an existing roadway is not an admission of guilt; rather, it is the first step in a process designed to improve safety. Proper documentation, communication, and logical prioritization of an agency’s plan to address safety issues identified in the RSA would be difficult to fault. For more information on legal issues, see the RSA Legal Issues appendix at the end of this document and consult with an attorney.
The keys to success in implementing an RSA program are:
• Agency support and willingness to incorporate audit findings
• Small, multidisciplinary audit team consisting of three to five people (may include highway/traffic safety, traffic engineering, planning, operations, geometric design, construction, maintenance, human factors, and enforcement)
• Audit conducted at the earliest possible stage of project development
• Willingness to investigate new ideas outside the traditional scope of work
COSTS AND BENEFITS OF RSAS
Approximate direct and indirect costs and benefits of adopting RSAs are detailed below:
1. Costs for implementing the RSA, if a consultant is used:
• $6-10K for consultant
• 50-60 agency staff hours
2. Costs for implementing improvements will vary depending on the nature and scope of the suggested improvements.
3. Benefits – Safety benefits of various countermeasures are known (crash reduction factors, accident modification factors) and can be converted to dollars.
4. Benefits – RSAs are a way for an agency to improve safety and communicate to the public how an agency is working towards reducing crashes.
Evaluation of RSAs in the U.S. has been very limited. Below are details from RSAs conducted in South Carolina and Michigan. Additionally, AUSTROADS (the federal road authority in
I believe that road safety audits are an excellent tool for evaluating and improving the safety of our highway system. In the projects we've done, we’ve seen the most benefit in doing an audit during conceptual and preliminary design, when any improvements can be incorporated into our project estimates and final design.
-Beth Wright District Engineer Missouri DOT
Road Safety Audit Marketing Plan 8
Australia) has found very positive benefit cost ratios on their RSAs.
The South Carolina DOT has conducted six RSAs since 2003. In one case, a Spartanburg County road audited in 2003, SC-296, saw a 23.4 percent reduction in crashes in 2004. Twenty-five of the 37 safety recommendations were adopted. All nine suggested safety improvements resulting from an RSA of SC-14 in Greenville County were implemented. This site saw a reduction of 60 percent in fatalities from 2003 to 2004, which equates to an estimated savings of $3,660,000. The DOT acknowledges these results are preliminary, but the numbers appear very promising.
AAA Michigan conducted RSAs on 35 intersections in Detroit. Collectively, these intersections experienced a 56 percent decrease in injury collisions. The economic evaluation (in terms of societal costs) for the Detroit intersections is summarized below:
• Overall, the net present value of the Detroit improvements is $4,792,000 (2-year life cycle) or $33,720,000 (15-year life cycle).
• A total of 22 intersections (or 65 percent) exceeded a benefit/cost ratio (B/C) of 2:1 in 2 years.
• A total of 33 intersections (or 97 percent) exceeded a B/C of 2:1 in 15 years.
• A total of 32 intersections (or 94 percent) reported a positive net present value (benefits) over 2 years.
FUNDING FOR RSAS
Federal-Aid funds can be used to conduct RSAs as part of preliminary engineering during project development. Federal-Aid funds can also be used to implement improvements from RSAs. Highway Safety Improvement Program (HSIP) funds can be used to conduct RSAs on existing roads and intersections.
Engineering services, such as RSAs, have always been eligible as part of a Federal-aid project under the broad Title 23 definitions of construction and projects. Section 112 of Title 23 allows the state to contract for these design/engineering services. Additionally, engineering services were an eligible expense under the previous Hazardous Elimination Safety program, and they remain an eligible expense under the new core HSIP program. Considering the respective provisions outlined in the law, HSIP funds, including the set-aside programs (High Risk Rural Roads and Railway-Highway Crossings), may be used to implement eligible countermeasures suggested in RSA reports.
The FHWA South Dakota Division Office is working with the South Dakota DOT to develop a policy where some of their safety money is earmarked to fund improvements identified by an RSA. The DOT tentatively has budgeted $250,000 for the year 2006 and $500,000 for 2007. There is great potential for conducting more RSAs once the availability of funding for these proactive safety improvements is known.
Road Safety Audit Marketing Plan 9
Metropolitan Planning Organizations in New Jersey and Pennsylvania have used and are using planning funds to conduct RSAs. See the appendices for more details.
SITUATION ANALYSIS
This section describes the environment in which targeted RSA users are operating. Several different situations are summarized, including legislation, policy initiatives, and crash reporting limitations.
SAFETEA-LU was passed on August 10, 2005. There is a requirement in this law for states to report annually, as part of their HSIP, at least 5 percent of the locations on their public roads that are exhibiting the most severe safety needs. The law also requires that this report include remedies, costs, and impediments to implementing improvements at each of these locations. This requirement provides an excellent opportunity to incorporate RSAs into a state’s overall safety process, since RSAs can identify comprehensive solutions to these severe safety problems beyond the traditional design approach.
RSAs also fit into FHWA’s Risk Management Initiative. Risk is defined as a future phenomenon that may occur with a direct impact to a project or program's benefit or detriment. FHWA’s Risk Management Initiative is about communicating transparently about resources and our risks. Through the Risk Management Initiative, the FHWA is encouraging Division Offices and state and locals partners to identify risks and mitigation strategies for their core work elements (responsibilities). An example risk event/threat statement related to safety is: If fatalities and injuries continue to occur at the current level/rate, then we will not be accomplishing our objectives, which will result in additional negative press and political pressure. RSAs are a mitigation risk response strategy.
Traffic safety is a result of the interaction of three factors: the vehicle, the driver, and the road. Crashes are very often attributed to more than just one of the causes. For example, a nighttime run-off-road collision may be attributed to both drowsy driving (human factors) and an unsigned, unmarked curve (road environment). Human factors play a part in about 95 percent of crashes, while the road environment affects about 28 percent of crashes. Clearly, the driver is the weakest link in the system, so the transportation safety profession must consider human needs in the design process. At the same time, even with collisions attributed purely to driver error or vehicle faults, a well-designed road can help to reduce the collision severity.
RSAs have been used successfully worldwide for a number of years to help agencies make systematic safety improvements to address the human and roadway factors that contribute to collisions. Globally, it is estimated that one million fatalities result from motor vehicle crashes each year. One simply cannot measure the impact an RSA program can have on communities and families. The potential for RSAs is unlimited. They can be conducted at any stage of the
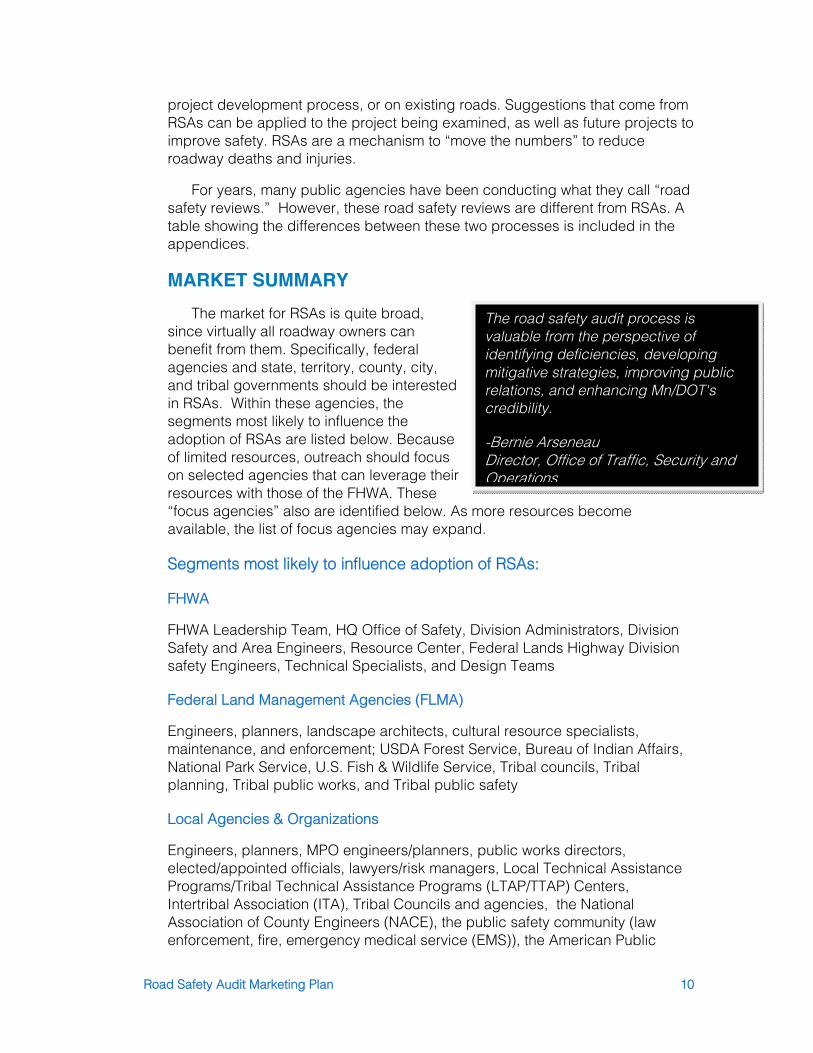
Road Safety Audit Marketing Plan 10
project development process, or on existing roads. Suggestions that come from RSAs can be applied to the project being examined, as well as future projects to improve safety. RSAs are a mechanism to “move the numbers” to reduce roadway deaths and injuries.
For years, many public agencies have been conducting what they call “road safety reviews.” However, these road safety reviews are different from RSAs. A table showing the differences between these two processes is included in the appendices.
MARKET SUMMARY
The market for RSAs is quite broad, since virtually all roadway owners can benefit from them. Specifically, federal agencies and state, territory, county, city, and tribal governments should be interested in RSAs. Within these agencies, the segments most likely to influence the adoption of RSAs are listed below. Because of limited resources, outreach should focus on selected agencies that can leverage their resources with those of the FHWA. These “focus agencies” also are identified below. As more resources become available, the list of focus agencies may expand.
Segments most likely to influence adoption of RSAs:
FHWA
FHWA Leadership Team, HQ Office of Safety, Division Administrators, Division Safety and Area Engineers, Resource Center, Federal Lands Highway Division safety Engineers, Technical Specialists, and Design Teams
Federal Land Management Agencies (FLMA)
Engineers, planners, landscape architects, cultural resource specialists, maintenance, and enforcement; USDA Forest Service, Bureau of Indian Affairs, National Park Service, U.S. Fish & Wildlife Service, Tribal councils, Tribal planning, Tribal public works, and Tribal public safety
Local Agencies & Organizations
Engineers, planners, MPO engineers/planners, public works directors, elected/appointed officials, lawyers/risk managers, Local Technical Assistance Programs/Tribal Technical Assistance Programs (LTAP/TTAP) Centers, Intertribal Association (ITA), Tribal Councils and agencies, the National Association of County Engineers (NACE), the public safety community (law enforcement, fire, emergency medical service (EMS)), the American Public
The road safety audit process is valuable from the perspective of identifying deficiencies, developing mitigative strategies, improving public relations, and enhancing Mn/DOT's credibility.
-Bernie Arseneau Director, Office of Traffic, Security and Operations
Road Safety Audit Marketing Plan 11
Works Association (APWA), the Association of Metropolitan Planning Organizations (AMPO) , the National Association of Regional Councils (NARC), the National League of Cities, National Association of Towns and Townships, and the Institute of Transportation Engineers (ITE).
State DOTs, Territories & Organization
Secretaries of Transportation/Chief Executive Officers, Management/chief engineers, designers, safety engineers, lawyers/risk managers, construction and maintenance personnel, Governors’ highway safety offices, Public safety community (law enforcement, fire, EMS), American Association of State Highway and Transportation Officials (AASHTO), and the Institute of Transportation Engineers (ITE).
Focus Agencies
FHWA, AASHTO, NACE, ITE, LTAP/TTAP, IACP, APWA
MARKET ANALYSIS
On the pages that follow is a table that summarizes primary RSA customers, their needs, and products to fill those needs. As progress is made regarding the listed audiences/customers, the RSA team can address the needs of secondary customers. Every audience/customer has a desire or need to reduce fatalities and injuries; specific needs to achieve those goals are listed in the chart.
HOW TO LEVERAGE ADDITIONAL RESOURCES/ PARTNERS
The RSA message can be conveyed in a variety of contexts, including:
• Federal Land Management Agencies’ Safety Management Systems
• FHWA Performance Plans
• FHWA Safety Circuit Riders Program (Local Outreach)
• Academia/Curriculum
• FHWA New Employee Orientation/FHWA’s Professional Development Program
• FHWA’s Intranet
• AASHTO Technology Implementation Group for RSAs
• Highway Safety Manual
• Interactive Highway Safety Design Module software
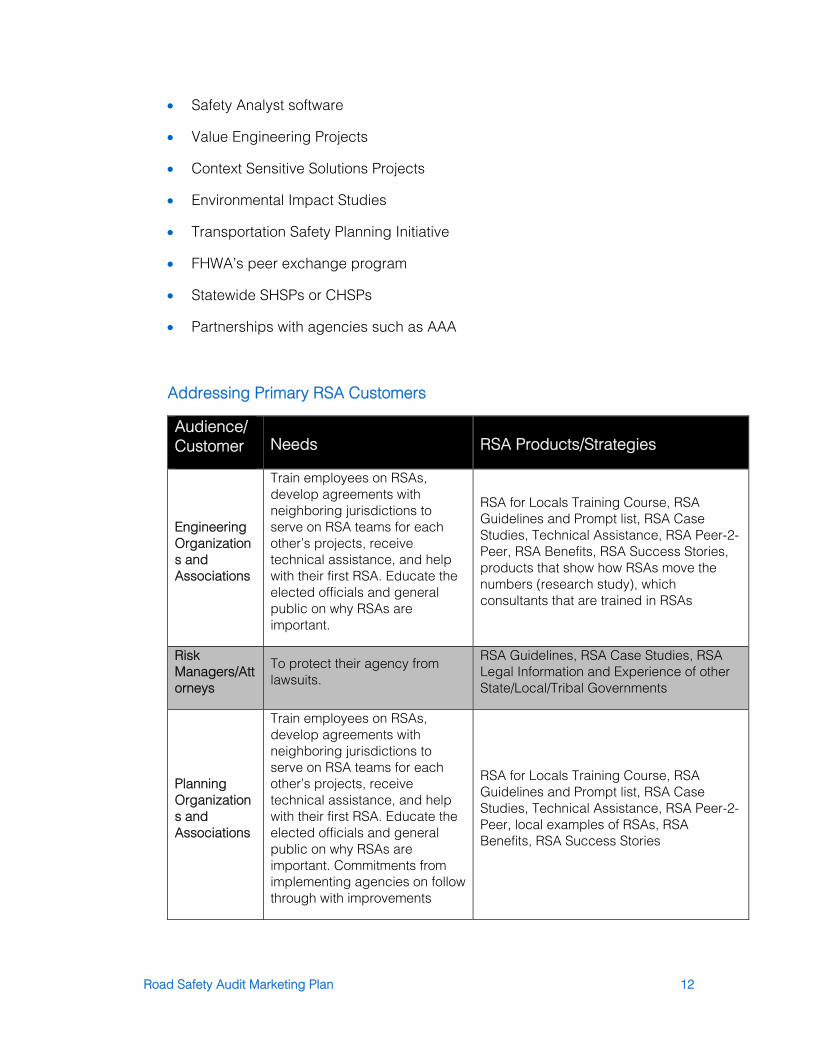
Road Safety Audit Marketing Plan 12
• Safety Analyst software
• Value Engineering Projects
• Context Sensitive Solutions Projects
• Environmental Impact Studies
• Transportation Safety Planning Initiative
• FHWA’s peer exchange program
• Statewide SHSPs or CHSPs
• Partnerships with agencies such as AAA
Addressing Primary RSA Customers
Audience/Customer Needs RSA Products/Strategies
Engineering Organizations and Associations
Train employees on RSAs, develop agreements with neighboring jurisdictions to serve on RSA teams for each other’s projects, receive technical assistance, and help with their first RSA. Educate the elected officials and general public on why RSAs are important.
RSA for Locals Training Course, RSA Guidelines and Prompt list, RSA Case Studies, Technical Assistance, RSA Peer-2-Peer, RSA Benefits, RSA Success Stories, products that show how RSAs move the numbers (research study), which consultants that are trained in RSAs
Risk Managers/Attorneys
To protect their agency from lawsuits.
RSA Guidelines, RSA Case Studies, RSA Legal Information and Experience of other State/Local/Tribal Governments
Planning Organizations and Associations
Train employees on RSAs, develop agreements with neighboring jurisdictions to serve on RSA teams for each other’s projects, receive technical assistance, and help with their first RSA. Educate the elected officials and general public on why RSAs are important. Commitments from implementing agencies on follow through with improvements
RSA for Locals Training Course, RSA Guidelines and Prompt list, RSA Case Studies, Technical Assistance, RSA Peer-2-Peer, local examples of RSAs, RSA Benefits, RSA Success Stories
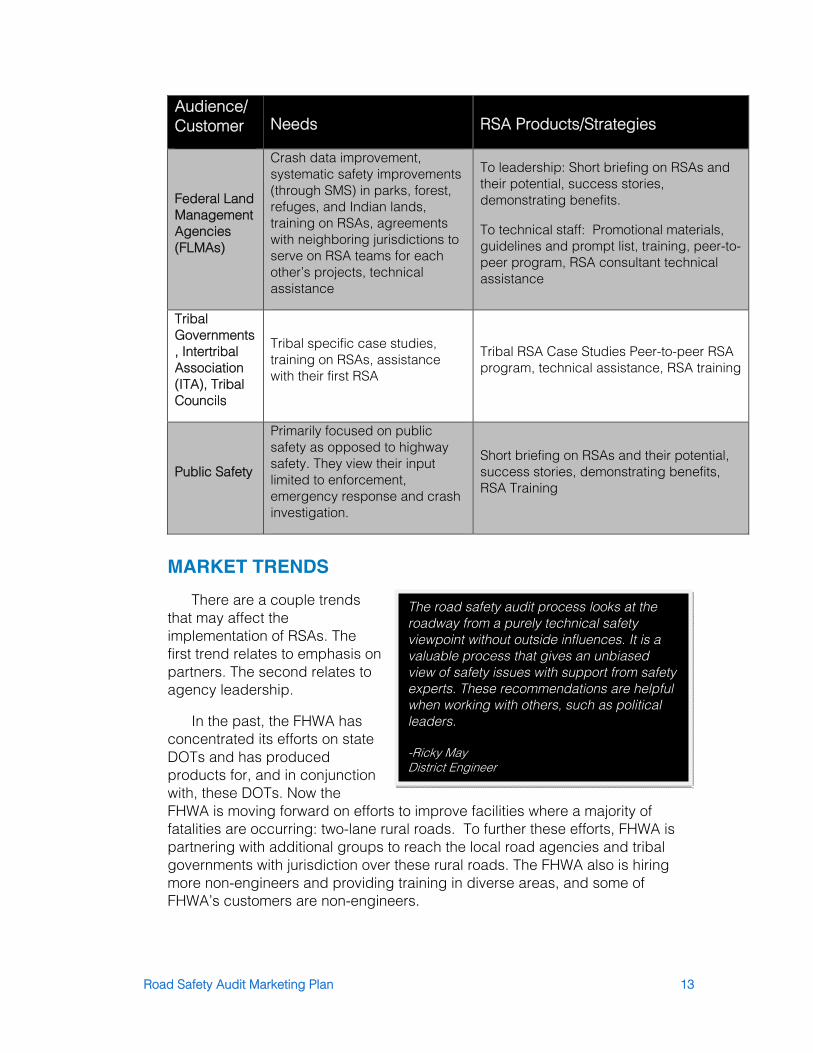
Road Safety Audit Marketing Plan 13
Audience/Customer Needs RSA Products/Strategies
Federal Land Management Agencies (FLMAs)
Crash data improvement, systematic safety improvements (through SMS) in parks, forest, refuges, and Indian lands, training on RSAs, agreements with neighboring jurisdictions to serve on RSA teams for each other’s projects, technical assistance
To leadership: Short briefing on RSAs and their potential, success stories, demonstrating benefits.
To technical staff: Promotional materials, guidelines and prompt list, training, peer-to-peer program, RSA consultant technical assistance
Tribal Governments, Intertribal Association (ITA), Tribal Councils
Tribal specific case studies, training on RSAs, assistance with their first RSA
Tribal RSA Case Studies Peer-to-peer RSA program, technical assistance, RSA training
Public Safety
Primarily focused on public safety as opposed to highway safety. They view their input limited to enforcement, emergency response and crash investigation.
Short briefing on RSAs and their potential, success stories, demonstrating benefits, RSA Training
MARKET TRENDS
There are a couple trends that may affect the implementation of RSAs. The first trend relates to emphasis on partners. The second relates to agency leadership.
In the past, the FHWA has concentrated its efforts on state DOTs and has produced products for, and in conjunction with, these DOTs. Now the FHWA is moving forward on efforts to improve facilities where a majority of fatalities are occurring: two-lane rural roads. To further these efforts, FHWA is partnering with additional groups to reach the local road agencies and tribal governments with jurisdiction over these rural roads. The FHWA also is hiring more non-engineers and providing training in diverse areas, and some of FHWA’s customers are non-engineers.
The road safety audit process looks at the roadway from a purely technical safety viewpoint without outside influences. It is a valuable process that gives an unbiased view of safety issues with support from safety experts. These recommendations are helpful when working with others, such as political leaders.
-Ricky May District Engineer

Road Safety Audit Marketing Plan 14
In addition, in many of the targeted agencies, the person responsible for transportation safety is a road superintendent, the director of street maintenance, or a transportation safety official. These individuals can have diverse backgrounds, not necessarily engineering.
With these trends in mind, RSA marketing efforts need to serve those with traditional engineering backgrounds and non-traditional backgrounds. Non-technical marketing communication tools (e.g., brochures, videos, PowerPoint presentations) should be created to communicate effectively with non-engineers. In addition, local agencies lacking transportation and/or safety professionals may need technical assistance.
CHALLENGES
Below is a summary of challenges to RSA implementation:
• Obtaining support from chief executives and upper management of federal, state, and local agencies and tribal governments
• Competing demands and resources
• Limited manpower, high turnover, staff with limited experience and no training, limited travel
• Resistance to the word “audit” because of negative feelings associated with financial audits
• Liability concerns
Even with these challenges, the FHWA remains hopeful that implementation will occur with the support of federal, state, local, and tribal leadership, as well as major associations and committees. With the increasing emphasis on saving lives, the FHWA believes that the RSA message will not only be heard, but will be heeded. Primary strategies to overcome these challenges include RSA training, technical assistance, and technology transfer. Specific products envisioned to accomplish these strategies are outlined in chapter 9.
MARKETING STRATEGY
The RSA marketing strategy is to leverage all resources that will help deliver the RSA message throughout the country. By utilizing the success of the states with active RSA programs, other states and partners will learn of the benefits that RSAs will offer their transportation programs. FHWA will seek the support of executive leadership to champion RSAs and develop and deliver materials that will help fulfill the RSA objectives. Expertise and resources from the FHWA HfL
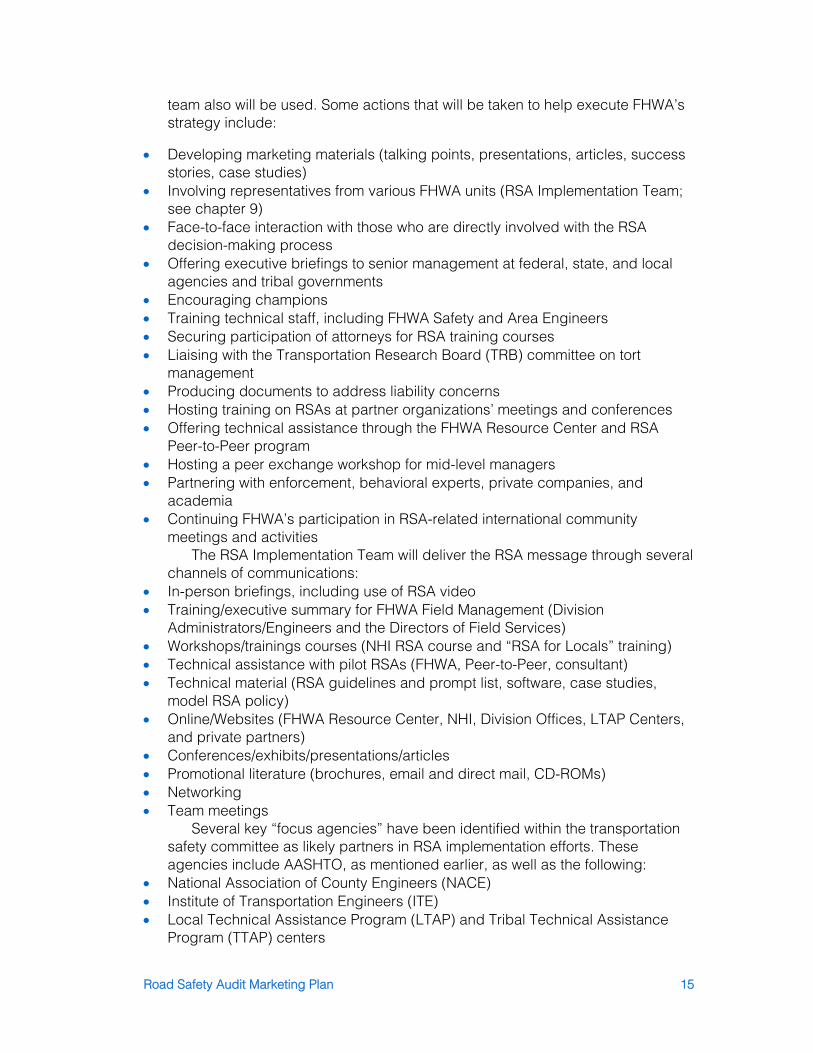
Road Safety Audit Marketing Plan 15
team also will be used. Some actions that will be taken to help execute FHWA’s strategy include:
• Developing marketing materials (talking points, presentations, articles, success stories, case studies)
• Involving representatives from various FHWA units (RSA Implementation Team; see chapter 9)
• Face-to-face interaction with those who are directly involved with the RSA decision-making process
• Offering executive briefings to senior management at federal, state, and local agencies and tribal governments
• Encouraging champions • Training technical staff, including FHWA Safety and Area Engineers • Securing participation of attorneys for RSA training courses • Liaising with the Transportation Research Board (TRB) committee on tort
management • Producing documents to address liability concerns • Hosting training on RSAs at partner organizations’ meetings and conferences • Offering technical assistance through the FHWA Resource Center and RSA
Peer-to-Peer program • Hosting a peer exchange workshop for mid-level managers • Partnering with enforcement, behavioral experts, private companies, and
academia • Continuing FHWA’s participation in RSA-related international community
meetings and activities The RSA Implementation Team will deliver the RSA message through several
channels of communications: • In-person briefings, including use of RSA video • Training/executive summary for FHWA Field Management (Division
Administrators/Engineers and the Directors of Field Services) • Workshops/trainings courses (NHI RSA course and “RSA for Locals” training) • Technical assistance with pilot RSAs (FHWA, Peer-to-Peer, consultant) • Technical material (RSA guidelines and prompt list, software, case studies,
model RSA policy) • Online/Websites (FHWA Resource Center, NHI, Division Offices, LTAP Centers,
and private partners) • Conferences/exhibits/presentations/articles • Promotional literature (brochures, email and direct mail, CD-ROMs) • Networking • Team meetings
Several key “focus agencies” have been identified within the transportation safety committee as likely partners in RSA implementation efforts. These agencies include AASHTO, as mentioned earlier, as well as the following:
• National Association of County Engineers (NACE) • Institute of Transportation Engineers (ITE) • Local Technical Assistance Program (LTAP) and Tribal Technical Assistance
Program (TTAP) centers
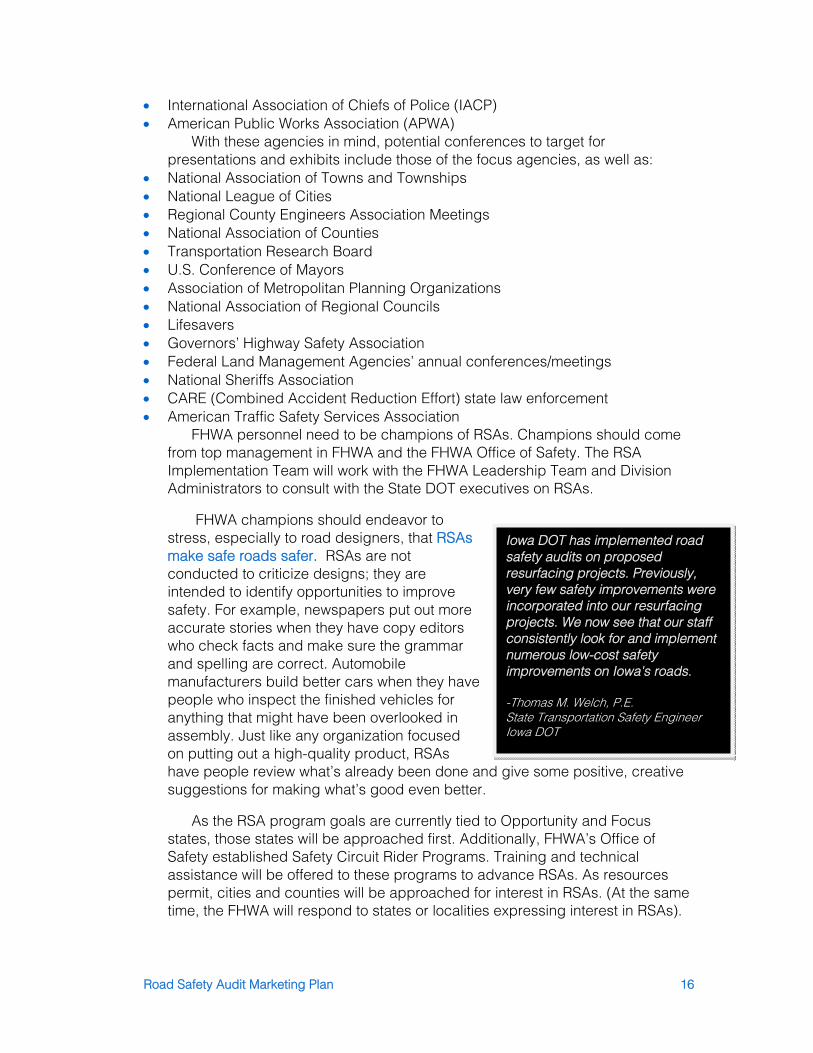
Road Safety Audit Marketing Plan 16
• International Association of Chiefs of Police (IACP) • American Public Works Association (APWA)
With these agencies in mind, potential conferences to target for presentations and exhibits include those of the focus agencies, as well as:
• National Association of Towns and Townships • National League of Cities • Regional County Engineers Association Meetings • National Association of Counties • Transportation Research Board • U.S. Conference of Mayors • Association of Metropolitan Planning Organizations • National Association of Regional Councils • Lifesavers • Governors’ Highway Safety Association • Federal Land Management Agencies’ annual conferences/meetings • National Sheriffs Association • CARE (Combined Accident Reduction Effort) state law enforcement • American Traffic Safety Services Association
FHWA personnel need to be champions of RSAs. Champions should come from top management in FHWA and the FHWA Office of Safety. The RSA Implementation Team will work with the FHWA Leadership Team and Division Administrators to consult with the State DOT executives on RSAs.
FHWA champions should endeavor to stress, especially to road designers, that RSAs make safe roads safer. RSAs are not conducted to criticize designs; they are intended to identify opportunities to improve safety. For example, newspapers put out more accurate stories when they have copy editors who check facts and make sure the grammar and spelling are correct. Automobile manufacturers build better cars when they have people who inspect the finished vehicles for anything that might have been overlooked in assembly. Just like any organization focused on putting out a high-quality product, RSAs have people review what’s already been done and give some positive, creative suggestions for making what’s good even better.
As the RSA program goals are currently tied to Opportunity and Focus states, those states will be approached first. Additionally, FHWA’s Office of Safety established Safety Circuit Rider Programs. Training and technical assistance will be offered to these programs to advance RSAs. As resources permit, cities and counties will be approached for interest in RSAs. (At the same time, the FHWA will respond to states or localities expressing interest in RSAs).
Iowa DOT has implemented road safety audits on proposed resurfacing projects. Previously, very few safety improvements were incorporated into our resurfacing projects. We now see that our staff consistently look for and implement numerous low-cost safety improvements on Iowa's roads.
-Thomas M. Welch, P.E. State Transportation Safety Engineer Iowa DOT
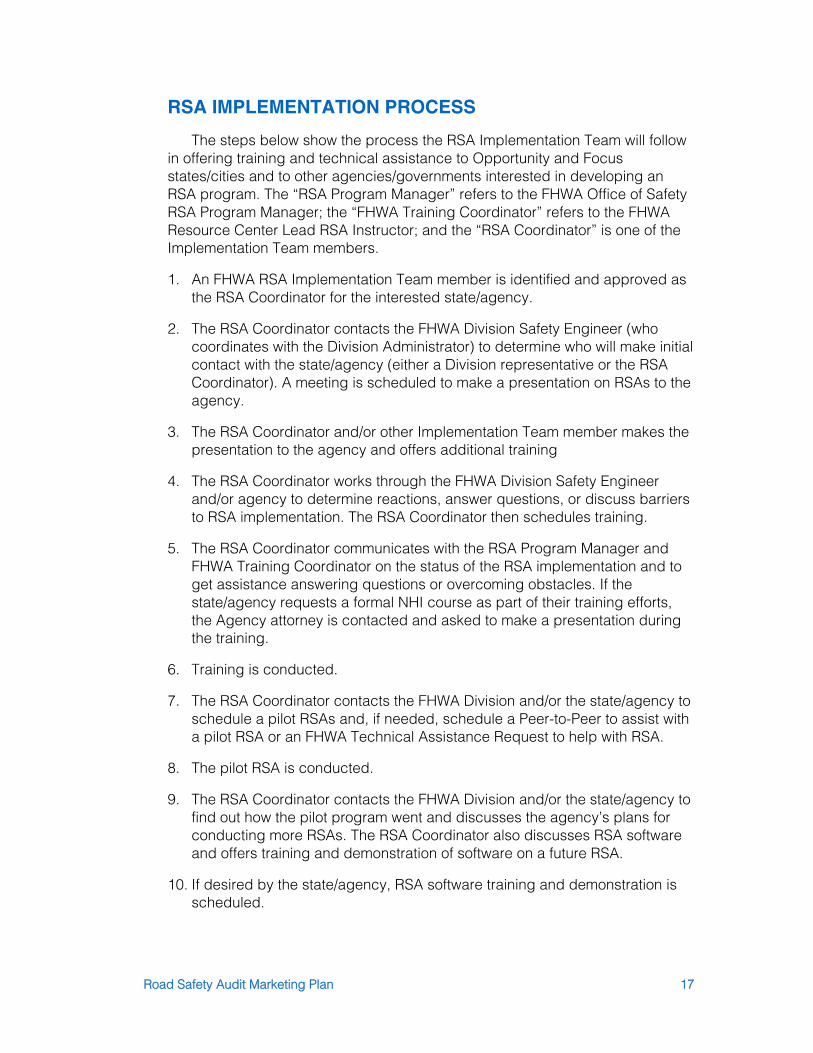
Road Safety Audit Marketing Plan 17
RSA IMPLEMENTATION PROCESS
The steps below show the process the RSA Implementation Team will follow in offering training and technical assistance to Opportunity and Focus states/cities and to other agencies/governments interested in developing an RSA program. The “RSA Program Manager” refers to the FHWA Office of Safety RSA Program Manager; the “FHWA Training Coordinator” refers to the FHWA Resource Center Lead RSA Instructor; and the “RSA Coordinator” is one of the Implementation Team members.
1. An FHWA RSA Implementation Team member is identified and approved as the RSA Coordinator for the interested state/agency.
2. The RSA Coordinator contacts the FHWA Division Safety Engineer (who coordinates with the Division Administrator) to determine who will make initial contact with the state/agency (either a Division representative or the RSA Coordinator). A meeting is scheduled to make a presentation on RSAs to the agency.
3. The RSA Coordinator and/or other Implementation Team member makes the presentation to the agency and offers additional training
4. The RSA Coordinator works through the FHWA Division Safety Engineer and/or agency to determine reactions, answer questions, or discuss barriers to RSA implementation. The RSA Coordinator then schedules training.
5. The RSA Coordinator communicates with the RSA Program Manager and FHWA Training Coordinator on the status of the RSA implementation and to get assistance answering questions or overcoming obstacles. If the state/agency requests a formal NHI course as part of their training efforts, the Agency attorney is contacted and asked to make a presentation during the training.
6. Training is conducted.
7. The RSA Coordinator contacts the FHWA Division and/or the state/agency to schedule a pilot RSAs and, if needed, schedule a Peer-to-Peer to assist with a pilot RSA or an FHWA Technical Assistance Request to help with RSA.
8. The pilot RSA is conducted.
9. The RSA Coordinator contacts the FHWA Division and/or the state/agency to find out how the pilot program went and discusses the agency’s plans for conducting more RSAs. The RSA Coordinator also discusses RSA software and offers training and demonstration of software on a future RSA.
10. If desired by the state/agency, RSA software training and demonstration is scheduled.
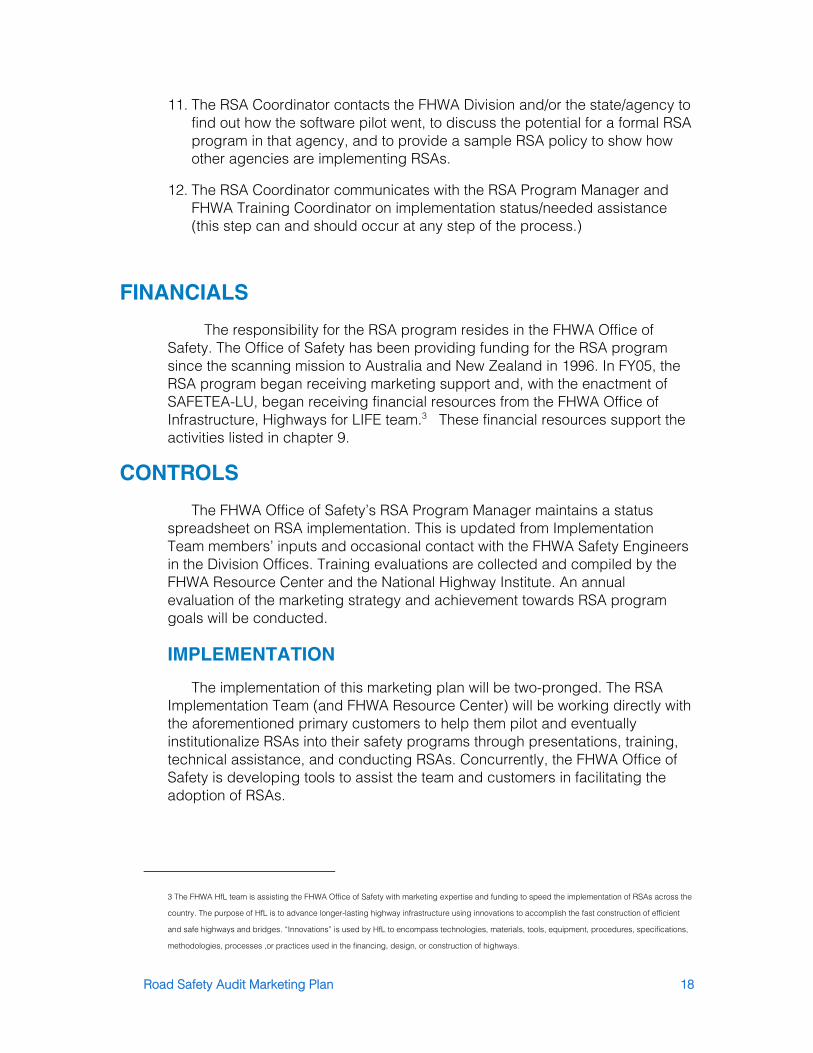
Road Safety Audit Marketing Plan 18
11. The RSA Coordinator contacts the FHWA Division and/or the state/agency to find out how the software pilot went, to discuss the potential for a formal RSA program in that agency, and to provide a sample RSA policy to show how other agencies are implementing RSAs.
12. The RSA Coordinator communicates with the RSA Program Manager and FHWA Training Coordinator on implementation status/needed assistance (this step can and should occur at any step of the process.)
FINANCIALS
The responsibility for the RSA program resides in the FHWA Office of Safety. The Office of Safety has been providing funding for the RSA program since the scanning mission to Australia and New Zealand in 1996. In FY05, the RSA program began receiving marketing support and, with the enactment of SAFETEA-LU, began receiving financial resources from the FHWA Office of Infrastructure, Highways for LIFE team.3 These financial resources support the activities listed in chapter 9.
CONTROLS
The FHWA Office of Safety’s RSA Program Manager maintains a status spreadsheet on RSA implementation. This is updated from Implementation Team members’ inputs and occasional contact with the FHWA Safety Engineers in the Division Offices. Training evaluations are collected and compiled by the FHWA Resource Center and the National Highway Institute. An annual evaluation of the marketing strategy and achievement towards RSA program goals will be conducted.
IMPLEMENTATION
The implementation of this marketing plan will be two-pronged. The RSA Implementation Team (and FHWA Resource Center) will be working directly with the aforementioned primary customers to help them pilot and eventually institutionalize RSAs into their safety programs through presentations, training, technical assistance, and conducting RSAs. Concurrently, the FHWA Office of Safety is developing tools to assist the team and customers in facilitating the adoption of RSAs.
3 The FHWA HfL team is assisting the FHWA Office of Safety with marketing expertise and funding to speed the implementation of RSAs across the
country. The purpose of HfL is to advance longer-lasting highway infrastructure using innovations to accomplish the fast construction of efficient
and safe highways and bridges. “Innovations” is used by HfL to encompass technologies, materials, tools, equipment, procedures, specifications,
methodologies, processes ,or practices used in the financing, design, or construction of highways.
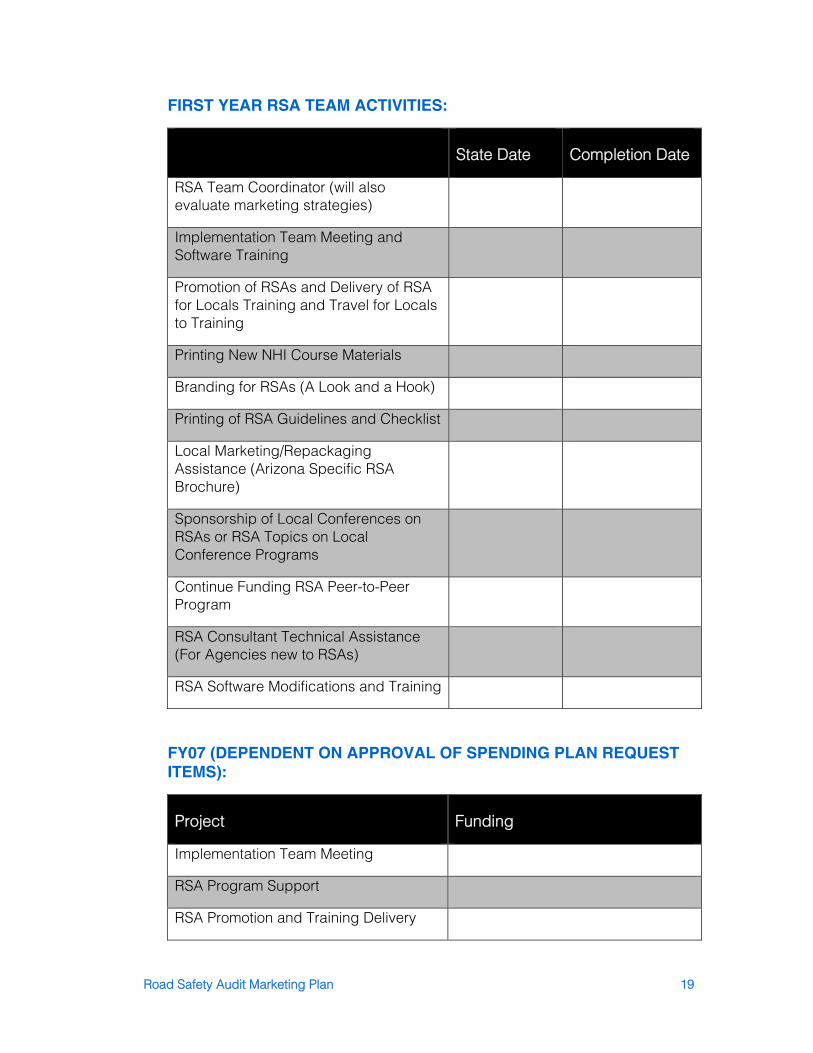
Road Safety Audit Marketing Plan 19
FIRST YEAR RSA TEAM ACTIVITIES:
State Date Completion Date
RSA Team Coordinator (will also evaluate marketing strategies)
Implementation Team Meeting and Software Training
Promotion of RSAs and Delivery of RSA for Locals Training and Travel for Locals to Training
Printing New NHI Course Materials
Branding for RSAs (A Look and a Hook)
Printing of RSA Guidelines and Checklist
Local Marketing/Repackaging Assistance (Arizona Specific RSA Brochure)
Sponsorship of Local Conferences on RSAs or RSA Topics on Local Conference Programs
Continue Funding RSA Peer-to-Peer Program
RSA Consultant Technical Assistance (For Agencies new to RSAs)
RSA Software Modifications and Training
FY07 (DEPENDENT ON APPROVAL OF SPENDING PLAN REQUEST ITEMS):
Project Funding
Implementation Team Meeting
RSA Program Support
RSA Promotion and Training Delivery
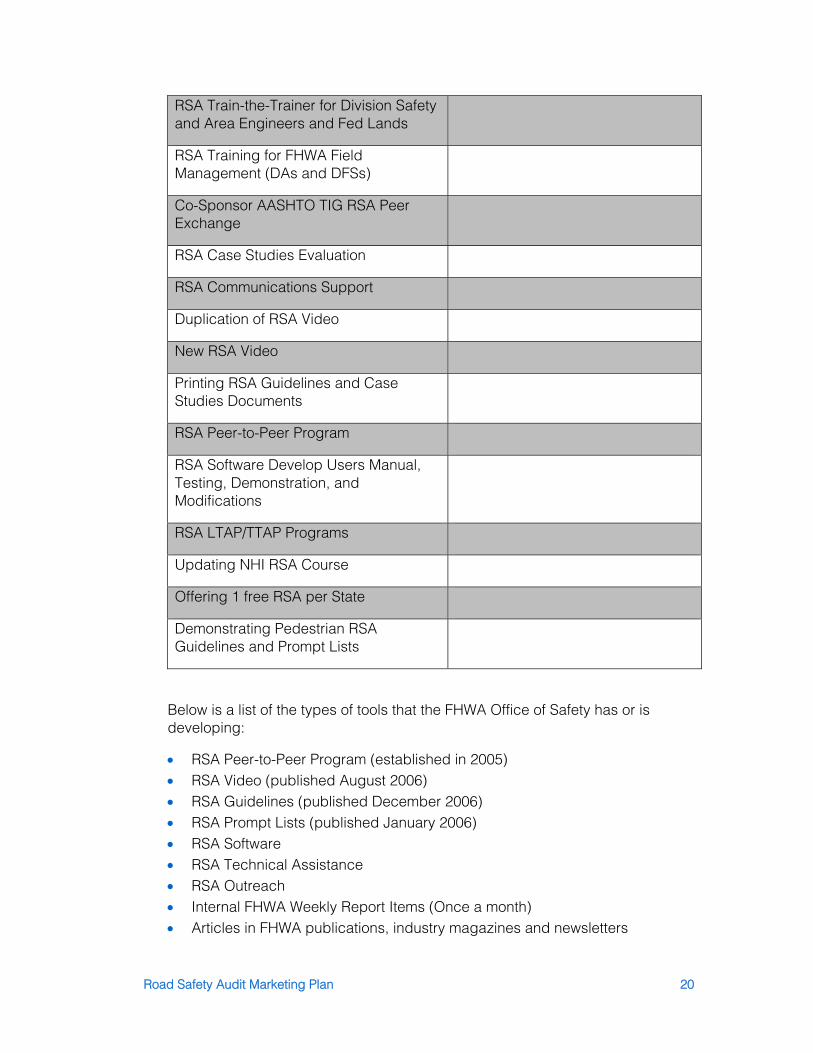
Road Safety Audit Marketing Plan 20
RSA Train-the-Trainer for Division Safety and Area Engineers and Fed Lands
RSA Training for FHWA Field Management (DAs and DFSs)
Co-Sponsor AASHTO TIG RSA Peer Exchange
RSA Case Studies Evaluation
RSA Communications Support
Duplication of RSA Video
New RSA Video
Printing RSA Guidelines and Case Studies Documents
RSA Peer-to-Peer Program
RSA Software Develop Users Manual, Testing, Demonstration, and Modifications
RSA LTAP/TTAP Programs
Updating NHI RSA Course
Offering 1 free RSA per State
Demonstrating Pedestrian RSA Guidelines and Prompt Lists
Below is a list of the types of tools that the FHWA Office of Safety has or is developing:
• RSA Peer-to-Peer Program (established in 2005) • RSA Video (published August 2006) • RSA Guidelines (published December 2006) • RSA Prompt Lists (published January 2006) • RSA Software • RSA Technical Assistance • RSA Outreach • Internal FHWA Weekly Report Items (Once a month) • Articles in FHWA publications, industry magazines and newsletters
Road Safety Audit Marketing Plan 21
• Obtaining reprints of articles for distribution • Developing/Tailoring/Delivering RSA presentations • Developing talking points on RSAs • Developing and Staffing RSA Exhibits • Brochures for overall program, Peer-to-Peer program (published 2006), risk
managers/attorneys, local outreach • Business cards • RSA Website • Maintaining RSA contacts database • RSA Video focusing on RSA results • RSA NHI Training (Developed 2002) • RSA Training for Locals (Developed 2005) • RSA Training Scheduling and Coordination • RSA Peer Exchanges (First one scheduled for May 22-23, 2007) • RSA Case Studies • RSA Benefits Information and Evaluation • RSA LTAP/TTAP Programs • Pedestrian RSA Guidelines and Prompt Lists • Intersection RSA Guidelines and Prompt Lists • Road Departure RSA Guidelines and Prompt Lists • Work Zone RSA Guidelines and Prompt Lists • Low Cost Safety Improvement RSA Implementations • RSA Marketing Plan Implementation Evaluation
The RSA Implementation Team meets yearly to discuss the RSA program.
The team will assist in communicating the availability of these tools to RSA customers and in determining whether these customers have additional RSA needs. These needs may result in the development of additional tools or activities.
MARKETING ORGANIZATION
FHWA’S RSA Implementation Team
• RSA Program Manager, Office of Safety • Craig Allred, Resource Center • Mike Castellano, Pennsylvania Division • Chimai Ngo, Federal Lands Highway • Monica Gourdine, Federal Lands Highway • Byron Lord, Highways for LIFE • Kathleen Bergeron, Highways for LIFE • Timothy Barkley, Office of Safety
Road Safety Audit Marketing Plan 22
• Keith Sinclair, Resource Center • Jeff Shaw, Resource Center • Keith Harrison, Resource Center • Karen Yunk, New Jersey Division • Jessica Rich, Tennessee Division • Marcee Allen, Colorado Division • Karla Petty, HQ Office of Safety/Arizona Division • Don Neuman, HQ Office of Safety/Missouri Division • Rudy Umbs, HQ Office of Safety • Jacinda Russell, Eastern Federal Lands • John Balser, HQ Office of Safety • Additionally, Human factors expertise has been made available from the
FHWA Safety R&D Human Centered Systems Team.
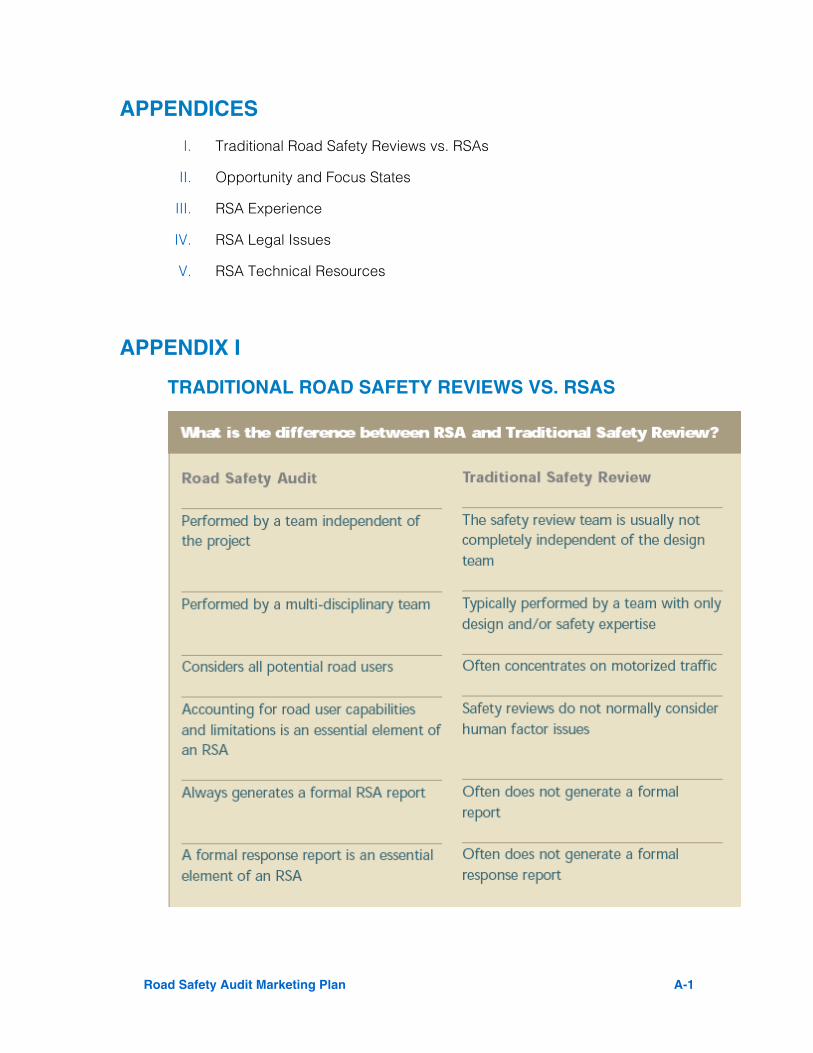
Road Safety Audit Marketing Plan A-1
APPENDICES
I. Traditional Road Safety Reviews vs. RSAs
II. Opportunity and Focus States
III. RSA Experience
IV. RSA Legal Issues
V. RSA Technical Resources
APPENDIX I
TRADITIONAL ROAD SAFETY REVIEWS VS. RSAS
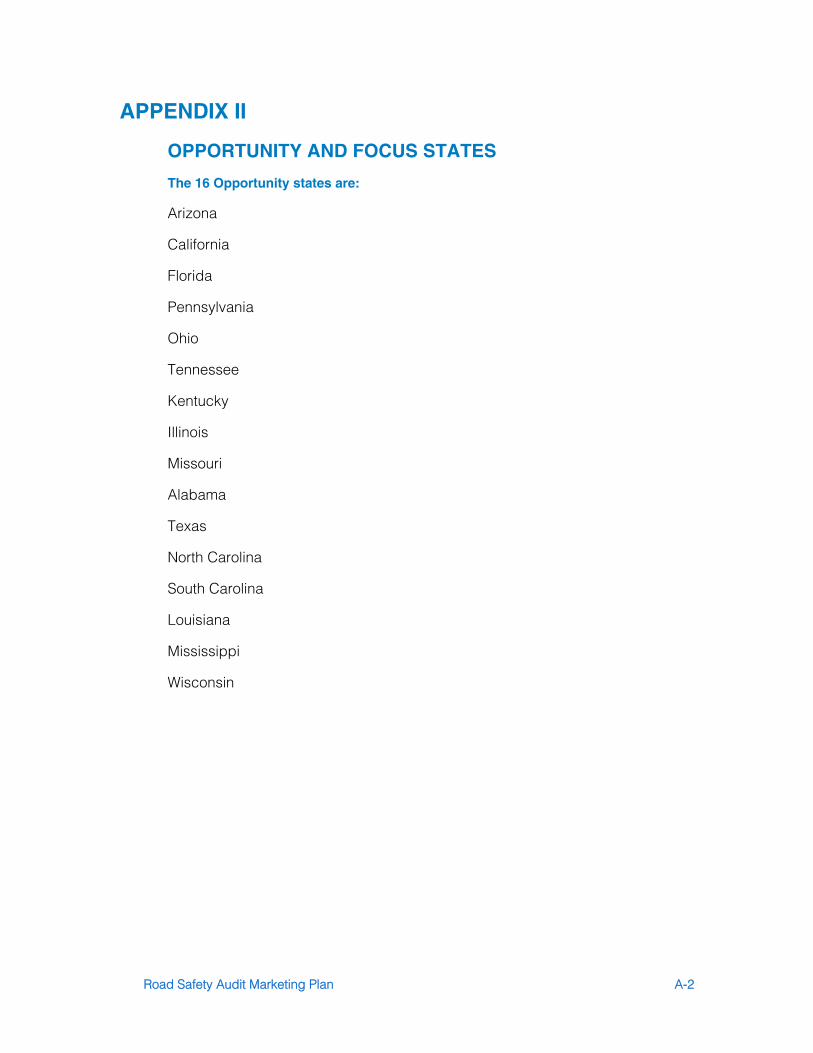
Road Safety Audit Marketing Plan A-2
APPENDIX II
OPPORTUNITY AND FOCUS STATES
The 16 Opportunity states are:
Arizona
California
Florida
Pennsylvania
Ohio
Tennessee
Kentucky
Illinois
Missouri
Alabama
Texas
North Carolina
South Carolina
Louisiana
Mississippi
Wisconsin
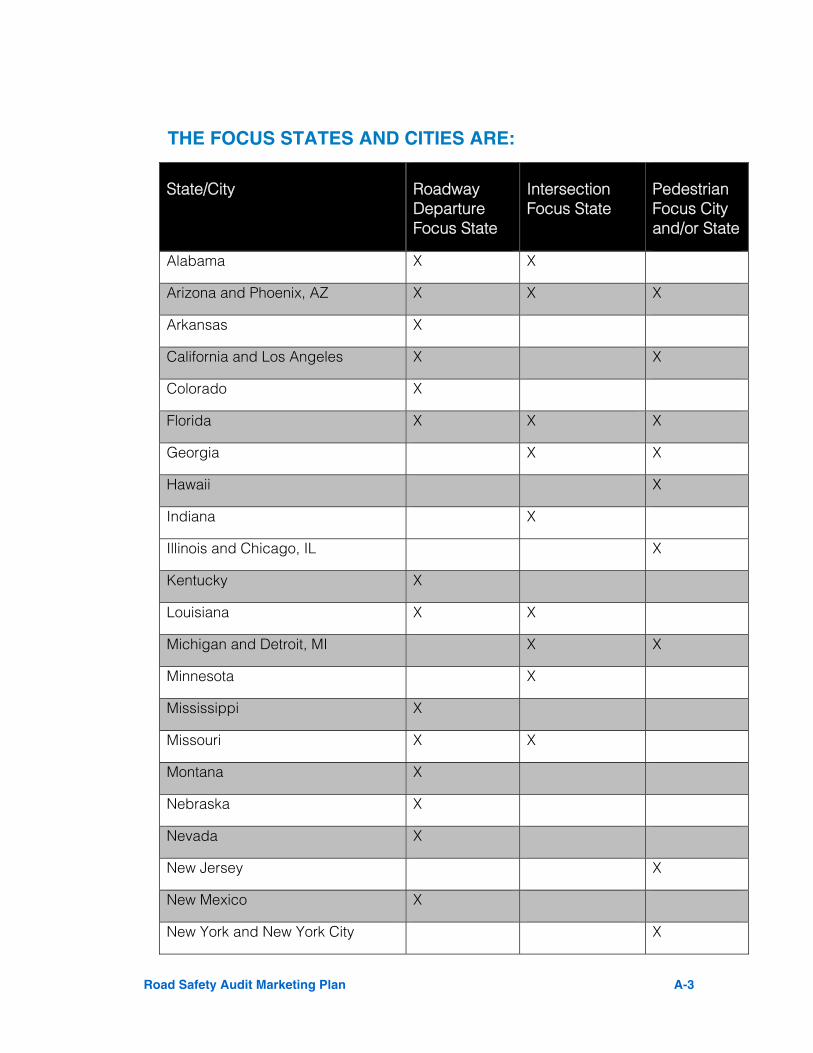
Road Safety Audit Marketing Plan A-3
THE FOCUS STATES AND CITIES ARE:
State/City Roadway Departure Focus State
Intersection Focus State
Pedestrian Focus City and/or State
Alabama X X
Arizona and Phoenix, AZ X X X
Arkansas X
California and Los Angeles X X
Colorado X
Florida X X X
Georgia X X
Hawaii X
Indiana X
Illinois and Chicago, IL X
Kentucky X
Louisiana X X
Michigan and Detroit, MI X X
Minnesota X
Mississippi X
Missouri X X
Montana X
Nebraska X
Nevada X
New Jersey X
New Mexico X
New York and New York City X
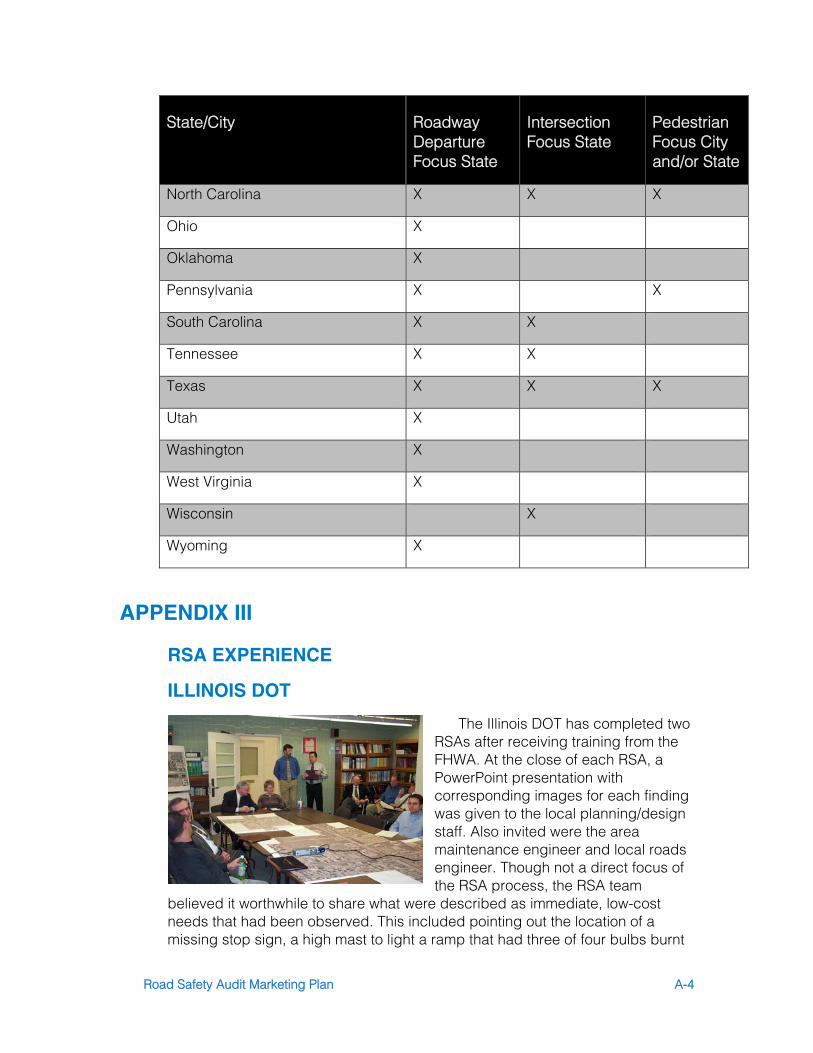
Road Safety Audit Marketing Plan A-4
State/City Roadway Departure Focus State
Intersection Focus State
Pedestrian Focus City and/or State
North Carolina X X X
Ohio X
Oklahoma X
Pennsylvania X X
South Carolina X X
Tennessee X X
Texas X X X
Utah X
Washington X
West Virginia X
Wisconsin X
Wyoming X
APPENDIX III
RSA EXPERIENCE
ILLINOIS DOT
The Illinois DOT has completed two RSAs after receiving training from the FHWA. At the close of each RSA, a PowerPoint presentation with corresponding images for each finding was given to the local planning/design staff. Also invited were the area maintenance engineer and local roads engineer. Though not a direct focus of the RSA process, the RSA team
believed it worthwhile to share what were described as immediate, low-cost needs that had been observed. This included pointing out the location of a missing stop sign, a high mast to light a ramp that had three of four bulbs burnt
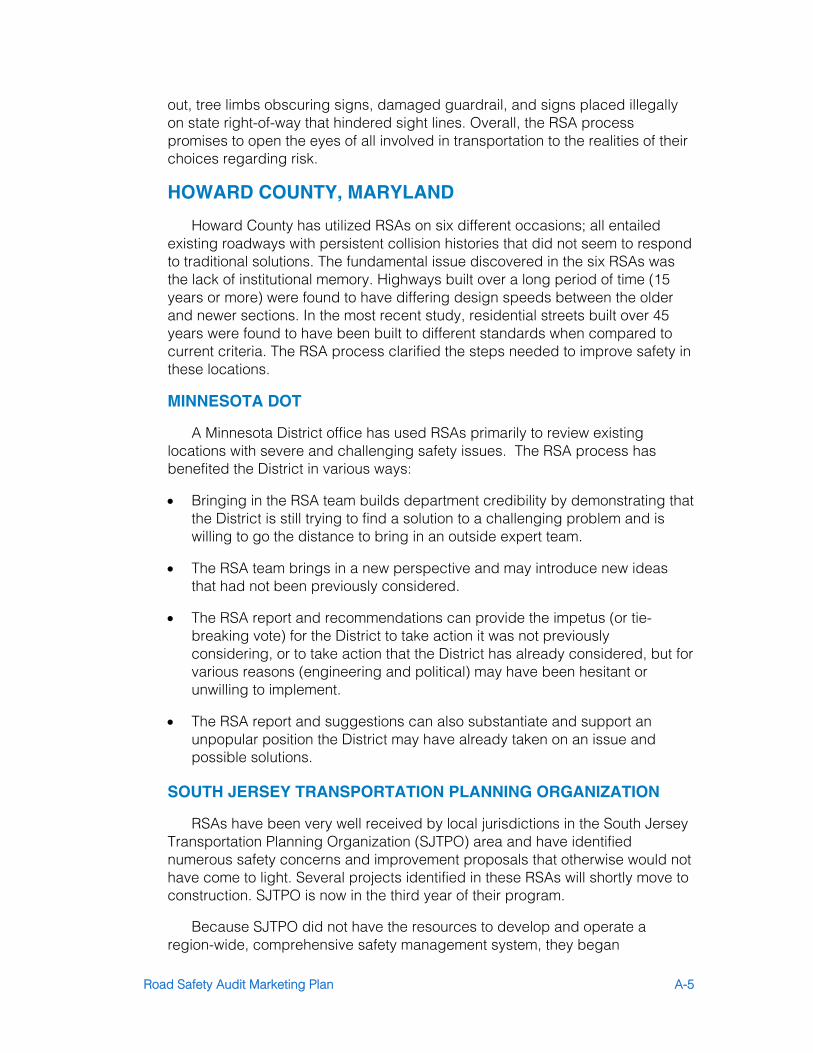
Road Safety Audit Marketing Plan A-5
out, tree limbs obscuring signs, damaged guardrail, and signs placed illegally on state right-of-way that hindered sight lines. Overall, the RSA process promises to open the eyes of all involved in transportation to the realities of their choices regarding risk.
HOWARD COUNTY, MARYLAND
Howard County has utilized RSAs on six different occasions; all entailed existing roadways with persistent collision histories that did not seem to respond to traditional solutions. The fundamental issue discovered in the six RSAs was the lack of institutional memory. Highways built over a long period of time (15 years or more) were found to have differing design speeds between the older and newer sections. In the most recent study, residential streets built over 45 years were found to have been built to different standards when compared to current criteria. The RSA process clarified the steps needed to improve safety in these locations.
MINNESOTA DOT
A Minnesota District office has used RSAs primarily to review existing locations with severe and challenging safety issues. The RSA process has benefited the District in various ways:
• Bringing in the RSA team builds department credibility by demonstrating that the District is still trying to find a solution to a challenging problem and is willing to go the distance to bring in an outside expert team.
• The RSA team brings in a new perspective and may introduce new ideas that had not been previously considered.
• The RSA report and recommendations can provide the impetus (or tie-breaking vote) for the District to take action it was not previously considering, or to take action that the District has already considered, but for various reasons (engineering and political) may have been hesitant or unwilling to implement.
• The RSA report and suggestions can also substantiate and support an unpopular position the District may have already taken on an issue and possible solutions.
SOUTH JERSEY TRANSPORTATION PLANNING ORGANIZATION
RSAs have been very well received by local jurisdictions in the South Jersey Transportation Planning Organization (SJTPO) area and have identified numerous safety concerns and improvement proposals that otherwise would not have come to light. Several projects identified in these RSAs will shortly move to construction. SJTPO is now in the third year of their program.
Because SJTPO did not have the resources to develop and operate a region-wide, comprehensive safety management system, they began
Road Safety Audit Marketing Plan A-6
conducting RSAs for locations of concern. The selection of roads to be audited is done in a rigorous fashion that combines crash data analysis with local experience. Since the recommended improvements emerge from a systematic process that selects the roads to be audited, the FHWA New Jersey Division Office accepts the recommendations as eligible for federal funding.
Both qualitative and quantitative criteria are used in selecting the sites for road safety audits. The SJTPO requests local experts, including engineers, planners, and enforcement officers, to nominate roadway segments that could be improved with quick and inexpensive measures. The nominated road segments initially are selected based on the following qualitative factors:
• Geographic compactness of corridor (road segments should be compact – 2 or 3 continuous miles)
• Degree of local control (there should be local control over the site with few state highway intersections within the selected segment)
• Degree of agency cooperation (cooperation among agencies and governments is important to the success of the project)
• Potential for safety improvement
Road segments that best meet the qualitative criteria are then screened quantitatively using crash, fatality, and injury data from the New Jersey DOT for the years 2001, 2002, 2003, and the first half of 2004. Database tools are used to identify the crashes for each candidate road segment, including cross streets. The number of crashes is converted to a rate per miles of travel to allow a data-driven ranking of candidate segments. The highest ranked segments are then compared to the averages for each of the four counties to identify RSA candidates with high promise for safety improvement.
The SJTPO retains consultants to audit the selected roadways. Audits consist of three phases: data collection and evaluation, field review, and preparation of the report and findings. The audit process is thorough, and each phase must address predefined requirements. The final report summarizes the findings of the inspection and describes recommended improvements.
Generally, an RSA is conducted each year for a roadway segment within each of SJTPO’s four counties. Project development work also is commissioned for high-priority improvements identified from previous audits. Depending on the types and costs of recommended improvements, projects can be either programmed for federal authorization in the following fiscal year or handled by the sponsoring agency with their own funds. Many improvements, such as sign replacement, striping, and clear zone maintenance, can be prioritized within existing maintenance budgets, whereas large-scale, complex improvements, such as intersection reconstruction or the addition of turn lanes, must be assigned to a regional project pool for prioritization and eventual implementation.
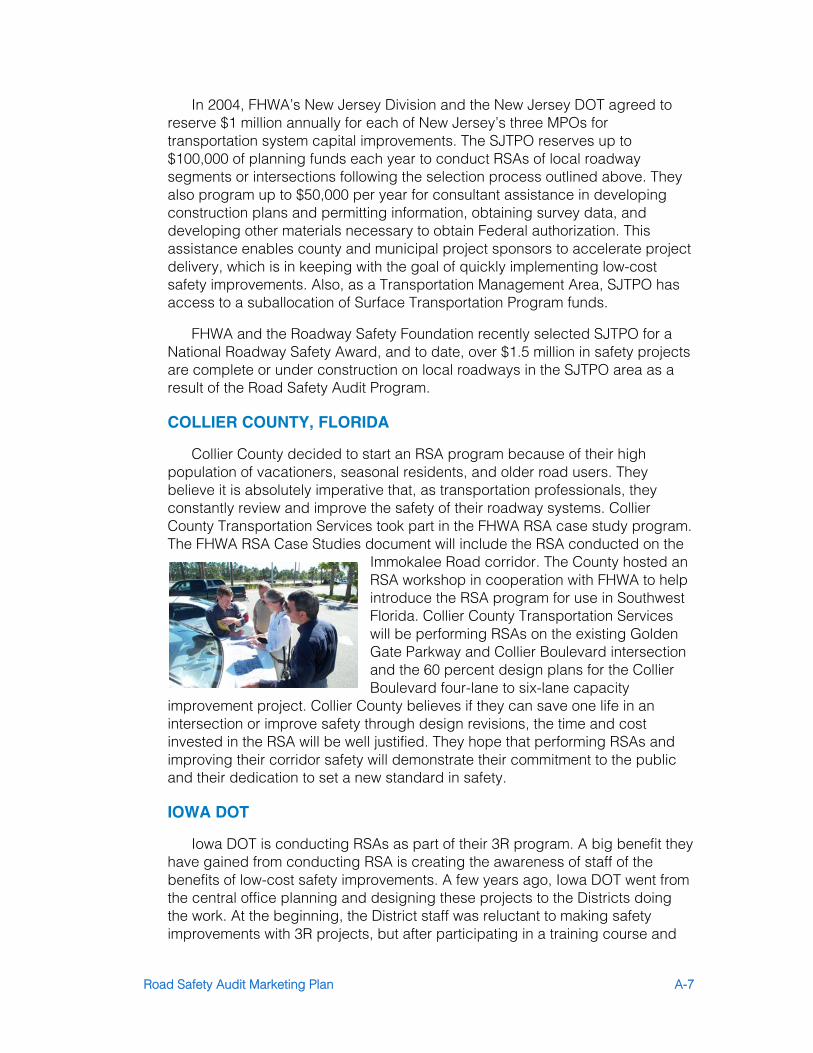
Road Safety Audit Marketing Plan A-7
In 2004, FHWA’s New Jersey Division and the New Jersey DOT agreed to reserve $1 million annually for each of New Jersey’s three MPOs for transportation system capital improvements. The SJTPO reserves up to $100,000 of planning funds each year to conduct RSAs of local roadway segments or intersections following the selection process outlined above. They also program up to $50,000 per year for consultant assistance in developing construction plans and permitting information, obtaining survey data, and developing other materials necessary to obtain Federal authorization. This assistance enables county and municipal project sponsors to accelerate project delivery, which is in keeping with the goal of quickly implementing low-cost safety improvements. Also, as a Transportation Management Area, SJTPO has access to a suballocation of Surface Transportation Program funds.
FHWA and the Roadway Safety Foundation recently selected SJTPO for a National Roadway Safety Award, and to date, over $1.5 million in safety projects are complete or under construction on local roadways in the SJTPO area as a result of the Road Safety Audit Program.
COLLIER COUNTY, FLORIDA
Collier County decided to start an RSA program because of their high population of vacationers, seasonal residents, and older road users. They believe it is absolutely imperative that, as transportation professionals, they constantly review and improve the safety of their roadway systems. Collier County Transportation Services took part in the FHWA RSA case study program. The FHWA RSA Case Studies document will include the RSA conducted on the
Immokalee Road corridor. The County hosted an RSA workshop in cooperation with FHWA to help introduce the RSA program for use in Southwest Florida. Collier County Transportation Services will be performing RSAs on the existing Golden Gate Parkway and Collier Boulevard intersection and the 60 percent design plans for the Collier Boulevard four-lane to six-lane capacity
improvement project. Collier County believes if they can save one life in an intersection or improve safety through design revisions, the time and cost invested in the RSA will be well justified. They hope that performing RSAs and improving their corridor safety will demonstrate their commitment to the public and their dedication to set a new standard in safety.
IOWA DOT
Iowa DOT is conducting RSAs as part of their 3R program. A big benefit they have gained from conducting RSA is creating the awareness of staff of the benefits of low-cost safety improvements. A few years ago, Iowa DOT went from the central office planning and designing these projects to the Districts doing the work. At the beginning, the District staff was reluctant to making safety improvements with 3R projects, but after participating in a training course and
Road Safety Audit Marketing Plan A-8
experiencing some RSAs, the Districts are recommending improvements to the Iowa DOT Central Office of Safety. The Districts have really bought into RSAs. Iowa DOT’s Central Office of Safety believes that incorporating low-cost safety improvements into 3R projects will result in a much higher benefit/cost ratio as compared to spending larger amounts of safety funds at isolated intersections.
Another benefit to RSAs is that it helps Iowa DOT keep their institutional knowledge. They have had three early retirement packages and are losing their more experienced people. Including newer engineering staff with experienced engineering staff on RSA teams helps bridge the gaps and becomes a very educational experience.
If hadn't been for RSAs, Iowa would have missed a great opportunity to implement the rumble "stripe" countermeasure. Iowa DOT was conducting a RSA in a DOT District in Iowa and reviewed a narrow two-lane roadway that was programmed for resurfacing. The road had a pretty high rate of roadway departure injuries and fatalities. The District planned to pave the entire road top and stripe 12-ft lanes, which would have left them with little or no shoulder. An RSA team member informed them of the research that shows that the safety of a roadway is degraded when the speeds go up after resurfacing and recommended they consider the rumble stripe concept. Iowa DOT ended up going with that approach, placing 11-ft lanes and having 2 ½ ft of paved shoulder with the edgeline in the rumble strip. This was completed in June 2005.
CLARK COUNTY, WASHINGTON
Clark County participated in the FHWA RSA Case Studies project. The project selected for the RSA was improvements to Ward Road, a two-lane rural roadway, initially motivated by safety concerns resulting from high-severity off-road collisions. Subsequently, the County’s Growth Management Act (1995) resulted in anticipated changes to the road network and hierarchy in the vicinity of the planned improvements, which resulted in the introduction of additional elements to the upgrades. The road improvements were the subject of considerable public interest and input, which had also influenced the design.
The planned improvements affected three roads: Ward Road (also known as 182nd Avenue), 172nd Avenue, and 119th Street. In addition to functioning as major rural collectors, these roads provided access to adjacent properties (residential and farm) and a small farming town.
At the time of the RSA, the improvements were in the County’s current Transportation Improvement Program, and were in the final design stage. Overall construction costs were estimated at about $9 million, including land acquisition costs.
Discussions with County staff indicated that, although improvements to Ward Road were initially proposed primarily to address high-severity off-road collisions, additional issues arose during the lengthy public consultation process concerning the level of traffic considered by different community groups to be
Road Safety Audit Marketing Plan A-9
suitable on the improved roads. To reconcile the competing desires of these groups, and to provide a forum for the groups to contribute beyond the public consultation stage to the actual design, a Community Design Team (CDT) was established that included representatives of the adjacent communities.
The design that was adopted to meet the requirements of the CDT appeared to have expanded beyond the initial safety-related aim of reducing collisions, to include two additional (and potentially competing) aims of controlling traffic speeds by increasing the number of controlled intersections through which traffic would pass, and achieving a redistribution of traffic that the CDT deemed equitable. Although the County’s efforts to include the public in the design process were in many ways laudable, the resulting reconfiguration of intersections and introduction of new traffic control devices was expected to compromise traffic safety by introducing additional conflict points. The RSA team felt it necessary to point out that that net result of directing formerly free-flowing traffic through controlled intersections was expected to be decreased severity, but increased frequency, of collisions compared with existing conditions. As a result of the RSA, County engineering staff started a re-examination of major elements of the project, which they expected would lead to a safer project at considerably less expense.
APPENDIX IV
RSA LEGAL ISSUES4
Some state and local agencies have been hesitant to conduct RSAs due to a fear that RSA reports will be used against them in tort liability lawsuits. Tort liability at the state and local level is a matter that is decided in accordance with state law and jurisprudence (court decisions).
A survey of state DOTs was conducted as part of NCHRP Synthesis project #336, Road Safety Audits. The survey asked questions about states’ sovereign immunity. Sovereign immunity is the doctrine that government agencies are immune to lawsuits unless they give their consent to the lawsuit. A summary of the information in the synthesis follows.
There appeared to be no specific trend in applying RSAs (to new projects or to existing roads) and whether or not the state had sovereign immunity. Two states implementing RSAs indicated full immunity, and three indicated partial immunity. For states that use RSAs (in the design stage or on existing roads but not both), two indicated full immunity, four had partial immunity, and four had no immunity.
4 The information provided here is not legal advice, but is meant to assist public agencies in discussions with their attorneys on developing a policy
for the implementation of RSAs.
Road Safety Audit Marketing Plan A-10
The same survey also received this response related to liability: “Liability is one of the major driving factors in performing a good audit; it demonstrates a proactive approach to identifying and mitigating safety concerns. When findings cannot be implemented an exception report is developed to address liability and mitigating measures. Our attorneys say that once safety issues are identified, and we have financial limitations on how much and how fast we can correct the issues, then the audit will help us in defense of liability.”
In the case of Kansas DOT, the RSA program was implemented to be proactive in identifying and fixing safety issues. The results of RSAs are for internal staff use only and are not available to the public or to lawyers representing claims against the state. There have been instances where these records were requested by outside legal counsel and to date, the information has remained at KDOT. The only instance where a RSA report was released was in a case where the state was being sued but the claim did not ask for any money. (Public disclosure laws require release of this information in many states. However, some states do not allow information gathered under public disclosure laws to be used in lawsuits.)
The Iowa DOT has had no instances of RSA records being requested or used in court by outside legal counsel. In both cases above, these states have successfully implemented RSA programs, which significantly improve the safety along public agency roads and assist in decision-making agency wide.
Federal law affords evidentiary and discovery protections that assist state and local highway agencies in keeping data and reports compiled or collected pursuant to various federal safety improvement programs from being used in tort liability actions. However, federal law does not protect data and reports from Freedom of Information Act requests.
The Highway Safety Act of 1973 was enacted to improve the safety of our nation’s highways by encouraging closer federal and state cooperation with respect to road safety improvement projects. The Act included several categorical programs to assist states in identifying highways in need of improvements and in funding these improvements, including 23 U.S.C. § 152 (Hazard Elimination Program, “Section 152”).i States objected to the absence of any confidentiality with respect to their compliance measures under Section 152, fearing that any information collected could be used as an effort-free tool in litigation against governments.
23 U.S.C. § 409 (“Section 409”) was enacted to address this concern. This law expressly forbids the discovery or admission into evidence of reports, data, or other information compiled or collected for activities required pursuant to several federal highway safety programs [including Sections 130, and 152 (now 148)] or for the purpose of developing any highway safety construction improvement project, in tort litigation arising from occurrences at the locations addressed in such documents or data.ii In 2003, the U.S. Supreme Court upheld the Constitutionality of Section 409, indicating that it “protects all reports, surveys, schedules, lists, or data actually compiled or collected for § 152
Road Safety Audit Marketing Plan A-11
purposes” (emphasis on original).iii Some states consider information covered by Section 409 as an exemption to its public disclosure laws, but courts may not agree with this interpretation.iv
Another approach could be to use RSA reports in tort liability suits to show the courts that the state or local agency is proactively trying to improve safety. Many litigants and their lawyers will hire an expert witness to conduct their own safety review of the location in question. The RSA report can be used to refute or counter the expert witness’s report and to show the public agency’s efforts at improving safety in that location. It is important to have a response to the RSA report in the file to show how the agency plans to incorporate the suggestions or why the RSA report suggestions will not be implemented.
Notes:
I. Under the Surface Transportation Act of 1978, these categorical programs were merged into the Rail Highway Crossing program (23 U.S.C. 130) and the Hazard Elimination Program (23 U.S.C. 152). To be eligible for funds under Section 152, a state or local government must “conduct and systematically maintain an engineering survey of all public roads to identify hazardous locations, sections, and elements, including roadside obstacles and unmarked or poorly marked roads, which may constitute a danger to motorists, bicyclists, and pedestrians, assign priorities for the correction of such locations, sections, and elements, and establish and implement a schedule of projects for their improvement.” The recently enacted section 1401 of SAFETEA-LU (Pub. L. 109-59, August 10, 2005) establishes a new Highway Safety Improvement Program in 23 U.S.C. § 148, which incorporates the elements of section 152 and which will be the source of funding for the activities eligible under that section. As a result of this provision of SAFETEA-LU, 23 U.S.C. § 409, cited in the next footnote, now references section 148, not section 152. Because activities eligible under section 152 will be funded under section 148, they will continue to be protected pursuant to section 409.
II. Section 409 in its entirety states “Notwithstanding any other provision of law, reports, surveys, schedules, lists, or data compiled or collected for the purpose of identifying, evaluating, or planning the safety enhancement of potential accident sites, hazardous roadway conditions, or railway-highway crossings, pursuant to sections 130, 144, and 148 [152] of this title or for the purpose of developing any highway safety construction improvement project which may be implemented utilizing Federal-aid highway funds shall not be subject to discovery or admitted into evidence in a Federal or State court proceeding or considered for other purposes in any action for damages arising from any occurrence at a location mentioned or addressed in such reports, surveys, schedules, lists, or data.”
III. Pierce County, Washington v. Guillen, 537 U.S. 129 (2003).
IV. The New York Supreme Court recently held that 409 protects only from requests in litigation and, thus, does not create a public records exemption in New York. See Newsday v. State DOT, Supreme Court Appellate Division, Third Judicial Department (July 1, 2004).
APPENDIX V
RSA TECHNICAL RESOURCES
There are a number of technical resources developed or under development for use by practitioners wishing to learn more about RSAs. These resources are discussed briefly below. For more detailed information, please contact John Dewar in FHWA’s Office of Safety Programs at [email protected].
Road Safety Audit Marketing Plan A-12
RSA Guidelines and Prompt Lists
The primary purpose of these guidelines is to provide a foundation for public agencies and tribal governments to draw upon when developing their own RSA policies and procedures and when conducting RSAs within their jurisdiction. These guidelines were developed by building upon experiences gained in the United States and in other countries. They are meant to present basic RSA principles, to encourage public agencies to implement road safety audits, and to embrace them as part of their everyday practice.
These guidelines are intended to provide information on road safety audits to policy makers, RSA teams, designers, planners, operations and safety analysts, project managers and clients and the general public. They are intended to promote awareness of road safety audits in terms of: societal benefits; principles, procedures, roles and responsibilities; qualifications of the audit teams; project cost and schedule implications; guidelines for selecting projects to audit; and tools, methods and resources available.
The guidelines are divided into three main sections. Part A provides general information on RSAs, information on how to implement an RSA program, and an overview of the RSA process. Part B describes the stages of an RSA and different types of audits, including preliminary design, detailed design, construction, pre-opening, and audits of existing roads. Part C describes RSA tools, namely prompt lists, and when and how to use them. Following the body of the guidelines, appendices that discuss approaches to road safety and the evolution of RSAs are provided. Several case studies are also provided, and a bibliography is included.
High-level and detailed prompt lists have been developed and may be used by RSA teams and designers. RSA prompt lists, even the most detailed ones, should be viewed as a prompt only. They are not a substitute for knowledge and experience; rather, they are an aid in the application of knowledge and experience. The RSA prompt lists are not all-inclusive, nor will they cover all potential issues and circumstances. Prompt lists can be downloaded from the FHWA Website at: http://safety.fhwa.dot.gov/rsa/index.htm.
RSA Software
A software tool for assisting the completion of RSAs has also been developed. The software facilitates team members in the collection of information as they proceed through the RSA process. It gives users access to comprehensive prompt lists and reduces the potential for users to simply “check” issues off a list. The prompt lists are comprehensive, helping users to identify issues that may be overlooked in the RSA process. They are presented in levels that users can drill into to get broad or detailed level prompts. With the software, users can link identified issues to user-defined locations in the study area and they can also provide accompanying comments with each issue. It also allows users to record suggestions for improvements that may be identified. Finally,
Road Safety Audit Marketing Plan A-13
output from the RSA software group’s findings, by issue, and exports the results to a Word compatible file that allows for quick completion of a formal RSA report.
RSA Case Studies
To demonstrate the effectiveness of RSAs, in December 2003 the FHWA Office of Safety sponsored an RSA of the Marquette Interchange in Milwaukee, Wisconsin. The RSA team reviewed the detailed design for an $800 million interchange reconstruction project. Subsequently, in the summer of 2004, the FHWA Office of Safety commissioned a series of nine additional RSAs. Between 2004 and 2006, RSAs were conducted with the following agencies: Illinois DOT, Oklahoma DOT, Oregon DOT, Wisconsin DOT, Standing Rock Sioux Tribe, City of Cincinnati, City of Tucson, Clark County (WA), Collier County (FL), and the National Park Service. The aim of these case studies was to demonstrate the usefulness and effectiveness of RSAs for a variety of projects, project stages, and in a variety of agencies throughout the United States.
Each case study includes photographs, a project description, a summary of key findings, and the lessons learned. The aim of this document is to provide state and local agencies and tribal governments with examples and advice that can assist them in implementing RSAs in their own jurisdictions.
RSA for Locals Training Course
The Road Safety Audits for Local Governments workshop is designed to introduce road safety audits as an effective tool that can help to reduce injuries and fatalities on local road networks. The workshop will help local road agency professionals understand basic road safety audit concepts, risk and safety, and common issues.
Agencies interested in scheduling a training course should contact Eloisa Raynault at [email protected] or phone: 202-366-3499.
RSA Training
NHI RSA Course
COURSE NUMBER: FHWA-NHI-380069
Course Title: Road Safety Audits and Road Safety Audit Reviews
Length: 2 Days CEU: 1.2 Units FEE: $270 Per Participant CLASS SIZE: Minimum: 20; Maximum: 30
Description: Performing effective road safety audits (RSAs) and road safety audit reviews (RSARs) improves safety and demonstrates to the public an agency's dedication to accident reduction. This course provides practical information on how to conduct a road safety audit. Participants learn how to improve transportation safety by applying a new proactive approach to RSAs and RSARs. This approach includes
Road Safety Audit Marketing Plan A-14
examination of a future or existing roadway by an independent, qualified audit team.
The course includes hands-on application of the training materials, which include information on the history and definition of RSAs, the importance of safety, the stages of a road safety audit, how to conduct a road safety audit, easy-to-use-checklists, and legal considerations. A copy of "Road Safety Audits and Road Safety Audit Reviews Reference Manual" is provided.
Outcomes: Upon completion of the course, participants will be able to:
• Express the road safety audit process terminology
• Perform a simple road safety audit, as a member of a team
• Assess the benefits of a road safety audit on a statewide basis
Target Audience: Federal, State, and local transportation personnel who are likely to serve on a road safety audit team. Consultants who conduct highway safety studies should also attend.
Course Scheduling: NHI Training Team (703) 235-0534
RSA PEER-TO-PEER PROGRAM
Technical or procedural questions often arise before and during an RSA. To provide assistance to agencies considering or actively conducting RSAs, FHWA’s Office of Safety has established a Peer-to-Peer (P2P) program. The RSA P2P program is provided at no cost to state, local and tribal transportation agencies, and it is easy to access the support of a knowledgeable peer.
An agency can request assistance either by email or by calling the toll-free number describing their needs to the FHWA-sponsored P2P coordinator. The coordinator will match the agency with a transportation professional that is experienced and knowledgeable in RSAs, including expertise with particular issues or types of RSAs.
The matched peer will then contact the agency to work out the details of the assistance to be provided within the program framework, which can include a site visit as needed.
To contact the Road Safety Audit Peer-to-Peer Program, call (866) P2P-FHWA or email: [email protected].

Road Safety Audit Marketing Plan
Road Safety Audit Marketing Plan A-16
U.S. Department of Transportation
Federal Highway Administration
Highways for LIFE
1200 New Jersey Ave, SE
Washington, DC 20590
www.fhwa.dot.gov/hfl
Phone 202.366.5508
Marketing Plan Making Work Zones Work Better
Marketing Plan
Making Work Zones Work Better
March 2007

Marketing Plan Making Work Zones Work Better
Marketing Plan Making Work Zones Work Better
TABLE OF CONTENTS
INTRODUCTION ............................................................................................ 1
CORPORATE PHILOSOPHIES ..................................................................... 3
SITUATION ANALYSIS ................................................................................. 6
PRODUCT ANALYSIS ................................................................................ 12
Peer-to-Peer (P2P) Program ...................................................................... 13
Focused Workshops ................................................................................. 14
Project Assessment Assistance ................................................................ 15
Additional MWZWB Resources ................................................................. 16
Additional HfL Resources ......................................................................... 16
Follow Up .................................................................................................. 17
Goals/Measures of Effectiveness .............................................................. 17
CUSTOMER-CLIENT ANALYSIS/TARGET MARKETS .............................. 18
STRATEGIC PLAN TO DELIVER AND DEPLOY MWZWB ........................ 20
Challenges ................................................................................................ 21
Scheduling of Activities ............................................................................. 22
Roles of Various FHWA Offices/Units ........................................................ 22
Making Work Zones Work Better Program Goals ...................................... 22
MARKETING STRATEGY ........................................................................... 22
Channels of Distribution ............................................................................ 22
Marketing Measures of Effectiveness........................................................ 23
PROJECTED PROGRAM MARKETING AND OPERATING COSTS .......... 24
APPENDIX A – FINAL RULE .................................................................... A-1
APPENDIX B – WORK ZONE SELF-ASSESSMENT SUMMARIES ......... B-1

Marketing Plan Making Work Zones Work Better 1
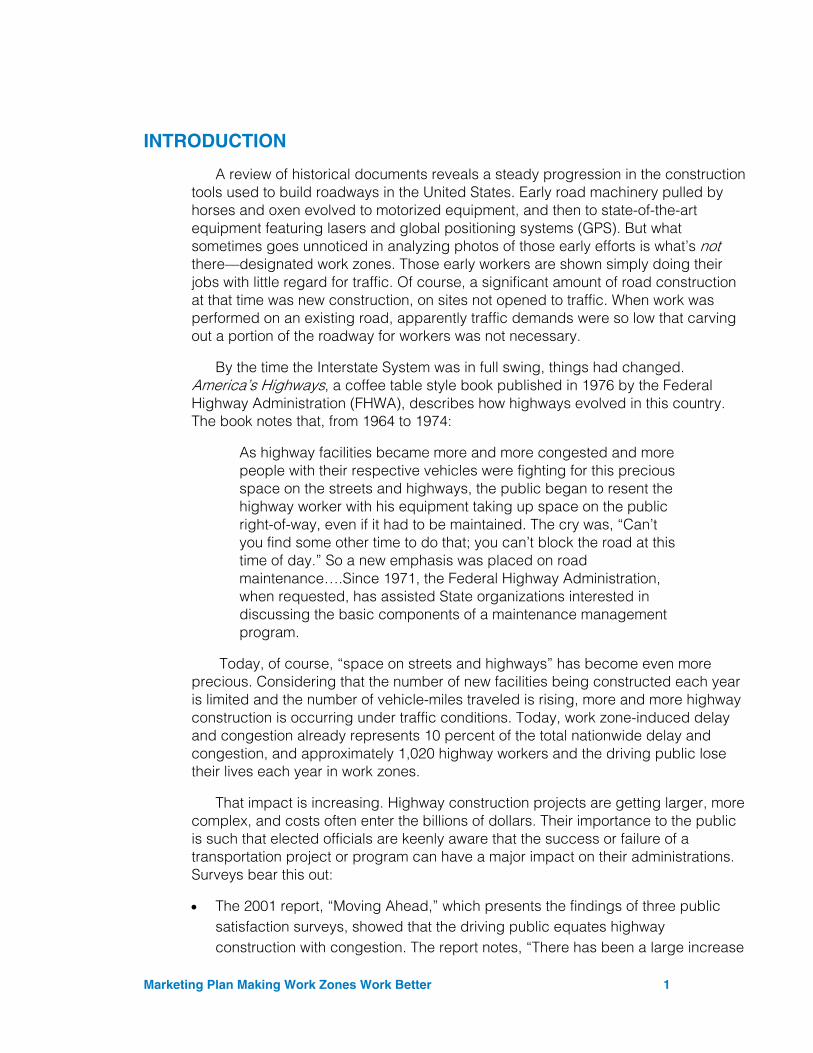
Marketing Plan Making Work Zones Work Better 1
INTRODUCTION
A review of historical documents reveals a steady progression in the construction tools used to build roadways in the United States. Early road machinery pulled by horses and oxen evolved to motorized equipment, and then to state-of-the-art equipment featuring lasers and global positioning systems (GPS). But what sometimes goes unnoticed in analyzing photos of those early efforts is what’s not there—designated work zones. Those early workers are shown simply doing their jobs with little regard for traffic. Of course, a significant amount of road construction at that time was new construction, on sites not opened to traffic. When work was performed on an existing road, apparently traffic demands were so low that carving out a portion of the roadway for workers was not necessary.
By the time the Interstate System was in full swing, things had changed. America’s Highways, a coffee table style book published in 1976 by the Federal Highway Administration (FHWA), describes how highways evolved in this country. The book notes that, from 1964 to 1974:
As highway facilities became more and more congested and more people with their respective vehicles were fighting for this precious space on the streets and highways, the public began to resent the highway worker with his equipment taking up space on the public right-of-way, even if it had to be maintained. The cry was, “Can’t you find some other time to do that; you can’t block the road at this time of day.” So a new emphasis was placed on road maintenance….Since 1971, the Federal Highway Administration, when requested, has assisted State organizations interested in discussing the basic components of a maintenance management program.
Today, of course, “space on streets and highways” has become even more precious. Considering that the number of new facilities being constructed each year is limited and the number of vehicle-miles traveled is rising, more and more highway construction is occurring under traffic conditions. Today, work zone-induced delay and congestion already represents 10 percent of the total nationwide delay and congestion, and approximately 1,020 highway workers and the driving public lose their lives each year in work zones.
That impact is increasing. Highway construction projects are getting larger, more complex, and costs often enter the billions of dollars. Their importance to the public is such that elected officials are keenly aware that the success or failure of a transportation project or program can have a major impact on their administrations. Surveys bear this out:
• The 2001 report, “Moving Ahead,” which presents the findings of three public satisfaction surveys, showed that the driving public equates highway construction with congestion. The report notes, “There has been a large increase
Marketing Plan Making Work Zones Work Better 2
(20 percentage points average) in dissatisfaction with all elements of traffic flow on major highways during the past five years. In 2000, 43 percent of respondents expressed dissatisfaction with traffic flow, compared to 23 percent in 1995. This may explain some of the 6 percentage point increase in dissatisfaction with highways. Thirty-two percent of respondents expressed dissatisfaction with work zones, the second highest indicator of dissatisfaction among attributes of major highways.”
• The 2005 version of the annual “Drive for Life” survey conducted by Mason-Dixon Polling and Research, Inc., showed that traffic delays were second only to other drivers’ behavior in the rankings of what aggravates drivers most.
The time is ripe for a dramatic change in how work zones are created and managed. On September 9, 2004, the FHWA published the Work Zone Safety and Mobility Rule. This new rule updates and renames the former regulation on "Traffic Safety in Highway and Street Work Zones" in 23 CFR 630 Subpart J. All state and local governments that receive Federal-aid highway funding are are required to comply with the updated provisions no later than October 12, 2007.
Along with its sponsorship of the rule, FHWA determined to offer significant assistance to states in conforming to the rule’s requirements, and the agency’s Office of Operations determined to develop a multi-faceted program to that end. This would include communications, one-on-one assistance, and scanning tours and demonstrations of successful applications.
Meanwhile, the Highways for LIFE (HfL) program was established to find ways of getting innovations and new highway technologies put into practice faster, thereby dramatically improving the American driving experience. These innovations might be ways of building highways faster, smoother, safer, or of better quality so that there would be less frequent repair crews disrupting traffic. Every highway construction project has to deal with the traffic management issue, so the goals of the Office of Operation and HfL with regard to making work zones work better obviously had common ground.
HfL determined that one way of accelerating the rate that members of the highway community embraced new technology might be through improving the process used in what is referred to as “technology transfer.” In the late 1990s, FHWA underwent an organizational restructuring. One piece of the restructuring was the dissolving of the existing organizational unit which had the corporate responsibility for technology delivery. Funds previously used by that entity were distributed to the individual program offices (Infrastructure, Safety, Operations, etc.), and these program offices were charged with managing their own efforts of deployment.
The HfL team therefore made a proposition to the heads of the three program offices: If they would select an innovation or technology that they believed their office urgently needed to get implemented nationally, the HfL program would support it
Marketing Plan Making Work Zones Work Better 3
with funding, marketing expertise, and by championing it to the leadership of the agency, as well as the highway community as a whole. The following were the selected innovations:
• Office of Infrastructure: Prefabricated Bridge Elements and Systems (PBES) • Office of Safety: Road Safety Audits (RSA) • Office of Operations: Making Work Zones Work Better (herein referred to as
MWZWB) Each of the Offices agreed to assemble a team of individuals with expertise in the
particular area of innovation, and these were to include people from all areas of the organization—headquarters, resource center, and divisions. Where possible, the Federal Lands Highways division would be included as well.
The teams were encouraged to meet with the HfL team offsite for a day-long discussion of what Highways for LIFE was all about, what sort of goals they were being asked to strive for, and to develop a preliminary approach to attaining those goals.
The intent of the MWZWB plan is two-pronged. It will assist state departments of transportation (DOT) in implementing strategies, ideas, and technologies designed to improve safety, reduce congestion and construction times, as well as in achieving compliance with the Work Zone Safety and Mobility rule. The MWZWB program will reach these goals through three primary efforts:
1. Work zone peer-to-peer (P2P) program 2. Focused technical workshops 3. Project assessment assistance
CORPORATE PHILOSOPHIES
As noted in the introduction, the HfL program and the MWZWB program developed by the Office of Operations have closely aligned goals. It is important to recognize the MWZWB program first and foremost as a philosophy to mitigate the impact of work zones upon all facets of the general public (travelers, nearby residents, and adjacent businesses), rather than simply a collection of techniques, strategies, or technologies. The focus of the MWZWB program is upon reducing impacts by reducing:
• The number of work zones that are required • The exposure of travelers and workers to work zones that have to occur • Safety and mobility impacts to those remaining travelers and workers who
encounter and endure work zone conditions when present
Both the highway community as a whole and the FHWA in particular have been diligent in seeking out and finding innovative solutions to highway challenges. Each
Marketing Plan Making Work Zones Work Better 4
year, teams of engineers, planners, and other professionals scan the globe, looking for potential innovations for highway facilities. The Office of Operations has accumulated a large database of strategies, techniques, and technologies that address one or more of these three focus areas. In 2000, FHWA published the Work Zone Operations Best Practices Guidebook, which lists specific examples of things that can be done to mitigate work zone impacts on the public. Obviously, the list of these innovations is significant, and it continues to grow. Whereas the initial list of practices numbered slightly over 100 ideas, the FHWA website now outlines well over 150 such innovations (see ops.fhwa.dot.gov/wz/practices/best/search_results.asp). A summary of the categories of strategies, techniques, and technologies that fall under the MWZWB philosophy in this guidebook are listed below.
• Agency work zone quality improvement strategies Awards and contests Committees, workshops, tours, committees Organizational approaches Toolkits, checklists, strategy lists, surveys
• Analysis efforts Cost analyses Lane closure analyses (queue length, delay) Traffic analyses Value engineering
• Community involvement Community impact mitigation strategies Public relations initiatives Stakeholder forums and discussions Task forces
• Constructability reviews to reduce construction time, minimize traffic disruptions • Construction methods to speed progress, minimize impacts to drivers/public • Education and outreach efforts
Driver education Public outreach/information campaigns Staff/contractor education and training
• Enforcement • Equipment • Evaluation • Incident management • Innovative contracting
Adjusting contract start times or duration Different contract types Lane rental Performance warranties
• Coordinating multiple projects Corridor management Multiple project coordination
• Public relations • Research efforts underway • Traffic management technologies
Marketing Plan Making Work Zones Work Better 5
• Traffic management/control planning and application Applications
Transit improvements Comprehensive transportation management plan implementation
Checklist, strategies, misc. guidance Roles and responsibility definitions
• Traveler information Periodic public information Real-time traveler info systems
• Work zone lane management Design for lane closures Lane closure restrictions Managing lane closures Total roadway closures (to reduce total contract time)
• Work zone speed management • Worker safety
Intrusion alarms Positive protection devices Use of robotics
The Office of Operations has also been supporting the MWZWB philosophy with the organization and conduct of workshops nationwide. Since 2002, 27 such workshops have been held in 24 different states. Each workshop consists of a series of short presentations on topics identified by the state and local agencies as interesting and important to them. The agencies designing the workshop choose from one or more presentations listed under the following main topic areas:
• Intelligent Transportation Systems (ITS) and Mitigation Techniques • Work Zone Information Systems • Innovative Technology • Integrating Operations • Reduce Demand • Innovative Contracting
In addition, the FHWA is supporting work zone related research and activities in
the areas of traffic management, worker safety, user safety, signage, mobility/delay, performance analysis, user costs, ITS, public relations/outreach, exposure to work zones, reduction/duration, time conscious methods, corridor plans, incident response efforts, and utility work. Consequently, the list of strategies, techniques, and technologies that fall under the MWZWB philosophy umbrella continues to grow, along with attendant support and guidance materials.
The FHWA has the overall lead in improving the safety and mobility of the nation’s roadway infrastructure. The agency has identified three “vital few” focus areas that have been targeted for greater attention and resources: safety, environmental stewardship, and congestion mitigation. Two of these three goals tie directly to MWZWB. One of the objectives of the vital few congestion goals is to reduce work
Marketing Plan Making Work Zones Work Better 6
zone delay by ensuring that all states are engaged in aggressively anticipating and mitigating congestion induced by highway work zones, and the safety goal is to reduce the national highway fatality rate from 1.5 to 1.0 deaths per 100 million vehicle miles traveled. The efforts of the MWZWB program will make a difference in achieving these goals.
SITUATION ANALYSIS
Two efforts have been initiated recently, in an effort to address the increase in the number of work zones and the level of work zone congestion.
The first is the Work Zone Safety and Mobility Rule published by FHWA on September 9, 2004. This rule updates and renames the former regulation on "Traffic Safety in Highway and Street Work Zones" in 23 CFR 630 Subpart J. All state and local governments that receive Federal-aid highway funding are required to comply with the provisions of the rule no later than October 12, 2007. A copy of the rule is included as Appendix A.
For states to be in substantial compliance with the new rule, they are required to:
• Develop an over-arching work zone policy • Define and identify significant projects • Develop traffic management plans for significant projects, which will include
temporary traffic control plans, traffic operations, and public information components
• Collect and analyze congestion and safety data, and • Perform work zone process reviews
While guidance has been developed and support is being provided to help state highway agencies comply with the rule, many agencies will likely need assistance in implementing some provisions of the rule.
A second development is the Highways for LIFE program, created by the 2005 Safe, Accountable, Flexible, Efficient Transportation Equity Act: A Legacy for Users (SAFETEA-LU). HfL was created to address the problem of a national highway system that is well beyond its design life. Bringing the system up to an appropriate level of quality using current construction methods would require an enormous capital investment. And even if such a sum were available, the congestion such a massive construction program would cause, again in terms of current methods, could cripple mobility. The HfL approach says that, just as innovations in such industries as consumer electronics and automobiles have resulted in lower cost, better quality, and higher value, one should be able to apply the concept of innovation implementation in the highway construction field—including managing highway construction projects to minimize congestion. This program is designed to rapidly implement innovative ideas that build projects faster, better, and safer into state DOT day-to-day practice. Key elements of the HfL program include the following:
Marketing Plan Making Work Zones Work Better 7
• Improving current approaches to technology transfer • Developing partnerships with industry • Funding of pilot projects with each state DOT • Communicating the innovations and approaches to the highway community, as
well as to highway users
An important aspect of the HfL approach is the need to focus on the highway user. As identified in the previous section, improved community involvement and public relations efforts are important innovations within the MWZWB initiative as well. Establishing and maintaining good communications with all affected audiences before and during construction and maintenance activities has long been acknowledged as highly effective in helping to mitigate the impacts of these activities on the public.
It is important to understand that coming up with innovations has never been the problem; the challenge has been the process of integrating innovations into day-to-day practice in a reasonable amount of time. Regrettably, the process often takes decades. This is unacceptable and accomplishes next to nothing toward the improvement of the users’ driving experience.
Feedback received from state DOTs during a national review on “Meeting the Customer’s Needs for Mobility and Safety During Construction and Maintenance Operations” indicated the following when it comes to technology transfer:
• They expect the FHWA to keep them advised of successes and failures from around the country
• The amount of information and number of periodicals and reports is overwhelming
• They want and need the FHWA to assist them in identifying new ideas, best practices, and technologies that will help them solve their problems and improve their operations
• Once these new ideas, best practices, and technologies have been identified, they look to the FHWA to assist in implementation
• They stressed the need to recognize that “one size does not fit all” • They felt that for technology transfer to be successful, the FHWA’s efforts must be
adapted to an individual agency’s needs • They were very supportive of the FHWA’s past efforts of sponsoring regional
workshops, peer reviews, and scanning trips • Many states are very strict on out-of-state travel, and the FHWA’s assistance is
seen as a necessity for technology sharing to be successful
Marketing Plan Making Work Zones Work Better 8
Based on this feedback, and with input from selected FHWA work zone practitioners1, the following elements are being advanced as key components for making work zones work better:
• Work Zone Peer-to-Peer Programs • Focused Technical Assistance Workshops • Project Assessment Assistance
These components, which will be described in more detail in the following section, will allow the FHWA to assist state DOTs in becoming more proactive and effective in adopting more effective ways and technologies in making work zones work better.
Presently, the ability of FHWA (and the state and local agencies themselves) to estimate how well work zones are “working” is limited to data being obtained through a Work Zone Self-Assessment process that the Office of Operations initiated in 2003. The self-assessment has occurred annually since then, with the results through the 2006 assessment available from the FHWA Office of Operations website (ops.fhwa.dot.gov/wz/decision_support/self-assess.htm). The goals of the self-assessment process are:
• Raise an agency’s level of awareness of practices and strategies used in mitigating work zone congestion and crashes
• Facilitate communication and sharing of best practices among transportation professionals
• Identify gaps in existing efforts to mitigate work zone-related congestion and crashes
• Provide an opportunity to benchmark progress • Provide information to FHWA helpful in measuring the effectiveness of the
National Work Zone Program and also for shaping that program
The self-assessment focuses attention on six main emphasis areas where high-leverage opportunities exist to minimize work zone impacts upon the public:
• Leadership and Policy • Project Planning and Programming • Project Design • Project Construction and Operation • Communications and Education • Program Evaluation
1 February 22, 2006, MWZWB/HfL meeting at Turner-Fairbank Highway Research Center, with following participants: Ken Opiela, Deborah Curtis, Chris Newman, Guan Xu, Daniel Grate, Joe Geigle, Mike Davies, Martha Kapitanov, Gus Shanine, Tracy Scriba, Kathleen Bergeron, Chung Eng.
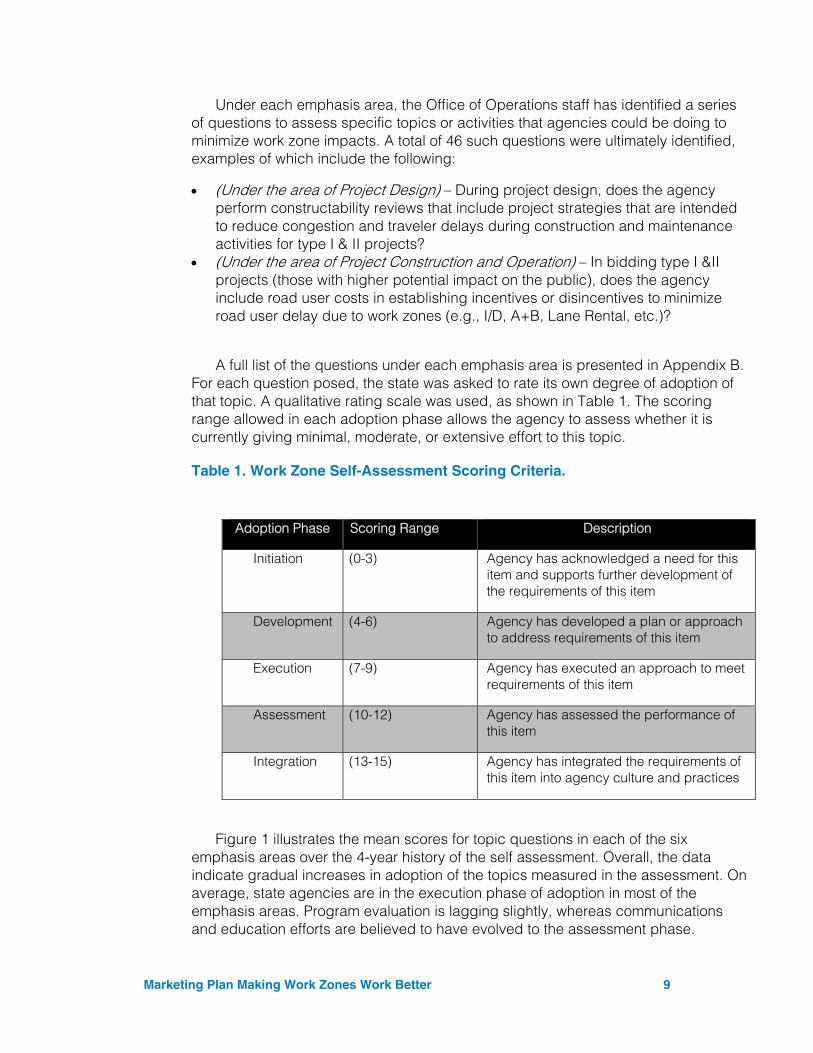
Marketing Plan Making Work Zones Work Better 9
Under each emphasis area, the Office of Operations staff has identified a series of questions to assess specific topics or activities that agencies could be doing to minimize work zone impacts. A total of 46 such questions were ultimately identified, examples of which include the following:
• (Under the area of Project Design) – During project design, does the agency perform constructability reviews that include project strategies that are intended to reduce congestion and traveler delays during construction and maintenance activities for type I & II projects?
• (Under the area of Project Construction and Operation) – In bidding type I &II projects (those with higher potential impact on the public), does the agency include road user costs in establishing incentives or disincentives to minimize road user delay due to work zones (e.g., I/D, A+B, Lane Rental, etc.)?
A full list of the questions under each emphasis area is presented in Appendix B. For each question posed, the state was asked to rate its own degree of adoption of that topic. A qualitative rating scale was used, as shown in Table 1. The scoring range allowed in each adoption phase allows the agency to assess whether it is currently giving minimal, moderate, or extensive effort to this topic.
Table 1. Work Zone Self-Assessment Scoring Criteria.
Figure 1 illustrates the mean scores for topic questions in each of the six emphasis areas over the 4-year history of the self assessment. Overall, the data indicate gradual increases in adoption of the topics measured in the assessment. On average, state agencies are in the execution phase of adoption in most of the emphasis areas. Program evaluation is lagging slightly, whereas communications and education efforts are believed to have evolved to the assessment phase.
Adoption Phase Scoring Range Description
Initiation (0-3) Agency has acknowledged a need for this item and supports further development of the requirements of this item
Development (4-6) Agency has developed a plan or approach to address requirements of this item
Execution (7-9) Agency has executed an approach to meet requirements of this item
Assessment (10-12) Agency has assessed the performance of this item
Integration (13-15) Agency has integrated the requirements of this item into agency culture and practices
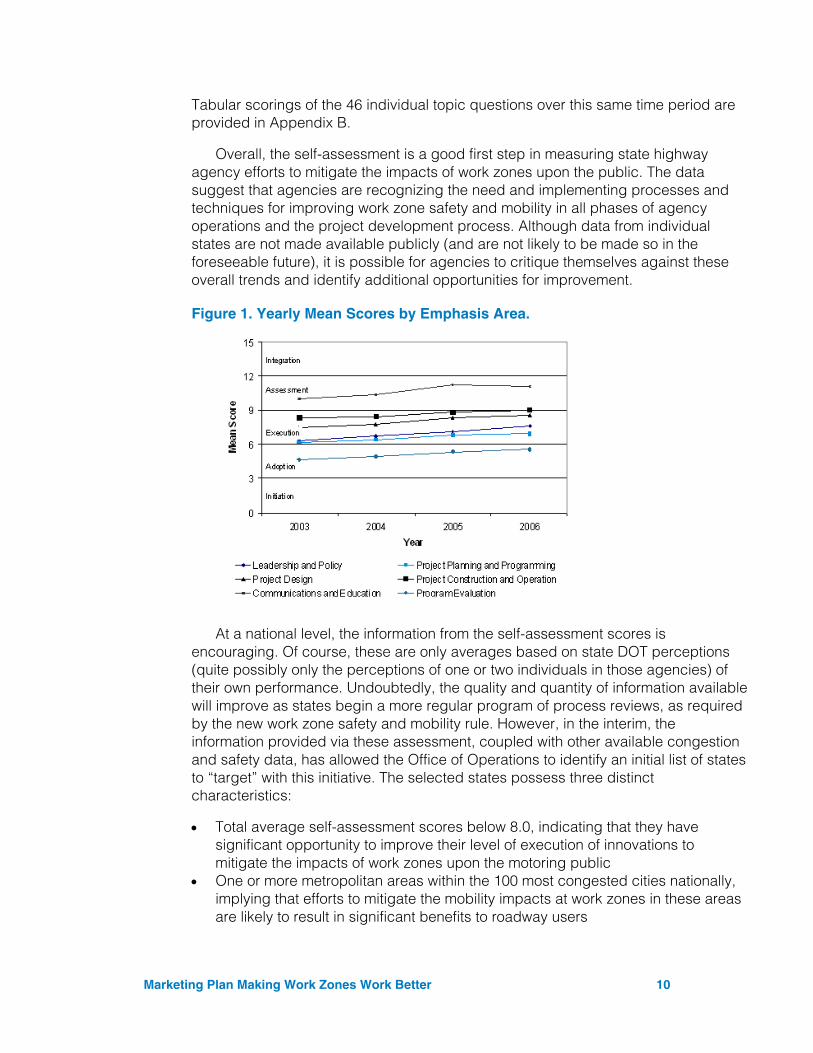
Marketing Plan Making Work Zones Work Better 10
Tabular scorings of the 46 individual topic questions over this same time period are provided in Appendix B.
Overall, the self-assessment is a good first step in measuring state highway agency efforts to mitigate the impacts of work zones upon the public. The data suggest that agencies are recognizing the need and implementing processes and techniques for improving work zone safety and mobility in all phases of agency operations and the project development process. Although data from individual states are not made available publicly (and are not likely to be made so in the foreseeable future), it is possible for agencies to critique themselves against these overall trends and identify additional opportunities for improvement.
Figure 1. Yearly Mean Scores by Emphasis Area.
At a national level, the information from the self-assessment scores is encouraging. Of course, these are only averages based on state DOT perceptions (quite possibly only the perceptions of one or two individuals in those agencies) of their own performance. Undoubtedly, the quality and quantity of information available will improve as states begin a more regular program of process reviews, as required by the new work zone safety and mobility rule. However, in the interim, the information provided via these assessment, coupled with other available congestion and safety data, has allowed the Office of Operations to identify an initial list of states to “target” with this initiative. The selected states possess three distinct characteristics:
• Total average self-assessment scores below 8.0, indicating that they have significant opportunity to improve their level of execution of innovations to mitigate the impacts of work zones upon the motoring public
• One or more metropolitan areas within the 100 most congested cities nationally, implying that efforts to mitigate the mobility impacts at work zones in these areas are likely to result in significant benefits to roadway users
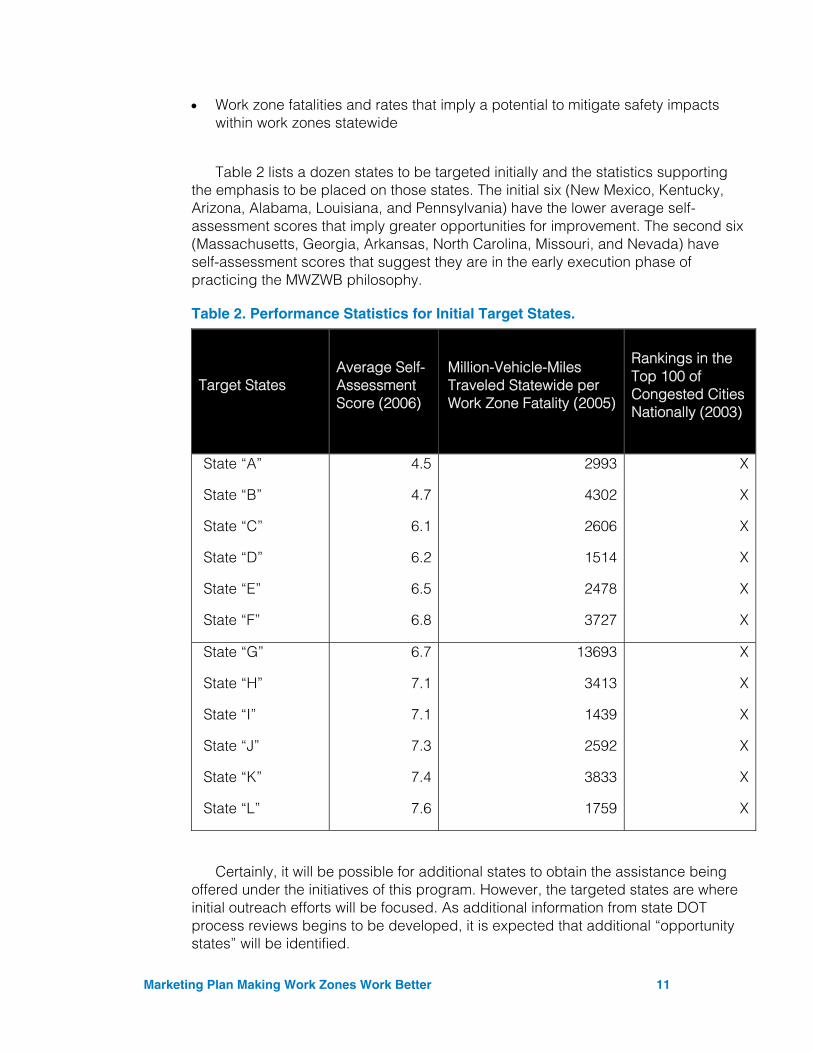
Marketing Plan Making Work Zones Work Better 11
• Work zone fatalities and rates that imply a potential to mitigate safety impacts within work zones statewide
Table 2 lists a dozen states to be targeted initially and the statistics supporting the emphasis to be placed on those states. The initial six (New Mexico, Kentucky, Arizona, Alabama, Louisiana, and Pennsylvania) have the lower average self-assessment scores that imply greater opportunities for improvement. The second six (Massachusetts, Georgia, Arkansas, North Carolina, Missouri, and Nevada) have self-assessment scores that suggest they are in the early execution phase of practicing the MWZWB philosophy.
Table 2. Performance Statistics for Initial Target States.
Target States Average Self-Assessment Score (2006)
Million-Vehicle-Miles Traveled Statewide per Work Zone Fatality (2005)
Rankings in the Top 100 of Congested Cities Nationally (2003)
State “A”
State “B”
State “C”
State “D”
State “E”
State “F”
4.5
4.7
6.1
6.2
6.5
6.8
2993
4302
2606
1514
2478
3727
X
X
X
X
X
X
State “G”
State “H”
State “I”
State “J”
State “K”
State “L”
6.7
7.1
7.1
7.3
7.4
7.6
13693
3413
1439
2592
3833
1759
X
X
X
X
X
X
Certainly, it will be possible for additional states to obtain the assistance being offered under the initiatives of this program. However, the targeted states are where initial outreach efforts will be focused. As additional information from state DOT process reviews begins to be developed, it is expected that additional “opportunity states” will be identified.
Marketing Plan Making Work Zones Work Better 12
PRODUCT ANALYSIS
The intent of the MWZWB plan is two-pronged. It is designed to help state DOTs better understand the potential impacts from work zones, meet their needs as they identify ways to improve their work zone management programs, and implement innovations to best mitigate the impacts of these work zones upon the public. It is also intended to assist the DOTs in achieving compliance with the regulations and spirit of the Work Zone Safety and Mobility rule.
The unique aspect of this particular program is that market research is continuous. The MWZWB program will need to continue monitoring and identifying additional needs of the state DOTs and take action to develop solutions to fill those needs. As soon as one need is filled, more than likely, another will surface. This is where the dynamic ability of this program will shine. In essence, the P2P and focused workshop components themselves are marketing components, as their function is to provide information necessary for users to adopt new and improved procedures and technologies.
In promoting better, more effective work zones, one has to realize that there are not one or two innovations which, if employed, could serve as a panacea for all work zone challenges. As noted earlier in this plan, there are dozens of approaches and products that, when used appropriately, can make the vital difference. These can range from highly sophisticated electronic equipment used to notify drivers of real time vital road conditions, to simple modifications in construction processes or phasing of activities. Efforts to date by the Office of Operations suggest that the overall concept of making work zones work better is fairly well understood among practitioners. The publication of the Work Zone Safety and Mobility final rule has further raised the awareness of this issue. Consequently, the need is not one of marketing the overall concept, but on assisting state DOT and local personnel in their efforts to understand how the myriad processes, strategies, techniques, and technologies can be best pared down to the one or few which will provide, for a given set of local conditions, the best return on the investment in time and money..
The fact that there are so many options that could be used to make “work zones work better” is perhaps itself a significant obstacle to accomplishing the ultimate goal of adopting innovation as the normal way of doing business. Wholesale adoption of all strategies at all work zones, for example, would be tremendous overkill and likely lead to a very inefficient use of financial resources. Not all work zones require the same type or degree of treatment in order to address the critical components that drive the congestion and safety impacts that occur. However, knowing which processes/strategies/techniques/ technologies and combinations thereof are best-suited to a set of work zone conditions (and understanding the various interdependencies between strategies and those conditions) requires expertise that may be beyond the skills of the decision-making personnel of many agencies. Furthermore, even if the knowledge exists, formal processes are not in place to address work zone issues at the appropriate points in the project delivery sequence, and process owners are not identified.
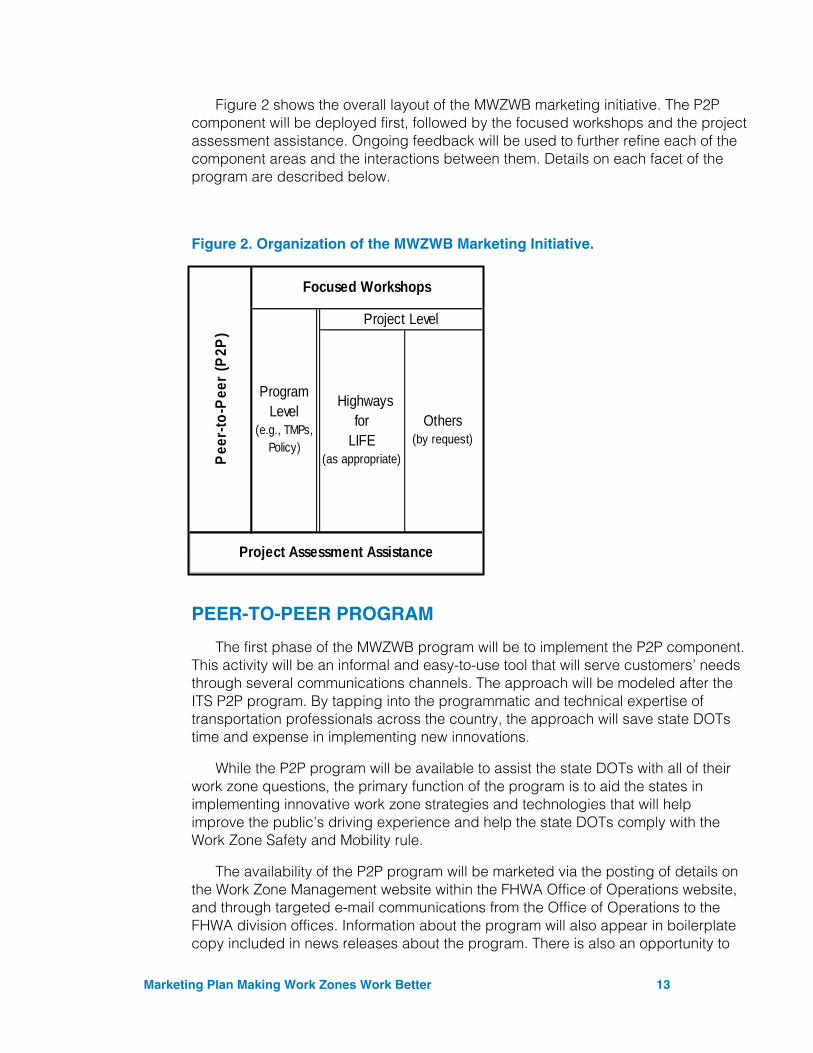
Marketing Plan Making Work Zones Work Better 13
Figure 2 shows the overall layout of the MWZWB marketing initiative. The P2P component will be deployed first, followed by the focused workshops and the project assessment assistance. Ongoing feedback will be used to further refine each of the component areas and the interactions between them. Details on each facet of the program are described below.
Figure 2. Organization of the MWZWB Marketing Initiative.
PEER-TO-PEER PROGRAM
The first phase of the MWZWB program will be to implement the P2P component. This activity will be an informal and easy-to-use tool that will serve customers’ needs through several communications channels. The approach will be modeled after the ITS P2P program. By tapping into the programmatic and technical expertise of transportation professionals across the country, the approach will save state DOTs time and expense in implementing new innovations.
While the P2P program will be available to assist the state DOTs with all of their work zone questions, the primary function of the program is to aid the states in implementing innovative work zone strategies and technologies that will help improve the public’s driving experience and help the state DOTs comply with the Work Zone Safety and Mobility rule.
The availability of the P2P program will be marketed via the posting of details on the Work Zone Management website within the FHWA Office of Operations website, and through targeted e-mail communications from the Office of Operations to the FHWA division offices. Information about the program will also appear in boilerplate copy included in news releases about the program. There is also an opportunity to
Project Assessment Assistance
Focused Workshops
Pee
r-to
-Pee
r (P
2P)
Program Level
(e.g., TMPs, Policy)
Project Level
Others (by request)
Highways for
LIFE (as appropriate)
Marketing Plan Making Work Zones Work Better 14
use the American Association of State Highway and Transportation Officials (AASHTO) Subcommittee on Operations and its Technology Implementation Group (TIG) to promote these efforts. A program brochure and business card will be developed to help facilitate program outreach and marketing.
Having a knowledgeable and well-respected group of experts available to provide technical assistance covering a wide variety of work zone related topics is the keystone of the P2P program. This group of experts will be able to assist the customer (their fellow work zone specialists) through e-mail, telephone, and as necessary, face-to-face support. Moreover, they will be accessible to review material and participate on scanning tours. The vision is that state DOTs will be able to use the panel of experts to review their documents at the policy, process, and project levels. Examples could be the particular state’s Work Zone Safety and Mobility Policy or the specifications for an ITS work zone.
While the primary function of the P2P program is to provide human resources to solve identified problems, other elements may be incorporated into the program as needed. For example, both scanning tours and open houses are valuable ways to gather or disseminate information. Based on need determined from requests, the work zone self-assessments, or other pertinent information, these two approaches may be applicable to the MWZWB effort.
A scanning tour would allow a select group of individuals to visit states that have integrated innovative practices into their program. Typically, the group takes the knowledge they obtained from the tour and drafts a report to disseminate the information to interested parties. It may be ideal for representatives from states that are not as advanced to participate in the tours. Information gathered first-hand often is more valuable and likely to be used than information read in a report.
Another valuable opportunity available through the P2P program is the hosting of open houses. Open houses are events that are focused around projects that are being constructed using the set of particular technologies/strategies appropriate for the unique project circumstances. For example, if one state is using ITS in a work zone, it becomes an opportunity to bring engineers from other states to see the process as it develops. They get a chance to discuss aspects of the project with the project engineer as the work is being done. This may be an ideal fit for those interested in the work zone aspects of HfL projects.
FOCUSED WORKSHOPS
The primary difference between the P2P program and the focused workshops is that the P2P program is to be available to individuals who proactively request assistance, whereas the intent of the focused workshops is to approach and provide assistance to states identified by the FHWA. While a focused workshop may be requested via the P2P program, the workshops will most likely be offered to states identified as having specific needs to either substantially comply with the Work Zone Safety and Mobility rule or to improve their work zone self-assessment scores.
Marketing Plan Making Work Zones Work Better 15
As seen in Figure 2 above, the focused workshops are geared to offer assistance at both the program level and the project level. Project-level workshops are further subdivided into two categories, HfL projects and other projects. These workshops are not intended to be training courses. In the previous MWZWB workshops, the information presented was fairly broad, and it did not translate easily from abstract examples of past applications to the needs and potential uses by the workshop attendees. Consequently, these focused workshops are intended to allow a state DOT to tap into the expertise of multiple experts to allow collaboration and critiquing of alternatives for especially complex and challenging work zone projects and agency processes to be accomplished from various expert perspectives (something that will generally not be possible through the peer-to-peer program). Upon conclusion of the workshop, it is expected that either a solution to a problem has been identified and accepted by the state or formal recommendations have been left with the state DOT with the understanding that the state would take action on the recommendations.
In the short term, emphasis will be placed on the targeted states listed in Table 2. Input from the FHWA division offices will be an integral part of an initial program assessment to help identify the topic areas to focus upon. The division office and the target state, as appropriate, will assist in prioritizing the areas that would provide the most benefit. Also, the division office will be able to inform the MWZWB coordinators whether their partner state DOT would be receptive to one or more focused workshops. In the long term, other states may solicit assistance in conducting a workshop based on their own program assessments, FHWA division office encouragement, or other data.
The program-level workshops will likely be the most frequent type of workshops held initially. As stated above, these tailored workshops will be offered to states identified by the self-assessment scores and division offices. These workshops will be tailored to aid states in policy and process development, particularly in regards to meeting the requirements of the new work zone rule.
The other workshops would be tailored towards specific projects. Where appropriate, HfL projects will be reviewed for an opportunity to provide a workshop that would assist the state DOT in implementing an innovative feature into their work zone. Non–HfL projects would most likely be identified for a tailored workshop either through the FHWA division office or through a P2P request. The successful model of Accelerated Construction Technology Transfer (ACTT) workshops could be employed.
PROJECT ASSESSMENT ASSISTANCE
The third component to the MWZWB program to be marketed under this plan targets the improvement in the understanding and use of tools and guidance for conducting work zone impact analyses. Such analyses are necessary to help identify significant projects, guide the selection of mitigation strategies for these projects, and provide data for the process reviews that state DOTs will be required to conduct under the Work Zone Safety and Mobility Rule. The FHWA Office of Operations has
Marketing Plan Making Work Zones Work Better 16
published general guidance on performing work zone impact assessments. However, this guidance is fairly high-level in nature, and it does not provide the detailed guidance that some practitioners may need to help them:
• Select appropriate analysis tools for their particular situation or phase of project development (one tool may be appropriate during planning while another is more appropriate during final traffic control plan development, for example)
• Select appropriate default values or assumed values when input data for a particular tool is not available
• Determine how to utilize the tool properly to evaluate the type of work zone situation (and alternatives) being proposed
• Evaluate the results of the analyses generated by the tools
Consequently, the Office of Operations will initiate an effort to develop a primer, guidance on selecting work zone traffic analysis tools, and guidelines on applying these tools to perform work zone impact analysis. It is envisioned that this guidance will be consistent with guidance currently in the traffic analysis toolbox (see ops.fhwa.dot.gov/trafficanalysistools/ toolbox.htm) and will ultimately be made a part of this toolbox.
Once this guidance is developed, further assistance in this area may be provided under either the P2P program or through the focused workshops. A focused workshop at the program level, for example, might examine which of the available tools would be most beneficial for the state to adopt and develop internal expertise in using. Meanwhile, a workshop at the project level might emphasize the use of a particular tool in the analysis of specific project alternatives.
ADDITIONAL MWZWB RESOURCES
In addition to the P2P, focused workshops, and project assessment assistance, supporting resources also play a role in the MWZWB program. These materials may include brochures, websites, guidance documents, Best Practices Guidebook, traffic analysis tools, and case studies. As the program matures and further market research data become available, other resources may be developed under this program. The Office of Operations will continue to support the development and dissemination of success stories and such under this program on its MWZWB website (see ops.fhwa.dot.gov/wz/about/wz_story.htm). Links to these stories and information will then be easily accessible to those interested. This information will also be available (via active links) to visitors to the National Work Zone Safety Information Clearinghouse (workzonesafety.org).
ADDITIONAL HFL RESOURCES
To provide the best return-on-investment to the HfL program, it is recommended that an integrated communications approach be developed to extend across the MWZWB, PBES, and RSA initiatives. It could act as a unifying strategy to instigate change, raise awareness, and measure results for the program as a whole, as well
Marketing Plan Making Work Zones Work Better 17
as for the three component initiatives. This campaign should be two-pronged, deploying a series of templated news releases on developments under the three programs. Links should be made to the MWZWB website where resources on improving work zones are already available. News releases to publicize an innovation being introduced on a project, a life saved because of an innovation in place, a quick turnaround on a project, savings realized on a project, etc. should be coordinated and housed. News releases could follow a “Swiss cheese” format, with all relevant program messaging in place; only the details of the specific triggering event would need to be added. The news releases related to MWZWB efforts could provide a link to the MWZWB website where reporters and other audiences could learn more about work zone safety issues.
FOLLOW UP
To ensure that each of the MWZWB elements is operating effectively, a monitoring and follow-up plan will be established. The key objectives will be to 1) ensure that the DOT’s needs were met and that progress has been made in improving the work zone program, and 2) using the user’s feedback to develop ways to improve the overall system. Follow-up should occur no more than 3 months from the time that a resource was provided.
GOALS/MEASURES OF EFFECTIVENESS
There are several ways to measure the general effectiveness of the MWZWB effort:
• Number of P2P requests made Requested supports supplied via phone/email Requested supports supplied via face-to-face Number of requests able to support
• Number of scanning tours held • Number of workshop requests made • Number of workshop requests able to support • Number of workshops initiated by the MWZWB coordinators • Number of project assessment assistance requests handled • MWZWB website use statistics, media hits • Success stories • Estimate of the road user costs, delays, etc. mitigated through the adoption of the
MWZWB philosophy on a particular project or within a particular state DOT • Number of state DOTs that have put into practice formalized processes to
consider and incorporate work zone innovations on projects where appropriate.
However, while it is important to measure the use of the tools within this program, it is imperative to keep in mind that “use” does not always equal “progress.” The resources provided must result in a change in philosophy or produce an actual product (i.e., the adoption of a policy or the integration of an innovative technology into their program).
Marketing Plan Making Work Zones Work Better 18
CUSTOMER-CLIENT ANALYSIS/TARGET MARKETS
The market for MWZWB is fairly extensive, since all road construction projects have work zones. MWZWB will have a positive effect on the roadway owners and roadway users.
While not the primary target of this new program, FHWA division offices will be the initial targets of the marketing. As their primary role will be leaders and disseminators of the program, it is essential for them to be aware of and understand the program as early as possible. Division offices have much closer ties to their corresponding DOT than do the Office of Operations or the HfL Office, and so generally have more credibility with them. In addition, division office personnel are closer to the specific issues and constraints facing their respective DOTs and should be in a better position to identify potential areas to target. The challenge in addressing this specific target market is that they tend to think more as a DOT (operationally) and do not automatically accept and embrace efforts that are promoted from FHWA headquarters. In addition, it is important to realize that, in most cases, it is the division personnel who decide whether a DOT is complying with any rules or regulations handed down from headquarters. If division staff are not on board with a concept or requirement, their likelihood of pushing it forward within the DOT obviously is going to be lower.
With the program being designed to assist in compliance with the new work zone rule and adoption of innovation through the HfL program, the primary target of the marketing will be state highway agencies. The primary message to the DOTs will be, “Leap, Not Creep” in proactively improving work zone safety and congestion. Within the DOTs, the initial marketing efforts clearly need to begin at the chief engineer or Deputy Secretary for Highway Operations level. Below that level, there exist at least two sub-target markets to be addressed. The first of these are the personnel who make up the various central division offices (traffic, construction, design, etc.). These individuals typically are tasked with identifying and helping to draft policy and guidelines that govern agency operations, but they are not involved in day-to-day decisions regarding innovation application to a specific project or set of projects. The overall consequences of policy and guidance recommendations upon such things as project costs, tort liability, and similar concerns do weigh on their decisions, however. Central division and administration personnel within a DOT likely will have general awareness of the MWZWB concepts, but their grasp of all of the nuances and specific innovations that can fall underneath this concept may be limited.
The other major sub-target market within DOTs is the field personnel who operate from district or regional offices. The degree of autonomy with which these districts operate varies substantially from state to state. These individuals generally are responsible for individual project development, as well as the conduct of the work once a contract is initiated. These individuals are very well versed in the specific challenges and problems encountered in the field across the range of projects to which they have been exposed. However, their breadth of experience and awareness of potential innovations may lag behind slightly (often because of day-to-
Marketing Plan Making Work Zones Work Better 19
day pressures of keeping a particular project on task and budget). Personnel positioned at this level in the DOT are also highly cost conscious and typically have budget needs in excess of funds allocated to their group for projects. Furthermore, although societal costs associated with work zone projects (delays, increased crash risk, etc.) are acknowledged as important, they do not impact the district’s budget the way that expenditures for innovations to mitigate those impacts do. As a result, it is important to this group for innovations to provide significant benefits that far outweigh the costs of implementation, and that the risk of failure to provide such benefits by an innovation is fairly low. As DOTs continue to downsize and increase workloads on those who remain, the ability of district personnel to have time to develop enough expertise and understanding to facilitate innovation implementation on their projects continues to diminish. The end result of these pressures is towards the maintenance of the status quo, or towards the adoption of only those innovations which have low potential risk and consequences of “failure.” That is exactly why this MWZWB program needs to begin at the executive level—at the end of the day, the degree to which it will be implemented is a policy-level decision.
Considering that many DOTs rely on the consultant industry to design their traffic management plans, a secondary target will be consultants. Thus, in addition to identified industry-specific marketing channels, it will be essential for the division offices and DOTs to reach out to this segment of the target audience. It is important to recognize that this audience generally is directed fairly closely by DOT district staff. District personnel hire and fire consultants through the bid-reward process as well. Whereas there may be a desire on the part of the consultant to include and promote innovation during the design or plan specification and estimation [PS&E] process, this group generally will defer to their sponsor when challenged about a decision to include such innovation. Fortunately, this group is also fairly well insulated from any public backlash for any innovations that do not turn out as intended.
Local transportation agencies also will benefit from the P2P program; however, the resources needed to assess their individual needs adequately and provide appropriate assistance currently are not available. Therefore, the first phase of marketing may not specifically target this audience.
Finally, it may be necessary to include the highway contractor community at some point in this process. Part of the reason is that innovations that improve worker safety have traditionally been viewed as the responsibility of the contractor rather than the DOT or local agency owning the roadway. The other part of the reason is that highway contractors typically do have the opportunity to suggest changes to the plans and processes originally proposed by the DOT (and may be less risk averse in doing so), so long as the cost of the project is not affected adversely. The contractor is likely to suggest changes that improve worker safety and worker mobility to and through the work zone. Since congestion in the vicinity of work operations constrains material deliveries and other facets of construction, it may indeed be possible for innovations to benefit both the public and the contractor in some instances.
Marketing Plan Making Work Zones Work Better 20
Additionally, those outside the highway community play a critical role in the success of this program. The foremost reason for involving the public is that the laws, regulations, and traditions of our society demand involvement of the public in governmental affairs. Also, of course, it is public funds that support the entire program. In fact, the demands of an informed and knowledgeable public may be the ultimate driver to a successful MWZMB program.
STRATEGIC PLAN TO DELIVER AND DEPLOY MWZWB
The P2P phase of the MWZWB program is on the verge of implementation. Through advance funding provided for this component, a task order has already been executed, and recruitment of work zone peers to support the program is well underway. The P2P program is expected to be ready for launch by spring 2007. A P2P brochure and business card are being developed to help with program outreach and marketing. Division offices will be engaged to help ensure that their DOT partners are familiar and comfortable with the resources available through the P2P program. Another opportunity will be to present the MWZWB information at the FHWA Operations/ITS annual meeting.
While the focused workshops are not as close to implementation as the P2P program, the intent is to conduct two pilot workshops and up to four additional workshops during fiscal year 2007. The workshops will draw from the pool of experts created for the P2P program. Contact will be made with division offices in the identified initial target states to begin discussions and to further assess needs and identify potential focus areas based on these needs. The state will be involved as determined appropriate by the division. Once the need for a focused workshop has been confirmed and its focus identified, formal planning for the workshop will begin. Experience from these initial workshops will be used to shape the longer term aspects of providing focused workshops. During this initial phase, only the targeted states and their respective divisions will be made aware of the focused workshops. As the focused workshops become more established, their availability will broaden and appropriate marketing will occur. A statement of work is being developed to support the provision of focused workshops.
The initial and key component of the project assessment assistance effort will be the development and distribution of the primer and guidance on work zone traffic analysis tools. This will be supplemented by technical assistance provide through the P2P and focused workshop components as appropriate. A statement of work has been drafted for the development of the primer and guidance.
Supporting resources will be developed and made available based upon needs identified through the P2P, focused workshops, self-assessments, and other interactions with the DOTs.
CHALLENGES
As elements of the program are developed, marketed, and implemented, it is important to keep in mind several key challenges that this program will have to
Marketing Plan Making Work Zones Work Better 21
overcome. With the passing of SAFETEA-LU came several new programs and requirements for states to implement. To compete with the demand and requirements of these new programs, the MWZWB effort must be able to show the DOTs “what’s in it for them.”
Limited manpower, high turnover, and limited travel are other challenges that need to be considered. These challenges will play a significant role in identifying experts to support the MWZWB program. It may be that some states do not have the manpower to spare an expert to travel to another state at the request of the P2P or focused workshop. It will be crucial to identify which experts will be allowed travel when provided adequate advance warning.
In addition to limited manpower, in recent years, both the FHWA and the DOTs have been asked to do more with smaller budgets. Therefore, it is critical to ensure that any funds spent in an effort to improve work zone safety and mobility be at a high benefit-to-cost ratio.
Another obstacle to overcome is the perception that high tech and innovative equates to added work and higher costs. In fact, often the opposite is true. Technology and innovation lead to more efficient processes and better, longer lasting products. A good example is the computer industry; computers today are cheaper than they have ever been yet are multiple times faster and are capable of doing many more functions than their predecessors.
SCHEDULING OF ACTIVITIES
To implement this plan efficiently, it may be advantageous to use a project manager program to keep track of dates, activities, and responsibilities. The following is an example of activities that need to be completed in order to put the program into operation:
• Completion of preliminary marketing plan – February 2007 • Establish base of experts and champions willing to participate • Work zone team workshop to revalidate approach – February/March 2007 • Completion of marketing plan – early spring 2007 • Launch P2P – spring 2007 • Create release template and media schedule – late spring 2007 • Develop P2P brochure and business card – February 2007 • Begin website redesign – late spring 2007 • First news releases sent – mid-summer 2007 • Cost out focused workshops and develop statement of work – February/March
2007 • Identify two pilot locations and up to four other locations for workshops – spring
2007 • Schedule and design pilot workshops – summer 2007 • Cost out work zone traffic analysis tools primer and guidance and develop
statement of work – February/March 2007
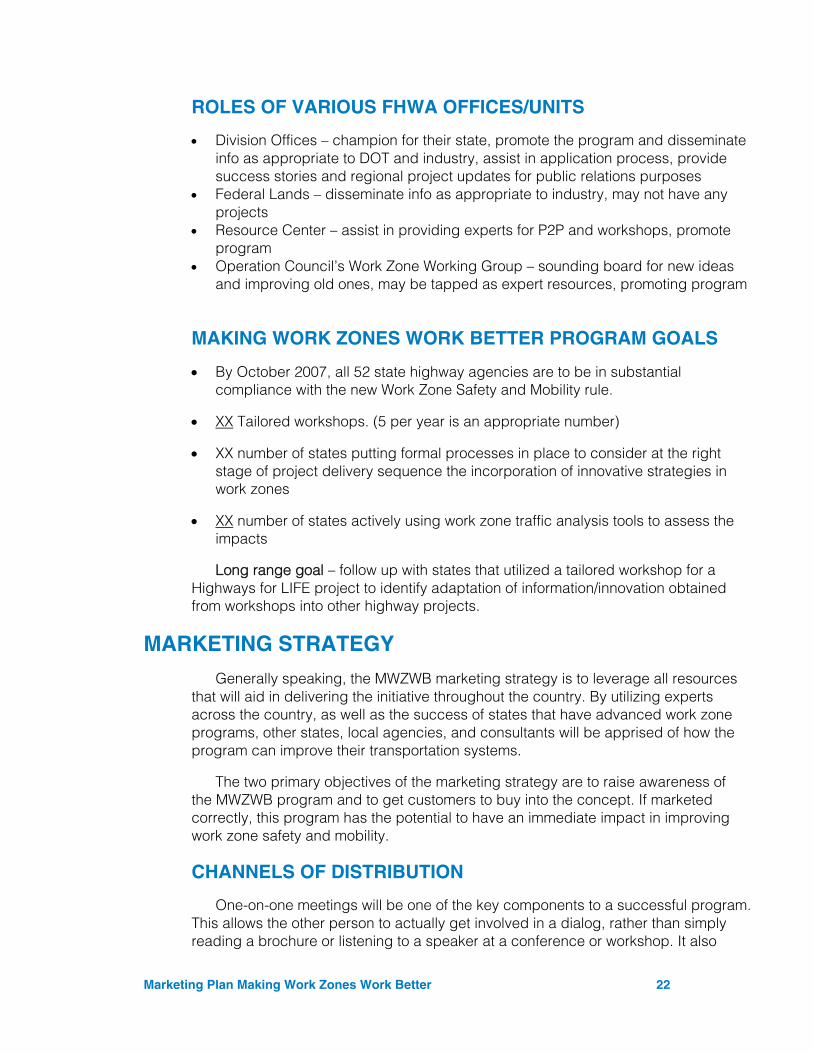
Marketing Plan Making Work Zones Work Better 22
ROLES OF VARIOUS FHWA OFFICES/UNITS
• Division Offices – champion for their state, promote the program and disseminate info as appropriate to DOT and industry, assist in application process, provide success stories and regional project updates for public relations purposes
• Federal Lands – disseminate info as appropriate to industry, may not have any projects
• Resource Center – assist in providing experts for P2P and workshops, promote program
• Operation Council’s Work Zone Working Group – sounding board for new ideas and improving old ones, may be tapped as expert resources, promoting program
MAKING WORK ZONES WORK BETTER PROGRAM GOALS
• By October 2007, all 52 state highway agencies are to be in substantial compliance with the new Work Zone Safety and Mobility rule.
• XX Tailored workshops. (5 per year is an appropriate number)
• XX number of states putting formal processes in place to consider at the right stage of project delivery sequence the incorporation of innovative strategies in work zones
• XX number of states actively using work zone traffic analysis tools to assess the impacts
Long range goal – follow up with states that utilized a tailored workshop for a Highways for LIFE project to identify adaptation of information/innovation obtained from workshops into other highway projects.
MARKETING STRATEGY
Generally speaking, the MWZWB marketing strategy is to leverage all resources that will aid in delivering the initiative throughout the country. By utilizing experts across the country, as well as the success of states that have advanced work zone programs, other states, local agencies, and consultants will be apprised of how the program can improve their transportation systems.
The two primary objectives of the marketing strategy are to raise awareness of the MWZWB program and to get customers to buy into the concept. If marketed correctly, this program has the potential to have an immediate impact in improving work zone safety and mobility.
CHANNELS OF DISTRIBUTION
One-on-one meetings will be one of the key components to a successful program. This allows the other person to actually get involved in a dialog, rather than simply reading a brochure or listening to a speaker at a conference or workshop. It also
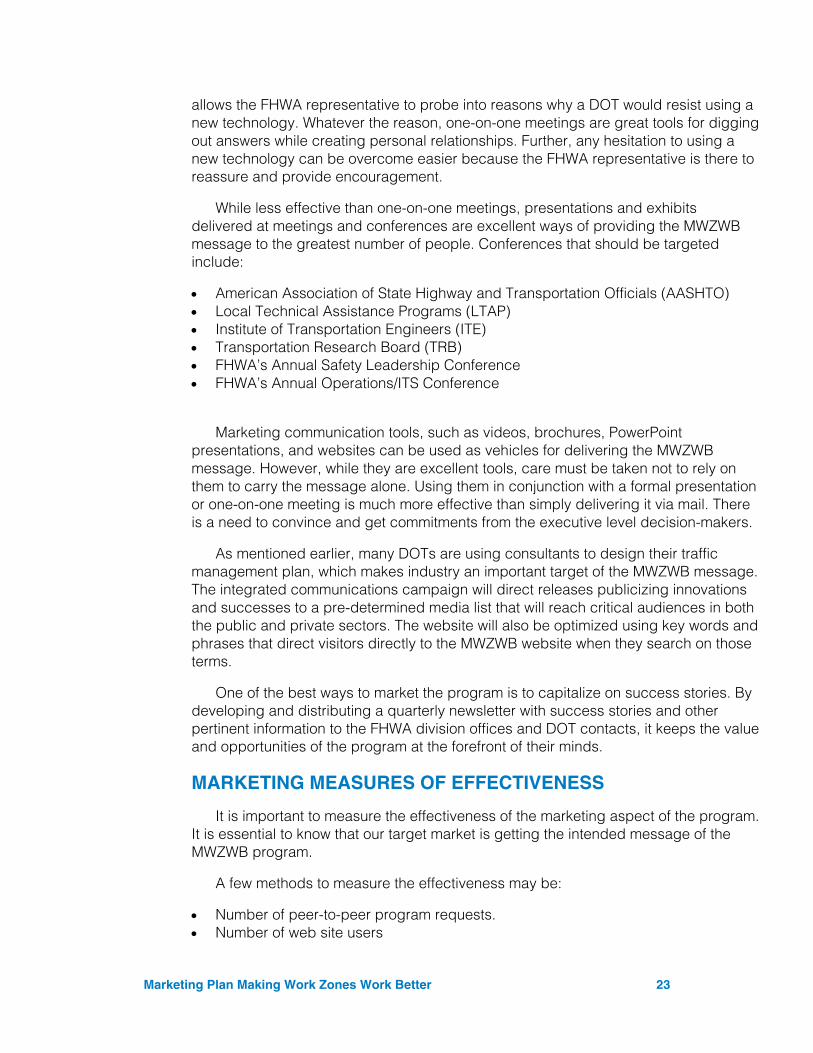
Marketing Plan Making Work Zones Work Better 23
allows the FHWA representative to probe into reasons why a DOT would resist using a new technology. Whatever the reason, one-on-one meetings are great tools for digging out answers while creating personal relationships. Further, any hesitation to using a new technology can be overcome easier because the FHWA representative is there to reassure and provide encouragement.
While less effective than one-on-one meetings, presentations and exhibits delivered at meetings and conferences are excellent ways of providing the MWZWB message to the greatest number of people. Conferences that should be targeted include:
• American Association of State Highway and Transportation Officials (AASHTO) • Local Technical Assistance Programs (LTAP) • Institute of Transportation Engineers (ITE) • Transportation Research Board (TRB) • FHWA’s Annual Safety Leadership Conference • FHWA’s Annual Operations/ITS Conference
Marketing communication tools, such as videos, brochures, PowerPoint presentations, and websites can be used as vehicles for delivering the MWZWB message. However, while they are excellent tools, care must be taken not to rely on them to carry the message alone. Using them in conjunction with a formal presentation or one-on-one meeting is much more effective than simply delivering it via mail. There is a need to convince and get commitments from the executive level decision-makers.
As mentioned earlier, many DOTs are using consultants to design their traffic management plan, which makes industry an important target of the MWZWB message. The integrated communications campaign will direct releases publicizing innovations and successes to a pre-determined media list that will reach critical audiences in both the public and private sectors. The website will also be optimized using key words and phrases that direct visitors directly to the MWZWB website when they search on those terms.
One of the best ways to market the program is to capitalize on success stories. By developing and distributing a quarterly newsletter with success stories and other pertinent information to the FHWA division offices and DOT contacts, it keeps the value and opportunities of the program at the forefront of their minds.
MARKETING MEASURES OF EFFECTIVENESS
It is important to measure the effectiveness of the marketing aspect of the program. It is essential to know that our target market is getting the intended message of the MWZWB program.
A few methods to measure the effectiveness may be:
• Number of peer-to-peer program requests. • Number of web site users
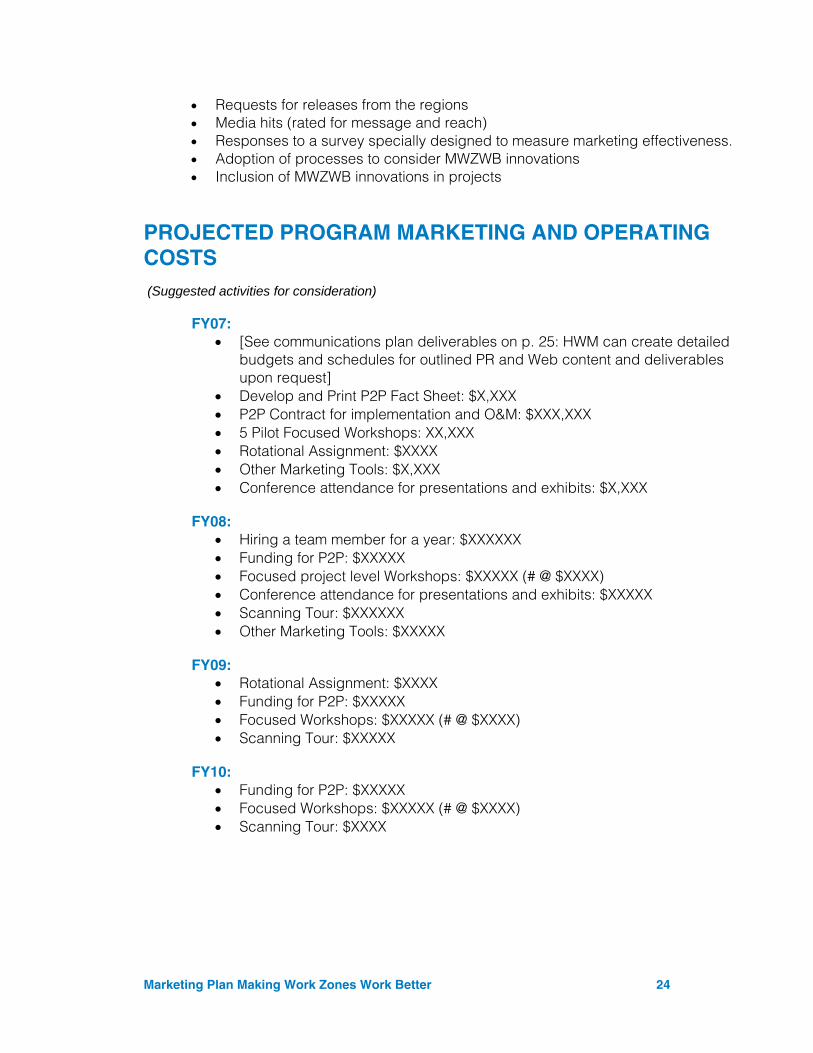
Marketing Plan Making Work Zones Work Better 24
• Requests for releases from the regions • Media hits (rated for message and reach) • Responses to a survey specially designed to measure marketing effectiveness. • Adoption of processes to consider MWZWB innovations • Inclusion of MWZWB innovations in projects
PROJECTED PROGRAM MARKETING AND OPERATING COSTS (Suggested activities for consideration)
FY07: • [See communications plan deliverables on p. 25: HWM can create detailed
budgets and schedules for outlined PR and Web content and deliverables upon request]
• Develop and Print P2P Fact Sheet: $X,XXX • P2P Contract for implementation and O&M: $XXX,XXX • 5 Pilot Focused Workshops: XX,XXX • Rotational Assignment: $XXXX • Other Marketing Tools: $X,XXX • Conference attendance for presentations and exhibits: $X,XXX
FY08: • Hiring a team member for a year: $XXXXXX • Funding for P2P: $XXXXX • Focused project level Workshops: $XXXXX (# @ $XXXX) • Conference attendance for presentations and exhibits: $XXXXX • Scanning Tour: $XXXXXX • Other Marketing Tools: $XXXXX
FY09: • Rotational Assignment: $XXXX • Funding for P2P: $XXXXX • Focused Workshops: $XXXXX (# @ $XXXX) • Scanning Tour: $XXXXX
FY10: • Funding for P2P: $XXXXX • Focused Workshops: $XXXXX (# @ $XXXX) • Scanning Tour: $XXXX
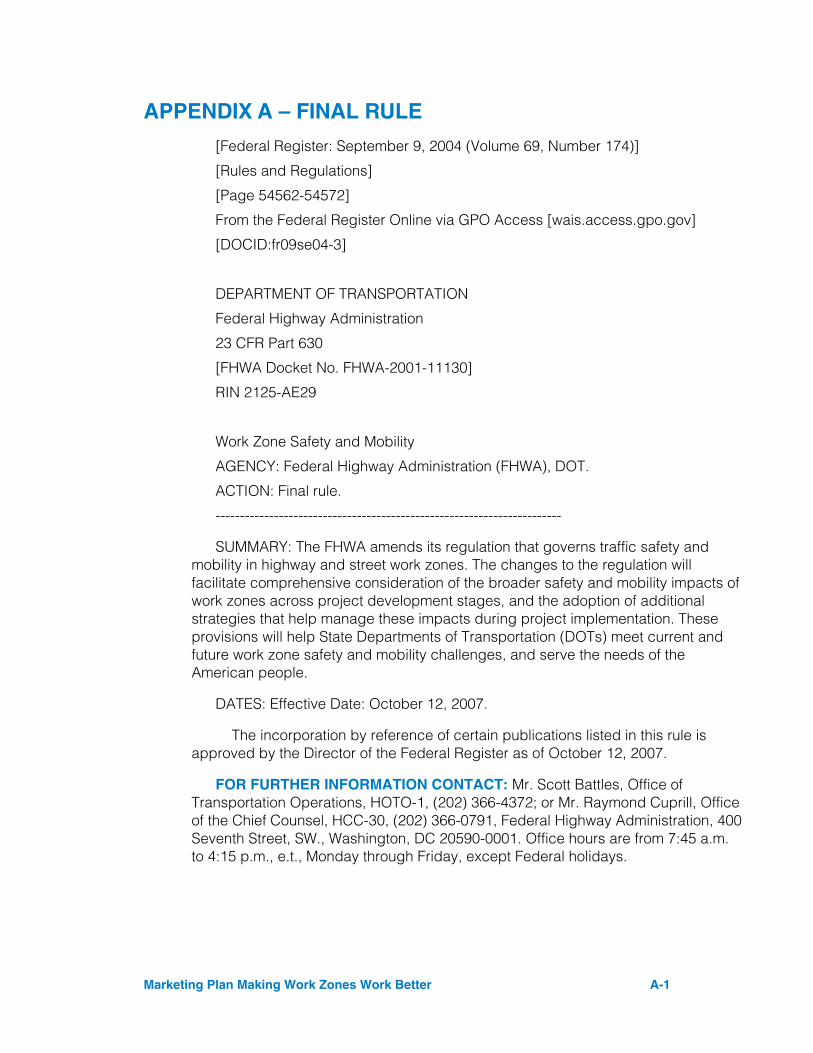
Marketing Plan Making Work Zones Work Better A-1
APPENDIX A – FINAL RULE
[Federal Register: September 9, 2004 (Volume 69, Number 174)]
[Rules and Regulations]
[Page 54562-54572]
From the Federal Register Online via GPO Access [wais.access.gpo.gov]
[DOCID:fr09se04-3]
DEPARTMENT OF TRANSPORTATION
Federal Highway Administration
23 CFR Part 630
[FHWA Docket No. FHWA-2001-11130]
RIN 2125-AE29
Work Zone Safety and Mobility
AGENCY: Federal Highway Administration (FHWA), DOT.
ACTION: Final rule.
-----------------------------------------------------------------------
SUMMARY: The FHWA amends its regulation that governs traffic safety and mobility in highway and street work zones. The changes to the regulation will facilitate comprehensive consideration of the broader safety and mobility impacts of work zones across project development stages, and the adoption of additional strategies that help manage these impacts during project implementation. These provisions will help State Departments of Transportation (DOTs) meet current and future work zone safety and mobility challenges, and serve the needs of the American people.
DATES: Effective Date: October 12, 2007.
The incorporation by reference of certain publications listed in this rule is approved by the Director of the Federal Register as of October 12, 2007.
FOR FURTHER INFORMATION CONTACT: Mr. Scott Battles, Office of Transportation Operations, HOTO-1, (202) 366-4372; or Mr. Raymond Cuprill, Office of the Chief Counsel, HCC-30, (202) 366-0791, Federal Highway Administration, 400 Seventh Street, SW., Washington, DC 20590-0001. Office hours are from 7:45 a.m. to 4:15 p.m., e.t., Monday through Friday, except Federal holidays.
Marketing Plan Making Work Zones Work Better A-2
SUPPLEMENTARY INFORMATION:
ELECTRONIC ACCESS
This document and all comments received by the U.S. DOT Docket Facility, Room PL-401, may be viewed through the Docket Management System (DMS) at dms.dot.gov. The DMS is available 24 hours each day, 365 days each year. Electronic submission and retrieval help and guidelines are available under the help section of this Web site.
An electronic copy of this document may be downloaded by using a computer, modem, and suitable communications software from the Government Printing Office's Electronic Bulletin Board Service at (202) 512-1661. Internet users may reach the Office of the Federal Register's home page at: www.archives.gov and the Government Printing Office's Web site at: www.access.gpo.gov/nara.
BACKGROUND
History
Pursuant to the requirements of Section 1051 of the Intermodal Surface Transportation Efficiency Act of 1991 (ISTEA), (Pub. L. 102-240, 105 Stat. 1914; Dec. 18, 1991), the FHWA developed a work zone safety program to improve work zone safety at highway construction sites. The FHWA implemented this program through non-regulatory action by publishing a notice in the Federal Register on October 24, 1995 (60 FR 54562). This notice established the National Highway Work Zone Safety Program (NHWZSP) to enhance safety at highway construction, maintenance, and utility sites. In this notice, the FHWA indicated the need to update its regulation on work zone safety (23 CFR 630, Subpart J).
As a first step in considering amendments to its work zone safety regulation, the FHWA published an advance notice of proposed rulemaking (ANPRM) on February 6, 2002, at 67 FR 5532. The ANPRM solicited information on the need to amend the regulation to better respond to the issues surrounding work zones, namely the need to reduce recurrent roadwork, the duration of work zones, and the disruption caused by work zones.
The FHWA published a notice of proposed rulemaking (NPRM) on May 7, 2003, at 68 FR 24384. The regulations proposed in the NPRM were intended to facilitate consideration and management of the broader safety and mobility impacts of work zones in a more coordinated and comprehensive manner across project development stages, and the development of appropriate strategies to manage these impacts. We received a substantial number of responses to the NPRM. While most of the respondents agreed with the intent and the concepts proposed in the NPRM, they recommended that the proposed provisions be revised and altered so as to make them practical for application in the field. The respondents identified the need for flexibility and scalability in the implementation of the provisions of the proposed rule; noted that some of the terms used in the proposed rule were ambiguous and lent themselves to subjective interpretation. Respondents also
Marketing Plan Making Work Zones Work Better A-3
commented that the documentation requirements in the proposal would impose undue time and resource burdens on State DOTs.
In order to address the comments received in response to the NPRM, the FHWA issued a supplemental notice of proposed rulemaking (SNPRM) on May 13, 2004, at 69 FR 26513. The SNPRM addressed the comments related to flexibility and scalability of provisions, eliminated ambiguous terms from the language, and reduced the documentation requirements. We received several supportive comments in response to the SNPRM. Most respondents noted that the SNPRM addressed the majority of their concerns regarding the originally proposed rule. However, they did offer additional comments regarding specific areas of concern. In the final rule issued today, the FHWA has addressed all the comments received in response to the SNPRM that are within the scope of this rulemaking.
The regulation addresses the changing times of more traffic, more congestion, greater safety issues, and more work zones. The regulation is broader so as to recognize the inherent linkage between safety and mobility and to facilitate systematic consideration and management of work zone impacts. The regulation can advance the state of the practice in highway construction project planning, design, and delivery so as to address the needs of the traveling public and highway workers. The key features of the final rule are as follows:
A policy driven focus that will institutionalize work zone processes and procedures at the agency level, with specific language for application at the project level.
A systems engineering approach that includes provisions to help transportation agencies address work zone considerations starting early in planning, and progressing through project design, implementation, and performance assessment.
Emphasis on addressing the broader impacts of work zones to develop transportation management strategies that address traffic safety and control through the work zone, transportation operations, and public information and outreach.
Emphasis on a partner driven approach, whereby transportation agencies and the FHWA will work together towards improving work zone safety and mobility.
Overall flexibility, scalability, and adaptability of the provisions, so as to customize the application of the regulations according to the needs of individual agencies, and to meet the needs of the various types of highway projects.
SUMMARY DISCUSSION OF COMMENTS RECEIVED IN RESPONSE TO THE SNPRM
The following discussion provides an overview of the comments received in response to the SNPRM, and the FHWA's actions to resolve and address the issues raised by the respondents.
Marketing Plan Making Work Zones Work Better A-4
PROFILE OF RESPONDENTS
We received a total of 33 responses to the docket. Out of the 33 total respondents, 27 were State DOTs; 4 were trade associations; and 2 provided comments as private individuals. The 4 trade associations were namely, the Laborers' Health and Safety Fund of North America (LHSFNA), the American Traffic Safety Services Association (ATSSA), the Associated General Contractors (AGC) of America, and the Institute of Transportation Engineers (ITE). We classified the American Association of State Highway and Transportation Officials (AASHTO) as a State DOT because they represent State DOT interests. The AASHTO provided a consolidated response to the SNPRM on behalf of its member States. Several State DOTs provided their comments individually.
The respondents represented a cross-section of job categories, ranging from all aspects of DOT function, to engineering/traffic/safety/design, to construction and contracting.
OVERALL POSITION OF RESPONDENTS
We received several supportive comments in response to the SNPRM. Most State DOTs, the AASHTO, and all private sector respondents greatly appreciated the FHWA's continued effort to receive input during the development of the proposed rule, and particularly in issuing the SNPRM. Most respondents also noted that the SNPRM addressed the majority of their concerns regarding the originally proposed rule.
The respondents also offered comments on specific areas of concern, and recommended changes to improve the rule's language. The State DOTs and the AASHTO offered comments, which relate to their continued concern that the rule allow for adequate flexibility and scalability while limiting unintended liability and cost. Private sector respondents also offered specific comments on certain areas of concern.
Details regarding these issues and FHWA's specific response are discussed in the following section, which provides a section-by-section analysis of the comments.
The level of support for the SNPRM is indicated by the fact that 23 of the 33 respondents expressed overall support for the provisions proposed in the SNPRM. It is to be noted that these respondents were not necessarily supportive of all the provisions, but rather that, their overall position on the SNPRM was supportive. Many of these respondents provided suggestions on modifications and revised language for specific provisions as they deemed appropriate. Of the 23 respondents who were supportive, 21 represented State DOTs and 2 represented trade associations.
Of the remaining respondents, 2 opposed the issuance of the rule, 2 agreed with the intent and the concepts but did not agree with many of the mandatory provisions, and the remaining 6 did not expressly indicate their overall position.
Marketing Plan Making Work Zones Work Better A-5
One of the two respondents who opposed the issuance of the rule was the Iowa DOT. It expressed that it supports the goals of improved safety and reduced congestion, but opposes the proposed rule as it would not necessarily help achieve these goals. It believes that its current work zone policies are sufficient to provide for a high standard of safety and mobility. It noted that the rule is not flexible enough, and that it would require significant commitments from its limited staff.
The other respondent that opposed the rule was the Kansas DOT. It suggested that the FHWA retract the rule and, instead, issue the information on work zone safety and mobility as a guide for use by State DOTs. It believes that encouraging State DOTs to review and improve their current practices on work zone safety and mobility, through closer contact with FHWA and other partners, would be more effective than mandating specific processes. It also suggested changes to specific sections, and recommended that the FHWA implement the AASHTO's recommendations, if retraction of the rule was not an option.
SECTION-BY-SECTION ANALYSIS OF SNPRM COMMENTS AND FHWA RESPONSE
Section 630.1002 Purpose
There were no major comments in response to this section. The overall sentiment of the respondents was supportive of the language as proposed in the SNPRM, and therefore, we will retain the language as proposed in the SNPRM.
Section 630.1004 Definitions and Explanation of Terms
Most respondents were supportive of this section. Some respondents offered specific comments on some of the definitions proposed in the SNPRM. They are discussed as follows:
• Definition for ``Mobility.'' The AGC of America remarked that the definition for mobility seems to imply a greater emphasis on mobility than on safety. It recommended that we change the second sentence of the definition to imply that work zone mobility should be achieved without compromising the safety of highway workers or road users. To address this comment the FHWA has amended the definition by adding the words, ``while not compromising the safety of highway workers or road users'' at the end of the second sentence. In addition, the word ``smoothly'' after the phrase, ``mobility pertains to moving road users,'' has been replaced by the word ``efficiently.''
• Definition for ``Safety.'' The AASHTO and several DOTs recommended that the term, ``road worker(s)'' be changed to ``highway worker(s)'' for the sake of consistency. We agree with this observation, and made this change. The Georgia DOT recommended that the term ``danger'' be changed to ``potential hazards'' to reduce potential liability. We agree with this recommendation, and therefore, replaced the word ``danger'' with ``potential hazards'' in the first sentence. In the second sentence, we rephrased ``minimizing the exposure to danger of road users'' with ``minimizing potential hazards to road users.''
Marketing Plan Making Work Zones Work Better A-6
• Definition for ``Temporary Traffic Control (TTC) Plan.'' We moved the definition for the TTC plan from Sec. 630.1004, Definitions and Explanation of Terms, to Sec. 630.1012(b), Transportation Management Plan (TMP), where the requirements for the TTC plan are laid out. This is in response to a comment from the Georgia DOT that the language under the TTC plan section of Sec. 630.1012(b) was not consistent with the Manual On Uniform Traffic Control Devices (MUTCD).\1\ Since the definition for the TTC plan was referenced from the MUTCD, it was removed from the definitions section and placed in Sec. 630.1012(b)(1), where TTC plans are discussed.
\1\ The MUTCD is approved by the FHWA and recognized as the national standard for traffic control on all public roads. It is incorporated by reference into the Code of Federal Regulations at 23 CFR part 655. It is available on the FHWA's Web site at mutcd.fhwa.dot.gov and is available for inspection and copying at the FHWA Washington, DC Headquarters and all FHWA Division Offices as prescribed at 49 CFR part 7.
• Definitions for ``Work Zone'' and ``Work Zone Crash.'' There were several comments recommending changes to certain terminology in both these definitions. For example, the AASHTO and several DOTs suggested that the term, ``traffic units,'' in the first sentence of the Work Zone Crash definition be changed to ``road users.'' However, we have decided not to adopt the changes in order to maintain consistency with other industry accepted sources--the definition for ``work zone'' being referenced from the MUTCD, and that for ``work zone crash,'' from the Model Minimum Uniform Crash Criteria Guideline (MMUCC).\2\
\2\ ``Model Minimum Uniform Crash Criteria Guideline'' (MMUCC), 2d Ed. (Electronic), 2003, produced by National Center for Statistics and Analysis, National Highway Traffic Safety Administration (NHTSA). Telephone 1-(800)-934-8517. Available at the URL: www-nrd.nhtsa.dot.gov. The NHTSA, the FHWA, the Federal Motor Carrier Safety Administration (FMCSA), and the Governors Highway Safety Association (GHSA) sponsored the development of the MMUCC Guideline which recommends voluntary implementation of the 111 MMUCC data elements and serves as a reporting threshold that includes all persons (injured and uninjured) in crashes statewide involving death, personal injury, or property damage of $1,000 or more. The Guideline is a tool to strengthen existing State crash data systems.
SECTION 630.1006 WORK ZONE SAFETY AND MOBILITY POLICY
The majority of the respondents supported the proposed language in this section. The AASHTO and several DOTs recommended the removal of the second clause in the second to last sentence, ``representing the different project development stages.'' These respondents believe that this change would grant the States maximum flexibility to implement the most appropriate team for each project. The FHWA agrees with this observation and has deleted the phrase in question.
The ATSSA recommended that we specifically include or encourage the participation of experienced industry professionals in the multi-disciplinary team referenced in the second to last sentence. The FHWA believes that States will solicit the participation of industry representatives if required for the specific project under consideration.
Marketing Plan Making Work Zones Work Better A-7
The Kansas DOT commented that the use of the words ``policy'' and ``guidance'' in the same sentence could be confusing, as policies usually carry more weight than guidance. This comment refers to the second sentence, the first part of which reads, ``This policy may take the form of processes, procedures, and/or guidance * * * '' The FHWA disagrees because we believe that policies do not necessarily have to be mandates. For example, it may be a State DOT policy that it ``shall'' consider and manage work zone impacts of projects, but the actual methods to do so may be provided as guidance to its district/region offices which may vary according to the different types of projects that they encounter. The underlying purpose of the work zone safety and mobility policy section is to require State DOTs to implement a policy for the systematic consideration and management of work zone impacts, so that such consideration and management becomes a part of the mainstream of DOT activities. How a State chooses to implement the policy is its prerogative--and it may take the form of processes, procedures, and/or guidance, and may vary upon the work zone impacts of projects.
The Virginia DOT commented on the second sentence of this section that it does not agree with the ``shall'' requirement to address work zone impacts through the various stages of project development and implementation. It justified its objection by saying that ``addressing work zone impacts through the various stages of project development and implementation'' will not work from a practical standpoint due to unforeseen field conditions and circumstances, and that the shall clause could result in potential litigation. The FHWA disagrees with the Virginia DOT. We would like to mention that the second sentence by itself, when taken out of context, doesn't quite convey the message of the entire section. The preceding sentence and the following sentence need to be considered in interpreting what the second sentence means.
The first sentence requires that State DOTs implement a policy for the systematic consideration and management of work zone impacts on all Federal-aid highway projects. The second sentence further qualifies the term ``systematic'' by saying that the policy shall address work zone impacts throughout the various stages of project development and implementation--this implies that the consideration and management of work zone impacts progresses through the various stages. The third sentence further clarifies that the methods to implement this policy may not necessarily be absolute requirements, but rather be implemented through guidance. Further, the third sentence provides a more specific delineator by saying that the implementation of the policy may vary based upon the characteristics and expected work zone impacts of individual projects or classes of projects.
SECTION 630.1008 AGENCY-LEVEL PROCESSES AND PROCEDURES
The AASHTO and several State DOTs remarked that there is inconsistency with the use of ``Agency'' and ``State Agency,'' and that this needs to be resolved. Further, a few State DOTs sought clarification as to whether ``agency'' applies to the State transportation agency or other entities that might be involved in the project
Marketing Plan Making Work Zones Work Better A-8
development process (i.e., county and/ or local governments and authorities). In response to this comment, we changed all instances of the terms ``State Agency'' and ``Agency'' in the entire subpart to the term ``State,'' as referenced in the rule.
SECTION 630.1008(A), SECTION INTRODUCTION
There were no specific comments in response to the language in this paragraph. In the second sentence, to remove ambiguity and for clarity, we replaced the words ``well defined data resources'' with the words, ``data and information resources.''
The North Carolina DOT observed that the language in this paragraph is an introduction to the section, and that it should not be labeled as ``(a).'' We did not make this change because the Office of the Federal Register (OFR) requires paragraph designations on all text in a rule. Section 630.1008(b), Work Zone Assessment and Management Procedures. Most respondents were supportive of the language in this paragraph.
SECTION 630.1008(C), WORK ZONE DATA
Most State DOTs and the AASHTO opposed the mandatory requirement to use work zone crash and operational data towards improving work zone safety and mobility on ongoing projects, as well as to improve agency processes and procedures. One of the key reasons cited for this opposition was the difficulty and level of effort involved in obtaining and compiling data quickly enough to take remedial action on ongoing projects. A few DOTs also stated that using data to improve State-level procedures was feasible but not at the individual project level. The AASHTO also observed that there is already a reference to data in Sec. 630.1008(e), ``Process Review,'' where the use of data is optional and not mandatory. Some States recommended that we clarify the term ``operational data,'' whether it is observed or collected data. They also noted that the ``shall'' clauses in the first two sentences are inconsistent with the ``encouraged to'' in the last sentence, and questioned as to how the use of data can be mandated when the data resources themselves are optional. The California Transportation Department (CalTrans) questioned the objective of developing TMPs and conducting process reviews if appropriate performance measures and data collection standards are not identified for determining success.
The FHWA provides the following comments and responses to the above stated concerns:
The purpose of the provisions in this section is not to require States to collect additional data during project implementation, but rather, to improve the use of available work zone field observations, crash data, and operational information to: (1) Manage the safety and mobility impacts of projects more effectively during implementation; and (2) provide the basis for systematic procedures to assess work zone impacts in project development. For example, most agencies maintain field diaries for constructions projects. These field diaries are intended to provide a log of problems, decisions, and progress made over the duration of a project. In many
Marketing Plan Making Work Zones Work Better A-9
States, these diaries log incidents and actions such as the need to replace channelization devices into their proper positions after knockdown by an errant vehicle, or to deal with severe congestion that occurred at some point during the day. These log notes, when considered over time, may provide indications of safety or operational deficiencies. To address such deficiencies, it may be necessary and prudent to improve the delineation through the work zone to prevent future occurrences of knockdown events, or to alter work schedules to avoid the congestion that recurs at unexpected times due to some local traffic generation phenomena.
Police reports are another example of an available source of data that may be useful in increasing work zone safety. Provisions are made in many agencies for a copy of each crash report to be forwarded to the engineering section immediately upon police filing of the crash report. Where a work zone is involved, a copy of this report should be forwarded as soon as possible to the project safety manager to determine if the work zone traffic controls had any contribution to the crash so that remedial action can be taken.
These applications do not necessarily require that agencies gather new data, but there may be a need to improve processes to forward such reports to the appropriate staff member for review during project implementation and/or to provide guidance or training to facilitate interpretation of these reports. Agencies may choose to enhance the data they capture to improve the effectiveness of these processes by following national crash data enhancement recommendations and/or linking it with other information (e.g., enforcement actions, public complaints, contractor claims). This same data and information can be gathered for multiple projects and analyzed by the agency to determine if there are common problems that could be remedied by a change in practices. The information may also be used for process reviews.
The first sentence of this paragraph was revised to convey that States are required to use field observations, available work zone crash data, and operational information at the project level, to manage the work zone impacts of specific projects during project implementation. This provision requires States to use data and information that is available to them, so as to take appropriate actions in a timely manner to correct potential safety or mobility issues in the field. Operational information refers to any available information on the operation of the work zone, be it observed or collected. For example, many areas have Intelligent Transportation Systems (ITS) in place, and many others are implementing specific ITS deployments to manage traffic during construction projects. The application of this provision to a project where ITS is an available information resource, would result in the use of the ITS information to identify potential safety or mobility issues on that project.
The second sentence was also revised to convey that work zone crash and operational data from multiple projects shall be analyzed towards improving State processes and procedures. Such analysis will help improve overall work zone safety and mobility. Data gathered during project implementation needs to be maintained
Marketing Plan Making Work Zones Work Better A-10
for such post hoc analyses purposes. Such data can be used to support analyses that help improve State procedures and the effectiveness of future work zone safety and mobility assessment and management procedures.
The respondents indicated that the use of ``encouraged to'' in the last sentence is inconsistent with the ``shall'' clauses in the first two sentences. Further, the phrase, ``establish data resources at the agency and project levels'' does not clearly convey the message of the provision. This provision does not require States to embark on a massive data collection, storage, and analysis effort, but rather to promote better use of elements of their existing/available data and information resources to support the activities required in the first two sentences. Examples of existing/available data and information resources include: Project logs, field observations, police crash records, operational data from traffic surveillance devices (e.g., data from traffic management centers, ITS devices, etc.), other monitoring activities (e.g., work zone speed enforcement or citations), and/or public complaints. We revised the last sentence to convey that States should maintain elements of their data and information resources that logically support the required activities.
In response to CalTrans' comment regarding establishing performance measures and data collection standards, we appreciate the value of the input, but we believe that we do not have adequate information at this time to specify performance measures for application at the National level. State DOTs may establish such performance measures and data collection standards as applicable to their individual needs and project scenarios. For example, the Ohio-DOT mandates that there shall always be at least two traffic lanes maintained in each direction for any work that is being performed on an Interstate or Interstate look-alike. We believe that such policies need to be developed and implemented according to individual State DOT needs, and hence we maintain a degree of flexibility in the rule language.
SECTION 630.1008(D), TRAINING
Most State DOTs and the AASHTO opposed the mandatory requirement that would require training for the personnel responsible for work zone safety and mobility during the different project development and implementation stages. These respondents noted that the proposed language implied that State DOTs would be responsible for training all the listed personnel, including those who do not work for the DOT itself, and that this would create a huge resource burden, as well as increase the liability potential for the DOTs. These commenters also ratified their opposition by quoting the MUTCD training requirement, which does not mandate training, but suggests that personnel should be trained appropriate to the job decisions that they are required to make. Some DOTs, including the New York State DOT (NYSDOT), requested that the reference to personnel responsible for enforcement of work zone related transportation management and traffic control be clarified as to whether it refers to law enforcement officers or to field construction/safety inspectors.
Marketing Plan Making Work Zones Work Better A-11
The FHWA provides the following comments and responses to the above stated concerns:
The FHWA agrees that the first sentence in the training section seems to imply that the State would be responsible for training all mentioned personnel; therefore, we changed the sentence to convey that the State shall ``require'' the mentioned personnel be trained. This change will require the State to train direct State employees only, and takes away the burden from the State to train personnel who are not direct employees. We believe that personnel responsible for the development, design, operation, inspection, and enforcement of work zone safety and mobility need to be trained, and this requirement will allow for training to be provided by the appropriate entities. The responsibility of the State would be to require such training, either through policy or through specification. For example, the Florida DOT has developed and required work zone training of their designers and contractors by procedure and by specifications. Similarly, the Maryland State Highway Administration (MD-SHA) provides a maintenance of traffic (MOT) design class to personnel responsible for planning and designing work zones, including consultants and contractors.
Further, in keeping with the MUTCD language on training, we added the phrase, ``appropriate to the job decisions each individual is required to make'' to the end of the first sentence. This clarifies that the type and level of training will vary according to the responsibilities of the different personnel. For example, Maryland State Highway Police officers attend a 4-hour work zone safety and traffic control session at the Police Academy.
We also revised the second sentence to convey that States shall require periodic training updates that reflect changing industry practices and State processes and procedures. Since we revised the first sentence to convey that training of non-State personnel is not a State responsibility, in the second sentence, we deleted the phrase, ``States are encouraged to keep records of the training successfully completed by these personnel.''
In response to the request that ``personnel responsible for enforcement'' of work zone related transportation management and traffic control be clarified, we believe that this group is inclusive of both law enforcement officers and field construction/safety inspectors.
SECTION 630.1008(E), PROCESS REVIEW
Most respondents were supportive of the language in this section. The AASHTO and several State DOTs recommended that States should have maximum flexibility to implement the most appropriate team for each project. These commenters suggested that the fourth and the fifth sentences of the section be deleted, and that the clause, ``as well as FHWA'' be added to the end of the third sentence.
The FHWA agrees with the observation made by the AASHTO and State DOTs that States should have maximum flexibility to implement the most appropriate review team for each project. Therefore, as suggested, we deleted the fourth and
Marketing Plan Making Work Zones Work Better A-12
the fifth sentence of the section, and added the clause, ``as well as FHWA'' to the end of the third sentence. Further, in the third sentence, we changed the phrase ``are encouraged to'' to ``should.''
SECTION 630.1010 SIGNIFICANT PROJECTS
All respondents agreed with the concept of defining significant projects, and the requirement to identify projects that are expected to have significant work zone impacts; however, most State DOTs and the AASHTO opposed the requirement to classify Interstate system projects that occupy a location for more than three days with either intermittent or continuous lane closures, as significant. They cited that all Interstate system projects that occupy a location for more than three days would not necessarily have significant work zone impacts, particularly on low-volume rural Interstate sections. Several DOTs remarked that designation of significant projects purely based on the duration would not be prudent, and that the volume of traffic on that Interstate should be taken into account. They also noted that such classification is not consistent with the MUTCD. They remarked that this provision could not be effectively applied to routine maintenance activities performed by State DOT maintenance crews, and that requesting exceptions to such routine work would be unreasonably arduous.
These respondents also objected to the associated exemption clause for the same provision, commenting that it would be very cumbersome to implement. Some States also requested clarification on whether general exceptions would be granted for work categories for defined segments of Interstate projects where the work would have little impact.
The DOTs of Idaho, Montana, North Dakota, South Dakota, and Wyoming commented that the threshold for designating the reference Interstate projects as significant was too low. They suggested that low volume Interstates and rural Interstates should be excluded, and that, the duration should be extended well above the three-day duration.
The AASHTO and the State DOTs also remarked that the identification of significant projects in ``cooperation with the FHWA'' should be changed to ``in consultation with the FHWA.''
The FHWA provides the following responses and proposed action in response to the referenced concerns:
• We agree with the majority of the concerns raised by the respondents.
• We changed the significant projects clause as applicable to Interstate system projects, to require States to classify as significant projects, all Interstate system projects within the boundaries of a designated Transportation Management Area (TMA), that occupy a location for more than three days with either intermittent or continuous lane closures. We believe that this change addresses all the concerns raised by the respondents. The delineation of projects by the boundaries of a designated TMA will address the work zone impacts of lane-
Marketing Plan Making Work Zones Work Better A-13
closures on Interstate segments in the most heavily traveled areas with recurring congestion problems. We believe that in general, areas with recurring congestion tend to be severely impacted by lane closures as compared to those without recurring congestion. We also believe that the areas that are already designated as TMAs tend to exhibit patterns of recurring congestion on their Interstates due to heavy traffic demand and limited capacity. This revision, in most cases, would also not require low-volume rural Interstate segments to be classified as significant projects.
• We revised the exemption clause provisions related to the applicable Interstate system projects to allow for exemptions to ``categories of projects.'' This will provide for blanket exemptions for specific categories of projects on Interstate segments that are not expected to have significant work zone impacts. This will eliminate the burdensome procedural aspect of seeking exemptions for Interstate projects on an individual project basis.
• We also reorganized this section to consist of paragraphs (a), (b), (c), and (d). Paragraph (a) provides the general definition for a significant project, with no changes in language from what was proposed in the SNPRM. Paragraph (b) enumerates the purpose of classifying projects as significant, and lays out the requirements for States to classify projects as significant. This language is also the same as what was proposed in the SNPRM. Paragraph (c) provides the revised definition of significant projects as applicable to Interstate system projects. Paragraph (d) provides the revised exemption clause as applicable to significant projects on the Interstate system. In keeping with the overall recommendation of respondents, we changed all instances of ``Agency'' and ``State Agency'' to ``State.''
• We do not agree with the recommendation that the identification of significant projects should be done in ``consultation'' with the FHWA rather than ``cooperation with the FHWA.'' We believe that this is a cooperative process, rather than requiring just consultation. Therefore, we did not make any change to this terminology.
SECTION 630.1012 PROJECT-LEVEL PROCEDURES
• Section 630.1012(a). The North Carolina DOT observed that the language in this section is an introduction to the section, and that it should not be labeled as ``(a).'' We did not make this change because the OFR requires paragraph designations on all text in a rule. The ITE recommended that the FHWA should encourage consideration of work zone impacts prior to project development, at the corridor and Transportation Improvement Program (TIP) and program development stage. It provided examples of decisions that would be made at the earlier stages, such as, life-cycle cost decisions, and project scheduling decisions. We appreciate ITE's input and agree with the general intent of its suggested content. We believe that the language in Sec. Sec. 630.1002, Purpose and 630.1010, Significant Projects covers some of the issues to which
Marketing Plan Making Work Zones Work Better A-14
the ITE refers. Specifically, the following two sentences from the respective sections address the ITE's concerns:
• From Sec. 630.1002, Purpose: ``Addressing these safety and mobility issues requires considerations that start early in project development and continue through project completion.''
• From Sec. 630.1010, Significant Projects: ``This identification of significant projects should be done as early as possible in the project delivery and development process, and in cooperation with the FHWA.''
• Section 630.1012(b), Transportation Management Plan (TMP). Most respondents were supportive of the provisions in this section. The Florida DOT requested further definition for the phrase ``less than significant work zone impacts.'' We believe that the definition for ``work zone impacts'' as provided in Sec. 630.1004 and the clauses for identification of projects with significant work zone impacts, as stated in Sec. 630.1010 adequately describe the phrase ``less than significant work zone impacts.'' We did not take any action in response to this comment. The New Jersey DOT recommended that, in order to facilitate maximum flexibility to States, the term ``typically'' be introduced before the word ``consists'' in the third sentence of this section. We do not agree with the suggested edit because for significant projects, a TMP shall always consist of a TTC plan, and address Transportation Operations (TO) and Public Information (PI) components, unless an exemption has been granted for that project. We did not take any action in response to this comment.
• Section 630.1012(b)(1), Temporary Traffic Control (TTC) Plan. In general, most respondents were supportive of the provisions in this section, except the provision regarding maintenance of pre-existing roadside safety features. Most State DOTs and the AASHTO were opposed to the provision, which required the maintenance of pre-existing roadside safety features in developing and implementing the TTC plan. They recommended that the FHWA either remove the requirement or change the mandatory ``shall'' to a ``should.'' Several DOTs stated that maintenance of all pre-existing roadside safety features would be very difficult, especially, in urban areas. Other DOTs requested clarification on what ``pre-existing roadside safety features'' would entail--whether it would include items like signs, guardrail, and barriers, or it would include features like shoulders, slopes and other geometric aspects. On that note, several DOTs mentioned that maintenance of pre-existing roadside safety ``hardware'' would be more practical than maintaining pre-existing roadside safety features. The Laborers Health and Safety Foundation of North America (LHSFNA) continued to stress the requirement for Internal Traffic Control Plans (ITCPs) for managing men and materials within the work area, so as to address worker safety issues better, and to level the playing field for contractors.
The FHWA offers the following in response to the comments and concerns raised above:
• The FHWA agrees with most of the concerns raised by the respondents.
Marketing Plan Making Work Zones Work Better A-15
• In the fourth sentence of paragraph (b)(1), we changed the term ``pre-existing roadside safety features,'' to ``pre-existing roadside safety hardware.'' We believe that this change will address all the concerns raised by the respondents, and eliminate ambiguity and subjectivity from the requirement.
• In response to the LHSFNA's comment regarding ITCPs, we agree that ITCPs are important for providing for worker safety inside the work area, but we still believe that this issue is outside the purview of this rulemaking effort and this subpart. In order to be consistent with the remaining sections of this subpart, and to eliminate ambiguity, we deleted the first sentence of this section, and replaced it with the definition for TTC plan as stated in Sec. 630.1004. Consequently, we removed the definition for TTC plan from Sec. 630.1004.
• Section 630.1012(b)(2), Transportation Operations (TO) Component. Most respondents were supportive of the provisions in this section. The AASHTO and several DOTs suggested that ``traveler information'' be removed as a typical TO strategy because ``traveler information'' fits more logically in the PI component. The New Jersey DOT recommended that the phrase ``transportation operations and safety requirements'' be changed to ``transportation operations and safety strategies,'' so as to soften the tone of the language. We agree with both of the above observations; therefore, we removed ``traveler information'' from the listing of typical TO strategies in the second sentence. We also changed the phrase ``transportation operations and safety requirements'' to ``transportation operations and safety strategies'' in the last sentence.
• Section 630.1012(b)(3), Public Information Component. Most respondents were supportive of the provisions in this section. The AASHTO and several DOTs suggested that ``traveler information'' be included as a typical PI strategy rather than a TO strategy, because ``traveler information'' fits more logically in the PI component. The New Jersey DOT recommended that the phrase ``public information and outreach requirements'' be changed to ``public information and outreach strategies,'' so as to soften the tone of the language. We agree with both of the above observations; therefore, we added a new sentence after the first sentence, to indicate that the PI component may include traveler information strategies. We also changed the phrase ``public information and outreach requirements'' to ``public information and outreach strategies'' in the third sentence.
• Section 630.1012(b)(4), Coordinated Development of TMP. Most respondents were supportive of the provisions in this section. The AASHTO and several DOTs recommended that the terminology, ``coordination and partnership'' in the first sentence, be changed to ``consultation,'' so that it doesn't imply active and direct participation from all the subjects. They explained that the term ``coordination'' implies that all participants have veto/negative powers which may delay project delivery as it is impossible to satisfy everybody. Further, the DOTs of Idaho, Montana, North Dakota, South Dakota, and Wyoming commented that the use of ``i.e.'' for the list of stakeholders implies that all those stakeholders are required for all projects. So they recommended that we
Marketing Plan Making Work Zones Work Better A-16
change the ``i.e.'' to ``e.g.'' so that it would imply that the list provides examples of possible stakeholders, and that all of them need not be involved in all projects. The FHWA agrees with both of the above observations and recommendations; therefore, we changed the phrase ``partnership and coordination'' to ``consultation'' in the first sentence of this section. We also changed ``i.e.'' to ``e.g.'' for the list of stakeholders.
• Section 630.1012(c), Inclusion of TMPs in Plans, Specifications, and Estimates (PS&Es). Most respondents were supportive of the provisions in this section. The DOTs of Idaho, Montana, North Dakota, South Dakota, and Wyoming noted that the last sentence in this section could imply that the State shall approve any TMP that is developed by the contractor, irrespective of whether it meets the standards or not. They recommended that the sentence be revised for clarity. The FHWA agrees with the above observation. We revised the last sentence of this section to convey that contractor developed TMPs shall be subject to the approval of the State, and that the TMPs shall not be implemented before they are approved by the State. This clarifies the language and explicitly states the notion that it is the State that is ultimately responsible for approving any contractor developed TMP.
• Section 630.1012(d), Pay Items. Most respondents were supportive of the provisions in this section. However, the ATSAA and the AGC of America opposed the option in Sec. 630.1012(d)(1) for States to use lump sum pay items for implementing the TMPs. The ATSSA believes that unit bid items provide greater specificity and are a better indicator of the direct cost of work zones. Conversely, the use of a lump sum pay item provides less comprehensive data, and may, in some cases, limit, or eliminate the contractor's ability to make a profit on certain projects due to unknown equipment or device requirements either during bidding or project implementation. It cited that unit pay items, especially for the TTC plan, would require that all the identified work zone safety and mobility strategies/equipment/devices be provided for by the contractor. This would level the playing field, and not place conscientious contractors (those who lay emphasis on work zone safety and mobility and include them in their bids) at a disadvantage. The FHWA recognizes ATSSA's and AGC's concerns, but we believe that States have the required understanding of when to use unit pay items and when not to, and that the requirement for unit pay items on all projects is not practical for real-world application. Therefore, we did not remove the option for DOTs to use lump sum contracting. We changed ``i.e.'' to ``e.g.'' for the list of possible performance criteria for performance specifications in Sec. 630.1012(d)(2), to remove the implication that the list is an exhaustive list of performance criteria.
• Section 630.1012(e), Responsible Persons. Most respondents were supportive of the provisions in this section. A few State DOTs remarked that the terms ``qualified person,'' ``assuring,'' and ``effectively administered,'' in Sec. 630.1012(e) were ambiguous and lent themselves to subjective interpretation. The FHWA agrees with the above observations. We changed the term ``qualified'' to ``trained,'' as specified in Sec. 630.1008(d) so as to clarify the
Marketing Plan Making Work Zones Work Better A-17
requirement for the responsible person. We also changed the phrase ``assuring that'' to ``implementing,'' and deleted the phrase, ``are effectively administered.''
• Section 630.1014 Implementation. Most respondents were supportive of the provisions in this section. We did not make any changes to the language in this section.
• Section 630.1016 Compliance Date. Most respondents were supportive of the provisions in this section. We did not make any changes to the language in this section.
• Rulemaking Analyses and Notices Executive Order 12866 (Regulatory Planning and Review) and U.S. DOT Regulatory Policies and Procedures. The FHWA has determined that this action is not a significant regulatory action within the meaning of Executive Order 12866 or significant within the meaning of the U.S. Department of Transportation regulatory policies and procedures. This final rule is not anticipated to adversely affect, in a material way, any sector of the economy. In addition, these changes will not create a serious inconsistency with any other agency's action or materially alter the budgetary impact of any entitlements, grants, user fees, or loan programs; nor will the changes raise any novel legal or policy issues. Therefore, a full regulatory evaluation is not required.
• Regulatory Flexibility Act. In compliance with the Regulatory Flexibility Act (RFA) (Pub. L. 96-354, 5 U.S.C. 601-612), the FHWA has evaluated the effects of this final rule on small entities and has determined that it will not have a significant economic impact on a substantial number of small entities. This rule applies to State departments of transportation in the execution of their highway program, specifically with respect to work zone safety and mobility. The implementation of the provisions in this rule will not affect the economic viability or sustenance of small entities, as States are not included in the definition of small entity set forth in 5 U.S.C. 601. For these reasons, the RFA does not apply and the FHWA certifies that the final rule will not have a significant economic impact on a substantial number of small entities.
• Unfunded Mandates Reform Act of 1995. This final rule will not impose unfunded mandates as defined by the Unfunded Mandates Reform Act of 1995 (Pub. L. 104-4, March 22, 1995, 109 Stat. 48). The final rule will not result in the expenditure by State, local, and tribal governments, in the aggregate, or by the private sector, of $120.7 million or more in any one year (2 U.S.C. 1532).
• Executive Order 13132 (Federalism). This action has been analyzed in accordance with the principles and criteria contained in Executive Order 13132, dated August 4, 1999, and it has been determined that this action does not have a substantial direct effect or sufficient federalism implications on States that would limit the policymaking discretion of the States. Nothing in this document directly preempts any State law or regulation or affects the States' ability to discharge traditional State governmental functions.
Marketing Plan Making Work Zones Work Better A-18
• Executive Order 12372 (Intergovernmental Review) Catalog of Federal Domestic Assistance Program Number 20.205, Highway Planning and Construction. The regulations implementing Executive Order 12372 regarding intergovernmental consultation on Federal programs and activities apply to this program.
• Paperwork Reduction Act of 1995 Under the Paperwork Reduction Act of 1995 (PRA) (44 U.S.C. 3501, et seq.). Federal agencies must obtain approval from the Office of Management and Budget (OMB) for each collection of information they conduct, sponsor, or require through regulations. The FHWA has determined that this final rule contains a requirement for data and information to be collected and maintained in the support of design, construction, and operational decisions that affect the safety and mobility of the traveling public related to highway and roadway work zones. This information collection requirement was submitted to and approved by the OMB, pursuant to the provisions of the PRA. In this submission, the FHWA requested the OMB to approve a single information collection clearance for all of the data and information in this final rule. The requirement has been approved, through July 31, 2007; OMB Control No. 2125-0600. The FHWA estimates that a total of 83,200 burden hours per year would be imposed on non-Federal entities to provide the required information for the regulation requirements. Respondents to this information collection include State Transportation Departments from all 50 States, Puerto Rico, and the District of Columbia. The estimates here only include burdens on the respondents to provide information that is not usually and customarily collected.
• Executive Order 13175 (Tribal Consultation). The FHWA has analyzed this action under Executive Order 13175, dated November 6, 2000, and believes that this action will not have substantial direct effects on one or more Indian tribes; will not impose substantial direct compliance costs on Indian tribal governments; and will not preempt tribal law. This rulemaking primarily applies to urbanized metropolitan areas and National Highway System (NHS) roadways that are under the jurisdiction of State transportation departments. The purpose of this final rule is to mitigate the safety and mobility impacts of highway construction and maintenance projects on the transportation system, and would not impose any direct compliance requirements on Indian tribal governments and will not have any economic or other impacts on the viability of Indian tribes. Therefore, a tribal summary impact statement is not required.
• Executive Order 13211 (Energy Effects). The FHWA has analyzed this action under Executive Order 13211, Actions Concerning Regulations that Significantly Affect Energy Supply, Distribution or Use. We have determined that this is not a significant energy action under that order because it is not a significant regulatory action under Executive Order 12866 and is not likely to have a significant adverse effect on the supply, distribution, or use of energy. Further, we believe that the implementation of the final rule by State departments of transportation will reduce the amount of congested travel on our highways, thereby reducing the fuel consumption associated with congested travel.
Marketing Plan Making Work Zones Work Better A-19
Therefore, the FHWA certifies that a Statement of Energy Effects under Executive Order 13211 is not required.
• National Environmental Policy Act. The FHWA has analyzed this action for the purposes of the National Environmental Policy Act of 1969 (42 U.S.C. 4321-4347 et seq.) and has determined that this action will not have any effect on the quality of the environment. Further, we believe that the implementation of the final rule by State departments of transportation will reduce the amount of congested travel on our highways. This reduction in congested travel will reduce automobile emissions thereby contributing to a cleaner environment.
• Executive Order 12630 (Taking of Private Property). The FHWA has analyzed this final rule under Executive Order 12630, Governmental Actions and Interference with Constitutionally Protected Property Rights. The FHWA does not anticipate that this action will affect a taking of private property or otherwise have taking implications under Executive Order 12630.
• Executive Order 12988 (Civil Justice Reform). This action meets applicable standards in sections 3(a) and 3(b)(2) of Executive Order 12988, Civil Justice Reform, to minimize litigation, eliminate ambiguity, and reduce burden.
• Executive Order 13045 (Protection of Children). The FHWA has analyzed this action under Executive Order 13045, Protection of Children from Environmental Health Risks and Safety Risks. The FHWA certifies that this action will not cause an environmental risk to health or safety that may disproportionately affect children.
• Regulation Identification Number. A regulation identification number (RIN) is assigned to each regulatory action listed in the Unified Agenda of Federal Regulations. The Regulatory Information Service Center publishes the Unified Agenda in April and October of each year. The RIN contained in the heading of this document can be used to cross reference this action with the Unified Agenda.
LIST OF SUBJECTS IN 23 CFR PART 630
Government contracts, Grant programs--transportation, Highway safety, Highways and roads, Incorporation by reference, Project agreement, Traffic regulations.
Issued on: September 1, 2004. Mary E. Peters, Federal Highway Administrator.
In consideration of the foregoing, the FHWA amends title 23, Code of Federal Regulations, Part 630, as follows:
PART 630 ⎯ PRECONSTRUCTION PROCEDURES
1. The authority citation for part 630 continues to read as follows: Authority: 23 U.S.C. 106, 109, 115, 315, 320, and 402(a); 23 CFR 1.32; and 49 CFR 1.48(b).
Marketing Plan Making Work Zones Work Better A-20
2. Revise subpart J of part 630 to read as follows: Subpart J--Work Zone Safety and Mobility Sec. 630.1002 Purpose.
630.1004 Definitions and explanation of terms.
630.1006 Workzone safety and mobility policy.
630.1008 State-level processes and procedures.
630.1010 Significant projects.
630.1012 Project-level procedures.
630.1014 Implementation.
630.1016 Compliance date.
Sec. 630.1002 Purpose. Work zones directly impact the safety and mobility of road users and highway workers. These safety and mobility impacts are exacerbated by an aging highway infrastructure and growing congestion in many locations. Addressing these safety and mobility issues requires considerations that start early in project development and continue through project completion. Part 6 of the Manual On Uniform Traffic Control Devices (MUTCD) \1\ sets forth basic principles and prescribes standards for the design, application, installation, and maintenance of traffic control devices for highway and street construction, maintenance operation, and utility work. In addition to the provisions in the MUTCD, there are other actions that could be taken to further help mitigate the safety and mobility impacts of work zones. This subpart establishes requirements and provides guidance for systematically addressing the safety and mobility impacts of work zones, and developing strategies to help manage these impacts on all Federal-aid highway projects.
\1\ The MUTCD is approved by the FHWA and recognized as the national standard for traffic control on all public roads. It is incorporated by reference into the Code of Federal Regulations at 23 CFR part 655. It is available on the FHWA's Web site at mutcd.fhwa.dot.gov and is available for inspection and copying at the FHWA Washington, DC Headquarters and all FHWA Division Offices as prescribed at 49 CFR part 7.
Sec. 630.1004 Definitions and explanation of terms. As used in this subpart:
• Highway workers include, but are not limited to, personnel of the contractor, subcontractor, DOT, utilities, and law enforcement, performing work within the right-of-way of a transportation facility. Mobility is the ability to move from place to place and is significantly dependent on the availability of transportation facilities and on system operating conditions. With specific reference to work zones, mobility pertains to moving road users efficiently through or around a work zone area with a minimum delay compared to baseline travel when no work zone is present, while not compromising the safety of highway workers or road users. The commonly used performance measures for the assessment of mobility include delay, speed, travel time and queue lengths.
Marketing Plan Making Work Zones Work Better A-21
• Safety is a representation of the level of exposure to potential hazards for users of transportation facilities and highway workers. With specific reference to work zones, safety refers to minimizing potential hazards to road users in the vicinity of a work zone and highway workers at the work zone interface with traffic. The commonly used measures for highway safety are the number of crashes or the consequences of crashes (fatalities and injuries) at a given location or along a section of highway during a period of time. Highway worker safety in work zones refers to the safety of workers at the work zone interface with traffic and the impacts of the work zone design on worker safety. The number of worker fatalities and injuries at a given location or along a section of highway, during a period of time are commonly used measures for highway worker safety.
• Work zone \2\ is an area of a highway with construction, maintenance, or utility work activities. A work zone is typically marked by signs, channelizing devices, barriers, pavement markings, and/or work vehicles. It extends from the first warning sign or high-intensity rotating, flashing, oscillating, or strobe lights on a vehicle to the END ROAD WORK sign or the last temporary traffic control (TTC) device.
\2\ MUTCD, Part 6, ``Temporary Traffic Control,'' Section 6C.02, ``Temporary Traffic Control Zones.''
• Work zone crash \3\ means a traffic crash in which the first harmful event occurs within the boundaries of a work zone or on an approach to or exit from a work zone, resulting from an activity, behavior, or control related to the movement of the traffic units through the work zone. This includes crashes occurring on approach to, exiting from or adjacent to work zones that are related to the work zone.
\3\ ``Model Minimum Uniform Crash Criteria Guideline'' (MMUCC), 2d Ed. (Electronic), 2003, produced by National Center for Statistics and Analysis, National Highway Traffic Safety Administration (NHTSA). Telephone 1-(800)-934-8517. Available at the URL: www-nrd.nhtsa.dot.gov. The NHTSA, the FHWA, the Federal Motor Carrier Safety Administration (FMCSA), and the Governors Highway Safety Association (GHSA) sponsored the development of the MMUCC Guideline which recommends voluntary implementation of the 111 MMUCC data elements and serves as a reporting threshold that includes all persons (injured and uninjured) in crashes statewide involving death, personal injury, or property damage of $1,000 or more. The Guideline is a tool to strengthen existing State crash data systems.
(a) Work zone impacts refer to work zone-induced deviations from the normal range of transportation system safety and mobility. The extent of the work zone impacts may vary based on factors such as, road classification, area type (urban, suburban, and rural), traffic and travel characteristics, type of work being performed, time of day/night, and complexity of the project. These impacts may extend beyond the physical location of the work zone itself, and may occur on the roadway on which the work is being performed, as well as other highway corridors, other modes of transportation, and/or the regional transportation network.
Marketing Plan Making Work Zones Work Better A-22
Sec. 630.1006 Work zone safety and mobility policy.
(b) Each State shall implement a policy for the systematic consideration and management of work zone impacts on all Federal-aid highway projects. This policy shall address work zone impacts throughout the various stages of the project development and implementation process. This policy may take the form of processes, procedures, and/or guidance, and may vary based on the characteristics and expected work zone impacts of individual projects or classes of projects. The States should institute this policy using a multi-disciplinary team and in partnership with the FHWA. The States are encouraged to implement this policy for non-Federal-aid projects as well.
Sec. 630.1008 State-level processes and procedures.
(a) This section consists of State-level processes and procedures for States to implement and sustain their respective work zone safety and mobility policies. State-level processes and procedures, data and information resources, training, and periodic evaluation enable a systematic approach for addressing and managing the safety and mobility impacts of work zones.
(b) Work zone assessment and management procedures. States should develop and implement systematic procedures to assess work zone impacts in project development, and to manage safety and mobility during project implementation. The scope of these procedures shall be based on the project characteristics.
(c) Work zone data. States shall use field observations, available work zone crash data, and operational information to manage work zone impacts for specific projects during implementation. States shall continually pursue improvement of work zone safety and mobility by analyzing work zone crash and operational data from multiple projects to improve State processes and procedures. States should maintain elements of the data and information resources that are necessary to support these activities.
(d) Training. States shall require that personnel involved in the development, design, implementation, operation, inspection, and enforcement of work zone related transportation management and traffic control be trained, appropriate to the job decisions each individual is required to make. States shall require periodic training updates that reflect changing industry practices and State processes and procedures.
(e) Process review. In order to assess the effectiveness of work zone safety and mobility procedures, the States shall perform a process review at least every two years. This review may include the evaluation of work zone data at the State level, and/or review of randomly selected projects throughout their jurisdictions. Appropriate personnel who represent the project development stages and the different offices within the State, and the FHWA should participate in this review. Other non-State stakeholders may also be included in this review, as appropriate. The results of the review are intended to lead to improvements in work zone processes and procedures, data and information resources, and
Marketing Plan Making Work Zones Work Better A-23
training programs so as to enhance efforts to address safety and mobility on current and future projects.
Sec. 630.1010 Significant projects.
(a) A significant project is one that, alone or in combination with other concurrent projects nearby is anticipated to cause sustained work zone impacts (as defined in Sec. 630.1004) that are greater than what is considered tolerable based on State policy and/or engineering judgment.
(b) The applicability of the provisions in Sec. Sec. 630.1012(b)(2) and 630.1012(b)(3) is dependent upon whether a project is determined to be significant. The State shall identify upcoming projects that are expected to be significant. This identification of significant projects should be done as early as possible in the project delivery and development process, and in cooperation with the FHWA. The State's work zone policy provisions, the project's characteristics, and the magnitude and extent of the anticipated work zone impacts should be considered when determining if a project is significant or not.
(c) All Interstate system projects within the boundaries of a designated Transportation Management Area (TMA) that occupy a location for more than three days with either intermittent or continuous lane closures shall be considered as significant projects.
(d) For an Interstate system project or categories of Interstate system projects that are classified as significant through the application of the provisions in Sec. 630.1010(c), but in the judgment of the State they do not cause sustained work zone impacts, the State may request from the FHWA, an exception to Sec. Sec. 630.1012(b)(2) and 630.1012(b)(3). Exceptions to these provisions may be granted by the FHWA based on the State's ability to show that the specific Interstate system project or categories of Interstate system projects do not have sustained work zone impacts.
Sec. 630.1012 Project-level procedures.
(a) This section provides guidance and establishes procedures for States to manage the work zone impacts of individual projects.
(b) Transportation Management Plan (TMP). A TMP consists of strategies to manage the work zone impacts of a project. Its scope, content, and degree of detail may vary based upon the State's work zone policy, and the State's understanding of the expected work zone impacts of the project. For significant projects (as defined in Sec. 630.1010), the State shall develop a TMP that consists of a Temporary Traffic Control (TTC) plan and addresses both Transportation Operations (TO) and Public Information (PI) components. For individual projects or classes of projects that the State determines to have less than significant work zone impacts, the TMP may consist only of a TTC plan. States are encouraged to consider TO and PI issues for all projects.
Marketing Plan Making Work Zones Work Better A-24
1) A TTC plan describes TTC measures to be used for facilitating road users through a work zone or an incident area. The TTC plan plays a vital role in providing continuity of reasonably safe and efficient road user flow and highway worker safety when a work zone, incident, or other event temporarily disrupts normal road user flow. The TTC plan shall be consistent with the provisions under Part 6 of the MUTCD and with the work zone hardware recommendations in Chapter 9 of the American Association of State Highway and Transportation Officials (AASHTO) Roadside Design Guide. Chapter 9 of the AASHTO Roadside Design Guide: ``Traffic Barriers, Traffic Control Devices, and Other Safety Features for Work Zones'' 2002, is incorporated by reference in accordance with 5 U.S.C. 552(a) and 1 CFR part 51 and is on file at the National Archives and Record Administration (NARA). For information on the availability of this material at NARA call (202) 741-6030, or go to www.archives.gov/federal_register/code_of_federal_regulations/ibr_locations.html.
The entire document is available for purchase from the American Association of State Highway and Transportation Officials (AASHTO), 444 North Capitol Street, NW., Suite 249, Washington, DC 20001 or at the URL: www.aashto.org/bookstore.It is available for inspection from the FHWA Washington Headquarters and all Division Offices as listed in 49 CFR Part 7. In developing and implementing the TTC plan, pre-existing roadside safety hardware shall be maintained at an equivalent or better level than existed prior to project implementation. The scope of the TTC plan is determined by the project characteristics, and the traffic safety and control requirements identified by the State for that project. The TTC plan shall either be a reference to specific TTC elements in the MUTCD, approved standard TTC plans, State transportation department TTC manual, or be designed specifically for the project.
2) The TO component of the TMP shall include the identification of strategies that will be used to mitigate impacts of the work zone on the operation and management of the transportation system within the work zone impact area. Typical TO strategies may include, but are not limited to, demand management, corridor/network management, safety management and enforcement, and work zone traffic management. The scope of the TO component should be determined by the project characteristics, and the transportation operations and safety strategies identified by the State.
(a) The PI component of the TMP shall include communications strategies that seek to inform affected road users, the general public, area residences and businesses, and appropriate public entities about the project, the expected work zone impacts, and the changing conditions on the project. This may include traveler information strategies. The scope of the PI component should be determined by the project characteristics and the public information and outreach strategies identified by the State. Public information should be provided through methods best suited for the project, and may include, but not
Marketing Plan Making Work Zones Work Better A-25
be limited to, information on the project characteristics, expected impacts, closure details, and commuter alternatives.
(b) States should develop and implement the TMP in sustained consultation with stakeholders (e.g., other transportation agencies, railroad agencies/operators, transit providers, freight movers, utility suppliers, police, fire, emergency medical services, schools, business communities, and regional transportation management centers).
(c) The Plans, Specifications, and Estimates (PS&Es) shall include either a TMP or provisions for contractors to develop a TMP at the most appropriate project phase as applicable to the State's chosen contracting methodology for the project. A contractor developed TMP shall be subject to the approval of the State, and shall not be implemented before it is approved by the State.
(d) The PS&Es shall include appropriate pay item provisions for implementing the TMP, either through method or performance based specifications.
1) For method-based specifications individual pay items, lump sum payment, or a combination thereof may be used.
2) For performance based specifications, applicable performance criteria and standards may be used (e.g., safety performance criteria such as number of crashes within the work zone; mobility performance criteria such as travel time through the work zone, delay, queue length, traffic volume; incident response and clearance criteria; work duration criteria).
(e) Responsible persons. The State and the contractor shall each designate a trained person, as specified in Sec. 630.1008(d), at the project level who has the primary responsibility and sufficient authority for implementing the TMP and other safety and mobility aspects of the project.
Sec. 630.1014 Implementation.
Each State shall work in partnership with the FHWA in the implementation of its policies and procedures to improve work zone safety and mobility. At a minimum, this shall involve an FHWA review of conformance of the State's policies and procedures with this regulation and reassessment of the State's implementation of its procedures at appropriate intervals. Each State is encouraged to address implementation of this regulation in its stewardship agreement with the FHWA.
Sec. 630.1016 Compliance Date.
States shall comply with all the provisions of this rule no later than October 12, 2007. For projects that are in the later stages of development at or about the compliance date, and if it is determined that the delivery of those projects would be significantly impacted as a result of this rule's provisions, States may request variances for those projects from the FHWA, on a project-by-project basis.
[FR Doc. 04-20340 Filed 9-8-04; 8:45 am] BILLING CODE 4910-22
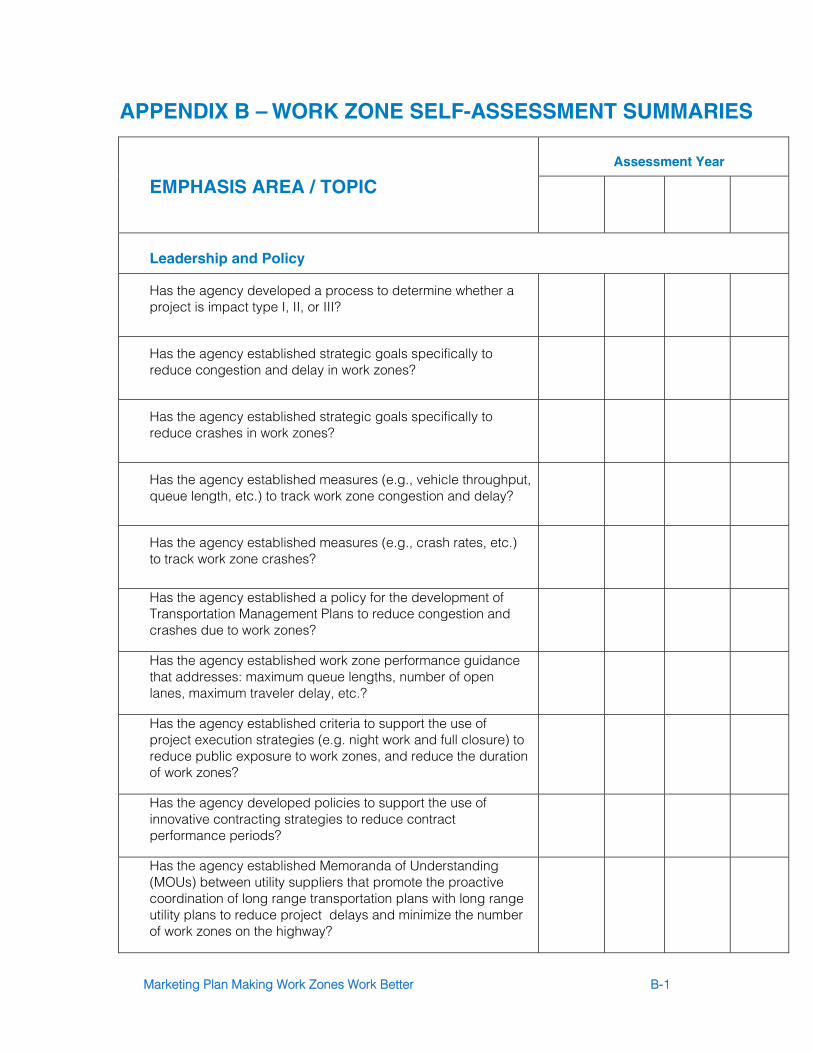
Marketing Plan Making Work Zones Work Better B-1
APPENDIX B – WORK ZONE SELF-ASSESSMENT SUMMARIES
EMPHASIS AREA / TOPIC Assessment Year
Leadership and Policy
Has the agency developed a process to determine whether a project is impact type I, II, or III?
Has the agency established strategic goals specifically to reduce congestion and delay in work zones?
Has the agency established strategic goals specifically to reduce crashes in work zones?
Has the agency established measures (e.g., vehicle throughput, queue length, etc.) to track work zone congestion and delay?
Has the agency established measures (e.g., crash rates, etc.) to track work zone crashes?
Has the agency established a policy for the development of Transportation Management Plans to reduce congestion and crashes due to work zones?
Has the agency established work zone performance guidance that addresses: maximum queue lengths, number of open lanes, maximum traveler delay, etc.?
Has the agency established criteria to support the use of project execution strategies (e.g. night work and full closure) to reduce public exposure to work zones, and reduce the duration of work zones?
Has the agency developed policies to support the use of innovative contracting strategies to reduce contract performance periods?
Has the agency established Memoranda of Understanding (MOUs) between utility suppliers that promote the proactive coordination of long range transportation plans with long range utility plans to reduce project delays and minimize the number of work zones on the highway?
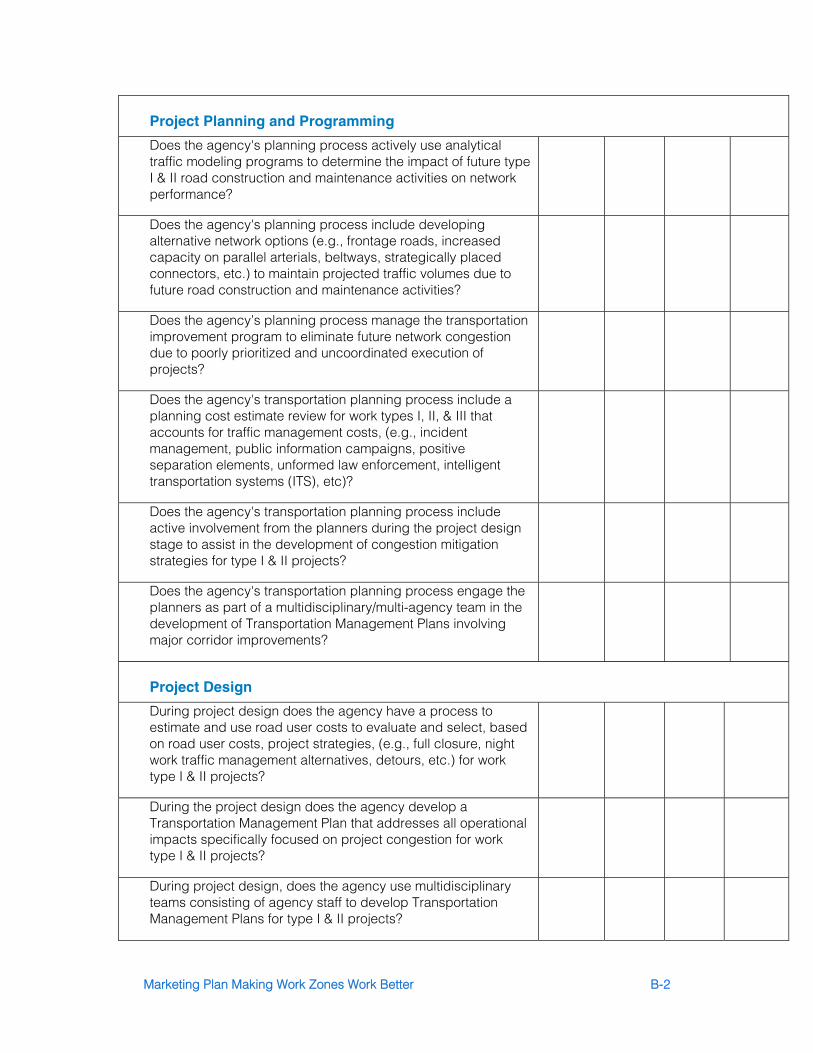
Marketing Plan Making Work Zones Work Better B-2
Project Planning and Programming
Does the agency's planning process actively use analytical traffic modeling programs to determine the impact of future type I & II road construction and maintenance activities on network performance?
Does the agency's planning process include developing alternative network options (e.g., frontage roads, increased capacity on parallel arterials, beltways, strategically placed connectors, etc.) to maintain projected traffic volumes due to future road construction and maintenance activities?
Does the agency’s planning process manage the transportation improvement program to eliminate future network congestion due to poorly prioritized and uncoordinated execution of projects?
Does the agency's transportation planning process include a planning cost estimate review for work types I, II, & III that accounts for traffic management costs, (e.g., incident management, public information campaigns, positive separation elements, unformed law enforcement, intelligent transportation systems (ITS), etc)?
Does the agency's transportation planning process include active involvement from the planners during the project design stage to assist in the development of congestion mitigation strategies for type I & II projects?
Does the agency's transportation planning process engage the planners as part of a multidisciplinary/multi-agency team in the development of Transportation Management Plans involving major corridor improvements?
Project Design
During project design does the agency have a process to estimate and use road user costs to evaluate and select, based on road user costs, project strategies, (e.g., full closure, night work traffic management alternatives, detours, etc.) for work type I & II projects?
During the project design does the agency develop a Transportation Management Plan that addresses all operational impacts specifically focused on project congestion for work type I & II projects?
During project design, does the agency use multidisciplinary teams consisting of agency staff to develop Transportation Management Plans for type I & II projects?
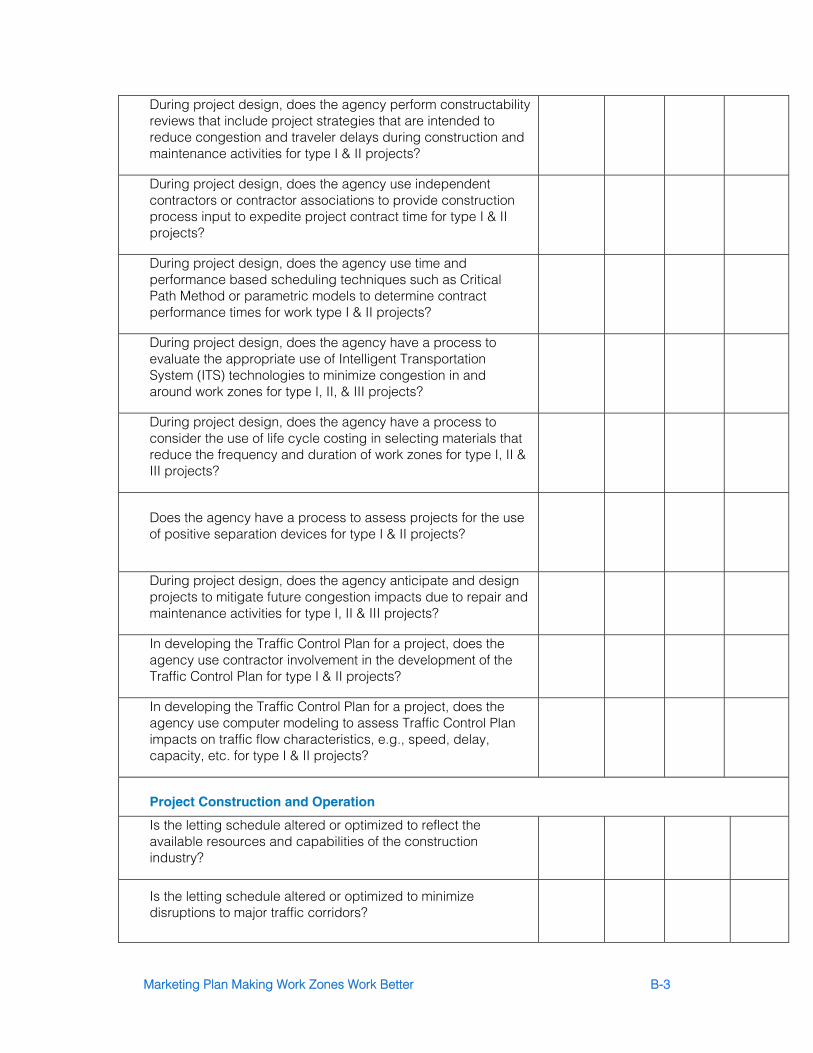
Marketing Plan Making Work Zones Work Better B-3
During project design, does the agency perform constructability reviews that include project strategies that are intended to reduce congestion and traveler delays during construction and maintenance activities for type I & II projects?
During project design, does the agency use independent contractors or contractor associations to provide construction process input to expedite project contract time for type I & II projects?
During project design, does the agency use time and performance based scheduling techniques such as Critical Path Method or parametric models to determine contract performance times for work type I & II projects?
During project design, does the agency have a process to evaluate the appropriate use of Intelligent Transportation System (ITS) technologies to minimize congestion in and around work zones for type I, II, & III projects?
During project design, does the agency have a process to consider the use of life cycle costing in selecting materials that reduce the frequency and duration of work zones for type I, II & III projects?
Does the agency have a process to assess projects for the use of positive separation devices for type I & II projects?
During project design, does the agency anticipate and design projects to mitigate future congestion impacts due to repair and maintenance activities for type I, II & III projects?
In developing the Traffic Control Plan for a project, does the agency use contractor involvement in the development of the Traffic Control Plan for type I & II projects?
In developing the Traffic Control Plan for a project, does the agency use computer modeling to assess Traffic Control Plan impacts on traffic flow characteristics, e.g., speed, delay, capacity, etc. for type I & II projects?
Project Construction and Operation
Is the letting schedule altered or optimized to reflect the available resources and capabilities of the construction industry?
Is the letting schedule altered or optimized to minimize disruptions to major traffic corridors?
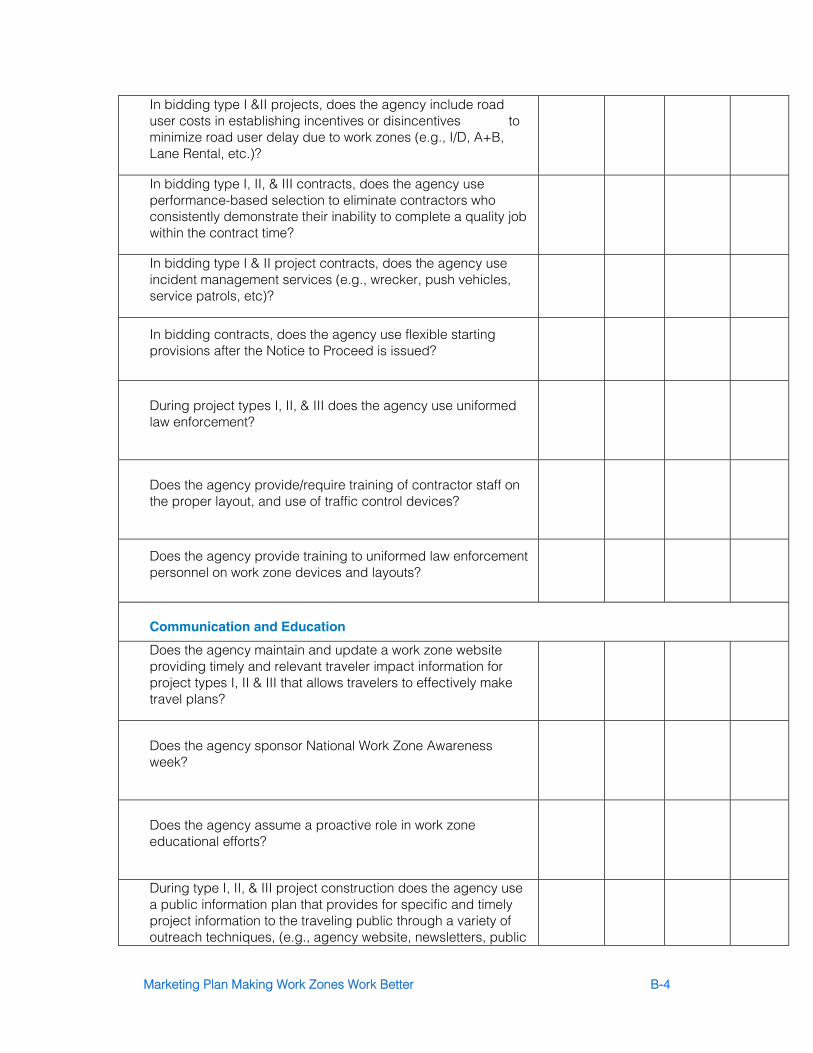
Marketing Plan Making Work Zones Work Better B-4
In bidding type I &II projects, does the agency include road user costs in establishing incentives or disincentives to minimize road user delay due to work zones (e.g., I/D, A+B, Lane Rental, etc.)?
In bidding type I, II, & III contracts, does the agency use performance-based selection to eliminate contractors who consistently demonstrate their inability to complete a quality job within the contract time?
In bidding type I & II project contracts, does the agency use incident management services (e.g., wrecker, push vehicles, service patrols, etc)?
In bidding contracts, does the agency use flexible starting provisions after the Notice to Proceed is issued?
During project types I, II, & III does the agency use uniformed law enforcement?
Does the agency provide/require training of contractor staff on the proper layout, and use of traffic control devices?
Does the agency provide training to uniformed law enforcement personnel on work zone devices and layouts?
Communication and Education
Does the agency maintain and update a work zone website providing timely and relevant traveler impact information for project types I, II & III that allows travelers to effectively make travel plans?
Does the agency sponsor National Work Zone Awareness week?
Does the agency assume a proactive role in work zone educational efforts?
During type I, II, & III project construction does the agency use a public information plan that provides for specific and timely project information to the traveling public through a variety of outreach techniques, (e.g., agency website, newsletters, public
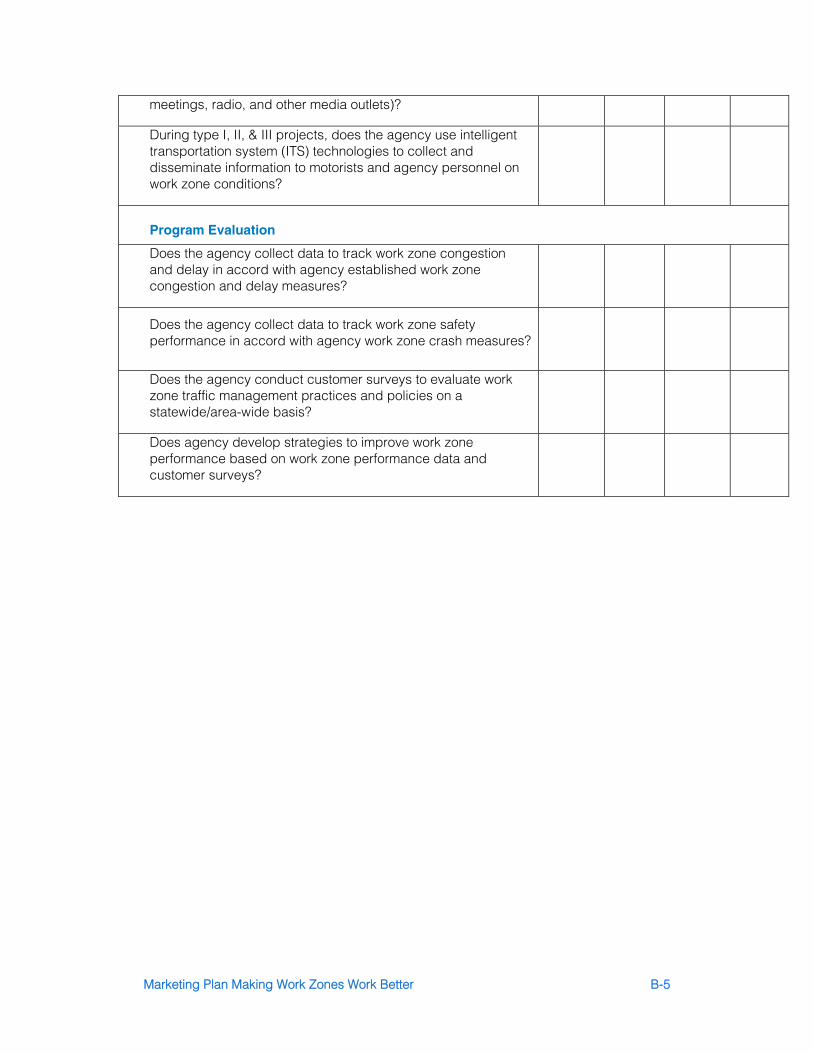
Marketing Plan Making Work Zones Work Better B-5
meetings, radio, and other media outlets)?
During type I, II, & III projects, does the agency use intelligent transportation system (ITS) technologies to collect and disseminate information to motorists and agency personnel on work zone conditions?
Program Evaluation
Does the agency collect data to track work zone congestion and delay in accord with agency established work zone congestion and delay measures?
Does the agency collect data to track work zone safety performance in accord with agency work zone crash measures?
Does the agency conduct customer surveys to evaluate work zone traffic management practices and policies on a statewide/area-wide basis?
Does agency develop strategies to improve work zone performance based on work zone performance data and customer surveys?

Marketing Plan Making Work Zones Work Better
U.S. Department of Transportation
Federal Highway Administration
Highways for LIFE
1200 New Jersey Ave, SE
Washington, DC 20590
www.fhwa.dot.gov/hfl
Phone 202.366.5508

Guide to Creating an Effective Marketing Plan 15
Guide to Creating an Effective Marketing Plan 16
U.S. Department of Transportation
Federal Highway Administration
Highways for LIFE
1200 New Jersey Ave, SE
Washington, DC 20590
www.fhwa.dot.gov/hfl
Phone 202.366.5508