Embed Size (px)
Citation preview

Progress 8 and Attainment 8 measure in 2016, 2017, and 2018 Guide for maintained secondary schools, academies and free schools
October 2016
2
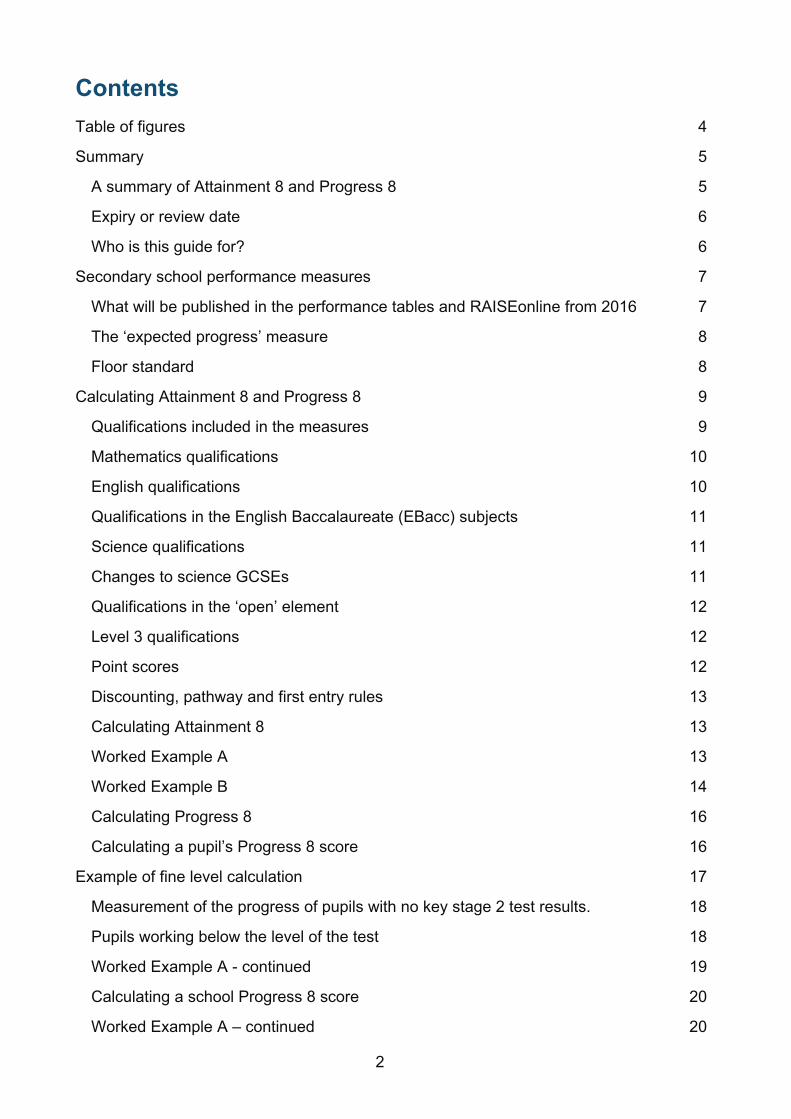
Contents Table of figures 4
Summary 5
A summary of Attainment 8 and Progress 8 5
Expiry or review date 6
Who is this guide for? 6
Secondary school performance measures 7
What will be published in the performance tables and RAISEonline from 2016 7
The ‘expected progress’ measure 8
Floor standard 8
Calculating Attainment 8 and Progress 8 9
Qualifications included in the measures 9
Mathematics qualifications 10
English qualifications 10
Qualifications in the English Baccalaureate (EBacc) subjects 11
Science qualifications 11
Changes to science GCSEs 11
Qualifications in the ‘open’ element 12
Level 3 qualifications 12
Point scores 12
Discounting, pathway and first entry rules 13
Calculating Attainment 8 13
Worked Example A 13
Worked Example B 14
Calculating Progress 8 16
Calculating a pupil’s Progress 8 score 16
Example of fine level calculation 17
Measurement of the progress of pupils with no key stage 2 test results. 18
Pupils working below the level of the test 18
Worked Example A - continued 19
Calculating a school Progress 8 score 20
Worked Example A – continued 20
3
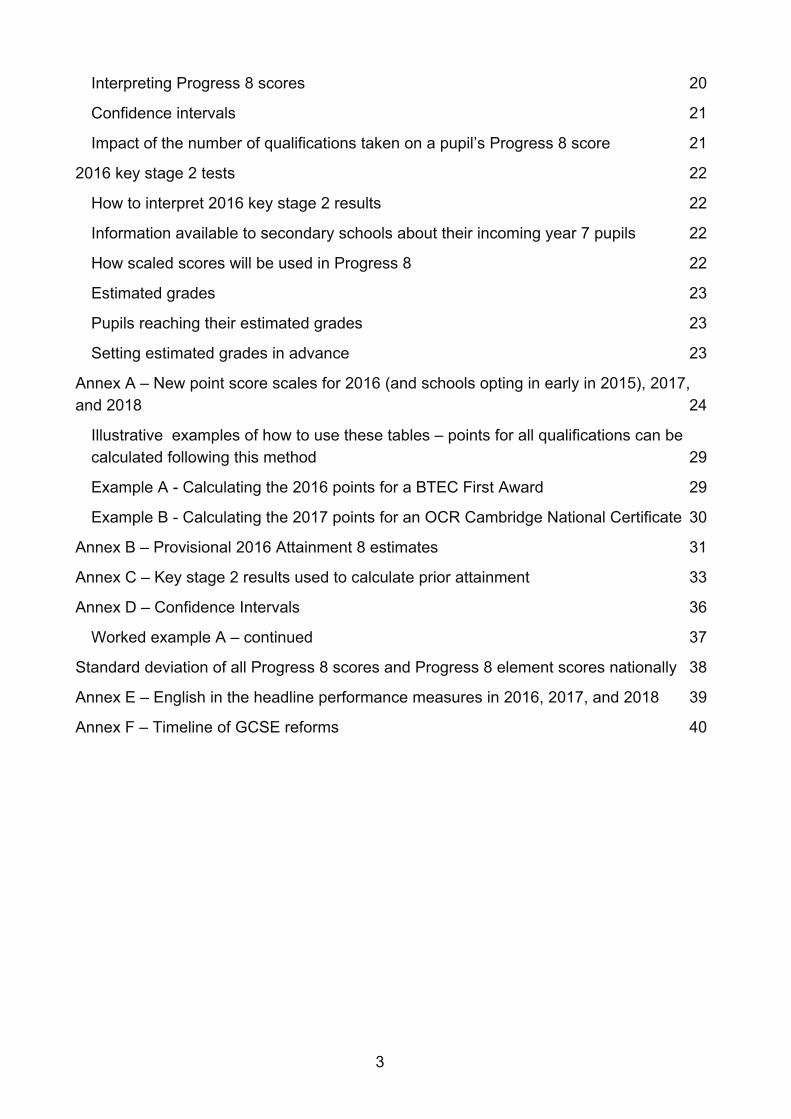
Interpreting Progress 8 scores 20
Confidence intervals 21
Impact of the number of qualifications taken on a pupil’s Progress 8 score 21
2016 key stage 2 tests 22
How to interpret 2016 key stage 2 results 22
Information available to secondary schools about their incoming year 7 pupils 22
How scaled scores will be used in Progress 8 22
Estimated grades 23
Pupils reaching their estimated grades 23
Setting estimated grades in advance 23
Annex A – New point score scales for 2016 (and schools opting in early in 2015), 2017, and 2018 24
Illustrative examples of how to use these tables – points for all qualifications can be calculated following this method 29
Example A - Calculating the 2016 points for a BTEC First Award 29
Example B - Calculating the 2017 points for an OCR Cambridge National Certificate 30
Annex B – Provisional 2016 Attainment 8 estimates 31
Annex C – Key stage 2 results used to calculate prior attainment 33
Annex D – Confidence Intervals 36
Worked example A – continued 37
Standard deviation of all Progress 8 scores and Progress 8 element scores nationally 38
Annex E – English in the headline performance measures in 2016, 2017, and 2018 39
Annex F – Timeline of GCSE reforms 40
4
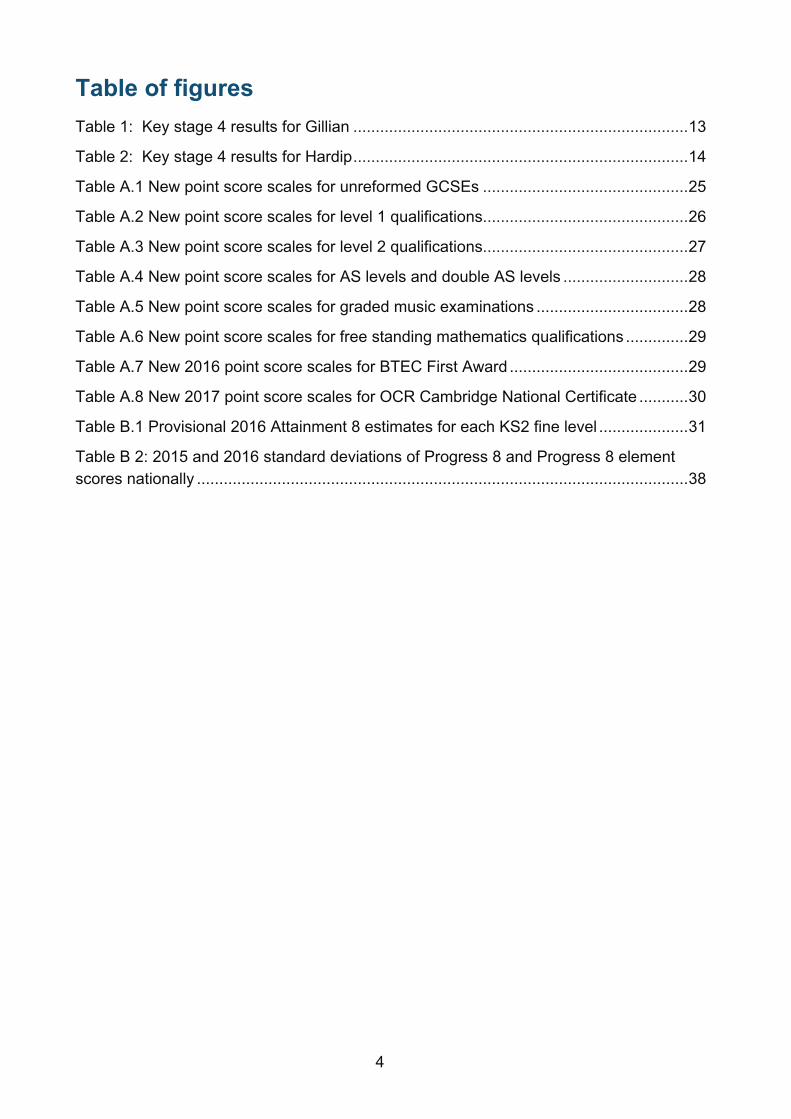
Table of figures Table 1: Key stage 4 results for Gillian ........................................................................... 13
Table 2: Key stage 4 results for Hardip ........................................................................... 14
Table A.1 New point score scales for unreformed GCSEs .............................................. 25
Table A.2 New point score scales for level 1 qualifications.............................................. 26
Table A.3 New point score scales for level 2 qualifications.............................................. 27
Table A.4 New point score scales for AS levels and double AS levels ............................ 28
Table A.5 New point score scales for graded music examinations .................................. 28
Table A.6 New point score scales for free standing mathematics qualifications .............. 29
Table A.7 New 2016 point score scales for BTEC First Award ........................................ 29
Table A.8 New 2017 point score scales for OCR Cambridge National Certificate ........... 30
Table B.1 Provisional 2016 Attainment 8 estimates for each KS2 fine level .................... 31
Table B 2: 2015 and 2016 standard deviations of Progress 8 and Progress 8 element scores nationally .............................................................................................................. 38
5
Summary In October 2013, we announced that a new secondary school accountability system will be implemented from 2016. It will include two new headline measures, Attainment 8 and Progress 8. This document explains how these measures will be calculated in 2016 (and have been calculated in 2015 for schools that chose to adopt the new measures a year early). It also includes changes that will apply in 2017 and 2018.
Schools had the option to adopt the new performance measures a year early in 2015. A list of these early opt-in schools is available on gov.uk www.gov.uk/government/publications/progress-8-school-performance-measure-early-opt-in-schools.
A summary of Attainment 8 and Progress 8 Progress 8 aims to capture the progress a pupil makes from the end of primary school to the end of secondary school. It is a type of value added measure, which means that pupils’ results are compared to the actual achievements of other pupils with the same prior attainment.
The new performance measures are designed to encourage schools to offer a broad and balanced curriculum with a focus on an academic core at key stage 4, and reward schools for the teaching of all their pupils, measuring performance across 8 qualifications. Every increase in every grade a pupil achieves will attract additional points in the performance tables.
Progress 8 will be calculated for individual pupils solely in order to calculate a school’s Progress 8 score, and there will be no need for schools to share individual Progress 8 scores with their pupils. Schools should continue to focus on which qualifications are most suitable for individual pupils, as the grades pupils achieve will help them reach their goals for the next stage of their education or training.
Attainment 8 will measure the achievement of a pupil across 8 qualifications including mathematics (double weighted) and English (double weighted), 3 further qualifications that count in the English Baccalaureate (EBacc) measure and 3 further qualifications that can be GCSE qualifications (including EBacc subjects) or any other non-GCSE qualifications on the DfE approved list. The details of how qualifications are included in the measure are set out on pages 9-13 of this document.
The Attainment 8 and Progress 8 calculations are described on pages 13-20.
A Progress 8 score will be calculated for each pupil by comparing their achievement –their Attainment 8 score – with the average Attainment 8 score of all pupils nationally who had a similar starting point (or ‘prior attainment’), calculated using assessment results from the end of primary school. The greater the Progress 8 score, the greater the progress made by the pupil compared to the average of pupils with similar prior
6
attainment. More information about the results used to calculate prior attainment is included on pages 16-18.
A school’s Progress 8 score will be calculated as the average of its pupils’ Progress 8 scores. It will give an indication of whether, as a group, pupils in the school made above or below average progress compared to similar pupils in other schools.
Attainment 8 and Progress 8 scores have been published in the 2015 performance tables for schools that have adopted the new performance measures a year early. We have provided schools that have not opted in early with Attainment 8 and Progress 8 data based on 2015 results to help them plan for the implementation of Progress 8 in 2016. We are not publishing this information for schools that have not opted in early as it reflects curriculum decisions that schools made before Progress 8 was announced and we do not want schools to be judged on a measure which they were not aware of when pupils started their courses.
Expiry or review date This guide will next be reviewed before March 2017. It combines and updates the previously published documents on Progress 8:
• Progress 8 school performance measure: Information for school leaders and governing bodies of maintained schools, academies and free schools
• Progress 8 measure in 2016: Technical guide for maintained secondary schools, academies, free schools and FE colleges with 14 to 16 provision
Who is this guide for? This guide is for:
• School leaders, school staff and governing bodies in all maintained schools, including special schools, academies and free schools
• Independent schools seeking information on Attainment 8
• Local authorities
7
Secondary school performance measures From 2016, the headline indicator of school performance determining the floor standard will be Progress 8.
What will be published in the performance tables and RAISEonline from 2016 The headline measures which will appear in the performance tables will be:
• Progress across 8 qualifications
• Attainment across the same 8 qualifications
• Percentage of pupils achieving the threshold in English and mathematics (currently a C grade, grade 5 when new GCSEs in English and mathematics are first reported in performance tables in 2017)
• Percentage of pupils entering the English Baccalaureate
• Percentage of pupils achieving the English Baccalaureate
• Percentage of students staying in education or employment after key stage 4 (destinations)
Further details about what will be published in the performance tables are detailed in the Statement of Intent published each year on the DfE School and college performance tables’ website.
Attainment 8 scores, including element breakdowns, will be published for all schools for which data are published in the performance tables. Progress 8 and the element breakdowns will be published for all secondary schools for which data are published in the performance tables, apart from independent schools and independent special schools.
As usual, suppression will be applied so we do not disclose the results of small numbers of pupils. The Attainment 8 and Progress 8 scores will be suppressed if the school has five or fewer pupils included in the measure, and the Progress 8 score will be suppressed if less than 50% of pupils at the end of key stage 4 are included in the measure.
For the schools that opted in a year early in 2015 the new headline measures were published in the performance tables and in RAISEonline alongside current performance measures information.
8
The ‘expected progress’ measure The current ‘expected progress’ measure will no longer appear in performance tables from 2016. The system of levels that underpins this measure has been removed, and so this measure is being phased out.
Floor standard The floor standard for a school is the minimum standard for pupil achievement and/or progress that the Government expects schools to meet.
Floor standards do not apply to special schools, independent schools, pupil referral units, alternative provision or hospital schools. Schools will be excluded from a Progress 8 floor standard in a particular year where they have fewer than 6 pupils at the end of key stage 4, or where less than 50% of pupils have key stage 2 assessments that can be used as prior attainment in the calculations of Progress 8.
In 2016 (or 2015 for those schools that chose to opt in a year early), a school will be below the floor standard if its Progress 8 score is below -0.5, and the upper band of the 95% confidence interval is below zero. If a school’s performance falls below this floor standard, then the school may come under scrutiny through inspection. Confidence intervals are explained in more detail on page 20-21 and in Annex D.
Schools in which pupils make on average one grade more progress than the national average (a Progress 8 score of +1.0 or above) will be exempt from routine inspections by Ofsted in the calendar year following the publication of the final performance tables.
9
Calculating Attainment 8 and Progress 8
Qualifications included in the measures Progress 8 is based on a calculation of pupils’ performance across 8 qualifications, called Attainment 8. These qualifications are:
1. A double weighted mathematics element that will contain the point score of the pupil’s English Baccalaureate (EBacc) mathematics qualification.
2. An English element based on the highest point score in a pupil’s EBacc English language or English literature qualification. This will be double weighted provided a pupil has taken both qualifications. In 2016 an English (combined) qualification can be included and double weighted.
3. An element which can include the three highest point scores from any of the EBacc qualifications in science subjects, computer science, history, geography, and languages. For more information see the list of qualifications that count in the EBacc. The qualifications can count in any combination and there is no requirement to take qualifications in each of the ‘pillars’ of the EBacc.
4. The remaining element contains the three highest point scores in any three other subjects, including English language or literature (if not counted in the English slot), further GCSE qualifications (including EBacc subjects) or any other non-GCSE qualifications on the DfE approved list. For more information see the list of qualifications that will be included in the 2016 key stage 4 performance tables, 2017 key stage 4 performance tables, and the 2018 key stage 4 performance tables.
If a pupil has not taken the maximum number of qualifications that count in each group then they will receive a point score of zero where a slot is empty.
No unreformed GCSEs (A*-G), International GCSEs or level 1/level 2 certificates in these subjects will count in performance tables once reformed GCSEs in that subject are introduced. For further details see Annex F.
10
Mathematics qualifications This element of Progress 8 is double weighted. Only mathematics qualifications which also count towards the EBacc can count in the mathematics slot. From 2017 only the new reformed GCSEs in mathematics or AS levels in mathematics or further mathematics will count towards the EBacc and in the mathematics slot of Progress 8.
If a pupil takes the mathematics linked pair GCSEs (Methods in Mathematics and Applications of Mathematics) the two results will be added together for the mathematics slot in Progress 8. These qualifications will count in the performance tables for the last time in 2016.
Where a pupil has taken more than one EBacc mathematics qualification (except for the mathematics linked pair GCSEs), qualifications which are not used in the mathematics slot will not count elsewhere in Progress 81.
Approved mathematical type qualifications that do not count towards the EBacc, e.g. GCSE statistics, will be counted in a slot in the ‘open’ element of Progress 8 regardless of whether or not a pupil has also taken an EBacc mathematics qualification.
Level 3 Free Standing Mathematics Qualifications will only count in a slot in the ‘open’ element, and will only count if a pupil has not taken an EBacc mathematics qualification.
English qualifications If a student sits both English language and English literature, the higher grade is double-weighted in the English slot. The lower grade can count in a slot in the ‘open’ element of subjects (not in the EBacc element). The combined English language and literature qualification will be available for the last time in 2016 and will be double-weighted in the Progress 8 measure.
If only GCSE English literature or English language is taken then this qualification will count in the English slot, but will not be double-weighted.
From 2017 only the new reformed GCSEs in English language and English literature, AS English language, AS English literature and AS English language and literature will count towards the EBacc and in the English slot of Progress 8.
An explanation of how English counts towards other headline performance table measures is provided at Annex E.
1 First entry and discounting rules as set out on page 13 still apply
11
Qualifications in the English Baccalaureate (EBacc) subjects Only qualifications that count towards the EBacc measure can be included in the Progress 8 slots reserved for EBacc qualifications.
Mathematics cannot be included in the EBacc element. English literature and English language cannot be included in the EBacc element. The best of these qualifications will count in the ‘English’ slot, and the other can count in the ‘open’ element.
There are no other stipulations about the types of EBacc subjects which can count in the three slots of the EBacc element. Any combination of EBacc subjects can be used to fill these slots, including for example:
• Biology, Chemistry, French; or
• Spanish, French, German; or
• History, Geography, Spanish.
Science qualifications All students have to study some science up to the age of 16. The key stage 4 science curriculum is compulsory in maintained schools, and academies are required to provide a broad and balanced curriculum, including English, mathematics and science, up to the age of 16.
In 2016 and 2017, core and additional science GCSE will take up one slot each in the Progress 8 measure. Core science GCSE alone will take up one slot – a pupil does not have to take additional science for core science to count in Progress 8. Separate GCSEs in biology, chemistry, physics and computer science each take up one slot, and can count in Progress 8 in any combination. The ‘double science’ level 1/level 2 certificates that are offered by some awarding organisations can take up two slots where this represents the highest relevant grades achieved (provided they are recognised for inclusion in performance tables). One grade from this qualification can fill one slot if higher grades are achieved in other qualifications. All these qualifications can count in the EBacc slots in the measure.
Changes to science GCSEs New science GCSEs will be available for teaching from September 2016, with the first examinations in summer 2018. There will be single science GCSEs (biology, chemistry, physics and computer science) and a combined science (double award). GCSE Single science GCSEs in biology, chemistry, physics and computer science will each take up one slot, and can count in Progress 8 in any combination. The combined science (double award) can take up two slots where this represents the highest relevant grades achieved. One grade from this qualification can fill one slot if higher grades are achieved in other qualifications.
12
Qualifications in the ‘open’ element Up to three GCSE qualifications (including EBacc subjects not used to fill the slots in the EBacc element) and/or non-GCSE qualifications from the approved list for the year in question can count towards the three slots in the ‘open’ element in the Progress 8 measure.
From 2017, approved non-GCSE qualifications are those that develop technical and practical skills not usually acquired through general education and are categorised as Technical Awards.
Level 3 qualifications AS levels will count in the appropriate element of the Progress 8 measure for their subject (for example, mathematics AS-levels will count in the mathematics slot, a French AS-level in the ‘EBacc group’, and an Art AS-level in the ‘open’ element). If a GCSE in the same subject has been taken the AS-level will always count in Progress 8 and the GCSE will not count, even if the AS has a lower point score than the GCSE. AS-levels at grades A and B will score higher points in Progress 8 than an A* at GCSE.
Level 3 qualifications not included in the EBacc list can only count in an ‘open’ slot. This includes Free Standing Mathematics qualifications and Asset Languages Ladder qualifications.
Free Standing Mathematics Qualifications will only count in an ‘open’ slot if a pupil has not taken an EBacc mathematics qualification.
Asset Language Ladder qualifications will only count in an ‘open’ slot if the pupil has not taken a GCSE in the same language.
One graded music qualification can count in the ‘open’ element of Progress 8, and can count alongside GCSE music.
Point scores The point score scale for performance table measures in 2016 will change from the current 16-58 scale to a 1-8 point scale, where 1 is equivalent to a grade G GCSE and an increase in one point represents an increase of one GCSE grade up to 8, which is equivalent to an A* GCSE. Different grades in non-GCSE qualifications will also be given a score on this scale.
In 2017, reformed GCSE qualifications in English and mathematics will be included for the first time in the Progress 8 measure. Further reformed GCSEs will be introduced in 2018 and 2019.
These qualifications will have a new grading scale that uses the numbers 1 to 9 to identify levels of performance (as will other reformed GCSEs once they are introduced
13
over the following two years). Points will be allocated to the new GCSEs on a 1-9 point scale corresponding to the new 1 to 9 grades, e.g. a grade 9 will get 9 points in the performance measures.
During this transition period where a combination of reformed and old style GCSEs can count towards performance measures, point scores from old style GCSEs will be mapped onto the 1-9 scale (see Annex A) and the Progress 8 measure calculated on this basis.
The point scores for different types of qualifications in 2016, 2017, and 2018 can be found in Annex A.
When a reformed GCSE is introduced in the performance tables, an early entry to the unreformed GCSE in the same subject will not count in the performance tables.
Discounting, pathway and first entry rules Discounting ensures that, where a pupil has taken two or more qualifications with a significant overlap in content, the performance tables only give credit once for teaching a single course of study.
Rules for first entry in a particular subject will still apply under Progress 8, as will rules for pathways in English, mathematics and science qualifications. Guidance on discounting and pathway rules can be found in the RAISEonline document library.
Calculating Attainment 8
Worked Example A
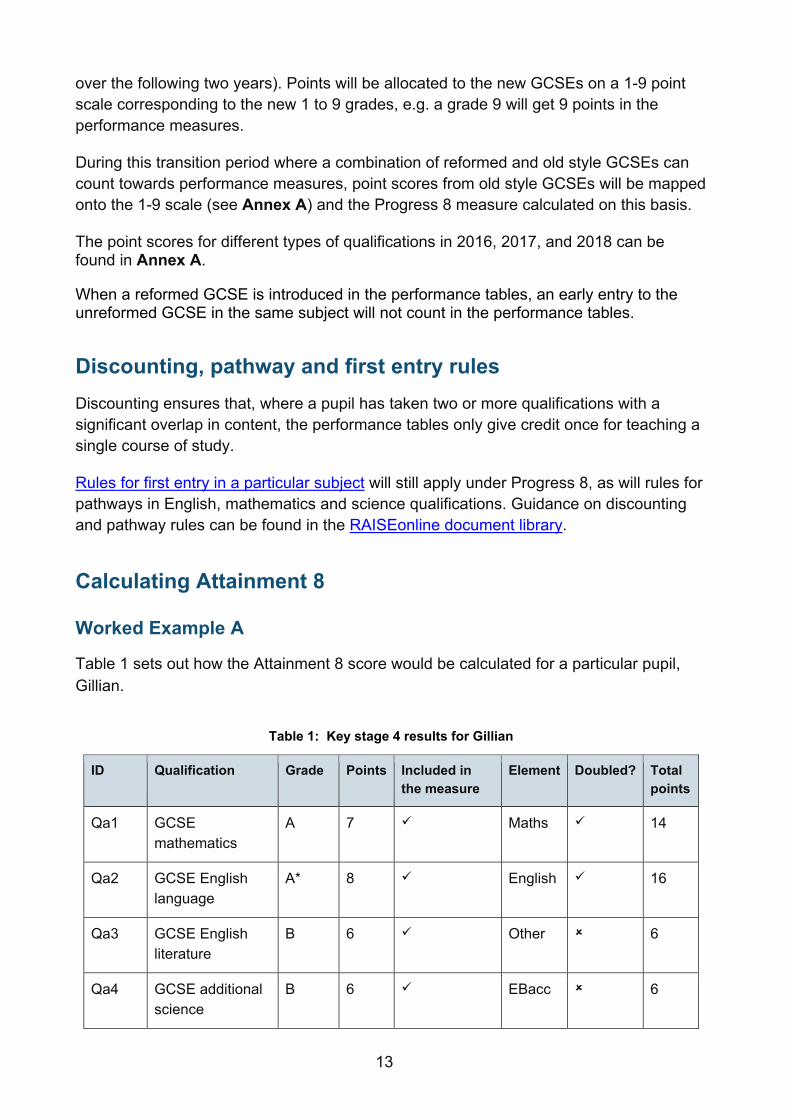
Table 1 sets out how the Attainment 8 score would be calculated for a particular pupil, Gillian.
Table 1: Key stage 4 results for Gillian
ID Qualification Grade Points Included in the measure
Element Doubled? Total points
Qa1 GCSE mathematics
A 7 Maths 14
Qa2 GCSE English language
A* 8 English 16
Qa3 GCSE English literature
B 6 Other 6
Qa4 GCSE additional science
B 6 EBacc 6
14
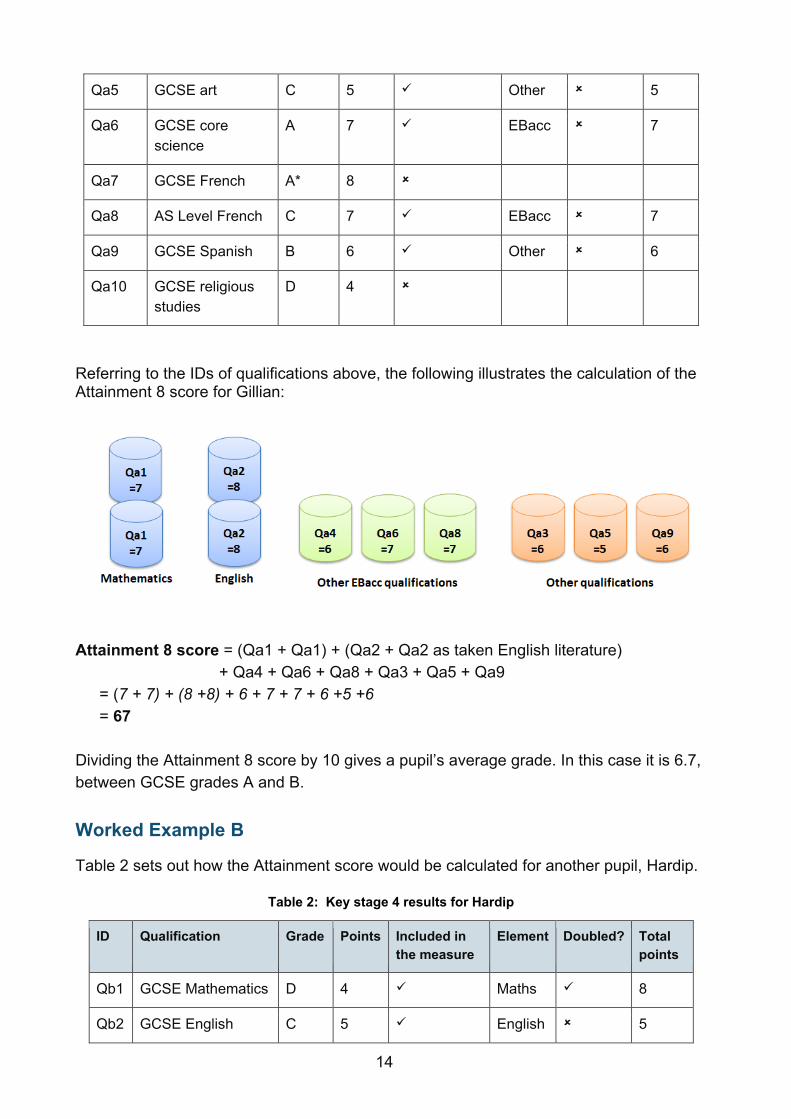
Qa5 GCSE art C 5 Other 5
Qa6 GCSE core science
A 7 EBacc 7
Qa7 GCSE French A* 8
Qa8 AS Level French C 7 EBacc 7
Qa9 GCSE Spanish B 6 Other 6
Qa10 GCSE religious studies
D 4
Referring to the IDs of qualifications above, the following illustrates the calculation of the Attainment 8 score for Gillian:
Attainment 8 score = (Qa1 + Qa1) + (Qa2 + Qa2 as taken English literature)
+ Qa4 + Qa6 + Qa8 + Qa3 + Qa5 + Qa9 = (7 + 7) + (8 +8) + 6 + 7 + 7 + 6 +5 +6 = 67
Dividing the Attainment 8 score by 10 gives a pupil’s average grade. In this case it is 6.7, between GCSE grades A and B.
Worked Example B
Table 2 sets out how the Attainment score would be calculated for another pupil, Hardip.
Table 2: Key stage 4 results for Hardip
ID Qualification Grade Points Included in the measure
Element Doubled? Total points
Qb1 GCSE Mathematics D 4 Maths 8
Qb2 GCSE English C 5 English 5
15
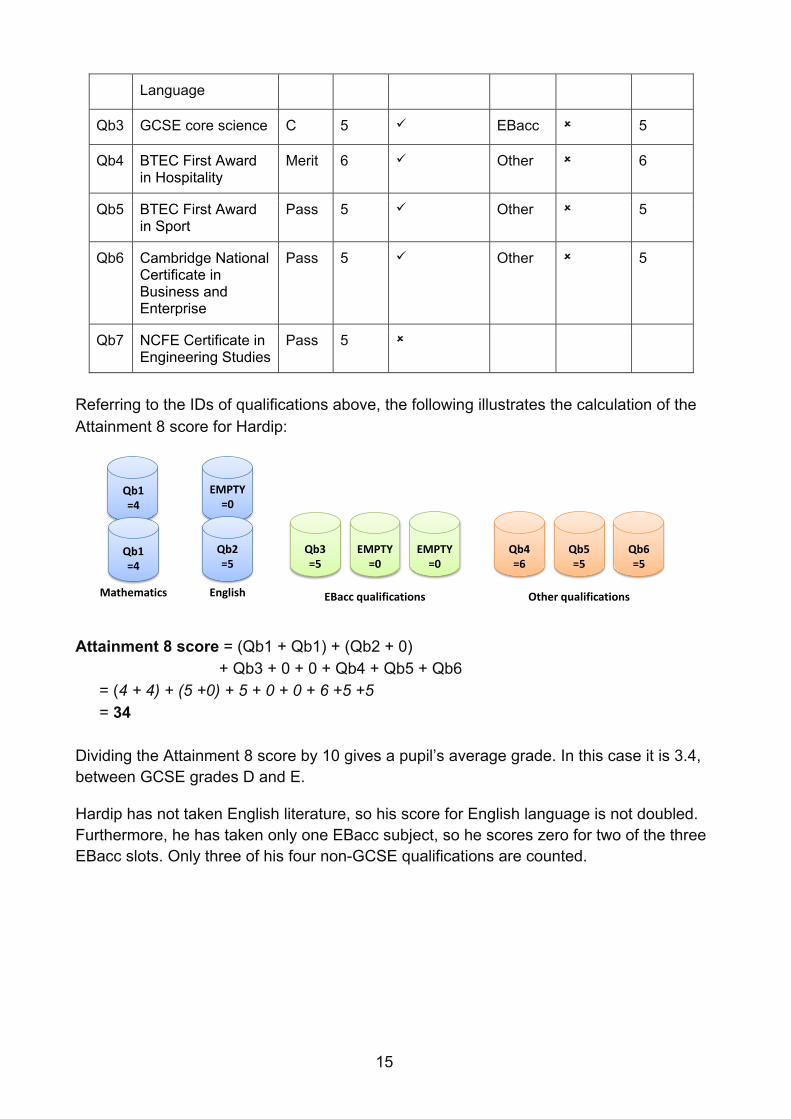
Language
Qb3 GCSE core science C 5 EBacc 5
Qb4 BTEC First Award in Hospitality
Merit 6 Other 6
Qb5 BTEC First Award in Sport
Pass 5 Other 5
Qb6 Cambridge National Certificate in Business and Enterprise
Pass 5 Other 5
Qb7 NCFE Certificate in Engineering Studies
Pass 5
Referring to the IDs of qualifications above, the following illustrates the calculation of the Attainment 8 score for Hardip:
Attainment 8 score = (Qb1 + Qb1) + (Qb2 + 0)
+ Qb3 + 0 + 0 + Qb4 + Qb5 + Qb6 = (4 + 4) + (5 +0) + 5 + 0 + 0 + 6 +5 +5 = 34
Dividing the Attainment 8 score by 10 gives a pupil’s average grade. In this case it is 3.4, between GCSE grades D and E.
Hardip has not taken English literature, so his score for English language is not doubled. Furthermore, he has taken only one EBacc subject, so he scores zero for two of the three EBacc slots. Only three of his four non-GCSE qualifications are counted.
Qb1=4
Qb3=5
EMPTY=0
EMPTY=0
Qb4=6
Qb5=5
Qb6=5
EnglishMathematics EBacc qualifications Other qualifications
Qb1=4
EMPTY=0
Qb2=5
16
Calculating Progress 8
Calculating a pupil’s Progress 8 score Progress 8 scores will be calculated for pupils for the sole purpose of calculating the school’s Progress 8 score.
Pupils are included in Progress 8 if:
• their key stage 4 (KS4) attainment can be matched to their attainment at key stage 2 (KS2);
• they have a KS2 average point score that is greater than zero;
• they do not have a missing or disregarded outcome in both English and maths KS2 tests / teacher assessments;
• they attend a maintained mainstream school
A pupil’s Progress 8 score is defined as their Attainment 8 score, minus their estimated Attainment 8 score. The estimated Attainment 8 score is the average Attainment 8 score of all pupils nationally with the same prior attainment at KS2. Provisional 2016 attainment estimates are shown in Annex B.
For 2016, a pupil’s prior attainment is defined as the average of their KS2 English and mathematics results, in fine graded levels. The input for the prior attainment calculation for 2015 to 2018 is shown in Annex C.
17
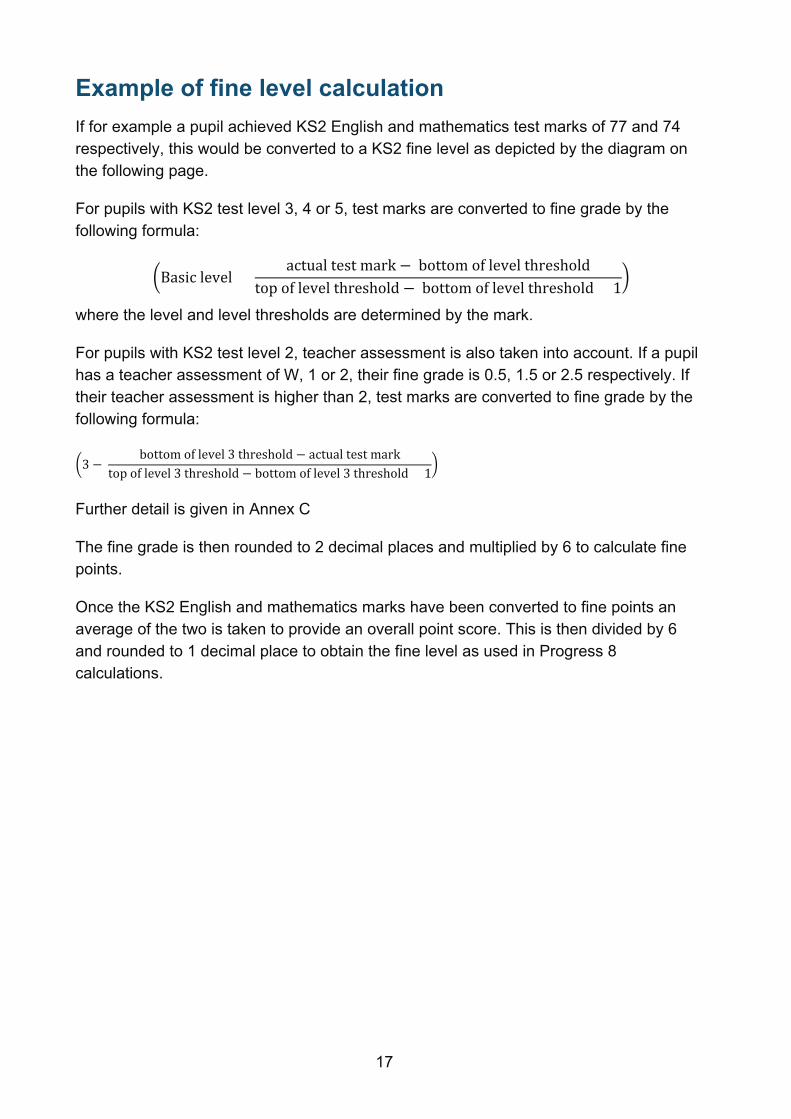
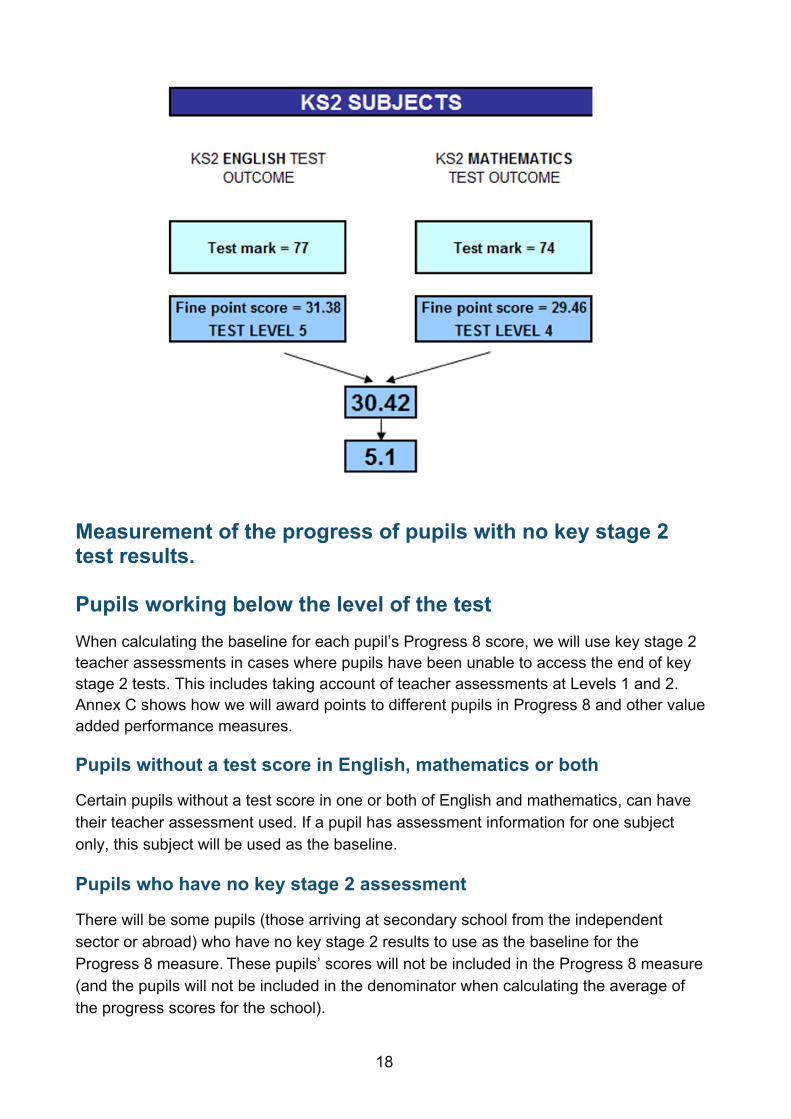
Example of fine level calculation If for example a pupil achieved KS2 English and mathematics test marks of 77 and 74 respectively, this would be converted to a KS2 fine level as depicted by the diagram on the following page.
For pupils with KS2 test level 3, 4 or 5, test marks are converted to fine grade by the following formula:
�Basic level + actual test mark − bottom of level threshold
top of level threshold − bottom of level threshold + 1�
where the level and level thresholds are determined by the mark.
For pupils with KS2 test level 2, teacher assessment is also taken into account. If a pupil has a teacher assessment of W, 1 or 2, their fine grade is 0.5, 1.5 or 2.5 respectively. If their teacher assessment is higher than 2, test marks are converted to fine grade by the following formula:
�3 − bottom of level 3 threshold − actual test mark
top of level 3 threshold − bottom of level 3 threshold + 1�
Further detail is given in Annex C
The fine grade is then rounded to 2 decimal places and multiplied by 6 to calculate fine points.
Once the KS2 English and mathematics marks have been converted to fine points an average of the two is taken to provide an overall point score. This is then divided by 6 and rounded to 1 decimal place to obtain the fine level as used in Progress 8 calculations.
18
Measurement of the progress of pupils with no key stage 2 test results.
Pupils working below the level of the test When calculating the baseline for each pupil’s Progress 8 score, we will use key stage 2 teacher assessments in cases where pupils have been unable to access the end of key stage 2 tests. This includes taking account of teacher assessments at Levels 1 and 2. Annex C shows how we will award points to different pupils in Progress 8 and other value added performance measures.
Pupils without a test score in English, mathematics or both
Certain pupils without a test score in one or both of English and mathematics, can have their teacher assessment used. If a pupil has assessment information for one subject only, this subject will be used as the baseline.
Pupils who have no key stage 2 assessment
There will be some pupils (those arriving at secondary school from the independent sector or abroad) who have no key stage 2 results to use as the baseline for the Progress 8 measure. These pupils’ scores will not be included in the Progress 8 measure (and the pupils will not be included in the denominator when calculating the average of the progress scores for the school).
19
However, these pupils will be included in the attainment measures for the school, unless they have arrived from a non-English speaking country in year 10 or year 11 and the school requests for their results to be removed. We also expect the school to be able to show to Ofsted, parents and others the progress these pupils have made through secondary school. The school can do this by providing information from robust assessments of their own when the pupil enters the school, and then looking at the pupil’s progress to GCSEs.
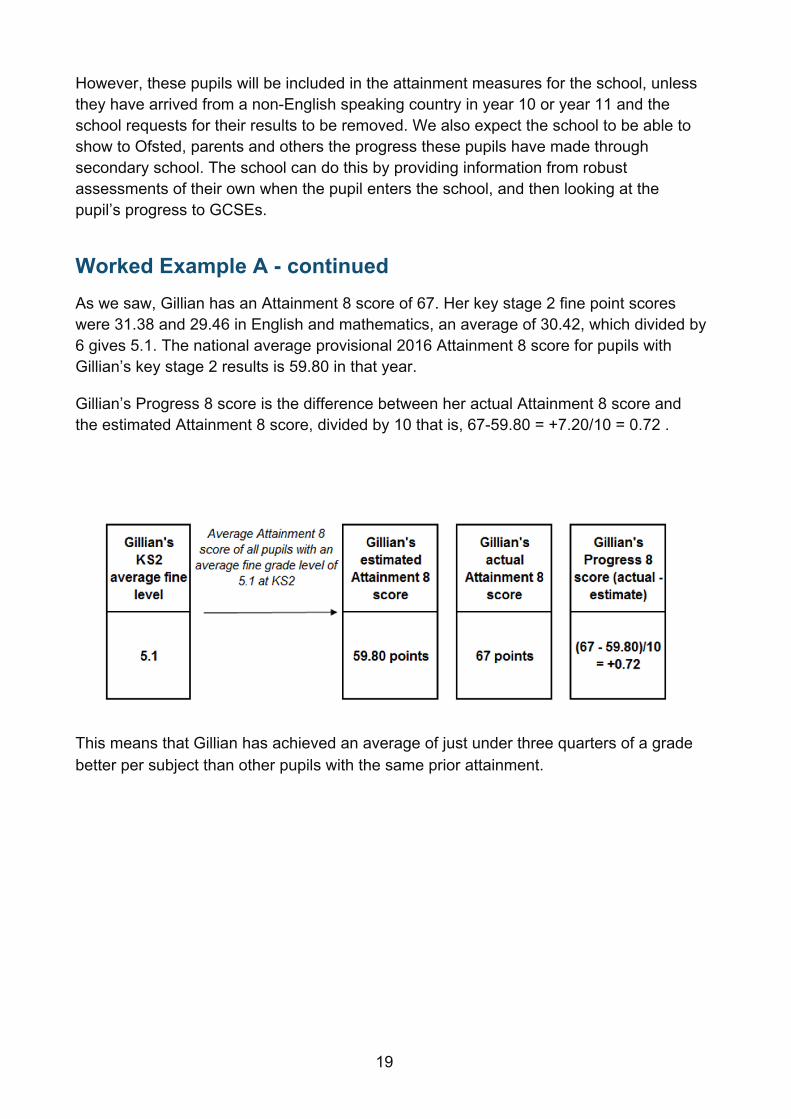
Worked Example A - continued As we saw, Gillian has an Attainment 8 score of 67. Her key stage 2 fine point scores were 31.38 and 29.46 in English and mathematics, an average of 30.42, which divided by 6 gives 5.1. The national average provisional 2016 Attainment 8 score for pupils with Gillian’s key stage 2 results is 59.80 in that year.
Gillian’s Progress 8 score is the difference between her actual Attainment 8 score and the estimated Attainment 8 score, divided by 10 that is, 67-59.80 = +7.20/10 = 0.72 .
This means that Gillian has achieved an average of just under three quarters of a grade better per subject than other pupils with the same prior attainment.
20
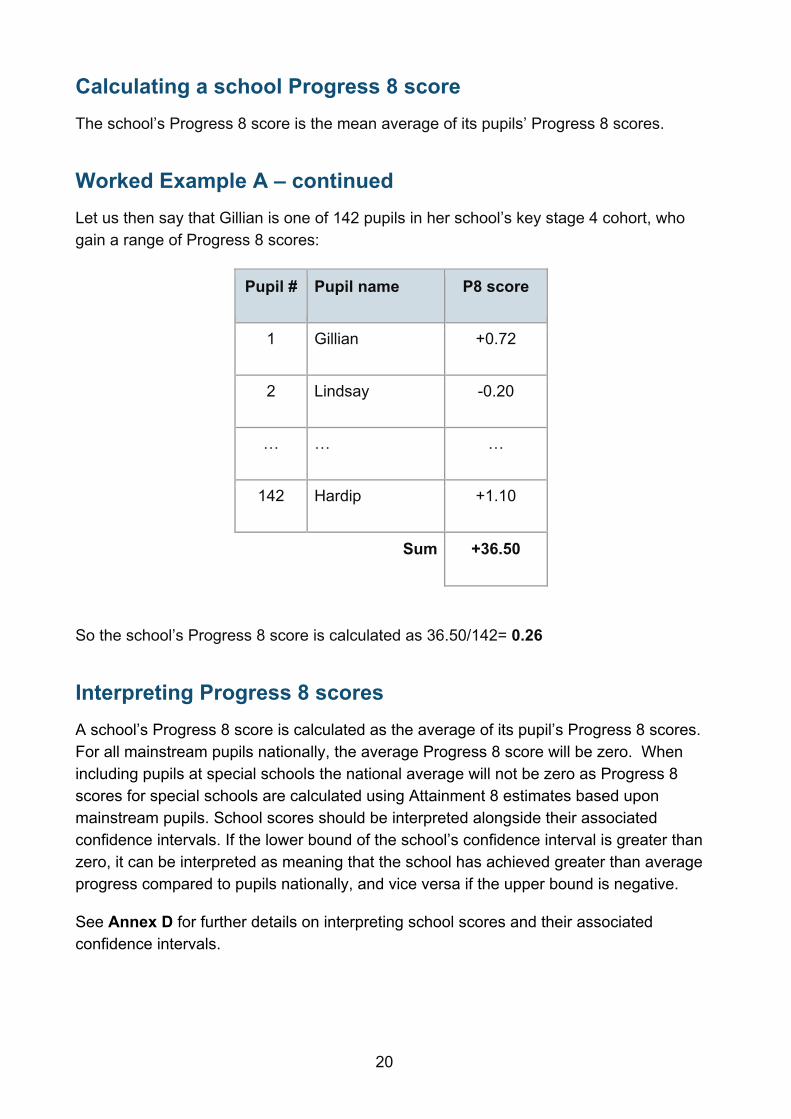
Calculating a school Progress 8 score The school’s Progress 8 score is the mean average of its pupils’ Progress 8 scores.
Worked Example A – continued Let us then say that Gillian is one of 142 pupils in her school’s key stage 4 cohort, who gain a range of Progress 8 scores:
Pupil # Pupil name P8 score
1 Gillian +0.72
2 Lindsay -0.20
… … …
142 Hardip +1.10
Sum +36.50
So the school’s Progress 8 score is calculated as 36.50/142= 0.26
Interpreting Progress 8 scores A school’s Progress 8 score is calculated as the average of its pupil’s Progress 8 scores. For all mainstream pupils nationally, the average Progress 8 score will be zero. When including pupils at special schools the national average will not be zero as Progress 8 scores for special schools are calculated using Attainment 8 estimates based upon mainstream pupils. School scores should be interpreted alongside their associated confidence intervals. If the lower bound of the school’s confidence interval is greater than zero, it can be interpreted as meaning that the school has achieved greater than average progress compared to pupils nationally, and vice versa if the upper bound is negative.
See Annex D for further details on interpreting school scores and their associated confidence intervals.
21
Confidence intervals Progress 8 results are calculated for a school based on a specific cohort of pupils. A school may have been just as effective but have performed differently with a different set of pupils. Similarly some pupils may be more likely to achieve high or low grades independently of which school they attend. To account for this natural uncertainty 95% confidence intervals around Progress 8 scores are provided as a proxy for the range of scores within which each school’s underlying performance measure can be confidently said to lie. The results of schools with a small cohort tend to have wider confidence intervals; this reflects the fact that the performance of a small number of pupils taking their key stage 4 exams can have a disproportionate effect on the school’s overall results. Both the Progress 8 score and the confidence interval for a school should be taken into account when comparing with other schools, pupil groups or national averages. Information about how confidence intervals will be calculated is described in Annex D.
Impact of the number of qualifications taken on a pupil’s Progress 8 score
The number of qualifications each pupil should enter remains a professional judgement led by what best meets the needs of an individual.
The Progress 8 score for each pupil will always be determined by dividing the points total by 10 (the eight qualifications with English and mathematics both double-weighted), regardless of how many qualifications the pupil sits.
This approach supports the policy aim to encourage schools to offer a broad and balanced curriculum with an academic core.
It may benefit some less able pupils to work towards good grades (and hence score more points) in fewer subjects, with the emphasis on doing well in English and mathematics, rather than to take more subjects but achieve lower grades overall.
22
2016 key stage 2 tests In May 2016 children sat new Key Stage 2 (KS2) tests that reflected the new more rigorous primary curriculum for the first time. The results for 2016 were not reported in levels, but in scaled scores ranging from 80-120 with a scaled score of 100 representing the expected standard. This means the results for 2016 look different from, and are not comparable to, those of previous years. If you would like to know further details on the reforms to primary assessment, including information on the KS2 interim teacher assessment framework for 2016, you can find this at:
www.gov.uk/government/organisations/standards-and-testing-agency
How to interpret 2016 key stage 2 results The results for 2016 cannot be compared to previous years because they reflect a new curriculum, new tests and assessments, and a new higher expected standard. If you would like to see how test scores compare with the 2016 national average for each subject, you can do this at www.gov.uk/government/collections/statistics-key-stage-2. Further information on the distribution of scaled scores is also available in the provisional primary statistical first release on GOV.UK.
Secondary schools should continue to view KS2 test results as just one piece of data available to them and continue to supplement this data with their own ongoing assessments of what pupils know and can do.
Information available to secondary schools about their incoming year 7 pupils Secondary schools will receive information via common transfer files on the teacher assessment and test score (the scaled score) awarded to each pupil.
Question Level Analysis is available for secondary schools to use on RAISEonline. This will help secondary schools identify strengths and weaknesses of incoming year 7 pupils in each test subject.
How scaled scores will be used in Progress 8 The first GCSE results for pupils with KS2 scaled scores will not be available until 2021. We will provide information about how scaled scores will be used in Progress 8 in due course.
23
Estimated grades The minimum grades each pupil requires to achieve a positive Progress 8 score (also known as their ‘estimated grade’) will not be known in advance. This is because each pupil’s results are compared to other pupils with the same prior attainment within the same cohort.
Care should be taken when using a previous year’s attainment estimates as a guide to potential future Progress 8 results. This is because changes to national subject entry patterns and performance will cause these estimates to change in future years. Many schools will change their curriculum offer in response to the Progress 8 measure, so any modelling based on current national results could be misleading.
However, there are several sources of information that should help schools to plan their teaching for individual pupils:
• Transition matrices should help schools to make predictions for pupils in individual subjects. Transition matrices based on 2015 results are available on RAISEonline. For a range of qualifications, and for each key stage 2 (KS2) sublevel, they show the number and percentage of pupils which went onto achieve each grade. This gives an indication of the average progress made by pupils in individual subjects (although schools should be aware that changes in performance may alter this picture by 2016).
Pupils reaching their estimated grades Unlike in the ‘expected progress’ measures, the Progress 8 measure does not give particular credit to a school for helping a pupil reach his or her estimated grade. Schools get credit for each increase in grade a pupil achieves, regardless of how this grade relates to their estimated grade. For example, the Progress 8 score can improve equally if a pupil working well below their estimated grade moves up one grade, or if another pupil moves up one grade to achieve their estimated grade.
Setting estimated grades in advance We had proposed to move to a system in 2019 in which schools are informed three years in advance about the results each pupil will require to achieve a positive Progress 8 score.
Following further analysis of the impact of qualification, curriculum and accountability reform, we no longer plan to move to this system in 2019 as we cannot be certain that it will not introduce unfairness in how estimated grades are set for different prior attainment groups.
We will, however, continue to review the possibility of moving to this approach at a later date.
24
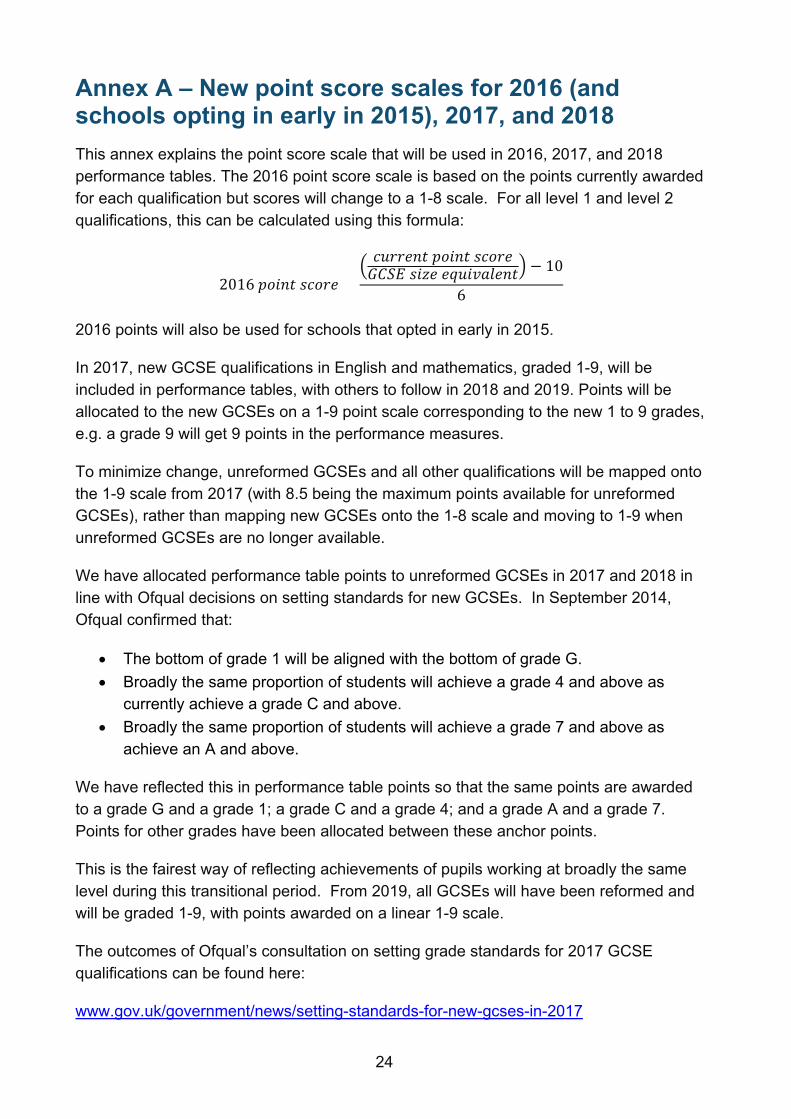
Annex A – New point score scales for 2016 (and schools opting in early in 2015), 2017, and 2018 This annex explains the point score scale that will be used in 2016, 2017, and 2018 performance tables. The 2016 point score scale is based on the points currently awarded for each qualification but scores will change to a 1-8 scale. For all level 1 and level 2 qualifications, this can be calculated using this formula:
2016 𝑝𝑝𝑝𝑝𝑝 𝑠𝑠𝑝𝑠𝑠 =� 𝑠𝑐𝑠𝑠𝑠𝑝𝑝 𝑝𝑝𝑝𝑝𝑝 𝑠𝑠𝑝𝑠𝑠𝐺𝐺𝐺𝐺 𝑠𝑝𝑠𝑠 𝑠𝑒𝑐𝑝𝑒𝑒𝑒𝑠𝑝𝑝� − 10
6
2016 points will also be used for schools that opted in early in 2015.
In 2017, new GCSE qualifications in English and mathematics, graded 1-9, will be included in performance tables, with others to follow in 2018 and 2019. Points will be allocated to the new GCSEs on a 1-9 point scale corresponding to the new 1 to 9 grades, e.g. a grade 9 will get 9 points in the performance measures.
To minimize change, unreformed GCSEs and all other qualifications will be mapped onto the 1-9 scale from 2017 (with 8.5 being the maximum points available for unreformed GCSEs), rather than mapping new GCSEs onto the 1-8 scale and moving to 1-9 when unreformed GCSEs are no longer available.
We have allocated performance table points to unreformed GCSEs in 2017 and 2018 in line with Ofqual decisions on setting standards for new GCSEs. In September 2014, Ofqual confirmed that:
• The bottom of grade 1 will be aligned with the bottom of grade G. • Broadly the same proportion of students will achieve a grade 4 and above as
currently achieve a grade C and above. • Broadly the same proportion of students will achieve a grade 7 and above as
achieve an A and above.
We have reflected this in performance table points so that the same points are awarded to a grade G and a grade 1; a grade C and a grade 4; and a grade A and a grade 7. Points for other grades have been allocated between these anchor points.
This is the fairest way of reflecting achievements of pupils working at broadly the same level during this transitional period. From 2019, all GCSEs will have been reformed and will be graded 1-9, with points awarded on a linear 1-9 scale.
The outcomes of Ofqual’s consultation on setting grade standards for 2017 GCSE qualifications can be found here:
www.gov.uk/government/news/setting-standards-for-new-gcses-in-2017
25
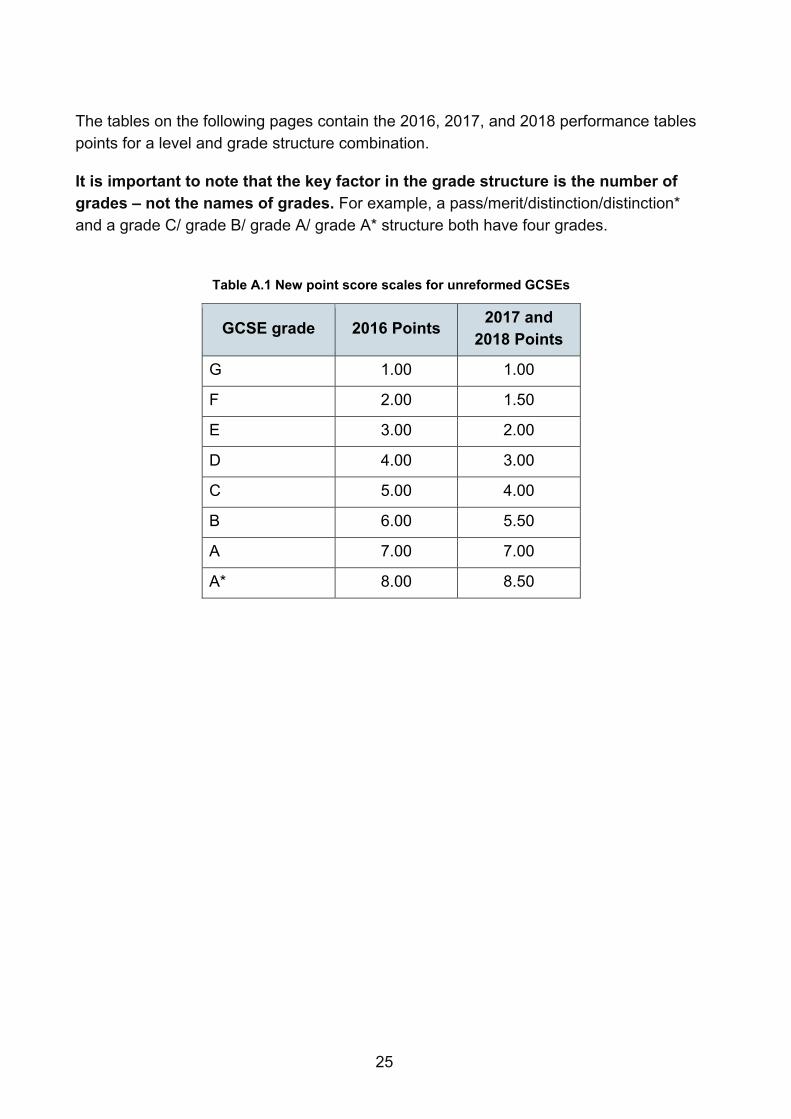
The tables on the following pages contain the 2016, 2017, and 2018 performance tables points for a level and grade structure combination.
It is important to note that the key factor in the grade structure is the number of grades – not the names of grades. For example, a pass/merit/distinction/distinction* and a grade C/ grade B/ grade A/ grade A* structure both have four grades.
Table A.1 New point score scales for unreformed GCSEs
GCSE grade 2016 Points 2017 and 2018 Points
G 1.00 1.00
F 2.00 1.50
E 3.00 2.00
D 4.00 3.00
C 5.00 4.00
B 6.00 5.50
A 7.00 7.00
A* 8.00 8.50
26
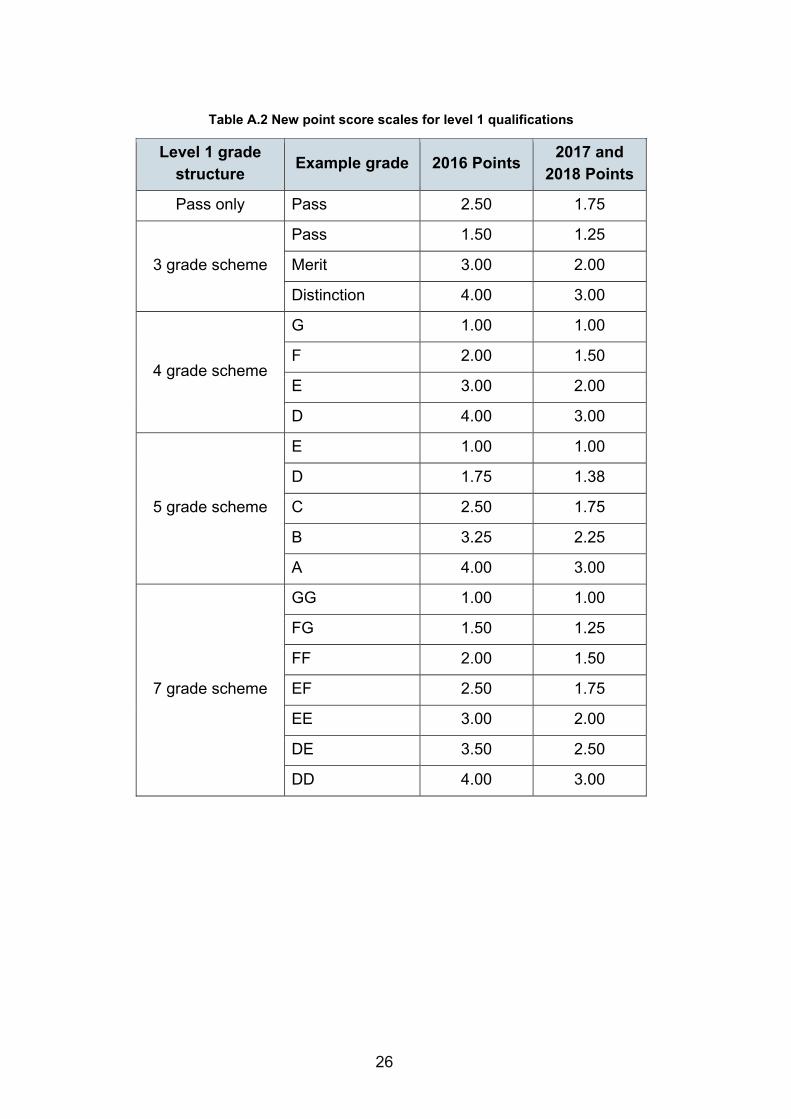
Table A.2 New point score scales for level 1 qualifications
Level 1 grade structure Example grade 2016 Points 2017 and
2018 Points
Pass only Pass 2.50 1.75
3 grade scheme
Pass 1.50 1.25
Merit 3.00 2.00
Distinction 4.00 3.00
4 grade scheme
G 1.00 1.00
F 2.00 1.50
E 3.00 2.00
D 4.00 3.00
5 grade scheme
E 1.00 1.00
D 1.75 1.38
C 2.50 1.75
B 3.25 2.25
A 4.00 3.00
7 grade scheme
GG 1.00 1.00
FG 1.50 1.25
FF 2.00 1.50
EF 2.50 1.75
EE 3.00 2.00
DE 3.50 2.50
DD 4.00 3.00
27
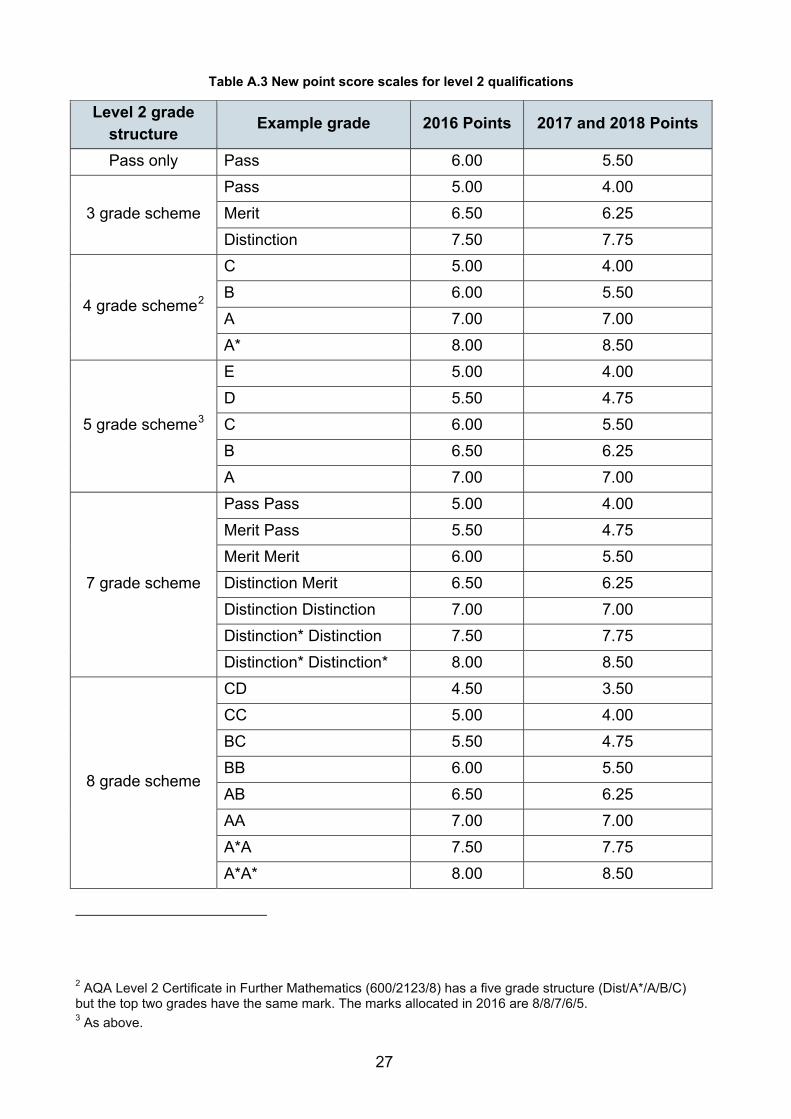
Table A.3 New point score scales for level 2 qualifications
Level 2 grade structure Example grade 2016 Points 2017 and 2018 Points
Pass only Pass 6.00 5.50
3 grade scheme Pass 5.00 4.00 Merit 6.50 6.25 Distinction 7.50 7.75
4 grade scheme2
C 5.00 4.00 B 6.00 5.50 A 7.00 7.00 A* 8.00 8.50
5 grade scheme3
E 5.00 4.00 D 5.50 4.75 C 6.00 5.50 B 6.50 6.25 A 7.00 7.00
7 grade scheme
Pass Pass 5.00 4.00 Merit Pass 5.50 4.75 Merit Merit 6.00 5.50 Distinction Merit 6.50 6.25 Distinction Distinction 7.00 7.00 Distinction* Distinction 7.50 7.75 Distinction* Distinction* 8.00 8.50
8 grade scheme
CD 4.50 3.50 CC 5.00 4.00 BC 5.50 4.75 BB 6.00 5.50 AB 6.50 6.25 AA 7.00 7.00 A*A 7.50 7.75 A*A* 8.00 8.50
2 AQA Level 2 Certificate in Further Mathematics (600/2123/8) has a five grade structure (Dist/A*/A/B/C) but the top two grades have the same mark. The marks allocated in 2016 are 8/8/7/6/5. 3 As above.
28
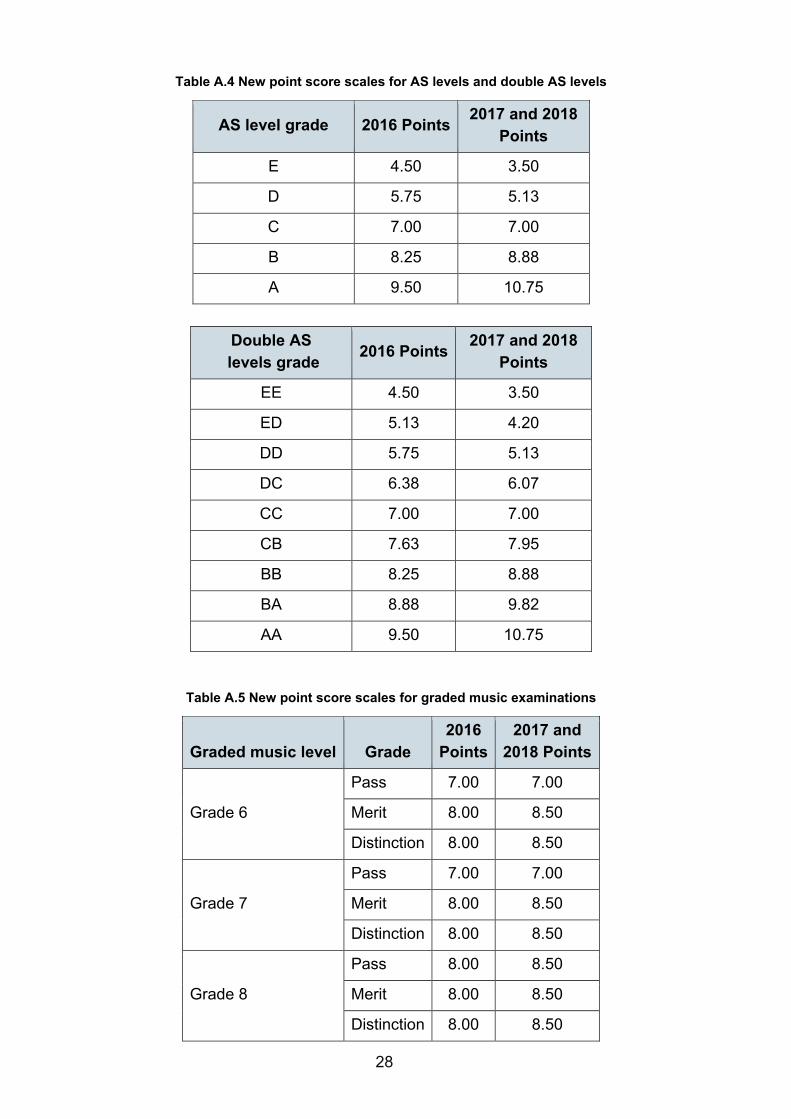
Table A.4 New point score scales for AS levels and double AS levels
AS level grade 2016 Points 2017 and 2018 Points
E 4.50 3.50
D 5.75 5.13
C 7.00 7.00
B 8.25 8.88
A 9.50 10.75
Double AS
levels grade 2016 Points 2017 and 2018 Points
EE 4.50 3.50
ED 5.13 4.20
DD 5.75 5.13
DC 6.38 6.07
CC 7.00 7.00
CB 7.63 7.95
BB 8.25 8.88
BA 8.88 9.82
AA 9.50 10.75
Table A.5 New point score scales for graded music examinations
Graded music level Grade 2016
Points 2017 and
2018 Points
Grade 6
Pass 7.00 7.00
Merit 8.00 8.50
Distinction 8.00 8.50
Grade 7
Pass 7.00 7.00
Merit 8.00 8.50
Distinction 8.00 8.50
Grade 8
Pass 8.00 8.50
Merit 8.00 8.50
Distinction 8.00 8.50
29
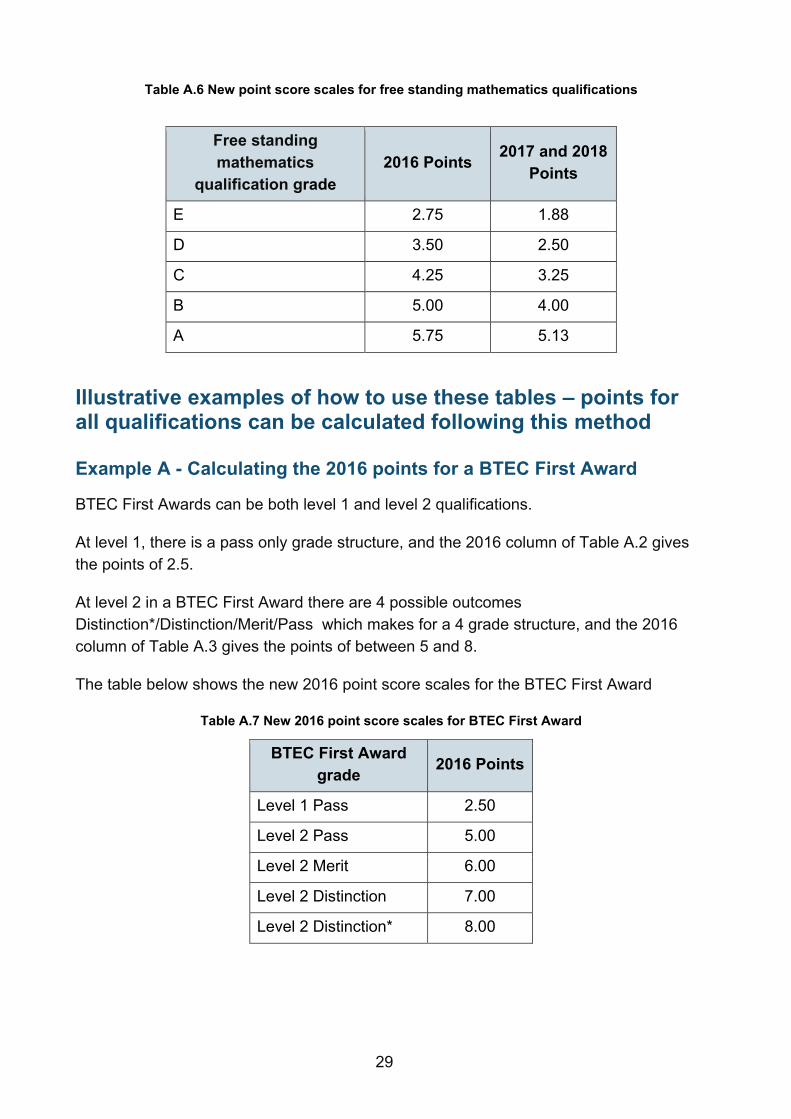
Table A.6 New point score scales for free standing mathematics qualifications
Free standing mathematics
qualification grade 2016 Points 2017 and 2018
Points
E 2.75 1.88
D 3.50 2.50
C 4.25 3.25
B 5.00 4.00
A 5.75 5.13
Illustrative examples of how to use these tables – points for all qualifications can be calculated following this method
Example A - Calculating the 2016 points for a BTEC First Award
BTEC First Awards can be both level 1 and level 2 qualifications.
At level 1, there is a pass only grade structure, and the 2016 column of Table A.2 gives the points of 2.5.
At level 2 in a BTEC First Award there are 4 possible outcomes Distinction*/Distinction/Merit/Pass which makes for a 4 grade structure, and the 2016 column of Table A.3 gives the points of between 5 and 8.
The table below shows the new 2016 point score scales for the BTEC First Award
Table A.7 New 2016 point score scales for BTEC First Award
BTEC First Award grade 2016 Points
Level 1 Pass 2.50
Level 2 Pass 5.00
Level 2 Merit 6.00
Level 2 Distinction 7.00
Level 2 Distinction* 8.00
30
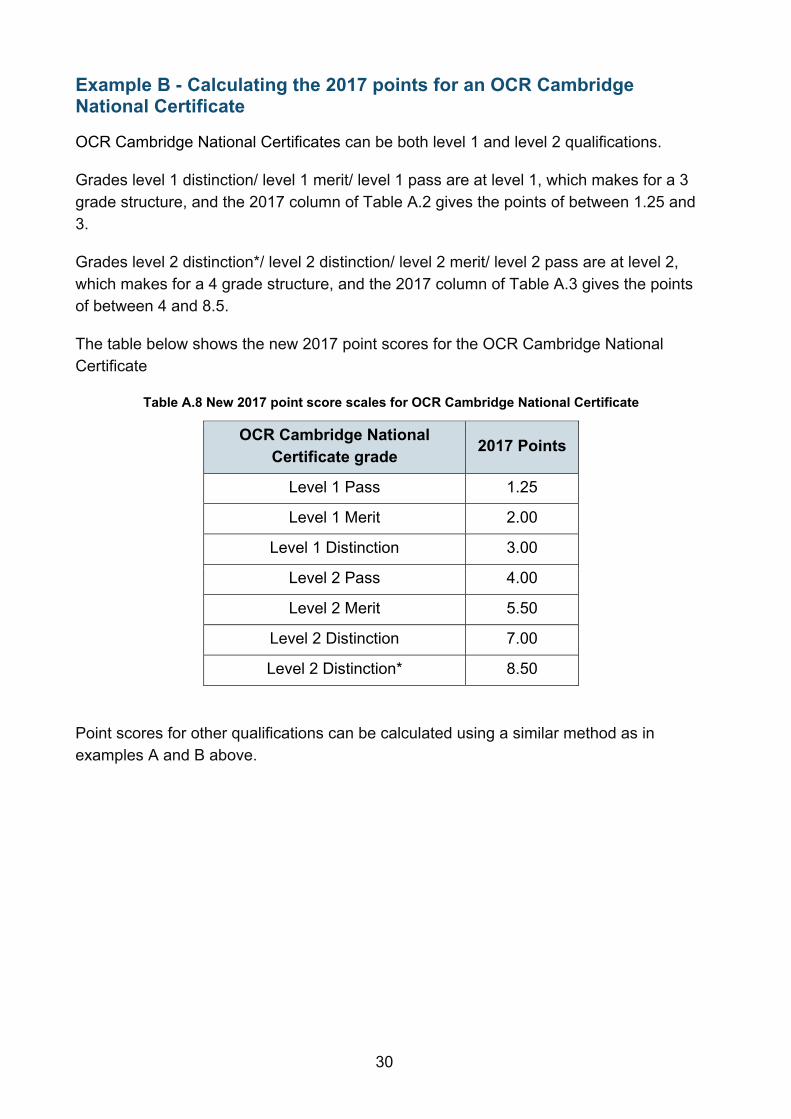
Example B - Calculating the 2017 points for an OCR Cambridge National Certificate
OCR Cambridge National Certificates can be both level 1 and level 2 qualifications.
Grades level 1 distinction/ level 1 merit/ level 1 pass are at level 1, which makes for a 3 grade structure, and the 2017 column of Table A.2 gives the points of between 1.25 and 3.
Grades level 2 distinction*/ level 2 distinction/ level 2 merit/ level 2 pass are at level 2, which makes for a 4 grade structure, and the 2017 column of Table A.3 gives the points of between 4 and 8.5.
The table below shows the new 2017 point scores for the OCR Cambridge National Certificate
Table A.8 New 2017 point score scales for OCR Cambridge National Certificate
OCR Cambridge National Certificate grade 2017 Points
Level 1 Pass 1.25
Level 1 Merit 2.00
Level 1 Distinction 3.00
Level 2 Pass 4.00
Level 2 Merit 5.50
Level 2 Distinction 7.00
Level 2 Distinction* 8.50
Point scores for other qualifications can be calculated using a similar method as in examples A and B above.
31
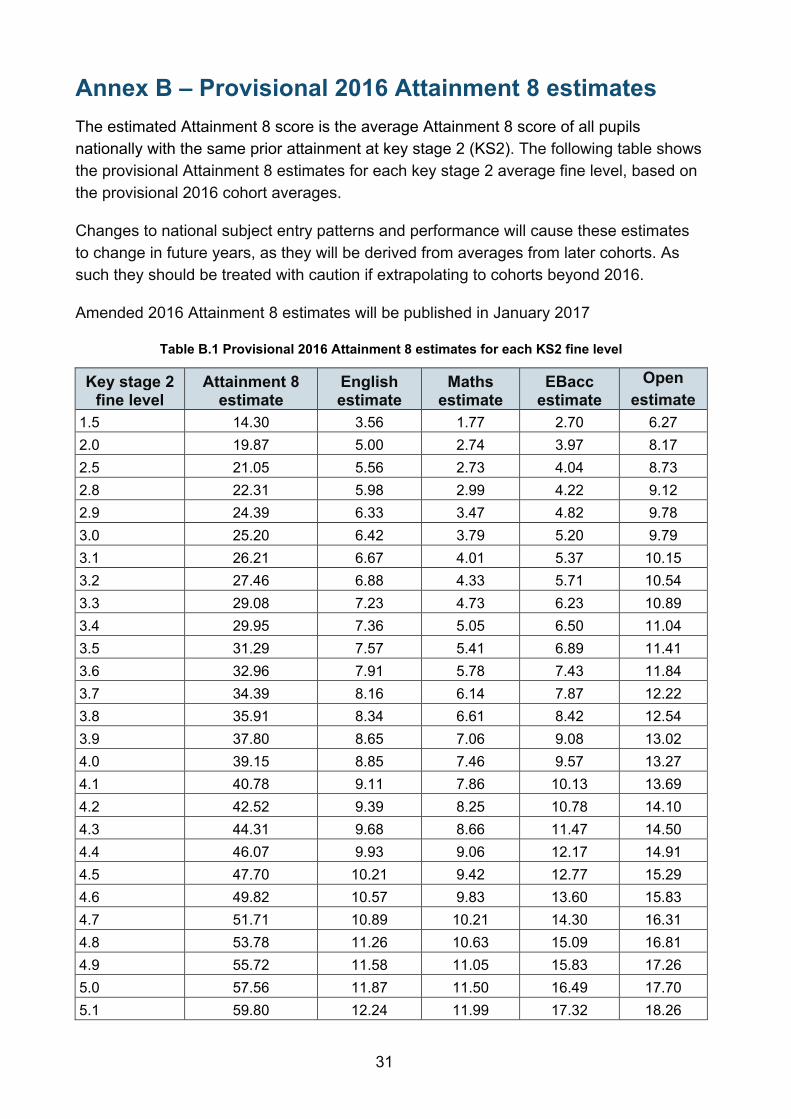
Annex B – Provisional 2016 Attainment 8 estimates The estimated Attainment 8 score is the average Attainment 8 score of all pupils nationally with the same prior attainment at key stage 2 (KS2). The following table shows the provisional Attainment 8 estimates for each key stage 2 average fine level, based on the provisional 2016 cohort averages.
Changes to national subject entry patterns and performance will cause these estimates to change in future years, as they will be derived from averages from later cohorts. As such they should be treated with caution if extrapolating to cohorts beyond 2016.
Amended 2016 Attainment 8 estimates will be published in January 2017
Table B.1 Provisional 2016 Attainment 8 estimates for each KS2 fine level
Key stage 2 fine level
Attainment 8 estimate
English estimate
Maths estimate
EBacc estimate
Open estimate
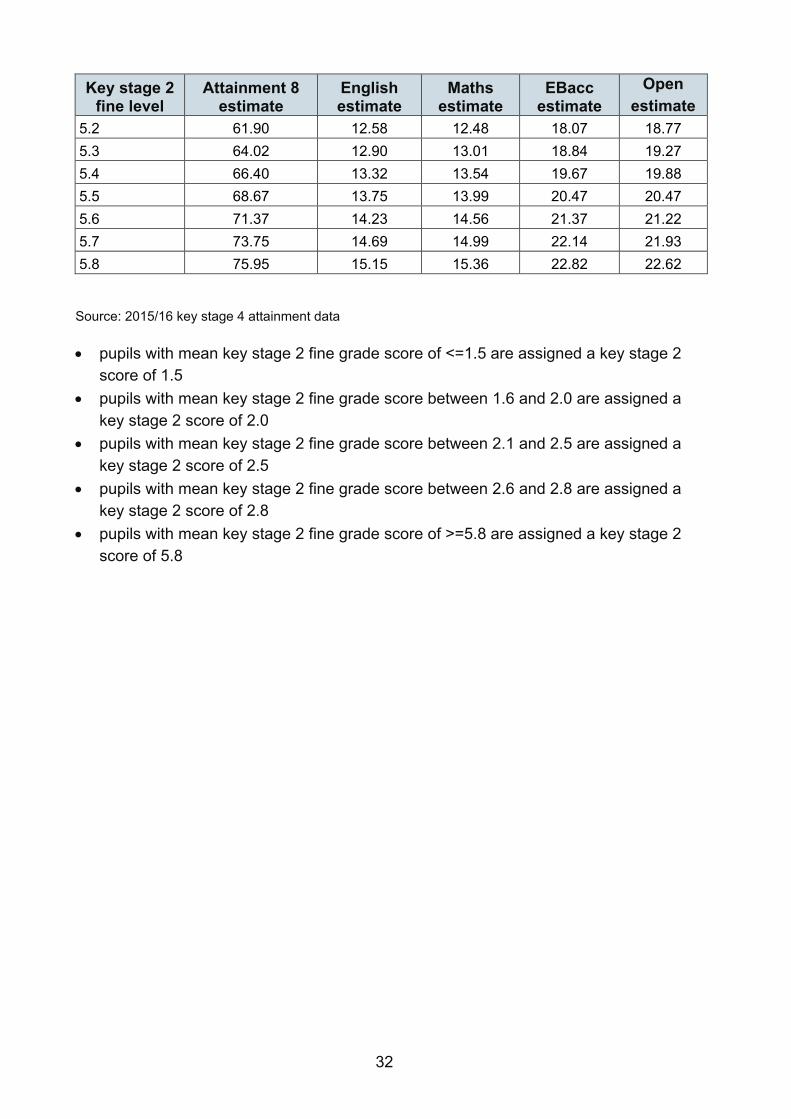
1.5 14.30 3.56 1.77 2.70 6.27 2.0 19.87 5.00 2.74 3.97 8.17 2.5 21.05 5.56 2.73 4.04 8.73 2.8 22.31 5.98 2.99 4.22 9.12 2.9 24.39 6.33 3.47 4.82 9.78 3.0 25.20 6.42 3.79 5.20 9.79 3.1 26.21 6.67 4.01 5.37 10.15 3.2 27.46 6.88 4.33 5.71 10.54 3.3 29.08 7.23 4.73 6.23 10.89 3.4 29.95 7.36 5.05 6.50 11.04 3.5 31.29 7.57 5.41 6.89 11.41 3.6 32.96 7.91 5.78 7.43 11.84 3.7 34.39 8.16 6.14 7.87 12.22 3.8 35.91 8.34 6.61 8.42 12.54 3.9 37.80 8.65 7.06 9.08 13.02 4.0 39.15 8.85 7.46 9.57 13.27 4.1 40.78 9.11 7.86 10.13 13.69 4.2 42.52 9.39 8.25 10.78 14.10 4.3 44.31 9.68 8.66 11.47 14.50 4.4 46.07 9.93 9.06 12.17 14.91 4.5 47.70 10.21 9.42 12.77 15.29 4.6 49.82 10.57 9.83 13.60 15.83 4.7 51.71 10.89 10.21 14.30 16.31 4.8 53.78 11.26 10.63 15.09 16.81 4.9 55.72 11.58 11.05 15.83 17.26 5.0 57.56 11.87 11.50 16.49 17.70 5.1 59.80 12.24 11.99 17.32 18.26
32
Key stage 2 fine level
Attainment 8 estimate
English estimate
Maths estimate
EBacc estimate
Open estimate
5.2 61.90 12.58 12.48 18.07 18.77 5.3 64.02 12.90 13.01 18.84 19.27 5.4 66.40 13.32 13.54 19.67 19.88 5.5 68.67 13.75 13.99 20.47 20.47 5.6 71.37 14.23 14.56 21.37 21.22 5.7 73.75 14.69 14.99 22.14 21.93 5.8 75.95 15.15 15.36 22.82 22.62
Source: 2015/16 key stage 4 attainment data
• pupils with mean key stage 2 fine grade score of <=1.5 are assigned a key stage 2 score of 1.5
• pupils with mean key stage 2 fine grade score between 1.6 and 2.0 are assigned a key stage 2 score of 2.0
• pupils with mean key stage 2 fine grade score between 2.1 and 2.5 are assigned a key stage 2 score of 2.5
• pupils with mean key stage 2 fine grade score between 2.6 and 2.8 are assigned a key stage 2 score of 2.8
• pupils with mean key stage 2 fine grade score of >=5.8 are assigned a key stage 2 score of 5.8
33
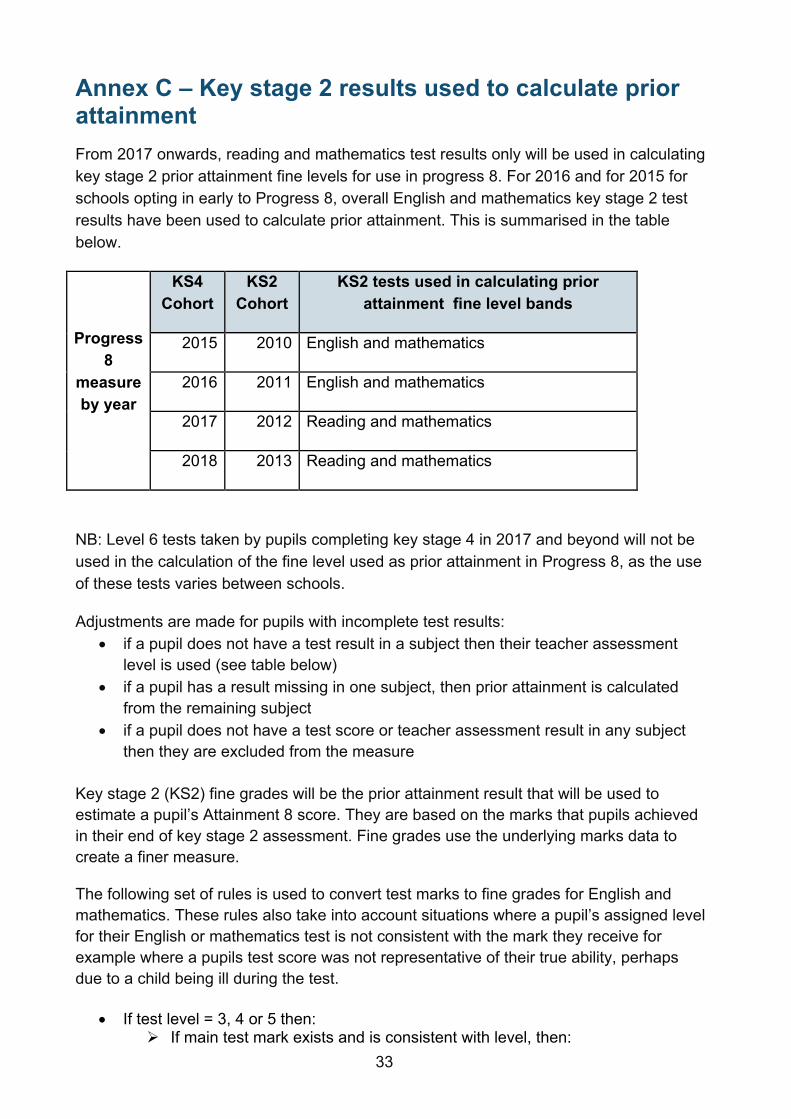
Annex C – Key stage 2 results used to calculate prior attainment From 2017 onwards, reading and mathematics test results only will be used in calculating key stage 2 prior attainment fine levels for use in progress 8. For 2016 and for 2015 for schools opting in early to Progress 8, overall English and mathematics key stage 2 test results have been used to calculate prior attainment. This is summarised in the table below.
Progress 8
measure by year
KS4 Cohort
KS2 Cohort
KS2 tests used in calculating prior attainment fine level bands
2015 2010 English and mathematics
2016 2011 English and mathematics
2017 2012 Reading and mathematics
2018 2013 Reading and mathematics
NB: Level 6 tests taken by pupils completing key stage 4 in 2017 and beyond will not be used in the calculation of the fine level used as prior attainment in Progress 8, as the use of these tests varies between schools.
Adjustments are made for pupils with incomplete test results: • if a pupil does not have a test result in a subject then their teacher assessment
level is used (see table below) • if a pupil has a result missing in one subject, then prior attainment is calculated
from the remaining subject • if a pupil does not have a test score or teacher assessment result in any subject
then they are excluded from the measure Key stage 2 (KS2) fine grades will be the prior attainment result that will be used to estimate a pupil’s Attainment 8 score. They are based on the marks that pupils achieved in their end of key stage 2 assessment. Fine grades use the underlying marks data to create a finer measure.
The following set of rules is used to convert test marks to fine grades for English and mathematics. These rules also take into account situations where a pupil’s assigned level for their English or mathematics test is not consistent with the mark they receive for example where a pupils test score was not representative of their true ability, perhaps due to a child being ill during the test.
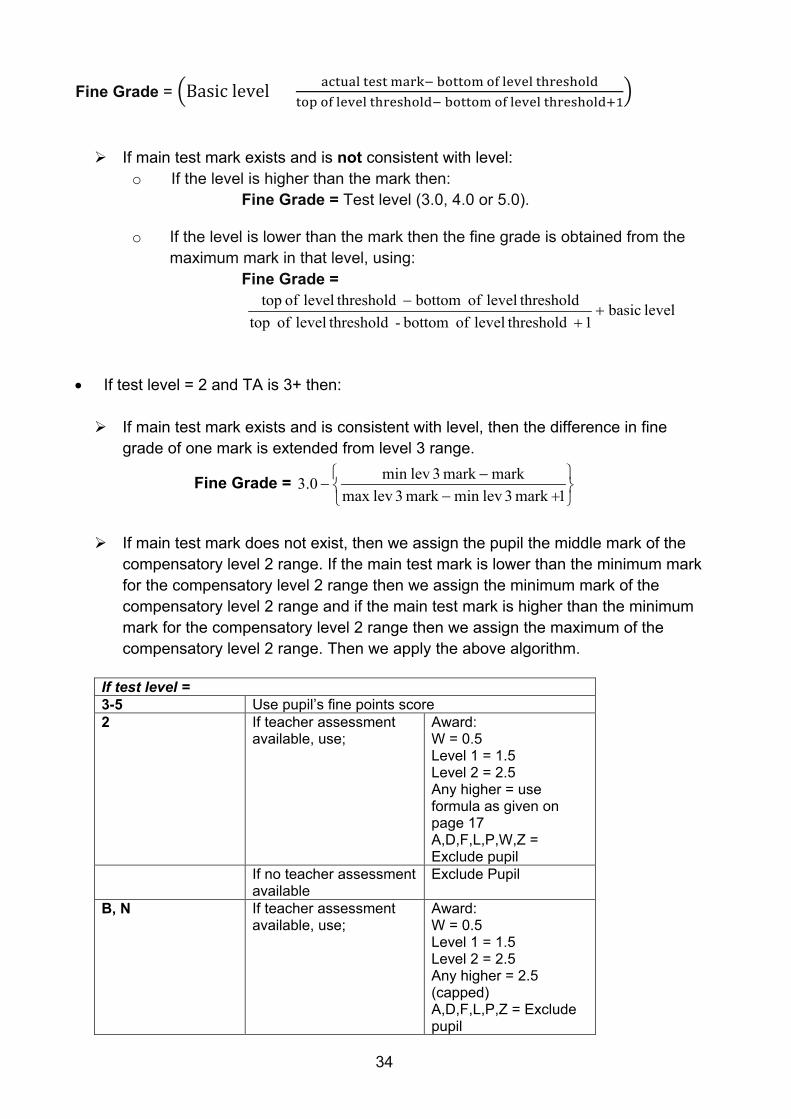
• If test level = 3, 4 or 5 then: If main test mark exists and is consistent with level, then:
34
Fine Grade = �Basic level + actual test mark− bottom of level thresholdtop of level threshold− bottom of level threshold+1
�
If main test mark exists and is not consistent with level:
o If the level is higher than the mark then: Fine Grade = Test level (3.0, 4.0 or 5.0).
o If the level is lower than the mark then the fine grade is obtained from the maximum mark in that level, using:
Fine Grade =
level basic1 thresholdlevel of bottom - thresholdlevel of top
thresholdlevel of bottom thresholdlevel of top ++
-
• If test level = 2 and TA is 3+ then:
If main test mark exists and is consistent with level, then the difference in fine
grade of one mark is extended from level 3 range.
Fine Grade =
+--
-1mark 3 levmin mark 3 levmax
markmark 3 levmin 0.3
If main test mark does not exist, then we assign the pupil the middle mark of the
compensatory level 2 range. If the main test mark is lower than the minimum mark for the compensatory level 2 range then we assign the minimum mark of the compensatory level 2 range and if the main test mark is higher than the minimum mark for the compensatory level 2 range then we assign the maximum of the compensatory level 2 range. Then we apply the above algorithm.
If test level = 3-5 Use pupil’s fine points score 2 If teacher assessment
available, use; Award: W = 0.5 Level 1 = 1.5 Level 2 = 2.5 Any higher = use formula as given on page 17 A,D,F,L,P,W,Z = Exclude pupil
If no teacher assessment available
Exclude Pupil
B, N If teacher assessment available, use;
Award: W = 0.5 Level 1 = 1.5 Level 2 = 2.5 Any higher = 2.5 (capped) A,D,F,L,P,Z = Exclude pupil
35
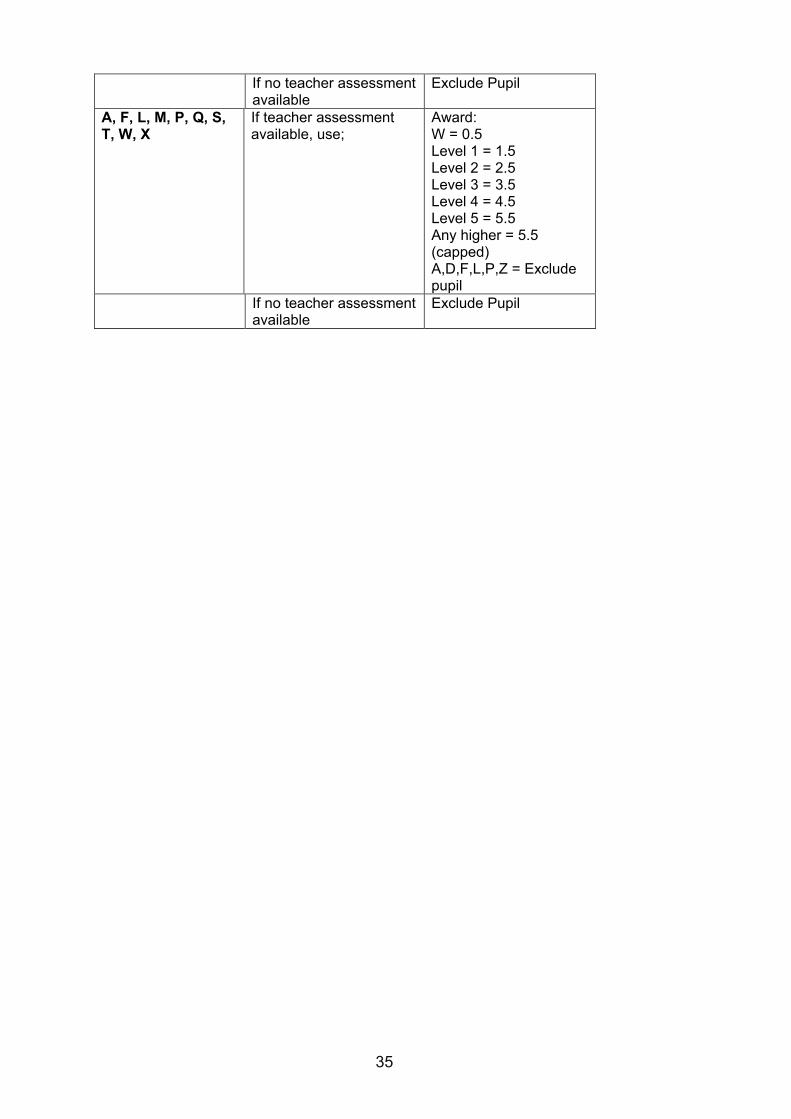
If no teacher assessment available
Exclude Pupil
A, F, L, M, P, Q, S, T, W, X
If teacher assessment available, use;
Award: W = 0.5 Level 1 = 1.5 Level 2 = 2.5 Level 3 = 3.5 Level 4 = 4.5 Level 5 = 5.5 Any higher = 5.5 (capped) A,D,F,L,P,Z = Exclude pupil
If no teacher assessment available
Exclude Pupil
36
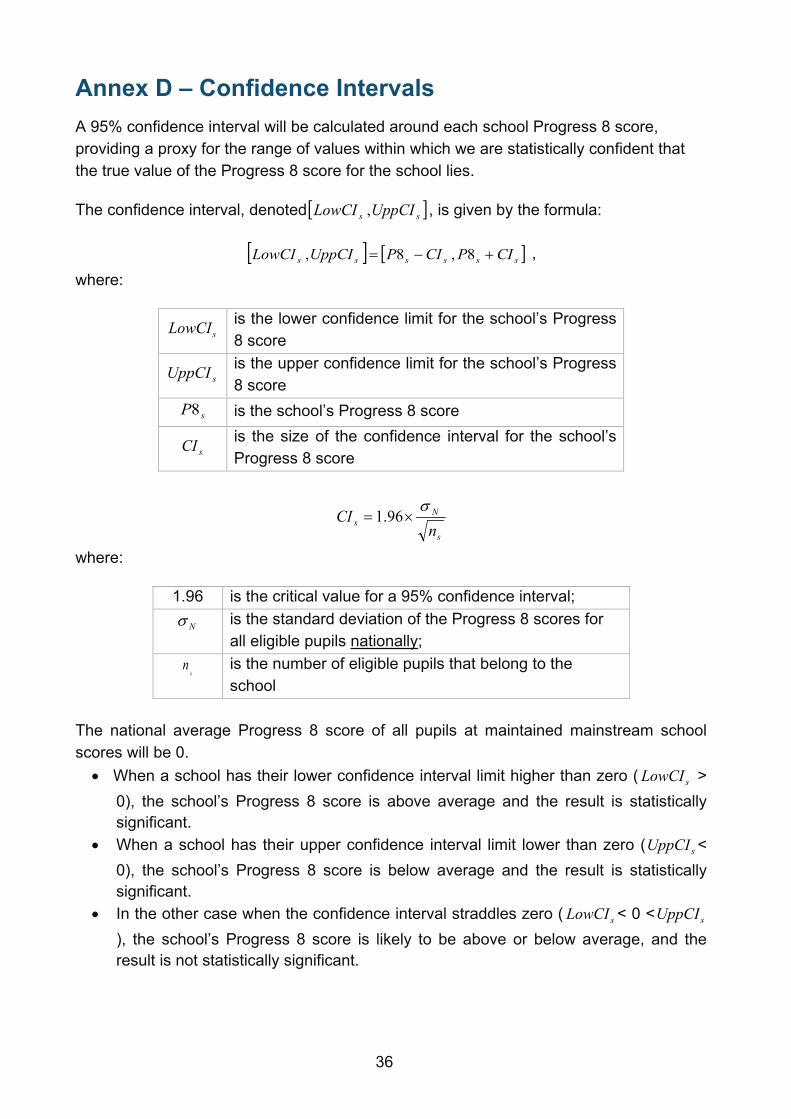
Annex D – Confidence Intervals A 95% confidence interval will be calculated around each school Progress 8 score, providing a proxy for the range of values within which we are statistically confident that the true value of the Progress 8 score for the school lies.
The confidence interval, denoted [ ]ss UppCILowCI , , is given by the formula:
[ ] [ ]ssssss CIPCIPUppCILowCI +-= 8,8, , where:
sLowCI is the lower confidence limit for the school’s Progress 8 score
sUppCI
sP8
sCI
is the upper confidence limit for the school’s Progress 8 score is the school’s Progress 8 score is the size of the confidence interval for the school’s Progress 8 score
s
Ns n
CIs
×= 96.1
where:
1.96 is the critical value for a 95% confidence interval;
N
sn
s is the standard deviation of the Progress 8 scores for all eligible pupils nationally; is the number of eligible pupils that belong to the school
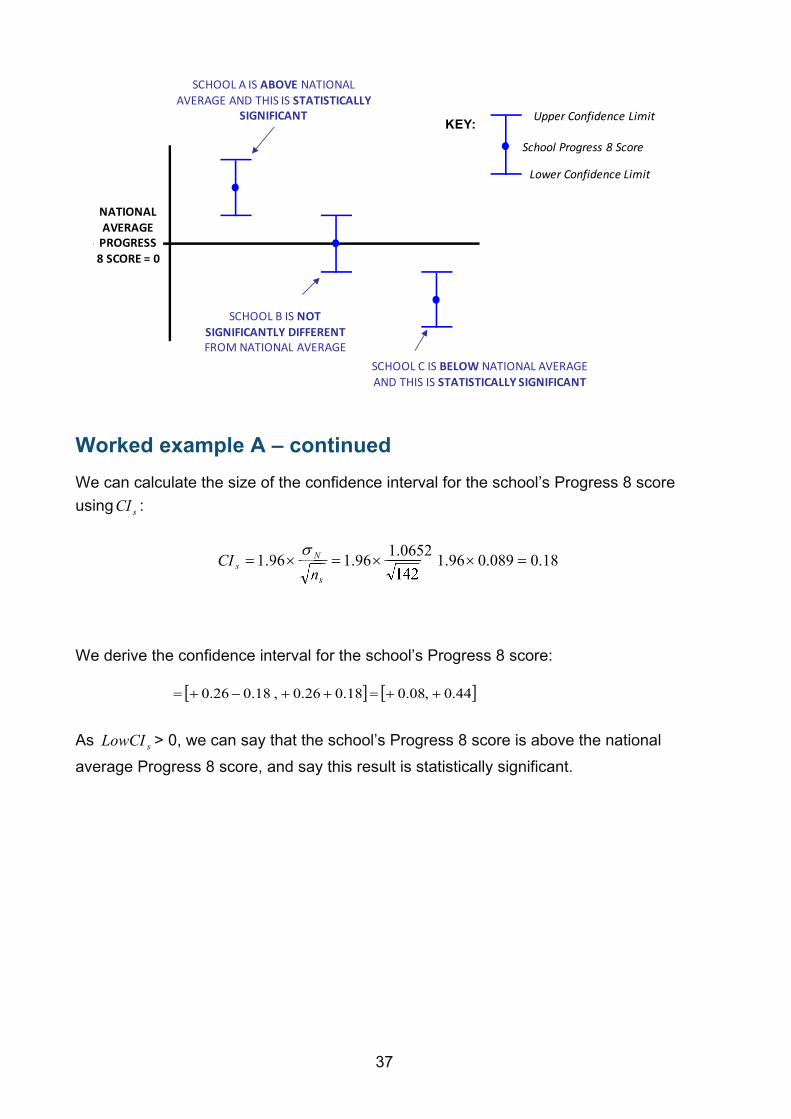
The national average Progress 8 score of all pupils at maintained mainstream school scores will be 0. • When a school has their lower confidence interval limit higher than zero ( sLowCI >
0), the school’s Progress 8 score is above average and the result is statistically significant.
• When a school has their upper confidence interval limit lower than zero ( sUppCI < 0), the school’s Progress 8 score is below average and the result is statistically significant.
• In the other case when the confidence interval straddles zero ( sLowCI < 0 < sUppCI), the school’s Progress 8 score is likely to be above or below average, and the result is not statistically significant.
37
Worked example A – continued We can calculate the size of the confidence interval for the school’s Progress 8 score using sCI :
18 . 0 089 . 0 96 . 1 142
96 . 1 96 . 1 = × = × = × = s
N s n
CI
We derive the confidence interval for the school’s Progress 8 score:
[ ] [ ]44.0,08.018.026.0,18.026.0 ++=++-+= As sLowCI > 0, we can say that the school’s Progress 8 score is above the national average Progress 8 score, and say this result is statistically significant.
KEY: Upper Confidence Limit
School Progress 8 Score
Lower Confidence Limit
NATIONAL AVERAGE
PROGRESS 8 SCORE = 0
SCHOOL A IS ABOVE NATIONAL AVERAGE AND THIS IS STATISTICALLY
SIGNIFICANT
SCHOOL B IS NOT SIGNIFICANTLY DIFFERENT FROM NATIONAL AVERAGE
SCHOOL C IS BELOW NATIONAL AVERAGE AND THIS IS STATISTICALLY SIGNIFICANT
1.0652 s
38
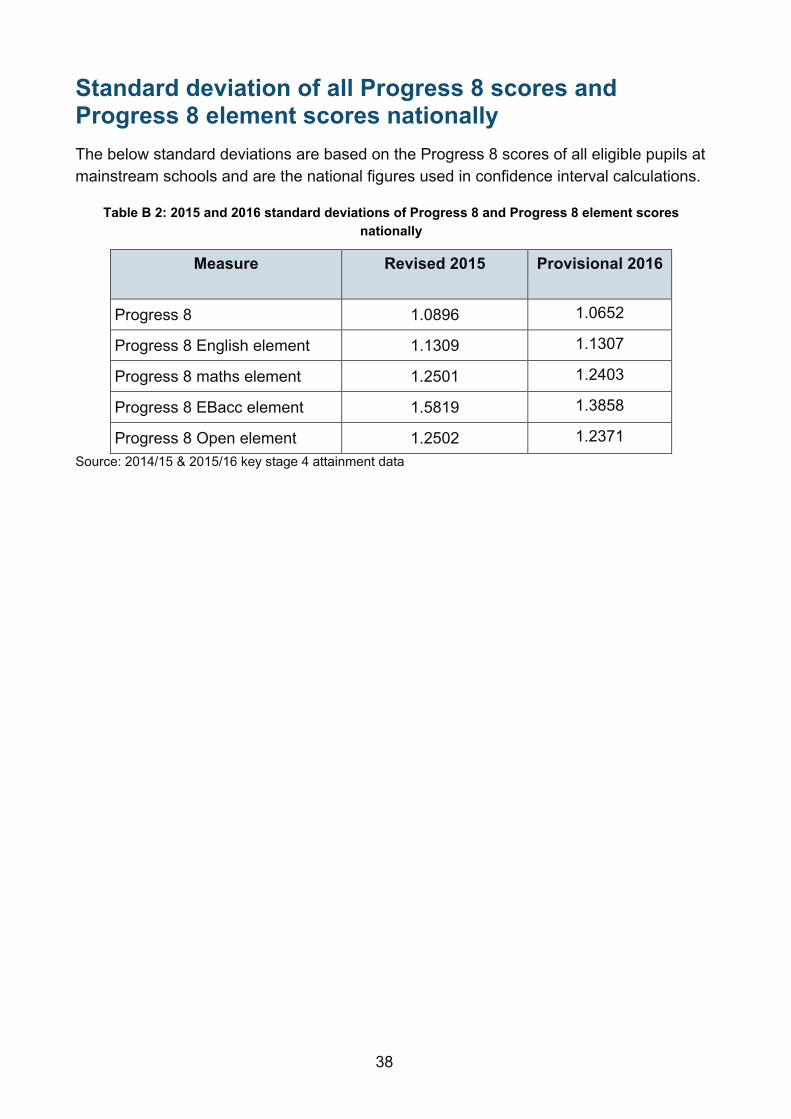
Standard deviation of all Progress 8 scores and Progress 8 element scores nationally The below standard deviations are based on the Progress 8 scores of all eligible pupils at mainstream schools and are the national figures used in confidence interval calculations.
Table B 2: 2015 and 2016 standard deviations of Progress 8 and Progress 8 element scores nationally
Measure
Revised 2015
Provisional 2016
Progress 8 1.0896 1.0652
Progress 8 English element 1.1309 1.1307
Progress 8 maths element 1.2501 1.2403
Progress 8 EBacc element 1.5819 1.3858
Progress 8 Open element 1.2502 1.2371 Source: 2014/15 & 2015/16 key stage 4 attainment data
39
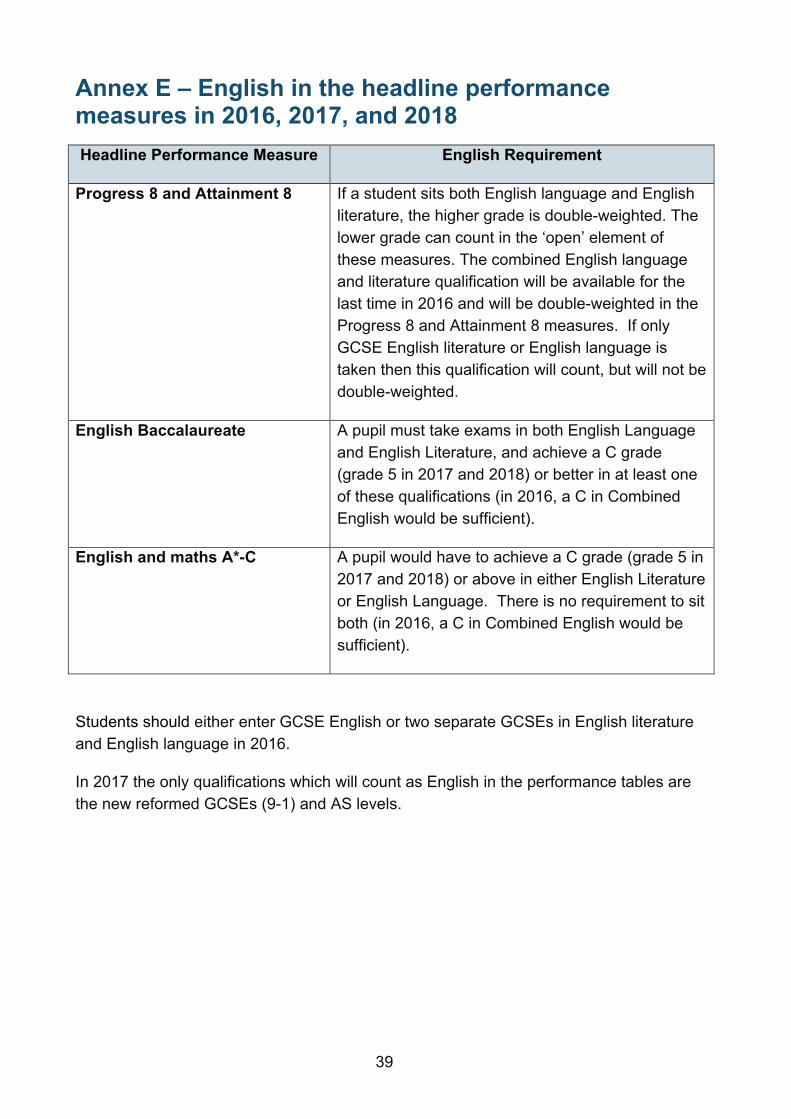
Annex E – English in the headline performance measures in 2016, 2017, and 2018 Headline Performance Measure English Requirement
Progress 8 and Attainment 8 If a student sits both English language and English literature, the higher grade is double-weighted. The lower grade can count in the ‘open’ element of these measures. The combined English language and literature qualification will be available for the last time in 2016 and will be double-weighted in the Progress 8 and Attainment 8 measures. If only GCSE English literature or English language is taken then this qualification will count, but will not be double-weighted.
English Baccalaureate A pupil must take exams in both English Language and English Literature, and achieve a C grade (grade 5 in 2017 and 2018) or better in at least one of these qualifications (in 2016, a C in Combined English would be sufficient).
English and maths A*-C A pupil would have to achieve a C grade (grade 5 in 2017 and 2018) or above in either English Literature or English Language. There is no requirement to sit both (in 2016, a C in Combined English would be sufficient).
Students should either enter GCSE English or two separate GCSEs in English literature and English language in 2016.
In 2017 the only qualifications which will count as English in the performance tables are the new reformed GCSEs (9-1) and AS levels.
40
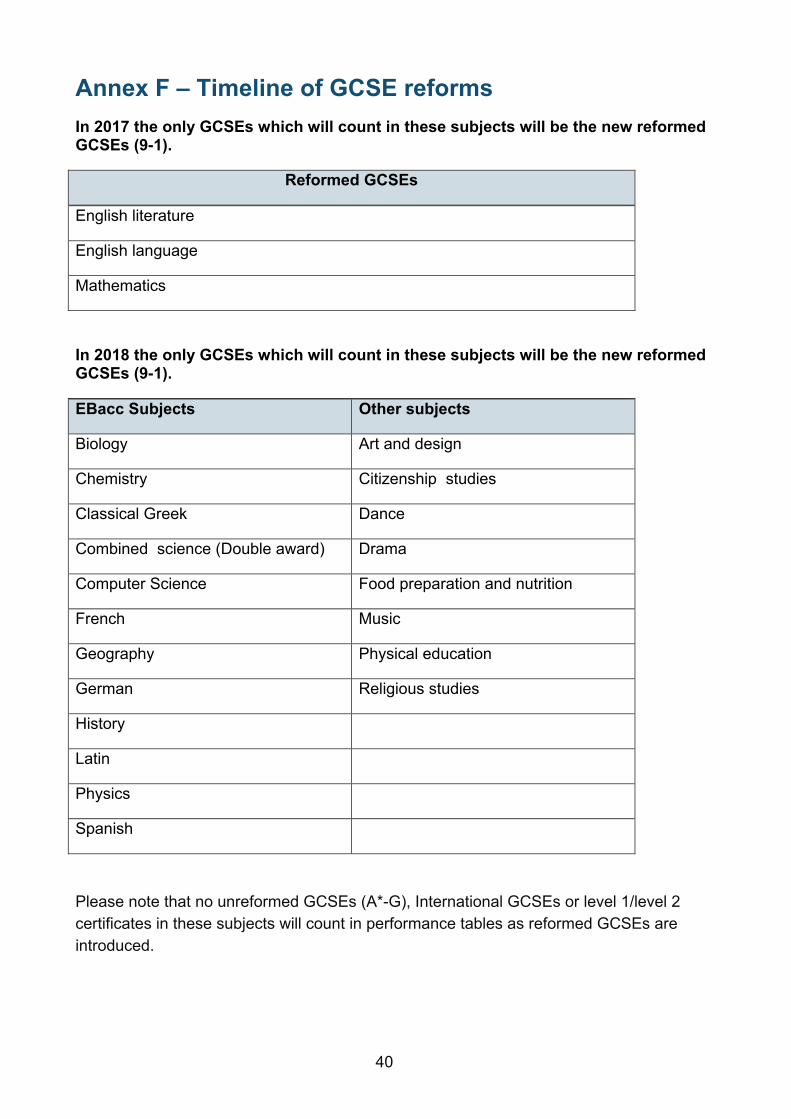
Annex F – Timeline of GCSE reforms In 2017 the only GCSEs which will count in these subjects will be the new reformed GCSEs (9-1).
Reformed GCSEs
English literature
English language
Mathematics
In 2018 the only GCSEs which will count in these subjects will be the new reformed GCSEs (9-1).
EBacc Subjects Other subjects
Biology Art and design
Chemistry Citizenship studies
Classical Greek Dance
Combined science (Double award) Drama
Computer Science Food preparation and nutrition
French Music
Geography Physical education
German Religious studies
History
Latin
Physics
Spanish
Please note that no unreformed GCSEs (A*-G), International GCSEs or level 1/level 2 certificates in these subjects will count in performance tables as reformed GCSEs are introduced.
41
© Crown copyright 2016
This publication (not including logos) is licensed under the terms of the Open Government Licence v3.0 except where otherwise stated. Where we have identified any third party copyright information you will need to obtain permission from the copyright holders concerned.
To view this licence: visit www.nationalarchives.gov.uk/doc/open-government-licence/version/3 email [email protected] write to Information Policy Team, The National Archives, Kew, London, TW9 4DU
About this publication: enquiries www.education.gov.uk/contactus download www.gov.uk/government/publications
Reference: DFE-00075-2015
Follow us on Twitter: @educationgovuk
Like us on Facebook: facebook.com/educationgovuk