Embed Size (px)
Citation preview

Zampori L Saouter E Schau E Cristobal J Castellani V Sala S
Guide for interpreting life cycle assessment result
2016
EUR 28266 EN
This publication is a Technical report by the Joint Research Centre (JRC) the European Commissionrsquos science and
knowledge service It aims to provide evidence-based scientific support to the European policy-making process
The scientific output expressed does not imply a policy position of the European Commission Neither the
European Commission nor any person acting on behalf of the Commission is responsible for the use which might
be made of this publication
JRC Science Hub
httpseceuropaeujrc
JRC104415
EUR 28266 EN
PDF ISBN 979-92-79-64114-5 ISSN 1831-9424 doi102788171315
Luxembourg Publications Office of the European Union 2016
copy European Union 2016
The reuse of the document is authorised provided the source is acknowledged and the original meaning or
message of the texts are not distorted The European Commission shall not be held liable for any consequences
stemming from the reuse
How to cite this report Zampori L Saouter E Castellani V Schau E Cristobal J Sala S Guide for
interpreting life cycle assessment result EUR 28266 EN doi102788171315
All images copy European Union 2016 except [page 8] (2015) Source James and Galatola [page 27] (2017)
Source International Journal of Life Cycle Assessment Rigamonti et al 2017
Table of contents
Abstract 1
1 Introduction 2
2 A practical scheme to interpret LCI and LCIA results 4
3 Identification of key issues Hotspots analysis 6
31 The hotspot analysis in the UNEPSETAC Life Cycle Initiative 6
32 The hotspot analysis in the Environmental Footprint pilot phase (2013 ndash 2017) 7
321 Procedure to identify the most relevant impact categories 8
322 Procedure to identify the most relevant life cycle stages 8
323 Procedure to identify the most relevant processes 9
324 Procedure to identify the most relevant elementary flows 9
325 Procedure to identify the hotspots 9
326 Dealing with negative numbers 10
327 Specific instructions about aggregating elementary flows 10
328 Conclusions 10
329 Example to identify most relevant contributions and hotspots 12
3291 Example most relevant Impact Categories 12
3292 Example most relevant Life Cycle Stages 13
3293 Example most relevant Processes 13
3294 Example most relevant Elementary Flows 13
3295 Example hotspots 15
4 Interpretation on Life Cycle Inventory (LCI) level 15
41 Analysis of data sources 16
411 Analysis of the system boundaries 17
412 Foreground system analysis 18
42 Data quality 19
43 Further completeness and consistency checks 23
431 Anomaly assessment 23
432 Cut-off 23
433 Long term emissions 23
5 Interpretation on Life Cycle Impact Assessment (LCIA) level 25
51 Characterization sensitivity analysis 25
511 Case study 1 ndash WEEE management Toxicity-related and Resource-related
impact categories affecting interpretation of results 25
512 Case study 2 ndash Basket of Products Food sensitivity analysis comparing different impact assessment methods 27
513 Conclusions and recommendations 28
52 Characterization mapped flows and unmapped flows 28
521 Comparison between two different methods 28
522 Analysis of uncharacterized flows within an impact category 30
523 Conclusions and recommendations 33
53 Normalization sensitivity analysis 33
531 Conclusions and recommendations 35
54 Weighting sensitivity analysis 35
541 Conclusions and recommendations 39
6 Estimation of uncertainty 40
611 Conclusions and recommendations 40
7 Meta-analysis 41
711 Conclusions and recommendations 42
8 Conclusion 43
References 45
List of abbreviations and definitions 51
List of figures 52
List of tables 53
1
Abstract
Interpretation of the results of a life cycle assessment (LCA) study is a mandatory phase
of LCA and it is a key aspect in order to derive robust conclusions and recommendations
One of the key aims of LCA is to provide the decision makers with comprehensive and
understandable information this task is achieved by a proper interpretation of the
results of an LCA study
The robust interpretation of a LCA study needs specific guidance to support the decision
making process both in policy and business contexts Existing standards and guidelines
provide a framework for interpretation but there is the need of improving
comprehensiveness and practical aspects thereof This report aims at providing
practitioners with a practical guidance on what are the aspects to be always taken into
account when interpreting results of an LCA Building on this report further guidance
needs to be developed to support interpretation of LCA studies both for LCA practitioners
and LCA users (eg decision makers)
This report provides a practical and schematic workflow to be followed during
interpretation starting from the assessment of the hotspots of the baseline scenario
which is completed by sensitivity completeness and consistency checks to be
performed at the level of the life cycle inventory (LCI) and life cycle impact assessment
(LCIA) Additionally case studies are reported to illustrate specific issues related to
interpretation of results
2
1 Introduction
Life cycle assessment (LCA) is more and more considered a reference method for the
evaluation of supply chains production and consumption systems up to regions
(Hellweg and Mila I Canals 2014)
Life cycle interpretation is one of the four phases identified in the ISO 14040 and the
ISO 14044 standards (ISO 2006ab) In fact according to the ISO standard
interpretation of Life Cycle Inventory (LCI) or Life Cycle Impact Assessment (LCIA)
phases according to the goal and scope of the study is a required step of an LCA study
ISO 14044 further specifies that interpretation comprises the following elements i) an
identification of the significant issues based on the results of the LCI and LCIA phases of
LCA ii) an evaluation that considers completeness sensitivity and consistency checks
iii) conclusions limitations and recommendations
In 2013 the European Commission has put forward a communication which aims at
harmonising the application of LCA for evaluation green products (Building the Single
Market for Green Products EC 2013a) calculating their Environmental Footprint (EF)
(both Product environmental footprint ndash PEF and Organisation environmental footprint ndash
OEF) The communication is accompanied by the PEF Guide (EC 2013b) which explains
that interpretation of the results of a PEF study serves two purposes i) to ensure that
the performance of the PEF model corresponds to the goals and quality requirements of
the study in this sense PEF interpretation may inform iterative improvements of the
PEF model until all goals and requirements are met and ii) to derive robust conclusions
and recommendations from the analysis for example in support of environmental
improvements
The International Reference Life Cycle Data System (ILCD) Handbook (EC 2010)
clarifies that interpretation of an LCA has two main purposes that fundamentally differ i)
steering the work towards improving the Life Cycle Inventory model to meet the needs
derived from the study goal ii) especially for comparative LCA studies (while partly also
applicable to other types of studies) it serves to derive robust conclusions and often
recommendations
Notwithstanding that several methodological guidance exists on the different steps of
LCA so far the interpretation phase has been little systematized even though its
importance is well recognized within the LCA community LCA studies sometimes
formulate conclusions and recommendations disregarding the uncertainties and the lack
of consistency within the LCI and LCIA steps and across the goal and scope definition
The need of guidance for the interpretation phase is becoming even more important as
LCA is being increasingly recognised and used by various stakeholders LCA has recently
become a reference methodology for decision support in the policy context in which its
results may impact entire sectors or societies In the EU context these recent trends are
reflected through initiatives and pilots related to the above-mentioned Building the
Single Market for Green Products (EC 2013a) as well as the new inclusion of LCA among
the methods in the EU Better Regulation toolbox (EC 2015) which identified tools
relevant for conducting the impact assessment of policies In this setting robust and
sound interpretation of LCA results is a must
Several authors have provided evidence that interpretation is one of the key steps of an
LCA study and give guidance andor recommendations depending on the purpose of the
study Skone (2000) pointed out that the purpose of performing life cycle interpretation
is to determine the level of confidence in the final results and communicate them in a
fair complete and accurate manner Initially it was recognized that interpretation was
not one of the hot topics in literature studies (Heijungs et al 2001) and authors
provided numerical techniques for interpretation More recently other authors such as
Guadreault et al (2009) while recognizing that LCA has become an important
methodology for more sustainable process design observed that its application in a
decision-making context has been limited by a poor understanding of methodological
3
choices and assumptions therefore they recommend careful interpretation of results to
improve the quality of the outcome (ie improve the decision-making process) This
view is shared by authors such as Prado Lopez et al (2014) who have identified the lack
of robust methods of interpretation to support decision makers hence they provide a
novel approach based on a multi-criteria decision analytic method (stochastic multi-
attribute analysis for life-cycle impact assessment (SMAA-LCIA)) which in their view
should support both interpretation of results and policymakers Van Hoof et al (2013)
explained how normalization helps maintain a multi-indicator approach while keeping the
most relevant indicators allowing effective decision making Finally other authors such
as Cellura et al (2011) and Huang et al (2013) performed LCA of specific products and
they pointed out the relevance of sensitivity analysis to strengthen the reliability of the
results obtained and draw conclusions to support sector specific guidelines A structured
approach covering the LCIA phase has been proposed (Castellani et al 2017)
highlighting the importance of a systematic sensitivity analysis of impact assessment
models normalization and weighting set Regarding normalisation and weighting steps
which are optional according to ISO standards a recent overview of approaches
strengths and limitations has been provided in the context of activities of the
UNEPSETAC Life Cycle Initiative (UNEPSETAC LCI) by Pizzol et al (2016)
The objective of this technical report is to provide guidance on how to perform an
interpretation of LCI and LCIA results based on what are the meaningful aspects to be
taken into account common to the majority of LCA studies
This technical report aims to be a practical document to be used by LCA practitioners as
a checklist of the main aspects to consider when interpreting LCI and LCIA results
Therefore this report makes extensive use of examples based on real case studies that
may help critically assess LCA results ensuring a reliable decision- and policy-making
support
A general framework on how to perform a proper interpretation is presented in chapter
2 the key aspects will be discussed further on in the report using case studies as an
example to guide the reader and the practitioner through ldquoreal liferdquo applications
Chapter 3 focuses on the identification of significant issues namely the main
contributors to the LCIA results (ie hotspots most relevant impact categories life cycle
stages processes and elementary flows)
Chapter 4 and 5 focus on the evaluations (sensitivity completeness and consistency
checks) in relation to the LCI and LCIA phases respectively Regarding the LCI the
report goes through the analysis of the data sources by giving examples on how to
interpret the system boundaries and the foreground system) it provides an overview on
data quality and it comprises further completeness and consistency checks (eg cut-off
long term emissions anomaly checks) When analysing the LCIA the report provides
insights on sensitivity analysis regarding characterization normalization and weighting
When dealing with characterization the attention of the reader is drawn also on issues
such as the mapping between the inventory and the characterization models and the
evaluation of uncharacterized elementary flows
Chapter 6 and 7 deal with overarching topics such as estimation of uncertainty of the
results of LCA study and meta-analysis
4
2 A practical scheme to interpret LCI and LCIA results
The initial step of the interpretation phase is to review information from the first three
phases of the LCA process such as the ones used to build the study goals and scope
quality assurance procedures reporting requirements results assumptions external
involvement (eg stakeholders peer reviews) (Skone 2000)
Both ISO 14044 and the ILCD Handbook (EC-JRC 2011a) propose a scheme with the
elements to be considered in the interpretation phase and their relation to the other
phases of the LCA study
The elements can be grouped in
identification of significant issues (based on the results of the LCI and LCIA
phases)
the purpose of this first element of interpretation is to analyse and structure the
results of earlier phases of the LCILCA study in order to identify the significant
issues There are two interrelated aspects of significant issues i) firstly there are
the main contributors to the LCIA results ie most relevant life cycle stages
processes and elementary flows and most relevant impact categories ii)
secondly there are the main choices that have the potential to influence the
precision of the final results of the LCA These can be methodological choices
assumptions foreground and background data used for deriving the process
inventories LCIA methods used for the impact assessment as well as the
optionally used normalisation and weighting factors
evaluation that considers completeness sensitivity and consistency checks
Completeness checks on the inventory are performed in order to determine the
degree to which it is complete and whether the cut-off criteria have been met
Sensitivity checks have the purpose to assess the reliability of the final results
and of the conclusions and recommendations of the LCA study The consistency
check is performed to investigate whether the assumptions methods and data
have been applied consistently throughout the LCILCA study
conclusions limitations and recommendations
Integrating the outcome of the other elements of the interpretation phase and
drawing on the main findings from the earlier phases of the LCA the final
element of the interpretation is to draw conclusions and identify limitations of the
LCA and to develop recommendations for the intended audience in accordance
with the goal definition and the intended applications of the results
In this report a schematic workflow representing a practical approach to interpret LCI
and LCIA results is proposed in Fig1 building on both ISO 14044 (ch 4511) and the
ILCD Handbook (ch 91) (EC-JRC 2011a) The workflow is to be seen as an iterative
approach to finally draw robust conclusions and recommendations
The scheme should not be seen as substituting the approaches of the ISO 14044 and the
ILCD Handbook instead it should be seen as a practical application of the requirements
laid down in these documents
Furthermore the scheme should not be intended as a comprehensive list of items to
check instead it should be seen as a normal workflow that should be carried out by an
LCA practitioner in order to derive robust conclusions out of the LCA study More
accurate and case-specific checks should be done depending on the intended goal and
scope of the study
Further aspects such as the appropriateness of the functional unit the intended goal
the system boundaries and value choices should normally be part of an interpretation in
order to identify recommendations and limitations of the study and draw the appropriate
conclusions They are not discussed further in this report but it is recommended that at
5
least each decision based on a personal or a stakeholderrsquos value shall always be
documented and explained in the conclusions of the LCA study This is consistent with
one of the key aims of LCA which is to provide the decision makers with comprehensive
and understandable information in a transparent manner
Figure 1 Practical application of requirements in ISO 14044 and ILCD Handbook to interpret LCI and LCIA results
6
3 Identification of key issues Hotspots analysis
In order to get started with interpretation of results it is necessary to identify what the
key issues are Once the key issues are identified it is possible to further evaluate the
overall robustness of the LCA study by using for example completeness consistency and
sensitivity checks
This chapter on hotspot analysis gives an overview of the overarching methodological
framework of hotspot analysis as currently developing with the UNEPSETAC Life Cycle
Initiative - Flagship Project 3a and the hotspot analysis as tested in the Environmental
Footprint (EF) pilot phase (2013 ndash 2017) In the first case hotspot analysis is regarded
as a subject on its own in the second case it is shown a practical way to perform a
hotspot analysis in an environmental footprinting context in the EU Environmental
Footprint it is more focused on the interpretation of the screening study results of the
average or representative product1 The hotspots in a EU Environmental Footprint may
be but does not have to found in a contribution analysis of the characterized results
Therefore in this chapter we first describe the hotspot analysis as outlaid in the
UNEPSETAC LCI and then the hotspot analysis as performed in the EF pilot phase
31 The hotspot analysis in the UNEPSETAC Life Cycle Initiative
The UNEPSETAC Life Cycle Initiative has been running a Flagship project (nr 3a) on
hotspot analysis since 2012 until 2017 According to UNEPSETAC (2016) the benefits
of hotspots analysis include ensuring
Focus on priority issues (eg waste water materials of concern)
Focus on the right life cycle stage (eg material acquisition manufacturing use
end of life)
Focus on the right actors (eg producers manufactures suppliers retailers
customers) to evaluate influence and implement solutions
Implications of trade-offs are understood
Resources (eg time money) can be effectively allocated to actions
Previously there was not currently a common global approach to hotspots analysis nor
has there been sufficient effort to bring together or share best practice amongst those
organisations or initiatives currently developing and using these methods Nor was there
any accepted guidance on how to translate and apply the results of hotspots analysis
into meaningful sustainability information and insight for use by industry governments
and other stakeholders Therefore the UNEP SETAC Life Cycle Initiative established a
new Flagship Project to address these and other issues The objectives of the
UNEPSETAC LCI Flagship Project 3 are to produce
1 A common methodological framework and global guidance for sustainability hotspots analysis
2 A protocol for the appropriate use and communication of sustainability information derived from hotspots analysis
3 To evaluate and if possible implement a range of options to bring together the findings from existing hotspots studies to provide a richer global picture of sustainability hotspots in the economy and society
Phase 1 was finished in December 2014 and gives an overview of different tools and
methods that can be used in the hotspot analysis This includes 42 hotspots analysis
1 In the context of the EF pilot phase within each Product Environmental Footprint Category Rule
(PEFCR) pilot a ldquorepresentative productrdquo has to be defined which is representing gt50 of the European market The PEF screening study is a PEF study conducted on the representative product one of the aims of the screening study is to identify the hotspots most relevant
elementary flows processes and life cycle stages
7
methodologies divided into product sector and national scale of application Of these 21
methodologies (4 at the national-level 5 at the sector-level and 12 predominantly
applied at the product category-level) were shortlisted and further analysed Examples
of methods are EU EIPRO and Global Protocol for Community Scale GHG emissions on
the national level GHG Protocol Corporate Value Chain (Scope 3) Accounting and
Reporting Standard and Sustainability Accounting Standards Board Materiality Maptrade on
the sector level and French Grenelle I and II BPX 30-323-0 Product Lifecycle
Environmental Impact Quantification Guidance Standard and Water Quality Association
(WQA) Hotspots Analysis on the product level Please refer to Figure ES 2 in (Barthel et
al 2014) for the complete list
This first phase of the project fed into the second phase of the Flagship project
Phase 2 is running from January 2015 ndash January 2017 and produces the methodological
framework (UNEPSETAC 2016) and the communication guidance2 These are currently
in a six-weeks public consultation (27 Oct ndash 15 Dec 2016) The framework provides
a recognized set of guiding principles and practices for hotspots analysis
a globally agreed methodological framework for hotspots analysis
agreement on the appropriate use and communication of product sustainability
information derived from hotspots analysis
Future step will be to work with hotspot analysis for cities and regions and road testing
of the methodological framework
32 The hotspot analysis in the Environmental Footprint pilot
phase (2013 ndash 2017)
The 2013-2017 Environmental Footprint (EF) pilot phase has three main objectives
test the process for developing product- and sector-specific rules
test different approaches to verification
test communication vehicles for communicating life cycle environmental
performance to business partners consumers and other company stakeholders
This is tested by groups of organisations called Technical Secretariats (TS) who
volunteered to develop the rules for their product or sector
The hotspot analysis as described below were tested and developed in an iterative way
on the approximatively 25 pilots participating in the EF pilot phase to develop Product
Environmental Footprint (PEF) Category Rules (PEFCR) or Organisation Environmental
Footprint (OEF) Sector Rules (OEFSR)
A hotspot analysis is required for the PEFOEF screening studies of the average or
representative product for the PEFCROEFSR and for the supporting studies3 (EF study of
a single productorganisation belonging to the product categorysector) when developing
PEFCROEFSR (PEFCR Guidance document (EC 2016))
The hotspot analysis in the EF context aims to identify the hotspots the most relevant
impact categories life cycle stages processes and elementary flows as shown in Fig 2
and it provides a guidance on how to do that
2 Communicating hotspots The effective use of sustainability information to drive action and improve
performance from httpwwwwraporguksitesfileswrapHotspots20Communications20Guidelines20v35207Oct2016pptx 3 The EF supporting studies are PEFOEF studies run by single companies with the aim of testing the draft
PEFCRs and OEFSRs
8
Figure 2 Hotspot analysis in the context of the Environmental Footprint pilot (James amp Galatola 2015)
As shown in the figure the hotspots (and thereby also the hotspot analysis) is important
for the decision on which life cycle stages processes and elementary flows that are
hotspots (gt 50 contribution) and which are relevant (gt 80 contribution)
The hotspots might serve the purpose of warning an organisation about the area where
they should focus their attention in order to improve the environmental performance of a
product (PEF) or an organisation (OEF) Whilst traditionally LCA practitioners are
expected to provide primarysite-specific data for processes taking place in the
foreground and secondary data for processes taking place in the background in PEFOEF
the implementation of the materiality principle leads to a different approach The
processes most contributing to the final results (in terms of environmental impacts or
savings) are those for which the best quality of data should be provided For the
processes less relevant it is possible to use data of lower quality
321 Procedure to identify the most relevant impact categories Starting from the normalised and weighted results of PEF screening study each
Technical Secretariat is asked to select the impact categories that they consider more
relevant in terms of communication purposesrdquo
322 Procedure to identify the most relevant life cycle stages
The proposed guideline by the PEFCR Guidance (EC 2016) is to consider as relevant all
life cycle stages which together contribute over 80 (before normalisation and
weighting) to any of the baseline impact categories This should start from the largest to
the smallest contributions In addition more life cycle stages can be added to the list of
the most relevant ones
In order to guarantee a minimum level of harmonisation among different
PEFCRsOEFSRs a list of default life cycle stages was identified
Raw material acquisition and pre-processing (including production of parts and
unspecific components)
9
Production of the main product4
Product distribution and storage
Use stage scenario (if in scope)
End-of-life (including product part reuse recovery recycling if in scope)
323 Procedure to identify the most relevant processes
Each impact category shall be investigated to identify the most relevant processes The
identification of the most relevant processes shall be done at the whole life cycle level
Similaridentical processes taking place in different life cycle stages (eg transportation)
shall be accounted separately
In the context of the EF pilot phase processes were defined as most relevant where they
collectively contributed at least 80 to any impact category before normalisation and
weighting
In some instances vertically aggregated datasets may be identified as representing
relevant processes It may not be obvious which process within an aggregated dataset
is responsible for contributing to an impact category The metadata accompanying the
data should be reviewed and used to identify relevant processes If this is not possible it
can be decided whether to seek further disaggregated data or to treat the aggregated
dataset as a process for the purposes of identifying relevance5
324 Procedure to identify the most relevant elementary flows
As far as the most relevant elementary flows is concerned they are the ones contributing
cumulatively more than 80 to the impact category It can be decided whether this is
calculated at the level of overall life cycle and or single (most relevant) process level
All elementary flows contributing more than 5 to the impact category shall be
considered as relevant
Once the most relevant elementary flows have been identified they shall be linked to the
processes emitting them
325 Procedure to identify the hotspots
A hotspot can be identified at different levels of granularity impact category life cycle
stage process or elementary flow
In the context of PEFOEF pilot phase a hotspot is defined as either (James and Galatola
2015)
OPTION A (1) life cycle stages (2) processes and (3) elementary flows
cumulatively contributing at least 50 to any impact category before
normalisation and weighting (from the most contributing in descending order)
OPTION B At least the two most relevant life cycle stages processes and at least
two elementary flows (minimum 6) Additional hotspots may be identified by the
TS
4 If it is not possible to differentiate between the production of the main product and ancillary materials and
other life cycle stages eg raw material acquisition and transport then these life cycle stages can be merged Adequate justifications shall be provided in the screening report and be highlighted in the consultation phase If an aggregated life cycle stageprocess is most relevant it implies that all the processes included will be classified as most relevant 5 In this last case if an aggregated dataset is relevant everything in it is automatically relevant
10
326 Dealing with negative numbers
When identifying the percentage contribution from any process or flow it is important
that absolute values are used (ie the minus sign is ignored) in calculating percentage
contributions This allows indentifying the relevance of any credits
327 Specific instructions about aggregating elementary flows
The toxicity-related impact categories (ldquoHuman toxicity cancer effectsrdquo ldquoHuman
toxicity non-cancer effectsrdquo and ldquoFreshwater ecotoxicityrdquo) contain long lists of
characterization factors specified on the elementary flow category level 3 (also known
as sub-compartment ndash for example urban air freshwater agricultural soil) The impact
category ldquoParticulate matterrdquo also contains characterization factors at the level 3
category
It is recommended to aggregate the elementary flows on the level 2 category (ie
emissions to air water soil) in the contribution analysis This is to make the analysis
more manageable and because the level 3 category does not give additional information
when analyzing on the process level (the processes already contain information on the
location type of the emissions)
It is important to model foreground data on the level 3 category for particulates and
toxic substance flows because the characterization factors can deviate considerably
Metal resource flows are not specified per origin of ore type in the source files of the
ILCD recommended methods However in several background databases metal
resource flows are differentiated (for example Silver Ag 46E-5 Au 13E-4 in ore
Silver Ag 42E-3 Au 11E-4 in ore Silver Ag 21E-4 Au 21E-4 in ore etc)
Therefore the specified flows were added to the ILCD method in LCA software packages
with the same characterization factors as for the unspecified metals When doing a
contribution analysis of the metal resource flows it is therefore recommended to
aggregate the flows per metal (silver copper nickel etc)
There are 5 different fossil fuel related resource flows specified in the source files of the
ILCD recommended methods (brown coal 119 MJkg crude oil 423 MJkg hard coal
263 MJkg natural gas 441 MJkg peat 84 MJkg) However in several background
databases fossil resource flows are specified with different calorific values (for example
Gas natural 468 MJ per kg Gas natural 366 MJ per m3 Gas natural 35 MJ per m3
Gas natural 303 MJ per kg etc) Therefore the specified flows were added to the
ILCD method in LCA software packages with characterization factors related to the
factors in the original source taking the different calorific value into account When
doing a contribution analysis of the fossil resource flows it is therefore recommended to
aggregate the flows based on the 5 original flows (brown coal crude oil hard coal
natural gas and peat)
328 Conclusions
In table 1 the requirements to define most relevant contributions during the EF pilot
phase are summarized as found in the PEFCR Guidance (EC 2016)
11
Table 1 Summary of requirements to define most relevant contributions and hotspots (James amp Galatola 2015)
Item At what level does relevance need to be identified
Threshold
Most relevant impact categories In the final results starting from normalized and weighted results but deviations possible if justified
No threshold Decision left to TS but subject to stakeholder consultation and TAB opinion
Most relevant life cycle stages For each impact category before normalization and weighting Not relevant for data needs identification
All life cycle stages contributing cumulatively more than 80 to any impact category
Hotspots For each impact category before normalization and weighting
Either (i) life cycle stages processes and elementary flows cumulatively contributing at least 50 to any impact category or
(ii) at least the two most relevant impact categories life cycle stages processes and at least two elementary flows (minimum 6) Additional hotspots may be identified by the TS
Most relevant processes For each impact category before normalization and weighting Essential for data needs identification
All processes contributing cumulatively more than 80 to any impact category
Most relevant elementary flows For each impact category before normalization and weighting Essential for data needs identification
All elementary flows contributing cumulatively more than 80 to any impact category and in any case all those contributing more than 5 individually
When assessing what is most relevant it is also recommended to check if what is
identified as being non-relevant can be actually considered as such A practical example
is given at paragraph 431
12
329 Example to identify most relevant contributions and hotspots
The PEFCR Guidance (2016) also provided an example on how to perform a hotspot
analysis and the identification of most relevant impact categories life cycle stages
processes and elementary flows The example is reported here it is a fictitious example
not based on any specific PEF study results
3291 Example most relevant Impact Categories
Table 2 shows the contribution of different impact categories based on normalised and
weighted results
Table 2 Selection of most relevant Impact Categories (James amp Galatola 2015)
Impact category Unit Contribution ()
Climate change kg CO2 eq 215
Ozone depletion kg CFC-11 eq 30
Human toxicity cancer effects CTUh 83
Human toxicity non-cancer effects CTUh 149
Particulate matter kg PM25 eq 01
Ionizing radiation human health Kbq U235 eq 05
Photochemical ozone formation kg NMVOC eq 24
Acidification molc H+ eq 15
Terrestrial eutrophication molc N eq 10
Freshwater eutrophication kg P eq 10
Marine eutrophication kg N eq 01
Freshwater ecotoxicity CTUe 01
Land use kg deficit 143
Water resource depletion m3 water eq 186
Mineral fossil resource depletion kg Sb eq 127
Based on the normalised and weighted results the TS can decide that the following
impact categories are relevant for communication purposes climate change water
depletion and land use Where there is deviation from the most significant contributors
to the normalised and equally weighted results justification shall be provided
Once the relevant impact categories for communication purposes have been selected
the TS shall start identifying the most relevant life cycle stage processes and flows per
each impact category (all baseline EF impact categories not only those relevant for
communication purposes)
13
3292 Example most relevant Life Cycle Stages
Table 3 shows the contribution of different life cycle stages to the climate change impact
category (based on the characterised inventory results before normalisation and
weighting)
Table 3 Selection of most relevant life cycle stages (James amp Galatola 2015)
Life cycle stage Contribution ()
Raw material acquisition and pre-processing 421
Production of the main product 252
Product distribution and storage 164
Use stage (if in scope) 108
End-of-life 55
The three life cycle stages in purple will be the ones identified as most relevant for
climate change as they are contributing to more than 80 This procedure shall be
repeated for all the baseline EF impact categories
3293 Example most relevant Processes
Table 4 shows the contribution of different processes to the climate change impact
category (based on the characterised inventory results before normalisation and
weighting)
Table 4 Selection of most relevant processes (James amp Galatola 2015)
Unit process Contribution ()
Process A 89
Process B 614
Process C 234
Process D 28
Process E 15
Process F 09
Other processes 09
According to the proposed procedure the processes in orange shall be selected as ldquomost
relevantrdquo Process E could be added to the as most relevant ones based on specific
considerations (eg it is under operational control it is of relevance for the specific
sector etc) This procedure shall be repeated for all the baseline EF impact categories
3294 Example most relevant Elementary Flows
Considering that the selection of the most relevant elementary flows can be done at
overall life cycle level (option 1) andor per relevant process (option 2) there are two
14
possible outcomes Starting from the inventory results provided in Table 5 the list of
most relevant flows are highlighted in blue in Table 6 (at overall life cycle) and Table 7
(at process level)
Table 5 Inventory results (climate change results expressed in gCOeq) (James amp Galatola 2015)
Inventory flow Substance 1 Substance 2 Substance 3 Substance 4 Substance 5 Total
Process A 249 85 6 45 5 390
Process B 1100 600 500 450 50 2700
Process C 300 250 20 30 430 1030
Process D 60 30 20 10 5 125
Process E 64 1 1 1 1 68
Process F 15 10 8 5 3 41
Other processes 15 10 8 5 3 41
Total 1803 986 563 546 497 4395
Table 6 Most relevant inventory flows contributing to climate change (based on the inventory results before normalisation and weighting) - overall life cycle (option 1) (James amp Galatola 2015)
Inventory flow Substance 1 Substance 2 Substance 3 Substance 4 Substance 5 Total
Process A 57 19 01 10 01 89
Process B 250 137 114 102 11 614
Process C 68 57 05 07 98 234
Process D 14 07 05 02 01 28
Process E 15 00 00 00 00 15
Process F 03 02 02 01 01 09
Other processes 03 02 02 01 01 09
Total 410 224 128 124 113
Table 7 Most relevant inventory flows contributing to climate change (based on the inventory results before normalisation and weighting) ndash process level (option 2) (James amp Galatola 2015)
Inventory flow Substance 1 Substance 2 Substance 3 Substance 4 Substance 5 Total
Process A 64 22 2 12 1 100
Process B 41 22 19 17 2 100
Process C 29 24 2 3 42 100
15
Process D 48 24 16 8 4 100
Process E 94 1 1 1 1 100
Process F 37 24 20 12 7 100
Other processes 37 24 20 12 7 100
3295 Example hotspots
In Tables 8 and 9 the identified hotspots - based on the two different approaches
available- are presented
Table 8 Hotspots based on 50 cumulative contribution (OPTION A) (James amp Galatola 2015)
Hotspots
Life cycle stages Raw material acquisition and pre-processing
Production of the main product
Processes Process B
Elementary flows Option 1 Substance 1 and 2
Option 2
Substance 1 and 2 in processes B
Substance 1 and 5 in process C
Substance 1 in process E
Table 9 Hotspots based on top two representatives (OPTION B) (James amp Galatola 2015)
Hotspots
Life cycle stages Raw material acquisition and pre-processing
Production of the main product
Processes Process B
Process C
Elementary flows Option 1 Substance 1 and 2 in process B
Option 2 Substance 1 in process E6 and substance 5 in process C
4 Interpretation on Life Cycle Inventory (LCI) level
During the life cycle inventory phase the actual data collection and modelling of the
system has to be done in line with the goal definition and aiming at meeting the
requirements derived in the scope phase The LCI results are the input to the
subsequent Life Cycle Impact Assessment (LCIA) phase
Interpretation involves evaluations at the level of Life Cycle Inventory in order to
improve the inventory model to meet the needs derived from the study goal
perform a sensitivity analysis to check for limitations in the appropriateness of
the life cycle inventory work
6 Choosing the hotspots based on option B-2 might lead to anomalies (like in this fictitious
example) where an elementary flow is identified as hotspot even if its absolute value is not
prominent
16
understanding the underlying assumptions when secondary datasets are used in
the model
combining the above points to refine the LCA model
draw appropriate and robust conclusions
Key aspects to evaluate life cycle inventories are the consistency and completeness
thereof They can be evaluated taking into account different aspects A sensitivity check
to evaluate the reliability of the results is also a needed step
A first aspect to be taken into account is the data source Primary data are collected
directly by the company performing the study thus the consistency of the data used
with the goal and scope of the study should be more straightforward However when
and LCA study is making use of secondary datasets to model the background system a
careful analysis of the consistency of these datasets with the primary data collected and
in relation with the goal and scope shall be made
Indeed different modelling assumptions in datasets aimed at representing the same
product system can lead to different results affecting the reliability of the LCA study
(Williams et al 2009) An example of the relevance of different data sources and
consistency has been discussed in Corrado et al (2017) this study focuses on different
data sources to originate the inventory of arable crops (1 kg of wheat) The choice of the
secondary dataset can have a relevant influence on LCA results and it is considered
among the challenges for a robust LCA (Notarnicola et al 2017a)
A second aspect to be taken into account regarding life cycle inventories is the quality of
the data used regarding time geographical and technological representativeness
precision methodological compliance and documentation Therefore in this chapter a
paragraph is dedicated to analyzing more in detail this aspect
A third relevant aspect in relation to LCIs is the consistency and completeness in relation
to single aspects such as cut-off inclusionexclusion of specific elementary flows (eg
long term emissions) It is not straightforward to judge if an inventory can be considered
complete As a general rule it has always to be kept in mind that the inventory has to
be checked in its completeness in relation to the goal and scope of the study for
example if the goal of the study is to assess only the climate change impact category
the completeness of the inventory shall be evaluated against those emissions that are
actually contributing to climate change within the system boundaries It does not lead to
improved conclusions the compilation of a more detailed inventory with the inclusion of
eg substances that do not contribute to climate change
41 Analysis of data sources
When selecting secondary data sets it is important to ensure that all data sets used in
the modelling of the system model are methodologically consistent (ie consistency
check) The use of inconsistent data can lead to an unreliable and distorted LCA study
often with wrong conclusion and recommendations drawn Furthermore use of datasets
with different level of completeness (ie completeness checks) may also lead to
unreliable conclusions
The study from Corrado et al (2017) is used as a case study to highlight the relevance
of different data sources in an LCA study Therefore the content of this paragraph is
mainly based on this paper The paper is organized as follows firstly the authors report
an overview of the system boundaries and underlying assumptions adopted in building
secondary datasets for arable crops within three databases Secondly they summarise
the approaches adopted to model the foreground system highlighting analogies and
differences Afterwards they point out the influence that modelling approaches can have
on the impact assessment Finally the combination of these elements allowed to derive
some considerations on relevant elements of datasets
17
It is focused on the analysis of secondary datasets for arable crops production as
modelled in three databases adopted as source of secondary data in LCA Agribalyse v
12 (Colomb et al 2015) Agrifootprint v 10 (Blonk Agri-footprint BV 2014) and
Ecoinvent v 31 (Weidema et al 2013) For simplicity in the remainder of the report
they are named Agribalyse Agrifootprint and Ecoinvent respectively
The authors performed three types of analysis
comparison of the system boundaries and underlying assumptions
analysis of how the foreground system is modelled in each dataset focusing on
different aspects such as fertilisers application and nutrient fate plant
protection products application and fate heavy metals (HMs) input mass balance
and fate irrigation agricultural operations land occupation and transformation
comparison of the results of the life cycle impact assessment for the foreground
system including the relative contribution of background
411 Analysis of the system boundaries
The system boundaries and the main underlying assumptions adopted to model arable
crops production in the three databases are reported in Table 10
Table 10 Underlying assumptions in relation to the three databases considered by the authors (Corrado et al 2017)
Agribalyse Agrifootprint Ecoinvent
Data source Provided by technical institutes (eg ARVALIS ndash Institut du Veacutegeacutetal)
Different sources (eg
scientific literature official
statistics such as FAOstat
Eurostat)
GL-Pro project ndash Barrois
region (Nemecek and
Baumgartner 2006)
Straw management (when
applicable)
Partly removed from the
field
Totally removed from the
field
Left on the field
Allocation of co-products
(grains and straw)
Not applied because the
straw market was not very
structured at the time when
the datasets were developed
Economic mass and energy
allocation
Not applicable because
straw is assumed to be left
on the field
Nutrients from straw left
on the field
The fertilising effect of crop
residues and emissions from
the residues are allocated to
the crop that generated the
residues
Not applicable The fertilising effects of crop
residues are allocated to the
crop that generated it (only
for P and K) The amount of
fertilisers is corrected for the
amount of nutrients in crop
residues
Crop
rotation
modelling
Phosphorou
s (P) and
potassium
(K) inputs
and
emissions
allocation
P and K fertilisers production
and emissions due to their
application are allocated to
each crop pro rata for the
crop exports
Not reported The amount of P and K of the
residues supplied to the field
through residues were
allocated to the crop that
generates them
18
N inputs and
emissions
allocation
The organic nitrogen
available for the crop to
which the fertiliser is
applied is allocated to that
crop The remaining fraction
that contributes to
increasing the stock of
organic matter was allocated
to all the crops in the
rotation Mineral nitrogen is
completely allocated to the
crop to which it was applied
Not reported Allocation not performed
412 Foreground system analysis
The authors compared the activities modelled in the foreground system of the datasets
referring to seven field activities agricultural operations fertilisers application and
nutrients environmental fate plant protection products (PPP) application and related
environmental fate heavy metals (HMs) input and related environmental fate irrigation
and land occupation and transformation The average crop yields reported in the dataset
presents small differences (wheat min-max barley min-max rapeseed min-max pea
min-max) The 95 confidence interval of the yields is defined only in Agrifootprint
datasets whereas it is not reported in Agribalyse and Ecoinvent datasets
For completeness findings and aspects to be taken into account are below reported The
below checklist can also be used to build a completeness check of the different datasets
and it can be used to build a sensitivity analysis based on the parameters that are seen
to be affecting the final results
Agricultural practices modelling
Management of agricultural residues
Composition of the crop rotation
Allocation to the co-products
Agricultural operations modelling
Number of operations
Number of passages
Machine power
Soil texture
Airborne emissions due to fuel combustion
Emissions of heavy metals due to tires abrasion
Fertilisers application and nutrients fate modelling
The nutrients fate is highly influenced by site-specific conditions
o environmental conditions
o soil type
o agricultural management practices
o type of fertiliser (Brentrup et al 2000)
o spatial differentiated emissions when modelling agricultural systems
Nomenclature (eg the paper shows that phosphorus compounds emissions were
expressed in the datasets with different flows limiting the possibility of making a
comparison among inventory data)
PPP application and environmental fate modelling
19
application method
weather and soil conditions
crop characteristics
irrigation
active substances whose use is not anymore authorised
Heavy metals inputs and environmental fate modelling
Mass balance
Fate
Irrigation modelling
Irrigation volumes
Water flows type
Environmental conditions
Spatially-differentiated water flows
Land use transformation modelling
Amounts of transformed land are considered
Type of land transformed (eg from hellip to hellip)
CO2 emissions due to land transformation
42 Data quality
As data is essential in all quantitative studies like LCAs so is also their quality
Therefore the data applied in the life cycle inventory phase shall be assessed in the
interpretation phase against the goal and scope of the study is the data quality
sufficient for the goal of the study Is the data consistent Can the data be seen as
complete
If the answer is yes then the interpretation can be preceded and conclusions drawn If
no then either the goal and scope need to be adjusted or probably in most cases
better the life cycle inventory phase need to be revisited in an iterative manner to
improve the data quality to the appropriate level The assessment of the data quality is a
mandatory reporting element in the interpretation phase
ISO 14044 (2006) defines data quality as characteristics of data that relate to their
ability to satisfy stated requirements The data quality requirements are described in
the goal and scope of the LCA study and covers the following 10 aspects (ISO14044
2006 ch 4236)
1) time-related coverage age of data and the minimum length of time over which
data should be collected
2) geographical coverage geographical area from which data for unit processes
should be collected to satisfy the goal of the study
3) technology coverage specific technology or technology mix
4) precision measure of the variability of the data values for each data expressed
(eg variance)
5) completeness percentage of flow that is measured or estimated
6) representativeness qualitative assessment of the degree to which the data set
reflects the true population of interest (ie geographical coverage time period
and technology coverage)
7) consistency qualitative assessment of whether the study methodology is applied
uniformly to the various components of the analysis
20
8) reproducibility qualitative assessment of the extent to which information about
the methodology and data values would allow an independent practitioner to
reproduce the results reported in the study
9) sources of the data
10) uncertainty of the information (eg data models and assumptions)
In the EF methods7 the consistency and reproducibility is one of the main aims of any
EF study and not evaluated as part of the data quality assessment Data sources should
be ILCDEF compliant and specified if a PEFCROEFSR is followed Precision and
uncertainty are evaluated together in the EF method Therefore the EF operates with six
semi qualitative data quality requirements instead of 9 in ISO14044 (cf section 56 in
European Commission 2013)
In order to evaluate the appropriateness and the quality of the data used to compile the
LCI they have to be scored against certain requirements As an example the table below
(Table 11) provides the data quality requirements for a PEF study of intermediate paper
products (EC 2013a Schau and Davidsson 2015)
The table 12 shows the semi-qualitative data quality rating (DQR) (based on expert
judgement) of the most impacting processes in an early phase of a PEF study of
intermediate packaging paper The data set DE Potato starch at plant was deemed to
be of too low quality (DQR = 267) as it scored poor (4) on Parameter uncertainty and
Methodological Appropriateness and Consistency to be used for comparative assertion
Therefore another dataset was searched for that was compliant with the goal and scope
of the study
It is also recommended that the practitioner is aware of the methodological choices used
to build the datasets (may be evaluated under Methodological Appropriateness and
Consistency) such as the definition of the system boundaries between nature and
technosphere and the time-horizons of the emissions (short-termlong term)
System boundaries between nature and technosphere are especially relevant for food
and agricultural product (and products made thereof) as for these products the
technosphere is closely interlinked with nature (Schau et al 2008) This includes
modelling of pesticides and fertilizers (De Schryver and Galatola 2016)
The time-horizons of the emissions are essential especially for long lived product and for
end-of-life processes (eg landfilling waste handling of residues from mining in raw
material extraction) (Guo and Murphy 2012) Also how radioactive waste is modelled is
essential to assess with a time horizon in mind Often a distinction is made between
long term and short term emission Where the boundary is set between those (100
years 300 years 50 000 years etc) can therefore be important and should be taken
into account when assessing the data quality for methodological appropriateness and
consistency (see chapter 433)
Database providers publish their modelling principle (see eg Baitz et al 2016) which is
an essential source for evaluating and assessing the data quality (of background data) in
addition to the metadata of the LCI data itself
Table 11 Data quality rating in an example of intermediate paper products (EC 2013 Schau and Davidsson 2015)
7 In the EF Guide the term representativenessrdquo is used instead of coveragerdquo used in ISO 14044 for the
geographical and time-related data quality requirement The term ldquoparameter uncertaintyrdquo is used instead of ldquoprecisionrdquo used in ISO14044 and the term ldquomethodological appropriateness and consistencyrdquo is used in the EF Guide instead of ldquoconsistencyrdquo used in ISO14044
21
Data quality elements
Representativeness
Qu
alit
y level
Qu
alit
y r
atin
g
Defin
itio
n
Tech
no
log
ica
l
Ge
og
rap
hic
al
Tim
e-r
ela
ted
Com
ple
ten
ess
Meth
od
olo
gic
al
Ap
pro
priate
ness a
nd
Co
nsis
tency
Pa
ram
ete
r u
nce
rta
inty
Very good
1
Meets the criterion to a very high degree without need for improvement
Eg Process is same For electricity from grid average technology as country- specific consumption mix
Country specific data
le 3 years old data
Very good completeness (ge 90 )
Full compliance with all requirements of the PEF guide
Very low uncertainty (le 7 )
Good
2
Meets the criterion to a high degree with little significant need for improvement
Eg average technology as country- specific consumption mix
Central Europe North Europe representative EU 27 mix
3-5 years old data
Good completeness (80 to 90 )
Attributional Process based approach AND following three method requirements of the PEF guide met (1) Dealing with multi-functionality (2) End of life modelling (3) System boundary
Low uncertainty (7 to 10 )
Fair 3
Meets the criterion to an acceptable degree but merits improvement
Eg average technology as country- specific production mix or average technology as average EU consumption mix
EU-27 countries other European country
5-10 years old data
Fair completeness (70 to 80 )
Attribution Process based approach AND two of the following three method requirements of the PEF guide met (1) Dealing with multi-functionality (2) End of life modelling (3) System boundary
Fair uncertainty (10 to 15 )
Poor
4
Does not meet the criterion to a sufficient degree but rather requires improvement
Eg average technology as country- specific consumption mix of a group of similar products
Middle east North-America Japan etc
10-15 years old data
Poor completeness (50 to 70 )
Attributional Process based approach AND one of the following three method requirements of the PEF guide met (1) Dealing with multi-functionality (2) End of life modelling (3) System boundary
High uncertainty (15 to 25 )
Very poor
5
Does not meet the criterion Substantial improvement is necessary
Eg other process or unknown not available (na)
Global data or unknown
ge 15 years old data
Very poor or unknown completeness (lt 50 )
Attributional Process based approach BUT None of the following three method requirements of the PEF guide met (1) Dealing with multi-functionality (2) End of life modelling (3) System boundary
Very high uncertainty (gt25 )
Table 12 Data quality rating in an early phase of a PEF study of intermediate packaging paper
22
Representativeness
Data set
Tech
no
logi
cal
Ge
ogr
aph
ical
Tim
e-r
ela
ted
Co
mp
lete
ne
ss
Par
ame
ter
un
cert
ain
ty
Me
tho
do
logi
cal
Ap
pro
pri
ate
ne
ss a
nd
Co
nsi
ste
ncy
Resulting Data Quality Rating (DQR)
CH building hall steel construction 1 3 3 1 3 4 250
CH disposal sludge from pulp and paper production 25 water to sanitary landfill 1 3 3 1 3 4 250
CH disposal steel 0 water to municipal incineration 1 3 3 1 3 4 250
DE lignite briquettes at plant 1 3 3 1 3 4 250
DE maize starch at plant 1 3 3 1 3 4 250
DE potato starch at plant 1 3 3 1 4 4 267
RER AKD sizer in paper production at plant 1 2 3 1 3 4 233
RER aluminium sulphate powder at plant 1 2 3 1 3 4 233
RER building multi-storey 1 2 3 1 3 4 233
RER electricity medium voltage production RER at grid 1 2 2 1 3 3 200
RER facilities chemical production 1 2 3 1 3 4 233
RER heavy fuel oil at regional storage 1 2 3 1 3 4 233
RER heavy fuel oil burned in industrial furnace 1MW non-modulating ltu-sogt 1 2 3 4 3 4 283
RER industrial wood hardwood under bark u=80 at forest road 1 2 3 1 3 4 233
RER industrial wood softwood under bark u=140 at forest road 1 2 3 1 3 4 233
RER natural gas high pressure at consumer 1 2 3 1 3 4 233
RER paper mill integrated ltu-sogt 1 2 3 1 3 4 233
RER PEFEmissions-RF ltu-sogt 1 2 3 3 3 3 250
RER PEFEmissions-VF v03 ltu-sogt 1 2 2 2 4 3 233
RER sodium chlorate powder at plant 1 2 3 1 3 4 233
RER sodium dithionite anhydrous at plant 1 2 3 1 3 4 233
RER sodium hydroxide 50 in H2O production mix at plant 1 2 3 1 3 4 233
RER steel converter chromium steel 188 at plant 1 2 3 1 3 4 233
RER steel electric chromium steel 188 at plant 1 2 3 1 3 4 233
RER sulphate pulp ECF bleached at plant 1 2 3 1 3 4 233
RER sulphate pulp unbleached at plant 1 2 3 1 3 4 233
RER sulphuric acid liquid at plant 1 2 3 1 3 4 233
RER transport freight rail 1 2 3 1 3 4 233
RER transport lorry gt16t fleet average 1 2 3 1 3 4 233
RER Water Withdrawals-VF ltu-sogt 1 1 2 1 3 3 183
23
43 Further completeness and consistency checks
In this section some further checks are presented referring both to completeness and
consistency checks
431 Anomaly assessment An anomaly assessment can be done where based on previous experience unusual or
surprising deviations from expected or normal results are observed and examined for
relevance (Skone 2000)
As a practical example it can be considered the case of LCA studies of mining activities
When the production of eg copper concentrates was assessed adopting an impact
assessment method such as ILCD and performing the hotspot analysis as described in
chapter 3 of this report it was found that the identification of most relevant impact
categories did not include Resource Depletion fossil mineral In addition the most
relevant processes and life cycle stages contributing to this impact category were not
related to the ones involved in the copper extraction In the case under analysis it was
found that elementary flows related to extraction of resources from nature were missing
from the inventory because the dataset used in the analysis did not include in its goal
and scope the assessment of Resource Depletion fossil mineral
A learning was that it is true that it is important to evaluate what is most relevant (eg
impact categories life cycle stages processes elementary flows) however it is also
important to check if what is found as being non-relevant can be actually considered as
such Hence it is important to evaluate if the LCI modelled is complete with regard to
the impact categories that the assessor wants to evaluate
432 Cut-off ISO 14044 identifies cut-off as the ldquospecification of the amount of material or energy
flow or the level of environmental significance associated with unit processes or product
system to be excluded from a studyrdquo ISO 14044 also requires that the effect on the
outcome of the study of the cut-off criteria selected shall be assessed and described in
the final report
Cut-off criteria can be based on
Mass eg lt5 cumulative mass input
Energy eg lt5 cumulative energy input
Environmental significance eg lt5 of the results of the selected impact categories It is important to note that the cut-off criteria need to be selected based on the goal and
scope of the study Therefore if the study is intended to be used for comparisons and
comparative assertions a sensitivity check using all the above three criteria is a
mandatory requirement
433 Long term emissions Long term emissions are those emissions considered to happen beyond 100 years up to
thousands of years (eg 60000)
Not all databases include long-term emissions within the system boundaries In some
cases it can be observed that LCA results after characterization normalization and
weighting are by far dominated by toxicity-related impact categories When this is the
case it is recommended to check if the datasets used include long term emissions
which in terms of absolute amounts are well superior compared to emissions occurring
within 100 years It has also to be noted that the models to estimate long term
emissions are affected by a high uncertainty which has to be taken into account in the
LCA study to avoid biased conclusions and wrong recommendations
When dealing with long term emissions it is important however not to overlook their
potential impact therefore it is recommended to
Assess a baseline scenario excluding long-term emissions
Perform a sensitivity analysis including long-term emissions in the LCI
Include an analysis of the uncertainty associated to the inclusion of long-term
emissions
24
25
5 Interpretation on Life Cycle Impact Assessment (LCIA)
level
Life Cycle Impact Assessment is the phase in an LCA where the inputs and outputs of
elementary flows that have been collected and reported in the inventory are translated
into impact indicator results LCIA has two mandatory steps which are the classification
and the characterization of LCI results and two optional steps normalisation and
weighting
Many elements can be subject to interpretation in the LCIA phase In this report the
focus will be on
the relevance of applying different characterization models
the relevance of applying different normalisation sets
the relevance of applying different weighting sets
the identification of the most sensitive elements in determining the final results
conclusions and recommendations
the coverage of characterization factors compared to the inventoried elementary
flows
Those points will be illustrated in the following section through illustrative case studies
First a case study dealing with sensitivity analysis of using different characterization
models for toxicity-related and resource-related impact categories will be discussed
Second a case study dealing with using different impact assessment methods This case
study will also be used to go through sensitivity analysis in relation to normalisation sets
and weighting sets
Third a case study mapping the coverage of characterization factors of toxicity-related
categories compared to the inventoried elementary flows will be shown
51 Characterization sensitivity analysis
The use of different characterization models to assess a certain impact category may
play a relevant role in the calculation of the final results and the identification of
hotspots most relevant life cycle stages processes and elementary flows
511 Case study 1 ndash WEEE management Toxicity-related and Resource-related impact categories affecting interpretation of results
The first case study is based on a work by Rigamonti et al (2017) the authors selected
a case study in which LCA has been applied to assess a waste electrical and electronic
equipment (WEEE) management system (Biganzoli et al 2015) In that study the
assessment was carried out to quantify the mass balance of the WEEE management
system in Lombardy Region in the year 2011 and to calculate its environmental benefits
and burdens
Firstly they tested characterization models and characterization factors (CFs) for
toxicity-related impact categories human toxicity cancer and non-cancer and eco-
toxicity There is an evolving debate on the robustness of these impact categories and
specifically for what concern impacts due to metals (see eg Pizzol et al 2011) In fact
some specific features of the metals (eg essentiality) as well as elements affecting
their fate modelling (eg different conditions affecting their bioavailability) are not fully
captured by currently available models applied in LCA Therefore the authors ran a
sensitivity analysis where updated CFs for metals were tested along the lines of recent
literature (Dong et al 2014) aiming at identifying the different results associated to
metals impact compared to the ILCD method (EC-JRC 2011) based on the USEtox
model (Rosenbaum et al 2008)
26
The total impact obtained by applying Dong et al 2014 CFs resulted about three times
higher than the corresponding obtained by the USEtox model This is mainly due to the
Dong et al 2014 CFs of Copper (Cu) and Zinc (Zn) which are higher than those adopted
in the USEtox model when considering the freshwater archetype proposed in the paper
of Dong as default when the location of the emission is not known
Secondly they tested impact assessment models for resource Models currently available
differ both in the modeling approach in the perspective adopted for assessing the
resources (Dewulf et al 2015) and as consequence in the characterization metric and
factors adopted (Mancini et al 2016) Beyond the potential benefit associated to a mass
based approach to recycling (eg kg of material recycled) there is indeed the need of
understanding to which extent the recycled materials are contributing to the resource
depletion impact categories The authors tested abiotic depletion potential (ADP) (CML
2012) which is focusing on potential depletion based on the ratio between resource
consumption and availability (either considering ultimate reserves in earth crust known
base reserves or economically viable reserves) ILCD model (EC-JRC 2011) which is an
extended version of CML2012 reserve based (based on CML algorithm few other
resources have been added described in Sala et al 2012) EDIP97 (Hauschild and
Wenzel 1998) which is comparing the resource with the deposits economically
exploitable without accounting for current level of consumption EPS2000 (Steen
1999) which assesses the cost (as societyrsquos willingness to pay) of substituting a
substance by an alternative for future generations affected by current level of depletion
Recipe 2008 (Goedkoop et al 2009) which is looking at marginal increase of extraction
cost per kg of extracted resource differentiating it by deposit and assuming a discount
rate over an indefinite timespan the Anthropogenic Abiotic Depletion Potential (AADP
Schneider et al 2011) which is accounting for the potential of resource recycling
assuming urban mining as an additional source of resources The recent update of the
AADP (Schneider et al 2015) was also considered It introduces the concepts of
ultimately extractable reserves represented by the amount available in the upper
earths crust that is ultimately recoverable A new set of CFs were also tested developed
by Mancini et al (2016) aiming at addressing the benefit associated to the recovery of
Critical Raw Materials (CRMs) The characterization model is based on the use and
adaptation to LCA of the supply risk indicators developed by the European Commission
(EC 2014) Three sets of CFs are tested based on different assumptions (1) baseline
option the supply risk factors as such ndash (SR) (2) an exponential function which
magnifies the differences between the CRMs - (SR)^6 (3) the ratio between supply risk
and production data (SRworld mine production in 2011) which reflects the size of the
market giving more importance to the materials used in small amounts in products and
applications like eg specialty metals that are often perceived as critical
The comparison among the different models was first of all made considering the mineral
resources present in the inventory of the case study covered by each of them The ILCD
method is the most comprehensive one with 31 mineral resources included in its model
for the resource depletion category On the contrary the Supply Risk (3) is the one that
covers the minor number of substances (ie 7)
A contribution analysis was also performed (Figure 3) Silver (Ag) gives the main
percentage contribution to the indicator in five models (ie CML 2012 versions b and c
ILCD Supply Risk 3) and EDIP97) Cobalt (Co) is the main contributor in the Supply
Risk (2) Copper (Cu) in the ReCiPe 2008 Palladium (Pd) in the EPS 2000 and AADP
(2015) and Nickel (Ni) in the AADP (2011) In the CML 2012 (a) Tellurium Gold (Au)
and Silver (Ag) are the most important substances whereas Aluminium (Al) Copper
(Cu) and Nickel (Ni) are the main contributors in the case of the Supply Risk (3)
27
Figure 3 Contribution analysis for the resource- related indicator calculated adopting several characterization models (Rigamonti et al 2017)
512 Case study 2 ndash Basket of Products Food sensitivity analysis
comparing different impact assessment methods
This case study is based on the application of different life cycle impact assessment
methods for the evaluation of the environmental impacts associated to food consumption
in Europe A process-based LCA has been performed for a basket of products that
represent the most relevant food product groups selected by importance in mass and
economic value to depict the average consumption for nutrition of EU citizens in 2010
(Notarnicola et al 2017b) The product groups in the basket were pig meat beef
poultry milk cheese butter bread sugar sunflower oil olive oil potatoes oranges
apples mineral water roasted coffee beer pre-prepared dishes For each product group
in the basket an inventory model based on a representative product has been
developed The impact of each representative product was then multiplied by the mass
of products in that product group that is consumed in one year by an average EU citizen
The environmental impact of the average food consumption of a European citizen has
been characterized using ILCD method for the life cycle impact assessment (EC-JRC
2011) The paper by Notarnicola et al (2017) illustrates the details of the process-based
LCA study on the BoP nutrition for EU 27 citizens and presents the results of the
characterisation phase The variability of the results associated to methodological
choices has been already preliminary explored (Castellani et al 2017) The present
report builds on those results and elaborates the interpretation phase (including also
normalisation and weighting) The questions that these analyses help answering are i)
are the products found to have the highest impact sensitive to changes in LCIA elements
(characterisation factors normalization references or the weighting sets) and ii) which
are the most contributing impact categories
This case study will also be used in paragraph 52 53 and 54 as a basis for further
insights on the interpretation of an LCA study
For this specific case the authors performed a sensitivity analysis on the LCIA
characterisation phase using ILCD compared with other two methods the CML-IA v 42
(Guineacutee et al 2002) and the Ecological footprint (EcF) (Wackernagel et al 2005) CML-
IA was chosen because it is widely used in LCA studies and because it adopts a different
28
modelling approach compared to ILCD in several impact categories that could be
relevant for food chains For instance for toxicity-related impact categories CML-IA is
based on USES-LCA model (Van Zelm et al 2009) whereas ILCD is applying USETOX
model (Rosenbaum et al 2008) for eutrophication CML-IA is using RAIN-LCA
(Huijbregts 1999) whereas ILCD is using different models for terrestrial and aquatic
eutrophication (respectively accumulated exceedance by Seppaumllauml et al 2006 and
EUtrend model as applied by Struijis et al 2009) The EF was chosen because it
assesses impacts in terms of direct and indirect land use and has been considered a
method that may complement LCA (Lee et al 2014) although based on an accounting
framework that has been questioned (Giampietro and Saltelli 2014) The version of EcF
method implemented in the study is the one already adapted to LCA and provided
within the SimaPro 805 software package (Pregrave Consultants 2015)
The three methods are mostly convergent in the identification of the product groups to
be considered hotspots within the BoP nutrition ie within the food consumption of the
European citizens ILCD and CML-IA identify a wider range of hotspots compared to EcF
mainly because they cover a wider range of impact categories (eg bread and potatoes
do not emerge as hotspot for EcF because their main impacts are in impact categories
not covered by the EcF method)
The product groups that emerge as hotspots in all the methods even if with slightly
different level of contribution are meat and dairy products and beer (as representative
product for alcoholic drinks)
The impact categories for which beer emerge as hotspot are slightly different among the
three methods ozone depletion ionizing radiation and resource depletion in ILCD and
CML-IA photochemical ozone formation in ILCD human toxicity and marine aquatic
ecotoxicity in CML-IA and nuclear energy in EcF The most contributing processes for all
the impact categories listed before is energy (electricity and heat) as already discussed
for ILCD In the case of CML-IA method toxicity-related impacts are mainly due to direct
emissions to air coming from the production process of the packaging glass
513 Conclusions and recommendations
These results reveal that the relative importance of one substance compared to another
changes with the model This is because the models differ in the substances that they
include and in the CFs of each substance It is recommended to run a sensitivity check
with different characterization models to evaluate the robustness of the conclusions
drawn It is also recommended to evaluate the theory underlying the characterization
models chosen to evaluate a certain impact category as this helps understanding the
results obtained
52 Characterization mapped flows and unmapped flows
This section shows two different levels of checks the first one focuses on a comparison
between two different life cycle impact assessment methods (ie ILCD vs CML-IA) based
on Castellani et al (2017) the second one focuses on what are the implications of
uncharacterized flows for a specific impact category (freshwater ecotoxicity) based on
the case study presented in Notarnicola et al (2017b)
521 Comparison between two different methods
A check of the inventoried elementary flows that are not characterized at the LCIA phase
should always be done to support interpretation of results Indeed the comprehensive
translation of the inventory into potential environmental impacts may not occur if some
of the elementary flows are not covered by the chosen characterization models Table 13
reports an example of the total amount of elementary flows that are available in an
inventory but they are not mapped and characterized by the methods considered (ILCD
and CML-IA) as reported in Castellani et al (2017) The authors checked the list of
uncharacterized flows for the inventory of the case study under evaluation and
29
highlighted the most relevant ones either in term of mass or of known environmental
concern The information obtained was then used in support to interpretation For
instance in case the two methods used for characterisation and normalisation give very
different results for one impact category the information about uncharacterized flows
can help to check if this difference is due to a different characterisation of impacts (ie
to a different way of considering the environmental relevance of some elementary flows)
or if it is affected by the fact that some flows (eg some emissions) are not taken into
account by one of the methods
This may occur also due to improper nomenclature of the elementary flows which may
cause a mismatch between the elementary flows listed in the inventory and the
elementary flows to which a characterization factor is available for example the
inventory may report CaCO3 while the characterization model may provide a CF for
calcite This mismatch would prevent the characterization of CaCO3
Table 13 Example of check of inventoried elementary flows that are not characterized by two impact assessment methods (based on Castellani et al 2017)
Flows Total elementary flows not characterized
Typologies of flows
Details on the elementary flows not characterized
ILCD CML-IA
ILCD CML-IA
Nr flows Amount Unit Nr flows
Amount Unit
raw materials
97 510 metals and minerals
47 795 kg 47 863 kg
water flows 25 126 m3 300 3825 m
3
Energy 0 0 MJ 12 18964 MJ
land use 11 001 m2 (or
m2a)
117 12898 m2 (or
m2a)
others 14 na mixed 34 na mixed
emissions to soil
83 227 pesticides to soil
45 0003 kg 173 008 kg
others 38 08 kg 54 41 kg
emissions to water
167 310 radioactive substances
42 119E+03 Bq 61 385E+06 Bq
metals and inorganics compounds
34 28 kg 36 28 kg
others 91 na mixed 213 na mixed
emissions to air
179 286 radioactive substances
49 899E+04 Bq 73 973E+07 Bq
metal and inorganics compounds
65 007 kg 56 0044 kg
pesticides 7 580E-08 kg 32 93 kg
others 70 na mixed 125 na mixed
waste flows 17 17 waste 17 3784 kg 17 3784 kg
Overall number of elementary flows not characterized
543 1350
In order to assess which elementary flows available in the inventory were not accounted
during the characterization the authors performed an analysis of the elementary flows
not characterized when using ILCD and CML-IA methods In total the model of the
basket includes 1730 elementary flows The ILCD method is not able to cover 543 of
these elementary flow as emission into air water soil or resource used whereas when
CML-IA is used to characterize the inventory 1350 elementary flows out of 1730 are not
30
characterized In Table 1 the list of main typologies of flows is reported Many pesticides
organic chemicals and inorganics are not characterized by the two methods Several
ionizing substances are not characterized as well as elementary flows related to group of
substances (such as AOX PAH BTEX VOC BOD and COD) Missing the CFs means that
it is not possible to estimate the extent to which eg the toxicity-related and ionizing
radiation-related impact categories are underestimated
Apart from the total number of flows covered the main difference between the two LCIA
methods is the ability to assign a characterization factor (CF) to the pesticides included
in the inventory ILCD has no CFs for 45 pesticidesrsquo emission to soil (plus 4 pesticidesrsquo
emissions to air) whereas CML-IA for 173 (plus 32 pesticidesrsquo emissions to air) This
may be the reason why human toxicity impacts appear as relevant in the results of ILCD
characterization (and related normalization and weighting as discussed below) and they
appear as less relevant in the results of CML-IA characterization and related
normalization and weighting
522 Analysis of uncharacterized flows within an impact category Based on the study of Castellani et al (2017) fourteen impact categories (IC)
recommended in PEF are calculated The number of elementary flows (ElFls) by ICs
varies from few flows (eutrophication acidification etc) to thousands (eco and human
toxicity) (see table 14)
For most of the ICs the contributing elementary flows reported in an inventory are well
identified and their inclusion in the calculation of the final score is expected to be done
correctly For climate change at mid-point 104 elementary flows with their associated
CFs are derived from the IPCC 2007 report for a 100-year period
However for impact categories like toxicity the number of elementary flows contributing
to the impact can be very important making possible the omission of some EFs at the
inventory level Additionally a high number of flows reported in the inventory have no
CFs If the number of un-characterized flows is too high this can lead to a non-robust
interpretation of the LCIA results
Table 12 shows the number of elementary flows with associated a CF (ie the single
chemical) and the amount of elementary flows with a CF per different compartment (eg
the single chemical in each compartment and sub-compartment)
Table 14 List of impact categories listed in ILCD with total number of elementary flows contributing to each IC
Impact Category ElFl with CFs (all emission compartments)
Unique ElFls with CFs (single chemical flows)
Climate change 104 102
Ozone Depletion 23 23
Human toxicity non cancer 3434 442 (USEtox 419 org+18 metals)
Human toxicity cancer 4734 607 (USEtox 596 org +8 metals)
Particulate matter 46 24
Ionizing radiation Human Health 50 29
Photochemical ozone formation 133 133
Acidification 7 7
Terrestrial eutrophication 7 7
Freshwater eutrophication 10 5
Freshwater ecotoxicity 15636 2526 (USEtox 2498 org +21 metals)
Land use 206 206
Water source depletion 1180 1180
Mineral fossil use amp Resource depletion
181 181
Marine eutrophication 14 11
Additional IC not used in PEF
Ionizing radiation Ecosystem (interim) 62 15
31
The potential impact of un-mapped (or uncharacterized) flows is illustrated via a case
study focusing the freshwater aquatic toxicity impact category using a recent modelling
of 17 food products (Notarnicola 2017b)
For a high proportion of the total mass of un-characterized ElFls the impact on the final
IC scores is null As a matter of fact 9998 of the 1887 kg ElFls emitted to the air are
made of air oxygen and hydrogen Only 033 kg (but still 199 flows) are actual made of
other type of chemicals 80 of those 033 kg are nitrogen type of chemicals 74
hydrogen chloride 12 sulphate etc (table 15) However regarding the ElFls to soil
and water the mass and number of un-characterized flow could have a significant
impact on the final score
Table 15 Type of chemicals (mass and number of EFs) not characterized per emission compartment (air oxygen and hydrogen have been excluded)
Compartments Group of chemicals Mass (g) Number of ElFl
Air
Total air 330 122
N-related 238662 2
inorganicsalt 74637 44
organic 5693 36
S - related 3896 1
metalmineral 3793 17
Alkenes 1530 2
Benzene Toluene Ethylbenzene and Xylene) unspecified ratio 0488 1
ozone 0314 1
P-related 0304 4
ionising 0261 4
Aldehydes 0213 1
Terpenes 0102 1
PAH 0034 1
Pesticide 0000 6
Acid 0000 1
Soil
Total soil 800 68
metalmineral 328315 15
inorganic 320234 4
oils 93496 3
organic 48702 2
Pesticide 5873 39
S - related 3777 2
N-related 0000 2
PAH 0000 1
Water
Total water 13871 112
inorganicsalt 7549785 22
TOC water 2840410 4
metalmineral 1998366 13
Suspended solid 1257655 6
inorganic 108851 6
organic 107546 37
AOX 2390 1
Acid 2032 2
S - related 2008 5
VOC 0643 1
32
N-related 0511 3
Propylene 0244 1
oils 0079 2
PAH 0055 2
Sodium Hydroxide 0054 1
Salt unspecified 0015 1
Hypochlorite 0013 1
ionising 0002 2
VOC 0001 1
P- related 0000 1
Looking at the results of the freshwater aquatic toxicity impact categories for all 17 food
products 90 of the impact category is driven by 10 out of 734 elementary flows that
represents only 14 of the mass of chemicals entering the aquatic environment (table
16) Furthermore it can be seen that
57 of the toxicity score are due to 3 metals representing 01 kg of the mass
However there are still more than 2 kg of un-characterized metalsminerals in
the inventory list (see table 15)
33 of the impact are due 10 pesticides (35 g) although there are still 39 un-
characterized pesticides in the inventory list (representing 5 g) (see table 15)
Table 16 Most relevant elementary flows contributing cumulatively up to 90 to the freshwater ecotoxicity impact category with USEtox
Substance Chemical
class Emission
Compartment Sub-compartment
Total impact (CTUe)
impact versus Total
Cumulated
impact Mass (kg)
Zinc metal Soil agricultural 931 21 21 00441
Copper metal Soil agricultural 902 21 42 00429
Chlorpyrifos pesticide Soil agricultural 833 19 61 00079
Copper metal Soil
351 8 69 00120
Zinc metal Water
139 3 72 00036
Folpet pesticide Soil agricultural 134 3 75 00004
Chlorothalonil pesticide Soil agricultural 111 3 78 00019
Chromium metal Water
105 2 80 00020
Cyfluthrin pesticide Soil agricultural 85 2 82 00001
Isoproturon pesticide Soil agricultural 81 2 84 00086
Cypermethrin pesticide Soil agricultural 70 2 85 00010
Chromium metal Soil agricultural 51 1 87 00019
Prochloraz pesticide Soil agricultural 45 1 88 00024
Captan pesticide Soil agricultural 39 1 88 00039
Alachlor pesticide Soil agricultural 38 1 89 00041
Metolachlor pesticide Soil agricultural 30 1 90 00050
Among the non-characterized elementary flows in relation to freshwater ecotoxicity it
can be observed
it is not known to which extent some of the chemicals may contribute to the IC
a number unspecified chemicals such as lsquoTotal organic matterrsquo (TOC BOD
CODhellip) PAH VOC that could contribute significantly to the overall score Since
the quantity of those ElFl can change significantly between products a default CF
could be proposed for those flow
some chemicals are known to be contributing to toxicity like pesticides and
metals still there are significant proportions that are not characterized
33
Although it is not possible to conclude if those un-characterized flows would have
changed the total score significantly based on the mass and number of known-
contributing class of chemicals (metals and pesticides) it is highly recommended that a
quantification of the uncharacterized chemicals is reported for the freshwater toxicity
impact category before drawing final conclusions
523 Conclusions and recommendations
Results of the LCIA phase can be highly affected by the characterization model chosen
as shown in chapter 51 Furthermore the evaluation of uncharacterized elementary
flows is of primary importance to assess the completeness of the LCIA coverage of the
identified LCI flows Indeed a high number of elementary flows inventoried might be
non-characterized by the chosen models even if their relevance in the assessed impact
categories could be of primary importance Therefore it is highly recommended that a
quantification of the uncharacterized elementary flows is reported before any
interpretation or conclusion is performed on the superiority of one product versus
another
53 Normalization sensitivity analysis
As for the characterisation phase also the choice of the normalisation reference set can
highly influence results Castellani et al (2017) have done a sensitivity analysis based on
the case study of a basket of product on food (see paragraph 512 for further details)
The authors report that as an optional step normalisation and weighting could be
applied to characterized LCA results to support the identification of the most important
impact categories Given that several sets of normalisation and weighting are available
the authors tested some of them in addition to the ILCD baseline with the aim of
assessing the sensitivity of the results to the choice of particular geographical and
temporal reference systems (ie normalization using EU or global scales) as well as
perspectives (ie weighting) This was investigated by selecting 3 sets of ILCD-compliant
normalization references (Benini et al 2014 Benini et al 2015 Laurent et al 2013)
and 2 sets of CML-IA compliant normalization references (EU 25+3 year 2000 and
World year 2000 - Guineacutee et al 2002) -reported in Table 17 In this section the
findings of the authors regarding normalisation will be discussed while the findings on
weighting will be discussed in section 54
Table 17 Summary of normalization sets used in the sensitivity analysis in Castellani et al (2016)
ILCD Impact Category Unit EC-JRC EU27
(2010) per person
a
EC-JRC Global (2010 or 2013)
per personb
PROSUITE Global (2010 or
2000) per person
c
Climate change kg CO2 eq 922E+03 707E+03 810E+03
Ozone depletion kg CFC-11 eq 216E-02 122E-02 414E-02
Human toxicity cancer effects CTUh 369E-05 124E-05 542E-05
Human toxicity non-cancer effects CTUh 533E-04 155E-04 110E-03
Particulate matterRespiratory inorganics kg PM25 eq 380E+00 507E+00 276E+00
Ionizing radiation human health kBq U
235 eq (to
air) 113E+03 241E+02 133E+03
Photochemical ozone formation human health kg NMVOC eq 317E+01 453E+01 567E+01
Acidification mol H+ eq 473E+01 561E+01 496E+01
Eutrophication terrestrial mol N eq 176E+02 164E+02 115E+02
Eutrophication freshwater kg P eq 148E+00 654E+00 620E-01
Eutrophication marine kg N eq 169E+01 304E+01 938E+00
Land use kg C deficit 748E+04 520E+06 236E+05
Ecotoxicity freshwater CTUe 874E+03 374E+03 665E+02
Resource depletion water m3 water eq 814E+01 689E+01 297E+01
Resource depletion mineral fossils and renewables kg Sb eq 101E-01 193E-01 313E-01
34
An additional analysis was performed to verify which one between normalization and
weighting is the most sensitive step in the identification of the most relevant impact
categories The same weighting sets described before were applied on the results of
normalization obtained using the two ILCD-compliant global normalization reference sets
tested before namely EC-JRC Global (Benini et al 2015) and PROSUITE Global (Laurent
et al 2013)
The contribution of product groups (Table 18) and of impact categories (Table 19) to the
total normalized impact of the BoP nutrition per citizen were analyzed
Table 18 presents a summary of the sensitivity analysis on product group contribution at
the normalization stage comparing the product group hotspots according to ILCD and
CML-IA methods Values are expressed as percentage of the normalized value per citizen
for that product group with respect to the total normalized impact per citizen (total
impact of nutrition in one year for an average EU-27 citizen) Equal weighting among
impact categories is assumed Results at the normalization stage almost confirm the
hotspots identified at the characterization stage meat and dairy products are again
hotspots for all the methods whereas other products that emerged before are
considered less contributing at the normalization stage This means that those products
generate impacts in impact categories that are considered less relevant compared to the
others according to the normalization scheme adopted For instance beer appeared to
be a hotspot for both ILCD and CML-IA at the characterization stage whereas only CML-
IA method identifies it as a hotspot at the normalization stage This happens because the
CML-IA normalization references (EU 25+3 and World) for marine aquatic toxicity -one
of the impact categories for which beer is a hotspot - are relatively low compared to the
ones in other LCIA methods
Table 18 presents a summary of the results of the sensitivity analysis at the
normalization stage comparing the relevance of impact categories according to ILCD
and CML-IA methods Results refer to the entire BoP For each impact category of the
two methods values are expressed as percentage of the normalized value per citizen for
that impact category with respect to the total normalized impact per citizen
Table 18 Results of sensitivity analysis on normalization sets at the European and global scale for ILCD- and CML-IA methods (Castellani et al 2016) The percentages represent the contribution of each product group to the total impacts of the BoP per citizen (reference flow) Equal weighting of impact categories is applied The second column reports the mass of each product group in the basket A color scale is applied to the results in each column (ie product group) from green (lowest contribution) to red (highest contribution)
Quantity in the basket (kgyear)
Share of total BoP
mass
EC-JRC EU27 (2010)
EC-JRC Global (2010
or 2013)
PROSUITE Global (2010
or 2000)
CML EU 25+3 (2000)
CML World (2000)
Mineral water 1050 194 1 1 1 3 3
Beer 698 129 4 4 7 16 21
Coffee 47 06 2 1 5 5 6
Apple 161 30 0 0 1 1 1
Oranges 174 32 1 1 2 1 2
Potatoes 691 130 3 3 3 3 4
Bread 393 73 3 3 3 4 5
Olive oil 53 10 1 0 1 2 3
Sunflower oil 53 10 4 4 5 3 3
Sugar from beet 298 55 3 3 3 2 1
Milk 801 148 9 9 8 7 6
Cheese 150 28 15 16 13 10 9
Butter 36 07 7 8 6 3 2
Meat - beef 137 25 18 17 16 11 10
Meat - pork 410 76 20 20 19 18 13
Meat - poultry 220 42 8 8 8 10 7
Pre-prepared meal
29 05 1 1 1 2 2
35
100 100 100 100 100 100
Table 19 Results of sensitivity analysis on normalization sets at the European and global scale for ILCD and CML-IA methods (Castellani et al 2016) The percentages reflect the relative relevance of impact categories compared to the total impacts of the BoP per citizen (reference flow) A colour scale is applied to the results in each column (ie impact category) from green (lowest contribution) to red (highest contribution)
EC-JRC EU27 (2010)
EC-JRC Global (2010 or 2013)
PROSUITE Global (2010 or 2000)
CML EU 25+3 (2000)
CML World (2000)
Climate change 19 11 13
Global warming (GWP100a) 78 102
Ozone depletion 00 00 00 Ozone layer depletion 02 00
Human toxicity cancer effects
62 83 25
Human toxicity
59 120 Human toxicity non-cancer effects
446 692 127
Particulate matter 26 09 21 -
Ionizing radiation HH 05 11 03 -
Photochemical ozone formation
10 03 03 Photochemical ozone formation
46 21
Acidification 73 286 41 Acidification 272 201
Terrestrial eutrophication 83 40 75
Eutrophication
133 163
Freshwater eutrophication 34 04 48
Marine eutrophication 82 20 87
Freshwater ecotoxicity 58 61 450
Freshwater aquatic ecotoxicity 340 314
- - - -
Marine aquatic ecotoxicity
- - - - Terrestrial ecotoxicity
Land use 23 00 04 -
Water resource depletion 62 33 100 -
Mineral fossil amp ren resource depletion
18 04 04 Abiotic depletion 02 11
Abiotic depletion (fossil fuels) 68 67
100 100 100
100 100
531 Conclusions and recommendations
Different normalisation sets may produce different results in terms of identification of
most relevant impact categories life cycle stages and processes Different reference
systems refer to different situation which can all be valid depending eg on the
geographical scope of the study It is recommended to evaluate different normalisation
tests which fit the study at hand to support the conclusions drawn with the baseline
scenario or to provide additional insights
54 Weighting sensitivity analysis
Castellani et al (2016) investigated only for ILCD-compliant normalization sets in
addition to equal weighting 8 ILCD-compliant weighting sets (reported in Table 20) were
tested The different sets were selected aiming at covering several perspectives on
weighting namely distance to target for EU policies considering binding and non-
binding target at 2020 (Castellani et al 2017) a previous distance to target set (EDIP)
36
for Europe for 2005 (Stranddorf et al 2005) two sets considering planetary boundaries
(Tuomisto et al 2012 Bjoslashrn and Hauschild 20158) a set which gives relevance to
midpoint indicators based on their contribution to impact at the endpoint (Ponsioen and
Goedkoop 2015) a set resulting from the combination of different panel-based
approaches (Huppes et al 2012)
When needed available weighting sets have been adapted to ILCD impact categories
The majority of these weighting sets build on normalization factors that are specific of a
geographic scale Tuomisto et al (2012) calculated planetary boundaries at global scale
whereas and Bjoslashrn and Hauschild (2015) did it for both global and European scales
Huppes et al (2012) adopted a panel-based approach with no specific geographic
representativeness whereas all the other weighting sets used in this work have been
originally developed or adjusted for applications at the targeting the European scale
The use of EU27-consistent weighting sets in combination with global normalization
factors may lead to inconsistencies therefore the results have to be interpreted in the
light of this inconsistency In this work the normalized and weighted results are
calculated and presented anyway for all combinations so to show the effect of the
selection of weighting available for practitioners rather than focussing on the (in-
)consistency of their joint use with normalization factors The performed analysis
quantified the relative contribution by impact category to the overall impacts associated
with the BoP as well as the contribution by each of the products The effects of the
different weighting sets tested on the results of the BoP normalized to EC-JRC EU27
normalization references are presented in Table 21 and Table 22
Table 20 Summary of weighting sets used in the sensitivity analysis by Castellani et al (2016)
Distance to target Damage oriented Panel-
based
Policy targets Planetary boundaries Mid-to-
endpoint
Castellani et al 2016
WFsA
Castellani et al 2016
WFsB
EDIP 2003 (Stranddo
rf et al 2005)
Tuomisto et al 2012
Bjoslashrn amp Hauschild
- European
2015
Bjoslashrn amp Hauschi
ld ndash Global 2015
Ponsioen amp
Goedkoop 2016
Huppes et al 2012
ILCD Impact Category dimensionless ()
Climate change 71 54 2 10 25 26 44 232
Ozone depletion 64 49 87 8 1 2 0 36
Human toxicity cancer effects 69 52 2 na na na 1 65
Human toxicity non-cancer effects
62 47 2 na na na
4 41
Particulate matterRespiratory inorganics
74 56 na na na na
8 66
Ionizing radiation human health
61 46 na na na na
0 65
Photochemical ozone formation human health
78 59 2 na
34 48
0 54
Acidification 72 55 2 8 1 1 0 42
Eutrophication terrestrial 70 53 2 28 1 0 0 23
Eutrophication freshwater 62 47 1 7 9 2 0 23
Eutrophication marine 69 52 2 28 1 1 0 23
Land use 64 53 na 6 25 16 19 102
Ecotoxicity freshwater 61 51 0 na 2 0 0 109
Resource depletion water 61 296 na 5 1 4 3 51
Resource depletion mineral fossils and renewables
61 30 0 na na
na 19 69
8 Bjoslashrn and Hauschild provided to the authors of this report a modified version to be used as weighting method
in compliance with EU27 ILCD normalization factors Global weighting factors were calculated directly from global normalization factors published by Bjoslashrn and Hauschild 2015
37
The contribution of specific products to the overall impacts associated to the BoP
nutrition is very similar when using several weighting sets in combination with
normalization references EU27 (Table 21) In fact for all the weighting sets tested pork
meat and beef meat are the highest contributor to the impacts (varying between 15
and 22) According to all sets cheese is the 3rd largest contributor (14 on average)
whereas milk and poultry meat are most frequently identified as 4th and 5th largest
contributors (roughly 8 each) On average these product groups account for roughly
70 of the total impacts Apples olive oil and pre-prepared meals are those contributing
the less followed by mineral water and oranges On average their cumulative
contribution is around 5
Table 21 Product groups contribution Results of several ILCD-compliant weighting sets in combination with normalization references EU27 (Castellani et al 2016) A color scale is applied to the results in each column (ie product group) from green (lowest contribution) to red (highest contribution)
PRODUCT GROUPS CONTRIBUTION
Quantity in the basket (kgyear)
Share of total BoP mass
Equal
weighting
Castellani et al (2016) WFsA
Castellani et
al (2016) WFsB
EDIP2003
9
Tuomisto et
al (2012)
BjornampHausch
ild (2015)
ndash Europe
an
BjornampHausch
ild (2015)
ndash global
Ponsioen and
Goodkoep
(2016)
Huppes et al (2012)
Mineral water 105 1940 1 1 3 1 1 1 2 1 1
Beer 66 cL 698 1290 4 4 4 4 3 8 8 7 5
Coffee 47 060 2 2 2 1 2 6 5 3 2
Apple 161 300 0 0 1 0 0 1 1 1 1
Oranges 174 320 1 1 3 0 1 2 2 1 1
Potato 691 1300 3 3 4 3 2 3 3 4 3
Bread 393 730 3 3 3 4 3 3 3 3 3
Olive oil 53 100 1 1 1 0 1 1 1 1 1
Sunflower oil 53 100 4 4 4 4 3 4 4 4 4
Sugar from beet 298 550 3 3 4 3 4 2 3 3 3
Milk 801 1480 9 9 8 9 8 8 8 8 8
Cheese 15 280 15 15 16 15 13 12 13 14 14
Butter 36 070 7 7 6 8 6 5 5 7 7
Meat - beef 137 250 18 18 17 18 22 15 16 16 17
Meat - pork 41 760 20 20 16 21 21 19 17 18 19
Meat - poultry 22 420 8 8 7 8 9 8 8 8 8
Pre-prepared meal 29 050 1 1 1 1 1 1 1 1 1
100
100 100 100 100 100 100 100 100
100
9 (based on Stranddorf et al 2005)
38
Conversely the identification of the most relevant impact categories contributing to the
overall impact of the entire BoP nutrition presents huge discrepancies when applying
different weighting sets (Table 22) This is due to the intrinsic differences among the
weighting sets which build on different perspectives and attribute different weights to
the impact categories
Table 22 Relevance of the different impact category Results of the application of several ILCD-compliant weighting sets in combination with normalization references EU27 (Castellani et al 2016) A color scale is applied to the results in each column (ie impact category) from green (lowest contribution) to red (highest contribution)
CONTRIBUTION ANALYSIS
1-1-1
Castellani et al (2016) WFsA
Castellani et al (2016) WFsB
EDIP2003 (based on Stranddorf et al 2005)
Tuomisto et al (2012)
Bjoslashrn amp Hauschild (2015)
Bjoslashrn amp Hauschild (2015) - global
Ponsioen amp
Goedkoop (2015)
Huppes et al (2012)
Climate change 19 20 15 2 32 214 260 204 87
Ozone depletion 00 00 00 2 00 00 00 00 00
Human toxicity cancer effects
62 66 50 7 na na na 22 81
Human toxicity non-cancer effects
446
425 323 53 na na na 477 363
Particulate matterRespiratory inorganics
26 30 23 na na na na 51 34
Ionizing radiation human health
05 05 04 na na na na 00 07
Photochemical ozone formation human health
10 12 09 1 00 162 263 00 11
Acidification 73 81 61 9 101 47 42 03 61
Eutrophication terrestrial
83 89 67 10 379 31 18 00 39
Eutrophication freshwater
34 32 25 3 37 134 43 00 16
Eutrophication marine
82 87 66 11 374 55 44 00 38
Land use 23 22 19 na 23 257 188 106 46
Ecotoxicity freshwater
58 55 46 0 na 60 04 00 127
Resource depletion water
62 59 284 na 53 39 137 49 63
Resource depletion mineral fossils and renewables
18 17 09 0 na na na 86 25
TOTAL 100 100 100 100 100 100 100 100 100
The discrepancies in the results suggest that it is important to acknowledge that
different perspectives lead to different results Moreover it is relatively straightforward
to identify the product groups impacting the most as from Table 21 when keeping
constant normalization references although varying weighing sets
The authors also checked the most sensitive element between normalization and
weighting their findings indicate normalization as the most sensitive choice if compared
39
to the selection of a specific weighting set among those considered in their work
However this result may change in case weighting methods building on different
approaches are added to the ones included in their work Nevertheless the ranking of
products is not significantly affected by changing normalization reference (eg from
ILCD EU27 to ILCD Global ndash Laurent et al 2013) This might be due to few impact
categories driving the results regardless of the normalization and weighting methods
selected or to the fact that all impact categories are strongly correlated
541 Conclusions and recommendations Weighting sets are often dependent on different value choices to assign different weights
to all impact categories Therefore different weighting sets lead to significant differences
of the final conclusions It is recommended that the decision about inclusion of which
weighting set to use has been made and documented in the first scope definition and
shall not be changed later during the study
40
6 Estimation of uncertainty
Evaluation of the uncertainty of an LCA study is a step which involves both the LCI and
LCIA phase therefore it is strictly linked to the content of the previous chapters
Uncertainty in LCA can be defined in different ways (Ciroth et al 2016) For examples it
can be meant as describing the variability of the LCA data to determine the significance
of the indicator results being ldquothe estimated amount or percentage by which an
observed or calculated value may differ from the true valuerdquo (Skone 2000) ISO 14044
defines uncertainty analysis as systematic procedure to quantify the uncertainty
introduced in the results of a life cycle inventory analysis due to the cumulative effects of
model imprecision input uncertainty and data variability
The estimation of uncertainty serves three main purposes
it supports a better understanding of the results obtained
it supports the iterative improvement of an LCA study
it also helps the target audience to assess the robustness and applicability of the
study results
The PEF Guide identifies two key sources of uncertainty in PEF studies
1 Stochastic uncertainties for the inventory data
they refer to statistical descriptions of variance around a meanaverage For
normally distributed data this variance is typically described in terms of an
average and standard deviation
2 Choice-related uncertainties
They arise from methodological choices including modelling principles system
boundaries allocation choices choice of impact assessment methods and other
assumptions related to time technology geographical aspects etc These are not
amenable to statistical description but rather can only be characterized via
scenario model assessments
In this report we refer to uncertainty analysis to describe the range of likely outcomes
based on a set of inputs and it differs from a sensitivity analysis which is linked to how
sensitive the results are to a change in an input parameter (see previous chapters)
It has to be kept in mind that all steps involved in a quantitative process are affected by
uncertainties Therefore it is important that the uncertainty is assessed
- At inventory level (eg standard deviation associated to a data point) An
example on how to assess the uncertainty at inventory level was recently
provided by Ciroth et al (2016)
- At characterization level (eg linked to characterization factors)
- At normalisation level (eg linked to normalisation factors)
- At weighting level (eg linked to weighting factors)
611 Conclusions and recommendations It is recommended that the overall uncertainty of an LCA study is estimated and
reported in the final report It is also recommended to include an evaluation to which
extent the uncertainties identified affect the final conclusions
41
7 Meta-analysis
The widespread development of LCA in the last decades as a decision supporting tool
leads to a huge amount of LCA studies in literature concerning all kind of goods and
services (ldquoproductsrdquo) When trying to make sense of their results that sometimes are
very different or come up with a conclusion techniques to combine or re-analyze them
are needed such as meta-analysis
Zumsteg et al (2012) described the key factors for conducting and reporting systematic
reviews including meta-analyses10 in LCA Those key factors are simplified in a check
list 1 Review title keywords and abstract 2 Rationale for the review 3 Review
question and objectives 4 Description of review protocol 5 Findings and features of
the individual studies in the review 6 Assessment of bias 7 Synthesis methods
(qualitative and quantitative) 8 Limitations of the review and 9 Summary of findings
and conclusions
This chapter is not intended to give guidelines on how to perform a systematic review or
a meta-analysis but to highlight the critical points that the practitioner should take into
account when collecting and using the LCA data Recalling the check list previously
described it is in the findings and features of the individual studies where one of the
biggest shortcomings when performing a meta-analysis concerning LCA studies is found
Assembling data from the individual studies is complex due to
the existing ldquoflexiblerdquo guidance in conducting LCA that leads to different
assumptions and methodological choices made in the various LCA modelling
exercises The ISO 14040 and 14044 standards provide the framework for LCA
This framework however leaves the individual practitioner with a range of
choices which can affect the legitimacy of the results of an LCA study
the lack of homogeneity reporting LCA results
As found in De Matos et al (2015) while doing a meta-analysis of different bioeconomy
value chains the most influencing differences among studies mainly relate to
The definition of the system boundaries and the stages included in the
study (eg even if the same general system boundaries are considered -
eg cradle to gate - some studies may or may not include intermediate
transport construction and decommissioning of buildings etc)
The impact assessment methods used as different methods may
consider for example different substances for a given impact category
and different characterization factors for the same substance
The definition of the functional unit (eg as the input the output
product the agricultural land unit etc) (Cherubini and Stromman
2011)
The consideration of direct and indirect land use change (dLUC and iLUC
respectively) (Cherubini and Stromman 2011)
The technology considered in the process and its maturity level
The approach used to model the multifunctional system For instance if
substitution is used the reference system selected may have a
significant influence on the final LCA results On the other hand if
allocation is used the selection of the allocation criteria and the relative
10 The definition of Meta-analysis given by Zumsteg et al (2012) is ldquoA melding of data from multiple studies usually involving additional mathematical analysis with the goal of utilizing this synergy of information and data size to answer questions that cannot be answered by existing individual studies or to improve the certainty or impact of know findings by increasing the sample
size Meta-analyses are often performed as part of a systematic reviewrdquo
42
contribution of each co-product may considerably influence the results of
the assessment
These points are in line with those reported in other studies in literature Wolf et al
(2015) conducted a meta-analysis of LCAs for wood energy services (heat power and
combined heat and power (CHP)) and chose a set of ldquodecisive parametersrdquo to be
analyzed arguing that those factors promote inconsistent findings along LCA studies
Apart from the previously mentioned the authors include the following factors (some of
them specific of the good or service under study)
Data sources such as empirical data literature well-known databases
unspecified databases simulators or expert interviews are some of
them
Transportation distances and types
Feedstock properties (in this case wood)
Combustion capacity and efficiency and co-combustion rates
Energy service provided (power heat and CHP)
Schreiber et al (2012) performed a meta-analysis on LCA studies of electricity
generation with carbon capture and storage (CCS) comprising the three main CCS
technologies (post-combustion oxyfuel and pre-combustion) In line with previous
studies they highlighted the different choices in the LCA methodology and parameters
(specific of the good or service under study) that heavily impact the overall results Here
we report those which differ from the already mentioned
Data quality and availability
Time horizon as most studies considered present and future power
plants as far as 2050
Spatial representation ndash some elements in the CCS process chain are
highly site-specific such as storage sites
Life cycle inventory (LCI) ndash which inputs and outputs are considered
Operational valuation and weighting methods
Power plant efficiency and energy penalty of the capture process
Carbon dioxide capture efficiency and purity
Fuel origin and composition
Moreover when having a look at the limitations of the review and meta-analysis some
studies just focus on GHG emissions Wolf et al (2015) set the CML midpoint impact
category Global Warming as the basis for the comparison of results because it is
represented in 100 of the studies They did not consider other less-frequent impact
categories but yet important such as acidification eutrophication and particulate
matter owing to the lack of results published in the studies On the other hand
Schreiber et al (2012) not only focused on GHG but they included other impacts such
as acidification potential eutrophication potential photochemical ozone creation
potential and cumulative energy demand
As a conclusion increased harmonization and transparency in the calculation and
reporting of LCA data and results is needed (Cristobal et al 2015)
711 Conclusions and recommendations
The number of LCA studies available is increasing and making sense of all the results
that can be obtained from them is a difficult task As a conclusion increased
harmonization and transparency in the calculation of LCA data and results is needed It
is recommended that reporting of LCA data is done in a more consistent and harmonized
43
manner to allow users of LCA study a better understanding of the results and
conclusions drawn
8 Conclusion
One of the key aims of LCA is to provide the decision makers with comprehensive and
understandable information this task is achieved by a proper interpretation of the
results of an LCA study
This report builds on the requirements provided in relevant international standards (ISO
14044) and guides (ILCD Handbook (EC-JRC 2011a) PEF Guide (EC 2013b) and it
proposes a practical approach on how to perform a robust interpretation of an LCA
study It provides a ready-to-use approach for the identification of significant issues and
it includes examples of completeness sensitivity and consistency checks based on real-
case studies which are used to draw the attention of the reader on how to evaluate the
results of an LCA study
The scheme proposed in this report should not be intended as a comprehensive list of
items to check instead it should be seen as a normal workflow that should be carried
out by an LCA practitioner in order to derive robust conclusions out of the LCA study
More accurate and case-specific checks should be done depending on the intended goal
and scope of the study
The report is structured in order to allow a practitioner focus on the two quantitative
phases of LCA the life cycle inventory (LCI) and the life cycle impact assessment (LCIA)
Regarding the LCI the report goes through the analysis of the data sources by giving
examples on how to interpret the system boundaries and the foreground system) it
provides an overview on data quality and it comprises further completeness and
consistency checks (eg cut-off long term emissions anomaly checks)
When analysing the LCIA the report provides insights on sensitivity analysis regarding
characterization normalization and weighting When dealing with characterization the
attention of the reader is drawn also on mapping between the inventory and the
characterization models and a discussion on the evaluation of uncharacterized
elementary flows is also included
Finally an overarching topic such as meta-analysis was deemed useful to be included as
this is often used when there is the need of assessing the state of the art of the LCA
studies on a specific product supply chain Key messages stemming from this report are
as follows
Results reveal that the relative importance of one substance compared to another
changes with the characterization model This is because the models differ in the
substances that they include and in the CFs of each substance It is
recommended to run a sensitivity check with different characterization models to
evaluate the robustness of the conclusions drawn It is also recommended to
evaluate the theory underlying the characterization models chosen to evaluate a
certain impact category as this helps understanding the results obtained Results of the LCIA phase can be highly affected by the characterization model
chosen Furthermore the evaluation of uncharacterized elementary flows is of
primary importance to assess the completeness of the LCIA coverage of the
identified LCI flows Indeed a high number of elementary flows inventoried might
be non-characterized by the chosen models even if their relevance in the
assessed impact categories could be of primary importance Therefore it is highly
recommended that a quantification of the uncharacterized elementary flows is
reported before any interpretation or conclusion is performed on the superiority
of one product versus another Different normalisation sets may produce different results in terms of
identification of most relevant impact categories life cycle stages and processes
Different reference systems refer to different situation which can all be valid
44
depending eg on the geographical scope of the study It is recommended to
evaluate different normalisation tests which fit the study at hand to support the
conclusions drawn with the baseline scenario or to provide additional insights Weighting sets are often dependent on different value choices to assign different
weights to all impact categories Therefore different weighting sets lead to
significant differences of the final conclusions It is recommended that the
decision about inclusion of which weighting set to use has been made and
documented in the first scope definition and shall not be changed later during the
study It is recommended that the overall uncertainty of an LCA study is estimated and
reported in the final report It is also recommended to include an evaluation to
which extent the uncertainties identified affect the final conclusions The number of LCA studies available is increasing and making sense of all the
results that can be obtained from them is a difficult task As a conclusion
increased harmonization and transparency in the calculation of LCA data and
results is needed It is recommended that reporting of LCA data is done in a more
consistent and harmonized manner to allow users of LCA study a better
understanding of the results and conclusions drawn Further aspects such as the appropriateness of the functional unit the intended goal
the system boundaries and value choices should normally be part of an interpretation in
order to identify recommendations and limitations of the study and draw the appropriate
conclusions They are not discussed further in this report but it is recommended that at
least each decision based on a personal or a stakeholderrsquos value shall always be
documented and explained in the conclusions of the LCA study This is consistent with
one of the key aims of LCA which is to provide the decision makers with comprehensive
and understandable information
45
References
Baitz M Makishi Colodel C Kupfer T Florin J Schuller O Kokborg M Koumlhler A
Thylmann D Stof-fregen A Schoumlll S Goumlrke J Rudolf M Gonzalez M (2016) GaBi
Database amp Modelling Principles Thinkstep Leinfelden-Echterdingen
Benini L Mancini L Sala S Manfredi S Schau EM Pant R (2014) Normalization
method and data for Environmental Footprints European Commission Joint
Research Center Institute for Environment and Sustainability Publications Office
of the European Union Luxemburg ISBN 978-92-79-40847-2
Benini L Sala S Pant R (2015) Global normalization factors for ILCD compliant
midpoint impact categories - EC-JRC internal draft report Set of factors available
at httpeplcajrceceuropaeuuploadsTable_ILCD_NFs_08-03-2016xlsx
Biganzoli L Falbo A Forte F Rigamonti L Grosso M (2015) Mass balance and life
cycle assessment of waste electrical and electronic equipment management
system implemented in Lombardia Region (Italy) Science of the Total
Environment 524ndash525 361-375
Bjoslashrn A Hauschild MZ (2015) Introducing carrying capacity-based normalization
in LCA framework and development of references at midpoint level The
International Journal of Life Cycle Assessment 20 (7)1005ndash1018
Blonk Agri-footprint BV (2014) Agri-footprint Methodology and basic principles -
Version 10
Brentrup F Kusters J Lammel J Kuhlmann H (2000) Methods to estimate on-
field nitrogen emissions from crop production as an input to LCA studies in the
agricultural sector The International Journal of Life Cycle Assessment 5 349ndash
357
Castellani V Benini L Sala S Pant R (2016) A distance-to-target weighting
method for Europe 2020 The International Journal of Life Cycle Assessment
21(8)1159-1169
Castellani V Sala S Benini L (2017) Hotspots analysis and critical interpretation
of food life cycle assessment studies for selecting eco-innovation options and for
policy support Journal of Cleaner Production 140 (2) 556-568
Cellura M Longo S Mistretta M (2011) Sensitivity analysis to quantify
uncertainty in life cycle assessment the case study of an Italian tile Renew Sust
Energ Rev 15(9)4697-4705
Cherubini F Stromman AH (2011) Life cycle assessment of bioenergy
systems state of the art and future challenges Bioresource technology 102 437
ndash 451
Ciroth A Muller S Weidema B Lesage P (2016) Empirically based uncertainty
factors for the pedigree matrix in ecoinvent The International Journal of Life
Cycle Assessment 21 1338-1348
CML (2002) CML-IA model and characterisation factors Available from
httpswwwuniversiteitleidennlenresearchresearch-outputsciencecml-ia-
characterisation-factors Accessed November 2015
Colomb V Ait-Amar S Basset-Mens C Dolleacute JB Koch P Lellahi A Mousset J
Salou T Tailleur A van der Werf HMG (2015) AGRIBALYSE Assessment and
lessons for the future Version 12
Corrado S Zampori L Castellani V Sala S (2017) Systematic analysis of
secondary Life Cycle Inventories when modelling agricultural production a case
study for arable crops Journal of Cleaner Production (under review)
46
Cristobal J De Matos CT Aurambout JP Manfredi S Kavalov B (2015)
Environmental sustainability assessment of bioeconomy value chains Biomass
and bioenergy 89 159 ndash 171
De Matos CT Cristobal J Aurambout JP (2015) Environmental sustainability
assessment of bioeconomy products and processes ndash progress report 1 European
Commission Report EUR 27356 EN
De Schryver A Galatola M (2016) Guidance for modelling agricultural processes
TAB Issue paper v 01 October 2016
Dewulf J Benini L Mancini L Sala S Blengini G A Ardente F Recchioni M Maes
J Pant R Pennington D (2015) Rethinking the Area of Protection lsquoNatural
Resourcesrsquo in Life Cycle Assessmen Environmental Science and Technology 49
(9)5310ndash5317
Dong Y Gandhi N Hauschild MZ (2014) Development of Comparative Toxicity
Potentials of 14 cationic metals in freshwater Chemosphere 112 26-33
Ecoinvent (2016) Allocation cut-off by classification [WWW Document] URL
httpwwwecoinventorgdatabasesystem-models-in-ecoinvent-3cut-off-
system-modelallocation-cut-off-by-classificationhtml (accessed 8916)
European Commission ndash Joint Research Centre (EC-JRC) (2011a) ILCD Handbook
ndash General guide for life cycle assessment ndash Detailed guidance European
Commission Joint Research Centre Institute for Environment and Sustainability
European Commission ndash Joint Research Centre (EC-JRC) (2011b) ILCD Handbook
- Recommendations for Life Cycle Impact Assessment in the European context
European Commission Joint Research Centre Institute for Environment and
Sustainability
European Commission (EC) (2013a) Communication from the Commission to the
EU Parliament and Council ndash Building the Single Market for Green Products ndash
Facilitating better information on the environmental performance of products and
organisations(20130196final)
European Commission (2013b) Commission Recommendation of 9 April 2013 on
the use of common methods to measure and communicate the life cycle
environmental performance of products and organisations (2013179EU) Official
Journal of the European Union Volume 56 4 May 2013
European Commission (2015)ndash Better Regulation Toolbox
httpeceuropaeusmart-regulationguidelinesdocsbr_toolbox_enpdf
European Commission (2016) Product Environmental Footprint Pilot Guidance -
Guidance for the implementation of the EU Product Environmental Footprint (PEF)
during the Environmental Footprint (EF) pilot phase - version 52 (pp 95)
Retrieved from
httpeceuropaeuenvironmenteussdsmgppdfGuidance_productspdf
FAO (2012) FAOstat Agriculture data Food and Agriculture Organization of the
United Nations httpfaostatfaoorg
Gaudreault C Samson R Stuart P (2009) Implications of choices and
interpretation in LCA for multi-criteria process design de-inked pulp capacity and
cogeneration at a paper mill case study J Clean Prod 17(17)1535-1546
Giampietro M Saltelli A (2014) Footprints to nowhere Ecological Indicators 46
610-621
Goedkoop M Heijungs R Huijbregts M de Schryver A Struijs J van Zelm R
(2009) ReCiPe 2008 A life cycle assessment method which comprises
harmonized category indicators at the midpoint and the endpoint level Report I
47
Characterisation Ministry of Housing Spatial Planning and Environment
Amsterdam
Guineacutee JB Gorreacutee M Heijungs R Huppes G Kleijn R de Koning A van Oers L
Wegener Sleeswijk A Suh S Udo de Haes HA de Bruijn H van Duin R
Huijbregts MAJ (2002) Handbook on life cycle assessment Operational guide to
the ISO standards I LCA in perspective IIa Guide IIb Operational annex III
Scientific background Kluwer Academic Publishers ISBN 1-4020-0228-9
Dordrecht 2002 692 pp
Guo M Murphy RJ (2012) LCA data quality sensitivity and uncertainty analysis
Science of the total environment 435230-243
Hauschild MZ Wenzel H (1998) Environmental Assessment of Products Vol 2 ndash
Scientific background Chapman amp Hall UK Kluwer Academic Publishers
Hingham USA
Heijungs R Kleijn R (2001) Numerical approaches towards life cycle
interpretation five examples The International Journal of Life Cycle Assessment
6(3)141-148
Hellweg S Mila i Canals L (2014) Emerging approaches challenges and
opportunities in life cycle assessment Science 344(6188) 1109-1113
Huang Y Spray A Parry T (2013) Sensitivity analysis of methodological choices
in road pavement LCA The International Journal of Life Cycle Assessment
18(1)93-101
Huijbregts MAJ Hellweg S Hertwich E (2011) Do we need a paradigm shift in life
cycle impact assessment Environmental Science and Techonology 45 (9)
38333834
Huijbregts MAJ (1999) Life-cycle impact assessment of acidifying and eutrophying
air pollutants Calculation of equivalency factors with RAINS-LCA Report available
at httpmedialeidenunivnllegacyLife-cycle20impact20assessmentpdf
(accessed April 2016)
Huppes G Van Oers L Pretato U Pennington DW (2012) Weighting
environmental effects Analytic survey with operational evaluation methods and a
meta-method The International Journal of Life Cycle Assessment 17 876ndash891
James K Galatola M (2015) Screening and hotspot analysis procedure to
identify the hotspots and the most relevant contributions (in terms of impact
categories life cycle stages processes and flows) Version 40 24 April 2015
Retrieved from
httpswebgateeceuropaeufpfiswikisdisplayEUENVFPEU+Environmental+F
ootprint+Pilot+Phase accessed November 2016
ISO 14040 (2006a) Environmental managementmdashlife cycle assessmentmdash
principles and framework Geneva Switzerland
ISO 14044 (2006b) ndash Environmental management ndash Life Cycle assessment ndash
Requirements and guidelines
Laurent A Hauschild M Z Golsteijn L Simas M Fontes J Wood R (2013)
Deliverable 52 Normalisation factors for environmental economic and socio-
economic indicators Report prepared within the 7th Framework programme
Project PROSUITE Available at httpwwwprosuiteorgwebguestpublic-
deliverables (accessed December 2015)
Lee SJ Hawkins TR Ingwersen WW Young DM (2014) Exploring the Use of
Ecological Footprint in Life Cycle Impact Assessment Findings from a Comparison
of Transportation Fuels Journal of Industrial ecology 19(3) 416ndash426
48
Mancini L Benini L Sala S (2015) Resource footprint of Europe complementarity
of Material Flow Analysis and Life Cycle Assessment for policy support
Environmental Science and Policy 54367ndash376
Mancini L Benini L Sala S (2016) Characterization of raw materials based on
supply risk indicators for Europe The International Journal of Life Cycle
Assessment 1-13 doi101007s11367-016-1137-2
Nemecek T Baumgartner D (2006) Concerted Action GL-Pro WP4
Environmental Analysis - Final report - Deliverable 43 Available at
httpwwwagroscopeadminchpublikationeneinzelpublikationindexhtmllang
=enampaid=23328amppid=23604
Notarnicola B Sala S Antoacuten A McLaren SJ Saouter E Sonesson U (2017a) The
role of life cycle assessment in supporting sustainable agri-food systems a
review of the challenges Journal of Cleaner Production 140(2)399-409
doi101016jjclepro201606071
Notarnicola B Tassielli G Renzulli PA Castellani V Sala S (2017b) Environmental
impact of food consumption in Europe Journal of Cleaner Production 140(2)
753-765 doi101016jjclepro201606080
Pizzol M Christensen P Schmidt J Thomsen M (2011) Impacts of ldquometalsrdquo on
human health a comparison between nine different methodologies for Life Cycle
Impact Assessment (LCIA) Journal of Cleaner Production 19(6) 646-656
Pizzol M Laurent A Sala S Weidema B Verones F Koffler C (2016)
Normalisation and weighting in life cycle assessment Quo Vadis The
International Journal of LCA 1-14 doi 101007s11367-016-1199-1
Prado-Lopez V Seager TP Chester M Laurin L Bernardo M Tylock S (2014)
Stochastic multi-attribute analysis (SMAA) as an interpretation method for
comparative life-cycle assessment (LCA) Int J Life Cycle Ass 19(2)405-416
Pregrave Consultants (2015) SimaPro Database Manual - Methods library available at
httpswwwpre-sustainabilitycomsimapro-database-and-methods-library
(accessed February 2016)
Ponsioen TC Goedkoop MJ (2016) Midpoint weighting based on endpoint
information Submitted to The International Journal of Life Cycle Assessment
Rigamonti L Falbo A Zampori L Sala S (2017) Supporting a transition towards
sustainable circular economy sensitivity analysis for the interpretation of LCA for
the recovery of electric and electronic waste The International Journal of Life
Cycle Assessment 1-10 doi 101007s11367-016-1231-5
Rosenbaum RK Bachmann TM Gold LS Huijbregts MAJ Jolliet O Juraske R
Koehler A Larsen FH MacLeod M Margni M McKone TE Payet J Schuhmacher
M van de Meent D Hauschild MZ (2008) USEtoxmdashthe UNEP-SETAC toxicity
model recommended characterisation factors for human toxicity and freshwater
ecotoxicity in life cycle impact assessment The International Journal of Life Cycle
Assessment 13(7) 532-546
Sala S Wolf MA Pant R (2012) Characterization factors of the ILCD
Recommended Life Cycle Impact Assessment methods Database and Supporting
Information First edition EUR25167EN ISBN 978-92-79-22727 Luxembourg
Publications Office of the European Union Available at
httpeplcajrceceuropaeuuploads201401LCIA-characterization-factors-of-
the-ILCDpdf
Schau EM Davidsson B (2015) Product Environmental Footprint (PEF) Category
Rules (PEFCR) Pilot Intermediate Paper Product First Draft PEFCR July
2015Accessible for registered stakeholders at
49
httpswebgateeceuropaeufpfiswikisdisplayEUENVFPStakeholder+workspa
ce3A+PEFCR+pilot+Intermediate+paper+product
Schau EM Fet AM (2008) LCA studies of food products as background for
environmental product declarations The International Journal of Life Cycle
Assessment 13(3) 255-264
Schneider L Berger M Finkbeiner M (2011) The anthropogenic stock extended
abiotic depletion potential (AADP) as new parameterization to model the depletion
of resources The International Journal of Life Cycle Assessment 16(9) 929-936
Schneider L Berger M Finkbeiner M (2015) Abiotic resource depletion in LCAmdash
background and update of the anthropogenic stock extended abiotic depletion
potential (AADP) model The International Journal of Life Cycle Assessment
20(5) 709-721
Schreiber A Zapp P and Marx J (2012) Meta-Analysis of Life Cycle Assessment
Studies on Electricity Generation with Carbon Capture and Storage Journal of
Industrial Ecology 16 S155ndashS168
Seppaumllauml J Posch M Johansson M Hettelingh JP (2006) Country-dependent
Characterisation Factors for Acidification and Terrestrial Eutrophication Based on
Accumulated Exceedance as an Impact Category Indicator The International
Journal of Life Cycle Assessment 11(6) 403-416
Skone TJ (2000) What is Life Cycle Interpretation Environmental Progress 19
(2) 92-100
Steen BA (1999) A systematic approach to environmental priority strategies in
product life development (EPS) Version 2000 ndash Models and data of the default
method Chalmers University LindholmenJohanneberg
Stranddorf HK Hoffmann L Schmidt A (2005) Update on Impact Categories
Normalisation and Weighting in LCA - Selected EDIP97-data Environmental
Project Nr 995 Miljoslashprojekt httpwww2mstdkudgivPublications200587-
7614-570-0pdf87-7614-571-9PDF (accessed December 2015)
Tuomisto HL Hodge ID Riordan P Macdonald DW (2012) Exploring a safe
operating approach to weighting in life cycle impact assessment ndash a case study of
organic conventional and integrated farming systems Journal of Cleaner
Production 37147-153
UNEP- SETAC (2016) Hotspots Analysis an Overarching Methodological
Framework Draft document developed for UNEPSETAC Life Cycle Initiative -3
Flagship Project 3a (Phase 2) 11 october 2016 Available at
httpwwwwraporgukcontentprinciples-and-practices-hotspot-analysis
Van Hoof G Vieira M Gausman M Weisbrod A (2013) Indicator selection in life
cycle assessment to enable decision making issues and solutions International
Journal of Life Cycle Assessment 181568-1580
Van Zelm R Huijbregts M A van de Meent D (2009) USES-LCA 20mdasha global
nested multi-media fate exposure and effects model The International Journal
of Life Cycle Assessment 14(3) 282-284
Wackernagel M Monfreda C Moran D Wermer P Goldfinger S Deumling D
Murray M (2005) ―National Footprint and Biocapacity Accounts 2005 The
underlying calculation method Global Footprint Network Oakland California
USA
Weidema B Bauer C Hischier R Mutel C Nemecek T Reinhard J Vadenbo CO
Wernet G (2013) Overview and methodology Data quality guideline for the
ecoinvent database version 3
50
Williams ED Weber CL Hawkins TR (2009) Hybrid Framework for Managing
Uncertainty in Life Cycle Inventories Journal of Industrial Ecology 13 928ndash944
Wolf C Klein D Weber-Blaschke G Richter K (2015) Systematic review and
meta-analysis of life cycle assessment for wood energy services Journal of
Industrial Ecology 20 743 ndash 763
Zumsteg JM Cooper JS Noon MS (2012) Systematic Review Checklist Journal of
Industrial Ecology 16 S12ndashS21
51
List of abbreviations and definitions
AOX adsorbable organic halogens
BOD biochemical oxygen demand
BTEX benzene toluene xylene isomers
CFs characterisation factors
COD chemical oxygen demand
DQR data quality requirements
EcF ecological footprint
EF environmental footprint
ElFl elementary flow
HMs heavy metals
IC impact category
ILCD International Reference Life Cycle Data System
LCA life cycle assessment
LCI life cycle inventory
LCIA life cycle impact assessment
OEFSR organisation environmental footprint sector rules
PAH polycyclic aromatic hydrocarbons
PEF product environmental footprint
PEFCR product environmental footprint sector rules
PPP plant protection products
OEF organisation environmental footprint
TAB technical advisory board
TS technical secretariat
UNEPSETAC LCI Unep Setac Life cycle Initiative
VOC volatile organic compounds
WEEE waste electrical and electronic equipment
52
List of figures
Figure 1 Practical application of requirements in ISO 14044 and ILCD Handbook to
interpret LCI and LCIA results 5
Figure 2 Hotspot analysis in the context of the Environmental Footprint pilot (James amp
Galatola 2015) 8
Figure 3 Contribution analysis for the resource- related indicator calculated adopting
several characterization models (Rigamonti et al 2017) 27
53
List of tables
Table 1 Summary of requirements to define most relevant contributions and hotspots
(James amp Galatola 2015) 11
Table 2 Selection of most relevant Impact Categories (James amp Galatola 2015) 12
Table 3 Selection of most relevant life cycle stages (James amp Galatola 2015) 13
Table 4 Selection of most relevant processes (James amp Galatola 2015) 13
Table 5 Inventory results (climate change results expressed in gCOeq) (James amp
Galatola 2015) 14
Table 6 Most relevant inventory flows contributing to climate change (based on the
inventory results before normalisation and weighting) - overall life cycle (option 1)
(James amp Galatola 2015) 14
Table 7 Most relevant inventory flows contributing to climate change (based on the
inventory results before normalisation and weighting) ndash process level (option 2) (James
amp Galatola 2015) 14
Table 8 Hotspots based on 50 cumulative contribution (OPTION A) (James amp Galatola
2015) 15
Table 9 Hotspots based on top two representatives (OPTION B) (James amp Galatola
2015) 15
Table 10 Underlying assumptions in relation to the three databases considered by the
authors (Corrado et al 2017) 17
Table 11 Data quality rating in an example of intermediate paper products (EC 2013
Schau and Davidsson 2015) 20
Table 12 Data quality rating in an early phase of a PEF study of intermediate packaging
paper 21
Table 13 Example of check of inventoried elementary flows that are not characterized by
two impact assessment methods (based on Castellani et al 2017) 29
Table 14 List of impact categories listed in ILCD with total number of elementary flows
contributing to each IC 30
Table 15 Type of chemicals (mass and number of EFs) not characterized per emission
compartment (air oxygen and hydrogen have been excluded) 31
Table 16 Most relevant elementary flows contributing cumulatively up to 90 to the
freshwater ecotoxicity impact category with USEtox 32
Table 17 Summary of normalization sets used in the sensitivity analysis in Castellani et
al (2016) 33
Table 18 Results of sensitivity analysis on normalization sets at the European and global
scale for ILCD- and CML-IA methods (Castellani et al 2016) The percentages
represent the contribution of each product group to the total impacts of the BoP per
citizen (reference flow) Equal weighting of impact categories is applied The second
column reports the mass of each product group in the basket A color scale is applied to
the results in each column (ie product group) from green (lowest contribution) to red
(highest contribution) 34
Table 19 Results of sensitivity analysis on normalization sets at the European and global
scale for ILCD and CML-IA methods (Castellani et al 2016) The percentages reflect
the relative relevance of impact categories compared to the total impacts of the BoP per
citizen (reference flow) A colour scale is applied to the results in each column (ie
impact category) from green (lowest contribution) to red (highest contribution) 35
54
Table 20 Summary of weighting sets used in the sensitivity analysis by Castellani et al
(2016) 36
Table 21 Product groups contribution Results of several ILCD-compliant weighting sets
in combination with normalization references EU27 (Castellani et al 2016) A color scale
is applied to the results in each column (ie product group) from green (lowest
contribution) to red (highest contribution) 37
Table 22 Relevance of the different impact category Results of the application of several
ILCD-compliant weighting sets in combination with normalization references EU27
(Castellani et al 2016) A color scale is applied to the results in each column (ie
impact category) from green (lowest contribution) to red (highest contribution) 38
Europe Direct is a service to help you find answers
to your questions about the European Union
Freephone number ()
00 800 6 7 8 9 10 11 () The information given is free as are most calls (though some operators phone boxes or hotels may
charge you)
More information on the European Union is available on the internet (httpeuropaeu)
HOW TO OBTAIN EU PUBLICATIONS
Free publications
bull one copy
via EU Bookshop (httpbookshopeuropaeu)
bull more than one copy or postersmaps
from the European Unionrsquos representations (httpeceuropaeurepresent_enhtm) from the delegations in non-EU countries (httpeeaseuropaeudelegationsindex_enhtm) by contacting the Europe Direct service (httpeuropaeueuropedirectindex_enhtm) or calling 00 800 6 7 8 9 10 11 (freephone number from anywhere in the EU) () () The information given is free as are most calls (though some operators phone boxes or hotels may charge you)
Priced publications
bull via EU Bookshop (httpbookshopeuropaeu)
XX-N
A-x
xxxx-E
N-N
doi102788171315
ISBN 978-92-79-64114-5
LB-N
A-2
8266-E
N-N

1
Abstract
Interpretation of the results of a life cycle assessment (LCA) study is a mandatory phase
of LCA and it is a key aspect in order to derive robust conclusions and recommendations
One of the key aims of LCA is to provide the decision makers with comprehensive and
understandable information this task is achieved by a proper interpretation of the
results of an LCA study
The robust interpretation of a LCA study needs specific guidance to support the decision
making process both in policy and business contexts Existing standards and guidelines
provide a framework for interpretation but there is the need of improving
comprehensiveness and practical aspects thereof This report aims at providing
practitioners with a practical guidance on what are the aspects to be always taken into
account when interpreting results of an LCA Building on this report further guidance
needs to be developed to support interpretation of LCA studies both for LCA practitioners
and LCA users (eg decision makers)
This report provides a practical and schematic workflow to be followed during
interpretation starting from the assessment of the hotspots of the baseline scenario
which is completed by sensitivity completeness and consistency checks to be
performed at the level of the life cycle inventory (LCI) and life cycle impact assessment
(LCIA) Additionally case studies are reported to illustrate specific issues related to
interpretation of results
2
1 Introduction
Life cycle assessment (LCA) is more and more considered a reference method for the
evaluation of supply chains production and consumption systems up to regions
(Hellweg and Mila I Canals 2014)
Life cycle interpretation is one of the four phases identified in the ISO 14040 and the
ISO 14044 standards (ISO 2006ab) In fact according to the ISO standard
interpretation of Life Cycle Inventory (LCI) or Life Cycle Impact Assessment (LCIA)
phases according to the goal and scope of the study is a required step of an LCA study
ISO 14044 further specifies that interpretation comprises the following elements i) an
identification of the significant issues based on the results of the LCI and LCIA phases of
LCA ii) an evaluation that considers completeness sensitivity and consistency checks
iii) conclusions limitations and recommendations
In 2013 the European Commission has put forward a communication which aims at
harmonising the application of LCA for evaluation green products (Building the Single
Market for Green Products EC 2013a) calculating their Environmental Footprint (EF)
(both Product environmental footprint ndash PEF and Organisation environmental footprint ndash
OEF) The communication is accompanied by the PEF Guide (EC 2013b) which explains
that interpretation of the results of a PEF study serves two purposes i) to ensure that
the performance of the PEF model corresponds to the goals and quality requirements of
the study in this sense PEF interpretation may inform iterative improvements of the
PEF model until all goals and requirements are met and ii) to derive robust conclusions
and recommendations from the analysis for example in support of environmental
improvements
The International Reference Life Cycle Data System (ILCD) Handbook (EC 2010)
clarifies that interpretation of an LCA has two main purposes that fundamentally differ i)
steering the work towards improving the Life Cycle Inventory model to meet the needs
derived from the study goal ii) especially for comparative LCA studies (while partly also
applicable to other types of studies) it serves to derive robust conclusions and often
recommendations
Notwithstanding that several methodological guidance exists on the different steps of
LCA so far the interpretation phase has been little systematized even though its
importance is well recognized within the LCA community LCA studies sometimes
formulate conclusions and recommendations disregarding the uncertainties and the lack
of consistency within the LCI and LCIA steps and across the goal and scope definition
The need of guidance for the interpretation phase is becoming even more important as
LCA is being increasingly recognised and used by various stakeholders LCA has recently
become a reference methodology for decision support in the policy context in which its
results may impact entire sectors or societies In the EU context these recent trends are
reflected through initiatives and pilots related to the above-mentioned Building the
Single Market for Green Products (EC 2013a) as well as the new inclusion of LCA among
the methods in the EU Better Regulation toolbox (EC 2015) which identified tools
relevant for conducting the impact assessment of policies In this setting robust and
sound interpretation of LCA results is a must
Several authors have provided evidence that interpretation is one of the key steps of an
LCA study and give guidance andor recommendations depending on the purpose of the
study Skone (2000) pointed out that the purpose of performing life cycle interpretation
is to determine the level of confidence in the final results and communicate them in a
fair complete and accurate manner Initially it was recognized that interpretation was
not one of the hot topics in literature studies (Heijungs et al 2001) and authors
provided numerical techniques for interpretation More recently other authors such as
Guadreault et al (2009) while recognizing that LCA has become an important
methodology for more sustainable process design observed that its application in a
decision-making context has been limited by a poor understanding of methodological
3
choices and assumptions therefore they recommend careful interpretation of results to
improve the quality of the outcome (ie improve the decision-making process) This
view is shared by authors such as Prado Lopez et al (2014) who have identified the lack
of robust methods of interpretation to support decision makers hence they provide a
novel approach based on a multi-criteria decision analytic method (stochastic multi-
attribute analysis for life-cycle impact assessment (SMAA-LCIA)) which in their view
should support both interpretation of results and policymakers Van Hoof et al (2013)
explained how normalization helps maintain a multi-indicator approach while keeping the
most relevant indicators allowing effective decision making Finally other authors such
as Cellura et al (2011) and Huang et al (2013) performed LCA of specific products and
they pointed out the relevance of sensitivity analysis to strengthen the reliability of the
results obtained and draw conclusions to support sector specific guidelines A structured
approach covering the LCIA phase has been proposed (Castellani et al 2017)
highlighting the importance of a systematic sensitivity analysis of impact assessment
models normalization and weighting set Regarding normalisation and weighting steps
which are optional according to ISO standards a recent overview of approaches
strengths and limitations has been provided in the context of activities of the
UNEPSETAC Life Cycle Initiative (UNEPSETAC LCI) by Pizzol et al (2016)
The objective of this technical report is to provide guidance on how to perform an
interpretation of LCI and LCIA results based on what are the meaningful aspects to be
taken into account common to the majority of LCA studies
This technical report aims to be a practical document to be used by LCA practitioners as
a checklist of the main aspects to consider when interpreting LCI and LCIA results
Therefore this report makes extensive use of examples based on real case studies that
may help critically assess LCA results ensuring a reliable decision- and policy-making
support
A general framework on how to perform a proper interpretation is presented in chapter
2 the key aspects will be discussed further on in the report using case studies as an
example to guide the reader and the practitioner through ldquoreal liferdquo applications
Chapter 3 focuses on the identification of significant issues namely the main
contributors to the LCIA results (ie hotspots most relevant impact categories life cycle
stages processes and elementary flows)
Chapter 4 and 5 focus on the evaluations (sensitivity completeness and consistency
checks) in relation to the LCI and LCIA phases respectively Regarding the LCI the
report goes through the analysis of the data sources by giving examples on how to
interpret the system boundaries and the foreground system) it provides an overview on
data quality and it comprises further completeness and consistency checks (eg cut-off
long term emissions anomaly checks) When analysing the LCIA the report provides
insights on sensitivity analysis regarding characterization normalization and weighting
When dealing with characterization the attention of the reader is drawn also on issues
such as the mapping between the inventory and the characterization models and the
evaluation of uncharacterized elementary flows
Chapter 6 and 7 deal with overarching topics such as estimation of uncertainty of the
results of LCA study and meta-analysis
4
2 A practical scheme to interpret LCI and LCIA results
The initial step of the interpretation phase is to review information from the first three
phases of the LCA process such as the ones used to build the study goals and scope
quality assurance procedures reporting requirements results assumptions external
involvement (eg stakeholders peer reviews) (Skone 2000)
Both ISO 14044 and the ILCD Handbook (EC-JRC 2011a) propose a scheme with the
elements to be considered in the interpretation phase and their relation to the other
phases of the LCA study
The elements can be grouped in
identification of significant issues (based on the results of the LCI and LCIA
phases)
the purpose of this first element of interpretation is to analyse and structure the
results of earlier phases of the LCILCA study in order to identify the significant
issues There are two interrelated aspects of significant issues i) firstly there are
the main contributors to the LCIA results ie most relevant life cycle stages
processes and elementary flows and most relevant impact categories ii)
secondly there are the main choices that have the potential to influence the
precision of the final results of the LCA These can be methodological choices
assumptions foreground and background data used for deriving the process
inventories LCIA methods used for the impact assessment as well as the
optionally used normalisation and weighting factors
evaluation that considers completeness sensitivity and consistency checks
Completeness checks on the inventory are performed in order to determine the
degree to which it is complete and whether the cut-off criteria have been met
Sensitivity checks have the purpose to assess the reliability of the final results
and of the conclusions and recommendations of the LCA study The consistency
check is performed to investigate whether the assumptions methods and data
have been applied consistently throughout the LCILCA study
conclusions limitations and recommendations
Integrating the outcome of the other elements of the interpretation phase and
drawing on the main findings from the earlier phases of the LCA the final
element of the interpretation is to draw conclusions and identify limitations of the
LCA and to develop recommendations for the intended audience in accordance
with the goal definition and the intended applications of the results
In this report a schematic workflow representing a practical approach to interpret LCI
and LCIA results is proposed in Fig1 building on both ISO 14044 (ch 4511) and the
ILCD Handbook (ch 91) (EC-JRC 2011a) The workflow is to be seen as an iterative
approach to finally draw robust conclusions and recommendations
The scheme should not be seen as substituting the approaches of the ISO 14044 and the
ILCD Handbook instead it should be seen as a practical application of the requirements
laid down in these documents
Furthermore the scheme should not be intended as a comprehensive list of items to
check instead it should be seen as a normal workflow that should be carried out by an
LCA practitioner in order to derive robust conclusions out of the LCA study More
accurate and case-specific checks should be done depending on the intended goal and
scope of the study
Further aspects such as the appropriateness of the functional unit the intended goal
the system boundaries and value choices should normally be part of an interpretation in
order to identify recommendations and limitations of the study and draw the appropriate
conclusions They are not discussed further in this report but it is recommended that at
5
least each decision based on a personal or a stakeholderrsquos value shall always be
documented and explained in the conclusions of the LCA study This is consistent with
one of the key aims of LCA which is to provide the decision makers with comprehensive
and understandable information in a transparent manner
Figure 1 Practical application of requirements in ISO 14044 and ILCD Handbook to interpret LCI and LCIA results
6
3 Identification of key issues Hotspots analysis
In order to get started with interpretation of results it is necessary to identify what the
key issues are Once the key issues are identified it is possible to further evaluate the
overall robustness of the LCA study by using for example completeness consistency and
sensitivity checks
This chapter on hotspot analysis gives an overview of the overarching methodological
framework of hotspot analysis as currently developing with the UNEPSETAC Life Cycle
Initiative - Flagship Project 3a and the hotspot analysis as tested in the Environmental
Footprint (EF) pilot phase (2013 ndash 2017) In the first case hotspot analysis is regarded
as a subject on its own in the second case it is shown a practical way to perform a
hotspot analysis in an environmental footprinting context in the EU Environmental
Footprint it is more focused on the interpretation of the screening study results of the
average or representative product1 The hotspots in a EU Environmental Footprint may
be but does not have to found in a contribution analysis of the characterized results
Therefore in this chapter we first describe the hotspot analysis as outlaid in the
UNEPSETAC LCI and then the hotspot analysis as performed in the EF pilot phase
31 The hotspot analysis in the UNEPSETAC Life Cycle Initiative
The UNEPSETAC Life Cycle Initiative has been running a Flagship project (nr 3a) on
hotspot analysis since 2012 until 2017 According to UNEPSETAC (2016) the benefits
of hotspots analysis include ensuring
Focus on priority issues (eg waste water materials of concern)
Focus on the right life cycle stage (eg material acquisition manufacturing use
end of life)
Focus on the right actors (eg producers manufactures suppliers retailers
customers) to evaluate influence and implement solutions
Implications of trade-offs are understood
Resources (eg time money) can be effectively allocated to actions
Previously there was not currently a common global approach to hotspots analysis nor
has there been sufficient effort to bring together or share best practice amongst those
organisations or initiatives currently developing and using these methods Nor was there
any accepted guidance on how to translate and apply the results of hotspots analysis
into meaningful sustainability information and insight for use by industry governments
and other stakeholders Therefore the UNEP SETAC Life Cycle Initiative established a
new Flagship Project to address these and other issues The objectives of the
UNEPSETAC LCI Flagship Project 3 are to produce
1 A common methodological framework and global guidance for sustainability hotspots analysis
2 A protocol for the appropriate use and communication of sustainability information derived from hotspots analysis
3 To evaluate and if possible implement a range of options to bring together the findings from existing hotspots studies to provide a richer global picture of sustainability hotspots in the economy and society
Phase 1 was finished in December 2014 and gives an overview of different tools and
methods that can be used in the hotspot analysis This includes 42 hotspots analysis
1 In the context of the EF pilot phase within each Product Environmental Footprint Category Rule
(PEFCR) pilot a ldquorepresentative productrdquo has to be defined which is representing gt50 of the European market The PEF screening study is a PEF study conducted on the representative product one of the aims of the screening study is to identify the hotspots most relevant
elementary flows processes and life cycle stages
7
methodologies divided into product sector and national scale of application Of these 21
methodologies (4 at the national-level 5 at the sector-level and 12 predominantly
applied at the product category-level) were shortlisted and further analysed Examples
of methods are EU EIPRO and Global Protocol for Community Scale GHG emissions on
the national level GHG Protocol Corporate Value Chain (Scope 3) Accounting and
Reporting Standard and Sustainability Accounting Standards Board Materiality Maptrade on
the sector level and French Grenelle I and II BPX 30-323-0 Product Lifecycle
Environmental Impact Quantification Guidance Standard and Water Quality Association
(WQA) Hotspots Analysis on the product level Please refer to Figure ES 2 in (Barthel et
al 2014) for the complete list
This first phase of the project fed into the second phase of the Flagship project
Phase 2 is running from January 2015 ndash January 2017 and produces the methodological
framework (UNEPSETAC 2016) and the communication guidance2 These are currently
in a six-weeks public consultation (27 Oct ndash 15 Dec 2016) The framework provides
a recognized set of guiding principles and practices for hotspots analysis
a globally agreed methodological framework for hotspots analysis
agreement on the appropriate use and communication of product sustainability
information derived from hotspots analysis
Future step will be to work with hotspot analysis for cities and regions and road testing
of the methodological framework
32 The hotspot analysis in the Environmental Footprint pilot
phase (2013 ndash 2017)
The 2013-2017 Environmental Footprint (EF) pilot phase has three main objectives
test the process for developing product- and sector-specific rules
test different approaches to verification
test communication vehicles for communicating life cycle environmental
performance to business partners consumers and other company stakeholders
This is tested by groups of organisations called Technical Secretariats (TS) who
volunteered to develop the rules for their product or sector
The hotspot analysis as described below were tested and developed in an iterative way
on the approximatively 25 pilots participating in the EF pilot phase to develop Product
Environmental Footprint (PEF) Category Rules (PEFCR) or Organisation Environmental
Footprint (OEF) Sector Rules (OEFSR)
A hotspot analysis is required for the PEFOEF screening studies of the average or
representative product for the PEFCROEFSR and for the supporting studies3 (EF study of
a single productorganisation belonging to the product categorysector) when developing
PEFCROEFSR (PEFCR Guidance document (EC 2016))
The hotspot analysis in the EF context aims to identify the hotspots the most relevant
impact categories life cycle stages processes and elementary flows as shown in Fig 2
and it provides a guidance on how to do that
2 Communicating hotspots The effective use of sustainability information to drive action and improve
performance from httpwwwwraporguksitesfileswrapHotspots20Communications20Guidelines20v35207Oct2016pptx 3 The EF supporting studies are PEFOEF studies run by single companies with the aim of testing the draft
PEFCRs and OEFSRs
8
Figure 2 Hotspot analysis in the context of the Environmental Footprint pilot (James amp Galatola 2015)
As shown in the figure the hotspots (and thereby also the hotspot analysis) is important
for the decision on which life cycle stages processes and elementary flows that are
hotspots (gt 50 contribution) and which are relevant (gt 80 contribution)
The hotspots might serve the purpose of warning an organisation about the area where
they should focus their attention in order to improve the environmental performance of a
product (PEF) or an organisation (OEF) Whilst traditionally LCA practitioners are
expected to provide primarysite-specific data for processes taking place in the
foreground and secondary data for processes taking place in the background in PEFOEF
the implementation of the materiality principle leads to a different approach The
processes most contributing to the final results (in terms of environmental impacts or
savings) are those for which the best quality of data should be provided For the
processes less relevant it is possible to use data of lower quality
321 Procedure to identify the most relevant impact categories Starting from the normalised and weighted results of PEF screening study each
Technical Secretariat is asked to select the impact categories that they consider more
relevant in terms of communication purposesrdquo
322 Procedure to identify the most relevant life cycle stages
The proposed guideline by the PEFCR Guidance (EC 2016) is to consider as relevant all
life cycle stages which together contribute over 80 (before normalisation and
weighting) to any of the baseline impact categories This should start from the largest to
the smallest contributions In addition more life cycle stages can be added to the list of
the most relevant ones
In order to guarantee a minimum level of harmonisation among different
PEFCRsOEFSRs a list of default life cycle stages was identified
Raw material acquisition and pre-processing (including production of parts and
unspecific components)
9
Production of the main product4
Product distribution and storage
Use stage scenario (if in scope)
End-of-life (including product part reuse recovery recycling if in scope)
323 Procedure to identify the most relevant processes
Each impact category shall be investigated to identify the most relevant processes The
identification of the most relevant processes shall be done at the whole life cycle level
Similaridentical processes taking place in different life cycle stages (eg transportation)
shall be accounted separately
In the context of the EF pilot phase processes were defined as most relevant where they
collectively contributed at least 80 to any impact category before normalisation and
weighting
In some instances vertically aggregated datasets may be identified as representing
relevant processes It may not be obvious which process within an aggregated dataset
is responsible for contributing to an impact category The metadata accompanying the
data should be reviewed and used to identify relevant processes If this is not possible it
can be decided whether to seek further disaggregated data or to treat the aggregated
dataset as a process for the purposes of identifying relevance5
324 Procedure to identify the most relevant elementary flows
As far as the most relevant elementary flows is concerned they are the ones contributing
cumulatively more than 80 to the impact category It can be decided whether this is
calculated at the level of overall life cycle and or single (most relevant) process level
All elementary flows contributing more than 5 to the impact category shall be
considered as relevant
Once the most relevant elementary flows have been identified they shall be linked to the
processes emitting them
325 Procedure to identify the hotspots
A hotspot can be identified at different levels of granularity impact category life cycle
stage process or elementary flow
In the context of PEFOEF pilot phase a hotspot is defined as either (James and Galatola
2015)
OPTION A (1) life cycle stages (2) processes and (3) elementary flows
cumulatively contributing at least 50 to any impact category before
normalisation and weighting (from the most contributing in descending order)
OPTION B At least the two most relevant life cycle stages processes and at least
two elementary flows (minimum 6) Additional hotspots may be identified by the
TS
4 If it is not possible to differentiate between the production of the main product and ancillary materials and
other life cycle stages eg raw material acquisition and transport then these life cycle stages can be merged Adequate justifications shall be provided in the screening report and be highlighted in the consultation phase If an aggregated life cycle stageprocess is most relevant it implies that all the processes included will be classified as most relevant 5 In this last case if an aggregated dataset is relevant everything in it is automatically relevant
10
326 Dealing with negative numbers
When identifying the percentage contribution from any process or flow it is important
that absolute values are used (ie the minus sign is ignored) in calculating percentage
contributions This allows indentifying the relevance of any credits
327 Specific instructions about aggregating elementary flows
The toxicity-related impact categories (ldquoHuman toxicity cancer effectsrdquo ldquoHuman
toxicity non-cancer effectsrdquo and ldquoFreshwater ecotoxicityrdquo) contain long lists of
characterization factors specified on the elementary flow category level 3 (also known
as sub-compartment ndash for example urban air freshwater agricultural soil) The impact
category ldquoParticulate matterrdquo also contains characterization factors at the level 3
category
It is recommended to aggregate the elementary flows on the level 2 category (ie
emissions to air water soil) in the contribution analysis This is to make the analysis
more manageable and because the level 3 category does not give additional information
when analyzing on the process level (the processes already contain information on the
location type of the emissions)
It is important to model foreground data on the level 3 category for particulates and
toxic substance flows because the characterization factors can deviate considerably
Metal resource flows are not specified per origin of ore type in the source files of the
ILCD recommended methods However in several background databases metal
resource flows are differentiated (for example Silver Ag 46E-5 Au 13E-4 in ore
Silver Ag 42E-3 Au 11E-4 in ore Silver Ag 21E-4 Au 21E-4 in ore etc)
Therefore the specified flows were added to the ILCD method in LCA software packages
with the same characterization factors as for the unspecified metals When doing a
contribution analysis of the metal resource flows it is therefore recommended to
aggregate the flows per metal (silver copper nickel etc)
There are 5 different fossil fuel related resource flows specified in the source files of the
ILCD recommended methods (brown coal 119 MJkg crude oil 423 MJkg hard coal
263 MJkg natural gas 441 MJkg peat 84 MJkg) However in several background
databases fossil resource flows are specified with different calorific values (for example
Gas natural 468 MJ per kg Gas natural 366 MJ per m3 Gas natural 35 MJ per m3
Gas natural 303 MJ per kg etc) Therefore the specified flows were added to the
ILCD method in LCA software packages with characterization factors related to the
factors in the original source taking the different calorific value into account When
doing a contribution analysis of the fossil resource flows it is therefore recommended to
aggregate the flows based on the 5 original flows (brown coal crude oil hard coal
natural gas and peat)
328 Conclusions
In table 1 the requirements to define most relevant contributions during the EF pilot
phase are summarized as found in the PEFCR Guidance (EC 2016)
11
Table 1 Summary of requirements to define most relevant contributions and hotspots (James amp Galatola 2015)
Item At what level does relevance need to be identified
Threshold
Most relevant impact categories In the final results starting from normalized and weighted results but deviations possible if justified
No threshold Decision left to TS but subject to stakeholder consultation and TAB opinion
Most relevant life cycle stages For each impact category before normalization and weighting Not relevant for data needs identification
All life cycle stages contributing cumulatively more than 80 to any impact category
Hotspots For each impact category before normalization and weighting
Either (i) life cycle stages processes and elementary flows cumulatively contributing at least 50 to any impact category or
(ii) at least the two most relevant impact categories life cycle stages processes and at least two elementary flows (minimum 6) Additional hotspots may be identified by the TS
Most relevant processes For each impact category before normalization and weighting Essential for data needs identification
All processes contributing cumulatively more than 80 to any impact category
Most relevant elementary flows For each impact category before normalization and weighting Essential for data needs identification
All elementary flows contributing cumulatively more than 80 to any impact category and in any case all those contributing more than 5 individually
When assessing what is most relevant it is also recommended to check if what is
identified as being non-relevant can be actually considered as such A practical example
is given at paragraph 431
12
329 Example to identify most relevant contributions and hotspots
The PEFCR Guidance (2016) also provided an example on how to perform a hotspot
analysis and the identification of most relevant impact categories life cycle stages
processes and elementary flows The example is reported here it is a fictitious example
not based on any specific PEF study results
3291 Example most relevant Impact Categories
Table 2 shows the contribution of different impact categories based on normalised and
weighted results
Table 2 Selection of most relevant Impact Categories (James amp Galatola 2015)
Impact category Unit Contribution ()
Climate change kg CO2 eq 215
Ozone depletion kg CFC-11 eq 30
Human toxicity cancer effects CTUh 83
Human toxicity non-cancer effects CTUh 149
Particulate matter kg PM25 eq 01
Ionizing radiation human health Kbq U235 eq 05
Photochemical ozone formation kg NMVOC eq 24
Acidification molc H+ eq 15
Terrestrial eutrophication molc N eq 10
Freshwater eutrophication kg P eq 10
Marine eutrophication kg N eq 01
Freshwater ecotoxicity CTUe 01
Land use kg deficit 143
Water resource depletion m3 water eq 186
Mineral fossil resource depletion kg Sb eq 127
Based on the normalised and weighted results the TS can decide that the following
impact categories are relevant for communication purposes climate change water
depletion and land use Where there is deviation from the most significant contributors
to the normalised and equally weighted results justification shall be provided
Once the relevant impact categories for communication purposes have been selected
the TS shall start identifying the most relevant life cycle stage processes and flows per
each impact category (all baseline EF impact categories not only those relevant for
communication purposes)
13
3292 Example most relevant Life Cycle Stages
Table 3 shows the contribution of different life cycle stages to the climate change impact
category (based on the characterised inventory results before normalisation and
weighting)
Table 3 Selection of most relevant life cycle stages (James amp Galatola 2015)
Life cycle stage Contribution ()
Raw material acquisition and pre-processing 421
Production of the main product 252
Product distribution and storage 164
Use stage (if in scope) 108
End-of-life 55
The three life cycle stages in purple will be the ones identified as most relevant for
climate change as they are contributing to more than 80 This procedure shall be
repeated for all the baseline EF impact categories
3293 Example most relevant Processes
Table 4 shows the contribution of different processes to the climate change impact
category (based on the characterised inventory results before normalisation and
weighting)
Table 4 Selection of most relevant processes (James amp Galatola 2015)
Unit process Contribution ()
Process A 89
Process B 614
Process C 234
Process D 28
Process E 15
Process F 09
Other processes 09
According to the proposed procedure the processes in orange shall be selected as ldquomost
relevantrdquo Process E could be added to the as most relevant ones based on specific
considerations (eg it is under operational control it is of relevance for the specific
sector etc) This procedure shall be repeated for all the baseline EF impact categories
3294 Example most relevant Elementary Flows
Considering that the selection of the most relevant elementary flows can be done at
overall life cycle level (option 1) andor per relevant process (option 2) there are two
14
possible outcomes Starting from the inventory results provided in Table 5 the list of
most relevant flows are highlighted in blue in Table 6 (at overall life cycle) and Table 7
(at process level)
Table 5 Inventory results (climate change results expressed in gCOeq) (James amp Galatola 2015)
Inventory flow Substance 1 Substance 2 Substance 3 Substance 4 Substance 5 Total
Process A 249 85 6 45 5 390
Process B 1100 600 500 450 50 2700
Process C 300 250 20 30 430 1030
Process D 60 30 20 10 5 125
Process E 64 1 1 1 1 68
Process F 15 10 8 5 3 41
Other processes 15 10 8 5 3 41
Total 1803 986 563 546 497 4395
Table 6 Most relevant inventory flows contributing to climate change (based on the inventory results before normalisation and weighting) - overall life cycle (option 1) (James amp Galatola 2015)
Inventory flow Substance 1 Substance 2 Substance 3 Substance 4 Substance 5 Total
Process A 57 19 01 10 01 89
Process B 250 137 114 102 11 614
Process C 68 57 05 07 98 234
Process D 14 07 05 02 01 28
Process E 15 00 00 00 00 15
Process F 03 02 02 01 01 09
Other processes 03 02 02 01 01 09
Total 410 224 128 124 113
Table 7 Most relevant inventory flows contributing to climate change (based on the inventory results before normalisation and weighting) ndash process level (option 2) (James amp Galatola 2015)
Inventory flow Substance 1 Substance 2 Substance 3 Substance 4 Substance 5 Total
Process A 64 22 2 12 1 100
Process B 41 22 19 17 2 100
Process C 29 24 2 3 42 100
15
Process D 48 24 16 8 4 100
Process E 94 1 1 1 1 100
Process F 37 24 20 12 7 100
Other processes 37 24 20 12 7 100
3295 Example hotspots
In Tables 8 and 9 the identified hotspots - based on the two different approaches
available- are presented
Table 8 Hotspots based on 50 cumulative contribution (OPTION A) (James amp Galatola 2015)
Hotspots
Life cycle stages Raw material acquisition and pre-processing
Production of the main product
Processes Process B
Elementary flows Option 1 Substance 1 and 2
Option 2
Substance 1 and 2 in processes B
Substance 1 and 5 in process C
Substance 1 in process E
Table 9 Hotspots based on top two representatives (OPTION B) (James amp Galatola 2015)
Hotspots
Life cycle stages Raw material acquisition and pre-processing
Production of the main product
Processes Process B
Process C
Elementary flows Option 1 Substance 1 and 2 in process B
Option 2 Substance 1 in process E6 and substance 5 in process C
4 Interpretation on Life Cycle Inventory (LCI) level
During the life cycle inventory phase the actual data collection and modelling of the
system has to be done in line with the goal definition and aiming at meeting the
requirements derived in the scope phase The LCI results are the input to the
subsequent Life Cycle Impact Assessment (LCIA) phase
Interpretation involves evaluations at the level of Life Cycle Inventory in order to
improve the inventory model to meet the needs derived from the study goal
perform a sensitivity analysis to check for limitations in the appropriateness of
the life cycle inventory work
6 Choosing the hotspots based on option B-2 might lead to anomalies (like in this fictitious
example) where an elementary flow is identified as hotspot even if its absolute value is not
prominent
16
understanding the underlying assumptions when secondary datasets are used in
the model
combining the above points to refine the LCA model
draw appropriate and robust conclusions
Key aspects to evaluate life cycle inventories are the consistency and completeness
thereof They can be evaluated taking into account different aspects A sensitivity check
to evaluate the reliability of the results is also a needed step
A first aspect to be taken into account is the data source Primary data are collected
directly by the company performing the study thus the consistency of the data used
with the goal and scope of the study should be more straightforward However when
and LCA study is making use of secondary datasets to model the background system a
careful analysis of the consistency of these datasets with the primary data collected and
in relation with the goal and scope shall be made
Indeed different modelling assumptions in datasets aimed at representing the same
product system can lead to different results affecting the reliability of the LCA study
(Williams et al 2009) An example of the relevance of different data sources and
consistency has been discussed in Corrado et al (2017) this study focuses on different
data sources to originate the inventory of arable crops (1 kg of wheat) The choice of the
secondary dataset can have a relevant influence on LCA results and it is considered
among the challenges for a robust LCA (Notarnicola et al 2017a)
A second aspect to be taken into account regarding life cycle inventories is the quality of
the data used regarding time geographical and technological representativeness
precision methodological compliance and documentation Therefore in this chapter a
paragraph is dedicated to analyzing more in detail this aspect
A third relevant aspect in relation to LCIs is the consistency and completeness in relation
to single aspects such as cut-off inclusionexclusion of specific elementary flows (eg
long term emissions) It is not straightforward to judge if an inventory can be considered
complete As a general rule it has always to be kept in mind that the inventory has to
be checked in its completeness in relation to the goal and scope of the study for
example if the goal of the study is to assess only the climate change impact category
the completeness of the inventory shall be evaluated against those emissions that are
actually contributing to climate change within the system boundaries It does not lead to
improved conclusions the compilation of a more detailed inventory with the inclusion of
eg substances that do not contribute to climate change
41 Analysis of data sources
When selecting secondary data sets it is important to ensure that all data sets used in
the modelling of the system model are methodologically consistent (ie consistency
check) The use of inconsistent data can lead to an unreliable and distorted LCA study
often with wrong conclusion and recommendations drawn Furthermore use of datasets
with different level of completeness (ie completeness checks) may also lead to
unreliable conclusions
The study from Corrado et al (2017) is used as a case study to highlight the relevance
of different data sources in an LCA study Therefore the content of this paragraph is
mainly based on this paper The paper is organized as follows firstly the authors report
an overview of the system boundaries and underlying assumptions adopted in building
secondary datasets for arable crops within three databases Secondly they summarise
the approaches adopted to model the foreground system highlighting analogies and
differences Afterwards they point out the influence that modelling approaches can have
on the impact assessment Finally the combination of these elements allowed to derive
some considerations on relevant elements of datasets
17
It is focused on the analysis of secondary datasets for arable crops production as
modelled in three databases adopted as source of secondary data in LCA Agribalyse v
12 (Colomb et al 2015) Agrifootprint v 10 (Blonk Agri-footprint BV 2014) and
Ecoinvent v 31 (Weidema et al 2013) For simplicity in the remainder of the report
they are named Agribalyse Agrifootprint and Ecoinvent respectively
The authors performed three types of analysis
comparison of the system boundaries and underlying assumptions
analysis of how the foreground system is modelled in each dataset focusing on
different aspects such as fertilisers application and nutrient fate plant
protection products application and fate heavy metals (HMs) input mass balance
and fate irrigation agricultural operations land occupation and transformation
comparison of the results of the life cycle impact assessment for the foreground
system including the relative contribution of background
411 Analysis of the system boundaries
The system boundaries and the main underlying assumptions adopted to model arable
crops production in the three databases are reported in Table 10
Table 10 Underlying assumptions in relation to the three databases considered by the authors (Corrado et al 2017)
Agribalyse Agrifootprint Ecoinvent
Data source Provided by technical institutes (eg ARVALIS ndash Institut du Veacutegeacutetal)
Different sources (eg
scientific literature official
statistics such as FAOstat
Eurostat)
GL-Pro project ndash Barrois
region (Nemecek and
Baumgartner 2006)
Straw management (when
applicable)
Partly removed from the
field
Totally removed from the
field
Left on the field
Allocation of co-products
(grains and straw)
Not applied because the
straw market was not very
structured at the time when
the datasets were developed
Economic mass and energy
allocation
Not applicable because
straw is assumed to be left
on the field
Nutrients from straw left
on the field
The fertilising effect of crop
residues and emissions from
the residues are allocated to
the crop that generated the
residues
Not applicable The fertilising effects of crop
residues are allocated to the
crop that generated it (only
for P and K) The amount of
fertilisers is corrected for the
amount of nutrients in crop
residues
Crop
rotation
modelling
Phosphorou
s (P) and
potassium
(K) inputs
and
emissions
allocation
P and K fertilisers production
and emissions due to their
application are allocated to
each crop pro rata for the
crop exports
Not reported The amount of P and K of the
residues supplied to the field
through residues were
allocated to the crop that
generates them
18
N inputs and
emissions
allocation
The organic nitrogen
available for the crop to
which the fertiliser is
applied is allocated to that
crop The remaining fraction
that contributes to
increasing the stock of
organic matter was allocated
to all the crops in the
rotation Mineral nitrogen is
completely allocated to the
crop to which it was applied
Not reported Allocation not performed
412 Foreground system analysis
The authors compared the activities modelled in the foreground system of the datasets
referring to seven field activities agricultural operations fertilisers application and
nutrients environmental fate plant protection products (PPP) application and related
environmental fate heavy metals (HMs) input and related environmental fate irrigation
and land occupation and transformation The average crop yields reported in the dataset
presents small differences (wheat min-max barley min-max rapeseed min-max pea
min-max) The 95 confidence interval of the yields is defined only in Agrifootprint
datasets whereas it is not reported in Agribalyse and Ecoinvent datasets
For completeness findings and aspects to be taken into account are below reported The
below checklist can also be used to build a completeness check of the different datasets
and it can be used to build a sensitivity analysis based on the parameters that are seen
to be affecting the final results
Agricultural practices modelling
Management of agricultural residues
Composition of the crop rotation
Allocation to the co-products
Agricultural operations modelling
Number of operations
Number of passages
Machine power
Soil texture
Airborne emissions due to fuel combustion
Emissions of heavy metals due to tires abrasion
Fertilisers application and nutrients fate modelling
The nutrients fate is highly influenced by site-specific conditions
o environmental conditions
o soil type
o agricultural management practices
o type of fertiliser (Brentrup et al 2000)
o spatial differentiated emissions when modelling agricultural systems
Nomenclature (eg the paper shows that phosphorus compounds emissions were
expressed in the datasets with different flows limiting the possibility of making a
comparison among inventory data)
PPP application and environmental fate modelling
19
application method
weather and soil conditions
crop characteristics
irrigation
active substances whose use is not anymore authorised
Heavy metals inputs and environmental fate modelling
Mass balance
Fate
Irrigation modelling
Irrigation volumes
Water flows type
Environmental conditions
Spatially-differentiated water flows
Land use transformation modelling
Amounts of transformed land are considered
Type of land transformed (eg from hellip to hellip)
CO2 emissions due to land transformation
42 Data quality
As data is essential in all quantitative studies like LCAs so is also their quality
Therefore the data applied in the life cycle inventory phase shall be assessed in the
interpretation phase against the goal and scope of the study is the data quality
sufficient for the goal of the study Is the data consistent Can the data be seen as
complete
If the answer is yes then the interpretation can be preceded and conclusions drawn If
no then either the goal and scope need to be adjusted or probably in most cases
better the life cycle inventory phase need to be revisited in an iterative manner to
improve the data quality to the appropriate level The assessment of the data quality is a
mandatory reporting element in the interpretation phase
ISO 14044 (2006) defines data quality as characteristics of data that relate to their
ability to satisfy stated requirements The data quality requirements are described in
the goal and scope of the LCA study and covers the following 10 aspects (ISO14044
2006 ch 4236)
1) time-related coverage age of data and the minimum length of time over which
data should be collected
2) geographical coverage geographical area from which data for unit processes
should be collected to satisfy the goal of the study
3) technology coverage specific technology or technology mix
4) precision measure of the variability of the data values for each data expressed
(eg variance)
5) completeness percentage of flow that is measured or estimated
6) representativeness qualitative assessment of the degree to which the data set
reflects the true population of interest (ie geographical coverage time period
and technology coverage)
7) consistency qualitative assessment of whether the study methodology is applied
uniformly to the various components of the analysis
20
8) reproducibility qualitative assessment of the extent to which information about
the methodology and data values would allow an independent practitioner to
reproduce the results reported in the study
9) sources of the data
10) uncertainty of the information (eg data models and assumptions)
In the EF methods7 the consistency and reproducibility is one of the main aims of any
EF study and not evaluated as part of the data quality assessment Data sources should
be ILCDEF compliant and specified if a PEFCROEFSR is followed Precision and
uncertainty are evaluated together in the EF method Therefore the EF operates with six
semi qualitative data quality requirements instead of 9 in ISO14044 (cf section 56 in
European Commission 2013)
In order to evaluate the appropriateness and the quality of the data used to compile the
LCI they have to be scored against certain requirements As an example the table below
(Table 11) provides the data quality requirements for a PEF study of intermediate paper
products (EC 2013a Schau and Davidsson 2015)
The table 12 shows the semi-qualitative data quality rating (DQR) (based on expert
judgement) of the most impacting processes in an early phase of a PEF study of
intermediate packaging paper The data set DE Potato starch at plant was deemed to
be of too low quality (DQR = 267) as it scored poor (4) on Parameter uncertainty and
Methodological Appropriateness and Consistency to be used for comparative assertion
Therefore another dataset was searched for that was compliant with the goal and scope
of the study
It is also recommended that the practitioner is aware of the methodological choices used
to build the datasets (may be evaluated under Methodological Appropriateness and
Consistency) such as the definition of the system boundaries between nature and
technosphere and the time-horizons of the emissions (short-termlong term)
System boundaries between nature and technosphere are especially relevant for food
and agricultural product (and products made thereof) as for these products the
technosphere is closely interlinked with nature (Schau et al 2008) This includes
modelling of pesticides and fertilizers (De Schryver and Galatola 2016)
The time-horizons of the emissions are essential especially for long lived product and for
end-of-life processes (eg landfilling waste handling of residues from mining in raw
material extraction) (Guo and Murphy 2012) Also how radioactive waste is modelled is
essential to assess with a time horizon in mind Often a distinction is made between
long term and short term emission Where the boundary is set between those (100
years 300 years 50 000 years etc) can therefore be important and should be taken
into account when assessing the data quality for methodological appropriateness and
consistency (see chapter 433)
Database providers publish their modelling principle (see eg Baitz et al 2016) which is
an essential source for evaluating and assessing the data quality (of background data) in
addition to the metadata of the LCI data itself
Table 11 Data quality rating in an example of intermediate paper products (EC 2013 Schau and Davidsson 2015)
7 In the EF Guide the term representativenessrdquo is used instead of coveragerdquo used in ISO 14044 for the
geographical and time-related data quality requirement The term ldquoparameter uncertaintyrdquo is used instead of ldquoprecisionrdquo used in ISO14044 and the term ldquomethodological appropriateness and consistencyrdquo is used in the EF Guide instead of ldquoconsistencyrdquo used in ISO14044
21
Data quality elements
Representativeness
Qu
alit
y level
Qu
alit
y r
atin
g
Defin
itio
n
Tech
no
log
ica
l
Ge
og
rap
hic
al
Tim
e-r
ela
ted
Com
ple
ten
ess
Meth
od
olo
gic
al
Ap
pro
priate
ness a
nd
Co
nsis
tency
Pa
ram
ete
r u
nce
rta
inty
Very good
1
Meets the criterion to a very high degree without need for improvement
Eg Process is same For electricity from grid average technology as country- specific consumption mix
Country specific data
le 3 years old data
Very good completeness (ge 90 )
Full compliance with all requirements of the PEF guide
Very low uncertainty (le 7 )
Good
2
Meets the criterion to a high degree with little significant need for improvement
Eg average technology as country- specific consumption mix
Central Europe North Europe representative EU 27 mix
3-5 years old data
Good completeness (80 to 90 )
Attributional Process based approach AND following three method requirements of the PEF guide met (1) Dealing with multi-functionality (2) End of life modelling (3) System boundary
Low uncertainty (7 to 10 )
Fair 3
Meets the criterion to an acceptable degree but merits improvement
Eg average technology as country- specific production mix or average technology as average EU consumption mix
EU-27 countries other European country
5-10 years old data
Fair completeness (70 to 80 )
Attribution Process based approach AND two of the following three method requirements of the PEF guide met (1) Dealing with multi-functionality (2) End of life modelling (3) System boundary
Fair uncertainty (10 to 15 )
Poor
4
Does not meet the criterion to a sufficient degree but rather requires improvement
Eg average technology as country- specific consumption mix of a group of similar products
Middle east North-America Japan etc
10-15 years old data
Poor completeness (50 to 70 )
Attributional Process based approach AND one of the following three method requirements of the PEF guide met (1) Dealing with multi-functionality (2) End of life modelling (3) System boundary
High uncertainty (15 to 25 )
Very poor
5
Does not meet the criterion Substantial improvement is necessary
Eg other process or unknown not available (na)
Global data or unknown
ge 15 years old data
Very poor or unknown completeness (lt 50 )
Attributional Process based approach BUT None of the following three method requirements of the PEF guide met (1) Dealing with multi-functionality (2) End of life modelling (3) System boundary
Very high uncertainty (gt25 )
Table 12 Data quality rating in an early phase of a PEF study of intermediate packaging paper
22
Representativeness
Data set
Tech
no
logi
cal
Ge
ogr
aph
ical
Tim
e-r
ela
ted
Co
mp
lete
ne
ss
Par
ame
ter
un
cert
ain
ty
Me
tho
do
logi
cal
Ap
pro
pri
ate
ne
ss a
nd
Co
nsi
ste
ncy
Resulting Data Quality Rating (DQR)
CH building hall steel construction 1 3 3 1 3 4 250
CH disposal sludge from pulp and paper production 25 water to sanitary landfill 1 3 3 1 3 4 250
CH disposal steel 0 water to municipal incineration 1 3 3 1 3 4 250
DE lignite briquettes at plant 1 3 3 1 3 4 250
DE maize starch at plant 1 3 3 1 3 4 250
DE potato starch at plant 1 3 3 1 4 4 267
RER AKD sizer in paper production at plant 1 2 3 1 3 4 233
RER aluminium sulphate powder at plant 1 2 3 1 3 4 233
RER building multi-storey 1 2 3 1 3 4 233
RER electricity medium voltage production RER at grid 1 2 2 1 3 3 200
RER facilities chemical production 1 2 3 1 3 4 233
RER heavy fuel oil at regional storage 1 2 3 1 3 4 233
RER heavy fuel oil burned in industrial furnace 1MW non-modulating ltu-sogt 1 2 3 4 3 4 283
RER industrial wood hardwood under bark u=80 at forest road 1 2 3 1 3 4 233
RER industrial wood softwood under bark u=140 at forest road 1 2 3 1 3 4 233
RER natural gas high pressure at consumer 1 2 3 1 3 4 233
RER paper mill integrated ltu-sogt 1 2 3 1 3 4 233
RER PEFEmissions-RF ltu-sogt 1 2 3 3 3 3 250
RER PEFEmissions-VF v03 ltu-sogt 1 2 2 2 4 3 233
RER sodium chlorate powder at plant 1 2 3 1 3 4 233
RER sodium dithionite anhydrous at plant 1 2 3 1 3 4 233
RER sodium hydroxide 50 in H2O production mix at plant 1 2 3 1 3 4 233
RER steel converter chromium steel 188 at plant 1 2 3 1 3 4 233
RER steel electric chromium steel 188 at plant 1 2 3 1 3 4 233
RER sulphate pulp ECF bleached at plant 1 2 3 1 3 4 233
RER sulphate pulp unbleached at plant 1 2 3 1 3 4 233
RER sulphuric acid liquid at plant 1 2 3 1 3 4 233
RER transport freight rail 1 2 3 1 3 4 233
RER transport lorry gt16t fleet average 1 2 3 1 3 4 233
RER Water Withdrawals-VF ltu-sogt 1 1 2 1 3 3 183
23
43 Further completeness and consistency checks
In this section some further checks are presented referring both to completeness and
consistency checks
431 Anomaly assessment An anomaly assessment can be done where based on previous experience unusual or
surprising deviations from expected or normal results are observed and examined for
relevance (Skone 2000)
As a practical example it can be considered the case of LCA studies of mining activities
When the production of eg copper concentrates was assessed adopting an impact
assessment method such as ILCD and performing the hotspot analysis as described in
chapter 3 of this report it was found that the identification of most relevant impact
categories did not include Resource Depletion fossil mineral In addition the most
relevant processes and life cycle stages contributing to this impact category were not
related to the ones involved in the copper extraction In the case under analysis it was
found that elementary flows related to extraction of resources from nature were missing
from the inventory because the dataset used in the analysis did not include in its goal
and scope the assessment of Resource Depletion fossil mineral
A learning was that it is true that it is important to evaluate what is most relevant (eg
impact categories life cycle stages processes elementary flows) however it is also
important to check if what is found as being non-relevant can be actually considered as
such Hence it is important to evaluate if the LCI modelled is complete with regard to
the impact categories that the assessor wants to evaluate
432 Cut-off ISO 14044 identifies cut-off as the ldquospecification of the amount of material or energy
flow or the level of environmental significance associated with unit processes or product
system to be excluded from a studyrdquo ISO 14044 also requires that the effect on the
outcome of the study of the cut-off criteria selected shall be assessed and described in
the final report
Cut-off criteria can be based on
Mass eg lt5 cumulative mass input
Energy eg lt5 cumulative energy input
Environmental significance eg lt5 of the results of the selected impact categories It is important to note that the cut-off criteria need to be selected based on the goal and
scope of the study Therefore if the study is intended to be used for comparisons and
comparative assertions a sensitivity check using all the above three criteria is a
mandatory requirement
433 Long term emissions Long term emissions are those emissions considered to happen beyond 100 years up to
thousands of years (eg 60000)
Not all databases include long-term emissions within the system boundaries In some
cases it can be observed that LCA results after characterization normalization and
weighting are by far dominated by toxicity-related impact categories When this is the
case it is recommended to check if the datasets used include long term emissions
which in terms of absolute amounts are well superior compared to emissions occurring
within 100 years It has also to be noted that the models to estimate long term
emissions are affected by a high uncertainty which has to be taken into account in the
LCA study to avoid biased conclusions and wrong recommendations
When dealing with long term emissions it is important however not to overlook their
potential impact therefore it is recommended to
Assess a baseline scenario excluding long-term emissions
Perform a sensitivity analysis including long-term emissions in the LCI
Include an analysis of the uncertainty associated to the inclusion of long-term
emissions
24
25
5 Interpretation on Life Cycle Impact Assessment (LCIA)
level
Life Cycle Impact Assessment is the phase in an LCA where the inputs and outputs of
elementary flows that have been collected and reported in the inventory are translated
into impact indicator results LCIA has two mandatory steps which are the classification
and the characterization of LCI results and two optional steps normalisation and
weighting
Many elements can be subject to interpretation in the LCIA phase In this report the
focus will be on
the relevance of applying different characterization models
the relevance of applying different normalisation sets
the relevance of applying different weighting sets
the identification of the most sensitive elements in determining the final results
conclusions and recommendations
the coverage of characterization factors compared to the inventoried elementary
flows
Those points will be illustrated in the following section through illustrative case studies
First a case study dealing with sensitivity analysis of using different characterization
models for toxicity-related and resource-related impact categories will be discussed
Second a case study dealing with using different impact assessment methods This case
study will also be used to go through sensitivity analysis in relation to normalisation sets
and weighting sets
Third a case study mapping the coverage of characterization factors of toxicity-related
categories compared to the inventoried elementary flows will be shown
51 Characterization sensitivity analysis
The use of different characterization models to assess a certain impact category may
play a relevant role in the calculation of the final results and the identification of
hotspots most relevant life cycle stages processes and elementary flows
511 Case study 1 ndash WEEE management Toxicity-related and Resource-related impact categories affecting interpretation of results
The first case study is based on a work by Rigamonti et al (2017) the authors selected
a case study in which LCA has been applied to assess a waste electrical and electronic
equipment (WEEE) management system (Biganzoli et al 2015) In that study the
assessment was carried out to quantify the mass balance of the WEEE management
system in Lombardy Region in the year 2011 and to calculate its environmental benefits
and burdens
Firstly they tested characterization models and characterization factors (CFs) for
toxicity-related impact categories human toxicity cancer and non-cancer and eco-
toxicity There is an evolving debate on the robustness of these impact categories and
specifically for what concern impacts due to metals (see eg Pizzol et al 2011) In fact
some specific features of the metals (eg essentiality) as well as elements affecting
their fate modelling (eg different conditions affecting their bioavailability) are not fully
captured by currently available models applied in LCA Therefore the authors ran a
sensitivity analysis where updated CFs for metals were tested along the lines of recent
literature (Dong et al 2014) aiming at identifying the different results associated to
metals impact compared to the ILCD method (EC-JRC 2011) based on the USEtox
model (Rosenbaum et al 2008)
26
The total impact obtained by applying Dong et al 2014 CFs resulted about three times
higher than the corresponding obtained by the USEtox model This is mainly due to the
Dong et al 2014 CFs of Copper (Cu) and Zinc (Zn) which are higher than those adopted
in the USEtox model when considering the freshwater archetype proposed in the paper
of Dong as default when the location of the emission is not known
Secondly they tested impact assessment models for resource Models currently available
differ both in the modeling approach in the perspective adopted for assessing the
resources (Dewulf et al 2015) and as consequence in the characterization metric and
factors adopted (Mancini et al 2016) Beyond the potential benefit associated to a mass
based approach to recycling (eg kg of material recycled) there is indeed the need of
understanding to which extent the recycled materials are contributing to the resource
depletion impact categories The authors tested abiotic depletion potential (ADP) (CML
2012) which is focusing on potential depletion based on the ratio between resource
consumption and availability (either considering ultimate reserves in earth crust known
base reserves or economically viable reserves) ILCD model (EC-JRC 2011) which is an
extended version of CML2012 reserve based (based on CML algorithm few other
resources have been added described in Sala et al 2012) EDIP97 (Hauschild and
Wenzel 1998) which is comparing the resource with the deposits economically
exploitable without accounting for current level of consumption EPS2000 (Steen
1999) which assesses the cost (as societyrsquos willingness to pay) of substituting a
substance by an alternative for future generations affected by current level of depletion
Recipe 2008 (Goedkoop et al 2009) which is looking at marginal increase of extraction
cost per kg of extracted resource differentiating it by deposit and assuming a discount
rate over an indefinite timespan the Anthropogenic Abiotic Depletion Potential (AADP
Schneider et al 2011) which is accounting for the potential of resource recycling
assuming urban mining as an additional source of resources The recent update of the
AADP (Schneider et al 2015) was also considered It introduces the concepts of
ultimately extractable reserves represented by the amount available in the upper
earths crust that is ultimately recoverable A new set of CFs were also tested developed
by Mancini et al (2016) aiming at addressing the benefit associated to the recovery of
Critical Raw Materials (CRMs) The characterization model is based on the use and
adaptation to LCA of the supply risk indicators developed by the European Commission
(EC 2014) Three sets of CFs are tested based on different assumptions (1) baseline
option the supply risk factors as such ndash (SR) (2) an exponential function which
magnifies the differences between the CRMs - (SR)^6 (3) the ratio between supply risk
and production data (SRworld mine production in 2011) which reflects the size of the
market giving more importance to the materials used in small amounts in products and
applications like eg specialty metals that are often perceived as critical
The comparison among the different models was first of all made considering the mineral
resources present in the inventory of the case study covered by each of them The ILCD
method is the most comprehensive one with 31 mineral resources included in its model
for the resource depletion category On the contrary the Supply Risk (3) is the one that
covers the minor number of substances (ie 7)
A contribution analysis was also performed (Figure 3) Silver (Ag) gives the main
percentage contribution to the indicator in five models (ie CML 2012 versions b and c
ILCD Supply Risk 3) and EDIP97) Cobalt (Co) is the main contributor in the Supply
Risk (2) Copper (Cu) in the ReCiPe 2008 Palladium (Pd) in the EPS 2000 and AADP
(2015) and Nickel (Ni) in the AADP (2011) In the CML 2012 (a) Tellurium Gold (Au)
and Silver (Ag) are the most important substances whereas Aluminium (Al) Copper
(Cu) and Nickel (Ni) are the main contributors in the case of the Supply Risk (3)
27
Figure 3 Contribution analysis for the resource- related indicator calculated adopting several characterization models (Rigamonti et al 2017)
512 Case study 2 ndash Basket of Products Food sensitivity analysis
comparing different impact assessment methods
This case study is based on the application of different life cycle impact assessment
methods for the evaluation of the environmental impacts associated to food consumption
in Europe A process-based LCA has been performed for a basket of products that
represent the most relevant food product groups selected by importance in mass and
economic value to depict the average consumption for nutrition of EU citizens in 2010
(Notarnicola et al 2017b) The product groups in the basket were pig meat beef
poultry milk cheese butter bread sugar sunflower oil olive oil potatoes oranges
apples mineral water roasted coffee beer pre-prepared dishes For each product group
in the basket an inventory model based on a representative product has been
developed The impact of each representative product was then multiplied by the mass
of products in that product group that is consumed in one year by an average EU citizen
The environmental impact of the average food consumption of a European citizen has
been characterized using ILCD method for the life cycle impact assessment (EC-JRC
2011) The paper by Notarnicola et al (2017) illustrates the details of the process-based
LCA study on the BoP nutrition for EU 27 citizens and presents the results of the
characterisation phase The variability of the results associated to methodological
choices has been already preliminary explored (Castellani et al 2017) The present
report builds on those results and elaborates the interpretation phase (including also
normalisation and weighting) The questions that these analyses help answering are i)
are the products found to have the highest impact sensitive to changes in LCIA elements
(characterisation factors normalization references or the weighting sets) and ii) which
are the most contributing impact categories
This case study will also be used in paragraph 52 53 and 54 as a basis for further
insights on the interpretation of an LCA study
For this specific case the authors performed a sensitivity analysis on the LCIA
characterisation phase using ILCD compared with other two methods the CML-IA v 42
(Guineacutee et al 2002) and the Ecological footprint (EcF) (Wackernagel et al 2005) CML-
IA was chosen because it is widely used in LCA studies and because it adopts a different
28
modelling approach compared to ILCD in several impact categories that could be
relevant for food chains For instance for toxicity-related impact categories CML-IA is
based on USES-LCA model (Van Zelm et al 2009) whereas ILCD is applying USETOX
model (Rosenbaum et al 2008) for eutrophication CML-IA is using RAIN-LCA
(Huijbregts 1999) whereas ILCD is using different models for terrestrial and aquatic
eutrophication (respectively accumulated exceedance by Seppaumllauml et al 2006 and
EUtrend model as applied by Struijis et al 2009) The EF was chosen because it
assesses impacts in terms of direct and indirect land use and has been considered a
method that may complement LCA (Lee et al 2014) although based on an accounting
framework that has been questioned (Giampietro and Saltelli 2014) The version of EcF
method implemented in the study is the one already adapted to LCA and provided
within the SimaPro 805 software package (Pregrave Consultants 2015)
The three methods are mostly convergent in the identification of the product groups to
be considered hotspots within the BoP nutrition ie within the food consumption of the
European citizens ILCD and CML-IA identify a wider range of hotspots compared to EcF
mainly because they cover a wider range of impact categories (eg bread and potatoes
do not emerge as hotspot for EcF because their main impacts are in impact categories
not covered by the EcF method)
The product groups that emerge as hotspots in all the methods even if with slightly
different level of contribution are meat and dairy products and beer (as representative
product for alcoholic drinks)
The impact categories for which beer emerge as hotspot are slightly different among the
three methods ozone depletion ionizing radiation and resource depletion in ILCD and
CML-IA photochemical ozone formation in ILCD human toxicity and marine aquatic
ecotoxicity in CML-IA and nuclear energy in EcF The most contributing processes for all
the impact categories listed before is energy (electricity and heat) as already discussed
for ILCD In the case of CML-IA method toxicity-related impacts are mainly due to direct
emissions to air coming from the production process of the packaging glass
513 Conclusions and recommendations
These results reveal that the relative importance of one substance compared to another
changes with the model This is because the models differ in the substances that they
include and in the CFs of each substance It is recommended to run a sensitivity check
with different characterization models to evaluate the robustness of the conclusions
drawn It is also recommended to evaluate the theory underlying the characterization
models chosen to evaluate a certain impact category as this helps understanding the
results obtained
52 Characterization mapped flows and unmapped flows
This section shows two different levels of checks the first one focuses on a comparison
between two different life cycle impact assessment methods (ie ILCD vs CML-IA) based
on Castellani et al (2017) the second one focuses on what are the implications of
uncharacterized flows for a specific impact category (freshwater ecotoxicity) based on
the case study presented in Notarnicola et al (2017b)
521 Comparison between two different methods
A check of the inventoried elementary flows that are not characterized at the LCIA phase
should always be done to support interpretation of results Indeed the comprehensive
translation of the inventory into potential environmental impacts may not occur if some
of the elementary flows are not covered by the chosen characterization models Table 13
reports an example of the total amount of elementary flows that are available in an
inventory but they are not mapped and characterized by the methods considered (ILCD
and CML-IA) as reported in Castellani et al (2017) The authors checked the list of
uncharacterized flows for the inventory of the case study under evaluation and
29
highlighted the most relevant ones either in term of mass or of known environmental
concern The information obtained was then used in support to interpretation For
instance in case the two methods used for characterisation and normalisation give very
different results for one impact category the information about uncharacterized flows
can help to check if this difference is due to a different characterisation of impacts (ie
to a different way of considering the environmental relevance of some elementary flows)
or if it is affected by the fact that some flows (eg some emissions) are not taken into
account by one of the methods
This may occur also due to improper nomenclature of the elementary flows which may
cause a mismatch between the elementary flows listed in the inventory and the
elementary flows to which a characterization factor is available for example the
inventory may report CaCO3 while the characterization model may provide a CF for
calcite This mismatch would prevent the characterization of CaCO3
Table 13 Example of check of inventoried elementary flows that are not characterized by two impact assessment methods (based on Castellani et al 2017)
Flows Total elementary flows not characterized
Typologies of flows
Details on the elementary flows not characterized
ILCD CML-IA
ILCD CML-IA
Nr flows Amount Unit Nr flows
Amount Unit
raw materials
97 510 metals and minerals
47 795 kg 47 863 kg
water flows 25 126 m3 300 3825 m
3
Energy 0 0 MJ 12 18964 MJ
land use 11 001 m2 (or
m2a)
117 12898 m2 (or
m2a)
others 14 na mixed 34 na mixed
emissions to soil
83 227 pesticides to soil
45 0003 kg 173 008 kg
others 38 08 kg 54 41 kg
emissions to water
167 310 radioactive substances
42 119E+03 Bq 61 385E+06 Bq
metals and inorganics compounds
34 28 kg 36 28 kg
others 91 na mixed 213 na mixed
emissions to air
179 286 radioactive substances
49 899E+04 Bq 73 973E+07 Bq
metal and inorganics compounds
65 007 kg 56 0044 kg
pesticides 7 580E-08 kg 32 93 kg
others 70 na mixed 125 na mixed
waste flows 17 17 waste 17 3784 kg 17 3784 kg
Overall number of elementary flows not characterized
543 1350
In order to assess which elementary flows available in the inventory were not accounted
during the characterization the authors performed an analysis of the elementary flows
not characterized when using ILCD and CML-IA methods In total the model of the
basket includes 1730 elementary flows The ILCD method is not able to cover 543 of
these elementary flow as emission into air water soil or resource used whereas when
CML-IA is used to characterize the inventory 1350 elementary flows out of 1730 are not
30
characterized In Table 1 the list of main typologies of flows is reported Many pesticides
organic chemicals and inorganics are not characterized by the two methods Several
ionizing substances are not characterized as well as elementary flows related to group of
substances (such as AOX PAH BTEX VOC BOD and COD) Missing the CFs means that
it is not possible to estimate the extent to which eg the toxicity-related and ionizing
radiation-related impact categories are underestimated
Apart from the total number of flows covered the main difference between the two LCIA
methods is the ability to assign a characterization factor (CF) to the pesticides included
in the inventory ILCD has no CFs for 45 pesticidesrsquo emission to soil (plus 4 pesticidesrsquo
emissions to air) whereas CML-IA for 173 (plus 32 pesticidesrsquo emissions to air) This
may be the reason why human toxicity impacts appear as relevant in the results of ILCD
characterization (and related normalization and weighting as discussed below) and they
appear as less relevant in the results of CML-IA characterization and related
normalization and weighting
522 Analysis of uncharacterized flows within an impact category Based on the study of Castellani et al (2017) fourteen impact categories (IC)
recommended in PEF are calculated The number of elementary flows (ElFls) by ICs
varies from few flows (eutrophication acidification etc) to thousands (eco and human
toxicity) (see table 14)
For most of the ICs the contributing elementary flows reported in an inventory are well
identified and their inclusion in the calculation of the final score is expected to be done
correctly For climate change at mid-point 104 elementary flows with their associated
CFs are derived from the IPCC 2007 report for a 100-year period
However for impact categories like toxicity the number of elementary flows contributing
to the impact can be very important making possible the omission of some EFs at the
inventory level Additionally a high number of flows reported in the inventory have no
CFs If the number of un-characterized flows is too high this can lead to a non-robust
interpretation of the LCIA results
Table 12 shows the number of elementary flows with associated a CF (ie the single
chemical) and the amount of elementary flows with a CF per different compartment (eg
the single chemical in each compartment and sub-compartment)
Table 14 List of impact categories listed in ILCD with total number of elementary flows contributing to each IC
Impact Category ElFl with CFs (all emission compartments)
Unique ElFls with CFs (single chemical flows)
Climate change 104 102
Ozone Depletion 23 23
Human toxicity non cancer 3434 442 (USEtox 419 org+18 metals)
Human toxicity cancer 4734 607 (USEtox 596 org +8 metals)
Particulate matter 46 24
Ionizing radiation Human Health 50 29
Photochemical ozone formation 133 133
Acidification 7 7
Terrestrial eutrophication 7 7
Freshwater eutrophication 10 5
Freshwater ecotoxicity 15636 2526 (USEtox 2498 org +21 metals)
Land use 206 206
Water source depletion 1180 1180
Mineral fossil use amp Resource depletion
181 181
Marine eutrophication 14 11
Additional IC not used in PEF
Ionizing radiation Ecosystem (interim) 62 15
31
The potential impact of un-mapped (or uncharacterized) flows is illustrated via a case
study focusing the freshwater aquatic toxicity impact category using a recent modelling
of 17 food products (Notarnicola 2017b)
For a high proportion of the total mass of un-characterized ElFls the impact on the final
IC scores is null As a matter of fact 9998 of the 1887 kg ElFls emitted to the air are
made of air oxygen and hydrogen Only 033 kg (but still 199 flows) are actual made of
other type of chemicals 80 of those 033 kg are nitrogen type of chemicals 74
hydrogen chloride 12 sulphate etc (table 15) However regarding the ElFls to soil
and water the mass and number of un-characterized flow could have a significant
impact on the final score
Table 15 Type of chemicals (mass and number of EFs) not characterized per emission compartment (air oxygen and hydrogen have been excluded)
Compartments Group of chemicals Mass (g) Number of ElFl
Air
Total air 330 122
N-related 238662 2
inorganicsalt 74637 44
organic 5693 36
S - related 3896 1
metalmineral 3793 17
Alkenes 1530 2
Benzene Toluene Ethylbenzene and Xylene) unspecified ratio 0488 1
ozone 0314 1
P-related 0304 4
ionising 0261 4
Aldehydes 0213 1
Terpenes 0102 1
PAH 0034 1
Pesticide 0000 6
Acid 0000 1
Soil
Total soil 800 68
metalmineral 328315 15
inorganic 320234 4
oils 93496 3
organic 48702 2
Pesticide 5873 39
S - related 3777 2
N-related 0000 2
PAH 0000 1
Water
Total water 13871 112
inorganicsalt 7549785 22
TOC water 2840410 4
metalmineral 1998366 13
Suspended solid 1257655 6
inorganic 108851 6
organic 107546 37
AOX 2390 1
Acid 2032 2
S - related 2008 5
VOC 0643 1
32
N-related 0511 3
Propylene 0244 1
oils 0079 2
PAH 0055 2
Sodium Hydroxide 0054 1
Salt unspecified 0015 1
Hypochlorite 0013 1
ionising 0002 2
VOC 0001 1
P- related 0000 1
Looking at the results of the freshwater aquatic toxicity impact categories for all 17 food
products 90 of the impact category is driven by 10 out of 734 elementary flows that
represents only 14 of the mass of chemicals entering the aquatic environment (table
16) Furthermore it can be seen that
57 of the toxicity score are due to 3 metals representing 01 kg of the mass
However there are still more than 2 kg of un-characterized metalsminerals in
the inventory list (see table 15)
33 of the impact are due 10 pesticides (35 g) although there are still 39 un-
characterized pesticides in the inventory list (representing 5 g) (see table 15)
Table 16 Most relevant elementary flows contributing cumulatively up to 90 to the freshwater ecotoxicity impact category with USEtox
Substance Chemical
class Emission
Compartment Sub-compartment
Total impact (CTUe)
impact versus Total
Cumulated
impact Mass (kg)
Zinc metal Soil agricultural 931 21 21 00441
Copper metal Soil agricultural 902 21 42 00429
Chlorpyrifos pesticide Soil agricultural 833 19 61 00079
Copper metal Soil
351 8 69 00120
Zinc metal Water
139 3 72 00036
Folpet pesticide Soil agricultural 134 3 75 00004
Chlorothalonil pesticide Soil agricultural 111 3 78 00019
Chromium metal Water
105 2 80 00020
Cyfluthrin pesticide Soil agricultural 85 2 82 00001
Isoproturon pesticide Soil agricultural 81 2 84 00086
Cypermethrin pesticide Soil agricultural 70 2 85 00010
Chromium metal Soil agricultural 51 1 87 00019
Prochloraz pesticide Soil agricultural 45 1 88 00024
Captan pesticide Soil agricultural 39 1 88 00039
Alachlor pesticide Soil agricultural 38 1 89 00041
Metolachlor pesticide Soil agricultural 30 1 90 00050
Among the non-characterized elementary flows in relation to freshwater ecotoxicity it
can be observed
it is not known to which extent some of the chemicals may contribute to the IC
a number unspecified chemicals such as lsquoTotal organic matterrsquo (TOC BOD
CODhellip) PAH VOC that could contribute significantly to the overall score Since
the quantity of those ElFl can change significantly between products a default CF
could be proposed for those flow
some chemicals are known to be contributing to toxicity like pesticides and
metals still there are significant proportions that are not characterized
33
Although it is not possible to conclude if those un-characterized flows would have
changed the total score significantly based on the mass and number of known-
contributing class of chemicals (metals and pesticides) it is highly recommended that a
quantification of the uncharacterized chemicals is reported for the freshwater toxicity
impact category before drawing final conclusions
523 Conclusions and recommendations
Results of the LCIA phase can be highly affected by the characterization model chosen
as shown in chapter 51 Furthermore the evaluation of uncharacterized elementary
flows is of primary importance to assess the completeness of the LCIA coverage of the
identified LCI flows Indeed a high number of elementary flows inventoried might be
non-characterized by the chosen models even if their relevance in the assessed impact
categories could be of primary importance Therefore it is highly recommended that a
quantification of the uncharacterized elementary flows is reported before any
interpretation or conclusion is performed on the superiority of one product versus
another
53 Normalization sensitivity analysis
As for the characterisation phase also the choice of the normalisation reference set can
highly influence results Castellani et al (2017) have done a sensitivity analysis based on
the case study of a basket of product on food (see paragraph 512 for further details)
The authors report that as an optional step normalisation and weighting could be
applied to characterized LCA results to support the identification of the most important
impact categories Given that several sets of normalisation and weighting are available
the authors tested some of them in addition to the ILCD baseline with the aim of
assessing the sensitivity of the results to the choice of particular geographical and
temporal reference systems (ie normalization using EU or global scales) as well as
perspectives (ie weighting) This was investigated by selecting 3 sets of ILCD-compliant
normalization references (Benini et al 2014 Benini et al 2015 Laurent et al 2013)
and 2 sets of CML-IA compliant normalization references (EU 25+3 year 2000 and
World year 2000 - Guineacutee et al 2002) -reported in Table 17 In this section the
findings of the authors regarding normalisation will be discussed while the findings on
weighting will be discussed in section 54
Table 17 Summary of normalization sets used in the sensitivity analysis in Castellani et al (2016)
ILCD Impact Category Unit EC-JRC EU27
(2010) per person
a
EC-JRC Global (2010 or 2013)
per personb
PROSUITE Global (2010 or
2000) per person
c
Climate change kg CO2 eq 922E+03 707E+03 810E+03
Ozone depletion kg CFC-11 eq 216E-02 122E-02 414E-02
Human toxicity cancer effects CTUh 369E-05 124E-05 542E-05
Human toxicity non-cancer effects CTUh 533E-04 155E-04 110E-03
Particulate matterRespiratory inorganics kg PM25 eq 380E+00 507E+00 276E+00
Ionizing radiation human health kBq U
235 eq (to
air) 113E+03 241E+02 133E+03
Photochemical ozone formation human health kg NMVOC eq 317E+01 453E+01 567E+01
Acidification mol H+ eq 473E+01 561E+01 496E+01
Eutrophication terrestrial mol N eq 176E+02 164E+02 115E+02
Eutrophication freshwater kg P eq 148E+00 654E+00 620E-01
Eutrophication marine kg N eq 169E+01 304E+01 938E+00
Land use kg C deficit 748E+04 520E+06 236E+05
Ecotoxicity freshwater CTUe 874E+03 374E+03 665E+02
Resource depletion water m3 water eq 814E+01 689E+01 297E+01
Resource depletion mineral fossils and renewables kg Sb eq 101E-01 193E-01 313E-01
34
An additional analysis was performed to verify which one between normalization and
weighting is the most sensitive step in the identification of the most relevant impact
categories The same weighting sets described before were applied on the results of
normalization obtained using the two ILCD-compliant global normalization reference sets
tested before namely EC-JRC Global (Benini et al 2015) and PROSUITE Global (Laurent
et al 2013)
The contribution of product groups (Table 18) and of impact categories (Table 19) to the
total normalized impact of the BoP nutrition per citizen were analyzed
Table 18 presents a summary of the sensitivity analysis on product group contribution at
the normalization stage comparing the product group hotspots according to ILCD and
CML-IA methods Values are expressed as percentage of the normalized value per citizen
for that product group with respect to the total normalized impact per citizen (total
impact of nutrition in one year for an average EU-27 citizen) Equal weighting among
impact categories is assumed Results at the normalization stage almost confirm the
hotspots identified at the characterization stage meat and dairy products are again
hotspots for all the methods whereas other products that emerged before are
considered less contributing at the normalization stage This means that those products
generate impacts in impact categories that are considered less relevant compared to the
others according to the normalization scheme adopted For instance beer appeared to
be a hotspot for both ILCD and CML-IA at the characterization stage whereas only CML-
IA method identifies it as a hotspot at the normalization stage This happens because the
CML-IA normalization references (EU 25+3 and World) for marine aquatic toxicity -one
of the impact categories for which beer is a hotspot - are relatively low compared to the
ones in other LCIA methods
Table 18 presents a summary of the results of the sensitivity analysis at the
normalization stage comparing the relevance of impact categories according to ILCD
and CML-IA methods Results refer to the entire BoP For each impact category of the
two methods values are expressed as percentage of the normalized value per citizen for
that impact category with respect to the total normalized impact per citizen
Table 18 Results of sensitivity analysis on normalization sets at the European and global scale for ILCD- and CML-IA methods (Castellani et al 2016) The percentages represent the contribution of each product group to the total impacts of the BoP per citizen (reference flow) Equal weighting of impact categories is applied The second column reports the mass of each product group in the basket A color scale is applied to the results in each column (ie product group) from green (lowest contribution) to red (highest contribution)
Quantity in the basket (kgyear)
Share of total BoP
mass
EC-JRC EU27 (2010)
EC-JRC Global (2010
or 2013)
PROSUITE Global (2010
or 2000)
CML EU 25+3 (2000)
CML World (2000)
Mineral water 1050 194 1 1 1 3 3
Beer 698 129 4 4 7 16 21
Coffee 47 06 2 1 5 5 6
Apple 161 30 0 0 1 1 1
Oranges 174 32 1 1 2 1 2
Potatoes 691 130 3 3 3 3 4
Bread 393 73 3 3 3 4 5
Olive oil 53 10 1 0 1 2 3
Sunflower oil 53 10 4 4 5 3 3
Sugar from beet 298 55 3 3 3 2 1
Milk 801 148 9 9 8 7 6
Cheese 150 28 15 16 13 10 9
Butter 36 07 7 8 6 3 2
Meat - beef 137 25 18 17 16 11 10
Meat - pork 410 76 20 20 19 18 13
Meat - poultry 220 42 8 8 8 10 7
Pre-prepared meal
29 05 1 1 1 2 2
35
100 100 100 100 100 100
Table 19 Results of sensitivity analysis on normalization sets at the European and global scale for ILCD and CML-IA methods (Castellani et al 2016) The percentages reflect the relative relevance of impact categories compared to the total impacts of the BoP per citizen (reference flow) A colour scale is applied to the results in each column (ie impact category) from green (lowest contribution) to red (highest contribution)
EC-JRC EU27 (2010)
EC-JRC Global (2010 or 2013)
PROSUITE Global (2010 or 2000)
CML EU 25+3 (2000)
CML World (2000)
Climate change 19 11 13
Global warming (GWP100a) 78 102
Ozone depletion 00 00 00 Ozone layer depletion 02 00
Human toxicity cancer effects
62 83 25
Human toxicity
59 120 Human toxicity non-cancer effects
446 692 127
Particulate matter 26 09 21 -
Ionizing radiation HH 05 11 03 -
Photochemical ozone formation
10 03 03 Photochemical ozone formation
46 21
Acidification 73 286 41 Acidification 272 201
Terrestrial eutrophication 83 40 75
Eutrophication
133 163
Freshwater eutrophication 34 04 48
Marine eutrophication 82 20 87
Freshwater ecotoxicity 58 61 450
Freshwater aquatic ecotoxicity 340 314
- - - -
Marine aquatic ecotoxicity
- - - - Terrestrial ecotoxicity
Land use 23 00 04 -
Water resource depletion 62 33 100 -
Mineral fossil amp ren resource depletion
18 04 04 Abiotic depletion 02 11
Abiotic depletion (fossil fuels) 68 67
100 100 100
100 100
531 Conclusions and recommendations
Different normalisation sets may produce different results in terms of identification of
most relevant impact categories life cycle stages and processes Different reference
systems refer to different situation which can all be valid depending eg on the
geographical scope of the study It is recommended to evaluate different normalisation
tests which fit the study at hand to support the conclusions drawn with the baseline
scenario or to provide additional insights
54 Weighting sensitivity analysis
Castellani et al (2016) investigated only for ILCD-compliant normalization sets in
addition to equal weighting 8 ILCD-compliant weighting sets (reported in Table 20) were
tested The different sets were selected aiming at covering several perspectives on
weighting namely distance to target for EU policies considering binding and non-
binding target at 2020 (Castellani et al 2017) a previous distance to target set (EDIP)
36
for Europe for 2005 (Stranddorf et al 2005) two sets considering planetary boundaries
(Tuomisto et al 2012 Bjoslashrn and Hauschild 20158) a set which gives relevance to
midpoint indicators based on their contribution to impact at the endpoint (Ponsioen and
Goedkoop 2015) a set resulting from the combination of different panel-based
approaches (Huppes et al 2012)
When needed available weighting sets have been adapted to ILCD impact categories
The majority of these weighting sets build on normalization factors that are specific of a
geographic scale Tuomisto et al (2012) calculated planetary boundaries at global scale
whereas and Bjoslashrn and Hauschild (2015) did it for both global and European scales
Huppes et al (2012) adopted a panel-based approach with no specific geographic
representativeness whereas all the other weighting sets used in this work have been
originally developed or adjusted for applications at the targeting the European scale
The use of EU27-consistent weighting sets in combination with global normalization
factors may lead to inconsistencies therefore the results have to be interpreted in the
light of this inconsistency In this work the normalized and weighted results are
calculated and presented anyway for all combinations so to show the effect of the
selection of weighting available for practitioners rather than focussing on the (in-
)consistency of their joint use with normalization factors The performed analysis
quantified the relative contribution by impact category to the overall impacts associated
with the BoP as well as the contribution by each of the products The effects of the
different weighting sets tested on the results of the BoP normalized to EC-JRC EU27
normalization references are presented in Table 21 and Table 22
Table 20 Summary of weighting sets used in the sensitivity analysis by Castellani et al (2016)
Distance to target Damage oriented Panel-
based
Policy targets Planetary boundaries Mid-to-
endpoint
Castellani et al 2016
WFsA
Castellani et al 2016
WFsB
EDIP 2003 (Stranddo
rf et al 2005)
Tuomisto et al 2012
Bjoslashrn amp Hauschild
- European
2015
Bjoslashrn amp Hauschi
ld ndash Global 2015
Ponsioen amp
Goedkoop 2016
Huppes et al 2012
ILCD Impact Category dimensionless ()
Climate change 71 54 2 10 25 26 44 232
Ozone depletion 64 49 87 8 1 2 0 36
Human toxicity cancer effects 69 52 2 na na na 1 65
Human toxicity non-cancer effects
62 47 2 na na na
4 41
Particulate matterRespiratory inorganics
74 56 na na na na
8 66
Ionizing radiation human health
61 46 na na na na
0 65
Photochemical ozone formation human health
78 59 2 na
34 48
0 54
Acidification 72 55 2 8 1 1 0 42
Eutrophication terrestrial 70 53 2 28 1 0 0 23
Eutrophication freshwater 62 47 1 7 9 2 0 23
Eutrophication marine 69 52 2 28 1 1 0 23
Land use 64 53 na 6 25 16 19 102
Ecotoxicity freshwater 61 51 0 na 2 0 0 109
Resource depletion water 61 296 na 5 1 4 3 51
Resource depletion mineral fossils and renewables
61 30 0 na na
na 19 69
8 Bjoslashrn and Hauschild provided to the authors of this report a modified version to be used as weighting method
in compliance with EU27 ILCD normalization factors Global weighting factors were calculated directly from global normalization factors published by Bjoslashrn and Hauschild 2015
37
The contribution of specific products to the overall impacts associated to the BoP
nutrition is very similar when using several weighting sets in combination with
normalization references EU27 (Table 21) In fact for all the weighting sets tested pork
meat and beef meat are the highest contributor to the impacts (varying between 15
and 22) According to all sets cheese is the 3rd largest contributor (14 on average)
whereas milk and poultry meat are most frequently identified as 4th and 5th largest
contributors (roughly 8 each) On average these product groups account for roughly
70 of the total impacts Apples olive oil and pre-prepared meals are those contributing
the less followed by mineral water and oranges On average their cumulative
contribution is around 5
Table 21 Product groups contribution Results of several ILCD-compliant weighting sets in combination with normalization references EU27 (Castellani et al 2016) A color scale is applied to the results in each column (ie product group) from green (lowest contribution) to red (highest contribution)
PRODUCT GROUPS CONTRIBUTION
Quantity in the basket (kgyear)
Share of total BoP mass
Equal
weighting
Castellani et al (2016) WFsA
Castellani et
al (2016) WFsB
EDIP2003
9
Tuomisto et
al (2012)
BjornampHausch
ild (2015)
ndash Europe
an
BjornampHausch
ild (2015)
ndash global
Ponsioen and
Goodkoep
(2016)
Huppes et al (2012)
Mineral water 105 1940 1 1 3 1 1 1 2 1 1
Beer 66 cL 698 1290 4 4 4 4 3 8 8 7 5
Coffee 47 060 2 2 2 1 2 6 5 3 2
Apple 161 300 0 0 1 0 0 1 1 1 1
Oranges 174 320 1 1 3 0 1 2 2 1 1
Potato 691 1300 3 3 4 3 2 3 3 4 3
Bread 393 730 3 3 3 4 3 3 3 3 3
Olive oil 53 100 1 1 1 0 1 1 1 1 1
Sunflower oil 53 100 4 4 4 4 3 4 4 4 4
Sugar from beet 298 550 3 3 4 3 4 2 3 3 3
Milk 801 1480 9 9 8 9 8 8 8 8 8
Cheese 15 280 15 15 16 15 13 12 13 14 14
Butter 36 070 7 7 6 8 6 5 5 7 7
Meat - beef 137 250 18 18 17 18 22 15 16 16 17
Meat - pork 41 760 20 20 16 21 21 19 17 18 19
Meat - poultry 22 420 8 8 7 8 9 8 8 8 8
Pre-prepared meal 29 050 1 1 1 1 1 1 1 1 1
100
100 100 100 100 100 100 100 100
100
9 (based on Stranddorf et al 2005)
38
Conversely the identification of the most relevant impact categories contributing to the
overall impact of the entire BoP nutrition presents huge discrepancies when applying
different weighting sets (Table 22) This is due to the intrinsic differences among the
weighting sets which build on different perspectives and attribute different weights to
the impact categories
Table 22 Relevance of the different impact category Results of the application of several ILCD-compliant weighting sets in combination with normalization references EU27 (Castellani et al 2016) A color scale is applied to the results in each column (ie impact category) from green (lowest contribution) to red (highest contribution)
CONTRIBUTION ANALYSIS
1-1-1
Castellani et al (2016) WFsA
Castellani et al (2016) WFsB
EDIP2003 (based on Stranddorf et al 2005)
Tuomisto et al (2012)
Bjoslashrn amp Hauschild (2015)
Bjoslashrn amp Hauschild (2015) - global
Ponsioen amp
Goedkoop (2015)
Huppes et al (2012)
Climate change 19 20 15 2 32 214 260 204 87
Ozone depletion 00 00 00 2 00 00 00 00 00
Human toxicity cancer effects
62 66 50 7 na na na 22 81
Human toxicity non-cancer effects
446
425 323 53 na na na 477 363
Particulate matterRespiratory inorganics
26 30 23 na na na na 51 34
Ionizing radiation human health
05 05 04 na na na na 00 07
Photochemical ozone formation human health
10 12 09 1 00 162 263 00 11
Acidification 73 81 61 9 101 47 42 03 61
Eutrophication terrestrial
83 89 67 10 379 31 18 00 39
Eutrophication freshwater
34 32 25 3 37 134 43 00 16
Eutrophication marine
82 87 66 11 374 55 44 00 38
Land use 23 22 19 na 23 257 188 106 46
Ecotoxicity freshwater
58 55 46 0 na 60 04 00 127
Resource depletion water
62 59 284 na 53 39 137 49 63
Resource depletion mineral fossils and renewables
18 17 09 0 na na na 86 25
TOTAL 100 100 100 100 100 100 100 100 100
The discrepancies in the results suggest that it is important to acknowledge that
different perspectives lead to different results Moreover it is relatively straightforward
to identify the product groups impacting the most as from Table 21 when keeping
constant normalization references although varying weighing sets
The authors also checked the most sensitive element between normalization and
weighting their findings indicate normalization as the most sensitive choice if compared
39
to the selection of a specific weighting set among those considered in their work
However this result may change in case weighting methods building on different
approaches are added to the ones included in their work Nevertheless the ranking of
products is not significantly affected by changing normalization reference (eg from
ILCD EU27 to ILCD Global ndash Laurent et al 2013) This might be due to few impact
categories driving the results regardless of the normalization and weighting methods
selected or to the fact that all impact categories are strongly correlated
541 Conclusions and recommendations Weighting sets are often dependent on different value choices to assign different weights
to all impact categories Therefore different weighting sets lead to significant differences
of the final conclusions It is recommended that the decision about inclusion of which
weighting set to use has been made and documented in the first scope definition and
shall not be changed later during the study
40
6 Estimation of uncertainty
Evaluation of the uncertainty of an LCA study is a step which involves both the LCI and
LCIA phase therefore it is strictly linked to the content of the previous chapters
Uncertainty in LCA can be defined in different ways (Ciroth et al 2016) For examples it
can be meant as describing the variability of the LCA data to determine the significance
of the indicator results being ldquothe estimated amount or percentage by which an
observed or calculated value may differ from the true valuerdquo (Skone 2000) ISO 14044
defines uncertainty analysis as systematic procedure to quantify the uncertainty
introduced in the results of a life cycle inventory analysis due to the cumulative effects of
model imprecision input uncertainty and data variability
The estimation of uncertainty serves three main purposes
it supports a better understanding of the results obtained
it supports the iterative improvement of an LCA study
it also helps the target audience to assess the robustness and applicability of the
study results
The PEF Guide identifies two key sources of uncertainty in PEF studies
1 Stochastic uncertainties for the inventory data
they refer to statistical descriptions of variance around a meanaverage For
normally distributed data this variance is typically described in terms of an
average and standard deviation
2 Choice-related uncertainties
They arise from methodological choices including modelling principles system
boundaries allocation choices choice of impact assessment methods and other
assumptions related to time technology geographical aspects etc These are not
amenable to statistical description but rather can only be characterized via
scenario model assessments
In this report we refer to uncertainty analysis to describe the range of likely outcomes
based on a set of inputs and it differs from a sensitivity analysis which is linked to how
sensitive the results are to a change in an input parameter (see previous chapters)
It has to be kept in mind that all steps involved in a quantitative process are affected by
uncertainties Therefore it is important that the uncertainty is assessed
- At inventory level (eg standard deviation associated to a data point) An
example on how to assess the uncertainty at inventory level was recently
provided by Ciroth et al (2016)
- At characterization level (eg linked to characterization factors)
- At normalisation level (eg linked to normalisation factors)
- At weighting level (eg linked to weighting factors)
611 Conclusions and recommendations It is recommended that the overall uncertainty of an LCA study is estimated and
reported in the final report It is also recommended to include an evaluation to which
extent the uncertainties identified affect the final conclusions
41
7 Meta-analysis
The widespread development of LCA in the last decades as a decision supporting tool
leads to a huge amount of LCA studies in literature concerning all kind of goods and
services (ldquoproductsrdquo) When trying to make sense of their results that sometimes are
very different or come up with a conclusion techniques to combine or re-analyze them
are needed such as meta-analysis
Zumsteg et al (2012) described the key factors for conducting and reporting systematic
reviews including meta-analyses10 in LCA Those key factors are simplified in a check
list 1 Review title keywords and abstract 2 Rationale for the review 3 Review
question and objectives 4 Description of review protocol 5 Findings and features of
the individual studies in the review 6 Assessment of bias 7 Synthesis methods
(qualitative and quantitative) 8 Limitations of the review and 9 Summary of findings
and conclusions
This chapter is not intended to give guidelines on how to perform a systematic review or
a meta-analysis but to highlight the critical points that the practitioner should take into
account when collecting and using the LCA data Recalling the check list previously
described it is in the findings and features of the individual studies where one of the
biggest shortcomings when performing a meta-analysis concerning LCA studies is found
Assembling data from the individual studies is complex due to
the existing ldquoflexiblerdquo guidance in conducting LCA that leads to different
assumptions and methodological choices made in the various LCA modelling
exercises The ISO 14040 and 14044 standards provide the framework for LCA
This framework however leaves the individual practitioner with a range of
choices which can affect the legitimacy of the results of an LCA study
the lack of homogeneity reporting LCA results
As found in De Matos et al (2015) while doing a meta-analysis of different bioeconomy
value chains the most influencing differences among studies mainly relate to
The definition of the system boundaries and the stages included in the
study (eg even if the same general system boundaries are considered -
eg cradle to gate - some studies may or may not include intermediate
transport construction and decommissioning of buildings etc)
The impact assessment methods used as different methods may
consider for example different substances for a given impact category
and different characterization factors for the same substance
The definition of the functional unit (eg as the input the output
product the agricultural land unit etc) (Cherubini and Stromman
2011)
The consideration of direct and indirect land use change (dLUC and iLUC
respectively) (Cherubini and Stromman 2011)
The technology considered in the process and its maturity level
The approach used to model the multifunctional system For instance if
substitution is used the reference system selected may have a
significant influence on the final LCA results On the other hand if
allocation is used the selection of the allocation criteria and the relative
10 The definition of Meta-analysis given by Zumsteg et al (2012) is ldquoA melding of data from multiple studies usually involving additional mathematical analysis with the goal of utilizing this synergy of information and data size to answer questions that cannot be answered by existing individual studies or to improve the certainty or impact of know findings by increasing the sample
size Meta-analyses are often performed as part of a systematic reviewrdquo
42
contribution of each co-product may considerably influence the results of
the assessment
These points are in line with those reported in other studies in literature Wolf et al
(2015) conducted a meta-analysis of LCAs for wood energy services (heat power and
combined heat and power (CHP)) and chose a set of ldquodecisive parametersrdquo to be
analyzed arguing that those factors promote inconsistent findings along LCA studies
Apart from the previously mentioned the authors include the following factors (some of
them specific of the good or service under study)
Data sources such as empirical data literature well-known databases
unspecified databases simulators or expert interviews are some of
them
Transportation distances and types
Feedstock properties (in this case wood)
Combustion capacity and efficiency and co-combustion rates
Energy service provided (power heat and CHP)
Schreiber et al (2012) performed a meta-analysis on LCA studies of electricity
generation with carbon capture and storage (CCS) comprising the three main CCS
technologies (post-combustion oxyfuel and pre-combustion) In line with previous
studies they highlighted the different choices in the LCA methodology and parameters
(specific of the good or service under study) that heavily impact the overall results Here
we report those which differ from the already mentioned
Data quality and availability
Time horizon as most studies considered present and future power
plants as far as 2050
Spatial representation ndash some elements in the CCS process chain are
highly site-specific such as storage sites
Life cycle inventory (LCI) ndash which inputs and outputs are considered
Operational valuation and weighting methods
Power plant efficiency and energy penalty of the capture process
Carbon dioxide capture efficiency and purity
Fuel origin and composition
Moreover when having a look at the limitations of the review and meta-analysis some
studies just focus on GHG emissions Wolf et al (2015) set the CML midpoint impact
category Global Warming as the basis for the comparison of results because it is
represented in 100 of the studies They did not consider other less-frequent impact
categories but yet important such as acidification eutrophication and particulate
matter owing to the lack of results published in the studies On the other hand
Schreiber et al (2012) not only focused on GHG but they included other impacts such
as acidification potential eutrophication potential photochemical ozone creation
potential and cumulative energy demand
As a conclusion increased harmonization and transparency in the calculation and
reporting of LCA data and results is needed (Cristobal et al 2015)
711 Conclusions and recommendations
The number of LCA studies available is increasing and making sense of all the results
that can be obtained from them is a difficult task As a conclusion increased
harmonization and transparency in the calculation of LCA data and results is needed It
is recommended that reporting of LCA data is done in a more consistent and harmonized
43
manner to allow users of LCA study a better understanding of the results and
conclusions drawn
8 Conclusion
One of the key aims of LCA is to provide the decision makers with comprehensive and
understandable information this task is achieved by a proper interpretation of the
results of an LCA study
This report builds on the requirements provided in relevant international standards (ISO
14044) and guides (ILCD Handbook (EC-JRC 2011a) PEF Guide (EC 2013b) and it
proposes a practical approach on how to perform a robust interpretation of an LCA
study It provides a ready-to-use approach for the identification of significant issues and
it includes examples of completeness sensitivity and consistency checks based on real-
case studies which are used to draw the attention of the reader on how to evaluate the
results of an LCA study
The scheme proposed in this report should not be intended as a comprehensive list of
items to check instead it should be seen as a normal workflow that should be carried
out by an LCA practitioner in order to derive robust conclusions out of the LCA study
More accurate and case-specific checks should be done depending on the intended goal
and scope of the study
The report is structured in order to allow a practitioner focus on the two quantitative
phases of LCA the life cycle inventory (LCI) and the life cycle impact assessment (LCIA)
Regarding the LCI the report goes through the analysis of the data sources by giving
examples on how to interpret the system boundaries and the foreground system) it
provides an overview on data quality and it comprises further completeness and
consistency checks (eg cut-off long term emissions anomaly checks)
When analysing the LCIA the report provides insights on sensitivity analysis regarding
characterization normalization and weighting When dealing with characterization the
attention of the reader is drawn also on mapping between the inventory and the
characterization models and a discussion on the evaluation of uncharacterized
elementary flows is also included
Finally an overarching topic such as meta-analysis was deemed useful to be included as
this is often used when there is the need of assessing the state of the art of the LCA
studies on a specific product supply chain Key messages stemming from this report are
as follows
Results reveal that the relative importance of one substance compared to another
changes with the characterization model This is because the models differ in the
substances that they include and in the CFs of each substance It is
recommended to run a sensitivity check with different characterization models to
evaluate the robustness of the conclusions drawn It is also recommended to
evaluate the theory underlying the characterization models chosen to evaluate a
certain impact category as this helps understanding the results obtained Results of the LCIA phase can be highly affected by the characterization model
chosen Furthermore the evaluation of uncharacterized elementary flows is of
primary importance to assess the completeness of the LCIA coverage of the
identified LCI flows Indeed a high number of elementary flows inventoried might
be non-characterized by the chosen models even if their relevance in the
assessed impact categories could be of primary importance Therefore it is highly
recommended that a quantification of the uncharacterized elementary flows is
reported before any interpretation or conclusion is performed on the superiority
of one product versus another Different normalisation sets may produce different results in terms of
identification of most relevant impact categories life cycle stages and processes
Different reference systems refer to different situation which can all be valid
44
depending eg on the geographical scope of the study It is recommended to
evaluate different normalisation tests which fit the study at hand to support the
conclusions drawn with the baseline scenario or to provide additional insights Weighting sets are often dependent on different value choices to assign different
weights to all impact categories Therefore different weighting sets lead to
significant differences of the final conclusions It is recommended that the
decision about inclusion of which weighting set to use has been made and
documented in the first scope definition and shall not be changed later during the
study It is recommended that the overall uncertainty of an LCA study is estimated and
reported in the final report It is also recommended to include an evaluation to
which extent the uncertainties identified affect the final conclusions The number of LCA studies available is increasing and making sense of all the
results that can be obtained from them is a difficult task As a conclusion
increased harmonization and transparency in the calculation of LCA data and
results is needed It is recommended that reporting of LCA data is done in a more
consistent and harmonized manner to allow users of LCA study a better
understanding of the results and conclusions drawn Further aspects such as the appropriateness of the functional unit the intended goal
the system boundaries and value choices should normally be part of an interpretation in
order to identify recommendations and limitations of the study and draw the appropriate
conclusions They are not discussed further in this report but it is recommended that at
least each decision based on a personal or a stakeholderrsquos value shall always be
documented and explained in the conclusions of the LCA study This is consistent with
one of the key aims of LCA which is to provide the decision makers with comprehensive
and understandable information
45
References
Baitz M Makishi Colodel C Kupfer T Florin J Schuller O Kokborg M Koumlhler A
Thylmann D Stof-fregen A Schoumlll S Goumlrke J Rudolf M Gonzalez M (2016) GaBi
Database amp Modelling Principles Thinkstep Leinfelden-Echterdingen
Benini L Mancini L Sala S Manfredi S Schau EM Pant R (2014) Normalization
method and data for Environmental Footprints European Commission Joint
Research Center Institute for Environment and Sustainability Publications Office
of the European Union Luxemburg ISBN 978-92-79-40847-2
Benini L Sala S Pant R (2015) Global normalization factors for ILCD compliant
midpoint impact categories - EC-JRC internal draft report Set of factors available
at httpeplcajrceceuropaeuuploadsTable_ILCD_NFs_08-03-2016xlsx
Biganzoli L Falbo A Forte F Rigamonti L Grosso M (2015) Mass balance and life
cycle assessment of waste electrical and electronic equipment management
system implemented in Lombardia Region (Italy) Science of the Total
Environment 524ndash525 361-375
Bjoslashrn A Hauschild MZ (2015) Introducing carrying capacity-based normalization
in LCA framework and development of references at midpoint level The
International Journal of Life Cycle Assessment 20 (7)1005ndash1018
Blonk Agri-footprint BV (2014) Agri-footprint Methodology and basic principles -
Version 10
Brentrup F Kusters J Lammel J Kuhlmann H (2000) Methods to estimate on-
field nitrogen emissions from crop production as an input to LCA studies in the
agricultural sector The International Journal of Life Cycle Assessment 5 349ndash
357
Castellani V Benini L Sala S Pant R (2016) A distance-to-target weighting
method for Europe 2020 The International Journal of Life Cycle Assessment
21(8)1159-1169
Castellani V Sala S Benini L (2017) Hotspots analysis and critical interpretation
of food life cycle assessment studies for selecting eco-innovation options and for
policy support Journal of Cleaner Production 140 (2) 556-568
Cellura M Longo S Mistretta M (2011) Sensitivity analysis to quantify
uncertainty in life cycle assessment the case study of an Italian tile Renew Sust
Energ Rev 15(9)4697-4705
Cherubini F Stromman AH (2011) Life cycle assessment of bioenergy
systems state of the art and future challenges Bioresource technology 102 437
ndash 451
Ciroth A Muller S Weidema B Lesage P (2016) Empirically based uncertainty
factors for the pedigree matrix in ecoinvent The International Journal of Life
Cycle Assessment 21 1338-1348
CML (2002) CML-IA model and characterisation factors Available from
httpswwwuniversiteitleidennlenresearchresearch-outputsciencecml-ia-
characterisation-factors Accessed November 2015
Colomb V Ait-Amar S Basset-Mens C Dolleacute JB Koch P Lellahi A Mousset J
Salou T Tailleur A van der Werf HMG (2015) AGRIBALYSE Assessment and
lessons for the future Version 12
Corrado S Zampori L Castellani V Sala S (2017) Systematic analysis of
secondary Life Cycle Inventories when modelling agricultural production a case
study for arable crops Journal of Cleaner Production (under review)
46
Cristobal J De Matos CT Aurambout JP Manfredi S Kavalov B (2015)
Environmental sustainability assessment of bioeconomy value chains Biomass
and bioenergy 89 159 ndash 171
De Matos CT Cristobal J Aurambout JP (2015) Environmental sustainability
assessment of bioeconomy products and processes ndash progress report 1 European
Commission Report EUR 27356 EN
De Schryver A Galatola M (2016) Guidance for modelling agricultural processes
TAB Issue paper v 01 October 2016
Dewulf J Benini L Mancini L Sala S Blengini G A Ardente F Recchioni M Maes
J Pant R Pennington D (2015) Rethinking the Area of Protection lsquoNatural
Resourcesrsquo in Life Cycle Assessmen Environmental Science and Technology 49
(9)5310ndash5317
Dong Y Gandhi N Hauschild MZ (2014) Development of Comparative Toxicity
Potentials of 14 cationic metals in freshwater Chemosphere 112 26-33
Ecoinvent (2016) Allocation cut-off by classification [WWW Document] URL
httpwwwecoinventorgdatabasesystem-models-in-ecoinvent-3cut-off-
system-modelallocation-cut-off-by-classificationhtml (accessed 8916)
European Commission ndash Joint Research Centre (EC-JRC) (2011a) ILCD Handbook
ndash General guide for life cycle assessment ndash Detailed guidance European
Commission Joint Research Centre Institute for Environment and Sustainability
European Commission ndash Joint Research Centre (EC-JRC) (2011b) ILCD Handbook
- Recommendations for Life Cycle Impact Assessment in the European context
European Commission Joint Research Centre Institute for Environment and
Sustainability
European Commission (EC) (2013a) Communication from the Commission to the
EU Parliament and Council ndash Building the Single Market for Green Products ndash
Facilitating better information on the environmental performance of products and
organisations(20130196final)
European Commission (2013b) Commission Recommendation of 9 April 2013 on
the use of common methods to measure and communicate the life cycle
environmental performance of products and organisations (2013179EU) Official
Journal of the European Union Volume 56 4 May 2013
European Commission (2015)ndash Better Regulation Toolbox
httpeceuropaeusmart-regulationguidelinesdocsbr_toolbox_enpdf
European Commission (2016) Product Environmental Footprint Pilot Guidance -
Guidance for the implementation of the EU Product Environmental Footprint (PEF)
during the Environmental Footprint (EF) pilot phase - version 52 (pp 95)
Retrieved from
httpeceuropaeuenvironmenteussdsmgppdfGuidance_productspdf
FAO (2012) FAOstat Agriculture data Food and Agriculture Organization of the
United Nations httpfaostatfaoorg
Gaudreault C Samson R Stuart P (2009) Implications of choices and
interpretation in LCA for multi-criteria process design de-inked pulp capacity and
cogeneration at a paper mill case study J Clean Prod 17(17)1535-1546
Giampietro M Saltelli A (2014) Footprints to nowhere Ecological Indicators 46
610-621
Goedkoop M Heijungs R Huijbregts M de Schryver A Struijs J van Zelm R
(2009) ReCiPe 2008 A life cycle assessment method which comprises
harmonized category indicators at the midpoint and the endpoint level Report I
47
Characterisation Ministry of Housing Spatial Planning and Environment
Amsterdam
Guineacutee JB Gorreacutee M Heijungs R Huppes G Kleijn R de Koning A van Oers L
Wegener Sleeswijk A Suh S Udo de Haes HA de Bruijn H van Duin R
Huijbregts MAJ (2002) Handbook on life cycle assessment Operational guide to
the ISO standards I LCA in perspective IIa Guide IIb Operational annex III
Scientific background Kluwer Academic Publishers ISBN 1-4020-0228-9
Dordrecht 2002 692 pp
Guo M Murphy RJ (2012) LCA data quality sensitivity and uncertainty analysis
Science of the total environment 435230-243
Hauschild MZ Wenzel H (1998) Environmental Assessment of Products Vol 2 ndash
Scientific background Chapman amp Hall UK Kluwer Academic Publishers
Hingham USA
Heijungs R Kleijn R (2001) Numerical approaches towards life cycle
interpretation five examples The International Journal of Life Cycle Assessment
6(3)141-148
Hellweg S Mila i Canals L (2014) Emerging approaches challenges and
opportunities in life cycle assessment Science 344(6188) 1109-1113
Huang Y Spray A Parry T (2013) Sensitivity analysis of methodological choices
in road pavement LCA The International Journal of Life Cycle Assessment
18(1)93-101
Huijbregts MAJ Hellweg S Hertwich E (2011) Do we need a paradigm shift in life
cycle impact assessment Environmental Science and Techonology 45 (9)
38333834
Huijbregts MAJ (1999) Life-cycle impact assessment of acidifying and eutrophying
air pollutants Calculation of equivalency factors with RAINS-LCA Report available
at httpmedialeidenunivnllegacyLife-cycle20impact20assessmentpdf
(accessed April 2016)
Huppes G Van Oers L Pretato U Pennington DW (2012) Weighting
environmental effects Analytic survey with operational evaluation methods and a
meta-method The International Journal of Life Cycle Assessment 17 876ndash891
James K Galatola M (2015) Screening and hotspot analysis procedure to
identify the hotspots and the most relevant contributions (in terms of impact
categories life cycle stages processes and flows) Version 40 24 April 2015
Retrieved from
httpswebgateeceuropaeufpfiswikisdisplayEUENVFPEU+Environmental+F
ootprint+Pilot+Phase accessed November 2016
ISO 14040 (2006a) Environmental managementmdashlife cycle assessmentmdash
principles and framework Geneva Switzerland
ISO 14044 (2006b) ndash Environmental management ndash Life Cycle assessment ndash
Requirements and guidelines
Laurent A Hauschild M Z Golsteijn L Simas M Fontes J Wood R (2013)
Deliverable 52 Normalisation factors for environmental economic and socio-
economic indicators Report prepared within the 7th Framework programme
Project PROSUITE Available at httpwwwprosuiteorgwebguestpublic-
deliverables (accessed December 2015)
Lee SJ Hawkins TR Ingwersen WW Young DM (2014) Exploring the Use of
Ecological Footprint in Life Cycle Impact Assessment Findings from a Comparison
of Transportation Fuels Journal of Industrial ecology 19(3) 416ndash426
48
Mancini L Benini L Sala S (2015) Resource footprint of Europe complementarity
of Material Flow Analysis and Life Cycle Assessment for policy support
Environmental Science and Policy 54367ndash376
Mancini L Benini L Sala S (2016) Characterization of raw materials based on
supply risk indicators for Europe The International Journal of Life Cycle
Assessment 1-13 doi101007s11367-016-1137-2
Nemecek T Baumgartner D (2006) Concerted Action GL-Pro WP4
Environmental Analysis - Final report - Deliverable 43 Available at
httpwwwagroscopeadminchpublikationeneinzelpublikationindexhtmllang
=enampaid=23328amppid=23604
Notarnicola B Sala S Antoacuten A McLaren SJ Saouter E Sonesson U (2017a) The
role of life cycle assessment in supporting sustainable agri-food systems a
review of the challenges Journal of Cleaner Production 140(2)399-409
doi101016jjclepro201606071
Notarnicola B Tassielli G Renzulli PA Castellani V Sala S (2017b) Environmental
impact of food consumption in Europe Journal of Cleaner Production 140(2)
753-765 doi101016jjclepro201606080
Pizzol M Christensen P Schmidt J Thomsen M (2011) Impacts of ldquometalsrdquo on
human health a comparison between nine different methodologies for Life Cycle
Impact Assessment (LCIA) Journal of Cleaner Production 19(6) 646-656
Pizzol M Laurent A Sala S Weidema B Verones F Koffler C (2016)
Normalisation and weighting in life cycle assessment Quo Vadis The
International Journal of LCA 1-14 doi 101007s11367-016-1199-1
Prado-Lopez V Seager TP Chester M Laurin L Bernardo M Tylock S (2014)
Stochastic multi-attribute analysis (SMAA) as an interpretation method for
comparative life-cycle assessment (LCA) Int J Life Cycle Ass 19(2)405-416
Pregrave Consultants (2015) SimaPro Database Manual - Methods library available at
httpswwwpre-sustainabilitycomsimapro-database-and-methods-library
(accessed February 2016)
Ponsioen TC Goedkoop MJ (2016) Midpoint weighting based on endpoint
information Submitted to The International Journal of Life Cycle Assessment
Rigamonti L Falbo A Zampori L Sala S (2017) Supporting a transition towards
sustainable circular economy sensitivity analysis for the interpretation of LCA for
the recovery of electric and electronic waste The International Journal of Life
Cycle Assessment 1-10 doi 101007s11367-016-1231-5
Rosenbaum RK Bachmann TM Gold LS Huijbregts MAJ Jolliet O Juraske R
Koehler A Larsen FH MacLeod M Margni M McKone TE Payet J Schuhmacher
M van de Meent D Hauschild MZ (2008) USEtoxmdashthe UNEP-SETAC toxicity
model recommended characterisation factors for human toxicity and freshwater
ecotoxicity in life cycle impact assessment The International Journal of Life Cycle
Assessment 13(7) 532-546
Sala S Wolf MA Pant R (2012) Characterization factors of the ILCD
Recommended Life Cycle Impact Assessment methods Database and Supporting
Information First edition EUR25167EN ISBN 978-92-79-22727 Luxembourg
Publications Office of the European Union Available at
httpeplcajrceceuropaeuuploads201401LCIA-characterization-factors-of-
the-ILCDpdf
Schau EM Davidsson B (2015) Product Environmental Footprint (PEF) Category
Rules (PEFCR) Pilot Intermediate Paper Product First Draft PEFCR July
2015Accessible for registered stakeholders at
49
httpswebgateeceuropaeufpfiswikisdisplayEUENVFPStakeholder+workspa
ce3A+PEFCR+pilot+Intermediate+paper+product
Schau EM Fet AM (2008) LCA studies of food products as background for
environmental product declarations The International Journal of Life Cycle
Assessment 13(3) 255-264
Schneider L Berger M Finkbeiner M (2011) The anthropogenic stock extended
abiotic depletion potential (AADP) as new parameterization to model the depletion
of resources The International Journal of Life Cycle Assessment 16(9) 929-936
Schneider L Berger M Finkbeiner M (2015) Abiotic resource depletion in LCAmdash
background and update of the anthropogenic stock extended abiotic depletion
potential (AADP) model The International Journal of Life Cycle Assessment
20(5) 709-721
Schreiber A Zapp P and Marx J (2012) Meta-Analysis of Life Cycle Assessment
Studies on Electricity Generation with Carbon Capture and Storage Journal of
Industrial Ecology 16 S155ndashS168
Seppaumllauml J Posch M Johansson M Hettelingh JP (2006) Country-dependent
Characterisation Factors for Acidification and Terrestrial Eutrophication Based on
Accumulated Exceedance as an Impact Category Indicator The International
Journal of Life Cycle Assessment 11(6) 403-416
Skone TJ (2000) What is Life Cycle Interpretation Environmental Progress 19
(2) 92-100
Steen BA (1999) A systematic approach to environmental priority strategies in
product life development (EPS) Version 2000 ndash Models and data of the default
method Chalmers University LindholmenJohanneberg
Stranddorf HK Hoffmann L Schmidt A (2005) Update on Impact Categories
Normalisation and Weighting in LCA - Selected EDIP97-data Environmental
Project Nr 995 Miljoslashprojekt httpwww2mstdkudgivPublications200587-
7614-570-0pdf87-7614-571-9PDF (accessed December 2015)
Tuomisto HL Hodge ID Riordan P Macdonald DW (2012) Exploring a safe
operating approach to weighting in life cycle impact assessment ndash a case study of
organic conventional and integrated farming systems Journal of Cleaner
Production 37147-153
UNEP- SETAC (2016) Hotspots Analysis an Overarching Methodological
Framework Draft document developed for UNEPSETAC Life Cycle Initiative -3
Flagship Project 3a (Phase 2) 11 october 2016 Available at
httpwwwwraporgukcontentprinciples-and-practices-hotspot-analysis
Van Hoof G Vieira M Gausman M Weisbrod A (2013) Indicator selection in life
cycle assessment to enable decision making issues and solutions International
Journal of Life Cycle Assessment 181568-1580
Van Zelm R Huijbregts M A van de Meent D (2009) USES-LCA 20mdasha global
nested multi-media fate exposure and effects model The International Journal
of Life Cycle Assessment 14(3) 282-284
Wackernagel M Monfreda C Moran D Wermer P Goldfinger S Deumling D
Murray M (2005) ―National Footprint and Biocapacity Accounts 2005 The
underlying calculation method Global Footprint Network Oakland California
USA
Weidema B Bauer C Hischier R Mutel C Nemecek T Reinhard J Vadenbo CO
Wernet G (2013) Overview and methodology Data quality guideline for the
ecoinvent database version 3
50
Williams ED Weber CL Hawkins TR (2009) Hybrid Framework for Managing
Uncertainty in Life Cycle Inventories Journal of Industrial Ecology 13 928ndash944
Wolf C Klein D Weber-Blaschke G Richter K (2015) Systematic review and
meta-analysis of life cycle assessment for wood energy services Journal of
Industrial Ecology 20 743 ndash 763
Zumsteg JM Cooper JS Noon MS (2012) Systematic Review Checklist Journal of
Industrial Ecology 16 S12ndashS21
51
List of abbreviations and definitions
AOX adsorbable organic halogens
BOD biochemical oxygen demand
BTEX benzene toluene xylene isomers
CFs characterisation factors
COD chemical oxygen demand
DQR data quality requirements
EcF ecological footprint
EF environmental footprint
ElFl elementary flow
HMs heavy metals
IC impact category
ILCD International Reference Life Cycle Data System
LCA life cycle assessment
LCI life cycle inventory
LCIA life cycle impact assessment
OEFSR organisation environmental footprint sector rules
PAH polycyclic aromatic hydrocarbons
PEF product environmental footprint
PEFCR product environmental footprint sector rules
PPP plant protection products
OEF organisation environmental footprint
TAB technical advisory board
TS technical secretariat
UNEPSETAC LCI Unep Setac Life cycle Initiative
VOC volatile organic compounds
WEEE waste electrical and electronic equipment
52
List of figures
Figure 1 Practical application of requirements in ISO 14044 and ILCD Handbook to
interpret LCI and LCIA results 5
Figure 2 Hotspot analysis in the context of the Environmental Footprint pilot (James amp
Galatola 2015) 8
Figure 3 Contribution analysis for the resource- related indicator calculated adopting
several characterization models (Rigamonti et al 2017) 27
53
List of tables
Table 1 Summary of requirements to define most relevant contributions and hotspots
(James amp Galatola 2015) 11
Table 2 Selection of most relevant Impact Categories (James amp Galatola 2015) 12
Table 3 Selection of most relevant life cycle stages (James amp Galatola 2015) 13
Table 4 Selection of most relevant processes (James amp Galatola 2015) 13
Table 5 Inventory results (climate change results expressed in gCOeq) (James amp
Galatola 2015) 14
Table 6 Most relevant inventory flows contributing to climate change (based on the
inventory results before normalisation and weighting) - overall life cycle (option 1)
(James amp Galatola 2015) 14
Table 7 Most relevant inventory flows contributing to climate change (based on the
inventory results before normalisation and weighting) ndash process level (option 2) (James
amp Galatola 2015) 14
Table 8 Hotspots based on 50 cumulative contribution (OPTION A) (James amp Galatola
2015) 15
Table 9 Hotspots based on top two representatives (OPTION B) (James amp Galatola
2015) 15
Table 10 Underlying assumptions in relation to the three databases considered by the
authors (Corrado et al 2017) 17
Table 11 Data quality rating in an example of intermediate paper products (EC 2013
Schau and Davidsson 2015) 20
Table 12 Data quality rating in an early phase of a PEF study of intermediate packaging
paper 21
Table 13 Example of check of inventoried elementary flows that are not characterized by
two impact assessment methods (based on Castellani et al 2017) 29
Table 14 List of impact categories listed in ILCD with total number of elementary flows
contributing to each IC 30
Table 15 Type of chemicals (mass and number of EFs) not characterized per emission
compartment (air oxygen and hydrogen have been excluded) 31
Table 16 Most relevant elementary flows contributing cumulatively up to 90 to the
freshwater ecotoxicity impact category with USEtox 32
Table 17 Summary of normalization sets used in the sensitivity analysis in Castellani et
al (2016) 33
Table 18 Results of sensitivity analysis on normalization sets at the European and global
scale for ILCD- and CML-IA methods (Castellani et al 2016) The percentages
represent the contribution of each product group to the total impacts of the BoP per
citizen (reference flow) Equal weighting of impact categories is applied The second
column reports the mass of each product group in the basket A color scale is applied to
the results in each column (ie product group) from green (lowest contribution) to red
(highest contribution) 34
Table 19 Results of sensitivity analysis on normalization sets at the European and global
scale for ILCD and CML-IA methods (Castellani et al 2016) The percentages reflect
the relative relevance of impact categories compared to the total impacts of the BoP per
citizen (reference flow) A colour scale is applied to the results in each column (ie
impact category) from green (lowest contribution) to red (highest contribution) 35
54
Table 20 Summary of weighting sets used in the sensitivity analysis by Castellani et al
(2016) 36
Table 21 Product groups contribution Results of several ILCD-compliant weighting sets
in combination with normalization references EU27 (Castellani et al 2016) A color scale
is applied to the results in each column (ie product group) from green (lowest
contribution) to red (highest contribution) 37
Table 22 Relevance of the different impact category Results of the application of several
ILCD-compliant weighting sets in combination with normalization references EU27
(Castellani et al 2016) A color scale is applied to the results in each column (ie
impact category) from green (lowest contribution) to red (highest contribution) 38
Europe Direct is a service to help you find answers
to your questions about the European Union
Freephone number ()
00 800 6 7 8 9 10 11 () The information given is free as are most calls (though some operators phone boxes or hotels may
charge you)
More information on the European Union is available on the internet (httpeuropaeu)
HOW TO OBTAIN EU PUBLICATIONS
Free publications
bull one copy
via EU Bookshop (httpbookshopeuropaeu)
bull more than one copy or postersmaps
from the European Unionrsquos representations (httpeceuropaeurepresent_enhtm) from the delegations in non-EU countries (httpeeaseuropaeudelegationsindex_enhtm) by contacting the Europe Direct service (httpeuropaeueuropedirectindex_enhtm) or calling 00 800 6 7 8 9 10 11 (freephone number from anywhere in the EU) () () The information given is free as are most calls (though some operators phone boxes or hotels may charge you)
Priced publications
bull via EU Bookshop (httpbookshopeuropaeu)
XX-N
A-x
xxxx-E
N-N
doi102788171315
ISBN 978-92-79-64114-5
LB-N
A-2
8266-E
N-N

2
1 Introduction
Life cycle assessment (LCA) is more and more considered a reference method for the
evaluation of supply chains production and consumption systems up to regions
(Hellweg and Mila I Canals 2014)
Life cycle interpretation is one of the four phases identified in the ISO 14040 and the
ISO 14044 standards (ISO 2006ab) In fact according to the ISO standard
interpretation of Life Cycle Inventory (LCI) or Life Cycle Impact Assessment (LCIA)
phases according to the goal and scope of the study is a required step of an LCA study
ISO 14044 further specifies that interpretation comprises the following elements i) an
identification of the significant issues based on the results of the LCI and LCIA phases of
LCA ii) an evaluation that considers completeness sensitivity and consistency checks
iii) conclusions limitations and recommendations
In 2013 the European Commission has put forward a communication which aims at
harmonising the application of LCA for evaluation green products (Building the Single
Market for Green Products EC 2013a) calculating their Environmental Footprint (EF)
(both Product environmental footprint ndash PEF and Organisation environmental footprint ndash
OEF) The communication is accompanied by the PEF Guide (EC 2013b) which explains
that interpretation of the results of a PEF study serves two purposes i) to ensure that
the performance of the PEF model corresponds to the goals and quality requirements of
the study in this sense PEF interpretation may inform iterative improvements of the
PEF model until all goals and requirements are met and ii) to derive robust conclusions
and recommendations from the analysis for example in support of environmental
improvements
The International Reference Life Cycle Data System (ILCD) Handbook (EC 2010)
clarifies that interpretation of an LCA has two main purposes that fundamentally differ i)
steering the work towards improving the Life Cycle Inventory model to meet the needs
derived from the study goal ii) especially for comparative LCA studies (while partly also
applicable to other types of studies) it serves to derive robust conclusions and often
recommendations
Notwithstanding that several methodological guidance exists on the different steps of
LCA so far the interpretation phase has been little systematized even though its
importance is well recognized within the LCA community LCA studies sometimes
formulate conclusions and recommendations disregarding the uncertainties and the lack
of consistency within the LCI and LCIA steps and across the goal and scope definition
The need of guidance for the interpretation phase is becoming even more important as
LCA is being increasingly recognised and used by various stakeholders LCA has recently
become a reference methodology for decision support in the policy context in which its
results may impact entire sectors or societies In the EU context these recent trends are
reflected through initiatives and pilots related to the above-mentioned Building the
Single Market for Green Products (EC 2013a) as well as the new inclusion of LCA among
the methods in the EU Better Regulation toolbox (EC 2015) which identified tools
relevant for conducting the impact assessment of policies In this setting robust and
sound interpretation of LCA results is a must
Several authors have provided evidence that interpretation is one of the key steps of an
LCA study and give guidance andor recommendations depending on the purpose of the
study Skone (2000) pointed out that the purpose of performing life cycle interpretation
is to determine the level of confidence in the final results and communicate them in a
fair complete and accurate manner Initially it was recognized that interpretation was
not one of the hot topics in literature studies (Heijungs et al 2001) and authors
provided numerical techniques for interpretation More recently other authors such as
Guadreault et al (2009) while recognizing that LCA has become an important
methodology for more sustainable process design observed that its application in a
decision-making context has been limited by a poor understanding of methodological
3
choices and assumptions therefore they recommend careful interpretation of results to
improve the quality of the outcome (ie improve the decision-making process) This
view is shared by authors such as Prado Lopez et al (2014) who have identified the lack
of robust methods of interpretation to support decision makers hence they provide a
novel approach based on a multi-criteria decision analytic method (stochastic multi-
attribute analysis for life-cycle impact assessment (SMAA-LCIA)) which in their view
should support both interpretation of results and policymakers Van Hoof et al (2013)
explained how normalization helps maintain a multi-indicator approach while keeping the
most relevant indicators allowing effective decision making Finally other authors such
as Cellura et al (2011) and Huang et al (2013) performed LCA of specific products and
they pointed out the relevance of sensitivity analysis to strengthen the reliability of the
results obtained and draw conclusions to support sector specific guidelines A structured
approach covering the LCIA phase has been proposed (Castellani et al 2017)
highlighting the importance of a systematic sensitivity analysis of impact assessment
models normalization and weighting set Regarding normalisation and weighting steps
which are optional according to ISO standards a recent overview of approaches
strengths and limitations has been provided in the context of activities of the
UNEPSETAC Life Cycle Initiative (UNEPSETAC LCI) by Pizzol et al (2016)
The objective of this technical report is to provide guidance on how to perform an
interpretation of LCI and LCIA results based on what are the meaningful aspects to be
taken into account common to the majority of LCA studies
This technical report aims to be a practical document to be used by LCA practitioners as
a checklist of the main aspects to consider when interpreting LCI and LCIA results
Therefore this report makes extensive use of examples based on real case studies that
may help critically assess LCA results ensuring a reliable decision- and policy-making
support
A general framework on how to perform a proper interpretation is presented in chapter
2 the key aspects will be discussed further on in the report using case studies as an
example to guide the reader and the practitioner through ldquoreal liferdquo applications
Chapter 3 focuses on the identification of significant issues namely the main
contributors to the LCIA results (ie hotspots most relevant impact categories life cycle
stages processes and elementary flows)
Chapter 4 and 5 focus on the evaluations (sensitivity completeness and consistency
checks) in relation to the LCI and LCIA phases respectively Regarding the LCI the
report goes through the analysis of the data sources by giving examples on how to
interpret the system boundaries and the foreground system) it provides an overview on
data quality and it comprises further completeness and consistency checks (eg cut-off
long term emissions anomaly checks) When analysing the LCIA the report provides
insights on sensitivity analysis regarding characterization normalization and weighting
When dealing with characterization the attention of the reader is drawn also on issues
such as the mapping between the inventory and the characterization models and the
evaluation of uncharacterized elementary flows
Chapter 6 and 7 deal with overarching topics such as estimation of uncertainty of the
results of LCA study and meta-analysis
4
2 A practical scheme to interpret LCI and LCIA results
The initial step of the interpretation phase is to review information from the first three
phases of the LCA process such as the ones used to build the study goals and scope
quality assurance procedures reporting requirements results assumptions external
involvement (eg stakeholders peer reviews) (Skone 2000)
Both ISO 14044 and the ILCD Handbook (EC-JRC 2011a) propose a scheme with the
elements to be considered in the interpretation phase and their relation to the other
phases of the LCA study
The elements can be grouped in
identification of significant issues (based on the results of the LCI and LCIA
phases)
the purpose of this first element of interpretation is to analyse and structure the
results of earlier phases of the LCILCA study in order to identify the significant
issues There are two interrelated aspects of significant issues i) firstly there are
the main contributors to the LCIA results ie most relevant life cycle stages
processes and elementary flows and most relevant impact categories ii)
secondly there are the main choices that have the potential to influence the
precision of the final results of the LCA These can be methodological choices
assumptions foreground and background data used for deriving the process
inventories LCIA methods used for the impact assessment as well as the
optionally used normalisation and weighting factors
evaluation that considers completeness sensitivity and consistency checks
Completeness checks on the inventory are performed in order to determine the
degree to which it is complete and whether the cut-off criteria have been met
Sensitivity checks have the purpose to assess the reliability of the final results
and of the conclusions and recommendations of the LCA study The consistency
check is performed to investigate whether the assumptions methods and data
have been applied consistently throughout the LCILCA study
conclusions limitations and recommendations
Integrating the outcome of the other elements of the interpretation phase and
drawing on the main findings from the earlier phases of the LCA the final
element of the interpretation is to draw conclusions and identify limitations of the
LCA and to develop recommendations for the intended audience in accordance
with the goal definition and the intended applications of the results
In this report a schematic workflow representing a practical approach to interpret LCI
and LCIA results is proposed in Fig1 building on both ISO 14044 (ch 4511) and the
ILCD Handbook (ch 91) (EC-JRC 2011a) The workflow is to be seen as an iterative
approach to finally draw robust conclusions and recommendations
The scheme should not be seen as substituting the approaches of the ISO 14044 and the
ILCD Handbook instead it should be seen as a practical application of the requirements
laid down in these documents
Furthermore the scheme should not be intended as a comprehensive list of items to
check instead it should be seen as a normal workflow that should be carried out by an
LCA practitioner in order to derive robust conclusions out of the LCA study More
accurate and case-specific checks should be done depending on the intended goal and
scope of the study
Further aspects such as the appropriateness of the functional unit the intended goal
the system boundaries and value choices should normally be part of an interpretation in
order to identify recommendations and limitations of the study and draw the appropriate
conclusions They are not discussed further in this report but it is recommended that at
5
least each decision based on a personal or a stakeholderrsquos value shall always be
documented and explained in the conclusions of the LCA study This is consistent with
one of the key aims of LCA which is to provide the decision makers with comprehensive
and understandable information in a transparent manner
Figure 1 Practical application of requirements in ISO 14044 and ILCD Handbook to interpret LCI and LCIA results
6
3 Identification of key issues Hotspots analysis
In order to get started with interpretation of results it is necessary to identify what the
key issues are Once the key issues are identified it is possible to further evaluate the
overall robustness of the LCA study by using for example completeness consistency and
sensitivity checks
This chapter on hotspot analysis gives an overview of the overarching methodological
framework of hotspot analysis as currently developing with the UNEPSETAC Life Cycle
Initiative - Flagship Project 3a and the hotspot analysis as tested in the Environmental
Footprint (EF) pilot phase (2013 ndash 2017) In the first case hotspot analysis is regarded
as a subject on its own in the second case it is shown a practical way to perform a
hotspot analysis in an environmental footprinting context in the EU Environmental
Footprint it is more focused on the interpretation of the screening study results of the
average or representative product1 The hotspots in a EU Environmental Footprint may
be but does not have to found in a contribution analysis of the characterized results
Therefore in this chapter we first describe the hotspot analysis as outlaid in the
UNEPSETAC LCI and then the hotspot analysis as performed in the EF pilot phase
31 The hotspot analysis in the UNEPSETAC Life Cycle Initiative
The UNEPSETAC Life Cycle Initiative has been running a Flagship project (nr 3a) on
hotspot analysis since 2012 until 2017 According to UNEPSETAC (2016) the benefits
of hotspots analysis include ensuring
Focus on priority issues (eg waste water materials of concern)
Focus on the right life cycle stage (eg material acquisition manufacturing use
end of life)
Focus on the right actors (eg producers manufactures suppliers retailers
customers) to evaluate influence and implement solutions
Implications of trade-offs are understood
Resources (eg time money) can be effectively allocated to actions
Previously there was not currently a common global approach to hotspots analysis nor
has there been sufficient effort to bring together or share best practice amongst those
organisations or initiatives currently developing and using these methods Nor was there
any accepted guidance on how to translate and apply the results of hotspots analysis
into meaningful sustainability information and insight for use by industry governments
and other stakeholders Therefore the UNEP SETAC Life Cycle Initiative established a
new Flagship Project to address these and other issues The objectives of the
UNEPSETAC LCI Flagship Project 3 are to produce
1 A common methodological framework and global guidance for sustainability hotspots analysis
2 A protocol for the appropriate use and communication of sustainability information derived from hotspots analysis
3 To evaluate and if possible implement a range of options to bring together the findings from existing hotspots studies to provide a richer global picture of sustainability hotspots in the economy and society
Phase 1 was finished in December 2014 and gives an overview of different tools and
methods that can be used in the hotspot analysis This includes 42 hotspots analysis
1 In the context of the EF pilot phase within each Product Environmental Footprint Category Rule
(PEFCR) pilot a ldquorepresentative productrdquo has to be defined which is representing gt50 of the European market The PEF screening study is a PEF study conducted on the representative product one of the aims of the screening study is to identify the hotspots most relevant
elementary flows processes and life cycle stages
7
methodologies divided into product sector and national scale of application Of these 21
methodologies (4 at the national-level 5 at the sector-level and 12 predominantly
applied at the product category-level) were shortlisted and further analysed Examples
of methods are EU EIPRO and Global Protocol for Community Scale GHG emissions on
the national level GHG Protocol Corporate Value Chain (Scope 3) Accounting and
Reporting Standard and Sustainability Accounting Standards Board Materiality Maptrade on
the sector level and French Grenelle I and II BPX 30-323-0 Product Lifecycle
Environmental Impact Quantification Guidance Standard and Water Quality Association
(WQA) Hotspots Analysis on the product level Please refer to Figure ES 2 in (Barthel et
al 2014) for the complete list
This first phase of the project fed into the second phase of the Flagship project
Phase 2 is running from January 2015 ndash January 2017 and produces the methodological
framework (UNEPSETAC 2016) and the communication guidance2 These are currently
in a six-weeks public consultation (27 Oct ndash 15 Dec 2016) The framework provides
a recognized set of guiding principles and practices for hotspots analysis
a globally agreed methodological framework for hotspots analysis
agreement on the appropriate use and communication of product sustainability
information derived from hotspots analysis
Future step will be to work with hotspot analysis for cities and regions and road testing
of the methodological framework
32 The hotspot analysis in the Environmental Footprint pilot
phase (2013 ndash 2017)
The 2013-2017 Environmental Footprint (EF) pilot phase has three main objectives
test the process for developing product- and sector-specific rules
test different approaches to verification
test communication vehicles for communicating life cycle environmental
performance to business partners consumers and other company stakeholders
This is tested by groups of organisations called Technical Secretariats (TS) who
volunteered to develop the rules for their product or sector
The hotspot analysis as described below were tested and developed in an iterative way
on the approximatively 25 pilots participating in the EF pilot phase to develop Product
Environmental Footprint (PEF) Category Rules (PEFCR) or Organisation Environmental
Footprint (OEF) Sector Rules (OEFSR)
A hotspot analysis is required for the PEFOEF screening studies of the average or
representative product for the PEFCROEFSR and for the supporting studies3 (EF study of
a single productorganisation belonging to the product categorysector) when developing
PEFCROEFSR (PEFCR Guidance document (EC 2016))
The hotspot analysis in the EF context aims to identify the hotspots the most relevant
impact categories life cycle stages processes and elementary flows as shown in Fig 2
and it provides a guidance on how to do that
2 Communicating hotspots The effective use of sustainability information to drive action and improve
performance from httpwwwwraporguksitesfileswrapHotspots20Communications20Guidelines20v35207Oct2016pptx 3 The EF supporting studies are PEFOEF studies run by single companies with the aim of testing the draft
PEFCRs and OEFSRs
8
Figure 2 Hotspot analysis in the context of the Environmental Footprint pilot (James amp Galatola 2015)
As shown in the figure the hotspots (and thereby also the hotspot analysis) is important
for the decision on which life cycle stages processes and elementary flows that are
hotspots (gt 50 contribution) and which are relevant (gt 80 contribution)
The hotspots might serve the purpose of warning an organisation about the area where
they should focus their attention in order to improve the environmental performance of a
product (PEF) or an organisation (OEF) Whilst traditionally LCA practitioners are
expected to provide primarysite-specific data for processes taking place in the
foreground and secondary data for processes taking place in the background in PEFOEF
the implementation of the materiality principle leads to a different approach The
processes most contributing to the final results (in terms of environmental impacts or
savings) are those for which the best quality of data should be provided For the
processes less relevant it is possible to use data of lower quality
321 Procedure to identify the most relevant impact categories Starting from the normalised and weighted results of PEF screening study each
Technical Secretariat is asked to select the impact categories that they consider more
relevant in terms of communication purposesrdquo
322 Procedure to identify the most relevant life cycle stages
The proposed guideline by the PEFCR Guidance (EC 2016) is to consider as relevant all
life cycle stages which together contribute over 80 (before normalisation and
weighting) to any of the baseline impact categories This should start from the largest to
the smallest contributions In addition more life cycle stages can be added to the list of
the most relevant ones
In order to guarantee a minimum level of harmonisation among different
PEFCRsOEFSRs a list of default life cycle stages was identified
Raw material acquisition and pre-processing (including production of parts and
unspecific components)
9
Production of the main product4
Product distribution and storage
Use stage scenario (if in scope)
End-of-life (including product part reuse recovery recycling if in scope)
323 Procedure to identify the most relevant processes
Each impact category shall be investigated to identify the most relevant processes The
identification of the most relevant processes shall be done at the whole life cycle level
Similaridentical processes taking place in different life cycle stages (eg transportation)
shall be accounted separately
In the context of the EF pilot phase processes were defined as most relevant where they
collectively contributed at least 80 to any impact category before normalisation and
weighting
In some instances vertically aggregated datasets may be identified as representing
relevant processes It may not be obvious which process within an aggregated dataset
is responsible for contributing to an impact category The metadata accompanying the
data should be reviewed and used to identify relevant processes If this is not possible it
can be decided whether to seek further disaggregated data or to treat the aggregated
dataset as a process for the purposes of identifying relevance5
324 Procedure to identify the most relevant elementary flows
As far as the most relevant elementary flows is concerned they are the ones contributing
cumulatively more than 80 to the impact category It can be decided whether this is
calculated at the level of overall life cycle and or single (most relevant) process level
All elementary flows contributing more than 5 to the impact category shall be
considered as relevant
Once the most relevant elementary flows have been identified they shall be linked to the
processes emitting them
325 Procedure to identify the hotspots
A hotspot can be identified at different levels of granularity impact category life cycle
stage process or elementary flow
In the context of PEFOEF pilot phase a hotspot is defined as either (James and Galatola
2015)
OPTION A (1) life cycle stages (2) processes and (3) elementary flows
cumulatively contributing at least 50 to any impact category before
normalisation and weighting (from the most contributing in descending order)
OPTION B At least the two most relevant life cycle stages processes and at least
two elementary flows (minimum 6) Additional hotspots may be identified by the
TS
4 If it is not possible to differentiate between the production of the main product and ancillary materials and
other life cycle stages eg raw material acquisition and transport then these life cycle stages can be merged Adequate justifications shall be provided in the screening report and be highlighted in the consultation phase If an aggregated life cycle stageprocess is most relevant it implies that all the processes included will be classified as most relevant 5 In this last case if an aggregated dataset is relevant everything in it is automatically relevant
10
326 Dealing with negative numbers
When identifying the percentage contribution from any process or flow it is important
that absolute values are used (ie the minus sign is ignored) in calculating percentage
contributions This allows indentifying the relevance of any credits
327 Specific instructions about aggregating elementary flows
The toxicity-related impact categories (ldquoHuman toxicity cancer effectsrdquo ldquoHuman
toxicity non-cancer effectsrdquo and ldquoFreshwater ecotoxicityrdquo) contain long lists of
characterization factors specified on the elementary flow category level 3 (also known
as sub-compartment ndash for example urban air freshwater agricultural soil) The impact
category ldquoParticulate matterrdquo also contains characterization factors at the level 3
category
It is recommended to aggregate the elementary flows on the level 2 category (ie
emissions to air water soil) in the contribution analysis This is to make the analysis
more manageable and because the level 3 category does not give additional information
when analyzing on the process level (the processes already contain information on the
location type of the emissions)
It is important to model foreground data on the level 3 category for particulates and
toxic substance flows because the characterization factors can deviate considerably
Metal resource flows are not specified per origin of ore type in the source files of the
ILCD recommended methods However in several background databases metal
resource flows are differentiated (for example Silver Ag 46E-5 Au 13E-4 in ore
Silver Ag 42E-3 Au 11E-4 in ore Silver Ag 21E-4 Au 21E-4 in ore etc)
Therefore the specified flows were added to the ILCD method in LCA software packages
with the same characterization factors as for the unspecified metals When doing a
contribution analysis of the metal resource flows it is therefore recommended to
aggregate the flows per metal (silver copper nickel etc)
There are 5 different fossil fuel related resource flows specified in the source files of the
ILCD recommended methods (brown coal 119 MJkg crude oil 423 MJkg hard coal
263 MJkg natural gas 441 MJkg peat 84 MJkg) However in several background
databases fossil resource flows are specified with different calorific values (for example
Gas natural 468 MJ per kg Gas natural 366 MJ per m3 Gas natural 35 MJ per m3
Gas natural 303 MJ per kg etc) Therefore the specified flows were added to the
ILCD method in LCA software packages with characterization factors related to the
factors in the original source taking the different calorific value into account When
doing a contribution analysis of the fossil resource flows it is therefore recommended to
aggregate the flows based on the 5 original flows (brown coal crude oil hard coal
natural gas and peat)
328 Conclusions
In table 1 the requirements to define most relevant contributions during the EF pilot
phase are summarized as found in the PEFCR Guidance (EC 2016)
11
Table 1 Summary of requirements to define most relevant contributions and hotspots (James amp Galatola 2015)
Item At what level does relevance need to be identified
Threshold
Most relevant impact categories In the final results starting from normalized and weighted results but deviations possible if justified
No threshold Decision left to TS but subject to stakeholder consultation and TAB opinion
Most relevant life cycle stages For each impact category before normalization and weighting Not relevant for data needs identification
All life cycle stages contributing cumulatively more than 80 to any impact category
Hotspots For each impact category before normalization and weighting
Either (i) life cycle stages processes and elementary flows cumulatively contributing at least 50 to any impact category or
(ii) at least the two most relevant impact categories life cycle stages processes and at least two elementary flows (minimum 6) Additional hotspots may be identified by the TS
Most relevant processes For each impact category before normalization and weighting Essential for data needs identification
All processes contributing cumulatively more than 80 to any impact category
Most relevant elementary flows For each impact category before normalization and weighting Essential for data needs identification
All elementary flows contributing cumulatively more than 80 to any impact category and in any case all those contributing more than 5 individually
When assessing what is most relevant it is also recommended to check if what is
identified as being non-relevant can be actually considered as such A practical example
is given at paragraph 431
12
329 Example to identify most relevant contributions and hotspots
The PEFCR Guidance (2016) also provided an example on how to perform a hotspot
analysis and the identification of most relevant impact categories life cycle stages
processes and elementary flows The example is reported here it is a fictitious example
not based on any specific PEF study results
3291 Example most relevant Impact Categories
Table 2 shows the contribution of different impact categories based on normalised and
weighted results
Table 2 Selection of most relevant Impact Categories (James amp Galatola 2015)
Impact category Unit Contribution ()
Climate change kg CO2 eq 215
Ozone depletion kg CFC-11 eq 30
Human toxicity cancer effects CTUh 83
Human toxicity non-cancer effects CTUh 149
Particulate matter kg PM25 eq 01
Ionizing radiation human health Kbq U235 eq 05
Photochemical ozone formation kg NMVOC eq 24
Acidification molc H+ eq 15
Terrestrial eutrophication molc N eq 10
Freshwater eutrophication kg P eq 10
Marine eutrophication kg N eq 01
Freshwater ecotoxicity CTUe 01
Land use kg deficit 143
Water resource depletion m3 water eq 186
Mineral fossil resource depletion kg Sb eq 127
Based on the normalised and weighted results the TS can decide that the following
impact categories are relevant for communication purposes climate change water
depletion and land use Where there is deviation from the most significant contributors
to the normalised and equally weighted results justification shall be provided
Once the relevant impact categories for communication purposes have been selected
the TS shall start identifying the most relevant life cycle stage processes and flows per
each impact category (all baseline EF impact categories not only those relevant for
communication purposes)
13
3292 Example most relevant Life Cycle Stages
Table 3 shows the contribution of different life cycle stages to the climate change impact
category (based on the characterised inventory results before normalisation and
weighting)
Table 3 Selection of most relevant life cycle stages (James amp Galatola 2015)
Life cycle stage Contribution ()
Raw material acquisition and pre-processing 421
Production of the main product 252
Product distribution and storage 164
Use stage (if in scope) 108
End-of-life 55
The three life cycle stages in purple will be the ones identified as most relevant for
climate change as they are contributing to more than 80 This procedure shall be
repeated for all the baseline EF impact categories
3293 Example most relevant Processes
Table 4 shows the contribution of different processes to the climate change impact
category (based on the characterised inventory results before normalisation and
weighting)
Table 4 Selection of most relevant processes (James amp Galatola 2015)
Unit process Contribution ()
Process A 89
Process B 614
Process C 234
Process D 28
Process E 15
Process F 09
Other processes 09
According to the proposed procedure the processes in orange shall be selected as ldquomost
relevantrdquo Process E could be added to the as most relevant ones based on specific
considerations (eg it is under operational control it is of relevance for the specific
sector etc) This procedure shall be repeated for all the baseline EF impact categories
3294 Example most relevant Elementary Flows
Considering that the selection of the most relevant elementary flows can be done at
overall life cycle level (option 1) andor per relevant process (option 2) there are two
14
possible outcomes Starting from the inventory results provided in Table 5 the list of
most relevant flows are highlighted in blue in Table 6 (at overall life cycle) and Table 7
(at process level)
Table 5 Inventory results (climate change results expressed in gCOeq) (James amp Galatola 2015)
Inventory flow Substance 1 Substance 2 Substance 3 Substance 4 Substance 5 Total
Process A 249 85 6 45 5 390
Process B 1100 600 500 450 50 2700
Process C 300 250 20 30 430 1030
Process D 60 30 20 10 5 125
Process E 64 1 1 1 1 68
Process F 15 10 8 5 3 41
Other processes 15 10 8 5 3 41
Total 1803 986 563 546 497 4395
Table 6 Most relevant inventory flows contributing to climate change (based on the inventory results before normalisation and weighting) - overall life cycle (option 1) (James amp Galatola 2015)
Inventory flow Substance 1 Substance 2 Substance 3 Substance 4 Substance 5 Total
Process A 57 19 01 10 01 89
Process B 250 137 114 102 11 614
Process C 68 57 05 07 98 234
Process D 14 07 05 02 01 28
Process E 15 00 00 00 00 15
Process F 03 02 02 01 01 09
Other processes 03 02 02 01 01 09
Total 410 224 128 124 113
Table 7 Most relevant inventory flows contributing to climate change (based on the inventory results before normalisation and weighting) ndash process level (option 2) (James amp Galatola 2015)
Inventory flow Substance 1 Substance 2 Substance 3 Substance 4 Substance 5 Total
Process A 64 22 2 12 1 100
Process B 41 22 19 17 2 100
Process C 29 24 2 3 42 100
15
Process D 48 24 16 8 4 100
Process E 94 1 1 1 1 100
Process F 37 24 20 12 7 100
Other processes 37 24 20 12 7 100
3295 Example hotspots
In Tables 8 and 9 the identified hotspots - based on the two different approaches
available- are presented
Table 8 Hotspots based on 50 cumulative contribution (OPTION A) (James amp Galatola 2015)
Hotspots
Life cycle stages Raw material acquisition and pre-processing
Production of the main product
Processes Process B
Elementary flows Option 1 Substance 1 and 2
Option 2
Substance 1 and 2 in processes B
Substance 1 and 5 in process C
Substance 1 in process E
Table 9 Hotspots based on top two representatives (OPTION B) (James amp Galatola 2015)
Hotspots
Life cycle stages Raw material acquisition and pre-processing
Production of the main product
Processes Process B
Process C
Elementary flows Option 1 Substance 1 and 2 in process B
Option 2 Substance 1 in process E6 and substance 5 in process C
4 Interpretation on Life Cycle Inventory (LCI) level
During the life cycle inventory phase the actual data collection and modelling of the
system has to be done in line with the goal definition and aiming at meeting the
requirements derived in the scope phase The LCI results are the input to the
subsequent Life Cycle Impact Assessment (LCIA) phase
Interpretation involves evaluations at the level of Life Cycle Inventory in order to
improve the inventory model to meet the needs derived from the study goal
perform a sensitivity analysis to check for limitations in the appropriateness of
the life cycle inventory work
6 Choosing the hotspots based on option B-2 might lead to anomalies (like in this fictitious
example) where an elementary flow is identified as hotspot even if its absolute value is not
prominent
16
understanding the underlying assumptions when secondary datasets are used in
the model
combining the above points to refine the LCA model
draw appropriate and robust conclusions
Key aspects to evaluate life cycle inventories are the consistency and completeness
thereof They can be evaluated taking into account different aspects A sensitivity check
to evaluate the reliability of the results is also a needed step
A first aspect to be taken into account is the data source Primary data are collected
directly by the company performing the study thus the consistency of the data used
with the goal and scope of the study should be more straightforward However when
and LCA study is making use of secondary datasets to model the background system a
careful analysis of the consistency of these datasets with the primary data collected and
in relation with the goal and scope shall be made
Indeed different modelling assumptions in datasets aimed at representing the same
product system can lead to different results affecting the reliability of the LCA study
(Williams et al 2009) An example of the relevance of different data sources and
consistency has been discussed in Corrado et al (2017) this study focuses on different
data sources to originate the inventory of arable crops (1 kg of wheat) The choice of the
secondary dataset can have a relevant influence on LCA results and it is considered
among the challenges for a robust LCA (Notarnicola et al 2017a)
A second aspect to be taken into account regarding life cycle inventories is the quality of
the data used regarding time geographical and technological representativeness
precision methodological compliance and documentation Therefore in this chapter a
paragraph is dedicated to analyzing more in detail this aspect
A third relevant aspect in relation to LCIs is the consistency and completeness in relation
to single aspects such as cut-off inclusionexclusion of specific elementary flows (eg
long term emissions) It is not straightforward to judge if an inventory can be considered
complete As a general rule it has always to be kept in mind that the inventory has to
be checked in its completeness in relation to the goal and scope of the study for
example if the goal of the study is to assess only the climate change impact category
the completeness of the inventory shall be evaluated against those emissions that are
actually contributing to climate change within the system boundaries It does not lead to
improved conclusions the compilation of a more detailed inventory with the inclusion of
eg substances that do not contribute to climate change
41 Analysis of data sources
When selecting secondary data sets it is important to ensure that all data sets used in
the modelling of the system model are methodologically consistent (ie consistency
check) The use of inconsistent data can lead to an unreliable and distorted LCA study
often with wrong conclusion and recommendations drawn Furthermore use of datasets
with different level of completeness (ie completeness checks) may also lead to
unreliable conclusions
The study from Corrado et al (2017) is used as a case study to highlight the relevance
of different data sources in an LCA study Therefore the content of this paragraph is
mainly based on this paper The paper is organized as follows firstly the authors report
an overview of the system boundaries and underlying assumptions adopted in building
secondary datasets for arable crops within three databases Secondly they summarise
the approaches adopted to model the foreground system highlighting analogies and
differences Afterwards they point out the influence that modelling approaches can have
on the impact assessment Finally the combination of these elements allowed to derive
some considerations on relevant elements of datasets
17
It is focused on the analysis of secondary datasets for arable crops production as
modelled in three databases adopted as source of secondary data in LCA Agribalyse v
12 (Colomb et al 2015) Agrifootprint v 10 (Blonk Agri-footprint BV 2014) and
Ecoinvent v 31 (Weidema et al 2013) For simplicity in the remainder of the report
they are named Agribalyse Agrifootprint and Ecoinvent respectively
The authors performed three types of analysis
comparison of the system boundaries and underlying assumptions
analysis of how the foreground system is modelled in each dataset focusing on
different aspects such as fertilisers application and nutrient fate plant
protection products application and fate heavy metals (HMs) input mass balance
and fate irrigation agricultural operations land occupation and transformation
comparison of the results of the life cycle impact assessment for the foreground
system including the relative contribution of background
411 Analysis of the system boundaries
The system boundaries and the main underlying assumptions adopted to model arable
crops production in the three databases are reported in Table 10
Table 10 Underlying assumptions in relation to the three databases considered by the authors (Corrado et al 2017)
Agribalyse Agrifootprint Ecoinvent
Data source Provided by technical institutes (eg ARVALIS ndash Institut du Veacutegeacutetal)
Different sources (eg
scientific literature official
statistics such as FAOstat
Eurostat)
GL-Pro project ndash Barrois
region (Nemecek and
Baumgartner 2006)
Straw management (when
applicable)
Partly removed from the
field
Totally removed from the
field
Left on the field
Allocation of co-products
(grains and straw)
Not applied because the
straw market was not very
structured at the time when
the datasets were developed
Economic mass and energy
allocation
Not applicable because
straw is assumed to be left
on the field
Nutrients from straw left
on the field
The fertilising effect of crop
residues and emissions from
the residues are allocated to
the crop that generated the
residues
Not applicable The fertilising effects of crop
residues are allocated to the
crop that generated it (only
for P and K) The amount of
fertilisers is corrected for the
amount of nutrients in crop
residues
Crop
rotation
modelling
Phosphorou
s (P) and
potassium
(K) inputs
and
emissions
allocation
P and K fertilisers production
and emissions due to their
application are allocated to
each crop pro rata for the
crop exports
Not reported The amount of P and K of the
residues supplied to the field
through residues were
allocated to the crop that
generates them
18
N inputs and
emissions
allocation
The organic nitrogen
available for the crop to
which the fertiliser is
applied is allocated to that
crop The remaining fraction
that contributes to
increasing the stock of
organic matter was allocated
to all the crops in the
rotation Mineral nitrogen is
completely allocated to the
crop to which it was applied
Not reported Allocation not performed
412 Foreground system analysis
The authors compared the activities modelled in the foreground system of the datasets
referring to seven field activities agricultural operations fertilisers application and
nutrients environmental fate plant protection products (PPP) application and related
environmental fate heavy metals (HMs) input and related environmental fate irrigation
and land occupation and transformation The average crop yields reported in the dataset
presents small differences (wheat min-max barley min-max rapeseed min-max pea
min-max) The 95 confidence interval of the yields is defined only in Agrifootprint
datasets whereas it is not reported in Agribalyse and Ecoinvent datasets
For completeness findings and aspects to be taken into account are below reported The
below checklist can also be used to build a completeness check of the different datasets
and it can be used to build a sensitivity analysis based on the parameters that are seen
to be affecting the final results
Agricultural practices modelling
Management of agricultural residues
Composition of the crop rotation
Allocation to the co-products
Agricultural operations modelling
Number of operations
Number of passages
Machine power
Soil texture
Airborne emissions due to fuel combustion
Emissions of heavy metals due to tires abrasion
Fertilisers application and nutrients fate modelling
The nutrients fate is highly influenced by site-specific conditions
o environmental conditions
o soil type
o agricultural management practices
o type of fertiliser (Brentrup et al 2000)
o spatial differentiated emissions when modelling agricultural systems
Nomenclature (eg the paper shows that phosphorus compounds emissions were
expressed in the datasets with different flows limiting the possibility of making a
comparison among inventory data)
PPP application and environmental fate modelling
19
application method
weather and soil conditions
crop characteristics
irrigation
active substances whose use is not anymore authorised
Heavy metals inputs and environmental fate modelling
Mass balance
Fate
Irrigation modelling
Irrigation volumes
Water flows type
Environmental conditions
Spatially-differentiated water flows
Land use transformation modelling
Amounts of transformed land are considered
Type of land transformed (eg from hellip to hellip)
CO2 emissions due to land transformation
42 Data quality
As data is essential in all quantitative studies like LCAs so is also their quality
Therefore the data applied in the life cycle inventory phase shall be assessed in the
interpretation phase against the goal and scope of the study is the data quality
sufficient for the goal of the study Is the data consistent Can the data be seen as
complete
If the answer is yes then the interpretation can be preceded and conclusions drawn If
no then either the goal and scope need to be adjusted or probably in most cases
better the life cycle inventory phase need to be revisited in an iterative manner to
improve the data quality to the appropriate level The assessment of the data quality is a
mandatory reporting element in the interpretation phase
ISO 14044 (2006) defines data quality as characteristics of data that relate to their
ability to satisfy stated requirements The data quality requirements are described in
the goal and scope of the LCA study and covers the following 10 aspects (ISO14044
2006 ch 4236)
1) time-related coverage age of data and the minimum length of time over which
data should be collected
2) geographical coverage geographical area from which data for unit processes
should be collected to satisfy the goal of the study
3) technology coverage specific technology or technology mix
4) precision measure of the variability of the data values for each data expressed
(eg variance)
5) completeness percentage of flow that is measured or estimated
6) representativeness qualitative assessment of the degree to which the data set
reflects the true population of interest (ie geographical coverage time period
and technology coverage)
7) consistency qualitative assessment of whether the study methodology is applied
uniformly to the various components of the analysis
20
8) reproducibility qualitative assessment of the extent to which information about
the methodology and data values would allow an independent practitioner to
reproduce the results reported in the study
9) sources of the data
10) uncertainty of the information (eg data models and assumptions)
In the EF methods7 the consistency and reproducibility is one of the main aims of any
EF study and not evaluated as part of the data quality assessment Data sources should
be ILCDEF compliant and specified if a PEFCROEFSR is followed Precision and
uncertainty are evaluated together in the EF method Therefore the EF operates with six
semi qualitative data quality requirements instead of 9 in ISO14044 (cf section 56 in
European Commission 2013)
In order to evaluate the appropriateness and the quality of the data used to compile the
LCI they have to be scored against certain requirements As an example the table below
(Table 11) provides the data quality requirements for a PEF study of intermediate paper
products (EC 2013a Schau and Davidsson 2015)
The table 12 shows the semi-qualitative data quality rating (DQR) (based on expert
judgement) of the most impacting processes in an early phase of a PEF study of
intermediate packaging paper The data set DE Potato starch at plant was deemed to
be of too low quality (DQR = 267) as it scored poor (4) on Parameter uncertainty and
Methodological Appropriateness and Consistency to be used for comparative assertion
Therefore another dataset was searched for that was compliant with the goal and scope
of the study
It is also recommended that the practitioner is aware of the methodological choices used
to build the datasets (may be evaluated under Methodological Appropriateness and
Consistency) such as the definition of the system boundaries between nature and
technosphere and the time-horizons of the emissions (short-termlong term)
System boundaries between nature and technosphere are especially relevant for food
and agricultural product (and products made thereof) as for these products the
technosphere is closely interlinked with nature (Schau et al 2008) This includes
modelling of pesticides and fertilizers (De Schryver and Galatola 2016)
The time-horizons of the emissions are essential especially for long lived product and for
end-of-life processes (eg landfilling waste handling of residues from mining in raw
material extraction) (Guo and Murphy 2012) Also how radioactive waste is modelled is
essential to assess with a time horizon in mind Often a distinction is made between
long term and short term emission Where the boundary is set between those (100
years 300 years 50 000 years etc) can therefore be important and should be taken
into account when assessing the data quality for methodological appropriateness and
consistency (see chapter 433)
Database providers publish their modelling principle (see eg Baitz et al 2016) which is
an essential source for evaluating and assessing the data quality (of background data) in
addition to the metadata of the LCI data itself
Table 11 Data quality rating in an example of intermediate paper products (EC 2013 Schau and Davidsson 2015)
7 In the EF Guide the term representativenessrdquo is used instead of coveragerdquo used in ISO 14044 for the
geographical and time-related data quality requirement The term ldquoparameter uncertaintyrdquo is used instead of ldquoprecisionrdquo used in ISO14044 and the term ldquomethodological appropriateness and consistencyrdquo is used in the EF Guide instead of ldquoconsistencyrdquo used in ISO14044
21
Data quality elements
Representativeness
Qu
alit
y level
Qu
alit
y r
atin
g
Defin
itio
n
Tech
no
log
ica
l
Ge
og
rap
hic
al
Tim
e-r
ela
ted
Com
ple
ten
ess
Meth
od
olo
gic
al
Ap
pro
priate
ness a
nd
Co
nsis
tency
Pa
ram
ete
r u
nce
rta
inty
Very good
1
Meets the criterion to a very high degree without need for improvement
Eg Process is same For electricity from grid average technology as country- specific consumption mix
Country specific data
le 3 years old data
Very good completeness (ge 90 )
Full compliance with all requirements of the PEF guide
Very low uncertainty (le 7 )
Good
2
Meets the criterion to a high degree with little significant need for improvement
Eg average technology as country- specific consumption mix
Central Europe North Europe representative EU 27 mix
3-5 years old data
Good completeness (80 to 90 )
Attributional Process based approach AND following three method requirements of the PEF guide met (1) Dealing with multi-functionality (2) End of life modelling (3) System boundary
Low uncertainty (7 to 10 )
Fair 3
Meets the criterion to an acceptable degree but merits improvement
Eg average technology as country- specific production mix or average technology as average EU consumption mix
EU-27 countries other European country
5-10 years old data
Fair completeness (70 to 80 )
Attribution Process based approach AND two of the following three method requirements of the PEF guide met (1) Dealing with multi-functionality (2) End of life modelling (3) System boundary
Fair uncertainty (10 to 15 )
Poor
4
Does not meet the criterion to a sufficient degree but rather requires improvement
Eg average technology as country- specific consumption mix of a group of similar products
Middle east North-America Japan etc
10-15 years old data
Poor completeness (50 to 70 )
Attributional Process based approach AND one of the following three method requirements of the PEF guide met (1) Dealing with multi-functionality (2) End of life modelling (3) System boundary
High uncertainty (15 to 25 )
Very poor
5
Does not meet the criterion Substantial improvement is necessary
Eg other process or unknown not available (na)
Global data or unknown
ge 15 years old data
Very poor or unknown completeness (lt 50 )
Attributional Process based approach BUT None of the following three method requirements of the PEF guide met (1) Dealing with multi-functionality (2) End of life modelling (3) System boundary
Very high uncertainty (gt25 )
Table 12 Data quality rating in an early phase of a PEF study of intermediate packaging paper
22
Representativeness
Data set
Tech
no
logi
cal
Ge
ogr
aph
ical
Tim
e-r
ela
ted
Co
mp
lete
ne
ss
Par
ame
ter
un
cert
ain
ty
Me
tho
do
logi
cal
Ap
pro
pri
ate
ne
ss a
nd
Co
nsi
ste
ncy
Resulting Data Quality Rating (DQR)
CH building hall steel construction 1 3 3 1 3 4 250
CH disposal sludge from pulp and paper production 25 water to sanitary landfill 1 3 3 1 3 4 250
CH disposal steel 0 water to municipal incineration 1 3 3 1 3 4 250
DE lignite briquettes at plant 1 3 3 1 3 4 250
DE maize starch at plant 1 3 3 1 3 4 250
DE potato starch at plant 1 3 3 1 4 4 267
RER AKD sizer in paper production at plant 1 2 3 1 3 4 233
RER aluminium sulphate powder at plant 1 2 3 1 3 4 233
RER building multi-storey 1 2 3 1 3 4 233
RER electricity medium voltage production RER at grid 1 2 2 1 3 3 200
RER facilities chemical production 1 2 3 1 3 4 233
RER heavy fuel oil at regional storage 1 2 3 1 3 4 233
RER heavy fuel oil burned in industrial furnace 1MW non-modulating ltu-sogt 1 2 3 4 3 4 283
RER industrial wood hardwood under bark u=80 at forest road 1 2 3 1 3 4 233
RER industrial wood softwood under bark u=140 at forest road 1 2 3 1 3 4 233
RER natural gas high pressure at consumer 1 2 3 1 3 4 233
RER paper mill integrated ltu-sogt 1 2 3 1 3 4 233
RER PEFEmissions-RF ltu-sogt 1 2 3 3 3 3 250
RER PEFEmissions-VF v03 ltu-sogt 1 2 2 2 4 3 233
RER sodium chlorate powder at plant 1 2 3 1 3 4 233
RER sodium dithionite anhydrous at plant 1 2 3 1 3 4 233
RER sodium hydroxide 50 in H2O production mix at plant 1 2 3 1 3 4 233
RER steel converter chromium steel 188 at plant 1 2 3 1 3 4 233
RER steel electric chromium steel 188 at plant 1 2 3 1 3 4 233
RER sulphate pulp ECF bleached at plant 1 2 3 1 3 4 233
RER sulphate pulp unbleached at plant 1 2 3 1 3 4 233
RER sulphuric acid liquid at plant 1 2 3 1 3 4 233
RER transport freight rail 1 2 3 1 3 4 233
RER transport lorry gt16t fleet average 1 2 3 1 3 4 233
RER Water Withdrawals-VF ltu-sogt 1 1 2 1 3 3 183
23
43 Further completeness and consistency checks
In this section some further checks are presented referring both to completeness and
consistency checks
431 Anomaly assessment An anomaly assessment can be done where based on previous experience unusual or
surprising deviations from expected or normal results are observed and examined for
relevance (Skone 2000)
As a practical example it can be considered the case of LCA studies of mining activities
When the production of eg copper concentrates was assessed adopting an impact
assessment method such as ILCD and performing the hotspot analysis as described in
chapter 3 of this report it was found that the identification of most relevant impact
categories did not include Resource Depletion fossil mineral In addition the most
relevant processes and life cycle stages contributing to this impact category were not
related to the ones involved in the copper extraction In the case under analysis it was
found that elementary flows related to extraction of resources from nature were missing
from the inventory because the dataset used in the analysis did not include in its goal
and scope the assessment of Resource Depletion fossil mineral
A learning was that it is true that it is important to evaluate what is most relevant (eg
impact categories life cycle stages processes elementary flows) however it is also
important to check if what is found as being non-relevant can be actually considered as
such Hence it is important to evaluate if the LCI modelled is complete with regard to
the impact categories that the assessor wants to evaluate
432 Cut-off ISO 14044 identifies cut-off as the ldquospecification of the amount of material or energy
flow or the level of environmental significance associated with unit processes or product
system to be excluded from a studyrdquo ISO 14044 also requires that the effect on the
outcome of the study of the cut-off criteria selected shall be assessed and described in
the final report
Cut-off criteria can be based on
Mass eg lt5 cumulative mass input
Energy eg lt5 cumulative energy input
Environmental significance eg lt5 of the results of the selected impact categories It is important to note that the cut-off criteria need to be selected based on the goal and
scope of the study Therefore if the study is intended to be used for comparisons and
comparative assertions a sensitivity check using all the above three criteria is a
mandatory requirement
433 Long term emissions Long term emissions are those emissions considered to happen beyond 100 years up to
thousands of years (eg 60000)
Not all databases include long-term emissions within the system boundaries In some
cases it can be observed that LCA results after characterization normalization and
weighting are by far dominated by toxicity-related impact categories When this is the
case it is recommended to check if the datasets used include long term emissions
which in terms of absolute amounts are well superior compared to emissions occurring
within 100 years It has also to be noted that the models to estimate long term
emissions are affected by a high uncertainty which has to be taken into account in the
LCA study to avoid biased conclusions and wrong recommendations
When dealing with long term emissions it is important however not to overlook their
potential impact therefore it is recommended to
Assess a baseline scenario excluding long-term emissions
Perform a sensitivity analysis including long-term emissions in the LCI
Include an analysis of the uncertainty associated to the inclusion of long-term
emissions
24
25
5 Interpretation on Life Cycle Impact Assessment (LCIA)
level
Life Cycle Impact Assessment is the phase in an LCA where the inputs and outputs of
elementary flows that have been collected and reported in the inventory are translated
into impact indicator results LCIA has two mandatory steps which are the classification
and the characterization of LCI results and two optional steps normalisation and
weighting
Many elements can be subject to interpretation in the LCIA phase In this report the
focus will be on
the relevance of applying different characterization models
the relevance of applying different normalisation sets
the relevance of applying different weighting sets
the identification of the most sensitive elements in determining the final results
conclusions and recommendations
the coverage of characterization factors compared to the inventoried elementary
flows
Those points will be illustrated in the following section through illustrative case studies
First a case study dealing with sensitivity analysis of using different characterization
models for toxicity-related and resource-related impact categories will be discussed
Second a case study dealing with using different impact assessment methods This case
study will also be used to go through sensitivity analysis in relation to normalisation sets
and weighting sets
Third a case study mapping the coverage of characterization factors of toxicity-related
categories compared to the inventoried elementary flows will be shown
51 Characterization sensitivity analysis
The use of different characterization models to assess a certain impact category may
play a relevant role in the calculation of the final results and the identification of
hotspots most relevant life cycle stages processes and elementary flows
511 Case study 1 ndash WEEE management Toxicity-related and Resource-related impact categories affecting interpretation of results
The first case study is based on a work by Rigamonti et al (2017) the authors selected
a case study in which LCA has been applied to assess a waste electrical and electronic
equipment (WEEE) management system (Biganzoli et al 2015) In that study the
assessment was carried out to quantify the mass balance of the WEEE management
system in Lombardy Region in the year 2011 and to calculate its environmental benefits
and burdens
Firstly they tested characterization models and characterization factors (CFs) for
toxicity-related impact categories human toxicity cancer and non-cancer and eco-
toxicity There is an evolving debate on the robustness of these impact categories and
specifically for what concern impacts due to metals (see eg Pizzol et al 2011) In fact
some specific features of the metals (eg essentiality) as well as elements affecting
their fate modelling (eg different conditions affecting their bioavailability) are not fully
captured by currently available models applied in LCA Therefore the authors ran a
sensitivity analysis where updated CFs for metals were tested along the lines of recent
literature (Dong et al 2014) aiming at identifying the different results associated to
metals impact compared to the ILCD method (EC-JRC 2011) based on the USEtox
model (Rosenbaum et al 2008)
26
The total impact obtained by applying Dong et al 2014 CFs resulted about three times
higher than the corresponding obtained by the USEtox model This is mainly due to the
Dong et al 2014 CFs of Copper (Cu) and Zinc (Zn) which are higher than those adopted
in the USEtox model when considering the freshwater archetype proposed in the paper
of Dong as default when the location of the emission is not known
Secondly they tested impact assessment models for resource Models currently available
differ both in the modeling approach in the perspective adopted for assessing the
resources (Dewulf et al 2015) and as consequence in the characterization metric and
factors adopted (Mancini et al 2016) Beyond the potential benefit associated to a mass
based approach to recycling (eg kg of material recycled) there is indeed the need of
understanding to which extent the recycled materials are contributing to the resource
depletion impact categories The authors tested abiotic depletion potential (ADP) (CML
2012) which is focusing on potential depletion based on the ratio between resource
consumption and availability (either considering ultimate reserves in earth crust known
base reserves or economically viable reserves) ILCD model (EC-JRC 2011) which is an
extended version of CML2012 reserve based (based on CML algorithm few other
resources have been added described in Sala et al 2012) EDIP97 (Hauschild and
Wenzel 1998) which is comparing the resource with the deposits economically
exploitable without accounting for current level of consumption EPS2000 (Steen
1999) which assesses the cost (as societyrsquos willingness to pay) of substituting a
substance by an alternative for future generations affected by current level of depletion
Recipe 2008 (Goedkoop et al 2009) which is looking at marginal increase of extraction
cost per kg of extracted resource differentiating it by deposit and assuming a discount
rate over an indefinite timespan the Anthropogenic Abiotic Depletion Potential (AADP
Schneider et al 2011) which is accounting for the potential of resource recycling
assuming urban mining as an additional source of resources The recent update of the
AADP (Schneider et al 2015) was also considered It introduces the concepts of
ultimately extractable reserves represented by the amount available in the upper
earths crust that is ultimately recoverable A new set of CFs were also tested developed
by Mancini et al (2016) aiming at addressing the benefit associated to the recovery of
Critical Raw Materials (CRMs) The characterization model is based on the use and
adaptation to LCA of the supply risk indicators developed by the European Commission
(EC 2014) Three sets of CFs are tested based on different assumptions (1) baseline
option the supply risk factors as such ndash (SR) (2) an exponential function which
magnifies the differences between the CRMs - (SR)^6 (3) the ratio between supply risk
and production data (SRworld mine production in 2011) which reflects the size of the
market giving more importance to the materials used in small amounts in products and
applications like eg specialty metals that are often perceived as critical
The comparison among the different models was first of all made considering the mineral
resources present in the inventory of the case study covered by each of them The ILCD
method is the most comprehensive one with 31 mineral resources included in its model
for the resource depletion category On the contrary the Supply Risk (3) is the one that
covers the minor number of substances (ie 7)
A contribution analysis was also performed (Figure 3) Silver (Ag) gives the main
percentage contribution to the indicator in five models (ie CML 2012 versions b and c
ILCD Supply Risk 3) and EDIP97) Cobalt (Co) is the main contributor in the Supply
Risk (2) Copper (Cu) in the ReCiPe 2008 Palladium (Pd) in the EPS 2000 and AADP
(2015) and Nickel (Ni) in the AADP (2011) In the CML 2012 (a) Tellurium Gold (Au)
and Silver (Ag) are the most important substances whereas Aluminium (Al) Copper
(Cu) and Nickel (Ni) are the main contributors in the case of the Supply Risk (3)
27
Figure 3 Contribution analysis for the resource- related indicator calculated adopting several characterization models (Rigamonti et al 2017)
512 Case study 2 ndash Basket of Products Food sensitivity analysis
comparing different impact assessment methods
This case study is based on the application of different life cycle impact assessment
methods for the evaluation of the environmental impacts associated to food consumption
in Europe A process-based LCA has been performed for a basket of products that
represent the most relevant food product groups selected by importance in mass and
economic value to depict the average consumption for nutrition of EU citizens in 2010
(Notarnicola et al 2017b) The product groups in the basket were pig meat beef
poultry milk cheese butter bread sugar sunflower oil olive oil potatoes oranges
apples mineral water roasted coffee beer pre-prepared dishes For each product group
in the basket an inventory model based on a representative product has been
developed The impact of each representative product was then multiplied by the mass
of products in that product group that is consumed in one year by an average EU citizen
The environmental impact of the average food consumption of a European citizen has
been characterized using ILCD method for the life cycle impact assessment (EC-JRC
2011) The paper by Notarnicola et al (2017) illustrates the details of the process-based
LCA study on the BoP nutrition for EU 27 citizens and presents the results of the
characterisation phase The variability of the results associated to methodological
choices has been already preliminary explored (Castellani et al 2017) The present
report builds on those results and elaborates the interpretation phase (including also
normalisation and weighting) The questions that these analyses help answering are i)
are the products found to have the highest impact sensitive to changes in LCIA elements
(characterisation factors normalization references or the weighting sets) and ii) which
are the most contributing impact categories
This case study will also be used in paragraph 52 53 and 54 as a basis for further
insights on the interpretation of an LCA study
For this specific case the authors performed a sensitivity analysis on the LCIA
characterisation phase using ILCD compared with other two methods the CML-IA v 42
(Guineacutee et al 2002) and the Ecological footprint (EcF) (Wackernagel et al 2005) CML-
IA was chosen because it is widely used in LCA studies and because it adopts a different
28
modelling approach compared to ILCD in several impact categories that could be
relevant for food chains For instance for toxicity-related impact categories CML-IA is
based on USES-LCA model (Van Zelm et al 2009) whereas ILCD is applying USETOX
model (Rosenbaum et al 2008) for eutrophication CML-IA is using RAIN-LCA
(Huijbregts 1999) whereas ILCD is using different models for terrestrial and aquatic
eutrophication (respectively accumulated exceedance by Seppaumllauml et al 2006 and
EUtrend model as applied by Struijis et al 2009) The EF was chosen because it
assesses impacts in terms of direct and indirect land use and has been considered a
method that may complement LCA (Lee et al 2014) although based on an accounting
framework that has been questioned (Giampietro and Saltelli 2014) The version of EcF
method implemented in the study is the one already adapted to LCA and provided
within the SimaPro 805 software package (Pregrave Consultants 2015)
The three methods are mostly convergent in the identification of the product groups to
be considered hotspots within the BoP nutrition ie within the food consumption of the
European citizens ILCD and CML-IA identify a wider range of hotspots compared to EcF
mainly because they cover a wider range of impact categories (eg bread and potatoes
do not emerge as hotspot for EcF because their main impacts are in impact categories
not covered by the EcF method)
The product groups that emerge as hotspots in all the methods even if with slightly
different level of contribution are meat and dairy products and beer (as representative
product for alcoholic drinks)
The impact categories for which beer emerge as hotspot are slightly different among the
three methods ozone depletion ionizing radiation and resource depletion in ILCD and
CML-IA photochemical ozone formation in ILCD human toxicity and marine aquatic
ecotoxicity in CML-IA and nuclear energy in EcF The most contributing processes for all
the impact categories listed before is energy (electricity and heat) as already discussed
for ILCD In the case of CML-IA method toxicity-related impacts are mainly due to direct
emissions to air coming from the production process of the packaging glass
513 Conclusions and recommendations
These results reveal that the relative importance of one substance compared to another
changes with the model This is because the models differ in the substances that they
include and in the CFs of each substance It is recommended to run a sensitivity check
with different characterization models to evaluate the robustness of the conclusions
drawn It is also recommended to evaluate the theory underlying the characterization
models chosen to evaluate a certain impact category as this helps understanding the
results obtained
52 Characterization mapped flows and unmapped flows
This section shows two different levels of checks the first one focuses on a comparison
between two different life cycle impact assessment methods (ie ILCD vs CML-IA) based
on Castellani et al (2017) the second one focuses on what are the implications of
uncharacterized flows for a specific impact category (freshwater ecotoxicity) based on
the case study presented in Notarnicola et al (2017b)
521 Comparison between two different methods
A check of the inventoried elementary flows that are not characterized at the LCIA phase
should always be done to support interpretation of results Indeed the comprehensive
translation of the inventory into potential environmental impacts may not occur if some
of the elementary flows are not covered by the chosen characterization models Table 13
reports an example of the total amount of elementary flows that are available in an
inventory but they are not mapped and characterized by the methods considered (ILCD
and CML-IA) as reported in Castellani et al (2017) The authors checked the list of
uncharacterized flows for the inventory of the case study under evaluation and
29
highlighted the most relevant ones either in term of mass or of known environmental
concern The information obtained was then used in support to interpretation For
instance in case the two methods used for characterisation and normalisation give very
different results for one impact category the information about uncharacterized flows
can help to check if this difference is due to a different characterisation of impacts (ie
to a different way of considering the environmental relevance of some elementary flows)
or if it is affected by the fact that some flows (eg some emissions) are not taken into
account by one of the methods
This may occur also due to improper nomenclature of the elementary flows which may
cause a mismatch between the elementary flows listed in the inventory and the
elementary flows to which a characterization factor is available for example the
inventory may report CaCO3 while the characterization model may provide a CF for
calcite This mismatch would prevent the characterization of CaCO3
Table 13 Example of check of inventoried elementary flows that are not characterized by two impact assessment methods (based on Castellani et al 2017)
Flows Total elementary flows not characterized
Typologies of flows
Details on the elementary flows not characterized
ILCD CML-IA
ILCD CML-IA
Nr flows Amount Unit Nr flows
Amount Unit
raw materials
97 510 metals and minerals
47 795 kg 47 863 kg
water flows 25 126 m3 300 3825 m
3
Energy 0 0 MJ 12 18964 MJ
land use 11 001 m2 (or
m2a)
117 12898 m2 (or
m2a)
others 14 na mixed 34 na mixed
emissions to soil
83 227 pesticides to soil
45 0003 kg 173 008 kg
others 38 08 kg 54 41 kg
emissions to water
167 310 radioactive substances
42 119E+03 Bq 61 385E+06 Bq
metals and inorganics compounds
34 28 kg 36 28 kg
others 91 na mixed 213 na mixed
emissions to air
179 286 radioactive substances
49 899E+04 Bq 73 973E+07 Bq
metal and inorganics compounds
65 007 kg 56 0044 kg
pesticides 7 580E-08 kg 32 93 kg
others 70 na mixed 125 na mixed
waste flows 17 17 waste 17 3784 kg 17 3784 kg
Overall number of elementary flows not characterized
543 1350
In order to assess which elementary flows available in the inventory were not accounted
during the characterization the authors performed an analysis of the elementary flows
not characterized when using ILCD and CML-IA methods In total the model of the
basket includes 1730 elementary flows The ILCD method is not able to cover 543 of
these elementary flow as emission into air water soil or resource used whereas when
CML-IA is used to characterize the inventory 1350 elementary flows out of 1730 are not
30
characterized In Table 1 the list of main typologies of flows is reported Many pesticides
organic chemicals and inorganics are not characterized by the two methods Several
ionizing substances are not characterized as well as elementary flows related to group of
substances (such as AOX PAH BTEX VOC BOD and COD) Missing the CFs means that
it is not possible to estimate the extent to which eg the toxicity-related and ionizing
radiation-related impact categories are underestimated
Apart from the total number of flows covered the main difference between the two LCIA
methods is the ability to assign a characterization factor (CF) to the pesticides included
in the inventory ILCD has no CFs for 45 pesticidesrsquo emission to soil (plus 4 pesticidesrsquo
emissions to air) whereas CML-IA for 173 (plus 32 pesticidesrsquo emissions to air) This
may be the reason why human toxicity impacts appear as relevant in the results of ILCD
characterization (and related normalization and weighting as discussed below) and they
appear as less relevant in the results of CML-IA characterization and related
normalization and weighting
522 Analysis of uncharacterized flows within an impact category Based on the study of Castellani et al (2017) fourteen impact categories (IC)
recommended in PEF are calculated The number of elementary flows (ElFls) by ICs
varies from few flows (eutrophication acidification etc) to thousands (eco and human
toxicity) (see table 14)
For most of the ICs the contributing elementary flows reported in an inventory are well
identified and their inclusion in the calculation of the final score is expected to be done
correctly For climate change at mid-point 104 elementary flows with their associated
CFs are derived from the IPCC 2007 report for a 100-year period
However for impact categories like toxicity the number of elementary flows contributing
to the impact can be very important making possible the omission of some EFs at the
inventory level Additionally a high number of flows reported in the inventory have no
CFs If the number of un-characterized flows is too high this can lead to a non-robust
interpretation of the LCIA results
Table 12 shows the number of elementary flows with associated a CF (ie the single
chemical) and the amount of elementary flows with a CF per different compartment (eg
the single chemical in each compartment and sub-compartment)
Table 14 List of impact categories listed in ILCD with total number of elementary flows contributing to each IC
Impact Category ElFl with CFs (all emission compartments)
Unique ElFls with CFs (single chemical flows)
Climate change 104 102
Ozone Depletion 23 23
Human toxicity non cancer 3434 442 (USEtox 419 org+18 metals)
Human toxicity cancer 4734 607 (USEtox 596 org +8 metals)
Particulate matter 46 24
Ionizing radiation Human Health 50 29
Photochemical ozone formation 133 133
Acidification 7 7
Terrestrial eutrophication 7 7
Freshwater eutrophication 10 5
Freshwater ecotoxicity 15636 2526 (USEtox 2498 org +21 metals)
Land use 206 206
Water source depletion 1180 1180
Mineral fossil use amp Resource depletion
181 181
Marine eutrophication 14 11
Additional IC not used in PEF
Ionizing radiation Ecosystem (interim) 62 15
31
The potential impact of un-mapped (or uncharacterized) flows is illustrated via a case
study focusing the freshwater aquatic toxicity impact category using a recent modelling
of 17 food products (Notarnicola 2017b)
For a high proportion of the total mass of un-characterized ElFls the impact on the final
IC scores is null As a matter of fact 9998 of the 1887 kg ElFls emitted to the air are
made of air oxygen and hydrogen Only 033 kg (but still 199 flows) are actual made of
other type of chemicals 80 of those 033 kg are nitrogen type of chemicals 74
hydrogen chloride 12 sulphate etc (table 15) However regarding the ElFls to soil
and water the mass and number of un-characterized flow could have a significant
impact on the final score
Table 15 Type of chemicals (mass and number of EFs) not characterized per emission compartment (air oxygen and hydrogen have been excluded)
Compartments Group of chemicals Mass (g) Number of ElFl
Air
Total air 330 122
N-related 238662 2
inorganicsalt 74637 44
organic 5693 36
S - related 3896 1
metalmineral 3793 17
Alkenes 1530 2
Benzene Toluene Ethylbenzene and Xylene) unspecified ratio 0488 1
ozone 0314 1
P-related 0304 4
ionising 0261 4
Aldehydes 0213 1
Terpenes 0102 1
PAH 0034 1
Pesticide 0000 6
Acid 0000 1
Soil
Total soil 800 68
metalmineral 328315 15
inorganic 320234 4
oils 93496 3
organic 48702 2
Pesticide 5873 39
S - related 3777 2
N-related 0000 2
PAH 0000 1
Water
Total water 13871 112
inorganicsalt 7549785 22
TOC water 2840410 4
metalmineral 1998366 13
Suspended solid 1257655 6
inorganic 108851 6
organic 107546 37
AOX 2390 1
Acid 2032 2
S - related 2008 5
VOC 0643 1
32
N-related 0511 3
Propylene 0244 1
oils 0079 2
PAH 0055 2
Sodium Hydroxide 0054 1
Salt unspecified 0015 1
Hypochlorite 0013 1
ionising 0002 2
VOC 0001 1
P- related 0000 1
Looking at the results of the freshwater aquatic toxicity impact categories for all 17 food
products 90 of the impact category is driven by 10 out of 734 elementary flows that
represents only 14 of the mass of chemicals entering the aquatic environment (table
16) Furthermore it can be seen that
57 of the toxicity score are due to 3 metals representing 01 kg of the mass
However there are still more than 2 kg of un-characterized metalsminerals in
the inventory list (see table 15)
33 of the impact are due 10 pesticides (35 g) although there are still 39 un-
characterized pesticides in the inventory list (representing 5 g) (see table 15)
Table 16 Most relevant elementary flows contributing cumulatively up to 90 to the freshwater ecotoxicity impact category with USEtox
Substance Chemical
class Emission
Compartment Sub-compartment
Total impact (CTUe)
impact versus Total
Cumulated
impact Mass (kg)
Zinc metal Soil agricultural 931 21 21 00441
Copper metal Soil agricultural 902 21 42 00429
Chlorpyrifos pesticide Soil agricultural 833 19 61 00079
Copper metal Soil
351 8 69 00120
Zinc metal Water
139 3 72 00036
Folpet pesticide Soil agricultural 134 3 75 00004
Chlorothalonil pesticide Soil agricultural 111 3 78 00019
Chromium metal Water
105 2 80 00020
Cyfluthrin pesticide Soil agricultural 85 2 82 00001
Isoproturon pesticide Soil agricultural 81 2 84 00086
Cypermethrin pesticide Soil agricultural 70 2 85 00010
Chromium metal Soil agricultural 51 1 87 00019
Prochloraz pesticide Soil agricultural 45 1 88 00024
Captan pesticide Soil agricultural 39 1 88 00039
Alachlor pesticide Soil agricultural 38 1 89 00041
Metolachlor pesticide Soil agricultural 30 1 90 00050
Among the non-characterized elementary flows in relation to freshwater ecotoxicity it
can be observed
it is not known to which extent some of the chemicals may contribute to the IC
a number unspecified chemicals such as lsquoTotal organic matterrsquo (TOC BOD
CODhellip) PAH VOC that could contribute significantly to the overall score Since
the quantity of those ElFl can change significantly between products a default CF
could be proposed for those flow
some chemicals are known to be contributing to toxicity like pesticides and
metals still there are significant proportions that are not characterized
33
Although it is not possible to conclude if those un-characterized flows would have
changed the total score significantly based on the mass and number of known-
contributing class of chemicals (metals and pesticides) it is highly recommended that a
quantification of the uncharacterized chemicals is reported for the freshwater toxicity
impact category before drawing final conclusions
523 Conclusions and recommendations
Results of the LCIA phase can be highly affected by the characterization model chosen
as shown in chapter 51 Furthermore the evaluation of uncharacterized elementary
flows is of primary importance to assess the completeness of the LCIA coverage of the
identified LCI flows Indeed a high number of elementary flows inventoried might be
non-characterized by the chosen models even if their relevance in the assessed impact
categories could be of primary importance Therefore it is highly recommended that a
quantification of the uncharacterized elementary flows is reported before any
interpretation or conclusion is performed on the superiority of one product versus
another
53 Normalization sensitivity analysis
As for the characterisation phase also the choice of the normalisation reference set can
highly influence results Castellani et al (2017) have done a sensitivity analysis based on
the case study of a basket of product on food (see paragraph 512 for further details)
The authors report that as an optional step normalisation and weighting could be
applied to characterized LCA results to support the identification of the most important
impact categories Given that several sets of normalisation and weighting are available
the authors tested some of them in addition to the ILCD baseline with the aim of
assessing the sensitivity of the results to the choice of particular geographical and
temporal reference systems (ie normalization using EU or global scales) as well as
perspectives (ie weighting) This was investigated by selecting 3 sets of ILCD-compliant
normalization references (Benini et al 2014 Benini et al 2015 Laurent et al 2013)
and 2 sets of CML-IA compliant normalization references (EU 25+3 year 2000 and
World year 2000 - Guineacutee et al 2002) -reported in Table 17 In this section the
findings of the authors regarding normalisation will be discussed while the findings on
weighting will be discussed in section 54
Table 17 Summary of normalization sets used in the sensitivity analysis in Castellani et al (2016)
ILCD Impact Category Unit EC-JRC EU27
(2010) per person
a
EC-JRC Global (2010 or 2013)
per personb
PROSUITE Global (2010 or
2000) per person
c
Climate change kg CO2 eq 922E+03 707E+03 810E+03
Ozone depletion kg CFC-11 eq 216E-02 122E-02 414E-02
Human toxicity cancer effects CTUh 369E-05 124E-05 542E-05
Human toxicity non-cancer effects CTUh 533E-04 155E-04 110E-03
Particulate matterRespiratory inorganics kg PM25 eq 380E+00 507E+00 276E+00
Ionizing radiation human health kBq U
235 eq (to
air) 113E+03 241E+02 133E+03
Photochemical ozone formation human health kg NMVOC eq 317E+01 453E+01 567E+01
Acidification mol H+ eq 473E+01 561E+01 496E+01
Eutrophication terrestrial mol N eq 176E+02 164E+02 115E+02
Eutrophication freshwater kg P eq 148E+00 654E+00 620E-01
Eutrophication marine kg N eq 169E+01 304E+01 938E+00
Land use kg C deficit 748E+04 520E+06 236E+05
Ecotoxicity freshwater CTUe 874E+03 374E+03 665E+02
Resource depletion water m3 water eq 814E+01 689E+01 297E+01
Resource depletion mineral fossils and renewables kg Sb eq 101E-01 193E-01 313E-01
34
An additional analysis was performed to verify which one between normalization and
weighting is the most sensitive step in the identification of the most relevant impact
categories The same weighting sets described before were applied on the results of
normalization obtained using the two ILCD-compliant global normalization reference sets
tested before namely EC-JRC Global (Benini et al 2015) and PROSUITE Global (Laurent
et al 2013)
The contribution of product groups (Table 18) and of impact categories (Table 19) to the
total normalized impact of the BoP nutrition per citizen were analyzed
Table 18 presents a summary of the sensitivity analysis on product group contribution at
the normalization stage comparing the product group hotspots according to ILCD and
CML-IA methods Values are expressed as percentage of the normalized value per citizen
for that product group with respect to the total normalized impact per citizen (total
impact of nutrition in one year for an average EU-27 citizen) Equal weighting among
impact categories is assumed Results at the normalization stage almost confirm the
hotspots identified at the characterization stage meat and dairy products are again
hotspots for all the methods whereas other products that emerged before are
considered less contributing at the normalization stage This means that those products
generate impacts in impact categories that are considered less relevant compared to the
others according to the normalization scheme adopted For instance beer appeared to
be a hotspot for both ILCD and CML-IA at the characterization stage whereas only CML-
IA method identifies it as a hotspot at the normalization stage This happens because the
CML-IA normalization references (EU 25+3 and World) for marine aquatic toxicity -one
of the impact categories for which beer is a hotspot - are relatively low compared to the
ones in other LCIA methods
Table 18 presents a summary of the results of the sensitivity analysis at the
normalization stage comparing the relevance of impact categories according to ILCD
and CML-IA methods Results refer to the entire BoP For each impact category of the
two methods values are expressed as percentage of the normalized value per citizen for
that impact category with respect to the total normalized impact per citizen
Table 18 Results of sensitivity analysis on normalization sets at the European and global scale for ILCD- and CML-IA methods (Castellani et al 2016) The percentages represent the contribution of each product group to the total impacts of the BoP per citizen (reference flow) Equal weighting of impact categories is applied The second column reports the mass of each product group in the basket A color scale is applied to the results in each column (ie product group) from green (lowest contribution) to red (highest contribution)
Quantity in the basket (kgyear)
Share of total BoP
mass
EC-JRC EU27 (2010)
EC-JRC Global (2010
or 2013)
PROSUITE Global (2010
or 2000)
CML EU 25+3 (2000)
CML World (2000)
Mineral water 1050 194 1 1 1 3 3
Beer 698 129 4 4 7 16 21
Coffee 47 06 2 1 5 5 6
Apple 161 30 0 0 1 1 1
Oranges 174 32 1 1 2 1 2
Potatoes 691 130 3 3 3 3 4
Bread 393 73 3 3 3 4 5
Olive oil 53 10 1 0 1 2 3
Sunflower oil 53 10 4 4 5 3 3
Sugar from beet 298 55 3 3 3 2 1
Milk 801 148 9 9 8 7 6
Cheese 150 28 15 16 13 10 9
Butter 36 07 7 8 6 3 2
Meat - beef 137 25 18 17 16 11 10
Meat - pork 410 76 20 20 19 18 13
Meat - poultry 220 42 8 8 8 10 7
Pre-prepared meal
29 05 1 1 1 2 2
35
100 100 100 100 100 100
Table 19 Results of sensitivity analysis on normalization sets at the European and global scale for ILCD and CML-IA methods (Castellani et al 2016) The percentages reflect the relative relevance of impact categories compared to the total impacts of the BoP per citizen (reference flow) A colour scale is applied to the results in each column (ie impact category) from green (lowest contribution) to red (highest contribution)
EC-JRC EU27 (2010)
EC-JRC Global (2010 or 2013)
PROSUITE Global (2010 or 2000)
CML EU 25+3 (2000)
CML World (2000)
Climate change 19 11 13
Global warming (GWP100a) 78 102
Ozone depletion 00 00 00 Ozone layer depletion 02 00
Human toxicity cancer effects
62 83 25
Human toxicity
59 120 Human toxicity non-cancer effects
446 692 127
Particulate matter 26 09 21 -
Ionizing radiation HH 05 11 03 -
Photochemical ozone formation
10 03 03 Photochemical ozone formation
46 21
Acidification 73 286 41 Acidification 272 201
Terrestrial eutrophication 83 40 75
Eutrophication
133 163
Freshwater eutrophication 34 04 48
Marine eutrophication 82 20 87
Freshwater ecotoxicity 58 61 450
Freshwater aquatic ecotoxicity 340 314
- - - -
Marine aquatic ecotoxicity
- - - - Terrestrial ecotoxicity
Land use 23 00 04 -
Water resource depletion 62 33 100 -
Mineral fossil amp ren resource depletion
18 04 04 Abiotic depletion 02 11
Abiotic depletion (fossil fuels) 68 67
100 100 100
100 100
531 Conclusions and recommendations
Different normalisation sets may produce different results in terms of identification of
most relevant impact categories life cycle stages and processes Different reference
systems refer to different situation which can all be valid depending eg on the
geographical scope of the study It is recommended to evaluate different normalisation
tests which fit the study at hand to support the conclusions drawn with the baseline
scenario or to provide additional insights
54 Weighting sensitivity analysis
Castellani et al (2016) investigated only for ILCD-compliant normalization sets in
addition to equal weighting 8 ILCD-compliant weighting sets (reported in Table 20) were
tested The different sets were selected aiming at covering several perspectives on
weighting namely distance to target for EU policies considering binding and non-
binding target at 2020 (Castellani et al 2017) a previous distance to target set (EDIP)
36
for Europe for 2005 (Stranddorf et al 2005) two sets considering planetary boundaries
(Tuomisto et al 2012 Bjoslashrn and Hauschild 20158) a set which gives relevance to
midpoint indicators based on their contribution to impact at the endpoint (Ponsioen and
Goedkoop 2015) a set resulting from the combination of different panel-based
approaches (Huppes et al 2012)
When needed available weighting sets have been adapted to ILCD impact categories
The majority of these weighting sets build on normalization factors that are specific of a
geographic scale Tuomisto et al (2012) calculated planetary boundaries at global scale
whereas and Bjoslashrn and Hauschild (2015) did it for both global and European scales
Huppes et al (2012) adopted a panel-based approach with no specific geographic
representativeness whereas all the other weighting sets used in this work have been
originally developed or adjusted for applications at the targeting the European scale
The use of EU27-consistent weighting sets in combination with global normalization
factors may lead to inconsistencies therefore the results have to be interpreted in the
light of this inconsistency In this work the normalized and weighted results are
calculated and presented anyway for all combinations so to show the effect of the
selection of weighting available for practitioners rather than focussing on the (in-
)consistency of their joint use with normalization factors The performed analysis
quantified the relative contribution by impact category to the overall impacts associated
with the BoP as well as the contribution by each of the products The effects of the
different weighting sets tested on the results of the BoP normalized to EC-JRC EU27
normalization references are presented in Table 21 and Table 22
Table 20 Summary of weighting sets used in the sensitivity analysis by Castellani et al (2016)
Distance to target Damage oriented Panel-
based
Policy targets Planetary boundaries Mid-to-
endpoint
Castellani et al 2016
WFsA
Castellani et al 2016
WFsB
EDIP 2003 (Stranddo
rf et al 2005)
Tuomisto et al 2012
Bjoslashrn amp Hauschild
- European
2015
Bjoslashrn amp Hauschi
ld ndash Global 2015
Ponsioen amp
Goedkoop 2016
Huppes et al 2012
ILCD Impact Category dimensionless ()
Climate change 71 54 2 10 25 26 44 232
Ozone depletion 64 49 87 8 1 2 0 36
Human toxicity cancer effects 69 52 2 na na na 1 65
Human toxicity non-cancer effects
62 47 2 na na na
4 41
Particulate matterRespiratory inorganics
74 56 na na na na
8 66
Ionizing radiation human health
61 46 na na na na
0 65
Photochemical ozone formation human health
78 59 2 na
34 48
0 54
Acidification 72 55 2 8 1 1 0 42
Eutrophication terrestrial 70 53 2 28 1 0 0 23
Eutrophication freshwater 62 47 1 7 9 2 0 23
Eutrophication marine 69 52 2 28 1 1 0 23
Land use 64 53 na 6 25 16 19 102
Ecotoxicity freshwater 61 51 0 na 2 0 0 109
Resource depletion water 61 296 na 5 1 4 3 51
Resource depletion mineral fossils and renewables
61 30 0 na na
na 19 69
8 Bjoslashrn and Hauschild provided to the authors of this report a modified version to be used as weighting method
in compliance with EU27 ILCD normalization factors Global weighting factors were calculated directly from global normalization factors published by Bjoslashrn and Hauschild 2015
37
The contribution of specific products to the overall impacts associated to the BoP
nutrition is very similar when using several weighting sets in combination with
normalization references EU27 (Table 21) In fact for all the weighting sets tested pork
meat and beef meat are the highest contributor to the impacts (varying between 15
and 22) According to all sets cheese is the 3rd largest contributor (14 on average)
whereas milk and poultry meat are most frequently identified as 4th and 5th largest
contributors (roughly 8 each) On average these product groups account for roughly
70 of the total impacts Apples olive oil and pre-prepared meals are those contributing
the less followed by mineral water and oranges On average their cumulative
contribution is around 5
Table 21 Product groups contribution Results of several ILCD-compliant weighting sets in combination with normalization references EU27 (Castellani et al 2016) A color scale is applied to the results in each column (ie product group) from green (lowest contribution) to red (highest contribution)
PRODUCT GROUPS CONTRIBUTION
Quantity in the basket (kgyear)
Share of total BoP mass
Equal
weighting
Castellani et al (2016) WFsA
Castellani et
al (2016) WFsB
EDIP2003
9
Tuomisto et
al (2012)
BjornampHausch
ild (2015)
ndash Europe
an
BjornampHausch
ild (2015)
ndash global
Ponsioen and
Goodkoep
(2016)
Huppes et al (2012)
Mineral water 105 1940 1 1 3 1 1 1 2 1 1
Beer 66 cL 698 1290 4 4 4 4 3 8 8 7 5
Coffee 47 060 2 2 2 1 2 6 5 3 2
Apple 161 300 0 0 1 0 0 1 1 1 1
Oranges 174 320 1 1 3 0 1 2 2 1 1
Potato 691 1300 3 3 4 3 2 3 3 4 3
Bread 393 730 3 3 3 4 3 3 3 3 3
Olive oil 53 100 1 1 1 0 1 1 1 1 1
Sunflower oil 53 100 4 4 4 4 3 4 4 4 4
Sugar from beet 298 550 3 3 4 3 4 2 3 3 3
Milk 801 1480 9 9 8 9 8 8 8 8 8
Cheese 15 280 15 15 16 15 13 12 13 14 14
Butter 36 070 7 7 6 8 6 5 5 7 7
Meat - beef 137 250 18 18 17 18 22 15 16 16 17
Meat - pork 41 760 20 20 16 21 21 19 17 18 19
Meat - poultry 22 420 8 8 7 8 9 8 8 8 8
Pre-prepared meal 29 050 1 1 1 1 1 1 1 1 1
100
100 100 100 100 100 100 100 100
100
9 (based on Stranddorf et al 2005)
38
Conversely the identification of the most relevant impact categories contributing to the
overall impact of the entire BoP nutrition presents huge discrepancies when applying
different weighting sets (Table 22) This is due to the intrinsic differences among the
weighting sets which build on different perspectives and attribute different weights to
the impact categories
Table 22 Relevance of the different impact category Results of the application of several ILCD-compliant weighting sets in combination with normalization references EU27 (Castellani et al 2016) A color scale is applied to the results in each column (ie impact category) from green (lowest contribution) to red (highest contribution)
CONTRIBUTION ANALYSIS
1-1-1
Castellani et al (2016) WFsA
Castellani et al (2016) WFsB
EDIP2003 (based on Stranddorf et al 2005)
Tuomisto et al (2012)
Bjoslashrn amp Hauschild (2015)
Bjoslashrn amp Hauschild (2015) - global
Ponsioen amp
Goedkoop (2015)
Huppes et al (2012)
Climate change 19 20 15 2 32 214 260 204 87
Ozone depletion 00 00 00 2 00 00 00 00 00
Human toxicity cancer effects
62 66 50 7 na na na 22 81
Human toxicity non-cancer effects
446
425 323 53 na na na 477 363
Particulate matterRespiratory inorganics
26 30 23 na na na na 51 34
Ionizing radiation human health
05 05 04 na na na na 00 07
Photochemical ozone formation human health
10 12 09 1 00 162 263 00 11
Acidification 73 81 61 9 101 47 42 03 61
Eutrophication terrestrial
83 89 67 10 379 31 18 00 39
Eutrophication freshwater
34 32 25 3 37 134 43 00 16
Eutrophication marine
82 87 66 11 374 55 44 00 38
Land use 23 22 19 na 23 257 188 106 46
Ecotoxicity freshwater
58 55 46 0 na 60 04 00 127
Resource depletion water
62 59 284 na 53 39 137 49 63
Resource depletion mineral fossils and renewables
18 17 09 0 na na na 86 25
TOTAL 100 100 100 100 100 100 100 100 100
The discrepancies in the results suggest that it is important to acknowledge that
different perspectives lead to different results Moreover it is relatively straightforward
to identify the product groups impacting the most as from Table 21 when keeping
constant normalization references although varying weighing sets
The authors also checked the most sensitive element between normalization and
weighting their findings indicate normalization as the most sensitive choice if compared
39
to the selection of a specific weighting set among those considered in their work
However this result may change in case weighting methods building on different
approaches are added to the ones included in their work Nevertheless the ranking of
products is not significantly affected by changing normalization reference (eg from
ILCD EU27 to ILCD Global ndash Laurent et al 2013) This might be due to few impact
categories driving the results regardless of the normalization and weighting methods
selected or to the fact that all impact categories are strongly correlated
541 Conclusions and recommendations Weighting sets are often dependent on different value choices to assign different weights
to all impact categories Therefore different weighting sets lead to significant differences
of the final conclusions It is recommended that the decision about inclusion of which
weighting set to use has been made and documented in the first scope definition and
shall not be changed later during the study
40
6 Estimation of uncertainty
Evaluation of the uncertainty of an LCA study is a step which involves both the LCI and
LCIA phase therefore it is strictly linked to the content of the previous chapters
Uncertainty in LCA can be defined in different ways (Ciroth et al 2016) For examples it
can be meant as describing the variability of the LCA data to determine the significance
of the indicator results being ldquothe estimated amount or percentage by which an
observed or calculated value may differ from the true valuerdquo (Skone 2000) ISO 14044
defines uncertainty analysis as systematic procedure to quantify the uncertainty
introduced in the results of a life cycle inventory analysis due to the cumulative effects of
model imprecision input uncertainty and data variability
The estimation of uncertainty serves three main purposes
it supports a better understanding of the results obtained
it supports the iterative improvement of an LCA study
it also helps the target audience to assess the robustness and applicability of the
study results
The PEF Guide identifies two key sources of uncertainty in PEF studies
1 Stochastic uncertainties for the inventory data
they refer to statistical descriptions of variance around a meanaverage For
normally distributed data this variance is typically described in terms of an
average and standard deviation
2 Choice-related uncertainties
They arise from methodological choices including modelling principles system
boundaries allocation choices choice of impact assessment methods and other
assumptions related to time technology geographical aspects etc These are not
amenable to statistical description but rather can only be characterized via
scenario model assessments
In this report we refer to uncertainty analysis to describe the range of likely outcomes
based on a set of inputs and it differs from a sensitivity analysis which is linked to how
sensitive the results are to a change in an input parameter (see previous chapters)
It has to be kept in mind that all steps involved in a quantitative process are affected by
uncertainties Therefore it is important that the uncertainty is assessed
- At inventory level (eg standard deviation associated to a data point) An
example on how to assess the uncertainty at inventory level was recently
provided by Ciroth et al (2016)
- At characterization level (eg linked to characterization factors)
- At normalisation level (eg linked to normalisation factors)
- At weighting level (eg linked to weighting factors)
611 Conclusions and recommendations It is recommended that the overall uncertainty of an LCA study is estimated and
reported in the final report It is also recommended to include an evaluation to which
extent the uncertainties identified affect the final conclusions
41
7 Meta-analysis
The widespread development of LCA in the last decades as a decision supporting tool
leads to a huge amount of LCA studies in literature concerning all kind of goods and
services (ldquoproductsrdquo) When trying to make sense of their results that sometimes are
very different or come up with a conclusion techniques to combine or re-analyze them
are needed such as meta-analysis
Zumsteg et al (2012) described the key factors for conducting and reporting systematic
reviews including meta-analyses10 in LCA Those key factors are simplified in a check
list 1 Review title keywords and abstract 2 Rationale for the review 3 Review
question and objectives 4 Description of review protocol 5 Findings and features of
the individual studies in the review 6 Assessment of bias 7 Synthesis methods
(qualitative and quantitative) 8 Limitations of the review and 9 Summary of findings
and conclusions
This chapter is not intended to give guidelines on how to perform a systematic review or
a meta-analysis but to highlight the critical points that the practitioner should take into
account when collecting and using the LCA data Recalling the check list previously
described it is in the findings and features of the individual studies where one of the
biggest shortcomings when performing a meta-analysis concerning LCA studies is found
Assembling data from the individual studies is complex due to
the existing ldquoflexiblerdquo guidance in conducting LCA that leads to different
assumptions and methodological choices made in the various LCA modelling
exercises The ISO 14040 and 14044 standards provide the framework for LCA
This framework however leaves the individual practitioner with a range of
choices which can affect the legitimacy of the results of an LCA study
the lack of homogeneity reporting LCA results
As found in De Matos et al (2015) while doing a meta-analysis of different bioeconomy
value chains the most influencing differences among studies mainly relate to
The definition of the system boundaries and the stages included in the
study (eg even if the same general system boundaries are considered -
eg cradle to gate - some studies may or may not include intermediate
transport construction and decommissioning of buildings etc)
The impact assessment methods used as different methods may
consider for example different substances for a given impact category
and different characterization factors for the same substance
The definition of the functional unit (eg as the input the output
product the agricultural land unit etc) (Cherubini and Stromman
2011)
The consideration of direct and indirect land use change (dLUC and iLUC
respectively) (Cherubini and Stromman 2011)
The technology considered in the process and its maturity level
The approach used to model the multifunctional system For instance if
substitution is used the reference system selected may have a
significant influence on the final LCA results On the other hand if
allocation is used the selection of the allocation criteria and the relative
10 The definition of Meta-analysis given by Zumsteg et al (2012) is ldquoA melding of data from multiple studies usually involving additional mathematical analysis with the goal of utilizing this synergy of information and data size to answer questions that cannot be answered by existing individual studies or to improve the certainty or impact of know findings by increasing the sample
size Meta-analyses are often performed as part of a systematic reviewrdquo
42
contribution of each co-product may considerably influence the results of
the assessment
These points are in line with those reported in other studies in literature Wolf et al
(2015) conducted a meta-analysis of LCAs for wood energy services (heat power and
combined heat and power (CHP)) and chose a set of ldquodecisive parametersrdquo to be
analyzed arguing that those factors promote inconsistent findings along LCA studies
Apart from the previously mentioned the authors include the following factors (some of
them specific of the good or service under study)
Data sources such as empirical data literature well-known databases
unspecified databases simulators or expert interviews are some of
them
Transportation distances and types
Feedstock properties (in this case wood)
Combustion capacity and efficiency and co-combustion rates
Energy service provided (power heat and CHP)
Schreiber et al (2012) performed a meta-analysis on LCA studies of electricity
generation with carbon capture and storage (CCS) comprising the three main CCS
technologies (post-combustion oxyfuel and pre-combustion) In line with previous
studies they highlighted the different choices in the LCA methodology and parameters
(specific of the good or service under study) that heavily impact the overall results Here
we report those which differ from the already mentioned
Data quality and availability
Time horizon as most studies considered present and future power
plants as far as 2050
Spatial representation ndash some elements in the CCS process chain are
highly site-specific such as storage sites
Life cycle inventory (LCI) ndash which inputs and outputs are considered
Operational valuation and weighting methods
Power plant efficiency and energy penalty of the capture process
Carbon dioxide capture efficiency and purity
Fuel origin and composition
Moreover when having a look at the limitations of the review and meta-analysis some
studies just focus on GHG emissions Wolf et al (2015) set the CML midpoint impact
category Global Warming as the basis for the comparison of results because it is
represented in 100 of the studies They did not consider other less-frequent impact
categories but yet important such as acidification eutrophication and particulate
matter owing to the lack of results published in the studies On the other hand
Schreiber et al (2012) not only focused on GHG but they included other impacts such
as acidification potential eutrophication potential photochemical ozone creation
potential and cumulative energy demand
As a conclusion increased harmonization and transparency in the calculation and
reporting of LCA data and results is needed (Cristobal et al 2015)
711 Conclusions and recommendations
The number of LCA studies available is increasing and making sense of all the results
that can be obtained from them is a difficult task As a conclusion increased
harmonization and transparency in the calculation of LCA data and results is needed It
is recommended that reporting of LCA data is done in a more consistent and harmonized
43
manner to allow users of LCA study a better understanding of the results and
conclusions drawn
8 Conclusion
One of the key aims of LCA is to provide the decision makers with comprehensive and
understandable information this task is achieved by a proper interpretation of the
results of an LCA study
This report builds on the requirements provided in relevant international standards (ISO
14044) and guides (ILCD Handbook (EC-JRC 2011a) PEF Guide (EC 2013b) and it
proposes a practical approach on how to perform a robust interpretation of an LCA
study It provides a ready-to-use approach for the identification of significant issues and
it includes examples of completeness sensitivity and consistency checks based on real-
case studies which are used to draw the attention of the reader on how to evaluate the
results of an LCA study
The scheme proposed in this report should not be intended as a comprehensive list of
items to check instead it should be seen as a normal workflow that should be carried
out by an LCA practitioner in order to derive robust conclusions out of the LCA study
More accurate and case-specific checks should be done depending on the intended goal
and scope of the study
The report is structured in order to allow a practitioner focus on the two quantitative
phases of LCA the life cycle inventory (LCI) and the life cycle impact assessment (LCIA)
Regarding the LCI the report goes through the analysis of the data sources by giving
examples on how to interpret the system boundaries and the foreground system) it
provides an overview on data quality and it comprises further completeness and
consistency checks (eg cut-off long term emissions anomaly checks)
When analysing the LCIA the report provides insights on sensitivity analysis regarding
characterization normalization and weighting When dealing with characterization the
attention of the reader is drawn also on mapping between the inventory and the
characterization models and a discussion on the evaluation of uncharacterized
elementary flows is also included
Finally an overarching topic such as meta-analysis was deemed useful to be included as
this is often used when there is the need of assessing the state of the art of the LCA
studies on a specific product supply chain Key messages stemming from this report are
as follows
Results reveal that the relative importance of one substance compared to another
changes with the characterization model This is because the models differ in the
substances that they include and in the CFs of each substance It is
recommended to run a sensitivity check with different characterization models to
evaluate the robustness of the conclusions drawn It is also recommended to
evaluate the theory underlying the characterization models chosen to evaluate a
certain impact category as this helps understanding the results obtained Results of the LCIA phase can be highly affected by the characterization model
chosen Furthermore the evaluation of uncharacterized elementary flows is of
primary importance to assess the completeness of the LCIA coverage of the
identified LCI flows Indeed a high number of elementary flows inventoried might
be non-characterized by the chosen models even if their relevance in the
assessed impact categories could be of primary importance Therefore it is highly
recommended that a quantification of the uncharacterized elementary flows is
reported before any interpretation or conclusion is performed on the superiority
of one product versus another Different normalisation sets may produce different results in terms of
identification of most relevant impact categories life cycle stages and processes
Different reference systems refer to different situation which can all be valid
44
depending eg on the geographical scope of the study It is recommended to
evaluate different normalisation tests which fit the study at hand to support the
conclusions drawn with the baseline scenario or to provide additional insights Weighting sets are often dependent on different value choices to assign different
weights to all impact categories Therefore different weighting sets lead to
significant differences of the final conclusions It is recommended that the
decision about inclusion of which weighting set to use has been made and
documented in the first scope definition and shall not be changed later during the
study It is recommended that the overall uncertainty of an LCA study is estimated and
reported in the final report It is also recommended to include an evaluation to
which extent the uncertainties identified affect the final conclusions The number of LCA studies available is increasing and making sense of all the
results that can be obtained from them is a difficult task As a conclusion
increased harmonization and transparency in the calculation of LCA data and
results is needed It is recommended that reporting of LCA data is done in a more
consistent and harmonized manner to allow users of LCA study a better
understanding of the results and conclusions drawn Further aspects such as the appropriateness of the functional unit the intended goal
the system boundaries and value choices should normally be part of an interpretation in
order to identify recommendations and limitations of the study and draw the appropriate
conclusions They are not discussed further in this report but it is recommended that at
least each decision based on a personal or a stakeholderrsquos value shall always be
documented and explained in the conclusions of the LCA study This is consistent with
one of the key aims of LCA which is to provide the decision makers with comprehensive
and understandable information
45
References
Baitz M Makishi Colodel C Kupfer T Florin J Schuller O Kokborg M Koumlhler A
Thylmann D Stof-fregen A Schoumlll S Goumlrke J Rudolf M Gonzalez M (2016) GaBi
Database amp Modelling Principles Thinkstep Leinfelden-Echterdingen
Benini L Mancini L Sala S Manfredi S Schau EM Pant R (2014) Normalization
method and data for Environmental Footprints European Commission Joint
Research Center Institute for Environment and Sustainability Publications Office
of the European Union Luxemburg ISBN 978-92-79-40847-2
Benini L Sala S Pant R (2015) Global normalization factors for ILCD compliant
midpoint impact categories - EC-JRC internal draft report Set of factors available
at httpeplcajrceceuropaeuuploadsTable_ILCD_NFs_08-03-2016xlsx
Biganzoli L Falbo A Forte F Rigamonti L Grosso M (2015) Mass balance and life
cycle assessment of waste electrical and electronic equipment management
system implemented in Lombardia Region (Italy) Science of the Total
Environment 524ndash525 361-375
Bjoslashrn A Hauschild MZ (2015) Introducing carrying capacity-based normalization
in LCA framework and development of references at midpoint level The
International Journal of Life Cycle Assessment 20 (7)1005ndash1018
Blonk Agri-footprint BV (2014) Agri-footprint Methodology and basic principles -
Version 10
Brentrup F Kusters J Lammel J Kuhlmann H (2000) Methods to estimate on-
field nitrogen emissions from crop production as an input to LCA studies in the
agricultural sector The International Journal of Life Cycle Assessment 5 349ndash
357
Castellani V Benini L Sala S Pant R (2016) A distance-to-target weighting
method for Europe 2020 The International Journal of Life Cycle Assessment
21(8)1159-1169
Castellani V Sala S Benini L (2017) Hotspots analysis and critical interpretation
of food life cycle assessment studies for selecting eco-innovation options and for
policy support Journal of Cleaner Production 140 (2) 556-568
Cellura M Longo S Mistretta M (2011) Sensitivity analysis to quantify
uncertainty in life cycle assessment the case study of an Italian tile Renew Sust
Energ Rev 15(9)4697-4705
Cherubini F Stromman AH (2011) Life cycle assessment of bioenergy
systems state of the art and future challenges Bioresource technology 102 437
ndash 451
Ciroth A Muller S Weidema B Lesage P (2016) Empirically based uncertainty
factors for the pedigree matrix in ecoinvent The International Journal of Life
Cycle Assessment 21 1338-1348
CML (2002) CML-IA model and characterisation factors Available from
httpswwwuniversiteitleidennlenresearchresearch-outputsciencecml-ia-
characterisation-factors Accessed November 2015
Colomb V Ait-Amar S Basset-Mens C Dolleacute JB Koch P Lellahi A Mousset J
Salou T Tailleur A van der Werf HMG (2015) AGRIBALYSE Assessment and
lessons for the future Version 12
Corrado S Zampori L Castellani V Sala S (2017) Systematic analysis of
secondary Life Cycle Inventories when modelling agricultural production a case
study for arable crops Journal of Cleaner Production (under review)
46
Cristobal J De Matos CT Aurambout JP Manfredi S Kavalov B (2015)
Environmental sustainability assessment of bioeconomy value chains Biomass
and bioenergy 89 159 ndash 171
De Matos CT Cristobal J Aurambout JP (2015) Environmental sustainability
assessment of bioeconomy products and processes ndash progress report 1 European
Commission Report EUR 27356 EN
De Schryver A Galatola M (2016) Guidance for modelling agricultural processes
TAB Issue paper v 01 October 2016
Dewulf J Benini L Mancini L Sala S Blengini G A Ardente F Recchioni M Maes
J Pant R Pennington D (2015) Rethinking the Area of Protection lsquoNatural
Resourcesrsquo in Life Cycle Assessmen Environmental Science and Technology 49
(9)5310ndash5317
Dong Y Gandhi N Hauschild MZ (2014) Development of Comparative Toxicity
Potentials of 14 cationic metals in freshwater Chemosphere 112 26-33
Ecoinvent (2016) Allocation cut-off by classification [WWW Document] URL
httpwwwecoinventorgdatabasesystem-models-in-ecoinvent-3cut-off-
system-modelallocation-cut-off-by-classificationhtml (accessed 8916)
European Commission ndash Joint Research Centre (EC-JRC) (2011a) ILCD Handbook
ndash General guide for life cycle assessment ndash Detailed guidance European
Commission Joint Research Centre Institute for Environment and Sustainability
European Commission ndash Joint Research Centre (EC-JRC) (2011b) ILCD Handbook
- Recommendations for Life Cycle Impact Assessment in the European context
European Commission Joint Research Centre Institute for Environment and
Sustainability
European Commission (EC) (2013a) Communication from the Commission to the
EU Parliament and Council ndash Building the Single Market for Green Products ndash
Facilitating better information on the environmental performance of products and
organisations(20130196final)
European Commission (2013b) Commission Recommendation of 9 April 2013 on
the use of common methods to measure and communicate the life cycle
environmental performance of products and organisations (2013179EU) Official
Journal of the European Union Volume 56 4 May 2013
European Commission (2015)ndash Better Regulation Toolbox
httpeceuropaeusmart-regulationguidelinesdocsbr_toolbox_enpdf
European Commission (2016) Product Environmental Footprint Pilot Guidance -
Guidance for the implementation of the EU Product Environmental Footprint (PEF)
during the Environmental Footprint (EF) pilot phase - version 52 (pp 95)
Retrieved from
httpeceuropaeuenvironmenteussdsmgppdfGuidance_productspdf
FAO (2012) FAOstat Agriculture data Food and Agriculture Organization of the
United Nations httpfaostatfaoorg
Gaudreault C Samson R Stuart P (2009) Implications of choices and
interpretation in LCA for multi-criteria process design de-inked pulp capacity and
cogeneration at a paper mill case study J Clean Prod 17(17)1535-1546
Giampietro M Saltelli A (2014) Footprints to nowhere Ecological Indicators 46
610-621
Goedkoop M Heijungs R Huijbregts M de Schryver A Struijs J van Zelm R
(2009) ReCiPe 2008 A life cycle assessment method which comprises
harmonized category indicators at the midpoint and the endpoint level Report I
47
Characterisation Ministry of Housing Spatial Planning and Environment
Amsterdam
Guineacutee JB Gorreacutee M Heijungs R Huppes G Kleijn R de Koning A van Oers L
Wegener Sleeswijk A Suh S Udo de Haes HA de Bruijn H van Duin R
Huijbregts MAJ (2002) Handbook on life cycle assessment Operational guide to
the ISO standards I LCA in perspective IIa Guide IIb Operational annex III
Scientific background Kluwer Academic Publishers ISBN 1-4020-0228-9
Dordrecht 2002 692 pp
Guo M Murphy RJ (2012) LCA data quality sensitivity and uncertainty analysis
Science of the total environment 435230-243
Hauschild MZ Wenzel H (1998) Environmental Assessment of Products Vol 2 ndash
Scientific background Chapman amp Hall UK Kluwer Academic Publishers
Hingham USA
Heijungs R Kleijn R (2001) Numerical approaches towards life cycle
interpretation five examples The International Journal of Life Cycle Assessment
6(3)141-148
Hellweg S Mila i Canals L (2014) Emerging approaches challenges and
opportunities in life cycle assessment Science 344(6188) 1109-1113
Huang Y Spray A Parry T (2013) Sensitivity analysis of methodological choices
in road pavement LCA The International Journal of Life Cycle Assessment
18(1)93-101
Huijbregts MAJ Hellweg S Hertwich E (2011) Do we need a paradigm shift in life
cycle impact assessment Environmental Science and Techonology 45 (9)
38333834
Huijbregts MAJ (1999) Life-cycle impact assessment of acidifying and eutrophying
air pollutants Calculation of equivalency factors with RAINS-LCA Report available
at httpmedialeidenunivnllegacyLife-cycle20impact20assessmentpdf
(accessed April 2016)
Huppes G Van Oers L Pretato U Pennington DW (2012) Weighting
environmental effects Analytic survey with operational evaluation methods and a
meta-method The International Journal of Life Cycle Assessment 17 876ndash891
James K Galatola M (2015) Screening and hotspot analysis procedure to
identify the hotspots and the most relevant contributions (in terms of impact
categories life cycle stages processes and flows) Version 40 24 April 2015
Retrieved from
httpswebgateeceuropaeufpfiswikisdisplayEUENVFPEU+Environmental+F
ootprint+Pilot+Phase accessed November 2016
ISO 14040 (2006a) Environmental managementmdashlife cycle assessmentmdash
principles and framework Geneva Switzerland
ISO 14044 (2006b) ndash Environmental management ndash Life Cycle assessment ndash
Requirements and guidelines
Laurent A Hauschild M Z Golsteijn L Simas M Fontes J Wood R (2013)
Deliverable 52 Normalisation factors for environmental economic and socio-
economic indicators Report prepared within the 7th Framework programme
Project PROSUITE Available at httpwwwprosuiteorgwebguestpublic-
deliverables (accessed December 2015)
Lee SJ Hawkins TR Ingwersen WW Young DM (2014) Exploring the Use of
Ecological Footprint in Life Cycle Impact Assessment Findings from a Comparison
of Transportation Fuels Journal of Industrial ecology 19(3) 416ndash426
48
Mancini L Benini L Sala S (2015) Resource footprint of Europe complementarity
of Material Flow Analysis and Life Cycle Assessment for policy support
Environmental Science and Policy 54367ndash376
Mancini L Benini L Sala S (2016) Characterization of raw materials based on
supply risk indicators for Europe The International Journal of Life Cycle
Assessment 1-13 doi101007s11367-016-1137-2
Nemecek T Baumgartner D (2006) Concerted Action GL-Pro WP4
Environmental Analysis - Final report - Deliverable 43 Available at
httpwwwagroscopeadminchpublikationeneinzelpublikationindexhtmllang
=enampaid=23328amppid=23604
Notarnicola B Sala S Antoacuten A McLaren SJ Saouter E Sonesson U (2017a) The
role of life cycle assessment in supporting sustainable agri-food systems a
review of the challenges Journal of Cleaner Production 140(2)399-409
doi101016jjclepro201606071
Notarnicola B Tassielli G Renzulli PA Castellani V Sala S (2017b) Environmental
impact of food consumption in Europe Journal of Cleaner Production 140(2)
753-765 doi101016jjclepro201606080
Pizzol M Christensen P Schmidt J Thomsen M (2011) Impacts of ldquometalsrdquo on
human health a comparison between nine different methodologies for Life Cycle
Impact Assessment (LCIA) Journal of Cleaner Production 19(6) 646-656
Pizzol M Laurent A Sala S Weidema B Verones F Koffler C (2016)
Normalisation and weighting in life cycle assessment Quo Vadis The
International Journal of LCA 1-14 doi 101007s11367-016-1199-1
Prado-Lopez V Seager TP Chester M Laurin L Bernardo M Tylock S (2014)
Stochastic multi-attribute analysis (SMAA) as an interpretation method for
comparative life-cycle assessment (LCA) Int J Life Cycle Ass 19(2)405-416
Pregrave Consultants (2015) SimaPro Database Manual - Methods library available at
httpswwwpre-sustainabilitycomsimapro-database-and-methods-library
(accessed February 2016)
Ponsioen TC Goedkoop MJ (2016) Midpoint weighting based on endpoint
information Submitted to The International Journal of Life Cycle Assessment
Rigamonti L Falbo A Zampori L Sala S (2017) Supporting a transition towards
sustainable circular economy sensitivity analysis for the interpretation of LCA for
the recovery of electric and electronic waste The International Journal of Life
Cycle Assessment 1-10 doi 101007s11367-016-1231-5
Rosenbaum RK Bachmann TM Gold LS Huijbregts MAJ Jolliet O Juraske R
Koehler A Larsen FH MacLeod M Margni M McKone TE Payet J Schuhmacher
M van de Meent D Hauschild MZ (2008) USEtoxmdashthe UNEP-SETAC toxicity
model recommended characterisation factors for human toxicity and freshwater
ecotoxicity in life cycle impact assessment The International Journal of Life Cycle
Assessment 13(7) 532-546
Sala S Wolf MA Pant R (2012) Characterization factors of the ILCD
Recommended Life Cycle Impact Assessment methods Database and Supporting
Information First edition EUR25167EN ISBN 978-92-79-22727 Luxembourg
Publications Office of the European Union Available at
httpeplcajrceceuropaeuuploads201401LCIA-characterization-factors-of-
the-ILCDpdf
Schau EM Davidsson B (2015) Product Environmental Footprint (PEF) Category
Rules (PEFCR) Pilot Intermediate Paper Product First Draft PEFCR July
2015Accessible for registered stakeholders at
49
httpswebgateeceuropaeufpfiswikisdisplayEUENVFPStakeholder+workspa
ce3A+PEFCR+pilot+Intermediate+paper+product
Schau EM Fet AM (2008) LCA studies of food products as background for
environmental product declarations The International Journal of Life Cycle
Assessment 13(3) 255-264
Schneider L Berger M Finkbeiner M (2011) The anthropogenic stock extended
abiotic depletion potential (AADP) as new parameterization to model the depletion
of resources The International Journal of Life Cycle Assessment 16(9) 929-936
Schneider L Berger M Finkbeiner M (2015) Abiotic resource depletion in LCAmdash
background and update of the anthropogenic stock extended abiotic depletion
potential (AADP) model The International Journal of Life Cycle Assessment
20(5) 709-721
Schreiber A Zapp P and Marx J (2012) Meta-Analysis of Life Cycle Assessment
Studies on Electricity Generation with Carbon Capture and Storage Journal of
Industrial Ecology 16 S155ndashS168
Seppaumllauml J Posch M Johansson M Hettelingh JP (2006) Country-dependent
Characterisation Factors for Acidification and Terrestrial Eutrophication Based on
Accumulated Exceedance as an Impact Category Indicator The International
Journal of Life Cycle Assessment 11(6) 403-416
Skone TJ (2000) What is Life Cycle Interpretation Environmental Progress 19
(2) 92-100
Steen BA (1999) A systematic approach to environmental priority strategies in
product life development (EPS) Version 2000 ndash Models and data of the default
method Chalmers University LindholmenJohanneberg
Stranddorf HK Hoffmann L Schmidt A (2005) Update on Impact Categories
Normalisation and Weighting in LCA - Selected EDIP97-data Environmental
Project Nr 995 Miljoslashprojekt httpwww2mstdkudgivPublications200587-
7614-570-0pdf87-7614-571-9PDF (accessed December 2015)
Tuomisto HL Hodge ID Riordan P Macdonald DW (2012) Exploring a safe
operating approach to weighting in life cycle impact assessment ndash a case study of
organic conventional and integrated farming systems Journal of Cleaner
Production 37147-153
UNEP- SETAC (2016) Hotspots Analysis an Overarching Methodological
Framework Draft document developed for UNEPSETAC Life Cycle Initiative -3
Flagship Project 3a (Phase 2) 11 october 2016 Available at
httpwwwwraporgukcontentprinciples-and-practices-hotspot-analysis
Van Hoof G Vieira M Gausman M Weisbrod A (2013) Indicator selection in life
cycle assessment to enable decision making issues and solutions International
Journal of Life Cycle Assessment 181568-1580
Van Zelm R Huijbregts M A van de Meent D (2009) USES-LCA 20mdasha global
nested multi-media fate exposure and effects model The International Journal
of Life Cycle Assessment 14(3) 282-284
Wackernagel M Monfreda C Moran D Wermer P Goldfinger S Deumling D
Murray M (2005) ―National Footprint and Biocapacity Accounts 2005 The
underlying calculation method Global Footprint Network Oakland California
USA
Weidema B Bauer C Hischier R Mutel C Nemecek T Reinhard J Vadenbo CO
Wernet G (2013) Overview and methodology Data quality guideline for the
ecoinvent database version 3
50
Williams ED Weber CL Hawkins TR (2009) Hybrid Framework for Managing
Uncertainty in Life Cycle Inventories Journal of Industrial Ecology 13 928ndash944
Wolf C Klein D Weber-Blaschke G Richter K (2015) Systematic review and
meta-analysis of life cycle assessment for wood energy services Journal of
Industrial Ecology 20 743 ndash 763
Zumsteg JM Cooper JS Noon MS (2012) Systematic Review Checklist Journal of
Industrial Ecology 16 S12ndashS21
51
List of abbreviations and definitions
AOX adsorbable organic halogens
BOD biochemical oxygen demand
BTEX benzene toluene xylene isomers
CFs characterisation factors
COD chemical oxygen demand
DQR data quality requirements
EcF ecological footprint
EF environmental footprint
ElFl elementary flow
HMs heavy metals
IC impact category
ILCD International Reference Life Cycle Data System
LCA life cycle assessment
LCI life cycle inventory
LCIA life cycle impact assessment
OEFSR organisation environmental footprint sector rules
PAH polycyclic aromatic hydrocarbons
PEF product environmental footprint
PEFCR product environmental footprint sector rules
PPP plant protection products
OEF organisation environmental footprint
TAB technical advisory board
TS technical secretariat
UNEPSETAC LCI Unep Setac Life cycle Initiative
VOC volatile organic compounds
WEEE waste electrical and electronic equipment
52
List of figures
Figure 1 Practical application of requirements in ISO 14044 and ILCD Handbook to
interpret LCI and LCIA results 5
Figure 2 Hotspot analysis in the context of the Environmental Footprint pilot (James amp
Galatola 2015) 8
Figure 3 Contribution analysis for the resource- related indicator calculated adopting
several characterization models (Rigamonti et al 2017) 27
53
List of tables
Table 1 Summary of requirements to define most relevant contributions and hotspots
(James amp Galatola 2015) 11
Table 2 Selection of most relevant Impact Categories (James amp Galatola 2015) 12
Table 3 Selection of most relevant life cycle stages (James amp Galatola 2015) 13
Table 4 Selection of most relevant processes (James amp Galatola 2015) 13
Table 5 Inventory results (climate change results expressed in gCOeq) (James amp
Galatola 2015) 14
Table 6 Most relevant inventory flows contributing to climate change (based on the
inventory results before normalisation and weighting) - overall life cycle (option 1)
(James amp Galatola 2015) 14
Table 7 Most relevant inventory flows contributing to climate change (based on the
inventory results before normalisation and weighting) ndash process level (option 2) (James
amp Galatola 2015) 14
Table 8 Hotspots based on 50 cumulative contribution (OPTION A) (James amp Galatola
2015) 15
Table 9 Hotspots based on top two representatives (OPTION B) (James amp Galatola
2015) 15
Table 10 Underlying assumptions in relation to the three databases considered by the
authors (Corrado et al 2017) 17
Table 11 Data quality rating in an example of intermediate paper products (EC 2013
Schau and Davidsson 2015) 20
Table 12 Data quality rating in an early phase of a PEF study of intermediate packaging
paper 21
Table 13 Example of check of inventoried elementary flows that are not characterized by
two impact assessment methods (based on Castellani et al 2017) 29
Table 14 List of impact categories listed in ILCD with total number of elementary flows
contributing to each IC 30
Table 15 Type of chemicals (mass and number of EFs) not characterized per emission
compartment (air oxygen and hydrogen have been excluded) 31
Table 16 Most relevant elementary flows contributing cumulatively up to 90 to the
freshwater ecotoxicity impact category with USEtox 32
Table 17 Summary of normalization sets used in the sensitivity analysis in Castellani et
al (2016) 33
Table 18 Results of sensitivity analysis on normalization sets at the European and global
scale for ILCD- and CML-IA methods (Castellani et al 2016) The percentages
represent the contribution of each product group to the total impacts of the BoP per
citizen (reference flow) Equal weighting of impact categories is applied The second
column reports the mass of each product group in the basket A color scale is applied to
the results in each column (ie product group) from green (lowest contribution) to red
(highest contribution) 34
Table 19 Results of sensitivity analysis on normalization sets at the European and global
scale for ILCD and CML-IA methods (Castellani et al 2016) The percentages reflect
the relative relevance of impact categories compared to the total impacts of the BoP per
citizen (reference flow) A colour scale is applied to the results in each column (ie
impact category) from green (lowest contribution) to red (highest contribution) 35
54
Table 20 Summary of weighting sets used in the sensitivity analysis by Castellani et al
(2016) 36
Table 21 Product groups contribution Results of several ILCD-compliant weighting sets
in combination with normalization references EU27 (Castellani et al 2016) A color scale
is applied to the results in each column (ie product group) from green (lowest
contribution) to red (highest contribution) 37
Table 22 Relevance of the different impact category Results of the application of several
ILCD-compliant weighting sets in combination with normalization references EU27
(Castellani et al 2016) A color scale is applied to the results in each column (ie
impact category) from green (lowest contribution) to red (highest contribution) 38
Europe Direct is a service to help you find answers
to your questions about the European Union
Freephone number ()
00 800 6 7 8 9 10 11 () The information given is free as are most calls (though some operators phone boxes or hotels may
charge you)
More information on the European Union is available on the internet (httpeuropaeu)
HOW TO OBTAIN EU PUBLICATIONS
Free publications
bull one copy
via EU Bookshop (httpbookshopeuropaeu)
bull more than one copy or postersmaps
from the European Unionrsquos representations (httpeceuropaeurepresent_enhtm) from the delegations in non-EU countries (httpeeaseuropaeudelegationsindex_enhtm) by contacting the Europe Direct service (httpeuropaeueuropedirectindex_enhtm) or calling 00 800 6 7 8 9 10 11 (freephone number from anywhere in the EU) () () The information given is free as are most calls (though some operators phone boxes or hotels may charge you)
Priced publications
bull via EU Bookshop (httpbookshopeuropaeu)
XX-N
A-x
xxxx-E
N-N
doi102788171315
ISBN 978-92-79-64114-5
LB-N
A-2
8266-E
N-N

3
choices and assumptions therefore they recommend careful interpretation of results to
improve the quality of the outcome (ie improve the decision-making process) This
view is shared by authors such as Prado Lopez et al (2014) who have identified the lack
of robust methods of interpretation to support decision makers hence they provide a
novel approach based on a multi-criteria decision analytic method (stochastic multi-
attribute analysis for life-cycle impact assessment (SMAA-LCIA)) which in their view
should support both interpretation of results and policymakers Van Hoof et al (2013)
explained how normalization helps maintain a multi-indicator approach while keeping the
most relevant indicators allowing effective decision making Finally other authors such
as Cellura et al (2011) and Huang et al (2013) performed LCA of specific products and
they pointed out the relevance of sensitivity analysis to strengthen the reliability of the
results obtained and draw conclusions to support sector specific guidelines A structured
approach covering the LCIA phase has been proposed (Castellani et al 2017)
highlighting the importance of a systematic sensitivity analysis of impact assessment
models normalization and weighting set Regarding normalisation and weighting steps
which are optional according to ISO standards a recent overview of approaches
strengths and limitations has been provided in the context of activities of the
UNEPSETAC Life Cycle Initiative (UNEPSETAC LCI) by Pizzol et al (2016)
The objective of this technical report is to provide guidance on how to perform an
interpretation of LCI and LCIA results based on what are the meaningful aspects to be
taken into account common to the majority of LCA studies
This technical report aims to be a practical document to be used by LCA practitioners as
a checklist of the main aspects to consider when interpreting LCI and LCIA results
Therefore this report makes extensive use of examples based on real case studies that
may help critically assess LCA results ensuring a reliable decision- and policy-making
support
A general framework on how to perform a proper interpretation is presented in chapter
2 the key aspects will be discussed further on in the report using case studies as an
example to guide the reader and the practitioner through ldquoreal liferdquo applications
Chapter 3 focuses on the identification of significant issues namely the main
contributors to the LCIA results (ie hotspots most relevant impact categories life cycle
stages processes and elementary flows)
Chapter 4 and 5 focus on the evaluations (sensitivity completeness and consistency
checks) in relation to the LCI and LCIA phases respectively Regarding the LCI the
report goes through the analysis of the data sources by giving examples on how to
interpret the system boundaries and the foreground system) it provides an overview on
data quality and it comprises further completeness and consistency checks (eg cut-off
long term emissions anomaly checks) When analysing the LCIA the report provides
insights on sensitivity analysis regarding characterization normalization and weighting
When dealing with characterization the attention of the reader is drawn also on issues
such as the mapping between the inventory and the characterization models and the
evaluation of uncharacterized elementary flows
Chapter 6 and 7 deal with overarching topics such as estimation of uncertainty of the
results of LCA study and meta-analysis
4
2 A practical scheme to interpret LCI and LCIA results
The initial step of the interpretation phase is to review information from the first three
phases of the LCA process such as the ones used to build the study goals and scope
quality assurance procedures reporting requirements results assumptions external
involvement (eg stakeholders peer reviews) (Skone 2000)
Both ISO 14044 and the ILCD Handbook (EC-JRC 2011a) propose a scheme with the
elements to be considered in the interpretation phase and their relation to the other
phases of the LCA study
The elements can be grouped in
identification of significant issues (based on the results of the LCI and LCIA
phases)
the purpose of this first element of interpretation is to analyse and structure the
results of earlier phases of the LCILCA study in order to identify the significant
issues There are two interrelated aspects of significant issues i) firstly there are
the main contributors to the LCIA results ie most relevant life cycle stages
processes and elementary flows and most relevant impact categories ii)
secondly there are the main choices that have the potential to influence the
precision of the final results of the LCA These can be methodological choices
assumptions foreground and background data used for deriving the process
inventories LCIA methods used for the impact assessment as well as the
optionally used normalisation and weighting factors
evaluation that considers completeness sensitivity and consistency checks
Completeness checks on the inventory are performed in order to determine the
degree to which it is complete and whether the cut-off criteria have been met
Sensitivity checks have the purpose to assess the reliability of the final results
and of the conclusions and recommendations of the LCA study The consistency
check is performed to investigate whether the assumptions methods and data
have been applied consistently throughout the LCILCA study
conclusions limitations and recommendations
Integrating the outcome of the other elements of the interpretation phase and
drawing on the main findings from the earlier phases of the LCA the final
element of the interpretation is to draw conclusions and identify limitations of the
LCA and to develop recommendations for the intended audience in accordance
with the goal definition and the intended applications of the results
In this report a schematic workflow representing a practical approach to interpret LCI
and LCIA results is proposed in Fig1 building on both ISO 14044 (ch 4511) and the
ILCD Handbook (ch 91) (EC-JRC 2011a) The workflow is to be seen as an iterative
approach to finally draw robust conclusions and recommendations
The scheme should not be seen as substituting the approaches of the ISO 14044 and the
ILCD Handbook instead it should be seen as a practical application of the requirements
laid down in these documents
Furthermore the scheme should not be intended as a comprehensive list of items to
check instead it should be seen as a normal workflow that should be carried out by an
LCA practitioner in order to derive robust conclusions out of the LCA study More
accurate and case-specific checks should be done depending on the intended goal and
scope of the study
Further aspects such as the appropriateness of the functional unit the intended goal
the system boundaries and value choices should normally be part of an interpretation in
order to identify recommendations and limitations of the study and draw the appropriate
conclusions They are not discussed further in this report but it is recommended that at
5
least each decision based on a personal or a stakeholderrsquos value shall always be
documented and explained in the conclusions of the LCA study This is consistent with
one of the key aims of LCA which is to provide the decision makers with comprehensive
and understandable information in a transparent manner
Figure 1 Practical application of requirements in ISO 14044 and ILCD Handbook to interpret LCI and LCIA results
6
3 Identification of key issues Hotspots analysis
In order to get started with interpretation of results it is necessary to identify what the
key issues are Once the key issues are identified it is possible to further evaluate the
overall robustness of the LCA study by using for example completeness consistency and
sensitivity checks
This chapter on hotspot analysis gives an overview of the overarching methodological
framework of hotspot analysis as currently developing with the UNEPSETAC Life Cycle
Initiative - Flagship Project 3a and the hotspot analysis as tested in the Environmental
Footprint (EF) pilot phase (2013 ndash 2017) In the first case hotspot analysis is regarded
as a subject on its own in the second case it is shown a practical way to perform a
hotspot analysis in an environmental footprinting context in the EU Environmental
Footprint it is more focused on the interpretation of the screening study results of the
average or representative product1 The hotspots in a EU Environmental Footprint may
be but does not have to found in a contribution analysis of the characterized results
Therefore in this chapter we first describe the hotspot analysis as outlaid in the
UNEPSETAC LCI and then the hotspot analysis as performed in the EF pilot phase
31 The hotspot analysis in the UNEPSETAC Life Cycle Initiative
The UNEPSETAC Life Cycle Initiative has been running a Flagship project (nr 3a) on
hotspot analysis since 2012 until 2017 According to UNEPSETAC (2016) the benefits
of hotspots analysis include ensuring
Focus on priority issues (eg waste water materials of concern)
Focus on the right life cycle stage (eg material acquisition manufacturing use
end of life)
Focus on the right actors (eg producers manufactures suppliers retailers
customers) to evaluate influence and implement solutions
Implications of trade-offs are understood
Resources (eg time money) can be effectively allocated to actions
Previously there was not currently a common global approach to hotspots analysis nor
has there been sufficient effort to bring together or share best practice amongst those
organisations or initiatives currently developing and using these methods Nor was there
any accepted guidance on how to translate and apply the results of hotspots analysis
into meaningful sustainability information and insight for use by industry governments
and other stakeholders Therefore the UNEP SETAC Life Cycle Initiative established a
new Flagship Project to address these and other issues The objectives of the
UNEPSETAC LCI Flagship Project 3 are to produce
1 A common methodological framework and global guidance for sustainability hotspots analysis
2 A protocol for the appropriate use and communication of sustainability information derived from hotspots analysis
3 To evaluate and if possible implement a range of options to bring together the findings from existing hotspots studies to provide a richer global picture of sustainability hotspots in the economy and society
Phase 1 was finished in December 2014 and gives an overview of different tools and
methods that can be used in the hotspot analysis This includes 42 hotspots analysis
1 In the context of the EF pilot phase within each Product Environmental Footprint Category Rule
(PEFCR) pilot a ldquorepresentative productrdquo has to be defined which is representing gt50 of the European market The PEF screening study is a PEF study conducted on the representative product one of the aims of the screening study is to identify the hotspots most relevant
elementary flows processes and life cycle stages
7
methodologies divided into product sector and national scale of application Of these 21
methodologies (4 at the national-level 5 at the sector-level and 12 predominantly
applied at the product category-level) were shortlisted and further analysed Examples
of methods are EU EIPRO and Global Protocol for Community Scale GHG emissions on
the national level GHG Protocol Corporate Value Chain (Scope 3) Accounting and
Reporting Standard and Sustainability Accounting Standards Board Materiality Maptrade on
the sector level and French Grenelle I and II BPX 30-323-0 Product Lifecycle
Environmental Impact Quantification Guidance Standard and Water Quality Association
(WQA) Hotspots Analysis on the product level Please refer to Figure ES 2 in (Barthel et
al 2014) for the complete list
This first phase of the project fed into the second phase of the Flagship project
Phase 2 is running from January 2015 ndash January 2017 and produces the methodological
framework (UNEPSETAC 2016) and the communication guidance2 These are currently
in a six-weeks public consultation (27 Oct ndash 15 Dec 2016) The framework provides
a recognized set of guiding principles and practices for hotspots analysis
a globally agreed methodological framework for hotspots analysis
agreement on the appropriate use and communication of product sustainability
information derived from hotspots analysis
Future step will be to work with hotspot analysis for cities and regions and road testing
of the methodological framework
32 The hotspot analysis in the Environmental Footprint pilot
phase (2013 ndash 2017)
The 2013-2017 Environmental Footprint (EF) pilot phase has three main objectives
test the process for developing product- and sector-specific rules
test different approaches to verification
test communication vehicles for communicating life cycle environmental
performance to business partners consumers and other company stakeholders
This is tested by groups of organisations called Technical Secretariats (TS) who
volunteered to develop the rules for their product or sector
The hotspot analysis as described below were tested and developed in an iterative way
on the approximatively 25 pilots participating in the EF pilot phase to develop Product
Environmental Footprint (PEF) Category Rules (PEFCR) or Organisation Environmental
Footprint (OEF) Sector Rules (OEFSR)
A hotspot analysis is required for the PEFOEF screening studies of the average or
representative product for the PEFCROEFSR and for the supporting studies3 (EF study of
a single productorganisation belonging to the product categorysector) when developing
PEFCROEFSR (PEFCR Guidance document (EC 2016))
The hotspot analysis in the EF context aims to identify the hotspots the most relevant
impact categories life cycle stages processes and elementary flows as shown in Fig 2
and it provides a guidance on how to do that
2 Communicating hotspots The effective use of sustainability information to drive action and improve
performance from httpwwwwraporguksitesfileswrapHotspots20Communications20Guidelines20v35207Oct2016pptx 3 The EF supporting studies are PEFOEF studies run by single companies with the aim of testing the draft
PEFCRs and OEFSRs
8
Figure 2 Hotspot analysis in the context of the Environmental Footprint pilot (James amp Galatola 2015)
As shown in the figure the hotspots (and thereby also the hotspot analysis) is important
for the decision on which life cycle stages processes and elementary flows that are
hotspots (gt 50 contribution) and which are relevant (gt 80 contribution)
The hotspots might serve the purpose of warning an organisation about the area where
they should focus their attention in order to improve the environmental performance of a
product (PEF) or an organisation (OEF) Whilst traditionally LCA practitioners are
expected to provide primarysite-specific data for processes taking place in the
foreground and secondary data for processes taking place in the background in PEFOEF
the implementation of the materiality principle leads to a different approach The
processes most contributing to the final results (in terms of environmental impacts or
savings) are those for which the best quality of data should be provided For the
processes less relevant it is possible to use data of lower quality
321 Procedure to identify the most relevant impact categories Starting from the normalised and weighted results of PEF screening study each
Technical Secretariat is asked to select the impact categories that they consider more
relevant in terms of communication purposesrdquo
322 Procedure to identify the most relevant life cycle stages
The proposed guideline by the PEFCR Guidance (EC 2016) is to consider as relevant all
life cycle stages which together contribute over 80 (before normalisation and
weighting) to any of the baseline impact categories This should start from the largest to
the smallest contributions In addition more life cycle stages can be added to the list of
the most relevant ones
In order to guarantee a minimum level of harmonisation among different
PEFCRsOEFSRs a list of default life cycle stages was identified
Raw material acquisition and pre-processing (including production of parts and
unspecific components)
9
Production of the main product4
Product distribution and storage
Use stage scenario (if in scope)
End-of-life (including product part reuse recovery recycling if in scope)
323 Procedure to identify the most relevant processes
Each impact category shall be investigated to identify the most relevant processes The
identification of the most relevant processes shall be done at the whole life cycle level
Similaridentical processes taking place in different life cycle stages (eg transportation)
shall be accounted separately
In the context of the EF pilot phase processes were defined as most relevant where they
collectively contributed at least 80 to any impact category before normalisation and
weighting
In some instances vertically aggregated datasets may be identified as representing
relevant processes It may not be obvious which process within an aggregated dataset
is responsible for contributing to an impact category The metadata accompanying the
data should be reviewed and used to identify relevant processes If this is not possible it
can be decided whether to seek further disaggregated data or to treat the aggregated
dataset as a process for the purposes of identifying relevance5
324 Procedure to identify the most relevant elementary flows
As far as the most relevant elementary flows is concerned they are the ones contributing
cumulatively more than 80 to the impact category It can be decided whether this is
calculated at the level of overall life cycle and or single (most relevant) process level
All elementary flows contributing more than 5 to the impact category shall be
considered as relevant
Once the most relevant elementary flows have been identified they shall be linked to the
processes emitting them
325 Procedure to identify the hotspots
A hotspot can be identified at different levels of granularity impact category life cycle
stage process or elementary flow
In the context of PEFOEF pilot phase a hotspot is defined as either (James and Galatola
2015)
OPTION A (1) life cycle stages (2) processes and (3) elementary flows
cumulatively contributing at least 50 to any impact category before
normalisation and weighting (from the most contributing in descending order)
OPTION B At least the two most relevant life cycle stages processes and at least
two elementary flows (minimum 6) Additional hotspots may be identified by the
TS
4 If it is not possible to differentiate between the production of the main product and ancillary materials and
other life cycle stages eg raw material acquisition and transport then these life cycle stages can be merged Adequate justifications shall be provided in the screening report and be highlighted in the consultation phase If an aggregated life cycle stageprocess is most relevant it implies that all the processes included will be classified as most relevant 5 In this last case if an aggregated dataset is relevant everything in it is automatically relevant
10
326 Dealing with negative numbers
When identifying the percentage contribution from any process or flow it is important
that absolute values are used (ie the minus sign is ignored) in calculating percentage
contributions This allows indentifying the relevance of any credits
327 Specific instructions about aggregating elementary flows
The toxicity-related impact categories (ldquoHuman toxicity cancer effectsrdquo ldquoHuman
toxicity non-cancer effectsrdquo and ldquoFreshwater ecotoxicityrdquo) contain long lists of
characterization factors specified on the elementary flow category level 3 (also known
as sub-compartment ndash for example urban air freshwater agricultural soil) The impact
category ldquoParticulate matterrdquo also contains characterization factors at the level 3
category
It is recommended to aggregate the elementary flows on the level 2 category (ie
emissions to air water soil) in the contribution analysis This is to make the analysis
more manageable and because the level 3 category does not give additional information
when analyzing on the process level (the processes already contain information on the
location type of the emissions)
It is important to model foreground data on the level 3 category for particulates and
toxic substance flows because the characterization factors can deviate considerably
Metal resource flows are not specified per origin of ore type in the source files of the
ILCD recommended methods However in several background databases metal
resource flows are differentiated (for example Silver Ag 46E-5 Au 13E-4 in ore
Silver Ag 42E-3 Au 11E-4 in ore Silver Ag 21E-4 Au 21E-4 in ore etc)
Therefore the specified flows were added to the ILCD method in LCA software packages
with the same characterization factors as for the unspecified metals When doing a
contribution analysis of the metal resource flows it is therefore recommended to
aggregate the flows per metal (silver copper nickel etc)
There are 5 different fossil fuel related resource flows specified in the source files of the
ILCD recommended methods (brown coal 119 MJkg crude oil 423 MJkg hard coal
263 MJkg natural gas 441 MJkg peat 84 MJkg) However in several background
databases fossil resource flows are specified with different calorific values (for example
Gas natural 468 MJ per kg Gas natural 366 MJ per m3 Gas natural 35 MJ per m3
Gas natural 303 MJ per kg etc) Therefore the specified flows were added to the
ILCD method in LCA software packages with characterization factors related to the
factors in the original source taking the different calorific value into account When
doing a contribution analysis of the fossil resource flows it is therefore recommended to
aggregate the flows based on the 5 original flows (brown coal crude oil hard coal
natural gas and peat)
328 Conclusions
In table 1 the requirements to define most relevant contributions during the EF pilot
phase are summarized as found in the PEFCR Guidance (EC 2016)
11
Table 1 Summary of requirements to define most relevant contributions and hotspots (James amp Galatola 2015)
Item At what level does relevance need to be identified
Threshold
Most relevant impact categories In the final results starting from normalized and weighted results but deviations possible if justified
No threshold Decision left to TS but subject to stakeholder consultation and TAB opinion
Most relevant life cycle stages For each impact category before normalization and weighting Not relevant for data needs identification
All life cycle stages contributing cumulatively more than 80 to any impact category
Hotspots For each impact category before normalization and weighting
Either (i) life cycle stages processes and elementary flows cumulatively contributing at least 50 to any impact category or
(ii) at least the two most relevant impact categories life cycle stages processes and at least two elementary flows (minimum 6) Additional hotspots may be identified by the TS
Most relevant processes For each impact category before normalization and weighting Essential for data needs identification
All processes contributing cumulatively more than 80 to any impact category
Most relevant elementary flows For each impact category before normalization and weighting Essential for data needs identification
All elementary flows contributing cumulatively more than 80 to any impact category and in any case all those contributing more than 5 individually
When assessing what is most relevant it is also recommended to check if what is
identified as being non-relevant can be actually considered as such A practical example
is given at paragraph 431
12
329 Example to identify most relevant contributions and hotspots
The PEFCR Guidance (2016) also provided an example on how to perform a hotspot
analysis and the identification of most relevant impact categories life cycle stages
processes and elementary flows The example is reported here it is a fictitious example
not based on any specific PEF study results
3291 Example most relevant Impact Categories
Table 2 shows the contribution of different impact categories based on normalised and
weighted results
Table 2 Selection of most relevant Impact Categories (James amp Galatola 2015)
Impact category Unit Contribution ()
Climate change kg CO2 eq 215
Ozone depletion kg CFC-11 eq 30
Human toxicity cancer effects CTUh 83
Human toxicity non-cancer effects CTUh 149
Particulate matter kg PM25 eq 01
Ionizing radiation human health Kbq U235 eq 05
Photochemical ozone formation kg NMVOC eq 24
Acidification molc H+ eq 15
Terrestrial eutrophication molc N eq 10
Freshwater eutrophication kg P eq 10
Marine eutrophication kg N eq 01
Freshwater ecotoxicity CTUe 01
Land use kg deficit 143
Water resource depletion m3 water eq 186
Mineral fossil resource depletion kg Sb eq 127
Based on the normalised and weighted results the TS can decide that the following
impact categories are relevant for communication purposes climate change water
depletion and land use Where there is deviation from the most significant contributors
to the normalised and equally weighted results justification shall be provided
Once the relevant impact categories for communication purposes have been selected
the TS shall start identifying the most relevant life cycle stage processes and flows per
each impact category (all baseline EF impact categories not only those relevant for
communication purposes)
13
3292 Example most relevant Life Cycle Stages
Table 3 shows the contribution of different life cycle stages to the climate change impact
category (based on the characterised inventory results before normalisation and
weighting)
Table 3 Selection of most relevant life cycle stages (James amp Galatola 2015)
Life cycle stage Contribution ()
Raw material acquisition and pre-processing 421
Production of the main product 252
Product distribution and storage 164
Use stage (if in scope) 108
End-of-life 55
The three life cycle stages in purple will be the ones identified as most relevant for
climate change as they are contributing to more than 80 This procedure shall be
repeated for all the baseline EF impact categories
3293 Example most relevant Processes
Table 4 shows the contribution of different processes to the climate change impact
category (based on the characterised inventory results before normalisation and
weighting)
Table 4 Selection of most relevant processes (James amp Galatola 2015)
Unit process Contribution ()
Process A 89
Process B 614
Process C 234
Process D 28
Process E 15
Process F 09
Other processes 09
According to the proposed procedure the processes in orange shall be selected as ldquomost
relevantrdquo Process E could be added to the as most relevant ones based on specific
considerations (eg it is under operational control it is of relevance for the specific
sector etc) This procedure shall be repeated for all the baseline EF impact categories
3294 Example most relevant Elementary Flows
Considering that the selection of the most relevant elementary flows can be done at
overall life cycle level (option 1) andor per relevant process (option 2) there are two
14
possible outcomes Starting from the inventory results provided in Table 5 the list of
most relevant flows are highlighted in blue in Table 6 (at overall life cycle) and Table 7
(at process level)
Table 5 Inventory results (climate change results expressed in gCOeq) (James amp Galatola 2015)
Inventory flow Substance 1 Substance 2 Substance 3 Substance 4 Substance 5 Total
Process A 249 85 6 45 5 390
Process B 1100 600 500 450 50 2700
Process C 300 250 20 30 430 1030
Process D 60 30 20 10 5 125
Process E 64 1 1 1 1 68
Process F 15 10 8 5 3 41
Other processes 15 10 8 5 3 41
Total 1803 986 563 546 497 4395
Table 6 Most relevant inventory flows contributing to climate change (based on the inventory results before normalisation and weighting) - overall life cycle (option 1) (James amp Galatola 2015)
Inventory flow Substance 1 Substance 2 Substance 3 Substance 4 Substance 5 Total
Process A 57 19 01 10 01 89
Process B 250 137 114 102 11 614
Process C 68 57 05 07 98 234
Process D 14 07 05 02 01 28
Process E 15 00 00 00 00 15
Process F 03 02 02 01 01 09
Other processes 03 02 02 01 01 09
Total 410 224 128 124 113
Table 7 Most relevant inventory flows contributing to climate change (based on the inventory results before normalisation and weighting) ndash process level (option 2) (James amp Galatola 2015)
Inventory flow Substance 1 Substance 2 Substance 3 Substance 4 Substance 5 Total
Process A 64 22 2 12 1 100
Process B 41 22 19 17 2 100
Process C 29 24 2 3 42 100
15
Process D 48 24 16 8 4 100
Process E 94 1 1 1 1 100
Process F 37 24 20 12 7 100
Other processes 37 24 20 12 7 100
3295 Example hotspots
In Tables 8 and 9 the identified hotspots - based on the two different approaches
available- are presented
Table 8 Hotspots based on 50 cumulative contribution (OPTION A) (James amp Galatola 2015)
Hotspots
Life cycle stages Raw material acquisition and pre-processing
Production of the main product
Processes Process B
Elementary flows Option 1 Substance 1 and 2
Option 2
Substance 1 and 2 in processes B
Substance 1 and 5 in process C
Substance 1 in process E
Table 9 Hotspots based on top two representatives (OPTION B) (James amp Galatola 2015)
Hotspots
Life cycle stages Raw material acquisition and pre-processing
Production of the main product
Processes Process B
Process C
Elementary flows Option 1 Substance 1 and 2 in process B
Option 2 Substance 1 in process E6 and substance 5 in process C
4 Interpretation on Life Cycle Inventory (LCI) level
During the life cycle inventory phase the actual data collection and modelling of the
system has to be done in line with the goal definition and aiming at meeting the
requirements derived in the scope phase The LCI results are the input to the
subsequent Life Cycle Impact Assessment (LCIA) phase
Interpretation involves evaluations at the level of Life Cycle Inventory in order to
improve the inventory model to meet the needs derived from the study goal
perform a sensitivity analysis to check for limitations in the appropriateness of
the life cycle inventory work
6 Choosing the hotspots based on option B-2 might lead to anomalies (like in this fictitious
example) where an elementary flow is identified as hotspot even if its absolute value is not
prominent
16
understanding the underlying assumptions when secondary datasets are used in
the model
combining the above points to refine the LCA model
draw appropriate and robust conclusions
Key aspects to evaluate life cycle inventories are the consistency and completeness
thereof They can be evaluated taking into account different aspects A sensitivity check
to evaluate the reliability of the results is also a needed step
A first aspect to be taken into account is the data source Primary data are collected
directly by the company performing the study thus the consistency of the data used
with the goal and scope of the study should be more straightforward However when
and LCA study is making use of secondary datasets to model the background system a
careful analysis of the consistency of these datasets with the primary data collected and
in relation with the goal and scope shall be made
Indeed different modelling assumptions in datasets aimed at representing the same
product system can lead to different results affecting the reliability of the LCA study
(Williams et al 2009) An example of the relevance of different data sources and
consistency has been discussed in Corrado et al (2017) this study focuses on different
data sources to originate the inventory of arable crops (1 kg of wheat) The choice of the
secondary dataset can have a relevant influence on LCA results and it is considered
among the challenges for a robust LCA (Notarnicola et al 2017a)
A second aspect to be taken into account regarding life cycle inventories is the quality of
the data used regarding time geographical and technological representativeness
precision methodological compliance and documentation Therefore in this chapter a
paragraph is dedicated to analyzing more in detail this aspect
A third relevant aspect in relation to LCIs is the consistency and completeness in relation
to single aspects such as cut-off inclusionexclusion of specific elementary flows (eg
long term emissions) It is not straightforward to judge if an inventory can be considered
complete As a general rule it has always to be kept in mind that the inventory has to
be checked in its completeness in relation to the goal and scope of the study for
example if the goal of the study is to assess only the climate change impact category
the completeness of the inventory shall be evaluated against those emissions that are
actually contributing to climate change within the system boundaries It does not lead to
improved conclusions the compilation of a more detailed inventory with the inclusion of
eg substances that do not contribute to climate change
41 Analysis of data sources
When selecting secondary data sets it is important to ensure that all data sets used in
the modelling of the system model are methodologically consistent (ie consistency
check) The use of inconsistent data can lead to an unreliable and distorted LCA study
often with wrong conclusion and recommendations drawn Furthermore use of datasets
with different level of completeness (ie completeness checks) may also lead to
unreliable conclusions
The study from Corrado et al (2017) is used as a case study to highlight the relevance
of different data sources in an LCA study Therefore the content of this paragraph is
mainly based on this paper The paper is organized as follows firstly the authors report
an overview of the system boundaries and underlying assumptions adopted in building
secondary datasets for arable crops within three databases Secondly they summarise
the approaches adopted to model the foreground system highlighting analogies and
differences Afterwards they point out the influence that modelling approaches can have
on the impact assessment Finally the combination of these elements allowed to derive
some considerations on relevant elements of datasets
17
It is focused on the analysis of secondary datasets for arable crops production as
modelled in three databases adopted as source of secondary data in LCA Agribalyse v
12 (Colomb et al 2015) Agrifootprint v 10 (Blonk Agri-footprint BV 2014) and
Ecoinvent v 31 (Weidema et al 2013) For simplicity in the remainder of the report
they are named Agribalyse Agrifootprint and Ecoinvent respectively
The authors performed three types of analysis
comparison of the system boundaries and underlying assumptions
analysis of how the foreground system is modelled in each dataset focusing on
different aspects such as fertilisers application and nutrient fate plant
protection products application and fate heavy metals (HMs) input mass balance
and fate irrigation agricultural operations land occupation and transformation
comparison of the results of the life cycle impact assessment for the foreground
system including the relative contribution of background
411 Analysis of the system boundaries
The system boundaries and the main underlying assumptions adopted to model arable
crops production in the three databases are reported in Table 10
Table 10 Underlying assumptions in relation to the three databases considered by the authors (Corrado et al 2017)
Agribalyse Agrifootprint Ecoinvent
Data source Provided by technical institutes (eg ARVALIS ndash Institut du Veacutegeacutetal)
Different sources (eg
scientific literature official
statistics such as FAOstat
Eurostat)
GL-Pro project ndash Barrois
region (Nemecek and
Baumgartner 2006)
Straw management (when
applicable)
Partly removed from the
field
Totally removed from the
field
Left on the field
Allocation of co-products
(grains and straw)
Not applied because the
straw market was not very
structured at the time when
the datasets were developed
Economic mass and energy
allocation
Not applicable because
straw is assumed to be left
on the field
Nutrients from straw left
on the field
The fertilising effect of crop
residues and emissions from
the residues are allocated to
the crop that generated the
residues
Not applicable The fertilising effects of crop
residues are allocated to the
crop that generated it (only
for P and K) The amount of
fertilisers is corrected for the
amount of nutrients in crop
residues
Crop
rotation
modelling
Phosphorou
s (P) and
potassium
(K) inputs
and
emissions
allocation
P and K fertilisers production
and emissions due to their
application are allocated to
each crop pro rata for the
crop exports
Not reported The amount of P and K of the
residues supplied to the field
through residues were
allocated to the crop that
generates them
18
N inputs and
emissions
allocation
The organic nitrogen
available for the crop to
which the fertiliser is
applied is allocated to that
crop The remaining fraction
that contributes to
increasing the stock of
organic matter was allocated
to all the crops in the
rotation Mineral nitrogen is
completely allocated to the
crop to which it was applied
Not reported Allocation not performed
412 Foreground system analysis
The authors compared the activities modelled in the foreground system of the datasets
referring to seven field activities agricultural operations fertilisers application and
nutrients environmental fate plant protection products (PPP) application and related
environmental fate heavy metals (HMs) input and related environmental fate irrigation
and land occupation and transformation The average crop yields reported in the dataset
presents small differences (wheat min-max barley min-max rapeseed min-max pea
min-max) The 95 confidence interval of the yields is defined only in Agrifootprint
datasets whereas it is not reported in Agribalyse and Ecoinvent datasets
For completeness findings and aspects to be taken into account are below reported The
below checklist can also be used to build a completeness check of the different datasets
and it can be used to build a sensitivity analysis based on the parameters that are seen
to be affecting the final results
Agricultural practices modelling
Management of agricultural residues
Composition of the crop rotation
Allocation to the co-products
Agricultural operations modelling
Number of operations
Number of passages
Machine power
Soil texture
Airborne emissions due to fuel combustion
Emissions of heavy metals due to tires abrasion
Fertilisers application and nutrients fate modelling
The nutrients fate is highly influenced by site-specific conditions
o environmental conditions
o soil type
o agricultural management practices
o type of fertiliser (Brentrup et al 2000)
o spatial differentiated emissions when modelling agricultural systems
Nomenclature (eg the paper shows that phosphorus compounds emissions were
expressed in the datasets with different flows limiting the possibility of making a
comparison among inventory data)
PPP application and environmental fate modelling
19
application method
weather and soil conditions
crop characteristics
irrigation
active substances whose use is not anymore authorised
Heavy metals inputs and environmental fate modelling
Mass balance
Fate
Irrigation modelling
Irrigation volumes
Water flows type
Environmental conditions
Spatially-differentiated water flows
Land use transformation modelling
Amounts of transformed land are considered
Type of land transformed (eg from hellip to hellip)
CO2 emissions due to land transformation
42 Data quality
As data is essential in all quantitative studies like LCAs so is also their quality
Therefore the data applied in the life cycle inventory phase shall be assessed in the
interpretation phase against the goal and scope of the study is the data quality
sufficient for the goal of the study Is the data consistent Can the data be seen as
complete
If the answer is yes then the interpretation can be preceded and conclusions drawn If
no then either the goal and scope need to be adjusted or probably in most cases
better the life cycle inventory phase need to be revisited in an iterative manner to
improve the data quality to the appropriate level The assessment of the data quality is a
mandatory reporting element in the interpretation phase
ISO 14044 (2006) defines data quality as characteristics of data that relate to their
ability to satisfy stated requirements The data quality requirements are described in
the goal and scope of the LCA study and covers the following 10 aspects (ISO14044
2006 ch 4236)
1) time-related coverage age of data and the minimum length of time over which
data should be collected
2) geographical coverage geographical area from which data for unit processes
should be collected to satisfy the goal of the study
3) technology coverage specific technology or technology mix
4) precision measure of the variability of the data values for each data expressed
(eg variance)
5) completeness percentage of flow that is measured or estimated
6) representativeness qualitative assessment of the degree to which the data set
reflects the true population of interest (ie geographical coverage time period
and technology coverage)
7) consistency qualitative assessment of whether the study methodology is applied
uniformly to the various components of the analysis
20
8) reproducibility qualitative assessment of the extent to which information about
the methodology and data values would allow an independent practitioner to
reproduce the results reported in the study
9) sources of the data
10) uncertainty of the information (eg data models and assumptions)
In the EF methods7 the consistency and reproducibility is one of the main aims of any
EF study and not evaluated as part of the data quality assessment Data sources should
be ILCDEF compliant and specified if a PEFCROEFSR is followed Precision and
uncertainty are evaluated together in the EF method Therefore the EF operates with six
semi qualitative data quality requirements instead of 9 in ISO14044 (cf section 56 in
European Commission 2013)
In order to evaluate the appropriateness and the quality of the data used to compile the
LCI they have to be scored against certain requirements As an example the table below
(Table 11) provides the data quality requirements for a PEF study of intermediate paper
products (EC 2013a Schau and Davidsson 2015)
The table 12 shows the semi-qualitative data quality rating (DQR) (based on expert
judgement) of the most impacting processes in an early phase of a PEF study of
intermediate packaging paper The data set DE Potato starch at plant was deemed to
be of too low quality (DQR = 267) as it scored poor (4) on Parameter uncertainty and
Methodological Appropriateness and Consistency to be used for comparative assertion
Therefore another dataset was searched for that was compliant with the goal and scope
of the study
It is also recommended that the practitioner is aware of the methodological choices used
to build the datasets (may be evaluated under Methodological Appropriateness and
Consistency) such as the definition of the system boundaries between nature and
technosphere and the time-horizons of the emissions (short-termlong term)
System boundaries between nature and technosphere are especially relevant for food
and agricultural product (and products made thereof) as for these products the
technosphere is closely interlinked with nature (Schau et al 2008) This includes
modelling of pesticides and fertilizers (De Schryver and Galatola 2016)
The time-horizons of the emissions are essential especially for long lived product and for
end-of-life processes (eg landfilling waste handling of residues from mining in raw
material extraction) (Guo and Murphy 2012) Also how radioactive waste is modelled is
essential to assess with a time horizon in mind Often a distinction is made between
long term and short term emission Where the boundary is set between those (100
years 300 years 50 000 years etc) can therefore be important and should be taken
into account when assessing the data quality for methodological appropriateness and
consistency (see chapter 433)
Database providers publish their modelling principle (see eg Baitz et al 2016) which is
an essential source for evaluating and assessing the data quality (of background data) in
addition to the metadata of the LCI data itself
Table 11 Data quality rating in an example of intermediate paper products (EC 2013 Schau and Davidsson 2015)
7 In the EF Guide the term representativenessrdquo is used instead of coveragerdquo used in ISO 14044 for the
geographical and time-related data quality requirement The term ldquoparameter uncertaintyrdquo is used instead of ldquoprecisionrdquo used in ISO14044 and the term ldquomethodological appropriateness and consistencyrdquo is used in the EF Guide instead of ldquoconsistencyrdquo used in ISO14044
21
Data quality elements
Representativeness
Qu
alit
y level
Qu
alit
y r
atin
g
Defin
itio
n
Tech
no
log
ica
l
Ge
og
rap
hic
al
Tim
e-r
ela
ted
Com
ple
ten
ess
Meth
od
olo
gic
al
Ap
pro
priate
ness a
nd
Co
nsis
tency
Pa
ram
ete
r u
nce
rta
inty
Very good
1
Meets the criterion to a very high degree without need for improvement
Eg Process is same For electricity from grid average technology as country- specific consumption mix
Country specific data
le 3 years old data
Very good completeness (ge 90 )
Full compliance with all requirements of the PEF guide
Very low uncertainty (le 7 )
Good
2
Meets the criterion to a high degree with little significant need for improvement
Eg average technology as country- specific consumption mix
Central Europe North Europe representative EU 27 mix
3-5 years old data
Good completeness (80 to 90 )
Attributional Process based approach AND following three method requirements of the PEF guide met (1) Dealing with multi-functionality (2) End of life modelling (3) System boundary
Low uncertainty (7 to 10 )
Fair 3
Meets the criterion to an acceptable degree but merits improvement
Eg average technology as country- specific production mix or average technology as average EU consumption mix
EU-27 countries other European country
5-10 years old data
Fair completeness (70 to 80 )
Attribution Process based approach AND two of the following three method requirements of the PEF guide met (1) Dealing with multi-functionality (2) End of life modelling (3) System boundary
Fair uncertainty (10 to 15 )
Poor
4
Does not meet the criterion to a sufficient degree but rather requires improvement
Eg average technology as country- specific consumption mix of a group of similar products
Middle east North-America Japan etc
10-15 years old data
Poor completeness (50 to 70 )
Attributional Process based approach AND one of the following three method requirements of the PEF guide met (1) Dealing with multi-functionality (2) End of life modelling (3) System boundary
High uncertainty (15 to 25 )
Very poor
5
Does not meet the criterion Substantial improvement is necessary
Eg other process or unknown not available (na)
Global data or unknown
ge 15 years old data
Very poor or unknown completeness (lt 50 )
Attributional Process based approach BUT None of the following three method requirements of the PEF guide met (1) Dealing with multi-functionality (2) End of life modelling (3) System boundary
Very high uncertainty (gt25 )
Table 12 Data quality rating in an early phase of a PEF study of intermediate packaging paper
22
Representativeness
Data set
Tech
no
logi
cal
Ge
ogr
aph
ical
Tim
e-r
ela
ted
Co
mp
lete
ne
ss
Par
ame
ter
un
cert
ain
ty
Me
tho
do
logi
cal
Ap
pro
pri
ate
ne
ss a
nd
Co
nsi
ste
ncy
Resulting Data Quality Rating (DQR)
CH building hall steel construction 1 3 3 1 3 4 250
CH disposal sludge from pulp and paper production 25 water to sanitary landfill 1 3 3 1 3 4 250
CH disposal steel 0 water to municipal incineration 1 3 3 1 3 4 250
DE lignite briquettes at plant 1 3 3 1 3 4 250
DE maize starch at plant 1 3 3 1 3 4 250
DE potato starch at plant 1 3 3 1 4 4 267
RER AKD sizer in paper production at plant 1 2 3 1 3 4 233
RER aluminium sulphate powder at plant 1 2 3 1 3 4 233
RER building multi-storey 1 2 3 1 3 4 233
RER electricity medium voltage production RER at grid 1 2 2 1 3 3 200
RER facilities chemical production 1 2 3 1 3 4 233
RER heavy fuel oil at regional storage 1 2 3 1 3 4 233
RER heavy fuel oil burned in industrial furnace 1MW non-modulating ltu-sogt 1 2 3 4 3 4 283
RER industrial wood hardwood under bark u=80 at forest road 1 2 3 1 3 4 233
RER industrial wood softwood under bark u=140 at forest road 1 2 3 1 3 4 233
RER natural gas high pressure at consumer 1 2 3 1 3 4 233
RER paper mill integrated ltu-sogt 1 2 3 1 3 4 233
RER PEFEmissions-RF ltu-sogt 1 2 3 3 3 3 250
RER PEFEmissions-VF v03 ltu-sogt 1 2 2 2 4 3 233
RER sodium chlorate powder at plant 1 2 3 1 3 4 233
RER sodium dithionite anhydrous at plant 1 2 3 1 3 4 233
RER sodium hydroxide 50 in H2O production mix at plant 1 2 3 1 3 4 233
RER steel converter chromium steel 188 at plant 1 2 3 1 3 4 233
RER steel electric chromium steel 188 at plant 1 2 3 1 3 4 233
RER sulphate pulp ECF bleached at plant 1 2 3 1 3 4 233
RER sulphate pulp unbleached at plant 1 2 3 1 3 4 233
RER sulphuric acid liquid at plant 1 2 3 1 3 4 233
RER transport freight rail 1 2 3 1 3 4 233
RER transport lorry gt16t fleet average 1 2 3 1 3 4 233
RER Water Withdrawals-VF ltu-sogt 1 1 2 1 3 3 183
23
43 Further completeness and consistency checks
In this section some further checks are presented referring both to completeness and
consistency checks
431 Anomaly assessment An anomaly assessment can be done where based on previous experience unusual or
surprising deviations from expected or normal results are observed and examined for
relevance (Skone 2000)
As a practical example it can be considered the case of LCA studies of mining activities
When the production of eg copper concentrates was assessed adopting an impact
assessment method such as ILCD and performing the hotspot analysis as described in
chapter 3 of this report it was found that the identification of most relevant impact
categories did not include Resource Depletion fossil mineral In addition the most
relevant processes and life cycle stages contributing to this impact category were not
related to the ones involved in the copper extraction In the case under analysis it was
found that elementary flows related to extraction of resources from nature were missing
from the inventory because the dataset used in the analysis did not include in its goal
and scope the assessment of Resource Depletion fossil mineral
A learning was that it is true that it is important to evaluate what is most relevant (eg
impact categories life cycle stages processes elementary flows) however it is also
important to check if what is found as being non-relevant can be actually considered as
such Hence it is important to evaluate if the LCI modelled is complete with regard to
the impact categories that the assessor wants to evaluate
432 Cut-off ISO 14044 identifies cut-off as the ldquospecification of the amount of material or energy
flow or the level of environmental significance associated with unit processes or product
system to be excluded from a studyrdquo ISO 14044 also requires that the effect on the
outcome of the study of the cut-off criteria selected shall be assessed and described in
the final report
Cut-off criteria can be based on
Mass eg lt5 cumulative mass input
Energy eg lt5 cumulative energy input
Environmental significance eg lt5 of the results of the selected impact categories It is important to note that the cut-off criteria need to be selected based on the goal and
scope of the study Therefore if the study is intended to be used for comparisons and
comparative assertions a sensitivity check using all the above three criteria is a
mandatory requirement
433 Long term emissions Long term emissions are those emissions considered to happen beyond 100 years up to
thousands of years (eg 60000)
Not all databases include long-term emissions within the system boundaries In some
cases it can be observed that LCA results after characterization normalization and
weighting are by far dominated by toxicity-related impact categories When this is the
case it is recommended to check if the datasets used include long term emissions
which in terms of absolute amounts are well superior compared to emissions occurring
within 100 years It has also to be noted that the models to estimate long term
emissions are affected by a high uncertainty which has to be taken into account in the
LCA study to avoid biased conclusions and wrong recommendations
When dealing with long term emissions it is important however not to overlook their
potential impact therefore it is recommended to
Assess a baseline scenario excluding long-term emissions
Perform a sensitivity analysis including long-term emissions in the LCI
Include an analysis of the uncertainty associated to the inclusion of long-term
emissions
24
25
5 Interpretation on Life Cycle Impact Assessment (LCIA)
level
Life Cycle Impact Assessment is the phase in an LCA where the inputs and outputs of
elementary flows that have been collected and reported in the inventory are translated
into impact indicator results LCIA has two mandatory steps which are the classification
and the characterization of LCI results and two optional steps normalisation and
weighting
Many elements can be subject to interpretation in the LCIA phase In this report the
focus will be on
the relevance of applying different characterization models
the relevance of applying different normalisation sets
the relevance of applying different weighting sets
the identification of the most sensitive elements in determining the final results
conclusions and recommendations
the coverage of characterization factors compared to the inventoried elementary
flows
Those points will be illustrated in the following section through illustrative case studies
First a case study dealing with sensitivity analysis of using different characterization
models for toxicity-related and resource-related impact categories will be discussed
Second a case study dealing with using different impact assessment methods This case
study will also be used to go through sensitivity analysis in relation to normalisation sets
and weighting sets
Third a case study mapping the coverage of characterization factors of toxicity-related
categories compared to the inventoried elementary flows will be shown
51 Characterization sensitivity analysis
The use of different characterization models to assess a certain impact category may
play a relevant role in the calculation of the final results and the identification of
hotspots most relevant life cycle stages processes and elementary flows
511 Case study 1 ndash WEEE management Toxicity-related and Resource-related impact categories affecting interpretation of results
The first case study is based on a work by Rigamonti et al (2017) the authors selected
a case study in which LCA has been applied to assess a waste electrical and electronic
equipment (WEEE) management system (Biganzoli et al 2015) In that study the
assessment was carried out to quantify the mass balance of the WEEE management
system in Lombardy Region in the year 2011 and to calculate its environmental benefits
and burdens
Firstly they tested characterization models and characterization factors (CFs) for
toxicity-related impact categories human toxicity cancer and non-cancer and eco-
toxicity There is an evolving debate on the robustness of these impact categories and
specifically for what concern impacts due to metals (see eg Pizzol et al 2011) In fact
some specific features of the metals (eg essentiality) as well as elements affecting
their fate modelling (eg different conditions affecting their bioavailability) are not fully
captured by currently available models applied in LCA Therefore the authors ran a
sensitivity analysis where updated CFs for metals were tested along the lines of recent
literature (Dong et al 2014) aiming at identifying the different results associated to
metals impact compared to the ILCD method (EC-JRC 2011) based on the USEtox
model (Rosenbaum et al 2008)
26
The total impact obtained by applying Dong et al 2014 CFs resulted about three times
higher than the corresponding obtained by the USEtox model This is mainly due to the
Dong et al 2014 CFs of Copper (Cu) and Zinc (Zn) which are higher than those adopted
in the USEtox model when considering the freshwater archetype proposed in the paper
of Dong as default when the location of the emission is not known
Secondly they tested impact assessment models for resource Models currently available
differ both in the modeling approach in the perspective adopted for assessing the
resources (Dewulf et al 2015) and as consequence in the characterization metric and
factors adopted (Mancini et al 2016) Beyond the potential benefit associated to a mass
based approach to recycling (eg kg of material recycled) there is indeed the need of
understanding to which extent the recycled materials are contributing to the resource
depletion impact categories The authors tested abiotic depletion potential (ADP) (CML
2012) which is focusing on potential depletion based on the ratio between resource
consumption and availability (either considering ultimate reserves in earth crust known
base reserves or economically viable reserves) ILCD model (EC-JRC 2011) which is an
extended version of CML2012 reserve based (based on CML algorithm few other
resources have been added described in Sala et al 2012) EDIP97 (Hauschild and
Wenzel 1998) which is comparing the resource with the deposits economically
exploitable without accounting for current level of consumption EPS2000 (Steen
1999) which assesses the cost (as societyrsquos willingness to pay) of substituting a
substance by an alternative for future generations affected by current level of depletion
Recipe 2008 (Goedkoop et al 2009) which is looking at marginal increase of extraction
cost per kg of extracted resource differentiating it by deposit and assuming a discount
rate over an indefinite timespan the Anthropogenic Abiotic Depletion Potential (AADP
Schneider et al 2011) which is accounting for the potential of resource recycling
assuming urban mining as an additional source of resources The recent update of the
AADP (Schneider et al 2015) was also considered It introduces the concepts of
ultimately extractable reserves represented by the amount available in the upper
earths crust that is ultimately recoverable A new set of CFs were also tested developed
by Mancini et al (2016) aiming at addressing the benefit associated to the recovery of
Critical Raw Materials (CRMs) The characterization model is based on the use and
adaptation to LCA of the supply risk indicators developed by the European Commission
(EC 2014) Three sets of CFs are tested based on different assumptions (1) baseline
option the supply risk factors as such ndash (SR) (2) an exponential function which
magnifies the differences between the CRMs - (SR)^6 (3) the ratio between supply risk
and production data (SRworld mine production in 2011) which reflects the size of the
market giving more importance to the materials used in small amounts in products and
applications like eg specialty metals that are often perceived as critical
The comparison among the different models was first of all made considering the mineral
resources present in the inventory of the case study covered by each of them The ILCD
method is the most comprehensive one with 31 mineral resources included in its model
for the resource depletion category On the contrary the Supply Risk (3) is the one that
covers the minor number of substances (ie 7)
A contribution analysis was also performed (Figure 3) Silver (Ag) gives the main
percentage contribution to the indicator in five models (ie CML 2012 versions b and c
ILCD Supply Risk 3) and EDIP97) Cobalt (Co) is the main contributor in the Supply
Risk (2) Copper (Cu) in the ReCiPe 2008 Palladium (Pd) in the EPS 2000 and AADP
(2015) and Nickel (Ni) in the AADP (2011) In the CML 2012 (a) Tellurium Gold (Au)
and Silver (Ag) are the most important substances whereas Aluminium (Al) Copper
(Cu) and Nickel (Ni) are the main contributors in the case of the Supply Risk (3)
27
Figure 3 Contribution analysis for the resource- related indicator calculated adopting several characterization models (Rigamonti et al 2017)
512 Case study 2 ndash Basket of Products Food sensitivity analysis
comparing different impact assessment methods
This case study is based on the application of different life cycle impact assessment
methods for the evaluation of the environmental impacts associated to food consumption
in Europe A process-based LCA has been performed for a basket of products that
represent the most relevant food product groups selected by importance in mass and
economic value to depict the average consumption for nutrition of EU citizens in 2010
(Notarnicola et al 2017b) The product groups in the basket were pig meat beef
poultry milk cheese butter bread sugar sunflower oil olive oil potatoes oranges
apples mineral water roasted coffee beer pre-prepared dishes For each product group
in the basket an inventory model based on a representative product has been
developed The impact of each representative product was then multiplied by the mass
of products in that product group that is consumed in one year by an average EU citizen
The environmental impact of the average food consumption of a European citizen has
been characterized using ILCD method for the life cycle impact assessment (EC-JRC
2011) The paper by Notarnicola et al (2017) illustrates the details of the process-based
LCA study on the BoP nutrition for EU 27 citizens and presents the results of the
characterisation phase The variability of the results associated to methodological
choices has been already preliminary explored (Castellani et al 2017) The present
report builds on those results and elaborates the interpretation phase (including also
normalisation and weighting) The questions that these analyses help answering are i)
are the products found to have the highest impact sensitive to changes in LCIA elements
(characterisation factors normalization references or the weighting sets) and ii) which
are the most contributing impact categories
This case study will also be used in paragraph 52 53 and 54 as a basis for further
insights on the interpretation of an LCA study
For this specific case the authors performed a sensitivity analysis on the LCIA
characterisation phase using ILCD compared with other two methods the CML-IA v 42
(Guineacutee et al 2002) and the Ecological footprint (EcF) (Wackernagel et al 2005) CML-
IA was chosen because it is widely used in LCA studies and because it adopts a different
28
modelling approach compared to ILCD in several impact categories that could be
relevant for food chains For instance for toxicity-related impact categories CML-IA is
based on USES-LCA model (Van Zelm et al 2009) whereas ILCD is applying USETOX
model (Rosenbaum et al 2008) for eutrophication CML-IA is using RAIN-LCA
(Huijbregts 1999) whereas ILCD is using different models for terrestrial and aquatic
eutrophication (respectively accumulated exceedance by Seppaumllauml et al 2006 and
EUtrend model as applied by Struijis et al 2009) The EF was chosen because it
assesses impacts in terms of direct and indirect land use and has been considered a
method that may complement LCA (Lee et al 2014) although based on an accounting
framework that has been questioned (Giampietro and Saltelli 2014) The version of EcF
method implemented in the study is the one already adapted to LCA and provided
within the SimaPro 805 software package (Pregrave Consultants 2015)
The three methods are mostly convergent in the identification of the product groups to
be considered hotspots within the BoP nutrition ie within the food consumption of the
European citizens ILCD and CML-IA identify a wider range of hotspots compared to EcF
mainly because they cover a wider range of impact categories (eg bread and potatoes
do not emerge as hotspot for EcF because their main impacts are in impact categories
not covered by the EcF method)
The product groups that emerge as hotspots in all the methods even if with slightly
different level of contribution are meat and dairy products and beer (as representative
product for alcoholic drinks)
The impact categories for which beer emerge as hotspot are slightly different among the
three methods ozone depletion ionizing radiation and resource depletion in ILCD and
CML-IA photochemical ozone formation in ILCD human toxicity and marine aquatic
ecotoxicity in CML-IA and nuclear energy in EcF The most contributing processes for all
the impact categories listed before is energy (electricity and heat) as already discussed
for ILCD In the case of CML-IA method toxicity-related impacts are mainly due to direct
emissions to air coming from the production process of the packaging glass
513 Conclusions and recommendations
These results reveal that the relative importance of one substance compared to another
changes with the model This is because the models differ in the substances that they
include and in the CFs of each substance It is recommended to run a sensitivity check
with different characterization models to evaluate the robustness of the conclusions
drawn It is also recommended to evaluate the theory underlying the characterization
models chosen to evaluate a certain impact category as this helps understanding the
results obtained
52 Characterization mapped flows and unmapped flows
This section shows two different levels of checks the first one focuses on a comparison
between two different life cycle impact assessment methods (ie ILCD vs CML-IA) based
on Castellani et al (2017) the second one focuses on what are the implications of
uncharacterized flows for a specific impact category (freshwater ecotoxicity) based on
the case study presented in Notarnicola et al (2017b)
521 Comparison between two different methods
A check of the inventoried elementary flows that are not characterized at the LCIA phase
should always be done to support interpretation of results Indeed the comprehensive
translation of the inventory into potential environmental impacts may not occur if some
of the elementary flows are not covered by the chosen characterization models Table 13
reports an example of the total amount of elementary flows that are available in an
inventory but they are not mapped and characterized by the methods considered (ILCD
and CML-IA) as reported in Castellani et al (2017) The authors checked the list of
uncharacterized flows for the inventory of the case study under evaluation and
29
highlighted the most relevant ones either in term of mass or of known environmental
concern The information obtained was then used in support to interpretation For
instance in case the two methods used for characterisation and normalisation give very
different results for one impact category the information about uncharacterized flows
can help to check if this difference is due to a different characterisation of impacts (ie
to a different way of considering the environmental relevance of some elementary flows)
or if it is affected by the fact that some flows (eg some emissions) are not taken into
account by one of the methods
This may occur also due to improper nomenclature of the elementary flows which may
cause a mismatch between the elementary flows listed in the inventory and the
elementary flows to which a characterization factor is available for example the
inventory may report CaCO3 while the characterization model may provide a CF for
calcite This mismatch would prevent the characterization of CaCO3
Table 13 Example of check of inventoried elementary flows that are not characterized by two impact assessment methods (based on Castellani et al 2017)
Flows Total elementary flows not characterized
Typologies of flows
Details on the elementary flows not characterized
ILCD CML-IA
ILCD CML-IA
Nr flows Amount Unit Nr flows
Amount Unit
raw materials
97 510 metals and minerals
47 795 kg 47 863 kg
water flows 25 126 m3 300 3825 m
3
Energy 0 0 MJ 12 18964 MJ
land use 11 001 m2 (or
m2a)
117 12898 m2 (or
m2a)
others 14 na mixed 34 na mixed
emissions to soil
83 227 pesticides to soil
45 0003 kg 173 008 kg
others 38 08 kg 54 41 kg
emissions to water
167 310 radioactive substances
42 119E+03 Bq 61 385E+06 Bq
metals and inorganics compounds
34 28 kg 36 28 kg
others 91 na mixed 213 na mixed
emissions to air
179 286 radioactive substances
49 899E+04 Bq 73 973E+07 Bq
metal and inorganics compounds
65 007 kg 56 0044 kg
pesticides 7 580E-08 kg 32 93 kg
others 70 na mixed 125 na mixed
waste flows 17 17 waste 17 3784 kg 17 3784 kg
Overall number of elementary flows not characterized
543 1350
In order to assess which elementary flows available in the inventory were not accounted
during the characterization the authors performed an analysis of the elementary flows
not characterized when using ILCD and CML-IA methods In total the model of the
basket includes 1730 elementary flows The ILCD method is not able to cover 543 of
these elementary flow as emission into air water soil or resource used whereas when
CML-IA is used to characterize the inventory 1350 elementary flows out of 1730 are not
30
characterized In Table 1 the list of main typologies of flows is reported Many pesticides
organic chemicals and inorganics are not characterized by the two methods Several
ionizing substances are not characterized as well as elementary flows related to group of
substances (such as AOX PAH BTEX VOC BOD and COD) Missing the CFs means that
it is not possible to estimate the extent to which eg the toxicity-related and ionizing
radiation-related impact categories are underestimated
Apart from the total number of flows covered the main difference between the two LCIA
methods is the ability to assign a characterization factor (CF) to the pesticides included
in the inventory ILCD has no CFs for 45 pesticidesrsquo emission to soil (plus 4 pesticidesrsquo
emissions to air) whereas CML-IA for 173 (plus 32 pesticidesrsquo emissions to air) This
may be the reason why human toxicity impacts appear as relevant in the results of ILCD
characterization (and related normalization and weighting as discussed below) and they
appear as less relevant in the results of CML-IA characterization and related
normalization and weighting
522 Analysis of uncharacterized flows within an impact category Based on the study of Castellani et al (2017) fourteen impact categories (IC)
recommended in PEF are calculated The number of elementary flows (ElFls) by ICs
varies from few flows (eutrophication acidification etc) to thousands (eco and human
toxicity) (see table 14)
For most of the ICs the contributing elementary flows reported in an inventory are well
identified and their inclusion in the calculation of the final score is expected to be done
correctly For climate change at mid-point 104 elementary flows with their associated
CFs are derived from the IPCC 2007 report for a 100-year period
However for impact categories like toxicity the number of elementary flows contributing
to the impact can be very important making possible the omission of some EFs at the
inventory level Additionally a high number of flows reported in the inventory have no
CFs If the number of un-characterized flows is too high this can lead to a non-robust
interpretation of the LCIA results
Table 12 shows the number of elementary flows with associated a CF (ie the single
chemical) and the amount of elementary flows with a CF per different compartment (eg
the single chemical in each compartment and sub-compartment)
Table 14 List of impact categories listed in ILCD with total number of elementary flows contributing to each IC
Impact Category ElFl with CFs (all emission compartments)
Unique ElFls with CFs (single chemical flows)
Climate change 104 102
Ozone Depletion 23 23
Human toxicity non cancer 3434 442 (USEtox 419 org+18 metals)
Human toxicity cancer 4734 607 (USEtox 596 org +8 metals)
Particulate matter 46 24
Ionizing radiation Human Health 50 29
Photochemical ozone formation 133 133
Acidification 7 7
Terrestrial eutrophication 7 7
Freshwater eutrophication 10 5
Freshwater ecotoxicity 15636 2526 (USEtox 2498 org +21 metals)
Land use 206 206
Water source depletion 1180 1180
Mineral fossil use amp Resource depletion
181 181
Marine eutrophication 14 11
Additional IC not used in PEF
Ionizing radiation Ecosystem (interim) 62 15
31
The potential impact of un-mapped (or uncharacterized) flows is illustrated via a case
study focusing the freshwater aquatic toxicity impact category using a recent modelling
of 17 food products (Notarnicola 2017b)
For a high proportion of the total mass of un-characterized ElFls the impact on the final
IC scores is null As a matter of fact 9998 of the 1887 kg ElFls emitted to the air are
made of air oxygen and hydrogen Only 033 kg (but still 199 flows) are actual made of
other type of chemicals 80 of those 033 kg are nitrogen type of chemicals 74
hydrogen chloride 12 sulphate etc (table 15) However regarding the ElFls to soil
and water the mass and number of un-characterized flow could have a significant
impact on the final score
Table 15 Type of chemicals (mass and number of EFs) not characterized per emission compartment (air oxygen and hydrogen have been excluded)
Compartments Group of chemicals Mass (g) Number of ElFl
Air
Total air 330 122
N-related 238662 2
inorganicsalt 74637 44
organic 5693 36
S - related 3896 1
metalmineral 3793 17
Alkenes 1530 2
Benzene Toluene Ethylbenzene and Xylene) unspecified ratio 0488 1
ozone 0314 1
P-related 0304 4
ionising 0261 4
Aldehydes 0213 1
Terpenes 0102 1
PAH 0034 1
Pesticide 0000 6
Acid 0000 1
Soil
Total soil 800 68
metalmineral 328315 15
inorganic 320234 4
oils 93496 3
organic 48702 2
Pesticide 5873 39
S - related 3777 2
N-related 0000 2
PAH 0000 1
Water
Total water 13871 112
inorganicsalt 7549785 22
TOC water 2840410 4
metalmineral 1998366 13
Suspended solid 1257655 6
inorganic 108851 6
organic 107546 37
AOX 2390 1
Acid 2032 2
S - related 2008 5
VOC 0643 1
32
N-related 0511 3
Propylene 0244 1
oils 0079 2
PAH 0055 2
Sodium Hydroxide 0054 1
Salt unspecified 0015 1
Hypochlorite 0013 1
ionising 0002 2
VOC 0001 1
P- related 0000 1
Looking at the results of the freshwater aquatic toxicity impact categories for all 17 food
products 90 of the impact category is driven by 10 out of 734 elementary flows that
represents only 14 of the mass of chemicals entering the aquatic environment (table
16) Furthermore it can be seen that
57 of the toxicity score are due to 3 metals representing 01 kg of the mass
However there are still more than 2 kg of un-characterized metalsminerals in
the inventory list (see table 15)
33 of the impact are due 10 pesticides (35 g) although there are still 39 un-
characterized pesticides in the inventory list (representing 5 g) (see table 15)
Table 16 Most relevant elementary flows contributing cumulatively up to 90 to the freshwater ecotoxicity impact category with USEtox
Substance Chemical
class Emission
Compartment Sub-compartment
Total impact (CTUe)
impact versus Total
Cumulated
impact Mass (kg)
Zinc metal Soil agricultural 931 21 21 00441
Copper metal Soil agricultural 902 21 42 00429
Chlorpyrifos pesticide Soil agricultural 833 19 61 00079
Copper metal Soil
351 8 69 00120
Zinc metal Water
139 3 72 00036
Folpet pesticide Soil agricultural 134 3 75 00004
Chlorothalonil pesticide Soil agricultural 111 3 78 00019
Chromium metal Water
105 2 80 00020
Cyfluthrin pesticide Soil agricultural 85 2 82 00001
Isoproturon pesticide Soil agricultural 81 2 84 00086
Cypermethrin pesticide Soil agricultural 70 2 85 00010
Chromium metal Soil agricultural 51 1 87 00019
Prochloraz pesticide Soil agricultural 45 1 88 00024
Captan pesticide Soil agricultural 39 1 88 00039
Alachlor pesticide Soil agricultural 38 1 89 00041
Metolachlor pesticide Soil agricultural 30 1 90 00050
Among the non-characterized elementary flows in relation to freshwater ecotoxicity it
can be observed
it is not known to which extent some of the chemicals may contribute to the IC
a number unspecified chemicals such as lsquoTotal organic matterrsquo (TOC BOD
CODhellip) PAH VOC that could contribute significantly to the overall score Since
the quantity of those ElFl can change significantly between products a default CF
could be proposed for those flow
some chemicals are known to be contributing to toxicity like pesticides and
metals still there are significant proportions that are not characterized
33
Although it is not possible to conclude if those un-characterized flows would have
changed the total score significantly based on the mass and number of known-
contributing class of chemicals (metals and pesticides) it is highly recommended that a
quantification of the uncharacterized chemicals is reported for the freshwater toxicity
impact category before drawing final conclusions
523 Conclusions and recommendations
Results of the LCIA phase can be highly affected by the characterization model chosen
as shown in chapter 51 Furthermore the evaluation of uncharacterized elementary
flows is of primary importance to assess the completeness of the LCIA coverage of the
identified LCI flows Indeed a high number of elementary flows inventoried might be
non-characterized by the chosen models even if their relevance in the assessed impact
categories could be of primary importance Therefore it is highly recommended that a
quantification of the uncharacterized elementary flows is reported before any
interpretation or conclusion is performed on the superiority of one product versus
another
53 Normalization sensitivity analysis
As for the characterisation phase also the choice of the normalisation reference set can
highly influence results Castellani et al (2017) have done a sensitivity analysis based on
the case study of a basket of product on food (see paragraph 512 for further details)
The authors report that as an optional step normalisation and weighting could be
applied to characterized LCA results to support the identification of the most important
impact categories Given that several sets of normalisation and weighting are available
the authors tested some of them in addition to the ILCD baseline with the aim of
assessing the sensitivity of the results to the choice of particular geographical and
temporal reference systems (ie normalization using EU or global scales) as well as
perspectives (ie weighting) This was investigated by selecting 3 sets of ILCD-compliant
normalization references (Benini et al 2014 Benini et al 2015 Laurent et al 2013)
and 2 sets of CML-IA compliant normalization references (EU 25+3 year 2000 and
World year 2000 - Guineacutee et al 2002) -reported in Table 17 In this section the
findings of the authors regarding normalisation will be discussed while the findings on
weighting will be discussed in section 54
Table 17 Summary of normalization sets used in the sensitivity analysis in Castellani et al (2016)
ILCD Impact Category Unit EC-JRC EU27
(2010) per person
a
EC-JRC Global (2010 or 2013)
per personb
PROSUITE Global (2010 or
2000) per person
c
Climate change kg CO2 eq 922E+03 707E+03 810E+03
Ozone depletion kg CFC-11 eq 216E-02 122E-02 414E-02
Human toxicity cancer effects CTUh 369E-05 124E-05 542E-05
Human toxicity non-cancer effects CTUh 533E-04 155E-04 110E-03
Particulate matterRespiratory inorganics kg PM25 eq 380E+00 507E+00 276E+00
Ionizing radiation human health kBq U
235 eq (to
air) 113E+03 241E+02 133E+03
Photochemical ozone formation human health kg NMVOC eq 317E+01 453E+01 567E+01
Acidification mol H+ eq 473E+01 561E+01 496E+01
Eutrophication terrestrial mol N eq 176E+02 164E+02 115E+02
Eutrophication freshwater kg P eq 148E+00 654E+00 620E-01
Eutrophication marine kg N eq 169E+01 304E+01 938E+00
Land use kg C deficit 748E+04 520E+06 236E+05
Ecotoxicity freshwater CTUe 874E+03 374E+03 665E+02
Resource depletion water m3 water eq 814E+01 689E+01 297E+01
Resource depletion mineral fossils and renewables kg Sb eq 101E-01 193E-01 313E-01
34
An additional analysis was performed to verify which one between normalization and
weighting is the most sensitive step in the identification of the most relevant impact
categories The same weighting sets described before were applied on the results of
normalization obtained using the two ILCD-compliant global normalization reference sets
tested before namely EC-JRC Global (Benini et al 2015) and PROSUITE Global (Laurent
et al 2013)
The contribution of product groups (Table 18) and of impact categories (Table 19) to the
total normalized impact of the BoP nutrition per citizen were analyzed
Table 18 presents a summary of the sensitivity analysis on product group contribution at
the normalization stage comparing the product group hotspots according to ILCD and
CML-IA methods Values are expressed as percentage of the normalized value per citizen
for that product group with respect to the total normalized impact per citizen (total
impact of nutrition in one year for an average EU-27 citizen) Equal weighting among
impact categories is assumed Results at the normalization stage almost confirm the
hotspots identified at the characterization stage meat and dairy products are again
hotspots for all the methods whereas other products that emerged before are
considered less contributing at the normalization stage This means that those products
generate impacts in impact categories that are considered less relevant compared to the
others according to the normalization scheme adopted For instance beer appeared to
be a hotspot for both ILCD and CML-IA at the characterization stage whereas only CML-
IA method identifies it as a hotspot at the normalization stage This happens because the
CML-IA normalization references (EU 25+3 and World) for marine aquatic toxicity -one
of the impact categories for which beer is a hotspot - are relatively low compared to the
ones in other LCIA methods
Table 18 presents a summary of the results of the sensitivity analysis at the
normalization stage comparing the relevance of impact categories according to ILCD
and CML-IA methods Results refer to the entire BoP For each impact category of the
two methods values are expressed as percentage of the normalized value per citizen for
that impact category with respect to the total normalized impact per citizen
Table 18 Results of sensitivity analysis on normalization sets at the European and global scale for ILCD- and CML-IA methods (Castellani et al 2016) The percentages represent the contribution of each product group to the total impacts of the BoP per citizen (reference flow) Equal weighting of impact categories is applied The second column reports the mass of each product group in the basket A color scale is applied to the results in each column (ie product group) from green (lowest contribution) to red (highest contribution)
Quantity in the basket (kgyear)
Share of total BoP
mass
EC-JRC EU27 (2010)
EC-JRC Global (2010
or 2013)
PROSUITE Global (2010
or 2000)
CML EU 25+3 (2000)
CML World (2000)
Mineral water 1050 194 1 1 1 3 3
Beer 698 129 4 4 7 16 21
Coffee 47 06 2 1 5 5 6
Apple 161 30 0 0 1 1 1
Oranges 174 32 1 1 2 1 2
Potatoes 691 130 3 3 3 3 4
Bread 393 73 3 3 3 4 5
Olive oil 53 10 1 0 1 2 3
Sunflower oil 53 10 4 4 5 3 3
Sugar from beet 298 55 3 3 3 2 1
Milk 801 148 9 9 8 7 6
Cheese 150 28 15 16 13 10 9
Butter 36 07 7 8 6 3 2
Meat - beef 137 25 18 17 16 11 10
Meat - pork 410 76 20 20 19 18 13
Meat - poultry 220 42 8 8 8 10 7
Pre-prepared meal
29 05 1 1 1 2 2
35
100 100 100 100 100 100
Table 19 Results of sensitivity analysis on normalization sets at the European and global scale for ILCD and CML-IA methods (Castellani et al 2016) The percentages reflect the relative relevance of impact categories compared to the total impacts of the BoP per citizen (reference flow) A colour scale is applied to the results in each column (ie impact category) from green (lowest contribution) to red (highest contribution)
EC-JRC EU27 (2010)
EC-JRC Global (2010 or 2013)
PROSUITE Global (2010 or 2000)
CML EU 25+3 (2000)
CML World (2000)
Climate change 19 11 13
Global warming (GWP100a) 78 102
Ozone depletion 00 00 00 Ozone layer depletion 02 00
Human toxicity cancer effects
62 83 25
Human toxicity
59 120 Human toxicity non-cancer effects
446 692 127
Particulate matter 26 09 21 -
Ionizing radiation HH 05 11 03 -
Photochemical ozone formation
10 03 03 Photochemical ozone formation
46 21
Acidification 73 286 41 Acidification 272 201
Terrestrial eutrophication 83 40 75
Eutrophication
133 163
Freshwater eutrophication 34 04 48
Marine eutrophication 82 20 87
Freshwater ecotoxicity 58 61 450
Freshwater aquatic ecotoxicity 340 314
- - - -
Marine aquatic ecotoxicity
- - - - Terrestrial ecotoxicity
Land use 23 00 04 -
Water resource depletion 62 33 100 -
Mineral fossil amp ren resource depletion
18 04 04 Abiotic depletion 02 11
Abiotic depletion (fossil fuels) 68 67
100 100 100
100 100
531 Conclusions and recommendations
Different normalisation sets may produce different results in terms of identification of
most relevant impact categories life cycle stages and processes Different reference
systems refer to different situation which can all be valid depending eg on the
geographical scope of the study It is recommended to evaluate different normalisation
tests which fit the study at hand to support the conclusions drawn with the baseline
scenario or to provide additional insights
54 Weighting sensitivity analysis
Castellani et al (2016) investigated only for ILCD-compliant normalization sets in
addition to equal weighting 8 ILCD-compliant weighting sets (reported in Table 20) were
tested The different sets were selected aiming at covering several perspectives on
weighting namely distance to target for EU policies considering binding and non-
binding target at 2020 (Castellani et al 2017) a previous distance to target set (EDIP)
36
for Europe for 2005 (Stranddorf et al 2005) two sets considering planetary boundaries
(Tuomisto et al 2012 Bjoslashrn and Hauschild 20158) a set which gives relevance to
midpoint indicators based on their contribution to impact at the endpoint (Ponsioen and
Goedkoop 2015) a set resulting from the combination of different panel-based
approaches (Huppes et al 2012)
When needed available weighting sets have been adapted to ILCD impact categories
The majority of these weighting sets build on normalization factors that are specific of a
geographic scale Tuomisto et al (2012) calculated planetary boundaries at global scale
whereas and Bjoslashrn and Hauschild (2015) did it for both global and European scales
Huppes et al (2012) adopted a panel-based approach with no specific geographic
representativeness whereas all the other weighting sets used in this work have been
originally developed or adjusted for applications at the targeting the European scale
The use of EU27-consistent weighting sets in combination with global normalization
factors may lead to inconsistencies therefore the results have to be interpreted in the
light of this inconsistency In this work the normalized and weighted results are
calculated and presented anyway for all combinations so to show the effect of the
selection of weighting available for practitioners rather than focussing on the (in-
)consistency of their joint use with normalization factors The performed analysis
quantified the relative contribution by impact category to the overall impacts associated
with the BoP as well as the contribution by each of the products The effects of the
different weighting sets tested on the results of the BoP normalized to EC-JRC EU27
normalization references are presented in Table 21 and Table 22
Table 20 Summary of weighting sets used in the sensitivity analysis by Castellani et al (2016)
Distance to target Damage oriented Panel-
based
Policy targets Planetary boundaries Mid-to-
endpoint
Castellani et al 2016
WFsA
Castellani et al 2016
WFsB
EDIP 2003 (Stranddo
rf et al 2005)
Tuomisto et al 2012
Bjoslashrn amp Hauschild
- European
2015
Bjoslashrn amp Hauschi
ld ndash Global 2015
Ponsioen amp
Goedkoop 2016
Huppes et al 2012
ILCD Impact Category dimensionless ()
Climate change 71 54 2 10 25 26 44 232
Ozone depletion 64 49 87 8 1 2 0 36
Human toxicity cancer effects 69 52 2 na na na 1 65
Human toxicity non-cancer effects
62 47 2 na na na
4 41
Particulate matterRespiratory inorganics
74 56 na na na na
8 66
Ionizing radiation human health
61 46 na na na na
0 65
Photochemical ozone formation human health
78 59 2 na
34 48
0 54
Acidification 72 55 2 8 1 1 0 42
Eutrophication terrestrial 70 53 2 28 1 0 0 23
Eutrophication freshwater 62 47 1 7 9 2 0 23
Eutrophication marine 69 52 2 28 1 1 0 23
Land use 64 53 na 6 25 16 19 102
Ecotoxicity freshwater 61 51 0 na 2 0 0 109
Resource depletion water 61 296 na 5 1 4 3 51
Resource depletion mineral fossils and renewables
61 30 0 na na
na 19 69
8 Bjoslashrn and Hauschild provided to the authors of this report a modified version to be used as weighting method
in compliance with EU27 ILCD normalization factors Global weighting factors were calculated directly from global normalization factors published by Bjoslashrn and Hauschild 2015
37
The contribution of specific products to the overall impacts associated to the BoP
nutrition is very similar when using several weighting sets in combination with
normalization references EU27 (Table 21) In fact for all the weighting sets tested pork
meat and beef meat are the highest contributor to the impacts (varying between 15
and 22) According to all sets cheese is the 3rd largest contributor (14 on average)
whereas milk and poultry meat are most frequently identified as 4th and 5th largest
contributors (roughly 8 each) On average these product groups account for roughly
70 of the total impacts Apples olive oil and pre-prepared meals are those contributing
the less followed by mineral water and oranges On average their cumulative
contribution is around 5
Table 21 Product groups contribution Results of several ILCD-compliant weighting sets in combination with normalization references EU27 (Castellani et al 2016) A color scale is applied to the results in each column (ie product group) from green (lowest contribution) to red (highest contribution)
PRODUCT GROUPS CONTRIBUTION
Quantity in the basket (kgyear)
Share of total BoP mass
Equal
weighting
Castellani et al (2016) WFsA
Castellani et
al (2016) WFsB
EDIP2003
9
Tuomisto et
al (2012)
BjornampHausch
ild (2015)
ndash Europe
an
BjornampHausch
ild (2015)
ndash global
Ponsioen and
Goodkoep
(2016)
Huppes et al (2012)
Mineral water 105 1940 1 1 3 1 1 1 2 1 1
Beer 66 cL 698 1290 4 4 4 4 3 8 8 7 5
Coffee 47 060 2 2 2 1 2 6 5 3 2
Apple 161 300 0 0 1 0 0 1 1 1 1
Oranges 174 320 1 1 3 0 1 2 2 1 1
Potato 691 1300 3 3 4 3 2 3 3 4 3
Bread 393 730 3 3 3 4 3 3 3 3 3
Olive oil 53 100 1 1 1 0 1 1 1 1 1
Sunflower oil 53 100 4 4 4 4 3 4 4 4 4
Sugar from beet 298 550 3 3 4 3 4 2 3 3 3
Milk 801 1480 9 9 8 9 8 8 8 8 8
Cheese 15 280 15 15 16 15 13 12 13 14 14
Butter 36 070 7 7 6 8 6 5 5 7 7
Meat - beef 137 250 18 18 17 18 22 15 16 16 17
Meat - pork 41 760 20 20 16 21 21 19 17 18 19
Meat - poultry 22 420 8 8 7 8 9 8 8 8 8
Pre-prepared meal 29 050 1 1 1 1 1 1 1 1 1
100
100 100 100 100 100 100 100 100
100
9 (based on Stranddorf et al 2005)
38
Conversely the identification of the most relevant impact categories contributing to the
overall impact of the entire BoP nutrition presents huge discrepancies when applying
different weighting sets (Table 22) This is due to the intrinsic differences among the
weighting sets which build on different perspectives and attribute different weights to
the impact categories
Table 22 Relevance of the different impact category Results of the application of several ILCD-compliant weighting sets in combination with normalization references EU27 (Castellani et al 2016) A color scale is applied to the results in each column (ie impact category) from green (lowest contribution) to red (highest contribution)
CONTRIBUTION ANALYSIS
1-1-1
Castellani et al (2016) WFsA
Castellani et al (2016) WFsB
EDIP2003 (based on Stranddorf et al 2005)
Tuomisto et al (2012)
Bjoslashrn amp Hauschild (2015)
Bjoslashrn amp Hauschild (2015) - global
Ponsioen amp
Goedkoop (2015)
Huppes et al (2012)
Climate change 19 20 15 2 32 214 260 204 87
Ozone depletion 00 00 00 2 00 00 00 00 00
Human toxicity cancer effects
62 66 50 7 na na na 22 81
Human toxicity non-cancer effects
446
425 323 53 na na na 477 363
Particulate matterRespiratory inorganics
26 30 23 na na na na 51 34
Ionizing radiation human health
05 05 04 na na na na 00 07
Photochemical ozone formation human health
10 12 09 1 00 162 263 00 11
Acidification 73 81 61 9 101 47 42 03 61
Eutrophication terrestrial
83 89 67 10 379 31 18 00 39
Eutrophication freshwater
34 32 25 3 37 134 43 00 16
Eutrophication marine
82 87 66 11 374 55 44 00 38
Land use 23 22 19 na 23 257 188 106 46
Ecotoxicity freshwater
58 55 46 0 na 60 04 00 127
Resource depletion water
62 59 284 na 53 39 137 49 63
Resource depletion mineral fossils and renewables
18 17 09 0 na na na 86 25
TOTAL 100 100 100 100 100 100 100 100 100
The discrepancies in the results suggest that it is important to acknowledge that
different perspectives lead to different results Moreover it is relatively straightforward
to identify the product groups impacting the most as from Table 21 when keeping
constant normalization references although varying weighing sets
The authors also checked the most sensitive element between normalization and
weighting their findings indicate normalization as the most sensitive choice if compared
39
to the selection of a specific weighting set among those considered in their work
However this result may change in case weighting methods building on different
approaches are added to the ones included in their work Nevertheless the ranking of
products is not significantly affected by changing normalization reference (eg from
ILCD EU27 to ILCD Global ndash Laurent et al 2013) This might be due to few impact
categories driving the results regardless of the normalization and weighting methods
selected or to the fact that all impact categories are strongly correlated
541 Conclusions and recommendations Weighting sets are often dependent on different value choices to assign different weights
to all impact categories Therefore different weighting sets lead to significant differences
of the final conclusions It is recommended that the decision about inclusion of which
weighting set to use has been made and documented in the first scope definition and
shall not be changed later during the study
40
6 Estimation of uncertainty
Evaluation of the uncertainty of an LCA study is a step which involves both the LCI and
LCIA phase therefore it is strictly linked to the content of the previous chapters
Uncertainty in LCA can be defined in different ways (Ciroth et al 2016) For examples it
can be meant as describing the variability of the LCA data to determine the significance
of the indicator results being ldquothe estimated amount or percentage by which an
observed or calculated value may differ from the true valuerdquo (Skone 2000) ISO 14044
defines uncertainty analysis as systematic procedure to quantify the uncertainty
introduced in the results of a life cycle inventory analysis due to the cumulative effects of
model imprecision input uncertainty and data variability
The estimation of uncertainty serves three main purposes
it supports a better understanding of the results obtained
it supports the iterative improvement of an LCA study
it also helps the target audience to assess the robustness and applicability of the
study results
The PEF Guide identifies two key sources of uncertainty in PEF studies
1 Stochastic uncertainties for the inventory data
they refer to statistical descriptions of variance around a meanaverage For
normally distributed data this variance is typically described in terms of an
average and standard deviation
2 Choice-related uncertainties
They arise from methodological choices including modelling principles system
boundaries allocation choices choice of impact assessment methods and other
assumptions related to time technology geographical aspects etc These are not
amenable to statistical description but rather can only be characterized via
scenario model assessments
In this report we refer to uncertainty analysis to describe the range of likely outcomes
based on a set of inputs and it differs from a sensitivity analysis which is linked to how
sensitive the results are to a change in an input parameter (see previous chapters)
It has to be kept in mind that all steps involved in a quantitative process are affected by
uncertainties Therefore it is important that the uncertainty is assessed
- At inventory level (eg standard deviation associated to a data point) An
example on how to assess the uncertainty at inventory level was recently
provided by Ciroth et al (2016)
- At characterization level (eg linked to characterization factors)
- At normalisation level (eg linked to normalisation factors)
- At weighting level (eg linked to weighting factors)
611 Conclusions and recommendations It is recommended that the overall uncertainty of an LCA study is estimated and
reported in the final report It is also recommended to include an evaluation to which
extent the uncertainties identified affect the final conclusions
41
7 Meta-analysis
The widespread development of LCA in the last decades as a decision supporting tool
leads to a huge amount of LCA studies in literature concerning all kind of goods and
services (ldquoproductsrdquo) When trying to make sense of their results that sometimes are
very different or come up with a conclusion techniques to combine or re-analyze them
are needed such as meta-analysis
Zumsteg et al (2012) described the key factors for conducting and reporting systematic
reviews including meta-analyses10 in LCA Those key factors are simplified in a check
list 1 Review title keywords and abstract 2 Rationale for the review 3 Review
question and objectives 4 Description of review protocol 5 Findings and features of
the individual studies in the review 6 Assessment of bias 7 Synthesis methods
(qualitative and quantitative) 8 Limitations of the review and 9 Summary of findings
and conclusions
This chapter is not intended to give guidelines on how to perform a systematic review or
a meta-analysis but to highlight the critical points that the practitioner should take into
account when collecting and using the LCA data Recalling the check list previously
described it is in the findings and features of the individual studies where one of the
biggest shortcomings when performing a meta-analysis concerning LCA studies is found
Assembling data from the individual studies is complex due to
the existing ldquoflexiblerdquo guidance in conducting LCA that leads to different
assumptions and methodological choices made in the various LCA modelling
exercises The ISO 14040 and 14044 standards provide the framework for LCA
This framework however leaves the individual practitioner with a range of
choices which can affect the legitimacy of the results of an LCA study
the lack of homogeneity reporting LCA results
As found in De Matos et al (2015) while doing a meta-analysis of different bioeconomy
value chains the most influencing differences among studies mainly relate to
The definition of the system boundaries and the stages included in the
study (eg even if the same general system boundaries are considered -
eg cradle to gate - some studies may or may not include intermediate
transport construction and decommissioning of buildings etc)
The impact assessment methods used as different methods may
consider for example different substances for a given impact category
and different characterization factors for the same substance
The definition of the functional unit (eg as the input the output
product the agricultural land unit etc) (Cherubini and Stromman
2011)
The consideration of direct and indirect land use change (dLUC and iLUC
respectively) (Cherubini and Stromman 2011)
The technology considered in the process and its maturity level
The approach used to model the multifunctional system For instance if
substitution is used the reference system selected may have a
significant influence on the final LCA results On the other hand if
allocation is used the selection of the allocation criteria and the relative
10 The definition of Meta-analysis given by Zumsteg et al (2012) is ldquoA melding of data from multiple studies usually involving additional mathematical analysis with the goal of utilizing this synergy of information and data size to answer questions that cannot be answered by existing individual studies or to improve the certainty or impact of know findings by increasing the sample
size Meta-analyses are often performed as part of a systematic reviewrdquo
42
contribution of each co-product may considerably influence the results of
the assessment
These points are in line with those reported in other studies in literature Wolf et al
(2015) conducted a meta-analysis of LCAs for wood energy services (heat power and
combined heat and power (CHP)) and chose a set of ldquodecisive parametersrdquo to be
analyzed arguing that those factors promote inconsistent findings along LCA studies
Apart from the previously mentioned the authors include the following factors (some of
them specific of the good or service under study)
Data sources such as empirical data literature well-known databases
unspecified databases simulators or expert interviews are some of
them
Transportation distances and types
Feedstock properties (in this case wood)
Combustion capacity and efficiency and co-combustion rates
Energy service provided (power heat and CHP)
Schreiber et al (2012) performed a meta-analysis on LCA studies of electricity
generation with carbon capture and storage (CCS) comprising the three main CCS
technologies (post-combustion oxyfuel and pre-combustion) In line with previous
studies they highlighted the different choices in the LCA methodology and parameters
(specific of the good or service under study) that heavily impact the overall results Here
we report those which differ from the already mentioned
Data quality and availability
Time horizon as most studies considered present and future power
plants as far as 2050
Spatial representation ndash some elements in the CCS process chain are
highly site-specific such as storage sites
Life cycle inventory (LCI) ndash which inputs and outputs are considered
Operational valuation and weighting methods
Power plant efficiency and energy penalty of the capture process
Carbon dioxide capture efficiency and purity
Fuel origin and composition
Moreover when having a look at the limitations of the review and meta-analysis some
studies just focus on GHG emissions Wolf et al (2015) set the CML midpoint impact
category Global Warming as the basis for the comparison of results because it is
represented in 100 of the studies They did not consider other less-frequent impact
categories but yet important such as acidification eutrophication and particulate
matter owing to the lack of results published in the studies On the other hand
Schreiber et al (2012) not only focused on GHG but they included other impacts such
as acidification potential eutrophication potential photochemical ozone creation
potential and cumulative energy demand
As a conclusion increased harmonization and transparency in the calculation and
reporting of LCA data and results is needed (Cristobal et al 2015)
711 Conclusions and recommendations
The number of LCA studies available is increasing and making sense of all the results
that can be obtained from them is a difficult task As a conclusion increased
harmonization and transparency in the calculation of LCA data and results is needed It
is recommended that reporting of LCA data is done in a more consistent and harmonized
43
manner to allow users of LCA study a better understanding of the results and
conclusions drawn
8 Conclusion
One of the key aims of LCA is to provide the decision makers with comprehensive and
understandable information this task is achieved by a proper interpretation of the
results of an LCA study
This report builds on the requirements provided in relevant international standards (ISO
14044) and guides (ILCD Handbook (EC-JRC 2011a) PEF Guide (EC 2013b) and it
proposes a practical approach on how to perform a robust interpretation of an LCA
study It provides a ready-to-use approach for the identification of significant issues and
it includes examples of completeness sensitivity and consistency checks based on real-
case studies which are used to draw the attention of the reader on how to evaluate the
results of an LCA study
The scheme proposed in this report should not be intended as a comprehensive list of
items to check instead it should be seen as a normal workflow that should be carried
out by an LCA practitioner in order to derive robust conclusions out of the LCA study
More accurate and case-specific checks should be done depending on the intended goal
and scope of the study
The report is structured in order to allow a practitioner focus on the two quantitative
phases of LCA the life cycle inventory (LCI) and the life cycle impact assessment (LCIA)
Regarding the LCI the report goes through the analysis of the data sources by giving
examples on how to interpret the system boundaries and the foreground system) it
provides an overview on data quality and it comprises further completeness and
consistency checks (eg cut-off long term emissions anomaly checks)
When analysing the LCIA the report provides insights on sensitivity analysis regarding
characterization normalization and weighting When dealing with characterization the
attention of the reader is drawn also on mapping between the inventory and the
characterization models and a discussion on the evaluation of uncharacterized
elementary flows is also included
Finally an overarching topic such as meta-analysis was deemed useful to be included as
this is often used when there is the need of assessing the state of the art of the LCA
studies on a specific product supply chain Key messages stemming from this report are
as follows
Results reveal that the relative importance of one substance compared to another
changes with the characterization model This is because the models differ in the
substances that they include and in the CFs of each substance It is
recommended to run a sensitivity check with different characterization models to
evaluate the robustness of the conclusions drawn It is also recommended to
evaluate the theory underlying the characterization models chosen to evaluate a
certain impact category as this helps understanding the results obtained Results of the LCIA phase can be highly affected by the characterization model
chosen Furthermore the evaluation of uncharacterized elementary flows is of
primary importance to assess the completeness of the LCIA coverage of the
identified LCI flows Indeed a high number of elementary flows inventoried might
be non-characterized by the chosen models even if their relevance in the
assessed impact categories could be of primary importance Therefore it is highly
recommended that a quantification of the uncharacterized elementary flows is
reported before any interpretation or conclusion is performed on the superiority
of one product versus another Different normalisation sets may produce different results in terms of
identification of most relevant impact categories life cycle stages and processes
Different reference systems refer to different situation which can all be valid
44
depending eg on the geographical scope of the study It is recommended to
evaluate different normalisation tests which fit the study at hand to support the
conclusions drawn with the baseline scenario or to provide additional insights Weighting sets are often dependent on different value choices to assign different
weights to all impact categories Therefore different weighting sets lead to
significant differences of the final conclusions It is recommended that the
decision about inclusion of which weighting set to use has been made and
documented in the first scope definition and shall not be changed later during the
study It is recommended that the overall uncertainty of an LCA study is estimated and
reported in the final report It is also recommended to include an evaluation to
which extent the uncertainties identified affect the final conclusions The number of LCA studies available is increasing and making sense of all the
results that can be obtained from them is a difficult task As a conclusion
increased harmonization and transparency in the calculation of LCA data and
results is needed It is recommended that reporting of LCA data is done in a more
consistent and harmonized manner to allow users of LCA study a better
understanding of the results and conclusions drawn Further aspects such as the appropriateness of the functional unit the intended goal
the system boundaries and value choices should normally be part of an interpretation in
order to identify recommendations and limitations of the study and draw the appropriate
conclusions They are not discussed further in this report but it is recommended that at
least each decision based on a personal or a stakeholderrsquos value shall always be
documented and explained in the conclusions of the LCA study This is consistent with
one of the key aims of LCA which is to provide the decision makers with comprehensive
and understandable information
45
References
Baitz M Makishi Colodel C Kupfer T Florin J Schuller O Kokborg M Koumlhler A
Thylmann D Stof-fregen A Schoumlll S Goumlrke J Rudolf M Gonzalez M (2016) GaBi
Database amp Modelling Principles Thinkstep Leinfelden-Echterdingen
Benini L Mancini L Sala S Manfredi S Schau EM Pant R (2014) Normalization
method and data for Environmental Footprints European Commission Joint
Research Center Institute for Environment and Sustainability Publications Office
of the European Union Luxemburg ISBN 978-92-79-40847-2
Benini L Sala S Pant R (2015) Global normalization factors for ILCD compliant
midpoint impact categories - EC-JRC internal draft report Set of factors available
at httpeplcajrceceuropaeuuploadsTable_ILCD_NFs_08-03-2016xlsx
Biganzoli L Falbo A Forte F Rigamonti L Grosso M (2015) Mass balance and life
cycle assessment of waste electrical and electronic equipment management
system implemented in Lombardia Region (Italy) Science of the Total
Environment 524ndash525 361-375
Bjoslashrn A Hauschild MZ (2015) Introducing carrying capacity-based normalization
in LCA framework and development of references at midpoint level The
International Journal of Life Cycle Assessment 20 (7)1005ndash1018
Blonk Agri-footprint BV (2014) Agri-footprint Methodology and basic principles -
Version 10
Brentrup F Kusters J Lammel J Kuhlmann H (2000) Methods to estimate on-
field nitrogen emissions from crop production as an input to LCA studies in the
agricultural sector The International Journal of Life Cycle Assessment 5 349ndash
357
Castellani V Benini L Sala S Pant R (2016) A distance-to-target weighting
method for Europe 2020 The International Journal of Life Cycle Assessment
21(8)1159-1169
Castellani V Sala S Benini L (2017) Hotspots analysis and critical interpretation
of food life cycle assessment studies for selecting eco-innovation options and for
policy support Journal of Cleaner Production 140 (2) 556-568
Cellura M Longo S Mistretta M (2011) Sensitivity analysis to quantify
uncertainty in life cycle assessment the case study of an Italian tile Renew Sust
Energ Rev 15(9)4697-4705
Cherubini F Stromman AH (2011) Life cycle assessment of bioenergy
systems state of the art and future challenges Bioresource technology 102 437
ndash 451
Ciroth A Muller S Weidema B Lesage P (2016) Empirically based uncertainty
factors for the pedigree matrix in ecoinvent The International Journal of Life
Cycle Assessment 21 1338-1348
CML (2002) CML-IA model and characterisation factors Available from
httpswwwuniversiteitleidennlenresearchresearch-outputsciencecml-ia-
characterisation-factors Accessed November 2015
Colomb V Ait-Amar S Basset-Mens C Dolleacute JB Koch P Lellahi A Mousset J
Salou T Tailleur A van der Werf HMG (2015) AGRIBALYSE Assessment and
lessons for the future Version 12
Corrado S Zampori L Castellani V Sala S (2017) Systematic analysis of
secondary Life Cycle Inventories when modelling agricultural production a case
study for arable crops Journal of Cleaner Production (under review)
46
Cristobal J De Matos CT Aurambout JP Manfredi S Kavalov B (2015)
Environmental sustainability assessment of bioeconomy value chains Biomass
and bioenergy 89 159 ndash 171
De Matos CT Cristobal J Aurambout JP (2015) Environmental sustainability
assessment of bioeconomy products and processes ndash progress report 1 European
Commission Report EUR 27356 EN
De Schryver A Galatola M (2016) Guidance for modelling agricultural processes
TAB Issue paper v 01 October 2016
Dewulf J Benini L Mancini L Sala S Blengini G A Ardente F Recchioni M Maes
J Pant R Pennington D (2015) Rethinking the Area of Protection lsquoNatural
Resourcesrsquo in Life Cycle Assessmen Environmental Science and Technology 49
(9)5310ndash5317
Dong Y Gandhi N Hauschild MZ (2014) Development of Comparative Toxicity
Potentials of 14 cationic metals in freshwater Chemosphere 112 26-33
Ecoinvent (2016) Allocation cut-off by classification [WWW Document] URL
httpwwwecoinventorgdatabasesystem-models-in-ecoinvent-3cut-off-
system-modelallocation-cut-off-by-classificationhtml (accessed 8916)
European Commission ndash Joint Research Centre (EC-JRC) (2011a) ILCD Handbook
ndash General guide for life cycle assessment ndash Detailed guidance European
Commission Joint Research Centre Institute for Environment and Sustainability
European Commission ndash Joint Research Centre (EC-JRC) (2011b) ILCD Handbook
- Recommendations for Life Cycle Impact Assessment in the European context
European Commission Joint Research Centre Institute for Environment and
Sustainability
European Commission (EC) (2013a) Communication from the Commission to the
EU Parliament and Council ndash Building the Single Market for Green Products ndash
Facilitating better information on the environmental performance of products and
organisations(20130196final)
European Commission (2013b) Commission Recommendation of 9 April 2013 on
the use of common methods to measure and communicate the life cycle
environmental performance of products and organisations (2013179EU) Official
Journal of the European Union Volume 56 4 May 2013
European Commission (2015)ndash Better Regulation Toolbox
httpeceuropaeusmart-regulationguidelinesdocsbr_toolbox_enpdf
European Commission (2016) Product Environmental Footprint Pilot Guidance -
Guidance for the implementation of the EU Product Environmental Footprint (PEF)
during the Environmental Footprint (EF) pilot phase - version 52 (pp 95)
Retrieved from
httpeceuropaeuenvironmenteussdsmgppdfGuidance_productspdf
FAO (2012) FAOstat Agriculture data Food and Agriculture Organization of the
United Nations httpfaostatfaoorg
Gaudreault C Samson R Stuart P (2009) Implications of choices and
interpretation in LCA for multi-criteria process design de-inked pulp capacity and
cogeneration at a paper mill case study J Clean Prod 17(17)1535-1546
Giampietro M Saltelli A (2014) Footprints to nowhere Ecological Indicators 46
610-621
Goedkoop M Heijungs R Huijbregts M de Schryver A Struijs J van Zelm R
(2009) ReCiPe 2008 A life cycle assessment method which comprises
harmonized category indicators at the midpoint and the endpoint level Report I
47
Characterisation Ministry of Housing Spatial Planning and Environment
Amsterdam
Guineacutee JB Gorreacutee M Heijungs R Huppes G Kleijn R de Koning A van Oers L
Wegener Sleeswijk A Suh S Udo de Haes HA de Bruijn H van Duin R
Huijbregts MAJ (2002) Handbook on life cycle assessment Operational guide to
the ISO standards I LCA in perspective IIa Guide IIb Operational annex III
Scientific background Kluwer Academic Publishers ISBN 1-4020-0228-9
Dordrecht 2002 692 pp
Guo M Murphy RJ (2012) LCA data quality sensitivity and uncertainty analysis
Science of the total environment 435230-243
Hauschild MZ Wenzel H (1998) Environmental Assessment of Products Vol 2 ndash
Scientific background Chapman amp Hall UK Kluwer Academic Publishers
Hingham USA
Heijungs R Kleijn R (2001) Numerical approaches towards life cycle
interpretation five examples The International Journal of Life Cycle Assessment
6(3)141-148
Hellweg S Mila i Canals L (2014) Emerging approaches challenges and
opportunities in life cycle assessment Science 344(6188) 1109-1113
Huang Y Spray A Parry T (2013) Sensitivity analysis of methodological choices
in road pavement LCA The International Journal of Life Cycle Assessment
18(1)93-101
Huijbregts MAJ Hellweg S Hertwich E (2011) Do we need a paradigm shift in life
cycle impact assessment Environmental Science and Techonology 45 (9)
38333834
Huijbregts MAJ (1999) Life-cycle impact assessment of acidifying and eutrophying
air pollutants Calculation of equivalency factors with RAINS-LCA Report available
at httpmedialeidenunivnllegacyLife-cycle20impact20assessmentpdf
(accessed April 2016)
Huppes G Van Oers L Pretato U Pennington DW (2012) Weighting
environmental effects Analytic survey with operational evaluation methods and a
meta-method The International Journal of Life Cycle Assessment 17 876ndash891
James K Galatola M (2015) Screening and hotspot analysis procedure to
identify the hotspots and the most relevant contributions (in terms of impact
categories life cycle stages processes and flows) Version 40 24 April 2015
Retrieved from
httpswebgateeceuropaeufpfiswikisdisplayEUENVFPEU+Environmental+F
ootprint+Pilot+Phase accessed November 2016
ISO 14040 (2006a) Environmental managementmdashlife cycle assessmentmdash
principles and framework Geneva Switzerland
ISO 14044 (2006b) ndash Environmental management ndash Life Cycle assessment ndash
Requirements and guidelines
Laurent A Hauschild M Z Golsteijn L Simas M Fontes J Wood R (2013)
Deliverable 52 Normalisation factors for environmental economic and socio-
economic indicators Report prepared within the 7th Framework programme
Project PROSUITE Available at httpwwwprosuiteorgwebguestpublic-
deliverables (accessed December 2015)
Lee SJ Hawkins TR Ingwersen WW Young DM (2014) Exploring the Use of
Ecological Footprint in Life Cycle Impact Assessment Findings from a Comparison
of Transportation Fuels Journal of Industrial ecology 19(3) 416ndash426
48
Mancini L Benini L Sala S (2015) Resource footprint of Europe complementarity
of Material Flow Analysis and Life Cycle Assessment for policy support
Environmental Science and Policy 54367ndash376
Mancini L Benini L Sala S (2016) Characterization of raw materials based on
supply risk indicators for Europe The International Journal of Life Cycle
Assessment 1-13 doi101007s11367-016-1137-2
Nemecek T Baumgartner D (2006) Concerted Action GL-Pro WP4
Environmental Analysis - Final report - Deliverable 43 Available at
httpwwwagroscopeadminchpublikationeneinzelpublikationindexhtmllang
=enampaid=23328amppid=23604
Notarnicola B Sala S Antoacuten A McLaren SJ Saouter E Sonesson U (2017a) The
role of life cycle assessment in supporting sustainable agri-food systems a
review of the challenges Journal of Cleaner Production 140(2)399-409
doi101016jjclepro201606071
Notarnicola B Tassielli G Renzulli PA Castellani V Sala S (2017b) Environmental
impact of food consumption in Europe Journal of Cleaner Production 140(2)
753-765 doi101016jjclepro201606080
Pizzol M Christensen P Schmidt J Thomsen M (2011) Impacts of ldquometalsrdquo on
human health a comparison between nine different methodologies for Life Cycle
Impact Assessment (LCIA) Journal of Cleaner Production 19(6) 646-656
Pizzol M Laurent A Sala S Weidema B Verones F Koffler C (2016)
Normalisation and weighting in life cycle assessment Quo Vadis The
International Journal of LCA 1-14 doi 101007s11367-016-1199-1
Prado-Lopez V Seager TP Chester M Laurin L Bernardo M Tylock S (2014)
Stochastic multi-attribute analysis (SMAA) as an interpretation method for
comparative life-cycle assessment (LCA) Int J Life Cycle Ass 19(2)405-416
Pregrave Consultants (2015) SimaPro Database Manual - Methods library available at
httpswwwpre-sustainabilitycomsimapro-database-and-methods-library
(accessed February 2016)
Ponsioen TC Goedkoop MJ (2016) Midpoint weighting based on endpoint
information Submitted to The International Journal of Life Cycle Assessment
Rigamonti L Falbo A Zampori L Sala S (2017) Supporting a transition towards
sustainable circular economy sensitivity analysis for the interpretation of LCA for
the recovery of electric and electronic waste The International Journal of Life
Cycle Assessment 1-10 doi 101007s11367-016-1231-5
Rosenbaum RK Bachmann TM Gold LS Huijbregts MAJ Jolliet O Juraske R
Koehler A Larsen FH MacLeod M Margni M McKone TE Payet J Schuhmacher
M van de Meent D Hauschild MZ (2008) USEtoxmdashthe UNEP-SETAC toxicity
model recommended characterisation factors for human toxicity and freshwater
ecotoxicity in life cycle impact assessment The International Journal of Life Cycle
Assessment 13(7) 532-546
Sala S Wolf MA Pant R (2012) Characterization factors of the ILCD
Recommended Life Cycle Impact Assessment methods Database and Supporting
Information First edition EUR25167EN ISBN 978-92-79-22727 Luxembourg
Publications Office of the European Union Available at
httpeplcajrceceuropaeuuploads201401LCIA-characterization-factors-of-
the-ILCDpdf
Schau EM Davidsson B (2015) Product Environmental Footprint (PEF) Category
Rules (PEFCR) Pilot Intermediate Paper Product First Draft PEFCR July
2015Accessible for registered stakeholders at
49
httpswebgateeceuropaeufpfiswikisdisplayEUENVFPStakeholder+workspa
ce3A+PEFCR+pilot+Intermediate+paper+product
Schau EM Fet AM (2008) LCA studies of food products as background for
environmental product declarations The International Journal of Life Cycle
Assessment 13(3) 255-264
Schneider L Berger M Finkbeiner M (2011) The anthropogenic stock extended
abiotic depletion potential (AADP) as new parameterization to model the depletion
of resources The International Journal of Life Cycle Assessment 16(9) 929-936
Schneider L Berger M Finkbeiner M (2015) Abiotic resource depletion in LCAmdash
background and update of the anthropogenic stock extended abiotic depletion
potential (AADP) model The International Journal of Life Cycle Assessment
20(5) 709-721
Schreiber A Zapp P and Marx J (2012) Meta-Analysis of Life Cycle Assessment
Studies on Electricity Generation with Carbon Capture and Storage Journal of
Industrial Ecology 16 S155ndashS168
Seppaumllauml J Posch M Johansson M Hettelingh JP (2006) Country-dependent
Characterisation Factors for Acidification and Terrestrial Eutrophication Based on
Accumulated Exceedance as an Impact Category Indicator The International
Journal of Life Cycle Assessment 11(6) 403-416
Skone TJ (2000) What is Life Cycle Interpretation Environmental Progress 19
(2) 92-100
Steen BA (1999) A systematic approach to environmental priority strategies in
product life development (EPS) Version 2000 ndash Models and data of the default
method Chalmers University LindholmenJohanneberg
Stranddorf HK Hoffmann L Schmidt A (2005) Update on Impact Categories
Normalisation and Weighting in LCA - Selected EDIP97-data Environmental
Project Nr 995 Miljoslashprojekt httpwww2mstdkudgivPublications200587-
7614-570-0pdf87-7614-571-9PDF (accessed December 2015)
Tuomisto HL Hodge ID Riordan P Macdonald DW (2012) Exploring a safe
operating approach to weighting in life cycle impact assessment ndash a case study of
organic conventional and integrated farming systems Journal of Cleaner
Production 37147-153
UNEP- SETAC (2016) Hotspots Analysis an Overarching Methodological
Framework Draft document developed for UNEPSETAC Life Cycle Initiative -3
Flagship Project 3a (Phase 2) 11 october 2016 Available at
httpwwwwraporgukcontentprinciples-and-practices-hotspot-analysis
Van Hoof G Vieira M Gausman M Weisbrod A (2013) Indicator selection in life
cycle assessment to enable decision making issues and solutions International
Journal of Life Cycle Assessment 181568-1580
Van Zelm R Huijbregts M A van de Meent D (2009) USES-LCA 20mdasha global
nested multi-media fate exposure and effects model The International Journal
of Life Cycle Assessment 14(3) 282-284
Wackernagel M Monfreda C Moran D Wermer P Goldfinger S Deumling D
Murray M (2005) ―National Footprint and Biocapacity Accounts 2005 The
underlying calculation method Global Footprint Network Oakland California
USA
Weidema B Bauer C Hischier R Mutel C Nemecek T Reinhard J Vadenbo CO
Wernet G (2013) Overview and methodology Data quality guideline for the
ecoinvent database version 3
50
Williams ED Weber CL Hawkins TR (2009) Hybrid Framework for Managing
Uncertainty in Life Cycle Inventories Journal of Industrial Ecology 13 928ndash944
Wolf C Klein D Weber-Blaschke G Richter K (2015) Systematic review and
meta-analysis of life cycle assessment for wood energy services Journal of
Industrial Ecology 20 743 ndash 763
Zumsteg JM Cooper JS Noon MS (2012) Systematic Review Checklist Journal of
Industrial Ecology 16 S12ndashS21
51
List of abbreviations and definitions
AOX adsorbable organic halogens
BOD biochemical oxygen demand
BTEX benzene toluene xylene isomers
CFs characterisation factors
COD chemical oxygen demand
DQR data quality requirements
EcF ecological footprint
EF environmental footprint
ElFl elementary flow
HMs heavy metals
IC impact category
ILCD International Reference Life Cycle Data System
LCA life cycle assessment
LCI life cycle inventory
LCIA life cycle impact assessment
OEFSR organisation environmental footprint sector rules
PAH polycyclic aromatic hydrocarbons
PEF product environmental footprint
PEFCR product environmental footprint sector rules
PPP plant protection products
OEF organisation environmental footprint
TAB technical advisory board
TS technical secretariat
UNEPSETAC LCI Unep Setac Life cycle Initiative
VOC volatile organic compounds
WEEE waste electrical and electronic equipment
52
List of figures
Figure 1 Practical application of requirements in ISO 14044 and ILCD Handbook to
interpret LCI and LCIA results 5
Figure 2 Hotspot analysis in the context of the Environmental Footprint pilot (James amp
Galatola 2015) 8
Figure 3 Contribution analysis for the resource- related indicator calculated adopting
several characterization models (Rigamonti et al 2017) 27
53
List of tables
Table 1 Summary of requirements to define most relevant contributions and hotspots
(James amp Galatola 2015) 11
Table 2 Selection of most relevant Impact Categories (James amp Galatola 2015) 12
Table 3 Selection of most relevant life cycle stages (James amp Galatola 2015) 13
Table 4 Selection of most relevant processes (James amp Galatola 2015) 13
Table 5 Inventory results (climate change results expressed in gCOeq) (James amp
Galatola 2015) 14
Table 6 Most relevant inventory flows contributing to climate change (based on the
inventory results before normalisation and weighting) - overall life cycle (option 1)
(James amp Galatola 2015) 14
Table 7 Most relevant inventory flows contributing to climate change (based on the
inventory results before normalisation and weighting) ndash process level (option 2) (James
amp Galatola 2015) 14
Table 8 Hotspots based on 50 cumulative contribution (OPTION A) (James amp Galatola
2015) 15
Table 9 Hotspots based on top two representatives (OPTION B) (James amp Galatola
2015) 15
Table 10 Underlying assumptions in relation to the three databases considered by the
authors (Corrado et al 2017) 17
Table 11 Data quality rating in an example of intermediate paper products (EC 2013
Schau and Davidsson 2015) 20
Table 12 Data quality rating in an early phase of a PEF study of intermediate packaging
paper 21
Table 13 Example of check of inventoried elementary flows that are not characterized by
two impact assessment methods (based on Castellani et al 2017) 29
Table 14 List of impact categories listed in ILCD with total number of elementary flows
contributing to each IC 30
Table 15 Type of chemicals (mass and number of EFs) not characterized per emission
compartment (air oxygen and hydrogen have been excluded) 31
Table 16 Most relevant elementary flows contributing cumulatively up to 90 to the
freshwater ecotoxicity impact category with USEtox 32
Table 17 Summary of normalization sets used in the sensitivity analysis in Castellani et
al (2016) 33
Table 18 Results of sensitivity analysis on normalization sets at the European and global
scale for ILCD- and CML-IA methods (Castellani et al 2016) The percentages
represent the contribution of each product group to the total impacts of the BoP per
citizen (reference flow) Equal weighting of impact categories is applied The second
column reports the mass of each product group in the basket A color scale is applied to
the results in each column (ie product group) from green (lowest contribution) to red
(highest contribution) 34
Table 19 Results of sensitivity analysis on normalization sets at the European and global
scale for ILCD and CML-IA methods (Castellani et al 2016) The percentages reflect
the relative relevance of impact categories compared to the total impacts of the BoP per
citizen (reference flow) A colour scale is applied to the results in each column (ie
impact category) from green (lowest contribution) to red (highest contribution) 35
54
Table 20 Summary of weighting sets used in the sensitivity analysis by Castellani et al
(2016) 36
Table 21 Product groups contribution Results of several ILCD-compliant weighting sets
in combination with normalization references EU27 (Castellani et al 2016) A color scale
is applied to the results in each column (ie product group) from green (lowest
contribution) to red (highest contribution) 37
Table 22 Relevance of the different impact category Results of the application of several
ILCD-compliant weighting sets in combination with normalization references EU27
(Castellani et al 2016) A color scale is applied to the results in each column (ie
impact category) from green (lowest contribution) to red (highest contribution) 38
Europe Direct is a service to help you find answers
to your questions about the European Union
Freephone number ()
00 800 6 7 8 9 10 11 () The information given is free as are most calls (though some operators phone boxes or hotels may
charge you)
More information on the European Union is available on the internet (httpeuropaeu)
HOW TO OBTAIN EU PUBLICATIONS
Free publications
bull one copy
via EU Bookshop (httpbookshopeuropaeu)
bull more than one copy or postersmaps
from the European Unionrsquos representations (httpeceuropaeurepresent_enhtm) from the delegations in non-EU countries (httpeeaseuropaeudelegationsindex_enhtm) by contacting the Europe Direct service (httpeuropaeueuropedirectindex_enhtm) or calling 00 800 6 7 8 9 10 11 (freephone number from anywhere in the EU) () () The information given is free as are most calls (though some operators phone boxes or hotels may charge you)
Priced publications
bull via EU Bookshop (httpbookshopeuropaeu)
XX-N
A-x
xxxx-E
N-N
doi102788171315
ISBN 978-92-79-64114-5
LB-N
A-2
8266-E
N-N
4
2 A practical scheme to interpret LCI and LCIA results
The initial step of the interpretation phase is to review information from the first three
phases of the LCA process such as the ones used to build the study goals and scope
quality assurance procedures reporting requirements results assumptions external
involvement (eg stakeholders peer reviews) (Skone 2000)
Both ISO 14044 and the ILCD Handbook (EC-JRC 2011a) propose a scheme with the
elements to be considered in the interpretation phase and their relation to the other
phases of the LCA study
The elements can be grouped in
identification of significant issues (based on the results of the LCI and LCIA
phases)
the purpose of this first element of interpretation is to analyse and structure the
results of earlier phases of the LCILCA study in order to identify the significant
issues There are two interrelated aspects of significant issues i) firstly there are
the main contributors to the LCIA results ie most relevant life cycle stages
processes and elementary flows and most relevant impact categories ii)
secondly there are the main choices that have the potential to influence the
precision of the final results of the LCA These can be methodological choices
assumptions foreground and background data used for deriving the process
inventories LCIA methods used for the impact assessment as well as the
optionally used normalisation and weighting factors
evaluation that considers completeness sensitivity and consistency checks
Completeness checks on the inventory are performed in order to determine the
degree to which it is complete and whether the cut-off criteria have been met
Sensitivity checks have the purpose to assess the reliability of the final results
and of the conclusions and recommendations of the LCA study The consistency
check is performed to investigate whether the assumptions methods and data
have been applied consistently throughout the LCILCA study
conclusions limitations and recommendations
Integrating the outcome of the other elements of the interpretation phase and
drawing on the main findings from the earlier phases of the LCA the final
element of the interpretation is to draw conclusions and identify limitations of the
LCA and to develop recommendations for the intended audience in accordance
with the goal definition and the intended applications of the results
In this report a schematic workflow representing a practical approach to interpret LCI
and LCIA results is proposed in Fig1 building on both ISO 14044 (ch 4511) and the
ILCD Handbook (ch 91) (EC-JRC 2011a) The workflow is to be seen as an iterative
approach to finally draw robust conclusions and recommendations
The scheme should not be seen as substituting the approaches of the ISO 14044 and the
ILCD Handbook instead it should be seen as a practical application of the requirements
laid down in these documents
Furthermore the scheme should not be intended as a comprehensive list of items to
check instead it should be seen as a normal workflow that should be carried out by an
LCA practitioner in order to derive robust conclusions out of the LCA study More
accurate and case-specific checks should be done depending on the intended goal and
scope of the study
Further aspects such as the appropriateness of the functional unit the intended goal
the system boundaries and value choices should normally be part of an interpretation in
order to identify recommendations and limitations of the study and draw the appropriate
conclusions They are not discussed further in this report but it is recommended that at
5
least each decision based on a personal or a stakeholderrsquos value shall always be
documented and explained in the conclusions of the LCA study This is consistent with
one of the key aims of LCA which is to provide the decision makers with comprehensive
and understandable information in a transparent manner
Figure 1 Practical application of requirements in ISO 14044 and ILCD Handbook to interpret LCI and LCIA results
6
3 Identification of key issues Hotspots analysis
In order to get started with interpretation of results it is necessary to identify what the
key issues are Once the key issues are identified it is possible to further evaluate the
overall robustness of the LCA study by using for example completeness consistency and
sensitivity checks
This chapter on hotspot analysis gives an overview of the overarching methodological
framework of hotspot analysis as currently developing with the UNEPSETAC Life Cycle
Initiative - Flagship Project 3a and the hotspot analysis as tested in the Environmental
Footprint (EF) pilot phase (2013 ndash 2017) In the first case hotspot analysis is regarded
as a subject on its own in the second case it is shown a practical way to perform a
hotspot analysis in an environmental footprinting context in the EU Environmental
Footprint it is more focused on the interpretation of the screening study results of the
average or representative product1 The hotspots in a EU Environmental Footprint may
be but does not have to found in a contribution analysis of the characterized results
Therefore in this chapter we first describe the hotspot analysis as outlaid in the
UNEPSETAC LCI and then the hotspot analysis as performed in the EF pilot phase
31 The hotspot analysis in the UNEPSETAC Life Cycle Initiative
The UNEPSETAC Life Cycle Initiative has been running a Flagship project (nr 3a) on
hotspot analysis since 2012 until 2017 According to UNEPSETAC (2016) the benefits
of hotspots analysis include ensuring
Focus on priority issues (eg waste water materials of concern)
Focus on the right life cycle stage (eg material acquisition manufacturing use
end of life)
Focus on the right actors (eg producers manufactures suppliers retailers
customers) to evaluate influence and implement solutions
Implications of trade-offs are understood
Resources (eg time money) can be effectively allocated to actions
Previously there was not currently a common global approach to hotspots analysis nor
has there been sufficient effort to bring together or share best practice amongst those
organisations or initiatives currently developing and using these methods Nor was there
any accepted guidance on how to translate and apply the results of hotspots analysis
into meaningful sustainability information and insight for use by industry governments
and other stakeholders Therefore the UNEP SETAC Life Cycle Initiative established a
new Flagship Project to address these and other issues The objectives of the
UNEPSETAC LCI Flagship Project 3 are to produce
1 A common methodological framework and global guidance for sustainability hotspots analysis
2 A protocol for the appropriate use and communication of sustainability information derived from hotspots analysis
3 To evaluate and if possible implement a range of options to bring together the findings from existing hotspots studies to provide a richer global picture of sustainability hotspots in the economy and society
Phase 1 was finished in December 2014 and gives an overview of different tools and
methods that can be used in the hotspot analysis This includes 42 hotspots analysis
1 In the context of the EF pilot phase within each Product Environmental Footprint Category Rule
(PEFCR) pilot a ldquorepresentative productrdquo has to be defined which is representing gt50 of the European market The PEF screening study is a PEF study conducted on the representative product one of the aims of the screening study is to identify the hotspots most relevant
elementary flows processes and life cycle stages
7
methodologies divided into product sector and national scale of application Of these 21
methodologies (4 at the national-level 5 at the sector-level and 12 predominantly
applied at the product category-level) were shortlisted and further analysed Examples
of methods are EU EIPRO and Global Protocol for Community Scale GHG emissions on
the national level GHG Protocol Corporate Value Chain (Scope 3) Accounting and
Reporting Standard and Sustainability Accounting Standards Board Materiality Maptrade on
the sector level and French Grenelle I and II BPX 30-323-0 Product Lifecycle
Environmental Impact Quantification Guidance Standard and Water Quality Association
(WQA) Hotspots Analysis on the product level Please refer to Figure ES 2 in (Barthel et
al 2014) for the complete list
This first phase of the project fed into the second phase of the Flagship project
Phase 2 is running from January 2015 ndash January 2017 and produces the methodological
framework (UNEPSETAC 2016) and the communication guidance2 These are currently
in a six-weeks public consultation (27 Oct ndash 15 Dec 2016) The framework provides
a recognized set of guiding principles and practices for hotspots analysis
a globally agreed methodological framework for hotspots analysis
agreement on the appropriate use and communication of product sustainability
information derived from hotspots analysis
Future step will be to work with hotspot analysis for cities and regions and road testing
of the methodological framework
32 The hotspot analysis in the Environmental Footprint pilot
phase (2013 ndash 2017)
The 2013-2017 Environmental Footprint (EF) pilot phase has three main objectives
test the process for developing product- and sector-specific rules
test different approaches to verification
test communication vehicles for communicating life cycle environmental
performance to business partners consumers and other company stakeholders
This is tested by groups of organisations called Technical Secretariats (TS) who
volunteered to develop the rules for their product or sector
The hotspot analysis as described below were tested and developed in an iterative way
on the approximatively 25 pilots participating in the EF pilot phase to develop Product
Environmental Footprint (PEF) Category Rules (PEFCR) or Organisation Environmental
Footprint (OEF) Sector Rules (OEFSR)
A hotspot analysis is required for the PEFOEF screening studies of the average or
representative product for the PEFCROEFSR and for the supporting studies3 (EF study of
a single productorganisation belonging to the product categorysector) when developing
PEFCROEFSR (PEFCR Guidance document (EC 2016))
The hotspot analysis in the EF context aims to identify the hotspots the most relevant
impact categories life cycle stages processes and elementary flows as shown in Fig 2
and it provides a guidance on how to do that
2 Communicating hotspots The effective use of sustainability information to drive action and improve
performance from httpwwwwraporguksitesfileswrapHotspots20Communications20Guidelines20v35207Oct2016pptx 3 The EF supporting studies are PEFOEF studies run by single companies with the aim of testing the draft
PEFCRs and OEFSRs
8
Figure 2 Hotspot analysis in the context of the Environmental Footprint pilot (James amp Galatola 2015)
As shown in the figure the hotspots (and thereby also the hotspot analysis) is important
for the decision on which life cycle stages processes and elementary flows that are
hotspots (gt 50 contribution) and which are relevant (gt 80 contribution)
The hotspots might serve the purpose of warning an organisation about the area where
they should focus their attention in order to improve the environmental performance of a
product (PEF) or an organisation (OEF) Whilst traditionally LCA practitioners are
expected to provide primarysite-specific data for processes taking place in the
foreground and secondary data for processes taking place in the background in PEFOEF
the implementation of the materiality principle leads to a different approach The
processes most contributing to the final results (in terms of environmental impacts or
savings) are those for which the best quality of data should be provided For the
processes less relevant it is possible to use data of lower quality
321 Procedure to identify the most relevant impact categories Starting from the normalised and weighted results of PEF screening study each
Technical Secretariat is asked to select the impact categories that they consider more
relevant in terms of communication purposesrdquo
322 Procedure to identify the most relevant life cycle stages
The proposed guideline by the PEFCR Guidance (EC 2016) is to consider as relevant all
life cycle stages which together contribute over 80 (before normalisation and
weighting) to any of the baseline impact categories This should start from the largest to
the smallest contributions In addition more life cycle stages can be added to the list of
the most relevant ones
In order to guarantee a minimum level of harmonisation among different
PEFCRsOEFSRs a list of default life cycle stages was identified
Raw material acquisition and pre-processing (including production of parts and
unspecific components)
9
Production of the main product4
Product distribution and storage
Use stage scenario (if in scope)
End-of-life (including product part reuse recovery recycling if in scope)
323 Procedure to identify the most relevant processes
Each impact category shall be investigated to identify the most relevant processes The
identification of the most relevant processes shall be done at the whole life cycle level
Similaridentical processes taking place in different life cycle stages (eg transportation)
shall be accounted separately
In the context of the EF pilot phase processes were defined as most relevant where they
collectively contributed at least 80 to any impact category before normalisation and
weighting
In some instances vertically aggregated datasets may be identified as representing
relevant processes It may not be obvious which process within an aggregated dataset
is responsible for contributing to an impact category The metadata accompanying the
data should be reviewed and used to identify relevant processes If this is not possible it
can be decided whether to seek further disaggregated data or to treat the aggregated
dataset as a process for the purposes of identifying relevance5
324 Procedure to identify the most relevant elementary flows
As far as the most relevant elementary flows is concerned they are the ones contributing
cumulatively more than 80 to the impact category It can be decided whether this is
calculated at the level of overall life cycle and or single (most relevant) process level
All elementary flows contributing more than 5 to the impact category shall be
considered as relevant
Once the most relevant elementary flows have been identified they shall be linked to the
processes emitting them
325 Procedure to identify the hotspots
A hotspot can be identified at different levels of granularity impact category life cycle
stage process or elementary flow
In the context of PEFOEF pilot phase a hotspot is defined as either (James and Galatola
2015)
OPTION A (1) life cycle stages (2) processes and (3) elementary flows
cumulatively contributing at least 50 to any impact category before
normalisation and weighting (from the most contributing in descending order)
OPTION B At least the two most relevant life cycle stages processes and at least
two elementary flows (minimum 6) Additional hotspots may be identified by the
TS
4 If it is not possible to differentiate between the production of the main product and ancillary materials and
other life cycle stages eg raw material acquisition and transport then these life cycle stages can be merged Adequate justifications shall be provided in the screening report and be highlighted in the consultation phase If an aggregated life cycle stageprocess is most relevant it implies that all the processes included will be classified as most relevant 5 In this last case if an aggregated dataset is relevant everything in it is automatically relevant
10
326 Dealing with negative numbers
When identifying the percentage contribution from any process or flow it is important
that absolute values are used (ie the minus sign is ignored) in calculating percentage
contributions This allows indentifying the relevance of any credits
327 Specific instructions about aggregating elementary flows
The toxicity-related impact categories (ldquoHuman toxicity cancer effectsrdquo ldquoHuman
toxicity non-cancer effectsrdquo and ldquoFreshwater ecotoxicityrdquo) contain long lists of
characterization factors specified on the elementary flow category level 3 (also known
as sub-compartment ndash for example urban air freshwater agricultural soil) The impact
category ldquoParticulate matterrdquo also contains characterization factors at the level 3
category
It is recommended to aggregate the elementary flows on the level 2 category (ie
emissions to air water soil) in the contribution analysis This is to make the analysis
more manageable and because the level 3 category does not give additional information
when analyzing on the process level (the processes already contain information on the
location type of the emissions)
It is important to model foreground data on the level 3 category for particulates and
toxic substance flows because the characterization factors can deviate considerably
Metal resource flows are not specified per origin of ore type in the source files of the
ILCD recommended methods However in several background databases metal
resource flows are differentiated (for example Silver Ag 46E-5 Au 13E-4 in ore
Silver Ag 42E-3 Au 11E-4 in ore Silver Ag 21E-4 Au 21E-4 in ore etc)
Therefore the specified flows were added to the ILCD method in LCA software packages
with the same characterization factors as for the unspecified metals When doing a
contribution analysis of the metal resource flows it is therefore recommended to
aggregate the flows per metal (silver copper nickel etc)
There are 5 different fossil fuel related resource flows specified in the source files of the
ILCD recommended methods (brown coal 119 MJkg crude oil 423 MJkg hard coal
263 MJkg natural gas 441 MJkg peat 84 MJkg) However in several background
databases fossil resource flows are specified with different calorific values (for example
Gas natural 468 MJ per kg Gas natural 366 MJ per m3 Gas natural 35 MJ per m3
Gas natural 303 MJ per kg etc) Therefore the specified flows were added to the
ILCD method in LCA software packages with characterization factors related to the
factors in the original source taking the different calorific value into account When
doing a contribution analysis of the fossil resource flows it is therefore recommended to
aggregate the flows based on the 5 original flows (brown coal crude oil hard coal
natural gas and peat)
328 Conclusions
In table 1 the requirements to define most relevant contributions during the EF pilot
phase are summarized as found in the PEFCR Guidance (EC 2016)
11
Table 1 Summary of requirements to define most relevant contributions and hotspots (James amp Galatola 2015)
Item At what level does relevance need to be identified
Threshold
Most relevant impact categories In the final results starting from normalized and weighted results but deviations possible if justified
No threshold Decision left to TS but subject to stakeholder consultation and TAB opinion
Most relevant life cycle stages For each impact category before normalization and weighting Not relevant for data needs identification
All life cycle stages contributing cumulatively more than 80 to any impact category
Hotspots For each impact category before normalization and weighting
Either (i) life cycle stages processes and elementary flows cumulatively contributing at least 50 to any impact category or
(ii) at least the two most relevant impact categories life cycle stages processes and at least two elementary flows (minimum 6) Additional hotspots may be identified by the TS
Most relevant processes For each impact category before normalization and weighting Essential for data needs identification
All processes contributing cumulatively more than 80 to any impact category
Most relevant elementary flows For each impact category before normalization and weighting Essential for data needs identification
All elementary flows contributing cumulatively more than 80 to any impact category and in any case all those contributing more than 5 individually
When assessing what is most relevant it is also recommended to check if what is
identified as being non-relevant can be actually considered as such A practical example
is given at paragraph 431
12
329 Example to identify most relevant contributions and hotspots
The PEFCR Guidance (2016) also provided an example on how to perform a hotspot
analysis and the identification of most relevant impact categories life cycle stages
processes and elementary flows The example is reported here it is a fictitious example
not based on any specific PEF study results
3291 Example most relevant Impact Categories
Table 2 shows the contribution of different impact categories based on normalised and
weighted results
Table 2 Selection of most relevant Impact Categories (James amp Galatola 2015)
Impact category Unit Contribution ()
Climate change kg CO2 eq 215
Ozone depletion kg CFC-11 eq 30
Human toxicity cancer effects CTUh 83
Human toxicity non-cancer effects CTUh 149
Particulate matter kg PM25 eq 01
Ionizing radiation human health Kbq U235 eq 05
Photochemical ozone formation kg NMVOC eq 24
Acidification molc H+ eq 15
Terrestrial eutrophication molc N eq 10
Freshwater eutrophication kg P eq 10
Marine eutrophication kg N eq 01
Freshwater ecotoxicity CTUe 01
Land use kg deficit 143
Water resource depletion m3 water eq 186
Mineral fossil resource depletion kg Sb eq 127
Based on the normalised and weighted results the TS can decide that the following
impact categories are relevant for communication purposes climate change water
depletion and land use Where there is deviation from the most significant contributors
to the normalised and equally weighted results justification shall be provided
Once the relevant impact categories for communication purposes have been selected
the TS shall start identifying the most relevant life cycle stage processes and flows per
each impact category (all baseline EF impact categories not only those relevant for
communication purposes)
13
3292 Example most relevant Life Cycle Stages
Table 3 shows the contribution of different life cycle stages to the climate change impact
category (based on the characterised inventory results before normalisation and
weighting)
Table 3 Selection of most relevant life cycle stages (James amp Galatola 2015)
Life cycle stage Contribution ()
Raw material acquisition and pre-processing 421
Production of the main product 252
Product distribution and storage 164
Use stage (if in scope) 108
End-of-life 55
The three life cycle stages in purple will be the ones identified as most relevant for
climate change as they are contributing to more than 80 This procedure shall be
repeated for all the baseline EF impact categories
3293 Example most relevant Processes
Table 4 shows the contribution of different processes to the climate change impact
category (based on the characterised inventory results before normalisation and
weighting)
Table 4 Selection of most relevant processes (James amp Galatola 2015)
Unit process Contribution ()
Process A 89
Process B 614
Process C 234
Process D 28
Process E 15
Process F 09
Other processes 09
According to the proposed procedure the processes in orange shall be selected as ldquomost
relevantrdquo Process E could be added to the as most relevant ones based on specific
considerations (eg it is under operational control it is of relevance for the specific
sector etc) This procedure shall be repeated for all the baseline EF impact categories
3294 Example most relevant Elementary Flows
Considering that the selection of the most relevant elementary flows can be done at
overall life cycle level (option 1) andor per relevant process (option 2) there are two
14
possible outcomes Starting from the inventory results provided in Table 5 the list of
most relevant flows are highlighted in blue in Table 6 (at overall life cycle) and Table 7
(at process level)
Table 5 Inventory results (climate change results expressed in gCOeq) (James amp Galatola 2015)
Inventory flow Substance 1 Substance 2 Substance 3 Substance 4 Substance 5 Total
Process A 249 85 6 45 5 390
Process B 1100 600 500 450 50 2700
Process C 300 250 20 30 430 1030
Process D 60 30 20 10 5 125
Process E 64 1 1 1 1 68
Process F 15 10 8 5 3 41
Other processes 15 10 8 5 3 41
Total 1803 986 563 546 497 4395
Table 6 Most relevant inventory flows contributing to climate change (based on the inventory results before normalisation and weighting) - overall life cycle (option 1) (James amp Galatola 2015)
Inventory flow Substance 1 Substance 2 Substance 3 Substance 4 Substance 5 Total
Process A 57 19 01 10 01 89
Process B 250 137 114 102 11 614
Process C 68 57 05 07 98 234
Process D 14 07 05 02 01 28
Process E 15 00 00 00 00 15
Process F 03 02 02 01 01 09
Other processes 03 02 02 01 01 09
Total 410 224 128 124 113
Table 7 Most relevant inventory flows contributing to climate change (based on the inventory results before normalisation and weighting) ndash process level (option 2) (James amp Galatola 2015)
Inventory flow Substance 1 Substance 2 Substance 3 Substance 4 Substance 5 Total
Process A 64 22 2 12 1 100
Process B 41 22 19 17 2 100
Process C 29 24 2 3 42 100
15
Process D 48 24 16 8 4 100
Process E 94 1 1 1 1 100
Process F 37 24 20 12 7 100
Other processes 37 24 20 12 7 100
3295 Example hotspots
In Tables 8 and 9 the identified hotspots - based on the two different approaches
available- are presented
Table 8 Hotspots based on 50 cumulative contribution (OPTION A) (James amp Galatola 2015)
Hotspots
Life cycle stages Raw material acquisition and pre-processing
Production of the main product
Processes Process B
Elementary flows Option 1 Substance 1 and 2
Option 2
Substance 1 and 2 in processes B
Substance 1 and 5 in process C
Substance 1 in process E
Table 9 Hotspots based on top two representatives (OPTION B) (James amp Galatola 2015)
Hotspots
Life cycle stages Raw material acquisition and pre-processing
Production of the main product
Processes Process B
Process C
Elementary flows Option 1 Substance 1 and 2 in process B
Option 2 Substance 1 in process E6 and substance 5 in process C
4 Interpretation on Life Cycle Inventory (LCI) level
During the life cycle inventory phase the actual data collection and modelling of the
system has to be done in line with the goal definition and aiming at meeting the
requirements derived in the scope phase The LCI results are the input to the
subsequent Life Cycle Impact Assessment (LCIA) phase
Interpretation involves evaluations at the level of Life Cycle Inventory in order to
improve the inventory model to meet the needs derived from the study goal
perform a sensitivity analysis to check for limitations in the appropriateness of
the life cycle inventory work
6 Choosing the hotspots based on option B-2 might lead to anomalies (like in this fictitious
example) where an elementary flow is identified as hotspot even if its absolute value is not
prominent
16
understanding the underlying assumptions when secondary datasets are used in
the model
combining the above points to refine the LCA model
draw appropriate and robust conclusions
Key aspects to evaluate life cycle inventories are the consistency and completeness
thereof They can be evaluated taking into account different aspects A sensitivity check
to evaluate the reliability of the results is also a needed step
A first aspect to be taken into account is the data source Primary data are collected
directly by the company performing the study thus the consistency of the data used
with the goal and scope of the study should be more straightforward However when
and LCA study is making use of secondary datasets to model the background system a
careful analysis of the consistency of these datasets with the primary data collected and
in relation with the goal and scope shall be made
Indeed different modelling assumptions in datasets aimed at representing the same
product system can lead to different results affecting the reliability of the LCA study
(Williams et al 2009) An example of the relevance of different data sources and
consistency has been discussed in Corrado et al (2017) this study focuses on different
data sources to originate the inventory of arable crops (1 kg of wheat) The choice of the
secondary dataset can have a relevant influence on LCA results and it is considered
among the challenges for a robust LCA (Notarnicola et al 2017a)
A second aspect to be taken into account regarding life cycle inventories is the quality of
the data used regarding time geographical and technological representativeness
precision methodological compliance and documentation Therefore in this chapter a
paragraph is dedicated to analyzing more in detail this aspect
A third relevant aspect in relation to LCIs is the consistency and completeness in relation
to single aspects such as cut-off inclusionexclusion of specific elementary flows (eg
long term emissions) It is not straightforward to judge if an inventory can be considered
complete As a general rule it has always to be kept in mind that the inventory has to
be checked in its completeness in relation to the goal and scope of the study for
example if the goal of the study is to assess only the climate change impact category
the completeness of the inventory shall be evaluated against those emissions that are
actually contributing to climate change within the system boundaries It does not lead to
improved conclusions the compilation of a more detailed inventory with the inclusion of
eg substances that do not contribute to climate change
41 Analysis of data sources
When selecting secondary data sets it is important to ensure that all data sets used in
the modelling of the system model are methodologically consistent (ie consistency
check) The use of inconsistent data can lead to an unreliable and distorted LCA study
often with wrong conclusion and recommendations drawn Furthermore use of datasets
with different level of completeness (ie completeness checks) may also lead to
unreliable conclusions
The study from Corrado et al (2017) is used as a case study to highlight the relevance
of different data sources in an LCA study Therefore the content of this paragraph is
mainly based on this paper The paper is organized as follows firstly the authors report
an overview of the system boundaries and underlying assumptions adopted in building
secondary datasets for arable crops within three databases Secondly they summarise
the approaches adopted to model the foreground system highlighting analogies and
differences Afterwards they point out the influence that modelling approaches can have
on the impact assessment Finally the combination of these elements allowed to derive
some considerations on relevant elements of datasets
17
It is focused on the analysis of secondary datasets for arable crops production as
modelled in three databases adopted as source of secondary data in LCA Agribalyse v
12 (Colomb et al 2015) Agrifootprint v 10 (Blonk Agri-footprint BV 2014) and
Ecoinvent v 31 (Weidema et al 2013) For simplicity in the remainder of the report
they are named Agribalyse Agrifootprint and Ecoinvent respectively
The authors performed three types of analysis
comparison of the system boundaries and underlying assumptions
analysis of how the foreground system is modelled in each dataset focusing on
different aspects such as fertilisers application and nutrient fate plant
protection products application and fate heavy metals (HMs) input mass balance
and fate irrigation agricultural operations land occupation and transformation
comparison of the results of the life cycle impact assessment for the foreground
system including the relative contribution of background
411 Analysis of the system boundaries
The system boundaries and the main underlying assumptions adopted to model arable
crops production in the three databases are reported in Table 10
Table 10 Underlying assumptions in relation to the three databases considered by the authors (Corrado et al 2017)
Agribalyse Agrifootprint Ecoinvent
Data source Provided by technical institutes (eg ARVALIS ndash Institut du Veacutegeacutetal)
Different sources (eg
scientific literature official
statistics such as FAOstat
Eurostat)
GL-Pro project ndash Barrois
region (Nemecek and
Baumgartner 2006)
Straw management (when
applicable)
Partly removed from the
field
Totally removed from the
field
Left on the field
Allocation of co-products
(grains and straw)
Not applied because the
straw market was not very
structured at the time when
the datasets were developed
Economic mass and energy
allocation
Not applicable because
straw is assumed to be left
on the field
Nutrients from straw left
on the field
The fertilising effect of crop
residues and emissions from
the residues are allocated to
the crop that generated the
residues
Not applicable The fertilising effects of crop
residues are allocated to the
crop that generated it (only
for P and K) The amount of
fertilisers is corrected for the
amount of nutrients in crop
residues
Crop
rotation
modelling
Phosphorou
s (P) and
potassium
(K) inputs
and
emissions
allocation
P and K fertilisers production
and emissions due to their
application are allocated to
each crop pro rata for the
crop exports
Not reported The amount of P and K of the
residues supplied to the field
through residues were
allocated to the crop that
generates them
18
N inputs and
emissions
allocation
The organic nitrogen
available for the crop to
which the fertiliser is
applied is allocated to that
crop The remaining fraction
that contributes to
increasing the stock of
organic matter was allocated
to all the crops in the
rotation Mineral nitrogen is
completely allocated to the
crop to which it was applied
Not reported Allocation not performed
412 Foreground system analysis
The authors compared the activities modelled in the foreground system of the datasets
referring to seven field activities agricultural operations fertilisers application and
nutrients environmental fate plant protection products (PPP) application and related
environmental fate heavy metals (HMs) input and related environmental fate irrigation
and land occupation and transformation The average crop yields reported in the dataset
presents small differences (wheat min-max barley min-max rapeseed min-max pea
min-max) The 95 confidence interval of the yields is defined only in Agrifootprint
datasets whereas it is not reported in Agribalyse and Ecoinvent datasets
For completeness findings and aspects to be taken into account are below reported The
below checklist can also be used to build a completeness check of the different datasets
and it can be used to build a sensitivity analysis based on the parameters that are seen
to be affecting the final results
Agricultural practices modelling
Management of agricultural residues
Composition of the crop rotation
Allocation to the co-products
Agricultural operations modelling
Number of operations
Number of passages
Machine power
Soil texture
Airborne emissions due to fuel combustion
Emissions of heavy metals due to tires abrasion
Fertilisers application and nutrients fate modelling
The nutrients fate is highly influenced by site-specific conditions
o environmental conditions
o soil type
o agricultural management practices
o type of fertiliser (Brentrup et al 2000)
o spatial differentiated emissions when modelling agricultural systems
Nomenclature (eg the paper shows that phosphorus compounds emissions were
expressed in the datasets with different flows limiting the possibility of making a
comparison among inventory data)
PPP application and environmental fate modelling
19
application method
weather and soil conditions
crop characteristics
irrigation
active substances whose use is not anymore authorised
Heavy metals inputs and environmental fate modelling
Mass balance
Fate
Irrigation modelling
Irrigation volumes
Water flows type
Environmental conditions
Spatially-differentiated water flows
Land use transformation modelling
Amounts of transformed land are considered
Type of land transformed (eg from hellip to hellip)
CO2 emissions due to land transformation
42 Data quality
As data is essential in all quantitative studies like LCAs so is also their quality
Therefore the data applied in the life cycle inventory phase shall be assessed in the
interpretation phase against the goal and scope of the study is the data quality
sufficient for the goal of the study Is the data consistent Can the data be seen as
complete
If the answer is yes then the interpretation can be preceded and conclusions drawn If
no then either the goal and scope need to be adjusted or probably in most cases
better the life cycle inventory phase need to be revisited in an iterative manner to
improve the data quality to the appropriate level The assessment of the data quality is a
mandatory reporting element in the interpretation phase
ISO 14044 (2006) defines data quality as characteristics of data that relate to their
ability to satisfy stated requirements The data quality requirements are described in
the goal and scope of the LCA study and covers the following 10 aspects (ISO14044
2006 ch 4236)
1) time-related coverage age of data and the minimum length of time over which
data should be collected
2) geographical coverage geographical area from which data for unit processes
should be collected to satisfy the goal of the study
3) technology coverage specific technology or technology mix
4) precision measure of the variability of the data values for each data expressed
(eg variance)
5) completeness percentage of flow that is measured or estimated
6) representativeness qualitative assessment of the degree to which the data set
reflects the true population of interest (ie geographical coverage time period
and technology coverage)
7) consistency qualitative assessment of whether the study methodology is applied
uniformly to the various components of the analysis
20
8) reproducibility qualitative assessment of the extent to which information about
the methodology and data values would allow an independent practitioner to
reproduce the results reported in the study
9) sources of the data
10) uncertainty of the information (eg data models and assumptions)
In the EF methods7 the consistency and reproducibility is one of the main aims of any
EF study and not evaluated as part of the data quality assessment Data sources should
be ILCDEF compliant and specified if a PEFCROEFSR is followed Precision and
uncertainty are evaluated together in the EF method Therefore the EF operates with six
semi qualitative data quality requirements instead of 9 in ISO14044 (cf section 56 in
European Commission 2013)
In order to evaluate the appropriateness and the quality of the data used to compile the
LCI they have to be scored against certain requirements As an example the table below
(Table 11) provides the data quality requirements for a PEF study of intermediate paper
products (EC 2013a Schau and Davidsson 2015)
The table 12 shows the semi-qualitative data quality rating (DQR) (based on expert
judgement) of the most impacting processes in an early phase of a PEF study of
intermediate packaging paper The data set DE Potato starch at plant was deemed to
be of too low quality (DQR = 267) as it scored poor (4) on Parameter uncertainty and
Methodological Appropriateness and Consistency to be used for comparative assertion
Therefore another dataset was searched for that was compliant with the goal and scope
of the study
It is also recommended that the practitioner is aware of the methodological choices used
to build the datasets (may be evaluated under Methodological Appropriateness and
Consistency) such as the definition of the system boundaries between nature and
technosphere and the time-horizons of the emissions (short-termlong term)
System boundaries between nature and technosphere are especially relevant for food
and agricultural product (and products made thereof) as for these products the
technosphere is closely interlinked with nature (Schau et al 2008) This includes
modelling of pesticides and fertilizers (De Schryver and Galatola 2016)
The time-horizons of the emissions are essential especially for long lived product and for
end-of-life processes (eg landfilling waste handling of residues from mining in raw
material extraction) (Guo and Murphy 2012) Also how radioactive waste is modelled is
essential to assess with a time horizon in mind Often a distinction is made between
long term and short term emission Where the boundary is set between those (100
years 300 years 50 000 years etc) can therefore be important and should be taken
into account when assessing the data quality for methodological appropriateness and
consistency (see chapter 433)
Database providers publish their modelling principle (see eg Baitz et al 2016) which is
an essential source for evaluating and assessing the data quality (of background data) in
addition to the metadata of the LCI data itself
Table 11 Data quality rating in an example of intermediate paper products (EC 2013 Schau and Davidsson 2015)
7 In the EF Guide the term representativenessrdquo is used instead of coveragerdquo used in ISO 14044 for the
geographical and time-related data quality requirement The term ldquoparameter uncertaintyrdquo is used instead of ldquoprecisionrdquo used in ISO14044 and the term ldquomethodological appropriateness and consistencyrdquo is used in the EF Guide instead of ldquoconsistencyrdquo used in ISO14044
21
Data quality elements
Representativeness
Qu
alit
y level
Qu
alit
y r
atin
g
Defin
itio
n
Tech
no
log
ica
l
Ge
og
rap
hic
al
Tim
e-r
ela
ted
Com
ple
ten
ess
Meth
od
olo
gic
al
Ap
pro
priate
ness a
nd
Co
nsis
tency
Pa
ram
ete
r u
nce
rta
inty
Very good
1
Meets the criterion to a very high degree without need for improvement
Eg Process is same For electricity from grid average technology as country- specific consumption mix
Country specific data
le 3 years old data
Very good completeness (ge 90 )
Full compliance with all requirements of the PEF guide
Very low uncertainty (le 7 )
Good
2
Meets the criterion to a high degree with little significant need for improvement
Eg average technology as country- specific consumption mix
Central Europe North Europe representative EU 27 mix
3-5 years old data
Good completeness (80 to 90 )
Attributional Process based approach AND following three method requirements of the PEF guide met (1) Dealing with multi-functionality (2) End of life modelling (3) System boundary
Low uncertainty (7 to 10 )
Fair 3
Meets the criterion to an acceptable degree but merits improvement
Eg average technology as country- specific production mix or average technology as average EU consumption mix
EU-27 countries other European country
5-10 years old data
Fair completeness (70 to 80 )
Attribution Process based approach AND two of the following three method requirements of the PEF guide met (1) Dealing with multi-functionality (2) End of life modelling (3) System boundary
Fair uncertainty (10 to 15 )
Poor
4
Does not meet the criterion to a sufficient degree but rather requires improvement
Eg average technology as country- specific consumption mix of a group of similar products
Middle east North-America Japan etc
10-15 years old data
Poor completeness (50 to 70 )
Attributional Process based approach AND one of the following three method requirements of the PEF guide met (1) Dealing with multi-functionality (2) End of life modelling (3) System boundary
High uncertainty (15 to 25 )
Very poor
5
Does not meet the criterion Substantial improvement is necessary
Eg other process or unknown not available (na)
Global data or unknown
ge 15 years old data
Very poor or unknown completeness (lt 50 )
Attributional Process based approach BUT None of the following three method requirements of the PEF guide met (1) Dealing with multi-functionality (2) End of life modelling (3) System boundary
Very high uncertainty (gt25 )
Table 12 Data quality rating in an early phase of a PEF study of intermediate packaging paper
22
Representativeness
Data set
Tech
no
logi
cal
Ge
ogr
aph
ical
Tim
e-r
ela
ted
Co
mp
lete
ne
ss
Par
ame
ter
un
cert
ain
ty
Me
tho
do
logi
cal
Ap
pro
pri
ate
ne
ss a
nd
Co
nsi
ste
ncy
Resulting Data Quality Rating (DQR)
CH building hall steel construction 1 3 3 1 3 4 250
CH disposal sludge from pulp and paper production 25 water to sanitary landfill 1 3 3 1 3 4 250
CH disposal steel 0 water to municipal incineration 1 3 3 1 3 4 250
DE lignite briquettes at plant 1 3 3 1 3 4 250
DE maize starch at plant 1 3 3 1 3 4 250
DE potato starch at plant 1 3 3 1 4 4 267
RER AKD sizer in paper production at plant 1 2 3 1 3 4 233
RER aluminium sulphate powder at plant 1 2 3 1 3 4 233
RER building multi-storey 1 2 3 1 3 4 233
RER electricity medium voltage production RER at grid 1 2 2 1 3 3 200
RER facilities chemical production 1 2 3 1 3 4 233
RER heavy fuel oil at regional storage 1 2 3 1 3 4 233
RER heavy fuel oil burned in industrial furnace 1MW non-modulating ltu-sogt 1 2 3 4 3 4 283
RER industrial wood hardwood under bark u=80 at forest road 1 2 3 1 3 4 233
RER industrial wood softwood under bark u=140 at forest road 1 2 3 1 3 4 233
RER natural gas high pressure at consumer 1 2 3 1 3 4 233
RER paper mill integrated ltu-sogt 1 2 3 1 3 4 233
RER PEFEmissions-RF ltu-sogt 1 2 3 3 3 3 250
RER PEFEmissions-VF v03 ltu-sogt 1 2 2 2 4 3 233
RER sodium chlorate powder at plant 1 2 3 1 3 4 233
RER sodium dithionite anhydrous at plant 1 2 3 1 3 4 233
RER sodium hydroxide 50 in H2O production mix at plant 1 2 3 1 3 4 233
RER steel converter chromium steel 188 at plant 1 2 3 1 3 4 233
RER steel electric chromium steel 188 at plant 1 2 3 1 3 4 233
RER sulphate pulp ECF bleached at plant 1 2 3 1 3 4 233
RER sulphate pulp unbleached at plant 1 2 3 1 3 4 233
RER sulphuric acid liquid at plant 1 2 3 1 3 4 233
RER transport freight rail 1 2 3 1 3 4 233
RER transport lorry gt16t fleet average 1 2 3 1 3 4 233
RER Water Withdrawals-VF ltu-sogt 1 1 2 1 3 3 183
23
43 Further completeness and consistency checks
In this section some further checks are presented referring both to completeness and
consistency checks
431 Anomaly assessment An anomaly assessment can be done where based on previous experience unusual or
surprising deviations from expected or normal results are observed and examined for
relevance (Skone 2000)
As a practical example it can be considered the case of LCA studies of mining activities
When the production of eg copper concentrates was assessed adopting an impact
assessment method such as ILCD and performing the hotspot analysis as described in
chapter 3 of this report it was found that the identification of most relevant impact
categories did not include Resource Depletion fossil mineral In addition the most
relevant processes and life cycle stages contributing to this impact category were not
related to the ones involved in the copper extraction In the case under analysis it was
found that elementary flows related to extraction of resources from nature were missing
from the inventory because the dataset used in the analysis did not include in its goal
and scope the assessment of Resource Depletion fossil mineral
A learning was that it is true that it is important to evaluate what is most relevant (eg
impact categories life cycle stages processes elementary flows) however it is also
important to check if what is found as being non-relevant can be actually considered as
such Hence it is important to evaluate if the LCI modelled is complete with regard to
the impact categories that the assessor wants to evaluate
432 Cut-off ISO 14044 identifies cut-off as the ldquospecification of the amount of material or energy
flow or the level of environmental significance associated with unit processes or product
system to be excluded from a studyrdquo ISO 14044 also requires that the effect on the
outcome of the study of the cut-off criteria selected shall be assessed and described in
the final report
Cut-off criteria can be based on
Mass eg lt5 cumulative mass input
Energy eg lt5 cumulative energy input
Environmental significance eg lt5 of the results of the selected impact categories It is important to note that the cut-off criteria need to be selected based on the goal and
scope of the study Therefore if the study is intended to be used for comparisons and
comparative assertions a sensitivity check using all the above three criteria is a
mandatory requirement
433 Long term emissions Long term emissions are those emissions considered to happen beyond 100 years up to
thousands of years (eg 60000)
Not all databases include long-term emissions within the system boundaries In some
cases it can be observed that LCA results after characterization normalization and
weighting are by far dominated by toxicity-related impact categories When this is the
case it is recommended to check if the datasets used include long term emissions
which in terms of absolute amounts are well superior compared to emissions occurring
within 100 years It has also to be noted that the models to estimate long term
emissions are affected by a high uncertainty which has to be taken into account in the
LCA study to avoid biased conclusions and wrong recommendations
When dealing with long term emissions it is important however not to overlook their
potential impact therefore it is recommended to
Assess a baseline scenario excluding long-term emissions
Perform a sensitivity analysis including long-term emissions in the LCI
Include an analysis of the uncertainty associated to the inclusion of long-term
emissions
24
25
5 Interpretation on Life Cycle Impact Assessment (LCIA)
level
Life Cycle Impact Assessment is the phase in an LCA where the inputs and outputs of
elementary flows that have been collected and reported in the inventory are translated
into impact indicator results LCIA has two mandatory steps which are the classification
and the characterization of LCI results and two optional steps normalisation and
weighting
Many elements can be subject to interpretation in the LCIA phase In this report the
focus will be on
the relevance of applying different characterization models
the relevance of applying different normalisation sets
the relevance of applying different weighting sets
the identification of the most sensitive elements in determining the final results
conclusions and recommendations
the coverage of characterization factors compared to the inventoried elementary
flows
Those points will be illustrated in the following section through illustrative case studies
First a case study dealing with sensitivity analysis of using different characterization
models for toxicity-related and resource-related impact categories will be discussed
Second a case study dealing with using different impact assessment methods This case
study will also be used to go through sensitivity analysis in relation to normalisation sets
and weighting sets
Third a case study mapping the coverage of characterization factors of toxicity-related
categories compared to the inventoried elementary flows will be shown
51 Characterization sensitivity analysis
The use of different characterization models to assess a certain impact category may
play a relevant role in the calculation of the final results and the identification of
hotspots most relevant life cycle stages processes and elementary flows
511 Case study 1 ndash WEEE management Toxicity-related and Resource-related impact categories affecting interpretation of results
The first case study is based on a work by Rigamonti et al (2017) the authors selected
a case study in which LCA has been applied to assess a waste electrical and electronic
equipment (WEEE) management system (Biganzoli et al 2015) In that study the
assessment was carried out to quantify the mass balance of the WEEE management
system in Lombardy Region in the year 2011 and to calculate its environmental benefits
and burdens
Firstly they tested characterization models and characterization factors (CFs) for
toxicity-related impact categories human toxicity cancer and non-cancer and eco-
toxicity There is an evolving debate on the robustness of these impact categories and
specifically for what concern impacts due to metals (see eg Pizzol et al 2011) In fact
some specific features of the metals (eg essentiality) as well as elements affecting
their fate modelling (eg different conditions affecting their bioavailability) are not fully
captured by currently available models applied in LCA Therefore the authors ran a
sensitivity analysis where updated CFs for metals were tested along the lines of recent
literature (Dong et al 2014) aiming at identifying the different results associated to
metals impact compared to the ILCD method (EC-JRC 2011) based on the USEtox
model (Rosenbaum et al 2008)
26
The total impact obtained by applying Dong et al 2014 CFs resulted about three times
higher than the corresponding obtained by the USEtox model This is mainly due to the
Dong et al 2014 CFs of Copper (Cu) and Zinc (Zn) which are higher than those adopted
in the USEtox model when considering the freshwater archetype proposed in the paper
of Dong as default when the location of the emission is not known
Secondly they tested impact assessment models for resource Models currently available
differ both in the modeling approach in the perspective adopted for assessing the
resources (Dewulf et al 2015) and as consequence in the characterization metric and
factors adopted (Mancini et al 2016) Beyond the potential benefit associated to a mass
based approach to recycling (eg kg of material recycled) there is indeed the need of
understanding to which extent the recycled materials are contributing to the resource
depletion impact categories The authors tested abiotic depletion potential (ADP) (CML
2012) which is focusing on potential depletion based on the ratio between resource
consumption and availability (either considering ultimate reserves in earth crust known
base reserves or economically viable reserves) ILCD model (EC-JRC 2011) which is an
extended version of CML2012 reserve based (based on CML algorithm few other
resources have been added described in Sala et al 2012) EDIP97 (Hauschild and
Wenzel 1998) which is comparing the resource with the deposits economically
exploitable without accounting for current level of consumption EPS2000 (Steen
1999) which assesses the cost (as societyrsquos willingness to pay) of substituting a
substance by an alternative for future generations affected by current level of depletion
Recipe 2008 (Goedkoop et al 2009) which is looking at marginal increase of extraction
cost per kg of extracted resource differentiating it by deposit and assuming a discount
rate over an indefinite timespan the Anthropogenic Abiotic Depletion Potential (AADP
Schneider et al 2011) which is accounting for the potential of resource recycling
assuming urban mining as an additional source of resources The recent update of the
AADP (Schneider et al 2015) was also considered It introduces the concepts of
ultimately extractable reserves represented by the amount available in the upper
earths crust that is ultimately recoverable A new set of CFs were also tested developed
by Mancini et al (2016) aiming at addressing the benefit associated to the recovery of
Critical Raw Materials (CRMs) The characterization model is based on the use and
adaptation to LCA of the supply risk indicators developed by the European Commission
(EC 2014) Three sets of CFs are tested based on different assumptions (1) baseline
option the supply risk factors as such ndash (SR) (2) an exponential function which
magnifies the differences between the CRMs - (SR)^6 (3) the ratio between supply risk
and production data (SRworld mine production in 2011) which reflects the size of the
market giving more importance to the materials used in small amounts in products and
applications like eg specialty metals that are often perceived as critical
The comparison among the different models was first of all made considering the mineral
resources present in the inventory of the case study covered by each of them The ILCD
method is the most comprehensive one with 31 mineral resources included in its model
for the resource depletion category On the contrary the Supply Risk (3) is the one that
covers the minor number of substances (ie 7)
A contribution analysis was also performed (Figure 3) Silver (Ag) gives the main
percentage contribution to the indicator in five models (ie CML 2012 versions b and c
ILCD Supply Risk 3) and EDIP97) Cobalt (Co) is the main contributor in the Supply
Risk (2) Copper (Cu) in the ReCiPe 2008 Palladium (Pd) in the EPS 2000 and AADP
(2015) and Nickel (Ni) in the AADP (2011) In the CML 2012 (a) Tellurium Gold (Au)
and Silver (Ag) are the most important substances whereas Aluminium (Al) Copper
(Cu) and Nickel (Ni) are the main contributors in the case of the Supply Risk (3)
27
Figure 3 Contribution analysis for the resource- related indicator calculated adopting several characterization models (Rigamonti et al 2017)
512 Case study 2 ndash Basket of Products Food sensitivity analysis
comparing different impact assessment methods
This case study is based on the application of different life cycle impact assessment
methods for the evaluation of the environmental impacts associated to food consumption
in Europe A process-based LCA has been performed for a basket of products that
represent the most relevant food product groups selected by importance in mass and
economic value to depict the average consumption for nutrition of EU citizens in 2010
(Notarnicola et al 2017b) The product groups in the basket were pig meat beef
poultry milk cheese butter bread sugar sunflower oil olive oil potatoes oranges
apples mineral water roasted coffee beer pre-prepared dishes For each product group
in the basket an inventory model based on a representative product has been
developed The impact of each representative product was then multiplied by the mass
of products in that product group that is consumed in one year by an average EU citizen
The environmental impact of the average food consumption of a European citizen has
been characterized using ILCD method for the life cycle impact assessment (EC-JRC
2011) The paper by Notarnicola et al (2017) illustrates the details of the process-based
LCA study on the BoP nutrition for EU 27 citizens and presents the results of the
characterisation phase The variability of the results associated to methodological
choices has been already preliminary explored (Castellani et al 2017) The present
report builds on those results and elaborates the interpretation phase (including also
normalisation and weighting) The questions that these analyses help answering are i)
are the products found to have the highest impact sensitive to changes in LCIA elements
(characterisation factors normalization references or the weighting sets) and ii) which
are the most contributing impact categories
This case study will also be used in paragraph 52 53 and 54 as a basis for further
insights on the interpretation of an LCA study
For this specific case the authors performed a sensitivity analysis on the LCIA
characterisation phase using ILCD compared with other two methods the CML-IA v 42
(Guineacutee et al 2002) and the Ecological footprint (EcF) (Wackernagel et al 2005) CML-
IA was chosen because it is widely used in LCA studies and because it adopts a different
28
modelling approach compared to ILCD in several impact categories that could be
relevant for food chains For instance for toxicity-related impact categories CML-IA is
based on USES-LCA model (Van Zelm et al 2009) whereas ILCD is applying USETOX
model (Rosenbaum et al 2008) for eutrophication CML-IA is using RAIN-LCA
(Huijbregts 1999) whereas ILCD is using different models for terrestrial and aquatic
eutrophication (respectively accumulated exceedance by Seppaumllauml et al 2006 and
EUtrend model as applied by Struijis et al 2009) The EF was chosen because it
assesses impacts in terms of direct and indirect land use and has been considered a
method that may complement LCA (Lee et al 2014) although based on an accounting
framework that has been questioned (Giampietro and Saltelli 2014) The version of EcF
method implemented in the study is the one already adapted to LCA and provided
within the SimaPro 805 software package (Pregrave Consultants 2015)
The three methods are mostly convergent in the identification of the product groups to
be considered hotspots within the BoP nutrition ie within the food consumption of the
European citizens ILCD and CML-IA identify a wider range of hotspots compared to EcF
mainly because they cover a wider range of impact categories (eg bread and potatoes
do not emerge as hotspot for EcF because their main impacts are in impact categories
not covered by the EcF method)
The product groups that emerge as hotspots in all the methods even if with slightly
different level of contribution are meat and dairy products and beer (as representative
product for alcoholic drinks)
The impact categories for which beer emerge as hotspot are slightly different among the
three methods ozone depletion ionizing radiation and resource depletion in ILCD and
CML-IA photochemical ozone formation in ILCD human toxicity and marine aquatic
ecotoxicity in CML-IA and nuclear energy in EcF The most contributing processes for all
the impact categories listed before is energy (electricity and heat) as already discussed
for ILCD In the case of CML-IA method toxicity-related impacts are mainly due to direct
emissions to air coming from the production process of the packaging glass
513 Conclusions and recommendations
These results reveal that the relative importance of one substance compared to another
changes with the model This is because the models differ in the substances that they
include and in the CFs of each substance It is recommended to run a sensitivity check
with different characterization models to evaluate the robustness of the conclusions
drawn It is also recommended to evaluate the theory underlying the characterization
models chosen to evaluate a certain impact category as this helps understanding the
results obtained
52 Characterization mapped flows and unmapped flows
This section shows two different levels of checks the first one focuses on a comparison
between two different life cycle impact assessment methods (ie ILCD vs CML-IA) based
on Castellani et al (2017) the second one focuses on what are the implications of
uncharacterized flows for a specific impact category (freshwater ecotoxicity) based on
the case study presented in Notarnicola et al (2017b)
521 Comparison between two different methods
A check of the inventoried elementary flows that are not characterized at the LCIA phase
should always be done to support interpretation of results Indeed the comprehensive
translation of the inventory into potential environmental impacts may not occur if some
of the elementary flows are not covered by the chosen characterization models Table 13
reports an example of the total amount of elementary flows that are available in an
inventory but they are not mapped and characterized by the methods considered (ILCD
and CML-IA) as reported in Castellani et al (2017) The authors checked the list of
uncharacterized flows for the inventory of the case study under evaluation and
29
highlighted the most relevant ones either in term of mass or of known environmental
concern The information obtained was then used in support to interpretation For
instance in case the two methods used for characterisation and normalisation give very
different results for one impact category the information about uncharacterized flows
can help to check if this difference is due to a different characterisation of impacts (ie
to a different way of considering the environmental relevance of some elementary flows)
or if it is affected by the fact that some flows (eg some emissions) are not taken into
account by one of the methods
This may occur also due to improper nomenclature of the elementary flows which may
cause a mismatch between the elementary flows listed in the inventory and the
elementary flows to which a characterization factor is available for example the
inventory may report CaCO3 while the characterization model may provide a CF for
calcite This mismatch would prevent the characterization of CaCO3
Table 13 Example of check of inventoried elementary flows that are not characterized by two impact assessment methods (based on Castellani et al 2017)
Flows Total elementary flows not characterized
Typologies of flows
Details on the elementary flows not characterized
ILCD CML-IA
ILCD CML-IA
Nr flows Amount Unit Nr flows
Amount Unit
raw materials
97 510 metals and minerals
47 795 kg 47 863 kg
water flows 25 126 m3 300 3825 m
3
Energy 0 0 MJ 12 18964 MJ
land use 11 001 m2 (or
m2a)
117 12898 m2 (or
m2a)
others 14 na mixed 34 na mixed
emissions to soil
83 227 pesticides to soil
45 0003 kg 173 008 kg
others 38 08 kg 54 41 kg
emissions to water
167 310 radioactive substances
42 119E+03 Bq 61 385E+06 Bq
metals and inorganics compounds
34 28 kg 36 28 kg
others 91 na mixed 213 na mixed
emissions to air
179 286 radioactive substances
49 899E+04 Bq 73 973E+07 Bq
metal and inorganics compounds
65 007 kg 56 0044 kg
pesticides 7 580E-08 kg 32 93 kg
others 70 na mixed 125 na mixed
waste flows 17 17 waste 17 3784 kg 17 3784 kg
Overall number of elementary flows not characterized
543 1350
In order to assess which elementary flows available in the inventory were not accounted
during the characterization the authors performed an analysis of the elementary flows
not characterized when using ILCD and CML-IA methods In total the model of the
basket includes 1730 elementary flows The ILCD method is not able to cover 543 of
these elementary flow as emission into air water soil or resource used whereas when
CML-IA is used to characterize the inventory 1350 elementary flows out of 1730 are not
30
characterized In Table 1 the list of main typologies of flows is reported Many pesticides
organic chemicals and inorganics are not characterized by the two methods Several
ionizing substances are not characterized as well as elementary flows related to group of
substances (such as AOX PAH BTEX VOC BOD and COD) Missing the CFs means that
it is not possible to estimate the extent to which eg the toxicity-related and ionizing
radiation-related impact categories are underestimated
Apart from the total number of flows covered the main difference between the two LCIA
methods is the ability to assign a characterization factor (CF) to the pesticides included
in the inventory ILCD has no CFs for 45 pesticidesrsquo emission to soil (plus 4 pesticidesrsquo
emissions to air) whereas CML-IA for 173 (plus 32 pesticidesrsquo emissions to air) This
may be the reason why human toxicity impacts appear as relevant in the results of ILCD
characterization (and related normalization and weighting as discussed below) and they
appear as less relevant in the results of CML-IA characterization and related
normalization and weighting
522 Analysis of uncharacterized flows within an impact category Based on the study of Castellani et al (2017) fourteen impact categories (IC)
recommended in PEF are calculated The number of elementary flows (ElFls) by ICs
varies from few flows (eutrophication acidification etc) to thousands (eco and human
toxicity) (see table 14)
For most of the ICs the contributing elementary flows reported in an inventory are well
identified and their inclusion in the calculation of the final score is expected to be done
correctly For climate change at mid-point 104 elementary flows with their associated
CFs are derived from the IPCC 2007 report for a 100-year period
However for impact categories like toxicity the number of elementary flows contributing
to the impact can be very important making possible the omission of some EFs at the
inventory level Additionally a high number of flows reported in the inventory have no
CFs If the number of un-characterized flows is too high this can lead to a non-robust
interpretation of the LCIA results
Table 12 shows the number of elementary flows with associated a CF (ie the single
chemical) and the amount of elementary flows with a CF per different compartment (eg
the single chemical in each compartment and sub-compartment)
Table 14 List of impact categories listed in ILCD with total number of elementary flows contributing to each IC
Impact Category ElFl with CFs (all emission compartments)
Unique ElFls with CFs (single chemical flows)
Climate change 104 102
Ozone Depletion 23 23
Human toxicity non cancer 3434 442 (USEtox 419 org+18 metals)
Human toxicity cancer 4734 607 (USEtox 596 org +8 metals)
Particulate matter 46 24
Ionizing radiation Human Health 50 29
Photochemical ozone formation 133 133
Acidification 7 7
Terrestrial eutrophication 7 7
Freshwater eutrophication 10 5
Freshwater ecotoxicity 15636 2526 (USEtox 2498 org +21 metals)
Land use 206 206
Water source depletion 1180 1180
Mineral fossil use amp Resource depletion
181 181
Marine eutrophication 14 11
Additional IC not used in PEF
Ionizing radiation Ecosystem (interim) 62 15
31
The potential impact of un-mapped (or uncharacterized) flows is illustrated via a case
study focusing the freshwater aquatic toxicity impact category using a recent modelling
of 17 food products (Notarnicola 2017b)
For a high proportion of the total mass of un-characterized ElFls the impact on the final
IC scores is null As a matter of fact 9998 of the 1887 kg ElFls emitted to the air are
made of air oxygen and hydrogen Only 033 kg (but still 199 flows) are actual made of
other type of chemicals 80 of those 033 kg are nitrogen type of chemicals 74
hydrogen chloride 12 sulphate etc (table 15) However regarding the ElFls to soil
and water the mass and number of un-characterized flow could have a significant
impact on the final score
Table 15 Type of chemicals (mass and number of EFs) not characterized per emission compartment (air oxygen and hydrogen have been excluded)
Compartments Group of chemicals Mass (g) Number of ElFl
Air
Total air 330 122
N-related 238662 2
inorganicsalt 74637 44
organic 5693 36
S - related 3896 1
metalmineral 3793 17
Alkenes 1530 2
Benzene Toluene Ethylbenzene and Xylene) unspecified ratio 0488 1
ozone 0314 1
P-related 0304 4
ionising 0261 4
Aldehydes 0213 1
Terpenes 0102 1
PAH 0034 1
Pesticide 0000 6
Acid 0000 1
Soil
Total soil 800 68
metalmineral 328315 15
inorganic 320234 4
oils 93496 3
organic 48702 2
Pesticide 5873 39
S - related 3777 2
N-related 0000 2
PAH 0000 1
Water
Total water 13871 112
inorganicsalt 7549785 22
TOC water 2840410 4
metalmineral 1998366 13
Suspended solid 1257655 6
inorganic 108851 6
organic 107546 37
AOX 2390 1
Acid 2032 2
S - related 2008 5
VOC 0643 1
32
N-related 0511 3
Propylene 0244 1
oils 0079 2
PAH 0055 2
Sodium Hydroxide 0054 1
Salt unspecified 0015 1
Hypochlorite 0013 1
ionising 0002 2
VOC 0001 1
P- related 0000 1
Looking at the results of the freshwater aquatic toxicity impact categories for all 17 food
products 90 of the impact category is driven by 10 out of 734 elementary flows that
represents only 14 of the mass of chemicals entering the aquatic environment (table
16) Furthermore it can be seen that
57 of the toxicity score are due to 3 metals representing 01 kg of the mass
However there are still more than 2 kg of un-characterized metalsminerals in
the inventory list (see table 15)
33 of the impact are due 10 pesticides (35 g) although there are still 39 un-
characterized pesticides in the inventory list (representing 5 g) (see table 15)
Table 16 Most relevant elementary flows contributing cumulatively up to 90 to the freshwater ecotoxicity impact category with USEtox
Substance Chemical
class Emission
Compartment Sub-compartment
Total impact (CTUe)
impact versus Total
Cumulated
impact Mass (kg)
Zinc metal Soil agricultural 931 21 21 00441
Copper metal Soil agricultural 902 21 42 00429
Chlorpyrifos pesticide Soil agricultural 833 19 61 00079
Copper metal Soil
351 8 69 00120
Zinc metal Water
139 3 72 00036
Folpet pesticide Soil agricultural 134 3 75 00004
Chlorothalonil pesticide Soil agricultural 111 3 78 00019
Chromium metal Water
105 2 80 00020
Cyfluthrin pesticide Soil agricultural 85 2 82 00001
Isoproturon pesticide Soil agricultural 81 2 84 00086
Cypermethrin pesticide Soil agricultural 70 2 85 00010
Chromium metal Soil agricultural 51 1 87 00019
Prochloraz pesticide Soil agricultural 45 1 88 00024
Captan pesticide Soil agricultural 39 1 88 00039
Alachlor pesticide Soil agricultural 38 1 89 00041
Metolachlor pesticide Soil agricultural 30 1 90 00050
Among the non-characterized elementary flows in relation to freshwater ecotoxicity it
can be observed
it is not known to which extent some of the chemicals may contribute to the IC
a number unspecified chemicals such as lsquoTotal organic matterrsquo (TOC BOD
CODhellip) PAH VOC that could contribute significantly to the overall score Since
the quantity of those ElFl can change significantly between products a default CF
could be proposed for those flow
some chemicals are known to be contributing to toxicity like pesticides and
metals still there are significant proportions that are not characterized
33
Although it is not possible to conclude if those un-characterized flows would have
changed the total score significantly based on the mass and number of known-
contributing class of chemicals (metals and pesticides) it is highly recommended that a
quantification of the uncharacterized chemicals is reported for the freshwater toxicity
impact category before drawing final conclusions
523 Conclusions and recommendations
Results of the LCIA phase can be highly affected by the characterization model chosen
as shown in chapter 51 Furthermore the evaluation of uncharacterized elementary
flows is of primary importance to assess the completeness of the LCIA coverage of the
identified LCI flows Indeed a high number of elementary flows inventoried might be
non-characterized by the chosen models even if their relevance in the assessed impact
categories could be of primary importance Therefore it is highly recommended that a
quantification of the uncharacterized elementary flows is reported before any
interpretation or conclusion is performed on the superiority of one product versus
another
53 Normalization sensitivity analysis
As for the characterisation phase also the choice of the normalisation reference set can
highly influence results Castellani et al (2017) have done a sensitivity analysis based on
the case study of a basket of product on food (see paragraph 512 for further details)
The authors report that as an optional step normalisation and weighting could be
applied to characterized LCA results to support the identification of the most important
impact categories Given that several sets of normalisation and weighting are available
the authors tested some of them in addition to the ILCD baseline with the aim of
assessing the sensitivity of the results to the choice of particular geographical and
temporal reference systems (ie normalization using EU or global scales) as well as
perspectives (ie weighting) This was investigated by selecting 3 sets of ILCD-compliant
normalization references (Benini et al 2014 Benini et al 2015 Laurent et al 2013)
and 2 sets of CML-IA compliant normalization references (EU 25+3 year 2000 and
World year 2000 - Guineacutee et al 2002) -reported in Table 17 In this section the
findings of the authors regarding normalisation will be discussed while the findings on
weighting will be discussed in section 54
Table 17 Summary of normalization sets used in the sensitivity analysis in Castellani et al (2016)
ILCD Impact Category Unit EC-JRC EU27
(2010) per person
a
EC-JRC Global (2010 or 2013)
per personb
PROSUITE Global (2010 or
2000) per person
c
Climate change kg CO2 eq 922E+03 707E+03 810E+03
Ozone depletion kg CFC-11 eq 216E-02 122E-02 414E-02
Human toxicity cancer effects CTUh 369E-05 124E-05 542E-05
Human toxicity non-cancer effects CTUh 533E-04 155E-04 110E-03
Particulate matterRespiratory inorganics kg PM25 eq 380E+00 507E+00 276E+00
Ionizing radiation human health kBq U
235 eq (to
air) 113E+03 241E+02 133E+03
Photochemical ozone formation human health kg NMVOC eq 317E+01 453E+01 567E+01
Acidification mol H+ eq 473E+01 561E+01 496E+01
Eutrophication terrestrial mol N eq 176E+02 164E+02 115E+02
Eutrophication freshwater kg P eq 148E+00 654E+00 620E-01
Eutrophication marine kg N eq 169E+01 304E+01 938E+00
Land use kg C deficit 748E+04 520E+06 236E+05
Ecotoxicity freshwater CTUe 874E+03 374E+03 665E+02
Resource depletion water m3 water eq 814E+01 689E+01 297E+01
Resource depletion mineral fossils and renewables kg Sb eq 101E-01 193E-01 313E-01
34
An additional analysis was performed to verify which one between normalization and
weighting is the most sensitive step in the identification of the most relevant impact
categories The same weighting sets described before were applied on the results of
normalization obtained using the two ILCD-compliant global normalization reference sets
tested before namely EC-JRC Global (Benini et al 2015) and PROSUITE Global (Laurent
et al 2013)
The contribution of product groups (Table 18) and of impact categories (Table 19) to the
total normalized impact of the BoP nutrition per citizen were analyzed
Table 18 presents a summary of the sensitivity analysis on product group contribution at
the normalization stage comparing the product group hotspots according to ILCD and
CML-IA methods Values are expressed as percentage of the normalized value per citizen
for that product group with respect to the total normalized impact per citizen (total
impact of nutrition in one year for an average EU-27 citizen) Equal weighting among
impact categories is assumed Results at the normalization stage almost confirm the
hotspots identified at the characterization stage meat and dairy products are again
hotspots for all the methods whereas other products that emerged before are
considered less contributing at the normalization stage This means that those products
generate impacts in impact categories that are considered less relevant compared to the
others according to the normalization scheme adopted For instance beer appeared to
be a hotspot for both ILCD and CML-IA at the characterization stage whereas only CML-
IA method identifies it as a hotspot at the normalization stage This happens because the
CML-IA normalization references (EU 25+3 and World) for marine aquatic toxicity -one
of the impact categories for which beer is a hotspot - are relatively low compared to the
ones in other LCIA methods
Table 18 presents a summary of the results of the sensitivity analysis at the
normalization stage comparing the relevance of impact categories according to ILCD
and CML-IA methods Results refer to the entire BoP For each impact category of the
two methods values are expressed as percentage of the normalized value per citizen for
that impact category with respect to the total normalized impact per citizen
Table 18 Results of sensitivity analysis on normalization sets at the European and global scale for ILCD- and CML-IA methods (Castellani et al 2016) The percentages represent the contribution of each product group to the total impacts of the BoP per citizen (reference flow) Equal weighting of impact categories is applied The second column reports the mass of each product group in the basket A color scale is applied to the results in each column (ie product group) from green (lowest contribution) to red (highest contribution)
Quantity in the basket (kgyear)
Share of total BoP
mass
EC-JRC EU27 (2010)
EC-JRC Global (2010
or 2013)
PROSUITE Global (2010
or 2000)
CML EU 25+3 (2000)
CML World (2000)
Mineral water 1050 194 1 1 1 3 3
Beer 698 129 4 4 7 16 21
Coffee 47 06 2 1 5 5 6
Apple 161 30 0 0 1 1 1
Oranges 174 32 1 1 2 1 2
Potatoes 691 130 3 3 3 3 4
Bread 393 73 3 3 3 4 5
Olive oil 53 10 1 0 1 2 3
Sunflower oil 53 10 4 4 5 3 3
Sugar from beet 298 55 3 3 3 2 1
Milk 801 148 9 9 8 7 6
Cheese 150 28 15 16 13 10 9
Butter 36 07 7 8 6 3 2
Meat - beef 137 25 18 17 16 11 10
Meat - pork 410 76 20 20 19 18 13
Meat - poultry 220 42 8 8 8 10 7
Pre-prepared meal
29 05 1 1 1 2 2
35
100 100 100 100 100 100
Table 19 Results of sensitivity analysis on normalization sets at the European and global scale for ILCD and CML-IA methods (Castellani et al 2016) The percentages reflect the relative relevance of impact categories compared to the total impacts of the BoP per citizen (reference flow) A colour scale is applied to the results in each column (ie impact category) from green (lowest contribution) to red (highest contribution)
EC-JRC EU27 (2010)
EC-JRC Global (2010 or 2013)
PROSUITE Global (2010 or 2000)
CML EU 25+3 (2000)
CML World (2000)
Climate change 19 11 13
Global warming (GWP100a) 78 102
Ozone depletion 00 00 00 Ozone layer depletion 02 00
Human toxicity cancer effects
62 83 25
Human toxicity
59 120 Human toxicity non-cancer effects
446 692 127
Particulate matter 26 09 21 -
Ionizing radiation HH 05 11 03 -
Photochemical ozone formation
10 03 03 Photochemical ozone formation
46 21
Acidification 73 286 41 Acidification 272 201
Terrestrial eutrophication 83 40 75
Eutrophication
133 163
Freshwater eutrophication 34 04 48
Marine eutrophication 82 20 87
Freshwater ecotoxicity 58 61 450
Freshwater aquatic ecotoxicity 340 314
- - - -
Marine aquatic ecotoxicity
- - - - Terrestrial ecotoxicity
Land use 23 00 04 -
Water resource depletion 62 33 100 -
Mineral fossil amp ren resource depletion
18 04 04 Abiotic depletion 02 11
Abiotic depletion (fossil fuels) 68 67
100 100 100
100 100
531 Conclusions and recommendations
Different normalisation sets may produce different results in terms of identification of
most relevant impact categories life cycle stages and processes Different reference
systems refer to different situation which can all be valid depending eg on the
geographical scope of the study It is recommended to evaluate different normalisation
tests which fit the study at hand to support the conclusions drawn with the baseline
scenario or to provide additional insights
54 Weighting sensitivity analysis
Castellani et al (2016) investigated only for ILCD-compliant normalization sets in
addition to equal weighting 8 ILCD-compliant weighting sets (reported in Table 20) were
tested The different sets were selected aiming at covering several perspectives on
weighting namely distance to target for EU policies considering binding and non-
binding target at 2020 (Castellani et al 2017) a previous distance to target set (EDIP)
36
for Europe for 2005 (Stranddorf et al 2005) two sets considering planetary boundaries
(Tuomisto et al 2012 Bjoslashrn and Hauschild 20158) a set which gives relevance to
midpoint indicators based on their contribution to impact at the endpoint (Ponsioen and
Goedkoop 2015) a set resulting from the combination of different panel-based
approaches (Huppes et al 2012)
When needed available weighting sets have been adapted to ILCD impact categories
The majority of these weighting sets build on normalization factors that are specific of a
geographic scale Tuomisto et al (2012) calculated planetary boundaries at global scale
whereas and Bjoslashrn and Hauschild (2015) did it for both global and European scales
Huppes et al (2012) adopted a panel-based approach with no specific geographic
representativeness whereas all the other weighting sets used in this work have been
originally developed or adjusted for applications at the targeting the European scale
The use of EU27-consistent weighting sets in combination with global normalization
factors may lead to inconsistencies therefore the results have to be interpreted in the
light of this inconsistency In this work the normalized and weighted results are
calculated and presented anyway for all combinations so to show the effect of the
selection of weighting available for practitioners rather than focussing on the (in-
)consistency of their joint use with normalization factors The performed analysis
quantified the relative contribution by impact category to the overall impacts associated
with the BoP as well as the contribution by each of the products The effects of the
different weighting sets tested on the results of the BoP normalized to EC-JRC EU27
normalization references are presented in Table 21 and Table 22
Table 20 Summary of weighting sets used in the sensitivity analysis by Castellani et al (2016)
Distance to target Damage oriented Panel-
based
Policy targets Planetary boundaries Mid-to-
endpoint
Castellani et al 2016
WFsA
Castellani et al 2016
WFsB
EDIP 2003 (Stranddo
rf et al 2005)
Tuomisto et al 2012
Bjoslashrn amp Hauschild
- European
2015
Bjoslashrn amp Hauschi
ld ndash Global 2015
Ponsioen amp
Goedkoop 2016
Huppes et al 2012
ILCD Impact Category dimensionless ()
Climate change 71 54 2 10 25 26 44 232
Ozone depletion 64 49 87 8 1 2 0 36
Human toxicity cancer effects 69 52 2 na na na 1 65
Human toxicity non-cancer effects
62 47 2 na na na
4 41
Particulate matterRespiratory inorganics
74 56 na na na na
8 66
Ionizing radiation human health
61 46 na na na na
0 65
Photochemical ozone formation human health
78 59 2 na
34 48
0 54
Acidification 72 55 2 8 1 1 0 42
Eutrophication terrestrial 70 53 2 28 1 0 0 23
Eutrophication freshwater 62 47 1 7 9 2 0 23
Eutrophication marine 69 52 2 28 1 1 0 23
Land use 64 53 na 6 25 16 19 102
Ecotoxicity freshwater 61 51 0 na 2 0 0 109
Resource depletion water 61 296 na 5 1 4 3 51
Resource depletion mineral fossils and renewables
61 30 0 na na
na 19 69
8 Bjoslashrn and Hauschild provided to the authors of this report a modified version to be used as weighting method
in compliance with EU27 ILCD normalization factors Global weighting factors were calculated directly from global normalization factors published by Bjoslashrn and Hauschild 2015
37
The contribution of specific products to the overall impacts associated to the BoP
nutrition is very similar when using several weighting sets in combination with
normalization references EU27 (Table 21) In fact for all the weighting sets tested pork
meat and beef meat are the highest contributor to the impacts (varying between 15
and 22) According to all sets cheese is the 3rd largest contributor (14 on average)
whereas milk and poultry meat are most frequently identified as 4th and 5th largest
contributors (roughly 8 each) On average these product groups account for roughly
70 of the total impacts Apples olive oil and pre-prepared meals are those contributing
the less followed by mineral water and oranges On average their cumulative
contribution is around 5
Table 21 Product groups contribution Results of several ILCD-compliant weighting sets in combination with normalization references EU27 (Castellani et al 2016) A color scale is applied to the results in each column (ie product group) from green (lowest contribution) to red (highest contribution)
PRODUCT GROUPS CONTRIBUTION
Quantity in the basket (kgyear)
Share of total BoP mass
Equal
weighting
Castellani et al (2016) WFsA
Castellani et
al (2016) WFsB
EDIP2003
9
Tuomisto et
al (2012)
BjornampHausch
ild (2015)
ndash Europe
an
BjornampHausch
ild (2015)
ndash global
Ponsioen and
Goodkoep
(2016)
Huppes et al (2012)
Mineral water 105 1940 1 1 3 1 1 1 2 1 1
Beer 66 cL 698 1290 4 4 4 4 3 8 8 7 5
Coffee 47 060 2 2 2 1 2 6 5 3 2
Apple 161 300 0 0 1 0 0 1 1 1 1
Oranges 174 320 1 1 3 0 1 2 2 1 1
Potato 691 1300 3 3 4 3 2 3 3 4 3
Bread 393 730 3 3 3 4 3 3 3 3 3
Olive oil 53 100 1 1 1 0 1 1 1 1 1
Sunflower oil 53 100 4 4 4 4 3 4 4 4 4
Sugar from beet 298 550 3 3 4 3 4 2 3 3 3
Milk 801 1480 9 9 8 9 8 8 8 8 8
Cheese 15 280 15 15 16 15 13 12 13 14 14
Butter 36 070 7 7 6 8 6 5 5 7 7
Meat - beef 137 250 18 18 17 18 22 15 16 16 17
Meat - pork 41 760 20 20 16 21 21 19 17 18 19
Meat - poultry 22 420 8 8 7 8 9 8 8 8 8
Pre-prepared meal 29 050 1 1 1 1 1 1 1 1 1
100
100 100 100 100 100 100 100 100
100
9 (based on Stranddorf et al 2005)
38
Conversely the identification of the most relevant impact categories contributing to the
overall impact of the entire BoP nutrition presents huge discrepancies when applying
different weighting sets (Table 22) This is due to the intrinsic differences among the
weighting sets which build on different perspectives and attribute different weights to
the impact categories
Table 22 Relevance of the different impact category Results of the application of several ILCD-compliant weighting sets in combination with normalization references EU27 (Castellani et al 2016) A color scale is applied to the results in each column (ie impact category) from green (lowest contribution) to red (highest contribution)
CONTRIBUTION ANALYSIS
1-1-1
Castellani et al (2016) WFsA
Castellani et al (2016) WFsB
EDIP2003 (based on Stranddorf et al 2005)
Tuomisto et al (2012)
Bjoslashrn amp Hauschild (2015)
Bjoslashrn amp Hauschild (2015) - global
Ponsioen amp
Goedkoop (2015)
Huppes et al (2012)
Climate change 19 20 15 2 32 214 260 204 87
Ozone depletion 00 00 00 2 00 00 00 00 00
Human toxicity cancer effects
62 66 50 7 na na na 22 81
Human toxicity non-cancer effects
446
425 323 53 na na na 477 363
Particulate matterRespiratory inorganics
26 30 23 na na na na 51 34
Ionizing radiation human health
05 05 04 na na na na 00 07
Photochemical ozone formation human health
10 12 09 1 00 162 263 00 11
Acidification 73 81 61 9 101 47 42 03 61
Eutrophication terrestrial
83 89 67 10 379 31 18 00 39
Eutrophication freshwater
34 32 25 3 37 134 43 00 16
Eutrophication marine
82 87 66 11 374 55 44 00 38
Land use 23 22 19 na 23 257 188 106 46
Ecotoxicity freshwater
58 55 46 0 na 60 04 00 127
Resource depletion water
62 59 284 na 53 39 137 49 63
Resource depletion mineral fossils and renewables
18 17 09 0 na na na 86 25
TOTAL 100 100 100 100 100 100 100 100 100
The discrepancies in the results suggest that it is important to acknowledge that
different perspectives lead to different results Moreover it is relatively straightforward
to identify the product groups impacting the most as from Table 21 when keeping
constant normalization references although varying weighing sets
The authors also checked the most sensitive element between normalization and
weighting their findings indicate normalization as the most sensitive choice if compared
39
to the selection of a specific weighting set among those considered in their work
However this result may change in case weighting methods building on different
approaches are added to the ones included in their work Nevertheless the ranking of
products is not significantly affected by changing normalization reference (eg from
ILCD EU27 to ILCD Global ndash Laurent et al 2013) This might be due to few impact
categories driving the results regardless of the normalization and weighting methods
selected or to the fact that all impact categories are strongly correlated
541 Conclusions and recommendations Weighting sets are often dependent on different value choices to assign different weights
to all impact categories Therefore different weighting sets lead to significant differences
of the final conclusions It is recommended that the decision about inclusion of which
weighting set to use has been made and documented in the first scope definition and
shall not be changed later during the study
40
6 Estimation of uncertainty
Evaluation of the uncertainty of an LCA study is a step which involves both the LCI and
LCIA phase therefore it is strictly linked to the content of the previous chapters
Uncertainty in LCA can be defined in different ways (Ciroth et al 2016) For examples it
can be meant as describing the variability of the LCA data to determine the significance
of the indicator results being ldquothe estimated amount or percentage by which an
observed or calculated value may differ from the true valuerdquo (Skone 2000) ISO 14044
defines uncertainty analysis as systematic procedure to quantify the uncertainty
introduced in the results of a life cycle inventory analysis due to the cumulative effects of
model imprecision input uncertainty and data variability
The estimation of uncertainty serves three main purposes
it supports a better understanding of the results obtained
it supports the iterative improvement of an LCA study
it also helps the target audience to assess the robustness and applicability of the
study results
The PEF Guide identifies two key sources of uncertainty in PEF studies
1 Stochastic uncertainties for the inventory data
they refer to statistical descriptions of variance around a meanaverage For
normally distributed data this variance is typically described in terms of an
average and standard deviation
2 Choice-related uncertainties
They arise from methodological choices including modelling principles system
boundaries allocation choices choice of impact assessment methods and other
assumptions related to time technology geographical aspects etc These are not
amenable to statistical description but rather can only be characterized via
scenario model assessments
In this report we refer to uncertainty analysis to describe the range of likely outcomes
based on a set of inputs and it differs from a sensitivity analysis which is linked to how
sensitive the results are to a change in an input parameter (see previous chapters)
It has to be kept in mind that all steps involved in a quantitative process are affected by
uncertainties Therefore it is important that the uncertainty is assessed
- At inventory level (eg standard deviation associated to a data point) An
example on how to assess the uncertainty at inventory level was recently
provided by Ciroth et al (2016)
- At characterization level (eg linked to characterization factors)
- At normalisation level (eg linked to normalisation factors)
- At weighting level (eg linked to weighting factors)
611 Conclusions and recommendations It is recommended that the overall uncertainty of an LCA study is estimated and
reported in the final report It is also recommended to include an evaluation to which
extent the uncertainties identified affect the final conclusions
41
7 Meta-analysis
The widespread development of LCA in the last decades as a decision supporting tool
leads to a huge amount of LCA studies in literature concerning all kind of goods and
services (ldquoproductsrdquo) When trying to make sense of their results that sometimes are
very different or come up with a conclusion techniques to combine or re-analyze them
are needed such as meta-analysis
Zumsteg et al (2012) described the key factors for conducting and reporting systematic
reviews including meta-analyses10 in LCA Those key factors are simplified in a check
list 1 Review title keywords and abstract 2 Rationale for the review 3 Review
question and objectives 4 Description of review protocol 5 Findings and features of
the individual studies in the review 6 Assessment of bias 7 Synthesis methods
(qualitative and quantitative) 8 Limitations of the review and 9 Summary of findings
and conclusions
This chapter is not intended to give guidelines on how to perform a systematic review or
a meta-analysis but to highlight the critical points that the practitioner should take into
account when collecting and using the LCA data Recalling the check list previously
described it is in the findings and features of the individual studies where one of the
biggest shortcomings when performing a meta-analysis concerning LCA studies is found
Assembling data from the individual studies is complex due to
the existing ldquoflexiblerdquo guidance in conducting LCA that leads to different
assumptions and methodological choices made in the various LCA modelling
exercises The ISO 14040 and 14044 standards provide the framework for LCA
This framework however leaves the individual practitioner with a range of
choices which can affect the legitimacy of the results of an LCA study
the lack of homogeneity reporting LCA results
As found in De Matos et al (2015) while doing a meta-analysis of different bioeconomy
value chains the most influencing differences among studies mainly relate to
The definition of the system boundaries and the stages included in the
study (eg even if the same general system boundaries are considered -
eg cradle to gate - some studies may or may not include intermediate
transport construction and decommissioning of buildings etc)
The impact assessment methods used as different methods may
consider for example different substances for a given impact category
and different characterization factors for the same substance
The definition of the functional unit (eg as the input the output
product the agricultural land unit etc) (Cherubini and Stromman
2011)
The consideration of direct and indirect land use change (dLUC and iLUC
respectively) (Cherubini and Stromman 2011)
The technology considered in the process and its maturity level
The approach used to model the multifunctional system For instance if
substitution is used the reference system selected may have a
significant influence on the final LCA results On the other hand if
allocation is used the selection of the allocation criteria and the relative
10 The definition of Meta-analysis given by Zumsteg et al (2012) is ldquoA melding of data from multiple studies usually involving additional mathematical analysis with the goal of utilizing this synergy of information and data size to answer questions that cannot be answered by existing individual studies or to improve the certainty or impact of know findings by increasing the sample
size Meta-analyses are often performed as part of a systematic reviewrdquo
42
contribution of each co-product may considerably influence the results of
the assessment
These points are in line with those reported in other studies in literature Wolf et al
(2015) conducted a meta-analysis of LCAs for wood energy services (heat power and
combined heat and power (CHP)) and chose a set of ldquodecisive parametersrdquo to be
analyzed arguing that those factors promote inconsistent findings along LCA studies
Apart from the previously mentioned the authors include the following factors (some of
them specific of the good or service under study)
Data sources such as empirical data literature well-known databases
unspecified databases simulators or expert interviews are some of
them
Transportation distances and types
Feedstock properties (in this case wood)
Combustion capacity and efficiency and co-combustion rates
Energy service provided (power heat and CHP)
Schreiber et al (2012) performed a meta-analysis on LCA studies of electricity
generation with carbon capture and storage (CCS) comprising the three main CCS
technologies (post-combustion oxyfuel and pre-combustion) In line with previous
studies they highlighted the different choices in the LCA methodology and parameters
(specific of the good or service under study) that heavily impact the overall results Here
we report those which differ from the already mentioned
Data quality and availability
Time horizon as most studies considered present and future power
plants as far as 2050
Spatial representation ndash some elements in the CCS process chain are
highly site-specific such as storage sites
Life cycle inventory (LCI) ndash which inputs and outputs are considered
Operational valuation and weighting methods
Power plant efficiency and energy penalty of the capture process
Carbon dioxide capture efficiency and purity
Fuel origin and composition
Moreover when having a look at the limitations of the review and meta-analysis some
studies just focus on GHG emissions Wolf et al (2015) set the CML midpoint impact
category Global Warming as the basis for the comparison of results because it is
represented in 100 of the studies They did not consider other less-frequent impact
categories but yet important such as acidification eutrophication and particulate
matter owing to the lack of results published in the studies On the other hand
Schreiber et al (2012) not only focused on GHG but they included other impacts such
as acidification potential eutrophication potential photochemical ozone creation
potential and cumulative energy demand
As a conclusion increased harmonization and transparency in the calculation and
reporting of LCA data and results is needed (Cristobal et al 2015)
711 Conclusions and recommendations
The number of LCA studies available is increasing and making sense of all the results
that can be obtained from them is a difficult task As a conclusion increased
harmonization and transparency in the calculation of LCA data and results is needed It
is recommended that reporting of LCA data is done in a more consistent and harmonized
43
manner to allow users of LCA study a better understanding of the results and
conclusions drawn
8 Conclusion
One of the key aims of LCA is to provide the decision makers with comprehensive and
understandable information this task is achieved by a proper interpretation of the
results of an LCA study
This report builds on the requirements provided in relevant international standards (ISO
14044) and guides (ILCD Handbook (EC-JRC 2011a) PEF Guide (EC 2013b) and it
proposes a practical approach on how to perform a robust interpretation of an LCA
study It provides a ready-to-use approach for the identification of significant issues and
it includes examples of completeness sensitivity and consistency checks based on real-
case studies which are used to draw the attention of the reader on how to evaluate the
results of an LCA study
The scheme proposed in this report should not be intended as a comprehensive list of
items to check instead it should be seen as a normal workflow that should be carried
out by an LCA practitioner in order to derive robust conclusions out of the LCA study
More accurate and case-specific checks should be done depending on the intended goal
and scope of the study
The report is structured in order to allow a practitioner focus on the two quantitative
phases of LCA the life cycle inventory (LCI) and the life cycle impact assessment (LCIA)
Regarding the LCI the report goes through the analysis of the data sources by giving
examples on how to interpret the system boundaries and the foreground system) it
provides an overview on data quality and it comprises further completeness and
consistency checks (eg cut-off long term emissions anomaly checks)
When analysing the LCIA the report provides insights on sensitivity analysis regarding
characterization normalization and weighting When dealing with characterization the
attention of the reader is drawn also on mapping between the inventory and the
characterization models and a discussion on the evaluation of uncharacterized
elementary flows is also included
Finally an overarching topic such as meta-analysis was deemed useful to be included as
this is often used when there is the need of assessing the state of the art of the LCA
studies on a specific product supply chain Key messages stemming from this report are
as follows
Results reveal that the relative importance of one substance compared to another
changes with the characterization model This is because the models differ in the
substances that they include and in the CFs of each substance It is
recommended to run a sensitivity check with different characterization models to
evaluate the robustness of the conclusions drawn It is also recommended to
evaluate the theory underlying the characterization models chosen to evaluate a
certain impact category as this helps understanding the results obtained Results of the LCIA phase can be highly affected by the characterization model
chosen Furthermore the evaluation of uncharacterized elementary flows is of
primary importance to assess the completeness of the LCIA coverage of the
identified LCI flows Indeed a high number of elementary flows inventoried might
be non-characterized by the chosen models even if their relevance in the
assessed impact categories could be of primary importance Therefore it is highly
recommended that a quantification of the uncharacterized elementary flows is
reported before any interpretation or conclusion is performed on the superiority
of one product versus another Different normalisation sets may produce different results in terms of
identification of most relevant impact categories life cycle stages and processes
Different reference systems refer to different situation which can all be valid
44
depending eg on the geographical scope of the study It is recommended to
evaluate different normalisation tests which fit the study at hand to support the
conclusions drawn with the baseline scenario or to provide additional insights Weighting sets are often dependent on different value choices to assign different
weights to all impact categories Therefore different weighting sets lead to
significant differences of the final conclusions It is recommended that the
decision about inclusion of which weighting set to use has been made and
documented in the first scope definition and shall not be changed later during the
study It is recommended that the overall uncertainty of an LCA study is estimated and
reported in the final report It is also recommended to include an evaluation to
which extent the uncertainties identified affect the final conclusions The number of LCA studies available is increasing and making sense of all the
results that can be obtained from them is a difficult task As a conclusion
increased harmonization and transparency in the calculation of LCA data and
results is needed It is recommended that reporting of LCA data is done in a more
consistent and harmonized manner to allow users of LCA study a better
understanding of the results and conclusions drawn Further aspects such as the appropriateness of the functional unit the intended goal
the system boundaries and value choices should normally be part of an interpretation in
order to identify recommendations and limitations of the study and draw the appropriate
conclusions They are not discussed further in this report but it is recommended that at
least each decision based on a personal or a stakeholderrsquos value shall always be
documented and explained in the conclusions of the LCA study This is consistent with
one of the key aims of LCA which is to provide the decision makers with comprehensive
and understandable information
45
References
Baitz M Makishi Colodel C Kupfer T Florin J Schuller O Kokborg M Koumlhler A
Thylmann D Stof-fregen A Schoumlll S Goumlrke J Rudolf M Gonzalez M (2016) GaBi
Database amp Modelling Principles Thinkstep Leinfelden-Echterdingen
Benini L Mancini L Sala S Manfredi S Schau EM Pant R (2014) Normalization
method and data for Environmental Footprints European Commission Joint
Research Center Institute for Environment and Sustainability Publications Office
of the European Union Luxemburg ISBN 978-92-79-40847-2
Benini L Sala S Pant R (2015) Global normalization factors for ILCD compliant
midpoint impact categories - EC-JRC internal draft report Set of factors available
at httpeplcajrceceuropaeuuploadsTable_ILCD_NFs_08-03-2016xlsx
Biganzoli L Falbo A Forte F Rigamonti L Grosso M (2015) Mass balance and life
cycle assessment of waste electrical and electronic equipment management
system implemented in Lombardia Region (Italy) Science of the Total
Environment 524ndash525 361-375
Bjoslashrn A Hauschild MZ (2015) Introducing carrying capacity-based normalization
in LCA framework and development of references at midpoint level The
International Journal of Life Cycle Assessment 20 (7)1005ndash1018
Blonk Agri-footprint BV (2014) Agri-footprint Methodology and basic principles -
Version 10
Brentrup F Kusters J Lammel J Kuhlmann H (2000) Methods to estimate on-
field nitrogen emissions from crop production as an input to LCA studies in the
agricultural sector The International Journal of Life Cycle Assessment 5 349ndash
357
Castellani V Benini L Sala S Pant R (2016) A distance-to-target weighting
method for Europe 2020 The International Journal of Life Cycle Assessment
21(8)1159-1169
Castellani V Sala S Benini L (2017) Hotspots analysis and critical interpretation
of food life cycle assessment studies for selecting eco-innovation options and for
policy support Journal of Cleaner Production 140 (2) 556-568
Cellura M Longo S Mistretta M (2011) Sensitivity analysis to quantify
uncertainty in life cycle assessment the case study of an Italian tile Renew Sust
Energ Rev 15(9)4697-4705
Cherubini F Stromman AH (2011) Life cycle assessment of bioenergy
systems state of the art and future challenges Bioresource technology 102 437
ndash 451
Ciroth A Muller S Weidema B Lesage P (2016) Empirically based uncertainty
factors for the pedigree matrix in ecoinvent The International Journal of Life
Cycle Assessment 21 1338-1348
CML (2002) CML-IA model and characterisation factors Available from
httpswwwuniversiteitleidennlenresearchresearch-outputsciencecml-ia-
characterisation-factors Accessed November 2015
Colomb V Ait-Amar S Basset-Mens C Dolleacute JB Koch P Lellahi A Mousset J
Salou T Tailleur A van der Werf HMG (2015) AGRIBALYSE Assessment and
lessons for the future Version 12
Corrado S Zampori L Castellani V Sala S (2017) Systematic analysis of
secondary Life Cycle Inventories when modelling agricultural production a case
study for arable crops Journal of Cleaner Production (under review)
46
Cristobal J De Matos CT Aurambout JP Manfredi S Kavalov B (2015)
Environmental sustainability assessment of bioeconomy value chains Biomass
and bioenergy 89 159 ndash 171
De Matos CT Cristobal J Aurambout JP (2015) Environmental sustainability
assessment of bioeconomy products and processes ndash progress report 1 European
Commission Report EUR 27356 EN
De Schryver A Galatola M (2016) Guidance for modelling agricultural processes
TAB Issue paper v 01 October 2016
Dewulf J Benini L Mancini L Sala S Blengini G A Ardente F Recchioni M Maes
J Pant R Pennington D (2015) Rethinking the Area of Protection lsquoNatural
Resourcesrsquo in Life Cycle Assessmen Environmental Science and Technology 49
(9)5310ndash5317
Dong Y Gandhi N Hauschild MZ (2014) Development of Comparative Toxicity
Potentials of 14 cationic metals in freshwater Chemosphere 112 26-33
Ecoinvent (2016) Allocation cut-off by classification [WWW Document] URL
httpwwwecoinventorgdatabasesystem-models-in-ecoinvent-3cut-off-
system-modelallocation-cut-off-by-classificationhtml (accessed 8916)
European Commission ndash Joint Research Centre (EC-JRC) (2011a) ILCD Handbook
ndash General guide for life cycle assessment ndash Detailed guidance European
Commission Joint Research Centre Institute for Environment and Sustainability
European Commission ndash Joint Research Centre (EC-JRC) (2011b) ILCD Handbook
- Recommendations for Life Cycle Impact Assessment in the European context
European Commission Joint Research Centre Institute for Environment and
Sustainability
European Commission (EC) (2013a) Communication from the Commission to the
EU Parliament and Council ndash Building the Single Market for Green Products ndash
Facilitating better information on the environmental performance of products and
organisations(20130196final)
European Commission (2013b) Commission Recommendation of 9 April 2013 on
the use of common methods to measure and communicate the life cycle
environmental performance of products and organisations (2013179EU) Official
Journal of the European Union Volume 56 4 May 2013
European Commission (2015)ndash Better Regulation Toolbox
httpeceuropaeusmart-regulationguidelinesdocsbr_toolbox_enpdf
European Commission (2016) Product Environmental Footprint Pilot Guidance -
Guidance for the implementation of the EU Product Environmental Footprint (PEF)
during the Environmental Footprint (EF) pilot phase - version 52 (pp 95)
Retrieved from
httpeceuropaeuenvironmenteussdsmgppdfGuidance_productspdf
FAO (2012) FAOstat Agriculture data Food and Agriculture Organization of the
United Nations httpfaostatfaoorg
Gaudreault C Samson R Stuart P (2009) Implications of choices and
interpretation in LCA for multi-criteria process design de-inked pulp capacity and
cogeneration at a paper mill case study J Clean Prod 17(17)1535-1546
Giampietro M Saltelli A (2014) Footprints to nowhere Ecological Indicators 46
610-621
Goedkoop M Heijungs R Huijbregts M de Schryver A Struijs J van Zelm R
(2009) ReCiPe 2008 A life cycle assessment method which comprises
harmonized category indicators at the midpoint and the endpoint level Report I
47
Characterisation Ministry of Housing Spatial Planning and Environment
Amsterdam
Guineacutee JB Gorreacutee M Heijungs R Huppes G Kleijn R de Koning A van Oers L
Wegener Sleeswijk A Suh S Udo de Haes HA de Bruijn H van Duin R
Huijbregts MAJ (2002) Handbook on life cycle assessment Operational guide to
the ISO standards I LCA in perspective IIa Guide IIb Operational annex III
Scientific background Kluwer Academic Publishers ISBN 1-4020-0228-9
Dordrecht 2002 692 pp
Guo M Murphy RJ (2012) LCA data quality sensitivity and uncertainty analysis
Science of the total environment 435230-243
Hauschild MZ Wenzel H (1998) Environmental Assessment of Products Vol 2 ndash
Scientific background Chapman amp Hall UK Kluwer Academic Publishers
Hingham USA
Heijungs R Kleijn R (2001) Numerical approaches towards life cycle
interpretation five examples The International Journal of Life Cycle Assessment
6(3)141-148
Hellweg S Mila i Canals L (2014) Emerging approaches challenges and
opportunities in life cycle assessment Science 344(6188) 1109-1113
Huang Y Spray A Parry T (2013) Sensitivity analysis of methodological choices
in road pavement LCA The International Journal of Life Cycle Assessment
18(1)93-101
Huijbregts MAJ Hellweg S Hertwich E (2011) Do we need a paradigm shift in life
cycle impact assessment Environmental Science and Techonology 45 (9)
38333834
Huijbregts MAJ (1999) Life-cycle impact assessment of acidifying and eutrophying
air pollutants Calculation of equivalency factors with RAINS-LCA Report available
at httpmedialeidenunivnllegacyLife-cycle20impact20assessmentpdf
(accessed April 2016)
Huppes G Van Oers L Pretato U Pennington DW (2012) Weighting
environmental effects Analytic survey with operational evaluation methods and a
meta-method The International Journal of Life Cycle Assessment 17 876ndash891
James K Galatola M (2015) Screening and hotspot analysis procedure to
identify the hotspots and the most relevant contributions (in terms of impact
categories life cycle stages processes and flows) Version 40 24 April 2015
Retrieved from
httpswebgateeceuropaeufpfiswikisdisplayEUENVFPEU+Environmental+F
ootprint+Pilot+Phase accessed November 2016
ISO 14040 (2006a) Environmental managementmdashlife cycle assessmentmdash
principles and framework Geneva Switzerland
ISO 14044 (2006b) ndash Environmental management ndash Life Cycle assessment ndash
Requirements and guidelines
Laurent A Hauschild M Z Golsteijn L Simas M Fontes J Wood R (2013)
Deliverable 52 Normalisation factors for environmental economic and socio-
economic indicators Report prepared within the 7th Framework programme
Project PROSUITE Available at httpwwwprosuiteorgwebguestpublic-
deliverables (accessed December 2015)
Lee SJ Hawkins TR Ingwersen WW Young DM (2014) Exploring the Use of
Ecological Footprint in Life Cycle Impact Assessment Findings from a Comparison
of Transportation Fuels Journal of Industrial ecology 19(3) 416ndash426
48
Mancini L Benini L Sala S (2015) Resource footprint of Europe complementarity
of Material Flow Analysis and Life Cycle Assessment for policy support
Environmental Science and Policy 54367ndash376
Mancini L Benini L Sala S (2016) Characterization of raw materials based on
supply risk indicators for Europe The International Journal of Life Cycle
Assessment 1-13 doi101007s11367-016-1137-2
Nemecek T Baumgartner D (2006) Concerted Action GL-Pro WP4
Environmental Analysis - Final report - Deliverable 43 Available at
httpwwwagroscopeadminchpublikationeneinzelpublikationindexhtmllang
=enampaid=23328amppid=23604
Notarnicola B Sala S Antoacuten A McLaren SJ Saouter E Sonesson U (2017a) The
role of life cycle assessment in supporting sustainable agri-food systems a
review of the challenges Journal of Cleaner Production 140(2)399-409
doi101016jjclepro201606071
Notarnicola B Tassielli G Renzulli PA Castellani V Sala S (2017b) Environmental
impact of food consumption in Europe Journal of Cleaner Production 140(2)
753-765 doi101016jjclepro201606080
Pizzol M Christensen P Schmidt J Thomsen M (2011) Impacts of ldquometalsrdquo on
human health a comparison between nine different methodologies for Life Cycle
Impact Assessment (LCIA) Journal of Cleaner Production 19(6) 646-656
Pizzol M Laurent A Sala S Weidema B Verones F Koffler C (2016)
Normalisation and weighting in life cycle assessment Quo Vadis The
International Journal of LCA 1-14 doi 101007s11367-016-1199-1
Prado-Lopez V Seager TP Chester M Laurin L Bernardo M Tylock S (2014)
Stochastic multi-attribute analysis (SMAA) as an interpretation method for
comparative life-cycle assessment (LCA) Int J Life Cycle Ass 19(2)405-416
Pregrave Consultants (2015) SimaPro Database Manual - Methods library available at
httpswwwpre-sustainabilitycomsimapro-database-and-methods-library
(accessed February 2016)
Ponsioen TC Goedkoop MJ (2016) Midpoint weighting based on endpoint
information Submitted to The International Journal of Life Cycle Assessment
Rigamonti L Falbo A Zampori L Sala S (2017) Supporting a transition towards
sustainable circular economy sensitivity analysis for the interpretation of LCA for
the recovery of electric and electronic waste The International Journal of Life
Cycle Assessment 1-10 doi 101007s11367-016-1231-5
Rosenbaum RK Bachmann TM Gold LS Huijbregts MAJ Jolliet O Juraske R
Koehler A Larsen FH MacLeod M Margni M McKone TE Payet J Schuhmacher
M van de Meent D Hauschild MZ (2008) USEtoxmdashthe UNEP-SETAC toxicity
model recommended characterisation factors for human toxicity and freshwater
ecotoxicity in life cycle impact assessment The International Journal of Life Cycle
Assessment 13(7) 532-546
Sala S Wolf MA Pant R (2012) Characterization factors of the ILCD
Recommended Life Cycle Impact Assessment methods Database and Supporting
Information First edition EUR25167EN ISBN 978-92-79-22727 Luxembourg
Publications Office of the European Union Available at
httpeplcajrceceuropaeuuploads201401LCIA-characterization-factors-of-
the-ILCDpdf
Schau EM Davidsson B (2015) Product Environmental Footprint (PEF) Category
Rules (PEFCR) Pilot Intermediate Paper Product First Draft PEFCR July
2015Accessible for registered stakeholders at
49
httpswebgateeceuropaeufpfiswikisdisplayEUENVFPStakeholder+workspa
ce3A+PEFCR+pilot+Intermediate+paper+product
Schau EM Fet AM (2008) LCA studies of food products as background for
environmental product declarations The International Journal of Life Cycle
Assessment 13(3) 255-264
Schneider L Berger M Finkbeiner M (2011) The anthropogenic stock extended
abiotic depletion potential (AADP) as new parameterization to model the depletion
of resources The International Journal of Life Cycle Assessment 16(9) 929-936
Schneider L Berger M Finkbeiner M (2015) Abiotic resource depletion in LCAmdash
background and update of the anthropogenic stock extended abiotic depletion
potential (AADP) model The International Journal of Life Cycle Assessment
20(5) 709-721
Schreiber A Zapp P and Marx J (2012) Meta-Analysis of Life Cycle Assessment
Studies on Electricity Generation with Carbon Capture and Storage Journal of
Industrial Ecology 16 S155ndashS168
Seppaumllauml J Posch M Johansson M Hettelingh JP (2006) Country-dependent
Characterisation Factors for Acidification and Terrestrial Eutrophication Based on
Accumulated Exceedance as an Impact Category Indicator The International
Journal of Life Cycle Assessment 11(6) 403-416
Skone TJ (2000) What is Life Cycle Interpretation Environmental Progress 19
(2) 92-100
Steen BA (1999) A systematic approach to environmental priority strategies in
product life development (EPS) Version 2000 ndash Models and data of the default
method Chalmers University LindholmenJohanneberg
Stranddorf HK Hoffmann L Schmidt A (2005) Update on Impact Categories
Normalisation and Weighting in LCA - Selected EDIP97-data Environmental
Project Nr 995 Miljoslashprojekt httpwww2mstdkudgivPublications200587-
7614-570-0pdf87-7614-571-9PDF (accessed December 2015)
Tuomisto HL Hodge ID Riordan P Macdonald DW (2012) Exploring a safe
operating approach to weighting in life cycle impact assessment ndash a case study of
organic conventional and integrated farming systems Journal of Cleaner
Production 37147-153
UNEP- SETAC (2016) Hotspots Analysis an Overarching Methodological
Framework Draft document developed for UNEPSETAC Life Cycle Initiative -3
Flagship Project 3a (Phase 2) 11 october 2016 Available at
httpwwwwraporgukcontentprinciples-and-practices-hotspot-analysis
Van Hoof G Vieira M Gausman M Weisbrod A (2013) Indicator selection in life
cycle assessment to enable decision making issues and solutions International
Journal of Life Cycle Assessment 181568-1580
Van Zelm R Huijbregts M A van de Meent D (2009) USES-LCA 20mdasha global
nested multi-media fate exposure and effects model The International Journal
of Life Cycle Assessment 14(3) 282-284
Wackernagel M Monfreda C Moran D Wermer P Goldfinger S Deumling D
Murray M (2005) ―National Footprint and Biocapacity Accounts 2005 The
underlying calculation method Global Footprint Network Oakland California
USA
Weidema B Bauer C Hischier R Mutel C Nemecek T Reinhard J Vadenbo CO
Wernet G (2013) Overview and methodology Data quality guideline for the
ecoinvent database version 3
50
Williams ED Weber CL Hawkins TR (2009) Hybrid Framework for Managing
Uncertainty in Life Cycle Inventories Journal of Industrial Ecology 13 928ndash944
Wolf C Klein D Weber-Blaschke G Richter K (2015) Systematic review and
meta-analysis of life cycle assessment for wood energy services Journal of
Industrial Ecology 20 743 ndash 763
Zumsteg JM Cooper JS Noon MS (2012) Systematic Review Checklist Journal of
Industrial Ecology 16 S12ndashS21
51
List of abbreviations and definitions
AOX adsorbable organic halogens
BOD biochemical oxygen demand
BTEX benzene toluene xylene isomers
CFs characterisation factors
COD chemical oxygen demand
DQR data quality requirements
EcF ecological footprint
EF environmental footprint
ElFl elementary flow
HMs heavy metals
IC impact category
ILCD International Reference Life Cycle Data System
LCA life cycle assessment
LCI life cycle inventory
LCIA life cycle impact assessment
OEFSR organisation environmental footprint sector rules
PAH polycyclic aromatic hydrocarbons
PEF product environmental footprint
PEFCR product environmental footprint sector rules
PPP plant protection products
OEF organisation environmental footprint
TAB technical advisory board
TS technical secretariat
UNEPSETAC LCI Unep Setac Life cycle Initiative
VOC volatile organic compounds
WEEE waste electrical and electronic equipment
52
List of figures
Figure 1 Practical application of requirements in ISO 14044 and ILCD Handbook to
interpret LCI and LCIA results 5
Figure 2 Hotspot analysis in the context of the Environmental Footprint pilot (James amp
Galatola 2015) 8
Figure 3 Contribution analysis for the resource- related indicator calculated adopting
several characterization models (Rigamonti et al 2017) 27
53
List of tables
Table 1 Summary of requirements to define most relevant contributions and hotspots
(James amp Galatola 2015) 11
Table 2 Selection of most relevant Impact Categories (James amp Galatola 2015) 12
Table 3 Selection of most relevant life cycle stages (James amp Galatola 2015) 13
Table 4 Selection of most relevant processes (James amp Galatola 2015) 13
Table 5 Inventory results (climate change results expressed in gCOeq) (James amp
Galatola 2015) 14
Table 6 Most relevant inventory flows contributing to climate change (based on the
inventory results before normalisation and weighting) - overall life cycle (option 1)
(James amp Galatola 2015) 14
Table 7 Most relevant inventory flows contributing to climate change (based on the
inventory results before normalisation and weighting) ndash process level (option 2) (James
amp Galatola 2015) 14
Table 8 Hotspots based on 50 cumulative contribution (OPTION A) (James amp Galatola
2015) 15
Table 9 Hotspots based on top two representatives (OPTION B) (James amp Galatola
2015) 15
Table 10 Underlying assumptions in relation to the three databases considered by the
authors (Corrado et al 2017) 17
Table 11 Data quality rating in an example of intermediate paper products (EC 2013
Schau and Davidsson 2015) 20
Table 12 Data quality rating in an early phase of a PEF study of intermediate packaging
paper 21
Table 13 Example of check of inventoried elementary flows that are not characterized by
two impact assessment methods (based on Castellani et al 2017) 29
Table 14 List of impact categories listed in ILCD with total number of elementary flows
contributing to each IC 30
Table 15 Type of chemicals (mass and number of EFs) not characterized per emission
compartment (air oxygen and hydrogen have been excluded) 31
Table 16 Most relevant elementary flows contributing cumulatively up to 90 to the
freshwater ecotoxicity impact category with USEtox 32
Table 17 Summary of normalization sets used in the sensitivity analysis in Castellani et
al (2016) 33
Table 18 Results of sensitivity analysis on normalization sets at the European and global
scale for ILCD- and CML-IA methods (Castellani et al 2016) The percentages
represent the contribution of each product group to the total impacts of the BoP per
citizen (reference flow) Equal weighting of impact categories is applied The second
column reports the mass of each product group in the basket A color scale is applied to
the results in each column (ie product group) from green (lowest contribution) to red
(highest contribution) 34
Table 19 Results of sensitivity analysis on normalization sets at the European and global
scale for ILCD and CML-IA methods (Castellani et al 2016) The percentages reflect
the relative relevance of impact categories compared to the total impacts of the BoP per
citizen (reference flow) A colour scale is applied to the results in each column (ie
impact category) from green (lowest contribution) to red (highest contribution) 35
54
Table 20 Summary of weighting sets used in the sensitivity analysis by Castellani et al
(2016) 36
Table 21 Product groups contribution Results of several ILCD-compliant weighting sets
in combination with normalization references EU27 (Castellani et al 2016) A color scale
is applied to the results in each column (ie product group) from green (lowest
contribution) to red (highest contribution) 37
Table 22 Relevance of the different impact category Results of the application of several
ILCD-compliant weighting sets in combination with normalization references EU27
(Castellani et al 2016) A color scale is applied to the results in each column (ie
impact category) from green (lowest contribution) to red (highest contribution) 38
Europe Direct is a service to help you find answers
to your questions about the European Union
Freephone number ()
00 800 6 7 8 9 10 11 () The information given is free as are most calls (though some operators phone boxes or hotels may
charge you)
More information on the European Union is available on the internet (httpeuropaeu)
HOW TO OBTAIN EU PUBLICATIONS
Free publications
bull one copy
via EU Bookshop (httpbookshopeuropaeu)
bull more than one copy or postersmaps
from the European Unionrsquos representations (httpeceuropaeurepresent_enhtm) from the delegations in non-EU countries (httpeeaseuropaeudelegationsindex_enhtm) by contacting the Europe Direct service (httpeuropaeueuropedirectindex_enhtm) or calling 00 800 6 7 8 9 10 11 (freephone number from anywhere in the EU) () () The information given is free as are most calls (though some operators phone boxes or hotels may charge you)
Priced publications
bull via EU Bookshop (httpbookshopeuropaeu)
XX-N
A-x
xxxx-E
N-N
doi102788171315
ISBN 978-92-79-64114-5
LB-N
A-2
8266-E
N-N

5
least each decision based on a personal or a stakeholderrsquos value shall always be
documented and explained in the conclusions of the LCA study This is consistent with
one of the key aims of LCA which is to provide the decision makers with comprehensive
and understandable information in a transparent manner
Figure 1 Practical application of requirements in ISO 14044 and ILCD Handbook to interpret LCI and LCIA results
6
3 Identification of key issues Hotspots analysis
In order to get started with interpretation of results it is necessary to identify what the
key issues are Once the key issues are identified it is possible to further evaluate the
overall robustness of the LCA study by using for example completeness consistency and
sensitivity checks
This chapter on hotspot analysis gives an overview of the overarching methodological
framework of hotspot analysis as currently developing with the UNEPSETAC Life Cycle
Initiative - Flagship Project 3a and the hotspot analysis as tested in the Environmental
Footprint (EF) pilot phase (2013 ndash 2017) In the first case hotspot analysis is regarded
as a subject on its own in the second case it is shown a practical way to perform a
hotspot analysis in an environmental footprinting context in the EU Environmental
Footprint it is more focused on the interpretation of the screening study results of the
average or representative product1 The hotspots in a EU Environmental Footprint may
be but does not have to found in a contribution analysis of the characterized results
Therefore in this chapter we first describe the hotspot analysis as outlaid in the
UNEPSETAC LCI and then the hotspot analysis as performed in the EF pilot phase
31 The hotspot analysis in the UNEPSETAC Life Cycle Initiative
The UNEPSETAC Life Cycle Initiative has been running a Flagship project (nr 3a) on
hotspot analysis since 2012 until 2017 According to UNEPSETAC (2016) the benefits
of hotspots analysis include ensuring
Focus on priority issues (eg waste water materials of concern)
Focus on the right life cycle stage (eg material acquisition manufacturing use
end of life)
Focus on the right actors (eg producers manufactures suppliers retailers
customers) to evaluate influence and implement solutions
Implications of trade-offs are understood
Resources (eg time money) can be effectively allocated to actions
Previously there was not currently a common global approach to hotspots analysis nor
has there been sufficient effort to bring together or share best practice amongst those
organisations or initiatives currently developing and using these methods Nor was there
any accepted guidance on how to translate and apply the results of hotspots analysis
into meaningful sustainability information and insight for use by industry governments
and other stakeholders Therefore the UNEP SETAC Life Cycle Initiative established a
new Flagship Project to address these and other issues The objectives of the
UNEPSETAC LCI Flagship Project 3 are to produce
1 A common methodological framework and global guidance for sustainability hotspots analysis
2 A protocol for the appropriate use and communication of sustainability information derived from hotspots analysis
3 To evaluate and if possible implement a range of options to bring together the findings from existing hotspots studies to provide a richer global picture of sustainability hotspots in the economy and society
Phase 1 was finished in December 2014 and gives an overview of different tools and
methods that can be used in the hotspot analysis This includes 42 hotspots analysis
1 In the context of the EF pilot phase within each Product Environmental Footprint Category Rule
(PEFCR) pilot a ldquorepresentative productrdquo has to be defined which is representing gt50 of the European market The PEF screening study is a PEF study conducted on the representative product one of the aims of the screening study is to identify the hotspots most relevant
elementary flows processes and life cycle stages
7
methodologies divided into product sector and national scale of application Of these 21
methodologies (4 at the national-level 5 at the sector-level and 12 predominantly
applied at the product category-level) were shortlisted and further analysed Examples
of methods are EU EIPRO and Global Protocol for Community Scale GHG emissions on
the national level GHG Protocol Corporate Value Chain (Scope 3) Accounting and
Reporting Standard and Sustainability Accounting Standards Board Materiality Maptrade on
the sector level and French Grenelle I and II BPX 30-323-0 Product Lifecycle
Environmental Impact Quantification Guidance Standard and Water Quality Association
(WQA) Hotspots Analysis on the product level Please refer to Figure ES 2 in (Barthel et
al 2014) for the complete list
This first phase of the project fed into the second phase of the Flagship project
Phase 2 is running from January 2015 ndash January 2017 and produces the methodological
framework (UNEPSETAC 2016) and the communication guidance2 These are currently
in a six-weeks public consultation (27 Oct ndash 15 Dec 2016) The framework provides
a recognized set of guiding principles and practices for hotspots analysis
a globally agreed methodological framework for hotspots analysis
agreement on the appropriate use and communication of product sustainability
information derived from hotspots analysis
Future step will be to work with hotspot analysis for cities and regions and road testing
of the methodological framework
32 The hotspot analysis in the Environmental Footprint pilot
phase (2013 ndash 2017)
The 2013-2017 Environmental Footprint (EF) pilot phase has three main objectives
test the process for developing product- and sector-specific rules
test different approaches to verification
test communication vehicles for communicating life cycle environmental
performance to business partners consumers and other company stakeholders
This is tested by groups of organisations called Technical Secretariats (TS) who
volunteered to develop the rules for their product or sector
The hotspot analysis as described below were tested and developed in an iterative way
on the approximatively 25 pilots participating in the EF pilot phase to develop Product
Environmental Footprint (PEF) Category Rules (PEFCR) or Organisation Environmental
Footprint (OEF) Sector Rules (OEFSR)
A hotspot analysis is required for the PEFOEF screening studies of the average or
representative product for the PEFCROEFSR and for the supporting studies3 (EF study of
a single productorganisation belonging to the product categorysector) when developing
PEFCROEFSR (PEFCR Guidance document (EC 2016))
The hotspot analysis in the EF context aims to identify the hotspots the most relevant
impact categories life cycle stages processes and elementary flows as shown in Fig 2
and it provides a guidance on how to do that
2 Communicating hotspots The effective use of sustainability information to drive action and improve
performance from httpwwwwraporguksitesfileswrapHotspots20Communications20Guidelines20v35207Oct2016pptx 3 The EF supporting studies are PEFOEF studies run by single companies with the aim of testing the draft
PEFCRs and OEFSRs
8
Figure 2 Hotspot analysis in the context of the Environmental Footprint pilot (James amp Galatola 2015)
As shown in the figure the hotspots (and thereby also the hotspot analysis) is important
for the decision on which life cycle stages processes and elementary flows that are
hotspots (gt 50 contribution) and which are relevant (gt 80 contribution)
The hotspots might serve the purpose of warning an organisation about the area where
they should focus their attention in order to improve the environmental performance of a
product (PEF) or an organisation (OEF) Whilst traditionally LCA practitioners are
expected to provide primarysite-specific data for processes taking place in the
foreground and secondary data for processes taking place in the background in PEFOEF
the implementation of the materiality principle leads to a different approach The
processes most contributing to the final results (in terms of environmental impacts or
savings) are those for which the best quality of data should be provided For the
processes less relevant it is possible to use data of lower quality
321 Procedure to identify the most relevant impact categories Starting from the normalised and weighted results of PEF screening study each
Technical Secretariat is asked to select the impact categories that they consider more
relevant in terms of communication purposesrdquo
322 Procedure to identify the most relevant life cycle stages
The proposed guideline by the PEFCR Guidance (EC 2016) is to consider as relevant all
life cycle stages which together contribute over 80 (before normalisation and
weighting) to any of the baseline impact categories This should start from the largest to
the smallest contributions In addition more life cycle stages can be added to the list of
the most relevant ones
In order to guarantee a minimum level of harmonisation among different
PEFCRsOEFSRs a list of default life cycle stages was identified
Raw material acquisition and pre-processing (including production of parts and
unspecific components)
9
Production of the main product4
Product distribution and storage
Use stage scenario (if in scope)
End-of-life (including product part reuse recovery recycling if in scope)
323 Procedure to identify the most relevant processes
Each impact category shall be investigated to identify the most relevant processes The
identification of the most relevant processes shall be done at the whole life cycle level
Similaridentical processes taking place in different life cycle stages (eg transportation)
shall be accounted separately
In the context of the EF pilot phase processes were defined as most relevant where they
collectively contributed at least 80 to any impact category before normalisation and
weighting
In some instances vertically aggregated datasets may be identified as representing
relevant processes It may not be obvious which process within an aggregated dataset
is responsible for contributing to an impact category The metadata accompanying the
data should be reviewed and used to identify relevant processes If this is not possible it
can be decided whether to seek further disaggregated data or to treat the aggregated
dataset as a process for the purposes of identifying relevance5
324 Procedure to identify the most relevant elementary flows
As far as the most relevant elementary flows is concerned they are the ones contributing
cumulatively more than 80 to the impact category It can be decided whether this is
calculated at the level of overall life cycle and or single (most relevant) process level
All elementary flows contributing more than 5 to the impact category shall be
considered as relevant
Once the most relevant elementary flows have been identified they shall be linked to the
processes emitting them
325 Procedure to identify the hotspots
A hotspot can be identified at different levels of granularity impact category life cycle
stage process or elementary flow
In the context of PEFOEF pilot phase a hotspot is defined as either (James and Galatola
2015)
OPTION A (1) life cycle stages (2) processes and (3) elementary flows
cumulatively contributing at least 50 to any impact category before
normalisation and weighting (from the most contributing in descending order)
OPTION B At least the two most relevant life cycle stages processes and at least
two elementary flows (minimum 6) Additional hotspots may be identified by the
TS
4 If it is not possible to differentiate between the production of the main product and ancillary materials and
other life cycle stages eg raw material acquisition and transport then these life cycle stages can be merged Adequate justifications shall be provided in the screening report and be highlighted in the consultation phase If an aggregated life cycle stageprocess is most relevant it implies that all the processes included will be classified as most relevant 5 In this last case if an aggregated dataset is relevant everything in it is automatically relevant
10
326 Dealing with negative numbers
When identifying the percentage contribution from any process or flow it is important
that absolute values are used (ie the minus sign is ignored) in calculating percentage
contributions This allows indentifying the relevance of any credits
327 Specific instructions about aggregating elementary flows
The toxicity-related impact categories (ldquoHuman toxicity cancer effectsrdquo ldquoHuman
toxicity non-cancer effectsrdquo and ldquoFreshwater ecotoxicityrdquo) contain long lists of
characterization factors specified on the elementary flow category level 3 (also known
as sub-compartment ndash for example urban air freshwater agricultural soil) The impact
category ldquoParticulate matterrdquo also contains characterization factors at the level 3
category
It is recommended to aggregate the elementary flows on the level 2 category (ie
emissions to air water soil) in the contribution analysis This is to make the analysis
more manageable and because the level 3 category does not give additional information
when analyzing on the process level (the processes already contain information on the
location type of the emissions)
It is important to model foreground data on the level 3 category for particulates and
toxic substance flows because the characterization factors can deviate considerably
Metal resource flows are not specified per origin of ore type in the source files of the
ILCD recommended methods However in several background databases metal
resource flows are differentiated (for example Silver Ag 46E-5 Au 13E-4 in ore
Silver Ag 42E-3 Au 11E-4 in ore Silver Ag 21E-4 Au 21E-4 in ore etc)
Therefore the specified flows were added to the ILCD method in LCA software packages
with the same characterization factors as for the unspecified metals When doing a
contribution analysis of the metal resource flows it is therefore recommended to
aggregate the flows per metal (silver copper nickel etc)
There are 5 different fossil fuel related resource flows specified in the source files of the
ILCD recommended methods (brown coal 119 MJkg crude oil 423 MJkg hard coal
263 MJkg natural gas 441 MJkg peat 84 MJkg) However in several background
databases fossil resource flows are specified with different calorific values (for example
Gas natural 468 MJ per kg Gas natural 366 MJ per m3 Gas natural 35 MJ per m3
Gas natural 303 MJ per kg etc) Therefore the specified flows were added to the
ILCD method in LCA software packages with characterization factors related to the
factors in the original source taking the different calorific value into account When
doing a contribution analysis of the fossil resource flows it is therefore recommended to
aggregate the flows based on the 5 original flows (brown coal crude oil hard coal
natural gas and peat)
328 Conclusions
In table 1 the requirements to define most relevant contributions during the EF pilot
phase are summarized as found in the PEFCR Guidance (EC 2016)
11
Table 1 Summary of requirements to define most relevant contributions and hotspots (James amp Galatola 2015)
Item At what level does relevance need to be identified
Threshold
Most relevant impact categories In the final results starting from normalized and weighted results but deviations possible if justified
No threshold Decision left to TS but subject to stakeholder consultation and TAB opinion
Most relevant life cycle stages For each impact category before normalization and weighting Not relevant for data needs identification
All life cycle stages contributing cumulatively more than 80 to any impact category
Hotspots For each impact category before normalization and weighting
Either (i) life cycle stages processes and elementary flows cumulatively contributing at least 50 to any impact category or
(ii) at least the two most relevant impact categories life cycle stages processes and at least two elementary flows (minimum 6) Additional hotspots may be identified by the TS
Most relevant processes For each impact category before normalization and weighting Essential for data needs identification
All processes contributing cumulatively more than 80 to any impact category
Most relevant elementary flows For each impact category before normalization and weighting Essential for data needs identification
All elementary flows contributing cumulatively more than 80 to any impact category and in any case all those contributing more than 5 individually
When assessing what is most relevant it is also recommended to check if what is
identified as being non-relevant can be actually considered as such A practical example
is given at paragraph 431
12
329 Example to identify most relevant contributions and hotspots
The PEFCR Guidance (2016) also provided an example on how to perform a hotspot
analysis and the identification of most relevant impact categories life cycle stages
processes and elementary flows The example is reported here it is a fictitious example
not based on any specific PEF study results
3291 Example most relevant Impact Categories
Table 2 shows the contribution of different impact categories based on normalised and
weighted results
Table 2 Selection of most relevant Impact Categories (James amp Galatola 2015)
Impact category Unit Contribution ()
Climate change kg CO2 eq 215
Ozone depletion kg CFC-11 eq 30
Human toxicity cancer effects CTUh 83
Human toxicity non-cancer effects CTUh 149
Particulate matter kg PM25 eq 01
Ionizing radiation human health Kbq U235 eq 05
Photochemical ozone formation kg NMVOC eq 24
Acidification molc H+ eq 15
Terrestrial eutrophication molc N eq 10
Freshwater eutrophication kg P eq 10
Marine eutrophication kg N eq 01
Freshwater ecotoxicity CTUe 01
Land use kg deficit 143
Water resource depletion m3 water eq 186
Mineral fossil resource depletion kg Sb eq 127
Based on the normalised and weighted results the TS can decide that the following
impact categories are relevant for communication purposes climate change water
depletion and land use Where there is deviation from the most significant contributors
to the normalised and equally weighted results justification shall be provided
Once the relevant impact categories for communication purposes have been selected
the TS shall start identifying the most relevant life cycle stage processes and flows per
each impact category (all baseline EF impact categories not only those relevant for
communication purposes)
13
3292 Example most relevant Life Cycle Stages
Table 3 shows the contribution of different life cycle stages to the climate change impact
category (based on the characterised inventory results before normalisation and
weighting)
Table 3 Selection of most relevant life cycle stages (James amp Galatola 2015)
Life cycle stage Contribution ()
Raw material acquisition and pre-processing 421
Production of the main product 252
Product distribution and storage 164
Use stage (if in scope) 108
End-of-life 55
The three life cycle stages in purple will be the ones identified as most relevant for
climate change as they are contributing to more than 80 This procedure shall be
repeated for all the baseline EF impact categories
3293 Example most relevant Processes
Table 4 shows the contribution of different processes to the climate change impact
category (based on the characterised inventory results before normalisation and
weighting)
Table 4 Selection of most relevant processes (James amp Galatola 2015)
Unit process Contribution ()
Process A 89
Process B 614
Process C 234
Process D 28
Process E 15
Process F 09
Other processes 09
According to the proposed procedure the processes in orange shall be selected as ldquomost
relevantrdquo Process E could be added to the as most relevant ones based on specific
considerations (eg it is under operational control it is of relevance for the specific
sector etc) This procedure shall be repeated for all the baseline EF impact categories
3294 Example most relevant Elementary Flows
Considering that the selection of the most relevant elementary flows can be done at
overall life cycle level (option 1) andor per relevant process (option 2) there are two
14
possible outcomes Starting from the inventory results provided in Table 5 the list of
most relevant flows are highlighted in blue in Table 6 (at overall life cycle) and Table 7
(at process level)
Table 5 Inventory results (climate change results expressed in gCOeq) (James amp Galatola 2015)
Inventory flow Substance 1 Substance 2 Substance 3 Substance 4 Substance 5 Total
Process A 249 85 6 45 5 390
Process B 1100 600 500 450 50 2700
Process C 300 250 20 30 430 1030
Process D 60 30 20 10 5 125
Process E 64 1 1 1 1 68
Process F 15 10 8 5 3 41
Other processes 15 10 8 5 3 41
Total 1803 986 563 546 497 4395
Table 6 Most relevant inventory flows contributing to climate change (based on the inventory results before normalisation and weighting) - overall life cycle (option 1) (James amp Galatola 2015)
Inventory flow Substance 1 Substance 2 Substance 3 Substance 4 Substance 5 Total
Process A 57 19 01 10 01 89
Process B 250 137 114 102 11 614
Process C 68 57 05 07 98 234
Process D 14 07 05 02 01 28
Process E 15 00 00 00 00 15
Process F 03 02 02 01 01 09
Other processes 03 02 02 01 01 09
Total 410 224 128 124 113
Table 7 Most relevant inventory flows contributing to climate change (based on the inventory results before normalisation and weighting) ndash process level (option 2) (James amp Galatola 2015)
Inventory flow Substance 1 Substance 2 Substance 3 Substance 4 Substance 5 Total
Process A 64 22 2 12 1 100
Process B 41 22 19 17 2 100
Process C 29 24 2 3 42 100
15
Process D 48 24 16 8 4 100
Process E 94 1 1 1 1 100
Process F 37 24 20 12 7 100
Other processes 37 24 20 12 7 100
3295 Example hotspots
In Tables 8 and 9 the identified hotspots - based on the two different approaches
available- are presented
Table 8 Hotspots based on 50 cumulative contribution (OPTION A) (James amp Galatola 2015)
Hotspots
Life cycle stages Raw material acquisition and pre-processing
Production of the main product
Processes Process B
Elementary flows Option 1 Substance 1 and 2
Option 2
Substance 1 and 2 in processes B
Substance 1 and 5 in process C
Substance 1 in process E
Table 9 Hotspots based on top two representatives (OPTION B) (James amp Galatola 2015)
Hotspots
Life cycle stages Raw material acquisition and pre-processing
Production of the main product
Processes Process B
Process C
Elementary flows Option 1 Substance 1 and 2 in process B
Option 2 Substance 1 in process E6 and substance 5 in process C
4 Interpretation on Life Cycle Inventory (LCI) level
During the life cycle inventory phase the actual data collection and modelling of the
system has to be done in line with the goal definition and aiming at meeting the
requirements derived in the scope phase The LCI results are the input to the
subsequent Life Cycle Impact Assessment (LCIA) phase
Interpretation involves evaluations at the level of Life Cycle Inventory in order to
improve the inventory model to meet the needs derived from the study goal
perform a sensitivity analysis to check for limitations in the appropriateness of
the life cycle inventory work
6 Choosing the hotspots based on option B-2 might lead to anomalies (like in this fictitious
example) where an elementary flow is identified as hotspot even if its absolute value is not
prominent
16
understanding the underlying assumptions when secondary datasets are used in
the model
combining the above points to refine the LCA model
draw appropriate and robust conclusions
Key aspects to evaluate life cycle inventories are the consistency and completeness
thereof They can be evaluated taking into account different aspects A sensitivity check
to evaluate the reliability of the results is also a needed step
A first aspect to be taken into account is the data source Primary data are collected
directly by the company performing the study thus the consistency of the data used
with the goal and scope of the study should be more straightforward However when
and LCA study is making use of secondary datasets to model the background system a
careful analysis of the consistency of these datasets with the primary data collected and
in relation with the goal and scope shall be made
Indeed different modelling assumptions in datasets aimed at representing the same
product system can lead to different results affecting the reliability of the LCA study
(Williams et al 2009) An example of the relevance of different data sources and
consistency has been discussed in Corrado et al (2017) this study focuses on different
data sources to originate the inventory of arable crops (1 kg of wheat) The choice of the
secondary dataset can have a relevant influence on LCA results and it is considered
among the challenges for a robust LCA (Notarnicola et al 2017a)
A second aspect to be taken into account regarding life cycle inventories is the quality of
the data used regarding time geographical and technological representativeness
precision methodological compliance and documentation Therefore in this chapter a
paragraph is dedicated to analyzing more in detail this aspect
A third relevant aspect in relation to LCIs is the consistency and completeness in relation
to single aspects such as cut-off inclusionexclusion of specific elementary flows (eg
long term emissions) It is not straightforward to judge if an inventory can be considered
complete As a general rule it has always to be kept in mind that the inventory has to
be checked in its completeness in relation to the goal and scope of the study for
example if the goal of the study is to assess only the climate change impact category
the completeness of the inventory shall be evaluated against those emissions that are
actually contributing to climate change within the system boundaries It does not lead to
improved conclusions the compilation of a more detailed inventory with the inclusion of
eg substances that do not contribute to climate change
41 Analysis of data sources
When selecting secondary data sets it is important to ensure that all data sets used in
the modelling of the system model are methodologically consistent (ie consistency
check) The use of inconsistent data can lead to an unreliable and distorted LCA study
often with wrong conclusion and recommendations drawn Furthermore use of datasets
with different level of completeness (ie completeness checks) may also lead to
unreliable conclusions
The study from Corrado et al (2017) is used as a case study to highlight the relevance
of different data sources in an LCA study Therefore the content of this paragraph is
mainly based on this paper The paper is organized as follows firstly the authors report
an overview of the system boundaries and underlying assumptions adopted in building
secondary datasets for arable crops within three databases Secondly they summarise
the approaches adopted to model the foreground system highlighting analogies and
differences Afterwards they point out the influence that modelling approaches can have
on the impact assessment Finally the combination of these elements allowed to derive
some considerations on relevant elements of datasets
17
It is focused on the analysis of secondary datasets for arable crops production as
modelled in three databases adopted as source of secondary data in LCA Agribalyse v
12 (Colomb et al 2015) Agrifootprint v 10 (Blonk Agri-footprint BV 2014) and
Ecoinvent v 31 (Weidema et al 2013) For simplicity in the remainder of the report
they are named Agribalyse Agrifootprint and Ecoinvent respectively
The authors performed three types of analysis
comparison of the system boundaries and underlying assumptions
analysis of how the foreground system is modelled in each dataset focusing on
different aspects such as fertilisers application and nutrient fate plant
protection products application and fate heavy metals (HMs) input mass balance
and fate irrigation agricultural operations land occupation and transformation
comparison of the results of the life cycle impact assessment for the foreground
system including the relative contribution of background
411 Analysis of the system boundaries
The system boundaries and the main underlying assumptions adopted to model arable
crops production in the three databases are reported in Table 10
Table 10 Underlying assumptions in relation to the three databases considered by the authors (Corrado et al 2017)
Agribalyse Agrifootprint Ecoinvent
Data source Provided by technical institutes (eg ARVALIS ndash Institut du Veacutegeacutetal)
Different sources (eg
scientific literature official
statistics such as FAOstat
Eurostat)
GL-Pro project ndash Barrois
region (Nemecek and
Baumgartner 2006)
Straw management (when
applicable)
Partly removed from the
field
Totally removed from the
field
Left on the field
Allocation of co-products
(grains and straw)
Not applied because the
straw market was not very
structured at the time when
the datasets were developed
Economic mass and energy
allocation
Not applicable because
straw is assumed to be left
on the field
Nutrients from straw left
on the field
The fertilising effect of crop
residues and emissions from
the residues are allocated to
the crop that generated the
residues
Not applicable The fertilising effects of crop
residues are allocated to the
crop that generated it (only
for P and K) The amount of
fertilisers is corrected for the
amount of nutrients in crop
residues
Crop
rotation
modelling
Phosphorou
s (P) and
potassium
(K) inputs
and
emissions
allocation
P and K fertilisers production
and emissions due to their
application are allocated to
each crop pro rata for the
crop exports
Not reported The amount of P and K of the
residues supplied to the field
through residues were
allocated to the crop that
generates them
18
N inputs and
emissions
allocation
The organic nitrogen
available for the crop to
which the fertiliser is
applied is allocated to that
crop The remaining fraction
that contributes to
increasing the stock of
organic matter was allocated
to all the crops in the
rotation Mineral nitrogen is
completely allocated to the
crop to which it was applied
Not reported Allocation not performed
412 Foreground system analysis
The authors compared the activities modelled in the foreground system of the datasets
referring to seven field activities agricultural operations fertilisers application and
nutrients environmental fate plant protection products (PPP) application and related
environmental fate heavy metals (HMs) input and related environmental fate irrigation
and land occupation and transformation The average crop yields reported in the dataset
presents small differences (wheat min-max barley min-max rapeseed min-max pea
min-max) The 95 confidence interval of the yields is defined only in Agrifootprint
datasets whereas it is not reported in Agribalyse and Ecoinvent datasets
For completeness findings and aspects to be taken into account are below reported The
below checklist can also be used to build a completeness check of the different datasets
and it can be used to build a sensitivity analysis based on the parameters that are seen
to be affecting the final results
Agricultural practices modelling
Management of agricultural residues
Composition of the crop rotation
Allocation to the co-products
Agricultural operations modelling
Number of operations
Number of passages
Machine power
Soil texture
Airborne emissions due to fuel combustion
Emissions of heavy metals due to tires abrasion
Fertilisers application and nutrients fate modelling
The nutrients fate is highly influenced by site-specific conditions
o environmental conditions
o soil type
o agricultural management practices
o type of fertiliser (Brentrup et al 2000)
o spatial differentiated emissions when modelling agricultural systems
Nomenclature (eg the paper shows that phosphorus compounds emissions were
expressed in the datasets with different flows limiting the possibility of making a
comparison among inventory data)
PPP application and environmental fate modelling
19
application method
weather and soil conditions
crop characteristics
irrigation
active substances whose use is not anymore authorised
Heavy metals inputs and environmental fate modelling
Mass balance
Fate
Irrigation modelling
Irrigation volumes
Water flows type
Environmental conditions
Spatially-differentiated water flows
Land use transformation modelling
Amounts of transformed land are considered
Type of land transformed (eg from hellip to hellip)
CO2 emissions due to land transformation
42 Data quality
As data is essential in all quantitative studies like LCAs so is also their quality
Therefore the data applied in the life cycle inventory phase shall be assessed in the
interpretation phase against the goal and scope of the study is the data quality
sufficient for the goal of the study Is the data consistent Can the data be seen as
complete
If the answer is yes then the interpretation can be preceded and conclusions drawn If
no then either the goal and scope need to be adjusted or probably in most cases
better the life cycle inventory phase need to be revisited in an iterative manner to
improve the data quality to the appropriate level The assessment of the data quality is a
mandatory reporting element in the interpretation phase
ISO 14044 (2006) defines data quality as characteristics of data that relate to their
ability to satisfy stated requirements The data quality requirements are described in
the goal and scope of the LCA study and covers the following 10 aspects (ISO14044
2006 ch 4236)
1) time-related coverage age of data and the minimum length of time over which
data should be collected
2) geographical coverage geographical area from which data for unit processes
should be collected to satisfy the goal of the study
3) technology coverage specific technology or technology mix
4) precision measure of the variability of the data values for each data expressed
(eg variance)
5) completeness percentage of flow that is measured or estimated
6) representativeness qualitative assessment of the degree to which the data set
reflects the true population of interest (ie geographical coverage time period
and technology coverage)
7) consistency qualitative assessment of whether the study methodology is applied
uniformly to the various components of the analysis
20
8) reproducibility qualitative assessment of the extent to which information about
the methodology and data values would allow an independent practitioner to
reproduce the results reported in the study
9) sources of the data
10) uncertainty of the information (eg data models and assumptions)
In the EF methods7 the consistency and reproducibility is one of the main aims of any
EF study and not evaluated as part of the data quality assessment Data sources should
be ILCDEF compliant and specified if a PEFCROEFSR is followed Precision and
uncertainty are evaluated together in the EF method Therefore the EF operates with six
semi qualitative data quality requirements instead of 9 in ISO14044 (cf section 56 in
European Commission 2013)
In order to evaluate the appropriateness and the quality of the data used to compile the
LCI they have to be scored against certain requirements As an example the table below
(Table 11) provides the data quality requirements for a PEF study of intermediate paper
products (EC 2013a Schau and Davidsson 2015)
The table 12 shows the semi-qualitative data quality rating (DQR) (based on expert
judgement) of the most impacting processes in an early phase of a PEF study of
intermediate packaging paper The data set DE Potato starch at plant was deemed to
be of too low quality (DQR = 267) as it scored poor (4) on Parameter uncertainty and
Methodological Appropriateness and Consistency to be used for comparative assertion
Therefore another dataset was searched for that was compliant with the goal and scope
of the study
It is also recommended that the practitioner is aware of the methodological choices used
to build the datasets (may be evaluated under Methodological Appropriateness and
Consistency) such as the definition of the system boundaries between nature and
technosphere and the time-horizons of the emissions (short-termlong term)
System boundaries between nature and technosphere are especially relevant for food
and agricultural product (and products made thereof) as for these products the
technosphere is closely interlinked with nature (Schau et al 2008) This includes
modelling of pesticides and fertilizers (De Schryver and Galatola 2016)
The time-horizons of the emissions are essential especially for long lived product and for
end-of-life processes (eg landfilling waste handling of residues from mining in raw
material extraction) (Guo and Murphy 2012) Also how radioactive waste is modelled is
essential to assess with a time horizon in mind Often a distinction is made between
long term and short term emission Where the boundary is set between those (100
years 300 years 50 000 years etc) can therefore be important and should be taken
into account when assessing the data quality for methodological appropriateness and
consistency (see chapter 433)
Database providers publish their modelling principle (see eg Baitz et al 2016) which is
an essential source for evaluating and assessing the data quality (of background data) in
addition to the metadata of the LCI data itself
Table 11 Data quality rating in an example of intermediate paper products (EC 2013 Schau and Davidsson 2015)
7 In the EF Guide the term representativenessrdquo is used instead of coveragerdquo used in ISO 14044 for the
geographical and time-related data quality requirement The term ldquoparameter uncertaintyrdquo is used instead of ldquoprecisionrdquo used in ISO14044 and the term ldquomethodological appropriateness and consistencyrdquo is used in the EF Guide instead of ldquoconsistencyrdquo used in ISO14044
21
Data quality elements
Representativeness
Qu
alit
y level
Qu
alit
y r
atin
g
Defin
itio
n
Tech
no
log
ica
l
Ge
og
rap
hic
al
Tim
e-r
ela
ted
Com
ple
ten
ess
Meth
od
olo
gic
al
Ap
pro
priate
ness a
nd
Co
nsis
tency
Pa
ram
ete
r u
nce
rta
inty
Very good
1
Meets the criterion to a very high degree without need for improvement
Eg Process is same For electricity from grid average technology as country- specific consumption mix
Country specific data
le 3 years old data
Very good completeness (ge 90 )
Full compliance with all requirements of the PEF guide
Very low uncertainty (le 7 )
Good
2
Meets the criterion to a high degree with little significant need for improvement
Eg average technology as country- specific consumption mix
Central Europe North Europe representative EU 27 mix
3-5 years old data
Good completeness (80 to 90 )
Attributional Process based approach AND following three method requirements of the PEF guide met (1) Dealing with multi-functionality (2) End of life modelling (3) System boundary
Low uncertainty (7 to 10 )
Fair 3
Meets the criterion to an acceptable degree but merits improvement
Eg average technology as country- specific production mix or average technology as average EU consumption mix
EU-27 countries other European country
5-10 years old data
Fair completeness (70 to 80 )
Attribution Process based approach AND two of the following three method requirements of the PEF guide met (1) Dealing with multi-functionality (2) End of life modelling (3) System boundary
Fair uncertainty (10 to 15 )
Poor
4
Does not meet the criterion to a sufficient degree but rather requires improvement
Eg average technology as country- specific consumption mix of a group of similar products
Middle east North-America Japan etc
10-15 years old data
Poor completeness (50 to 70 )
Attributional Process based approach AND one of the following three method requirements of the PEF guide met (1) Dealing with multi-functionality (2) End of life modelling (3) System boundary
High uncertainty (15 to 25 )
Very poor
5
Does not meet the criterion Substantial improvement is necessary
Eg other process or unknown not available (na)
Global data or unknown
ge 15 years old data
Very poor or unknown completeness (lt 50 )
Attributional Process based approach BUT None of the following three method requirements of the PEF guide met (1) Dealing with multi-functionality (2) End of life modelling (3) System boundary
Very high uncertainty (gt25 )
Table 12 Data quality rating in an early phase of a PEF study of intermediate packaging paper
22
Representativeness
Data set
Tech
no
logi
cal
Ge
ogr
aph
ical
Tim
e-r
ela
ted
Co
mp
lete
ne
ss
Par
ame
ter
un
cert
ain
ty
Me
tho
do
logi
cal
Ap
pro
pri
ate
ne
ss a
nd
Co
nsi
ste
ncy
Resulting Data Quality Rating (DQR)
CH building hall steel construction 1 3 3 1 3 4 250
CH disposal sludge from pulp and paper production 25 water to sanitary landfill 1 3 3 1 3 4 250
CH disposal steel 0 water to municipal incineration 1 3 3 1 3 4 250
DE lignite briquettes at plant 1 3 3 1 3 4 250
DE maize starch at plant 1 3 3 1 3 4 250
DE potato starch at plant 1 3 3 1 4 4 267
RER AKD sizer in paper production at plant 1 2 3 1 3 4 233
RER aluminium sulphate powder at plant 1 2 3 1 3 4 233
RER building multi-storey 1 2 3 1 3 4 233
RER electricity medium voltage production RER at grid 1 2 2 1 3 3 200
RER facilities chemical production 1 2 3 1 3 4 233
RER heavy fuel oil at regional storage 1 2 3 1 3 4 233
RER heavy fuel oil burned in industrial furnace 1MW non-modulating ltu-sogt 1 2 3 4 3 4 283
RER industrial wood hardwood under bark u=80 at forest road 1 2 3 1 3 4 233
RER industrial wood softwood under bark u=140 at forest road 1 2 3 1 3 4 233
RER natural gas high pressure at consumer 1 2 3 1 3 4 233
RER paper mill integrated ltu-sogt 1 2 3 1 3 4 233
RER PEFEmissions-RF ltu-sogt 1 2 3 3 3 3 250
RER PEFEmissions-VF v03 ltu-sogt 1 2 2 2 4 3 233
RER sodium chlorate powder at plant 1 2 3 1 3 4 233
RER sodium dithionite anhydrous at plant 1 2 3 1 3 4 233
RER sodium hydroxide 50 in H2O production mix at plant 1 2 3 1 3 4 233
RER steel converter chromium steel 188 at plant 1 2 3 1 3 4 233
RER steel electric chromium steel 188 at plant 1 2 3 1 3 4 233
RER sulphate pulp ECF bleached at plant 1 2 3 1 3 4 233
RER sulphate pulp unbleached at plant 1 2 3 1 3 4 233
RER sulphuric acid liquid at plant 1 2 3 1 3 4 233
RER transport freight rail 1 2 3 1 3 4 233
RER transport lorry gt16t fleet average 1 2 3 1 3 4 233
RER Water Withdrawals-VF ltu-sogt 1 1 2 1 3 3 183
23
43 Further completeness and consistency checks
In this section some further checks are presented referring both to completeness and
consistency checks
431 Anomaly assessment An anomaly assessment can be done where based on previous experience unusual or
surprising deviations from expected or normal results are observed and examined for
relevance (Skone 2000)
As a practical example it can be considered the case of LCA studies of mining activities
When the production of eg copper concentrates was assessed adopting an impact
assessment method such as ILCD and performing the hotspot analysis as described in
chapter 3 of this report it was found that the identification of most relevant impact
categories did not include Resource Depletion fossil mineral In addition the most
relevant processes and life cycle stages contributing to this impact category were not
related to the ones involved in the copper extraction In the case under analysis it was
found that elementary flows related to extraction of resources from nature were missing
from the inventory because the dataset used in the analysis did not include in its goal
and scope the assessment of Resource Depletion fossil mineral
A learning was that it is true that it is important to evaluate what is most relevant (eg
impact categories life cycle stages processes elementary flows) however it is also
important to check if what is found as being non-relevant can be actually considered as
such Hence it is important to evaluate if the LCI modelled is complete with regard to
the impact categories that the assessor wants to evaluate
432 Cut-off ISO 14044 identifies cut-off as the ldquospecification of the amount of material or energy
flow or the level of environmental significance associated with unit processes or product
system to be excluded from a studyrdquo ISO 14044 also requires that the effect on the
outcome of the study of the cut-off criteria selected shall be assessed and described in
the final report
Cut-off criteria can be based on
Mass eg lt5 cumulative mass input
Energy eg lt5 cumulative energy input
Environmental significance eg lt5 of the results of the selected impact categories It is important to note that the cut-off criteria need to be selected based on the goal and
scope of the study Therefore if the study is intended to be used for comparisons and
comparative assertions a sensitivity check using all the above three criteria is a
mandatory requirement
433 Long term emissions Long term emissions are those emissions considered to happen beyond 100 years up to
thousands of years (eg 60000)
Not all databases include long-term emissions within the system boundaries In some
cases it can be observed that LCA results after characterization normalization and
weighting are by far dominated by toxicity-related impact categories When this is the
case it is recommended to check if the datasets used include long term emissions
which in terms of absolute amounts are well superior compared to emissions occurring
within 100 years It has also to be noted that the models to estimate long term
emissions are affected by a high uncertainty which has to be taken into account in the
LCA study to avoid biased conclusions and wrong recommendations
When dealing with long term emissions it is important however not to overlook their
potential impact therefore it is recommended to
Assess a baseline scenario excluding long-term emissions
Perform a sensitivity analysis including long-term emissions in the LCI
Include an analysis of the uncertainty associated to the inclusion of long-term
emissions
24
25
5 Interpretation on Life Cycle Impact Assessment (LCIA)
level
Life Cycle Impact Assessment is the phase in an LCA where the inputs and outputs of
elementary flows that have been collected and reported in the inventory are translated
into impact indicator results LCIA has two mandatory steps which are the classification
and the characterization of LCI results and two optional steps normalisation and
weighting
Many elements can be subject to interpretation in the LCIA phase In this report the
focus will be on
the relevance of applying different characterization models
the relevance of applying different normalisation sets
the relevance of applying different weighting sets
the identification of the most sensitive elements in determining the final results
conclusions and recommendations
the coverage of characterization factors compared to the inventoried elementary
flows
Those points will be illustrated in the following section through illustrative case studies
First a case study dealing with sensitivity analysis of using different characterization
models for toxicity-related and resource-related impact categories will be discussed
Second a case study dealing with using different impact assessment methods This case
study will also be used to go through sensitivity analysis in relation to normalisation sets
and weighting sets
Third a case study mapping the coverage of characterization factors of toxicity-related
categories compared to the inventoried elementary flows will be shown
51 Characterization sensitivity analysis
The use of different characterization models to assess a certain impact category may
play a relevant role in the calculation of the final results and the identification of
hotspots most relevant life cycle stages processes and elementary flows
511 Case study 1 ndash WEEE management Toxicity-related and Resource-related impact categories affecting interpretation of results
The first case study is based on a work by Rigamonti et al (2017) the authors selected
a case study in which LCA has been applied to assess a waste electrical and electronic
equipment (WEEE) management system (Biganzoli et al 2015) In that study the
assessment was carried out to quantify the mass balance of the WEEE management
system in Lombardy Region in the year 2011 and to calculate its environmental benefits
and burdens
Firstly they tested characterization models and characterization factors (CFs) for
toxicity-related impact categories human toxicity cancer and non-cancer and eco-
toxicity There is an evolving debate on the robustness of these impact categories and
specifically for what concern impacts due to metals (see eg Pizzol et al 2011) In fact
some specific features of the metals (eg essentiality) as well as elements affecting
their fate modelling (eg different conditions affecting their bioavailability) are not fully
captured by currently available models applied in LCA Therefore the authors ran a
sensitivity analysis where updated CFs for metals were tested along the lines of recent
literature (Dong et al 2014) aiming at identifying the different results associated to
metals impact compared to the ILCD method (EC-JRC 2011) based on the USEtox
model (Rosenbaum et al 2008)
26
The total impact obtained by applying Dong et al 2014 CFs resulted about three times
higher than the corresponding obtained by the USEtox model This is mainly due to the
Dong et al 2014 CFs of Copper (Cu) and Zinc (Zn) which are higher than those adopted
in the USEtox model when considering the freshwater archetype proposed in the paper
of Dong as default when the location of the emission is not known
Secondly they tested impact assessment models for resource Models currently available
differ both in the modeling approach in the perspective adopted for assessing the
resources (Dewulf et al 2015) and as consequence in the characterization metric and
factors adopted (Mancini et al 2016) Beyond the potential benefit associated to a mass
based approach to recycling (eg kg of material recycled) there is indeed the need of
understanding to which extent the recycled materials are contributing to the resource
depletion impact categories The authors tested abiotic depletion potential (ADP) (CML
2012) which is focusing on potential depletion based on the ratio between resource
consumption and availability (either considering ultimate reserves in earth crust known
base reserves or economically viable reserves) ILCD model (EC-JRC 2011) which is an
extended version of CML2012 reserve based (based on CML algorithm few other
resources have been added described in Sala et al 2012) EDIP97 (Hauschild and
Wenzel 1998) which is comparing the resource with the deposits economically
exploitable without accounting for current level of consumption EPS2000 (Steen
1999) which assesses the cost (as societyrsquos willingness to pay) of substituting a
substance by an alternative for future generations affected by current level of depletion
Recipe 2008 (Goedkoop et al 2009) which is looking at marginal increase of extraction
cost per kg of extracted resource differentiating it by deposit and assuming a discount
rate over an indefinite timespan the Anthropogenic Abiotic Depletion Potential (AADP
Schneider et al 2011) which is accounting for the potential of resource recycling
assuming urban mining as an additional source of resources The recent update of the
AADP (Schneider et al 2015) was also considered It introduces the concepts of
ultimately extractable reserves represented by the amount available in the upper
earths crust that is ultimately recoverable A new set of CFs were also tested developed
by Mancini et al (2016) aiming at addressing the benefit associated to the recovery of
Critical Raw Materials (CRMs) The characterization model is based on the use and
adaptation to LCA of the supply risk indicators developed by the European Commission
(EC 2014) Three sets of CFs are tested based on different assumptions (1) baseline
option the supply risk factors as such ndash (SR) (2) an exponential function which
magnifies the differences between the CRMs - (SR)^6 (3) the ratio between supply risk
and production data (SRworld mine production in 2011) which reflects the size of the
market giving more importance to the materials used in small amounts in products and
applications like eg specialty metals that are often perceived as critical
The comparison among the different models was first of all made considering the mineral
resources present in the inventory of the case study covered by each of them The ILCD
method is the most comprehensive one with 31 mineral resources included in its model
for the resource depletion category On the contrary the Supply Risk (3) is the one that
covers the minor number of substances (ie 7)
A contribution analysis was also performed (Figure 3) Silver (Ag) gives the main
percentage contribution to the indicator in five models (ie CML 2012 versions b and c
ILCD Supply Risk 3) and EDIP97) Cobalt (Co) is the main contributor in the Supply
Risk (2) Copper (Cu) in the ReCiPe 2008 Palladium (Pd) in the EPS 2000 and AADP
(2015) and Nickel (Ni) in the AADP (2011) In the CML 2012 (a) Tellurium Gold (Au)
and Silver (Ag) are the most important substances whereas Aluminium (Al) Copper
(Cu) and Nickel (Ni) are the main contributors in the case of the Supply Risk (3)
27
Figure 3 Contribution analysis for the resource- related indicator calculated adopting several characterization models (Rigamonti et al 2017)
512 Case study 2 ndash Basket of Products Food sensitivity analysis
comparing different impact assessment methods
This case study is based on the application of different life cycle impact assessment
methods for the evaluation of the environmental impacts associated to food consumption
in Europe A process-based LCA has been performed for a basket of products that
represent the most relevant food product groups selected by importance in mass and
economic value to depict the average consumption for nutrition of EU citizens in 2010
(Notarnicola et al 2017b) The product groups in the basket were pig meat beef
poultry milk cheese butter bread sugar sunflower oil olive oil potatoes oranges
apples mineral water roasted coffee beer pre-prepared dishes For each product group
in the basket an inventory model based on a representative product has been
developed The impact of each representative product was then multiplied by the mass
of products in that product group that is consumed in one year by an average EU citizen
The environmental impact of the average food consumption of a European citizen has
been characterized using ILCD method for the life cycle impact assessment (EC-JRC
2011) The paper by Notarnicola et al (2017) illustrates the details of the process-based
LCA study on the BoP nutrition for EU 27 citizens and presents the results of the
characterisation phase The variability of the results associated to methodological
choices has been already preliminary explored (Castellani et al 2017) The present
report builds on those results and elaborates the interpretation phase (including also
normalisation and weighting) The questions that these analyses help answering are i)
are the products found to have the highest impact sensitive to changes in LCIA elements
(characterisation factors normalization references or the weighting sets) and ii) which
are the most contributing impact categories
This case study will also be used in paragraph 52 53 and 54 as a basis for further
insights on the interpretation of an LCA study
For this specific case the authors performed a sensitivity analysis on the LCIA
characterisation phase using ILCD compared with other two methods the CML-IA v 42
(Guineacutee et al 2002) and the Ecological footprint (EcF) (Wackernagel et al 2005) CML-
IA was chosen because it is widely used in LCA studies and because it adopts a different
28
modelling approach compared to ILCD in several impact categories that could be
relevant for food chains For instance for toxicity-related impact categories CML-IA is
based on USES-LCA model (Van Zelm et al 2009) whereas ILCD is applying USETOX
model (Rosenbaum et al 2008) for eutrophication CML-IA is using RAIN-LCA
(Huijbregts 1999) whereas ILCD is using different models for terrestrial and aquatic
eutrophication (respectively accumulated exceedance by Seppaumllauml et al 2006 and
EUtrend model as applied by Struijis et al 2009) The EF was chosen because it
assesses impacts in terms of direct and indirect land use and has been considered a
method that may complement LCA (Lee et al 2014) although based on an accounting
framework that has been questioned (Giampietro and Saltelli 2014) The version of EcF
method implemented in the study is the one already adapted to LCA and provided
within the SimaPro 805 software package (Pregrave Consultants 2015)
The three methods are mostly convergent in the identification of the product groups to
be considered hotspots within the BoP nutrition ie within the food consumption of the
European citizens ILCD and CML-IA identify a wider range of hotspots compared to EcF
mainly because they cover a wider range of impact categories (eg bread and potatoes
do not emerge as hotspot for EcF because their main impacts are in impact categories
not covered by the EcF method)
The product groups that emerge as hotspots in all the methods even if with slightly
different level of contribution are meat and dairy products and beer (as representative
product for alcoholic drinks)
The impact categories for which beer emerge as hotspot are slightly different among the
three methods ozone depletion ionizing radiation and resource depletion in ILCD and
CML-IA photochemical ozone formation in ILCD human toxicity and marine aquatic
ecotoxicity in CML-IA and nuclear energy in EcF The most contributing processes for all
the impact categories listed before is energy (electricity and heat) as already discussed
for ILCD In the case of CML-IA method toxicity-related impacts are mainly due to direct
emissions to air coming from the production process of the packaging glass
513 Conclusions and recommendations
These results reveal that the relative importance of one substance compared to another
changes with the model This is because the models differ in the substances that they
include and in the CFs of each substance It is recommended to run a sensitivity check
with different characterization models to evaluate the robustness of the conclusions
drawn It is also recommended to evaluate the theory underlying the characterization
models chosen to evaluate a certain impact category as this helps understanding the
results obtained
52 Characterization mapped flows and unmapped flows
This section shows two different levels of checks the first one focuses on a comparison
between two different life cycle impact assessment methods (ie ILCD vs CML-IA) based
on Castellani et al (2017) the second one focuses on what are the implications of
uncharacterized flows for a specific impact category (freshwater ecotoxicity) based on
the case study presented in Notarnicola et al (2017b)
521 Comparison between two different methods
A check of the inventoried elementary flows that are not characterized at the LCIA phase
should always be done to support interpretation of results Indeed the comprehensive
translation of the inventory into potential environmental impacts may not occur if some
of the elementary flows are not covered by the chosen characterization models Table 13
reports an example of the total amount of elementary flows that are available in an
inventory but they are not mapped and characterized by the methods considered (ILCD
and CML-IA) as reported in Castellani et al (2017) The authors checked the list of
uncharacterized flows for the inventory of the case study under evaluation and
29
highlighted the most relevant ones either in term of mass or of known environmental
concern The information obtained was then used in support to interpretation For
instance in case the two methods used for characterisation and normalisation give very
different results for one impact category the information about uncharacterized flows
can help to check if this difference is due to a different characterisation of impacts (ie
to a different way of considering the environmental relevance of some elementary flows)
or if it is affected by the fact that some flows (eg some emissions) are not taken into
account by one of the methods
This may occur also due to improper nomenclature of the elementary flows which may
cause a mismatch between the elementary flows listed in the inventory and the
elementary flows to which a characterization factor is available for example the
inventory may report CaCO3 while the characterization model may provide a CF for
calcite This mismatch would prevent the characterization of CaCO3
Table 13 Example of check of inventoried elementary flows that are not characterized by two impact assessment methods (based on Castellani et al 2017)
Flows Total elementary flows not characterized
Typologies of flows
Details on the elementary flows not characterized
ILCD CML-IA
ILCD CML-IA
Nr flows Amount Unit Nr flows
Amount Unit
raw materials
97 510 metals and minerals
47 795 kg 47 863 kg
water flows 25 126 m3 300 3825 m
3
Energy 0 0 MJ 12 18964 MJ
land use 11 001 m2 (or
m2a)
117 12898 m2 (or
m2a)
others 14 na mixed 34 na mixed
emissions to soil
83 227 pesticides to soil
45 0003 kg 173 008 kg
others 38 08 kg 54 41 kg
emissions to water
167 310 radioactive substances
42 119E+03 Bq 61 385E+06 Bq
metals and inorganics compounds
34 28 kg 36 28 kg
others 91 na mixed 213 na mixed
emissions to air
179 286 radioactive substances
49 899E+04 Bq 73 973E+07 Bq
metal and inorganics compounds
65 007 kg 56 0044 kg
pesticides 7 580E-08 kg 32 93 kg
others 70 na mixed 125 na mixed
waste flows 17 17 waste 17 3784 kg 17 3784 kg
Overall number of elementary flows not characterized
543 1350
In order to assess which elementary flows available in the inventory were not accounted
during the characterization the authors performed an analysis of the elementary flows
not characterized when using ILCD and CML-IA methods In total the model of the
basket includes 1730 elementary flows The ILCD method is not able to cover 543 of
these elementary flow as emission into air water soil or resource used whereas when
CML-IA is used to characterize the inventory 1350 elementary flows out of 1730 are not
30
characterized In Table 1 the list of main typologies of flows is reported Many pesticides
organic chemicals and inorganics are not characterized by the two methods Several
ionizing substances are not characterized as well as elementary flows related to group of
substances (such as AOX PAH BTEX VOC BOD and COD) Missing the CFs means that
it is not possible to estimate the extent to which eg the toxicity-related and ionizing
radiation-related impact categories are underestimated
Apart from the total number of flows covered the main difference between the two LCIA
methods is the ability to assign a characterization factor (CF) to the pesticides included
in the inventory ILCD has no CFs for 45 pesticidesrsquo emission to soil (plus 4 pesticidesrsquo
emissions to air) whereas CML-IA for 173 (plus 32 pesticidesrsquo emissions to air) This
may be the reason why human toxicity impacts appear as relevant in the results of ILCD
characterization (and related normalization and weighting as discussed below) and they
appear as less relevant in the results of CML-IA characterization and related
normalization and weighting
522 Analysis of uncharacterized flows within an impact category Based on the study of Castellani et al (2017) fourteen impact categories (IC)
recommended in PEF are calculated The number of elementary flows (ElFls) by ICs
varies from few flows (eutrophication acidification etc) to thousands (eco and human
toxicity) (see table 14)
For most of the ICs the contributing elementary flows reported in an inventory are well
identified and their inclusion in the calculation of the final score is expected to be done
correctly For climate change at mid-point 104 elementary flows with their associated
CFs are derived from the IPCC 2007 report for a 100-year period
However for impact categories like toxicity the number of elementary flows contributing
to the impact can be very important making possible the omission of some EFs at the
inventory level Additionally a high number of flows reported in the inventory have no
CFs If the number of un-characterized flows is too high this can lead to a non-robust
interpretation of the LCIA results
Table 12 shows the number of elementary flows with associated a CF (ie the single
chemical) and the amount of elementary flows with a CF per different compartment (eg
the single chemical in each compartment and sub-compartment)
Table 14 List of impact categories listed in ILCD with total number of elementary flows contributing to each IC
Impact Category ElFl with CFs (all emission compartments)
Unique ElFls with CFs (single chemical flows)
Climate change 104 102
Ozone Depletion 23 23
Human toxicity non cancer 3434 442 (USEtox 419 org+18 metals)
Human toxicity cancer 4734 607 (USEtox 596 org +8 metals)
Particulate matter 46 24
Ionizing radiation Human Health 50 29
Photochemical ozone formation 133 133
Acidification 7 7
Terrestrial eutrophication 7 7
Freshwater eutrophication 10 5
Freshwater ecotoxicity 15636 2526 (USEtox 2498 org +21 metals)
Land use 206 206
Water source depletion 1180 1180
Mineral fossil use amp Resource depletion
181 181
Marine eutrophication 14 11
Additional IC not used in PEF
Ionizing radiation Ecosystem (interim) 62 15
31
The potential impact of un-mapped (or uncharacterized) flows is illustrated via a case
study focusing the freshwater aquatic toxicity impact category using a recent modelling
of 17 food products (Notarnicola 2017b)
For a high proportion of the total mass of un-characterized ElFls the impact on the final
IC scores is null As a matter of fact 9998 of the 1887 kg ElFls emitted to the air are
made of air oxygen and hydrogen Only 033 kg (but still 199 flows) are actual made of
other type of chemicals 80 of those 033 kg are nitrogen type of chemicals 74
hydrogen chloride 12 sulphate etc (table 15) However regarding the ElFls to soil
and water the mass and number of un-characterized flow could have a significant
impact on the final score
Table 15 Type of chemicals (mass and number of EFs) not characterized per emission compartment (air oxygen and hydrogen have been excluded)
Compartments Group of chemicals Mass (g) Number of ElFl
Air
Total air 330 122
N-related 238662 2
inorganicsalt 74637 44
organic 5693 36
S - related 3896 1
metalmineral 3793 17
Alkenes 1530 2
Benzene Toluene Ethylbenzene and Xylene) unspecified ratio 0488 1
ozone 0314 1
P-related 0304 4
ionising 0261 4
Aldehydes 0213 1
Terpenes 0102 1
PAH 0034 1
Pesticide 0000 6
Acid 0000 1
Soil
Total soil 800 68
metalmineral 328315 15
inorganic 320234 4
oils 93496 3
organic 48702 2
Pesticide 5873 39
S - related 3777 2
N-related 0000 2
PAH 0000 1
Water
Total water 13871 112
inorganicsalt 7549785 22
TOC water 2840410 4
metalmineral 1998366 13
Suspended solid 1257655 6
inorganic 108851 6
organic 107546 37
AOX 2390 1
Acid 2032 2
S - related 2008 5
VOC 0643 1
32
N-related 0511 3
Propylene 0244 1
oils 0079 2
PAH 0055 2
Sodium Hydroxide 0054 1
Salt unspecified 0015 1
Hypochlorite 0013 1
ionising 0002 2
VOC 0001 1
P- related 0000 1
Looking at the results of the freshwater aquatic toxicity impact categories for all 17 food
products 90 of the impact category is driven by 10 out of 734 elementary flows that
represents only 14 of the mass of chemicals entering the aquatic environment (table
16) Furthermore it can be seen that
57 of the toxicity score are due to 3 metals representing 01 kg of the mass
However there are still more than 2 kg of un-characterized metalsminerals in
the inventory list (see table 15)
33 of the impact are due 10 pesticides (35 g) although there are still 39 un-
characterized pesticides in the inventory list (representing 5 g) (see table 15)
Table 16 Most relevant elementary flows contributing cumulatively up to 90 to the freshwater ecotoxicity impact category with USEtox
Substance Chemical
class Emission
Compartment Sub-compartment
Total impact (CTUe)
impact versus Total
Cumulated
impact Mass (kg)
Zinc metal Soil agricultural 931 21 21 00441
Copper metal Soil agricultural 902 21 42 00429
Chlorpyrifos pesticide Soil agricultural 833 19 61 00079
Copper metal Soil
351 8 69 00120
Zinc metal Water
139 3 72 00036
Folpet pesticide Soil agricultural 134 3 75 00004
Chlorothalonil pesticide Soil agricultural 111 3 78 00019
Chromium metal Water
105 2 80 00020
Cyfluthrin pesticide Soil agricultural 85 2 82 00001
Isoproturon pesticide Soil agricultural 81 2 84 00086
Cypermethrin pesticide Soil agricultural 70 2 85 00010
Chromium metal Soil agricultural 51 1 87 00019
Prochloraz pesticide Soil agricultural 45 1 88 00024
Captan pesticide Soil agricultural 39 1 88 00039
Alachlor pesticide Soil agricultural 38 1 89 00041
Metolachlor pesticide Soil agricultural 30 1 90 00050
Among the non-characterized elementary flows in relation to freshwater ecotoxicity it
can be observed
it is not known to which extent some of the chemicals may contribute to the IC
a number unspecified chemicals such as lsquoTotal organic matterrsquo (TOC BOD
CODhellip) PAH VOC that could contribute significantly to the overall score Since
the quantity of those ElFl can change significantly between products a default CF
could be proposed for those flow
some chemicals are known to be contributing to toxicity like pesticides and
metals still there are significant proportions that are not characterized
33
Although it is not possible to conclude if those un-characterized flows would have
changed the total score significantly based on the mass and number of known-
contributing class of chemicals (metals and pesticides) it is highly recommended that a
quantification of the uncharacterized chemicals is reported for the freshwater toxicity
impact category before drawing final conclusions
523 Conclusions and recommendations
Results of the LCIA phase can be highly affected by the characterization model chosen
as shown in chapter 51 Furthermore the evaluation of uncharacterized elementary
flows is of primary importance to assess the completeness of the LCIA coverage of the
identified LCI flows Indeed a high number of elementary flows inventoried might be
non-characterized by the chosen models even if their relevance in the assessed impact
categories could be of primary importance Therefore it is highly recommended that a
quantification of the uncharacterized elementary flows is reported before any
interpretation or conclusion is performed on the superiority of one product versus
another
53 Normalization sensitivity analysis
As for the characterisation phase also the choice of the normalisation reference set can
highly influence results Castellani et al (2017) have done a sensitivity analysis based on
the case study of a basket of product on food (see paragraph 512 for further details)
The authors report that as an optional step normalisation and weighting could be
applied to characterized LCA results to support the identification of the most important
impact categories Given that several sets of normalisation and weighting are available
the authors tested some of them in addition to the ILCD baseline with the aim of
assessing the sensitivity of the results to the choice of particular geographical and
temporal reference systems (ie normalization using EU or global scales) as well as
perspectives (ie weighting) This was investigated by selecting 3 sets of ILCD-compliant
normalization references (Benini et al 2014 Benini et al 2015 Laurent et al 2013)
and 2 sets of CML-IA compliant normalization references (EU 25+3 year 2000 and
World year 2000 - Guineacutee et al 2002) -reported in Table 17 In this section the
findings of the authors regarding normalisation will be discussed while the findings on
weighting will be discussed in section 54
Table 17 Summary of normalization sets used in the sensitivity analysis in Castellani et al (2016)
ILCD Impact Category Unit EC-JRC EU27
(2010) per person
a
EC-JRC Global (2010 or 2013)
per personb
PROSUITE Global (2010 or
2000) per person
c
Climate change kg CO2 eq 922E+03 707E+03 810E+03
Ozone depletion kg CFC-11 eq 216E-02 122E-02 414E-02
Human toxicity cancer effects CTUh 369E-05 124E-05 542E-05
Human toxicity non-cancer effects CTUh 533E-04 155E-04 110E-03
Particulate matterRespiratory inorganics kg PM25 eq 380E+00 507E+00 276E+00
Ionizing radiation human health kBq U
235 eq (to
air) 113E+03 241E+02 133E+03
Photochemical ozone formation human health kg NMVOC eq 317E+01 453E+01 567E+01
Acidification mol H+ eq 473E+01 561E+01 496E+01
Eutrophication terrestrial mol N eq 176E+02 164E+02 115E+02
Eutrophication freshwater kg P eq 148E+00 654E+00 620E-01
Eutrophication marine kg N eq 169E+01 304E+01 938E+00
Land use kg C deficit 748E+04 520E+06 236E+05
Ecotoxicity freshwater CTUe 874E+03 374E+03 665E+02
Resource depletion water m3 water eq 814E+01 689E+01 297E+01
Resource depletion mineral fossils and renewables kg Sb eq 101E-01 193E-01 313E-01
34
An additional analysis was performed to verify which one between normalization and
weighting is the most sensitive step in the identification of the most relevant impact
categories The same weighting sets described before were applied on the results of
normalization obtained using the two ILCD-compliant global normalization reference sets
tested before namely EC-JRC Global (Benini et al 2015) and PROSUITE Global (Laurent
et al 2013)
The contribution of product groups (Table 18) and of impact categories (Table 19) to the
total normalized impact of the BoP nutrition per citizen were analyzed
Table 18 presents a summary of the sensitivity analysis on product group contribution at
the normalization stage comparing the product group hotspots according to ILCD and
CML-IA methods Values are expressed as percentage of the normalized value per citizen
for that product group with respect to the total normalized impact per citizen (total
impact of nutrition in one year for an average EU-27 citizen) Equal weighting among
impact categories is assumed Results at the normalization stage almost confirm the
hotspots identified at the characterization stage meat and dairy products are again
hotspots for all the methods whereas other products that emerged before are
considered less contributing at the normalization stage This means that those products
generate impacts in impact categories that are considered less relevant compared to the
others according to the normalization scheme adopted For instance beer appeared to
be a hotspot for both ILCD and CML-IA at the characterization stage whereas only CML-
IA method identifies it as a hotspot at the normalization stage This happens because the
CML-IA normalization references (EU 25+3 and World) for marine aquatic toxicity -one
of the impact categories for which beer is a hotspot - are relatively low compared to the
ones in other LCIA methods
Table 18 presents a summary of the results of the sensitivity analysis at the
normalization stage comparing the relevance of impact categories according to ILCD
and CML-IA methods Results refer to the entire BoP For each impact category of the
two methods values are expressed as percentage of the normalized value per citizen for
that impact category with respect to the total normalized impact per citizen
Table 18 Results of sensitivity analysis on normalization sets at the European and global scale for ILCD- and CML-IA methods (Castellani et al 2016) The percentages represent the contribution of each product group to the total impacts of the BoP per citizen (reference flow) Equal weighting of impact categories is applied The second column reports the mass of each product group in the basket A color scale is applied to the results in each column (ie product group) from green (lowest contribution) to red (highest contribution)
Quantity in the basket (kgyear)
Share of total BoP
mass
EC-JRC EU27 (2010)
EC-JRC Global (2010
or 2013)
PROSUITE Global (2010
or 2000)
CML EU 25+3 (2000)
CML World (2000)
Mineral water 1050 194 1 1 1 3 3
Beer 698 129 4 4 7 16 21
Coffee 47 06 2 1 5 5 6
Apple 161 30 0 0 1 1 1
Oranges 174 32 1 1 2 1 2
Potatoes 691 130 3 3 3 3 4
Bread 393 73 3 3 3 4 5
Olive oil 53 10 1 0 1 2 3
Sunflower oil 53 10 4 4 5 3 3
Sugar from beet 298 55 3 3 3 2 1
Milk 801 148 9 9 8 7 6
Cheese 150 28 15 16 13 10 9
Butter 36 07 7 8 6 3 2
Meat - beef 137 25 18 17 16 11 10
Meat - pork 410 76 20 20 19 18 13
Meat - poultry 220 42 8 8 8 10 7
Pre-prepared meal
29 05 1 1 1 2 2
35
100 100 100 100 100 100
Table 19 Results of sensitivity analysis on normalization sets at the European and global scale for ILCD and CML-IA methods (Castellani et al 2016) The percentages reflect the relative relevance of impact categories compared to the total impacts of the BoP per citizen (reference flow) A colour scale is applied to the results in each column (ie impact category) from green (lowest contribution) to red (highest contribution)
EC-JRC EU27 (2010)
EC-JRC Global (2010 or 2013)
PROSUITE Global (2010 or 2000)
CML EU 25+3 (2000)
CML World (2000)
Climate change 19 11 13
Global warming (GWP100a) 78 102
Ozone depletion 00 00 00 Ozone layer depletion 02 00
Human toxicity cancer effects
62 83 25
Human toxicity
59 120 Human toxicity non-cancer effects
446 692 127
Particulate matter 26 09 21 -
Ionizing radiation HH 05 11 03 -
Photochemical ozone formation
10 03 03 Photochemical ozone formation
46 21
Acidification 73 286 41 Acidification 272 201
Terrestrial eutrophication 83 40 75
Eutrophication
133 163
Freshwater eutrophication 34 04 48
Marine eutrophication 82 20 87
Freshwater ecotoxicity 58 61 450
Freshwater aquatic ecotoxicity 340 314
- - - -
Marine aquatic ecotoxicity
- - - - Terrestrial ecotoxicity
Land use 23 00 04 -
Water resource depletion 62 33 100 -
Mineral fossil amp ren resource depletion
18 04 04 Abiotic depletion 02 11
Abiotic depletion (fossil fuels) 68 67
100 100 100
100 100
531 Conclusions and recommendations
Different normalisation sets may produce different results in terms of identification of
most relevant impact categories life cycle stages and processes Different reference
systems refer to different situation which can all be valid depending eg on the
geographical scope of the study It is recommended to evaluate different normalisation
tests which fit the study at hand to support the conclusions drawn with the baseline
scenario or to provide additional insights
54 Weighting sensitivity analysis
Castellani et al (2016) investigated only for ILCD-compliant normalization sets in
addition to equal weighting 8 ILCD-compliant weighting sets (reported in Table 20) were
tested The different sets were selected aiming at covering several perspectives on
weighting namely distance to target for EU policies considering binding and non-
binding target at 2020 (Castellani et al 2017) a previous distance to target set (EDIP)
36
for Europe for 2005 (Stranddorf et al 2005) two sets considering planetary boundaries
(Tuomisto et al 2012 Bjoslashrn and Hauschild 20158) a set which gives relevance to
midpoint indicators based on their contribution to impact at the endpoint (Ponsioen and
Goedkoop 2015) a set resulting from the combination of different panel-based
approaches (Huppes et al 2012)
When needed available weighting sets have been adapted to ILCD impact categories
The majority of these weighting sets build on normalization factors that are specific of a
geographic scale Tuomisto et al (2012) calculated planetary boundaries at global scale
whereas and Bjoslashrn and Hauschild (2015) did it for both global and European scales
Huppes et al (2012) adopted a panel-based approach with no specific geographic
representativeness whereas all the other weighting sets used in this work have been
originally developed or adjusted for applications at the targeting the European scale
The use of EU27-consistent weighting sets in combination with global normalization
factors may lead to inconsistencies therefore the results have to be interpreted in the
light of this inconsistency In this work the normalized and weighted results are
calculated and presented anyway for all combinations so to show the effect of the
selection of weighting available for practitioners rather than focussing on the (in-
)consistency of their joint use with normalization factors The performed analysis
quantified the relative contribution by impact category to the overall impacts associated
with the BoP as well as the contribution by each of the products The effects of the
different weighting sets tested on the results of the BoP normalized to EC-JRC EU27
normalization references are presented in Table 21 and Table 22
Table 20 Summary of weighting sets used in the sensitivity analysis by Castellani et al (2016)
Distance to target Damage oriented Panel-
based
Policy targets Planetary boundaries Mid-to-
endpoint
Castellani et al 2016
WFsA
Castellani et al 2016
WFsB
EDIP 2003 (Stranddo
rf et al 2005)
Tuomisto et al 2012
Bjoslashrn amp Hauschild
- European
2015
Bjoslashrn amp Hauschi
ld ndash Global 2015
Ponsioen amp
Goedkoop 2016
Huppes et al 2012
ILCD Impact Category dimensionless ()
Climate change 71 54 2 10 25 26 44 232
Ozone depletion 64 49 87 8 1 2 0 36
Human toxicity cancer effects 69 52 2 na na na 1 65
Human toxicity non-cancer effects
62 47 2 na na na
4 41
Particulate matterRespiratory inorganics
74 56 na na na na
8 66
Ionizing radiation human health
61 46 na na na na
0 65
Photochemical ozone formation human health
78 59 2 na
34 48
0 54
Acidification 72 55 2 8 1 1 0 42
Eutrophication terrestrial 70 53 2 28 1 0 0 23
Eutrophication freshwater 62 47 1 7 9 2 0 23
Eutrophication marine 69 52 2 28 1 1 0 23
Land use 64 53 na 6 25 16 19 102
Ecotoxicity freshwater 61 51 0 na 2 0 0 109
Resource depletion water 61 296 na 5 1 4 3 51
Resource depletion mineral fossils and renewables
61 30 0 na na
na 19 69
8 Bjoslashrn and Hauschild provided to the authors of this report a modified version to be used as weighting method
in compliance with EU27 ILCD normalization factors Global weighting factors were calculated directly from global normalization factors published by Bjoslashrn and Hauschild 2015
37
The contribution of specific products to the overall impacts associated to the BoP
nutrition is very similar when using several weighting sets in combination with
normalization references EU27 (Table 21) In fact for all the weighting sets tested pork
meat and beef meat are the highest contributor to the impacts (varying between 15
and 22) According to all sets cheese is the 3rd largest contributor (14 on average)
whereas milk and poultry meat are most frequently identified as 4th and 5th largest
contributors (roughly 8 each) On average these product groups account for roughly
70 of the total impacts Apples olive oil and pre-prepared meals are those contributing
the less followed by mineral water and oranges On average their cumulative
contribution is around 5
Table 21 Product groups contribution Results of several ILCD-compliant weighting sets in combination with normalization references EU27 (Castellani et al 2016) A color scale is applied to the results in each column (ie product group) from green (lowest contribution) to red (highest contribution)
PRODUCT GROUPS CONTRIBUTION
Quantity in the basket (kgyear)
Share of total BoP mass
Equal
weighting
Castellani et al (2016) WFsA
Castellani et
al (2016) WFsB
EDIP2003
9
Tuomisto et
al (2012)
BjornampHausch
ild (2015)
ndash Europe
an
BjornampHausch
ild (2015)
ndash global
Ponsioen and
Goodkoep
(2016)
Huppes et al (2012)
Mineral water 105 1940 1 1 3 1 1 1 2 1 1
Beer 66 cL 698 1290 4 4 4 4 3 8 8 7 5
Coffee 47 060 2 2 2 1 2 6 5 3 2
Apple 161 300 0 0 1 0 0 1 1 1 1
Oranges 174 320 1 1 3 0 1 2 2 1 1
Potato 691 1300 3 3 4 3 2 3 3 4 3
Bread 393 730 3 3 3 4 3 3 3 3 3
Olive oil 53 100 1 1 1 0 1 1 1 1 1
Sunflower oil 53 100 4 4 4 4 3 4 4 4 4
Sugar from beet 298 550 3 3 4 3 4 2 3 3 3
Milk 801 1480 9 9 8 9 8 8 8 8 8
Cheese 15 280 15 15 16 15 13 12 13 14 14
Butter 36 070 7 7 6 8 6 5 5 7 7
Meat - beef 137 250 18 18 17 18 22 15 16 16 17
Meat - pork 41 760 20 20 16 21 21 19 17 18 19
Meat - poultry 22 420 8 8 7 8 9 8 8 8 8
Pre-prepared meal 29 050 1 1 1 1 1 1 1 1 1
100
100 100 100 100 100 100 100 100
100
9 (based on Stranddorf et al 2005)
38
Conversely the identification of the most relevant impact categories contributing to the
overall impact of the entire BoP nutrition presents huge discrepancies when applying
different weighting sets (Table 22) This is due to the intrinsic differences among the
weighting sets which build on different perspectives and attribute different weights to
the impact categories
Table 22 Relevance of the different impact category Results of the application of several ILCD-compliant weighting sets in combination with normalization references EU27 (Castellani et al 2016) A color scale is applied to the results in each column (ie impact category) from green (lowest contribution) to red (highest contribution)
CONTRIBUTION ANALYSIS
1-1-1
Castellani et al (2016) WFsA
Castellani et al (2016) WFsB
EDIP2003 (based on Stranddorf et al 2005)
Tuomisto et al (2012)
Bjoslashrn amp Hauschild (2015)
Bjoslashrn amp Hauschild (2015) - global
Ponsioen amp
Goedkoop (2015)
Huppes et al (2012)
Climate change 19 20 15 2 32 214 260 204 87
Ozone depletion 00 00 00 2 00 00 00 00 00
Human toxicity cancer effects
62 66 50 7 na na na 22 81
Human toxicity non-cancer effects
446
425 323 53 na na na 477 363
Particulate matterRespiratory inorganics
26 30 23 na na na na 51 34
Ionizing radiation human health
05 05 04 na na na na 00 07
Photochemical ozone formation human health
10 12 09 1 00 162 263 00 11
Acidification 73 81 61 9 101 47 42 03 61
Eutrophication terrestrial
83 89 67 10 379 31 18 00 39
Eutrophication freshwater
34 32 25 3 37 134 43 00 16
Eutrophication marine
82 87 66 11 374 55 44 00 38
Land use 23 22 19 na 23 257 188 106 46
Ecotoxicity freshwater
58 55 46 0 na 60 04 00 127
Resource depletion water
62 59 284 na 53 39 137 49 63
Resource depletion mineral fossils and renewables
18 17 09 0 na na na 86 25
TOTAL 100 100 100 100 100 100 100 100 100
The discrepancies in the results suggest that it is important to acknowledge that
different perspectives lead to different results Moreover it is relatively straightforward
to identify the product groups impacting the most as from Table 21 when keeping
constant normalization references although varying weighing sets
The authors also checked the most sensitive element between normalization and
weighting their findings indicate normalization as the most sensitive choice if compared
39
to the selection of a specific weighting set among those considered in their work
However this result may change in case weighting methods building on different
approaches are added to the ones included in their work Nevertheless the ranking of
products is not significantly affected by changing normalization reference (eg from
ILCD EU27 to ILCD Global ndash Laurent et al 2013) This might be due to few impact
categories driving the results regardless of the normalization and weighting methods
selected or to the fact that all impact categories are strongly correlated
541 Conclusions and recommendations Weighting sets are often dependent on different value choices to assign different weights
to all impact categories Therefore different weighting sets lead to significant differences
of the final conclusions It is recommended that the decision about inclusion of which
weighting set to use has been made and documented in the first scope definition and
shall not be changed later during the study
40
6 Estimation of uncertainty
Evaluation of the uncertainty of an LCA study is a step which involves both the LCI and
LCIA phase therefore it is strictly linked to the content of the previous chapters
Uncertainty in LCA can be defined in different ways (Ciroth et al 2016) For examples it
can be meant as describing the variability of the LCA data to determine the significance
of the indicator results being ldquothe estimated amount or percentage by which an
observed or calculated value may differ from the true valuerdquo (Skone 2000) ISO 14044
defines uncertainty analysis as systematic procedure to quantify the uncertainty
introduced in the results of a life cycle inventory analysis due to the cumulative effects of
model imprecision input uncertainty and data variability
The estimation of uncertainty serves three main purposes
it supports a better understanding of the results obtained
it supports the iterative improvement of an LCA study
it also helps the target audience to assess the robustness and applicability of the
study results
The PEF Guide identifies two key sources of uncertainty in PEF studies
1 Stochastic uncertainties for the inventory data
they refer to statistical descriptions of variance around a meanaverage For
normally distributed data this variance is typically described in terms of an
average and standard deviation
2 Choice-related uncertainties
They arise from methodological choices including modelling principles system
boundaries allocation choices choice of impact assessment methods and other
assumptions related to time technology geographical aspects etc These are not
amenable to statistical description but rather can only be characterized via
scenario model assessments
In this report we refer to uncertainty analysis to describe the range of likely outcomes
based on a set of inputs and it differs from a sensitivity analysis which is linked to how
sensitive the results are to a change in an input parameter (see previous chapters)
It has to be kept in mind that all steps involved in a quantitative process are affected by
uncertainties Therefore it is important that the uncertainty is assessed
- At inventory level (eg standard deviation associated to a data point) An
example on how to assess the uncertainty at inventory level was recently
provided by Ciroth et al (2016)
- At characterization level (eg linked to characterization factors)
- At normalisation level (eg linked to normalisation factors)
- At weighting level (eg linked to weighting factors)
611 Conclusions and recommendations It is recommended that the overall uncertainty of an LCA study is estimated and
reported in the final report It is also recommended to include an evaluation to which
extent the uncertainties identified affect the final conclusions
41
7 Meta-analysis
The widespread development of LCA in the last decades as a decision supporting tool
leads to a huge amount of LCA studies in literature concerning all kind of goods and
services (ldquoproductsrdquo) When trying to make sense of their results that sometimes are
very different or come up with a conclusion techniques to combine or re-analyze them
are needed such as meta-analysis
Zumsteg et al (2012) described the key factors for conducting and reporting systematic
reviews including meta-analyses10 in LCA Those key factors are simplified in a check
list 1 Review title keywords and abstract 2 Rationale for the review 3 Review
question and objectives 4 Description of review protocol 5 Findings and features of
the individual studies in the review 6 Assessment of bias 7 Synthesis methods
(qualitative and quantitative) 8 Limitations of the review and 9 Summary of findings
and conclusions
This chapter is not intended to give guidelines on how to perform a systematic review or
a meta-analysis but to highlight the critical points that the practitioner should take into
account when collecting and using the LCA data Recalling the check list previously
described it is in the findings and features of the individual studies where one of the
biggest shortcomings when performing a meta-analysis concerning LCA studies is found
Assembling data from the individual studies is complex due to
the existing ldquoflexiblerdquo guidance in conducting LCA that leads to different
assumptions and methodological choices made in the various LCA modelling
exercises The ISO 14040 and 14044 standards provide the framework for LCA
This framework however leaves the individual practitioner with a range of
choices which can affect the legitimacy of the results of an LCA study
the lack of homogeneity reporting LCA results
As found in De Matos et al (2015) while doing a meta-analysis of different bioeconomy
value chains the most influencing differences among studies mainly relate to
The definition of the system boundaries and the stages included in the
study (eg even if the same general system boundaries are considered -
eg cradle to gate - some studies may or may not include intermediate
transport construction and decommissioning of buildings etc)
The impact assessment methods used as different methods may
consider for example different substances for a given impact category
and different characterization factors for the same substance
The definition of the functional unit (eg as the input the output
product the agricultural land unit etc) (Cherubini and Stromman
2011)
The consideration of direct and indirect land use change (dLUC and iLUC
respectively) (Cherubini and Stromman 2011)
The technology considered in the process and its maturity level
The approach used to model the multifunctional system For instance if
substitution is used the reference system selected may have a
significant influence on the final LCA results On the other hand if
allocation is used the selection of the allocation criteria and the relative
10 The definition of Meta-analysis given by Zumsteg et al (2012) is ldquoA melding of data from multiple studies usually involving additional mathematical analysis with the goal of utilizing this synergy of information and data size to answer questions that cannot be answered by existing individual studies or to improve the certainty or impact of know findings by increasing the sample
size Meta-analyses are often performed as part of a systematic reviewrdquo
42
contribution of each co-product may considerably influence the results of
the assessment
These points are in line with those reported in other studies in literature Wolf et al
(2015) conducted a meta-analysis of LCAs for wood energy services (heat power and
combined heat and power (CHP)) and chose a set of ldquodecisive parametersrdquo to be
analyzed arguing that those factors promote inconsistent findings along LCA studies
Apart from the previously mentioned the authors include the following factors (some of
them specific of the good or service under study)
Data sources such as empirical data literature well-known databases
unspecified databases simulators or expert interviews are some of
them
Transportation distances and types
Feedstock properties (in this case wood)
Combustion capacity and efficiency and co-combustion rates
Energy service provided (power heat and CHP)
Schreiber et al (2012) performed a meta-analysis on LCA studies of electricity
generation with carbon capture and storage (CCS) comprising the three main CCS
technologies (post-combustion oxyfuel and pre-combustion) In line with previous
studies they highlighted the different choices in the LCA methodology and parameters
(specific of the good or service under study) that heavily impact the overall results Here
we report those which differ from the already mentioned
Data quality and availability
Time horizon as most studies considered present and future power
plants as far as 2050
Spatial representation ndash some elements in the CCS process chain are
highly site-specific such as storage sites
Life cycle inventory (LCI) ndash which inputs and outputs are considered
Operational valuation and weighting methods
Power plant efficiency and energy penalty of the capture process
Carbon dioxide capture efficiency and purity
Fuel origin and composition
Moreover when having a look at the limitations of the review and meta-analysis some
studies just focus on GHG emissions Wolf et al (2015) set the CML midpoint impact
category Global Warming as the basis for the comparison of results because it is
represented in 100 of the studies They did not consider other less-frequent impact
categories but yet important such as acidification eutrophication and particulate
matter owing to the lack of results published in the studies On the other hand
Schreiber et al (2012) not only focused on GHG but they included other impacts such
as acidification potential eutrophication potential photochemical ozone creation
potential and cumulative energy demand
As a conclusion increased harmonization and transparency in the calculation and
reporting of LCA data and results is needed (Cristobal et al 2015)
711 Conclusions and recommendations
The number of LCA studies available is increasing and making sense of all the results
that can be obtained from them is a difficult task As a conclusion increased
harmonization and transparency in the calculation of LCA data and results is needed It
is recommended that reporting of LCA data is done in a more consistent and harmonized
43
manner to allow users of LCA study a better understanding of the results and
conclusions drawn
8 Conclusion
One of the key aims of LCA is to provide the decision makers with comprehensive and
understandable information this task is achieved by a proper interpretation of the
results of an LCA study
This report builds on the requirements provided in relevant international standards (ISO
14044) and guides (ILCD Handbook (EC-JRC 2011a) PEF Guide (EC 2013b) and it
proposes a practical approach on how to perform a robust interpretation of an LCA
study It provides a ready-to-use approach for the identification of significant issues and
it includes examples of completeness sensitivity and consistency checks based on real-
case studies which are used to draw the attention of the reader on how to evaluate the
results of an LCA study
The scheme proposed in this report should not be intended as a comprehensive list of
items to check instead it should be seen as a normal workflow that should be carried
out by an LCA practitioner in order to derive robust conclusions out of the LCA study
More accurate and case-specific checks should be done depending on the intended goal
and scope of the study
The report is structured in order to allow a practitioner focus on the two quantitative
phases of LCA the life cycle inventory (LCI) and the life cycle impact assessment (LCIA)
Regarding the LCI the report goes through the analysis of the data sources by giving
examples on how to interpret the system boundaries and the foreground system) it
provides an overview on data quality and it comprises further completeness and
consistency checks (eg cut-off long term emissions anomaly checks)
When analysing the LCIA the report provides insights on sensitivity analysis regarding
characterization normalization and weighting When dealing with characterization the
attention of the reader is drawn also on mapping between the inventory and the
characterization models and a discussion on the evaluation of uncharacterized
elementary flows is also included
Finally an overarching topic such as meta-analysis was deemed useful to be included as
this is often used when there is the need of assessing the state of the art of the LCA
studies on a specific product supply chain Key messages stemming from this report are
as follows
Results reveal that the relative importance of one substance compared to another
changes with the characterization model This is because the models differ in the
substances that they include and in the CFs of each substance It is
recommended to run a sensitivity check with different characterization models to
evaluate the robustness of the conclusions drawn It is also recommended to
evaluate the theory underlying the characterization models chosen to evaluate a
certain impact category as this helps understanding the results obtained Results of the LCIA phase can be highly affected by the characterization model
chosen Furthermore the evaluation of uncharacterized elementary flows is of
primary importance to assess the completeness of the LCIA coverage of the
identified LCI flows Indeed a high number of elementary flows inventoried might
be non-characterized by the chosen models even if their relevance in the
assessed impact categories could be of primary importance Therefore it is highly
recommended that a quantification of the uncharacterized elementary flows is
reported before any interpretation or conclusion is performed on the superiority
of one product versus another Different normalisation sets may produce different results in terms of
identification of most relevant impact categories life cycle stages and processes
Different reference systems refer to different situation which can all be valid
44
depending eg on the geographical scope of the study It is recommended to
evaluate different normalisation tests which fit the study at hand to support the
conclusions drawn with the baseline scenario or to provide additional insights Weighting sets are often dependent on different value choices to assign different
weights to all impact categories Therefore different weighting sets lead to
significant differences of the final conclusions It is recommended that the
decision about inclusion of which weighting set to use has been made and
documented in the first scope definition and shall not be changed later during the
study It is recommended that the overall uncertainty of an LCA study is estimated and
reported in the final report It is also recommended to include an evaluation to
which extent the uncertainties identified affect the final conclusions The number of LCA studies available is increasing and making sense of all the
results that can be obtained from them is a difficult task As a conclusion
increased harmonization and transparency in the calculation of LCA data and
results is needed It is recommended that reporting of LCA data is done in a more
consistent and harmonized manner to allow users of LCA study a better
understanding of the results and conclusions drawn Further aspects such as the appropriateness of the functional unit the intended goal
the system boundaries and value choices should normally be part of an interpretation in
order to identify recommendations and limitations of the study and draw the appropriate
conclusions They are not discussed further in this report but it is recommended that at
least each decision based on a personal or a stakeholderrsquos value shall always be
documented and explained in the conclusions of the LCA study This is consistent with
one of the key aims of LCA which is to provide the decision makers with comprehensive
and understandable information
45
References
Baitz M Makishi Colodel C Kupfer T Florin J Schuller O Kokborg M Koumlhler A
Thylmann D Stof-fregen A Schoumlll S Goumlrke J Rudolf M Gonzalez M (2016) GaBi
Database amp Modelling Principles Thinkstep Leinfelden-Echterdingen
Benini L Mancini L Sala S Manfredi S Schau EM Pant R (2014) Normalization
method and data for Environmental Footprints European Commission Joint
Research Center Institute for Environment and Sustainability Publications Office
of the European Union Luxemburg ISBN 978-92-79-40847-2
Benini L Sala S Pant R (2015) Global normalization factors for ILCD compliant
midpoint impact categories - EC-JRC internal draft report Set of factors available
at httpeplcajrceceuropaeuuploadsTable_ILCD_NFs_08-03-2016xlsx
Biganzoli L Falbo A Forte F Rigamonti L Grosso M (2015) Mass balance and life
cycle assessment of waste electrical and electronic equipment management
system implemented in Lombardia Region (Italy) Science of the Total
Environment 524ndash525 361-375
Bjoslashrn A Hauschild MZ (2015) Introducing carrying capacity-based normalization
in LCA framework and development of references at midpoint level The
International Journal of Life Cycle Assessment 20 (7)1005ndash1018
Blonk Agri-footprint BV (2014) Agri-footprint Methodology and basic principles -
Version 10
Brentrup F Kusters J Lammel J Kuhlmann H (2000) Methods to estimate on-
field nitrogen emissions from crop production as an input to LCA studies in the
agricultural sector The International Journal of Life Cycle Assessment 5 349ndash
357
Castellani V Benini L Sala S Pant R (2016) A distance-to-target weighting
method for Europe 2020 The International Journal of Life Cycle Assessment
21(8)1159-1169
Castellani V Sala S Benini L (2017) Hotspots analysis and critical interpretation
of food life cycle assessment studies for selecting eco-innovation options and for
policy support Journal of Cleaner Production 140 (2) 556-568
Cellura M Longo S Mistretta M (2011) Sensitivity analysis to quantify
uncertainty in life cycle assessment the case study of an Italian tile Renew Sust
Energ Rev 15(9)4697-4705
Cherubini F Stromman AH (2011) Life cycle assessment of bioenergy
systems state of the art and future challenges Bioresource technology 102 437
ndash 451
Ciroth A Muller S Weidema B Lesage P (2016) Empirically based uncertainty
factors for the pedigree matrix in ecoinvent The International Journal of Life
Cycle Assessment 21 1338-1348
CML (2002) CML-IA model and characterisation factors Available from
httpswwwuniversiteitleidennlenresearchresearch-outputsciencecml-ia-
characterisation-factors Accessed November 2015
Colomb V Ait-Amar S Basset-Mens C Dolleacute JB Koch P Lellahi A Mousset J
Salou T Tailleur A van der Werf HMG (2015) AGRIBALYSE Assessment and
lessons for the future Version 12
Corrado S Zampori L Castellani V Sala S (2017) Systematic analysis of
secondary Life Cycle Inventories when modelling agricultural production a case
study for arable crops Journal of Cleaner Production (under review)
46
Cristobal J De Matos CT Aurambout JP Manfredi S Kavalov B (2015)
Environmental sustainability assessment of bioeconomy value chains Biomass
and bioenergy 89 159 ndash 171
De Matos CT Cristobal J Aurambout JP (2015) Environmental sustainability
assessment of bioeconomy products and processes ndash progress report 1 European
Commission Report EUR 27356 EN
De Schryver A Galatola M (2016) Guidance for modelling agricultural processes
TAB Issue paper v 01 October 2016
Dewulf J Benini L Mancini L Sala S Blengini G A Ardente F Recchioni M Maes
J Pant R Pennington D (2015) Rethinking the Area of Protection lsquoNatural
Resourcesrsquo in Life Cycle Assessmen Environmental Science and Technology 49
(9)5310ndash5317
Dong Y Gandhi N Hauschild MZ (2014) Development of Comparative Toxicity
Potentials of 14 cationic metals in freshwater Chemosphere 112 26-33
Ecoinvent (2016) Allocation cut-off by classification [WWW Document] URL
httpwwwecoinventorgdatabasesystem-models-in-ecoinvent-3cut-off-
system-modelallocation-cut-off-by-classificationhtml (accessed 8916)
European Commission ndash Joint Research Centre (EC-JRC) (2011a) ILCD Handbook
ndash General guide for life cycle assessment ndash Detailed guidance European
Commission Joint Research Centre Institute for Environment and Sustainability
European Commission ndash Joint Research Centre (EC-JRC) (2011b) ILCD Handbook
- Recommendations for Life Cycle Impact Assessment in the European context
European Commission Joint Research Centre Institute for Environment and
Sustainability
European Commission (EC) (2013a) Communication from the Commission to the
EU Parliament and Council ndash Building the Single Market for Green Products ndash
Facilitating better information on the environmental performance of products and
organisations(20130196final)
European Commission (2013b) Commission Recommendation of 9 April 2013 on
the use of common methods to measure and communicate the life cycle
environmental performance of products and organisations (2013179EU) Official
Journal of the European Union Volume 56 4 May 2013
European Commission (2015)ndash Better Regulation Toolbox
httpeceuropaeusmart-regulationguidelinesdocsbr_toolbox_enpdf
European Commission (2016) Product Environmental Footprint Pilot Guidance -
Guidance for the implementation of the EU Product Environmental Footprint (PEF)
during the Environmental Footprint (EF) pilot phase - version 52 (pp 95)
Retrieved from
httpeceuropaeuenvironmenteussdsmgppdfGuidance_productspdf
FAO (2012) FAOstat Agriculture data Food and Agriculture Organization of the
United Nations httpfaostatfaoorg
Gaudreault C Samson R Stuart P (2009) Implications of choices and
interpretation in LCA for multi-criteria process design de-inked pulp capacity and
cogeneration at a paper mill case study J Clean Prod 17(17)1535-1546
Giampietro M Saltelli A (2014) Footprints to nowhere Ecological Indicators 46
610-621
Goedkoop M Heijungs R Huijbregts M de Schryver A Struijs J van Zelm R
(2009) ReCiPe 2008 A life cycle assessment method which comprises
harmonized category indicators at the midpoint and the endpoint level Report I
47
Characterisation Ministry of Housing Spatial Planning and Environment
Amsterdam
Guineacutee JB Gorreacutee M Heijungs R Huppes G Kleijn R de Koning A van Oers L
Wegener Sleeswijk A Suh S Udo de Haes HA de Bruijn H van Duin R
Huijbregts MAJ (2002) Handbook on life cycle assessment Operational guide to
the ISO standards I LCA in perspective IIa Guide IIb Operational annex III
Scientific background Kluwer Academic Publishers ISBN 1-4020-0228-9
Dordrecht 2002 692 pp
Guo M Murphy RJ (2012) LCA data quality sensitivity and uncertainty analysis
Science of the total environment 435230-243
Hauschild MZ Wenzel H (1998) Environmental Assessment of Products Vol 2 ndash
Scientific background Chapman amp Hall UK Kluwer Academic Publishers
Hingham USA
Heijungs R Kleijn R (2001) Numerical approaches towards life cycle
interpretation five examples The International Journal of Life Cycle Assessment
6(3)141-148
Hellweg S Mila i Canals L (2014) Emerging approaches challenges and
opportunities in life cycle assessment Science 344(6188) 1109-1113
Huang Y Spray A Parry T (2013) Sensitivity analysis of methodological choices
in road pavement LCA The International Journal of Life Cycle Assessment
18(1)93-101
Huijbregts MAJ Hellweg S Hertwich E (2011) Do we need a paradigm shift in life
cycle impact assessment Environmental Science and Techonology 45 (9)
38333834
Huijbregts MAJ (1999) Life-cycle impact assessment of acidifying and eutrophying
air pollutants Calculation of equivalency factors with RAINS-LCA Report available
at httpmedialeidenunivnllegacyLife-cycle20impact20assessmentpdf
(accessed April 2016)
Huppes G Van Oers L Pretato U Pennington DW (2012) Weighting
environmental effects Analytic survey with operational evaluation methods and a
meta-method The International Journal of Life Cycle Assessment 17 876ndash891
James K Galatola M (2015) Screening and hotspot analysis procedure to
identify the hotspots and the most relevant contributions (in terms of impact
categories life cycle stages processes and flows) Version 40 24 April 2015
Retrieved from
httpswebgateeceuropaeufpfiswikisdisplayEUENVFPEU+Environmental+F
ootprint+Pilot+Phase accessed November 2016
ISO 14040 (2006a) Environmental managementmdashlife cycle assessmentmdash
principles and framework Geneva Switzerland
ISO 14044 (2006b) ndash Environmental management ndash Life Cycle assessment ndash
Requirements and guidelines
Laurent A Hauschild M Z Golsteijn L Simas M Fontes J Wood R (2013)
Deliverable 52 Normalisation factors for environmental economic and socio-
economic indicators Report prepared within the 7th Framework programme
Project PROSUITE Available at httpwwwprosuiteorgwebguestpublic-
deliverables (accessed December 2015)
Lee SJ Hawkins TR Ingwersen WW Young DM (2014) Exploring the Use of
Ecological Footprint in Life Cycle Impact Assessment Findings from a Comparison
of Transportation Fuels Journal of Industrial ecology 19(3) 416ndash426
48
Mancini L Benini L Sala S (2015) Resource footprint of Europe complementarity
of Material Flow Analysis and Life Cycle Assessment for policy support
Environmental Science and Policy 54367ndash376
Mancini L Benini L Sala S (2016) Characterization of raw materials based on
supply risk indicators for Europe The International Journal of Life Cycle
Assessment 1-13 doi101007s11367-016-1137-2
Nemecek T Baumgartner D (2006) Concerted Action GL-Pro WP4
Environmental Analysis - Final report - Deliverable 43 Available at
httpwwwagroscopeadminchpublikationeneinzelpublikationindexhtmllang
=enampaid=23328amppid=23604
Notarnicola B Sala S Antoacuten A McLaren SJ Saouter E Sonesson U (2017a) The
role of life cycle assessment in supporting sustainable agri-food systems a
review of the challenges Journal of Cleaner Production 140(2)399-409
doi101016jjclepro201606071
Notarnicola B Tassielli G Renzulli PA Castellani V Sala S (2017b) Environmental
impact of food consumption in Europe Journal of Cleaner Production 140(2)
753-765 doi101016jjclepro201606080
Pizzol M Christensen P Schmidt J Thomsen M (2011) Impacts of ldquometalsrdquo on
human health a comparison between nine different methodologies for Life Cycle
Impact Assessment (LCIA) Journal of Cleaner Production 19(6) 646-656
Pizzol M Laurent A Sala S Weidema B Verones F Koffler C (2016)
Normalisation and weighting in life cycle assessment Quo Vadis The
International Journal of LCA 1-14 doi 101007s11367-016-1199-1
Prado-Lopez V Seager TP Chester M Laurin L Bernardo M Tylock S (2014)
Stochastic multi-attribute analysis (SMAA) as an interpretation method for
comparative life-cycle assessment (LCA) Int J Life Cycle Ass 19(2)405-416
Pregrave Consultants (2015) SimaPro Database Manual - Methods library available at
httpswwwpre-sustainabilitycomsimapro-database-and-methods-library
(accessed February 2016)
Ponsioen TC Goedkoop MJ (2016) Midpoint weighting based on endpoint
information Submitted to The International Journal of Life Cycle Assessment
Rigamonti L Falbo A Zampori L Sala S (2017) Supporting a transition towards
sustainable circular economy sensitivity analysis for the interpretation of LCA for
the recovery of electric and electronic waste The International Journal of Life
Cycle Assessment 1-10 doi 101007s11367-016-1231-5
Rosenbaum RK Bachmann TM Gold LS Huijbregts MAJ Jolliet O Juraske R
Koehler A Larsen FH MacLeod M Margni M McKone TE Payet J Schuhmacher
M van de Meent D Hauschild MZ (2008) USEtoxmdashthe UNEP-SETAC toxicity
model recommended characterisation factors for human toxicity and freshwater
ecotoxicity in life cycle impact assessment The International Journal of Life Cycle
Assessment 13(7) 532-546
Sala S Wolf MA Pant R (2012) Characterization factors of the ILCD
Recommended Life Cycle Impact Assessment methods Database and Supporting
Information First edition EUR25167EN ISBN 978-92-79-22727 Luxembourg
Publications Office of the European Union Available at
httpeplcajrceceuropaeuuploads201401LCIA-characterization-factors-of-
the-ILCDpdf
Schau EM Davidsson B (2015) Product Environmental Footprint (PEF) Category
Rules (PEFCR) Pilot Intermediate Paper Product First Draft PEFCR July
2015Accessible for registered stakeholders at
49
httpswebgateeceuropaeufpfiswikisdisplayEUENVFPStakeholder+workspa
ce3A+PEFCR+pilot+Intermediate+paper+product
Schau EM Fet AM (2008) LCA studies of food products as background for
environmental product declarations The International Journal of Life Cycle
Assessment 13(3) 255-264
Schneider L Berger M Finkbeiner M (2011) The anthropogenic stock extended
abiotic depletion potential (AADP) as new parameterization to model the depletion
of resources The International Journal of Life Cycle Assessment 16(9) 929-936
Schneider L Berger M Finkbeiner M (2015) Abiotic resource depletion in LCAmdash
background and update of the anthropogenic stock extended abiotic depletion
potential (AADP) model The International Journal of Life Cycle Assessment
20(5) 709-721
Schreiber A Zapp P and Marx J (2012) Meta-Analysis of Life Cycle Assessment
Studies on Electricity Generation with Carbon Capture and Storage Journal of
Industrial Ecology 16 S155ndashS168
Seppaumllauml J Posch M Johansson M Hettelingh JP (2006) Country-dependent
Characterisation Factors for Acidification and Terrestrial Eutrophication Based on
Accumulated Exceedance as an Impact Category Indicator The International
Journal of Life Cycle Assessment 11(6) 403-416
Skone TJ (2000) What is Life Cycle Interpretation Environmental Progress 19
(2) 92-100
Steen BA (1999) A systematic approach to environmental priority strategies in
product life development (EPS) Version 2000 ndash Models and data of the default
method Chalmers University LindholmenJohanneberg
Stranddorf HK Hoffmann L Schmidt A (2005) Update on Impact Categories
Normalisation and Weighting in LCA - Selected EDIP97-data Environmental
Project Nr 995 Miljoslashprojekt httpwww2mstdkudgivPublications200587-
7614-570-0pdf87-7614-571-9PDF (accessed December 2015)
Tuomisto HL Hodge ID Riordan P Macdonald DW (2012) Exploring a safe
operating approach to weighting in life cycle impact assessment ndash a case study of
organic conventional and integrated farming systems Journal of Cleaner
Production 37147-153
UNEP- SETAC (2016) Hotspots Analysis an Overarching Methodological
Framework Draft document developed for UNEPSETAC Life Cycle Initiative -3
Flagship Project 3a (Phase 2) 11 october 2016 Available at
httpwwwwraporgukcontentprinciples-and-practices-hotspot-analysis
Van Hoof G Vieira M Gausman M Weisbrod A (2013) Indicator selection in life
cycle assessment to enable decision making issues and solutions International
Journal of Life Cycle Assessment 181568-1580
Van Zelm R Huijbregts M A van de Meent D (2009) USES-LCA 20mdasha global
nested multi-media fate exposure and effects model The International Journal
of Life Cycle Assessment 14(3) 282-284
Wackernagel M Monfreda C Moran D Wermer P Goldfinger S Deumling D
Murray M (2005) ―National Footprint and Biocapacity Accounts 2005 The
underlying calculation method Global Footprint Network Oakland California
USA
Weidema B Bauer C Hischier R Mutel C Nemecek T Reinhard J Vadenbo CO
Wernet G (2013) Overview and methodology Data quality guideline for the
ecoinvent database version 3
50
Williams ED Weber CL Hawkins TR (2009) Hybrid Framework for Managing
Uncertainty in Life Cycle Inventories Journal of Industrial Ecology 13 928ndash944
Wolf C Klein D Weber-Blaschke G Richter K (2015) Systematic review and
meta-analysis of life cycle assessment for wood energy services Journal of
Industrial Ecology 20 743 ndash 763
Zumsteg JM Cooper JS Noon MS (2012) Systematic Review Checklist Journal of
Industrial Ecology 16 S12ndashS21
51
List of abbreviations and definitions
AOX adsorbable organic halogens
BOD biochemical oxygen demand
BTEX benzene toluene xylene isomers
CFs characterisation factors
COD chemical oxygen demand
DQR data quality requirements
EcF ecological footprint
EF environmental footprint
ElFl elementary flow
HMs heavy metals
IC impact category
ILCD International Reference Life Cycle Data System
LCA life cycle assessment
LCI life cycle inventory
LCIA life cycle impact assessment
OEFSR organisation environmental footprint sector rules
PAH polycyclic aromatic hydrocarbons
PEF product environmental footprint
PEFCR product environmental footprint sector rules
PPP plant protection products
OEF organisation environmental footprint
TAB technical advisory board
TS technical secretariat
UNEPSETAC LCI Unep Setac Life cycle Initiative
VOC volatile organic compounds
WEEE waste electrical and electronic equipment
52
List of figures
Figure 1 Practical application of requirements in ISO 14044 and ILCD Handbook to
interpret LCI and LCIA results 5
Figure 2 Hotspot analysis in the context of the Environmental Footprint pilot (James amp
Galatola 2015) 8
Figure 3 Contribution analysis for the resource- related indicator calculated adopting
several characterization models (Rigamonti et al 2017) 27
53
List of tables
Table 1 Summary of requirements to define most relevant contributions and hotspots
(James amp Galatola 2015) 11
Table 2 Selection of most relevant Impact Categories (James amp Galatola 2015) 12
Table 3 Selection of most relevant life cycle stages (James amp Galatola 2015) 13
Table 4 Selection of most relevant processes (James amp Galatola 2015) 13
Table 5 Inventory results (climate change results expressed in gCOeq) (James amp
Galatola 2015) 14
Table 6 Most relevant inventory flows contributing to climate change (based on the
inventory results before normalisation and weighting) - overall life cycle (option 1)
(James amp Galatola 2015) 14
Table 7 Most relevant inventory flows contributing to climate change (based on the
inventory results before normalisation and weighting) ndash process level (option 2) (James
amp Galatola 2015) 14
Table 8 Hotspots based on 50 cumulative contribution (OPTION A) (James amp Galatola
2015) 15
Table 9 Hotspots based on top two representatives (OPTION B) (James amp Galatola
2015) 15
Table 10 Underlying assumptions in relation to the three databases considered by the
authors (Corrado et al 2017) 17
Table 11 Data quality rating in an example of intermediate paper products (EC 2013
Schau and Davidsson 2015) 20
Table 12 Data quality rating in an early phase of a PEF study of intermediate packaging
paper 21
Table 13 Example of check of inventoried elementary flows that are not characterized by
two impact assessment methods (based on Castellani et al 2017) 29
Table 14 List of impact categories listed in ILCD with total number of elementary flows
contributing to each IC 30
Table 15 Type of chemicals (mass and number of EFs) not characterized per emission
compartment (air oxygen and hydrogen have been excluded) 31
Table 16 Most relevant elementary flows contributing cumulatively up to 90 to the
freshwater ecotoxicity impact category with USEtox 32
Table 17 Summary of normalization sets used in the sensitivity analysis in Castellani et
al (2016) 33
Table 18 Results of sensitivity analysis on normalization sets at the European and global
scale for ILCD- and CML-IA methods (Castellani et al 2016) The percentages
represent the contribution of each product group to the total impacts of the BoP per
citizen (reference flow) Equal weighting of impact categories is applied The second
column reports the mass of each product group in the basket A color scale is applied to
the results in each column (ie product group) from green (lowest contribution) to red
(highest contribution) 34
Table 19 Results of sensitivity analysis on normalization sets at the European and global
scale for ILCD and CML-IA methods (Castellani et al 2016) The percentages reflect
the relative relevance of impact categories compared to the total impacts of the BoP per
citizen (reference flow) A colour scale is applied to the results in each column (ie
impact category) from green (lowest contribution) to red (highest contribution) 35
54
Table 20 Summary of weighting sets used in the sensitivity analysis by Castellani et al
(2016) 36
Table 21 Product groups contribution Results of several ILCD-compliant weighting sets
in combination with normalization references EU27 (Castellani et al 2016) A color scale
is applied to the results in each column (ie product group) from green (lowest
contribution) to red (highest contribution) 37
Table 22 Relevance of the different impact category Results of the application of several
ILCD-compliant weighting sets in combination with normalization references EU27
(Castellani et al 2016) A color scale is applied to the results in each column (ie
impact category) from green (lowest contribution) to red (highest contribution) 38
Europe Direct is a service to help you find answers
to your questions about the European Union
Freephone number ()
00 800 6 7 8 9 10 11 () The information given is free as are most calls (though some operators phone boxes or hotels may
charge you)
More information on the European Union is available on the internet (httpeuropaeu)
HOW TO OBTAIN EU PUBLICATIONS
Free publications
bull one copy
via EU Bookshop (httpbookshopeuropaeu)
bull more than one copy or postersmaps
from the European Unionrsquos representations (httpeceuropaeurepresent_enhtm) from the delegations in non-EU countries (httpeeaseuropaeudelegationsindex_enhtm) by contacting the Europe Direct service (httpeuropaeueuropedirectindex_enhtm) or calling 00 800 6 7 8 9 10 11 (freephone number from anywhere in the EU) () () The information given is free as are most calls (though some operators phone boxes or hotels may charge you)
Priced publications
bull via EU Bookshop (httpbookshopeuropaeu)
XX-N
A-x
xxxx-E
N-N
doi102788171315
ISBN 978-92-79-64114-5
LB-N
A-2
8266-E
N-N

9
Production of the main product4
Product distribution and storage
Use stage scenario (if in scope)
End-of-life (including product part reuse recovery recycling if in scope)
323 Procedure to identify the most relevant processes
Each impact category shall be investigated to identify the most relevant processes The
identification of the most relevant processes shall be done at the whole life cycle level
Similaridentical processes taking place in different life cycle stages (eg transportation)
shall be accounted separately
In the context of the EF pilot phase processes were defined as most relevant where they
collectively contributed at least 80 to any impact category before normalisation and
weighting
In some instances vertically aggregated datasets may be identified as representing
relevant processes It may not be obvious which process within an aggregated dataset
is responsible for contributing to an impact category The metadata accompanying the
data should be reviewed and used to identify relevant processes If this is not possible it
can be decided whether to seek further disaggregated data or to treat the aggregated
dataset as a process for the purposes of identifying relevance5
324 Procedure to identify the most relevant elementary flows
As far as the most relevant elementary flows is concerned they are the ones contributing
cumulatively more than 80 to the impact category It can be decided whether this is
calculated at the level of overall life cycle and or single (most relevant) process level
All elementary flows contributing more than 5 to the impact category shall be
considered as relevant
Once the most relevant elementary flows have been identified they shall be linked to the
processes emitting them
325 Procedure to identify the hotspots
A hotspot can be identified at different levels of granularity impact category life cycle
stage process or elementary flow
In the context of PEFOEF pilot phase a hotspot is defined as either (James and Galatola
2015)
OPTION A (1) life cycle stages (2) processes and (3) elementary flows
cumulatively contributing at least 50 to any impact category before
normalisation and weighting (from the most contributing in descending order)
OPTION B At least the two most relevant life cycle stages processes and at least
two elementary flows (minimum 6) Additional hotspots may be identified by the
TS
4 If it is not possible to differentiate between the production of the main product and ancillary materials and
other life cycle stages eg raw material acquisition and transport then these life cycle stages can be merged Adequate justifications shall be provided in the screening report and be highlighted in the consultation phase If an aggregated life cycle stageprocess is most relevant it implies that all the processes included will be classified as most relevant 5 In this last case if an aggregated dataset is relevant everything in it is automatically relevant
10
326 Dealing with negative numbers
When identifying the percentage contribution from any process or flow it is important
that absolute values are used (ie the minus sign is ignored) in calculating percentage
contributions This allows indentifying the relevance of any credits
327 Specific instructions about aggregating elementary flows
The toxicity-related impact categories (ldquoHuman toxicity cancer effectsrdquo ldquoHuman
toxicity non-cancer effectsrdquo and ldquoFreshwater ecotoxicityrdquo) contain long lists of
characterization factors specified on the elementary flow category level 3 (also known
as sub-compartment ndash for example urban air freshwater agricultural soil) The impact
category ldquoParticulate matterrdquo also contains characterization factors at the level 3
category
It is recommended to aggregate the elementary flows on the level 2 category (ie
emissions to air water soil) in the contribution analysis This is to make the analysis
more manageable and because the level 3 category does not give additional information
when analyzing on the process level (the processes already contain information on the
location type of the emissions)
It is important to model foreground data on the level 3 category for particulates and
toxic substance flows because the characterization factors can deviate considerably
Metal resource flows are not specified per origin of ore type in the source files of the
ILCD recommended methods However in several background databases metal
resource flows are differentiated (for example Silver Ag 46E-5 Au 13E-4 in ore
Silver Ag 42E-3 Au 11E-4 in ore Silver Ag 21E-4 Au 21E-4 in ore etc)
Therefore the specified flows were added to the ILCD method in LCA software packages
with the same characterization factors as for the unspecified metals When doing a
contribution analysis of the metal resource flows it is therefore recommended to
aggregate the flows per metal (silver copper nickel etc)
There are 5 different fossil fuel related resource flows specified in the source files of the
ILCD recommended methods (brown coal 119 MJkg crude oil 423 MJkg hard coal
263 MJkg natural gas 441 MJkg peat 84 MJkg) However in several background
databases fossil resource flows are specified with different calorific values (for example
Gas natural 468 MJ per kg Gas natural 366 MJ per m3 Gas natural 35 MJ per m3
Gas natural 303 MJ per kg etc) Therefore the specified flows were added to the
ILCD method in LCA software packages with characterization factors related to the
factors in the original source taking the different calorific value into account When
doing a contribution analysis of the fossil resource flows it is therefore recommended to
aggregate the flows based on the 5 original flows (brown coal crude oil hard coal
natural gas and peat)
328 Conclusions
In table 1 the requirements to define most relevant contributions during the EF pilot
phase are summarized as found in the PEFCR Guidance (EC 2016)
11
Table 1 Summary of requirements to define most relevant contributions and hotspots (James amp Galatola 2015)
Item At what level does relevance need to be identified
Threshold
Most relevant impact categories In the final results starting from normalized and weighted results but deviations possible if justified
No threshold Decision left to TS but subject to stakeholder consultation and TAB opinion
Most relevant life cycle stages For each impact category before normalization and weighting Not relevant for data needs identification
All life cycle stages contributing cumulatively more than 80 to any impact category
Hotspots For each impact category before normalization and weighting
Either (i) life cycle stages processes and elementary flows cumulatively contributing at least 50 to any impact category or
(ii) at least the two most relevant impact categories life cycle stages processes and at least two elementary flows (minimum 6) Additional hotspots may be identified by the TS
Most relevant processes For each impact category before normalization and weighting Essential for data needs identification
All processes contributing cumulatively more than 80 to any impact category
Most relevant elementary flows For each impact category before normalization and weighting Essential for data needs identification
All elementary flows contributing cumulatively more than 80 to any impact category and in any case all those contributing more than 5 individually
When assessing what is most relevant it is also recommended to check if what is
identified as being non-relevant can be actually considered as such A practical example
is given at paragraph 431
12
329 Example to identify most relevant contributions and hotspots
The PEFCR Guidance (2016) also provided an example on how to perform a hotspot
analysis and the identification of most relevant impact categories life cycle stages
processes and elementary flows The example is reported here it is a fictitious example
not based on any specific PEF study results
3291 Example most relevant Impact Categories
Table 2 shows the contribution of different impact categories based on normalised and
weighted results
Table 2 Selection of most relevant Impact Categories (James amp Galatola 2015)
Impact category Unit Contribution ()
Climate change kg CO2 eq 215
Ozone depletion kg CFC-11 eq 30
Human toxicity cancer effects CTUh 83
Human toxicity non-cancer effects CTUh 149
Particulate matter kg PM25 eq 01
Ionizing radiation human health Kbq U235 eq 05
Photochemical ozone formation kg NMVOC eq 24
Acidification molc H+ eq 15
Terrestrial eutrophication molc N eq 10
Freshwater eutrophication kg P eq 10
Marine eutrophication kg N eq 01
Freshwater ecotoxicity CTUe 01
Land use kg deficit 143
Water resource depletion m3 water eq 186
Mineral fossil resource depletion kg Sb eq 127
Based on the normalised and weighted results the TS can decide that the following
impact categories are relevant for communication purposes climate change water
depletion and land use Where there is deviation from the most significant contributors
to the normalised and equally weighted results justification shall be provided
Once the relevant impact categories for communication purposes have been selected
the TS shall start identifying the most relevant life cycle stage processes and flows per
each impact category (all baseline EF impact categories not only those relevant for
communication purposes)
13
3292 Example most relevant Life Cycle Stages
Table 3 shows the contribution of different life cycle stages to the climate change impact
category (based on the characterised inventory results before normalisation and
weighting)
Table 3 Selection of most relevant life cycle stages (James amp Galatola 2015)
Life cycle stage Contribution ()
Raw material acquisition and pre-processing 421
Production of the main product 252
Product distribution and storage 164
Use stage (if in scope) 108
End-of-life 55
The three life cycle stages in purple will be the ones identified as most relevant for
climate change as they are contributing to more than 80 This procedure shall be
repeated for all the baseline EF impact categories
3293 Example most relevant Processes
Table 4 shows the contribution of different processes to the climate change impact
category (based on the characterised inventory results before normalisation and
weighting)
Table 4 Selection of most relevant processes (James amp Galatola 2015)
Unit process Contribution ()
Process A 89
Process B 614
Process C 234
Process D 28
Process E 15
Process F 09
Other processes 09
According to the proposed procedure the processes in orange shall be selected as ldquomost
relevantrdquo Process E could be added to the as most relevant ones based on specific
considerations (eg it is under operational control it is of relevance for the specific
sector etc) This procedure shall be repeated for all the baseline EF impact categories
3294 Example most relevant Elementary Flows
Considering that the selection of the most relevant elementary flows can be done at
overall life cycle level (option 1) andor per relevant process (option 2) there are two
14
possible outcomes Starting from the inventory results provided in Table 5 the list of
most relevant flows are highlighted in blue in Table 6 (at overall life cycle) and Table 7
(at process level)
Table 5 Inventory results (climate change results expressed in gCOeq) (James amp Galatola 2015)
Inventory flow Substance 1 Substance 2 Substance 3 Substance 4 Substance 5 Total
Process A 249 85 6 45 5 390
Process B 1100 600 500 450 50 2700
Process C 300 250 20 30 430 1030
Process D 60 30 20 10 5 125
Process E 64 1 1 1 1 68
Process F 15 10 8 5 3 41
Other processes 15 10 8 5 3 41
Total 1803 986 563 546 497 4395
Table 6 Most relevant inventory flows contributing to climate change (based on the inventory results before normalisation and weighting) - overall life cycle (option 1) (James amp Galatola 2015)
Inventory flow Substance 1 Substance 2 Substance 3 Substance 4 Substance 5 Total
Process A 57 19 01 10 01 89
Process B 250 137 114 102 11 614
Process C 68 57 05 07 98 234
Process D 14 07 05 02 01 28
Process E 15 00 00 00 00 15
Process F 03 02 02 01 01 09
Other processes 03 02 02 01 01 09
Total 410 224 128 124 113
Table 7 Most relevant inventory flows contributing to climate change (based on the inventory results before normalisation and weighting) ndash process level (option 2) (James amp Galatola 2015)
Inventory flow Substance 1 Substance 2 Substance 3 Substance 4 Substance 5 Total
Process A 64 22 2 12 1 100
Process B 41 22 19 17 2 100
Process C 29 24 2 3 42 100
15
Process D 48 24 16 8 4 100
Process E 94 1 1 1 1 100
Process F 37 24 20 12 7 100
Other processes 37 24 20 12 7 100
3295 Example hotspots
In Tables 8 and 9 the identified hotspots - based on the two different approaches
available- are presented
Table 8 Hotspots based on 50 cumulative contribution (OPTION A) (James amp Galatola 2015)
Hotspots
Life cycle stages Raw material acquisition and pre-processing
Production of the main product
Processes Process B
Elementary flows Option 1 Substance 1 and 2
Option 2
Substance 1 and 2 in processes B
Substance 1 and 5 in process C
Substance 1 in process E
Table 9 Hotspots based on top two representatives (OPTION B) (James amp Galatola 2015)
Hotspots
Life cycle stages Raw material acquisition and pre-processing
Production of the main product
Processes Process B
Process C
Elementary flows Option 1 Substance 1 and 2 in process B
Option 2 Substance 1 in process E6 and substance 5 in process C
4 Interpretation on Life Cycle Inventory (LCI) level
During the life cycle inventory phase the actual data collection and modelling of the
system has to be done in line with the goal definition and aiming at meeting the
requirements derived in the scope phase The LCI results are the input to the
subsequent Life Cycle Impact Assessment (LCIA) phase
Interpretation involves evaluations at the level of Life Cycle Inventory in order to
improve the inventory model to meet the needs derived from the study goal
perform a sensitivity analysis to check for limitations in the appropriateness of
the life cycle inventory work
6 Choosing the hotspots based on option B-2 might lead to anomalies (like in this fictitious
example) where an elementary flow is identified as hotspot even if its absolute value is not
prominent
16
understanding the underlying assumptions when secondary datasets are used in
the model
combining the above points to refine the LCA model
draw appropriate and robust conclusions
Key aspects to evaluate life cycle inventories are the consistency and completeness
thereof They can be evaluated taking into account different aspects A sensitivity check
to evaluate the reliability of the results is also a needed step
A first aspect to be taken into account is the data source Primary data are collected
directly by the company performing the study thus the consistency of the data used
with the goal and scope of the study should be more straightforward However when
and LCA study is making use of secondary datasets to model the background system a
careful analysis of the consistency of these datasets with the primary data collected and
in relation with the goal and scope shall be made
Indeed different modelling assumptions in datasets aimed at representing the same
product system can lead to different results affecting the reliability of the LCA study
(Williams et al 2009) An example of the relevance of different data sources and
consistency has been discussed in Corrado et al (2017) this study focuses on different
data sources to originate the inventory of arable crops (1 kg of wheat) The choice of the
secondary dataset can have a relevant influence on LCA results and it is considered
among the challenges for a robust LCA (Notarnicola et al 2017a)
A second aspect to be taken into account regarding life cycle inventories is the quality of
the data used regarding time geographical and technological representativeness
precision methodological compliance and documentation Therefore in this chapter a
paragraph is dedicated to analyzing more in detail this aspect
A third relevant aspect in relation to LCIs is the consistency and completeness in relation
to single aspects such as cut-off inclusionexclusion of specific elementary flows (eg
long term emissions) It is not straightforward to judge if an inventory can be considered
complete As a general rule it has always to be kept in mind that the inventory has to
be checked in its completeness in relation to the goal and scope of the study for
example if the goal of the study is to assess only the climate change impact category
the completeness of the inventory shall be evaluated against those emissions that are
actually contributing to climate change within the system boundaries It does not lead to
improved conclusions the compilation of a more detailed inventory with the inclusion of
eg substances that do not contribute to climate change
41 Analysis of data sources
When selecting secondary data sets it is important to ensure that all data sets used in
the modelling of the system model are methodologically consistent (ie consistency
check) The use of inconsistent data can lead to an unreliable and distorted LCA study
often with wrong conclusion and recommendations drawn Furthermore use of datasets
with different level of completeness (ie completeness checks) may also lead to
unreliable conclusions
The study from Corrado et al (2017) is used as a case study to highlight the relevance
of different data sources in an LCA study Therefore the content of this paragraph is
mainly based on this paper The paper is organized as follows firstly the authors report
an overview of the system boundaries and underlying assumptions adopted in building
secondary datasets for arable crops within three databases Secondly they summarise
the approaches adopted to model the foreground system highlighting analogies and
differences Afterwards they point out the influence that modelling approaches can have
on the impact assessment Finally the combination of these elements allowed to derive
some considerations on relevant elements of datasets
17
It is focused on the analysis of secondary datasets for arable crops production as
modelled in three databases adopted as source of secondary data in LCA Agribalyse v
12 (Colomb et al 2015) Agrifootprint v 10 (Blonk Agri-footprint BV 2014) and
Ecoinvent v 31 (Weidema et al 2013) For simplicity in the remainder of the report
they are named Agribalyse Agrifootprint and Ecoinvent respectively
The authors performed three types of analysis
comparison of the system boundaries and underlying assumptions
analysis of how the foreground system is modelled in each dataset focusing on
different aspects such as fertilisers application and nutrient fate plant
protection products application and fate heavy metals (HMs) input mass balance
and fate irrigation agricultural operations land occupation and transformation
comparison of the results of the life cycle impact assessment for the foreground
system including the relative contribution of background
411 Analysis of the system boundaries
The system boundaries and the main underlying assumptions adopted to model arable
crops production in the three databases are reported in Table 10
Table 10 Underlying assumptions in relation to the three databases considered by the authors (Corrado et al 2017)
Agribalyse Agrifootprint Ecoinvent
Data source Provided by technical institutes (eg ARVALIS ndash Institut du Veacutegeacutetal)
Different sources (eg
scientific literature official
statistics such as FAOstat
Eurostat)
GL-Pro project ndash Barrois
region (Nemecek and
Baumgartner 2006)
Straw management (when
applicable)
Partly removed from the
field
Totally removed from the
field
Left on the field
Allocation of co-products
(grains and straw)
Not applied because the
straw market was not very
structured at the time when
the datasets were developed
Economic mass and energy
allocation
Not applicable because
straw is assumed to be left
on the field
Nutrients from straw left
on the field
The fertilising effect of crop
residues and emissions from
the residues are allocated to
the crop that generated the
residues
Not applicable The fertilising effects of crop
residues are allocated to the
crop that generated it (only
for P and K) The amount of
fertilisers is corrected for the
amount of nutrients in crop
residues
Crop
rotation
modelling
Phosphorou
s (P) and
potassium
(K) inputs
and
emissions
allocation
P and K fertilisers production
and emissions due to their
application are allocated to
each crop pro rata for the
crop exports
Not reported The amount of P and K of the
residues supplied to the field
through residues were
allocated to the crop that
generates them
18
N inputs and
emissions
allocation
The organic nitrogen
available for the crop to
which the fertiliser is
applied is allocated to that
crop The remaining fraction
that contributes to
increasing the stock of
organic matter was allocated
to all the crops in the
rotation Mineral nitrogen is
completely allocated to the
crop to which it was applied
Not reported Allocation not performed
412 Foreground system analysis
The authors compared the activities modelled in the foreground system of the datasets
referring to seven field activities agricultural operations fertilisers application and
nutrients environmental fate plant protection products (PPP) application and related
environmental fate heavy metals (HMs) input and related environmental fate irrigation
and land occupation and transformation The average crop yields reported in the dataset
presents small differences (wheat min-max barley min-max rapeseed min-max pea
min-max) The 95 confidence interval of the yields is defined only in Agrifootprint
datasets whereas it is not reported in Agribalyse and Ecoinvent datasets
For completeness findings and aspects to be taken into account are below reported The
below checklist can also be used to build a completeness check of the different datasets
and it can be used to build a sensitivity analysis based on the parameters that are seen
to be affecting the final results
Agricultural practices modelling
Management of agricultural residues
Composition of the crop rotation
Allocation to the co-products
Agricultural operations modelling
Number of operations
Number of passages
Machine power
Soil texture
Airborne emissions due to fuel combustion
Emissions of heavy metals due to tires abrasion
Fertilisers application and nutrients fate modelling
The nutrients fate is highly influenced by site-specific conditions
o environmental conditions
o soil type
o agricultural management practices
o type of fertiliser (Brentrup et al 2000)
o spatial differentiated emissions when modelling agricultural systems
Nomenclature (eg the paper shows that phosphorus compounds emissions were
expressed in the datasets with different flows limiting the possibility of making a
comparison among inventory data)
PPP application and environmental fate modelling
19
application method
weather and soil conditions
crop characteristics
irrigation
active substances whose use is not anymore authorised
Heavy metals inputs and environmental fate modelling
Mass balance
Fate
Irrigation modelling
Irrigation volumes
Water flows type
Environmental conditions
Spatially-differentiated water flows
Land use transformation modelling
Amounts of transformed land are considered
Type of land transformed (eg from hellip to hellip)
CO2 emissions due to land transformation
42 Data quality
As data is essential in all quantitative studies like LCAs so is also their quality
Therefore the data applied in the life cycle inventory phase shall be assessed in the
interpretation phase against the goal and scope of the study is the data quality
sufficient for the goal of the study Is the data consistent Can the data be seen as
complete
If the answer is yes then the interpretation can be preceded and conclusions drawn If
no then either the goal and scope need to be adjusted or probably in most cases
better the life cycle inventory phase need to be revisited in an iterative manner to
improve the data quality to the appropriate level The assessment of the data quality is a
mandatory reporting element in the interpretation phase
ISO 14044 (2006) defines data quality as characteristics of data that relate to their
ability to satisfy stated requirements The data quality requirements are described in
the goal and scope of the LCA study and covers the following 10 aspects (ISO14044
2006 ch 4236)
1) time-related coverage age of data and the minimum length of time over which
data should be collected
2) geographical coverage geographical area from which data for unit processes
should be collected to satisfy the goal of the study
3) technology coverage specific technology or technology mix
4) precision measure of the variability of the data values for each data expressed
(eg variance)
5) completeness percentage of flow that is measured or estimated
6) representativeness qualitative assessment of the degree to which the data set
reflects the true population of interest (ie geographical coverage time period
and technology coverage)
7) consistency qualitative assessment of whether the study methodology is applied
uniformly to the various components of the analysis
20
8) reproducibility qualitative assessment of the extent to which information about
the methodology and data values would allow an independent practitioner to
reproduce the results reported in the study
9) sources of the data
10) uncertainty of the information (eg data models and assumptions)
In the EF methods7 the consistency and reproducibility is one of the main aims of any
EF study and not evaluated as part of the data quality assessment Data sources should
be ILCDEF compliant and specified if a PEFCROEFSR is followed Precision and
uncertainty are evaluated together in the EF method Therefore the EF operates with six
semi qualitative data quality requirements instead of 9 in ISO14044 (cf section 56 in
European Commission 2013)
In order to evaluate the appropriateness and the quality of the data used to compile the
LCI they have to be scored against certain requirements As an example the table below
(Table 11) provides the data quality requirements for a PEF study of intermediate paper
products (EC 2013a Schau and Davidsson 2015)
The table 12 shows the semi-qualitative data quality rating (DQR) (based on expert
judgement) of the most impacting processes in an early phase of a PEF study of
intermediate packaging paper The data set DE Potato starch at plant was deemed to
be of too low quality (DQR = 267) as it scored poor (4) on Parameter uncertainty and
Methodological Appropriateness and Consistency to be used for comparative assertion
Therefore another dataset was searched for that was compliant with the goal and scope
of the study
It is also recommended that the practitioner is aware of the methodological choices used
to build the datasets (may be evaluated under Methodological Appropriateness and
Consistency) such as the definition of the system boundaries between nature and
technosphere and the time-horizons of the emissions (short-termlong term)
System boundaries between nature and technosphere are especially relevant for food
and agricultural product (and products made thereof) as for these products the
technosphere is closely interlinked with nature (Schau et al 2008) This includes
modelling of pesticides and fertilizers (De Schryver and Galatola 2016)
The time-horizons of the emissions are essential especially for long lived product and for
end-of-life processes (eg landfilling waste handling of residues from mining in raw
material extraction) (Guo and Murphy 2012) Also how radioactive waste is modelled is
essential to assess with a time horizon in mind Often a distinction is made between
long term and short term emission Where the boundary is set between those (100
years 300 years 50 000 years etc) can therefore be important and should be taken
into account when assessing the data quality for methodological appropriateness and
consistency (see chapter 433)
Database providers publish their modelling principle (see eg Baitz et al 2016) which is
an essential source for evaluating and assessing the data quality (of background data) in
addition to the metadata of the LCI data itself
Table 11 Data quality rating in an example of intermediate paper products (EC 2013 Schau and Davidsson 2015)
7 In the EF Guide the term representativenessrdquo is used instead of coveragerdquo used in ISO 14044 for the
geographical and time-related data quality requirement The term ldquoparameter uncertaintyrdquo is used instead of ldquoprecisionrdquo used in ISO14044 and the term ldquomethodological appropriateness and consistencyrdquo is used in the EF Guide instead of ldquoconsistencyrdquo used in ISO14044
21
Data quality elements
Representativeness
Qu
alit
y level
Qu
alit
y r
atin
g
Defin
itio
n
Tech
no
log
ica
l
Ge
og
rap
hic
al
Tim
e-r
ela
ted
Com
ple
ten
ess
Meth
od
olo
gic
al
Ap
pro
priate
ness a
nd
Co
nsis
tency
Pa
ram
ete
r u
nce
rta
inty
Very good
1
Meets the criterion to a very high degree without need for improvement
Eg Process is same For electricity from grid average technology as country- specific consumption mix
Country specific data
le 3 years old data
Very good completeness (ge 90 )
Full compliance with all requirements of the PEF guide
Very low uncertainty (le 7 )
Good
2
Meets the criterion to a high degree with little significant need for improvement
Eg average technology as country- specific consumption mix
Central Europe North Europe representative EU 27 mix
3-5 years old data
Good completeness (80 to 90 )
Attributional Process based approach AND following three method requirements of the PEF guide met (1) Dealing with multi-functionality (2) End of life modelling (3) System boundary
Low uncertainty (7 to 10 )
Fair 3
Meets the criterion to an acceptable degree but merits improvement
Eg average technology as country- specific production mix or average technology as average EU consumption mix
EU-27 countries other European country
5-10 years old data
Fair completeness (70 to 80 )
Attribution Process based approach AND two of the following three method requirements of the PEF guide met (1) Dealing with multi-functionality (2) End of life modelling (3) System boundary
Fair uncertainty (10 to 15 )
Poor
4
Does not meet the criterion to a sufficient degree but rather requires improvement
Eg average technology as country- specific consumption mix of a group of similar products
Middle east North-America Japan etc
10-15 years old data
Poor completeness (50 to 70 )
Attributional Process based approach AND one of the following three method requirements of the PEF guide met (1) Dealing with multi-functionality (2) End of life modelling (3) System boundary
High uncertainty (15 to 25 )
Very poor
5
Does not meet the criterion Substantial improvement is necessary
Eg other process or unknown not available (na)
Global data or unknown
ge 15 years old data
Very poor or unknown completeness (lt 50 )
Attributional Process based approach BUT None of the following three method requirements of the PEF guide met (1) Dealing with multi-functionality (2) End of life modelling (3) System boundary
Very high uncertainty (gt25 )
Table 12 Data quality rating in an early phase of a PEF study of intermediate packaging paper
22
Representativeness
Data set
Tech
no
logi
cal
Ge
ogr
aph
ical
Tim
e-r
ela
ted
Co
mp
lete
ne
ss
Par
ame
ter
un
cert
ain
ty
Me
tho
do
logi
cal
Ap
pro
pri
ate
ne
ss a
nd
Co
nsi
ste
ncy
Resulting Data Quality Rating (DQR)
CH building hall steel construction 1 3 3 1 3 4 250
CH disposal sludge from pulp and paper production 25 water to sanitary landfill 1 3 3 1 3 4 250
CH disposal steel 0 water to municipal incineration 1 3 3 1 3 4 250
DE lignite briquettes at plant 1 3 3 1 3 4 250
DE maize starch at plant 1 3 3 1 3 4 250
DE potato starch at plant 1 3 3 1 4 4 267
RER AKD sizer in paper production at plant 1 2 3 1 3 4 233
RER aluminium sulphate powder at plant 1 2 3 1 3 4 233
RER building multi-storey 1 2 3 1 3 4 233
RER electricity medium voltage production RER at grid 1 2 2 1 3 3 200
RER facilities chemical production 1 2 3 1 3 4 233
RER heavy fuel oil at regional storage 1 2 3 1 3 4 233
RER heavy fuel oil burned in industrial furnace 1MW non-modulating ltu-sogt 1 2 3 4 3 4 283
RER industrial wood hardwood under bark u=80 at forest road 1 2 3 1 3 4 233
RER industrial wood softwood under bark u=140 at forest road 1 2 3 1 3 4 233
RER natural gas high pressure at consumer 1 2 3 1 3 4 233
RER paper mill integrated ltu-sogt 1 2 3 1 3 4 233
RER PEFEmissions-RF ltu-sogt 1 2 3 3 3 3 250
RER PEFEmissions-VF v03 ltu-sogt 1 2 2 2 4 3 233
RER sodium chlorate powder at plant 1 2 3 1 3 4 233
RER sodium dithionite anhydrous at plant 1 2 3 1 3 4 233
RER sodium hydroxide 50 in H2O production mix at plant 1 2 3 1 3 4 233
RER steel converter chromium steel 188 at plant 1 2 3 1 3 4 233
RER steel electric chromium steel 188 at plant 1 2 3 1 3 4 233
RER sulphate pulp ECF bleached at plant 1 2 3 1 3 4 233
RER sulphate pulp unbleached at plant 1 2 3 1 3 4 233
RER sulphuric acid liquid at plant 1 2 3 1 3 4 233
RER transport freight rail 1 2 3 1 3 4 233
RER transport lorry gt16t fleet average 1 2 3 1 3 4 233
RER Water Withdrawals-VF ltu-sogt 1 1 2 1 3 3 183
23
43 Further completeness and consistency checks
In this section some further checks are presented referring both to completeness and
consistency checks
431 Anomaly assessment An anomaly assessment can be done where based on previous experience unusual or
surprising deviations from expected or normal results are observed and examined for
relevance (Skone 2000)
As a practical example it can be considered the case of LCA studies of mining activities
When the production of eg copper concentrates was assessed adopting an impact
assessment method such as ILCD and performing the hotspot analysis as described in
chapter 3 of this report it was found that the identification of most relevant impact
categories did not include Resource Depletion fossil mineral In addition the most
relevant processes and life cycle stages contributing to this impact category were not
related to the ones involved in the copper extraction In the case under analysis it was
found that elementary flows related to extraction of resources from nature were missing
from the inventory because the dataset used in the analysis did not include in its goal
and scope the assessment of Resource Depletion fossil mineral
A learning was that it is true that it is important to evaluate what is most relevant (eg
impact categories life cycle stages processes elementary flows) however it is also
important to check if what is found as being non-relevant can be actually considered as
such Hence it is important to evaluate if the LCI modelled is complete with regard to
the impact categories that the assessor wants to evaluate
432 Cut-off ISO 14044 identifies cut-off as the ldquospecification of the amount of material or energy
flow or the level of environmental significance associated with unit processes or product
system to be excluded from a studyrdquo ISO 14044 also requires that the effect on the
outcome of the study of the cut-off criteria selected shall be assessed and described in
the final report
Cut-off criteria can be based on
Mass eg lt5 cumulative mass input
Energy eg lt5 cumulative energy input
Environmental significance eg lt5 of the results of the selected impact categories It is important to note that the cut-off criteria need to be selected based on the goal and
scope of the study Therefore if the study is intended to be used for comparisons and
comparative assertions a sensitivity check using all the above three criteria is a
mandatory requirement
433 Long term emissions Long term emissions are those emissions considered to happen beyond 100 years up to
thousands of years (eg 60000)
Not all databases include long-term emissions within the system boundaries In some
cases it can be observed that LCA results after characterization normalization and
weighting are by far dominated by toxicity-related impact categories When this is the
case it is recommended to check if the datasets used include long term emissions
which in terms of absolute amounts are well superior compared to emissions occurring
within 100 years It has also to be noted that the models to estimate long term
emissions are affected by a high uncertainty which has to be taken into account in the
LCA study to avoid biased conclusions and wrong recommendations
When dealing with long term emissions it is important however not to overlook their
potential impact therefore it is recommended to
Assess a baseline scenario excluding long-term emissions
Perform a sensitivity analysis including long-term emissions in the LCI
Include an analysis of the uncertainty associated to the inclusion of long-term
emissions
24
25
5 Interpretation on Life Cycle Impact Assessment (LCIA)
level
Life Cycle Impact Assessment is the phase in an LCA where the inputs and outputs of
elementary flows that have been collected and reported in the inventory are translated
into impact indicator results LCIA has two mandatory steps which are the classification
and the characterization of LCI results and two optional steps normalisation and
weighting
Many elements can be subject to interpretation in the LCIA phase In this report the
focus will be on
the relevance of applying different characterization models
the relevance of applying different normalisation sets
the relevance of applying different weighting sets
the identification of the most sensitive elements in determining the final results
conclusions and recommendations
the coverage of characterization factors compared to the inventoried elementary
flows
Those points will be illustrated in the following section through illustrative case studies
First a case study dealing with sensitivity analysis of using different characterization
models for toxicity-related and resource-related impact categories will be discussed
Second a case study dealing with using different impact assessment methods This case
study will also be used to go through sensitivity analysis in relation to normalisation sets
and weighting sets
Third a case study mapping the coverage of characterization factors of toxicity-related
categories compared to the inventoried elementary flows will be shown
51 Characterization sensitivity analysis
The use of different characterization models to assess a certain impact category may
play a relevant role in the calculation of the final results and the identification of
hotspots most relevant life cycle stages processes and elementary flows
511 Case study 1 ndash WEEE management Toxicity-related and Resource-related impact categories affecting interpretation of results
The first case study is based on a work by Rigamonti et al (2017) the authors selected
a case study in which LCA has been applied to assess a waste electrical and electronic
equipment (WEEE) management system (Biganzoli et al 2015) In that study the
assessment was carried out to quantify the mass balance of the WEEE management
system in Lombardy Region in the year 2011 and to calculate its environmental benefits
and burdens
Firstly they tested characterization models and characterization factors (CFs) for
toxicity-related impact categories human toxicity cancer and non-cancer and eco-
toxicity There is an evolving debate on the robustness of these impact categories and
specifically for what concern impacts due to metals (see eg Pizzol et al 2011) In fact
some specific features of the metals (eg essentiality) as well as elements affecting
their fate modelling (eg different conditions affecting their bioavailability) are not fully
captured by currently available models applied in LCA Therefore the authors ran a
sensitivity analysis where updated CFs for metals were tested along the lines of recent
literature (Dong et al 2014) aiming at identifying the different results associated to
metals impact compared to the ILCD method (EC-JRC 2011) based on the USEtox
model (Rosenbaum et al 2008)
26
The total impact obtained by applying Dong et al 2014 CFs resulted about three times
higher than the corresponding obtained by the USEtox model This is mainly due to the
Dong et al 2014 CFs of Copper (Cu) and Zinc (Zn) which are higher than those adopted
in the USEtox model when considering the freshwater archetype proposed in the paper
of Dong as default when the location of the emission is not known
Secondly they tested impact assessment models for resource Models currently available
differ both in the modeling approach in the perspective adopted for assessing the
resources (Dewulf et al 2015) and as consequence in the characterization metric and
factors adopted (Mancini et al 2016) Beyond the potential benefit associated to a mass
based approach to recycling (eg kg of material recycled) there is indeed the need of
understanding to which extent the recycled materials are contributing to the resource
depletion impact categories The authors tested abiotic depletion potential (ADP) (CML
2012) which is focusing on potential depletion based on the ratio between resource
consumption and availability (either considering ultimate reserves in earth crust known
base reserves or economically viable reserves) ILCD model (EC-JRC 2011) which is an
extended version of CML2012 reserve based (based on CML algorithm few other
resources have been added described in Sala et al 2012) EDIP97 (Hauschild and
Wenzel 1998) which is comparing the resource with the deposits economically
exploitable without accounting for current level of consumption EPS2000 (Steen
1999) which assesses the cost (as societyrsquos willingness to pay) of substituting a
substance by an alternative for future generations affected by current level of depletion
Recipe 2008 (Goedkoop et al 2009) which is looking at marginal increase of extraction
cost per kg of extracted resource differentiating it by deposit and assuming a discount
rate over an indefinite timespan the Anthropogenic Abiotic Depletion Potential (AADP
Schneider et al 2011) which is accounting for the potential of resource recycling
assuming urban mining as an additional source of resources The recent update of the
AADP (Schneider et al 2015) was also considered It introduces the concepts of
ultimately extractable reserves represented by the amount available in the upper
earths crust that is ultimately recoverable A new set of CFs were also tested developed
by Mancini et al (2016) aiming at addressing the benefit associated to the recovery of
Critical Raw Materials (CRMs) The characterization model is based on the use and
adaptation to LCA of the supply risk indicators developed by the European Commission
(EC 2014) Three sets of CFs are tested based on different assumptions (1) baseline
option the supply risk factors as such ndash (SR) (2) an exponential function which
magnifies the differences between the CRMs - (SR)^6 (3) the ratio between supply risk
and production data (SRworld mine production in 2011) which reflects the size of the
market giving more importance to the materials used in small amounts in products and
applications like eg specialty metals that are often perceived as critical
The comparison among the different models was first of all made considering the mineral
resources present in the inventory of the case study covered by each of them The ILCD
method is the most comprehensive one with 31 mineral resources included in its model
for the resource depletion category On the contrary the Supply Risk (3) is the one that
covers the minor number of substances (ie 7)
A contribution analysis was also performed (Figure 3) Silver (Ag) gives the main
percentage contribution to the indicator in five models (ie CML 2012 versions b and c
ILCD Supply Risk 3) and EDIP97) Cobalt (Co) is the main contributor in the Supply
Risk (2) Copper (Cu) in the ReCiPe 2008 Palladium (Pd) in the EPS 2000 and AADP
(2015) and Nickel (Ni) in the AADP (2011) In the CML 2012 (a) Tellurium Gold (Au)
and Silver (Ag) are the most important substances whereas Aluminium (Al) Copper
(Cu) and Nickel (Ni) are the main contributors in the case of the Supply Risk (3)
27
Figure 3 Contribution analysis for the resource- related indicator calculated adopting several characterization models (Rigamonti et al 2017)
512 Case study 2 ndash Basket of Products Food sensitivity analysis
comparing different impact assessment methods
This case study is based on the application of different life cycle impact assessment
methods for the evaluation of the environmental impacts associated to food consumption
in Europe A process-based LCA has been performed for a basket of products that
represent the most relevant food product groups selected by importance in mass and
economic value to depict the average consumption for nutrition of EU citizens in 2010
(Notarnicola et al 2017b) The product groups in the basket were pig meat beef
poultry milk cheese butter bread sugar sunflower oil olive oil potatoes oranges
apples mineral water roasted coffee beer pre-prepared dishes For each product group
in the basket an inventory model based on a representative product has been
developed The impact of each representative product was then multiplied by the mass
of products in that product group that is consumed in one year by an average EU citizen
The environmental impact of the average food consumption of a European citizen has
been characterized using ILCD method for the life cycle impact assessment (EC-JRC
2011) The paper by Notarnicola et al (2017) illustrates the details of the process-based
LCA study on the BoP nutrition for EU 27 citizens and presents the results of the
characterisation phase The variability of the results associated to methodological
choices has been already preliminary explored (Castellani et al 2017) The present
report builds on those results and elaborates the interpretation phase (including also
normalisation and weighting) The questions that these analyses help answering are i)
are the products found to have the highest impact sensitive to changes in LCIA elements
(characterisation factors normalization references or the weighting sets) and ii) which
are the most contributing impact categories
This case study will also be used in paragraph 52 53 and 54 as a basis for further
insights on the interpretation of an LCA study
For this specific case the authors performed a sensitivity analysis on the LCIA
characterisation phase using ILCD compared with other two methods the CML-IA v 42
(Guineacutee et al 2002) and the Ecological footprint (EcF) (Wackernagel et al 2005) CML-
IA was chosen because it is widely used in LCA studies and because it adopts a different
28
modelling approach compared to ILCD in several impact categories that could be
relevant for food chains For instance for toxicity-related impact categories CML-IA is
based on USES-LCA model (Van Zelm et al 2009) whereas ILCD is applying USETOX
model (Rosenbaum et al 2008) for eutrophication CML-IA is using RAIN-LCA
(Huijbregts 1999) whereas ILCD is using different models for terrestrial and aquatic
eutrophication (respectively accumulated exceedance by Seppaumllauml et al 2006 and
EUtrend model as applied by Struijis et al 2009) The EF was chosen because it
assesses impacts in terms of direct and indirect land use and has been considered a
method that may complement LCA (Lee et al 2014) although based on an accounting
framework that has been questioned (Giampietro and Saltelli 2014) The version of EcF
method implemented in the study is the one already adapted to LCA and provided
within the SimaPro 805 software package (Pregrave Consultants 2015)
The three methods are mostly convergent in the identification of the product groups to
be considered hotspots within the BoP nutrition ie within the food consumption of the
European citizens ILCD and CML-IA identify a wider range of hotspots compared to EcF
mainly because they cover a wider range of impact categories (eg bread and potatoes
do not emerge as hotspot for EcF because their main impacts are in impact categories
not covered by the EcF method)
The product groups that emerge as hotspots in all the methods even if with slightly
different level of contribution are meat and dairy products and beer (as representative
product for alcoholic drinks)
The impact categories for which beer emerge as hotspot are slightly different among the
three methods ozone depletion ionizing radiation and resource depletion in ILCD and
CML-IA photochemical ozone formation in ILCD human toxicity and marine aquatic
ecotoxicity in CML-IA and nuclear energy in EcF The most contributing processes for all
the impact categories listed before is energy (electricity and heat) as already discussed
for ILCD In the case of CML-IA method toxicity-related impacts are mainly due to direct
emissions to air coming from the production process of the packaging glass
513 Conclusions and recommendations
These results reveal that the relative importance of one substance compared to another
changes with the model This is because the models differ in the substances that they
include and in the CFs of each substance It is recommended to run a sensitivity check
with different characterization models to evaluate the robustness of the conclusions
drawn It is also recommended to evaluate the theory underlying the characterization
models chosen to evaluate a certain impact category as this helps understanding the
results obtained
52 Characterization mapped flows and unmapped flows
This section shows two different levels of checks the first one focuses on a comparison
between two different life cycle impact assessment methods (ie ILCD vs CML-IA) based
on Castellani et al (2017) the second one focuses on what are the implications of
uncharacterized flows for a specific impact category (freshwater ecotoxicity) based on
the case study presented in Notarnicola et al (2017b)
521 Comparison between two different methods
A check of the inventoried elementary flows that are not characterized at the LCIA phase
should always be done to support interpretation of results Indeed the comprehensive
translation of the inventory into potential environmental impacts may not occur if some
of the elementary flows are not covered by the chosen characterization models Table 13
reports an example of the total amount of elementary flows that are available in an
inventory but they are not mapped and characterized by the methods considered (ILCD
and CML-IA) as reported in Castellani et al (2017) The authors checked the list of
uncharacterized flows for the inventory of the case study under evaluation and
29
highlighted the most relevant ones either in term of mass or of known environmental
concern The information obtained was then used in support to interpretation For
instance in case the two methods used for characterisation and normalisation give very
different results for one impact category the information about uncharacterized flows
can help to check if this difference is due to a different characterisation of impacts (ie
to a different way of considering the environmental relevance of some elementary flows)
or if it is affected by the fact that some flows (eg some emissions) are not taken into
account by one of the methods
This may occur also due to improper nomenclature of the elementary flows which may
cause a mismatch between the elementary flows listed in the inventory and the
elementary flows to which a characterization factor is available for example the
inventory may report CaCO3 while the characterization model may provide a CF for
calcite This mismatch would prevent the characterization of CaCO3
Table 13 Example of check of inventoried elementary flows that are not characterized by two impact assessment methods (based on Castellani et al 2017)
Flows Total elementary flows not characterized
Typologies of flows
Details on the elementary flows not characterized
ILCD CML-IA
ILCD CML-IA
Nr flows Amount Unit Nr flows
Amount Unit
raw materials
97 510 metals and minerals
47 795 kg 47 863 kg
water flows 25 126 m3 300 3825 m
3
Energy 0 0 MJ 12 18964 MJ
land use 11 001 m2 (or
m2a)
117 12898 m2 (or
m2a)
others 14 na mixed 34 na mixed
emissions to soil
83 227 pesticides to soil
45 0003 kg 173 008 kg
others 38 08 kg 54 41 kg
emissions to water
167 310 radioactive substances
42 119E+03 Bq 61 385E+06 Bq
metals and inorganics compounds
34 28 kg 36 28 kg
others 91 na mixed 213 na mixed
emissions to air
179 286 radioactive substances
49 899E+04 Bq 73 973E+07 Bq
metal and inorganics compounds
65 007 kg 56 0044 kg
pesticides 7 580E-08 kg 32 93 kg
others 70 na mixed 125 na mixed
waste flows 17 17 waste 17 3784 kg 17 3784 kg
Overall number of elementary flows not characterized
543 1350
In order to assess which elementary flows available in the inventory were not accounted
during the characterization the authors performed an analysis of the elementary flows
not characterized when using ILCD and CML-IA methods In total the model of the
basket includes 1730 elementary flows The ILCD method is not able to cover 543 of
these elementary flow as emission into air water soil or resource used whereas when
CML-IA is used to characterize the inventory 1350 elementary flows out of 1730 are not
30
characterized In Table 1 the list of main typologies of flows is reported Many pesticides
organic chemicals and inorganics are not characterized by the two methods Several
ionizing substances are not characterized as well as elementary flows related to group of
substances (such as AOX PAH BTEX VOC BOD and COD) Missing the CFs means that
it is not possible to estimate the extent to which eg the toxicity-related and ionizing
radiation-related impact categories are underestimated
Apart from the total number of flows covered the main difference between the two LCIA
methods is the ability to assign a characterization factor (CF) to the pesticides included
in the inventory ILCD has no CFs for 45 pesticidesrsquo emission to soil (plus 4 pesticidesrsquo
emissions to air) whereas CML-IA for 173 (plus 32 pesticidesrsquo emissions to air) This
may be the reason why human toxicity impacts appear as relevant in the results of ILCD
characterization (and related normalization and weighting as discussed below) and they
appear as less relevant in the results of CML-IA characterization and related
normalization and weighting
522 Analysis of uncharacterized flows within an impact category Based on the study of Castellani et al (2017) fourteen impact categories (IC)
recommended in PEF are calculated The number of elementary flows (ElFls) by ICs
varies from few flows (eutrophication acidification etc) to thousands (eco and human
toxicity) (see table 14)
For most of the ICs the contributing elementary flows reported in an inventory are well
identified and their inclusion in the calculation of the final score is expected to be done
correctly For climate change at mid-point 104 elementary flows with their associated
CFs are derived from the IPCC 2007 report for a 100-year period
However for impact categories like toxicity the number of elementary flows contributing
to the impact can be very important making possible the omission of some EFs at the
inventory level Additionally a high number of flows reported in the inventory have no
CFs If the number of un-characterized flows is too high this can lead to a non-robust
interpretation of the LCIA results
Table 12 shows the number of elementary flows with associated a CF (ie the single
chemical) and the amount of elementary flows with a CF per different compartment (eg
the single chemical in each compartment and sub-compartment)
Table 14 List of impact categories listed in ILCD with total number of elementary flows contributing to each IC
Impact Category ElFl with CFs (all emission compartments)
Unique ElFls with CFs (single chemical flows)
Climate change 104 102
Ozone Depletion 23 23
Human toxicity non cancer 3434 442 (USEtox 419 org+18 metals)
Human toxicity cancer 4734 607 (USEtox 596 org +8 metals)
Particulate matter 46 24
Ionizing radiation Human Health 50 29
Photochemical ozone formation 133 133
Acidification 7 7
Terrestrial eutrophication 7 7
Freshwater eutrophication 10 5
Freshwater ecotoxicity 15636 2526 (USEtox 2498 org +21 metals)
Land use 206 206
Water source depletion 1180 1180
Mineral fossil use amp Resource depletion
181 181
Marine eutrophication 14 11
Additional IC not used in PEF
Ionizing radiation Ecosystem (interim) 62 15
31
The potential impact of un-mapped (or uncharacterized) flows is illustrated via a case
study focusing the freshwater aquatic toxicity impact category using a recent modelling
of 17 food products (Notarnicola 2017b)
For a high proportion of the total mass of un-characterized ElFls the impact on the final
IC scores is null As a matter of fact 9998 of the 1887 kg ElFls emitted to the air are
made of air oxygen and hydrogen Only 033 kg (but still 199 flows) are actual made of
other type of chemicals 80 of those 033 kg are nitrogen type of chemicals 74
hydrogen chloride 12 sulphate etc (table 15) However regarding the ElFls to soil
and water the mass and number of un-characterized flow could have a significant
impact on the final score
Table 15 Type of chemicals (mass and number of EFs) not characterized per emission compartment (air oxygen and hydrogen have been excluded)
Compartments Group of chemicals Mass (g) Number of ElFl
Air
Total air 330 122
N-related 238662 2
inorganicsalt 74637 44
organic 5693 36
S - related 3896 1
metalmineral 3793 17
Alkenes 1530 2
Benzene Toluene Ethylbenzene and Xylene) unspecified ratio 0488 1
ozone 0314 1
P-related 0304 4
ionising 0261 4
Aldehydes 0213 1
Terpenes 0102 1
PAH 0034 1
Pesticide 0000 6
Acid 0000 1
Soil
Total soil 800 68
metalmineral 328315 15
inorganic 320234 4
oils 93496 3
organic 48702 2
Pesticide 5873 39
S - related 3777 2
N-related 0000 2
PAH 0000 1
Water
Total water 13871 112
inorganicsalt 7549785 22
TOC water 2840410 4
metalmineral 1998366 13
Suspended solid 1257655 6
inorganic 108851 6
organic 107546 37
AOX 2390 1
Acid 2032 2
S - related 2008 5
VOC 0643 1
32
N-related 0511 3
Propylene 0244 1
oils 0079 2
PAH 0055 2
Sodium Hydroxide 0054 1
Salt unspecified 0015 1
Hypochlorite 0013 1
ionising 0002 2
VOC 0001 1
P- related 0000 1
Looking at the results of the freshwater aquatic toxicity impact categories for all 17 food
products 90 of the impact category is driven by 10 out of 734 elementary flows that
represents only 14 of the mass of chemicals entering the aquatic environment (table
16) Furthermore it can be seen that
57 of the toxicity score are due to 3 metals representing 01 kg of the mass
However there are still more than 2 kg of un-characterized metalsminerals in
the inventory list (see table 15)
33 of the impact are due 10 pesticides (35 g) although there are still 39 un-
characterized pesticides in the inventory list (representing 5 g) (see table 15)
Table 16 Most relevant elementary flows contributing cumulatively up to 90 to the freshwater ecotoxicity impact category with USEtox
Substance Chemical
class Emission
Compartment Sub-compartment
Total impact (CTUe)
impact versus Total
Cumulated
impact Mass (kg)
Zinc metal Soil agricultural 931 21 21 00441
Copper metal Soil agricultural 902 21 42 00429
Chlorpyrifos pesticide Soil agricultural 833 19 61 00079
Copper metal Soil
351 8 69 00120
Zinc metal Water
139 3 72 00036
Folpet pesticide Soil agricultural 134 3 75 00004
Chlorothalonil pesticide Soil agricultural 111 3 78 00019
Chromium metal Water
105 2 80 00020
Cyfluthrin pesticide Soil agricultural 85 2 82 00001
Isoproturon pesticide Soil agricultural 81 2 84 00086
Cypermethrin pesticide Soil agricultural 70 2 85 00010
Chromium metal Soil agricultural 51 1 87 00019
Prochloraz pesticide Soil agricultural 45 1 88 00024
Captan pesticide Soil agricultural 39 1 88 00039
Alachlor pesticide Soil agricultural 38 1 89 00041
Metolachlor pesticide Soil agricultural 30 1 90 00050
Among the non-characterized elementary flows in relation to freshwater ecotoxicity it
can be observed
it is not known to which extent some of the chemicals may contribute to the IC
a number unspecified chemicals such as lsquoTotal organic matterrsquo (TOC BOD
CODhellip) PAH VOC that could contribute significantly to the overall score Since
the quantity of those ElFl can change significantly between products a default CF
could be proposed for those flow
some chemicals are known to be contributing to toxicity like pesticides and
metals still there are significant proportions that are not characterized
33
Although it is not possible to conclude if those un-characterized flows would have
changed the total score significantly based on the mass and number of known-
contributing class of chemicals (metals and pesticides) it is highly recommended that a
quantification of the uncharacterized chemicals is reported for the freshwater toxicity
impact category before drawing final conclusions
523 Conclusions and recommendations
Results of the LCIA phase can be highly affected by the characterization model chosen
as shown in chapter 51 Furthermore the evaluation of uncharacterized elementary
flows is of primary importance to assess the completeness of the LCIA coverage of the
identified LCI flows Indeed a high number of elementary flows inventoried might be
non-characterized by the chosen models even if their relevance in the assessed impact
categories could be of primary importance Therefore it is highly recommended that a
quantification of the uncharacterized elementary flows is reported before any
interpretation or conclusion is performed on the superiority of one product versus
another
53 Normalization sensitivity analysis
As for the characterisation phase also the choice of the normalisation reference set can
highly influence results Castellani et al (2017) have done a sensitivity analysis based on
the case study of a basket of product on food (see paragraph 512 for further details)
The authors report that as an optional step normalisation and weighting could be
applied to characterized LCA results to support the identification of the most important
impact categories Given that several sets of normalisation and weighting are available
the authors tested some of them in addition to the ILCD baseline with the aim of
assessing the sensitivity of the results to the choice of particular geographical and
temporal reference systems (ie normalization using EU or global scales) as well as
perspectives (ie weighting) This was investigated by selecting 3 sets of ILCD-compliant
normalization references (Benini et al 2014 Benini et al 2015 Laurent et al 2013)
and 2 sets of CML-IA compliant normalization references (EU 25+3 year 2000 and
World year 2000 - Guineacutee et al 2002) -reported in Table 17 In this section the
findings of the authors regarding normalisation will be discussed while the findings on
weighting will be discussed in section 54
Table 17 Summary of normalization sets used in the sensitivity analysis in Castellani et al (2016)
ILCD Impact Category Unit EC-JRC EU27
(2010) per person
a
EC-JRC Global (2010 or 2013)
per personb
PROSUITE Global (2010 or
2000) per person
c
Climate change kg CO2 eq 922E+03 707E+03 810E+03
Ozone depletion kg CFC-11 eq 216E-02 122E-02 414E-02
Human toxicity cancer effects CTUh 369E-05 124E-05 542E-05
Human toxicity non-cancer effects CTUh 533E-04 155E-04 110E-03
Particulate matterRespiratory inorganics kg PM25 eq 380E+00 507E+00 276E+00
Ionizing radiation human health kBq U
235 eq (to
air) 113E+03 241E+02 133E+03
Photochemical ozone formation human health kg NMVOC eq 317E+01 453E+01 567E+01
Acidification mol H+ eq 473E+01 561E+01 496E+01
Eutrophication terrestrial mol N eq 176E+02 164E+02 115E+02
Eutrophication freshwater kg P eq 148E+00 654E+00 620E-01
Eutrophication marine kg N eq 169E+01 304E+01 938E+00
Land use kg C deficit 748E+04 520E+06 236E+05
Ecotoxicity freshwater CTUe 874E+03 374E+03 665E+02
Resource depletion water m3 water eq 814E+01 689E+01 297E+01
Resource depletion mineral fossils and renewables kg Sb eq 101E-01 193E-01 313E-01
34
An additional analysis was performed to verify which one between normalization and
weighting is the most sensitive step in the identification of the most relevant impact
categories The same weighting sets described before were applied on the results of
normalization obtained using the two ILCD-compliant global normalization reference sets
tested before namely EC-JRC Global (Benini et al 2015) and PROSUITE Global (Laurent
et al 2013)
The contribution of product groups (Table 18) and of impact categories (Table 19) to the
total normalized impact of the BoP nutrition per citizen were analyzed
Table 18 presents a summary of the sensitivity analysis on product group contribution at
the normalization stage comparing the product group hotspots according to ILCD and
CML-IA methods Values are expressed as percentage of the normalized value per citizen
for that product group with respect to the total normalized impact per citizen (total
impact of nutrition in one year for an average EU-27 citizen) Equal weighting among
impact categories is assumed Results at the normalization stage almost confirm the
hotspots identified at the characterization stage meat and dairy products are again
hotspots for all the methods whereas other products that emerged before are
considered less contributing at the normalization stage This means that those products
generate impacts in impact categories that are considered less relevant compared to the
others according to the normalization scheme adopted For instance beer appeared to
be a hotspot for both ILCD and CML-IA at the characterization stage whereas only CML-
IA method identifies it as a hotspot at the normalization stage This happens because the
CML-IA normalization references (EU 25+3 and World) for marine aquatic toxicity -one
of the impact categories for which beer is a hotspot - are relatively low compared to the
ones in other LCIA methods
Table 18 presents a summary of the results of the sensitivity analysis at the
normalization stage comparing the relevance of impact categories according to ILCD
and CML-IA methods Results refer to the entire BoP For each impact category of the
two methods values are expressed as percentage of the normalized value per citizen for
that impact category with respect to the total normalized impact per citizen
Table 18 Results of sensitivity analysis on normalization sets at the European and global scale for ILCD- and CML-IA methods (Castellani et al 2016) The percentages represent the contribution of each product group to the total impacts of the BoP per citizen (reference flow) Equal weighting of impact categories is applied The second column reports the mass of each product group in the basket A color scale is applied to the results in each column (ie product group) from green (lowest contribution) to red (highest contribution)
Quantity in the basket (kgyear)
Share of total BoP
mass
EC-JRC EU27 (2010)
EC-JRC Global (2010
or 2013)
PROSUITE Global (2010
or 2000)
CML EU 25+3 (2000)
CML World (2000)
Mineral water 1050 194 1 1 1 3 3
Beer 698 129 4 4 7 16 21
Coffee 47 06 2 1 5 5 6
Apple 161 30 0 0 1 1 1
Oranges 174 32 1 1 2 1 2
Potatoes 691 130 3 3 3 3 4
Bread 393 73 3 3 3 4 5
Olive oil 53 10 1 0 1 2 3
Sunflower oil 53 10 4 4 5 3 3
Sugar from beet 298 55 3 3 3 2 1
Milk 801 148 9 9 8 7 6
Cheese 150 28 15 16 13 10 9
Butter 36 07 7 8 6 3 2
Meat - beef 137 25 18 17 16 11 10
Meat - pork 410 76 20 20 19 18 13
Meat - poultry 220 42 8 8 8 10 7
Pre-prepared meal
29 05 1 1 1 2 2
35
100 100 100 100 100 100
Table 19 Results of sensitivity analysis on normalization sets at the European and global scale for ILCD and CML-IA methods (Castellani et al 2016) The percentages reflect the relative relevance of impact categories compared to the total impacts of the BoP per citizen (reference flow) A colour scale is applied to the results in each column (ie impact category) from green (lowest contribution) to red (highest contribution)
EC-JRC EU27 (2010)
EC-JRC Global (2010 or 2013)
PROSUITE Global (2010 or 2000)
CML EU 25+3 (2000)
CML World (2000)
Climate change 19 11 13
Global warming (GWP100a) 78 102
Ozone depletion 00 00 00 Ozone layer depletion 02 00
Human toxicity cancer effects
62 83 25
Human toxicity
59 120 Human toxicity non-cancer effects
446 692 127
Particulate matter 26 09 21 -
Ionizing radiation HH 05 11 03 -
Photochemical ozone formation
10 03 03 Photochemical ozone formation
46 21
Acidification 73 286 41 Acidification 272 201
Terrestrial eutrophication 83 40 75
Eutrophication
133 163
Freshwater eutrophication 34 04 48
Marine eutrophication 82 20 87
Freshwater ecotoxicity 58 61 450
Freshwater aquatic ecotoxicity 340 314
- - - -
Marine aquatic ecotoxicity
- - - - Terrestrial ecotoxicity
Land use 23 00 04 -
Water resource depletion 62 33 100 -
Mineral fossil amp ren resource depletion
18 04 04 Abiotic depletion 02 11
Abiotic depletion (fossil fuels) 68 67
100 100 100
100 100
531 Conclusions and recommendations
Different normalisation sets may produce different results in terms of identification of
most relevant impact categories life cycle stages and processes Different reference
systems refer to different situation which can all be valid depending eg on the
geographical scope of the study It is recommended to evaluate different normalisation
tests which fit the study at hand to support the conclusions drawn with the baseline
scenario or to provide additional insights
54 Weighting sensitivity analysis
Castellani et al (2016) investigated only for ILCD-compliant normalization sets in
addition to equal weighting 8 ILCD-compliant weighting sets (reported in Table 20) were
tested The different sets were selected aiming at covering several perspectives on
weighting namely distance to target for EU policies considering binding and non-
binding target at 2020 (Castellani et al 2017) a previous distance to target set (EDIP)
36
for Europe for 2005 (Stranddorf et al 2005) two sets considering planetary boundaries
(Tuomisto et al 2012 Bjoslashrn and Hauschild 20158) a set which gives relevance to
midpoint indicators based on their contribution to impact at the endpoint (Ponsioen and
Goedkoop 2015) a set resulting from the combination of different panel-based
approaches (Huppes et al 2012)
When needed available weighting sets have been adapted to ILCD impact categories
The majority of these weighting sets build on normalization factors that are specific of a
geographic scale Tuomisto et al (2012) calculated planetary boundaries at global scale
whereas and Bjoslashrn and Hauschild (2015) did it for both global and European scales
Huppes et al (2012) adopted a panel-based approach with no specific geographic
representativeness whereas all the other weighting sets used in this work have been
originally developed or adjusted for applications at the targeting the European scale
The use of EU27-consistent weighting sets in combination with global normalization
factors may lead to inconsistencies therefore the results have to be interpreted in the
light of this inconsistency In this work the normalized and weighted results are
calculated and presented anyway for all combinations so to show the effect of the
selection of weighting available for practitioners rather than focussing on the (in-
)consistency of their joint use with normalization factors The performed analysis
quantified the relative contribution by impact category to the overall impacts associated
with the BoP as well as the contribution by each of the products The effects of the
different weighting sets tested on the results of the BoP normalized to EC-JRC EU27
normalization references are presented in Table 21 and Table 22
Table 20 Summary of weighting sets used in the sensitivity analysis by Castellani et al (2016)
Distance to target Damage oriented Panel-
based
Policy targets Planetary boundaries Mid-to-
endpoint
Castellani et al 2016
WFsA
Castellani et al 2016
WFsB
EDIP 2003 (Stranddo
rf et al 2005)
Tuomisto et al 2012
Bjoslashrn amp Hauschild
- European
2015
Bjoslashrn amp Hauschi
ld ndash Global 2015
Ponsioen amp
Goedkoop 2016
Huppes et al 2012
ILCD Impact Category dimensionless ()
Climate change 71 54 2 10 25 26 44 232
Ozone depletion 64 49 87 8 1 2 0 36
Human toxicity cancer effects 69 52 2 na na na 1 65
Human toxicity non-cancer effects
62 47 2 na na na
4 41
Particulate matterRespiratory inorganics
74 56 na na na na
8 66
Ionizing radiation human health
61 46 na na na na
0 65
Photochemical ozone formation human health
78 59 2 na
34 48
0 54
Acidification 72 55 2 8 1 1 0 42
Eutrophication terrestrial 70 53 2 28 1 0 0 23
Eutrophication freshwater 62 47 1 7 9 2 0 23
Eutrophication marine 69 52 2 28 1 1 0 23
Land use 64 53 na 6 25 16 19 102
Ecotoxicity freshwater 61 51 0 na 2 0 0 109
Resource depletion water 61 296 na 5 1 4 3 51
Resource depletion mineral fossils and renewables
61 30 0 na na
na 19 69
8 Bjoslashrn and Hauschild provided to the authors of this report a modified version to be used as weighting method
in compliance with EU27 ILCD normalization factors Global weighting factors were calculated directly from global normalization factors published by Bjoslashrn and Hauschild 2015
37
The contribution of specific products to the overall impacts associated to the BoP
nutrition is very similar when using several weighting sets in combination with
normalization references EU27 (Table 21) In fact for all the weighting sets tested pork
meat and beef meat are the highest contributor to the impacts (varying between 15
and 22) According to all sets cheese is the 3rd largest contributor (14 on average)
whereas milk and poultry meat are most frequently identified as 4th and 5th largest
contributors (roughly 8 each) On average these product groups account for roughly
70 of the total impacts Apples olive oil and pre-prepared meals are those contributing
the less followed by mineral water and oranges On average their cumulative
contribution is around 5
Table 21 Product groups contribution Results of several ILCD-compliant weighting sets in combination with normalization references EU27 (Castellani et al 2016) A color scale is applied to the results in each column (ie product group) from green (lowest contribution) to red (highest contribution)
PRODUCT GROUPS CONTRIBUTION
Quantity in the basket (kgyear)
Share of total BoP mass
Equal
weighting
Castellani et al (2016) WFsA
Castellani et
al (2016) WFsB
EDIP2003
9
Tuomisto et
al (2012)
BjornampHausch
ild (2015)
ndash Europe
an
BjornampHausch
ild (2015)
ndash global
Ponsioen and
Goodkoep
(2016)
Huppes et al (2012)
Mineral water 105 1940 1 1 3 1 1 1 2 1 1
Beer 66 cL 698 1290 4 4 4 4 3 8 8 7 5
Coffee 47 060 2 2 2 1 2 6 5 3 2
Apple 161 300 0 0 1 0 0 1 1 1 1
Oranges 174 320 1 1 3 0 1 2 2 1 1
Potato 691 1300 3 3 4 3 2 3 3 4 3
Bread 393 730 3 3 3 4 3 3 3 3 3
Olive oil 53 100 1 1 1 0 1 1 1 1 1
Sunflower oil 53 100 4 4 4 4 3 4 4 4 4
Sugar from beet 298 550 3 3 4 3 4 2 3 3 3
Milk 801 1480 9 9 8 9 8 8 8 8 8
Cheese 15 280 15 15 16 15 13 12 13 14 14
Butter 36 070 7 7 6 8 6 5 5 7 7
Meat - beef 137 250 18 18 17 18 22 15 16 16 17
Meat - pork 41 760 20 20 16 21 21 19 17 18 19
Meat - poultry 22 420 8 8 7 8 9 8 8 8 8
Pre-prepared meal 29 050 1 1 1 1 1 1 1 1 1
100
100 100 100 100 100 100 100 100
100
9 (based on Stranddorf et al 2005)
38
Conversely the identification of the most relevant impact categories contributing to the
overall impact of the entire BoP nutrition presents huge discrepancies when applying
different weighting sets (Table 22) This is due to the intrinsic differences among the
weighting sets which build on different perspectives and attribute different weights to
the impact categories
Table 22 Relevance of the different impact category Results of the application of several ILCD-compliant weighting sets in combination with normalization references EU27 (Castellani et al 2016) A color scale is applied to the results in each column (ie impact category) from green (lowest contribution) to red (highest contribution)
CONTRIBUTION ANALYSIS
1-1-1
Castellani et al (2016) WFsA
Castellani et al (2016) WFsB
EDIP2003 (based on Stranddorf et al 2005)
Tuomisto et al (2012)
Bjoslashrn amp Hauschild (2015)
Bjoslashrn amp Hauschild (2015) - global
Ponsioen amp
Goedkoop (2015)
Huppes et al (2012)
Climate change 19 20 15 2 32 214 260 204 87
Ozone depletion 00 00 00 2 00 00 00 00 00
Human toxicity cancer effects
62 66 50 7 na na na 22 81
Human toxicity non-cancer effects
446
425 323 53 na na na 477 363
Particulate matterRespiratory inorganics
26 30 23 na na na na 51 34
Ionizing radiation human health
05 05 04 na na na na 00 07
Photochemical ozone formation human health
10 12 09 1 00 162 263 00 11
Acidification 73 81 61 9 101 47 42 03 61
Eutrophication terrestrial
83 89 67 10 379 31 18 00 39
Eutrophication freshwater
34 32 25 3 37 134 43 00 16
Eutrophication marine
82 87 66 11 374 55 44 00 38
Land use 23 22 19 na 23 257 188 106 46
Ecotoxicity freshwater
58 55 46 0 na 60 04 00 127
Resource depletion water
62 59 284 na 53 39 137 49 63
Resource depletion mineral fossils and renewables
18 17 09 0 na na na 86 25
TOTAL 100 100 100 100 100 100 100 100 100
The discrepancies in the results suggest that it is important to acknowledge that
different perspectives lead to different results Moreover it is relatively straightforward
to identify the product groups impacting the most as from Table 21 when keeping
constant normalization references although varying weighing sets
The authors also checked the most sensitive element between normalization and
weighting their findings indicate normalization as the most sensitive choice if compared
39
to the selection of a specific weighting set among those considered in their work
However this result may change in case weighting methods building on different
approaches are added to the ones included in their work Nevertheless the ranking of
products is not significantly affected by changing normalization reference (eg from
ILCD EU27 to ILCD Global ndash Laurent et al 2013) This might be due to few impact
categories driving the results regardless of the normalization and weighting methods
selected or to the fact that all impact categories are strongly correlated
541 Conclusions and recommendations Weighting sets are often dependent on different value choices to assign different weights
to all impact categories Therefore different weighting sets lead to significant differences
of the final conclusions It is recommended that the decision about inclusion of which
weighting set to use has been made and documented in the first scope definition and
shall not be changed later during the study
40
6 Estimation of uncertainty
Evaluation of the uncertainty of an LCA study is a step which involves both the LCI and
LCIA phase therefore it is strictly linked to the content of the previous chapters
Uncertainty in LCA can be defined in different ways (Ciroth et al 2016) For examples it
can be meant as describing the variability of the LCA data to determine the significance
of the indicator results being ldquothe estimated amount or percentage by which an
observed or calculated value may differ from the true valuerdquo (Skone 2000) ISO 14044
defines uncertainty analysis as systematic procedure to quantify the uncertainty
introduced in the results of a life cycle inventory analysis due to the cumulative effects of
model imprecision input uncertainty and data variability
The estimation of uncertainty serves three main purposes
it supports a better understanding of the results obtained
it supports the iterative improvement of an LCA study
it also helps the target audience to assess the robustness and applicability of the
study results
The PEF Guide identifies two key sources of uncertainty in PEF studies
1 Stochastic uncertainties for the inventory data
they refer to statistical descriptions of variance around a meanaverage For
normally distributed data this variance is typically described in terms of an
average and standard deviation
2 Choice-related uncertainties
They arise from methodological choices including modelling principles system
boundaries allocation choices choice of impact assessment methods and other
assumptions related to time technology geographical aspects etc These are not
amenable to statistical description but rather can only be characterized via
scenario model assessments
In this report we refer to uncertainty analysis to describe the range of likely outcomes
based on a set of inputs and it differs from a sensitivity analysis which is linked to how
sensitive the results are to a change in an input parameter (see previous chapters)
It has to be kept in mind that all steps involved in a quantitative process are affected by
uncertainties Therefore it is important that the uncertainty is assessed
- At inventory level (eg standard deviation associated to a data point) An
example on how to assess the uncertainty at inventory level was recently
provided by Ciroth et al (2016)
- At characterization level (eg linked to characterization factors)
- At normalisation level (eg linked to normalisation factors)
- At weighting level (eg linked to weighting factors)
611 Conclusions and recommendations It is recommended that the overall uncertainty of an LCA study is estimated and
reported in the final report It is also recommended to include an evaluation to which
extent the uncertainties identified affect the final conclusions
41
7 Meta-analysis
The widespread development of LCA in the last decades as a decision supporting tool
leads to a huge amount of LCA studies in literature concerning all kind of goods and
services (ldquoproductsrdquo) When trying to make sense of their results that sometimes are
very different or come up with a conclusion techniques to combine or re-analyze them
are needed such as meta-analysis
Zumsteg et al (2012) described the key factors for conducting and reporting systematic
reviews including meta-analyses10 in LCA Those key factors are simplified in a check
list 1 Review title keywords and abstract 2 Rationale for the review 3 Review
question and objectives 4 Description of review protocol 5 Findings and features of
the individual studies in the review 6 Assessment of bias 7 Synthesis methods
(qualitative and quantitative) 8 Limitations of the review and 9 Summary of findings
and conclusions
This chapter is not intended to give guidelines on how to perform a systematic review or
a meta-analysis but to highlight the critical points that the practitioner should take into
account when collecting and using the LCA data Recalling the check list previously
described it is in the findings and features of the individual studies where one of the
biggest shortcomings when performing a meta-analysis concerning LCA studies is found
Assembling data from the individual studies is complex due to
the existing ldquoflexiblerdquo guidance in conducting LCA that leads to different
assumptions and methodological choices made in the various LCA modelling
exercises The ISO 14040 and 14044 standards provide the framework for LCA
This framework however leaves the individual practitioner with a range of
choices which can affect the legitimacy of the results of an LCA study
the lack of homogeneity reporting LCA results
As found in De Matos et al (2015) while doing a meta-analysis of different bioeconomy
value chains the most influencing differences among studies mainly relate to
The definition of the system boundaries and the stages included in the
study (eg even if the same general system boundaries are considered -
eg cradle to gate - some studies may or may not include intermediate
transport construction and decommissioning of buildings etc)
The impact assessment methods used as different methods may
consider for example different substances for a given impact category
and different characterization factors for the same substance
The definition of the functional unit (eg as the input the output
product the agricultural land unit etc) (Cherubini and Stromman
2011)
The consideration of direct and indirect land use change (dLUC and iLUC
respectively) (Cherubini and Stromman 2011)
The technology considered in the process and its maturity level
The approach used to model the multifunctional system For instance if
substitution is used the reference system selected may have a
significant influence on the final LCA results On the other hand if
allocation is used the selection of the allocation criteria and the relative
10 The definition of Meta-analysis given by Zumsteg et al (2012) is ldquoA melding of data from multiple studies usually involving additional mathematical analysis with the goal of utilizing this synergy of information and data size to answer questions that cannot be answered by existing individual studies or to improve the certainty or impact of know findings by increasing the sample
size Meta-analyses are often performed as part of a systematic reviewrdquo
42
contribution of each co-product may considerably influence the results of
the assessment
These points are in line with those reported in other studies in literature Wolf et al
(2015) conducted a meta-analysis of LCAs for wood energy services (heat power and
combined heat and power (CHP)) and chose a set of ldquodecisive parametersrdquo to be
analyzed arguing that those factors promote inconsistent findings along LCA studies
Apart from the previously mentioned the authors include the following factors (some of
them specific of the good or service under study)
Data sources such as empirical data literature well-known databases
unspecified databases simulators or expert interviews are some of
them
Transportation distances and types
Feedstock properties (in this case wood)
Combustion capacity and efficiency and co-combustion rates
Energy service provided (power heat and CHP)
Schreiber et al (2012) performed a meta-analysis on LCA studies of electricity
generation with carbon capture and storage (CCS) comprising the three main CCS
technologies (post-combustion oxyfuel and pre-combustion) In line with previous
studies they highlighted the different choices in the LCA methodology and parameters
(specific of the good or service under study) that heavily impact the overall results Here
we report those which differ from the already mentioned
Data quality and availability
Time horizon as most studies considered present and future power
plants as far as 2050
Spatial representation ndash some elements in the CCS process chain are
highly site-specific such as storage sites
Life cycle inventory (LCI) ndash which inputs and outputs are considered
Operational valuation and weighting methods
Power plant efficiency and energy penalty of the capture process
Carbon dioxide capture efficiency and purity
Fuel origin and composition
Moreover when having a look at the limitations of the review and meta-analysis some
studies just focus on GHG emissions Wolf et al (2015) set the CML midpoint impact
category Global Warming as the basis for the comparison of results because it is
represented in 100 of the studies They did not consider other less-frequent impact
categories but yet important such as acidification eutrophication and particulate
matter owing to the lack of results published in the studies On the other hand
Schreiber et al (2012) not only focused on GHG but they included other impacts such
as acidification potential eutrophication potential photochemical ozone creation
potential and cumulative energy demand
As a conclusion increased harmonization and transparency in the calculation and
reporting of LCA data and results is needed (Cristobal et al 2015)
711 Conclusions and recommendations
The number of LCA studies available is increasing and making sense of all the results
that can be obtained from them is a difficult task As a conclusion increased
harmonization and transparency in the calculation of LCA data and results is needed It
is recommended that reporting of LCA data is done in a more consistent and harmonized
43
manner to allow users of LCA study a better understanding of the results and
conclusions drawn
8 Conclusion
One of the key aims of LCA is to provide the decision makers with comprehensive and
understandable information this task is achieved by a proper interpretation of the
results of an LCA study
This report builds on the requirements provided in relevant international standards (ISO
14044) and guides (ILCD Handbook (EC-JRC 2011a) PEF Guide (EC 2013b) and it
proposes a practical approach on how to perform a robust interpretation of an LCA
study It provides a ready-to-use approach for the identification of significant issues and
it includes examples of completeness sensitivity and consistency checks based on real-
case studies which are used to draw the attention of the reader on how to evaluate the
results of an LCA study
The scheme proposed in this report should not be intended as a comprehensive list of
items to check instead it should be seen as a normal workflow that should be carried
out by an LCA practitioner in order to derive robust conclusions out of the LCA study
More accurate and case-specific checks should be done depending on the intended goal
and scope of the study
The report is structured in order to allow a practitioner focus on the two quantitative
phases of LCA the life cycle inventory (LCI) and the life cycle impact assessment (LCIA)
Regarding the LCI the report goes through the analysis of the data sources by giving
examples on how to interpret the system boundaries and the foreground system) it
provides an overview on data quality and it comprises further completeness and
consistency checks (eg cut-off long term emissions anomaly checks)
When analysing the LCIA the report provides insights on sensitivity analysis regarding
characterization normalization and weighting When dealing with characterization the
attention of the reader is drawn also on mapping between the inventory and the
characterization models and a discussion on the evaluation of uncharacterized
elementary flows is also included
Finally an overarching topic such as meta-analysis was deemed useful to be included as
this is often used when there is the need of assessing the state of the art of the LCA
studies on a specific product supply chain Key messages stemming from this report are
as follows
Results reveal that the relative importance of one substance compared to another
changes with the characterization model This is because the models differ in the
substances that they include and in the CFs of each substance It is
recommended to run a sensitivity check with different characterization models to
evaluate the robustness of the conclusions drawn It is also recommended to
evaluate the theory underlying the characterization models chosen to evaluate a
certain impact category as this helps understanding the results obtained Results of the LCIA phase can be highly affected by the characterization model
chosen Furthermore the evaluation of uncharacterized elementary flows is of
primary importance to assess the completeness of the LCIA coverage of the
identified LCI flows Indeed a high number of elementary flows inventoried might
be non-characterized by the chosen models even if their relevance in the
assessed impact categories could be of primary importance Therefore it is highly
recommended that a quantification of the uncharacterized elementary flows is
reported before any interpretation or conclusion is performed on the superiority
of one product versus another Different normalisation sets may produce different results in terms of
identification of most relevant impact categories life cycle stages and processes
Different reference systems refer to different situation which can all be valid
44
depending eg on the geographical scope of the study It is recommended to
evaluate different normalisation tests which fit the study at hand to support the
conclusions drawn with the baseline scenario or to provide additional insights Weighting sets are often dependent on different value choices to assign different
weights to all impact categories Therefore different weighting sets lead to
significant differences of the final conclusions It is recommended that the
decision about inclusion of which weighting set to use has been made and
documented in the first scope definition and shall not be changed later during the
study It is recommended that the overall uncertainty of an LCA study is estimated and
reported in the final report It is also recommended to include an evaluation to
which extent the uncertainties identified affect the final conclusions The number of LCA studies available is increasing and making sense of all the
results that can be obtained from them is a difficult task As a conclusion
increased harmonization and transparency in the calculation of LCA data and
results is needed It is recommended that reporting of LCA data is done in a more
consistent and harmonized manner to allow users of LCA study a better
understanding of the results and conclusions drawn Further aspects such as the appropriateness of the functional unit the intended goal
the system boundaries and value choices should normally be part of an interpretation in
order to identify recommendations and limitations of the study and draw the appropriate
conclusions They are not discussed further in this report but it is recommended that at
least each decision based on a personal or a stakeholderrsquos value shall always be
documented and explained in the conclusions of the LCA study This is consistent with
one of the key aims of LCA which is to provide the decision makers with comprehensive
and understandable information
45
References
Baitz M Makishi Colodel C Kupfer T Florin J Schuller O Kokborg M Koumlhler A
Thylmann D Stof-fregen A Schoumlll S Goumlrke J Rudolf M Gonzalez M (2016) GaBi
Database amp Modelling Principles Thinkstep Leinfelden-Echterdingen
Benini L Mancini L Sala S Manfredi S Schau EM Pant R (2014) Normalization
method and data for Environmental Footprints European Commission Joint
Research Center Institute for Environment and Sustainability Publications Office
of the European Union Luxemburg ISBN 978-92-79-40847-2
Benini L Sala S Pant R (2015) Global normalization factors for ILCD compliant
midpoint impact categories - EC-JRC internal draft report Set of factors available
at httpeplcajrceceuropaeuuploadsTable_ILCD_NFs_08-03-2016xlsx
Biganzoli L Falbo A Forte F Rigamonti L Grosso M (2015) Mass balance and life
cycle assessment of waste electrical and electronic equipment management
system implemented in Lombardia Region (Italy) Science of the Total
Environment 524ndash525 361-375
Bjoslashrn A Hauschild MZ (2015) Introducing carrying capacity-based normalization
in LCA framework and development of references at midpoint level The
International Journal of Life Cycle Assessment 20 (7)1005ndash1018
Blonk Agri-footprint BV (2014) Agri-footprint Methodology and basic principles -
Version 10
Brentrup F Kusters J Lammel J Kuhlmann H (2000) Methods to estimate on-
field nitrogen emissions from crop production as an input to LCA studies in the
agricultural sector The International Journal of Life Cycle Assessment 5 349ndash
357
Castellani V Benini L Sala S Pant R (2016) A distance-to-target weighting
method for Europe 2020 The International Journal of Life Cycle Assessment
21(8)1159-1169
Castellani V Sala S Benini L (2017) Hotspots analysis and critical interpretation
of food life cycle assessment studies for selecting eco-innovation options and for
policy support Journal of Cleaner Production 140 (2) 556-568
Cellura M Longo S Mistretta M (2011) Sensitivity analysis to quantify
uncertainty in life cycle assessment the case study of an Italian tile Renew Sust
Energ Rev 15(9)4697-4705
Cherubini F Stromman AH (2011) Life cycle assessment of bioenergy
systems state of the art and future challenges Bioresource technology 102 437
ndash 451
Ciroth A Muller S Weidema B Lesage P (2016) Empirically based uncertainty
factors for the pedigree matrix in ecoinvent The International Journal of Life
Cycle Assessment 21 1338-1348
CML (2002) CML-IA model and characterisation factors Available from
httpswwwuniversiteitleidennlenresearchresearch-outputsciencecml-ia-
characterisation-factors Accessed November 2015
Colomb V Ait-Amar S Basset-Mens C Dolleacute JB Koch P Lellahi A Mousset J
Salou T Tailleur A van der Werf HMG (2015) AGRIBALYSE Assessment and
lessons for the future Version 12
Corrado S Zampori L Castellani V Sala S (2017) Systematic analysis of
secondary Life Cycle Inventories when modelling agricultural production a case
study for arable crops Journal of Cleaner Production (under review)
46
Cristobal J De Matos CT Aurambout JP Manfredi S Kavalov B (2015)
Environmental sustainability assessment of bioeconomy value chains Biomass
and bioenergy 89 159 ndash 171
De Matos CT Cristobal J Aurambout JP (2015) Environmental sustainability
assessment of bioeconomy products and processes ndash progress report 1 European
Commission Report EUR 27356 EN
De Schryver A Galatola M (2016) Guidance for modelling agricultural processes
TAB Issue paper v 01 October 2016
Dewulf J Benini L Mancini L Sala S Blengini G A Ardente F Recchioni M Maes
J Pant R Pennington D (2015) Rethinking the Area of Protection lsquoNatural
Resourcesrsquo in Life Cycle Assessmen Environmental Science and Technology 49
(9)5310ndash5317
Dong Y Gandhi N Hauschild MZ (2014) Development of Comparative Toxicity
Potentials of 14 cationic metals in freshwater Chemosphere 112 26-33
Ecoinvent (2016) Allocation cut-off by classification [WWW Document] URL
httpwwwecoinventorgdatabasesystem-models-in-ecoinvent-3cut-off-
system-modelallocation-cut-off-by-classificationhtml (accessed 8916)
European Commission ndash Joint Research Centre (EC-JRC) (2011a) ILCD Handbook
ndash General guide for life cycle assessment ndash Detailed guidance European
Commission Joint Research Centre Institute for Environment and Sustainability
European Commission ndash Joint Research Centre (EC-JRC) (2011b) ILCD Handbook
- Recommendations for Life Cycle Impact Assessment in the European context
European Commission Joint Research Centre Institute for Environment and
Sustainability
European Commission (EC) (2013a) Communication from the Commission to the
EU Parliament and Council ndash Building the Single Market for Green Products ndash
Facilitating better information on the environmental performance of products and
organisations(20130196final)
European Commission (2013b) Commission Recommendation of 9 April 2013 on
the use of common methods to measure and communicate the life cycle
environmental performance of products and organisations (2013179EU) Official
Journal of the European Union Volume 56 4 May 2013
European Commission (2015)ndash Better Regulation Toolbox
httpeceuropaeusmart-regulationguidelinesdocsbr_toolbox_enpdf
European Commission (2016) Product Environmental Footprint Pilot Guidance -
Guidance for the implementation of the EU Product Environmental Footprint (PEF)
during the Environmental Footprint (EF) pilot phase - version 52 (pp 95)
Retrieved from
httpeceuropaeuenvironmenteussdsmgppdfGuidance_productspdf
FAO (2012) FAOstat Agriculture data Food and Agriculture Organization of the
United Nations httpfaostatfaoorg
Gaudreault C Samson R Stuart P (2009) Implications of choices and
interpretation in LCA for multi-criteria process design de-inked pulp capacity and
cogeneration at a paper mill case study J Clean Prod 17(17)1535-1546
Giampietro M Saltelli A (2014) Footprints to nowhere Ecological Indicators 46
610-621
Goedkoop M Heijungs R Huijbregts M de Schryver A Struijs J van Zelm R
(2009) ReCiPe 2008 A life cycle assessment method which comprises
harmonized category indicators at the midpoint and the endpoint level Report I
47
Characterisation Ministry of Housing Spatial Planning and Environment
Amsterdam
Guineacutee JB Gorreacutee M Heijungs R Huppes G Kleijn R de Koning A van Oers L
Wegener Sleeswijk A Suh S Udo de Haes HA de Bruijn H van Duin R
Huijbregts MAJ (2002) Handbook on life cycle assessment Operational guide to
the ISO standards I LCA in perspective IIa Guide IIb Operational annex III
Scientific background Kluwer Academic Publishers ISBN 1-4020-0228-9
Dordrecht 2002 692 pp
Guo M Murphy RJ (2012) LCA data quality sensitivity and uncertainty analysis
Science of the total environment 435230-243
Hauschild MZ Wenzel H (1998) Environmental Assessment of Products Vol 2 ndash
Scientific background Chapman amp Hall UK Kluwer Academic Publishers
Hingham USA
Heijungs R Kleijn R (2001) Numerical approaches towards life cycle
interpretation five examples The International Journal of Life Cycle Assessment
6(3)141-148
Hellweg S Mila i Canals L (2014) Emerging approaches challenges and
opportunities in life cycle assessment Science 344(6188) 1109-1113
Huang Y Spray A Parry T (2013) Sensitivity analysis of methodological choices
in road pavement LCA The International Journal of Life Cycle Assessment
18(1)93-101
Huijbregts MAJ Hellweg S Hertwich E (2011) Do we need a paradigm shift in life
cycle impact assessment Environmental Science and Techonology 45 (9)
38333834
Huijbregts MAJ (1999) Life-cycle impact assessment of acidifying and eutrophying
air pollutants Calculation of equivalency factors with RAINS-LCA Report available
at httpmedialeidenunivnllegacyLife-cycle20impact20assessmentpdf
(accessed April 2016)
Huppes G Van Oers L Pretato U Pennington DW (2012) Weighting
environmental effects Analytic survey with operational evaluation methods and a
meta-method The International Journal of Life Cycle Assessment 17 876ndash891
James K Galatola M (2015) Screening and hotspot analysis procedure to
identify the hotspots and the most relevant contributions (in terms of impact
categories life cycle stages processes and flows) Version 40 24 April 2015
Retrieved from
httpswebgateeceuropaeufpfiswikisdisplayEUENVFPEU+Environmental+F
ootprint+Pilot+Phase accessed November 2016
ISO 14040 (2006a) Environmental managementmdashlife cycle assessmentmdash
principles and framework Geneva Switzerland
ISO 14044 (2006b) ndash Environmental management ndash Life Cycle assessment ndash
Requirements and guidelines
Laurent A Hauschild M Z Golsteijn L Simas M Fontes J Wood R (2013)
Deliverable 52 Normalisation factors for environmental economic and socio-
economic indicators Report prepared within the 7th Framework programme
Project PROSUITE Available at httpwwwprosuiteorgwebguestpublic-
deliverables (accessed December 2015)
Lee SJ Hawkins TR Ingwersen WW Young DM (2014) Exploring the Use of
Ecological Footprint in Life Cycle Impact Assessment Findings from a Comparison
of Transportation Fuels Journal of Industrial ecology 19(3) 416ndash426
48
Mancini L Benini L Sala S (2015) Resource footprint of Europe complementarity
of Material Flow Analysis and Life Cycle Assessment for policy support
Environmental Science and Policy 54367ndash376
Mancini L Benini L Sala S (2016) Characterization of raw materials based on
supply risk indicators for Europe The International Journal of Life Cycle
Assessment 1-13 doi101007s11367-016-1137-2
Nemecek T Baumgartner D (2006) Concerted Action GL-Pro WP4
Environmental Analysis - Final report - Deliverable 43 Available at
httpwwwagroscopeadminchpublikationeneinzelpublikationindexhtmllang
=enampaid=23328amppid=23604
Notarnicola B Sala S Antoacuten A McLaren SJ Saouter E Sonesson U (2017a) The
role of life cycle assessment in supporting sustainable agri-food systems a
review of the challenges Journal of Cleaner Production 140(2)399-409
doi101016jjclepro201606071
Notarnicola B Tassielli G Renzulli PA Castellani V Sala S (2017b) Environmental
impact of food consumption in Europe Journal of Cleaner Production 140(2)
753-765 doi101016jjclepro201606080
Pizzol M Christensen P Schmidt J Thomsen M (2011) Impacts of ldquometalsrdquo on
human health a comparison between nine different methodologies for Life Cycle
Impact Assessment (LCIA) Journal of Cleaner Production 19(6) 646-656
Pizzol M Laurent A Sala S Weidema B Verones F Koffler C (2016)
Normalisation and weighting in life cycle assessment Quo Vadis The
International Journal of LCA 1-14 doi 101007s11367-016-1199-1
Prado-Lopez V Seager TP Chester M Laurin L Bernardo M Tylock S (2014)
Stochastic multi-attribute analysis (SMAA) as an interpretation method for
comparative life-cycle assessment (LCA) Int J Life Cycle Ass 19(2)405-416
Pregrave Consultants (2015) SimaPro Database Manual - Methods library available at
httpswwwpre-sustainabilitycomsimapro-database-and-methods-library
(accessed February 2016)
Ponsioen TC Goedkoop MJ (2016) Midpoint weighting based on endpoint
information Submitted to The International Journal of Life Cycle Assessment
Rigamonti L Falbo A Zampori L Sala S (2017) Supporting a transition towards
sustainable circular economy sensitivity analysis for the interpretation of LCA for
the recovery of electric and electronic waste The International Journal of Life
Cycle Assessment 1-10 doi 101007s11367-016-1231-5
Rosenbaum RK Bachmann TM Gold LS Huijbregts MAJ Jolliet O Juraske R
Koehler A Larsen FH MacLeod M Margni M McKone TE Payet J Schuhmacher
M van de Meent D Hauschild MZ (2008) USEtoxmdashthe UNEP-SETAC toxicity
model recommended characterisation factors for human toxicity and freshwater
ecotoxicity in life cycle impact assessment The International Journal of Life Cycle
Assessment 13(7) 532-546
Sala S Wolf MA Pant R (2012) Characterization factors of the ILCD
Recommended Life Cycle Impact Assessment methods Database and Supporting
Information First edition EUR25167EN ISBN 978-92-79-22727 Luxembourg
Publications Office of the European Union Available at
httpeplcajrceceuropaeuuploads201401LCIA-characterization-factors-of-
the-ILCDpdf
Schau EM Davidsson B (2015) Product Environmental Footprint (PEF) Category
Rules (PEFCR) Pilot Intermediate Paper Product First Draft PEFCR July
2015Accessible for registered stakeholders at
49
httpswebgateeceuropaeufpfiswikisdisplayEUENVFPStakeholder+workspa
ce3A+PEFCR+pilot+Intermediate+paper+product
Schau EM Fet AM (2008) LCA studies of food products as background for
environmental product declarations The International Journal of Life Cycle
Assessment 13(3) 255-264
Schneider L Berger M Finkbeiner M (2011) The anthropogenic stock extended
abiotic depletion potential (AADP) as new parameterization to model the depletion
of resources The International Journal of Life Cycle Assessment 16(9) 929-936
Schneider L Berger M Finkbeiner M (2015) Abiotic resource depletion in LCAmdash
background and update of the anthropogenic stock extended abiotic depletion
potential (AADP) model The International Journal of Life Cycle Assessment
20(5) 709-721
Schreiber A Zapp P and Marx J (2012) Meta-Analysis of Life Cycle Assessment
Studies on Electricity Generation with Carbon Capture and Storage Journal of
Industrial Ecology 16 S155ndashS168
Seppaumllauml J Posch M Johansson M Hettelingh JP (2006) Country-dependent
Characterisation Factors for Acidification and Terrestrial Eutrophication Based on
Accumulated Exceedance as an Impact Category Indicator The International
Journal of Life Cycle Assessment 11(6) 403-416
Skone TJ (2000) What is Life Cycle Interpretation Environmental Progress 19
(2) 92-100
Steen BA (1999) A systematic approach to environmental priority strategies in
product life development (EPS) Version 2000 ndash Models and data of the default
method Chalmers University LindholmenJohanneberg
Stranddorf HK Hoffmann L Schmidt A (2005) Update on Impact Categories
Normalisation and Weighting in LCA - Selected EDIP97-data Environmental
Project Nr 995 Miljoslashprojekt httpwww2mstdkudgivPublications200587-
7614-570-0pdf87-7614-571-9PDF (accessed December 2015)
Tuomisto HL Hodge ID Riordan P Macdonald DW (2012) Exploring a safe
operating approach to weighting in life cycle impact assessment ndash a case study of
organic conventional and integrated farming systems Journal of Cleaner
Production 37147-153
UNEP- SETAC (2016) Hotspots Analysis an Overarching Methodological
Framework Draft document developed for UNEPSETAC Life Cycle Initiative -3
Flagship Project 3a (Phase 2) 11 october 2016 Available at
httpwwwwraporgukcontentprinciples-and-practices-hotspot-analysis
Van Hoof G Vieira M Gausman M Weisbrod A (2013) Indicator selection in life
cycle assessment to enable decision making issues and solutions International
Journal of Life Cycle Assessment 181568-1580
Van Zelm R Huijbregts M A van de Meent D (2009) USES-LCA 20mdasha global
nested multi-media fate exposure and effects model The International Journal
of Life Cycle Assessment 14(3) 282-284
Wackernagel M Monfreda C Moran D Wermer P Goldfinger S Deumling D
Murray M (2005) ―National Footprint and Biocapacity Accounts 2005 The
underlying calculation method Global Footprint Network Oakland California
USA
Weidema B Bauer C Hischier R Mutel C Nemecek T Reinhard J Vadenbo CO
Wernet G (2013) Overview and methodology Data quality guideline for the
ecoinvent database version 3
50
Williams ED Weber CL Hawkins TR (2009) Hybrid Framework for Managing
Uncertainty in Life Cycle Inventories Journal of Industrial Ecology 13 928ndash944
Wolf C Klein D Weber-Blaschke G Richter K (2015) Systematic review and
meta-analysis of life cycle assessment for wood energy services Journal of
Industrial Ecology 20 743 ndash 763
Zumsteg JM Cooper JS Noon MS (2012) Systematic Review Checklist Journal of
Industrial Ecology 16 S12ndashS21
51
List of abbreviations and definitions
AOX adsorbable organic halogens
BOD biochemical oxygen demand
BTEX benzene toluene xylene isomers
CFs characterisation factors
COD chemical oxygen demand
DQR data quality requirements
EcF ecological footprint
EF environmental footprint
ElFl elementary flow
HMs heavy metals
IC impact category
ILCD International Reference Life Cycle Data System
LCA life cycle assessment
LCI life cycle inventory
LCIA life cycle impact assessment
OEFSR organisation environmental footprint sector rules
PAH polycyclic aromatic hydrocarbons
PEF product environmental footprint
PEFCR product environmental footprint sector rules
PPP plant protection products
OEF organisation environmental footprint
TAB technical advisory board
TS technical secretariat
UNEPSETAC LCI Unep Setac Life cycle Initiative
VOC volatile organic compounds
WEEE waste electrical and electronic equipment
52
List of figures
Figure 1 Practical application of requirements in ISO 14044 and ILCD Handbook to
interpret LCI and LCIA results 5
Figure 2 Hotspot analysis in the context of the Environmental Footprint pilot (James amp
Galatola 2015) 8
Figure 3 Contribution analysis for the resource- related indicator calculated adopting
several characterization models (Rigamonti et al 2017) 27
53
List of tables
Table 1 Summary of requirements to define most relevant contributions and hotspots
(James amp Galatola 2015) 11
Table 2 Selection of most relevant Impact Categories (James amp Galatola 2015) 12
Table 3 Selection of most relevant life cycle stages (James amp Galatola 2015) 13
Table 4 Selection of most relevant processes (James amp Galatola 2015) 13
Table 5 Inventory results (climate change results expressed in gCOeq) (James amp
Galatola 2015) 14
Table 6 Most relevant inventory flows contributing to climate change (based on the
inventory results before normalisation and weighting) - overall life cycle (option 1)
(James amp Galatola 2015) 14
Table 7 Most relevant inventory flows contributing to climate change (based on the
inventory results before normalisation and weighting) ndash process level (option 2) (James
amp Galatola 2015) 14
Table 8 Hotspots based on 50 cumulative contribution (OPTION A) (James amp Galatola
2015) 15
Table 9 Hotspots based on top two representatives (OPTION B) (James amp Galatola
2015) 15
Table 10 Underlying assumptions in relation to the three databases considered by the
authors (Corrado et al 2017) 17
Table 11 Data quality rating in an example of intermediate paper products (EC 2013
Schau and Davidsson 2015) 20
Table 12 Data quality rating in an early phase of a PEF study of intermediate packaging
paper 21
Table 13 Example of check of inventoried elementary flows that are not characterized by
two impact assessment methods (based on Castellani et al 2017) 29
Table 14 List of impact categories listed in ILCD with total number of elementary flows
contributing to each IC 30
Table 15 Type of chemicals (mass and number of EFs) not characterized per emission
compartment (air oxygen and hydrogen have been excluded) 31
Table 16 Most relevant elementary flows contributing cumulatively up to 90 to the
freshwater ecotoxicity impact category with USEtox 32
Table 17 Summary of normalization sets used in the sensitivity analysis in Castellani et
al (2016) 33
Table 18 Results of sensitivity analysis on normalization sets at the European and global
scale for ILCD- and CML-IA methods (Castellani et al 2016) The percentages
represent the contribution of each product group to the total impacts of the BoP per
citizen (reference flow) Equal weighting of impact categories is applied The second
column reports the mass of each product group in the basket A color scale is applied to
the results in each column (ie product group) from green (lowest contribution) to red
(highest contribution) 34
Table 19 Results of sensitivity analysis on normalization sets at the European and global
scale for ILCD and CML-IA methods (Castellani et al 2016) The percentages reflect
the relative relevance of impact categories compared to the total impacts of the BoP per
citizen (reference flow) A colour scale is applied to the results in each column (ie
impact category) from green (lowest contribution) to red (highest contribution) 35
54
Table 20 Summary of weighting sets used in the sensitivity analysis by Castellani et al
(2016) 36
Table 21 Product groups contribution Results of several ILCD-compliant weighting sets
in combination with normalization references EU27 (Castellani et al 2016) A color scale
is applied to the results in each column (ie product group) from green (lowest
contribution) to red (highest contribution) 37
Table 22 Relevance of the different impact category Results of the application of several
ILCD-compliant weighting sets in combination with normalization references EU27
(Castellani et al 2016) A color scale is applied to the results in each column (ie
impact category) from green (lowest contribution) to red (highest contribution) 38
Europe Direct is a service to help you find answers
to your questions about the European Union
Freephone number ()
00 800 6 7 8 9 10 11 () The information given is free as are most calls (though some operators phone boxes or hotels may
charge you)
More information on the European Union is available on the internet (httpeuropaeu)
HOW TO OBTAIN EU PUBLICATIONS
Free publications
bull one copy
via EU Bookshop (httpbookshopeuropaeu)
bull more than one copy or postersmaps
from the European Unionrsquos representations (httpeceuropaeurepresent_enhtm) from the delegations in non-EU countries (httpeeaseuropaeudelegationsindex_enhtm) by contacting the Europe Direct service (httpeuropaeueuropedirectindex_enhtm) or calling 00 800 6 7 8 9 10 11 (freephone number from anywhere in the EU) () () The information given is free as are most calls (though some operators phone boxes or hotels may charge you)
Priced publications
bull via EU Bookshop (httpbookshopeuropaeu)
XX-N
A-x
xxxx-E
N-N
doi102788171315
ISBN 978-92-79-64114-5
LB-N
A-2
8266-E
N-N
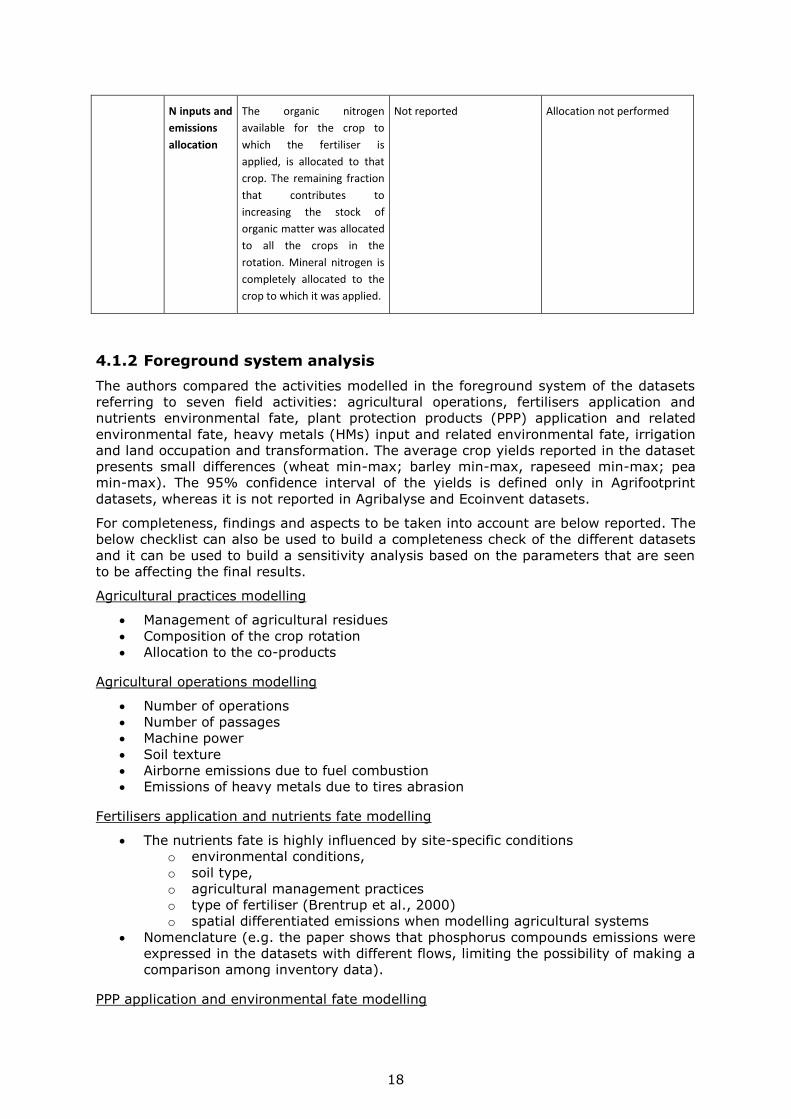
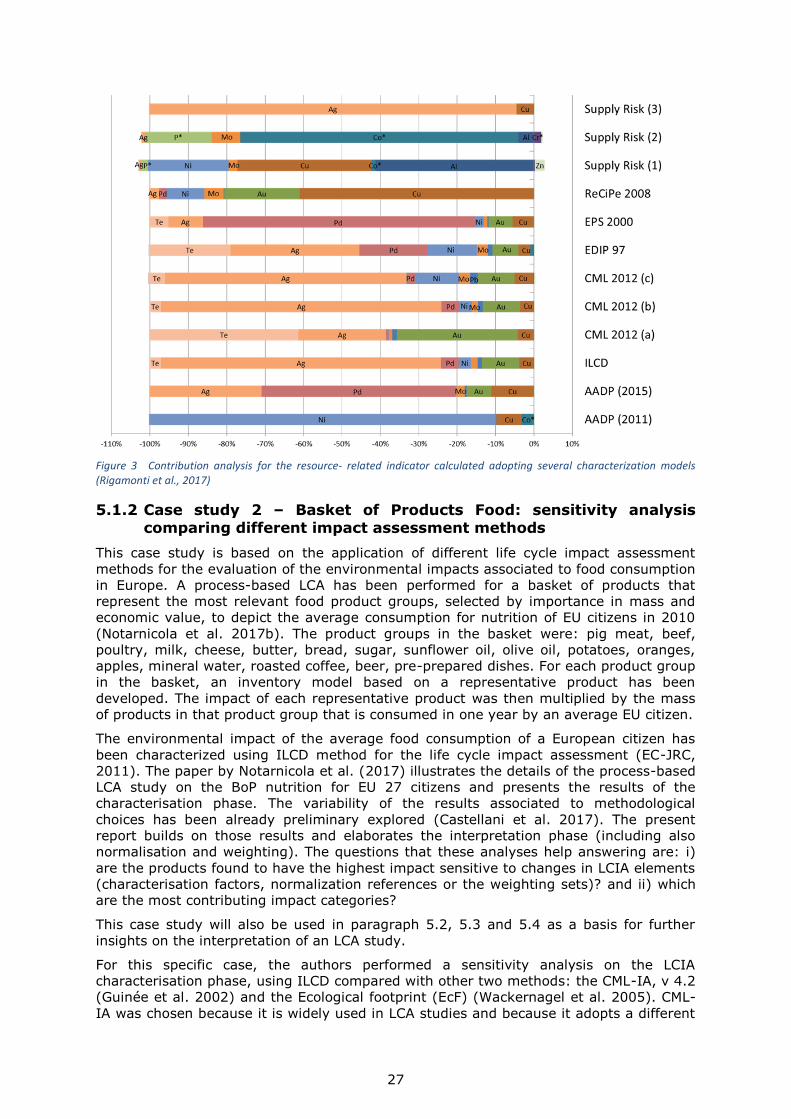

XX-N
A-x
xxxx-E
N-N
doi102788171315
ISBN 978-92-79-64114-5
LB-N
A-2
8266-E
N-N


![[Libro] C lculo. Louis Leithold. Septima Edici¢n.pdf](https://img.pdfslide.us/doc/110x75/577c7e871a28abe054a18ac9/libro-clculo-louis-leithold-septima-edicinpdf.jpg)