Embed Size (px)
Citation preview

EFSA Journal 2016;14(issue):NNNN
Suggested citation: EFSA PPR Panel, 2015. Guidance on the establishment of the residue definition for dietary risk
assessment. EFSA Journal 2016;14(issue):NNNN, 180 pp. doi:10.2903/j.efsa.2016.NNNN
Available online: www.efsa.europa.eu/efsajournal
© European Food Safety Authority, 2016
SCIENTIFIC OPINION
Guidance on the establishment of the residue definition for dietary risk assessment1
EFSA Panel on Plant Protection Products and their Residues (PPR)2, 3
European Food Safety Authority (EFSA), Parma, Italy
ABSTRACT
This guidance is intended to harmonise the process for the establishment of the residue definition for
dietary risk assessment by inclusion/exclusion of residues on the basis of their toxicity and the
potential for exposure in the diet. The guidance provides a practical instrument including a
combination of scientific tools ((Q)SAR, read across, TTC) and criteria for identification of residues
for which hazard identification and characterisation is needed, to characterise pesticide metabolites
and to define compounds that should be included in the residue definition for dietary risk assessment.
It is proposed to make use of all information available, including mechanistic understanding, in order
to support the decision process and to enable the risk assessors to provide the risk manager with
detailed information on toxicity and exposure of every single metabolite as well as on the
uncertainties connected to the proposal. The guidance document is complemented by three practical
case studies which are intended to demonstrate the applicability of the proposed decision scheme.
© European Food Safety Authority, 2016
KEY WORDS
Pesticide, residue definition, dietary risk assessment, (Q)SAR, read across, TTC, metabolite
1 On request from EFSA, Question No EFSA-Q-2013-01001, adopted on DD Month YYYY 2
Panel members: Paulien Adriaanse, Theodorus Brock, Philippe Berny, Sabine Duquesne, Sandro Grilli, Antonio F.
Hernandez-Jerez, Susanne Hougaard Bennekou, Michael Klein, Thomas Kuhl, Ryszard Laskowski Kyriaki Machera,
Colin Ockleford, Olavi Pelkonen, Silvia Pieper, Rob Smith, Michael Stemmer, Ingvar Sundh, Ivana Teodorovic, Tiktak
Aaldrik, Chris J.Topping and Gerrit Wolterink. Correspondence: [email protected] 3 Acknowledgement: The Panel wishes to thank the members of the Working Group on preparation of a guidance on the
establishment of the residue definition for dietary risk assessment: Susanne Hougaard Bennekou, Metka Filipic (until June
2015), Alberto Mantovani (until June 2015), Thomas Kuhl, Bernadette Ossendorp (until October 2015) and Gerrit
Wolterink for the preparatory work on this scientific opinion and, the hearing experts: Bruno Urbain and Andrew Worth,
and EFSA staff: Anja Friel, Juan Parra Morte, Rositsa Serafimova, Andrea Terron and Gabriele Zancanaro for the support
provided to this scientific opinion.

Establishment of the residue definition for dietary risk assessment
EFSA Journal 2016;14(issue):NNNN 2
SUMMARY
The European Food Safety Authority (EFSA) asked the Panel on Plant Protection Products and their
Residues (PPR Panel) to prepare Guidance on the establishment of the residue definition to be used
for dietary risk assessment.
This guidance should consist of a stepwise method helping the risk assessor, on the basis of factual
information (derived from toxicological data, metabolism data) and non-testing methods, by weight of
evidence, to:
conclude for which of the terminal residues4 of a pesticide on food and feed commodities a
hazard identification and characterisation is needed;
perform such a hazard identification and characterisation
define the compounds present as terminal residues that should be included in the residue
definition for risk assessment.
This guidance document aims at satisfying the needs of modern residue assessments and at
harmonising the setting of residue definitions between active substances. It is the intention to guide
the assessment per se rather than providing a simple decision scheme. Specifically it is proposed to
make use of and apply weighing of all information available, including mechanistic evidence, in order
to support an informed and transparent decision process and to enable the risk assessors to provide the
risk manager with detailed information on toxicity and exposure of every single metabolite as well as
on the uncertainties connected to a proposed residue definition.
The procedure of derivation of the residue definition for dietary risk assessment is a screening
exercise, where the relevance of all individual metabolites or groups thereof is thoroughly assessed in
a stepwise approach, starting with the compilation of an inventory of metabolites and the assessment
of their genotoxicity endpoints (Module 1), followed by the assessment of other regulatory endpoints
of toxicity (termed general toxicity; Module 2). For every single metabolite, this screening generates
an inventory of toxicity and dietary exposure information for consumers and livestock. The exposure
information includes sources and types of exposure, relevance of a particular exposure path and
exposure from groundwater used as drinking water All together the hazard and exposure information
forms the basis to estimate the contribution of each metabolite to the total toxicological burden for
consumers and the final proposal of the residue definition (Module 3). The scenario-specific
information is completed by a list of uncertainties identified that were considered in the final proposal
and that are deemed relevant for decision making (risk management).
The guidance document is complemented by three practical case studies which are intended to
demonstrate the applicability of the proposed decision scheme. Although the guidance document -and
the examples- describe EFSA’s current thinking on this topic, this has to be viewed as
recommendation only. Thus, in the context of this guidance, the word “should” is used for something
suggested or recommended rather than required.
4 Terminal residues: Residues to which humans and livestock will be exposed, i.e. in crops at harvest, or in stored
commodities at the time of out-loading, or in commodities upon processing, or in food of animal origin at
collection/slaughter, respectively.

Establishment of the residue definition for dietary risk assessment
EFSA Journal 2016;14(issue):NNNN 3
TABLE OF CONTENTS 1
Abstract .................................................................................................................................................... 1 2
Summary .................................................................................................................................................. 2 3
Table of contents ...................................................................................................................................... 3 4
Background as provided by EFSA ........................................................................................................... 4 5
Terms of reference as provided by EFSA ................................................................................................ 5 6
Assessment ............................................................................................................................................... 5 7
1. Introduction ..................................................................................................................................... 5 8
2. Module 1: Exclusion of genotoxicity (steps 1-9) ............................................................................. 7 9
2.1. Identification of metabolites characterised by the toxicological studies conducted with the 10
parent compound (step 4) ..................................................................................................................... 8 11
2.2. Application of (Q)SAR and read across for the exclusion of genotoxicity (steps 5-6) ........... 9 12
2.2.1. Quality criteria for the application of (Q)SAR analysis for genotoxicity assessment ........ 9 13
2.2.2. Quality criteria for the application of “read across” analysis for genotoxicity assessment11 14
2.3. TTC assessment for evaluation of genotoxicity (step 7) ....................................................... 14 15
2.4. Testing battery for assessment of genotoxicity (step 8) ........................................................ 14 16
2.5. Genotoxicity concern (Step 9) .............................................................................................. 15 17
3. Module 2: General Toxicity Assessment (steps 10 – 19) .............................................................. 15 18
3.1. Identification of metabolites characterised by the toxicological studies conducted with the 19
parent (step 10)................................................................................................................................... 17 20
3.2. TTC assessment for general toxicity (step 11) ...................................................................... 17 21
3.3. Potency considerations for metabolites (step 12).................................................................. 17 22
3.4. Toxicological assessment of plant metabolites in food and feed (steps 13-15) .................... 18 23
3.5. Livestock Dietary burden calculation (steps 16 and 17) ....................................................... 18 24
3.6. Testing Strategy (step 18) ..................................................................................................... 19 25
3.7. Assessment of the toxicological burden and relevance of metabolites (step 19) .................. 21 26
4. Module 3: Decision making for residue definition for risk assessment (step 20) .......................... 21 27
5. Exposure assessments .................................................................................................................... 24 28
5.1. General aspects ..................................................................................................................... 24 29
5.2. Metabolite residue input levels for exposure calculation ...................................................... 25 30
6. Assessment of stereoisomers (enantiomers and diastereoisomers) for the parent and metabolites 27 31
6.1. Exclusion of genotoxicity for isomers or changed isomeric compositions ........................... 28 32
6.2. Isomer assessment step 1 Exposure profile ........................................................................... 28 33
6.3. Isomer assessment step 2: Hazard evaluation ....................................................................... 29 34
6.4. Isomer assessment step 3: Consumer risk assessment .......................................................... 30 35
7. Uncertainties .................................................................................................................................. 30 36
References .............................................................................................................................................. 32 37
Appendices ............................................................................................................................................. 36 38
Appendix A. ADI and ARfD distribution for pesticide active substances ....................................... 36 39
Appendix B. Case study – Isopoturon (RAR Germany 2014) ......................................................... 43 40
Appendix C. Case study – Spiroxamine (DE, 2009) ...................................................................... 69 41
Appendix D. Case study – Epoxiconazole (DE, 2009) ................................................................. 110 42
Abbreviations ....................................................................................................................................... 179 43
44

Establishment of the residue definition for dietary risk assessment
EFSA Journal 2016;14(issue):NNNN 4
BACKGROUND AS PROVIDED BY EFSA 45
Commission Regulation (EU) No 283/20135 setting out the data requirements for active substances, in 46
accordance with Regulation (EC) No 1107/20096 of the European Parliament and of the Council 47
concerning the placing of plant protection products on the market, provides that the following 48
elements shall be considered when judging which compounds are to be included in the residue 49
definition for risk assessment: 50
The toxicological significance of the compounds; 51
The amounts likely to be present. 52
53
The general principles for the establishment of the residue definition to be used for dietary risk 54
assessment are covered by the OECD guidance document on the residue definition (OECD, 2009a). 55
The OECD guidance is considering the actual toxicological burden for consumers by 56
inclusion/exclusion of not only the active substance but any residue such as metabolites, degradates, 57
transformation products (herein after referred to only as metabolites) on the basis of their toxicity 58
compared to that of the parent active substance and the potential for exposure in the diet. 59
In 2008, the Panel on Plant Protection Products and their Residues (PPR) has received a mandate to 60
develop a scientific opinion on the assessment of the toxicological relevance of pesticide metabolites. 61
This mandate also stated that a guidance document on the establishment of residue definition for 62
dietary risk assessment would later be developed by using the opinion as a scientific basis for such a 63
future guidance. 64
After adoption of the scientific opinion on the evaluation of the toxicological relevance of pesticide 65
metabolites in 2012 (EFSA PPR Panel, 2012), it is now desirable that the PPR Panel prepares 66
guidance on the residue definition for dietary risk assessment. This guidance should be a practical 67
instrument, aimed at helping risk assessors to adopt such definitions based on a combination of 68
scientific tools as described in the opinion. The guidance should also be used for identifying cases 69
where further toxicological data are needed to characterise pesticide metabolites. 70
A public consultation of stakeholders on a draft of the guidance will be launched before finalising the 71
guidance. 72
Any relevant opinions and guidance documents elaborated by the Scientific Committee of EFSA will 73
be duly considered, as will on going work on mixture toxicity and cumulative risk assessments. Along 74
the steps of progress in developing the guidance, the suggested approach will be validated using data 75
on previously evaluated compounds. In case needed, the European Commission and Member States 76
will be consulted on particular risk management elements contained in the guidance. 77
78
79
5 Commission Regulation (EU) No 283/2013 setting out the data requirements for active substances, in accordance with
Regulation (EC) No 1107/2009 of the European Parliament and of the Council concerning the placing of plant protection
products on the market. 6 Regulation (EC) No 1107/2009 of the European Parliament and of the Council of 21 October 2009 concerning the placing
of plant protection products on the market and repealing Council Directives 79/117/EC and 91/414/EEC. Official Journal L
309, 1-50. 24 November 2009

Establishment of the residue definition for dietary risk assessment
EFSA Journal 2016;14(issue):NNNN 5
TERMS OF REFERENCE AS PROVIDED BY EFSA 80
In application of Article 29 1(b) of Regulation (EC) No 178/20027, the Panel on Plant Protection 81
Products and their Residues (PPR Panel) is requested to prepare Guidance on the establishment of the 82
residue definition to be used for dietary risk assessment. 83
84
This guidance should consist of a stepwise method helping the risk assessor, on the basis of factual 85
information (derived from toxicological data, metabolism data) and non-testing methods, by weight of 86
evidence, to: 87
conclude for which of the terminal residues8 of a pesticide on food and feed commodities a 88
hazard identification and characterisation is needed; 89
perform such a hazard identification and characterisation 90
define the compounds present as terminal residues that should be included in the residue 91
definition for risk assessment. 92
93
In carrying out this mandate, the panel should consider that the components of the terminal residues of 94
pesticide active substances will have been duly identified following the requirements of Commission 95
Regulation (EU) No 283/2013 and in the context of this Regulation referred OECD test guidelines. As 96
provided under point 1.11 of the introduction of the annex of the aforementioned Regulation, this 97
includes information on the possible metabolic conversion of isomers for active substances consisting 98
in a mixture of isomers. 99
100
A case study should be included in an appendix to the guidance document to demonstrate the practical 101
application of the developed methodology. 102
ASSESSMENT 103
1. Introduction 104
This guidance document applies to chemical active substances (“pesticides”) and their residues as 105
defined in Regulation EC (No) 1107/2009. 106
The need for new guidance on how to establish the residue definition for risk assessment of pesticides 107
has arisen as current regulatory requirements in this regards are not completely and explicitly 108
addressed in available guidance documents like EC, 1997; FAO, 2009 or OECD, 2009a. In particular, 109
Regulation (EC) 283/2013 states that “the risk assessment has to take into account the residue 110
definition established for risk assessment”, which requires considerations on the relevance of 111
metabolites for the consumer risk assessment as to whether or not they can cause potential risks to the 112
consumer. This, in turn, means that for all compounds not included in the residue definition a 113
justification for their non-inclusion should be made. 114
In addition, the implications of recent scientific developments in the regulatory area, such as the issue 115
of mixture toxicity and the agreement to apply the dose addition concept for compounds that produce 116
common adverse outcomes on the same target organ / system (phenomenological effect (EFSA PPR 117
Panel, 2013, 2014)) or the relevance of potential non-thresholded effects, are not discussed in the 118
framework of setting the residue definition for risk assessment in the above mentioned guidance 119
documents. Available guidance does also not consider the application of tools such as the TTC 120
approach, (Q)SAR and read across (EFSA PPR Panel, 2012). Furthermore, improved analytical 121
performance and the development of new analytical methods have led to an increase in number of 122
7 Regulation (EC) No 178/2002 of the European Parliament and of the Council of 28 January 2002 laying down the general
principles and requirements of food law, establishing the European Food Safety Authority and laying down procedures in
matters of food safety. OJ L 31, 01.02.2002, p.1-24. 8 Terminal residues: Residues to which humans and livestock will be exposed, i.e. in crops at harvest, or in stored
commodities at the time of out-loading, or in commodities upon processing, or in food of animal origin at
collection/slaughter, respectively.

Establishment of the residue definition for dietary risk assessment
EFSA Journal 2016;14(issue):NNNN 6
identified metabolites, including isomers, and thereby an increased demand for addressing their 123
potential concern for consumers. This guidance document therefore aims at satisfying the needs of 124
modern residue assessments and at harmonising the setting of residue definitions between the active 125
substances. It had been the intention to guide the assessment per se rather than providing a simple 126
decision scheme. Specifically it is proposed to make use of and apply careful weighing to all 127
information available, including mechanistic understanding, in order to support a highly informed 128
decision process and to enable the risk assessors to provide the risk manager with detailed information 129
on toxicity and exposure of every single metabolite as well as on the uncertainties connected to the 130
proposal. 131
The fate of pesticides after application onto the crop or soil may be affected by numerous 132
biophysicochemical degradation processes resulting in a change of the chemical entity of the pesticide 133
and occurrence of a mixture of compounds in harvestable commodities and the environment – parent 134
substance, metabolites and degradates (in the following termed “metabolites”). The residue pattern in 135
food and feed items is modulated by a set of different criteria like the substance properties, application 136
scheme, crop, cultivation practices, harvesting or environmental factors, resulting in a divergent 137
composition of residues over time and in different commodities of the harvested crop. For many 138
pesticides, the soil acts as a sink and source for residues and the transfer between soil sphere and 139
plants may play an important role in the formation of the residue profile in crops. 140
Metabolism studies are in general performed with the radiolabelled parent compound. Such studies in 141
plants and livestock as well as studies simulating food processing practices, aim at identifying the 142
nature and, to a certain extent, the quantity of individual residue compounds in commodities at stages 143
of intermediate and commercial harvest, and in by-products. Metabolism studies form the basis for the 144
proposal of the residue definitions while field studies with the non-radiolabelled active substance 145
support quantitative metabolite assessments. 146
The residue definition for risk assessment is used by risk assessors to evaluate the potential risk of 147
dietary intake of pesticide residues resulting from the application of a pesticide. The residue definition 148
should consider all compounds that are of toxicological significance for human and livestock, taking 149
into account the amounts likely to be present in food and feed. It is therefore necessary to consider 150
aspects of both, toxicity and dietary exposure to residues and to account for the use specific residue 151
pattern in food commodities of plant origin as well as in animal commodities that result from livestock 152
exposure via feed. 153
The approach chosen in this guidance document recommends the combined use of relative exposures 154
(in percentage of the total residues) and absolute exposures (in mg/kg bw/d) where necessary for a 155
decision. In the context of this guidance it is possible to apply TTC triggers. However, potential 156
simultaneous dietary exposure to multiple metabolites should be taken account of, and the possibility 157
that all or part of the metabolites will cause the same adverse outcome should be considered. In such 158
case, dose addition should be used, in consistency with earlier Scientific Opinions of the PPR Panel 159
(EFSA PPR Panel, 2012, 2013, 2014), and consequently exposure should be calculated as the sum of 160
the single metabolites. Where an exposure assessment is performed in the framework of setting the 161
residue definition, the variety of potential exposure situations has to be considered by setting up a 162
reasonable worst case scenario that takes into account the complexity of the temporal and spatial 163
changes that can occur with the residues. The necessary robustness of a residue definition against 164
future regulatory changes (e.g. extension of authorisations and increase of exposure) therefore depends 165
on the completeness of the underlying data set in terms of the uses intended. It should be noted that a 166
proposal of the residue definition for risk assessment made under a premise not reflecting critical 167
conditions, even in the same crop category, does not necessarily apply to any other situation by 168
default. 169
The procedure of derivation of the residue definition for dietary risk assessment is a screening 170
exercise, where the relevance of all individual metabolites or groups thereof is thoroughly assessed in 171
a stepwise approach, starting with the compilation of an inventory of metabolites and the assessment 172

Establishment of the residue definition for dietary risk assessment
EFSA Journal 2016;14(issue):NNNN 7
of genotoxicity endpoints (Module 1),continuing with other regulatory endpoints of toxicity (termed 173
general toxicity; Module 2). For every single metabolite, this screening generates an inventory of 174
toxicity and dietary exposure information for consumers and livestock including sources and types of 175
exposure, relevance of a particular exposure path and exposure from groundwater used as drinking 176
water. This information forms the basis for the final proposal of the residue definition (Module 3). The 177
scenario-specific information is completed by a list of uncertainties identified that were considered in 178
the final proposal and that are deemed relevant for decision making (risk management). 179
Where exposure assessments are used to waive further data requirements, e.g. when applying the TTC 180
approach or when major metabolites are excluded in the dietary exposure screening due to low 181
absolute residue values, the boundary conditions of these estimations are transparently described and 182
should be considered in future assessments. 183
The guidance document is complemented by three practical case studies which are intended to 184
demonstrate the applicability of the proposed decision scheme. Although the guidance document -and 185
the examples- describe EFSA’s current thinking on this topic, this has to be viewed as 186
recommendation only. Thus, in the context of this guidance, the word “should” is used for something 187
suggested or recommended rather than required. 188
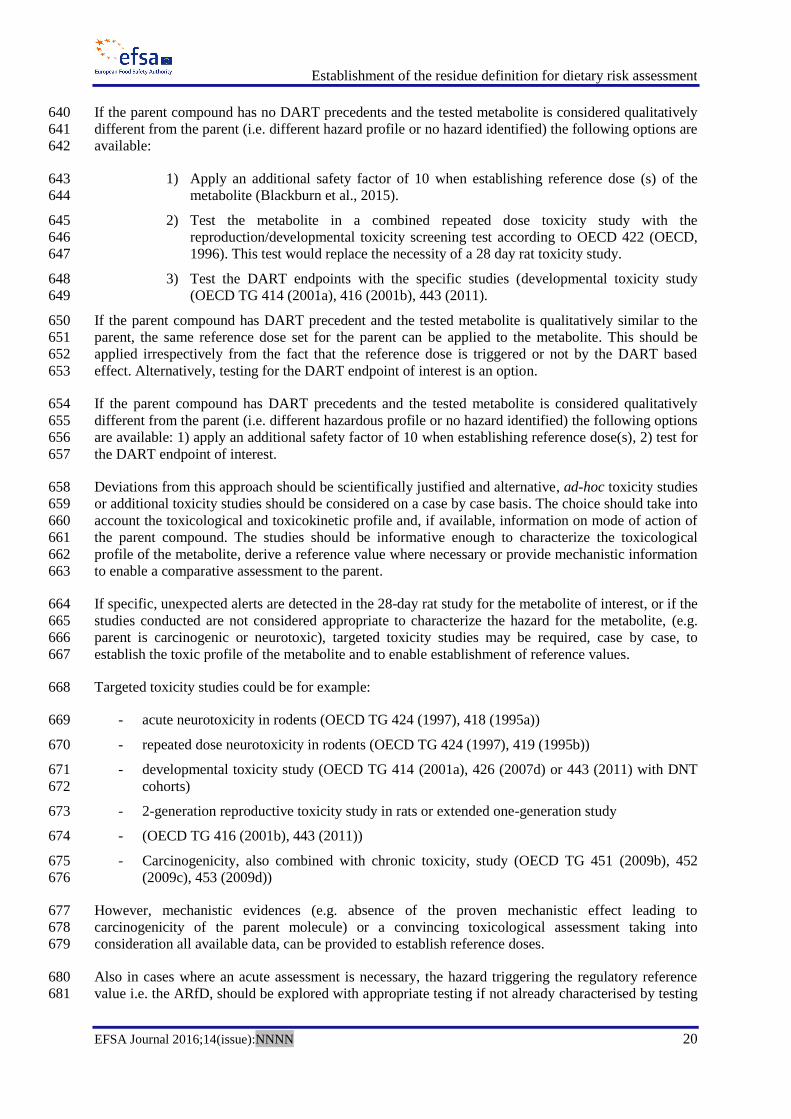
2. Module 1: Exclusion of genotoxicity (steps 1-9) 189
For all metabolites the genotoxic potential has to be assessed (Module 1, Fig. 1). The genotoxicity 190
assessment should start with identification of the metabolites at any level in nature-of-residue studies 191
(i.e. primary and rotational crops, livestock, fish, food processing). The assessment continues with the 192
exclusion of metabolites of no appreciable concern, e.g. sugar or lignin (step 2 of the decision 193
scheme). In step 3, screening for genotoxic compounds classified according to Regulation (EC) 194
1272/20089 should be done (see point 2.5). If no concern is identified, proceed with step 4. 195
9 Regulation (EC) No 1272/2008 of the European Parliament and of the Council of 16 December 2008 on classification,
labelling and packaging of substances and mixtures, amending and repealing Directives 67/548/EEC and 1999/45/EC, and
amending Regulation (EC) No 1907/2006 (Text with EEA relevance) OJ L 353, 31.12.2008, p. 1–1355 (BG, ES, CS, DA,
DE, ET, EL, EN, FR, GA, IT, LV, LT, HU, MT, NL, PL, PT, RO, SK, SL, FI, SV) Special edition in Croatian: Chapter 13
Volume 020 P. 3 - 1357

Establishment of the residue definition for dietary risk assessment
EFSA Journal 2016;14(issue):NNNN 8
1st
Mo
du
le: E
xclu
sio
n o
f ge
nto
xici
ty
3. Metabolite is classified as genotoxic
No
Yes9. Risk assessment
case by case
4. Metabolite is
genotoxicologicaly
characterised
5. (Q)SAR Prediction6. Read across:
Genotoxicicty profiling and grouping of
metabolites (including major rat metabolites)
Genotoxicological
concern
7.TTC: combined exposure
assessment (optional)
Yes
Exposure > TTC OR inconclusi
ve
8. Testing battery on
group representati
ve
YesNo
Genotoxicological
concern
Yes
No No No
1. Metabolites identified at any level in residue metabolism studies
2.Exclusion of metabolites of no concern
Yes
2nd Module: Assessment of General toxicity
3rd Module: Decision on residue definition
196
Figure 1: Module 1 exclusion of genotoxicity 197
2.1. Identification of metabolites characterised by the toxicological studies conducted with 198
the parent compound (step 4) 199
Where no specific studies are available, the metabolites to have been studied in the toxicological 200
studies conducted with the parent (i.e. active substance) are those contributing to 10% or more (as 201
individual metabolite) of the administered dose in terms of total radioactive material recovered in the 202
urine as detected in ADME studies. The study design and the dose selection of the ADME study 203
should allow for a comparison with the general toxicity studies conducted with the parent. 204
As a general rule metabolites quantification would be based on the amount of metabolite considering 205
the lowest available dose and the animal sex showing the lowest excreted amount from a repeat dose 206
ADME study. ADME studies conducted in rat by repeated administration at doses similar to the one 207
applied in the general toxicity studies should preferentially be used for the hazard characterisation of 208
the metabolites. In case a different study design has been applied, e.g. single dose administration or 209
doses much higher than those used in the general toxicity studies their use for the hazard 210
characterisation of the metabolites should be justified. 211
For the metabolites considered to be evaluated by the toxicological studies conducted with the parent 212
compound, the conclusions about the genotoxicity properties of the parent will apply to these 213
metabolites as well and no further testing/data would be required (step 4 of the decision scheme). In 214
addition if a metabolite is not characterized by the toxicological studies conducted with the parent, but 215
found to be common to another active substance and covered by the toxicological properties of this 216
active substance, the conclusion about the genotoxicity properties of this active substance can be used 217
to characterize the metabolite. 218
However, in some cases a different approach can be taken: 219
220

Establishment of the residue definition for dietary risk assessment
EFSA Journal 2016;14(issue):NNNN 9
i) When dealing with mixtures of isomers, the 10% value should be considered as the sum 221
of the individual isomers (EFSA PPR Panel, 2012). 222
223
ii) A special case should be also considered for conjugated metabolites. Glucoside and 224
glucuronide conjugates will be evaluated in terms of their aglycon moiety; all the 225
remaining conjugated metabolites (e.g. sulfate, amino acid) will be assessed case-by-case. 226
227
iii) For poorly or limited absorbed active substances, the 10% of total radioactive material 228
recovered in the urine from the ADME study can be referred to the absorbed dose rather 229
than to the administered dose. In the absence of an agreed definition of poorly or limited 230
absorbed substances a threshold of 80% or less in terms of calculated absorption or 231
bioavailability is considered as indicative for limited absorbed substances, though a case-232
by-case consideration can be applied e.g. for potent active substances, see point 3.3. 233
234
iv) If a metabolite or degradate occurs ≤10% of the absorbed dose in rat urine from the 235
ADME study, expert judgement may still conclude that the hazard has been characterised 236
by testing with the parent; though criteria for such conclusion should be provided (e.g. 237
the metabolite only differs from the parent by simple structural changes that are not 238
expected to cause additional hazard). 239
240
2.2. Application of (Q)SAR and read across for the exclusion of genotoxicity (steps 5-6) 241
The genotoxicity assessment should be assisted by application of (Q)SAR (step 5 of the decision 242
scheme) and read across of metabolites (step 6 of the decision scheme) and by considerations on 243
exposure (step 7 of the decision scheme) against the threshold of toxicological concern (TTC) for 244
genotoxicity (0.0025 µg/kg bw/day). For substances grouped according to their predicted effect it is 245
considered appropriate to apply the dose addition approach, as would be done for compounds included 246
in the same residue definition for dietary risk assessment (EFSA Scientific Committee, 2012; EFSA 247
PPR Panel, 2013, 2014). 248
Step 5 of the decision scheme includes the use of scientifically valid (Q)SAR models (see 2.2.1). The 249
use of computational models for predictions of genotoxicity should not be based on the use of any 250
single model alone, but on a “weight of evidence” approach including all available information 251
provided by the models (e.g. applicability domain, proposed mechanistic information, prediction for 252
the similar substance). To maximise the sensitivity and specificity of the prediction, at least two 253
independent (Q)SAR models, where possible, (e.g based on different training sets and/or algorithms) 254
should be applied for each genotoxicity endpoint, including both knowledge based and statistical 255
based models (Worth et al., 2010, 2011a). 256
To address the possibility of false negative and false positive (Q)SAR predictions, grouping and read 257
across is proposed (Worth et al., 2011a,b, 2013) (step 6). Structural and functional similarity, grouping 258
criteria and selection of representative metabolite(s) for potential testing have to be substantiated by 259
appropriate and relevant information. For guidance on grouping and profiling see OECD (2014). 260
2.2.1. Quality criteria for the application of (Q)SAR analysis for genotoxicity assessment 261
A framework for assessing (Q)SAR applicability builds on guidance already adopted for the REACH 262
regulation (ECHA, 2008), including international (OECD) guidance on the scientific validation and 263
documentation of (Q)SAR models for regulatory purposes (OECD, 2007a). 264
In order a (Q)SAR prediction to be adequate for the assessment purpose i.e. genotoxicity assessment, 265
the following conditions should be fulfilled (Gleeson et al., 2012): 266
i) The prediction should be generated by a scientifically valid (i.e. relevant and reliable) model; 267

Establishment of the residue definition for dietary risk assessment
EFSA Journal 2016;14(issue):NNNN 10
ii) The model should be applicable to the chemical of interest with the necessary level of 268
reliability; 269
iii) The model endpoint should be relevant for the purpose (i.e. genotoxicity assessment); 270
iv) The information should be well documented. 271
2.2.1.1. Scientific validity of the model 272
The first condition for using the (Q)SAR for regulatory purpose is the demonstration of the model 273
validity. A set of five validation principles has been established by the OECD (OECD, 2007a) to guide 274
regulatory agencies in the evaluation of the performance of (Q)SAR. According to them the model 275
should be associated with: 276
i) A defined endpoint; 277
ii) An unambiguous algorithm; 278
iii) A defined domain of applicability; 279
iv) Appropriate measures of goodness-of-fit, robustness and predictivity; 280
v) A mechanistic interpretation, where possible. 281
Information which covers the above listed five principles should be available to the assessor as a part 282
of the relevant documentation of the prediction. Information for some of the models may be available 283
from the JRC QSAR model database http://qsardb.jrc.ec.europa.eu/qmrf/index.jsp. 284
2.2.1.2. Applicability domain 285
The concept of applicability domain was introduced to assess the probability of a chemical of interest 286
being covered by the chemical space of the (Q)SAR model. When the substance to be predicted is 287
within its applicability domain, the model is generally considered to give reliable results. If a 288
substance is outside the applicability domain of the model, the reliability of the prediction is uncertain. 289
In this case, the prediction itself can be only used as a part of the overall weight of evidence or as 290
supporting information, though a positive prediction will be considered as alerting structure and 291
deviations should be justified. 292
For statistically based and hybrid models (e.g. CAESAR), the training set is used to develop the 293
applicability domain of the model. 294
For knowledge based models (e.g. DEREK), where no training set is available, the applicability 295
domain cannot be defined as described above. However, knowledge based models usually provide 296
multiple supporting information e.g. suggested mode of action, examples, references, that can be used 297
to evaluate the reliability and adequacy of the prediction. 298
Some software tools do not give any information on the applicability domain for the chemical of 299
interest. In this case, since the concept of the applicability domain is related to the reliability of the 300
prediction, model predictions for similar substances with known experimental data can be used as an 301
alternative. These analogues may be selected from the training set of the model (if available) and/ or 302
from additional data sets. The selection of analogues and the consequent prediction and analyses of the 303
results may be provided by the software used, or can, as an alternative, be done by the applicant. 304
Information on the applicability domain (reliability of the prediction) should be provided where 305
applicable as a part of the documentation of the prediction. 306
Description, experimental data and predictions of the substances considered analogues of the chemical 307
of interest (provided by the software or selected by the applicant) should be provided as part of the 308

Establishment of the residue definition for dietary risk assessment
EFSA Journal 2016;14(issue):NNNN 11
supporting documentation for the prediction. If the information is not provided by the software itself, 309
criteria for the selection of analogues should be provided by the applicant. 310
2.2.1.3. Relevant endpoints for genotoxicity 311
In the context of this guidance, (Q)SAR should be used as a scientific tool for the genotoxicity 312
assessment of residues of pesticide active substances. The genotoxicity endpoints explored and 313
assessed through the application of (Q)SAR should be described and the information provided to the 314
assessor. Any additional information provided by the model e.g. suggested mechanism of action, 315
uncertainties, should be included in the supporting documentation. The relevant genotoxicity 316
endpoints that have to be explored are gene mutations, and structural and numerical chromosomal 317
alterations. 318
2.2.1.4. Documentation 319
The following should be provided to support the quality of the prediction 320
i) Used model (title, name of authors, reference); 321
ii) Information about modelled endpoint (endpoint, experimental protocol); 322
iii) Used training set (number of the substances, information about the chemical diversity of the 323
training set chemicals); 324
iv) Information on the algorithm used for deriving the model and the molecular descriptors (name 325
and type of the descriptors used, software used for descriptor generation and descriptor 326
selection); 327
v) Internal statistics (performance of the model to the training set chemicals)- goodness-of-fit, 328
robustness and predictivity (including specificity and sensitivity); 329
vi) External statistic, if available; 330
vii) Information about the applicability domain (description of the applicability domain of the 331
model and method used to assess the applicability domain); 332
viii) Mechanistic interpretation of the model; 333
ix) Description, experimental data and predictions of possible structural analogues of the 334
substance (provided by the software or selected by the applicant); 335
x) Any additional information provided by the model, e.g. suggested mechanism of action, 336
uncertainties; 337
Information mentioned in the points 1 to 8 can be substituted by referencing to the JRC QSAR model 338
reporting format database (QMRF), if the model is included in the database. However, irrespective 339
from the source of information, applicants should evaluate the validity of the model used (in relation 340
to the application) as well as the adequacy of the individual model prediction. 341
2.2.1.5. Conclusions from the completed (Q)SAR predictions 342
As a final step, a conclusion on the (Q)SAR prediction should be done as a part of the assessment. The 343
conclusive step includes analysis of the prediction and its reliability. 344
2.2.2. Quality criteria for the application of “read across” analysis for genotoxicity assessment 345
A framework for assessing “read across” applicability for genotoxicity assessment builds on guidance 346
already adopted for the REACH regulation (ECHA, 2008), including the updated OECD guidance on 347
grouping of chemicals (OECD, 2014) and ECHA Read across Assessment Framework (ECHA, 2015). 348
The term “read across” indicates an approach making use of endpoint information i.e. experimental 349
data on genotoxicity for a chemical(s) (source chemical(s)), to make a prediction for the same 350

Establishment of the residue definition for dietary risk assessment
EFSA Journal 2016;14(issue):NNNN 12
endpoint for a different chemical(s) (target chemical(s)). The source and target chemical(s) are 351
considered to provoke similar effects related to the assessed endpoints, usually based on structural 352
similarity, and therefore assumed to exhibit similar biological activity (OECD, 2007b). 353
The approach proposed in this guidance is an implementation of the read across based on analogues 354
since it will be used for the analysis of a group generally composed of a limited number of substances. 355
The simplest case will be consistent with the use of the experimental data on genotoxicity generated 356
for the active substance (source chemical) for prediction of the genotoxic potential of its metabolite(s) 357
(target chemical(s)). However, any other available experimental information, e.g. experimental data 358
for other compounds, could be used and considered acceptable for performing the read across as long 359
as they fulfil and comply with the relevant OECD guidelines. 360
Read across must be, in all cases, scientifically justified and thoroughly documented. 361
In accordance to ECHA (ECHA, 2008), the main steps for the read across adapted for genotoxicity 362
assessment of metabolites of pesticide active substances are: 363
i) Define the endpoint(s) that is/are going to be evaluated by read across 364
The endpoint(s) that is/are going to be evaluated by read across should be clearly defined, e.g. in vitro 365
Ames mutagenicity, with/without S9. This is critical in order to demonstrate the regulatory relevance 366
of the selected endpoint, to justify the use of the read across working hypothesis and to assess the 367
similarity between the analogues which are considered endpoint related. 368
ii) Make a clear working hypothesis and justification for the read across 369
It is recommended that the read across working hypothesis would be based on the molecular initiating 370
events (knowledge on how the chemical is expected to interact with the biological system), e.g. 371
covalent binding with DNA. This would facilitate the definition of similarity and would provide 372
mechanistic evidence, enhancing the confidence in the read across prediction (Patlewicz, 2013). 373
Molecular initiating events of relevance for the genotoxicity assessment are well known and the 374
chemical properties important for the interaction with the DNA and/or proteins have been encoded 375
into structural alerts (Ashby and Tennant, 1988 and 1991; Bailey et al, 2005; Kazius et al 2005; 376
Serafimova et al, 2007; Benigni et al 2008; Enoch and Cronin, 2012). 377
Some of these lists (called primary profilers) are included into OECD QSAR Toolbox 378
(http://www.qsartoolbox.org/) and could be used for grouping. 379
Primary profilers are mechanistic or endpoint specific. Mechanistic primary profilers contain structural 380
alerts that have been developed around the chemistry related to a specific molecular initiating event 381
(e.g. DNA binding by OASIS v1.2, DNA binding by OECD Toolbox). The structural alerts within this 382
type of profiler are not necessarily supported by toxicological data. Endpoint specific primary profilers 383
contain structural alerts that have been identified from the analysis of toxicological data (e.g. DNA 384
alerts from the Ames, Micronucleus and Chromosome Assay tests by OASIS v 1.2, in vitro 385
mutagenicity test (Ames test) alerts by ISS). 386
Mechanistic and endpoint specific primary profilers should be applied in a complementary way to the 387
active substance and metabolites. The ideal profiling case will be when one (or both) of the 388
mechanistic profilers identifies a single mechanism related to the predicted endpoint that is supported 389
by appropriate endpoint specific profiler(s); in such a case the theoretically derived structural alert(s) 390
is/are confirmed by the experimental data. 391
Based on the results of the profiling a specific group should be formed. The first intention is to use the 392
active substance and (if available) its metabolites that have been tested for genotoxicity as source 393
chemical(s). Therefore, all metabolites sharing the same alert(s) as the active substance or tested 394

Establishment of the residue definition for dietary risk assessment
EFSA Journal 2016;14(issue):NNNN 13
metabolites, for the predicted endpoint, or lack of alert(s), should be placed in the same group. The 395
remaining metabolites should be grouped depending on the resulting profile, e.g. to form a group 396
including all metabolites sharing the same alert, but not present in the active substance. It is worth to 397
note that read across can only be accepted in the framework of the current data requirements. 398
Provide information on substance identity for all the substances included in the read across 399
Detailed information on composition, including substance identity and purity, should be provided for 400
all substances (source and target (s) chemicals) included in the chemical groups formed and used for 401
read across. Information should be detailed enough to allow the assessor to unambiguously identify 402
the substances and to assess the structural similarity on which the read across hypothesis is based. 403
Lack of adequate information on structure and impurities could undermine the read across. 404
iii) Outline the structural similarity(ies) between substances 405
The structural similarity of the target and the source substances needs to be assessed. The impact of 406
the structural differences between substances for the endpoint(s) under consideration also needs to be 407
assessed. 408
The analysis on structural similarity should consider all the appropriate elements, namely: 409
- Presence of structural alerts; 410
- Presence, relevance and number of common functional groups; 411
- Presence and relevance of non-common functional groups; 412
- Similarity of the ‘core structure’ apart from the (non-)common functional groups; 413
- Potential differences due to differences in reactivity, metabolism and mode of action; 414
- Potential differences due to steric hindrance; 415
416
Secondary profilers (i.e. organic functional groups) in the OECD QSAR Toolbox could be used in this 417
analysis. However, it should be mentioned that the software could only help in the first part of the 418
analysis, in particular to identify common and non-common functional groups present in source and 419
target chemical(s). The relevance of the similarities and dissimilarities identified for making use of the 420
read across to evaluate the endpoint considered in the analysis should be discussed. 421
iv) Conclusions from the completed read across investigations 422
423
As a final step, a conclusion on the applicability of the read across should be done as a part of the 424
assessment. The conclusive step includes a scientific justification on the applicability of the read 425
across resulting in the following possibilities: 426
- A group of metabolites is proven to be similar to the source substance (i.e. the active 427
substance or a compound tested for genotoxicity), if the existing experimental data allows 428
concluding on a lack of genotoxicity concern for the source substance, then no genotoxicity 429
concern would exist for the substances included in that group. 430
- A group of metabolites is proven to be dissimilar to the source substance, if e.g. a new 431
structural alert has been identified and considered of genotoxicity concern. In this case, 432
genotoxicity cannot be excluded and the substance will move to step 7 of the decision 433
scheme. 434
In performing read across, a case should be made when positive in-vitro micronucleus test and 435
negative in-vivo micronucleus test exist for the same substance. In this case, before discharging the 436
positive concern by making use of the in-vivo micronucleus test, evidence of bone marrow exposure 437
has to be proven. 438
v) Documentation 439

Establishment of the residue definition for dietary risk assessment
EFSA Journal 2016;14(issue):NNNN 14
The documentation provided must be sufficient to allow an independent assessment of the adequacy 440
and the scientific validity of the read across approach. The following elements are considered essential 441
to adequately document a read across approach (adapted from ECHA 2008, OECD 2014, 442
ECHA, 2013): 443
- Description of the endpoint(s) that is/are to be read across; 444
- A read across hypothesis; 445
- A justification for the read across hypothesis; 446
- A list of all the substances included in the approach with their detailed substance identity 447
information; 448
- An analysis of the similarity/dissimilarity 449
- A conclusion on the applicability of the proposed read across approach. 450
451
2.2.3 Conclusion 452
A final conclusion on the genotoxic potential should be made for all metabolites based on the 453
information of (Q)SAR predictions and read-across. In case of diverging results between QSAR 454
predictions and read-across analysis, justification for the decision has to be provided (see case studies). 455
2.3. TTC assessment for evaluation of genotoxicity (step 7) 456
The Threshold of Toxicological Concern (TTC) approach is a method that can be applied to evaluate 457
the toxicological relevance of metabolites (EFSA PPR Panel, 2012) when chemical-specific data are 458
not available. The assessment is based on the known chemical structure of the substance and the 459
estimated exposure. 460
In the context of this guidance, the TTC approach is not intended to supersede the evaluation of 461
available toxicological data; including those cases where structural analogues can be assessed based on 462
the toxicological data from the tested compounds i.e. parent and/or metabolites. For the genotoxicity 463
assessment, the TTC approach is a subordinate screening tool to (Q)SAR and read across, where 464
human exposure is estimated to be very low. 465
In addition, in case of dietary exposure to co-occurring pesticide metabolites, the application of the 466
TTC should assume dose addition. 467
For the genotoxicity endpoints it is proposed that metabolites showing commonality in reaction 468
mechanisms i.e. the same specific genotoxicity endpoint (i.e. point mutation or structural and 469
numerical chromosome aberration) to be grouped and optionally assessed against the TTC value of 470
0.0025 µg/kg bw/day as a combined exposure (see chapter 5), or directly to be subjected to 471
genotoxicity testing (step 8 of the decision scheme). 472
Substances considered to be of genotoxic concern following (Q)SAR prediction and read across, and 473
exceeding the cumulative exposure of 0.0025 µg/kg bw/day will go to step 8 of the decision scheme to 474
be tested. 475
2.4. Testing battery for assessment of genotoxicity (step 8) 476
After profiling and grouping of metabolites (if necessary), in vitro tests on at least one representative 477
metabolite per group should be performed (step 8). The selection of the representative metabolite can 478
be based on multiple aspects e.g. relevant exposure or technical factors, and should be justified. For 479
one or more metabolites identified to be tested for their genotoxic potential, the testing battery should 480
include as a minimum two in vitro tests, covering all three genetic endpoints, i.e. gene mutations, 481
structural and numerical chromosomal alterations (EFSA Scientific Committee 2011; Kirkland et al., 482
2014a, b). The need for in vivo follow up testing should be considered on a case by case, through the 483
evaluation of the spectrum of genotoxic events observed in vitro (if any), the data on toxicokinetics, on 484
bioavailability and on the potential target organ. Applicants and assessors should refer to the Scientific 485

Establishment of the residue definition for dietary risk assessment
EFSA Journal 2016;14(issue):NNNN 15
Opinion on genotoxicity testing strategies applicable to food and feed safety assessment (EFSA 486
Scientific Committee, 2011) for selection of the most appropriate assays and results interpretation. 487
Individual metabolites or group representatives that are negative in the genotoxicity testing battery 488
will be considered of no genotoxicity concern and will go to the next step of the assessment decision 489
tree (Module 2). If testing is conducted on one or more group representatives the negative outcome of 490
the study will be applied to the full group. Metabolites or group representatives resulting positive in a 491
test battery will be considered of genotoxicity concern. If testing is conducted on a group 492
representative, the positive outcome of the study will be applied to the full group. 493
2.5. Genotoxicity concern (Step 9) 494 For all compounds identified as of genotoxic concern under steps 3 and all metabolites for which 495
genotoxic properties cannot be excluded after testing and read-across (positive in step 4 or 8), a case-496
by-case assessment is required. These metabolites are not suitable candidates to be carried further 497
through the process for inclusion into the residue definition in the remit of this guidance document. 498
Instead, risk assessors and risk managers need to take further actions to exclude any unacceptable risk 499
for consumers (e.g. in depth-assessment of exposure, proposal of mitigation measures, management 500
decision on acceptability of known genotoxicants in regulated products). 501
3. Module 2: General Toxicity Assessment (steps 10 – 19) 502
In this guidance, the general acute and chronic toxicity assessment of the metabolite of interest is 503
understood to enable a quantitative and qualitative comparison of the toxicity profile(s) of the 504
metabolite(s) with the parent substance and to identify any specific hazard for the metabolite in order 505
to derive respective health based limits for human exposure to the relevant metabolite(s), when 506
appropriate. 507
The assessment scheme is proposing the combined use of the TTC approach, occurrence level of 508
metabolites, elements of grouping and read across, and testing. 509

Establishment of the residue definition for dietary risk assessment
EFSA Journal 2016;14(issue):NNNN 16
510
511
2n
d M
od
ule
: Ass
essm
ent
of
Gen
eral
to
xici
ty3
rd M
od
ule
: D
ecis
ion
on
re
sid
ue
def
init
ion
10. General toxicity of metabolite characterised
11. TTC: Combined exposure of uncharacterised
metabolites
Exposure>TTCOR inconclusive
12. Consideration on potency
No
18. Testing strategy (if required), grouping and read across
19.Assessment against total toxicological burden (% of sum of parent and identified metabolites, weighted by their relative potency)
20. Residue definition (sum of compounds form ≥ 75% of toxicological burden)
Metabolite is plant metabolite in food/ feed or processing
No
Yes
Potent (ADI≤0.01mg/kg/day OR
ARfD≤0.025 mk/kg)
13. Major metabolite in food (≥10%TRR and ≥0.01 mg/kg OR ≥ 0.05 mg/kg)
ORMajor processing
(≥10%TRR)
No
Yes
15. Major metabolite in feed (≥10%TRR and
≥0.01 mg/kg )
16. Dietary burden (parent and major
metabolites) ≥0.004 mg/kg bw
17. Major metabolite in animal commodities
(≥10%TRR for non potent substances)(≥10% TRR OR ≥0.01 mg/kg for potent
substances at 1N)
Yes Yes
Yes
Yes
No
No
No concern
Metabolite is plant metabolite in food
or processing
No
No
Yes
No
No
Yes
Yes
1st Module: Exclusion of gentoxicity
512
Figure 2: Assessment scheme for general toxicity and decision on residue definition 513

Establishment of the residue definition for dietary risk assessment
EFSA Journal 2016;14(issue):NNNN 17
3.1. Identification of metabolites characterised by the toxicological studies conducted with the 514
parent (step 10) 515
In line with the criteria described in chapter 2.1, no further toxicological testing will be necessary, if 516
the metabolite is considered quantitatively covered by the mammalian metabolism studies (ADME 517
studies; step 10). If the criteria described in the chapter 2.1 are met, the general toxicity assessment of 518
the metabolite would be considered characterised by the studies conducted with the active substance 519
and the reference values of parent compound apply. 520
3.2. TTC assessment for general toxicity (step 11) 521
Following the specific criteria described in chapter 2.3, the combined exposure of all metabolites not 522
covered by the ADME study conducted in mammalian species or by specific studies, can be summed 523
up and compared to the specific TTC value as an optional assessment step (step 11). 524
For the general toxicity assessment (see Module 2), the exposure is intended as a combined exposure 525
of all identified, but toxicologically non-characterised metabolites (see step 11 of the decision 526
scheme). The TTC approach in this module should be seen as a screening tool, which is optional and 527
restricted to cases where the exposure can be reliably estimated and is not subject to large uncertainties 528
due to foreseeable extensions of authorisations, or limited knowledge about the identity and/or 529
magnitude of residues e.g. in case of transfer and metabolism of feed metabolites in livestock. 530
In order to apply the TTC in a cumulative way, the ratio between the exposure of each metabolite and 531
the corresponding Cramer Class TTC will be summed up. If the sum is ≥ 1, specific hazard and/or 532
comparative risk assessment will be conducted. If the resulting sum is ≤1, no further assessment is 533
necessary. 534
The thresholds of 0.3 µg/kg bw/d (for organophosphate and carbamate with anti-cholinesterase 535
activity) or 1.5 µg/kg bw/d (Cramer Class III and Cramer Class II) and 30 µg/kg bw/d (Cramer Class 536
I) should be used (EFSA Scientific Committee, 2012). 537
Besides the standard chronic exposure assessment, an acute TTC assessment can be similarly 538
conducted, where necessary. In line with EFSA Scientific Opinion (EFSA PPR Panel, 2012) ad hoc 539
acute TTC values derived from short term exposure pesticide NOAELs can be adopted: 0.3 µg/kg 540
body weight/day for substances with neurotoxicity alert and 5 µg/kg body weight/day for substances 541
allocated to Cramer class II and III. The same TTC values as for chronic exposure is adopted for 542
substances allocated in the Cramer class I (30 µg/kg body weight/day). 543
3.3. Potency considerations for metabolites (step 12) 544
In the context of this guidance, potency is defined by the ADI or the ARfD of the parent substance or 545
the metabolite(s), if respective data exist. General criteria for definition of low ADIs and ARfDs were 546
derived from the evaluation of the distribution of ADIs and ARfDs from a pesticide database 547
comprising 270 and 195 active substances, respectively (see Appendix A). A conservative assumption 548
was made by considering that all the substances included in the lowest 25th percentile of the 549
distribution of ADIs or ARfDs were considered of potential concern, and it is expected that most of 550
the neurotoxic substances will be included in this range. It was concluded by extrapolation of the 551
corresponding ADI or ARfD values that active substances with an ADI <0.01 mg/kg/body weight per 552
day, or an ARfD <0.025 mg/kg/body weight, as appropriate, should be considered “potent”. In this 553
case the values for orientation to categorise significant and insignificant residues (see chapter 3.4) 554
should not be applied for the exclusion, by default, of any metabolite as of “no concern”. 555
If a metabolite is more potent than the parent on the basis of data (dossier, data base on toxicology 556
according to Annex I of OECD 2009a) and/or additional information (e.g. public literature) the 557
relative potency is addressed by the application of a relative potency factor (RPF). This might need to 558

Establishment of the residue definition for dietary risk assessment
EFSA Journal 2016;14(issue):NNNN 18
be reflected in the characterisation of a metabolite as being potent or not according to the criteria for 559
the definition of potency. 560
Additional complementary elements can be considered at this point when estimating the relevance of 561
metabolites to be included in further assessment (OECD, 2009a), like: 562
- number and level of identified minor metabolites 563
- uses considered for the active substance 564
- the metabolite is common to other active substances and already characterised 565
- quantitative relevance of the metabolite in the mammalian metabolism study (see chapter 2.1) 566
If the overall assessment would be inconclusive, and a safety concern cannot be dismissed, then the 567
metabolites should be further assessed to define their toxicological relevance. 568
3.4. Toxicological assessment of plant metabolites in food and feed (steps 13-15) 569
Further assessment should be performed for major metabolites contributing at any point in time in the 570
residue metabolism studies to ≥10% of the TRR and ≥0.01 mg/kg in food and in feed commodities, or 571
(if <10%TRR) to ≥ 0.05 mg/kg in food commodities (whichever set of conditions is met). For nature 572
of processing studies, 10% TRR applies as sole trigger for relevance. These thresholds are arbitrary 573
and should be considered only as indicative for a metabolite having a potential for exposure that could 574
significantly contribute to the dietary risk. Metabolites below 10% of the TRR in food and feed and 575
less than 0.05 mg/kg in food (minor metabolites), or above 10% of TRR but <0.01 mg/kg (non-576
relevant major metabolites), are generally considered as unlikely to contribute significantly to the 577
dietary risk, unless they are presumed as “potent” based on considerations described in 3.3. 578
If the conditions described in chapter 2.1 are not met, then additional testing should be considered 579
(step 18) for all relevant major and potent minor plant metabolites in food. The testing strategy should 580
take into account the toxicological profile of the parent and the possibility to explore specific hazards. 581
Toxicological testing of livestock or plant metabolites can be waived, if it can be demonstrated that an 582
extension of uses or an increase of the application rate is unlikely to change the conclusion on the 583
relevance of metabolites (e.g. non-detectable residues of a metabolite of a non-potent active substance 584
in a feeding study at an exaggerated dose rate; a very limited number of target crops for a herbicide 585
and observed phytotoxicity precluding higher application rates). 586
3.5. Livestock Dietary burden calculation (steps 16 and 17) 587
Livestock metabolism data are used to identify potential candidates for inclusion into the residue 588
definition for plants (as for potential residue transfer into livestock matrices from feed) and into the 589
residue definition for livestock commodities itself (step 17). For the livestock dietary burden 590
calculation against the trigger of 0.004 mg/kg bw/d (step 16), parent and major plant metabolites 591
(≥10% TRR and ≥0.01 mg/kg) observed in feed items are used as the sum expressed as parent unless 592
information is available from animal studies that they belong to separate pathways in animals. 593
If a metabolism study in livestock is required (OECD 503 (2007c), all major livestock metabolites 594
≥10% TRR are selected (in step 17) for subsequent grouping and testing (step 18), if not yet 595
toxicologically characterised. In case of substances of high potency (see chapter 3.3), metabolites 596
<10 % TRR are relevant for toxicological grouping and testing, if their anticipated individual level in 597
animal tissues or milk at 1N rate is ≥0.01 mg/kg. 598

Establishment of the residue definition for dietary risk assessment
EFSA Journal 2016;14(issue):NNNN 19
3.6. Testing Strategy (step 18) 599
In general, a 28-day rat study according to OECD 407 enhanced (OECD, 2008) would be appropriate 600
as a first step. 601
Grouping can be used for the selection of representative substance/s to be tested and read across 602
according to the recommendations of OECD (2014); grouping criteria and/or selection of 603
representative substance/s for testing should be at least substantiated by: 604
- identification of the critical effect(s)/endpoint(s) of the parent to be read across 605
- criteria for similarity (e.g. structural similarities and chemical reactivity which are assumed to 606
trigger a similar toxicokinetic and toxicodynamic properties) and analogues selection. 607
- compile toxicity data for analogous chemicals 608
- support the proposed toxicity mechanism by comparative mechanistic data 609
In line with the general principles described above, the design of the 28 day rat toxicity study has to be 610
considered carefully. The following considerations should be taken into account for the design of the 611
study: 612
- The top dose of the metabolite should achieve the maximum tolerated dose (MTD) for 613
repeated administration. Alternatively, the maximum administrable dose or the maximum dose 614
of 1 g/kg body weight should be used in case the MTD cannot be determined. 615
- The range of doses selected in the study should allow for comparison with the toxicity of the 616
parent; alternatively, a parallel group should be tested with the parent. The experimental 617
conditions should be, as far as possible, close to the ones applied for the parent in terms of 618
animal species, strain, number of animals, endpoints evaluated and general experimental 619
conditions. 620
If a comparable 28-day rat study was not conducted with the parent, the choice of a 28-day study with 621
the metabolite could still represent a valid option; though, an expert toxicology judgment and/or the 622
use of an additional safety factor should be considered (see 3.7). 623
The enhanced OECD 407 (OECD, 2008) study has a number of optional endpoints in regard to 624
endocrine-mediated effects; these endpoints are recommended in order to make a robust and 625
comprehensive hazard characterisation of the metabolite. 626
Furthermore, the test should include an assessment of the male reproductive system by means of a 627
detailed histopathological evaluation of the testes, i.e. a stage-dependent qualitative evaluation of 628
spermatogenesis should be conducted on section of testes from all control and high dose terminal 629
necropsy animals. A qualitative examination of spermatogenesis stages will be made for normal 630
progression of the stages of spermatogenesis, cell associations and proportions expected to be present 631
during spermatogenesis. If potential effects are identified, then other groups should be examined 632
(Creasy, 2003 and Russell et al., 1990). 633
One important limitation of the extended 28 day rat toxicity study (OECD 407) is lack of exploration 634
of developmental and reproductive toxicity (DART) endpoints after in utero exposure 635
To minimize the risk associated with potential DART effects, different options can be considered: 636
If the parent compound has no DART precedents and the tested metabolite is considered qualitatively 637
similar to the parent in terms of toxicological profile, no further testing would be necessary and the 638
DART profile of the metabolite will be considered based on the parent. 639
Establishment of the residue definition for dietary risk assessment
EFSA Journal 2016;14(issue):NNNN 20
If the parent compound has no DART precedents and the tested metabolite is considered qualitatively 640
different from the parent (i.e. different hazard profile or no hazard identified) the following options are 641
available: 642
1) Apply an additional safety factor of 10 when establishing reference dose (s) of the 643
metabolite (Blackburn et al., 2015). 644
2) Test the metabolite in a combined repeated dose toxicity study with the 645
reproduction/developmental toxicity screening test according to OECD 422 (OECD, 646
1996). This test would replace the necessity of a 28 day rat toxicity study. 647
3) Test the DART endpoints with the specific studies (developmental toxicity study 648
(OECD TG 414 (2001a), 416 (2001b), 443 (2011). 649
If the parent compound has DART precedent and the tested metabolite is qualitatively similar to the 650
parent, the same reference dose set for the parent can be applied to the metabolite. This should be 651
applied irrespectively from the fact that the reference dose is triggered or not by the DART based 652
effect. Alternatively, testing for the DART endpoint of interest is an option. 653
If the parent compound has DART precedents and the tested metabolite is considered qualitatively 654
different from the parent (i.e. different hazardous profile or no hazard identified) the following options 655
are available: 1) apply an additional safety factor of 10 when establishing reference dose(s), 2) test for 656
the DART endpoint of interest. 657
Deviations from this approach should be scientifically justified and alternative, ad-hoc toxicity studies 658
or additional toxicity studies should be considered on a case by case basis. The choice should take into 659
account the toxicological and toxicokinetic profile and, if available, information on mode of action of 660
the parent compound. The studies should be informative enough to characterize the toxicological 661
profile of the metabolite, derive a reference value where necessary or provide mechanistic information 662
to enable a comparative assessment to the parent. 663
If specific, unexpected alerts are detected in the 28-day rat study for the metabolite of interest, or if the 664
studies conducted are not considered appropriate to characterize the hazard for the metabolite, (e.g. 665
parent is carcinogenic or neurotoxic), targeted toxicity studies may be required, case by case, to 666
establish the toxic profile of the metabolite and to enable establishment of reference values. 667
Targeted toxicity studies could be for example: 668
- acute neurotoxicity in rodents (OECD TG 424 (1997), 418 (1995a)) 669
- repeated dose neurotoxicity in rodents (OECD TG 424 (1997), 419 (1995b)) 670
- developmental toxicity study (OECD TG 414 (2001a), 426 (2007d) or 443 (2011) with DNT 671
cohorts) 672
- 2-generation reproductive toxicity study in rats or extended one-generation study 673
- (OECD TG 416 (2001b), 443 (2011)) 674
- Carcinogenicity, also combined with chronic toxicity, study (OECD TG 451 (2009b), 452 675
(2009c), 453 (2009d)) 676
However, mechanistic evidences (e.g. absence of the proven mechanistic effect leading to 677
carcinogenicity of the parent molecule) or a convincing toxicological assessment taking into 678
consideration all available data, can be provided to establish reference doses. 679
Also in cases where an acute assessment is necessary, the hazard triggering the regulatory reference 680
value i.e. the ARfD, should be explored with appropriate testing if not already characterised by testing 681

Establishment of the residue definition for dietary risk assessment
EFSA Journal 2016;14(issue):NNNN 21
performed with the parent. Furthermore, the above mentioned consideration should also apply for the 682
acute assessment, where appropriate. 683
3.7. Assessment of the toxicological burden and relevance of metabolites (step 19) 684
Metabolites that are considered as candidates for inclusion into the residue definition for risk 685
assessment have to be screened for their individual impact on the dietary exposure and risk (step 19). 686
The relative contribution of a metabolite (or group of metabolites with similar profile) to the overall 687
toxicological burden (i.e. the sum of identified metabolites, weighted by their relative potency), is 688
considered a suitable measure to assess the relevance of a metabolite in terms of dietary consumer 689
safety. The toxicological burden is meant as the sum of those residue compounds that were not 690
previously excluded from the assessment (e.g. due to low potency, minor quantitative relevance, non-691
significant transfer of major feed metabolites to food of animal origin). 692
Where an exposure assessment is performed within the decision process for the residue definition 693
(TTC, livestock dietary burden), the individual metabolite exposure data should be derived from the 694
representative uses or from an extended data set of intended uses (if submitted) according to the 695
conditions set out in chapter 5. 696
The outcome of toxicological testing of metabolites should be followed by establishment of the 697
toxicity profile and relative potencies for risk assessment. The possible outcomes could be: 698
- The toxicity of the metabolite is similar to or lower than that of the parent (the relative 699
potency factor (RPF) is ≤ 1); in this case the risk assessment can be performed using the acute 700
and chronic reference values of the parent or applying a RPF < 1 to the reference values based 701
on an appropriate data set 702
- The toxicity of the metabolite is higher compared to parent i.e. has lower NOAEL/LOAEL 703
referring to the critical endpoint (RPF >1); the same ADI or ARfD of the parent has to be 704
used, though the potency of the metabolite should be considered for the residue definition. 705
- The metabolite has a toxicity profile different from the parent; in this case specific acute and 706
chronic reference values should be established. If the assessment conducted was not including 707
the establishment of an acute reference value, the worst case assumption will be that the same 708
value should be applied to both the acute as well as the chronic reference values. To establish 709
the reference doses in absence of a full data package, an additional safety factor of 10 should 710
be applied, if the 28 day rat study is the only study available. 711
- A specific relationship with the parent toxicity cannot be established e.g. because the endpoint 712
of reference for the parent was only observed in a study of longer duration, and it may 713
represent an evolution of the finding observed in the study conducted with the metabolite; in 714
this situation a case by case approach including expert judgement should be applied by 715
considering e.g. expert evaluation of the observed toxicity/pathology or the use of an 716
additional assessment factor. 717
4. Module 3: Decision making for residue definition for risk assessment (step 20) 718
The parent is considered as relevant for inclusion into the residue definition if present in at least one 719
commodity of relevance for human consumption (either via food of plant or animal origin). 720
The residue definition should be proposed per crop or livestock category. 721
Within a crop category, a residue definition consisting of separate components should be proposed for 722
metabolites bearing a toxicity profile different from parent and/or other relevant metabolites (see 723
chapter 3.7). 724

Establishment of the residue definition for dietary risk assessment
EFSA Journal 2016;14(issue):NNNN 22
After grouping and toxicological assessment, the toxicological burden of each metabolite in a group of 725
metabolites with a comparable toxicity profile is expressed as percentage of the overall burden for the 726
critical effect (i.e. the effect triggering the reference value). By default, metabolites or groups of them 727
comprising ≥ 75% of the overall toxicological burden should be considered relevant for inclusion into 728
the residue definition. Differences in the potency to parent should be balanced by accounting for a 729
relative potency factor (RPF). If a metabolite or group of metabolites from a highly potent active 730
substance is considered as significantly less toxic (falling in the group of non-potent substances), the 731
criteria of non-potent active substances apply to these metabolites. The threshold of 75% should be 732
considered as indicative and is not expected to cover all possible cases. 733
Where for derivation of the residue definition absolute exposure considerations10
are applied in 734
addition to the concept of relative contribution of metabolites to the dietary toxicological burden, these 735
exposure considerations need to consider the full picture of possible dietary exposure, i.e. direct 736
exposure via food of plant and indirect via food of animal origin, and where appropriate from 737
groundwater used as drinking water. Where this condition cannot be met, i.e. reliable dietary exposure 738
estimates cannot be provided, the assessment has either to be skipped (TTC), or a conservative 739
approach has to be applied (e.g. covering uncertainty on residue uptake from soil by rotational crops), 740
or a data gap is identified. In the latter case, the setting of a residue definition is either not possible or 741
only possible on a provisional basis. 742
In case of relevant isomeric properties of a residue of concern (see chapter 6), additional uncertainty 743
factors may be applied. 744
10 Absolute exposure considerations may refer to e.g. exclusion of metabolites via TTC, refinement of input values from
metabolism data by field studies supporting a specifc use

Establishment of the residue definition for dietary risk assessment
EFSA Journal 2016;14(issue):NNNN 23
1st
Mo
du
le: E
xclu
sio
n o
f ge
nto
xici
ty2
nd M
od
ule
: Ass
essm
ent
of
Gen
eral
to
xici
ty
3rd
Mo
du
le:
Dec
isio
n o
n
resi
du
e d
efin
itio
n
3. Metabolite is classified as genotoxic
No
Yes9. Risk assessment
case by case
4. Metabolite is genotoxicologicaly
characterised
5. (Q)SAR Prediction6. Read across: Genotoxicicty
profiling and grouping of metabolites (including major rat
metabolites)
Genotoxicological concern
7.TTC: combined exposure
assessment (optional)
YesExposure > TTC OR inconclusive
8. Testing battery on group
representativeYesNo
Genotoxicological concern
Yes
10. General toxicity of metabolite characterised
11. TTC: Combined exposure of uncharacterised
metabolites
Exposure>TTCOR inconclusive
12. Consideration on potency
No
18. Testing strategy (if required), grouping and read across
19.Assessment against total toxicological burden (% of sum of parent and identified metabolites, weighted by their relative potency)
20. Residue definition (sum of compounds form ≥ 75% of toxicological burden)
Metabolite is plant metabolite in food/ feed or processing
No
Yes
Potent (ADI≤0.01mg/kg/day OR
ARfD≤0.025 mk/kg)
13. Major metabolite in food (≥10%TRR and ≥0.01 mg/kg OR ≥ 0.05 mg/kg)
ORMajor processing
(≥10%TRR)
No
Yes
15. Major metabolite in feed (≥10%TRR and
≥0.01 mg/kg )
16. Dietary burden (parent and major
metabolites) ≥0.004 mg/kg bw
17. Major metabolite in animal commodities
(≥10%TRR for non potent substances)(≥10% TRR OR ≥0.01 mg/kg for potent
substances at 1N)
Yes Yes
Yes
Yes
No
No
No No No
1. Metabolites identified at any level in residue metabolism studies
2.Exclusion of metabolites of no concern
Yes
No concern
Metabolite is plant metabolite in food
or processing
No
No
Yes
No
No
Yes
Yes
745
Figure 3: Overall assessment scheme 746

Establishment of the residue definition for dietary risk assessment
EFSA Journal 2016;14(issue):NNNN 24
5. Exposure assessments 747
5.1. General aspects 748 The significance of absolute quantities of residues in metabolism and field studies is limited as regards 749
their use in exposure estimates. While for a very limited number of uses (e.g. the representative uses in 750
the pesticide peer review) the regulatory relevant consumer exposure (in mg/kg bw/d) can in most 751
instances be reliably estimated, this is not the case for uses intended in the future, which may create a 752
higher exposure potential, e.g. by higher application rates or shorter PHIs. In order to set up a residue 753
definition that is sufficiently robust against changes of authorisations of additional uses, the relative 754
contribution of metabolites to the toxicological burden is preferred over absolute exposure estimates as 755
a decision criteria for the residue definition. 756
However, within the decision process on the residue definitions, exposure calculations and assessment 757
of metabolites against agreed triggers may be performed where appropriate (obligatory in case of 758
potentially relevant metabolites in feed items, or on a facultative basis (TTC assessments of 759
genotoxicity (module 1) and general toxicity (module 2). 760
This guidance will rely on the core criteria and principles set out in test methods, guidelines and 761
guidance documents relevant to the submission of information to be used for the assessments for 762
pesticides in Europe or by the pertinent regulations them-selves. In this context it is implied that the 763
uncertainties and boundaries of assessments to inform regulatory decisions are acknowledged and 764
accepted, and as they are considered to apply to a comparable extend to every assessment within the 765
same framework, they are not further detailed and discussed in this guidance. 766
The following prerequisites and established principles are taken as given when applying the approach 767
suggested in this guidance document: 768
• In plant metabolism studies, selection of crops and use patterns are representative and 769
consistent with existing or intended GAPs and will reflect the situation where the highest 770
amount of radioactivity resulting from metabolism would be expected in the consumable11
771
parts of the crop at harvest (steps 13-15) 772
• Where metabolism data is intended to be directly used for exposure estimates (TTC, livestock 773
dietary burden), scaling of overdosed metabolism studies is acceptable within an agreed range 774
of application rates and where the latter is the only deviation from cGAP (proportionality 775
approach EFSA, 2015). 776
• Only models and parameters agreed as applicable for assessments in the EU (variability and 777
processing factors; consumption data, livestock feeding tables etc.) are used in line with the 778
most current requirements and conventions. 779
• All residue data are expressed as equivalents of a reference compound (in most cases parent 780
compound) for exposure estimates and subsequent comparison against relevant triggers (TTC, 781
livestock dietary burden). 782
• Potential exposure from other possible sources related to the authorisation of a pesticide 783
(including drinking water) will be taken into account in order to ensure that total exposure of 784
consumers to a given metabolite is appropriately assessed. Metabolites that both occur in food 785
and in groundwater should be considered with their full consumer exposure potential in the 786
frame of TTC assessments for screening of dietary non-relevance and to inform risk managers 787
on additional sources of exposure. 788
• Similarly, the simultaneous use of the active substance as a biocide or in veterinary medicine 789
is reported and all available information submitted, to appropriately consider possible 790
11 for livestock and consumers, respectively

Establishment of the residue definition for dietary risk assessment
EFSA Journal 2016;14(issue):NNNN 25
cumulated exposure due to different uses of the same substance. Also, where the structure of a 791
metabolite is identical to that of another registered active substance all accessible information 792
will be provided, to take into account in the frame of TTC assessments for screening of dietary 793
non-relevance, and to inform risk managers on additional sources of exposure. 794
795
In principle, where metabolites are excluded from the residue definition based on exposure estimates 796
falling below the appropriate trigger (TTC, livestock dietary burden), the residue definitions are only 797
applicable within the boundaries of this specific exposure assessment. If a more critical residue 798
situation is created e.g. by extension of uses or number of applications, even within the assessed crop 799
groups (e.g. root crops, cereals, fruit crops), affirmation of the established residue definition by an 800
updated exposure assessment is required. However, if the metabolism data used for the initial 801
assessment of the residue definition are truly corresponding to realistic worst case conditions and are 802
covering an extensive range of uses12
, and any complementing relevant information with regard to 803
other sources of exposure to the active substance or its metabolites is complete, the necessity for a 804
soon revision is less probable. 805
Metabolites identified exclusively in plant feed items need to be considered for the livestock dietary 806
burden calculation when detected at significant proportions and levels (≥10% TRR and ≥0.01 mg/kg). 807
In addition, all metabolites deemed relevant for food items (≥10% TRR and ≥0.01 mg/kg, OR 808
≥0.05 mg/kg, respectively) that can be used as feed items have to be included for livestock dietary 809
burden estimates. In case the exposure to livestock is comprised mostly of minor metabolites, the 810
overall dietary burden should yet be assessed. In this case a case by case evaluation is required, and 811
the scrutiny necessary in this evaluation will likely be driven by the structural and intrinsic properties 812
of these minor metabolites (e.g. a metabolite with a structure indicating it might be highly fat-soluble 813
or itself hardly metabolised may require more thorough considerations than a metabolite lacking such 814
properties). If exposure is significant and there is the potential that measurable residues may be 815
transferred into animal commodities, a best estimate of the levels (or a likely range of levels) of the 816
metabolite residues should be provided. The applicability of the available livestock data with parent to 817
the metabolites under assessment should be discussed. 818
5.2. Metabolite residue input levels for exposure calculation 819
Assessments should be made for the target PHI, even if this may not always represent the worst case 820
residue situation for all metabolites individually. However, in case of suspected genotoxicity of 821
metabolites (based on (Q)SAR, new alerts, in vitro tests), the maximum occurrence of metabolites at 822
the target PHI or later should be calculated and exposure compared to the adequate trigger and highest 823
consumption (equivalent to short-term consumer risk assessments). The reason is the underlying 824
assumption of non-thresholded genotoxicity, where a single exposure event may already provoke a 825
genotoxic effect. Where metabolites are grouped based on their common genotoxicity endpoint of 826
concern (i.e. point mutation, structural and numerical chromosome aberrations), the occurrence of 827
these metabolites should be assessed based on their critical occurrence level at a specific PHI (the 828
“worst case PHI”). Combination of different PHIs for metabolites within one group is not considered 829
adequate. 830
As a first step of exposure assessment, median and maximum residue levels for every single 831
metabolite or for a group of metabolites as appropriate should be derived. These should be based on as 832
much information as possible. 833
i) Best data would be measured levels from residue field trials (assisted by targeted processing 834
studies, if applicable) or livestock feeding studies performed under realistic worst case 835
conditions. If measured data are available, but not conforming GAP or anticipated dietary 836
burden levels (parent and metabolites), approximation to more realistic conditions should be 837
12 e.g. where a number of MRL applications are part of dossier submission

Establishment of the residue definition for dietary risk assessment
EFSA Journal 2016;14(issue):NNNN 26
attempted to receive highest and mean metabolite levels (linear extra- or intrapolation to GAP 838
rate according to the generally accepted rate range of between 0.3x and 4x the GAP rate, 839
respecting the limitations of this approach; refer to EFSA, 2015). While scaling of residue 840
field trial data has been investigated and confirmed as appropriate within the ranges 841
established, for livestock, toxicokinetic information should be used to assess if interpolation 842
can be made to adjust for a different exposure rate of the animal than investigated in tests and 843
studies. 844
ii) If such data are not available, conversion factors (residue level of indicator compound 845
divided by residue level of metabolite) should be derived from appropriate metabolism and/or 846
field data and be applied to the set of field samples analysed for the indicator compound. This 847
would allow determination of highest and mean metabolite levels. Often, parent compound is 848
an appropriate indicator, however, another main residue compound (dominant metabolite 849
analysed in metabolism and field trials or feeding studies) may provide more reliable 850
estimates of exposure at the relevant sampling stage. If a targeted primary crop metabolism 851
study is available that covers the intended use in terms of the type of crop or crop group, the 852
number and type of applications and sampling, then this study should be preferred for use in 853
exposure assessments over averaged data from a set of metabolism studies not exactly 854
reflecting target conditions. If several metabolism studies cover the same intended use (e.g. by 855
differing only in the radiolabel position), then mean conversion factors should be applied. If 856
no targeted metabolism study is available, adequate mean conversion factors should be 857
derived on base of available data, accompanied by a justification. Considerations should 858
include the type of application (e.g. soil or foliar), number of applications, their interval and 859
sampling stage (rate of metabolism), matrix type, active substance properties (systemic 860
behaviour), differences between metabolism studies (crop groups; mammals). Conversion 861
factors may also be based on intermediate or non-food/non-feed samples. In any case, 862
attention should be given to observed differences between metabolism and field trials (e.g. 863
reduced or enhanced metabolism in field trials compared to metabolism studies as observed by 864
residue levels of the indicator compound). 865
iii) In the context of this guidance, conversion factors are only intended to be used for screening 866
purposes for the relevance assessment of metabolites before setting the final residue 867
definition. It is not intended to supersede data requirements for the generation of field trials 868
according to the residue definition for risk assessment. 869
iv) It is only meaningful to apply conversion factors to field trials, where residues of the indicator 870
compound can be reliably determined in the field (>LOQ in at least 25% of field trials). 871
Where no adequate field data is available, the metabolite input level for exposure assessments 872
can be derived by normalising the metabolism study values to 1N GAP conditions (if outside 873
±25% of application rate), thus resulting in a single residue value. This value, derived for one 874
(or more) model crops in metabolism studies, may need to be extrapolated to all intended 875
crops for exposure assessment. Where only one indicator residue value from field trials is 876
available ≥ LOQ, the highest residue from field and (normalised) metabolism studies should 877
be used. 878
v) The same principles for exposure assessments should apply to primary and rotational crops 879
(conversion factors, selection of indicator compound, preference of field data over metabolism 880
data, normalisation and extrapolation of crops). 881
Special consideration should be given to the effective N rate, at which rotational crop studies 882
are performed. The N rate is understood as the ratio of actual residues in the soil under study 883
conditions to the maximum likely residue soil situation comprising the background levels 884
from long-term use as well as realistic seasonal applications (e.g. crop failure is likely to be 885
relevant after early applications at growth stages, where crop damage cannot be excluded, 886
while it is unlikely to be relevant after applications immediately prior to harvest). 887

Establishment of the residue definition for dietary risk assessment
EFSA Journal 2016;14(issue):NNNN 27
Exposure estimates for rotational crops may be normalised to 1N rate. The following should 888
be considered in the derivation of 1N rate: 889
The expected maximum background levels of parent and metabolites after GAP 890
compliant use are calculated based on empirically derived kinetic types, degradation 891
half-lifes and specific boundary conditions. Such background levels for assessment 892
should be adopted from the environmental fate assessment of parent and metabolites 893
and expressed in terms of g as/ha for scaling purposes. Documented evidence of 894
reduced bioavailability of soil residues over time (“aging”) may be used for 895
refinement. 896
If soil residue data for parent and metabolites are - together with the plant residue 897
data - available in rotational crop studies, these should be preferred for comparison 898
with the predicted soil background levels to calculate the effective N rate, especially 899
where metabolites show significant transfer from soil into the crops. Thereby, the soil-900
plant transfer of relevant metabolites in the rotational crop studies at the different 901
plant-back intervals can be quantitatively assessed. Individual N rates may be derived 902
for parent and metabolites. 903
Where soil residue data are provided within a rotational crop study for one sampling 904
point only, the time-dependent occurrence of metabolites might be calculated. 905
Where no soil residue data are provided in the study reports and the active substance 906
and/or metabolites are considered as persistent with accumulation over years of GAP 907
compliant use, the transfer of soil residues into rotational crop has to be estimated 908
based on the calculated mean concentration of residues in soil under study conditions 909
and the maximum occurrence in the rotational field crops. 910
A case should be provided for the set-up of the scenario used for decision making. 911
Rotational crop studies are usually performed on a set of model crops (cereals, root and tuber 912
vegetable, leafy crop). In case of accumulating compounds, where assumptions on the likely 913
crop rotation can hardly be made for years, extrapolation to all potential field crops may be 914
required. 915
6. Assessment of stereoisomers (enantiomers and diastereoisomers) for the parent and 916
metabolites 917
The current data requirements for plant protection products indicate that the information provided 918
must be sufficient to permit an evaluation to be made on the nature and extent of the risks for 919
consumers from exposure to the active substance, its metabolites, degradation and reaction products, 920
where they are of toxicological significance, and also that it is necessary to establish the isomeric 921
composition and possible metabolic conversion of isomers when relevant. This does also include the 922
case when metabolites are isomers of the active substance, i.e. when interconversion (induced 923
enzymatically, photochemically, microbially, thermally, or in a different manner) leads to the 924
generation of isomers of the active substance that do not match the technical specification of the latter. 925
The impact of stereochemistry on the toxicological relevance of pesticide metabolites for dietary risk 926
assessments has previously been discussed in detail (EFSA PPR Panel, 2012). Since isomers may 927
differ in their toxicological potency or profile, changes in stereoisomeric compositions need to be 928
considered for the risk assessment. Therefore, the potential differences between the toxicologically 929
tested isomeric mixture(s) and the stereoisomeric composition of the residues to which humans will be 930
exposed need to be addressed. 931
Guidance regarding the technical aspects of addressing the aspects including basic chemical 932
evaluations, approaches to study design, sampling and analysis strategies or similar aspects relevant 933
for obtaining information on the stereochemical composition of the residues is considered out of scope 934
of this document. For guidance on these matters, a “Guidance of EFSA on completing risk 935

Establishment of the residue definition for dietary risk assessment
EFSA Journal 2016;14(issue):NNNN 28
assessments for active substances of plant protection products that have stereoisomers and for 936
transformation products of any active substances where these transformation products may have 937
stereoisomers” is currently under development (hereinafter referred to as EFSA Guidance on isomers). 938
Moreover, the criteria to determine whether or not a change in the stereoisomer compositions is 939
significant (in terms of residue analysis) will also be defined in the ESFA Guidance on isomers, taking 940
into account the variability that can be reasonably expected in the analytical results obtained with 941
stereo-selective methods used in radiolabelled metabolism studies and/or in field studies. 942
With regard to the dietary risk assessment considerations for isomers, a stepwise approach is proposed 943
in this guidance document. The stepwise approach can be initiated with either considerations on the 944
exposure profile or on the hazard characterisation of the different isomers whatever is deemed 945
most suitable and adequate for the specific situation. A special case is derived in terms of the 946
evaluation of the genotoxic potential of isomers. 947
6.1. Exclusion of genotoxicity for isomers or changed isomeric compositions 948
Since biological systems are chiral entities, in a chiral environment stereoisomers can show selective 949
absorption, accumulation, enzyme interactions and metabolism, receptor interactions and DNA 950
binding. Consequently each stereoisomer or isomeric mixture can have different kinetic, dynamic and 951
toxicological profile. With the DNA 3D structure certain compounds could interact stereo selectively. 952
Examples include Cis-platin (Boudvillain et al., 1995; Kasparkova et al., 2008; Marchan et al., 2004) 953
and transformations leading to epoxide intermediates which are particularly prone to stereo selective 954
mutagenicity and carcinogenicity i.e. Aflatoxin B1 (Stewart et al., 1996, Iyer et al., 1994) and styrene 955
7,8-epoxide. 956
For pesticide substances there is substantial evidence of stereo-selective metabolism, stereo-selective 957
toxicity and also data on isomerisation in the environment, but no examples for stereo-selective 958
genotoxicity of pesticides or their metabolites are currently known. Such conditions may not be 959
completely excluded i.e. stereo-selective genotoxicity might not have been discovered by studies; 960
however (Q)SAR analysis predict structural alerts independently from the stereochemical 961
composition. 962
The low level of uncertainties linked to the potential genotoxicity of isomers or different isomer 963
compositions of a compound leads to the conclusion that isomers and changes in the isomers 964
composition is not anticipated to be a genotoxicity concern and will be not further addressed by the 965
guidance. 966
6.2. Isomer assessment step 1 Exposure profile 967
The stereoisomeric ratio to which humans will be exposed has to be defined. 968
Different outcomes from the investigation of the isomeric composition of the residues in consumable 969
crop parts/commodities are possible, making it difficult to suggest a generic strategy that will cover all 970
situations; however, the most likely cases are expected as follows: 971
972
Case 1: The stereoisomeric ratio of the active substance and the pertinent metabolites (i.e. 973
metabolites evaluated in module 2 for which the stereoisomeric composition should be known), found 974
in samples from nature-of-residues studies across different crops (including rotational crops) and at 975
different sampling times, as well as in livestock metabolism studies where appropriate, show no 976
difference in stereoisomeric ratio compared to the parent and the metabolites addressed in module 2. 977
In this case, it is important that the mixture composition used in the key study performed to assess the 978
hazard in module 2 is reflecting the mixture composition of the residues studies. In the case of ‘no 979
difference’ further investigation of isomer ratios is not required, and the magnitude of residue studies 980
with analysis of residues as the sum of the respective stereoisomers are appropriate to be used for 981
dietary exposure and risk assessments. No further isomer-specialised hazard assessment is required. 982

Establishment of the residue definition for dietary risk assessment
EFSA Journal 2016;14(issue):NNNN 29
Case 2: The stereoisomeric compositon of residues found in the nature-of-residues studies 983
show a significant difference compared to the stereoisomeric ratio of parent and compounds addressed 984
in module 2, and these changes are consistently observed across crops / commodities and different 985
sampling / harvesting intervals (and number of available studies satisfies the criteria set out in current 986
guidance for establishing a global residue definition). Further investigation of isomer ratios in residue 987
trials is not necessarily required. Hazard evaluation should be conducted. 988
Case 3: The stereoisomeric composition of residues found in samples from the nature-of-989
residue studies show a difference compared to parent and compounds addressed in module 2 or the 990
composition / ratio of isomers found in the nature-of-residue studies is not coherent across the crops / 991
commodities, in particular when showing a change of the isomeric ratio into different directions (for 992
both the active substance and pertinent metabolites). Hazard evaluation should be conducted. In a case 993
where a significant impact of the isomer ratio on the observed toxicity is expected, robust data for 994
exposure assessment become necessary. Studies on the magnitude of residues (decline and at harvest 995
trials, processing trials, rotational crop trials, feeding studies as appropriate) have to be conducted 996
using stereoselective analytical methods for. This applies to all crops and commodities to be assessed 997
in order to generate a representative number of results. With regard to representativeness the same 998
standards should be applied as defined by current guidance on magnitude-of-residue studies. 999
6.3. Isomer assessment step 2: Hazard evaluation 1000
The stereoisomeric composition established as the likely exposure profile should be compared with 1001
that of the material used in the toxicological studies conducted with parent or metabolites, if that is the 1002
case. If no significant change in composition (including ratio) is observed, the data for the 1003
toxicologically tested substance should be used for risk assessment. 1004
Upon assessment of the study results, and where feasible, a case might be made for waiving further 1005
toxicological testing by deriving a factor to describe the change of ratio of the individual isomers in 1006
residue studies compared to the ratio initially tested in the toxicology studies for the parent and 1007
metabolites if is the case. This factor can be used as an equivalence/correction factor in the dietary risk 1008
assessment. This conservative approach might be meaningful mostly when the number of isomers is 1009
very limited, and the uncertainty added to the risk assessment by using such factors is noted. 1010
This worst case approach may be taken for the derivation of the ADI by applying a factor of two when 1011
the mixture is a sample racemate of two isomers and is based on the assumption that the biological 1012
activity (i.e. target effect, toxicodynamic and toxicokinetic/metabolism properties) is due to one 1013
isomer which is representing all residue. 1014
A larger factor can be applied for compounds with more than one chiral centre with the assumption 1015
that all biological activity is due to the isomer present in the smallest proportion and that all residues in 1016
food are present in this form. This approach is however considered to be very conservative though it 1017
could be used for the definition of “significant changes” in isomer composition and then trigger further 1018
considerations when exposure is above the ADI. 1019
When significant change in isomer composition is detected in residue studies, the next step is the 1020
hazard evaluation of the isomeric mixture considering all the available data on isomers present in the 1021
mixture and the nature and severity of the toxicological effects observed with the mixture. The aim 1022
is to conclude if the stereoisomers will contribute qualitatively and quantitative to the hazard. This 1023
should be done by providing supporting evidences. Supporting evidences can be provided by 1024
additional investigations as described in the module 2 of this guidance and by making use of in-vitro 1025
and/or in-vivo studies to investigate initially the toxicological and metabolic properties of the mixture 1026
and, if is the case, of the single enantiomer. 1027
If the hazard evaluation concludes that no quantitative and/or qualitative differences are likely and this 1028
is scientifically justifiable, the risk assessment based on total exposure to all stereoisomers is 1029

Establishment of the residue definition for dietary risk assessment
EFSA Journal 2016;14(issue):NNNN 30
appropriate. If conclusion cannot be made, the risk assessment will be made by considering the 1030
specific isomeric hazard characterisation to provide a specific ADI. 1031
6.4. Isomer assessment step 3: Consumer risk assessment 1032
Both acute and chronic risk assessments need to be considered. As for case 1 and 2, the consumer risk 1033
assessment is conducted against the toxicological reference values derived for the residue of concern 1034
from the data package deemed suitable. 1035
As for case 2 and 3, if data on the toxicity of individual isomers and quantitative data on the isomeric 1036
composition of residues in food are available, calculation of the consumer intake can be carried out. 1037
7. Uncertainties 1038
This chapter is still under development and might be changed according to the Scientific Committee 1039
guidance on uncertainty in scientific assessment (pending adoption). 1040
In its Scientific Opinion the PPR Panel (EFSA PPR Panel, 2012) proposed different levels of 1041
uncertainties analysis (i.e. qualitative, deterministic or probabilistic) for the uncertainties affecting the 1042
assessment. It is assumed that the uncertainty assessment will take into account case by case 1043
circumstances and that will be used to identify critical areas that need further refinement. PPR Panel 1044
(2012) recommended initially, all significant uncertainties to be evaluated qualitatively; however, if 1045
the outcome is not considered clear enough for a decision making, those critical uncertainties should 1046
be analysed quantitatively. 1047
A tabular approach is recommended for evaluation and expression of uncertainties affecting the 1048
residue definition. 1049
Table 1. Tabular approach for evaluation and expression of uncertainties affecting the residue 1050
definition. The +/– symbols indicate whether each source of uncertainty has the potential to make the 1051
true risk higher (+) or lower (–) than the indicated outcome. The number of symbols provides a 1052
subjective relative evaluation of the magnitude of the effect (e.g. +++ indicates an uncertainty that 1053
could make the true risk much higher). If the effect could vary over a range, lower and upper 1054
evaluations are given (e.g. + / ++). If possible, the user should indicate the meaning of different 1055
numbers of symbols (e.g. two symbols might be used to represent a factor of 5, and three symbols a 1056
factor of 10). Finally, the combined impact of all the uncertainties is evaluated subjectively. More 1057
detail on the rationale for these evaluations (especially for the more important uncertainties and the 1058
overall uncertainty) should be provided as separate text accompanying the table. 1059
Source of uncertainty Magnitude and direction of influence
Concise description of source of uncertainty Symbols to show evaluation of influence (e.g.:
+/++)
Insert one row for each source of uncertainty
affecting the assessment
Overall evaluation of uncertainty affecting the
assessment outcome
Add narrative text here, describing the assessor’s
subjective evaluation of the overall degree of
uncertainty affecting the assessment outcome,
taking account of all the uncertainties identified
Evaluation of overall uncertainty (e.g., - - - /+)

Establishment of the residue definition for dietary risk assessment
EFSA Journal 2016;14(issue):NNNN 31
above.
1060
1061
A number of uncertainties having a potential impact on the residue definition (and therefore ultimately 1062
on the dietary risk assessment) were noted across the different steps described in this guidance 1063
document and they were listed below. The list should be intended as indicative and a more thorough 1064
evaluation should be performed on a case by case basis as the uncertainties are largely dependent on 1065
the amount and quality of the available data. 1066
Exclusion of genotoxicity using of (Q)SAR and read across. In particular, the use of read 1067
across for further assessment of chemical structures of concern following the (Q)SAR is a 1068
potential source of uncertainties. 1069
Grouping and read across are applied as a tool to support the general toxicological 1070
assessment of metabolites and this is a potential source of uncertainties. 1071
The use of TTC as a screening tool in the toxicological risk assessment of residues was 1072
considered a source of uncertainties, particularly because of the uncertainties linked to the 1073
exposure scenario. 1074
Differential metabolism of the isomers may lead to a predominance of one of the isomers 1075
in animals or plants and this is considered a source of uncertainties in the toxicity 1076
evaluation of residues. 1077
The exclusion criteria based on simple structural changes is a source of uncertainties, 1078
particularly when dealing with endpoints of chronic toxicity. Metabolism of a chemical 1079
often comprises, among others, demethylation or hydroxylation of a ring structure. It is 1080
assumed that the simple demethylation or hydroxylation of a ring structure without 1081
opening the ring will not increase the toxicity of the metabolite. This assumption is based 1082
on a conclusion in an External Scientific Report to EFSA prepared by AGES (2010). It is 1083
noted that AGES based this conclusion on data obtained mostly from acute toxicity 1084
studies. AGES also noted that there are some compounds were hydroxylation of a ring 1085
structure may increase its toxicity (e.g. hydrochinon). Therefore, some uncertainty 1086
remains on the applicability to predict the toxicity after short-term or long-term exposure. 1087
In the context of this guidance thresholds are applied across multiple steps of the decision 1088
scheme. They are arbitrary in their nature and considered a source of uncertainties. The 1089
use of the ADME study conducted in rodent species is a relevant source of uncertainties, 1090
particularly when dealing with effects observed in different species, pregnant animals or 1091
in the foetus. 1092
A number of uncertainties are linked to the experimental conditions applied for the 1093
characterisation of the metabolic and toxicological profile of the parent substance and of 1094
the metabolites. 1095
The lack of information about the nature and quantity of unidentified residues needs to 1096
find due considerations in the uncertainty assessment. 1097
Metabolite exposure assessment has to rely not only on the available data, but on 1098
extrapolations and additional assumptions of varying degrees of uncertainty, whose 1099
inherent uncertainties need to be addressed. Risk managers should be informed about 1100
additional sources of exposure (e.g. groundwater, metabolites common to other active 1101
substances). 1102
The potential contribution of individual metabolites to adequate reference values is 1103
assessed under step 19; a detailed uncertainty analysis covering the overall level of 1104
conservatism for the chosen scenario can be provided upon request of risk management. 1105
1106
1107
1108
1109
1110
1111

Establishment of the residue definition for dietary risk assessment
EFSA Journal 2016;14(issue):NNNN 32
REFERENCES 1112
1113
AGES (Austrian Agency for Health and Food Safety), 2010. Impact of metabolic and degradation 1114
processes on the toxicological properties of residues of pesticides in food commodities. External 1115
scientific report. EFSA. Available from: http://www.efsa.europa.eu/en/supporting/pub/449e.htm 1116
Ashby J and Tennant RW, 1988. Chemical structure, Salmonella mutagenicity and extent of 1117
carcinogenicity as indicators of genotoxic carcinogenesis among 222 chemicals tested in rodents by 1118
the U.S. NCI/ NTP. Mutation Research, 204, 17-155. 1119
Ashby J and Tennant RW, 1991. Definitive relationships among chemical structure, carcinogenicity 1120
and mutagenicity for 301 chemicals tested by the U.S. NTP. Mutation Research/reviews in genetic 1121
Toxicology, 257, 3, 229–306. 1122
Bailey A, Chanderbhan N, Collazo-Braier N, Cheesman M and Twaroski M, 2005. The use of 1123
structure-activity relationship analysis in the food contact notification program. Regulatory 1124
Toxicology and Pharmacology, 42, 225-235. 1125
Benigni R and Bossa C, 2008. Predictivity and reliability of (Q)SAR models: The case of mutagens 1126
and carcinogens. Toxicology Mechanisms and Methods, 18(2-3), 137-147. 1127
Blackburn K, Daston G, Fisher J, Lester C, Naciff JM, Rufer ES, Stuard SB and Woller K, 2015. A 1128
strategy for safety assessment of chemicals with data gaps for development and/or reproductive 1129
toxicity. Regulatory Toxicology and Pharmacology, 72, 202-215. 1130
Boudvillain M, Dalbies R, Aussourd C, Leng M, 1995. Intrastrand cross-links are not formed in the 1131
reaction between transplatin and native DNA: relationm with the clinical inefficency of transplatin. 1132
Nucleic Acids Research, 23, 2381-2388. 1133
Creasy DM, 2003. Evaluation of testicular toxicology: A synopsis and discussion of the 1134
recommendations proposed by the society of toxicologic pathology. Birth Defects Res (part B), 68, 1135
408-415. 1136
ECHA (European Chemicals Agency), 2008. Guidance on Information Requirements and Chemical 1137
Safety Assessment. Chapter R6. ECHA, Helsinki, Finland. 134pp. Available online: 1138
http://echa.europa.eu/documents/10162/13632/information_requirements_r6_en.pdf. 1139
ECHA (European Chemicals Agency), 2013. Grouping of substances and read across approach, Part1. 1140
ECHA, Helsinki, Finland. Availible online: 1141
http://echa.europa.eu/documents/10162/13628/read_across_introductory_note_en.pdf. 1142
ECHA (European Chemicals Agency), 2015. Read across Assessment Framework, ECHA, Helsinki, 1143
Finland. Available online: http://echa.europa.eu/documents/10162/13628/raaf_en.pdf 1144
EFSA (European Food Safety Authority), 2015, Residues trials and MRL calculations - Proposals for 1145
a harmonised approach for the selection of the trials and data used for the estimation of MRL, 1146
STMR and HR. Available online: 1147
http://ec.europa.eu/food/plant/docs/pesticides_mrl_guidelines_plant_mrl_calculations_2015_en.pdf 1148
EFSA Scientific Committee, 2011. Scientific Opinion on genotoxicity testing strategies applicable to 1149
food and feed safety assessment. EFSA Journal 2011;9(9):2379, 69 1150
pp.doi:10.2903/j.efsa.2011.2379 1151
EFSA Scientific Committee, 2012. Scientific Opinion on exploring options for providing advice 1152
about possible human health risks based on the concept of Threshold of Toxicological Concern 1153
(TTC). EFSA Journal 2012;10(7):2750, 103 pp. doi:10.2903/j.efsa.2012.2750 1154

Establishment of the residue definition for dietary risk assessment
EFSA Journal 2016;14(issue):NNNN 33
EFSA PPR Panel (EFSA Panel on Plant Protection Products and their Residues), 2012.Scientific 1155
Opinion on Evaluation of the Toxicological Relevance of Pesticide Metabolites for Dietary Risk 1156
Assessment. EFSA Journal 2012;10(07):2799, 187pp. doi:10.2903/j.efsa.2012.2799 1157
EFSA PPR Panel (EFSA Panel on Plant Protection Products and their Residues), 2013. Scientific 1158
Opinion on relevance of dissimilar mode of action and its appropriate application for cumulative 1159
risk assessment of pesticides residues in food. EFSA Journal 2013;11(12):3472, 40 pp. 1160
doi:10.2903/j.efsa.2013.3472 1161
EFSA Panel on Plant Protection Products and their Residues (PPR), 2014. Scientific Opinion on the 1162
identification of pesticides to be included in cumulative assessment groups on the basis of their 1163
toxicological profile (2014 update). EFSA Journal 2013;11(7):3293, 131 pp. 1164
doi:10.2903/j.efsa.2013.3293 1165
1166
Enoch SJ and Cronin MTD, 2012. Development of new structural alerts suitable for chemical category 1167
formation for assigning covalent and non-covalent mechanisms relevant to DNA binding. Mutation 1168
Research – Reviews, 743 (1–2), 10–19. 1169
1170
EC (European Commission), 1997. Guidance Document, Appendix A - Metabolism and Distribution 1171
in Plants 7028/VI/95 rev.3. EC, Brussels, 13pp. Available online: 1172
http://ec.europa.eu/food/plant/pesticides/max_residue_levels/guidelines/index_en.htm. 1173
FAO (Food and Agriculture Organization of the United Nations), 2009. FAO Manual on the 1174
Submission and Evaluation of Pesticide Residues Data; Plant Production and Protection Paper 197; 1175
Rome 2009 (second edition) 1176
Gleeson MP, Modi S, Bender A, Robinson RL, Kirchmair J, Promkatkaew M, Hannongbua S, and 1177
Glen RC, 2012. The challenges involved in modelling toxicity data in-silico: a review. Current 1178
pharmaceutical design, 18 (9), 1266-1291. 1179
Iyer RS, Coles BF, Raney KD, Thier R, Guengerich FP and Harris TM. 1994. DNA adduction by the 1180
potent carcinogen aflatoxin B1: Mechanistic studies. Journal of American Chemical Society, 116, 1181
1603–1609. 1182
Kasparkova J, Marini V, Bursova V and Brabec V, 2008. Biophysical Studies on the Stability of 1183
DNA Intrastrand Cross-Links of Transplatin. Biophysical Journal, 95, 4361-4371. 1184
Kazius J, McGuire R and Bursi R, 2005. Deviation and validation of toxicophores for mutagenicity 1185
prediction. Journal of Medicine Chemistry, 48 (1), 312-320. 1186
Kirkland D, Zeiger E, Madia F, Gooderham N, Kasper P, Lynch A, Morita T, Ouedraogo G, Parra 1187
Morte JM, Pfuhler S, Rogiers V, Schulz M, Thybaud V, van Benthem J, Vanparys P, Worth A and 1188
Corvi R, 2014a. Can in vitro mammalian cell genotoxicity test results be used to complement 1189
positive results in the Ames test and help predict carcinogenic or in vivo genotoxic activity? I. 1190
Reports of individual databases presented at an EURL ECVAM Workshop. Mutation 1191
Research/Genetic Toxicology and Environmental Mutagenesis, 775–776, 55-68. 1192
Kirkland D, Zeiger E, Madia F and Corvi R, 2014b. Can in vitro mammalian cell genotoxicity test 1193
results be used to complement positive results in the Ames test and help predict carcinogenic or in 1194
vivo genotoxic activity? II. Construction and analysis of a consolidated database. Mutation 1195
Research/Genetic Toxicology and Environmental Mutagenesis, 775–776, 69-80. 1196
Marchan V, Pedroso E and Grandas A, 2004. Insights into the reaction of transplatin with DNA and 1197
proteins: Methionine-mediated formation of histidine-guanine trans-Pt(NH3)(2) cross-links. 1198
Chemistry-a European Journal, 10, 5369-5375. 1199
OECD (Organisation for Economic Co-operation and Development), 1995a. Test No. 418: Delayed 1200
Neurotoxicity of Organophosphorus Substances Following Acute Exposure, OECD Guidelines for 1201

Establishment of the residue definition for dietary risk assessment
EFSA Journal 2016;14(issue):NNNN 34
the Testing of Chemicals, Section 4, OECD Publishing, Paris. 1202
DOI: http://dx.doi.org/10.1787/9789264070905-en 1203
OECD (Organisation for Economic Co-operation and Development), 1995b. Test No. 419: Delayed 1204
Neurotoxicity of Organophosphorus Substances: 28-day Repeated Dose Study, OECD Guidelines 1205
for the Testing of Chemicals, Section 4, OECD Publishing, Paris. 1206
DOI: DOI: http://dx.doi.org/10.1787/9789264070929-en 1207
OECD (Organisation for Economic Co-operation and Development), 1996. Test No. 422: Combined 1208
Repeated Dose Toxicity Study with the Reproduction/Developmental Toxicity Screening Test, 1209
OECD Guidelines for the Testing of Chemicals, Section 4, OECD Publishing, Paris. DOI: 1210
http://dx.doi.org/10.1787/9789264070981-en 1211
OECD (Organisation for Economic Co-operation and Development), 1997. Test No. 424: 1212
Neurotoxicity Study in Rodents, OECD Guidelines for the Testing of Chemicals, Section 4, OECD 1213
Publishing, Paris. DOI: http://dx.doi.org/10.1787/9789264071025-en 1214
OECD (Organisation for Economic Co-operation and Development), 2001a. Test No. 414: Prenatal 1215
Development Toxicity Study, OECD Guidelines for the Testing of Chemicals, Section 4, OECD 1216
Publishing, Paris. DOI: http://dx.doi.org/10.1787/9789264070820-en 1217
OECD (Organisation for Economic Co-operation and Development), 2001b. Test No. 416: Two-1218
Generation Reproduction Toxicity, OECD Guidelines for the Testing of Chemicals, Section 4, 1219
OECD Publishing, Paris. DOI: http://dx.doi.org/10.1787/9789264070868-en 1220
OECD (Organisation for Economic Co-operation and Development), 2007a. Guidance Document on 1221
the Validation of (Quantitative) Structure Activity Relationship ((Q)SAR) Models. OECD Series 1222
on Testing and Assessment No. 69.ENV/JM/MONO(2007)2. OECD Publishing, Paris. Available 1223
at: http://www.oecd.org/ 1224
OECD (Organisation for Economic Co-operation and Development), 2007b. Guidance on Grouping 1225
of Chemicals. Series on Testing and Assessment Number 80.ENV/JM/MONO(2007)28. OECD 1226
Publishing, Paris. Available at: http://www.oecd.org/ 1227
OECD (Organisation for Economic Co-operation and Development), 2007c. Test No. 503: 1228
Metabolism in Livestock, OECD Guidelines for the Testing of Chemicals, Section 5, OECD 1229
Publishing, Paris. DOI: http://dx.doi.org/10.1787/9789264061873-en 1230
OECD (Organisation for Economic Co-operation and Development), 2007d. Test No. 426: 1231
Developmental Neurotoxicity Study, OECD Guidelines for the Testing of Chemicals, Section 4, 1232
OECD Publishing, Paris. DOI: http://dx.doi.org/10.1787/9789264067394-en 1233
OECD (Organisation for Economic Co-operation and Development), 2008. Test No. 407: Repeated 1234
Dose 28-day Oral Toxicity Study in Rodents, OECD Guidelines for the Testing of Chemicals, 1235
Section 4, OECD Publishing, Paris. DOI: http://dx.doi.org/10.1787/9789264070684-en 1236
OECD (Organisation for Economic Co-operation and Development), 2009a. Series on testing and 1237
assessment No. 63 and Series on pesticides No. 31 guidance document on the definition of residue; 1238
ENV/JM/MONO(2009)30; 28-Jul-2009 1239
OECD (Organisation for Economic Co-operation and Development), 2009b. Test No. 451: 1240
Carcinogenicity Studies, OECD Guidelines for the Testing of Chemicals, Section 4, OECD 1241
Publishing, Paris. DOI: http://dx.doi.org/10.1787/9789264071186-en 1242

Establishment of the residue definition for dietary risk assessment
EFSA Journal 2016;14(issue):NNNN 35
OECD (Organisation for Economic Co-operation and Development), 2009c. Test No. 452: Chronic 1243
Toxicity Studies, OECD Guidelines for the Testing of Chemicals, Section 4, OECD Publishing, 1244
Paris. DOI: http://dx.doi.org/10.1787/9789264071209-en 1245
OECD (Organisation for Economic Co-operation and Development), 2009d. Test No. 453: Combined 1246
Chronic Toxicity/Carcinogenicity Studies, OECD Guidelines for the Testing of Chemicals, Section 1247
4, OECD Publishing, Paris. DOI: http://dx.doi.org/10.1787/9789264071223-en 1248
OECD (Organisation for Economic Co-operation and Development), 2011. Test No. 443: Extended 1249
One-Generation Reproductive Toxicity Study, OECD Guidelines for the Testing of Chemicals, 1250
Section 4, OECD Publishing, Paris.DOI: http://dx.doi.org/10.1787/9789264122550-en 1251
OECD (Organisation for Economic Co-operation and Development), 2014, Series on testing & 1252
assessment No 194. Guidance on grouping of Chemicals. Second edition. OECD Publishing, Paris. 1253
Patlewicza G, Ballb N, Boothc E, Hulzebosd E, Zvinavashee E and Hennesf C, 2013. Use of 1254
category approaches, read across and (Q)SAR: General considerations. Regulatory Toxicology and 1255
Pharmacology, 67 (1), 1–12. 1256
Russell LD, Ettlin RA, Sinha Hikim AP and Clegg ED, 1990. Histological and histopathological 1257
evaluation of the testis. Cache River Press, Clearwater, FL. (1990) 1258
Serafimova R, Todorov M, Nedelcheva D, Pavlov T, Akahori Y, Nakai M and Mekenyan O, 2007. 1259
QSAR and mechanistic interpretation of estrogen receptor biding. SAR ad QSAR in Environmental 1260
Research, 18 (3), 389-421. 1261
Stewart RK, SerabjitSingh CJ and Massey TE, 1996. Glutathione S-transferase-catalyzed conjugation 1262
of bioactivated aflatoxin B-1 in rabbit lung and liver. Toxicology and Applied Pharmacology 140, 1263
499-507. 1264
Worth AP, Fuart-Gatnik M, Lapenna S, Lo Piparo E, Mostrag-Szlichtyng A and Serafimova R, 2010. 1265
Applicability of QSAR analysis to the evaluation of the toxicological relevance of metabolites and 1266
degradates of pesticide active substances for dietary risk assessment. Final report of a project 1267
carried out by the JRC for the European Food Safety Authority (EFSA). Available from: 1268
http://www.efsa.europa.eu/en/scdocs/scdoc/50e.htm 1269
Worth A, Fuart-Gatnik M, Lapenna S, Lo Piparo E, Mostrag-Szlichtyng A and Serafimova R, 2011a. 1270
The use of computational methods in the toxicological assessment of chemicals in food: current 1271
status and future prospects. JRC report EUR 24748 EN. Publications Office of the European 1272
Union, Luxembourg. Available from: http://publications.jrc.ec.europa.eu/repository/ 1273
Worth A, Lapenna S, Lo Piparo E, Mostrag-Szlichtyng A and Serafimova R, 2011b. A Framework for 1274
assessing in silico Toxicity Predictions: Case Studies with selected Pesticides. JRC report EUR 1275
24705 EN. Publications Office of the European Union, Luxembourg. Available from: 1276
http://publications.jrc.ec.europa.eu/repository/ 1277
Worth A, Lapenna S and Serafimova R, 2013. QSAR and metabolic simulation tools in the assessment 1278
of genotoxicity. Chapter 6 in: Computational Toxicology, Volume II. Methods in Molecular 1279
Biology, Volume 930. B Reisfeld & AN Mayeno (Eds). Humana Press, New York. pp 125-162. 1280
1281

Establishment of the residue definition for dietary risk assessment
EFSA Journal 2016;14(issue):NNNN 36
APPENDICES 1282
Appendix A. ADI and ARfD distribution for pesticide active substances 1283
1. Introduction 1284 In the context of this guidance, separation between major and minor metabolites is made using 1285
arbitrary thresholds. These thresholds have a limited scientific validity; though, they have been used in 1286
the regulatory field in multiple circumstances and for this reason they are generally accepted as a 1287
pragmatic and practical tools. However, because of this arbitrary nature, additional considerations on 1288
the toxicological properties of the parent substance are necessary to accomplish the aim of predicting 1289
whether a metabolite is toxicologically similar or different to the parent substance. In particular, and in 1290
line with the OECD guidance (OECD, 2009), it is important to take into account the potency and the 1291
relevant endpoints of toxicity of the parent substance. In the absence of toxicity data on the 1292
metabolites, the default assumption is that they possess the same toxicological profile as for the parent 1293
substance and the more toxic is the parent compound, the greater is the need for inclusion of the 1294
metabolites in the assessment. In order to propose a definition of potency that could be used to 1295
complement the arbitrary thresholds, an evaluation of the distribution of the ADIs and ARfDs for 1296
European approved active substances was performed, assuming that most of the active substances 1297
eliciting neurotoxic effects are the one with the lower reference values. The data used in performing 1298
this exercise were extracted from the external report on “Investigation of the state of the art on 1299
identification of appropriate reference point for the derivation of health-based guidance values (ADI, 1300
AOEL and AAOEL) for pesticides and on the derivation of uncertainty factors to be used in human 1301
risk assessment” (CRD-HSE, 2013). Additional data were added to the database for the most recently 1302
evaluated active substances by EFSA (until end of 2014) which were not included in the database at 1303
the time of publication. 1304
The Assessment and Methodological Support Unit (AMU) of EFSA was requested to support the 1305
PRAS unit in identifying a data driven distribution of ADIs and ARfDs for pesticide active substances. 1306
2. Material and methods 1307
2.1 Data 1308
Two sets of raw data were provided to the AMU unit. A first set (ADIclean.csv) listed 270 approved 1309
compounds and their related Acceptable Daily Intake (ADI) values. A second set (ARDclean.csv) 1310
listed 195 approved compounds and their related Acute Reference Dose (ARfD) values. 1311
2.2 Methodologies 1312
A simple descriptive statistics was first computed to understand the distribution of the data. The data 1313
were visualised using boxplots. 1314
As a second step, a set of quantiles (from 10% to 50% with steps of 5%) were calculated based on the 1315
available raw data. The quantiles were calculated both for the ADI and the ARfD values. The results 1316
were then plotted in a density graph. 1317
Finally, a set of tables were produced in order to list all the compounds with an ADI or an ARfD value 1318
lower than each threshold. 1319
All analysis were performed in R13
and the following packages were used: 1320
stats 1321
13
R Core Team (2014). R: A language and environment for statistical computing. R Foundation for Statistical Computing,
Vienna, Austria. URL http://www.R-project.org/.

Establishment of the residue definition for dietary risk assessment
EFSA Journal 2016;14(issue):NNNN 37
ggplot2 1322
3. Results 1323
3.1 ADI 1324
The boxplots based on the available data showed a distribution of the data concentrated mainly around 1325
the median value (0.02 – see Figure 1, the white box around the zero value groups the data up the 75th 1326
percentile of the ADI data distribution) with some outliers relatively far from the median (the 1327
maximum value observed is equal to 10, not represented in Figure 1). Table 1 shows the summary 1328
statistics on the ADI values. 1329
Table 1: Summary statistics on ADI values (in mg/kg bw/d) 1330
Min. 1st Qu. Median Mean 3rd Qu Max.
0.00015 0.01 0.02150 0.12970 0.08000 10
1331
0
1
2
3
1 2
adi
ad
i
1332 Figure 1: ADI boxplot. The observations with a value higher than 3 are excluded from the 1333
visualisation. 1334
Figure 2 shows the density distribution of the ADI values. The coloured lines represent the location of 1335
the different quantiles on the distribution. The values are reported in the legend. 1336

Establishment of the residue definition for dietary risk assessment
EFSA Journal 2016;14(issue):NNNN 38
Perc ADI
0.100.150.200.250.300.350.400.450.50
0.0020.0030.0050.0100.0100.0100.0150.0200.022
0
5
10
15
20
0.000 0.025 0.050 0.075 0.100
ADI
de
nsity
1337 Figure 2: Density plot of the ADI values. The coloured lines show the different percentiles and 1338
the correspondent ADI value 1339
In order to have information on the relevant endpoints triggering the distribution of the ADIs, the 1340
distribution of the NOAELs relative to the endpoints of interest was performed for the active 1341
substances included in the external report (n= 224 active substances) (CRD-HSE, 2013). 1342
Results are summarized in Figure 3. 1343

Establishment of the residue definition for dietary risk assessment
EFSA Journal 2016;14(issue):NNNN 39
1344 Figure 3 Plots of the different NOAELs used for the derivation of the ADI separated by target 1345
organ 1346
3.2 ARfD 1347
The boxplots based on the available ARfD data shows the distribution of the data concentrates mainly 1348
around the median value (0.1 mg/kg bw – see Figure 14, the white box around the zero value groups 1349
the data up the 75th percentile of the ARfD data distribution) with some outliers relatively far from the 1350
median. Table 2 shows the summary statistics on the ARfD values. 1351
Table 2: Summary statistics on ARfD values 1352
Min. 1st Qu. Median Mean 3rd Qu Max.
0.0002 0.0275 0.1000 0.2428 0.3000 4.5000
1353
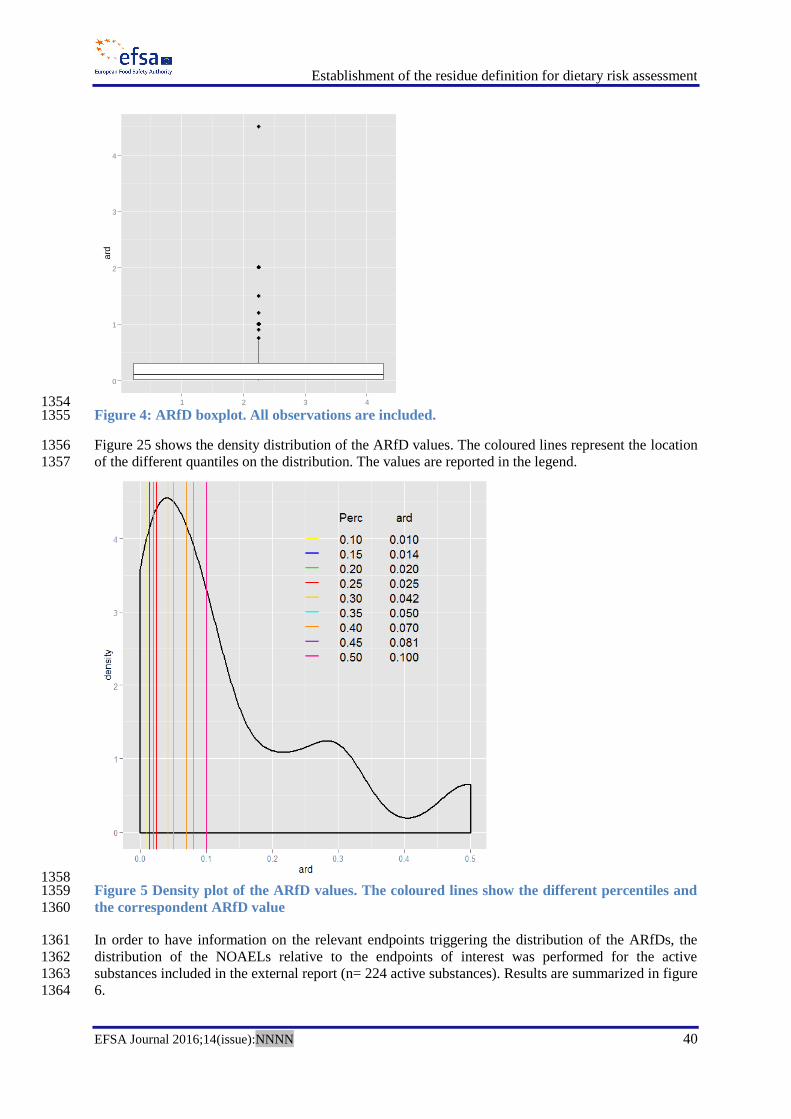
Establishment of the residue definition for dietary risk assessment
EFSA Journal 2016;14(issue):NNNN 40
0
1
2
3
4
1 2 3 4
ard
ard
1354 Figure 4: ARfD boxplot. All observations are included. 1355
Figure 25 shows the density distribution of the ARfD values. The coloured lines represent the location 1356
of the different quantiles on the distribution. The values are reported in the legend. 1357
1358 Figure 5 Density plot of the ARfD values. The coloured lines show the different percentiles and 1359
the correspondent ARfD value 1360
In order to have information on the relevant endpoints triggering the distribution of the ARfDs, the 1361
distribution of the NOAELs relative to the endpoints of interest was performed for the active 1362
substances included in the external report (n= 224 active substances). Results are summarized in figure 1363
6. 1364

Establishment of the residue definition for dietary risk assessment
EFSA Journal 2016;14(issue):NNNN 41
1365 Figure 6 Plots of the different NOAELs used for the derivation of the ARfD separated by target 1366
organ 1367
4. Discussion and Conclusions 1368
The plots of NOAELs (Figure 3) used to derive the ADIs indicate that, other than for clinical signs, 1369
there is a broad range of potencies and none of the end-points is related to either relatively high or low 1370
dose levels. The liver is the most common target and clinical signs are the most frequent endpoint 1371
triggering relatively low ADIs values. 1372
The plots of NOAELs (Figure 6) used to derive the ARfDs indicate that, other than cholinesterase 1373
inhibition, there is a broad range of potencies and none of the end points can be considered as 1374
prevalent. The effects on foetus (and maternal toxicity) and nervous system/clinical signs are the main 1375
targets/end points. 1376
As expected the ADI is more conservative concerning the neurotoxic effects and provides a better 1377
estimation of the distribution of the effect (e.g. effects only observed after repeated dose). 1378
The ADI of 0.01 mg/kg/bw/d is representing the 25th percentile of the ADIs distribution and includes 1379
most of the active substances (approx. 67%) for which neurotoxic effects are relevant and the most 1380
toxic substances for other target organs toxicity in general. The value of 0.01mg/kg/bw/d will only 1381
partially include active substances with developmental effects (maternal and foetal effects). 1382
The ARfD of 0.025 mg/kg/bw is representing the 25th percentile and includes most of substances 1383
(approx. 50%) inducing acute clinical signs and/or neurotoxic effects. However, as for the ADI, this 1384
value only partially covers foetal effects. 1385
Based on these considerations, the ADI dose of <0.01 mg/kg/bw/d and the ARfD of <0.025 mg/kg/bw 1386
are proposed as a threshold to define toxicologically potent substances. 1387
1388

Establishment of the residue definition for dietary risk assessment
EFSA Journal 2016;14(issue):NNNN 42
5. References 1389
OECD (Organisation for Economic Co-operation and Development), 2009. Series on testing and 1390
assessment No. 63 and Series on pesticides No. 31 guidance document on the definition of residue; 1391
ENV/JM/MONO(2009)30; 28-Jul-2009 1392
CRD-HSE (Chemicals Regulation Directorate, Health & Safety Executive, UK), 2013. Investigation 1393
of the state of the art on identification of appropriate reference points for the derivation of health-1394
based guidance values (ADI, AOEL and AAOEL) for pesticides and on the derivation of 1395
uncertainty factors to be used in human risk assessment. Supporting Publications 2013:EN-413. 1396
[169 pp.] 1397
1398

Establishment of the residue definition for dietary risk assessment
EFSA Journal 2016;14(issue):NNNN 43
Appendix B. Case study – Isopoturon (Germany, 2014)14
1399
1400
Step 1: Metabolite identified at any level in residue metabolism (plant) and groundwater studies 1401
1402 Table 1 Isoproturon metabolites 1403
Compound
identifier
Name in Study and Assessment
reports and
SMILES
Structure
Parent Isoproturon
CC(C)c1ccc(NC(=O)N(C)C)cc1
M02 AE F064145 Monodesmethyl
isoproturon
CC(C)c1ccc(NC(=O)NC)cc1
M03 RPA 415044 Hydroxy-mono-
desmethyl
CC(C)(O)c1ccc(NC(=O)NC)cc1
M04 RPA 410365 Hydroxy-didesmethyl
CC(C)(O)c1ccc(NC(N)=O)cc1
M05 RPA 409656
CC(c1ccc(NC(=O)NC)cc1)C(O)=O
M06 RPA 410198
CC(C(O)=O)c1ccc(N)cc1
M07 RPA 410226, sum of isomers
CC(O)(CO)c1ccc(NC(=O)N(C)C)cc1
M07a BD4236D2 (Isomer 1), RPA 410226
M07b BD4236D2 (Isomer 2), RPA 410226
M08 RPA 409658 1-OH-isoproturon
CC(CO)c1ccc(NC(=O)N(C)C)cc1
14 Germany, 2014. Renewal Assessment Report (RAR) on the active substance isoproturon prepared by the rapporteur
Member State Germany in the framework of Regulation (EU) No 1141/2010,February 2014. Available at http://dar.efsa.europa.eu/dar-web/provision
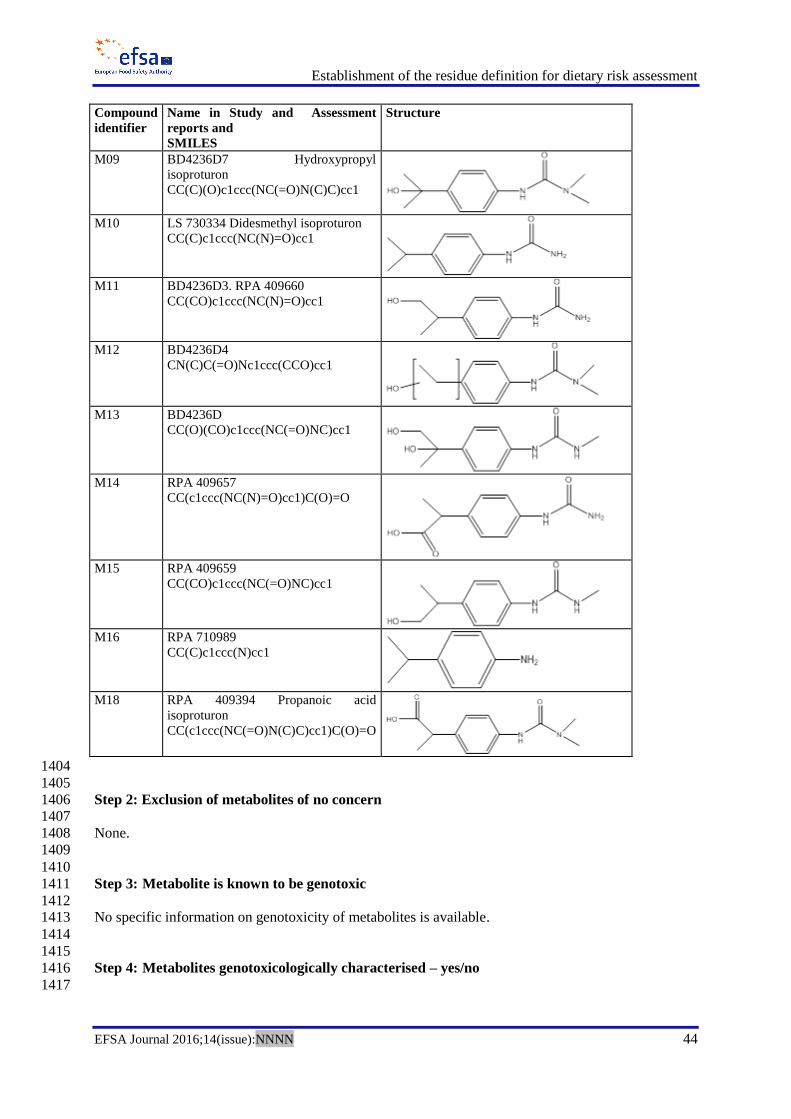
Establishment of the residue definition for dietary risk assessment
EFSA Journal 2016;14(issue):NNNN 44
Compound
identifier
Name in Study and Assessment
reports and
SMILES
Structure
M09 BD4236D7 Hydroxypropyl
isoproturon
CC(C)(O)c1ccc(NC(=O)N(C)C)cc1
M10 LS 730334 Didesmethyl isoproturon
CC(C)c1ccc(NC(N)=O)cc1
M11 BD4236D3. RPA 409660
CC(CO)c1ccc(NC(N)=O)cc1
M12 BD4236D4
CN(C)C(=O)Nc1ccc(CCO)cc1
M13 BD4236D
CC(O)(CO)c1ccc(NC(=O)NC)cc1
M14 RPA 409657
CC(c1ccc(NC(N)=O)cc1)C(O)=O
M15 RPA 409659
CC(CO)c1ccc(NC(=O)NC)cc1
M16 RPA 710989
CC(C)c1ccc(N)cc1
M18 RPA 409394 Propanoic acid
isoproturon
CC(c1ccc(NC(=O)N(C)C)cc1)C(O)=O
1404
1405
Step 2: Exclusion of metabolites of no concern 1406 1407
None. 1408
1409
1410
Step 3: Metabolite is known to be genotoxic 1411
1412 No specific information on genotoxicity of metabolites is available. 1413
1414
1415
Step 4: Metabolites genotoxicologically characterised – yes/no 1416
1417

Establishment of the residue definition for dietary risk assessment
EFSA Journal 2016;14(issue):NNNN 45
Step 4.1 Assessment of metabolites whether they are covered by studies with the parent (Table 1418
2) or specific studies. 1419 1420
Step 4.2 Conclusion 1421 Proceed with genotoxicity assessment (steps 5 to 9) for all metabolites whose toxicological properties 1422
are not covered by the parent compound (shaded in grey) or by specific studies. 1423 Table 2 Assessment of occurrence of isoproturon residue metabolites in toxicological studies with 1424
parent compound (RAR Germany 2014) 1425
Compound Name in Study and
Assessment reports
Occurrence in rat
metabolism
(% administered dose)
Toxicological properties covered by
studies with parent compound
Parent Isoproturon <1 Yes
M02 AE F064145
Monodesmethyl
isoproturon
1 No (specific bacterial mutagenicity
study available)
M03 RPA 415044 Hydroxy-
mono-desmethyl
24 Yes (>10% AD)
M04 RPA 410365 Hydroxy-
didesmethyl
51 Yes (>10% AD)
M05 RPA 409656 8 No
M06 RPA 410198 - No
M07 RPA 410226, sum of
isomers
6 No
M08 RPA 409658 1-OH-
isoproturon
3 No
M09 BD4236D7
Hydroxypropyl
isoproturon
3 No
M10 LS 730334 Didesmethyl
isoproturon
15 Yes (>10% AD)
M11 BD4236D3. RPA
409660
6 No
M12 BD4236D4 - No
M13 BD4236D 11 Yes (>10% AD)
M14 RPA 409657 2 No
M15 RPA 409659 3 No
M16 RPA 710989 - No
M18 RPA 409394 Propanoic
acid isoproturon
2 No
AD: administered dose 1426 1427
Step 5: (Q)SAR prediction of genotoxicity 1428 1429
Step 5.1: Description of (Q)SAR strategy 1430
In order to predict the genotoxic potential (gene mutation and chromosomal aberrations) of the minor 1431
rat and plant specific metabolites, four models have been applied: CAESAR Mutagenicity Model v 1432
2.1.12 - implemented in the VEGA software (v 1.0.8) and DEREK Nexus Mutagenicity Model (v 1433
4.0.6.) for prediction of gene mutation; and a rule base with the structural alerts for in vivo 1434
micronucleus - implemented in the Toxtree v.2.6.6. (R. Benigni, C., O. Tcheremenskaia and A. Worth, 1435
Development of structural alerts for the in vivo micronucleus assay in rodents", European Commission 1436
report EUR 23844) and DEREK Nexus Chromosome Damage model Model (v 4.0.6) for prediction of 1437
chromosomal aberrations 1438
Independently from the predictions of the models, the metabolite(s) will be subject of read across 1439
analysis (step 6). 1440

Establishment of the residue definition for dietary risk assessment
EFSA Journal 2016;14(issue):NNNN 46
Step 5.2: Documentation of CAESAR Mutagenicity model 1441
xi) Used model (title, name of authors, reference) 1442
CAESAR Mutagenicity Model v 2.1.12, Ferrari T., Gini G. 1443
An open source multistep model to predict mutagenicity from statistical analysis and relevant 1444
structural alerts.Ferrari T., Gini G.Chemistry Central Journal 2010, 4(Suppl 1):S2 (29 July 2010) 1445
xii) Information about modelled endpoint (endpoint, experimental protocol) 1446
Ames Mutagenicity essay. 1447
xiii) Used training set (number of the substances, information about the chemical diversity of the 1448
training set chemicals) 1449
4204 compounds from the Kazius-Bursi mutagenicity database (Kazius J, Mcguire R, Bursi R: 1450
Derivation and validation of toxicophores for mutagenicity prediction.J Med Chem 2005, 48(1):312-1451
320.), 2348 classified as mutagenic and 1856 classified as non-mutagenic by Ames test. 80% of the 1452
entire data set (3367 compounds) was used for the development of the model, while the other 20% 1453
(837 compounds) was used as a test (validation set). 1454
1455
xiv) Information on the algorithm used for deriving the model and the molecular descriptors 1456
(name and type of the descriptors used, software used for descriptor generation and 1457
descriptor selection) 1458
A mutagenicity classifier has been arranged integrating two different techniques: a machine learning 1459
algorithm from the Support Vector Machines (SVM) collection, to build an early model with the best 1460
statistical accuracy, then an ad hoc expert system based on known structural alerts (SAs)(Benigni-1461
Bossa rule base), tailored to refine its predictions. The purpose is to prevent hazardous molecules 1462
misclassified in first instance (false negatives) from being labelled as safe. The resultant classifier can 1463
be presented as a cascading filters system: compounds evaluated as positive by SVM are immediately 1464
labelled mutagenic, whereas the presumed negatives are further shifted through two consecutive 1465
checkpoints for SAs with rising sensitivity. The first checkpoint (12 SAs) has the chance to enhance 1466
the prediction accuracy by attempting a precise isolation of potential false negatives (FNs); the second 1467
checkpoint (4 SAs) proceeds with a more drastic (but more prudent) FNs removal, as much as this 1468
doesn't noticeably downgrade the original accuracy by generating too many false positives (FPs) as 1469
well. To reinforce this distinction, compounds filtered out by the first checkpoint are 1470
labelled mutagenic while those filtered out by the second checkpoint are labelled suspicious: this label 1471
is a warning that denotes a candidate mutagen, since it has fired a SA with low specificity. Unaffected 1472
compounds that pass through both checkpoints are finally labelled non-mutagenic. 1473
xv) Internal statistics (performance of the model to the training set chemicals)- goodness-of-fit, 1474
robustness and predictivity 1475
The authors reported accuracy of around 92% for the training set and around 82% for the test set. 1476
xvi) External statistic, if available 1477
Not available 1478
xvii) Information about the applicability domain (description of the applicability domain of the 1479
model and method used to assess the applicability domain) 1480

Establishment of the residue definition for dietary risk assessment
EFSA Journal 2016;14(issue):NNNN 47
The model provides evaluation of the reliability of the prediction which is in three steps scale: 1481
Compound is in model Applicability Domain, Compound could be out of model Applicability Domain 1482
and Compound is out of model Applicability Domain. 1483
The Applicability Domain evaluation is based of combination of 5 Applicability Domain scores: 1484
Similarity index – measure for the similarity between the predicted substance and training set 1485
substances with known experimental value; 1486
Concordance – the similar substances found in the training set have (or have not) experimental values 1487
that are in agreement with the predicted value; 1488
Accuracy – accuracy of prediction for similar molecules found in the training set 1489
Atom centred fragments similarity check – all atom centred fragments of the substance are (are not) 1490
found in the list of atom centred fragments of the training set substances. 1491
Model descriptor range check – descriptors for the substance have (or have not) values inside the 1492
descriptor range of the training set substances. 1493
xviii) Mechanistic interpretation of the model 1494
Not available 1495
xix) Description, experimental data and predictions of possible structural analogues of the 1496
substance (provided by the software or selected by the applicant) 1497
The software provides six most similar substances from the training set with their experimental and 1498
predicted values. 1499
xx) Any additional information provided by the model, e.g. suggested mechanism of action, 1500
uncertainties 1501
Not available 1502
Documentation of DEREK Nexus mutagenicity model 1503
1. Used model (title, name of authors, reference) 1504
DEREK Nexus Mutagenicity Model v 4.0.6. 1505
Lhasa Ltd, Leeds, UK, http://www.lhasalimited.org/ 1506
Sanderson DM & Earnshaw CG (1991). Computer prediction of possible toxic action from chemical 1507
structure; The DEREK system. Human and Experimental Toxicology 10, 261-273. 1508
Judson PN, Marchant CA & Vessey JD (2003). Using argumentation for absolute reasoning about the 1509
potential toxicity of chemicals. Journal of Chemical Information and Computer Sciences 43, 1364-1510
1370. 1511
Marchant CA, Briggs KA & Long A (2003). In silico tools for sharing data and knowledge on toxicity 1512
and metabolism: Derek for Windows, Meteor, and Vitic. Toxicology Mechanisms and Methods 18, 1513
177–187. 1514
Judson PN, Stalford SA & Vessey J (2013). Assessing confidence in predictions made by knowledge-1515
based systems. Toxicology Research 2, 70-79. 1516
1517

Establishment of the residue definition for dietary risk assessment
EFSA Journal 2016;14(issue):NNNN 48
2. Information about modelled endpoint (endpoint, experimental protocol) 1518
The Derek Nexus model for mutagenicity is developed from Ames test data in both S.typh and E.coli. 1519
Supporting data from in vivo lacZ-transgenic assay, in vitro L5178Y TK+/- assay, in vitro HGPRT 1520
gene mutation assay, in vitro Na+/K+ ATPase gene mutation assay has also been considered for the 1521
development of a small number of alerts. Additionally, alert writers consider both mechanistic 1522
evidence and chemical properties (such as reactivity). 1523
3. Used training set (number of the substances, information about the chemical diversity of the 1524
training set chemicals) 1525
The DEREK model for mutagenicity is base of rules which codified the knowledge about the relation 1526
between a structural features and a toxicological ( i.e. mutagenic) effect. Although almost all alerts are 1527
related with mechanistic explanation and examples, these rules are not related with particular training 1528
set. 1529
Recently a model for negative prediction (non-mutagenic) has been developed and added to the 1530
previous model. For it development a training set of above 10 000 substances has been used (the 1531
number of mutagenic and non-mutagenic substances is almost equal). The training set is a compilation 1532
of six public available data sets (e.g. Kirkland, ISSSTY, NTP data sets) 1533
4. Information on the algorithm used for deriving the model and the molecular descriptors 1534
(name and type of the descriptors used, software used for descriptor generation and 1535
descriptor selection) 1536
Derek Nexus is a rule-based expert system for the prediction of toxicity. Its knowledge base is 1537
composed of alerts, examples and reasoning rules which may each contribute to the predictions made 1538
by the system. Each alert in Derek describes a chemical substructure believed to be responsible for 1539
inducing a specific toxicological outcome (often referred to as a toxicophore). Alerts are derived by 1540
experts, using toxicological data and information regarding the biological mechanism of action. Where 1541
relevant, metabolism data may be incorporated into an alert, enabling the prediction of compounds 1542
which are not directly toxicity but are metabolised to an active species. The derivation of each alert is 1543
described in the alert comments along with supporting references and example compounds where 1544
possible. In addition a likelihood is provided (e.g. certain, probable, plausible) which takes into 1545
account the presence of a structural alert and a limited number of molecular descriptors. 1546
5. Internal statistics (performance of the model to the training set chemicals)- goodness-of-fit, 1547
robustness and predictivity 1548
Derek is a knowledge-based expert system containing mechanistically-based rules which are built 1549
using all the underlying evidence available to the SAR developer. Therefore, there is no defined 1550
training or test set, and therefore there are no internal validation statistics to report. 1551
6. External statistic, if available 1552
Not public available 1553
7. Information about the applicability domain (description of the applicability domain of the 1554
model and method used to assess the applicability domain) 1555
The scope of the structure-activity relationships describing the mutagenicity endpoint are defined by 1556
the developer to be the applicability domain for the model. Therefore, if a chemical matches an alert 1557
describing a structure-activity for mutagenicity it can be considered to be within the applicability 1558
domain. The applicability domain of each alert is defined by the alert developer on the basis of the 1559

Establishment of the residue definition for dietary risk assessment
EFSA Journal 2016;14(issue):NNNN 49
training set data and expert judgement on the chemical and biological factors which affect the 1560
mechanism of action for each alert. 1561
8. Mechanistic interpretation of the model 1562
All alerts describing structure-activity relationships for the mutagenicity endpoint have a mechanistic 1563
basis wherever possible. Mechanistic information is detailed in the comments associated with an alert 1564
and can include information on both the mechanism of action and biological target. The mechanistic 1565
basis of the model was developed a priori by examining the active and inactive structures before 1566
developing the structure-activity relationship. All references supporting the mechanistic basis of an 1567
alert are detailed and available for inspection within the software. 1568
9. Description, experimental data and predictions of possible structural analogues of the 1569
substance (provided by the software or selected by the applicant) 1570
The derivation of each alert is described in the alert comments along with supporting references and 1571
example compounds where possible 1572
10. Any additional information provided by the model, e.g. suggested mechanism of action, 1573
uncertainties 1574
Described above 1575
The model is published in the QMRF JRC Database: http://qsardb.jrc.it/qmrf/ 1576
1577
Documentation of Toxtree model – structural alerts for in vivo micronucleus assay 1578
1. Used model (title, name of authors, reference) 1579
Structural alerts for in vivo micronucleus implemented in the Toxtree v.2.6.6 1580
Structural analysis and predictive value of the rodent in vivo micronucleus assay results. Benigni R, 1581
Bossa C, Worth A, Mutagenesis.2010 Jul;25(4):335-41 1582
2. Information about modelled endpoint (endpoint, experimental protocol) 1583
A large majority of the data are based on the analysis of micronuclei in bone marrow cells for rationale 1584
of and details on the assay, see (Krishna, G. and Hayashi, M. (2000) In vivo rodent micronucleus 1585
assay: protocol, conduct and data interpretation. Mutat. Res., 455, 155–166. 1586
Morita, T., Asano, N., Awogi.T et al. (1997) Evaluation of the rodent micronucleus assay in the 1587
screening of IARC carcinogens (groups 1, 2A and 2B) the summary report of the 6th collaborative 1588
study by CSGMT/JEMS MMS. Collaborative Study of the Micronucleus Group Test. Mammalian 1589
Mutagenicity Study Group. Mutat. Res., 389, 3–122. 1590
Hayashi, M., MacGregor, J. T., Gatehouse, D. G. et al. (2000) In vivo rodent erythrocyte micronucleus 1591
assay. II. Some aspects of protocol design including repeated treatments, integration with toxicity 1592
testing, and automated scoring. Environ. Mol. Mutagen., 35, 234–252. 1593
Hayashi, M., MacGregor, J. T., Gatehouse, D. G. et al. (2007) In vivo erythrocyte micronucleus assay 1594
III. Validation and regulatory acceptance of automated scoring and the use of rat peripheral blood 1595
reticulocytes, withdiscussion of non-hematopoietic target cells and a single dose-level limit 1596
test. Mutat. Res., 627, 10–30.)]. 1597
3. Used training set (number of the substances, information about the chemical diversity of the 1598
training set chemicals) 1599

Establishment of the residue definition for dietary risk assessment
EFSA Journal 2016;14(issue):NNNN 50
690 chemicals from ‘FDA SAR Genetox Database’; Leadscope Inc. 178 are micronucleus positive and 1600
512 are micronucleus negative. 1601
1602
4. Information on the algorithm used for deriving the model and the molecular descriptors 1603
(name and type of the descriptors used, software used for descriptor generation and 1604
descriptor selection) 1605
The model is based on both existing hypotheses on the mechanisms of toxic action (by e.g. checking 1606
the relative influence on micronucleus induction of DNA reactivity and protein binding) and on a 1607
structural analysis of the chemicals tested in the assay. 1608
The rulebase consists of the Benigni-Bossa mutagenicity-carcinogenicity alerts, with the exclusion of 1609
the alerts specific for non-genotoxic carcinogenicity – 30 alerts, and five additional alerts associated 1610
with a few suggested mechanisms related with in vivo micronucleus (e.g. mitotic spindle poisoning, 1611
topoisomerase II inhibition) 1612
5. Internal statistics (performance of the model to the training set chemicals)- goodness-of-fit, 1613
robustness and predictivity 1614
The authors reported an accuracy of prediction around 57% 1615
6. External statistic, if available 1616
Not available 1617
7. Information about the applicability domain (description of the applicability domain of the 1618
model and method used to assess the applicability domain) 1619
Not available 1620
8. Mechanistic interpretation of the model 1621
The structural alerts included in the model relate with the mechanisms of action suggested by the 1622
authors: DNA damaging, mitotic spindle poisoning or topoisomerase II inhibition. The latter effects 1623
are likely related to interference with proteins. 1624
9. Description, experimental data and predictions of possible structural analogues of the 1625
substance (provided by the software or selected by the applicant) 1626
Not available 1627
10. Any additional information provided by the model, e.g. suggested mechanism of action, 1628
uncertainties 1629
Not available 1630
The model is published in the QMRF JRC Database: http://qsardb.jrc.it/qmrf/ 1631
Documentation of DEREK Nexus Chromosome damage model 1632
1. Used model (title, name of authors, reference) 1633
DEREK Nexus chromosome damage Model v 4.0.6. 1634
Lhasa Ltd, Leeds, UK, http://www.lhasalimited.org/ 1635

Establishment of the residue definition for dietary risk assessment
EFSA Journal 2016;14(issue):NNNN 51
Sanderson DM & Earnshaw CG (1991). Computer prediction of possible toxic action from chemical 1636
structure; The DEREK system. Human and Experimental Toxicology 10, 261-273. 1637
Judson PN, Marchant CA & Vessey JD (2003) Using argumentation for absolute reasoning about the 1638
potential toxicity of chemicals. Journal of Chemical Information and Computer Sciences 43, 1364-1639
1370. 1640
Marchant CA, Briggs KA & Long A (2003). In silico tools for sharing data and knowledge on toxicity 1641
and metabolism: Derek for Windows, Meteor, and Vitic. Toxicology Mechanisms and Methods 18, 1642
177–187. 1643
Judson PN, Stalford SA & Vessey J (2013). Assessing confidence in predictions made by knowledge-1644
based systems. Toxicology Research 2, 70-79. 1645
2. Information about modelled endpoint (endpoint, experimental protocol) 1646
The Derek Nexus model for chromosome damage is developed from several sources of data. Sources 1647
of primary data used for alert development include in vitro and in vivo chromosome aberration test, in 1648
vitro and in vivo micronucleus test, in vitro L5178Y TK+/- assay. Alert writers consider both 1649
mechanistic evidence and chemical properties (such as reactivity). Depending on evidence in vitro 1650
and/or in vivo prediction can be made. 1651
1652
3. Used training set (number of the substances, information about the chemical diversity of the 1653
training set chemicals) 1654
The DEREK model for chromosome damage is base of rules which codified the knowledge about the 1655
relation between a structural features and a toxicological ( i.e. mutagenic) effect. Although almost all 1656
alerts are related with mechanistic explanation and examples, these rules are not related with particular 1657
training set. 1658
4. Information on the algorithm used for deriving the model and the molecular descriptors 1659
(name and type of the descriptors used, software used for descriptor generation and 1660
descriptor selection) 1661
Derek Nexus is a rule-based expert system for the prediction of toxicity. Its knowledge base is 1662
composed of alerts, examples and reasoning rules which may each contribute to the predictions made 1663
by the system. Each alert in Derek describes a chemical substructure believed to be responsible for 1664
inducing a specific toxicological outcome (often referred to as a toxicophore). Alerts are derived by 1665
experts, using toxicological data and information regarding the biological mechanism of action. Where 1666
relevant, metabolism data may be incorporated into an alert, enabling the prediction of compounds 1667
which are not directly toxicity but are metabolised to an active species. The derivation of each alert is 1668
described in the alert comments along with supporting references and example compounds where 1669
possible. In addition a likelihood is provided (ie certain, probable, plausible, equivocal and nothing to 1670
report) which takes into account the presence of a structural alert and a limited number of molecular 1671
descriptors. 1672
5. Internal statistics (performance of the model to the training set chemicals)- goodness-of-fit, 1673
robustness and predictivity 1674
Derek is a knowledge-based expert system containing mechanistically-based rules which are built 1675
using all the underlying evidence available to the SAR developer. Therefore, there is no defined 1676
training or test set, and therefore there are no internal validation statistics to report. 1677
6. External statistic, if available 1678
Not public available 1679

Establishment of the residue definition for dietary risk assessment
EFSA Journal 2016;14(issue):NNNN 52
7. Information about the applicability domain (description of the applicability domain of the 1680
model and method used to assess the applicability domain) 1681
The scopes of the structure-activity relationships describing the chromosome damage endpoint are 1682
defined by the developer to be the applicability domain for the model. Therefore, if a chemical 1683
activates an alert describing a structure activity for chromosome damage it can be considered to be 1684
within the applicability domain. If a compound does not activate an alert or reasoning rule in Derek, a 1685
result of ‘nothing to report’ is presented to the user. This can be interpreted as a negative prediction or 1686
that the query compound is outside the domain of the model. Which of these is more appropriate may 1687
depend on the endpoint of interest. 1688
8. Mechanistic interpretation of the model 1689
All alerts describing structure-activity relationships for the chromosome damage endpoint have a 1690
mechanistic basis wherever possible. Mechanistic information is detailed in the comments associated 1691
with an alert and can include information on both the mechanism of action and biological target. The 1692
mechanistic basis of the model was developed a priori by examining the active and inactive structures 1693
before developing the structure-activity relationship. All references supporting the mechanistic basis 1694
of an alert are detailed and available for inspection within the software. 1695
9. Description, experimental data and predictions of possible structural analogues of the 1696
substance (provided by the software or selected by the applicant) 1697
The derivation of each alert is described in the alert comments along with supporting references and 1698
example compounds where possible 1699
10. Any additional information provided by the model, e.g. suggested mechanism of action, 1700
uncertainties 1701
Described above 1702
The model is published in the QMRF JRC Database: http://qsardb.jrc.it/qmrf/ 1703
1704
Step 5.3: Description of results, toxicological analysis of predicted effects and applicability 1705
domain 1706 1707 Table 3 Prediction of genotoxicity (gene mutation - CAESAR and DEREK Nexus Mutagenicity models 1708
and chromosomal aberrations - Toxtree – in vivo micronucleus model and DEREK Nexus in 1709 vitro human and mammalian chromosomal damage models) of minor rat and plant specific 1710 metabolites by (Q)SAR 1711
Metabolite CAESAR prediction of
gene mutation
(Applicability Domain)
DEREK Nexus
prediction of gene
mutation (no
Applicability
Domain evaluation
is available)
Toxtree prediction
of in vivo
micronucleus (no
Applicability
Domain evaluation
is available)
DEREK Nexus
prediction of in
vitro/in vivo
Chromosome
damage (human
and mammalian)
Parent Not applied Not applied Not applied Not applied
M02 Negative (Could be out) Negative Negative Nothing to report
M05 Negative (Could be out) Negative Negative Nothing to report
M06 Negative (Out) Negative Positive alert Equivocal
M07 Negative (In) Negative Positive alert Nothing to report
M08 Negative (Could be out) Negative Negative Nothing to report
M09 Negative (In) Negative Negative Nothing to report
M11 Negative (In) Negative Negative Nothing to report

Establishment of the residue definition for dietary risk assessment
EFSA Journal 2016;14(issue):NNNN 53
Metabolite CAESAR prediction of
gene mutation
(Applicability Domain)
DEREK Nexus
prediction of gene
mutation (no
Applicability
Domain evaluation
is available)
Toxtree prediction
of in vivo
micronucleus (no
Applicability
Domain evaluation
is available)
DEREK Nexus
prediction of in
vitro/in vivo
Chromosome
damage (human
and mammalian)
M12 Positive (Could be out) Negative Negative Nothing to report
M14 Negative (Could be out) Negative Negative Nothing to report
M15 Negative (In) Negative Negative Nothing to report
M16 Positive (Could be out) Negative Positive alert Equivocal
M18 Negative (In) Negative Negative Nothing to report
1712 1713
CAESAR Mutagenicity model predicts 10 out of 12 metabolites as negative (non-mutagenic): 1714
metabolites M02, M05, M06, M07, M08, M09, M11, M14, M15 and M18. One of the metabolites 1715
M06 is out of the model applicability domain, four of them M02, M05, M08 and M14 could be out of 1716
model applicability domain and five – M07, M09, M11, M15 and M18 are into model applicability 1717
domain. 1718
Two of the metabolites – M12 and M16 are predicted as potential mutagenic. Both substances could 1719
be out of the model applicability domain. Additional analysis of the six most similar substances from 1720
the training set for the metabolite M16 shows that the similarity range is between 0.952 – 0.929. All of 1721
them are primary aromatic amines with a different numbers of small alkyl (methyl or ethyl) 1722
substituents in the aromatic ring. For all of them with one exception the experimental data are positive, 1723
which gives additional confidence of the positive prediction. 1724
The same analyse for the metabolite M12 shows that in general similarity between the chemical of 1725
interest and the most similar substances from the training set is lower but still high enough (0.896 – 1726
0.854), but experimental value for all substances (with one exception which is an aromatic amine) are 1727
non-mutagenic, which challenges the positive prediction for the metabolite M12. 1728
DEREK Nexus Mutagenicity model predicts all 12 metabolites as negative (non-mutagenic). 1729
Toxtree in vivo micronucleus model predicts 9 out of 12 metabolites as negative (there are not alerts 1730
for micronucleus) – M02, M05, M08, M09, M11, M12, M14, M15 and M18. No additional 1731
information is provided by the model. 1732
Three of the metabolites are predicted as positive (at least one positive alert for micronucleus assay 1733
was found) – M06, M07 and M16. As a structural alert for the metabolite M06 and M16 is identified: 1734
Primary aromatic amine, hydroxyl amine and its derived esters (with restrictions). This is an alert 1735
related with potential DNA reactive agents who are known to be positive in the micronucleus assay. 1736
For the metabolite M07, the identified alerts is H-acceptor-path3-H-acceptor. According to the authors 1737
this alert represents a molecular framework that could account for non-covalent interactions with 1738
proteins or DNA. Such interactions, as in the case of DNA intercalation or groove binding, are 1739
potentially genotoxic. However, the positive prediction value of this alert reported by the authors 1740
(Benigni, 2010) is low 34%. 1741
DEREK Nexus in vitro human and mammalian chromosomal damage models predict equivocal results 1742
for the metabolites M06 and M16 due to an aniline or alkylaniline moieties in the molecule. 1743
1744
1745
1746
1747
1748

Establishment of the residue definition for dietary risk assessment
EFSA Journal 2016;14(issue):NNNN 54
Step 5.4: Conclusion 1749 1750
(Q)SAR assessment identified a potential of metabolites M06, M07, M12 and M16 to provoke 1751
genotoxic effects. Metabolites M02, M05, M08, M09, M11, M14, M15 and M18 are predicted as 1752
negative from all models. All metabolites are moved to the next step – read across analyses. 1753
1754
1755
Step 6: Read across (OECD toolbox)15
1756
1757 Step 6.1: Read across 1758
Both endpoints, gene mutation and chromosomal aberrations, should be evaluated by read across for 1759
all metabolites. 1760
Molecular initiating events of relevance for this assessment are interaction with DNA and/or proteins. 1761
The profilers included in the OECD Toolbox which codified the structural alerts which are important 1762
for these two types of interactions are mechanistic profilers - DNA binding by OASIS v.1.3, DNA 1763
binding by OECD, Protein binding by OASIS v 1.3, Protein binding by OECD and endpoint specific 1764
profilers- DNA alerts for AMES, MN and CA by OASIS v1.3, In vitro mutagenicity (AMES test) 1765
alerts by ISS, In vivo mutagenicity (Micronucleus) alerts by ISS, Protein binding alerts for 1766
Chromosomal aberrations by OASIS v1.1. 1767
Above mentioned profilers have been applied to metabolites M02, M05, M06, M07, M08, M09, M11, 1768
M12, M14, M15, M16 and M18 as chemicals of interest and to the parent substance and all majors rat 1769
metabolites, which are considered characterised by the provided genotoxicity studies, as substances 1770
with known experimental genotoxic activity. 1771
In order to evaluate the structural similarity, in addition to the structural alerts related to the evaluated 1772
endpoints, organic functional group profiler has been applied. This additional step will provide 1773
information on the presence/ absence of other functional groups different to the structural alerts and 1774
will give indication for the potential influence of the remaining part of the molecule to the relevant 1775
structural alerts (i.e. electronic and structural influence). 1776
No structural alerts in the parents substance and in all evaluated metabolites were found by Protein 1777
binding by OASIS v 1.3, Protein binding by OECD, Protein binding alerts for Chromosomal 1778
aberrations by OASIS v1.1. profilers. 1779
The alerts found by DNA binding by OASIS v.1.3, DNA binding by OECD and endpoint specific 1780
profilers - DNA alerts for AMES, MN and CA by OASIS v1.3, In vitro mutagenicity (AMES test) 1781
alerts by ISS, In vivo mutagenicity (Micronucleus) alerts by ISS and organic functional group are 1782
presented in the Table 4. 1783
15
http://www.oecd.org/chemicalsafety/risk-assessment/theoecdqsartoolbox.htm
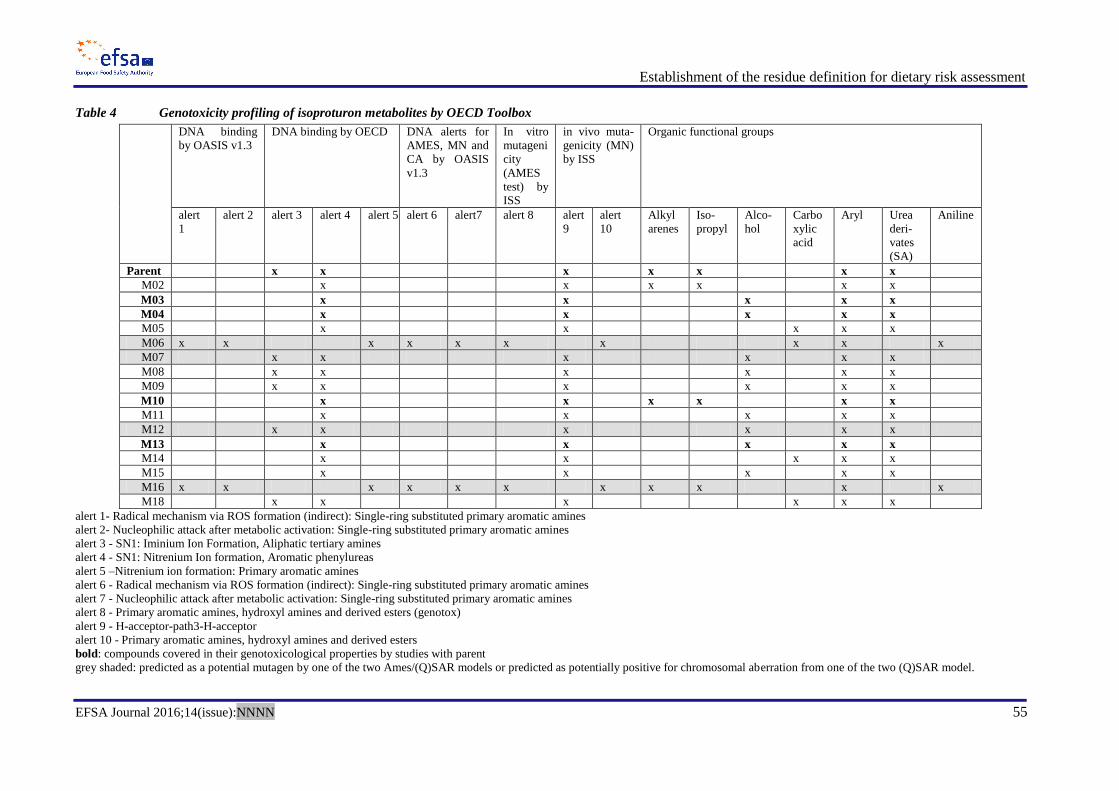
Establishment of the residue definition for dietary risk assessment
EFSA Journal 2016;14(issue):NNNN 55
Table 4 Genotoxicity profiling of isoproturon metabolites by OECD Toolbox
DNA binding
by OASIS v1.3
DNA binding by OECD DNA alerts for
AMES, MN and
CA by OASIS
v1.3
In vitro
mutageni
city
(AMES
test) by
ISS
in vivo muta-
genicity (MN)
by ISS
Organic functional groups
alert
1
alert 2 alert 3 alert 4 alert 5 alert 6 alert7 alert 8 alert
9
alert
10
Alkyl
arenes
Iso-
propyl
Alco-
hol
Carbo
xylic
acid
Aryl Urea
deri-
vates
(SA)
Aniline
Parent x x x x x x x
M02 x x x x x x
M03 x x x x x
M04 x x x x x
M05 x x x x x
M06 x x x x x x x x x x
M07 x x x x x x
M08 x x x x x x
M09 x x x x x x
M10 x x x x x x
M11 x x x x x
M12 x x x x x x
M13 x x x x x
M14 x x x x x
M15 x x x x x
M16 x x x x x x x x x x x
M18 x x x x x x
alert 1- Radical mechanism via ROS formation (indirect): Single-ring substituted primary aromatic amines
alert 2- Nucleophilic attack after metabolic activation: Single-ring substituted primary aromatic amines
alert 3 - SN1: Iminium Ion Formation, Aliphatic tertiary amines
alert 4 - SN1: Nitrenium Ion formation, Aromatic phenylureas
alert 5 –Nitrenium ion formation: Primary aromatic amines
alert 6 - Radical mechanism via ROS formation (indirect): Single-ring substituted primary aromatic amines
alert 7 - Nucleophilic attack after metabolic activation: Single-ring substituted primary aromatic amines
alert 8 - Primary aromatic amines, hydroxyl amines and derived esters (genotox)
alert 9 - H-acceptor-path3-H-acceptor
alert 10 - Primary aromatic amines, hydroxyl amines and derived esters
bold: compounds covered in their genotoxicological properties by studies with parent
grey shaded: predicted as a potential mutagen by one of the two Ames/(Q)SAR models or predicted as potentially positive for chromosomal aberration from one of the two (Q)SAR model.

Establishment of the residue definition for dietary risk assessment
EFSA Journal 2016;14(issue):NNNN 56
Analyses of the results from the read across for the metabolites predicted as negative by the (Q)SAR 1
models 2
Alerts 4 and 9 are present in all evaluated metabolites as well as in the parent substance and all major 3
rat metabolites (bold in Table 4). Alert 3 is present in three of the metabolites of evaluation M08, M09 4
and M18 and in the parent substance. Therefore the alerts are considered covered by the experimental 5
studies and not relevant for the metabolites in terms of the genotoxicity. No other alerts were 6
identified 7
8
Secondary profiler gives no hints on additional organic functional groups of concern. The changes in 9
the structural features are related with demethylation of the methylurea group (M02, M05, M11, M14 10
and M15) and/or hydroxylation (M02, M08, M09, M11 and M15) or carboxylation (M05, M14 and 11
M18) of the side alkyl chain on the 4th position. Demethylation and hydroxylation are observed in the 12
major rat metabolites and therefore the metabolites M02, M08, M09, M11 and M14 are considered 13
similar to the parent substance and the major rat metabolites, thus not of genotoxic concern. The 14
carboxyl group is not detected in any of the major rat metabolites but considering that the group is not 15
recognised as a structural alert for genotoxicity and it is outlying from the structural alert for 16
genotoxicity (methylurea group), it is considered that the group could not lead to activation of the 17
structural alert, therefore M05, M14 and M18 are not considered of genotoxic concern. 18
Analyses of the results from the read across for the metabolites predicted as positive by the (Q)SAR 19
models 20
Alerts 3, 4, and 9 present in the parent substance and the major rat metabolites are identified also in 21
the metabolites M07 and M12. No new alerts were identified. In both metabolites OH group(s) 22
appeared as a result of metabolism of the alkyl chain on the 4th position in comparison with the parent 23
substance. The organic functional hydroxy group of metabolites M07 and M12, which is not present in 24
the parent, is found in metabolites M03 and M04, both major in the rat (sum 75 % of AD). Based on 25
the read across analysis, metabolites M07 and M12 could be regarded as very similar to the parent 26
substance and its major rat metabolites. Metabolites M07 and M12 are concluded to be of no 27
genotoxicity concern. 28
Alerts 3, 4, and 9 present in the parent substance and the major rat metabolites are not present in the 29
metabolites M06 and M16, but almost all applied profilers identified aromatic primary amine present 30
in their structure as a potential alert for genotoxicity (DNA binding by OASIS v 1.3, DNA binding by 31
OECD, In vivo mutagenicity (Micronucleus) alerts by ISS, DNA alerts for AMES, MN and CA by 32
OASIS v1.3). This alert is not present neither in the parent substance nor in the major rat metabolites 33
and together with the positive prediction of the (Q)SAR models the possibility for genotoxic potential 34
cannot be excluded. To exclude an unacceptable dietary risk by potentially genotoxic metabolites, 35
either a combined exposure estimate and comparison against TTC can be performed (step 7) or 36
metabolites M06 and M16 would need to be tested (step 8). 37
38
Step 6.2: Conclusion 39
Metabolites M02, M05, M08, M09, M11, M14, M15 and M18 are not predicted to be of concern for 40
genotoxicity. 41
Metabolite M12 is predicted as a potential mutagen by one of the two Ames/(Q)SAR models. 42
Metabolite M07 is predicted as potential positive for chromosomal aberration from one of the two 43
(Q)SAR model. However, both metabolites (M12 and M07) are not considered of genotoxicity 44
concern following read-across analysis. 45
Metabolite M06 was predicted positive for in-vivo micronucleus and “equivocal” following prediction 46
for in-vitro chromosome aberration. 47

Establishment of the residue definition for dietary risk assessment
EFSA Journal 2016;14(issue):NNNN 57
Metabolite M16 was predicted as a potential mutagen by one of the two Ames/(Q)SAR models and 48
predicted positive for in-vivo micronucleus and “equivocal” following prediction for in-vitro 49
chromosome aberration. 50
For metabolites M06 and M16, genotoxicity concern cannot be excluded following read-across 51
analysis. In addition, both metabolites M06 and M16 are predicted to be of potential concern for the 52
same end point of genotoxicity ie in-vivo micronucleus and in-vitro chromosome aberration; therefore, 53
combined exposure for metabolites M06 and M16 should be calculated and assessed against TTC for 54
genotoxicity (step7) and/or testing (step 8). 55
56
Step 7: Generation of input data and combined exposure assessment against TTCgenotoxicity 57
58 The uses in Table 5 are considered in the exposure estimate to be used in the TTC assessment. 59
Regulatory decisions based on specific exposure estimates are therefore restricted to the particular 60
GAP conditions considered. 61
62 Table 5 Uses considered for exposure estimates 63
Crop Application
Growth stage Number kg as/ha PHI
Cereals (wheat,
barley, rye,
triticale)
BBCH 00-32 1 1.5 not relevant
64
65
Step 7.1: Derivation of residue input data for metabolites16 66 67
a) Residue levels in primary crop (cereal) and in groundwater 68
– Metabolite identification was performed in winter wheat plant parts treated with 69 14
C-isoproturon at 1.875 kg/ha (ca. 1.25 N rate) post-emergence 5 months after planting. 70
– Residue situation for pre-emergence use in cereals has been deemed addressed by the 30 71
days plant-back interval investigated in the rotational crop study (see point b) 72
– Residues in grain are relevant for consumer and livestock exposure; residues in straw are 73
relevant for livestock exposure calculation; residues in forage are not relevant for livestock 74
exposure (restriction in the GAP for grazing livestock on the treated crop), chaff and 75
stubble are neither relevant for quantitative consumer or livestock exposure calculation. 76
– Residue levels of metabolites in grain were adopted from the metabolism study, while 77
values for straw were calculated by applying the parent/metabolite ratio of the metabolism 78
study to field trial data for parent. A conversion factor can only be successfully applied if 79
quantifiable parent residue values are available; this was not (or hardly) the case for the 80
field trial data for grain, where in 82 out of 89 residue trials parent levels were below the 81
LOQ. The untransformed metabolism data for grain were therefore considered more 82
adequate for exposure estimation of metabolites, while for straw the field data were used 83
to estimate exposure. 84
– Residues in groundwater were relevant for quantitative consumer exposure calculation and 85
comparison against the TTC (if applicable) 86
87
16 Based on metabolism and residue data in the Assessment Report (Germany, 2014)

Establishment of the residue definition for dietary risk assessment
EFSA Journal 2016;14(issue):NNNN 58
88
b) Residue levels in rotational crops 89
– Rotational crop metabolism study was performed at 1N rate (bare soil application) and 90
sowing of rotational crops at 30 day plant-back interval (PBI), 210 day PBI and 320 day 91
PBI. 92
– No field study is available; no conversion was required to account for differences in 93
application rate or accumulation (1N study). Thus, metabolite data were directly used for 94
exposure estimates. 95
– Crop groups covered: Cereals (grain, straw), root crops (turnip root and leaf), leafy crops 96
(Swiss chard; 210 and 320 d PBI only). Additional crop groups (oilseed; fruiting 97
vegetables) are not considered relevant. 98
– 30 day PBI (cereals): Data are considered suitable for the evaluation of GAP compliant 99
pre-emergence application due to the 1N application rate, bare soil application, and 100
sowing shortly after application. It is therefore considered appropriate to evaluate a 101
possible GAP residue situation, to derive the residue definition and to provide input values 102
for dietary risk assessment and livestock burden calculation. 103
– 30 day PBI (root/tuber and leafy crops): The case of crop failure in cereals upon herbicide 104
use could lead to a residue situation relevant for acute dietary exposure scenarios) and is 105
therefore relevant for genotoxicity screening. For general toxicity assessment, only the 106
chronic scenario is relevant for the consumer as no ARfD is proposed for isoproturon and 107
its metabolites.17
It is assumed that residues after crop failure in root/tuber and leafy crops 108
do not contribute to a significant long-term dietary burden of livestock animals relevant 109
for dietary risk assessment. Therefore, residues from 30 d PBI (root/tuber, leafy crops) do 110
not need to be considered for risk assessment. 111
– 214/312 day PBI (all crops): The rotation crop residue data represent realistic replanting 112
scenarios and are considered for exposure assessment. 113
114
17 The status of the evaluation of Isoproturon at the time of 2014 was considered during the development of the case. It is
noted that an ARfD was set for Isoproturon later in 2015.

Establishment of the residue definition for dietary risk assessment
EFSA Journal 2016;14(issue):NNNN 59
Table 6 Residue levels of isoproturon and metabolites in a primary crop winter wheat metabolism study, in a 115 field study and in groundwater for the relevant application rate 116
Wheat, primary crop
Straw Grain Groundwater
Metabolism study 1.25 N Field
data Metabolism study 1.25 N
Field
data PECgw FOCUS
#
TRR CF HR/HRc TRR CF STMR/
HRc
% mg
[equ]/kg
mg
[equ]/kg %
mg
[equ]/kg
mg
[equ]/kg μg/L
μg
[equ]/L
5.197 0.088
Parent 17.8 0.923 1.00 0.15 3.3 0.003 1.00 0.010
M02
M03 3.9 0.203 0.22 0.033
M04 6.3 0.329 0.36 0.053 1.2 0.001 0.33 N/A
M05 1.9 0.101 0.11 0.016 19.3 0.017 5.67 N/A
M06 3.4 0.179 0.19 0.029 0.6 0.001 0.33 N/A
M07 4.3 0.225 0.24 0.037 5.4 0.005 1.67 N/A
M08 3.3 0.170 0.18 0.028 2.2 0.002 0.00 N/A 11.682 10.841
M09 2.838 2.634
M10 3.1 0.160 0.17 0.026 1.712 1.981
M11
M12
M13
M14
M15
M16
M18 7.227 6.310
[equ] Isoproturon equivalents 117 # PECgw - FOCUS modelling results (80th percentile annual average concentration at 1 m) – pre-emergence 118 application in wheat of 1500 g a.s./ha; highest predicted concentration across all scenarios 119

Establishment of the residue definition for dietary risk assessment
EFSA Journal 2016;14(issue):NNNN 60
Table 7 Residue levels of isoproturon metabolites in rotational crops following application of 1566 g a.s./ha (1N)
Wheat
30 days 213 days 30 days 213 days 324 days
Grain Grain Straw Straw Straw
TRR 0.106 mg/kg TRR 0.019 mg/kg TRR 2.089 mg/kg TRR 0.187 mg/kg TRR 0.127 mg/kg
% mg/kg % mg/kg % mg/kg % mg/kg % mg/kg
Parent 0.3 0.006
M02
M03 3.6 0.004 3.7 0.0007 15.5 0.323 9.9* 0.019 13.7 0.017
M04
M05
M06
M07a 1.6 0.0003 4.9 0.102 6.5 0.012 4.9 0.006
M07b 2.6 0.055 2.5 0.003
M08 1.1 0.023
M09 5.1 0.005 1.5 0.0003 24.2 0.505 2.4 0.005 13.8 0.018
M10
M11 4.4 0.005 7.5 0.0014 7.1 0.149 11.2 0.021 9.4 0.012
M12 2.6 0.003 4.3 0.0008 4.7 0.098 4.7 0.009 5.6 0.007
M13 1.6 0.0003 2.9 0.061 6.2 0.012 5.1 0.006
M14
M15
M16
M18 * Re-calculated 10.2% TRR based on the available values

Establishment of the residue definition for dietary risk assessment
EFSA Journal 2016;14(issue):NNNN 61
Table 7 (cont.)
Swiss chard Turnip
213 days 324 days 30 days ** 213 days 324 days
mature mature roots leaves roots leaves leaves
TRR 0.045 mg/kg TRR 0.027 mg/kg TRR 0.116 mg/kg TRR 0.948 mg/kg TRR 0.012 mg/kg TRR 0.029 mg/kg TRR 0.025 mg/kg
% mg/kg % mg/kg % mg/kg % mg/kg % mg/kg % mg/kg % mg/kg
Parent 2.9 0.003 0.4 0.004
M02 1.2 0.001 0.7 0.006
M03 22.5 0.010 14.6 0.004 3.9 0.005 36.2 0.343 2.3 <0.001
(0.0003)*
25.7 0.008 26.8 0.007
M04
M05
M06
M07a 3.8 0.002 3.3 0.032 3.8 0.001
M07b 1.5 0.001 5.2 0.006 4.2 0.040 2.8 <0.001
(0.0003)*
M08 3.7 0.002 1.4 0.002 1.2 0.011
M09 15.7 0.007 24.5 0.007 28.9 0.034 36.8 0.348 12.2 0.002 16.1 0.005 29.2 0.007
M10
M11 7.4 0.003 12.3 0.003 1.4 0.002 2.0 0.019 1.2 <0.001
(0.0001)*
10.8 0.003 6.6 0.002
M12 3.3 0.001 0.5 0.004 2.1 0.001
M13 5.4 0.002 2.9 0.003 2.9 0.027 2.3 <0.001
(0.0003)*
5.2 0.002 3.7 0.001
M14
M15
M16
M18 * calculated based on TRR
** considered only relevant in case of acutely toxic compounds. Not relevant for isoproturon at the status of the evaluation considered in this case study.

Establishment of the residue definition for dietary risk assessment
EFSA Journal 2016;14(issue):NNNN 62
Step 7.2: Combined exposure calculation for those metabolites, for which genotoxic effects 1
cannot be excluded 2
3 Table 8 Exposure calculation
18 and TTC assessment of metabolites with potential genotoxicity concern 4
Metabolite Root crops Cereal grain Leafy crops Groundwater
mg/kg mg/kg mg/kg µg/L
M06 - 0.0010 - -
M16 - - - -
Sum of metabolites - 0.0010 - -
Chronic exposure (most critical diets)
Combined metabolite exposure for M06, M16
0.010 µg/kg bw/d (DK child) = 413 % TTCgenotoxicity
0.009 µg/kg bw/d (WHO Cluster diet B) = 356 % TTCgenotoxicity
0.007 µg/kg bw/d (WHO Cluster diet D) = 288 % TTCgenotoxicity
Individual metabolite exposure
M06: 0.000-0.020 µg/kg bw/d = 0-413 % TTCgenotoxicity
M16: No exposure. = 0 % TTCgenotoxicity
5
Acute exposure
Combined metabolite exposure for M06, M16
0.0145 µg/kg bw (wheat, children) = 578 % TTCgenotoxicity
0.0078 µg/kg bw (wheat, adults) = 313 % TTCgenotoxicity
0.0072 µg/kg bw (barley, adults) = 290 % TTCgenotoxicity
0.0049 µg/kg bw (rye, adults) = 194 % TTCgenotoxicity
Individual max. metabolite exposure
M06: 0.0145 µg/kg bw (wheat, children) = 578 % TTCgenotoxicity
M16: No exposure. = 0 % TTCgenotoxicity
6
Step 7.3: Conclusion 7 The combined exposure assessment for all metabolites, for which potential genotoxic effects cannot be 8
excluded a priori, reveals an exceedance of the applicable TTC for genotoxicity of 9
0.0025 µg/kg bw/d. 10
11
Metabolite M06 individually exceeds the genotoxicity threshold for chronic as well as acute 12
consumption data. Testing is required (step 8). 13 14
Metabolite M16 does not contribute to the consumer exposure since its occurrence is limited to 15
primary crop non-food intermediate commodities (cereal forage) that are also not destined for animal 16
feed. No extrapolation to other crops is required. Testing of metabolite M16 is not required. 17
18
19
18 Exposure assessment performed with EFSA PRIMo rev.2

Establishment of the residue definition for dietary risk assessment
EFSA Journal 2016;14(issue):NNNN 63
Step 8: Genotoxicity testing 20
21 No tests on metabolite M06 is available. As the prediction indicate a potential concern for the in-vivo 22
micronucleus and in-vitro chromosome aberration (equivocal), metabolite M06 is recommended to be 23
tested in-vitro to investigate structural and numerical chromosome aberration (e.g. TG 487). In 24
addition, although metabolite M06 was predicted as negative for point mutation the analysis was 25
considered potentially out of the chemical domain and the read-across showed a positive outcome for 26
some alerts of relevance for this end point; therefore an Ames test (TG471) is also recommended. 27
28
29
Step 9: Genotoxicity concern 30
31 Additional information on metabolite M06 is required. 32
33
34
Step 10: General toxicity of metabolites characterized by studies with parent or by specific 35
studies 36 37
Step 10.1: Toxicological assessment of parent compound 38 39
The ADI for the parent compound, isoproturon, was set at 0.015 mg/kg bw/d based on liver tumours in 40
the rat carcinogenicity study. 41
Based on the tumour effect observed in rat the parent substance is classified as carcinogen Cat.2 42
An ARfD was considered as not necessary.19
43
44
Step 10.2: Toxicological assessment of metabolites 45
46 Metabolites M03, M04, M10 and M13 are considered covered in their toxicological properties by the 47
studies with the parent. No further toxicological assessment is needed. 48
49
50
Step 11: Combined exposure of all metabolites to assess general toxicity (optional) 51
52 The TTC assessment is not applicable to the representative uses of isoproturon due to significant 53
residues in animal feed items that may create additional consumer intakes via food of animal origin. 54
Therefore, no comprehensive and sufficiently precise consumer exposure assessment can be 55
performed. Moreover, already the consumer exposure via groundwater that could be used as drinking 56
water exceeds the TTC for Cramer Class III. 57
58
59
Step 12: Consideration on potency 60
61 The ADI for the parent compound, isoproturon, was set at 0.015 mg/kg bw/d based on liver tumours in 62
the rat carcinogenicity study. Based on the ADI value (>0.01 mg/kg bw/d), isoproturon and its 63
metabolites are not considered of concern in terms of potency. 64
No additional consideration of potency is required. 65
66
19 The status of the evaluation of Isoproturon at the time of 2014 was considered during the development of the case. It is
noted that an ARfD was set for Isoproturon later in 2015.

Establishment of the residue definition for dietary risk assessment
EFSA Journal 2016;14(issue):NNNN 64
Step 13: Assessment of major plant metabolites in food (≥10 % TRR (and at least 0.01mg/kg) 67
OR ≥0.05 mg/kg) 68
69 Metabolites M03 and M05 are candidates for inclusion into the residue definition from food (extracted 70
from Table 6 and 7), while M09 is a candidate only due to its occurrence in feed (see Step 7.1, point 71
b). 72
73
Metabolite M03 is covered in its toxicological properties by parent compound studies, because is 74
above 10% of AD in terms of total radioactive material recovered in the urine as detected in ADME 75
studies. 76
77
Metabolite M05 was only observed in primary crops and is present in the rat metabolism study at a 78
level in the urine of 8% of the administered dose. Toxicological assessment is needed (step 18) 79
80
81
Step 14: Assessment of minor plant metabolites in food 82
83 Based on the ADI value for parent (>0.01 mg/kg bw/d), metabolites defined as minor by their 84
insignificant presence in food commodities are not considered of concern. Minor metabolites of 85
substances not falling under the ‘high potency’ definition are usually not expected to significantly 86
contribute to the toxicological dietary burden at the levels observed and no further toxicological or 87
exposure assessment is needed. Metabolite M07 is a racemic mixture of two isomers. The sum of the 88
two isomers is <10% of the TRR and <0.01 mg/kg and thus M07 is considered a minor metabolite of 89
no concern. 90
91
92
Step 15: Assessment of major plant metabolites in feed (≥10% TRR and ≥0.01 mg/kg) 93 94
For the dietary burden calculation, only those compounds are considered that occur in at least one 95
relevant commodity at≥10 % TRR (and at least 0.01 mg/kg) 96
97
This is the case for parent and metabolites M03, M05, M09 and M11 (see Table 6 and 7) 98
99
For the purpose of livestock dietary burden calculation the converted residue levels will be used, i.e. 100
the calculation is specific for the representative uses (see Table 5). 101
102
103
104

Establishment of the residue definition for dietary risk assessment
EFSA Journal 2016;14(issue):NNNN 65
Step 16: Potential of residue transfer from feed to livestock 105
106 The dietary burden calculation as decision tool for the requirement of an animal metabolism study has 107
to consider highest likely residues of the relevant compounds in feed items. This is also required for 108
MRL setting in food of animal origin. 109
110
The residue situation for pre- and post-emergence use differs in terms of composition of the residue 111
and the total amount. Both situations are considered equally relevant for the dietary burden 112
calculation. Derivation of input data is described for primary crops in step 7.1 (incl. Table 6) and for 113
rotational crops in step 7.2 (incl. Table 7). 114
115
Post-emergence use 116
The dietary burden calculation for the post-emergence scenario is summarised in Table 9a, consisting 117
of field data (parent; grain/straw), values from the primary crop metabolism study (M05; grain) and 118
converted field data (M05; straw). Rotational crop data are relevant for M03 (leafy crops; 213 d PBI). 119
120 Table 9a Dietary burden calculation for isoproturon and potentially relevant metabolites – 121
post-emergence use scenario 122
Compound Primary/Rotational crops Rotational
crops
Contribution to livestock burden
Cereal grain Cereal straw Leafy
mg/kg mg/kg mg/kg Diet mg/kg bw/d %
Post-emergence scenario
Isoproturon 0.010 0.150 - Lamb
Ewe
Layer
0.004
0.004
0.002
80
81
55
M05 0.017 0.016 - Lamb
Ewe
Layer
0.001
0.001
0.001
14
15
39
M03 - - 0.010 Lamb
Ewe
Layer
<0.001
<0.001
<0.001
5
5
7
Sum 0.027 0.166 0.010 Lamb
Ewe
Layer
0.005
0.004
0.003
100
100
100
123
124
125
Pre-emergence use 126
The dietary burden calculation for pre-emergence scenario is summarised in Table 9b, consisting of 127
wheat data from the rotational crop metabolism study, 30 day plant-back interval, as a surrogate for 128
the assessed scenario (all compounds). Rotational crop data are relevant for M03 (leafy crops; 213 d 129
PBI). 130

Establishment of the residue definition for dietary risk assessment
EFSA Journal 2016;14(issue):NNNN 66
Table 9b Dietary burden calculation for isoproturon and potentially relevant metabolites – 131 pre-emergence use scenario 132
Compound Primary/Rotational crops Rotational
crops
Contribution to livestock burden
Cereal grain Cereal straw Leafy
mg/kg mg/kg mg/kg Diet mg/kg bw/d %
Pre-emergence scenario
Isoproturon - 0.006 - Lamb
Ewe
Layer
<0.001
<0.001
<0.001
<1
<1
<1
M03 0.004 0.323 0.010 Lamb
Ewe
Layer
0.009
0.007
0.003
32
33
32
M09 0.005 0.505 0.007 Lamb
Ewe
Layer
0.015
0.011
0.004
51
51
50
M11 0.005 0.149 0.003 Lamb
Ewe
Layer
0.004
0.003
0.002
15
15
18
Sum 0.014 0.983 0.020 Lamb
Ewe
Layer
0.028
0.022
0.009
100
100
100
133
134
The trigger of 0.004 mg/kg bw/d for conduct of a livestock metabolism study is exceeded for 135
ruminants (maximum 0.028 mg/kg bw/d) and poultry (maximum 0.009 mg/kg bw/d). 136
137
It is concluded based on all the information, that a new ruminant metabolism study with parent 138
isoproturon is required. In case that the potentially relevant feed metabolites are not found in the 139
metabolic pathway of isoproturon in animals in the livestock metabolism studies, further metabolism 140
data might be required if the dietary burden of these metabolites is still significant. 141
142
143
Step 17: Major animal metabolites >10% TRR in food 144 145
No data available (data gap). 146
147
148
Step 18: Testing strategy, grouping and read-across 149 150
Metabolite M03 is covered in its toxicological properties by parent compound studies, because it is 151
above 10% of AD in terms of total radioactive material recovered in the urine as detected in ADME 152
studies. 153
154
Metabolite M05 is considered structurally similar to the parent and to the major rat metabolite - M03. 155
The structural difference with M03 is the presence of a carboxyl group instead of the hydroxyl group 156
in alkyl chain at 4th position. A carboxylic group can potentially produce idiosyncratic reactions 157
through formation of acyl glucoronide reaction (Bailey M, Dickinson R, Acryl glucuronide reactivity 158
in perspective: biological consequences, 2003, Chemico-Biological Interactions, 145, 117-137). 159
Idiosyncratic reactions are unlikely to be captured by any additional testing and as M05 is occurring at 160
the level of 8% in the rat urine, the toxicological data provided by the parent are considered to cover 161
the toxicological assessment of M05. 162
163

Establishment of the residue definition for dietary risk assessment
EFSA Journal 2016;14(issue):NNNN 67
Metabolite M09 is considered similar with the parent substance. The structural difference is a simple 164
hydroxylation of the alkyl chain at 4th position; therefore parent reference values can be applied. 165
166
Metabolite M11 is considered covered by the toxicological data provided for the parent and 167
occurrence of a major rat metabolite – M10. The structural difference with M10 is a simple 168
hydroxylation of the alkyl chain at 4th position; therefore parent reference values can be applied. 169
170
171
Step 19: Assessment of consumer toxicological burden 172 173
Besides parent isoproturon, metabolites M03 (via leafy rotational crops) and M05 are candidates for 174
inclusion into the residue definition for plants as they all occur at levels exceeding ≥10 % TRR (and at 175
least 0.01 mg/kg) OR ≥0.05 mg/kg in terms of absolute levels in at least one food commodity (see 176
Table 6 and 7, step 7). 177
Additional major metabolites in cereal straw (M09, M11) might become relevant pending finalisation 178
of the assessment of their relevance in feed items for transfer into food of animal origin (livestock 179
metabolism studies required). 180
Results of exposure assessment for the use in cereals and rotational crops and comparison against the 181
overall toxicological burden in plant products are presented in Table 10. 182
183 Table 10 Residues of potential concern in food of plant and animal origin 184
Cereals (pre-emergence) Cereals (post-emergence) Leafy RC (213 d)
Grain Straw Grain Straw Swiss chard
Metabolite RPF %TRR % tox burden
%TRR % tox burden
%TRR % tox burden
%TRR % tox burden
%TRR % tox burden
Parent 1 0.3 0 3.3 10 17.8 40
M03 1 3.6 23 a 15.5 24 22.5 36
M05 1 19.3 60 1.9 4
M09 1 5.1 32 a 24.2 38 15.7 25 a
M11 1 4.4 28 a 7.1 11 7.4 12 a
Other (minor)
1 b 2.6 17 16.2 27 32.0 30 20.4 56 17.7 27
Sum of relevant metabolites
1
Not
relevant a
47.1 73 22.6 70 19.7 44 22.5 36
Sum of non-considered metabolites
1 b 16.2 27 32.0 30 24.3 56 40.8 64
a Not relevant for the residue definition as metabolite is minor in food (<0.01 mg/kg in grain) 185 b Default assumption; no characterisation of general toxicological required for minor metabolites 186 187
The post-emergence scenario is considered relevant for setting the residue definition with parent and 188
metabolite M05 as major contributors to the overall toxicological burden (70%, considering RPF 1). 189
Metabolite M03 is relevant due to its occurrence in rotational leafy crops. 190
191
Additional metabolites (M03, M09, M11) might become relevant pending information on their 192
potential transfer from feed to food of animal origin. 193 194 195

Establishment of the residue definition for dietary risk assessment
EFSA Journal 2016;14(issue):NNNN 68
Step 20: Residue definitions 196 197
The proposed residue definition for risk assessment (expressed as isoproturon) in plants is 198
199
Cereals: Parent, M05 (primary crops, provisional, pending closure of data gaps) 200
Leafy crops: M03 (rotational crops only) 201
202
No residue definition for risk assessment in livestock can be proposed (data gap). 203
204
205
Data gaps 206
1. Genotoxic potential for metabolite M06 needs to be addressed by in-vitro test on structural 207
and numerical chromosome aberration (e.g. OECD 487) and Ames test (OECD 471). 208
2. The applicability of parent reference values for M05 has to be evidenced. Alternatively, non-209
relevant exposure of M05 can be demonstrated by proven absence of residues under GAP 210
conditions (residues in field trials below LOQ of 0.01 mg/kg). 211
3. Livestock exposure is significant under GAP conditions (ruminant, poultry). No acceptable 212
livestock metabolism study with parent isoproturon is available to assess the potential for 213
residues and their nature in food of animal origin. Unless the nature and quantity of residues in 214
food of animal origin is known, no residue definition (animals) can be proposed. 215
216
Uncertainties of particular relevance for decision making 217
The finalisation of the evaluation of the uncertainties is underdevelopment pending adoption of the 218
Scientific Committee guidance on uncertainty in scientific assessment. 219
1. The residue definition in plants comprises 70 % of the total toxicological burden for consumer 220
(only food of plant origin considered; pending information on the transfer from feed to food of 221
animal origin). Although this is slightly below the target of 75% this has only a marginal 222
impact on the calculated dietary consumer risk. 223
2. Grouping of metabolites is based on criteria for similarity. However, these criteria are not 224
fully characterized. For genotoxicity endpoints, grouping on profiling and presence of 225
functional groups was considered suitable for the purpose of risk assessment. Grouping of 226
metabolites for section of representative substance for testing for general toxicity was based 227
on common moiety and similarity in the chemical reactivity and this was considered 228
appropriate for this purpose. However, some uncertainties still exist as no testing was 229
performed. 230
3. Limitations in the assessment of metabolites (e.g. containing a carboxylic group in the 231
structure) that can potentially produce reactive metabolites exist and this is recognized as an 232
uncertainty. 233
4. Genotoxic alerts indicated by (Q)SAR for metabolites M07 and M12 are considered not 234
relevant on the basis ofread-across. This bears a higher uncertainty compared to in vitro results 235
according to the proposed testing scheme. 236
5. Groundwater exposure may increase the dietary intake of toxicological relevant residues M08, 237
M09, M10 and M18. This is not considered to impact the proposal on which metabolites are 238
relevant in food of plant and animal origin. 239

Establishment of the residue definition for dietary risk assessment
EFSA Journal 2016;14(issue):NNNN 69
Appendix C. Case study – Spiroxamine (Germany, 2009)20
240
Step 1: Metabolite identified at any level in nature-of-residue studies 241 A list of metabolites detected in residue metabolism studies is given in Table 1. Conjugated 242
metabolites (glycosides, glucuronides) are assumed to be covered in their toxicological properties by 243
their respective aglycons21
. 244 Table 1 Spiroxamine metabolites 245
Compound
identifier
Name in Study and Assessment
reports and SMILES
Structure Remark
Parent Spiroxamine CCCN(CC)CC1COC2(CCC(C(C)(C)C)CC2)O1
CH3
N
CH3O
H3C
CH3
CH3O
M01 Desethyl CCCNCC1COC2(CCC(C(C)(C)C)CC2)O1
CH3NH
O
H3C
CH3
CH3 O
M02 Despropyl CCNCC1COC2(CCC(C(C)(C)C)CC2)O1
CH3NH
O
H3C
CH3
CH3 O
M03 N-oxide CCCN(=O)(CC)CC1COC2(CCC(C(C)(C)C)CC2)O1
CH3N
O
CH3O
H3C
CH3
CH3O
M04 N-formyl-desethyl CCCN(CC1COC2(CCC(C(C)(C)C)CC2)O1)C=O
CH3N
O
H3C
CH3
CH3
O
O
M05 Hydroxyl CCCN(CC)CC1COC2(CCC(C(C)(C)CO)CC2)O1
CH3
N
CH3OCH3
CH3OH O
M05
representati
ve for
conjugate
M40, M25
M06 Acid CCCN(CC)CC1COC2(CCC(C(C)(C)C(O)=O)CC
2)O1
CH3
N
CH3OCH3
CH3OH
O
O
M06
representati
ve for
conjugates
M19, M44
M07 Hydroxy acid CCCN(CC)CC1COC2(CCC(C(C)(CO)C(O)=O)C
C2)O1
CH3
N
CH3O
CH3OH
HO O
O
M08 8-hydroxy acid CCCN(CC)CC1COC2(CCC(O)(C(C)(C)C(O)=O)
CC2)O1
CH3
N
CH3O
HO
CH3
H3C
OH
O
O
M09 Hydroxy-despropyl CCNCC1COC2(CCC(C(C)(C)CO)CC2)O1
CH3NH
OCH3
CH3OH O
M09
representati
ve for
conjugate
M39, M27
M10 Hydroxy-N-oxide CCCN(=O)(CC)C1COC2(CCC(C(C)(C)CO)CC2)
O1
CH3
N
O
CH3
OCH3
CH3OH O
M10
representati
ve for
conjugates
M20, M21
20
Germany 2009. Assessment Report on the active substance spiroxamine prepared by the rapporteur Member State
Germany in consultation with Hungary in the framework of Commission Regulation (EC) No 737/2007, September 2009.
Available at http://dar.efsa.europa.eu/dar-web/provision 21 Greyed out in this table

Establishment of the residue definition for dietary risk assessment
EFSA Journal 2016;14(issue):NNNN 70
Compound
identifier
Name in Study and Assessment
reports and SMILES
Structure Remark
M11 Desethyl acid CCCNCC1COC2(CCC(C(C)(C)C(O)=O)CC2)O1
CH3
NH
OCH3
CH3OH
O
O
M11
representati
ve for
conjugate
M43
M12 Despropyl acid CCNCC1COC2(CCC(C(C)(C)C(O)=O)CC2)O1
CH3NH
OCH3
CH3OH
O
O
M12
representati
ve for
conjugate
M45
M13 Cyclohexanol CC(C)(C)C1CCC(O)CC1
H3C
CH3
CH3
OH
M13
representati
ve for
conjugates
M22, M32,
M33, M34,
tentative for
M35 and
M36 (upon
closing of
data gap;
step 20)
M14 Diol CC(C)(CO)C1CCC(O)CC1
CH3
CH3
OH
OH
M14
representati
ve for
conjugate
M24
M15 Ketone CC(C)(C)C1CCC(=O)CC1 H3C
CH3
CH3
O
M16 Hydroxy-ketone
aglycon M23 CC(C)(CO)C1CCC(=O)CC1
CH3
CH3
OH
O
M16
representati
ve for
conjugate
M23
M19 Acid glucuronide CCCN(CC)CC1COC2(CCC(C(C)(C)C(=O)OC3C(O)C(O)C(O)C(C(O)=O)O3)CC2)O1 CH3
N
CH3OCH3
CH3O
O
OHOH
HO
OH
O
O
O
Toxicologic
al
assessment
covered by
M06
M20 Hydroxy-N-oxide glucoside CCCN(=O)(CC)CC1COC2(CCC(C(C)(C)COC3C
(O)C(O)C(O)C(CO)O3)CC2)O1
CH3
N
O
CH3OCH3
CH3
O
OHOH
HO
HO
O
O
Toxicologic
al
assessment
covered by
M10
M21 Hydroxy-N-oxide malonyl glucosid CCCN(=O)(CC)CC1COC2(CCC(C(C)(C)COC3C
(O)C(O)C(O)C(COC(=O)CC(O)=O)O3)CC2)O1
CH3
N
O
CH3
OCH3
CH3
O
OHOH
HO
O
O
OH
O
OO
Toxicologic
al
assessment
covered by
M10
M22 Cyclohexanol-glucuronide CC(C)(C)C1CCC(OC2C(O)C(O)C(O)C(C(O)=O)
O2)CC1
H3C
CH3
CH3
O
HO
OH OH
OH
O
O
Toxicologic
al
assessment
covered by
M13

Establishment of the residue definition for dietary risk assessment
EFSA Journal 2016;14(issue):NNNN 71
Compound
identifier
Name in Study and Assessment
reports and SMILES
Structure Remark
M23 Hydroxy-ketone-conjugate CC(C)(COC1C(O)C(O)C(O)C(CO)O1)C1CCC(=
O)CC1
CH3
CH3O
OHOH
HO
OH
O O
Toxicologic
al
assessment
covered by
M16
M24 Diol-diglycoside CC(C)(COC1C(O)C(O)C(O)C(CO)O1)C1CCC(CC2C(O)C(O)C(O)C(CO)O2)CC1
CH3
CH3O
OHOH
HO
OH
O
HO
OH OH
OH
O
Toxicologic
al
assessment
covered by
M14
M25 Sulfate CCCN(CC)CC1COC2(CCC(C(C)(C)COS(O)(=O
)=O)CC2)O1 CH3
N
CH3OCH3
CH3
OSHO
O
O
O
M26 Desethyl-sulfate CCCNCC1COC2(COC(C(C)(C)COS(O)(=O)=O)
OC2)O1
CH3NH
OCH3
CH3
OSHO
O
O
O
M27 Despropyl-sulfate CCNCC1COC2(CCC(C(C)(C)COS(O)(=O)=O)C
C2)O1 CH3NH
OCH3
CH3
OSHO
O
O
O
M28 Aminodiol CCCN(CC)CC(O)CO
CH3
N
CH3
OH
HO
M29 Aminodiol-N-oxide CCCN(=O)(CC)CC(O)CO
CH3
N
O
CH3OHOH
M30 Desethyl-aminodiol CCCNCC(O)CO
CH3
NH
OH
HO
M31 Despropyl-aminodiol CCNCC(O)CO
CH3NH
OH
HO
M32 Cyclohexanol glucoside CC(C)(C)C1CCC(OC2C(O)C(O)C(O)C(CO)O2)CC1
H3C
CH3
CH3
O
HO
OH OH
OH
O
Toxicologic
al
assessment
covered by
M13
M33 Cyclohexanol - glucopyranosyl-pentose CC(C)(C)C1CCC(OC2C(O)C(O)C(O)C(COC3C(
O)C(O)C(CO)O3)O2)CC1
H3C
CH3
CH3
O
HO
OH OH
O
OH
OH
OH
O
O
Toxicologic
al
assessment
covered by
M13
M34 Cyclohexanol-glucopyranosyl-
glucopyranosyl-pentose CC(C)(C)C1CCC(OC2C(O)C(O)C(O)C(OC3C(O
)C(O)C(O)C(COC4C(O)C(O)C(CO)O4)O3)O2)C
C1
H3C
CH3
CH3
O
HO
OH OH
O
HO
OH OH
O
HO
OH
OH
O
OO
Toxicologic
al
assessment
covered by
M13
M35 Docosanoic acid ester CCCCCCCCCCCCCCCCCCCCCC(=O)OC1CCC(C(C)(C)C)CC1
CH3
O
OH3C
CH3
CH3

Establishment of the residue definition for dietary risk assessment
EFSA Journal 2016;14(issue):NNNN 72
Compound
identifier
Name in Study and Assessment
reports and SMILES
Structure Remark
M36 Tetracosanoic acid ester CCCCCCCCCCCCCCCCCCCCCCCC(=O)OC1
CCC(C(C)(C)C)CC1
CH3
O
OH3C
CH3
CH3
M37 Cyclohexenol CC(C)(C)C1CCC(O)C=C1 H3C
CH3
CH3
OH
M38 N-formyl-despropyl CCN(CC1COC2(CCC(C(C)(C)C)CC2)O1)C=O
CH3N
O
H3C
CH3
CH3 O
O
M39 Hydroxy despropyl glycoside CCNCC1COC2(CCC(C(C)(C)COC3C(O)C(O)C(O)C(CO)O3)CC2)O1
CH3NH
OCH3
CH3
O
OHOH
HO
HO
O
O
Toxicologic
al
assessment
covered by
M09
M40 Hydroxy glycoside CCCN(CC)CC1COC2(CCC(C(C)(C)COC3C(O)
C(O)C(O)C(CO)O3)CC2)O1
CH3N
CH3OCH3
CH3
O
OHOH
HO
HO
O
O
Toxicologic
al
assessment
covered by
M05
M41 Hydroxy-desethyl CCCNCC1COC2(CCC(C(C)(C)CO)CC2)O1
CH3NH
OCH3
CH3OH O
M41
representati
ve for
conjugate
M42, M26
M42 Hydroxy-desethyl glycoside CCNCC1COC2(CCC(C(C)(C)COC3C(O)C(O)C(
O)C(CO)O3)CC2)O1
CH3NH
OCH3
CH3
O
OHOH
HO
HO
O
O
Toxicologic
al
assessment
covered by
M41
M43 Desethyl acid glycoside CCNCC1COC2(CCC(C(C)(C)C(=O)OC3C(O)C(O)C(O)C(CO)O3)CC2)O1
CH3NH
OCH3
CH3O
O
OHOH
HO
HO
O
O
Toxicologic
al
assessment
covered by
M11
M44 Acid glycoside CCCN(CC)CC1COC2(CCC(C(C)(C)C(=O)OC3C(O)C(O)C(O)C(CO)O3)CC2)O1
CH3N
CH3
OCH3
CH3O
O
OHOH
HO
HO
O
O
Toxicologic
al
assessment
covered by
M06
M45 Despropyl acid glycoside CCNCC1COC2(CCC(C(C)(C)C(=O)OC3C(O)C(
O)C(O)C(CO)O3)CC2)O1
CH3NH
OCH3
CH3O
O
OHOH
HO
HO
O
O
Toxicologic
al
assessment
covered by
M12
246
Step 2: Exclusion of metabolites of no concern 247 None. 248
Step 3: Metabolite is known to be genotoxic 249 No specific information on genotoxicity of metabolites is available. 250
Step 4: Metabolites genotoxicologically characterised 251

Establishment of the residue definition for dietary risk assessment
EFSA Journal 2016;14(issue):NNNN 73
Step 4.1: Assessment of metabolites whether they are covered by studies with parent (Table 2) 252 or by specific studies. 253
Genotoxicity studies on metabolite M03 indicated no genotoxic concern in the conditions described 254
for in vitro testing conducted to explore genototoxicity endpoints i.e. point mutations and numerical 255
and structural chromosome aberrations (DE, 2009). 256
257
Step 4.2: Conclusion 258 Proceed with metabolite genotoxicity assessment (steps 5 to 8) for all metabolites whose toxicological 259
properties are not covered by parent compound (shaded in grey) or by specific studies. 260 Table 2 Assessment of occurrence of spiroxamine metabolites in toxicological studies with parent 261
compound – major and minor rat metabolites 262
Occurrence in rat metabolism
(% administered dose)
Toxicological properties covered by
studies with parent compound or
by specific studies
Parent Spiroxamine Yes
M01 Desethyl No
M02 Despropyl No
M03 N-oxide Yes (specific studies)
M04 N-formyl-desethyl No
M05 Hydroxyl No
M06 Acid 24.3 Yes
M07 Hydroxy acid No
M08 8-hydroxy acid 3.6 No
M09 Hydroxy-despropyl No
M10 Hydroxy-N-oxide No
M11 Desethyl acid 6.1 No
M12 Despropyl acid 4 No
M13 Cyclohexanol No
M14 Diol No
M15 Ketone No
M16 Hydroxy-ketone No
M25 Sulfate 1.4 No
M26 Desethyl-sulfate 3.2 No
M27 Despropyl-sulfate 3.1 No
M28 Aminodiol No
M29 Aminodiol-N-oxide No
M30 Desethyl-aminodiol No
M31 Despropyl-aminodiol No
M35 Docosanoic acid ester No
M36 Tetracosanoic acid
ester
No
M37 Cyclohexenol 0.8 No
M38 N-formyl-despropyl No
M41 Hydroxy-desethyl No
263
Step 5: (Q)SAR prediction of genotoxicity 264
Step 5.1: Description of (Q)SAR strategy 265
To predict the genotoxic potential (gene mutation and chromosomal aberrations) of the minor rat and 266
plant specific metabolites four models have been applied. The CAESAR Mutagenicity Model v 2.1.12 267
- implemented in the VEGA software (v 1.0.8) and OASIS AMES Mutagenicity model (v08.08) 268
implemented in the TIMES software (v2.27.13) for prediction of gene mutation; and a rule base model 269
with the structural alerts for in vivo micronucleus- implemented in the Toxtree v.2.6.6. (Romualdo 270
Benigni, Cecilia Bossa, Olga Tcheremenskaia and Andrew Worth, Development of structural alerts for 271
the in vivo micronucleus assay in rodents", European Commission report EUR 23844) and OASIS 272

Establishment of the residue definition for dietary risk assessment
EFSA Journal 2016;14(issue):NNNN 74
Chromosomal Aberration model (v08.08) implemented in the TIMES software (v2.27.13) for 273
prediction of chromosomal aberrations. 274
Independently of the predictions from (Q)SAR models, the metabolite(s) will be subject of read across 275
analysis (step 6). 276
Step 5.2: Documentation of prediction models 277
Documentation of CAESAR Mutagenicity model (VEGA software) 278
xxi) Used model (title, name of authors, reference) 279
CAESAR Mutagenicity Model v 2.1.12, Ferrari T., Gini G. 280
An open source multistep model to predict mutagenicity from statistical analysis and relevant 281
structural alerts.Ferrari T., Gini G.Chemistry Central Journal 2010, 4(Suppl 1):S2 (29 July 2010) 282
xxii) Information about modelled endpoint (endpoint, experimental protocol) 283
Ames Mutagenicity essay. 284
xxiii) Used training set (number of the substances, information about the chemical diversity 285
of the training set chemicals) 286
4204 compounds from the Kazius-Bursi mutagenicity database (Kazius J, Mcguire R, Bursi R: 287
Derivation and validation of toxicophores for mutagenicity prediction.J Med Chem 2005, 48(1):312-288
320.), 2348 classified as mutagenic and 1856 classified as non-mutagenic by Ames test. 80% of the 289
entire data set (3367 compounds) was used for the development of the model, while the other 20% 290
(837 compounds) was used as a test (validation set). 291
xxiv) Information on the algorithm used for deriving the model and the molecular 292
descriptors (name and type of the descriptors used, software used for descriptor generation 293
and descriptor selection) 294
A mutagenicity classifier has been arranged integrating two different techniques: a machine learning 295
algorithm from the Support Vector Machines (SVM) collection, to build an early model with the best 296
statistical accuracy, then an ad hoc expert system based on known structural alerts (SAs)(Benigni-297
Bossa rule base), tailored to refine its predictions. The purpose is to prevent hazardous molecules 298
misclassified in first instance (false negatives) from being labelled as safe. The resultant classifier can 299
be presented as a cascading filters system: compounds evaluated as positive by SVM are immediately 300
labelled mutagenic, whereas the presumed negatives are further shifted through two consecutive 301
checkpoints for SAs with rising sensitivity. The first checkpoint (12 SAs) has the chance to enhance 302
the prediction accuracy by attempting a precise isolation of potential false negatives (FNs); the second 303
checkpoint (4 SAs) proceeds with a more drastic (but more prudent) FNs removal, as much as this 304
doesn't noticeably downgrade the original accuracy by generating too many false positives (FPs) as 305
well. To reinforce this distinction, compounds filtered out by the first checkpoint are 306
labelled mutagenic while those filtered out by the second checkpoint are labelled suspicious: this label 307
is a warning that denotes a candidate mutagen, since it has fired a SA with low specificity. Unaffected 308
compounds that pass through both checkpoints are finally labelled non-mutagenic. 309
xxv) Internal statistics (performance of the model to the training set chemicals)- goodness-310
of-fit, robustness and predictivity 311
The authors reported accuracy of around 92% for the training set and around 82% for the test set. 312

Establishment of the residue definition for dietary risk assessment
EFSA Journal 2016;14(issue):NNNN 75
xxvi) External statistic, if available 313
Not available 314
xxvii) Information about the applicability domain (description of the applicability domain of 315
the model and method used to assess the applicability domain) 316
The model provides evaluation of the reliability of the prediction which is in three steps scale: 317
Compound is in model Applicability Domain, Compound could be out of model Applicability Domain 318
and Compound is out of model Applicability Domain. 319
The Applicability Domain evaluation is based of combination of 5 Applicability Domain scores: 320
Similarity index – measure for the similarity between the predicted substance and training set 321
substances with known experimental value; 322
Concordance – the similar substances found in the training set have (or have not) experimental values 323
that are in agreement with the predicted value; 324
Accuracy – accuracy of prediction for similar molecules found in the training set 325
Atom centred fragments similarity check – all atom centred fragments of the substance are (are not) 326
found in the list of atom centred fragments of the training set substances. 327
Model descriptor range check – descriptors for the substance have (or have not) values inside the 328
descriptor range of the training set substances. 329
xxviii) Mechanistic interpretation of the model 330
Not available 331
xxix) Description, experimental data and predictions of possible structural analogues of the 332
substance (provided by the software or selected by the applicant) 333
The software provides six most similar substances from the training set with their experimental and 334
predicted values. 335
xxx) Any additional information provided by the model, e.g. suggested mechanism of 336
action, uncertainties 337
Not available 338
Documentation of OASIS Ames Mutagenicity model (TIMES software) 339
1. Used model (title, name of authors, reference) 340
OASIS AMES mutagenicity model v08.08, Laboratory of mathematical chemistry, Burgas University 341
R. Serafimova, M. Todorov, T. Pavlov, S. Kotov, E. Jacob,A. Aptula, O. Mekenyan, Identification of 342
the structural requirements for mutagencitiy by incorporating molecular flexibility and metabolic 343
activation of chemicals. II. General Ames mutagenicity model. Chem. Res. Toxicol, 20, (2007), pp. 344
662−676. 345
2. Information about modelled endpoint (endpoint, experimental protocol) 346

Establishment of the residue definition for dietary risk assessment
EFSA Journal 2016;14(issue):NNNN 76
Ames Mutagenicity essay. 347
3. Used training set (number of the substances, information about the chemical diversity of the 348
training set chemicals) 349
The training set consists of 3489 chemicals (NTP database) separated in three groups: 641 mutagenic 350
chemicals as parents, 418 chemicals mutagenic after S9 metabolic activation (non mutagens as 351
parents), and 2430 non mutagenic chemicals. These three classes of chemicals were considered as 352
biologically dissimilar in the modeling process; i.e., chemicals being mutagenic as parents are 353
distinguished from chemicals, which were metabolically activated 354
4. Information on the algorithm used for deriving the model and the molecular descriptors 355
(name and type of the descriptors used, software used for descriptor generation and 356
descriptor selection) 357
The TIMES system combines in the same modelling platform metabolic activation of chemicals and 358
their interaction with target macromolecules. The reactivity Ames model (-S9) describing interactions 359
of chemicals with DNA was based on an alerting group approach. Only those toxicophores having 360
clear interpretation for the molecular mechanism causing the ultimate effect were included in the 361
model. The alerts were classified as direct acting and metabolically activated. The mechanistic 362
interrelation between alerts and related parametric ranges generalizing the effect of the rest of the 363
molecules on the alert is also considered. In the Ames model (+S9), the reactivity component was 364
combined with a metabolic simulator, which was trained to reproduce documented maps for 365
mammalian (mainly rat) liver metabolism for 260 chemicals. Parent chemicals and each of the 366
generated metabolites were submitted to a battery of models to screen for a general effect and 367
mutagenicity mechanisms. Thus, chemicals were predicted to be mutagenic as parents only, parents 368
and metabolites, and metabolites only. 369
5. Internal statistics (performance of the model to the training set chemicals)- goodness-of-fit, 370
robustness and predictivity 371
For 3489 chemicals, the Ames model (-S9) was able to predict correctly 82% of the Ames positive and 372
91% of the Ames negative training set chemicals. When metabolic activation is taken into account, the 373
Ames model (+S9) predicts 76% of the Ames positive and 76% of the Ames negative training set 374
chemicals. 375
6. External statistic, if available 376
Not available 377
7. Information about the applicability domain (description of the applicability domain of the 378
model and method used to assess the applicability domain) 379
The stepwise approach was used to define the applicability domain of the model. It consists of the 380
following sub-domain levels: 381
382
General parametric requirements - includes ranges of variation log KOW and MW, 383
Structural domain - based on atom-centered fragments (ACFs). 384
Interpolation space - estimates the population density of the parametric space defined by the 385
explanatory variables of the QSAR models by making use the training set chemicals. 386
Domain of simulator of metabolism - determines the reliability of the simulated metabolism. 387
388
A chemical is considered In Domain if its log KOW and MW are within the specified ranges and if its 389
ACFs are presented in the training chemicals. The information implemented in the applicability 390

Establishment of the residue definition for dietary risk assessment
EFSA Journal 2016;14(issue):NNNN 77
domain is extracted from the correctly predicted training chemicals used to build the model and in this 391
respect the applicability domain determines practically the interpolation space of the model. 392
393
S. Dimitrov, G. Dimitrova, T. Pavlov, N. Dimitrova, G. Patlevisz, J. Niemela and O. Mekenyan, J. 394
Chem. Inf. Model. Vol. 45 (2005), pp. 839-849. 395
396
8. Mechanistic interpretation of the model 397
Each structural alert in the model is related with a suggested mechanism of action which is reported 398
together with the prediction. 399
9. Description, experimental data and predictions of possible structural analogues of the 400
substance (provided by the software or selected by the applicant) 401
Not available 402
10. Any additional information provided by the model, e.g. suggested mechanism of action, 403
uncertainties 404
The model provided suggested mechanism of action, examples of the substances documented to have 405
the mechanism of action, generation of metabolites and prediction for them, information for 406
experimental observed metabolites (if available). 407
Documentation of rule based model on structural alerts for in vivo micronucleus assay (Toxtree 408
software) 409
11. Used model (title, name of authors, reference) 410
Structural alerts for in vivo micronucleus implemented in the Toxtree v.2.6.6 411
Structural analysis and predictive value of the rodent in vivo micronucleus assay results. Benigni R, 412
Bossa C, Worth A, Mutagenesis.2010 Jul;25(4):335-41 413
12. Information about modelled endpoint (endpoint, experimental protocol) 414
A large majority of the data are based on the analysis of micronuclei in bone marrow cells [for 415
rationale of and details on the assay, see (Krishna, G. and Hayashi, M. (2000) In vivo rodent 416
micronucleus assay: protocol, conduct and data interpretation. Mutat. Res., 455, 155–166. 417
Morita, T., Asano, N., Awogi.T et al. (1997) Evaluation of the rodent micronucleus assay in the 418
screening of IARC carcinogens (groups 1, 2A and 2B) the summary report of the 6th collaborative 419
study by CSGMT/JEMS MMS. Collaborative Study of the Micronucleus Group Test. Mammalian 420
Mutagenicity Study Group. Mutat. Res., 389, 3–122. 421
Hayashi, M., MacGregor, J. T., Gatehouse, D. G. et al. (2000) In vivo rodent erythrocyte micronucleus 422
assay. II. Some aspects of protocol design including repeated treatments, integration with toxicity 423
testing, and automated scoring. Environ. Mol. Mutagen., 35, 234–252. 424
Hayashi, M., MacGregor, J. T., Gatehouse, D. G. et al. (2007) in vivo erythrocyte micronucleus assay 425
III. Validation and regulatory acceptance of automated scoring and the use of rat peripheral blood 426
reticulocytes, with discussion of non-hematopoietic target cells and a single dose-level limit test. 427
Mutat. Res., 627, 10–30.)]. 428
13. Used training set (number of the substances, information about the chemical diversity of the 429
training set chemicals) 430

Establishment of the residue definition for dietary risk assessment
EFSA Journal 2016;14(issue):NNNN 78
690 chemicals from ‘FDA SAR Genetox Database’; Leadscope Inc. 178 are micronucleus positive and 431
512 are micronucleus negative. 432
14. Information on the algorithm used for deriving the model and the molecular descriptors 433
(name and type of the descriptors used, software used for descriptor generation and 434
descriptor selection) 435
The model is based on both existing hypotheses on the mechanisms of toxic action (by e.g. checking 436
the relative influence on micronucleus induction of DNA reactivity and protein binding) and on a 437
structural analysis of the chemicals tested in the assay. 438
The rulebase consists of the Benigni-Bossa mutagenicity-carcinogenicity alerts, with the exclusion of 439
the alerts specific for non-genotoxic carcinogenicity – 30 alerts, and five additional alerts associated 440
with a few suggested mechanisms related with in vivo micronucleus (e.g. mitotic spindle poisoning, 441
topoisomerase II inhibition) 442
15. Internal statistics (performance of the model to the training set chemicals)- goodness-of-fit, 443
robustness and predictivity 444
The authors reported sensitivity 66%, specificity 54% and concordance (overall accuracy) around 57% 445
16. External statistic, if available 446
Not available 447
17. Information about the applicability domain (description of the applicability domain of the 448
model and method used to assess the applicability domain) 449
Not available 450
18. Mechanistic interpretation of the model 451
The structural alerts included in the model are related with suggested by the authors mechanisms of 452
action: DNA damaging, mitotic spindle poisoning or topoisomerase II inhibition. The latter effects are 453
likely related to interference with proteins. 454
19. Description, experimental data and predictions of possible structural analogues of the 455
substance (provided by the software or selected by the applicant) 456
Not available 457
20. Any additional information provided by the model, e.g. suggested mechanism of action, 458
uncertainties 459
Not available 460
The model is published in the QMRF JRC Database: http://qsardb.jrc.it/qmrf/ 461
Documentation of OASIS in vitro chromosomal aberration model (TIMES software) 462
1. Used model (title, name of authors, reference) 463
OASIS in vitro chromosomal aberration model v08.08, Laboratory of mathematical chemistry, Burgas 464
University 465

Establishment of the residue definition for dietary risk assessment
EFSA Journal 2016;14(issue):NNNN 79
O. Mekenyan, M. Todorov, R. Serafimova, S. Stoeva, A. Aptula, R. Finking, E. Jacob, Identifying the 466
structural requirements for chromosomal aberration by incorporating molecular flexibility and 467
metabolic activation of chemicals. Chem. Res. Toxicol. Vol. 20, (2007), pp. 1927−1941. 468
2. Information about modelled endpoint (endpoint, experimental protocol) 469
In vitro structural chromosomal aberrations 470
3. Used training set (number of the substances, information about the chemical diversity of the 471
training set chemicals) 472
The training set consists of 506 chemicals separated in three groups: 243 mutagenic chemicals as 473
parents, 77 chemicals mutagenic after S9 metabolic activation (non mutagens as parents), and 186 non 474
mutagenic chemicals 475
Sofuni, T., Ed. (1998). Data Book of Chromosomal Aberration Test in vitro, Revised Edition. Life-476
Science Information Center, Tokyo, Japan. 477
4. Information on the algorithm used for deriving the model and the molecular descriptors 478
(name and type of the descriptors used, software used for descriptor generation and 479
descriptor selection) 480
Modeling the potential of chemicals to induce chromosomal damage has been hampered by the 481
diversity of mechanisms which condition this biological effect. The direct binding of a chemical to 482
DNA is one of the underlying mechanisms that is also responsible for bacterial mutagenicity. 483
Disturbance of DNA synthesis due to inhibition of topoisomerases and interaction of chemicals with 484
nuclear proteins associated with DNA (e.g., histone proteins) were identified as additional 485
mechanisms leading to CA. Reactivity component of the CA model (-S9) describing interactions of 486
chemicals with DNA and/or proteins was based on an alerting group approach. Only those 487
toxicophores having clear interpretation for the molecular mechanism causing the ultimate effect were 488
included in the model. Some of the specified alerts interact directly with DNA or nuclear proteins, 489
whereas others are applied in a combination of two-dimensional QSAR models assessing the degree of 490
activation of the alerts from the rest of the molecules. In the CA model (+S9), the reactivity 491
component was combined with a metabolic simulator, which was trained to reproduce documented 492
maps for mammalian (mainly rat) liver metabolism for 260 chemicals. Parent chemicals and each of 493
the generated metabolites were submitted to a battery of models to screen for a general effect and 494
mutagenicity mechanisms. Thus, chemicals were predicted to be mutagenic as parents only, parents 495
and metabolites, and metabolites only. 496
5. Internal statistics (performance of the model to the training set chemicals)- goodness-of-fit, 497
robustness and predictivity 498
For 506 chemicals, the CA model (-S9) was able to predict correctly 79% of the CA positive and 87% 499
of the CA negative training set chemicals. When metabolic activation is taken into account, the CA 500
model (+S9) predicts 81% of the CA positive and 75% of the CA negative training set chemicals. 501
6. External statistic, if available 502
Not available 503
7. Information about the applicability domain (description of the applicability domain of the 504
model and method used to assess the applicability domain) 505

Establishment of the residue definition for dietary risk assessment
EFSA Journal 2016;14(issue):NNNN 80
The stepwise approach was used to define the applicability domain of the model. It consists of the 506
following sub-domain levels: 507
508
General parametric requirements - includes ranges of variation log KOW and MW, 509
Structural domain - based on atom-centered fragments (ACFs). 510
Interpolation space - estimates the population density of the parametric space defined by the 511
explanatory variables of the QSAR models by making use the training set chemicals. 512
Domain of simulator of metabolism - determines the reliability of the simulated metabolism. 513
514
A chemical is considered In Domain if its log KOW and MW are within the specified ranges and if its 515
ACFs are presented in the training chemicals. The information implemented in the applicability 516
domain is extracted from the correctly predicted training chemicals used to build the model and in this 517
respect the applicability domain determines practically the interpolation space of the model. 518
519
S. Dimitrov, G. Dimitrova, T. Pavlov, N. Dimitrova, G. Patlevisz, J. Niemela and O. Mekenyan, J. 520
Chem. Inf. Model. Vol. 45 (2005), pp. 839-849. 521
522
8. Mechanistic interpretation of the model 523
Each structural alert in the model is related with a suggested mechanism of action which is reported 524
together with the prediction. 525
9. Description, experimental data and predictions of possible structural analogues of the 526
substance (provided by the software or selected by the applicant) 527
Not available 528
10. Any additional information provided by the model, e.g. suggested mechanism of action, 529
uncertainties 530
The model provided suggested mechanism of action, examples of the substances documented to have 531
the mechanism of action, generation of metabolites and prediction for them, information for 532
experimental observed metabolites (if available). 533
Step 5.3: Description of results, toxicological analysis of predicted effects and applicability 534
domain 535 Table 3. Prediction of genotoxicity (gene mutation - CAESAR and OASIS AMES model; chromosomal 536
aberrations – rule based in vivo micronucleus and OASIS CA model) of minor rat and plant 537 specific metabolites by (Q)SAR 538
CAESAR
prediction of
gene mutation
(Applicability
Domain)
OASIS
prediction of
gene mutation
(Applicability
Domain)
Rule based model
for prediction of
in vivo CA
(Toxtree) (no
Applicability
Domain
evaluation is
available)
OASIS
prediction of
CA
(Applicability
Domain)
M01 Desethyl Negative (Could
be out)
Negative (out) Positive alert for
CA
Negative (out)
M02 Despropyl Negative (Could
be out)
Negative (out) Positive alert for
CA
Negative (out)
M04 N-formyl-
desethyl
Negative (Could
be out)
Negative (out) Positive alert for
CA
Negative (out)
M05 Hydroxyl Negative (Could
be out)
Negative (out) Positive alert for
CA
Negative (out)
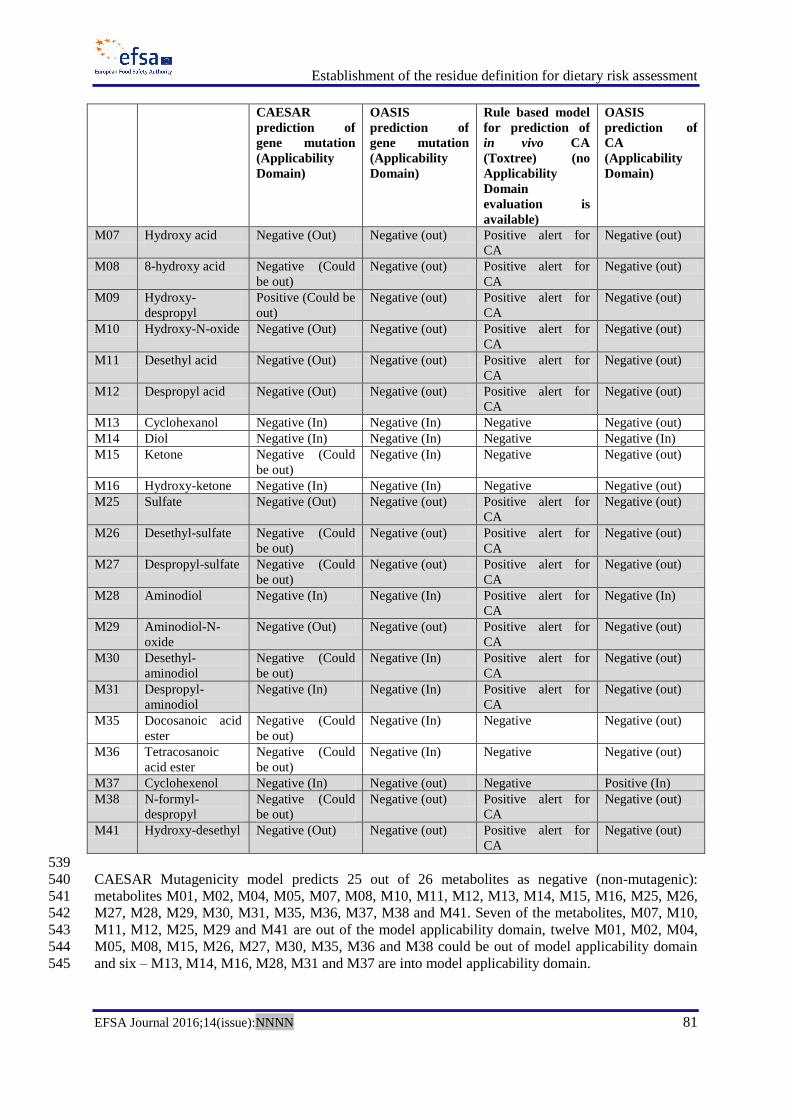
Establishment of the residue definition for dietary risk assessment
EFSA Journal 2016;14(issue):NNNN 81
CAESAR
prediction of
gene mutation
(Applicability
Domain)
OASIS
prediction of
gene mutation
(Applicability
Domain)
Rule based model
for prediction of
in vivo CA
(Toxtree) (no
Applicability
Domain
evaluation is
available)
OASIS
prediction of
CA
(Applicability
Domain)
M07 Hydroxy acid Negative (Out) Negative (out) Positive alert for
CA
Negative (out)
M08 8-hydroxy acid Negative (Could
be out)
Negative (out) Positive alert for
CA
Negative (out)
M09 Hydroxy-
despropyl
Positive (Could be
out)
Negative (out) Positive alert for
CA
Negative (out)
M10 Hydroxy-N-oxide Negative (Out) Negative (out) Positive alert for
CA
Negative (out)
M11 Desethyl acid Negative (Out) Negative (out) Positive alert for
CA
Negative (out)
M12 Despropyl acid Negative (Out) Negative (out) Positive alert for
CA
Negative (out)
M13 Cyclohexanol Negative (In) Negative (In) Negative Negative (out)
M14 Diol Negative (In) Negative (In) Negative Negative (In)
M15 Ketone Negative (Could
be out)
Negative (In) Negative Negative (out)
M16 Hydroxy-ketone Negative (In) Negative (In) Negative Negative (out)
M25 Sulfate Negative (Out) Negative (out) Positive alert for
CA
Negative (out)
M26 Desethyl-sulfate Negative (Could
be out)
Negative (out) Positive alert for
CA
Negative (out)
M27 Despropyl-sulfate Negative (Could
be out)
Negative (out) Positive alert for
CA
Negative (out)
M28 Aminodiol Negative (In) Negative (In) Positive alert for
CA
Negative (In)
M29 Aminodiol-N-
oxide
Negative (Out) Negative (out) Positive alert for
CA
Negative (out)
M30 Desethyl-
aminodiol
Negative (Could
be out)
Negative (In) Positive alert for
CA
Negative (out)
M31 Despropyl-
aminodiol
Negative (In) Negative (In) Positive alert for
CA
Negative (out)
M35 Docosanoic acid
ester
Negative (Could
be out)
Negative (In) Negative Negative (out)
M36 Tetracosanoic
acid ester
Negative (Could
be out)
Negative (In) Negative Negative (out)
M37 Cyclohexenol Negative (In) Negative (out) Negative Positive (In)
M38 N-formyl-
despropyl
Negative (Could
be out)
Negative (out) Positive alert for
CA
Negative (out)
M41 Hydroxy-desethyl Negative (Out) Negative (out) Positive alert for
CA
Negative (out)
539
CAESAR Mutagenicity model predicts 25 out of 26 metabolites as negative (non-mutagenic): 540
metabolites M01, M02, M04, M05, M07, M08, M10, M11, M12, M13, M14, M15, M16, M25, M26, 541
M27, M28, M29, M30, M31, M35, M36, M37, M38 and M41. Seven of the metabolites, M07, M10, 542
M11, M12, M25, M29 and M41 are out of the model applicability domain, twelve M01, M02, M04, 543
M05, M08, M15, M26, M27, M30, M35, M36 and M38 could be out of model applicability domain 544
and six – M13, M14, M16, M28, M31 and M37 are into model applicability domain. 545

Establishment of the residue definition for dietary risk assessment
EFSA Journal 2016;14(issue):NNNN 82
One metabolite M09 is predicted as potential mutagenic. The substance could be out of the model 546
applicability domain. Additional analysis of the 6 most similar substances from the training set shows 547
that the similarity is low between 0.795 – 0.773. All of them do not share the same functional groups 548
as the predicted substance. The most similar substance from the training set is mutagenic but it is an 549
epoxide.. 550
OASIS Ames mutagenicity model predicts all 26 metabolites as negative (non-mutagenic). Seventeen 551
of the metabolites are out of the model applicability domain M01, M02, M04, M05, M07, M08, M09, 552
M10, M11, M12, M25, M26, M27, M29, M37, M38 and M41). Nine of the metabolites are in the 553
model applicability domain M13, M14, M15, M16, M28, M30, M31, M35 and M36. 554
Toxtree in vivo micronucleus model predicts 19 metabolites as positive (at least one positive alert for 555
micronucleus assay was found) – M01, M02, M04, M05, M07, M08, M09, M10, M11, M12, M25, 556
M26, M27, M28, M29, M30, M31, M38 and M41. H-acceptor-path3-H-acceptor is identified as a 557
structural alert. According to the authors this alert represents a molecular framework that could 558
account for non-covalent interactions with proteins or DNA. Such interactions, as in the case of DNA 559
intercalation or groove binding, are potentially genotoxic. However, the positive prediction value of 560
this alert reported by the authors (Benigni, 2010) is low 34%. 561
OASIS Chromosomal aberration model predicts 25 out of 26 metabolites as negative. Two of them 562
(M14 and M28) are in the model applicability domain and the rest are out of the model applicability 563
domain. 564
One metabolite (M37) is predicted as positive (could cause chromosomal aberrations). The analyses of 565
the prediction shows that the positive prediction is after metabolic activation and the predicted as a 566
positive metabolite is in the model applicability domain and the reliability of the prediction reported 567
by the model is high (more or equal to 60%). The identified alert is an alpha/beta-unsaturated 568
carbonyls and related compounds and it is related with the mechanism of action: Interactions with 569
topoisomerases / proteins. 570
Step 5.4: Conclusion 571
(Q)SAR assessment identified a potential of metabolites M01, M02, M04, M05, M07, M08, 572
M09, M10, M11, M12, M25, M26, M27, M28, M29, M30, M31 M37, M38 and M41 to 573
provoke genotoxic effects. Metabolites M13, M14, M15; M16, M35, M36 are predicted as 574
negative from all models. All metabolites are moved to the next step – read across analysis. 575
576
Step 6: Read across (OECD toolbox)22
577
Step 6.1: Read across 578
Both endpoints gene mutation and chromosomal aberrations should be evaluated by read across for all 579
metabolites. 580
Molecular initiating events of relevance for this assessment are interaction with DNA and/or proteins. 581
The profilers included in the OECD Toolbox which codified the structural alerts which are important 582
for these two types of interactions are mechanistic profilers - DNA binding by OASIS v.1.3, DNA 583
binding by OECD, Protein binding by OASIS v 1.3, Protein binding by OECD and endpoint specific 584
profilers- DNA alerts for AMES, MN and CA by OASIS v1.3, In vitro mutagenicity (AMES test) 585
alerts by ISS, In vivo mutagenicity (Micronucleus) alerts by ISS, Protein binding alerts for 586
Chromosomal aberrations by OASIS v1.1. 587
Above mentioned profilers have been applied to metabolites M01, M02, M04, M05, M07, M08, M09, 588
M10, M11, M12, M13, M14, M15, M16, M25, M26, M27, M28, M29, M30, M31, M35, M36, M37, 589
M38 and M41 as chemicals of interest and to the parent substance, the major rat metabolite, which is 590
considered characterised by the provided genotoxicity studies and M03 for which studies were 591
provided, as substances with known experimental genotoxic activity. 592
22 http://www.oecd.org/chemicalsafety/risk-assessment/theoecdqsartoolbox.htm

Establishment of the residue definition for dietary risk assessment
EFSA Journal 2016;14(issue):NNNN 83
In order to be evaluated, the structural similarity in addition to the structural alerts related with the 593
evaluated endpoints, an organic functional group profiler has been applied. This additional step 594
provides information of the presence/ absence of other functional groups different than the structural 595
alerts and gives indication for the potential influence of the rest part of the molecule to the relevant 596
structural alerts (i.e. electronic and structural influence). 597
No structural alerts in the parent substance and in all evaluated metabolites were found by the 598
profilers: DNA binding by OASIS v.1.3, Protein binding by OASIS v 1.3, Protein binding by OECD 599
and endpoint specific profilers- DNA alerts for AMES, MN and CA by OASIS v1.3, In vitro 600
mutagenicity (AMES test) alerts by ISS, Protein binding alerts for Chromosomal aberrations by 601
OASIS v1.1. 602
The alerts found by DNA binding by OECD, Protein binding by OECD and endpoint specific profiler 603
- In vivo mutagenicity (Micronucleus) alerts by ISS and Organic functional group are presented in the 604
Table 4. 605

Establishment of the residue definition for dietary risk assessment
EFSA Journal 2016;14(issue):NNNN 84
Table 4 Genotoxicity profiling of Spiroxamine metabolites by OECD Toolbox
DNA
binding
by OECD
in vivo
mutagenicit
y (MN)
by ISS
Protein
binding
by
OECD
Organic functional groups
SN1:
Iminium Ion
Formation,
Aliphatic
tertiary
amines
Hacceptor-
path3-
Hacceptor
Acetates Aliphatic
amine,
tertiary
Aliphatic
amine,
secondary
N-
Oxide
Formyl
amino
Alcohol Carboxylic
acid
Alkane
branched
with
quaternary
carbon
Alkane
branched
with
tertiary
carbon
Cycloalkane Dioxolane Ether,
cyclic
Saturated
heterocyclic
fragment
Tert-
butyl
Cyclo
keton
Sulfate Carboxylic
acid ester
Parent* Spiroxamine x x x x x x x x x x
M01 desethyl x x x x x x x x x
M02 despropyl x x x x x x x x x
M03 N-oxide x x x x x x x x x
M04 N-formyl-desethyl
x x x x x x x x x x
M05 hydroxyl x x x x x x x x x x
M06* acid x x x x x x x x x
M07 hydroxy acid
x x x x x x x x x x
M08 8-hydroxy
acid
x x x x x x x x x
M09 hydroxy-despropyl
x x x x x x x x x
M10 hydroxy-
N-oxide
x x x x x x x x x
M11 desethyl acid
x x x x x x x x
M12 despropyl
acid
x x x x x x x x
M13 Cyclohexa
nol
x x x x x
M14 Diol x x x x
M15 ketone x x x x x
M16 hydroxy-
ketone
x x x x x
M25 sulfate x x x x x x x x x x
M26 desethyl-
sulfate
x x x x x x x x x
M27 despropyl-sulfate
x x x x x x x x x
M28 aminodiol x x x x
M29 aminodiol-
N-oxide
x x x x
M30 desethyl- x x x

Establishment of the residue definition for dietary risk assessment
EFSA Journal 2016;14(issue):NNNN 85
DNA
binding
by OECD
in vivo
mutagenicit
y (MN)
by ISS
Protein
binding
by
OECD
Organic functional groups
SN1:
Iminium Ion
Formation,
Aliphatic
tertiary
amines
Hacceptor-
path3-
Hacceptor
Acetates Aliphatic
amine,
tertiary
Aliphatic
amine,
secondary
N-
Oxide
Formyl
amino
Alcohol Carboxylic
acid
Alkane
branched
with
quaternary
carbon
Alkane
branched
with
tertiary
carbon
Cycloalkane Dioxolane Ether,
cyclic
Saturated
heterocyclic
fragment
Tert-
butyl
Cyclo
keton
Sulfate Carboxylic
acid ester
aminodiol
M31 despropyl-
aminodiol
x x x
M35 x x x x x x x
M36 x x x x x x x
M37 cyclohexen
ol
x x x x
M38 N-formyl-despropyl
x x x x x x x x x x
M41 hydroxy-
desethyl
x x x x x x x x x
* Compounds covered in their genotoxicological properties by studies with parent
Grey shaded: predicted as a potential mutagen by one of the two Ames/(Q)SAR models or predicted as potentially positive by one of the two chromosomal aberration/(Q)SAR model

Establishment of the residue definition for dietary risk assessment
EFSA Journal 2016;14(issue):NNNN 86
Both alerts aliphatic tertiary amine and Hacceptor-path3-H-acceptor present in the parent substance 1
and in the major rat metabolite (M06) are identified also in the metabolites M04, M05, M07, M08, 2
M25 and M38. No new alerts were identified. In metabolites M04 and M38 the N-formyl amino group 3
appeared as a result of metabolism of ethyl or propyl chain of the tertiary amine. OH group (in 4
metabolites M05, M07 and M08), a carboxylic group (M07 and M08) and a sulphate group (M25) 5
appeared as a result of the metabolism of t-butyl group. Therefore, based on the read across analysis 6
metabolites M04, M05, M07, M08, M25 and M38 could be considered very similar to the parent 7
substance and metabolite M06 and are not of genotoxicity concern. 8
Aliphatic tertiary amine as an alert has disappeared in metabolites M01, M02, M03, M09, M10, M11, 9
M12, M26, M27 and M41, the second alert - Hacceptor-path3-Hacceptor, is present in all of them. No 10
new alerts were identified. The changes in the rest part of the molecules compare with the parent 11
substance and are related with metabolism of the ethyl or propyl chain of the tertiary amine with 12
forming of N-oxide (M03 and M10) and secondary amine (M01 M02, M9, M11, M12, M26, M27 and 13
M41); and oxidation or sulphation of the t-butyl group with forming: an alcohol (M09, M10 and M41) 14
a carboxylic acid (M11 and M12) and a sulphate (M26 and M27). Based on the read across analysis 15
metabolites M01, M02, M09, M11, M12, M26, M27 and M41 could be considered similar to the 16
parent substance and the major rat metabolite; and are not of genotoxicity concern. Experimental data 17
for the metabolite M03 –N-oxide are available. No evidence for a genotoxic potential was identified in 18
the submitted in vitro studies (Ames test, HPRT gene mutation assay, chromosome aberration assay; 19
Ref: Spiroxamine_AR_09_Vol3_B6_16-09-2009). Metabolite M10 is also an N-oxide with oxidised t-20
butyl group, therefore could be considered very similar to metabolite M03 and the genotoxic potential 21
for it could be excluded. 22
Metabolite M28 has both structural alerts - aliphatic tertiary amine and Hacceptor-path3-Hacceptor but 23
in general the substance is significantly different than the parent substance and the major rat 24
metabolite. It is a smaller aliphatic molecule, and a different behaviour could be expected. Structurally 25
similar to metabolite M28 are also metabolites M29, M30 and M31. The difference is that in them the 26
structural alert aliphatic tertiary amine disappears forming N-oxide, and secondary amine. Hacceptor-27
path3-Hacceptor is present in three of them. No new alerts were identified. Taken into account the 28
positive prediction from the (Q)SAR models for these metabolites and since they are rather different 29
from the parent substance and the major rat metabolite,concern of genotoxicity cannot be excluded. To 30
exclude an unacceptable dietary risk by potentially genotoxic metabolites, either a combined exposure 31
estimate and comparison against TTC can be performed (step 7) or metabolites M28, M29, M30 and 32
M31 would need to be tested (step 8). The metabolite M28 contents both structural alerts and could be 33
tested as representative for the other three metabolites. 34
In metabolites M35 and M36 the structural alert aliphatic tertiary amine has disappeared, H-acceptor-35
path3-H-acceptor is still present and a new alert is identified (direct acylation involving leaving group 36
– acetates; protein binding by OECD). Based on the new alert, the concern of genotoxicity of 37
metabolites M35 and M36 cannot be excluded. To exclude an unacceptable dietary risk by potentially 38
genotoxic metabolites, both a combined exposure estimate and comparison against TTC can be 39
performed (step 8), or metabolites M35 and/or M36 would need to be tested for genotoxicity (step 9). 40
As the genotoxic concern for metabolites M35 and M36 is due to the presence of the ester bond, they 41
should be grouped as stand-alone. Alternatively, hydrolysis data across a range of physiological 42
conditions (pH 3 to pH 6) could be provided. Should these data be indicative of a fast hydrolysis 43
resulting in the metabolite M13 and carboxylic acid, the carboxylic acid should be assessed through, at 44
least initially, (Q)SAR and read across (see data gap). 45
In metabolites M13, M14, M15, M16 and M37 the structural alerts aliphatic tertiary amine and 46
Hacceptor-path3-Hacceptor have disappeared. The substances are different than the parent substance 47
and the major rat metabolite. They are cyclic aliphatic alcohols (M13, M14 and M37) and cyclic 48
aliphatic ketons (M15 and M16). In metabolites M14 and M16 additional OH group is appeared in the 49
t-butyl group. No new alerts were identified. 50

Establishment of the residue definition for dietary risk assessment
EFSA Journal 2016;14(issue):NNNN 87
Although no new alerts were identified for the metabolite M37 based on the high reliable positive 51
(Q)SAR prediction (TIMES model for chromosomal aberration) the concern of genotoxicity for 52
metabolite M37 cannot be excluded. 53
Metabolites M13, M14, M15 and M16 are predicted as negative by all (Q)SAR models though the 54
prediction was not reliable for one model for CA, while the applicability domain was not defined for 55
the second CA model leading to uncertainty on the prediction for CA. They are very similar to 56
metabolite M37, however in all of them there is no a double bond in the cycle which leads to different 57
chemical reactivity and it is crucial for forming of the structural features (alpha, beta-unsaturated 58
carbonyl substance) which has a potential to interact with topoisomerases / proteins (suggested 59
mechanism of action by the authors of the (Q)SAR model). 60
61
Step 6.2: Conclusion 62
Metabolites M13, M14, M15 and M16 are predicted as negative by all (Q)SAR models and no new 63
alerts are identified by read-across, hence they are not of concern for genotoxicity. 64
Metabolites M01, M02, M04, M05, M07, M08, M09, M10, M11, M12, M38 and M41, although 65
predicted as potential genotoxicant by (Q)SAR models, analysis are not of concern for genotoxicity 66
after read across. 67
For metabolites M28, M29, M30 and M31, a genotoxicity concern cannot be excluded, therefore they 68
should be subject of exposure assessment and comparison against TTC (step 8) and/or testing (step 9). 69
Metabolite M28 could potentially be tested as a representative for all of them. 70
For metabolites M35 and M36 genotoxicity concerns cannot be excluded, therefore they should be 71
subject to exposure assessment and comparison against TTC (step 8) and/or testing (step 9). 72
Alternatively, hydrolysis data across a range of physiological conditions (pH 3 to pH 6) could be 73
provided. Should these data indicate a fast hydrolysis resulting in the metabolite M13 and carboxylic 74
acid, the carboxylic acid should be assessed through, at least initially, (Q)SAR and read across. 75
For metabolite M37 genotoxicity concern cannot be excluded, therefore it should to be subject of 76
exposure assessment and comparison against TTC (step 8) and/or testing (step 9). 77
78
Step 7: Combined exposure assessment (optional) 79 The representative uses in Table 5 are considered in the exposure estimate. Regulatory decisions based 80
on exposure estimates are therefore restricted to these GAP conditions. 81 Table 5 Uses considered for exposure estimates 82
Crop Application
Growth stage Number kg as/ha PHI
Cereals (wheat, rye, triticale) BBCH 30-69 2 0.375 not relevant
Cereals (barley, oats) BBCH 30-61 2 0.375 not relevant
Grape BBCH 13-85 5 0.200-0.400 14 (table)
35 (wine)
Banana - 12 0.320 0 PHI pre-harvest interval 83 84
Step 7.1: Derivation of residue input data for metabolites23
85 86 a) Residue levels of in primary crops 87
23 Based on metabolism and residue data in Assessment Report (2009)
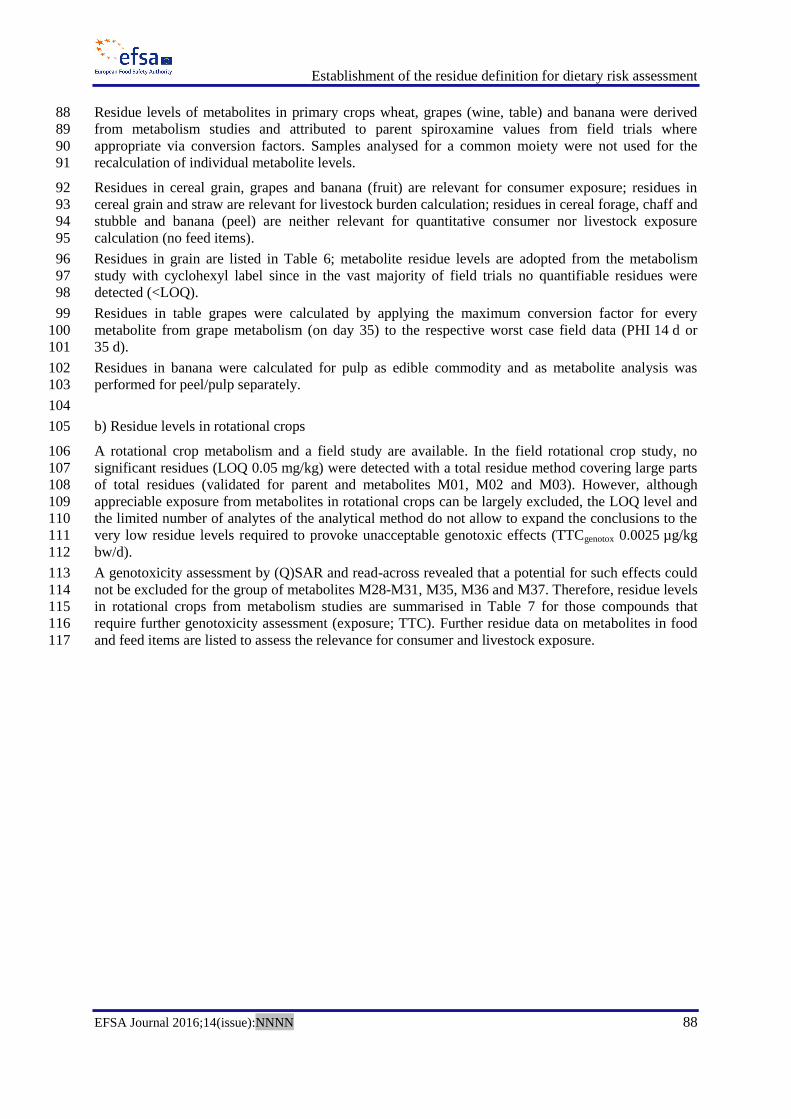
Establishment of the residue definition for dietary risk assessment
EFSA Journal 2016;14(issue):NNNN 88
Residue levels of metabolites in primary crops wheat, grapes (wine, table) and banana were derived 88
from metabolism studies and attributed to parent spiroxamine values from field trials where 89
appropriate via conversion factors. Samples analysed for a common moiety were not used for the 90
recalculation of individual metabolite levels. 91
Residues in cereal grain, grapes and banana (fruit) are relevant for consumer exposure; residues in 92
cereal grain and straw are relevant for livestock burden calculation; residues in cereal forage, chaff and 93
stubble and banana (peel) are neither relevant for quantitative consumer nor livestock exposure 94
calculation (no feed items). 95
Residues in grain are listed in Table 6; metabolite residue levels are adopted from the metabolism 96
study with cyclohexyl label since in the vast majority of field trials no quantifiable residues were 97
detected (<LOQ). 98
Residues in table grapes were calculated by applying the maximum conversion factor for every 99
metabolite from grape metabolism (on day 35) to the respective worst case field data (PHI 14 d or 100
35 d). 101
Residues in banana were calculated for pulp as edible commodity and as metabolite analysis was 102
performed for peel/pulp separately. 103
104
b) Residue levels in rotational crops 105
A rotational crop metabolism and a field study are available. In the field rotational crop study, no 106
significant residues (LOQ 0.05 mg/kg) were detected with a total residue method covering large parts 107
of total residues (validated for parent and metabolites M01, M02 and M03). However, although 108
appreciable exposure from metabolites in rotational crops can be largely excluded, the LOQ level and 109
the limited number of analytes of the analytical method do not allow to expand the conclusions to the 110
very low residue levels required to provoke unacceptable genotoxic effects (TTCgenotox 0.0025 µg/kg 111
bw/d). 112
A genotoxicity assessment by (Q)SAR and read-across revealed that a potential for such effects could 113
not be excluded for the group of metabolites M28-M31, M35, M36 and M37. Therefore, residue levels 114
in rotational crops from metabolism studies are summarised in Table 7 for those compounds that 115
require further genotoxicity assessment (exposure; TTC). Further residue data on metabolites in food 116
and feed items are listed to assess the relevance for consumer and livestock exposure. 117

Establishment of the residue definition for dietary risk assessment
EFSA Journal 2016;14(issue):NNNN 89
Table 6 Residue levels of spiroxamine metabolites in primary crop metabolism and converted field data
Grape, 35 day PHI
Cyclohexyl-1-14C label (1N) 1,3-dioxolane-4-14C label (1N) Overall CF Measured field data
(table/wine grape) a
Converted field data b
Table grape Wine grape
% TRR mg/kg CF % TRR mg/kg CF mean max STMR HR STMR
(mg/kg)
HR
(mg/kg)
STMR
(mg/kg)
Spiroxamine, parent compound 24.6 0.84 1.00 45.6 5.96 1.00 1 1 0.19/0.13 0.33/n.r. 0.190 0.330 0.100
Desethyl (M01) 1.1 0.04 0.05 2.1 0.27 0.05 0.05 0.05 0.009 0.015 0.005
Despropyl (M02) 0.5 0.02 0.02 1.5 0.20 0.03 0.03 0.03 0.006 0.011 0.003
N-oxide (M03) 2.9 0.10 0.12 4.7 0.61 0.10 0.11 0.12 0.022 0.039 0.012
Hydroxy (M05) n.d. n.d. n.d. 0.3 0.04 0.007 - 0.007 0.001 0.002 0.001
Diol (M14) 13 0.44 0.53 n.d. n.d. n.d. - 0.53 0.100 0.174 0.053
Tert.butylketone (M15) 1.3 0.04 0.05 n.d. n.d. n.d. - 0.05 0.010 0.017 0.005
Hydroxyketone (M23) 0.5 0.02 0.02 n.d. n.d. n.d. - 0.02 0.004 0.007 0.002
Aminodiol (M28)* n.d. n.d. n.d. 37.5 4.91 0.82 - 0.82 0.156 0.271 0.082
Aminodiol-N-oxide (M29)* n.d. n.d. n.d. 0.1 0.01 0.002 - 0.002 <0.001 <0.001 <0.001
Desethyl-aminodiol (M30)* n.d. n.d. n.d. 1.1 0.14 0.02 - 0.02 0.005 0.008 0.002
Despropyl-aminodiol (M31)* n.d. n.d. n.d. 1.2 0.16 0.03 - 0.03 0.005 0.009 0.003
Cyclohexanol conj. (M33, M34) 25.3 0.86 1.03 n.d. n.d. n.d. - 1.03 0.195 0.339 0.103
Docosanoic acid ester (M35) * 13 0.44 0.53 n.d. n.d. n.d. - 0.53 0.100 0.174 0.053
Tetracosanoic acid ester (M36) * 4.2 0.14 0.17 n.d. n.d. n.d. - 0.17 0.032 0.056 0.017
Cyclohexenol (M37)* 3.2 0.11 0.13 n.d. n.d. n.d. - 0.13 0.025 0.043 0.013 a based on untransformed field data (Southern-EU data for table and wine grapes (STMR) and Northern-EU data for table grapes (HR) as reported in RAR 2009 b based on max CF x parent (measured residues only; no recalculation from total residues)
CF: Conversion factor
** Metabolites of potential genotoxic concern

Establishment of the residue definition for dietary risk assessment
EFSA Journal 2016;14(issue):NNNN 90
Banana pulp, 35 day PHI (no
further metabolites identified in
peel)
Cyclohexyl-1-14C label (1N) 1,3-dioxolane-4-14C label (1N) Overall CF Measured field data a Converted field data b
% TRR mg/kg CF % TRR mg/kg CF mean max STMR HR STMR HR
Spiroxamine, parent compound 44.9 0.20 1.00 60.0 0.333 1.00 1 1 0.07 0.08 0.07 0.08
Desethyl (M01) 1.1 0.005 0.02 0.9 0.005 0.02 0.02 0.02 0.002 0.002
Despropyl (M02) 0.5 0.002 0.01 0.4 0.002 0.007 0.009 0.01 0.001 0.001
N-oxide (M03) 0.8 0.003 0.02 1.2 0.007 0.02 0.02 0.02 0.001 0.002
Diol-[hexose-pentose] (M24) 9.2 0.041 0.21 n.d. n.d. n.d. - 0.21 0.014 0.016
Aminodiol (M28)* n.d. n.d. n.d. 31.2 0.173 0.52 - 0.52 0.036 0.042
Desethyl-aminodiol (M30)* n.d. n.d. n.d. 0.6 0.003 0.01 - 0.01 0.001 0.001
Despropyl-aminodiol (M31)* n.d. n.d. n.d. 0.6 0.003 0.01 - 0.01 0.001 0.001
Cyclohexanol-[hexose-hexose] (M33a) 10.4 0.046 0.23 n.d. n.d. n.d. - 0.23 0.016 0.018
Cyclohexanol-[hexose-pentose] (M33) 3.2 0.014 0.07 n.d. n.d. n.d. - 0.07 0.005 0.006 a pulp data b based on max CF x parent (measured residue)
* Metabolites of potential genotoxic concern

Establishment of the residue definition for dietary risk assessment
EFSA Journal 2016;14(issue):NNNN 91
Wheat, 56-61 day PHI
Cyclohexyl-1-14C label (1.1N) 1,3-dioxolane-4-14C label (2.2N) CF Measured field data a Converted field data b
% TRR mg/kg CF % TRR mg/kg CF mean max STMR HR STMR HR
Grain
Spiroxamine, parent compound 14.3 0.010 1.00 2.8 0.013 1.00 1 1 0.05 0.05 n.a. d n.a. d Desethyl (M01) 0.5 <0.001 0.03 n.d. n.d. - - 0.03
Despropyl (M02) 3.0 0.002 0.21 n.d. n.d. - - 0.21
N-oxide (M03) 17.8 0.012 1.24 1.2 0.005 0.43 0.84 1.24
N-formyl-desethyl (M04) 6.9 0.005 0.48 n.d. n.d. - - 0.48
Hydroxy (M05) 1.6 0.001 0.11 n.d. n.d. - - 0.11
Straw
Spiroxamine, parent compound 25.1 8.76 1.00 20.6 17.01 1.00 1 1 0.53 2.0 0.53 2.0
Desethyl (M01) 2.0 0.70 0.08 n.d. n.d. - 0.08 0.04 0.16
Despropyl (M02) 3.2 1.12 0.13 4.2 3.48 0.20 0.17 0.20 0.11 0.41
N-oxide (M03) 22.0 7.68 0.88 20.9 17.26 1.01 0.95 1.01 0.54 2.03
N-formyl-desethyl (M04) 7.5 2.62 0.30 9.7 8.06 0.47 0.38 0.47 0.25 0.94
Hydroxy (M05) 2.4 0.84 0.10 n.d. n.d. - - 0.10 0.05 0.19
Hydroxy-despropyl (M09) 0.3 0.11 0.01 0.4 0.35 0.02 0.02 0.02 0.01 0.04
Hydroxy-N-oxide glucoside (M20) 2.0 0.70 0.08 n.d. n.d. - - 0.08 0.04 0.16
Malonic acid glucoside (M21) 1.9 0.67 0.08 3.1 2.57 0.15 0.11 0.15 0.08 0.30
Hydroxy-ketone conj (M23) 1.8 0.63 0.07 n.d. n.d. - - 0.07 0.04 0.14
Desethyl (M01)+ Hydroxy (M05) - - - 5.2 4.32 - c - - - - a based on untransformed field data (wheat, S-EU as critical case for cereal straw; wheat grain data applicable to barley) b based on max CF x parent c not used; individual values for M01 and M05 available d not used; number of non-detects too high (10/12)

Establishment of the residue definition for dietary risk assessment
EFSA Journal 2016;14(issue):NNNN 92
Table 7 Residue levels of spiroxamine metabolites in rotational crop metabolism (food and feed)
Cyclohexyl-1-14C label (2N rate) 1,3-dioxolane-4-14C label (2N rate)
% TRR mg/kg % TRR mg/kg % TRR mg/kg % TRR mg/kg % TRR mg/kg
30 days 161 days 30 days 193 days 294 days
Swiss chard (immature)
No data
TRR = 0.846 mg/kg
TRR = 0.410 mg/kg
TRR = 0.204 mg/kg
Despropyl-aminodiol (M31)* n.d. n.d. n.d. n.d. n.d. n.d.
Aminodiol-N-oxide (M29)* 1.0 0.008 5.2 0.021 n.d. n.d.
Aminodiol (M28)* 1.8 0.016 2.4 0.010 n.d. n.d.
Desethyl-aminodiol (30)* n.d. n.d. n.d. n.d. n.d. n.d.
Cyclohexenol (M37)* n.d. n.d. n.d. n.d. n.d. n.d.
Parent 9.4 0.080 2.4 0.010 8.2 0.017
M01 6.6 0.056 3.1 0.012 12.6 0.026
M02 15.0 0.127 11.0 0.045 50.0 0.102
M03 n.d. n.d. n.d. n.d. n.d. n.d.
M04 n.d. n.d. n.d. n.d. n.d. n.d.
M05 17.2 0.146 1.9 0.008 2.7 0.005
M38 n.d. n.d. n.d. n.d. n.d. n.d.
M39 2.0 0.017 n.d. n.d. n.d. n.d.
M40 4.7 0.040 0.8 0.003 n.d. n.d.
M42 n.d. n.d. n.d. n.d. n.d. n.d.
M43 1.8 0.015 n.d. n.d. n.d. n.d.
M44 2.2 0.019 4.6 0.019 3.3 0.007
M45 3.5 0.029 6.0 0.025 2.6 0.005
Swiss chard (mature)
TRR = 0.150 mg/kg
TRR = 0.07 mg/kg
TRR = 0.676 mg/kg
TRR = 0.348 mg/kg
TRR = 0.104 mg/kg
Despropyl-aminodiol (M31)* n.d. n.d. n.d. n.d. n.d. n.d. n.d. n.d. n.d. n.d.
Aminodiol-N-oxide (M29)* n.d. n.d. n.d. n.d. 0.8 0.006 n.d. n.d. n.d. n.d.
Aminodiol (M28)* n.d. n.d. n.d. n.d. n.d. n.d. 3.9 0.014 n.d. n.d.
Desethyl-aminodiol (30)* n.d. n.d. n.d. n.d. n.d. n.d. n.d. n.d. n.d. n.d.
Cyclohexenol (M37)* n.d. n.d. n.d. n.d. n.d. n.d. n.d. n.d. n.d. n.d.
Parent 40.8 0.061 8.8 0.006 9.4 0.064 3.3 0.011 10.0 0.010
M01 9.0 0.061 4.0 0.014 12.3 0.013
M02 7.5 0.011 14.2 0.010 19.7 0.133 19.0 0.066 51.2 0.053
M03 6.1 0.009 14.2 0.010 n.d. n.d. n.d. n.d. n.d. n.d.
M04 n.d. n.d. n.d. n.d. n.d. n.d. n.d. n.d. n.d. n.d.
M05 12.8 0.086 1.5 0.005 n.d. n.d.
M05/M01 a
11.6 0.017 12.1 0.008
M20 2.5 0.004 n.d. n.d.
M21 1.6 0.002 n.d. n.d.
M23 2.2 0.003 n.d. n.d.

Establishment of the residue definition for dietary risk assessment
EFSA Journal 2016;14(issue):NNNN 93
Cyclohexyl-1-14C label (2N rate) 1,3-dioxolane-4-14C label (2N rate)
% TRR mg/kg % TRR mg/kg % TRR mg/kg % TRR mg/kg % TRR mg/kg
30 days 161 days 30 days 193 days 294 days M24 3.0 0.005 n.d. n.d.
M38 n.d. n.d. n.d. n.d. n.d. n.d.
M39 2.8 0.019 n.d. n.d. n.d. n.d.
M40 3.8 0.025 0.8 0.003 n.d. n.d.
M42 0.4 0.003 1.6 0.005 n.d. n.d.
M43 0.6 0.004 n.d. n.d. n.d. n.d.
M44 3.1 0.021 2.4 0.008 n.d. n.d.
M45 1.8 0.012 5.5 0.019 2.8 0.003
Turnip roots
TRR = 0.040 mg/kg
TRR = 0.020 mg/kg
TRR = 0.101 mg/kg
TRR = 0.026 mg/kg
TRR = 0.012 mg/kg
Despropyl-aminodiol (M31)* n.d. n.d. n.d. n.d. 6.1 0.006 n.d. n.d. No data
Aminodiol-N-oxide (M29)* n.d. n.d. n.d. n.d. 4.8 0.005 4.7 0.001
Aminodiol (M28)* n.d. n.d. n.d. n.d. 4.9 0.005 n.d. n.d.
Desethyl-aminodiol (30)* n.d. n.d. n.d. n.d. n.d. n.d. n.d. n.d.
Cyclohexenol (M37)* n.d. n.d. n.d. n.d. n.d. n.d. n.d. n.d.
Parent 45.8 0.018 27.4 0.005 3.5 0.003 n.d. n.d.
M01 1.5 0.001 n.d. n.d.
M02 2.6 0.002 3.3 0.001 2.9 0.003 n.d. n.d.
M03 2.8 0.001 3.5 0.001 n.d. n.d. n.d. n.d.
M04 n.d. n.d. n.d. 0.001 n.d. n.d. n.d. n.d.
M05 0.8 0.001 n.d. n.d.
M05/M01 a
4.4 0.002 3.7 0.001
M20 n.d. n.d. n.d. n.d.
M21 n.d. n.d. n.d. n.d.
M23 8.1 0.003 n.d. n.d.
M24 7.8 0.003 n.d. n.d.
M38 n.d. n.d. n.d. n.d.
M39 n.d. n.d. n.d. n.d.
M40 n.d. n.d. n.d. n.d.
M42 2.8 0.003 n.d. n.d.
M43 2.6 0.003 n.d. n.d.
M44 1.9 0.002 n.d. n.d.
M45 3.7 0.004 9.1 0.002
Wheat straw
TRR = 1.070 mg/kg
TRR = 1.270 mg/kg
TRR = 3.178 mg/kg
TRR = 2.631 mg/kg
TRR = 0.986 mg/kg
Despropyl-aminodiol (M31)* n.d. n.d. n.d. n.d. n.d. n.d. 1.4 0.037 1.8 0.018
Aminodiol-N-oxide (M29)* n.d. n.d. n.d. n.d. n.d. n.d. n.d. n.d. n.d. n.d.
Aminodiol (M28)* n.d. n.d. n.d. n.d. 0.2 0.008 n.d. n.d. n.d. n.d.
Desethyl-aminodiol (30)* n.d. n.d. n.d. n.d. n.d. n.d. n.d. n.d. n.d. n.d.
Cyclohexenol (M37)* n.d. n.d. n.d. n.d. n.d. n.d. n.d. n.d. n.d. n.d.

Establishment of the residue definition for dietary risk assessment
EFSA Journal 2016;14(issue):NNNN 94
Cyclohexyl-1-14C label (2N rate) 1,3-dioxolane-4-14C label (2N rate)
% TRR mg/kg % TRR mg/kg % TRR mg/kg % TRR mg/kg % TRR mg/kg
30 days 161 days 30 days 193 days 294 days Parent 6.8 0.073 4.0 0.051 15.2 0.485 3.0 0.078 4.2 0.041
M01 15.1 0.479 6.2 0.163 5.6 0.055
M02 3.5 0.037 2.9 0.037 17.4 0.553 14.3 0.376 17.4 0.172
M03 12.7 0.136 12.1 0.154 7.4 0.235 5.0 0.132 1.4 0.014
M04 9.2 0.098 7,5 0.095 6.4 0.204 2.8 0.075 n.d. n.d.
M05 n.d. n.d. n.d. n.d. n.d. n.d.
M05/M01a 4.5 0.048 2.4 0.030
M20 2.1 0.022 2.6 0.033
M21 1.5 0.016 2.4 0.030
M23 2.2 0.024 1.9 0.024
M24 n.d. n.d. 4.4 0.056
M38 7.6 0.243 6.9 0.181 3.4 0.034
M39 0.5 0.015 1.6 0.043 n.d. n.d.
M40 2.8 0.088 0.9 0.024 12.6 0.124
M42 0.8 0.025 4.7 0.124 n.d. n.d.
M43 0.5 0.017 3.4 0.088 n.d. n.d.
M44 1.0 0.032 3.9 0.104 10.5 0.103
M45 0.6 0.018 2.8 0.075 2.8 0.027
Wheat grain
TRR = 0.060 mg/kg
TRR = 0.050 mg/kg
TRR = 0.131 mg/kg
TRR = 0.223 mg/kg
TRR = 0.092 mg/kg
Despropyl-aminodiol (M31)* n.d. n.d. n.d. n.d. n.d. n.d. n.d. n.d. n.d. n.d.
Aminodiol-N-oxide (M29)* n.d. n.d. n.d. n.d. n.d. n.d. n.d. n.d. n.d. n.d.
Aminodiol (M28)* n.d. n.d. n.d. n.d. n.d. n.d. n.d. n.d. n.d. n.d.
Desethyl-aminodiol (30)* n.d. n.d. n.d. n.d. n.d. n.d. n.d. n.d. n.d. n.d.
Cyclohexenol (M37)* n.d. n.d. n.d. n.d. n.d. n.d. n.d. n.d. n.d. n.d.
Parent n.d. n.d. n.d. n.d. 2.7 0.004 n.d. n.d. n.d. n.d.
M01 2.9 0.004 n.d. n.d. n.d. n.d.
M02 n.d. n.d. n.d. n.d. 4.8 0.006 n.d. n.d. n.d. n.d.
M03 n.d. n.d. n.d. n.d. 4.3 0.006 n.d. n.d. n.d. n.d.
M04 n.d. n.d. n.d. n.d. 1.5 0.002 n.d. n.d. n.d. n.d.
M05 n.d. n.d. n.d. n.d. n.d. n.d.
M05/M01a n.d. n.d. n.d. n.d.
M20 n.d. n.d. n.d. n.d.
M21 n.d. n.d. n.d. n.d.
M23 n.d. n.d. n.d. n.d.
M24 n.d. n.d. n.d. n.d.
M38 2.7 0.003 n.d. n.d. n.d. n.d.
M39 n.d. n.d. n.d. n.d. n.d. n.d.
M40 n.d. n.d. n.d. n.d. n.d. n.d.
M42 n.d. n.d. n.d. n.d. n.d. n.d.
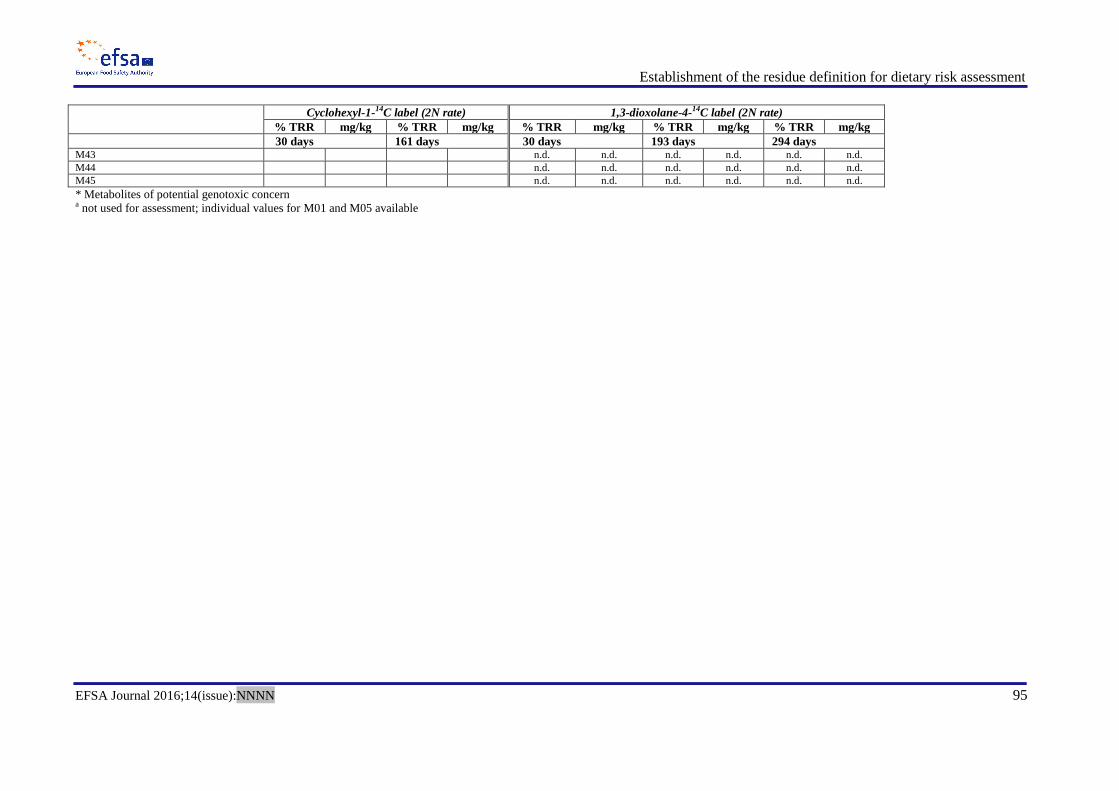
Establishment of the residue definition for dietary risk assessment
EFSA Journal 2016;14(issue):NNNN 95
Cyclohexyl-1-14C label (2N rate) 1,3-dioxolane-4-14C label (2N rate)
% TRR mg/kg % TRR mg/kg % TRR mg/kg % TRR mg/kg % TRR mg/kg
30 days 161 days 30 days 193 days 294 days M43 n.d. n.d. n.d. n.d. n.d. n.d.
M44 n.d. n.d. n.d. n.d. n.d. n.d.
M45 n.d. n.d. n.d. n.d. n.d. n.d.
* Metabolites of potential genotoxic concern a not used for assessment; individual values for M01 and M05 available

Establishment of the residue definition for dietary risk assessment
EFSA Journal 2016;14(issue):NNNN 96
Step 7.2: Exposure calculations for those metabolites, for which genotoxic effects cannot be 1
excluded 2 Table 8 Exposure calculation
24 and TTC assessment of metabolites with potential genotoxicity concern 3
Wine
grape
Table grape Banana Cereal
grain
Root
crops
Leafy
crops
STMR STMR HR STMR HR Metabolism data
mg/kg mg/kg mg/kg mg/kg mg/kg mg/kg mg/kg mg/kg
Metabolite M28 0.082 0.156 0.271 0.036 0.042 nd 0.005 0.010
Metabolite M29 0.001 0.0004 0.001 nd nd nd 0.005 0.021
Metabolite M30 0.002 0.005 0.008 0.001 0.001 nd nd nd
Metabolite M31 0.003 0.005 0.009 0.001 0.001 nd 0.006 nd
Sum of metabolites 0.088 0.166 0.289 0.038 0.044 - 0.016 0.031
Metabolite M35
0.053 0.100 0.174 nd nd nd nd nd
Metabolite M36 0.017 0.032 0.056 nd nd nd nd nd
Sum of metabolites 0.070 0.132 0.230 - - - - -
Metabolite M37
0.013 0.025 0.043 nd nd nd nd nd
Sum of metabolites 0.013 0.025 0.043 - - - - -
Chronic exposure (most critical; metabolite groups)
M28-M31: 0.419 µg/kg bw/d (FR all population) = >10000 % TTCgenotoxicity
M35-M36: 0.294 µg/kg bw/d (FR all population) = >10000 % TTCgenotoxicity
M37: 0.087 µg/kg bw/d (FR all population) = 3480 % TTCgenotoxicity
Acute exposure (most critical; metabolite groups)
M28-M31: 18.9 µg/kg bw/d (table grapes, children) = >10000 % TTCgenotoxicity
M35-M36: 15.1 µg/kg bw/d (table grapes, children) = >10000 % TTCgenotoxicity
M37: 2.82 µg/kg bw (table grapes, children) = >10000 % TTCgenotoxicity
4
Step 7.3: Conclusion 5 The combined as well as the individual exposure assessment for all metabolites, for which an 6
unacceptable risk of genotoxic effects cannot be excluded a priori (M28-31; M35-36; M37), reveals 7
an exceedance of the acceptable TTC threshold for genotoxicity of 0.0025 µg/kg bw/d, see table 8. 8
9
Additional exposure by food of animal origin via rotational crops cannot be excluded for M28-M31. 10
The reliability of the exposure estimate is, although limited with regard to the upper bound, reliable for 11
the lower bound high exposure (exceedance of TTC). 12
13
Metabolite M28 has the highest exposure potential within the group of metabolites M28-M31. It is in 14
this respect a suitable candidate for genotoxicity testing. 15
16
Potential genotoxic effects (indicated during genotoxicity hazard assessment) cannot be excluded for 17
metabolite group M35/M36 and for M37 based on exposure estimates, which do not provide 18
indications of dietary non-relevance. Genotoxicity concerns should be addressed for M35/M36 and 19
M37 either by testing according to step 9 or by hydrolysis experiments under physiological conditions 20
combined with QSAR assessment (M35/M36 only). 21
22
23
24
24 Exposure assessment performed with EFSA PRIMo rev.2

Establishment of the residue definition for dietary risk assessment
EFSA Journal 2016;14(issue):NNNN 97
Step 8: Genotoxicity testing 25 Metabolite M28, selected as representative for metabolites M28 - M31, should be tested for the 26
exclusion of genotoxicity (data gap; see step 20). 27
Metabolite M37 should be tested for the exclusion of genotoxicity (data gap; see step 20). 28
Genotoxicity endpoints (point mutations, structural and numerical chromosome aberrations) should be 29
investigated. In-vitro studies (e.g. Ames test (TG 471) and in vitro micronucleus assay (TG 487)) are 30
considered suitable for the exploration of the above mentioned genotoxicity endpoints. 31
Similar testing strategy should be applied for the selected group representative for metabolites M35 32
and M36 or by hydrolysis experiments under physiological conditions combined with QSAR 33
assessment (data gap; see step 20). 34
35
Step 9: Genotoxicity concern 36 None (pending additional information on metabolites M28, M35 and M36, M37). 37
38
Step 10: General toxicity of metabolites characterized by studies with parent or by specific 39
studies 40
Step 10.1: Toxicological assessment of parent compound 41 The ADI for the parent compound, spiroxamine, was set at 0.025 mg/kg bw per day based on the 42
effects observed on the liver and the eye in the dog toxicity studies (NOAEL of 2.5 mg/kg bw per day, 43
UF 100; EFSA, 2010). 44
The ARfD for the parent compound was set at 0.1 mg/kg/bw based on unspecific toxicity in the rat 45
neurotoxicity study (NOAEL 10 mg/kg bw; UF of 100; EFSA, 2010). 46
Malformations (i.e. cleft palate) were observed at 100 mg/kg bw per day in the developmental toxicity 47
in rats leading to a proposal for classification with R63 “Possible risk of harm to the unborn child” 48
(EFSA, 2010). The developmental NOAEL in rats was 30 mg/kg bw per day. 49
50 The liver and gastrointestinal tract were the target organs of toxicity in the 28-day and 90-day toxicity 51
studies conducted with the parent in rats with an established NOAEL of 3.4 and 1.9 mg/kg bw per day 52
respectively (DE, 2009). 53
54
Step 10.2: Toxicological assessment of metabolites 55 Metabolites M06 is considered covered in its toxicological properties by the studies with the parent 56
(i.e. above the threshold of 10% of the administered dose in terms of total radioactive material 57
recovered in the urine as detected in ADME studies; see Table 2). No further toxicological assessment 58
is needed. 59
Toxicological studies on M03 showed that M03 has an acute oral toxicity to rats (LD50 oral: ~707 60
mg/kg bw). The liver and gastrointestinal tract were the target organs of toxicity in the 28-day and 90-61
day toxicity studies in rats. The NOAEL were 12.9 and 8.8 mg/kg bw/day respectively (DE, 2009). 62
Further toxicological assessment is not needed (step 18). 63
64
Step 11: Combined exposure of all metabolites to assess general toxicity (optional) 65 The TTC assessment is only of limited applicability to the representative uses of spiroxamine due to 66
the level of uncertainties linked to the multiple uses, the number of metabolites and their grouping as 67
well as possible exposure scenarios considering residues from treated plant commodities as well as 68
livestock animals. Therefore, TTC assessment is not an adequate assessment tool and the exposure 69
assessment is not conducted. 70
71
Step 12: Consideration on potency 72 The ADI for the parent compound, spiroxamine, was set at 0.025 mg/kg bw per day based on the 73
effects observed on the liver and the eye in the dog toxicity studies. Based on the ADI value 74
(>0.01 mg/kg bw/d), spiroxamine is not considered of concern in terms of potency. 75
76
77

Establishment of the residue definition for dietary risk assessment
EFSA Journal 2016;14(issue):NNNN 98
Step 13: Assessment of major plant metabolites in food (≥10% TRR and ≥0.01 mg/kg OR 78
≥0.05 mg/kg) 79 The metabolite spectra for cereals and fruits are considered dissimilar and justify separate residue 80
definitions, if necessary (pending closure of data gaps). 81
For cereals and rotational crops (food items only), parent, metabolites M01, M02, M03 and M05 are 82
candidates for inclusion into the residue definition for plants (Table 6 and 7). 83
For fruits, parent, metabolites M01, M02, M03, M14, M28, M30, M31, M33 (=M13 conj.), M34 84
(=M13 conj.), M35, M36 and 37 are candidates for inclusion into the residue definition for plants 85
(Table 6 and 7). 86
Metabolite M03 is considered toxicologically characterised by specific studies (see step 10.2). 87
Metabolites M01, M02, M05, M14, M28, M30, M31, M33 (=M13 conj.), M34 (=M13 conj.), 88
M35,M36 and M37 are below the threshold of 10% of the AD in terms of total radioactive material 89
recovered in the urine as detected in ADME studies. Consequently, further toxicological and exposure 90
considerations are needed (step 18). 91
Metabolites M33 and M34 are sugar conjugates and they likely result in metabolite M13 after 92
hydrolysis; therefore, the assessment will be conducted on M13. 93
Metabolites M(35) and M(36) are esters of M13 and docosanoic and tetracosanoic acid and they need 94
to be assessed. 95
96
Step 14: Assessment of minor plant metabolites in food (<10% TRR AND <0.05 mg/kg) 97 Based on the ADI value for parent (>0.01 mg/kg bw/d) the minor metabolites are not considered of 98
concern in terms of potency in relationship to parent. Minor metabolites are not expected to 99
significantly contribute to the toxicity burden and no further toxicological or exposure assessment is 100
needed. 101
102
Step 15: Assessment of major plant metabolites in feed (≥10% TRR and ≥0.01 mg/kg) 103 For dietary burden calculation, those compounds are considered that occur at 1N rate in at least one 104
feed commodity at ≥10 % TRR (and at least 0.01 mg/kg). 105
These are parent, metabolites M01, M02, M03, M05, M40 (conjugate of M05), and M44 (conjugate of 106
M06). 107
Grape and banana are not considered as feed items. 108
109
Step 16: Potential of residue transfer from feed to livestock 110 The dietary burden calculation for requiring an animal metabolism study and further define the 111
relevance of metabolites, has to consider the highest likely residues of major residues in feed items, if 112
they exceed the triggers in at least one food commodity (Table 9). 113
Using input data of parent and all major feed metabolites for the dietary burden calculation, the trigger 114
of 0.004 mg/kg bw/d for requirement of a livestock metabolism study is exceeded for ruminants and 115
poultry. 116
Parent (including the group of related metabolites) and metabolite M03 are considered separately due 117
to structural dissimilarity that may lead to a different kinetic ADME behaviour in livestock 118
(assessment based on structural similarities; see step 18). 119
Metabolism of spiroxamine is addressed by radiolabelled studies in goats and laying hens (step 17). 120
Metabolism of lead compound M03 in ruminants and poultry is not characterised. The dietary risk 121
associated with the potential transfer of metabolite M03 into animal commodities cannot be assessed 122
by means of the parent residue profile and levels. Since M03 exceeds the trigger of 0.004 mg/kg bw/d, 123
it is concluded on base of all information, that a new ruminant and poultry metabolism study with lead 124
compound M03 is required (data gap). 125
126 127

Establishment of the residue definition for dietary risk assessment
EFSA Journal 2016;14(issue):NNNN 99
128 Table 9 Input data and dietary burden calculation for spiroxamine and potentially relevant metabolites
25 129 Primary/Rotational crops Rotational crops Contribution to livestock burden
Compound Cereal grain Cereal straw Leafy Root
mg/kg mg/kg mg/kg mg/kg Diet mg/kg bw/d %
Spiroxamine group
Spiroxamine 0.010 2.0 0.061 0.018 Lamb
Ewe
Layer
0.060
0.047
0.017
41
41
38
M01 0.001 0.16 0.031 n.d. Lamb
Ewe
Layer
0.005
0.004
0.001
3
3
3
M02 0.002 0.41 0.067 0.002 Lamb
Ewe
Layer
0.012
0.009
0.003
8
8
6
M05 0.001 0.19 0.073 n.d. Lamb
Ewe
Layer
0.005
0.004
0.002
4
4
4
M40
(conjugated
M5)
n.d. 0.062 0.020 n.d. Lamb
Ewe
Layer
0.002
0.001
0.000
1
1
1
M44
(conjugated
M06)
n.d. 0.052 0.010 0.001 Lamb
Ewe
Layer
0.002
0.001
0.000
1
1
1
M03 0.012 2.0 0.005 0.001 Lamb
Ewe
Layer
0.060
0.047
0.022
41
41
47
Sum Lamb
Ewe
Layer
0.120
0.094
0.039
100
100
100 130 131
Step 17: Major animal metabolites ≥10% TRR in food 132
Ruminants 133
Radiolabelled metabolism studies with spiroxamine as lead compound serve as basis for the proposal 134
of a residue definition for risk assessment (applicable for feed metabolites of the spiroxamine group; 135
Table 9). After administration of spiroxamine to lactating ruminants, the identified metabolite spectra 136
in goat contains 10 metabolites (Table 10). Metabolite M06, its glucuronide M19 and M07 occur as 137
major metabolites of parent compound at levels exceeding each 10% of TRR and need further 138
assessment. 139
Parent, M06, M07 and M19 make up between 40-67% of TRR and 59-84% of identified residues. 140
Other significant feed metabolites included in the dietary burden calculation within the parent group 141
are considered assessable by available metabolism and feeding data, even if they were not observed in 142
livestock metabolism (e.g. M01, M02 in ruminant feed are covered by their sulfate conjugates M26 143
and M27) (DE, 2009). 144
145
25 EFSA livestock burden calculator considering OECD feeding table.

Establishment of the residue definition for dietary risk assessment
EFSA Journal 2016;14(issue):NNNN 100
Table 10: Metabolite levels in a ruminant metabolism study after administration of spiroxamine (85N rate) 146
Residue component Kidney Liver Muscle
mg/kg % of TRR mg/kg % of TRR mg/kg % of TRR
Parent 0.028 0.2 1.10 5.0 nd nd
M06 1.48 10.4 4.33 19.6 0.500 48.3
M07 2.27 16.0 0.38 1.7 0.106 10.3
M08 0.33 2.3 0.26 1.2 nd nd
M11 0.82 5.8 0.84 3.8 0.066 6.4
M12 1.28 9.0 0.7 3.5 0.070 6.8
M19 1.89 13.3 7.22 32.7 0.082 7.9
M22 0.06 0.4 nd nd nd nd
M25 0.23 1.6 0.49 2.2 nd nd
M26 0.46 3.2 0.42 1.9 nd nd
M27 0.82 5.8 1.04 4.7 nd nd
Residue component Fat Milk
mg/kg % of TRR mg/kg % of TRR
Parent nd nd nd nd
M06 0.199 30.5 0.496 53.3
M07 0.063 9.7 0.101 10.9
M08 nd nd nd nd
M11 0.028 4.3 0.051 5.5
M12 0.041 6.2 nd nd
M19 0.101 15.4 nd nd
M22 nd nd nd nd
M25 nd nd 0.076 8.2
M26 0.023 3.5 nd nd
M27 0.023 3.5 nd nd
147
No final conclusion can be made for metabolites following administration of the second lead 148
compound M03 to ruminants. 149
Poultry 150
A radiolabelled metabolism study is available. Residues found in the metabolism study comprise the 151
major compounds parent, M06, M01 and M02 (all >10% TRR in at least one edible matrix; no further 152
metabolites identified). Quantitative transfer into animal matrices at 1N cannot be excluded a priori. 153
Table 11 Metabolite levels in a poultry metabolism study after administration of spiroxamine (300N rate) 154
Residue component Liver Muscle Fat Eggs
mg/kg % TRR mg/kg % TRR mg/kg % TRR mg/kg % TRR
Spiroxamine 2.324 13.3 0.430 17.8 9.562 77.4 0.100 11.8
M06 1.486 8.5 0.901 37.3 0.210 1.7 0.317 37.4
M02 3.793 21.7 0.273 11.3 0.420 3.4 0.086 10.2
M01 3.723 21.3 0.225 9.3 1.038 8.4 0.097 11.5
Identification rate 11.326 64.8 1.829 75.7 11.230 90.9 0.600 70.9
155
No conclusion can be made for metabolites following administration of metabolite M03 (data gap). 156
Other significant feed metabolites, although not observed in livestock metabolism, are considered as 157
covered by available data. M44 is a conjugate of M06, and M05 is considered an intermediate in 158
parent metabolism to M06 (DE, 2009). 159

Establishment of the residue definition for dietary risk assessment
EFSA Journal 2016;14(issue):NNNN 101
Step 18: Testing strategy, grouping and read-across 160 Proposal for grouping based on structural similarities: 161
Group A (parent similar metabolites): 162
M01, M02, M05, M06, M07, M19, M40, M44 163 CH3
NH
O
H3C
CH3
CH3 O
M1
CH3NH
O
H3C
CH3
CH3 O
M2
CH3
N
CH3OCH3
CH3OH O M5
CH3
N
CH3OCH3
CH3OH
O
O
M6 CH3
N
CH3O
CH3OH
HO O
O
M7
CH3
N
CH3OCH3
CH3O
O
OHOH
HO
OH
O
O
O
M19
CH3N
CH3OCH3
CH3
O
OHOH
HO
HO
O
O
M40
CH3N
CH3
OCH3
CH3O
O
OHOH
HO
HO
O
O
M44
164
Group B 165
M14, M33 (conjugate M13), M34 (conjugate M13), M35, M36, M37, 166
H3C
CH3
CH3
OH
M13
CH3
CH3
OH
OH
M14
H3C
CH3
CH3
O
HO
OH OH
O
OH
OH
OH
O
O
M33
H3C
CH3
CH3
O
HO
OH OH
O
HO
OH OH
O
HO
OH
OH
O
OO
M34
CH3
O
OH3C
CH3
CH3
M35
CH3
O
OH3C
CH3
CH3
M35
H3C
CH3
CH3
OH
M37
Group C - aminodiol 167
M28, M30, M31 168
CH3
N
CH3
OH
HO
M28
CH3
NH
OH
HO
M30
CH3NH
OH
HO
M31
169
Group D – oxide 170
M03, 171
CH3N
O
CH3O
H3C
CH3
CH3O
M3
172
Group A: (parent similar metabolites) 173 Toxicological assessment of metabolites M01 and M02 174
Metabolites M01 and M02 at first instance are considered as similar to the parent substance, the 175
difference is that they are secondary amines while the parent is a tertiary amine, therefore parent 176
reference values can be applied. 177
Toxicological assessment of metabolite M05 and its conjugate M40 178

Establishment of the residue definition for dietary risk assessment
EFSA Journal 2016;14(issue):NNNN 102
Metabolite M05 is considered similar to the parent substance. The structural difference is a simple 179
hydroxylation of the t-butyl group, therefore parent reference values can be applied. 180
Toxicological assessment of metabolite M06 and its conjugates M19 and M44 181
Metabolite M06 is covered in its toxicological properties by parent compound studies, because it is 182
above 10% of AD in terms of total radioactive material recovered in the urine as detected in ADME 183
studies. 184
Toxicological assessment of metabolite M07 185
Metabolite M07 is very similar with M06. The structural difference is an additional hydroxyl group in 186
the t-butyl group, therefore no further toxicological consideration is needed. 187
Group B: 188 Toxicological assessment of metabolite M13 and its conjugates M33, M34 189
Metabolite M13 is identified in conjugated form (M33 and M34) as a major plant metabolite in fruits. 190
Additional testing is recommended in order to establish adequate toxicological reference values 191
(relevant for representative uses grapes and banana). M13 is lead compound for M33, M34 and M14. 192
Metabolites M33 and M34 are considered sugar conjugates and they likely result in metabolite M13 193
after hydrolysis. The 28 days rat toxicity study should be performed following the study design as 194
recommended in the guidance document (chapter 3.1). In addition, as spiroxamine is proposed for 195
classification (cat.2) due to the concern on developmental toxicity, a tiered approach should be 196
considered by first addressing the hazard characterization and the reference potency factor for 197
potential waiving of testing for developmental toxicity. Alternatively, as recommended in section 3.4 198
of the guidance, if the metabolite M13 is common to other active substances and already characterised, 199
these data could be considered, if relevant, for the risk assessment. 200
Toxicological assessment of metabolite M14 201
Metabolite M14 is very similar with metabolite M13, the difference is a hydroxyl group in the t-butyl 202
group, therefore the metabolite could be grouped with M13. 203
Toxicological assessment of metabolites M35 and M36 204
Metabolites M35 and M36 are esters of M13 and docosanoic and tetracosanoic acid data on hydrolysis 205
are not available. Should hydrolysis data demonstrate hydrolysis of the ester bond, the two resulting 206
alcohols can be grouped based on chemical similarity of the moiety and represented by the lead 207
compound (M13). However, the resulting acids need to be assessed separately. Similarly, if hydrolysis 208
cannot be demonstrated, the two esters (M35 and M36) should be assessed as such. 209
Toxicological assessment of metabolite M37 210
Metabolite M37 contains the same general structural moiety as M13, however there is a double bound 211
in the cycle which could lead to a different chemical reactivity and similarity in the toxicological 212
properties cannot be assumed. 213
The 28 days rat toxicity study should be performed following the study design as recommended in the 214
guidance document (chapter 3.1). In addition, as spiroxamine is proposed for classification (cat.2) due 215
to the concern on developmental toxicity, a tiered approach should be considered by first addressing 216
the hazard characterization and the reference potency factor for potential waiving of testing for 217
developmental toxicity. Alternatively, as recommended in section 3.4 of the guidance, if the 218
metabolite M37 is common to other active substances and already characterised, these data could be 219
considered, if relevant, for the risk assessment. 220
Group C (aminodiols) 221
Toxicological assessment of metabolites M28, M30 and M31 222
Additional testing is recommended for metabolite M28 (e.g. selection criteria based on the relevant 223
exposure) to establish adequate toxicological reference values. Initially, the 28 days rat toxicity study 224
should be performed. In addition, as spiroxamine is proposed for classification (cat.2) due to the 225
concern on developmental toxicity, a tiered approach should be considered by first addressing the 226
hazard characterization and the reference potency factor for potential waiving of testing for 227
developmental toxicity. 228
Group D - oxide 229
Toxicological assessment of metabolite M03 230

Establishment of the residue definition for dietary risk assessment
EFSA Journal 2016;14(issue):NNNN 103
In principle based on the results above, additional testing would be needed for metabolite M03 in 231
order to establish adequate toxicological reference. However, adequate 28 day and 90-day rat toxicity 232
studies are available (DE, 2009). As spiroxamine is proposed for classification (cat.2) due to the 233
concern on developmental toxicity, this hazard needs to be assessed for metabolite M03. With the 234
parent compound, spiroxamine, developmental toxicity effect was observed at doses higher than the 235
one used as a point of departure for the establishment of the reference values. Additionally, in the 28 236
and 90 day rat toxicity studies the metabolite M03 was less potent than the parent. For these reasons 237
testing for developmental toxicity with the metabolite M03 can be waived. In this case the 238
development hazard characterisation will be the same as for the parent. 239
No further toxicological testing required. 240
241

Establishment of the residue definition for dietary risk assessment
EFSA Journal 2016;14(issue):NNNN 104
Step 19: Assessment of toxicogical burden 242 The following major compounds of (qualitative) toxicological relevance were identified in food and 243
feed of plant origin and require further assessment: Parent, M01, M02, M03, M05 (including its 244
conjugate M40), M44 (conjugate of M6), M14, M28, M30, M31, M33 (conjugate of M13), M34 245
(conjugate of M13), M35, M36 and M37. 246
Their quantitative occurrence is expressed in Table 12 and Table 13 in terms of %TRR (as determined 247
in metabolism studies) and in % of toxicological burden, which is meant as percentage of identified 248
residue compounds on the total identified compounds of toxicological relevance. 249
The following compounds are quantitatively relevant for risk assessment: 250
251 Cereals: Parent, M03 and additionally (for rotational crops only) M01, M02 and M05 (free and 252
conjugated) 253
Root crops: Parent; rotational crops only 254
Leafy crops: Parent, M01, M02, M05 (free and conjugated); rotational crops only 255
Fruit crops: Parent, M14, M28, M33 and M34 (conjugates of M13), M35 (provisionally; open data 256
requirements) 257
258
In primary crops, the coverage of the toxicological burden is between 85-97% for fruit crops 259
(provisionally) and 70-73% for cereals. 260
261

Establishment of the residue definition for dietary risk assessment
EFSA Journal 2016;14(issue):NNNN 105
Table 12 Residue input data for residues of potential concern in food and feed of plant origin (primary crops)
Cereals Fruits
Grain (C)a Straw (C) a Grapes (C) Grapes (D) Banana (C) Banana (D)
Metabolite RPF
%TRR
% tox
burden %TRR
% tox
burden %TRR
% tox
burden %TRR
% tox
burden %TRR
% tox
burden
%TRR % tox
burden
Parent 1 14.3 32.4 25.1 36.8 24.6 27.5 45.6 48.5 44.9 64.1 60.0 60.9
M01 1 0.5 1.1 2.0 3.8 1.1 1.2 2.1 2.2 1.1 1.6 0.9 0.9
M02 1 3.0 6.8 3.2 6.1 0.5 0.6 1.5 1.6 0.5 0.7 0.4 0.4
M03 1 17.8 40.4 22.0 33.6 2.9 3.2 4.7 5.0 0.8 1.1 1.2 1.3
M14 (incl. conj.
M24) 1b 13.0 14.5 9.2 13.1
M28 1b 37.5 39.9 31.2 31.6
M30 1b 1.1 1.2 0.6
M31 1b 1.2 1.3 0.6
M13 (incl. conj.
M33, M34) 1b 25.3 28.2 13.6 19.4
M35 1b 13.0 14.5
M36 1b 4.2 4.7
M37 1b 3.2 3.6
Other (minor) 8.5 15.9 1.8 0.4 0 0
Sum of relevant
metabolites 32.1 72.8 47.1 70.4 75.9 84.7 b 83.1 88.4 b 67.7 96.6 b 91.2 92.5 b
Sum of non-
considered
metabolites
12.0 21.1 3.4 11.0 2.4 3.7
a The residue situation in cereal D-label is covered by assessment of C-label b Provisional; toxicological characterisation not finalised

Establishment of the residue definition for dietary risk assessment
EFSA Journal 2016;14(issue):NNNN 106
Table 13 Residue input data for major residues of potential concern in food of plant origin (rotational crops)
Metabolite RPF 30 d PBI 294d a 30 d PBI 30 d PBI 161 d PBI a
Straw (C) Straw (D) Straw (D) Turnip roots (C) Swiss chard (D) Swiss chard (C)
%TR
R
% tox burden %TRR % tox burden %TRR % tox burden %TRR % tox burden %TRR % tox burden %TRR % tox burden
Parent 1 6.8 16.0 15.2 20.0 4.2 7.0 45.8 64.1 9.4 14.4 8.8 15.0
M01 1 n.d. n.d. 15.1 19.8 5.6 9.4 4.4 6.2 9.0 14.0 12.1 20.6
M02 1 3.5 8.2 17.4 22.9 17.4 29.1 2.6 3.6 19.7 30.7 14.2 24.2
M03 1 12.7 29.9 7.4 9.7 1.4 2.3 2.8 3.9 14.2 24.2
M05 (+conj. M40) 1 4.5 10.6 2.8 3.7 12.6 21.1 16.6 25.8 - -
M06 (+ conj. M44) 1 1.0 1.3 10.5 17.6 3.1 4.8
Sum of relevant
metabolites 27.5 64.7 58.9 78.0 51.7 86.6 45.8 64.1 54.7 84.9 49.3 84.1
Sum of non-
considered
metabolites
15.0 35.3 16.6 22.0 8.0 13.4 25.7 35.9 9.5 15.1 9.3 15.9
a 30d PBI is critical due to higher exposure potential; no higher toxicity is assumed for compounds identified as major at later PBIs (therefore non-consideration of M06 (free+conjugated) for cereals
and M03 for Swiss chard)

Establishment of the residue definition for dietary risk assessment
EFSA Journal 2016;14(issue):NNNN 107
Livestock 1
The following major residue compounds are considered as candidates for inclusion into the residue 2
definition for livestock: Parent spiroxamine, M01 (poultry), M02 (poultry), M06 (including its 3
glucuronide conjugate M19; goat and poultry), M07 (goat). 4
5
Their quantitative occurrence is expressed in Table 14 (for ruminants) and Table 15 (for poultry) in 6
terms of %TRR (as determined in metabolism studies) and in % of toxicological burden, which is 7
meant as percentage of identified residue compounds. 8 Table 14 Residues of concern for food of animal origin following administration of spiroxamine: 9
Ruminants (≥10 % TRR and at least 0.01 mg/kg) 10
Kidney Liver Muscle Fat Milk
Metabolite RPF %TRR % tox
burden
%TRR % tox
burden
%TRR % tox
burden
%TRR % tox
burden
%TRR % tox
burden
Parent 1 0.2 0.3 5.0 6.6 nd - nd - nd -
M06 (incl.
conjug. M19)
1 23.7 34.9 52.3 68.6 56.2 70.5 45.9 62.8 53.3 68.4
M07 1 16.0 23.5 1.7 2.2 10.3 10.3 9.7 9.7 10.9 14.0
Sum of
relevant
metabolites
39.9 58.7 59.0 77.4 66.5 70.8 55.6 72.5 64.2 84.4
Sum of non-
considered
metabolites
(all minor)
28.1 17.3 13.2 17.5 77.9
11
Table 15 Residues of concern for food of animal origin following administration of spiroxamine: 12 Poultry (≥10 % TRR and at least 0.01 mg/kg) 13
Liver Muscle Fat Eggs
Metabolite RPF %TRR % tox
burden
%TRR % tox
burden
%TRR % tox
burden
%TRR % tox
burden
Parent 1 13.3 20.5 17.8 23.5 77.4 85.1 11.8 16.6
M01 1 21.3 32.9 9.3 12.3 8.4 9.2 11.5 16.2
M02 1 21.7 33.5 11.3 14.9 3.4 3.7 10.2 14.4
M06 1 8.5 13.1 37.3 49.3 1.7 1.9 37.4 52.8
Sum of relevant
metabolites
64.8 100 75.7 100 90.9 100 70.9 100
Sum of non-
considered metabolites
0 0 0 0 0 0 0 0
14
The fate of parent and feed metabolites M01, M02 and M05 in ruminants and poultry is considered as 15
covered by available studies with parent. 16
The following compounds in food of animal origin are relevant for risk assessment: 17
Ruminants: Parent, M06 (free and conjugated), M07 18
Poultry: Parent, M01, M02, M06 19
No final conclusion is possible unless information on the metabolic fate of feed metabolite M03 in 20
ruminants and poultry is available (data gap). 21
22

Establishment of the residue definition for dietary risk assessment
EFSA Journal 2016;14(issue):NNNN 108
Step 20: Residue definition for risk assessment 23 Plants 24
Due to the different metabolism of spiroxamine in cereals, grapes and rotational crops, the following 25
separate residue definitions are proposed (all expressed as spiroxamine). 26
Cereals: Parent, M03 (primary crops) 27
Parent, M03, M01, M02, M05 (free and conjugated); rotational crops only 28
Root crops: Parent; rotational crops only 29
Leafy crops: Parent, M01, M02, M05 (free and conjugated); rotational crops only 30
Fruit crops: Parent, M14, M28, M33 and M34 (conjugates of M13), M35 (open data 31
requirements) 32
33
The residue definition for fruit crops is provisional pending full toxicological assessment of 34
metabolites of group B and C (see step 18; data requirement). Separate risk assessments or the 35
application of RPFs might be indicated for the different metabolite groups. 36
Although the relevance of M03 in food for direct human consumption is low, it is proposed to include 37
M03 into the residue definition based on the toxicological properties of M03, the exposure potential 38
for livestock and human exposure via food of animal origin and uncertainties for isomers composition. 39
40
Animals 41
The following residue definition is proposed for ruminants, pigs and horses (provisional pending 42
addressing of the data gap in livestock animals): 43
Ruminants: Parent, M06 (free and conjugated), M07 44
Poultry: Parent, M01, M02, M06 45
46
Data gaps 47
Genotoxicity studies for M28 and M37 should be provided. The testing battery should as a 48
minimum include two in vitro tests, covering all three genetic endpoints, i.e. gene mutations, 49
structural and numerical chromosomal alterations. 50
Adequate toxicological references should be provided for M28 or other representative 51
substance for Group C (M28, M30 and M31), M13 (as a group representative metabolite for 52
M14, M33 and M34) and M37. The 28 day rat study is recommended as a first tier approach. 53
Hydrolysis study demonstrating cleavage of M35 and M36 under physiological conditions, 54
followed by a(Q)SAR/ Read across for the exclusion of genotoxicity and followed by the 55
general toxicological assessment or testing for the ester compounds.. 56
Ruminant and poultry metabolism of metabolite M03 in feed has to be addressed. 57
58
Uncertainties of particular relevance for decision making 59
The finalisation of the evaluation of the uncertainties is underdevelopment pending adoption of the 60
Scientific Committee guidance on uncertainty in scientific assessment. 61

Establishment of the residue definition for dietary risk assessment
EFSA Journal 2016;14(issue):NNNN 109
The quantitative relevance of all identified metabolites in food and feed as well as their toxicological 62
assessment is discussed in this case study under conditions considered as reasonable worst case by the 63
assessors. A detailed uncertainty assessment for particular elements of toxicity and exposure 64
calculation can be provided on request of risk managers. 65
The following describes those steps in the decision scheme where alternative, more conservative, 66
decisions could have been made and provides the justification for the approach taken. 67
For metabolites M13, M15 and M16 the prediction for genotoxicity is negative, but not 68
considered reliable because they were out of the applicability domain in one CA model and 69
the applicability domain was not defined in the second CA model. This was considered 70
unlikely to be of concern based on expert judgment on the absence of reactive chemical 71
groups in the structure. 72 73
Grouping of metabolites is based on criteria for similarity. However, these criteria are not 74
fully characterized. For genotoxicity endpoints, grouping on profiling and presence of 75
functional groups was considered suitable for the purpose of risk assessment. Grouping of 76
metabolites for section of representative substance for testing for general toxicity was based 77
on common moiety and similarity in the chemical reactivity and this was considered 78
appropriate for this purpose. However, uncertainties still exist as no testing against the 79
toxicological endpoint/s was performed (e.g. the difference between secondary and tertiary 80
amines or hydroxylation of a butyl-group can call for a different reactivity. In absence of 81
testing this is still considered an uncertainty). 82
Genotoxic alerts indicated by (Q)SAR for 12 metabolites are considered not relevant on the 83
basis of grouping and read-across. This bears a higher uncertainty compared to in vitro results 84
according to the proposed testing scheme. 85
Minor rat and plant metabolites were assessed for their genotoxicity potential through 86
(Q)SAR, grouping and read across. . However, minor plant metabolites were not assessed for 87
general toxicity endpoints based on the assumption that the parent is a low potency substance. 88
The uncertainty with regard to non-consideration of minor metabolites is therefore based on 89
the assumption that their toxicological burden will be limited and then refers only to the 90
exposure part. 91
The toxicological burden covered by the residue definition is slightly below the target of 92
75% of the total toxicological burden for cereals, some rotational crops and ruminant matrices. 93
This has only a marginal impact on the calculated dietary consumer risk 94
No data are provided to assess the impact of the possible preferential 95
metabolism/degradation of each enantiomer in animals, plants and the environment. As 96
spiroxamine has diastereoisomers the risk assessment should consider the highest intake, 97
assuming that all the toxic activities are due to a single isomer which is representing the 98
residue and a factor of two to the ADI and ARfD should be applied. 99
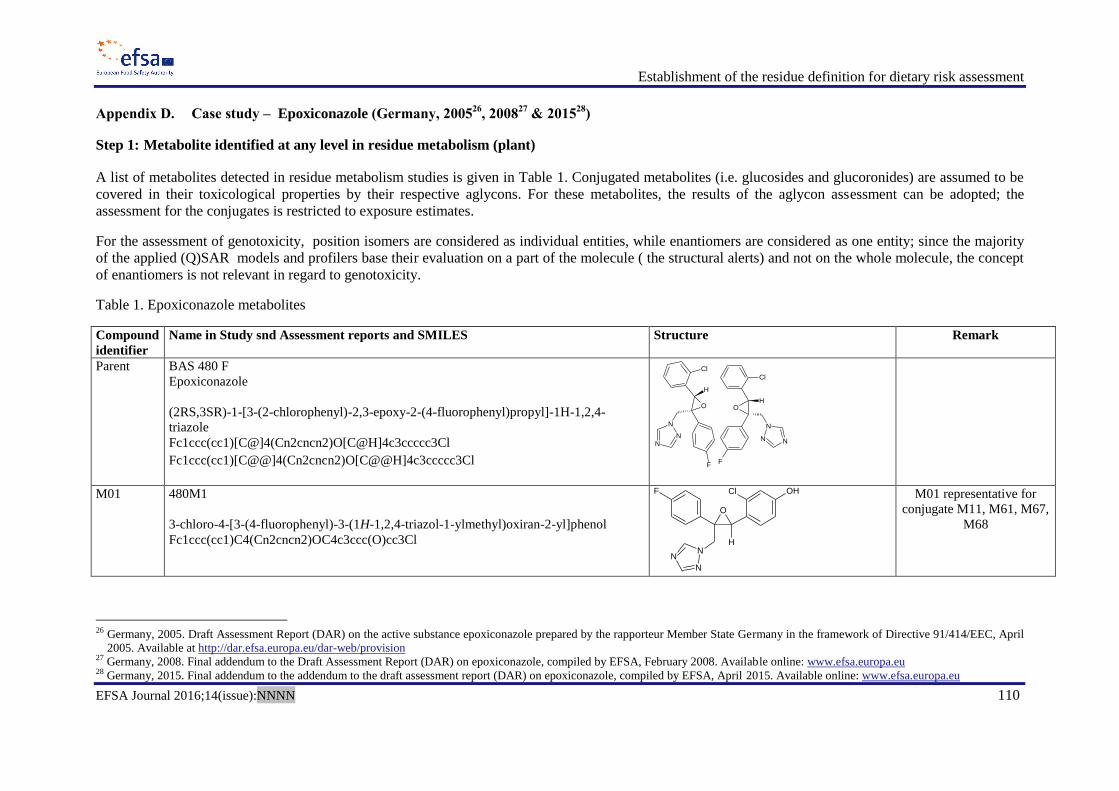
Establishment of the residue definition for dietary risk assessment
EFSA Journal 2016;14(issue):NNNN 110
Appendix D. Case study – Epoxiconazole (Germany, 200526
, 200827
& 201528
)
Step 1: Metabolite identified at any level in residue metabolism (plant)
A list of metabolites detected in residue metabolism studies is given in Table 1. Conjugated metabolites (i.e. glucosides and glucoronides) are assumed to be
covered in their toxicological properties by their respective aglycons. For these metabolites, the results of the aglycon assessment can be adopted; the
assessment for the conjugates is restricted to exposure estimates.
For the assessment of genotoxicity, position isomers are considered as individual entities, while enantiomers are considered as one entity; since the majority
of the applied (Q)SAR models and profilers base their evaluation on a part of the molecule ( the structural alerts) and not on the whole molecule, the concept
of enantiomers is not relevant in regard to genotoxicity.
Table 1. Epoxiconazole metabolites
Compound
identifier
Name in Study snd Assessment reports and SMILES Structure Remark
Parent BAS 480 F
Epoxiconazole
(2RS,3SR)-1-[3-(2-chlorophenyl)-2,3-epoxy-2-(4-fluorophenyl)propyl]-1H-1,2,4-
triazole
Fc1ccc(cc1)[C@]4(Cn2cncn2)O[C@H]4c3ccccc3Cl
Fc1ccc(cc1)[C@@]4(Cn2cncn2)O[C@@H]4c3ccccc3Cl
Cl
F
NN
N
OH
Cl
F
NN
N
O
H
M01 480M1
3-chloro-4-[3-(4-fluorophenyl)-3-(1H-1,2,4-triazol-1-ylmethyl)oxiran-2-yl]phenol
Fc1ccc(cc1)C4(Cn2cncn2)OC4c3ccc(O)cc3Cl
ClF
N
N
N
O
H
OH
M01 representative for
conjugate M11, M61, M67,
M68
26 Germany, 2005. Draft Assessment Report (DAR) on the active substance epoxiconazole prepared by the rapporteur Member State Germany in the framework of Directive 91/414/EEC, April
2005. Available at http://dar.efsa.europa.eu/dar-web/provision 27 Germany, 2008. Final addendum to the Draft Assessment Report (DAR) on epoxiconazole, compiled by EFSA, February 2008. Available online: www.efsa.europa.eu 28 Germany, 2015. Final addendum to the addendum to the draft assessment report (DAR) on epoxiconazole, compiled by EFSA, April 2015. Available online: www.efsa.europa.eu

Establishment of the residue definition for dietary risk assessment
EFSA Journal 2016;14(issue):NNNN 111
Compound
identifier
Name in Study snd Assessment reports and SMILES Structure Remark
M02 480M2
BF 480-2, II
(Chloro-hydroxy-metabolite)
4-chloro-3-[3-(4-fluorophenyl)-3-(1H-1,2,4-triazol-1-ylmethyl)oxiran-2-yl]phenol
Fc1ccc(cc1)C4(Cn2cncn2)OC4c3cc(O)ccc3Cl
ClF
N
N
N
O
H
OH
M02 representative for
conjugate M27, M32, M61,
M67, M68
M03 480M3
(XXXIV)
2-[3-(2-chlorophenyl)-2-(1H-1,2,4-triazol-1-ylmethyl)oxiran-2-yl]-5-fluorophenol
Fc1ccc(c(O)c1)C4(Cn2cncn2)OC4c3ccccc3Cl
5-[3-(2-chlorophenyl)-2-(1H-1,2,4-triazol-1-ylmethyl)oxiran-2-yl]-2-fluorophenol
Fc1ccc(cc1O)C4(Cn2cncn2)OC4c3ccccc3Cl
ClF
N
N
O
H
N
OH
ClF
N
N
O
H
N
OH
Both isomers are used for
ananlysis
M03 representative for
conjugate M66
M04 480M4
BF 480-11
1-(2-chlorophenyl)-2-(4-fluorophenyl)-3-(1H-1,2,4-triazol-1-yl)propane-1,2-diol
OC(Cn1cncn1)(c2ccc(F)cc2)C(O)c3ccccc3Cl Cl
F
NN
OH
H
N
OH
M04 representative for
conjugate M28, M29
M05 480M5
1-(2-chloro-4-hydroxyphenyl)-2-(4-fluorophenyl)-3-(1H-1,2,4-triazol-1-yl)propane-1,2-
diol
OC(Cn1cncn1)(c2ccc(F)cc2)C(O)c3ccc(O)cc3Cl Cl
F
NN
OH
H
N
OHOH
Used for ananlysis
M05 representative for
conjugate M60

Establishment of the residue definition for dietary risk assessment
EFSA Journal 2016;14(issue):NNNN 112
Compound
identifier
Name in Study snd Assessment reports and SMILES Structure Remark
M06 480M6
1-(4-fluorophenyl)-2-(1H-1,2,4-triazol-1-yl)ethanone
O=C(Cn1cncn1)c2ccc(F)cc2
F
NN
N
O
M07 480M07
BAS 480-F-alcohol
1-(4-fluorophenyl)-2-(1H-1,2,4-triazol-1-yl)ethanol
OC(Cn1cncn1)c2ccc(F)cc2
F
NN
N
OH
M08 480M08
1-(4-fluorophenyl)-2-(1H-1,2,4-triazol-1-yl)ethane-1,1-diol
OC(O)(Cn1cncn1)c2ccc(F)cc2 F
N
NN
OH
OH
M09 480M09
1-(4-fluorophenyl)-2-(1H-1,2,4-triazol-1-yl)ethanethiol
SC(Cn1cncn1)c2ccc(F)cc2
F
NN
N
SH
M10 480M10
3-chloro-4-[3-(4-fluorophenyl)-3-(1H-1,2,4-triazol-1-ylmethyl)oxiran-2-yl]phenyl
hydrogen sulfate
O=S(=O)(O)Oc1ccc(c(Cl)c1)C4OC4(Cn2cncn2)c3ccc(F)cc3
ClF
N
NN
O
H
OS
O
O
OH

Establishment of the residue definition for dietary risk assessment
EFSA Journal 2016;14(issue):NNNN 113
Compound
identifier
Name in Study snd Assessment reports and SMILES Structure Remark
M11 480M11
3-chloro-4-[3-(4-fluorophenyl)-3-(1H-1,2,4-triazol-1-ylmethyl)oxiran-2-yl]phenyl b-D-
glucopyranosiduronic acid
Fc1ccc(cc1)C5(Cn2cncn2)OC5c3ccc(cc3Cl)O[C@@H]4O[C@@H]([C@@H](O)[C@
H](O)[C@H]4O)C(=O)O
Cl
F
N
NN O
H
O
O
OH
OH
OH
O OH
Toxicological assessment
covered by M01
M12 480M12
1-(2-chlorophenyl)-2-(4-fluorophenyl)-1-(methylthio)-3-(1H-1,2,4-triazol-1-yl)propan-
2-ol
OC(Cn1cncn1)(c2ccc(F)cc2)C(SC)c3ccccc3Cl Cl F
N
N
N
OHH
S
CH3
M13 480M13
S-[1-(2-chloro-4-hydroxyphenyl)-2-(4-fluorophenyl)-2-hydroxy-3-(1H-1,2,4-triazol-1-
yl)propyl]cysteine
OC(Cn1cncn1)(c2ccc(F)cc2)C(SCC(N)C(=O)O)c3ccc(O)cc3Cl Cl
F
NN
N
OH
H
S
OH
NH2O
OH
M13 representative for
conjugate M25
M15 480M15
S-[1-(2-chloro-4-hydroxyphenyl)-2-(4-fluorophenyl)-2-hydroxy-3-(1H-1,2,4-triazol-1-
yl)propyl]cysteinyl-b-alanine
OC(Cn1cncn1)(c2ccc(F)cc2)C(SCC(N)C(=O)NCCC(=O)O)c3ccc(O)cc3Cl
Cl
F
N
N
NOH
H
S
OH
NH2O
NH
O
OH
M15 representative for
conjugate M25

Establishment of the residue definition for dietary risk assessment
EFSA Journal 2016;14(issue):NNNN 114
Compound
identifier
Name in Study snd Assessment reports and SMILES Structure Remark
M16 480M16
S-{3-chloro-4-[2-(4-fluorophenyl)-1,2-dihydroxy-3-(1H-1,2,4-triazol-1-
yl)propyl]phenyl}cysteine
OC(Cn1cncn1)(c2ccc(F)cc2)C(O)c3ccc(SCC(N)C(=O)O)cc3Cl
S
NH2
O
OH
Cl
F
N
N
N
OH
H
OH
M17 480M17
S-[1-(2-chlorophenyl)-2-(4-fluorophenyl)-2-hydroxy-3-(1H-1,2,4-triazol-1-
yl)propyl]cysteine
OC(Cn1cncn1)(c2ccc(F)cc2)C(SCC(N)C(=O)O)c3ccccc3Cl
S
NH2
O
OH
Cl
F
N
NN OH
H
M18 480M18
Thio-BF 480-11, V
1-(2-chlorophenyl)-2-(4-fluorophenyl)-1-mercapto-3-(1H-
1,2,4-triazol-1-yl)propan-2-ol
OC(Cn1cncn1)(C(S)c2ccccc2Cl)c3ccc(F)cc3
Cl
F
NN
N
OH
SH
M18 representative for
conjugate M30
M19 480M19
3-chloro-4-[2-(4-fluorophenyl)-2-hydroxy-1-(methylthio)-3-(1H-1,2,4-triazol-1-
yl)propyl]phenol
OC(Cn1cncn1)(c2ccc(F)cc2)C(SC)c3ccc(O)cc3Cl S
CH3
Cl
F
N
N
N
OH
H
OH
M19 representative for
conjugate M54

Establishment of the residue definition for dietary risk assessment
EFSA Journal 2016;14(issue):NNNN 115
Compound
identifier
Name in Study snd Assessment reports and SMILES Structure Remark
M20 480M20
N-acetyl-S-[1-(2-chloro-4-hydroxyphenyl)-2-(4-fluorophenyl)-2-hydroxy-3-(1H-1,2,4-
triazol-1-yl)propyl]cysteine
OC(Cn1cncn1)(c2ccc(F)cc2)C(SCC(NC(C)=O)C(=O)O)c3ccc(O)cc3Cl S
Cl
F
N
NN
OH
H
OHNH
O
CH3
OHO
M21 480M21
5-chloro-4-[3-(4-fluorophenyl)-3-(1H-1,2,4-triazol-1-ylmethyl)oxiran-2-yl]-2-
hydroxyphenyl b-D-glucopyranosiduronic acid
Fc1ccc(cc1)C5(Cn2cncn2)OC5c4cc(O)c(O[C@@H]3O[C@@H]([C@@H](O)[C@H](
O)[C@H]3O)C(=O)O)cc4Cl
Cl
F
N
NN O
H
O
O
OH
OH
OH
O OH
OH
Toxicological assessment
is done on
OH
N
N
N
FO Cl
OH
M22 480M22
5-chloro-4-[3-(4-fluorophenyl)-3-(1H-1,2,4-triazol-1-ylmethyl)oxiran-2-yl]-2-
hydroxyphenyl hydrogen sulfate
O=S(=O)(O)Oc1cc(Cl)c(cc1O)C4OC4(Cn2cncn2)c3ccc(F)cc3
ClF
N
NN
O
H
OS
O
O
OH
OH
M23 480M23
N-acetyl-S-{3-chloro-4-[2-(4-fluorophenyl)-2-hydroxy-3-(1H-1,2,4-triazol-1-
yl)propyl]phenyl}cysteine
OC(Cn1cncn1)(Cc2ccc(SCC(NC(C)=O)C(=O)O)cc2Cl)c3ccc(F)cc3
SNH
O
CH3
OH
O
Cl
F
N
N
N
OH
H
M25 480M25
Unknown conjugate of MW=57 with x-chloro-y-[2-(4-fluoro-phenyl)-2-hydroxy-1-
sulfanyl-3-(1H-1,2,4-triazol-1-yl)propyl] phenol
Structure to be covered by 480M13 /
480M15,
Uncertainty assessment
Toxicological assessment
covered by M13, M15
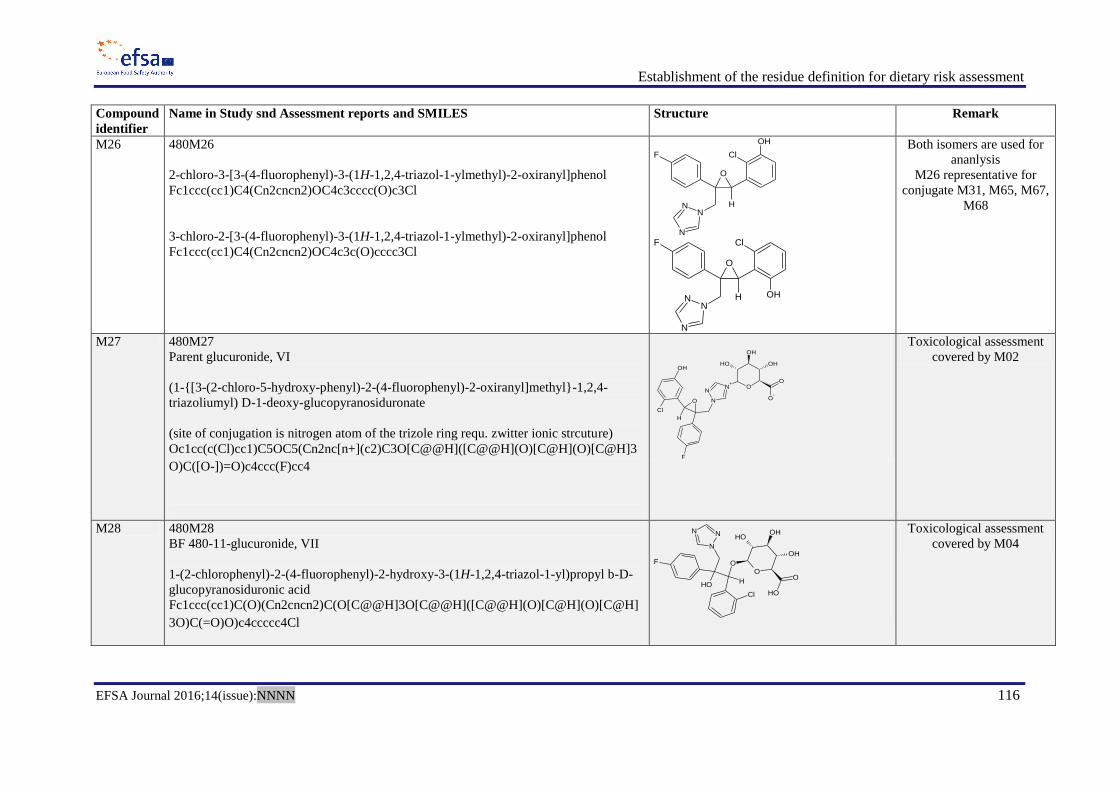
Establishment of the residue definition for dietary risk assessment
EFSA Journal 2016;14(issue):NNNN 116
Compound
identifier
Name in Study snd Assessment reports and SMILES Structure Remark
M26 480M26
2-chloro-3-[3-(4-fluorophenyl)-3-(1H-1,2,4-triazol-1-ylmethyl)-2-oxiranyl]phenol
Fc1ccc(cc1)C4(Cn2cncn2)OC4c3cccc(O)c3Cl
3-chloro-2-[3-(4-fluorophenyl)-3-(1H-1,2,4-triazol-1-ylmethyl)-2-oxiranyl]phenol
Fc1ccc(cc1)C4(Cn2cncn2)OC4c3c(O)cccc3Cl
ClF
N
NN
O
H
OH
ClF
N
NN
O
H OH
Both isomers are used for
ananlysis
M26 representative for
conjugate M31, M65, M67,
M68
M27 480M27
Parent glucuronide, VI
(1-{[3-(2-chloro-5-hydroxy-phenyl)-2-(4-fluorophenyl)-2-oxiranyl]methyl}-1,2,4-
triazoliumyl) D-1-deoxy-glucopyranosiduronate
(site of conjugation is nitrogen atom of the trizole ring requ. zwitter ionic strcuture)
Oc1cc(c(Cl)cc1)C5OC5(Cn2nc[n+](c2)C3O[C@@H]([C@@H](O)[C@H](O)[C@H]3
O)C([O-])=O)c4ccc(F)cc4
O
OH
OH OH
O
O-
Cl
F
N+
N
NO
H
OH
Toxicological assessment
covered by M02
M28 480M28
BF 480-11-glucuronide, VII
1-(2-chlorophenyl)-2-(4-fluorophenyl)-2-hydroxy-3-(1H-1,2,4-triazol-1-yl)propyl b-D-
glucopyranosiduronic acid
Fc1ccc(cc1)C(O)(Cn2cncn2)C(O[C@@H]3O[C@@H]([C@@H](O)[C@H](O)[C@H]
3O)C(=O)O)c4ccccc4Cl
OO
OHOH
OH
O
OHCl
F
N N
N
OHH
Toxicological assessment
covered by M04

Establishment of the residue definition for dietary risk assessment
EFSA Journal 2016;14(issue):NNNN 117
Compound
identifier
Name in Study snd Assessment reports and SMILES Structure Remark
M29 480M29
BF 480-11-conjugate
1-(2-chlorophenyl)-2-(4-fluorophenyl)-1-hydroxy-3-(1H-1,2,4-triazol-1-yl)propan-2-yl
b-D-glucopyranosiduronic acid
Clc1ccccc1C(O)C(Cn2cncn2)(O[C@@H]3O[C@@H]([C@@H](O)[C@H](O)[C@H]3
O)C(=O)O)c4ccc(F)cc4
OO
OHOH
OH
O
OH
Cl
F
NN
N
H
OH
Toxicological assessment
covered by M04
M30 480M30
Thio-BF 480-11-conjugate
1-(2-chlorophenyl)-2-(4-fluorophenyl)-1-mercapto-3-(1H-1,2,4-triazol-1-yl)propan-2-yl
b-D-glucopyranosiduronic acid
Clc1ccccc1C(S)C(Cn2cncn2)(O[C@@H]3O[C@@H]([C@@H](O)[C@H](O)[C@H]3
O)C(=O)O)c4ccc(F)cc4
1-(2-chlorophenyl)-2-(4-fluorophenyl)-2-hydroxy-3-(1H-1,2,4-triazol-1-yl)propyl 1-thio-
b-D-glucopyranosiduronic
acidFc1ccc(cc1)C(O)(Cn2cncn2)C(S[C@@H]3O[C@@H]([C@@H](O)[C@H](O)[C
@H]3O)C(=O)O)c4ccccc4Cl
OO
OHOH
OH
O
OH
Cl
F
NN
N
H
SH
Cl
F
N
NN
H
S
OOH
OH
OH
OOH
OH
Toxicological assessment
covered by M18

Establishment of the residue definition for dietary risk assessment
EFSA Journal 2016;14(issue):NNNN 118
Compound
identifier
Name in Study snd Assessment reports and SMILES Structure Remark
M31 480M31
Conjugate of III
2-chloro-3-[3-(4-fluorophenyl)-3-(1H-1,2,4-triazol-1-ylmethyl)oxiran-2-yl]phenyl b-D-
glucopyranosiduronic acid
Fc1ccc(cc1)C5(Cn2cncn2)OC5c4cccc(O[C@@H]3O[C@@H]([C@@H](O)[C@H](O)
[C@H]3O)C(=O)O)c4Cl
3-chloro-2-[3-(4-fluorophenyl)-3-(1H-1,2,4-triazol-1-ylmethyl)oxiran-2-yl]phenyl b-D-
glucopyranosiduronic acid
Fc1ccc(cc1)C5(Cn2cncn2)OC5c4c(O[C@@H]3O[C@@H]([C@@H](O)[C@H](O)[C
@H]3O)C(=O)O)cccc4Cl
Cl
F
N
N
N
O
H
O
O
OHOH
OH
O
OH
Cl
F
N
NN O
H
O O
OH
OH OH
O
OH
Toxicological assessment
covered by M26 (both
isomers)
M32 480M32
Conjugate of II
4-chloro-3-[3-(4-fluorophenyl)-3-(1H-1,2,4-triazol-1-ylmethyl)oxiran-2-yl]phenyl b-D-
glucopyranosiduronic acid
Fc1ccc(cc1)C5(Cn2cncn2)OC5c3cc(ccc3Cl)O[C@@H]4O[C@@H]([C@@H](O)[C@
H](O)[C@H]4O)C(=O)O
Cl
F
N
NN O
HO
O
OH
OH
OH
O OH
Toxicological assessment
covered by M02
M52 480M52
1,2,4-Triazole
BF 480-16 (87 085)(CGA 71019)(CGA 98032)
1H-1,2,4-triazole
c1nncn1
NH
N
N
M49 480M49
Triazolyl alanine
3-(1H-1,2,4-triazol-1-yl)alanine
NC(Cn1cncn1)C(=O)O
N
N
N
NH2
OH
O

Establishment of the residue definition for dietary risk assessment
EFSA Journal 2016;14(issue):NNNN 119
Compound
identifier
Name in Study snd Assessment reports and SMILES Structure Remark
M50 480M50
Triazolyl hydroxy propionic acid
2-hydroxy-3-(1H-1,2,4-triazol-1-yl)propanoic acid
OC(Cn1cncn1)C(=O)O
N
N
N
OH
OH
O
M51 480M51
BF 480-17
Triazolyl acetic acid
1H-1,2,4-triazol-1-ylacetic acid
O=C(O)Cn1cncn1
N N
N OH
O
M53 480M53 (and/or isomers)
1-(2-chlorophenyl)-2-(4-fluoro-2-hydroxyphenyl)-2-hydroxy-3-(1H-1,2,4-triazol-1-
yl)propyl b-D-glucopyranosiduronic acid
Fc1ccc(c(O)c1)C(O)(Cn2cncn2)C(O[C@@H]3O[C@@H]([C@@H](O)[C@H](O)[C@
H]3O)C(=O)O)c4ccccc4Cl
1-(2-chlorophenyl)-2-(4-fluoro-3-hydroxyphenyl)-2-hydroxy-3-(1H-1,2,4-triazol-1-
yl)propyl b-D-glucopyranosiduronic acid
Fc1ccc(cc1O)C(O)(Cn2cncn2)C(O[C@@H]3O[C@@H]([C@@H](O)[C@H](O)[C@H
]3O)C(=O)O)c4ccccc4Cl
Cl
F
N N
N
H
O O
OH
OHOH
O
OHOH
OH
Cl
F
N N
N
H
O O
OH
OHOH
O
OHOH
OH
Toxicological assessment
is done on
OH
ClOH
N
N
N
F
OH
OH
ClOH
N
N
N
F
OH

Establishment of the residue definition for dietary risk assessment
EFSA Journal 2016;14(issue):NNNN 120
Compound
identifier
Name in Study snd Assessment reports and SMILES Structure Remark
M54 480M54 (and/or isomers)
Exact position of OH not known, unresolved mixture (?)
To be covered by 480M19, 480M53, and uncertainty to be discussed Cl
F
NN
N
OH S CH3
OH
Toxicological assessment
covered by M19
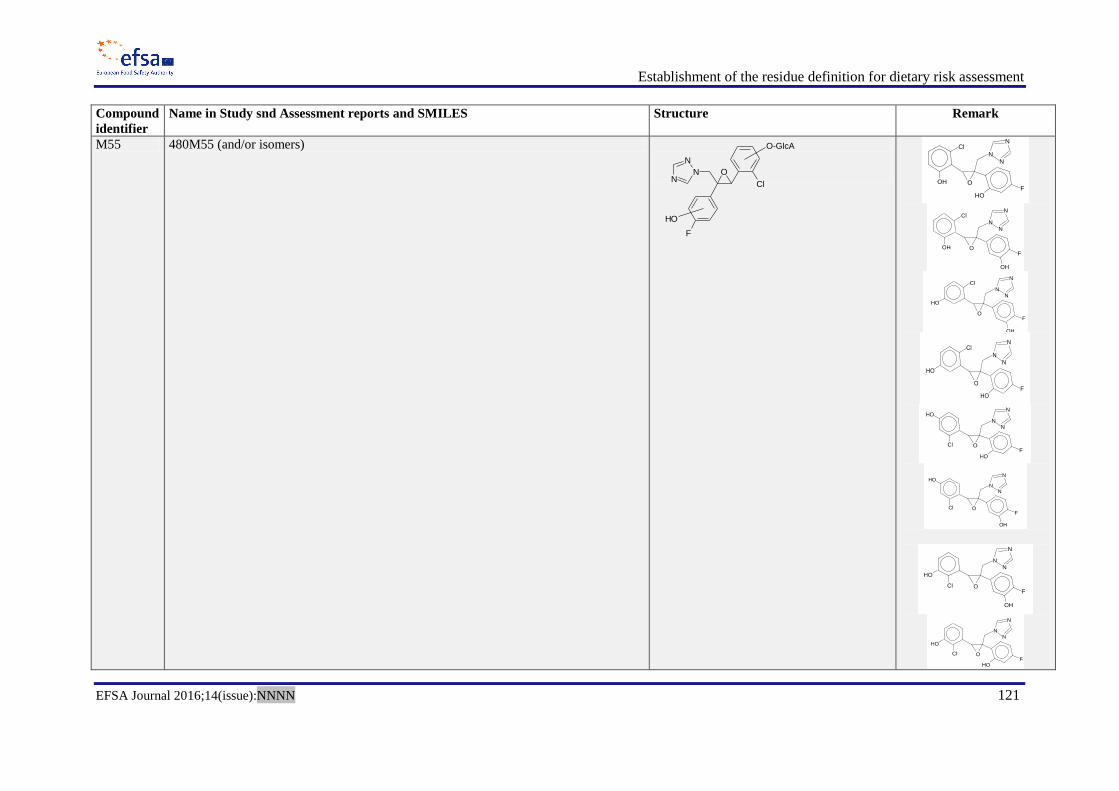
Establishment of the residue definition for dietary risk assessment
EFSA Journal 2016;14(issue):NNNN 121
Compound
identifier
Name in Study snd Assessment reports and SMILES Structure Remark
M55 480M55 (and/or isomers)
OH
Cl
N
N
N
FHO
O
OH
Cl
N
N
N
F
OH
O
HO
ClN
N
N
F
OH
O
HO
ClN
N
N
FHO
O
HO
N
N
N
FHO
OCl
HON
N
N
F
OH
OCl
HO
N
N
N
F
OH
OCl
HO
N
N
N
FHO
OCl
Cl
F
NN
N
O
O-GlcA
OH

Establishment of the residue definition for dietary risk assessment
EFSA Journal 2016;14(issue):NNNN 122
Compound
identifier
Name in Study snd Assessment reports and SMILES Structure Remark
M56 480M56
(and/or isomers)
Exact position of OH not known, assumed to be at 5- position, and uncertainty to be
discussed
{[1-(2-chloro-5-hydroxyphenyl)-2-(4-fluorophenyl)-2-hydroxy-3-(1H-1,2,4-triazol-1-
yl)propyl]sulfanyl}acetic acid
OC(Cn1cncn1)(c2ccc(F)cc2)C(SCC(=O)O)c3cc(O)ccc3Cl
Cl
F
NN
N
OH
H
S
OH
O OH
M60 480M60
(and/or isomers)
Exact position of OH not known (mixture?), structure coverd by ? Cl
NN
N
OHO-GlcA
F
OH
Toxicological assessment
covered by M5
M61 480M61
Exact position of OH not known (mixture?), covered by either480M1,480M2, or
480M26
Toxicological assessment
covered by M1, M2, M26
Cl
F
NN
N
OH S
O
OH
OH

Establishment of the residue definition for dietary risk assessment
EFSA Journal 2016;14(issue):NNNN 123
Compound
identifier
Name in Study snd Assessment reports and SMILES Structure Remark
M62 480M62
1-{[3-(2-chlorophenyl)-2-(4-fluorophenyl)-2-oxiranyl]methyl}-1H-1,2,4-triazol-3-yl
acetate
CC(=O)Oc1ncn(n1)CC3(OC3c2ccccc2Cl)c4ccc(F)cc4
1-{[3-(2-chlorophenyl)-2-(4-fluorophenyl)-2-oxiranyl]methyl}-1H-1,2,4-triazol-5-yl
acetate
CC(=O)Oc4ncnn4CC2(OC2c1ccccc1Cl)c3ccc(F)cc3
Cl
F
N
N
N
O
HO
O
CH3
OO
CH3
Cl
F
N
N
N
O
H
M63 480M63
(1Z)-1-(2-chlorophenyl)-2-(4-fluorophenyl)-3-(1H-1,2,4-triazol-1-yl)-1-propen-1-yl b-D-
glucopyranosiduronic acid
Fc1ccc(cc1)C(/Cn2cncn2)=C(/O[C@@H]3O[C@@H]([C@@H](O)[C@H](O)[C@H]3
O)C(=O)O)c4ccccc4Cl Cl
F
N
N N
O
OOH
OH
OH
OOH
Toxicological assessment
is done on
F
NN
N
Cl
M65 480M65
Identical to 480M31 first structure
Toxicological assessment
covered by M26 (the first
structure)

Establishment of the residue definition for dietary risk assessment
EFSA Journal 2016;14(issue):NNNN 124
Compound
identifier
Name in Study snd Assessment reports and SMILES Structure Remark
M66 480M66
2-[3-(2-chlorophenyl)-2-(1H-1,2,4-triazol-1-ylmethyl)-2-oxiranyl]-5-fluorophenyl b-D-
glucopyranosiduronic acid
Clc1ccccc1C5OC5(Cn2cncn2)c4ccc(F)cc4O[C@@H]3O[C@@H]([C@@H](O)[C@H]
(O)[C@H]3O)C(=O)O
5-[3-(2-chlorophenyl)-2-(1H-1,2,4-triazol-1-ylmethyl)-2-oxiranyl]-2-fluorophenyl b-D-
glucopyranosiduronic acid
Clc1ccccc1C5OC5(Cn2cncn2)c4cc(O[C@@H]3O[C@@H]([C@@H](O)[C@H](O)[C
@H]3O)C(=O)O)c(F)cc4
O
O OH
OH
OHO
OH
Cl
F
N
N
N
O
H
Cl
F
N
NN
O
H O
O
OH
OH
OH
O OH
Toxicological assessment
covered by M3
M67 480M67
Covered by 480M31 480M32
Toxicological assessment
covered by M1, M2,
M26_2
M68 480M68
Exact position of OH not known (mixture?), covered by either480M1,480M2, or
480M26
Toxicological assessment
covered by M1, M2,
M26_2
Step 2: Exclusion of metabolites of no concern
None.

Establishment of the residue definition for dietary risk assessment
EFSA Journal 2016;14(issue):NNNN 125
Step 3: Metabolite is known to be genotoxic
No specific information on genotoxicity of metabolites is available.
Step 4/Step 5: Metabolite is covered by rat metabolism
No major rat metabolites (>10% of AD in rat urine from the ADME study) were identified.
Proceed with the genotoxicity assessment (steps 5 to 9) for all metabolites.
Step 5: (Q)SAR prediction of Ames genotoxicity
Step 5.1: Description of (Q)SAR strategy
In order to predict the genotoxic potential (gene mutation and chromosomal aberrations) of the minor rat and plant specific metabolites, four models have
been applied: OASIS AMES Mutagenicity and Chromosomal Aberration models (v08.08) implemented in the TIMES software (v2.27.13) and DEREK
Nexus Mutagenicity and Chromosome Damage Models v 4.0.6. Lhasa Ltd, Leeds.
Independently of the predictions from (Q)SAR models, the metabolite(s) will be subject of read across analysis (step 6).
Step 5.2: Documentation of OASIS Ames Mutagenicity model (TIMES software)
11. Used model (title, name of authors, reference)
OASIS AMES mutagenicity model v08.08, Laboratory of mathematical chemistry, Burgas University
R. Serafimova, M. Todorov, T. Pavlov, S. Kotov, E. Jacob,A. Aptula, O. Mekenyan, Identification of the structural requirements for mutagencitiy by
incorporating molecular flexibility and metabolic activation of chemicals. II. General Ames mutagenicity model. Chem. Res. Toxicol, 20, (2007), pp.
662−676.
12. Information about modelled endpoint (endpoint, experimental protocol)
Ames Mutagenicity essay.
Establishment of the residue definition for dietary risk assessment
EFSA Journal 2016;14(issue):NNNN 126
13. Used training set (number of the substances, information about the chemical diversity of the training set chemicals)
The training set consists of 3489 chemicals (NTP database) separated in three groups: 641 mutagenic chemicals as parents, 418 chemicals mutagenic after S9
metabolic activation (non mutagens as parents), and 2430 non mutagenic chemicals. These three classes of chemicals were considered as biologically
dissimilar in the modeling process; i.e., chemicals being mutagenic as parents are distinguished from chemicals, which were metabolically activated
14. Information on the algorithm used for deriving the model and the molecular descriptors (name and type of the descriptors used, software used for
descriptor generation and descriptor selection)
The TIMES system combines in the same modeling platform metabolic activation of chemicals and their interaction with target macromolecules. The
reactivity Ames model (-S9) describing interactions of chemicals with DNA was based on an alerting group approach. Only those toxicophores having clear
interpretation for the molecular mechanism causing the ultimate effect were included in the model. The alerts were classified as direct acting and
metabolically activated. The mechanistic interrelation between alerts and related parametric ranges generalizing the effect of the rest of the molecules on the
alert is also considered. In the Ames model (+S9), the reactivity component was combined with a metabolic simulator, which was trained to reproduce
documented maps for mammalian (mainly rat) liver metabolism for 260 chemicals. Parent chemicals and each of the generated metabolites were submitted to
a battery of models to screen for a general effect and mutagenicity mechanisms. Thus, chemicals were predicted to be mutagenic as parents only, parents and
metabolites, and metabolites only.
15. Internal statistics (performance of the model to the training set chemicals)- goodness-of-fit, robustness and predictivity
For 3489 chemicals, the Ames model (-S9) was able to predict correctly 82% of the Ames positive and 91% of the Ames negative training set chemicals.
When metabolic activation is taken into account, the Ames model (+S9) predicts 76% of the Ames positive and 76% of the Ames negative training set
chemicals.
16. External statistic, if available
Not available
17. Information about the applicability domain (description of the applicability domain of the model and method used to assess the applicability domain)
The stepwise approach was used to define the applicability domain of the model. It consists of the following sub-domain levels:

Establishment of the residue definition for dietary risk assessment
EFSA Journal 2016;14(issue):NNNN 127
General parametric requirements - includes ranges of variation log KOW and MW,
Structural domain - based on atom-centered fragments (ACFs).
Interpolation space - estimates the population density of the parametric space defined by the explanatory variables of the QSAR models by making use
the training set chemicals.
Domain of simulator of metabolism - determines the reliability of the simulated metabolism.
A chemical is considered In Domain if its log KOW and MW are within the specified ranges and if its ACFs are presented in the training chemicals. The
information implemented in the applicability domain is extracted from the correctly predicted training chemicals used to build the model and in this respect
the applicability domain determines practically the interpolation space of the model.
S. Dimitrov, G. Dimitrova, T. Pavlov, N. Dimitrova, G. Patlevisz, J. Niemela and O. Mekenyan, J. Chem. Inf. Model. Vol. 45 (2005), pp. 839-849.
18. Mechanistic interpretation of the model
Each structural alert in the model is related with a suggested mechanism of action which is reported together with the prediction.
19. Description, experimental data and predictions of possible structural analogues of the substance (provided by the software or selected by the
applicant)
Not available
20. Any additional information provided by the model, e.g. suggested mechanism of action, uncertainties
The model provided suggested mechanism of action, examples of the substances documented to have the mechanism of action, generation of metabolites and
prediction for them, information for experimental observed metabolites (if available).

Establishment of the residue definition for dietary risk assessment
EFSA Journal 2016;14(issue):NNNN 128
Documentation of DEREK Nexus mutagenicity model
11. Used model (title, name of authors, reference)
DEREK Nexus Mutagenicity Model v 4.0.6.
Lhasa Ltd, Leeds, UK, http://www.lhasalimited.org/
Sanderson DM & Earnshaw CG (1991). Computer prediction of possible toxic action from chemical structure; The DEREK system. Human and Experimental
Toxicology 10, 261-273.
Judson PN, Marchant CA & Vessey JD (2003). Using argumentation for absolute reasoning about the potential toxicity of chemicals. Journal of Chemical
Information and Computer Sciences 43, 1364-1370.
Marchant CA, Briggs KA & Long A (2003). In silico tools for sharing data and knowledge on toxicity and metabolism: Derek for Windows, Meteor, and
Vitic. Toxicology Mechanisms and Methods 18, 177–187.
Judson PN, Stalford SA & Vessey J (2013). Assessing confidence in predictions made by knowledge-based systems. Toxicology Research 2, 70-79.
12. Information about modelled endpoint (endpoint, experimental protocol)
The Derek Nexus model for mutagenicity is developed from Ames test data in both S.typh and E.coli. Supporting data from in vivo lacZ-transgenic assay, in
vitro L5178Y TK+/- assay, in vitro HGPRT gene mutation assay, in vitro Na+/K+ ATPase gene mutation assay has also been considered for the development
of a small number of alerts. Additionally, alert writers consider both mechanistic evidence and chemical properties (such as reactivity).
13. Used training set (number of the substances, information about the chemical diversity of the training set chemicals)
The DEREK model for mutagenicity is a base of rules which codified the knowledge about the relation between a structural features and a toxicological (i.e.
mutagenic) effect. Although almost all alerts are related with mechanistic explanation and examples, these rules are not related with particular training set.
Establishment of the residue definition for dietary risk assessment
EFSA Journal 2016;14(issue):NNNN 129
Recently, a model for negative prediction (non-mutagenic) has been developed and added to the previous model. For its development a training set of above
10 000 substances has been used (the number of mutagenic and non-mutagenic substances is almost equal). The training set is a compilation of six public
available data sets (e.g. Kirkland, ISSSTY, NTP data sets).
14. Information on the algorithm used for deriving the model and the molecular descriptors (name and type of the descriptors used, software used for
descriptor generation and descriptor selection)
Derek Nexus is a rule-based expert system for the prediction of toxicity. Its knowledge base is composed of alerts, examples and reasoning rules which may
each contribute to the predictions made by the system. Each alert in Derek describes a chemical substructure believed to be responsible for inducing a specific
toxicological outcome (often referred to as a toxicophore). Alerts are derived by experts, using toxicological data and information regarding the biological
mechanism of action. Where relevant, metabolism data may be incorporated into an alert, enabling the prediction of compounds which are not directly toxic
but are metabolised to an active species. The derivation of each alert is described in the alert comments along with supporting references and example
compounds where possible. In addition, a likelihood is provided (e.g. certain, probable, plausible) which takes into account the presence of a structural alert
and a limited number of molecular descriptors.
Derek Nexus contains new expert-derived functionality to provide negative predictions for bacterial in vitro mutagenicity. Non alerting compounds are
evaluated to identify unclassified and misclassified features (from a data set of >104 compounds).
• Misclassified features in the molecule are derived from non alerting mutagens in the Lhasa reference set.
• Features in the molecule that are not found in the Lhasa reference set are considered unclassified.
In compounds where all features in the molecule are found in accurately classified compounds from the reference set, a negative prediction is displayed.
Predictions for compounds with misclassified or unclassified features remain negative, and these features are highlighted to the user to enable expert
assessment of the prediction. Internal statistics (performance of the model to the training set chemicals)- goodness-of-fit, robustness and predictivity
Derek is a knowledge-based expert system containing mechanistically-based rules which are built using all the underlying evidence available to the SAR
developer. Therefore, there is no defined training or test set, and therefore there are no internal validation statistics to report.
15. External statistic, if available

Establishment of the residue definition for dietary risk assessment
EFSA Journal 2016;14(issue):NNNN 130
Not public available for positive predictions.
Performance against three external, proprietary data sets highlights that negative predictivity for all outcomes is good (generally > 80%) with the presence of
unclassified or misclassified features slightly reducing accuracy.
16. Information about the applicability domain (description of the applicability domain of the model and method used to assess the applicability domain)
The scope of the structure-activity relationships describing the mutagenicity endpoint is defined by the developer to be the applicability domain for the model.
Therefore, if a chemical matches an alert describing a structure-activity for mutagenicity it can be considered to be within the applicability domain. The
applicability domain of each alert is defined by the alert developer on the basis of the training set data and expert judgement on the chemical and biological
factors which affect the mechanism of action for each alert.
If a compound does not activate an alert or reasoning rule then Derek makes a negative prediction. The applicability of the negative prediction to the query
compounds can be determined by an expert, if required, by investigating the presence (or absence) of misclassified and/or unclassified features.
17. Mechanistic interpretation of the model
All alerts describing structure-activity relationships for the mutagenicity endpoint have a mechanistic basis wherever possible. Mechanistic information is
detailed in the comments associated with an alert and can include information on both the mechanism of action and biological target. The mechanistic basis of
the model was developed a priori by examining the active and inactive structures before developing the structure-activity relationship. All references
supporting the mechanistic basis of an alert are detailed and available for inspection within the software.
18. Description, experimental data and predictions of possible structural analogues of the substance (provided by the software or selected by the
applicant)
The derivation of each alert is described in the alert comments along with supporting references and example compounds where possible.
19. Any additional information provided by the model, e.g. suggested mechanism of action, uncertainties
Described above.

Establishment of the residue definition for dietary risk assessment
EFSA Journal 2016;14(issue):NNNN 131
The model is published in the QMRF JRC Database: http://qsardb.jrc.it/qmrf/.
Documentation of OASIS in vitro chromosomal aberration model (TIMES software)
11. Used model (title, name of authors, reference)
OASIS in vitro chromosomal aberration model v08.08, Laboratory of mathematical chemistry, Burgas University
O. Mekenyan, M. Todorov, R. Serafimova, S. Stoeva, A. Aptula, R. Finking, E. Jacob, Identifying the structural requirements for chromosomal aberration by
incorporating molecular flexibility and metabolic activation of chemicals. Chem. Res. Toxicol. Vol. 20, (2007), pp. 1927−1941.
12. Information about modelled endpoint (endpoint, experimental protocol)
In vitro structural chromosomal aberrations
13. Used training set (number of the substances, information about the chemical diversity of the training set chemicals)
The training set consists of 506 chemicals separated in three groups: 243 mutagenic chemicals as parents, 77 chemicals mutagenic after S9 metabolic
activation (non mutagens as parents), and 186 non mutagenic chemicals
Sofuni, T., Ed. (1998). Data Book of Chromosomal Aberration Test in vitro, Revised Edition. Life-Science Information Center, Tokyo, Japan.
14. Information on the algorithm used for deriving the model and the molecular descriptors (name and type of the descriptors used, software used for
descriptor generation and descriptor selection)
Modeling the potential of chemicals to induce chromosomal damage has been hampered by the diversity of mechanisms which condition this biological
effect. The direct binding of a chemical to DNA is one of the underlying mechanisms that is also responsible for bacterial mutagenicity. Disturbance of DNA
synthesis due to inhibition of topoisomerases and interaction of chemicals with nuclear proteins associated with DNA (e.g., histone proteins) were identified
as additional mechanisms leading to CA. Reactivity component of the CA model (-S9) describing interactions of chemicals with DNA and/or proteins was
based on an alerting group approach. Only those toxicophores having clear interpretation for the molecular mechanism causing the ultimate effect were
included in the model. Some of the specified alerts interact directly with DNA or nuclear proteins, whereas others are applied in a combination of two-
dimensional QSAR models assessing the degree of activation of the alerts from the rest of the molecules. In the CA model (+S9), the reactivity component
was combined with a metabolic simulator, which was trained to reproduce documented maps for mammalian (mainly rat) liver metabolism for 260 chemicals.
Establishment of the residue definition for dietary risk assessment
EFSA Journal 2016;14(issue):NNNN 132
Parent chemicals and each of the generated metabolites were submitted to a battery of models to screen for a general effect and mutagenicity mechanisms.
Thus, chemicals were predicted to be mutagenic as parents only, parents and metabolites, and metabolites only.
15. Internal statistics (performance of the model to the training set chemicals)- goodness-of-fit, robustness and predictivity
For 506 chemicals, the CA model (-S9) was able to predict correctly 79% of the CA positive and 87% of the CA negative training set chemicals. When
metabolic activation is taken into account, the CA model (+S9) predicts 81% of the CA positive and 75% of the CA negative training set chemicals.
16. External statistic, if available
Not available
17. Information about the applicability domain (description of the applicability domain of the model and method used to assess the applicability domain)
The stepwise approach was used to define the applicability domain of the model. It consists of the following sub-domain levels:
General parametric requirements - includes ranges of variation log KOW and MW,
Structural domain - based on atom-centered fragments (ACFs).
Interpolation space - estimates the population density of the parametric space defined by the explanatory variables of the QSAR models by making use
the training set chemicals.
Domain of simulator of metabolism - determines the reliability of the simulated metabolism.
A chemical is considered In Domain if its log KOW and MW are within the specified ranges and if its ACFs are presented in the training chemicals. The
information implemented in the applicability domain is extracted from the correctly predicted training chemicals used to build the model and in this respect
the applicability domain determines practically the interpolation space of the model.
S. Dimitrov, G. Dimitrova, T. Pavlov, N. Dimitrova, G. Patlevisz, J. Niemela and O. Mekenyan, J. Chem. Inf. Model. Vol. 45 (2005), pp. 839-849.
18. Mechanistic interpretation of the model

Establishment of the residue definition for dietary risk assessment
EFSA Journal 2016;14(issue):NNNN 133
Each structural alert in the model is related with a suggested mechanism of action which is reported together with the prediction.
19. Description, experimental data and predictions of possible structural analogues of the substance (provided by the software or selected by the
applicant)
Not available
20. Any additional information provided by the model, e.g. suggested mechanism of action, uncertainties
The model provided suggested mechanism of action, examples of the substances documented to have the mechanism of action, generation of metabolites and
prediction for them, information for experimental observed metabolites (if available).
Documentation of DEREK Nexus Chromosome damage model
11. Used model (title, name of authors, reference)
DEREK Nexus Mutagenicity Model v 4.0.6.
Lhasa Ltd, Leeds, UK, http://www.lhasalimited.org/
Sanderson DM & Earnshaw CG (1991). Computer prediction of possible toxic action from chemical structure; The DEREK system. Human and Experimental
Toxicology 10, 261-273.
Judson PN, Marchant CA & Vessey JD (2003) Using argumentation for absolute reasoning about the potential toxicity of chemicals. Journal of Chemical
Information and Computer Sciences 43, 1364-1370.
Marchant CA, Briggs KA & Long A (2003). In silico tools for sharing data and knowledge on toxicity and metabolism: Derek for Windows, Meteor, and
Vitic. Toxicology Mechanisms and Methods 18, 177–187.
Judson PN, Stalford SA & Vessey J (2013). Assessing confidence in predictions made by knowledge-based systems. Toxicology Research 2, 70-79.
12. Information about modelled endpoint (endpoint, experimental protocol)
Establishment of the residue definition for dietary risk assessment
EFSA Journal 2016;14(issue):NNNN 134
The Derek Nexus model for chromosome damage is developed from several sources of data. Sources of primary data used for alert development include in
vitro and in vivo chromosome aberration test, in vitro and in vivo micronucleus test, in vitro L5178Y TK+/- assay. Alert writers consider both mechanistic
evidence and chemical properties (such as reactivity). Depending on evidence in vitro and/or in vivo prediction can be made.
13. Used training set (number of the substances, information about the chemical diversity of the training set chemicals)
The DEREK model for chromosome damage is a base of rules which codified the knowledge about the relation between a structural features and a
toxicological ( i.e. chromosome damage) effect. Although almost all alerts are related with mechanistic explanation and examples, these rules are not related
with particular training set.
14. Information on the algorithm used for deriving the model and the molecular descriptors (name and type of the descriptors used, software used for
descriptor generation and descriptor selection)
Derek Nexus is a rule-based expert system for the prediction of toxicity. Its knowledge base is composed of alerts, examples and reasoning rules which may
each contribute to the predictions made by the system. Each alert in Derek describes a chemical substructure believed to be responsible for inducing a specific
toxicological outcome (often referred to as a toxicophore). Alerts are derived by experts, using toxicological data and information regarding the biological
mechanism of action. Where relevant, metabolism data may be incorporated into an alert, enabling the prediction of compounds which are not directly
toxicity but are metabolised to an active species. The derivation of each alert is described in the alert comments along with supporting references and example
compounds where possible. In addition likelihood is provided (ie certain, probable, plausible, equivocal and nothing to report) which takes into account the
presence of a structural alert and a limited number of molecular descriptors.
15. Internal statistics (performance of the model to the training set chemicals)- goodness-of-fit, robustness and predictivity
Derek is a knowledge-based expert system containing mechanistically-based rules which are built using all the underlying evidence available to the SAR
developer. Therefore, there is no defined training or test set, and therefore there are no internal validation statistics to report.
16. External statistic, if available
Not public available.

Establishment of the residue definition for dietary risk assessment
EFSA Journal 2016;14(issue):NNNN 135
17. Information about the applicability domain (description of the applicability domain of the model and method used to assess the applicability domain)
The scope of the structure-activity relationships describing the chromosome damage endpoint is defined by the developer to be the applicability domain for
the model. Therefore, if a chemical matches an alert describing a structure-activity for mutagenicity it can be considered to be within the applicability domain.
The applicability domain of each alert is defined by the alert developer on the basis of the training set data and expert judgement on the chemical and
biological factors which affect the mechanism of action for each alert. If a compound does not activate an alert or reasoning rule in Derek, a result of ‘nothing
to report’ is presented to the user. This can be interpreted as a negative prediction or that the query compound is outside the domain of the model. Which of
these is more appropriate may depend on the endpoint of interest.
18. Mechanistic interpretation of the model
All alerts describing structure-activity relationships for the chromosome damage endpoint have a mechanistic basis wherever possible. Mechanistic
information is detailed in the comments associated with an alert and can include information on both the mechanism of action and biological target. The
mechanistic basis of the model was developed a priori by examining the active and inactive structures before developing the structure-activity relationship.
All references supporting the mechanistic basis of an alert are detailed and available for inspection within the software.
19. Description, experimental data and predictions of possible structural analogues of the substance (provided by the software or selected by the
applicant)
The derivation of each alert is described in the alert comments along with supporting references and example compounds where possible
20. Any additional information provided by the model, e.g. suggested mechanism of action, uncertainties
Described above
The model is published in the QMRF JRC Database: http://qsardb.jrc.it/qmrf/
Step 5.3: Description of results. Analysis of genotoxicity prediction and applicability domain
Table 3 Prediction of genotoxicity (gene mutation - OASIS and DEREK Nexus models and chromosomal aberrations - OASIS chromosomal aberration model
and DEREK Nexus in vitro human and mammalian chromosomal damage models) of rat and plant specific metabolites by (Q)SAR

Establishment of the residue definition for dietary risk assessment
EFSA Journal 2016;14(issue):NNNN 136
OASIS gene mutation model
(Applicability Domain)
DEREK
Ames model
DEREK
Chromosome damages model
OASIS Chromosomal aberration
model (Applicability Domain)
M01 Negative (Out) Negative Nothing to report Positive with MA* (Out)
M02 Negative (Out) Negative Nothing to report Positive with MA(Out)
M03_1 Negative (Out) Negative Nothing to report Positive with MA (Out)
M03_2 Negative (Out) Negative Nothing to report Positive with MA(Out)
M04 Negative (Out) Negative Nothing to report Positive with MA (Out)
M05 Negative (Out) Negative Nothing to report Positive with/without MA (Out)
M06 Negative (Out) Negative Nothing to report Negative with/without MA (Out)
M07 Negative (Out) Negative Nothing to report Positive with MA (Out)
M08 Negative (Out) Negative Nothing to report Negative with/without MA (Out)
M09 Negative (Out) Negative Nothing to report Positive with MA (Out)
M10 Negative (Out) Negative Nothing to report Positive with MA (Out)
M12 Negative (Out) Negative Nothing to report Positive with MA (Out)
M13 Negative (Out) Negative Nothing to report Positive with/without MA (Out)
M15 Negative (Out) Negative Nothing to report Positive with/without MA (Out)
M16 Negative (Out) Negative Nothing to report Positive with MA (Out)
M17 Negative (Out) Negative Nothing to report Positive with MA (Out)

Establishment of the residue definition for dietary risk assessment
EFSA Journal 2016;14(issue):NNNN 137
M18 Negative (Out) Negative Nothing to report Positive with MA (Out)
M19 Negative (Out) Negative Nothing to report Positive with/without MA (Out)
M20 Negative (Out) Negative Nothing to report Positive with/without MA (Out)
M21 Negative (Out) Negative Plausible Positive with MA(Out)
M22 Negative (Out) Negative Nothing to report Positive with MA (Out)
M23 Negative (Out) Negative Nothing to report Positive with MA(Out)
M26_1 Negative (Out) Negative Nothing to report Positive with MA (Out)
M26_2 Negative (Out) Negative Nothing to report Positive with MA(Out)
M49 Negative (Out) Negative Nothing to report Negative with/without MA (Out)
M50 Negative (Out) Negative Nothing to report Negative with/without MA (Out)
M51 Negative (Out) Negative Nothing to report Negative with/without MA (Out)
M52 Negative (Out) Negative Nothing to report Negative with/without MA (Out)
M53_1 Negative (Out) Negative Nothing to report Positive with MA (Out)
M53_2 Negative (Out) Negative Nothing to report Positive with MA (Out)
M55_1 Negative (Out) Negative Nothing to report Positive with MA (Out)
M55_2 Negative (Out) Negative Nothing to report Positive with MA (Out)
M55_3 Negative (Out) Negative Nothing to report Positive with MA(Out)
M55_4 Negative (Out) Negative Nothing to report Positive with MA (Out)
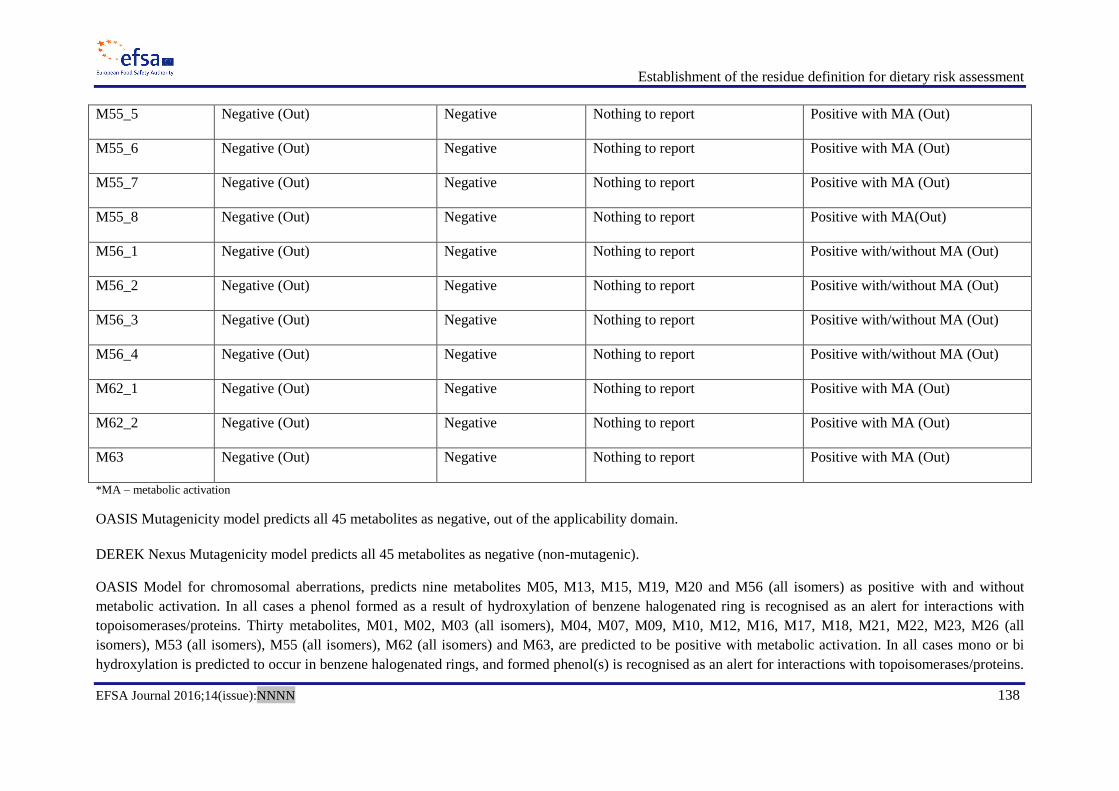
Establishment of the residue definition for dietary risk assessment
EFSA Journal 2016;14(issue):NNNN 138
M55_5 Negative (Out) Negative Nothing to report Positive with MA (Out)
M55_6 Negative (Out) Negative Nothing to report Positive with MA (Out)
M55_7 Negative (Out) Negative Nothing to report Positive with MA (Out)
M55_8 Negative (Out) Negative Nothing to report Positive with MA(Out)
M56_1 Negative (Out) Negative Nothing to report Positive with/without MA (Out)
M56_2 Negative (Out) Negative Nothing to report Positive with/without MA (Out)
M56_3 Negative (Out) Negative Nothing to report Positive with/without MA (Out)
M56_4 Negative (Out) Negative Nothing to report Positive with/without MA (Out)
M62_1 Negative (Out) Negative Nothing to report Positive with MA (Out)
M62_2 Negative (Out) Negative Nothing to report Positive with MA (Out)
M63 Negative (Out) Negative Nothing to report Positive with MA (Out)
*MA – metabolic activation
OASIS Mutagenicity model predicts all 45 metabolites as negative, out of the applicability domain.
DEREK Nexus Mutagenicity model predicts all 45 metabolites as negative (non-mutagenic).
OASIS Model for chromosomal aberrations, predicts nine metabolites M05, M13, M15, M19, M20 and M56 (all isomers) as positive with and without
metabolic activation. In all cases a phenol formed as a result of hydroxylation of benzene halogenated ring is recognised as an alert for interactions with
topoisomerases/proteins. Thirty metabolites, M01, M02, M03 (all isomers), M04, M07, M09, M10, M12, M16, M17, M18, M21, M22, M23, M26 (all
isomers), M53 (all isomers), M55 (all isomers), M62 (all isomers) and M63, are predicted to be positive with metabolic activation. In all cases mono or bi
hydroxylation is predicted to occur in benzene halogenated rings, and formed phenol(s) is recognised as an alert for interactions with topoisomerases/proteins.

Establishment of the residue definition for dietary risk assessment
EFSA Journal 2016;14(issue):NNNN 139
All predictions are out of the model applicability domain. Six metabolites are predicted as negative with and without metabolic activation M06, M08, M49,
M50, M51 and M52. They are out of the model applicability domain.
DEREK Nexus in vitro human and mammalian chromosomal damage models predict metabolite M21 as plausible to cause chromosomal damages due to a
catechol alert in the molecule. For all other metabolites the outputs are “nothing to report”.
Step 5.4: Conclusion on (Q)SAR
Metabolites M06, M08, M49, M50, M51 and M52 are predicted as negative from all models.
(Q)SAR assessment identified a potential of metabolite M21 to induce genotoxicity hazard. Both models for chromosomal damages predicted the
metabolite as positive.
Metabolites M04, M05, M06, M07, M08, M09, M12, M13, M15, M16, M17, M18, M19, M20, M23, M49, M50, M51, M52, M53 (all isomers),
M56 (all isomers) and M63 are predicted as negative from three model, though they are predicted as positive by the OASIS chromosomal
aberration model.
Step 6: Read across (OECD toolbox)29
Step 6.1:
Both endpoints, gene mutation and chromosomal aberrations, should be evaluated by read across for all metabolites.
Molecular initiating events of relevance for this assessment are interaction with DNA and/or proteins. The profilers included in the OECD Toolbox which
codified the structural alerts that are important for these two types of interactions are the mechanistic profilers - DNA binding by OASIS v.1.3, DNA binding
by OECD, Protein binding by OASIS v 1.3, Protein binding by OECD and endpoint specific profilers- DNA alerts for AMES, MN and CA by OASIS v1.3, In
vitro mutagenicity (AMES test) alerts by ISS, In vivo mutagenicity (Micronucleus) alerts by ISS, Protein binding alerts for Chromosomal aberrations by
OASIS v1.1.
The above mentioned profilers have been applied to all metabolites of interest and to the parent substance as a substance with known experimental genotoxic
activity.
29 http://www.oecd.org/chemicalsafety/risk-assessment/theoecdqsartoolbox.htm

Establishment of the residue definition for dietary risk assessment
EFSA Journal 2016;14(issue):NNNN 140
In order to evaluate the structural similarity, in addition to the structural alerts related to the evaluated endpoints, organic functional group profiler has been
applied. This additional step will provide information on the presence/absence of other functional groups different to the structural alerts and will give
indication for the potential influence of the remaining part of the molecule to the relevant structural alerts (i.e. electronic and structural influence).
No structural alerts were reported for the parent substance and for all the metabolites evaluated for the profilers DNA alerts for AMES, MN and CA following
the application of OASIS v1.3.
The alerts found for DNA binding following the profilers for DNA binding by OASIS v.1.3, DNA binding by OECD, Protein binding by OASIS v 1.3,
Protein binding by OECD and endpoint specific profilers, In vitro mutagenicity (AMES test) alerts by ISS, In vivo mutagenicity (Micronucleus) alerts by ISS,
Protein binding alerts for Chromosomal aberrations by OASIS v1.1 and organic functional group are presented in the Table 4.
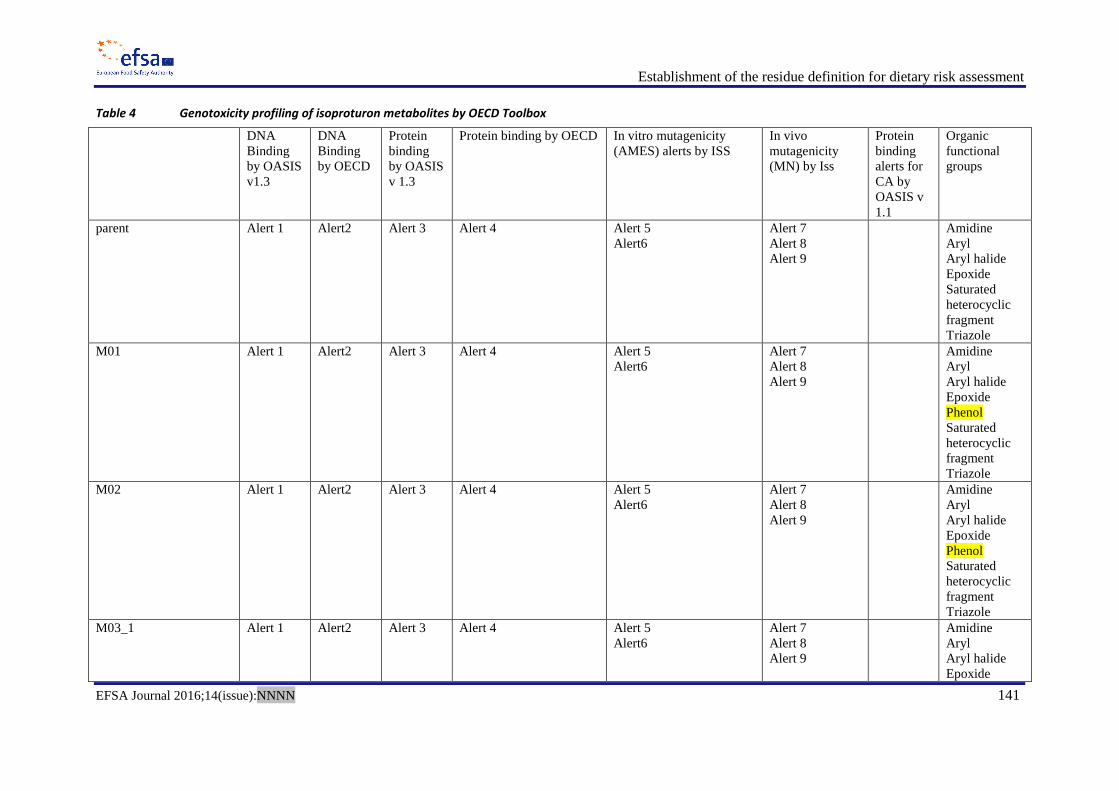
Establishment of the residue definition for dietary risk assessment
EFSA Journal 2016;14(issue):NNNN 141
Table 4 Genotoxicity profiling of isoproturon metabolites by OECD Toolbox
DNA
Binding
by OASIS
v1.3
DNA
Binding
by OECD
Protein
binding
by OASIS
v 1.3
Protein binding by OECD In vitro mutagenicity
(AMES) alerts by ISS
In vivo
mutagenicity
(MN) by Iss
Protein
binding
alerts for
CA by
OASIS v
1.1
Organic
functional
groups
parent Alert 1 Alert2 Alert 3 Alert 4 Alert 5
Alert6
Alert 7
Alert 8
Alert 9
Amidine
Aryl
Aryl halide
Epoxide
Saturated
heterocyclic
fragment
Triazole
M01 Alert 1 Alert2 Alert 3 Alert 4 Alert 5
Alert6
Alert 7
Alert 8
Alert 9
Amidine
Aryl
Aryl halide
Epoxide
Phenol
Saturated
heterocyclic
fragment
Triazole
M02 Alert 1 Alert2 Alert 3 Alert 4 Alert 5
Alert6
Alert 7
Alert 8
Alert 9
Amidine
Aryl
Aryl halide
Epoxide
Phenol
Saturated
heterocyclic
fragment
Triazole
M03_1 Alert 1 Alert2 Alert 3 Alert 4 Alert 5
Alert6
Alert 7
Alert 8
Alert 9
Amidine
Aryl
Aryl halide
Epoxide
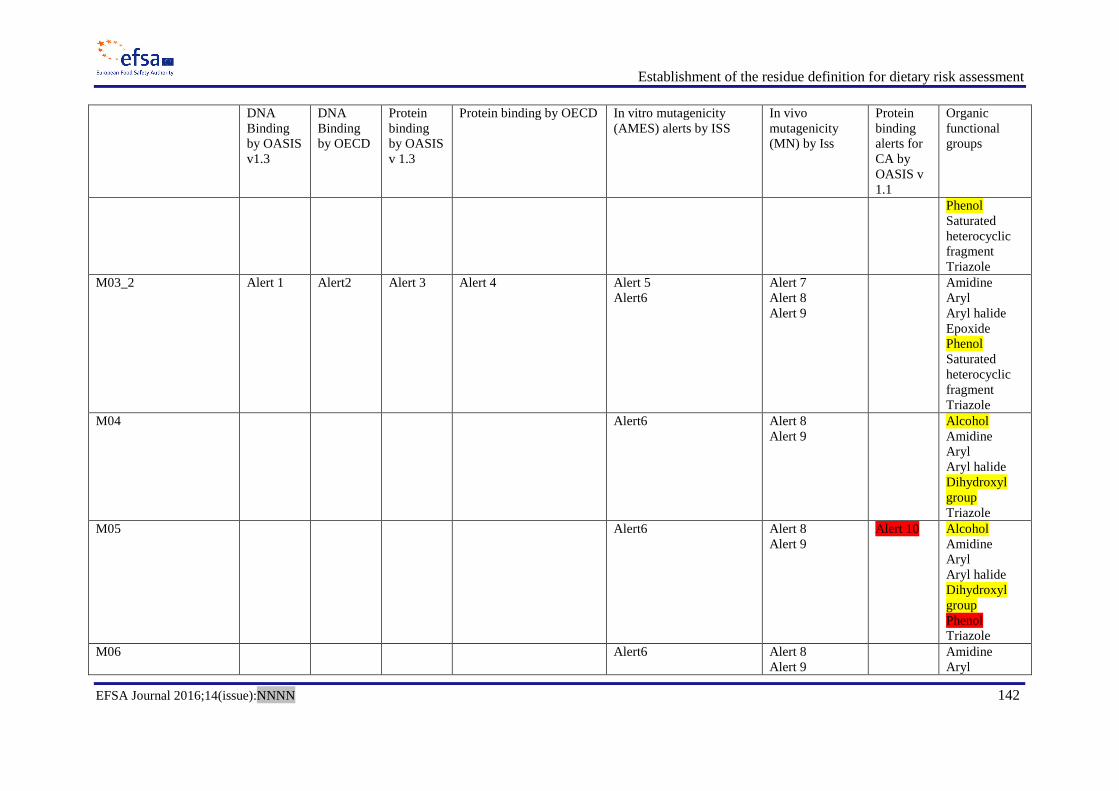
Establishment of the residue definition for dietary risk assessment
EFSA Journal 2016;14(issue):NNNN 142
DNA
Binding
by OASIS
v1.3
DNA
Binding
by OECD
Protein
binding
by OASIS
v 1.3
Protein binding by OECD In vitro mutagenicity
(AMES) alerts by ISS
In vivo
mutagenicity
(MN) by Iss
Protein
binding
alerts for
CA by
OASIS v
1.1
Organic
functional
groups
Phenol
Saturated
heterocyclic
fragment
Triazole
M03_2 Alert 1 Alert2 Alert 3 Alert 4 Alert 5
Alert6
Alert 7
Alert 8
Alert 9
Amidine
Aryl
Aryl halide
Epoxide
Phenol
Saturated
heterocyclic
fragment
Triazole
M04 Alert6 Alert 8
Alert 9
Alcohol
Amidine
Aryl
Aryl halide
Dihydroxyl
group
Triazole
M05 Alert6 Alert 8
Alert 9
Alert 10 Alcohol
Amidine
Aryl
Aryl halide
Dihydroxyl
group
Phenol
Triazole
M06 Alert6 Alert 8
Alert 9
Amidine
Aryl

Establishment of the residue definition for dietary risk assessment
EFSA Journal 2016;14(issue):NNNN 143
DNA
Binding
by OASIS
v1.3
DNA
Binding
by OECD
Protein
binding
by OASIS
v 1.3
Protein binding by OECD In vitro mutagenicity
(AMES) alerts by ISS
In vivo
mutagenicity
(MN) by Iss
Protein
binding
alerts for
CA by
OASIS v
1.1
Organic
functional
groups
Aryl halide
Ketone
Triazole
M07 Alert6 Alert 8
Alert 9
Alcohol
Amidine
Aryl
Aryl halide
Triazole
M08 Alert6 Alert 8
Alert 9
Alcohol
Amidine
Aryl
Aryl halide
Triazole
M09 Alert 11 Alert 12 Alert 13 Alert6 Alert 8
Alert 9
Amidine
Aryl
Aryl halide
Thioalcohol
Triazole
M10 Alert 1 Alert2 Alert 3 Alert 4 Alert 5
Alert6
Alert 7
Alert 8
Alert 9
Amidine
Aryl
Aryl halide
Epoxide
Saturated
heterocyclic
fragment
Sulfate
Triazole
M12 Alert6 Alert 8
Alert 9
Alcohol
Amidine
Aryl
Aryl halide

Establishment of the residue definition for dietary risk assessment
EFSA Journal 2016;14(issue):NNNN 144
DNA
Binding
by OASIS
v1.3
DNA
Binding
by OECD
Protein
binding
by OASIS
v 1.3
Protein binding by OECD In vitro mutagenicity
(AMES) alerts by ISS
In vivo
mutagenicity
(MN) by Iss
Protein
binding
alerts for
CA by
OASIS v
1.1
Organic
functional
groups
Sulfide
Triazole
M13 Alert6 Alert 8
Alert 9
Alert10 Alcohol
Aliphatic
Amine,
primary
Alpha amino
acid
Amidine
Aryl
Aryl halide
Carboxylic
acid
Phenol
Sulfide
Triazole
M15 Alert 14 Alert6 Alert 8
Alert 9
Alert10 Alcohol
Aliphatic
Amine,
primary
Amidine
Aryl
Aryl halide
Carboxamide
Carboxylic
acid
Phenol
Sulfide
Triazole
M16 Alert6 Alert 8
Alert 9
Alcohol
Aliphatic

Establishment of the residue definition for dietary risk assessment
EFSA Journal 2016;14(issue):NNNN 145
DNA
Binding
by OASIS
v1.3
DNA
Binding
by OECD
Protein
binding
by OASIS
v 1.3
Protein binding by OECD In vitro mutagenicity
(AMES) alerts by ISS
In vivo
mutagenicity
(MN) by Iss
Protein
binding
alerts for
CA by
OASIS v
1.1
Organic
functional
groups
Amine,
primary
Alpha amino
acid
Amidine
Aryl
Aryl halide
Carboxylic
acid
Dihydroxyl
group
Sulfide
Triazole
M17 Alert6 Alert 8
Alert 9
Alcohol
Aliphatic
Amine,
primary
Alpha amino
acid
Amidine
Aryl
Aryl halide
Carboxylic
acid
Sulfide
Triazole
M18 Alert 11 Alert 12 Alert 13 Alert6 Alert 8
Alert 9
Alcohol
Amidine
Aryl
Aryl halide
Thioalcohol

Establishment of the residue definition for dietary risk assessment
EFSA Journal 2016;14(issue):NNNN 146
DNA
Binding
by OASIS
v1.3
DNA
Binding
by OECD
Protein
binding
by OASIS
v 1.3
Protein binding by OECD In vitro mutagenicity
(AMES) alerts by ISS
In vivo
mutagenicity
(MN) by Iss
Protein
binding
alerts for
CA by
OASIS v
1.1
Organic
functional
groups
Triazole
M19 Alert6 Alert 8
Alert 9
Alert 10 Alcohol
Amidine
Aryl
Aryl halide
Phenol
Sulfide
Triazole
M20 Alert 14 Alert6 Alert 8
Alert 9
Alert 10 Alcohol
Amidine
Aryl
Aryl halide
Carboxamide
Carboxylic
acid
Phenol
Sarcosine
Sulfide
Triazole
M21 Alert 1 Alert2 Alert 3 Alert 4 Alert 5
Alert6
Alert 7
Alert 8
Alert 9
Amidine
Aryl
Aryl halide
Epoxide
Phenol
Saturated
heterocyclic
fragment
Triazole
M22 Alert 1 Alert2 Alert 3 Alert 4 Alert 5
Alert6
Alert 7
Alert 8
Alert 9
Amidine
Aryl
Aryl halide

Establishment of the residue definition for dietary risk assessment
EFSA Journal 2016;14(issue):NNNN 147
DNA
Binding
by OASIS
v1.3
DNA
Binding
by OECD
Protein
binding
by OASIS
v 1.3
Protein binding by OECD In vitro mutagenicity
(AMES) alerts by ISS
In vivo
mutagenicity
(MN) by Iss
Protein
binding
alerts for
CA by
OASIS v
1.1
Organic
functional
groups
Epoxide
Phenol
Saturated
heterocyclic
fragment
Sulfate
Triazole
M23 Alert 14 Alert6 Alert 8
Alert 9
Alcohol
Amidine
Aryl
Aryl halide
Carboxamide
Carboxylic
acid
Sarcosine
Sulfide
Triazole
M26_1 Alert 1 Alert2 Alert 3 Alert 4 Alert 5
Alert6
Alert 7
Alert 8
Alert 9
Amidine
Aryl
Aryl halide
Epoxide
Phenol
Saturated
heterocyclic
fragment
Triazole
M26_2 Alert 1 Alert2 Alert 3 Alert 4 Alert 5
Alert6
Alert 7
Alert 8
Alert 9
Amidine
Aryl
Aryl halide
Epoxide
Phenol

Establishment of the residue definition for dietary risk assessment
EFSA Journal 2016;14(issue):NNNN 148
DNA
Binding
by OASIS
v1.3
DNA
Binding
by OECD
Protein
binding
by OASIS
v 1.3
Protein binding by OECD In vitro mutagenicity
(AMES) alerts by ISS
In vivo
mutagenicity
(MN) by Iss
Protein
binding
alerts for
CA by
OASIS v
1.1
Organic
functional
groups
Saturated
heterocyclic
fragment
Triazole
M49 Alert6 Alert 8
Alert 9
Aliphatic
Amine,
primary
Alpha amino
acid
Amidine
Aryl
Carboxylic
acid
Triazole
M50 Alert6 Alert 8
Alert 9
Alcohol
Amidine
Aryl
Carboxylic
acid
Triazole
M51 Alert6 Alert 8
Alert 9
Amidine
Aryl
Carboxylic
acid
Triazole
M52 Alert6 Alert 8
Alert 9
Amidine
Aryl
Triazole
M53_1 Alert6 Alert 8
Alert 9
Alcohol
Amidine
Aryl

Establishment of the residue definition for dietary risk assessment
EFSA Journal 2016;14(issue):NNNN 149
DNA
Binding
by OASIS
v1.3
DNA
Binding
by OECD
Protein
binding
by OASIS
v 1.3
Protein binding by OECD In vitro mutagenicity
(AMES) alerts by ISS
In vivo
mutagenicity
(MN) by Iss
Protein
binding
alerts for
CA by
OASIS v
1.1
Organic
functional
groups
Aryl halide
Dihydroxyl
group
Phenol
Triazole
M53_2 Alert6 Alert 8
Alert 9
Alcohol
Amidine
Aryl
Aryl halide
Dihydroxyl
group
Phenol
Triazole
M55_1 to M55_8 Alert 1 Alert2 Alert 3 Alert 4 Alert 5
Alert6
Alert 7
Alert 8
Alert 9
Amidine
Aryl
Aryl halide
Epoxide
Phenol
Saturated
heterocyclic
fragment
Triazole
M56_1 to M56_4 Alert6 Alert 8
Alert 9 Alert 10 Alcohol
Amidine
Aryl
Aryl halide
Carboxylic
acid
Phenol
Sulfide
Triazole

Establishment of the residue definition for dietary risk assessment
EFSA Journal 2016;14(issue):NNNN 150
DNA
Binding
by OASIS
v1.3
DNA
Binding
by OECD
Protein
binding
by OASIS
v 1.3
Protein binding by OECD In vitro mutagenicity
(AMES) alerts by ISS
In vivo
mutagenicity
(MN) by Iss
Protein
binding
alerts for
CA by
OASIS v
1.1
Organic
functional
groups
M62_1 and M62_2 Alert 1
Alert 15
Alert2 Alert 3 Alert 4
Alert 16
Alert 5
Alert6
Alert 7
Alert 8
Alert 9
Acetoxy
Amidine
Aryl
Aryl halide
Carboxylic
acid ester
Epoxide
Saturated
heterocyclic
fragment
Triazole
M63 Alert6 Alert 8
Alert 9
Alkene
Allyl
Amidine
Aryl
Aryl halide
Triazole Alert 1: SN2 > Alkylation, direct acting epoxides and related > Epoxides and Aziridines
Alert 2:SN2 > Direct Acting Epoxides and related > Epoxides
Alert 3: SN2 > Ring opening SN2 reaction > Epoxides, Aziridines and Sulfuranes
Alert 4: SN2 > Epoxides and Related Chemicals > Epoxides
Alert 5: Epoxides and aziridines
Alert 6: Hydrazine
Alert 7: Epoxides and aziridines
Alert 8: H-acceptor-path3-H-acceptor
Alert 9: Hydrazine
Alert 10: AN2 > Michael-type addition to quinoid structures > Phenols
Alert 11: Radical > Generation of reactive oxygen species > Thiols
Alert 12: SN2 > Interchange reaction with sulphur containing compounds > Thiols and disulfide compounds
Alert 13: SN2 > SN2 reaction at a sulphur atom > Thiols
Alert 14: Acylation > Ester aminolysis > Amides
Alert 15: Specific Acetate Esters (different mechanisms e.g. Nucleophilic attack after cerbenium ion formation; Acylation)
Alert 16: Acylation > Direct Acylation Involving a Leaving group > Acetates
Establishment of the residue definition for dietary risk assessment
EFSA Journal 2016;14(issue):NNNN 151
Read across results:
All profilers (except DNA alerts for AMES, MN and CA following OASIS v1.3 analysis) recognized
in the parent molecule epoxide ring, as a potential alert for binding with DNA and/or proteins (alerts
1, 2, 3, 4, 5, and 7). The profilers developed by ISS for Ames mutagenicity and in vivo MN identified
additional two alerts - Hydrazine (alerts 6 and alert 8) and H-acceptor-path3-H-acceptor (alert 9).
The three alerts present in the parent substance are also present in metabolites M01, M02, M03, M10,
M21, M22, M26, M55 (all isomers). No new alerts were identified. One or more hydroxyl groups (in
metabolites M01, M02, M03, M21, M26 and M55) and a sulphate group (in metabolite M10 and
M22) are considered consequent to the metabolism of the halogenated rings. Metabolites M01, M02,
M03, M10, M22, M26, M55 (all isomers) could be considered very similar to the parent substance
and therefore of not genotoxicity concern. Although the read across analysis show that the metabolite
M21 is also very similar to the parent substance and the OECD Toolbox profilers didn’t identified any
new alert, both models for chromosomal damages (DEREK Nexus and OASIS) predicted the
metabolite as positive. Therefore the concern of genotoxicity cannot be excluded.
Metabolite M62 contains all alerts present in the parent substance but a new alert – Acetates is
identified by two profilers (DNA binding by OASIS and Protein binding by OECD). Therefore the
concern of genotoxicity cannot be excluded.
The alert linked to the epoxide ring disappeared for metabolites M04, M06, M07, M08, M12, M16,
M17, M49, M50, M51, M52, M53 and M63; the two additional alerts - Hydrazine and Hacceptor-
path3-Hacceptor, are present in all of them. No new alerts were identified. Differences in the
remaining part of the molecules, compared to the parent substance are related with opening of the
epoxide ring and formation of OH group in metabolites M04, M53 and M17. For the metabolite M53,
an additional OH group in the fluorinated aromatic ring is present while the metabolite M17 is a
cysteine conjugate of metabolite M04. Therefore, based on the read across analysis, metabolites M04
and M53 should be considered very similar to the parent substance and therefore of no genotoxicity
concern. If hydrolysis can be justified for metabolite M17, its toxicological assessment is covered by
metabolite M04 and therefore the genotoxicity concern for this metabolite could also be excluded.
For metabolite M12, after opening of the epoxide ring, a methylthiol group is formed, and for
metabolite M63 a double bond is present. Although these two new functional groups are not
recognized as structural alerts for genotoxicity, they could change the molecular reactivity and
consequently the biological behaviour of these two metabolites when compared to the parent
substance and therefore genotoxic concern for them could not be excluded.
For metabolites M06, M07 and M08, the epoxide ring and the halogenated aromatic ring are not
present and they should be considered structurally different from the parent substance, two of them
are predicted (by OASIS CA model) as potentially causing chromosomal aberrations (M07 and M09),
therefore their genotoxic potential cannot be excluded.
Metabolites M49, M50, M51 and M52, for which no new alerts were identified, belong to the triazole
class M52 containing alanine M49, propanoic M50 and ylacetic M51 acids groups; therefore they
cannot be considered structurally similar to the parents substance. They are predicted as negative by
all 4 models but the predictions are out of the model applicability model, therefore and their genotoxic
potential should be evaluated.

Establishment of the residue definition for dietary risk assessment
EFSA Journal 2016;14(issue):NNNN 152
A special case is the metabolite M16, a cysteine conjugate of metabolite M05 (see the analyses done
for the metabolite M05 below).
The OH group, present in the chlorinated aromatic ring, is recognized as an alert for interaction with
proteins (Protein binding alerts for CA by OASIS) in metabolites M05, M13, M15, M19, M20, M56
(all isomers). Metabolites M13, M15, M16, M19, M20 and M56 are all conjugates of metabolite M05.
They are hydrolysis products of metabolite M05 for which genotoxic potential cannot be excluded
since a new alert is present. It should be noted that for metabolites M15 and M20 a new alert – amides
was recognized by Protein binding by OASIS but this alert is a part of the cysteine molecule and
therefore it was not considered of genotoxicity concern.
Similarly, the new alert – amides (Protein binding by OASIS) was reported for metabolite M23. Also
in this case, the alert was linked to the cysteine molecule. If hydrolyses is demonstrated the metabolite
could be considered similar to metabolite M05, although has one OH group less.
For metabolites M09 and M18 a new alert – thiols, for DNA and protein binding (DNA binding by
OASIS, Protein binding by OASIS and Protein binding by OECD) was reported. Therefore their
genotoxic potential cannot be excluded. Considering the remaining part of the molecule the
metabolite M09 should be considered similar to metabolites M06, M07 and M08 and grouped
together. Metabolite M18 is similar to metabolite M12 and they could be grouped together.
Summary:
1. Metabolites M01, M02, M03, M10, M22, M26, M55 (all isomers) are very similar to the
parent substance and therefore considered of no genotoxicity concern.
2. Metabolites M04 and M53 should be also considered very similar to the parent substance and
therefore of no genotoxicity concern. If hydrolysis can be considered as a likely event for
metabolite M17 its toxicological assessment is covered by metabolite M04 and therefore the
genotoxicity concern for this metabolite could also be excluded.
3. Metabolite M21 the genotoxicity concern cannot be excluded therefore it should to be
subject of exposure assessment and comparison against TTC (step8) and/or testing (step 9).
4. Metabolite M62 the genotoxicity concern cannot be excluded therefore it should to be
subject of exposure assessment and comparison against TTC (step8) and/or testing (step 9).
5. Metabolite M63 the genotoxicity concern cannot be excluded therefore it should to be
subject of exposure assessment and comparison against TTC (step8) and/or testing (step 9).
6. Metabolites M12 and M18 the genotoxicity concern cannot be excluded therefore they
should to be subject of exposure assessment and comparison against TTC (step8) and/or
testing (step 9). Metabolite M18 could be potentially tested as a representative, since an alert
was identified for it.
7. Metabolites M06, M07, M08 and M09 the genotoxicity concern cannot be excluded
therefore they should to be subject of exposure assessment and comparison against TTC
(step8) and/or testing (step 9). Metabolite M06 (a ketone) and M09 (a thiol) could be tested as
group representatives.
8. Metabolites M49, M50, M51 and M52 the genotoxicity concern cannot be excluded therefore
they should to be subject of exposure assessment and comparison against TTC (step8) and/or
testing (step 9).
9. M05, M13, M15, M16, M19, M20, M23, M56 (all isomers) the genotoxicity concern cannot
be excluded therefore they should to be subject of exposure assessment and comparison

Establishment of the residue definition for dietary risk assessment
EFSA Journal 2016;14(issue):NNNN 153
against TTC (step 8) and/or testing (step 9). Metabolite M05 could be tested as representative
in case hydrolysis is considered as likely.
Step 7: Generation of input data and combined exposure assessment against TTCgenotoxicity
For following uses an exposure assessment was attempted.
Table 5 Uses considered for exposure estimates
Crop Application
Growth stage Number kg as/ha # PHI
Cereals
(wheat, rye, barley, oat, spelt,
triticale)
BBCH 25-69 2 0.125 35
Sugar beets BBCH 39-49 2 0.125 28
Banana Not specified Not specified 0.098 0
PHI pre-harvest interval
# per treatment
Step 7.1. Derivation of residue input data for metabolites
a) Residue levels in primary crop (cereal, sugar beet, banana) and in groundwater
Metabolite identification was attempted in the following commodities of crops treated post-
emergence with 14
C-epoxiconazole:
spring wheat plant parts, treated
o at growth stages BBCH 37 and 47-49 with 0.12 kg as/ha at a time (ca. 0.96 N rate) –
triazole label
o at growth stage BBCH 29 with 0.25 kg as/ha (1 N rate) – oxirane label
o at growth stage BBCH 38 and 69 with 0.125 kg as/ha at a time (1 N rate) for each label,
oxirane and triazole
sugar beet roots and tops, treated twice with 0.15 kg as/ha (1.2 N), growth stages not reported
protected and unprotected bunches of bananas, treated post-emergence with 4 x 0.15 kg as/ha,
growth stages not reported
coffee beans of plants treated post-emergence with 0.15 and 0.10 kg as/ha, growth stages at
treatment not reported
Residues in banana and coffee beans are relevant for consumers only. Residues in grain and
sugar beet root are relevant for consumer and livestock exposure; residues in straw and beat
tops are relevant for livestock exposure calculation; residues in forage are not deemed
relevant for livestock exposure (GAP is on cereals for grain production).
FOCUS groundwater level predictions are available for epoxiconazole and 1,2,4-triazole. The
PECgw values for both substances are far below the 0.1 µg/L level in all 9 FOCUS scenarios.
Information is not available for any other metabolite. (assessed for cereals and sugar beet
uses)
Where necessary for the assessment residue data from field trials (HR, STMR) as reported in
the DAR and addenda to the DAR were used.

Establishment of the residue definition for dietary risk assessment
EFSA Journal 2016;14(issue):NNNN 154
b) Residue levels in rotational crops
Rotational crop metabolism study was simulating realistic worst case situations in terms of
soil residue concentrations, considering the soil accumulation potential of epoxiconazole, and
sowing of rotational crops at 30 day plant-back interval (PBI), 120 day PBI and 356 day PBI.
Field trials are available but cannot be used for conversion. Parent residues were <LOQ. Soil
concentrations in the field trials upon a single use of epoxiconazole were significantly lower
than the predicted plateau concentration in soil. Thus, metabolism data could be used for
exposure estimates for metabolites, where suitable. Crop groups studied: Cereals (grain,
straw), root crops (radish root and leaf), and leafy crops (lettuce). Data on additional crop
groups (oilseed; fruiting vegetables) are not available. However, metabolite identification in
rotational crops was limited to cereals (triazole label) only.
30 day PBI (root/tuber and leafy crops): Upon regular harvest with the intended PHI,
ploughing and fallowing will precede replanting, that however may occur earlier than after
120 days. Therefore, residue data of the 30 day PBI should be considered when deriving
highest and median residues in rotational crops across the three plant back intervals.
Wheat:
Study 1
Oxirane label (1 N): 6 additional - not identified - components were found in the organic phases of the
straw samples (<0.001-0.007 mg/kg <0.1-0.4% TRR). The aqueous phase was composed of 31
distinct peaks (0.001-0.04 mg/kg, 0.1-2.2% TRR, not identified). In grains, greater parts of
radioactivity were associated with or incorporated into the starch fraction; no identification of
metabolites was performed.
Triazole label (0.96 N): 12 additional - not identified - components were found in the organic phases
of the straw samples (0.001-0.017 mg/kg, <0.1% TRR). The aqueous phase was composed of 20
distinct peaks, 18 of them unidentified (0.001-0.015 mg/kg, <0.1% TRR). In grains, greater parts of
radioactivity were associated with or incorporated into the starch fraction; no identification of
metabolites was performed.
Study 2
Generally, the identification and characterisation rate was high in all matrices accounting for around
90% of the radioactivity present. In grain (oxirane label), the identification and characterisation rates
were slightly lower, however the residue concentration was low (TRR 0.049 mg/kg) which resulted in
a higher uncertainty of the values measured. Due to high matrix load only some structures could be
elucidated: metabolites 480M61 and 480M63. Some unidentified peaks were present in the medium
polar region in amounts.
From the two cereal metabolism studies, the identity of additional cereal metabolites was proposed as
displayed in column 5 of Table 1; however concentrations were only determined for metabolites listed
in Table 6.

Establishment of the residue definition for dietary risk assessment
EFSA Journal 2016;14(issue):NNNN 155
Table 6 Wheat metabolism summary
Wheat, primary crop - Study 1
Wheat, primary crop - Study 2
Metabolism study 1 N (oxirane) Metabolism study 0.96 N (triazole) Metabolism study 1 N (oxirane) Metabolism study 1N (triazole) Metabolism study 1 N (oxirane) Metabolism study 1N (triazole)
Straw Straw Straw Straw Grain Grain
TRR CF HRc TRR CF HRc TRR CF HRc TRR CF HRc TRR CF
ST
MR
c
TRR CF
ST
MR
c
% mg /kg mg /kg % mg
/kg mg /kg %
mg
/kg
mg
/kg %
mg
/kg
mg
/kg %
mg
/kg
mg
/kg %
mg
/kg
mg
/kg
TRR 1.98 13.71 13.99 15.23 0.049 0.324
Parent 42.7 0.84 1 15.4 63.4 8.70 1 15.4 89.2 12.47 1 15.4 92.1 14.02 1 15.4 53.4 0.026 1 0.14 4.5 0.015 1 0.14
M02 1.2 0.02 0.024 0.367
M04 0.1 0.002 0.002 0.037
M06 0.4 0.061 0.007 0.108
M07 1.5 0.03 0.036 0.550
M26
(M61) 1.8 0.04 0.048 0.733
M61
conj. 1.1 0.157 0.018 0.278
M61/
M63
**
3.1 0.432 0.035 0.53 1.9 0.295 0.021 0.324 2.6 0.001 0.039 0.005
M49* 0.7 0.053 0.004 0.058 78.6 0.121 8.07 1.13
* Concentration [mg/kg] of M49 was calculated using the molecular mass of triazole alanine
** “Medium polar” with retention times between 40 and 62 minutes using HPLC method LCO1, containing metabolites M61/M63

Establishment of the residue definition for dietary risk assessment
EFSA Journal 2016;14(issue):NNNN 156
1
Sugar beet (1.2 N): 2
No identification of any compound in roots and leaves attempted except parent compound. 3
Sugar beet roots: Parent 0.032-0.034 mg/kg, corresponding to 57-64% TRR, up to 6 additional 4
compounds at 0.001– 0.003 mg/kg; 5
Sugar beet tops: Parent 4.09-6.0 mg/kg corresponding to 92-98% TRR, no metabolites determined. 6
7
Coffee (0.15 + 0.1 kg as/ha; N rate factor unknown): 8
Coffee beans: No identification of residues due to low absolute levels (TRR 0.008 – 0.009 mg/kg), 9
only presence of parent (0.001 mg/kg) could be confirmed. 10
Coffee leaves: Identified compounds are summarised in Table 7. 11
The data have limited relevance to support the metabolism in the pulses/oilseed crop category to 12
which coffee beans have been allocated. 13
Table 7 Coffee metabolism summary 14
Designation
Coffee leaves
0 DAT
Coffee leaves
57/62 DAT
Coffee leaves
77/82 DAT
mg/kg %TRR mg/kg %TRR mg/kg %TRR
Oxirane-2-14
C label
TRR 30.348 100 39.154 100 22.946 100
480M65/480M66 0.242 0.8 0.732 1.9 0.509 2.2
480M67 0.469 1.5 1.551 4.0 0.970 4.2
480M68 0.459 1.5 0.621 1.6 0.278 1.2
Parent 26.274 86.6 28.406 72.5 18.339 79.9
Triazole-3(5)-14
C label
TRR 28.921 100 36.497 100 26.795 100
480M65/480M66 - - 0.808 2.2 0.433 1.6
480M67 - - 0.608 1.7 1.110 4.1
480M68 - - - - - -
Parent 28.243 97.7 31.397 86.0 20.457 76.3
15
16
17
18
19
20

Establishment of the residue definition for dietary risk assessment
EFSA Journal 2016;14(issue):NNNN 157
21
Banana (4 x 0.15 kg as/ha; N rate factor unknown): 22
Table 8 Banana metabolism summary 23
Unprotected banana Protected banana
C Phenyl label F Phenyl label C Phenyl label F Phenyl label
% TRR mg/kg % TRR mg/kg % TRR mg/kg % TRR mg/kg
Parent 64.2 0.029 61.4 0.012 72.8 0.025 79.4 0.17
unknown 7.3 0.003
unknown 6.5 0.003 1.7 0.001 2.1 0.001
unknown 6.1 0.003 0.9 <0.001 1.0 <0.001
unknown 1.6 0.001 4.0 0.002
unknowns* (3)
1.1-1.8 <0.001
(5)
0.9-2.1 <0.001
* Number of metabolites in parentheses and range of concentration 24 25
Rotational crops: 26
Identification of residues was only made in cereals in the triazole label study, and results are 27
summarised in Table 9. 28
Table 9 Rotational crop metabolism 29
Grain Straw
% TRR mg/kg % TRR mg/kg
Parent epoxiconazole - - 39.4 0.458
M49 (Triazolyl alanine ) 54.1 0.612 - -
M50 Triazolyl hydroxy propionic acid - - 16.0 0.186
M51 Triazolyl acetic acid 25.8 0.292 10.1 0.118
Unknown - - 4.0 0.047
Unknown - - 2.4 0.028
Unknown - - 3.4 0.040
Unknown - - 3.4 0.040
Fraction containing M61 conj.1)
- - 3.3 0.038
Fraction containing M61 conj. 2)
- - 6.8 0.079
M61) - - 2.7 0.032
Isomer of M263) - - 1.5 0.018 1) Enzyme treatment afforded 53.6 % metabolite M61 30 2) Enzyme treatment afforded 71.1 % metabolite M61 31 3) Metabolite hydroxylated at the chloroaromatic ring at position 5. 32
33

Establishment of the residue definition for dietary risk assessment
EFSA Journal 2016;14(issue):NNNN 158
Step 7.2 Combined exposure calculation for those metabolites, for which genotoxic effects 34
cannot be excluded 35
According to the outcome of Module 1 (exclusion of genotoxicity), metabolites M05, M06, M07, 36
M08, M09, M12, M13, M15, M16, M18, M19, M20, M21, M23, M62, M63, should be further 37
addressed for their relevance in dietary exposure. 38
For metabolites M49, M50, M51, M52 (triazole derivative metabolites, “TDMs”) a genotoxicity 39
concern could not be ruled out after the screening in Module 1, however TDMs are common 40
metabolites to a number of active substances, and separate toxicological data are available. It is 41
therefore not appropriate to conduct a TTC assessment for these metabolites. 42
M62 was reported as identified in wheat but was concluded as an artefact of work-up with ethyl 43
acetate. 44
Further, metabolites M08, M09, M16, M19, M20, M21 and M23 were reported in the DAR as poultry 45
metabolites. From the original study report it appears that identification of the said metabolites was 46
based on hen excreta, and they were not identified in commodities relevant for consumers, though a 47
large number of peaks in the hen edible commodities remained unidentified. Therefore, their presence 48
in hen edible commodities cannot be ruled out in general, but they will have to be disregarded in the 49
consumer exposure estimates. 50
Metabolites, for which dietary exposure finally should be assessed to use the TTCgenotox: 51
M06 Poultry liver & eggs; Ruminant milk, liver, kidney, fat; Cereal straw
M07 Ruminant liver, Poultry liver, muscle, skin, fat & eggs; Cereal straw
M13 Ruminant milk, liver, kidney; Poultry liver & eggs
M5 Ruminant milk & liver
M56 Ruminant milk, liver & kidney
M18 Ruminant muscle & fat
M12 Poultry liver
M15 Poultry liver & eggs
M63 Cereal grain & straw 52
Step 7.3 Conclusion 53
With the data and information available it is not possible to conduct reliable quantitative dietary 54
exposure assessments with regard to metabolites for assessment of genotoxicity against the TTC. 55
For most of the identified or tentatively identified metabolites the residue levels were either not or 56
insufficiently reported, or cannot be precisely calculated as they can arise in animal commodities upon 57
livestock exposure to epoxiconazole in feed items. Hence, a conclusive calculation of reliable dietary 58
exposure, necessary for a TTC assessment, is not possible. 59
However, only from the contribution of M63 in a dietary exposure assessment for cereal grain with the 60
available information of potential levels, the TTCgenotox is already exceeded. 61
Metabolites M49, M50, M51 and M52 (the triazole derivative metabolites aka TDMs) were identified 62
in grain and straw. A triazole label study is only available in ruminants; nothing can be stated with 63
regard on TDM occurrence in poultry commodities. Studies were only conducted with epoxiconazole, 64
and not with TDMs that are major residues in cereal grain and rotational commodities. However, 65
TDMs are common metabolites to a number of substances and have got separate reference values 66
allocated, therefore, this is considered a special case where a separate risk assessment is highly 67

Establishment of the residue definition for dietary risk assessment
EFSA Journal 2016;14(issue):NNNN 159
recommended, and Metabolites M49, M50, M51 and M52 are therefore not dealt with in the 68
subsequent assessment, but the suggestion as candidates for risk assessment is taken forward. 69
Step 8: Genotoxicity testing 70
1. Metabolite (21) the genotoxicity concern cannot be excluded therefore it should be subject to 71
testing (step 9). 72
2. Metabolite M63 the genotoxicity concern cannot be excluded therefore it should be subject to 73
testing (step 9). 74
3. Metabolites M12 and M18 the genotoxicity concern cannot be excluded therefore metabolite 75
M18 could be potentially tested as a representative, since an alert was identified for it. 76
4. Metabolites M06, M07, M08 and M09 the genotoxicity concern cannot be excluded 77
therefore metabolite M06 (a ketone) and (9) (a thiol) could be tested as group representatives. 78
5. M05, M13, M15, M56 (all isomers) the genotoxicity concern cannot be excluded therefore 79
metabolite M05 could be tested as representative in case hydrolysis of the other metabolites 80
into metabolite M5 is demonstrated. If this cannot be demonstrated, all metabolites should be 81
subject to individual testing. Livestock metabolites M16, M19, M20, M23 may be considered 82
covered by this group. 83
84
Genotoxicity endpoints (point mutations, structural and numerical chromosome aberrations) should be 85
investigated. In-vitro studies (e.g. Ames test (TG 471) and in vitro micronucleus assay (TG 487)) are 86
considered suitable for the exploration of the above mentioned genotoxicity endpoints. 87
Step 9: Genotoxicity concern 88
For several metabolites a genotoxicity concern can only be ruled out upon further investigations (See 89
step 8 above). 90
Step 10 Assessment of toxicological properties of parent compound and metabolites 91
Step 10.1 Toxicological assessment of parent compound 92
Introduction: Summary of the toxicity of epoxiconazole 93
The most sensitive effects of epoxiconazole were reduced body weight gain and liver toxicity, as 94
observed in a 18-month study in mice, a 2-year study in rats and a 1-year study in dogs. In addition 95
anemia was observed. 96
Epoxiconazole is considered to induce liver tumours in mice and rats through a phenobarbitone-like 97
mechanism, i.e. induction of liver enzymes and hepatic growth. Increased incidences of adrenal gland 98
cortex neoplasms, ovarian cysts, ovarian theca granulosa cell tumours, and decreased incidences of 99
neoplasms in the testes (Leydig cell tumours), in the adrenal gland medulla (phaeochromocytomas) 100
and in the pituitary gland (adenomas) in rats were considered indicative of an effect on the synthesis or 101
availability of steroid hormones. Hormonal changes were detected after 4 days of administration 102
supporting the conclusion that hormonal imbalances were induced within the first week of exposure at 103
least in females. Specific steroid hormones affected by epoxiconazole in male and female rats included 104
androgens, oestradiol, corticosterone and aldosterone. LH, FSH, ACTH were however generally 105
increased, indicating intact feed-back mechanisms. 106

Establishment of the residue definition for dietary risk assessment
EFSA Journal 2016;14(issue):NNNN 160
In reproductive toxicity studies epoxiconazole increased precoital intervals, prolonged or abolished 107
oestrus cycles and decreased levels of relevant steroid hormones. Duration of pregnancy was 108
prolonged, probably due to interference with parturition-inducing signals. This resulted in an increased 109
number of pups either being born dead or dying in the early postnatal period. 110
In several prenatal developmental toxicity studies in rats, among others reductions in oestradiol, 111
progesterone and prolactin levels and increased placental weights were observed. The increase in 112
placental weight may be related to the hormonal changes induced in the dams and indicate an 113
increased placental metabolic function (synthesis of steroids, detoxification of epoxiconazole). 114
Embryofoetal toxicity consisted of increased embryo- or foetolethality and higher incidence of skeletal 115
variations cleft palate malformations and increased post implantation loss. 116
In a prenatal developmental toxicity study in rabbits, dose-dependent maternal toxicity (reduced food 117
consumption, impairments in body weight) marked increase in post implantation loss and reduced 118
uterine weights) was observed. 119
Epoxiconazole was not neurotoxic. 120
The current classification of epoxiconazole is: 121
Category 1B for developmental and reproductive toxicity, Category 2 for carcinogenicity 122
In conclusion, many of the effects of epoxiconazole appear to be the result of liver enzyme induction 123
or effects on hormone levels (androgens, oestradiol, corticosterone and aldosterone, LH, FSH, ACTH), 124
including the ones observed in the developmental toxicity study. Some studies are showing that the 125
teratogenic effect is likely due to retinoic metabolism linked to liver enzyme induction ie CYP 26 126
induction (Menegola et al. 200530
and 200631
) It is noted that foetal effects (NOAEL 20 mg/kg 127
bw/day) occurred at doses well above the overall NOAEL of 0.8 mg/kg bw/day that formed the basis 128
for the ADI. However, an ARfD was also set based on the reproductive effects of epoxiconazole. 129
Step 10.2 Toxicological assessment of metabolites 130
None of the metabolites was present in rat urine above 10%AR and no individual studies on 131
metabolites exist except for the TDMs. It is known that M49, M50, M51 and M52 - belonging to the 132
TDMs - are common metabolites to a number of active substances and have got separate reference 133
values allocated, based on a separate dossier with toxicological studies. Therefore, for this special case 134
a separate risk assessment is highly recommended, and Metabolites M49, M50, M51 and M52 are not 135
dealt with further in this case study, as the case is for demonstration purposes only. However, the 136
suggestion to consider TDMs as candidates for risk assessment is taken forward. 137
It is further noted, that the assessment of expoxiconazole in this case study is using the assumption that 138
expoxiconazole and TDMs have separate reference values and do not share common effects. However, 139
it should be born mind that there probably are effects shared between TDMs and epoxiconazole, and 140
therefore, in reality, this needs to be considered for a proper assessment. 141
Step 11: Combined exposure of all metabolites to assess general toxicity (optional) 142
30 Menegola, E., Broccia, M.L., Di Renzo, F., Massa, V. and Giavini, E., 2005. Study on the common teratogenic pathway
elicited by the fungicides triazole-derivatives. Toxicology in Vitro 19, 737– 748. 31 Menegola, E., Broccia, M.L., Di Renzo, F., Massa, V. and Giavini, E., 2006. Postulated pathogenic pathway in triazole
fungicide induced dysmorphogenic effects. Reproductive Toxicology 22,

Establishment of the residue definition for dietary risk assessment
EFSA Journal 2016;14(issue):NNNN 161
For the rest TTC is not applicable due to uncertainty caused by significant livestock exposure and 143
residue transfer in animal commodities, and the knowledge of existence of several non identified 144
metabolites in the edible plant matrices. 145
Step 12 Consideration on potency 146
The ADI was set at 0.008 mg/kg bw/d derived from the NOAEL of the 18-month carcinogenicity 147
study in mice (0.8 mg/kg bw/d) and using as safety factor of 100. 148
ARfD 0.023 mg/kg bw based on two generation reproduction study in rat applying a safety factor of 149
100. 150
The substance is considered potent. 151
Step 13 152
Based on its potency all metabolites in food meeting the criteria for potent substance metabolites in 153
food commodities of plant and animal origin should be toxicologically assessed (Refer to listing in 154
step 18.) 155
Step 15 156
Major plant residues in feed are the parent compound and the TDMs. As has been indicated already 157
earlier (see Step 7.3), the assessment of Metabolites M49, M50, M51 and M52 is not dealt with further 158
in this case study; however, the suggestion to consider the TDMs as candidates for risk assessment is 159
taken forward by default. 160
In rotational cereal straw metabolites hydroxylated at the chloroaromatic ring were tentatively 161
identified as free compounds and as conjugates and the sum considered together in the different 162
fractions would exceed 10% TRR. However definite confirmation of the identity of these residues and 163
their total levels is missing. Further it appears that the potential contribution to the livestock burden of 164
residues in rotate cereals might be marginal in view of the residue concentrations observed in the 165
primary cereal commodity which is driving the livestock dietary burden. Hence the livestock dietary 166
burden calculation is conducted for parent residues only for primary cereal and sugar beet 167
commodities. Banana is not considered relevant for livestock feeding. 168
The trigger of 0.004 mg/kg bw/d for requirement of a livestock metabolism study is exceeded for 169
ruminants and poultry. Metabolism of expoxiconzole is addressed by radiolabelled studies in goats and 170
laying hens (step 17). 171
Epoxiconazole are considered fat soluble and having a potential for accumulation. 172
173
174
175
176
177
178

Establishment of the residue definition for dietary risk assessment
EFSA Journal 2016;14(issue):NNNN 162
Step 16 179
Table 13 Input data and dietary burden calculation for epoxiconazole32
180
Commodity Median dietary burden Maximum dietary burden
Input value
(mg/kg) Comment Input value
(mg/kg) Comment
Epoxiconazole
Sugar beet pulp (dry) 0.9 Median residue*
default PF 18
0.9 Highest residue *
default PF 18
Sugar beet tops 0.68 Median residue 1.44 Highest residue
Wheat, rye, spelt, triticale
grain
0.03 Median residue 0.03 Median residue
Wheat, rye, spelt, triticale bran 0.126 Median residue *PF
4.2
0.126 Median residue *PF
4.2
Barley, oat grain 0.14 Median residue 0.14 Median residue
Barley, oat bran 0.588 Median residue *PF
4.2
0.588 Median residue *PF
4.2
Cereal straw 2.42 Median residue 15.4 Highest residue
Contribution to livestock burden
Epoxiconazole - Maximum intakes
Diet mg/kg bw/d %
Lamb 0.459 100
Ram/ Ewe 0.360 100
Dairy cattle 0.210 100
Beef cattle 0.131 100
Poultry(Layer) 0.130 100
181
Step 17 182
10% TRR (red) 0.01 mg/kg at N rate for critical diet (blue)
183
Livestock Studies 184
Table 14 Goat metabolism (oxirane label, 10 mg/kg bw) 185
Code
Milk Muscle Fat Liver Kidney
mg/kg % TRR mg/kg % TRR mg/kg % TRR mg/kg % TRR mg/kg % TRR
Parent 0.260 52.9 0.470 58.5 4.999 90.9 8.545 32.8 1.815 22.1
M02 0.008 1.9 0.033 4.1 0.071 1.3 0.395 1.5 0.191 2.3
M02 conj.
(M32)
0.011 3.5
M04 0.011 2.7 0.048 5.9 0.084 1.5 1.441 5.5 0.405 4.9
32 EFSA livestock burden calculator considering OECD feeding table.
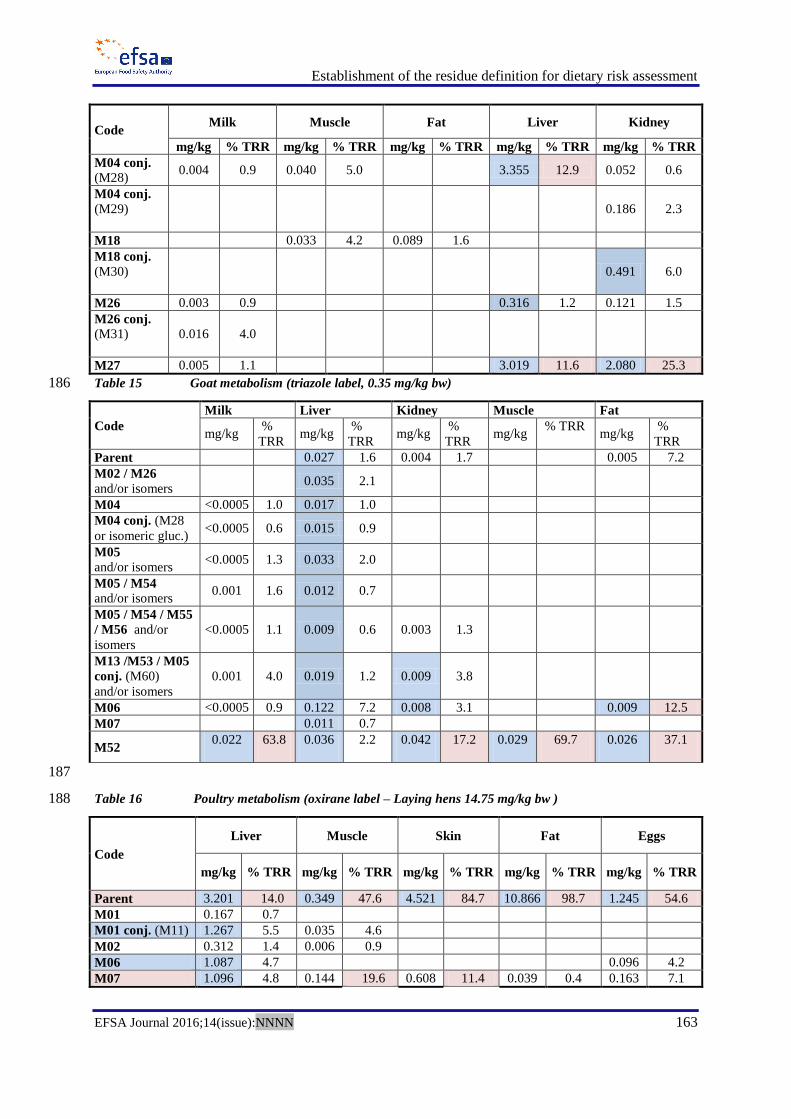
Establishment of the residue definition for dietary risk assessment
EFSA Journal 2016;14(issue):NNNN 163
Code
Milk Muscle Fat Liver Kidney
mg/kg % TRR mg/kg % TRR mg/kg % TRR mg/kg % TRR mg/kg % TRR
M04 conj.
(M28) 0.004 0.9 0.040 5.0 3.355 12.9 0.052 0.6
M04 conj.
(M29)
0.186 2.3
M18 0.033 4.2 0.089 1.6
M18 conj.
(M30)
0.491 6.0
M26 0.003 0.9 0.316 1.2 0.121 1.5
M26 conj.
(M31)
0.016 4.0
M27 0.005 1.1 3.019 11.6 2.080 25.3
Table 15 Goat metabolism (triazole label, 0.35 mg/kg bw) 186
Code
Milk Liver Kidney Muscle Fat
mg/kg %
TRR mg/kg
%
TRR mg/kg
%
TRR mg/kg
% TRR mg/kg
%
TRR
Parent 0.027 1.6 0.004 1.7 0.005 7.2
M02 / M26
and/or isomers 0.035 2.1
M04 <0.0005 1.0 0.017 1.0
M04 conj. (M28
or isomeric gluc.) <0.0005 0.6 0.015 0.9
M05
and/or isomers <0.0005 1.3 0.033 2.0
M05 / M54
and/or isomers 0.001 1.6 0.012 0.7
M05 / M54 / M55
/ M56 and/or
isomers
<0.0005 1.1 0.009 0.6 0.003 1.3
M13 /M53 / M05
conj. (M60)
and/or isomers
0.001 4.0 0.019 1.2 0.009 3.8
M06 <0.0005 0.9 0.122 7.2 0.008 3.1 0.009 12.5
M07 0.011 0.7
M52 0.022 63.8 0.036 2.2 0.042 17.2 0.029 69.7 0.026 37.1
187
Table 16 Poultry metabolism (oxirane label – Laying hens 14.75 mg/kg bw ) 188
Code
Liver Muscle Skin Fat Eggs
mg/kg % TRR mg/kg % TRR mg/kg % TRR mg/kg % TRR mg/kg % TRR
Parent 3.201 14.0 0.349 47.6 4.521 84.7 10.866 98.7 1.245 54.6
M01 0.167 0.7
M01 conj. (M11) 1.267 5.5 0.035 4.6
M02 0.312 1.4 0.006 0.9
M06 1.087 4.7 0.096 4.2
M07 1.096 4.8 0.144 19.6 0.608 11.4 0.039 0.4 0.163 7.1

Establishment of the residue definition for dietary risk assessment
EFSA Journal 2016;14(issue):NNNN 164
Code
Liver Muscle Skin Fat Eggs
mg/kg % TRR mg/kg % TRR mg/kg % TRR mg/kg % TRR mg/kg % TRR
M10 0.515 2.2 0.016 2.2
M12 0.049 0.2
M13 1.107 4.8 0.213 9.3
M13 conj. (M25) 0.375 1.6
M15 0.554 2.4 0.263 11.5
189
Step 18 Testing strategy, grouping and read-across 190
The following metabolites are to be included on considerations of their toxicity (as identified in step 7 191
and 17): 192
M02, M04, M05, M06, M07, M11, M13, M15, M26, M27, M28, M30, M53, M54, M55, M56, M60, 193
M61/ M63 (and the TDMs: M52, M49, M50, M51) 194
In specific cases, for conjugated metabolites their aglycons will be referenced. 195
Toxicological information is only available for the parent compound. Therefore, the grouping proposal 196
is based only on the structural similarity. Substances belonging to the same group are expected to have 197
a similar chemical reactivity. 198
Group A 199
ClF
N
N
N
O
H
OH
M01
Cl
F
N
NN O
H
O
O
OH
OH
OH
O OH
M11
ClF
N
N
N
O
H
OH
M02
O
OH
OH OH
O
O-
Cl
F
N+
N
NO
H
OH
M27
ClF
N
NN
O
H
OH
ClF
N
NN
O
H OH
M26
M61
Cl
F
NN
N
O
O-GlcA
OH
M55
200

Establishment of the residue definition for dietary risk assessment
EFSA Journal 2016;14(issue):NNNN 165
The metabolites identified in group A mainly differ from the parent by the addition of a hydroxyl 201
group in one or two halogenated benzene rings, or conjugates thereof. 202
The following subgroups may be considered: 203
Metabolites M01 (aglycon of M11), M02 (aglycon of M27) and M26, M61, the difference 204
with the parent molecule is due to the presence of a hydroxyl group in different positions in 205
one of the halogenated benzene rings. 206
M55 is also conjugated metabolites, however their aglycons are unique (two hydroxyl groups 207
are presented either in one of benzene halogenated ring or in both benzene halogenated rings). 208
Strategy for M01, M02, M11, M26, M27, M55 and M61: 209
The hydroxylation on a ring system without cleavage of the ring is not expected to cause 210
additional hazard or increase the toxicity of the compound. 211
M11, M27 are conjugated metabolites (i.e. glucosides and glucoronides) and the toxicology of 212
the glucosides or glucuronides are considered to be covered by their respective aglycons: M1 213
as representative for M11; M2 as representative for M27. 214
Based on the observations above it is concluded that the toxicological properties of 215
metabolites M01, M02, M11, M26, M27, M55 and M61 are covered by the toxicology of the 216
parent. For these metabolites no further testing is required. 217
218
Group B 219
Cl
F
NN
OH
H
N
OH
M04
OO
OHOH
OH
O
OHCl
F
N N
N
OHH
M28
Cl
F
N N
N
H
O O
OH
OHOH
O
OHOH
OH
Cl
F
N N
N
H
O O
OH
OHOH
O
OHOH
OH
M53
Cl
F
NN
OH
H
N
OHOH
M05
Cl
NN
N
OHO-GlcA
F
OH
M60
Cl
F
NN
N
OH
H
S
OH
NH2O
OH
M13
Cl
F
N
N
NOH
H
S
OH
NH2O
NH
O
OH
M15

Establishment of the residue definition for dietary risk assessment
EFSA Journal 2016;14(issue):NNNN 166
Cl
F
NN
N
OH
SH
M18
OO
OHOH
OH
O
OH
Cl
F
NN
N
H
SH
Cl
F
N
NN
H
S
OOH
OH
OH
OOH
OH
M30
Cl
F
NN
N
OH S CH3
OH
M54
Cl
F
NN
N
OH
H
S
OH
O OH
Cl
F
NN
N
OH S
O
OH
OH
M56
220
In metabolites belonging to group B the epoxide ring is opened to form diols which maybe 221
subsequently metabolized further. Although it is likely that this will render the compounds less 222
reactive it is not clear how this may affect their toxicity. 223
The following subgroups may be considered: 224
In metabolites M04 (aglycon of M28) and M05 (aglycon of M60) the epoxide ring is open and 225
an additional hydroxyl group appears in the chlorinated benzene ring in metabolite M05. 226
M53 is also a conjugated metabolite; its aglycon is unique as it is monohydroxylated on the 227
fluorinated ring. 228
Metabolites M13, M15 are conjugates (cysteine or cysteinyl-beta-alanine) of metabolite M05 229
and therefore, if their hydrolysis is demonstrated, the toxicological assessment might rely on 230
the assessment of the respective aglycon or its representative. 231
In the metabolites M18 (aglycon of M30) and M54 one of the OH groups is is replaced by a 232
methylthiol group (M54) or sulfhydryl group (M18) and therefore they might have different 233
reactivity. 234
M56 as acetate should be evaluated as such (or its hydrolysis product if the hydrolysis is 235
demonstrated) 236
Strategy for M04, M05, M13, M15, M28, M53, M60: 237
The toxicity of the glucoside and glucuronide conjugates is considered to be covered by their 238
respective aglycons, i.e. M04 as representative for M28 and M53; M05 as representative for M60 239

Establishment of the residue definition for dietary risk assessment
EFSA Journal 2016;14(issue):NNNN 167
Metabolites M13, M15 are conjugates (cysteine or cysteinyl-beta-alanine) of metabolite M05 and 240
therefore if hydrolysis to M05 is demonstrated the toxicological assessment might rely on the 241
assessment of M05. As a first step, it should be demonstrated whether the compounds M13, M15 are 242
converted to M05. If this occurs the toxicological properties of these compounds are considered 243
covered by the toxicology of M05. 244
The toxicity of M05 is considered to be covered by that of M04. 245
M04 can be considered a representative of this group of metabolites. The potency of this compound to 246
induce liver enzymes and to induce endocrine disruption should be tested in vitro (e.g. according to 247
Kjaerstad et al., 2010)33
. Epoxiconazole should be included in these studies and the relative potency of 248
these metabolites as compared to epoxiconazole should be assessed. 249
In view of the structural similarities between epoxiconazole and the metabolites of group B, and since 250
developmental effects of epoxiconazole were observed at doses well above the NOAEL that formed 251
the basis of the ADI, no further testing of the developmental potency of the metabolites in group B is 252
required. 253
For those compounds that are not hydrolysed to M05 one representative metabolite should be tested 254
according to the strategy as described above for M04. 255
Strategy for M18, M54 and M56 256
M56 is an acetate. If hydrolysis is demonstrated its toxicity can be considered covered by that of M18, 257
since the hydroxylation of the rings is not expected to increase the toxicity. As a first step, it should be 258
demonstrated whether the acetate group in M56 is hydrolysed. 259
M18 can be considered a representative of this group of metabolites. The potency of this compound to 260
induce liver enzymes and to induce endocrine disruption should be tested in vitro (e.g. according to 261
Kjaerstad et al., 2010)34
. Epoxiconazole should be included in these studies and the relative potency of 262
these metabolites as compared to epoxiconazole should be assessed. 263
If the acetate group in M56 is not hydrolysed it should be tested according to the strategy as described 264
above for M18. 265
Group C: 266
F
NN
N
O M06
F
NN
N
OH M07
267
Strategy for M06 and M07 268
The metabolites M06 and M07 lack the chlorobenzene ring. No metabolites lacking the chlorobenzene 269
ring were identified in the metabolism study in rats. It is therefore possible that these metabolites have 270
a toxicity profile that differs from that of epoxiconazole. 271
33 Kjaerstad et al., Reproductive Toxicology 30 (2010) 573-582 34 Kjaerstad et al., Reproductive Toxicology 30 (2010) 573-582

Establishment of the residue definition for dietary risk assessment
EFSA Journal 2016;14(issue):NNNN 168
M6 is probably the most reactive of these metabolites and therefore toxicologically most relevant. 272
Thus, M6 can be considered representatives for the metabolites in group C. It is not clear whether the 273
metabolites of group C also affect liver enzymes and steroid hormones in a similar way as 274
epoxiconazole. Therefore, the potency of M06 to induce liver enzymes and to induce endocrine 275
disruption should be tested in vitro (e.g. according to Kjaerstad et al., 2010)35
. Epoxiconazole should 276
be included in these studies and the relative potency of these metabolites as compared to 277
epoxiconazole should be assessed. 278
Since the toxicity profile may differ from that of epoxiconazole the toxicity of M6 should be assessed 279
in the enhanced OECD 407. 280
Secondly, the potential developmental toxicity effects of M06 should be tested in a developmental 281
toxicity study in rats (OECD 414). 282
Group D: 283
NH
N
N
M52
N
N
N
NH2
OH
O
M49
N
N
N
OH
OH
O
M50
N N
N OH
O
M51
284
Strategy for M49, M50, M51 and M52 285
This group consists of the triazole derivative metabolites (TDMs). The toxicology of triazole (M52), 286
triazole acetic acid (M51) and triazole alanine (M49) has been assessed and reference values have 287
been established (EFSA, 2008) 36
. The toxicity of M50 (triazole hydroxypropionic acid) is considered 288
covered by that of M49 and M51. As for the existence of data that were deemed sufficient to set 289
toxicological reference values, no further considerations on toxicity assessment for these metabolites 290
will be made in this case study. 291
Group E: Metabolite M63 is a glucopyranosiduronic acid conjugate. It is aglycon is unique and rather 292
different than other metabolites (with double bond between the three rings) and should be kept in 293
separate group. 294
Cl
F
N
N N
O
OOH
OH
OH
OOH
295
First Tier: For all the metabolites with an alert for genotoxicity in module 1, it should be investigated 296
whether or not there is a genotoxicity concern by appropriate genotoxicity tests in vitro and, when 297
necessary, in vivo. 298
35 Kjaerstad et al., Reproductive Toxicology 30 (2010) 573-582 36 EFSA (European Food Safety Authority), 2008. Conclusion regarding the peer review of the pesticide risk assessment of
the active substance penconazole. 104 pp. doi:10.2903/j.efsa.2008.175r

Establishment of the residue definition for dietary risk assessment
EFSA Journal 2016;14(issue):NNNN 169
Group E 299
Metabolite M63 is a glucopyranosiduronic acid conjugate. Its aglycon is unique and rather different 300
than other metabolites (with a double bond between the three rings). 301
Strategy for M63 302
Firstly, the potency of this compound to induce liver enzymes and to induce endocrine disruption 303
should be tested in vitro (e.g. according to Kjaerstad et al, 2010)37
. Epoxiconazole should be included 304
in these studies and the relative potency of this metabolite as compared to epoxiconazole should be 305
assessed. Depending on results, an additional safety factor of 10x can be applied in case of negative 306
outcome for endocrine effect. If the results are indicative that the metabolite has a similar qualitative 307
profile of the parent, the same reference dose of the parent can be applied. Testing for DART 308
endpoints can be an option. 309
310
Step 19 Assessment against total toxicological burden 311
The following compounds of relevance were identified in food and feed of plant origin and require 312
further assessment: 313
Cereals: According to the findings in Tables 6 and 9, parent compound, M49, M50 and M51 (TDMs), 314
and M61/63 pending the finalisation of the toxicological relevance assessment (in particular 315
genotoxicity for M63). 316
The TDMs should be subject to a separate assessment considering all sources, which is not conducted 317
here as this would go beyond the scope of this case study. 318
Root crops: Parent 319
Fruit crops: Parent 320
The following compounds of relevance were identified in food of animal origin and require further 321
assessment (According to the findings in Tables 14 to 16): 322
Parent, M02, M04, M05, M06, M07, M11, M13, M15, M26, M27, M28, M30, M52, M53, M54, M55, 323
M56, M60. 324
Their quantitative occurrence is expressed in Table 17 (for poultry) and Tables 17 and 18 (for 325
ruminants) and in terms of %TRR (as determined in metabolism studies) and in % of toxicological 326
burden, which is meant as percentage of identified residue compounds. 327
In the absence of toxicological data on the metabolites a RPF of 1 is assumed for all metabolites 328
except TDMs. It is again noted that the assessment in this case study is using the assumption that 329
epoxiconazole and TDMs have separate reference values and do not share common effects. However, 330
it should be born mind that there probably are effects shared between TDMs and epoxiconazole, and 331
therefore, in reality, this needs to be considered for a proper assessment. 332
333
37 Kjaerstad et al., Reproductive Toxicology 30 (2010) 573-582

Establishment of the residue definition for dietary risk assessment
EFSA Journal 2016;14(issue):NNNN 170
Table 17 Residues of concern for food of animal origin(≥10 % TRR and at least 0.01 mg/kg)- Poultry 334 (oxirane label) 335
Residue
component Liver Muscle Skin Fat Eggs
RPF %
TRR
% tox
burden
%
TRR
% tox
burden
%
TRR
% tox
burden
%
TRR
% tox
burden
%
TRR
% tox
burden
Parent 1 14 33.1 47.6 63.6 84.7 88.1 98.7 99.6 54.6 63.0
M01 0.7 M01 conj.
(M11) 5.5 4.6
M01 (sum) 1 6.2 14.7 4.6 6.1
M02 1 1.4 3.3 0.9 1.2
M06 1 4.7 11.1 4.2 4.8
M07 1 4.8 11.3 19.6 26.2 11.4 11.9 0.4 0.4 7.1 8.2
M10 1 2.2 5.2 2.2 2.9
M12 1 0.2 0.5
M13 4.8
9.3
M13 conj.
(M25) 1.6
M13 (sum) 1 6.4 15.1 9.3 10.7
M15 1 2.4 5.7 11.5 13.3
Total identified 42.3 100 74.9 100 96.1 100 99.1 100 86.7 100
Sum of relevant
compounds 31.4 74.2 71.8 95.9 96.1 100.0 99.1 100.0 71.0 81.9
Sum of non-
considered
compounds 10.9 25.8 3.1 4.1 0 0 0 0 15.7 18.1
336
Table 18 Residues of concern for food of animal origin(≥10 % TRR and at least 0.01 mg/kg)- 337 Ruminant metabolism low dose (triazole label, 0.35 mg/kg bw) 338
Residue component RPF Milk Liver Kidney Muscle Fat
%
TRR
% tox
burden
%
TRR
% tox
burden
%
TRR
% tox
burden
%
TRR
% tox
burden
%
TRR
% tox
burden
Parent 1
1.6 8.9 1.7 17.2
7.2 36.5
M02 / M26 1
2.1 11.7
M04
1
1.0
M04 conj.
0.6
0.9
M04 (sum) 1 1.6 15.2 1.9 10.6
M05 1 1.3 12.4 2.0 11.1
M05 / M54 1 1.6 15.2 0.7 3.9
M05 / M54 / M55 /
M56 1 1.1 10.5 0.6 3.3 1.3 13.1
M13 /M53 / M05
conj. 1 4.0 38.1 1.2 6.7 3.8 38.4
M06 1 0.9 8.6 7.2 40.0 3.1 31.3
12.5 63.5
M07 1
0.7 3.9
M52 (TDM) n/a 63.8 100.0 2.2 100.0 17.2 100.0 69.7 100 37.1 100.0
Total identified -
Parent group 1 10.5 100.0 18.0 100.0 9.9 100.0 - - 19.7 100.0
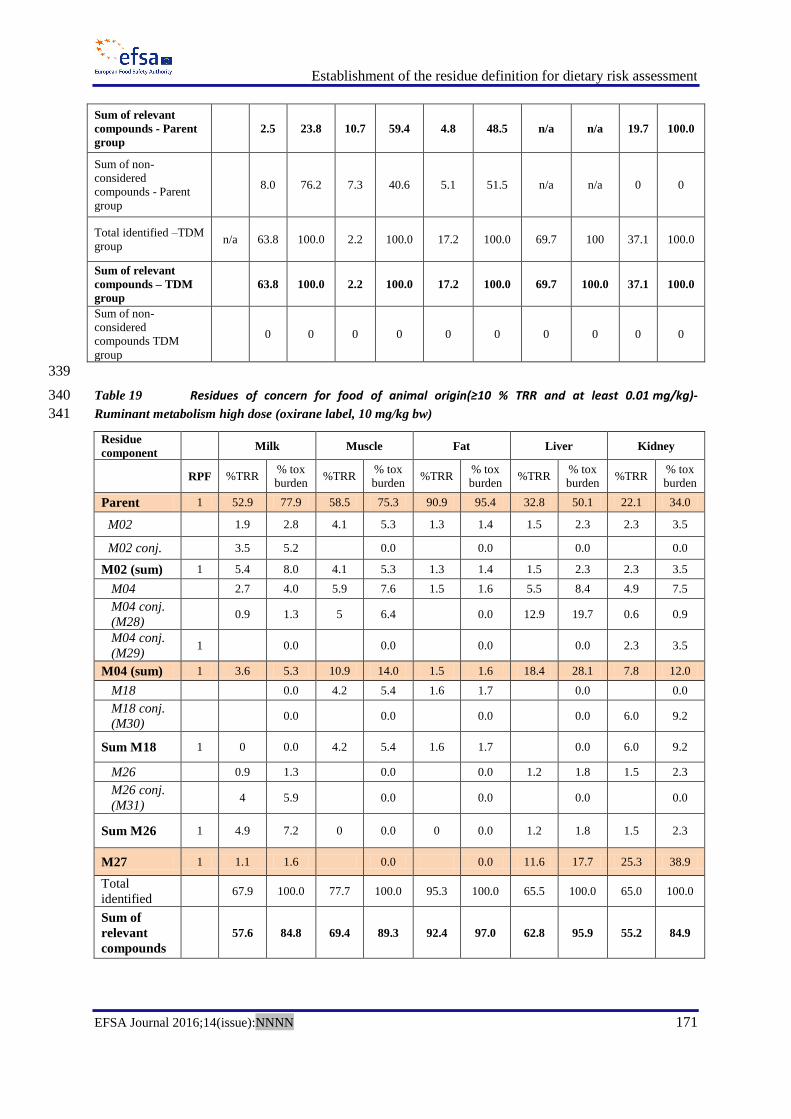
Establishment of the residue definition for dietary risk assessment
EFSA Journal 2016;14(issue):NNNN 171
Sum of relevant
compounds - Parent
group
2.5 23.8 10.7 59.4 4.8 48.5 n/a n/a 19.7 100.0
Sum of non-
considered
compounds - Parent
group
8.0 76.2 7.3 40.6 5.1 51.5 n/a n/a 0 0
Total identified –TDM
group n/a 63.8 100.0 2.2 100.0 17.2 100.0 69.7 100 37.1 100.0
Sum of relevant
compounds – TDM
group
63.8 100.0 2.2 100.0 17.2 100.0 69.7 100.0 37.1 100.0
Sum of non-
considered
compounds TDM
group
0 0 0 0 0 0 0 0 0 0
339
Table 19 Residues of concern for food of animal origin(≥10 % TRR and at least 0.01 mg/kg)- 340
Ruminant metabolism high dose (oxirane label, 10 mg/kg bw) 341
Residue
component Milk Muscle Fat Liver Kidney
RPF %TRR
% tox
burden %TRR
% tox
burden %TRR
% tox
burden %TRR
% tox
burden %TRR
% tox
burden
Parent 1 52.9 77.9 58.5 75.3 90.9 95.4 32.8 50.1 22.1 34.0
M02 1.9 2.8 4.1 5.3 1.3 1.4 1.5 2.3 2.3 3.5
M02 conj. 3.5 5.2 0.0 0.0 0.0 0.0
M02 (sum) 1 5.4 8.0 4.1 5.3 1.3 1.4 1.5 2.3 2.3 3.5
M04 2.7 4.0 5.9 7.6 1.5 1.6 5.5 8.4 4.9 7.5
M04 conj.
(M28) 0.9 1.3 5 6.4 0.0 12.9 19.7 0.6 0.9
M04 conj.
(M29) 1 0.0 0.0 0.0 0.0 2.3 3.5
M04 (sum) 1 3.6 5.3 10.9 14.0 1.5 1.6 18.4 28.1 7.8 12.0
M18 0.0 4.2 5.4 1.6 1.7 0.0 0.0
M18 conj.
(M30) 0.0 0.0 0.0 0.0 6.0 9.2
Sum M18 1 0 0.0 4.2 5.4 1.6 1.7 0.0 6.0 9.2
M26 0.9 1.3 0.0 0.0 1.2 1.8 1.5 2.3
M26 conj.
(M31) 4 5.9 0.0 0.0 0.0 0.0
Sum M26 1 4.9 7.2 0 0.0 0 0.0 1.2 1.8 1.5 2.3
M27 1 1.1 1.6 0.0 0.0 11.6 17.7 25.3 38.9
Total
identified 67.9 100.0 77.7 100.0 95.3 100.0 65.5 100.0 65.0 100.0
Sum of
relevant
compounds
57.6 84.8 69.4 89.3 92.4 97.0 62.8 95.9 55.2 84.9

Establishment of the residue definition for dietary risk assessment
EFSA Journal 2016;14(issue):NNNN 172
Sum of non-
considered
compounds
10.3 15.2 8.3 10.7 2.9 3.0 2.7 4.1 9.8 15.1
342
Step 20 343
Residue definition for plants 344
The following compounds are relevant for risk assessment: 345
346
Cereals (primary and rotational crops): 347
Parent, and provisionally M61/63 pending the finalisation of the toxicological 348
relevance assessment (in particular genotoxicity for M63) 349
Separately M49, M50 and M51 (TDMs) 350
Root crops: Parent (default) 351
Fruit crops: Parent (default) 352
353
Residue definition for livestock 354
With regard to the ruminant studies the following is noted: In the high dose goat metabolism study 355
primarily the parent compound was recovered. From the rat metabolism data it has been shown that 356
the excretion of radioactivity is dose related (low excretion of parent at higher dose rates and more 357
intensive excretion at lower dose rates). Moreover, the high dosed goat study used a shorter slaughter 358
interval than the low dosed study. It was therefore assumed that these are the reasons why the residue 359
pattern differs significantly between the two studies so that at the high dosed metabolism study M06 360
was not observed while there was significant occurrence in animal matrices in the low dosed study. 361
Poultry: Parent + M07 + M01 and M13, including their conjugates 362
Ruminants: Parent + M04 (free & conj.) + M06 +M27 363
Separately M52 (TDM) 364
The residue definitions are provisional pending full toxicological assessment of metabolites in the 365
“parent group” as appropriate (refer to steo 18) or investigation of their occurrence in a ruminant 366
feeding study. 367
368

Establishment of the residue definition for dietary risk assessment
EFSA Journal 2016;14(issue):NNNN 173
Assessment of stereoisomers (enantiomers and diastereoisomers) for the parent and metabolites 369
The toxicological studies are performed with a racemic mixture of parent compound. 370
Enantiomer ratio in commodities of plant origin (tables X-X9) (Final addendum to the Draft 371
Assessment Report (DAR) in the context of confirmatory data peer review, 2012) 372 373
The enantiomer ration in plant samples was determined in methanol extracts (and concentrated by SPE 374
(solid-phase extraction) fractionation) and chromatography using a chiral column. 375
376 Table X Enantiomer ration in wheat grain samples 377
Proportion Residue in
wheat
grain
(-)-BAS
480 F
(+)-BAS
480 F
(-)-BAS
480 F
(+)-BAS
480 F
Sum DALA* Growth
stage
Region
(%) (%) (mg/kg) (mg/kg) (mg/kg) BBCH
20 80 0.004 0.017 0.021 42 89 EU-N
20 80 0.003 0.013 0.016 29 85 EU-N
21 79 0.004 0.014 0.018 34 87 EU-N
27 73 0.003 0.008 0.010 42 89 EU-S
29 71 0.008 0.019 0.026 42 89 EU-N
31 69 0.010 0.022 0.032 41 89 EU-N
32 68 0.003 0.006 0.009 35 87 EU-S
32 68 0.010 0.021 0.031 35 89 EU-N
33 67 0.012 0.024 0.036 38 83 EU-N
34 66 0.007 0.013 0.020 43 85 EU-N
35 65 0.006 0.011 0.017 35 87 EU-N
37 63 0.008 0.013 0.021 49 92 EU-S
38 62 0.004 0.007 0.012 42 89 EU-N
42 58 0.033 0.045 0.077 28 85 EU-N
46 54 0.006 0.007 0.012 41 89 EU-S
47 53 0.020 0.022 0.042 48 89 EU-S
49 51 0.038 0.039 0.077 42 89 EU-S *DALA – interval after last application 378 379
Table X2 Enantiomer ration in barley grain samples 380
Proportion Residue in
barley
grain
(-)-BAS
480 F
(+)-BAS
480 F
(-)-BAS
480 F
(+)-BAS
480 F
Sum DALA* Growth
stage
Region
(%) (%) (mg/kg) (mg/kg) (mg/kg) BBCH
16 84 0.014 0.072 0.086 42 89 EU-S
16 84 0.015 0.080 0.096 49 92 EU-S
18 82 0.022 0.103 0.126 34 87 EU-S
22 78 0.009 0.032 0.041 35 87 EU-S
26 74 0.022 0.064 0.086 56 89 EU-N
26 74 0.011 0.032 0.042 49 92 EU-S
27 73 0.011 0.031 0.042 42 89 EU-S
28 72 0.017 0.045 0.063 42 89 EU-S
30 70 0.022 0.053 0.075 49 89 EU-S
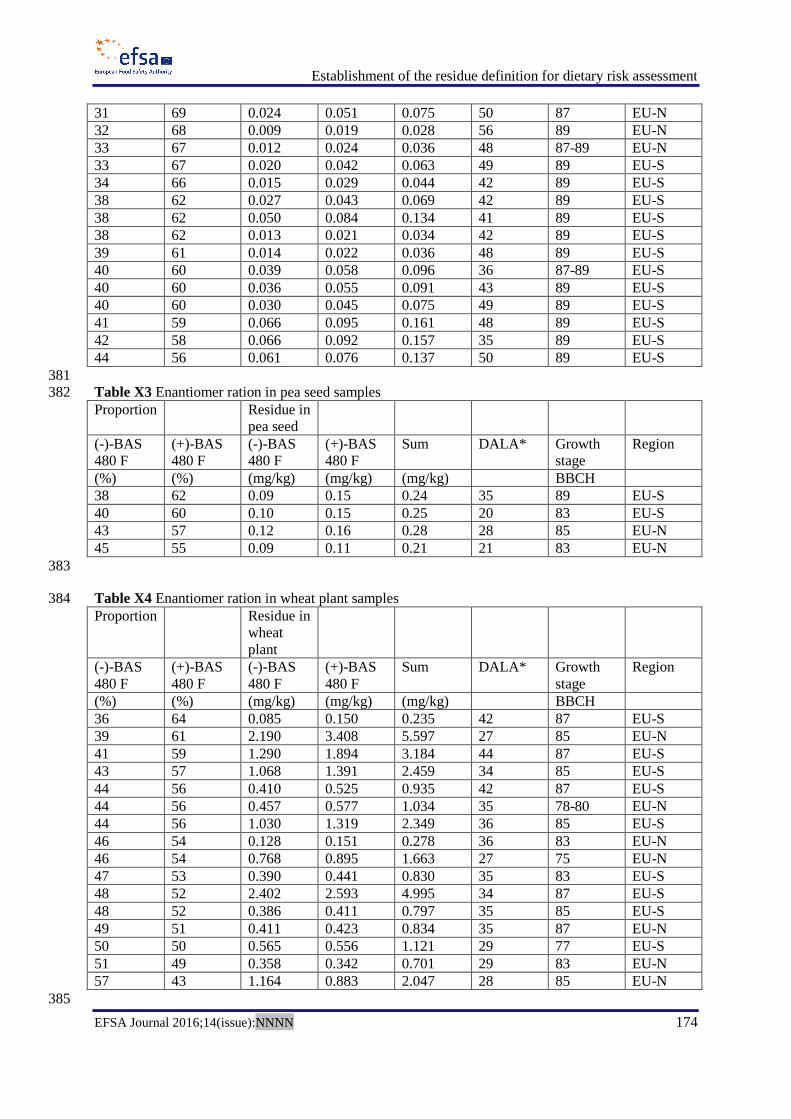
Establishment of the residue definition for dietary risk assessment
EFSA Journal 2016;14(issue):NNNN 174
31 69 0.024 0.051 0.075 50 87 EU-N
32 68 0.009 0.019 0.028 56 89 EU-N
33 67 0.012 0.024 0.036 48 87-89 EU-N
33 67 0.020 0.042 0.063 49 89 EU-S
34 66 0.015 0.029 0.044 42 89 EU-S
38 62 0.027 0.043 0.069 42 89 EU-S
38 62 0.050 0.084 0.134 41 89 EU-S
38 62 0.013 0.021 0.034 42 89 EU-S
39 61 0.014 0.022 0.036 48 89 EU-S
40 60 0.039 0.058 0.096 36 87-89 EU-S
40 60 0.036 0.055 0.091 43 89 EU-S
40 60 0.030 0.045 0.075 49 89 EU-S
41 59 0.066 0.095 0.161 48 89 EU-S
42 58 0.066 0.092 0.157 35 89 EU-S
44 56 0.061 0.076 0.137 50 89 EU-S
381
Table X3 Enantiomer ration in pea seed samples 382
Proportion Residue in
pea seed
(-)-BAS
480 F
(+)-BAS
480 F
(-)-BAS
480 F
(+)-BAS
480 F
Sum DALA* Growth
stage
Region
(%) (%) (mg/kg) (mg/kg) (mg/kg) BBCH
38 62 0.09 0.15 0.24 35 89 EU-S
40 60 0.10 0.15 0.25 20 83 EU-S
43 57 0.12 0.16 0.28 28 85 EU-N
45 55 0.09 0.11 0.21 21 83 EU-N
383
Table X4 Enantiomer ration in wheat plant samples 384
Proportion Residue in
wheat
plant
(-)-BAS
480 F
(+)-BAS
480 F
(-)-BAS
480 F
(+)-BAS
480 F
Sum DALA* Growth
stage
Region
(%) (%) (mg/kg) (mg/kg) (mg/kg) BBCH
36 64 0.085 0.150 0.235 42 87 EU-S
39 61 2.190 3.408 5.597 27 85 EU-N
41 59 1.290 1.894 3.184 44 87 EU-S
43 57 1.068 1.391 2.459 34 85 EU-S
44 56 0.410 0.525 0.935 42 87 EU-S
44 56 0.457 0.577 1.034 35 78-80 EU-N
44 56 1.030 1.319 2.349 36 85 EU-S
46 54 0.128 0.151 0.278 36 83 EU-N
46 54 0.768 0.895 1.663 27 75 EU-N
47 53 0.390 0.441 0.830 35 83 EU-S
48 52 2.402 2.593 4.995 34 87 EU-S
48 52 0.386 0.411 0.797 35 85 EU-S
49 51 0.411 0.423 0.834 35 87 EU-N
50 50 0.565 0.556 1.121 29 77 EU-S
51 49 0.358 0.342 0.701 29 83 EU-N
57 43 1.164 0.883 2.047 28 85 EU-N
385

Establishment of the residue definition for dietary risk assessment
EFSA Journal 2016;14(issue):NNNN 175
Table X5 Enantiomer ration in barley plant samples 386
Proportion Residue in
barley
plant
(-)-BAS
480 F
(+)-BAS
480 F
(-)-BAS
480 F
(+)-BAS
480 F
Sum DALA* Growth
stage
Region
(%) (%) (mg/kg) (mg/kg) (mg/kg) BBCH
34 66 0.237 0.460 0.697 42 83 EU-N
36 64 0.331 0.598 0.929 42 83-87 EU-N
37 63 0.402 0.690 1.092 35 77 EU-N
38 62 0.345 0.559 0.904 35 75-81 EU-N
38 62 0.741 1.216 1.958 35 87-89 EU-S
41 59 0.380 0.544 0.925 34 87 EU-S
44 56 1.237 1.559 2.796 35 87 EU-S
43 57 0.258 0.347 0.605 34 85 EU-S
387
Table X6 Enantiomer ration in maize plant samples 388
Proportion Residue in
maize
plant
(-)-BAS
480 F
(+)-BAS
480 F
(-)-BAS
480 F
(+)-BAS
480 F
Sum DALA* Growth
stage
Region
(%) (%) (mg/kg) (mg/kg) (mg/kg) BBCH
18 82 0.033 0.145 0.177 19 75 EU-N
18 82 0.019 0.087 0.106 46 85 EU-N
20 80 0.004 0.014 0.018 86 89 EU-N
21 79 0.061 0.232 0.293 12 71 EU-N
23 77 0.007 0.023 0.030 71 89 EU-N
25 75 0.007 0.021 0.028 64 85 EU-N
25 75 0.013 0.039 0.053 28 75 EU-N
29 71 0.010 0.023 0.033 57 85 EU-N
30 70 0.138 0.315 0.453 69 89 EU-S
31 69 0.020 0.043 0.063 17 71 EU-N
31 69 0.182 0.413 0.595 49 85 EU-S
31 69 0.082 0.186 0.269 21 75 EU-S
31 69 0.080 0.180 0.260 49 89 EU-S
32 68 0.016 0.033 0.049 29 75-77 EU-N
32 68 0.045 0.097 0.142 77 89 EU-S
33 67 0.200 0.399 0.599 14 71 EU-S
34 66 0.076 0.146 0.222 16 71 EU-S
35 65 0.046 0.084 0.130 49 85 EU-S
35 65 0.170 0.321 0.491 35 85 EU-S
35 65 0.006 0.011 0.016 91 89 EU-N
36 64 0.030 0.053 0.083 13 71 EU-N
36 64 0.051 0.090 0.142 27 77 EU-S
40 60 0.293 0.435 0.728 21 75-77 EU-S
45 55 0.255 0.311 0.566 6 71 EU-S
389
390
391

Establishment of the residue definition for dietary risk assessment
EFSA Journal 2016;14(issue):NNNN 176
Table X7 Enantiomer ration in pea plants 392
Proportion Residue in
pea plants
(-)-BAS
480 F
(+)-BAS
480 F
(-)-BAS
480 F
(+)-BAS
480 F
Sum DALA* Growth
stage
Region
(%) (%) (mg/kg) (mg/kg) (mg/kg) BBCH
50 50 0.64 0.63 1.27 EU-N
50 50 1.67 1.66 3.33 EU-S
52 48 1.15 1.05 2.20 EU-S
393
Table X8 Enantiomer ration in wheat ear samples 394
Proportion Residue in
wheat ears
(-)-BAS
480 F
(+)-BAS
480 F
(-)-BAS
480 F
(+)-BAS
480 F
Sum DALA* Growth
stage
Region
(%) (%) (mg/kg) (mg/kg) (mg/kg) BBCH
48 52 0.076 0.081 0.156 36 83 EU-N
48 52 0.133 0.143 0.276 35 78-80 EU-N
48 52 0.085 0.091 0.177 36 85 EU-S
48 52 0.293 0.313 0.606 44 87 EU-S
48 52 0.747 0.799 1.546 34 87 EU-N
48 52 0.123 0.132 0.256 34 85 EU-S
48 52 0.121 0.130 0.251 35 83-85 EU-S
48 52 0.101 0.108 0.209 42 87 EU-S
48 52 0.124 0.133 0.256 35 85 EU-S
48 52 0.117 0.125 0.243 27 75 EU-N
48 52 0.581 0.622 1.203 29 83 EU-N
48 52 0.187 0.200 0.387 29 77 EU-S
48 52 0.289 0.309 0.598 35 83 EU-S
48 52 0.358 0.383 0.741 42 87 EU-S
48 52 0.595 0.636 1.231 28 87 EU-S
48 52 0.502 0.537 1.038 28 87 EU-S
48 52 0.647 0.692 1.338 34 87 EU-S
395
Table X9 Enantiomer ration in maize cob with husk samples 396
Proportion Residue in
cob with
husk
(-)-BAS
480 F
(+)-BAS
480 F
(-)-BAS
480 F
(+)-BAS
480 F
Sum DALA* Growth
stage
Region
(%) (%) (mg/kg) (mg/kg) (mg/kg) BBCH
25 75 0.001 0.004 0.006 64 85
35 65 0.004 0.007 0.011 17 71
37 63 0.009 0.015 0.025 28 75
40 60 0.004 0.006 0.009 13 71
45 55 0.007 0.009 0.016 30 85
47 53 0.010 0.011 0.021 9 71
49 51 0.010 0.010 0.019 20 75-77
54 46 0.009 0.008 0.017 6 71
397

Establishment of the residue definition for dietary risk assessment
EFSA Journal 2016;14(issue):NNNN 177
Results of analyses of the plant samples, present in the Tables X-X8, show that the applied ratio 398
(51:49) is not maintained. A significant and reproducible increase of the (+) - enantiomer is observed 399
for cereal grains (wheat - 33:6, barley - 32:68 and pea - 42:58) and other parts of the plants (maize 400
plant - 30:70 and cob - 42:48, barley plant - 39:61, wheat plant – 46:54). The ratio is changed slightly 401
in the same direction also for wheat ear (48:52) and kept not changed for pea plants (but only 3 402
samples are analysed). Slightly change in opposite direction was observed in coffee, both in beans and 403
leaves the proportion of (+)- enantiomer decreased to 41.6% and 45.4%, respectively. 404
405
406
Enantiomer ratio in samples of animal origin (goat, rat)(tables X10, X11) 407 The enantiomer ratio in animal tissue and milk samples was determined by chromatography using a 408
chiral column. 409
410
Table X10. Enantiomer ration in samples from BAS 480 F metabolism studies conducted in goat (re-411
extraction extracts) 412
Origin Matrix Previous
studies
Methanol
extract
Present Study
Methanol
exctract
BAS 480 F (-)-BAS 480 F (+)-BAS 480
F
(mg/kg) (%TRR) (% ROI) (% ROI)
Goat (Study
151738)
Urine (Day 7) 0.042 1.4 43.1 56.9
Liver 0.027 1.6 16.7 83.3
Kidney 0.004 1.7 44.0 56.0
Fat 0.005 7.2 47.0 53.0
413
Table X11. Enantiomer ration in samples from BAS 480 F metabolism studies conducted in rat 414
Matrix/Experiment/Sampling
Time
Animal BAS 480
F
Enantiomer
ratios
(-)-BAS
480 F
(+)-
BAS
480 F
(mg/kg) (% TRR) (%
Dose)
(%) (%)
Application solution 51.2 48.8
Plasma F01 4.146 64.1 0.03 29.6 70.4
WxF F02 5.731 71.0 0.07 34.2 65.8
(1h) Mean 31.9 68.1
Liver F01 31.812 65.5 0.98 45.8 54.2
WxF F02 41.557 71.2 1.33 46.4 53.7
(1h) Mean 46.1 53.9
Liver F03 0.918 3.7 0.04 23.9 76.1
DxF F04 0.426 2.2 0.02 19.4 80.6
(48 h) Mean 21.7 78.3
Faeces F03 106.564 20.2 3.20 53.9 46.1
DxF F04 482.697 74.8 6.65 50.1 50.0
(0-24 h) Mean 52.0 48.0
Faeces F03 46.980 3.8 1.91 60.0 40.0
DxF F04 229.748 14.4 9.39 51.3 48.7
(24-48h) mean 55.6 44.4

Establishment of the residue definition for dietary risk assessment
EFSA Journal 2016;14(issue):NNNN 178
415
Results of analyses of the goat matrices (table X10) after administration of a racemic mixture show 416
significant increase of the proportion of (+)-enantiomer to 83% in liver. Observed isomer change in 417
kidney, fat and urine was in the same direction but not so significant, the proportion of (+)- enantiomer 418
was 56%, 53% and 57%, respectively. The increase of the proportion of the positive enantiomer in 419
goat liver was in accordance with the results for liver in rat study – 78% (Table X11). 420
Stereoisomeric composition of residues found in the samples (plant and animal origin) shows a 421
difference compared to the sample used in the toxicological studies (a racemic mixture). In the 422
absence of additional sterioselective toxicological studies, correction factors of 1.3 and 1.7 were 423
derived for cereal grain and liver, respectively in order to address the relevance of stereoisomeric 424
composition change on the consumer dietary risk assessment. These factors take into account the 425
reduction of the (-/+) enantiomer ratio and assuming that the toxicity is attributed to the (+)-426
enantiomer. 427
428
Data gaps 429
Uncertainties of particular relevance for decision making 430
A large number of metabolites contain a hydroxyl group in either the chlorinated or the 431
fluorinated ring structure or in both structures. The position of the hydroxyl group in the 432
ring structure varies between metabolites. For some metabolites the position of the 433
hydroxyl group has not been identified. It is assumed that for the epoxiconazole 434
metabolites the hydroxylation of a ring structure without opening the ring will not increase 435
the toxicity of the metabolite. This assumption is based on a conclusion in an External 436
Scientific Report to EFSA prepared by AGES (2010). It is noted that AGES based this 437
conclusion on data obtained mostly from acute toxicity studies. AGES also noted that 438
there are some compounds were hydroxylation of a ring structure may increase its toxicity 439
(e.g. hydrochinon). Therefore, some uncertainty remains on the applicability to predict the 440
toxicity after short-term or long-term exposure 441
QSAR/RA 442
Exposure, coverage of tox burden, rate of identification in metabolism studies, variability 443
between studies, testing strategy 444
445

Establishment of the residue definition for dietary risk assessment
EFSA Journal 2016;14(issue):NNNN 179
ABBREVIATIONS 446
1N GAP Application rate according to Good Agricultural Practice 447
AAOEL Acute Acceptable Operator Exposure Level 448
ACF atom-centered fragments 449
AD administered dose 450
ADI acceptable daily intake 451
ADME absorption, distribution, metabolism, and excretion 452
AOEL Acceptable operator exposure levels 453
ARfD acute reference dose 454
BBCH Scale describing the phenomenological growth stage of plants 455
CA Chromosomal aberration 456
CF Conversion factor 457
cGAP critical GAP 458
FN false negative 459
FP false positive 460
GAP Good Agricultural Practice 461
HR highest residue 462
HRc Highest residues converted 463
ISS Istituto Superiore di Sanità 464
KOW Octanol-Water Partition Coefficient 465
LOAEL lowest observed adverse effect level 466
LOQ Limit of Quantitation 467
MN Micronucleus 468
MTD maximum tolerated dose 469
MW Molecular weight 470
NOAEL No Observed Adverse Effect Level 471
NTP National Toxicology Program 472
PBI plant-back interval 473

Establishment of the residue definition for dietary risk assessment
EFSA Journal 2016;14(issue):NNNN 180
PHI pre-harvest interval 474
QSAR (Quantitative) structure–activity relationship 475
RPF relative potency factor 476
SA structural alerts 477
STMR supervised trials median residue 478
SVM Support Vector Machines 479
TRR total radioactive residue 480
TTC Threshold of Toxicological Concern 481