Embed Size (px)
Citation preview
GUIDANCE DOCUMENT FOR FUEL BURNING EQUIPMENTS AND AIR POLLUTION CONTROL SYSTEMS
GUIDANCE DOCUMENT FOR FUEL BURNING EQUIPMENTS
AND AIR POLLUTION CONTROL SYSTEMS
Department of Environment
GUIDANCE DOCUMENT FOR FUEL BURNING EQUIPMENTS AND AIR POLLUTION CONTROL SYSTEMS
i
TABLE OF CONTENTS
List of Abbreviations ii
List of Figures iii
List of Tables iv
PAGE
SECTION A Industrial Exhaust / Vent
1. Introduction 1
2. Basic Principal of Exhaust System 1
3. The Design of Exhaust System 3
4. Other Air Pollution Control System 9
SECTION B Boiler
1. Introduction 21
2. Boiler Systems 24
3. Type of Boiler 26
4. Boiler Efficiency 28
SECTION C Furnace
1. Introduction 33
2. Description of Furnace 33
3. Type of Furnace 35
4. Design Criteria for Furnace 37
SECTION D Generator Set
1. Introduction 41
2. Description 41
3. Design Criteria 42
4. Positioning of Chimeny (Exhaust Outlet) 43
5. Additional Mitigation Measures 44
GUIDANCE DOCUMENT FOR FUEL BURNING EQUIPMENTS AND AIR POLLUTION CONTROL SYSTEMS
ii
PAGE
SECTION E Fabric Filter (Baghouse)
1. Introduction 45
2. Descrition of Baghouse 45
3. Type og Bag house Cleaning Techniques 46
4. Design Criteria for Filter Bag 48
5. Design Methodology for Bag Filter 48
6. Instrumentation for Process Control 53
7. Accessories Equipments 53
SECTION F Wet Scrubber
1. Introduction 54
2. Design Criteria for Wet Scrubber 55
3. Design Methodology 55
4. Instrumentation 60
SECTION G Flue Gas Desulfurization (FGD)
1. Introduction 61
2. Operating Principle 61
3. Design Criteria for FGD 62
4. Instrumentation 63
SECTION H Initial Separators And Centrifugal Collectors
1. Introduction 64
2. The Design of a Cyclone 64
3. Instrumentation fro Process Control 69
GUIDANCE DOCUMENT FOR FUEL BURNING EQUIPMENTS AND AIR POLLUTION CONTROL SYSTEMS
iii
PAGE
SECTION I Electrostatic Precipitator
1. Introduction 70
2. Types of Electrostatic Precipitator 70
3. Basic Principle of Electrostatic Precipitator 70
4. The Design of Electrostatic Precipitator 72
5. Calculation Formula 78
6. Review of ESP Design Plan 79
7. Instrumentation 80
SECTION J Spray Booth
1. Introduction 81
2. Design of Spray Booth 82
SECTION K Incinerator
1. Introduction 83
2. Design Consideration 83
3. Performance Monitoring 87
GUIDANCE DOCUMENT FOR FUEL BURNING EQUIPMENTS AND AIR POLLUTION CONTROL SYSTEMS
iv
LIST OF ABBREVIATIONS
APCS Air Pollution Control System ACGIH American Conference of Govermental Industrial Hygienists FTP Fan Total Pressure BPM Best Practicable Means LHV Lower Heating Value HHV Higher Heating Value SF Siegert‘s Factor EAF Electric Arc Furnace SWL Sound Power Level SPL Sound Pressure Level ULSD Ultra Low Sulphur Diesel CSA Cross Sectional Area A/C Air–To–Cloth Ratio HRP VCP Venturi Countercurrent Packed VWC Venturi Wet Cyclone VAW Venturi Air Washer L/G Liquid–to–Gas Ratio LEV GDPC Generalize Pressure Drop Correlation FGD Flue Gas Desulfurisation FSI Furnace Sorbent Injection DSI Duct Sorbent Injection LSD Lime Spray Drying CFB Circulating Fluidized Bed ESP Electrostatic Precipitator USEPA United States Environmental Protection Agency SCA Special Collection Area FPM DRE Destruction and removal efficiency PIC Producti of incomplete combustion SCC Secondary Combustion Chamber PCC Primary Combustion Chamber
GUIDANCE DOCUMENT FOR FUEL BURNING EQUIPMENTS AND AIR POLLUTION CONTROL SYSTEMS
v
LIST OF FIGURES
Figure 1 Exhaust System
Figure 2 Schematic Diagram of a boiler room
Figure 3 Fire tube boiler
Figure 4 Water tube boiler
Figure 5 Schematic Diagram of an Industrial Process Furnace
Figure 6 Schematic Diagram of Arc Furnace
Figure 7 Schematic of Blast Furnace
Figure 8 Basic Oxygen Furnace
Figure 9 Typical generator sets
Figure 10 Example of noise mitigating measures for generator
Figure 11 Positive–Pressure Bag House
Figure 12 Negative–Pressure Bag House
Figure 13 Particle charging
Figure 14 Electrostatic Precipitator
Figure 15 ESP Sectionalization
GUIDANCE DOCUMENT FOR FUEL BURNING EQUIPMENTS AND AIR POLLUTION CONTROL SYSTEMS
vi
LIST OF TABLES
Table 1 Fire tube vs water tube boiler
Table 2 Amount of steam based on heat transfer area
Table 3 Amount of fuel per steam generation
Table 4 Boiler capacity, firing rate and fuel consumption
Table 5 Values for stoiL
stoitr
V
V
,
,
Table 6 Typical values of volumetric heat release rate (qv) in MW/m3
Table 7 Recommended values of burner region heat release rate, qb
Table 8 Schedule of Permissible Sound Levels
Table 9 Noise analysis for the acoustic door
Table 10 Design Criteria for filter bags
Table 11 Air–To–Cloth Ratio and Can Velocity
Table 12 Sequence of Calculation for the Design of Bag Filters
Table 13 Normal emission contain particle of mixed sizes
Table 14 Design criteria for wet scrubber
Table 15 Design parameter and acceptable range of FGD operation
Table 16 Ratios and cyclone type
Table 17 Design criterias for cyclone
Table 18 Sequence of calculation for the design of cyclone
Table 19 Typical Effective Particle Migration Velocity Rates for Various
Applications
Table 20 Low, Normal and High Resistivity
Table 21 Typical range of design parameters for fly ash precipitators.
Table 22 Design considerations for waste incinerators
Table 23 Design guidelines for air pollution control systems
Table 24 Parameters to be monitored continuously
Table 25 Operating guidelines for hazardous waste incinerators
GUIDANCE DOCUMENT FOR FUEL BURNING EQUIPMENTS AND AIR POLLUTION CONTROL SYSTEMS
1
SECTION A : INDUSTRIAL EXHAUST/ VENT
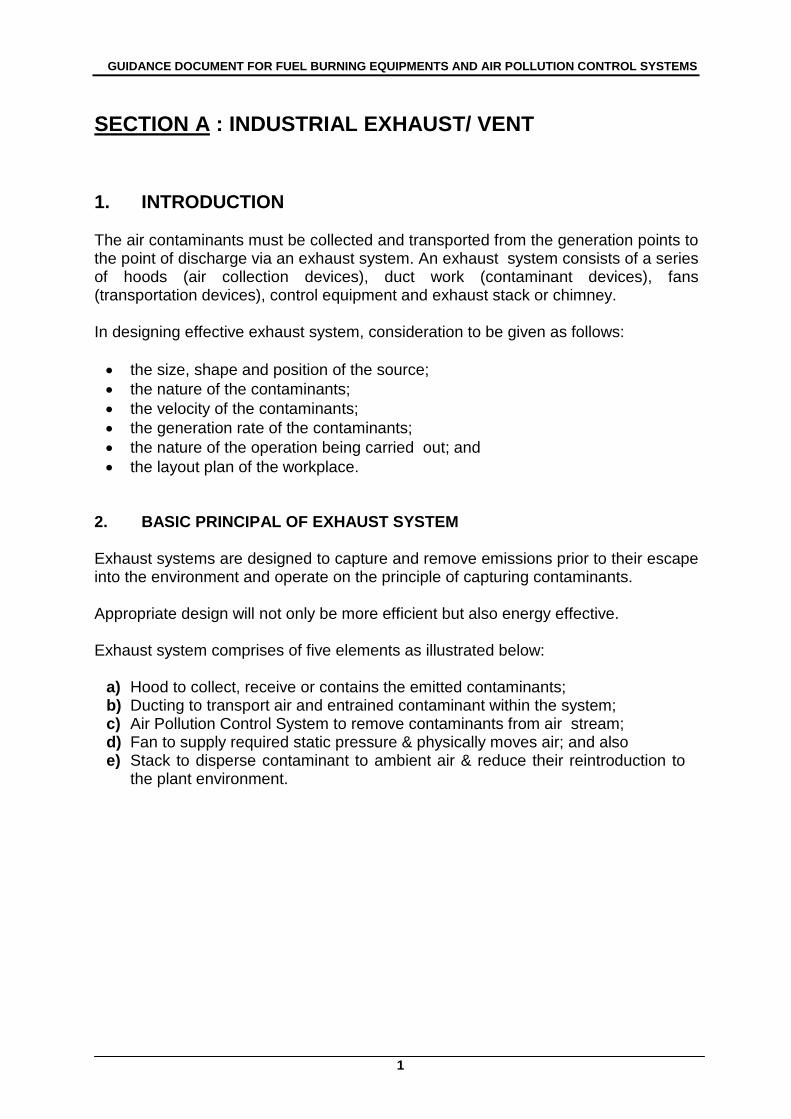
1. INTRODUCTION The air contaminants must be collected and transported from the generation points to the point of discharge via an exhaust system. An exhaust system consists of a series of hoods (air collection devices), duct work (contaminant devices), fans (transportation devices), control equipment and exhaust stack or chimney. In designing effective exhaust system, consideration to be given as follows:
the size, shape and position of the source;
the nature of the contaminants;
the velocity of the contaminants;
the generation rate of the contaminants;
the nature of the operation being carried out; and
the layout plan of the workplace.
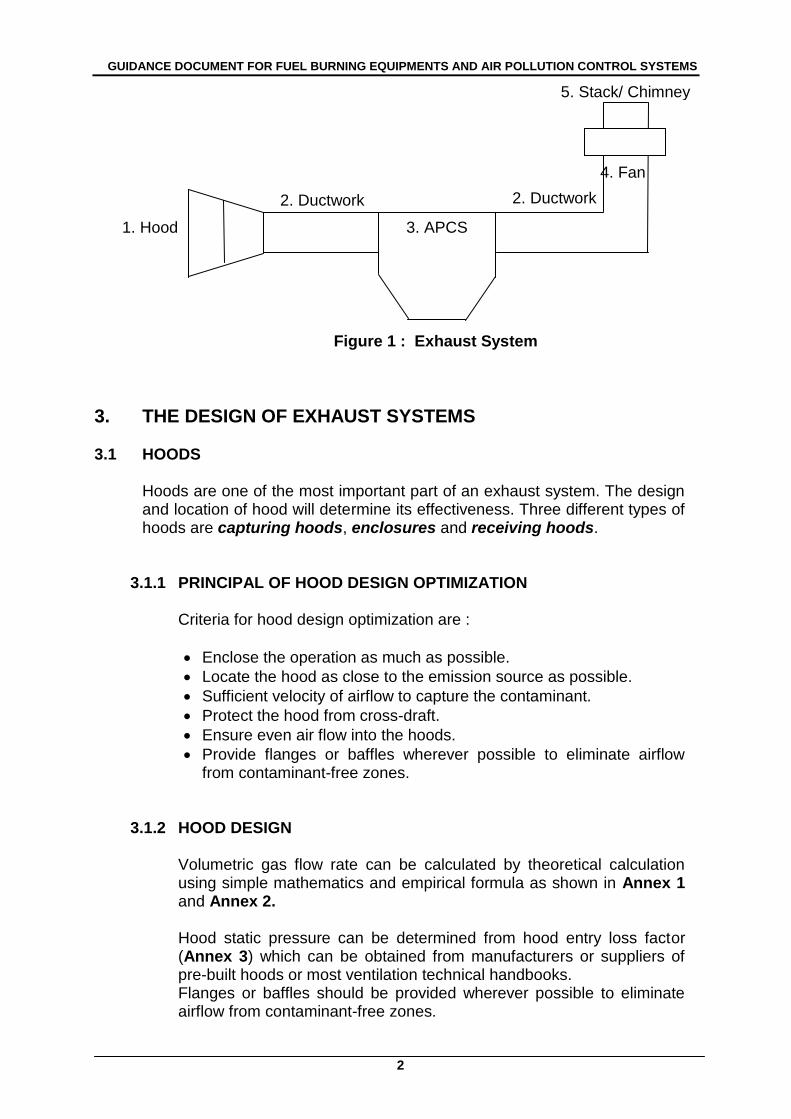
2. BASIC PRINCIPAL OF EXHAUST SYSTEM Exhaust systems are designed to capture and remove emissions prior to their escape into the environment and operate on the principle of capturing contaminants. Appropriate design will not only be more efficient but also energy effective. Exhaust system comprises of five elements as illustrated below:
a) Hood to collect, receive or contains the emitted contaminants; b) Ducting to transport air and entrained contaminant within the system; c) Air Pollution Control System to remove contaminants from air stream; d) Fan to supply required static pressure & physically moves air; and also e) Stack to disperse contaminant to ambient air & reduce their reintroduction to
the plant environment.
GUIDANCE DOCUMENT FOR FUEL BURNING EQUIPMENTS AND AIR POLLUTION CONTROL SYSTEMS
2
Dd Duct
Figure 1 : Exhaust System
3. THE DESIGN OF EXHAUST SYSTEMS 3.1 HOODS
Hoods are one of the most important part of an exhaust system. The design and location of hood will determine its effectiveness. Three different types of hoods are capturing hoods, enclosures and receiving hoods.
3.1.1 PRINCIPAL OF HOOD DESIGN OPTIMIZATION
Criteria for hood design optimization are :
Enclose the operation as much as possible.
Locate the hood as close to the emission source as possible.
Sufficient velocity of airflow to capture the contaminant.
Protect the hood from cross-draft.
Ensure even air flow into the hoods.
Provide flanges or baffles wherever possible to eliminate airflow from contaminant-free zones.
3.1.2 HOOD DESIGN
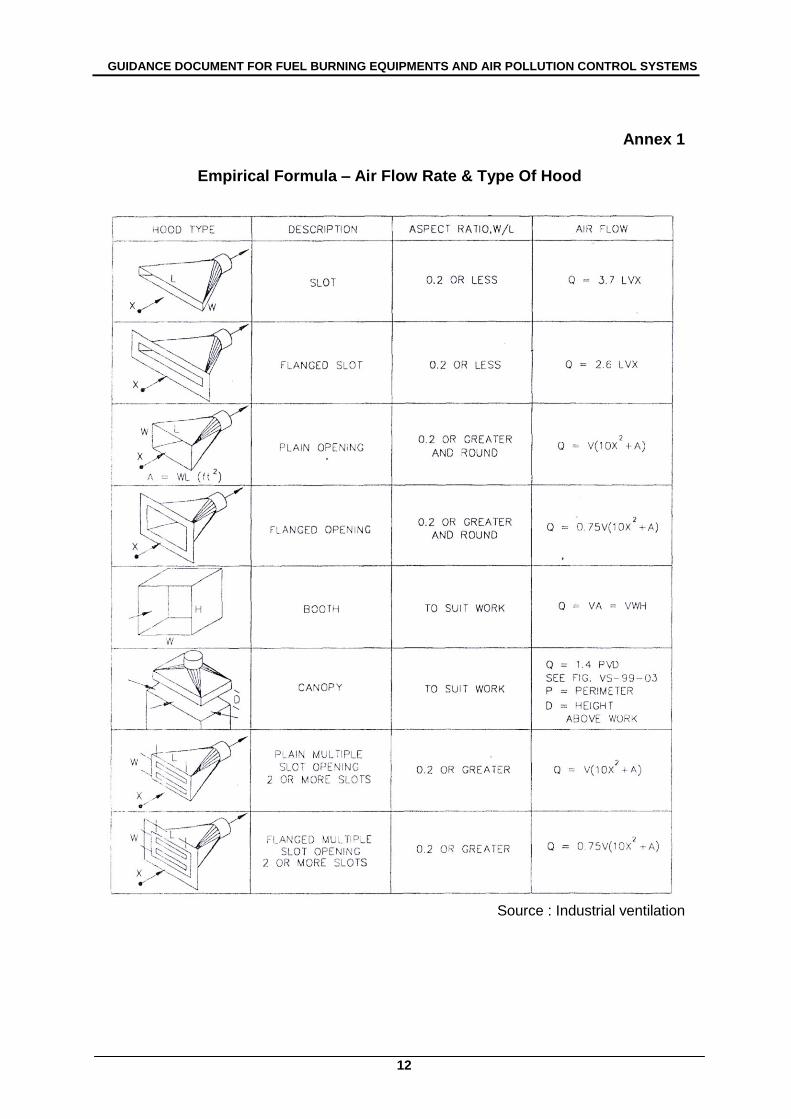
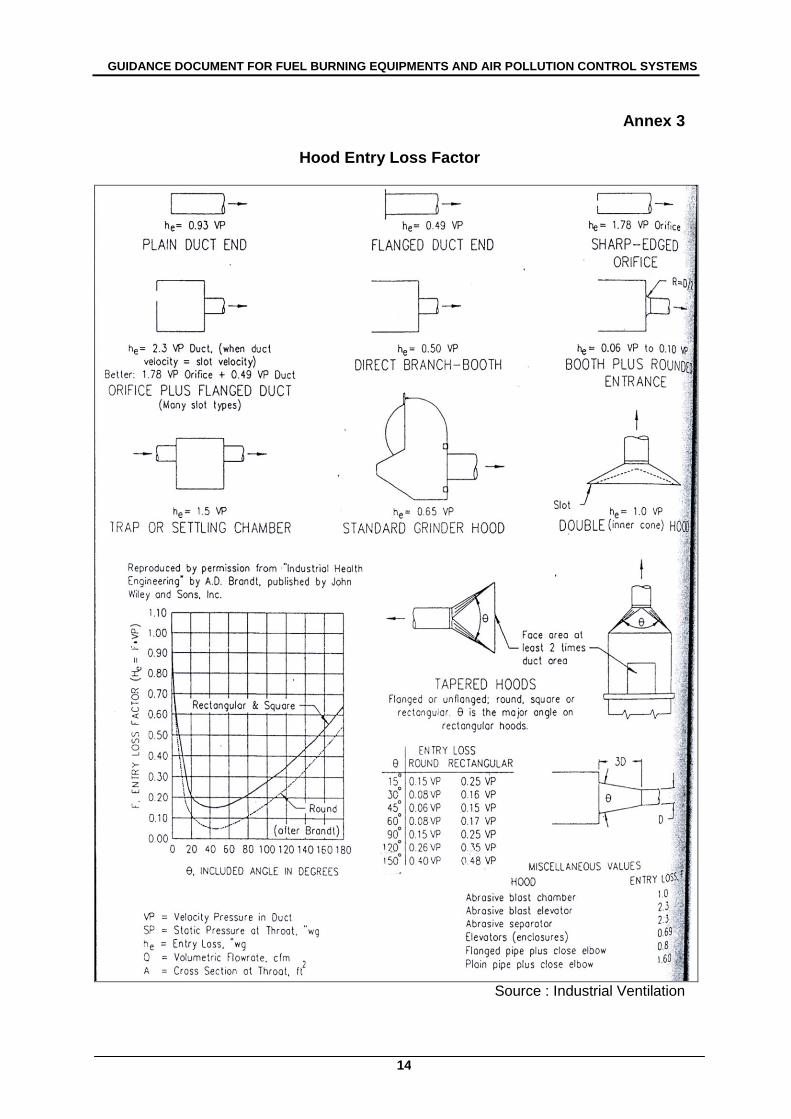
Volumetric gas flow rate can be calculated by theoretical calculation using simple mathematics and empirical formula as shown in Annex 1 and Annex 2. Hood static pressure can be determined from hood entry loss factor (Annex 3) which can be obtained from manufacturers or suppliers of pre-built hoods or most ventilation technical handbooks. Flanges or baffles should be provided wherever possible to eliminate airflow from contaminant-free zones.
2. Ductwork
4. Fan
2. Ductwork
1. Hood
5. Stack/ Chimney
3. APCS
GUIDANCE DOCUMENT FOR FUEL BURNING EQUIPMENTS AND AIR POLLUTION CONTROL SYSTEMS
3
The flange width can be calculated as follows:
DXWidthFlange 21
Where : X = distance to desired capture point D = duct diameter.
3.1.3 SPECIFIC HOOD DESIGN
Specific hood design and operating criteria can be referred in the American Conference of Governmental Industrial Hygienists (ACGIH) Industrial Ventilation Manual.
3.1.4 HOOD CONSTRUCTION
Hood should be at least 2 gauges heavier than the connecting duct, free of sharp edges and bends, and reinforced for stiffness. A tapered transition piece between the hood and the exhaust duct should be provided if possible. For cases where air temperature and corrosion problems are not severe, galvanized sheet metal can be used to construct hood. For high temperature of up to 480 0C and over 480 0C, black iron and stainless steel could be used respectively. Corrosive gases and vapors, corrosive resistant metal, polyvinyl chloride (PVC) or others plastic and coatings may be used. A real-time hood performance monitor (e.g. a static pressure tap with manometer) should be provided if inadequate hood performance could result in hazardous conditions for person using the hood.
3.2 DUCTING SYSTEM
This equipment of the exhaust system should be located to permit, as far as possible, a symmetrical layout of pipes about the central fan, to minimize inequality in airflow resistance in the branches. The shortest lengths of straight ductwork should be used; long runs of small diameter duct should be avoided except when transport of dust required. All unnecessary elbows, tees or entries should be avoided.
Exhaust duct takeoff from the hood should, wherever possible, be located in the line of normal contaminant travel. Ductwork should be located so that it
GUIDANCE DOCUMENT FOR FUEL BURNING EQUIPMENTS AND AIR POLLUTION CONTROL SYSTEMS
4
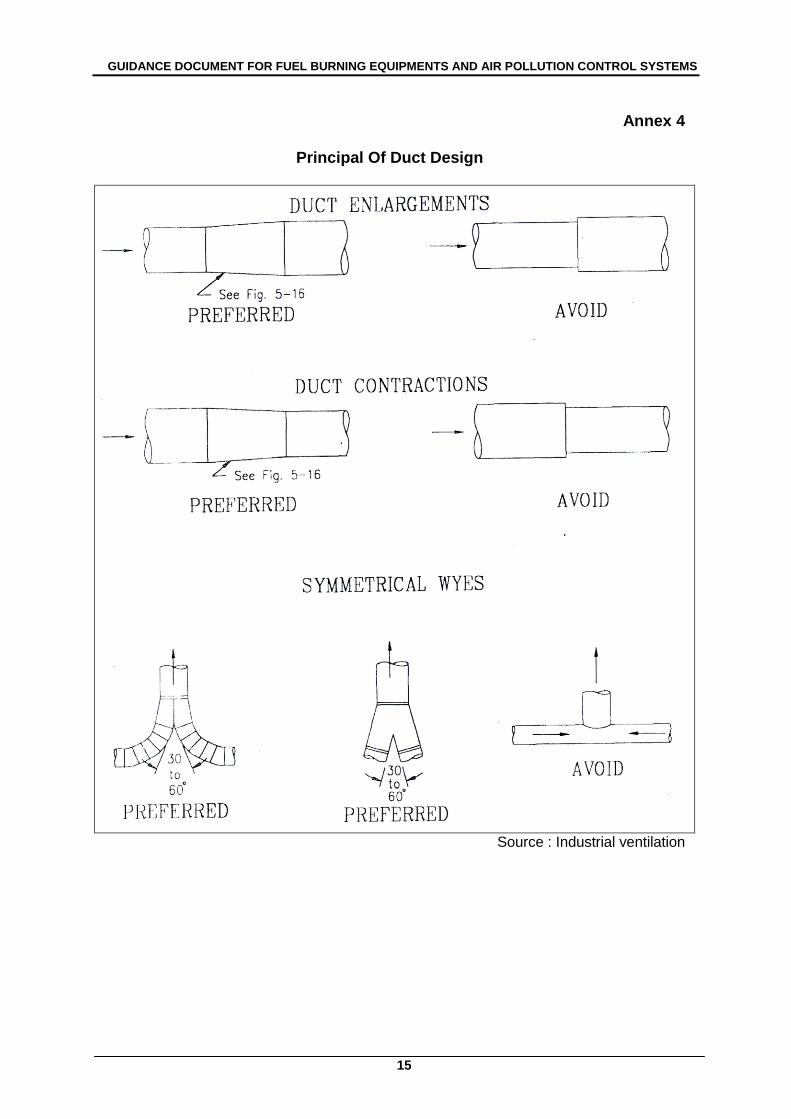
is readily accessible for inspection, cleaning and repairs; duct should be protected against external damage. For large and shallow hoods, multiple takeoffs may be used to attain the desired distributions of exhaust airflow. Interior baffles or filter banks should also be used to attain satisfactory air distribution. Principal of duct design are appended in Annex 4.
3.2.1 DUCT CONSTRUCTION
All exhaust system should be constructed of new materials and installed in a permanent and workmanlike manner. Duct supports of sufficient capacity should be provided to carry the weight of the system. The interior of all ducts should be smooth and free from obstructions, especially at joint, elbows, and bends. Round duct should be used for the construction of the exhaust system. Retangular ducts, if used, should be as square as possible and be two gauges heavier than round ducts and reinforced to prevent collapsing at any static pressure possible in the duct. Duct should be constructed of galvanized sheet steel riveted and sealed, or black iron welded, flanged or gasketed, except where corrosive gases or mist or other factors render such metals impractical. Galvanized construction is not recommended for temperatures above 200 0C. For corrosive conditions, corrosive resistant metals, PVC or other plastic or coating may be used for duct construction. The actual metal thickness for round industrial ducts will vary with the diameter of the duct, the concentration and abrasiveness of the contaminants, static pressure, reinforcement, and span between supports.
3.2.2 DUCT VELOCITY
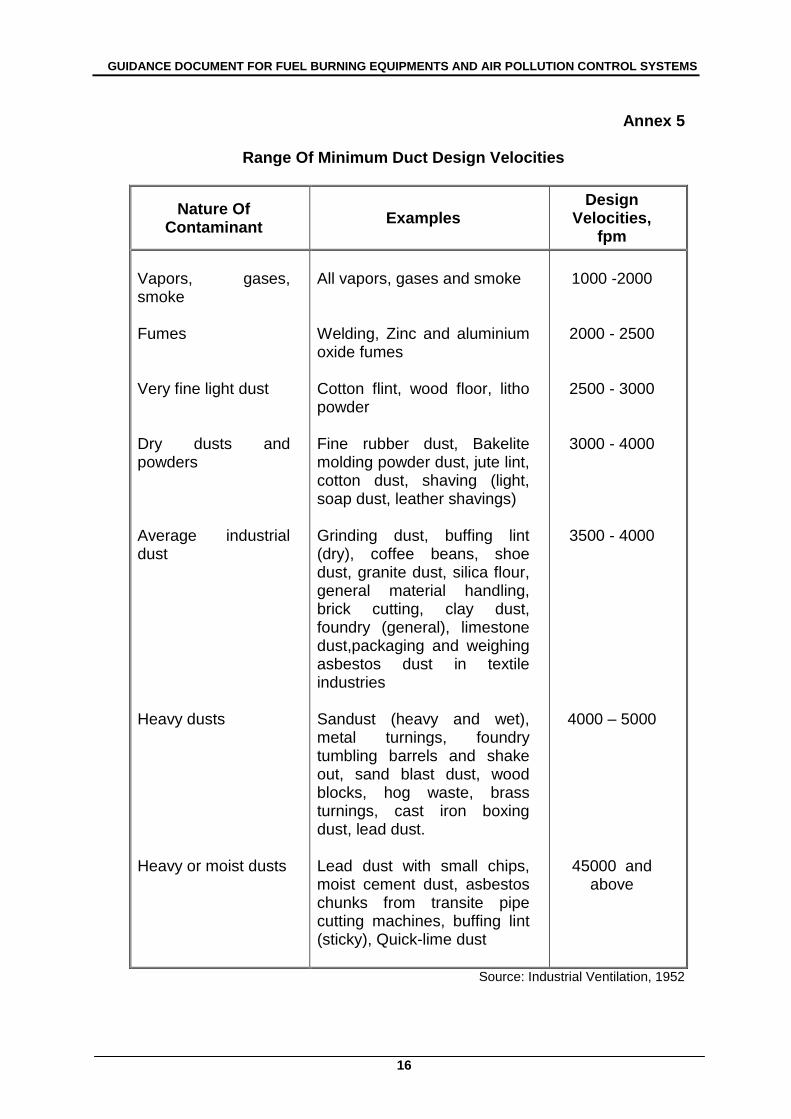
Duct velocities should be sufficient to prevent the settling of dry aerosols. The recommended minimum duct velocities are appended in Annex 5. When condensable vapors are to be exhausted, the effects of cold temperatures on the exhaust duct should be considered and provisions should be made to prevent or clean/remove unwanted or controlled condensation.
GUIDANCE DOCUMENT FOR FUEL BURNING EQUIPMENTS AND AIR POLLUTION CONTROL SYSTEMS
5
3.2.3 BRANCHES, ELBOWS AND TRANSITIONS
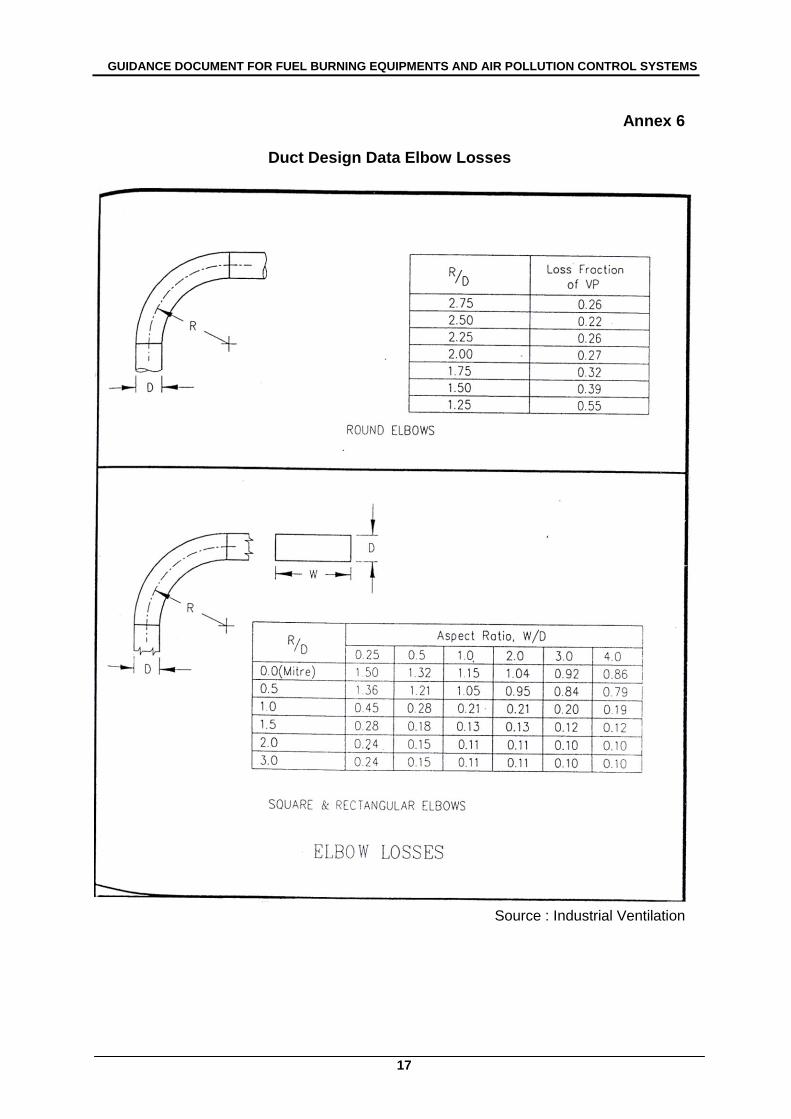
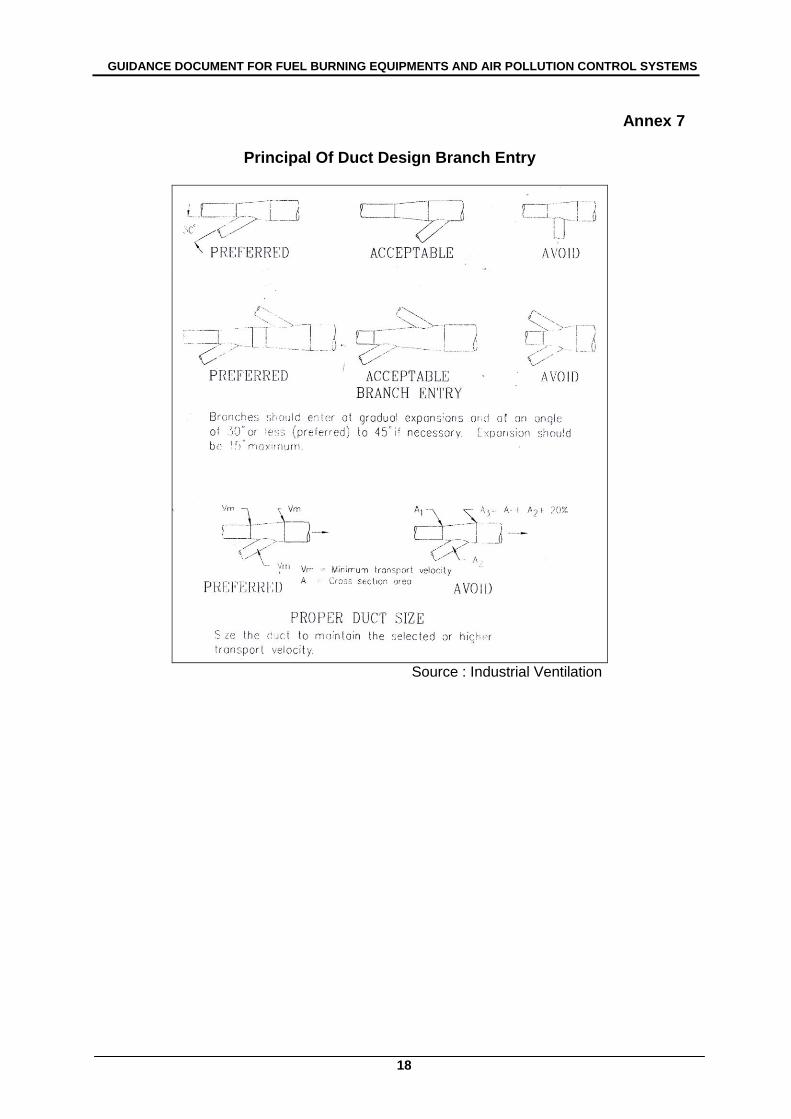
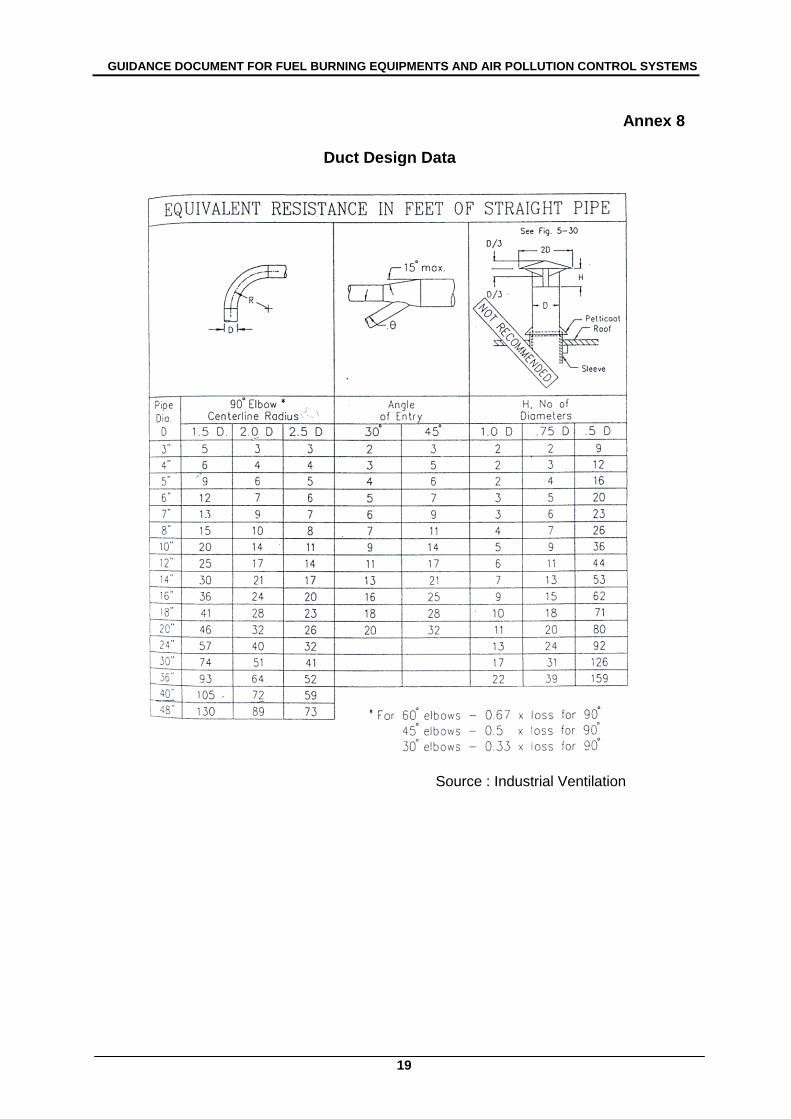
All branches should enter the main duct at gradual expansions at an angle not exceeding 45° and preferably 30° or less. Connections should be to the top or side of the main and not directly opposite each other. Elbows and bends should be at minimum of 2 gauges heavier than straight length ducts of equal diameter and have a centerline radius of curvature of at least 2 and preferably 2.5 times the pipe diameter, Annex 6, Annex 7 & Annex 8. Transitions in mains and sub-mains should be tapered in duct enlargement and contraction. The taper should be at least 5 units long for each unit change in diameter.
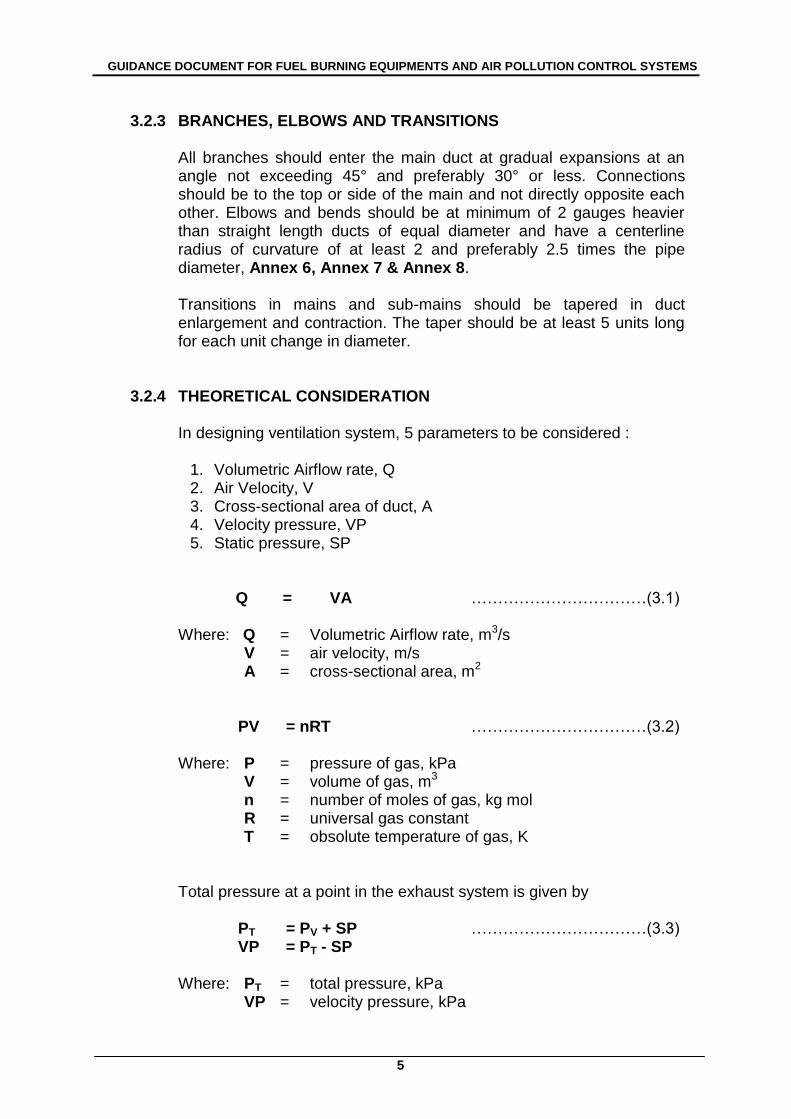
3.2.4 THEORETICAL CONSIDERATION
In designing ventilation system, 5 parameters to be considered :
1. Volumetric Airflow rate, Q 2. Air Velocity, V 3. Cross-sectional area of duct, A 4. Velocity pressure, VP 5. Static pressure, SP
Q = VA ……………………………(3.1)
Where: Q = Volumetric Airflow rate, m3/s V = air velocity, m/s A = cross-sectional area, m2
PV = nRT ……………………………(3.2)
Where: P = pressure of gas, kPa V = volume of gas, m3 n = number of moles of gas, kg mol R = universal gas constant T = obsolute temperature of gas, K
Total pressure at a point in the exhaust system is given by PT = PV + SP ……………………………(3.3) VP = PT - SP
Where: PT = total pressure, kPa
VP = velocity pressure, kPa
GUIDANCE DOCUMENT FOR FUEL BURNING EQUIPMENTS AND AIR POLLUTION CONTROL SYSTEMS
6
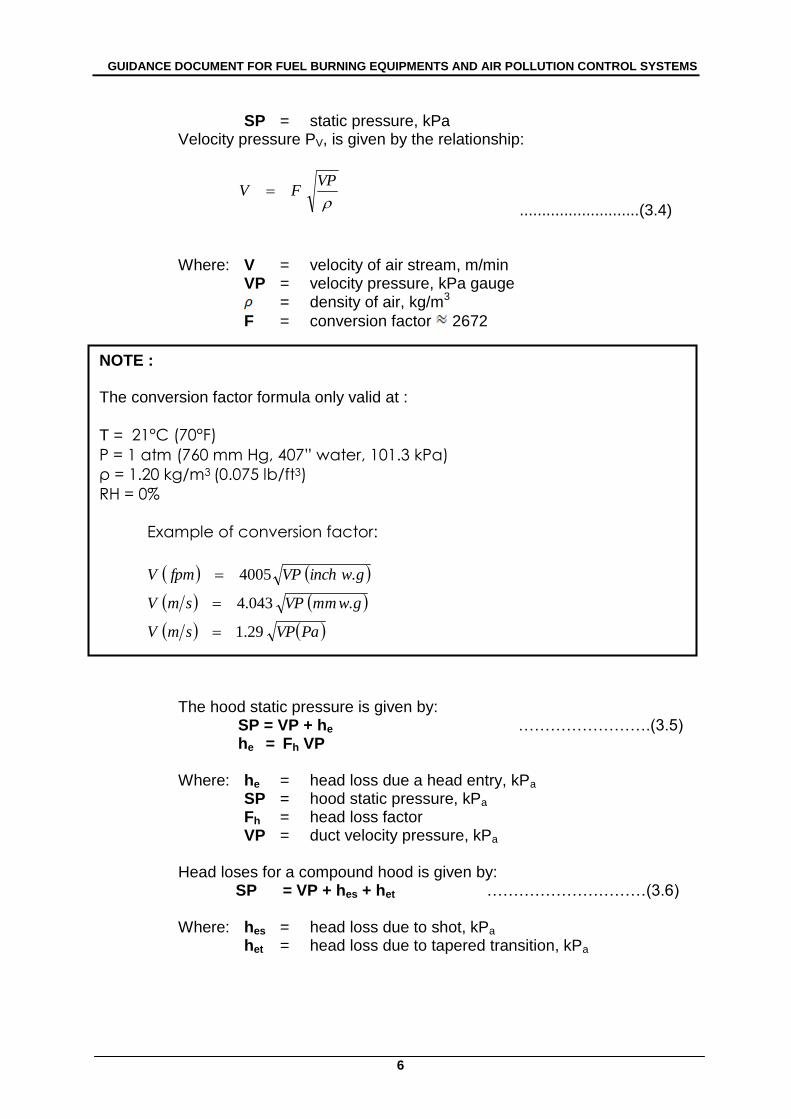
SP = static pressure, kPa Velocity pressure PV, is given by the relationship:
VPFV
...........................(3.4)
Where: V = velocity of air stream, m/min VP = velocity pressure, kPa gauge
= density of air, kg/m3
F = conversion factor 2672
The hood static pressure is given by: SP = VP + he …………………….(3.5)
he = Fh VP
Where: he = head loss due a head entry, kPa
SP = hood static pressure, kPa
Fh = head loss factor VP = duct velocity pressure, kPa
Head loses for a compound hood is given by:
SP = VP + hes + het …………………………(3.6)
Where: hes = head loss due to shot, kPa het = head loss due to tapered transition, kPa
NOTE : The conversion factor formula only valid at :
T = 21°C (70°F)
P = 1 atm (760 mm Hg, 407” water, 101.3 kPa)
ρ = 1.20 kg/m3 (0.075 lb/ft3)
RH = 0%
Example of conversion factor:
PaVPsmV
gwmmVPsmV
gwinchVPfpmV
29.1
.043.4
.4005
GUIDANCE DOCUMENT FOR FUEL BURNING EQUIPMENTS AND AIR POLLUTION CONTROL SYSTEMS
7
3.3 AIR POLLUTION CONTROL SYSTEM (APCS)
APCS should be compatible with all the components of the local exhaust ventilation system. Collection rate, capacity, and resistance of the air cleaner should remain as constant as possible throughout its daily operating cycle and be nearly independent of entering dust, fume, or vapor concentration. Detail design can be referred in the following section.
3.4 EXHAUST FAN
Fans are the main component of exhaust ventilation systems. An appropriate size and type of fan is necessary for effective ventilation system. As a rule of thumb, the fan should be located at a point of at least 6 equivalent straight duct diameters before inlet and 3 equivalent straight duct diameters after the outlet before any bend or fittings. Where this is impracticable due to space constraints, the associated pressure loss must be accounted for. Fan selection should consider long-term contaminant effects on the fan and the fan wheel. Where severe conditions of abrasion or corrosion are present, special linings or metals could be used in fan construction. Fan blades might need to be cleaned periodically. Fan serving systems with air cleaners or plenum design should be selected such that the system operating point (interception of airflow rate, Q and fan total pressure, FTP lies on a steep forward portion of the fan characteristic curve.
3.4.1 FAN CAPACITY AND STATIC PRESSURE
Static pressure losses through the exhaust system is important to determine the fan capacity
The fan must have a capacity not less than the sum of originally estimated airflow rates (using Blast Gate Adjustment Method) or the corrected flow rates (using Velocity Pressure Method) for all the exhaust hoods.
A fan of the proper size and operating speed should be selected from the rating table published by the fan manufacturer based on the airflow rate and static pressure required or as estimated by design.
Fan Total Pressure, FTP
FTP = TPoutlet - TPinlet
GUIDANCE DOCUMENT FOR FUEL BURNING EQUIPMENTS AND AIR POLLUTION CONTROL SYSTEMS
8
= (SPoutlet + VPoutlet) - (SPinlet + VPinlet) ……………………. (3.7)
Fan Static Pressure, FSP FSP = FTP - VPoutlet = TPoutlet - TPinlet - VPoutlet
Since TP = (SP+VP), then FSP = (SPoutlet + VPoutlet) – (SPinlet + VPinlet) - VPoutlet FSP = SPoutlet - SPinlet - VPinlet ………………….(3.8)
Keep in mind: VP = always positive (+Ve) SPinlet = usually negative (-Ve)
SPoutlet = +Ve 3.5 STACK/CHIMNEY/EXHAUST
A good stack design include the existing environment, aesthetics, building dimension, types of emission sources, the local meteorology and topography. A stack height derived for a single small source may not sufficient if emissions from that source are increased. Also, in calculating a stack height for two adjacent stacks, the emissions should be looked upon as though they were from one stack. For example, if there are two boilers which will have adjacent stacks, the stack height calculation should be based on total emission from both boilers. All gaseous wastes, smoke and dust should be adequately captured using the best practicable means (BPM) and discharged to the atmosphere through suitable stack or chimneys. Stack height and its location are the most critical factor to achieve maximum dispersion to meet Ambient Air Quality Guidelines. (a) Stack Height
In determining stack height, there are 3 documents can be referred: 1. Third Edition of the 1956 Clean Air Act Memorandum 2. Guideline for Determination of Good Engineering Practice Stack
Height (Technical Support Document For The Stack Height Regulations)
3. Air Dispersion Modelling
GUIDANCE DOCUMENT FOR FUEL BURNING EQUIPMENTS AND AIR POLLUTION CONTROL SYSTEMS
9
As a general guideline a minimum requirement of the stack height should be at least 3 meters above the highest structure within vicinity of the stack.
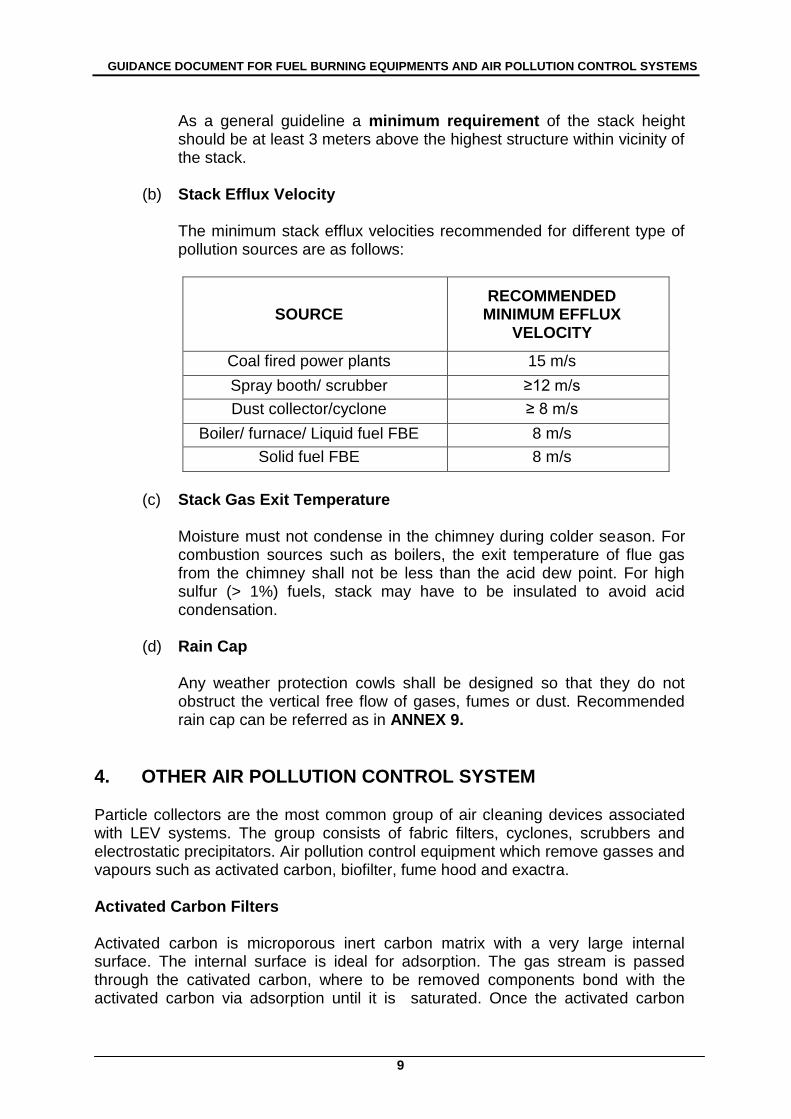
(b) Stack Efflux Velocity
The minimum stack efflux velocities recommended for different type of pollution sources are as follows:
SOURCE RECOMMENDED
MINIMUM EFFLUX VELOCITY
Coal fired power plants 15 m/s
Spray booth/ scrubber ≥12 m/s
Dust collector/cyclone ≥ 8 m/s
Boiler/ furnace/ Liquid fuel FBE 8 m/s
Solid fuel FBE 8 m/s
(c) Stack Gas Exit Temperature
Moisture must not condense in the chimney during colder season. For combustion sources such as boilers, the exit temperature of flue gas from the chimney shall not be less than the acid dew point. For high sulfur (> 1%) fuels, stack may have to be insulated to avoid acid condensation.
(d) Rain Cap
Any weather protection cowls shall be designed so that they do not obstruct the vertical free flow of gases, fumes or dust. Recommended rain cap can be referred as in ANNEX 9.
4. OTHER AIR POLLUTION CONTROL SYSTEM Particle collectors are the most common group of air cleaning devices associated with LEV systems. The group consists of fabric filters, cyclones, scrubbers and electrostatic precipitators. Air pollution control equipment which remove gasses and vapours such as activated carbon, biofilter, fume hood and exactra. Activated Carbon Filters Activated carbon is microporous inert carbon matrix with a very large internal surface. The internal surface is ideal for adsorption. The gas stream is passed through the cativated carbon, where to be removed components bond with the activated carbon via adsorption until it is saturated. Once the activated carbon
GUIDANCE DOCUMENT FOR FUEL BURNING EQUIPMENTS AND AIR POLLUTION CONTROL SYSTEMS
10
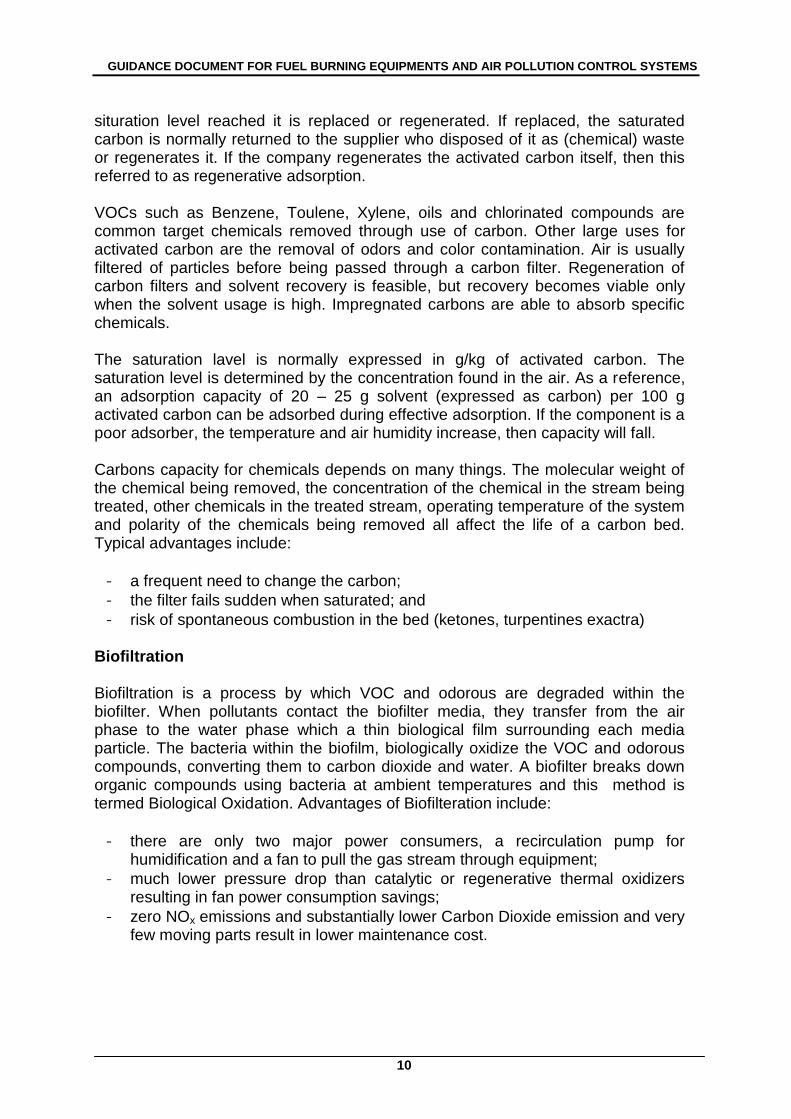
situration level reached it is replaced or regenerated. If replaced, the saturated carbon is normally returned to the supplier who disposed of it as (chemical) waste or regenerates it. If the company regenerates the activated carbon itself, then this referred to as regenerative adsorption. VOCs such as Benzene, Toulene, Xylene, oils and chlorinated compounds are common target chemicals removed through use of carbon. Other large uses for activated carbon are the removal of odors and color contamination. Air is usually filtered of particles before being passed through a carbon filter. Regeneration of carbon filters and solvent recovery is feasible, but recovery becomes viable only when the solvent usage is high. Impregnated carbons are able to absorb specific chemicals. The saturation lavel is normally expressed in g/kg of activated carbon. The saturation level is determined by the concentration found in the air. As a reference, an adsorption capacity of 20 – 25 g solvent (expressed as carbon) per 100 g activated carbon can be adsorbed during effective adsorption. If the component is a poor adsorber, the temperature and air humidity increase, then capacity will fall. Carbons capacity for chemicals depends on many things. The molecular weight of the chemical being removed, the concentration of the chemical in the stream being treated, other chemicals in the treated stream, operating temperature of the system and polarity of the chemicals being removed all affect the life of a carbon bed. Typical advantages include:
- a frequent need to change the carbon;
- the filter fails sudden when saturated; and
- risk of spontaneous combustion in the bed (ketones, turpentines exactra) Biofiltration Biofiltration is a process by which VOC and odorous are degraded within the biofilter. When pollutants contact the biofilter media, they transfer from the air phase to the water phase which a thin biological film surrounding each media particle. The bacteria within the biofilm, biologically oxidize the VOC and odorous compounds, converting them to carbon dioxide and water. A biofilter breaks down organic compounds using bacteria at ambient temperatures and this method is termed Biological Oxidation. Advantages of Biofilteration include:
- there are only two major power consumers, a recirculation pump for humidification and a fan to pull the gas stream through equipment;
- much lower pressure drop than catalytic or regenerative thermal oxidizers resulting in fan power consumption savings;
- zero NOx emissions and substantially lower Carbon Dioxide emission and very few moving parts result in lower maintenance cost.

GUIDANCE DOCUMENT FOR FUEL BURNING EQUIPMENTS AND AIR POLLUTION CONTROL SYSTEMS
11
Fume Hood
Fume hood or fume cupboard is a type of local ventilation device that design to limit exposure to hazardous or toxic fumes, vapours or dust. Two main types exist, ducted and recirculating (aka ductless). Fume typically protect only the user, and most commonly used in laboratories where hazardous or noxious chemicals are released during testing, research, development or teaching. They are also used in industrial applications or other activities where hazardous or noxious vapors, gases or dusts are generated or released. Most fume hoods are design to connect to exhaust system that expel the air directly to the exterior of a building. Large quantities of energy are required to run that exhaust the air, and to heat, cool, filter, control and move the air that will replace the air exhausted.
GUIDANCE DOCUMENT FOR FUEL BURNING EQUIPMENTS AND AIR POLLUTION CONTROL SYSTEMS
12
Annex 1
Empirical Formula – Air Flow Rate & Type Of Hood
Source : Industrial ventilation
GUIDANCE DOCUMENT FOR FUEL BURNING EQUIPMENTS AND AIR POLLUTION CONTROL SYSTEMS
13
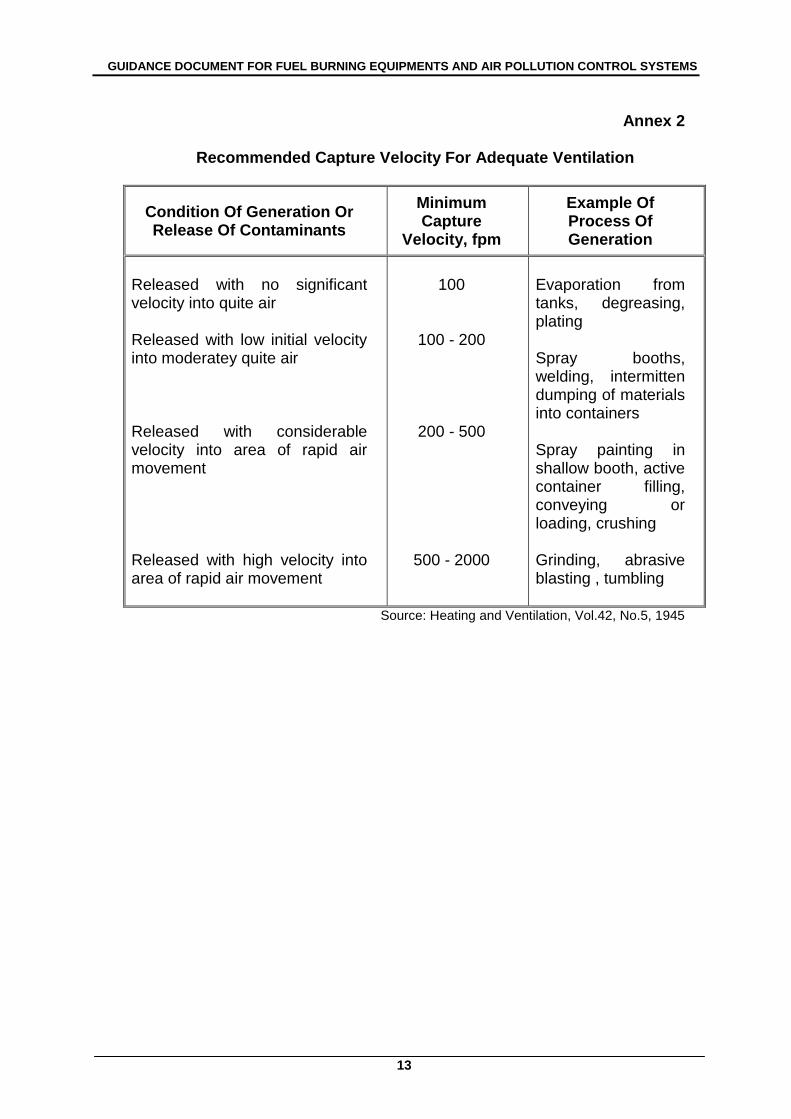
Annex 2
Recommended Capture Velocity For Adequate Ventilation
Condition Of Generation Or Release Of Contaminants
Minimum Capture
Velocity, fpm
Example Of Process Of Generation
Released with no significant velocity into quite air Released with low initial velocity into moderatey quite air Released with considerable velocity into area of rapid air movement Released with high velocity into area of rapid air movement
100
100 - 200
200 - 500
500 - 2000
Evaporation from tanks, degreasing, plating Spray booths, welding, intermitten dumping of materials into containers Spray painting in shallow booth, active container filling, conveying or loading, crushing Grinding, abrasive blasting , tumbling
Source: Heating and Ventilation, Vol.42, No.5, 1945
GUIDANCE DOCUMENT FOR FUEL BURNING EQUIPMENTS AND AIR POLLUTION CONTROL SYSTEMS
14
Annex 3
Hood Entry Loss Factor
Source : Industrial Ventilation
GUIDANCE DOCUMENT FOR FUEL BURNING EQUIPMENTS AND AIR POLLUTION CONTROL SYSTEMS
15
Annex 4
Principal Of Duct Design
Source : Industrial ventilation
GUIDANCE DOCUMENT FOR FUEL BURNING EQUIPMENTS AND AIR POLLUTION CONTROL SYSTEMS
16
Annex 5 Range Of Minimum Duct Design Velocities
Nature Of Contaminant
Examples Design
Velocities, fpm
Vapors, gases, smoke Fumes Very fine light dust Dry dusts and powders Average industrial dust Heavy dusts Heavy or moist dusts
All vapors, gases and smoke Welding, Zinc and aluminium oxide fumes Cotton flint, wood floor, litho powder Fine rubber dust, Bakelite molding powder dust, jute lint, cotton dust, shaving (light, soap dust, leather shavings) Grinding dust, buffing lint (dry), coffee beans, shoe dust, granite dust, silica flour, general material handling, brick cutting, clay dust, foundry (general), limestone dust,packaging and weighing asbestos dust in textile industries Sandust (heavy and wet), metal turnings, foundry tumbling barrels and shake out, sand blast dust, wood blocks, hog waste, brass turnings, cast iron boxing dust, lead dust. Lead dust with small chips, moist cement dust, asbestos chunks from transite pipe cutting machines, buffing lint (sticky), Quick-lime dust
1000 -2000
2000 - 2500
2500 - 3000
3000 - 4000
3500 - 4000
4000 – 5000
45000 and above
Source: Industrial Ventilation, 1952
GUIDANCE DOCUMENT FOR FUEL BURNING EQUIPMENTS AND AIR POLLUTION CONTROL SYSTEMS
17
Annex 6
Duct Design Data Elbow Losses
Source : Industrial Ventilation
GUIDANCE DOCUMENT FOR FUEL BURNING EQUIPMENTS AND AIR POLLUTION CONTROL SYSTEMS
18
Annex 7
Principal Of Duct Design Branch Entry
Source : Industrial Ventilation
GUIDANCE DOCUMENT FOR FUEL BURNING EQUIPMENTS AND AIR POLLUTION CONTROL SYSTEMS
19
Annex 8
Duct Design Data
Source : Industrial Ventilation
GUIDANCE DOCUMENT FOR FUEL BURNING EQUIPMENTS AND AIR POLLUTION CONTROL SYSTEMS
20
Annex 9
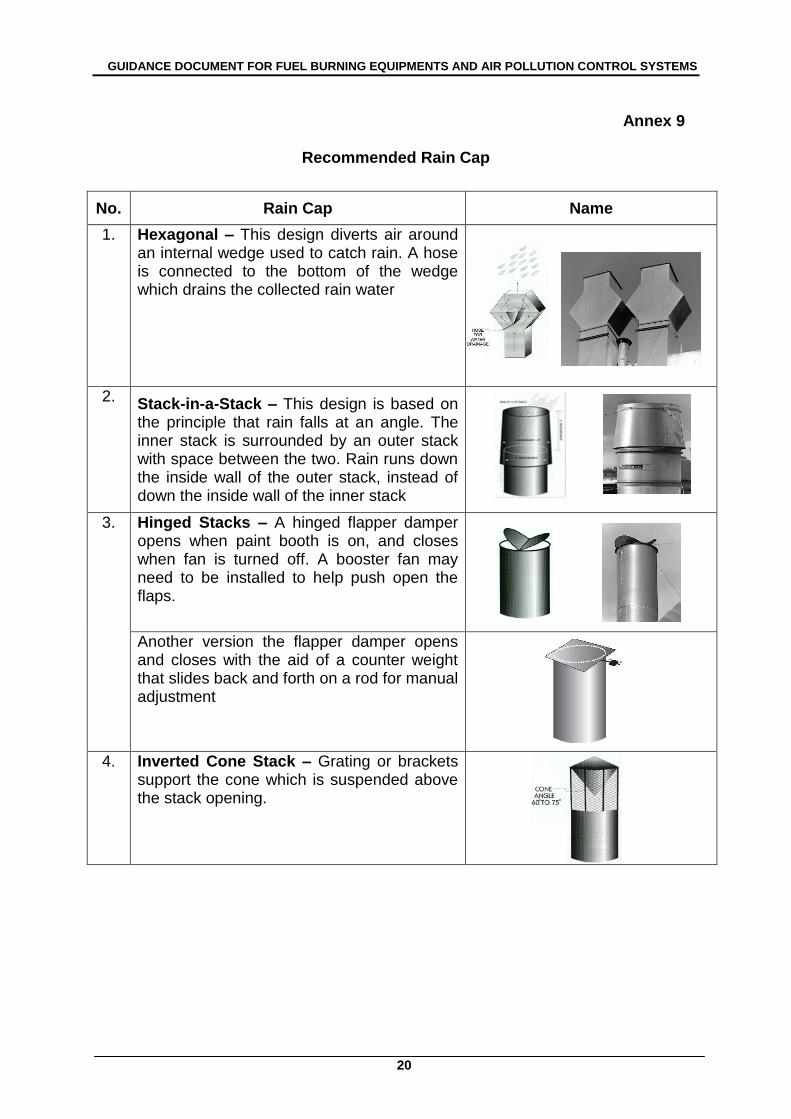
Recommended Rain Cap
No. Rain Cap Name
1. Hexagonal – This design diverts air around an internal wedge used to catch rain. A hose is connected to the bottom of the wedge which drains the collected rain water
2. Stack-in-a-Stack – This design is based on the principle that rain falls at an angle. The inner stack is surrounded by an outer stack with space between the two. Rain runs down the inside wall of the outer stack, instead of down the inside wall of the inner stack
3. Hinged Stacks – A hinged flapper damper opens when paint booth is on, and closes when fan is turned off. A booster fan may need to be installed to help push open the flaps.
Another version the flapper damper opens and closes with the aid of a counter weight that slides back and forth on a rod for manual adjustment
4. Inverted Cone Stack – Grating or brackets support the cone which is suspended above the stack opening.
GUIDANCE DOCUMENT FOR FUEL BURNING EQUIPMENTS AND AIR POLLUTION CONTROL SYSTEMS
21
SECTION B : BOILER
1. INTRODUCTION Boiler is an enclosed vessel that provides a means for combustion heat to be transferred into water until it becomes heated water or steam. The hot water or steam under pressure is then usable to produce energy in a turbine and for transferring the heat to a process such as ‗cooking‘ the fresh fruit bunch in palm oil mills. Water is a useful and cheap medium for transfering heat to a process. When water is boiled into steam its volume increases about 1600 times, producing a force that is almost as explosive as gunpowder. This excessive forcce can be transferred into electrical energy by mean of a turbine. As water easily evaporated by transfering energy into it, it can also condense back into liquid water when the energy is transferred out by heat removal in the turbine and condenser. The hot water can be recycled back into the boiler to make the whole process economical. In the case of palm oil mill, the low pressure saturated steam after the turbine is used to steam the fresh fruit bunch and it is impossible to recover the water to be returned back to the boiler. Some of the steam is absorbed into the fruitlets, and the rest is lost due to open system in the fruit ‗cooker‘. Parts of Boilers Boilers equipment consists of drums, shell, headers, tubes, baffles and economizer. 1.1 Drums, shell and headers
Boiler drums, shells or header are used to collect steam or hot water generated in the boiler and distributes it as necessary within the boiler tubes. These components must be strong enough to contain the steam that is generated and to mechanically hold the boiler tubes as they expand and contract with changes temperature. The shells of fire tubes boilers may be reinforced by the use of stays to hold the boiler heads in place. These components are generally fabricated with welded seams and connections.
1.2 Boiler Tubes
Boiler tubes carry water, steam, or flue gases through he boiler. Boiler tubes are installed by expanding or welding them into seats in the drums or headers. The expander is slipped into the end of the tube; it consists of a tapered pin which fits into a cage containing small rollers. The pin is turned with a wrench or motor, forcing the rollers out against the tube and simultaneously moving into the tube.
GUIDANCE DOCUMENT FOR FUEL BURNING EQUIPMENTS AND AIR POLLUTION CONTROL SYSTEMS
22
1.3 Baffles
Baffles are thin walls or partitions installed in water tube boilers to direct the flow of gases over the heating surface in the desired manner. The number and position of baffles have an effect on boiler efficiency. A leaking baffle permits gases to short circuit through the boiler. Heat which should have been absorbed by the water is then dissipated and lost further more tube may be damaged. Baffles maybe made of iron castings, a sheet metal strips, brick, tile, or plastic refractory. Provision must be made to permit movement between baffle and setting walls while still maintaining a gas tight seal.
1.4 Gauge glass, Gauge cocks Each boiler must have at least one water gauge glass. If the operating pressure is 400 psig or greater, two gauge glasses are required on the same horizontal line. Each gauge glass must have a valve drain, and the gauge glass and pipe connections must not be less than ½ inch pipe size. The lowest visible part of the gauge glass must be at least 2 inches above the lowest permissible water level, which is defined as the lowest level at which there is no danger of overheating any part of the boiler during operation. For horizontal fire tube boilers the age glass is set to allow at least 3 inches of water over the highest point of the tubes, flues, or crown sheet at its lowest reading. A valve drains to some safe discharge point. Each boiler must have three or more gauge or try cocks located within the visible length of the gauge glass. Gage cocks are used to check the accuracy of the boiler water level as indicated by the gauge glass. They are opened by hand wheel, chain wheel, or lever, and are closed by hand, a weight, or a spring. The middle cock is usually at the normal water level of the boiler, the other two are spaced equally above and below it. Spacing depends on the size of the boiler.
1.5 Sootblowers
A sootblower is a device which is designed to blast soot and ash away from the walls of a furnace or similar piece of equipment. Sootblowers operate at set intervals, with a cleaning cycle that can vary in length, depending on the device and the size of the equipment which needs to be cleaned. Soot blowers function to keep combustion particles from sticking to boiler tube banks within the boiler tower. The basic principle of the soot blower is the cleaning of heating surfaces by multiple impacts of high pressure air, steam or water from opposing nozzle orifices at the end of a translating-rotating tube. A traveling lance with nozzle jets penetrates the narrow openings in the boiler tube banks to blast the tubes clean. The tubes must be kept clean to allow optimum boiler output and efficiency. A common application at oil, coal or multifuel source power plants is retractable or rotary soot blowers
GUIDANCE DOCUMENT FOR FUEL BURNING EQUIPMENTS AND AIR POLLUTION CONTROL SYSTEMS
23
The primary elements of the typical soot blower should be:
(1) A nozzle-especially selected for each application. (2) A means to convey the nozzle-conveying mechanism includes the lance
tube, carriage and drive motor. (3) A means to supply blowing medium into the nozzle-poppet valve, feed
tube, packing gland and lance tube. (4) A means to sup-port and contain the lower component -- a canopy type
beam with a two-point suspension. (5) Controls-integral components protected by the beam to control the
blowing cycle and supply power to the drive motor. 1.6 Economizer
Economizers are used to recover heat from the boiler flue gases and thereby increase boiler efficiency. The heat absorbed by economizer is transferred to the boiler feedwater flowing through the inside of the economizer tubes. Continuous tube construction is common. Bare tubes are used for coal fired boilers and fin tubes or extended surface for gas and oil fired units. Extended surface on natural gas fired boiler may use up to 9 fins/in and for heavy oil fired 2 fins/in. Economizers are usually arranged with gas flow down and water flow up that helps to avoid water hammer. Economizers should be equipped with three valve bypass on the water side to allow bypassing water at low boiler loads and minimize economizers corrosion. Stacks or chimneys are necessary to discharge the products of combustion at a sufficiently high elevation to prevent nuisance due to low-flying smoke, soot, and ash. A certain amount of draft is also required to conduct the flue gases through the furnace, boiler, tubes, economizers, air heaters, and dust collectors, and the stack can help to produce part of this draft. The height of the stack necessary to:
a. Stack construction.
Stacks are built of steel plate, masonry, and reinforced concrete. Caged ladders should be installed. All stack guys should be kept clear of walkways and roads and, where subject to hazardous contact, should be properly guarded. Stacks are provided with means of cleaning ash, soot, or water from their base, the means depending mainly of the size of the stack.
b. Flues and ducts.
Flues are used to interconnect boiler outlets, economizers, air heaters, and stack. Ducts are used to interconnect forced-draft fans, air heaters, and wind boxes or combustion air plenums. Flues and ducts are usually made of steel. Expansion joints are provided to allow for expansion and contraction. All flues or ducts carrying heated air or gases should be insulated to minimize radiation losses. Outside insulation is preferred for its
GUIDANCE DOCUMENT FOR FUEL BURNING EQUIPMENTS AND AIR POLLUTION CONTROL SYSTEMS
24
maintainability. Flues and ducts are designed to be as short as possible, free from sharp bends or abrupt changes in cross-sectional area and of adequate cross-sectional area to minimize draft loss at the design flow rates.
A boiler must meet operational safety; generation of clean steam or hot at the desired rate, pressure, and temperature; economy of operation and maintenance; and conformance to applicable codes. To meet these requirements, a boiler must have the following characteristic
a. Adequate water or steam capacity b. Properly sized steam / water separators for steam boilers c. Rapid, positive, and regular water circulation d. Heating surfaces which are easy to clean on both water and gas sides e. Parts which are accessible for inspection and repair f. Correct amount land proper arrangement of heating surface g. A furnace of proper size and shape for efficient combustion and for
directing the flow of gases for efficient heat transfer 2. BOILER SYSTEMS
The boiler system comprises of : 2.1 Feed Water System
The feed water system provides water to the boiler and regulates it automatically to meet the steam demand. Various valves provide access for maintenance and repair.
The water supplied to the boiler that is converted into steam is called feed water. The two sources of feed water are :
i- Condensate or condensed steam (temperature between 50 - 100°C)
returned from the processes (not in palm oil mill since the final steam is used to cook the fresh fruit bunches) and
ii- Makeup water (treated raw water) which must come from outside the boiler room and plant processes (to make up for steam loss). For higher boiler efficiencies, the feed water is preheated by economizer, using the waste heat in the flue gas.
Feed water entering the boiler need to be treated to remove hardness and removed solids through softening and demineralization process.
GUIDANCE DOCUMENT FOR FUEL BURNING EQUIPMENTS AND AIR POLLUTION CONTROL SYSTEMS
25
2.2 Steam System
The system collects and controls the steam produced in the boiler. Steam is directed through a piping system to the point of use. Throughout the system, steam pressure is regulated using valves and checked with steam pressure gauges.
2.3 Fuel System
The fuel system includes all equipment used to provide fuel to generate the necessary heat. The equipment required in the fuel system depends on the type of fuel used in the system.
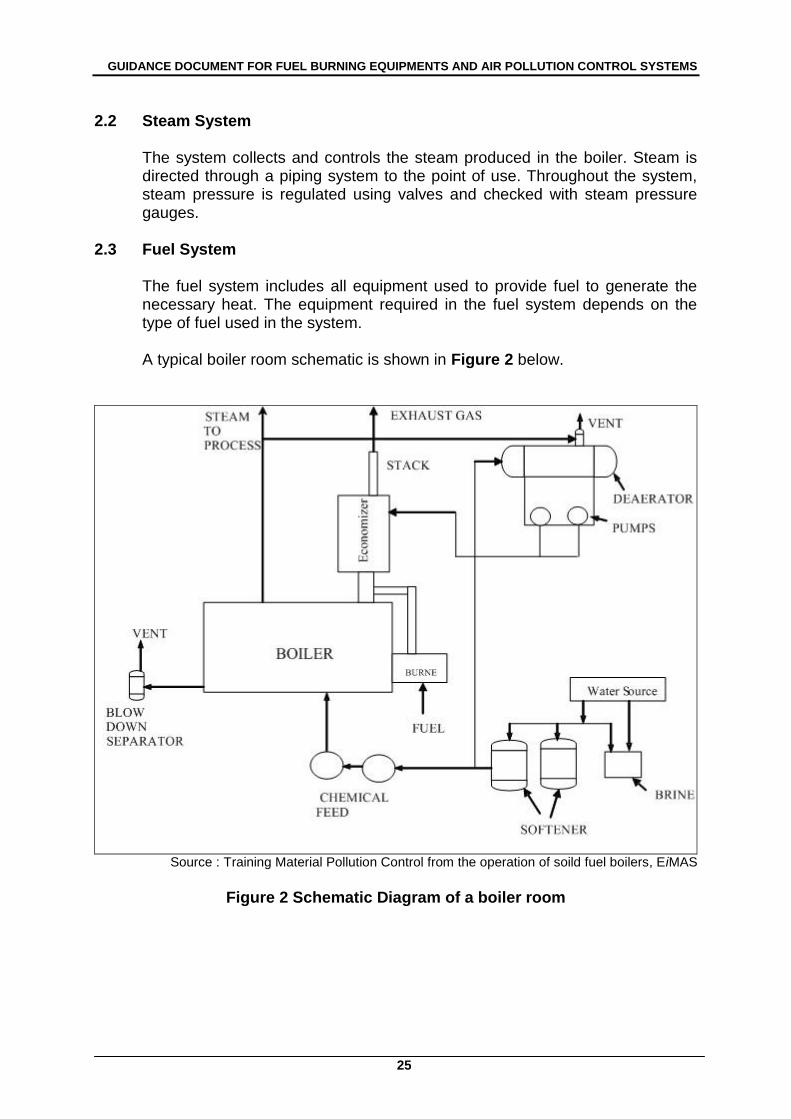
A typical boiler room schematic is shown in Figure 2 below.
Source : Training Material Pollution Control from the operation of soild fuel boilers, EiMAS
Figure 2 Schematic Diagram of a boiler room
GUIDANCE DOCUMENT FOR FUEL BURNING EQUIPMENTS AND AIR POLLUTION CONTROL SYSTEMS
26
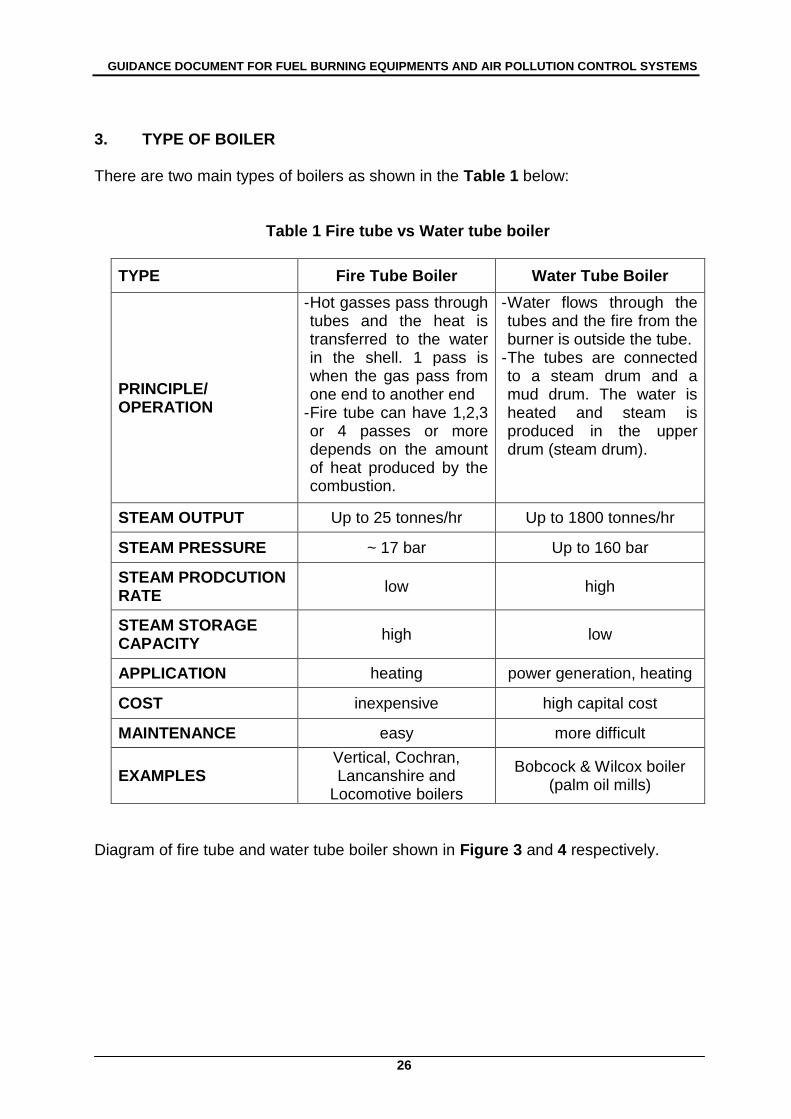
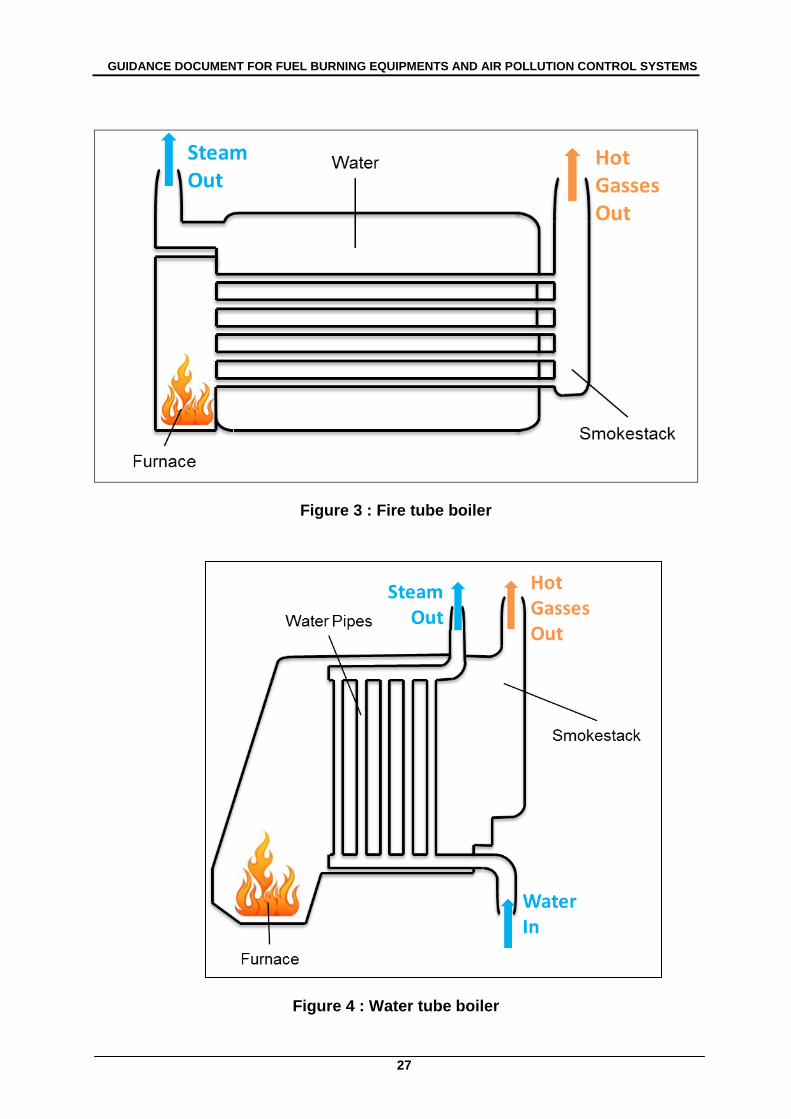
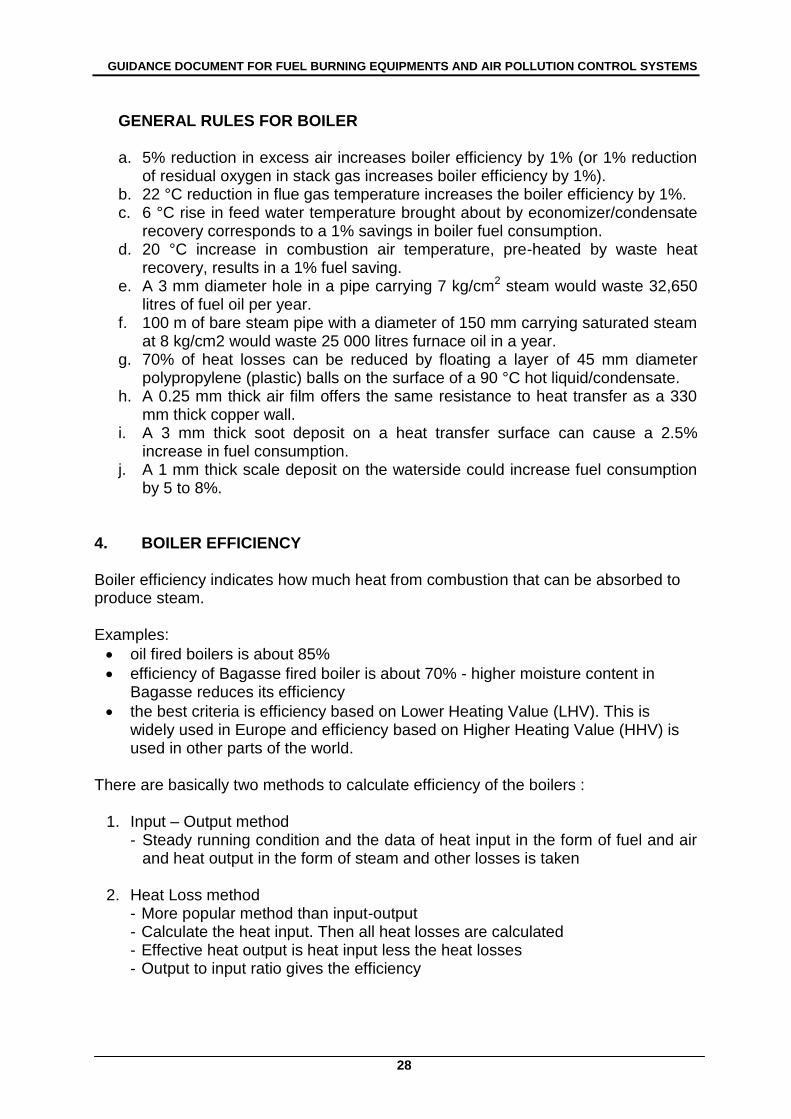
3. TYPE OF BOILER There are two main types of boilers as shown in the Table 1 below:
Table 1 Fire tube vs Water tube boiler
TYPE Fire Tube Boiler Water Tube Boiler
PRINCIPLE/ OPERATION
- Hot gasses pass through tubes and the heat is transferred to the water in the shell. 1 pass is when the gas pass from one end to another end
- Fire tube can have 1,2,3 or 4 passes or more depends on the amount of heat produced by the combustion.
- Water flows through the tubes and the fire from the burner is outside the tube.
- The tubes are connected to a steam drum and a mud drum. The water is heated and steam is produced in the upper drum (steam drum).
STEAM OUTPUT Up to 25 tonnes/hr Up to 1800 tonnes/hr
STEAM PRESSURE ~ 17 bar Up to 160 bar
STEAM PRODCUTION RATE
low high
STEAM STORAGE CAPACITY
high low
APPLICATION heating power generation, heating
COST inexpensive high capital cost
MAINTENANCE easy more difficult
EXAMPLES Vertical, Cochran, Lancanshire and
Locomotive boilers
Bobcock & Wilcox boiler (palm oil mills)
Diagram of fire tube and water tube boiler shown in Figure 3 and 4 respectively.
GUIDANCE DOCUMENT FOR FUEL BURNING EQUIPMENTS AND AIR POLLUTION CONTROL SYSTEMS
27
Figure 3 : Fire tube boiler
Figure 4 : Water tube boiler
GUIDANCE DOCUMENT FOR FUEL BURNING EQUIPMENTS AND AIR POLLUTION CONTROL SYSTEMS
28
GENERAL RULES FOR BOILER a. 5% reduction in excess air increases boiler efficiency by 1% (or 1% reduction
of residual oxygen in stack gas increases boiler efficiency by 1%). b. 22 °C reduction in flue gas temperature increases the boiler efficiency by 1%. c. 6 °C rise in feed water temperature brought about by economizer/condensate
recovery corresponds to a 1% savings in boiler fuel consumption. d. 20 °C increase in combustion air temperature, pre-heated by waste heat
recovery, results in a 1% fuel saving. e. A 3 mm diameter hole in a pipe carrying 7 kg/cm2 steam would waste 32,650
litres of fuel oil per year. f. 100 m of bare steam pipe with a diameter of 150 mm carrying saturated steam
at 8 kg/cm2 would waste 25 000 litres furnace oil in a year. g. 70% of heat losses can be reduced by floating a layer of 45 mm diameter
polypropylene (plastic) balls on the surface of a 90 °C hot liquid/condensate. h. A 0.25 mm thick air film offers the same resistance to heat transfer as a 330
mm thick copper wall. i. A 3 mm thick soot deposit on a heat transfer surface can cause a 2.5%
increase in fuel consumption. j. A 1 mm thick scale deposit on the waterside could increase fuel consumption
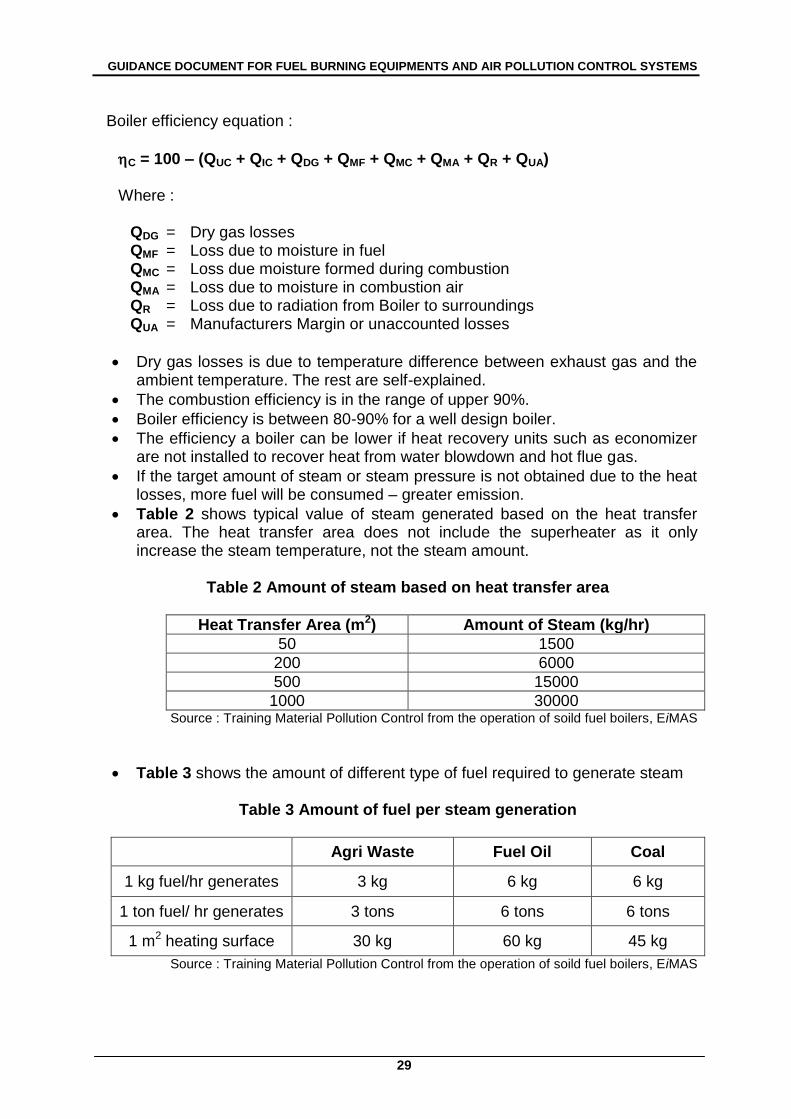
by 5 to 8%. 4. BOILER EFFICIENCY Boiler efficiency indicates how much heat from combustion that can be absorbed to produce steam. Examples:
oil fired boilers is about 85%
efficiency of Bagasse fired boiler is about 70% - higher moisture content in Bagasse reduces its efficiency
the best criteria is efficiency based on Lower Heating Value (LHV). This is widely used in Europe and efficiency based on Higher Heating Value (HHV) is used in other parts of the world.
There are basically two methods to calculate efficiency of the boilers :
1. Input – Output method - Steady running condition and the data of heat input in the form of fuel and air
and heat output in the form of steam and other losses is taken
2. Heat Loss method - More popular method than input-output - Calculate the heat input. Then all heat losses are calculated - Effective heat output is heat input less the heat losses - Output to input ratio gives the efficiency
GUIDANCE DOCUMENT FOR FUEL BURNING EQUIPMENTS AND AIR POLLUTION CONTROL SYSTEMS
29
Boiler efficiency equation :
C = 100 – (QUC + QIC + QDG + QMF + QMC + QMA + QR + QUA)
Where :
QDG = Dry gas losses QMF = Loss due to moisture in fuel QMC = Loss due moisture formed during combustion QMA = Loss due to moisture in combustion air QR = Loss due to radiation from Boiler to surroundings QUA = Manufacturers Margin or unaccounted losses
Dry gas losses is due to temperature difference between exhaust gas and the ambient temperature. The rest are self-explained.
The combustion efficiency is in the range of upper 90%.
Boiler efficiency is between 80-90% for a well design boiler.
The efficiency a boiler can be lower if heat recovery units such as economizer are not installed to recover heat from water blowdown and hot flue gas.
If the target amount of steam or steam pressure is not obtained due to the heat losses, more fuel will be consumed – greater emission.
Table 2 shows typical value of steam generated based on the heat transfer area. The heat transfer area does not include the superheater as it only increase the steam temperature, not the steam amount.
Table 2 Amount of steam based on heat transfer area
Heat Transfer Area (m2) Amount of Steam (kg/hr)
50 1500
200 6000
500 15000
1000 30000 Source : Training Material Pollution Control from the operation of soild fuel boilers, EiMAS
Table 3 shows the amount of different type of fuel required to generate steam
Table 3 Amount of fuel per steam generation
Agri Waste Fuel Oil Coal
1 kg fuel/hr generates 3 kg 6 kg 6 kg
1 ton fuel/ hr generates 3 tons 6 tons 6 tons
1 m2 heating surface 30 kg 60 kg 45 kg
Source : Training Material Pollution Control from the operation of soild fuel boilers, EiMAS
GUIDANCE DOCUMENT FOR FUEL BURNING EQUIPMENTS AND AIR POLLUTION CONTROL SYSTEMS
30
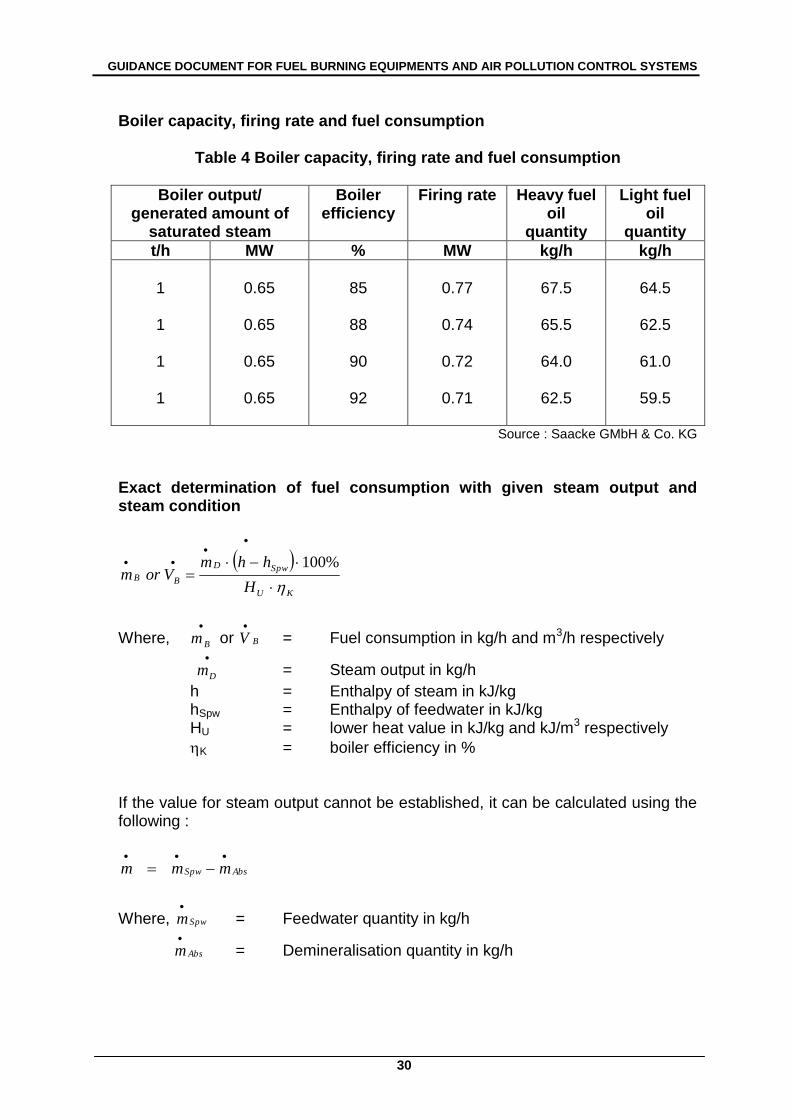
Boiler capacity, firing rate and fuel consumption
Table 4 Boiler capacity, firing rate and fuel consumption
Boiler output/ generated amount of
saturated steam
Boiler efficiency
Firing rate Heavy fuel oil
quantity
Light fuel oil
quantity
t/h MW % MW kg/h kg/h
1
1
1
1
0.65
0.65
0.65
0.65
85
88
90
92
0.77
0.74
0.72
0.71
67.5
65.5
64.0
62.5
64.5
62.5
61.0
59.5
Source : Saacke GMbH & Co. KG
Exact determination of fuel consumption with given steam output and steam condition
KU
SpwD
BB
H
hhmVorm
%100
Where,
Bm or BV
= Fuel consumption in kg/h and m3/h respectively
Dm = Steam output in kg/h
h = Enthalpy of steam in kJ/kg hSpw = Enthalpy of feedwater in kJ/kg HU = lower heat value in kJ/kg and kJ/m3 respectively
K = boiler efficiency in %
If the value for steam output cannot be established, it can be calculated using the following :
AbsSpw mmm
Where, Spwm
= Feedwater quantity in kg/h
Absm
= Demineralisation quantity in kg/h
GUIDANCE DOCUMENT FOR FUEL BURNING EQUIPMENTS AND AIR POLLUTION CONTROL SYSTEMS
31
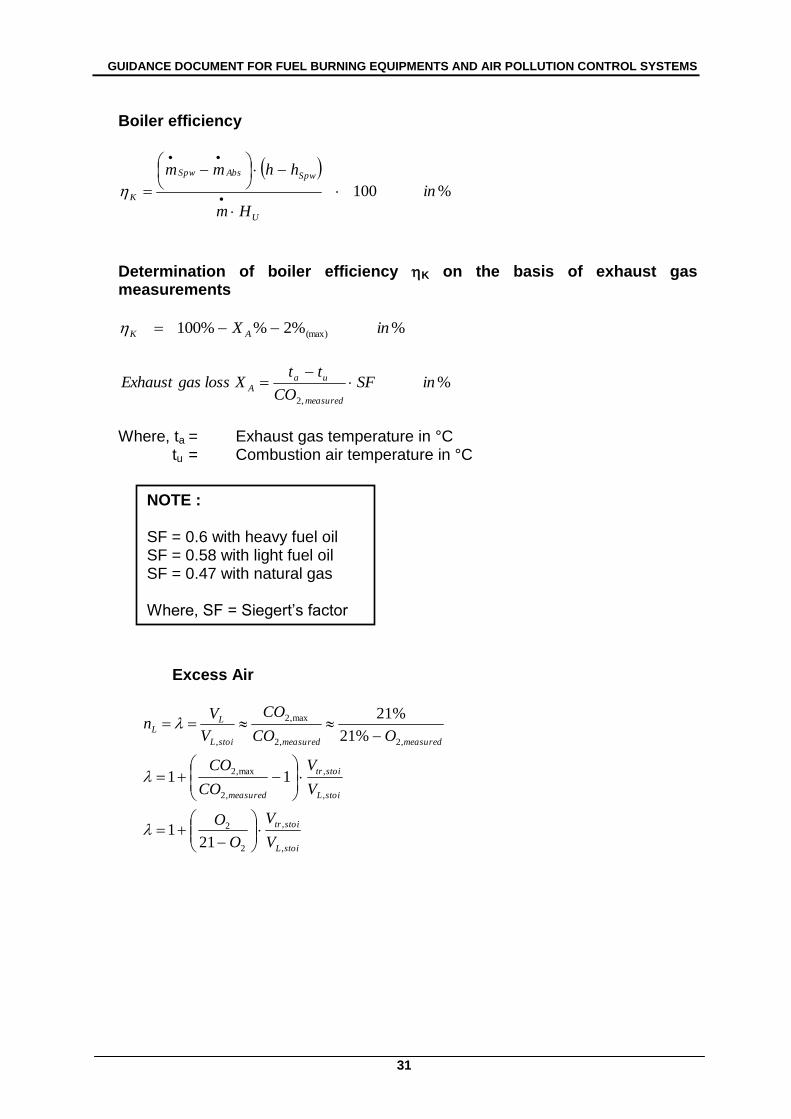
Boiler efficiency
%100 in
Hm
hhmm
U
SpwAbsSpw
K
Determination of boiler efficiency K on the basis of exhaust gas measurements
%%2%%100 (max) inX AK
%,2
inSFCO
ttXlossgasExhaust
measured
uaA
Where, ta = Exhaust gas temperature in °C
tu = Combustion air temperature in °C
Excess Air
stoiL
stoitr
stoiL
stoitr
measured
measuredmeasuredstoiL
LL
V
V
O
O
V
V
CO
CO
OCO
CO
V
Vn
,
,
2
2
,
,
,2
max,2
,2,2
max,2
,
211
11
%21
%21
NOTE : SF = 0.6 with heavy fuel oil SF = 0.58 with light fuel oil SF = 0.47 with natural gas Where, SF = Siegert‘s factor
GUIDANCE DOCUMENT FOR FUEL BURNING EQUIPMENTS AND AIR POLLUTION CONTROL SYSTEMS
32
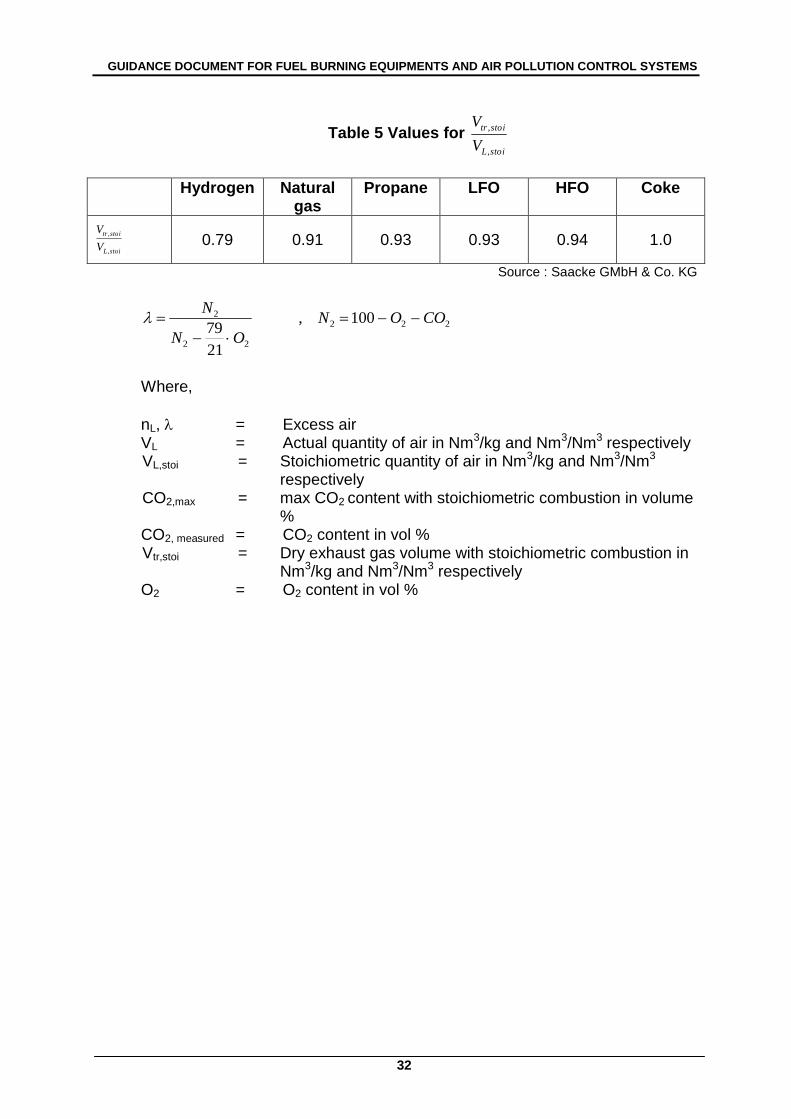
Table 5 Values for stoiL
stoitr
V
V
,
,
Hydrogen Natural gas
Propane LFO HFO Coke
stoiL
stoitr
V
V
,
, 0.79 0.91 0.93 0.93 0.94 1.0
Source : Saacke GMbH & Co. KG
222
22
2 100,
21
79COON
ON
N
Where,
nL, = Excess air VL = Actual quantity of air in Nm3/kg and Nm3/Nm3 respectively VL,stoi = Stoichiometric quantity of air in Nm3/kg and Nm3/Nm3
respectively CO2,max = max CO2 content with stoichiometric combustion in volume
% CO2, measured = CO2 content in vol % Vtr,stoi = Dry exhaust gas volume with stoichiometric combustion in
Nm3/kg and Nm3/Nm3 respectively O2 = O2 content in vol %
GUIDANCE DOCUMENT FOR FUEL BURNING EQUIPMENTS AND AIR POLLUTION CONTROL SYSTEMS
33
SECTION C : FURNACE
1. INTRODUCTION
A furnace is a device used for heating. An industrial furnace or direct fired heater is equipment used to provide heat for a process or can serve as reactor which provides heats of reaction. Furnace designs vary as to its function, heating duty, type of fuel and method of introducing combustion air. However, most process furnaces have some common features.
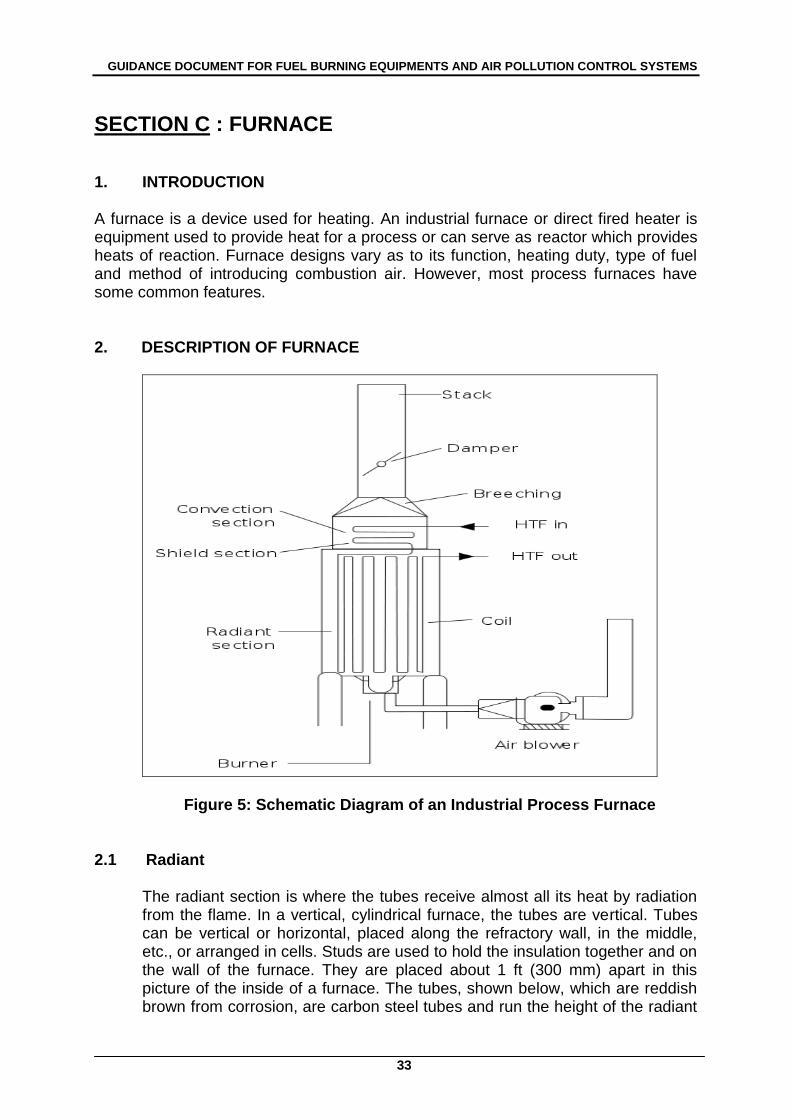
2. DESCRIPTION OF FURNACE
Figure 5: Schematic Diagram of an Industrial Process Furnace
2.1 Radiant The radiant section is where the tubes receive almost all its heat by radiation from the flame. In a vertical, cylindrical furnace, the tubes are vertical. Tubes can be vertical or horizontal, placed along the refractory wall, in the middle, etc., or arranged in cells. Studs are used to hold the insulation together and on the wall of the furnace. They are placed about 1 ft (300 mm) apart in this picture of the inside of a furnace. The tubes, shown below, which are reddish brown from corrosion, are carbon steel tubes and run the height of the radiant
GUIDANCE DOCUMENT FOR FUEL BURNING EQUIPMENTS AND AIR POLLUTION CONTROL SYSTEMS
34
section. The tubes are a distance away from the insulation so radiation can be reflected to the back of the tubes to maintain a uniform tube wall temperature. Tube guides at the top, middle and bottom hold the tubes in place.
2.2 Convection Section
The convection section is located above the radiant section where it is cooler to recover additional heat. Heat transfer takes place by convection here, and the tubes are finned to increase heat transfer. The first two tube rows in the bottom of the convection section and at the top of the radiant section is an area of bare tubes (without fins) and are known as the shield section, so named because they are still exposed to plenty of radiation from the firebox and they also act to shield the convection section tubes, which are normally of less resistant material from the high temperatures in the firebox. The area of the radiant section just before flue gas enters the shield section and into the convection section called the bridge zone. A crossover is the tube that connects from the convection section outlet to the radiant section inlet. The crossover piping is normally located outside so that the temperature can be monitored and the efficiency of the convection section can be calculated. The sight glass at the top allows personnel to see the flame shape and pattern from above and visually inspect if flame impingement is occurring. Flame impingement happens when the flame touches the tubes and causes small isolated spots of very high temperature.
2.3 Burner
The burner in the vertical, cylindrical furnace as above is located in the floor and fires upward. Some furnaces have side fired burners, such as in train locomotives. The burner tile is made of high temperature refractory and is where the flame is contained. Air registers located below the burner and at the outlet of the air blower are devices with movable flaps or vanes that control the shape and pattern of the flame, whether it spreads out or even swirls around. Flames should not spread out too much, as this will cause flame impingement. Air registers can be classified as primary, secondary and if applicable, tertiary, depending on when their air is introduced. The primary air register supplies primary air, which is the first to be introduced in the burner. Secondary air is added to supplement primary air. Burners may include a pre-mixer to mix the air and fuel for better combustion before introducing into the burner. Some burners even use steam as premix to preheat the air and create better mixing of the fuel and heated air. The floor of the furnace is mostly made of a different material from that of the wall, typically hard castable refractory to allow technicians to walk on its floor during maintenance.
GUIDANCE DOCUMENT FOR FUEL BURNING EQUIPMENTS AND AIR POLLUTION CONTROL SYSTEMS
35
3. Type of Furnace
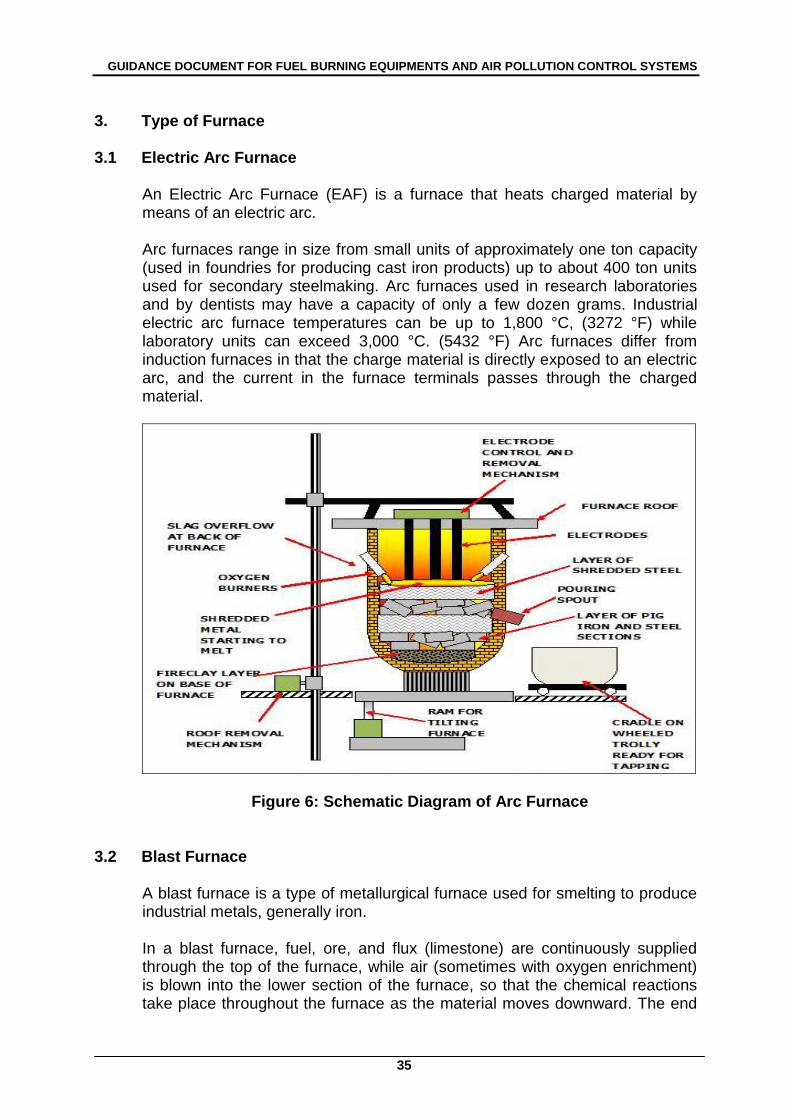
3.1 Electric Arc Furnace An Electric Arc Furnace (EAF) is a furnace that heats charged material by means of an electric arc. Arc furnaces range in size from small units of approximately one ton capacity (used in foundries for producing cast iron products) up to about 400 ton units used for secondary steelmaking. Arc furnaces used in research laboratories and by dentists may have a capacity of only a few dozen grams. Industrial electric arc furnace temperatures can be up to 1,800 °C, (3272 °F) while laboratory units can exceed 3,000 °C. (5432 °F) Arc furnaces differ from induction furnaces in that the charge material is directly exposed to an electric arc, and the current in the furnace terminals passes through the charged material.
Figure 6: Schematic Diagram of Arc Furnace
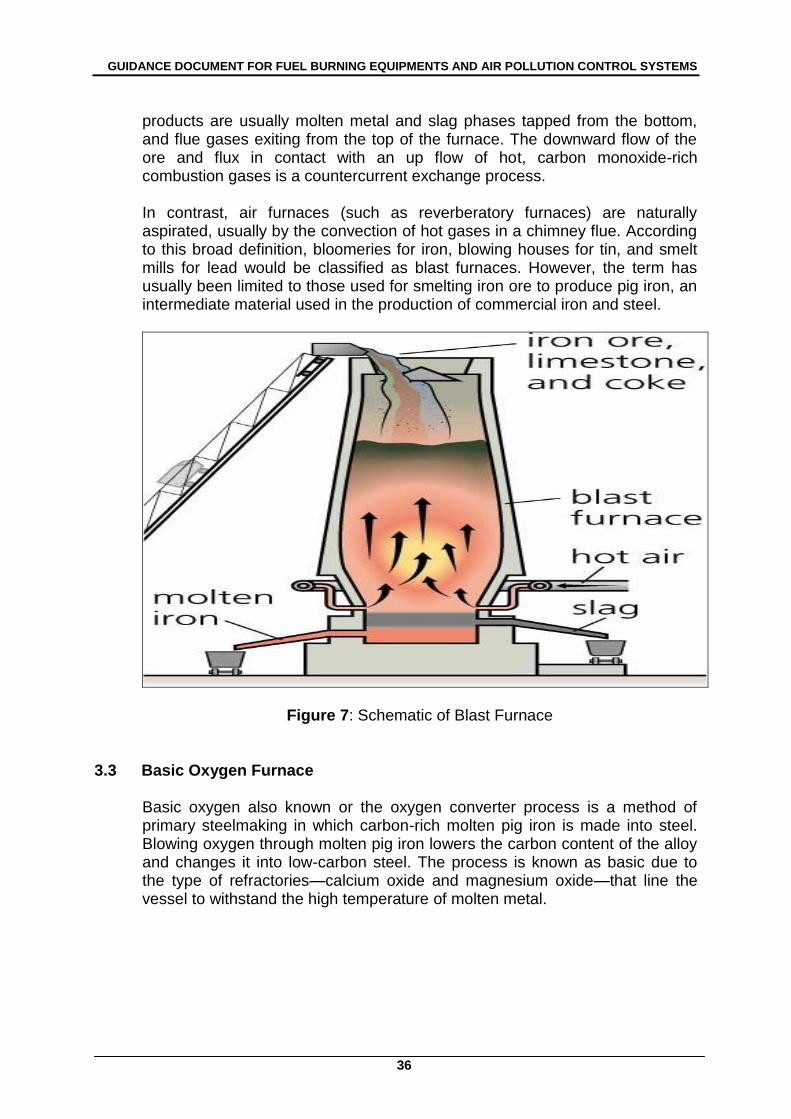
3.2 Blast Furnace
A blast furnace is a type of metallurgical furnace used for smelting to produce industrial metals, generally iron. In a blast furnace, fuel, ore, and flux (limestone) are continuously supplied through the top of the furnace, while air (sometimes with oxygen enrichment) is blown into the lower section of the furnace, so that the chemical reactions take place throughout the furnace as the material moves downward. The end
GUIDANCE DOCUMENT FOR FUEL BURNING EQUIPMENTS AND AIR POLLUTION CONTROL SYSTEMS
36
products are usually molten metal and slag phases tapped from the bottom, and flue gases exiting from the top of the furnace. The downward flow of the ore and flux in contact with an up flow of hot, carbon monoxide-rich combustion gases is a countercurrent exchange process. In contrast, air furnaces (such as reverberatory furnaces) are naturally aspirated, usually by the convection of hot gases in a chimney flue. According to this broad definition, bloomeries for iron, blowing houses for tin, and smelt mills for lead would be classified as blast furnaces. However, the term has usually been limited to those used for smelting iron ore to produce pig iron, an intermediate material used in the production of commercial iron and steel.
Figure 7: Schematic of Blast Furnace
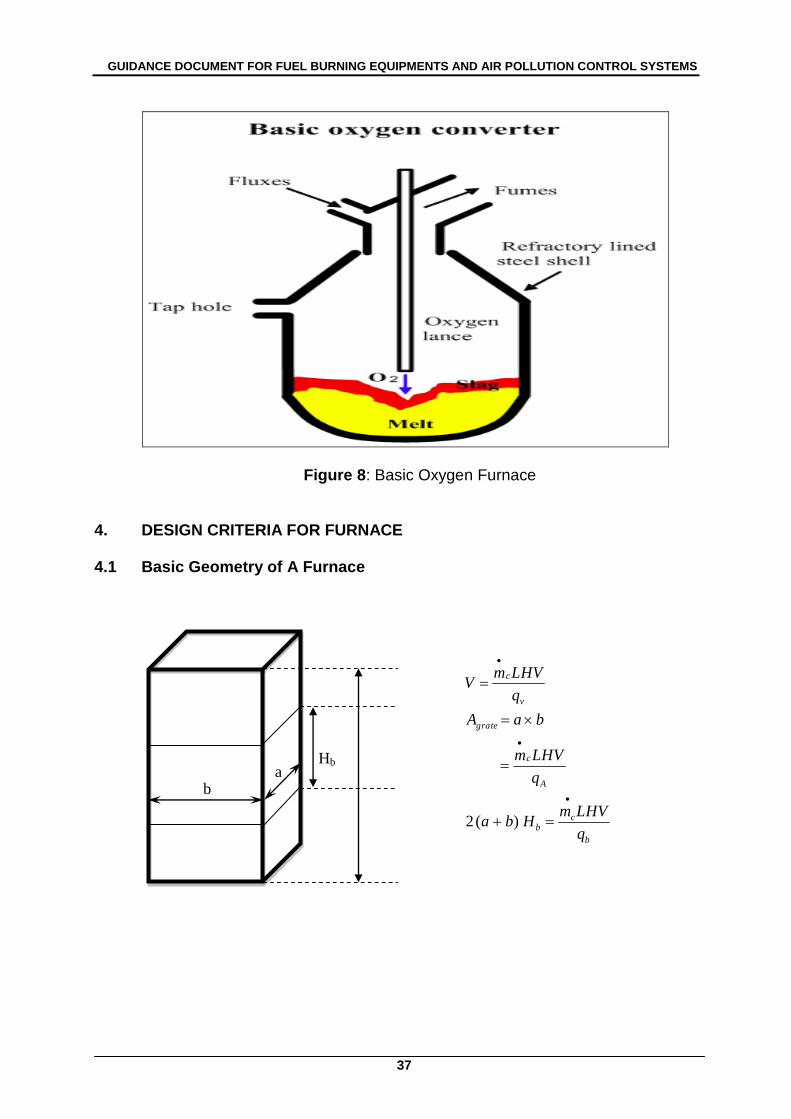
3.3 Basic Oxygen Furnace Basic oxygen also known or the oxygen converter process is a method of primary steelmaking in which carbon-rich molten pig iron is made into steel. Blowing oxygen through molten pig iron lowers the carbon content of the alloy and changes it into low-carbon steel. The process is known as basic due to the type of refractories—calcium oxide and magnesium oxide—that line the vessel to withstand the high temperature of molten metal.
GUIDANCE DOCUMENT FOR FUEL BURNING EQUIPMENTS AND AIR POLLUTION CONTROL SYSTEMS
37
Figure 8: Basic Oxygen Furnace
4. DESIGN CRITERIA FOR FURNACE
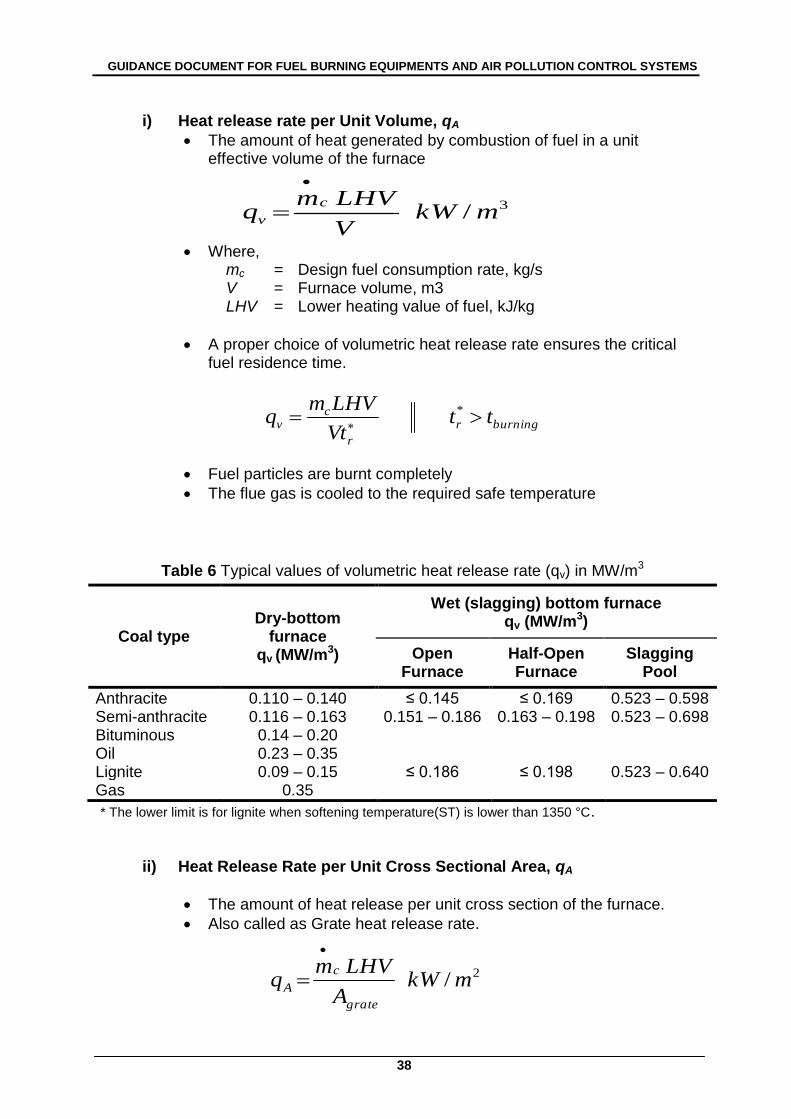
4.1 Basic Geometry of A Furnace
a b
Hb
b
cb
A
c
grate
v
c
q
LHVmHba
q
LHVm
baA
q
LHVmV
)(2
GUIDANCE DOCUMENT FOR FUEL BURNING EQUIPMENTS AND AIR POLLUTION CONTROL SYSTEMS
38
i) Heat release rate per Unit Volume, qA
The amount of heat generated by combustion of fuel in a unit effective volume of the furnace
Where, mc = Design fuel consumption rate, kg/s V = Furnace volume, m3 LHV = Lower heating value of fuel, kJ/kg
A proper choice of volumetric heat release rate ensures the critical fuel residence time.
Fuel particles are burnt completely
The flue gas is cooled to the required safe temperature
Table 6 Typical values of volumetric heat release rate (qv) in MW/m3
Coal type Dry-bottom
furnace qv (MW/m3)
Wet (slagging) bottom furnace qv (MW/m3)
Open Furnace
Half-Open Furnace
Slagging Pool
Anthracite 0.110 – 0.140 ≤ 0.145 ≤ 0.169 0.523 – 0.598 Semi-anthracite 0.116 – 0.163 0.151 – 0.186 0.163 – 0.198 0.523 – 0.698 Bituminous 0.14 – 0.20 Oil 0.23 – 0.35 Lignite 0.09 – 0.15 ≤ 0.186 ≤ 0.198 0.523 – 0.640 Gas 0.35
* The lower limit is for lignite when softening temperature(ST) is lower than 1350 °C.
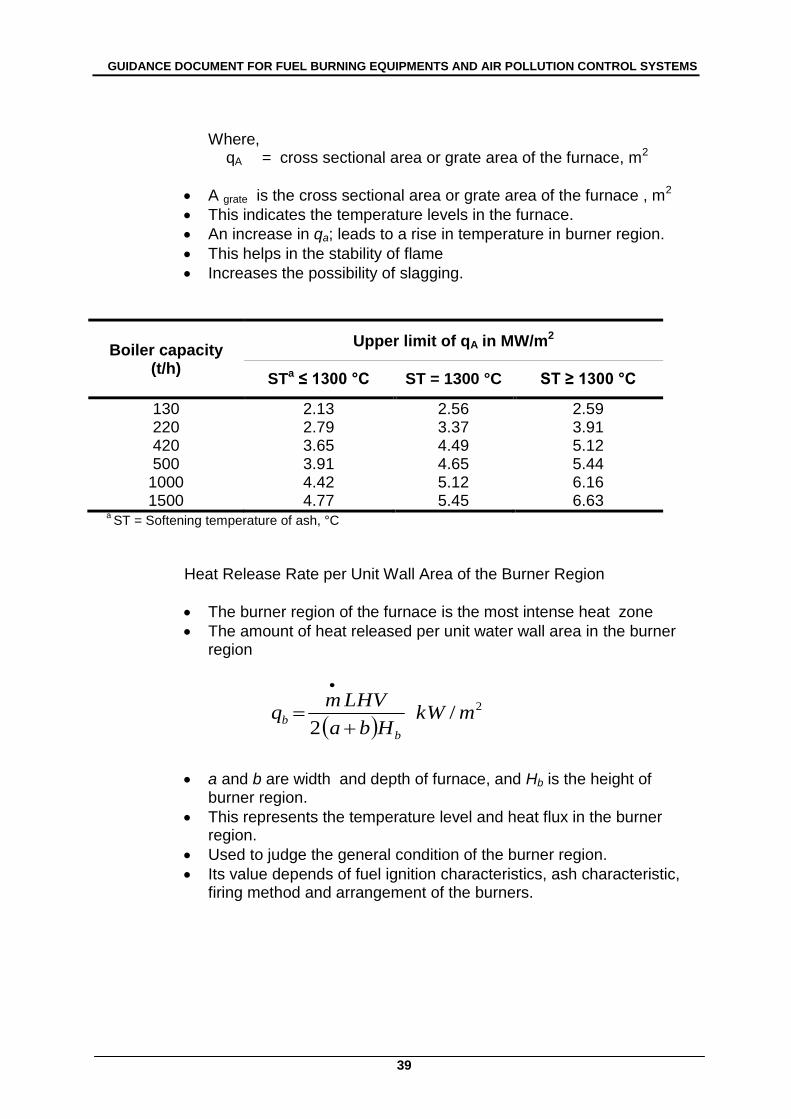
ii) Heat Release Rate per Unit Cross Sectional Area, qA
The amount of heat release per unit cross section of the furnace.
Also called as Grate heat release rate.
3/ mkWV
LHVmq
c
v
burningr
r
cv tt
Vt
LHVmq
*
2/ mkWA
LHVmq
grate
c
A
GUIDANCE DOCUMENT FOR FUEL BURNING EQUIPMENTS AND AIR POLLUTION CONTROL SYSTEMS
39
Where,
qA = cross sectional area or grate area of the furnace, m2
A grate is the cross sectional area or grate area of the furnace , m2
This indicates the temperature levels in the furnace.
An increase in qa; leads to a rise in temperature in burner region.
This helps in the stability of flame
Increases the possibility of slagging.
Boiler capacity (t/h)
Upper limit of qA in MW/m2
STa ≤ 1300 °C ST = 1300 °C ST ≥ 1300 °C
130 2.13 2.56 2.59 220 2.79 3.37 3.91 420 3.65 4.49 5.12 500 3.91 4.65 5.44
1000 4.42 5.12 6.16 1500 4.77 5.45 6.63
a ST = Softening temperature of ash, °C
Heat Release Rate per Unit Wall Area of the Burner Region
The burner region of the furnace is the most intense heat zone
The amount of heat released per unit water wall area in the burner region
a and b are width and depth of furnace, and Hb is the height of burner region.
This represents the temperature level and heat flux in the burner region.
Used to judge the general condition of the burner region.
Its value depends of fuel ignition characteristics, ash characteristic, firing method and arrangement of the burners.
2/
2mkW
Hba
LHVmq
b
b
GUIDANCE DOCUMENT FOR FUEL BURNING EQUIPMENTS AND AIR POLLUTION CONTROL SYSTEMS
40
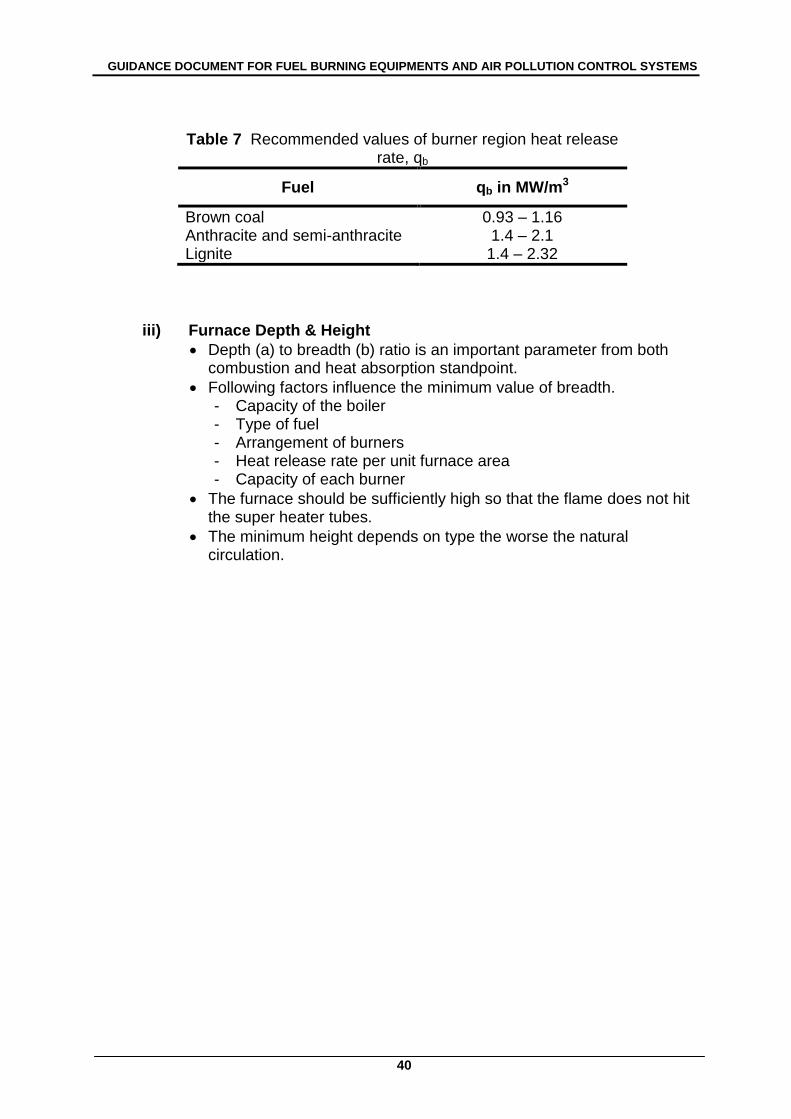
Table 7 Recommended values of burner region heat release
rate, qb
Fuel qb in MW/m3
Brown coal 0.93 – 1.16 Anthracite and semi-anthracite 1.4 – 2.1 Lignite 1.4 – 2.32
iii) Furnace Depth & Height
Depth (a) to breadth (b) ratio is an important parameter from both combustion and heat absorption standpoint.
Following factors influence the minimum value of breadth. - Capacity of the boiler - Type of fuel - Arrangement of burners - Heat release rate per unit furnace area - Capacity of each burner
The furnace should be sufficiently high so that the flame does not hit the super heater tubes.
The minimum height depends on type the worse the natural circulation.
GUIDANCE DOCUMENT FOR FUEL BURNING EQUIPMENTS AND AIR POLLUTION CONTROL SYSTEMS
41
SECTION D : GENERATOR SETS 1. INTRODUCTION
Generator is generally power-driven by diesel engine(s). All generators including standby generator consuming more than 15 kg per hour of liquid fuel shall require written notification from the Department of Environment before the commencement of installation work. The owners are legally bounded to submit such notification under Clean Air Regulation Regulations.
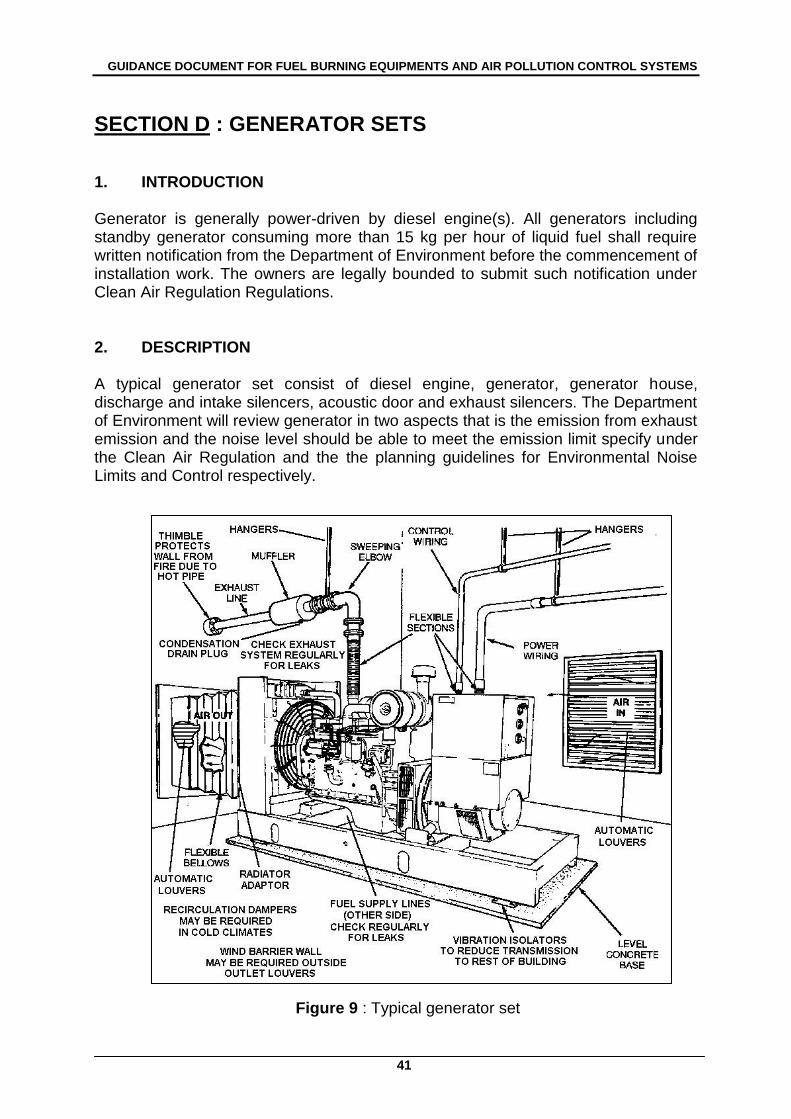
2. DESCRIPTION
A typical generator set consist of diesel engine, generator, generator house, discharge and intake silencers, acoustic door and exhaust silencers. The Department of Environment will review generator in two aspects that is the emission from exhaust emission and the noise level should be able to meet the emission limit specify under the Clean Air Regulation and the the planning guidelines for Environmental Noise Limits and Control respectively.
Figure 9 : Typical generator set
GUIDANCE DOCUMENT FOR FUEL BURNING EQUIPMENTS AND AIR POLLUTION CONTROL SYSTEMS
42
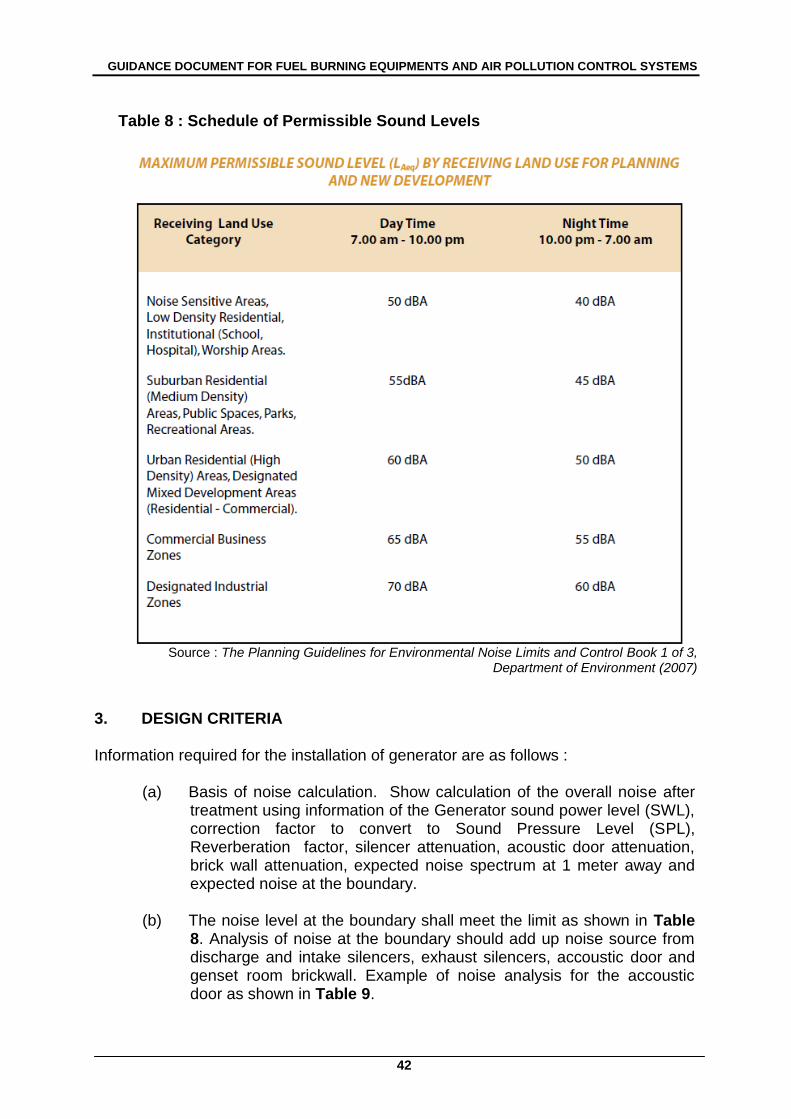
Table 8 : Schedule of Permissible Sound Levels
Source : The Planning Guidelines for Environmental Noise Limits and Control Book 1 of 3,
Department of Environment (2007)
3. DESIGN CRITERIA
Information required for the installation of generator are as follows :
(a) Basis of noise calculation. Show calculation of the overall noise after
treatment using information of the Generator sound power level (SWL), correction factor to convert to Sound Pressure Level (SPL), Reverberation factor, silencer attenuation, acoustic door attenuation, brick wall attenuation, expected noise spectrum at 1 meter away and expected noise at the boundary.
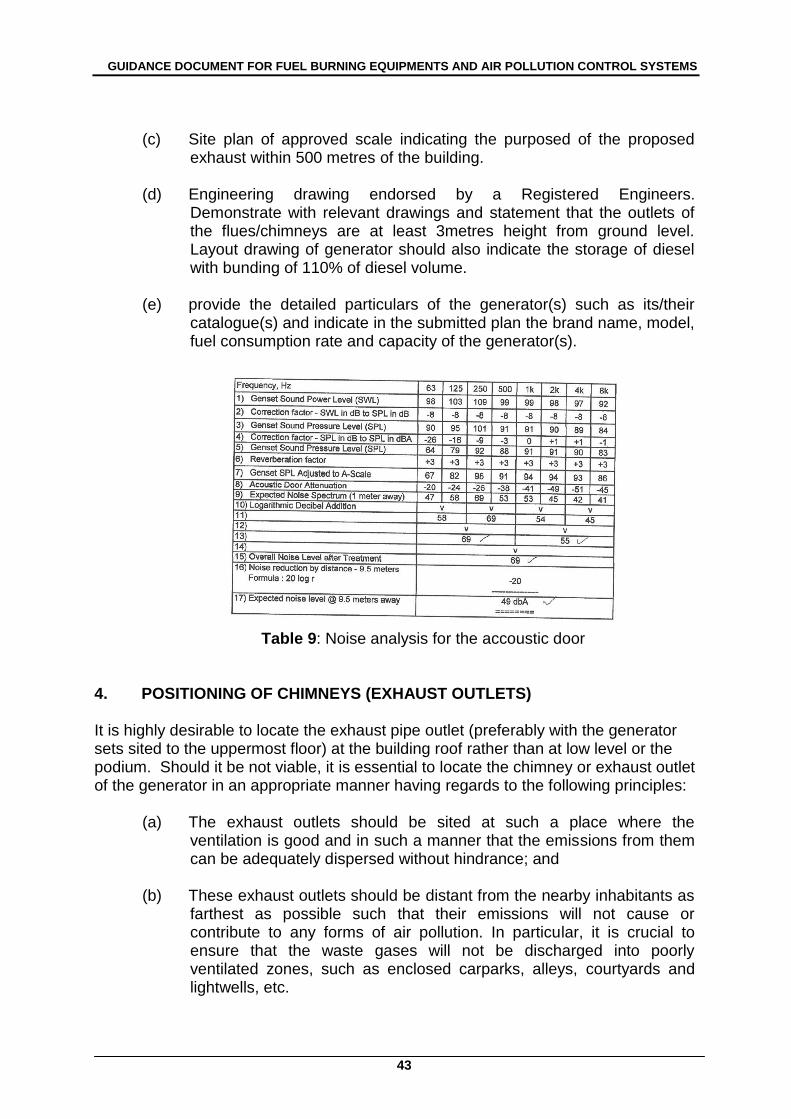
(b) The noise level at the boundary shall meet the limit as shown in Table 8. Analysis of noise at the boundary should add up noise source from discharge and intake silencers, exhaust silencers, accoustic door and genset room brickwall. Example of noise analysis for the accoustic door as shown in Table 9.
GUIDANCE DOCUMENT FOR FUEL BURNING EQUIPMENTS AND AIR POLLUTION CONTROL SYSTEMS
43
(c) Site plan of approved scale indicating the purposed of the proposed
exhaust within 500 metres of the building.
(d) Engineering drawing endorsed by a Registered Engineers. Demonstrate with relevant drawings and statement that the outlets of the flues/chimneys are at least 3metres height from ground level. Layout drawing of generator should also indicate the storage of diesel with bunding of 110% of diesel volume.
(e) provide the detailed particulars of the generator(s) such as its/their
catalogue(s) and indicate in the submitted plan the brand name, model, fuel consumption rate and capacity of the generator(s).
Table 9: Noise analysis for the accoustic door
4. POSITIONING OF CHIMNEYS (EXHAUST OUTLETS)
It is highly desirable to locate the exhaust pipe outlet (preferably with the generator sets sited to the uppermost floor) at the building roof rather than at low level or the podium. Should it be not viable, it is essential to locate the chimney or exhaust outlet of the generator in an appropriate manner having regards to the following principles:
(a) The exhaust outlets should be sited at such a place where the
ventilation is good and in such a manner that the emissions from them can be adequately dispersed without hindrance; and
(b) These exhaust outlets should be distant from the nearby inhabitants as
farthest as possible such that their emissions will not cause or contribute to any forms of air pollution. In particular, it is crucial to ensure that the waste gases will not be discharged into poorly ventilated zones, such as enclosed carparks, alleys, courtyards and lightwells, etc.
GUIDANCE DOCUMENT FOR FUEL BURNING EQUIPMENTS AND AIR POLLUTION CONTROL SYSTEMS
44
5. Additional mitigation measures
Under circumstances where emissions from the flue(s) or chimney(s) may pose foreseeable pollution to the nearby receptors, say, exhaust outlets immediately above the 4 podium levels of residential developments, the application will only be approved upon satisfactory demonstration by the applicants on the provision of effective air pollution control measures to alleviate the impacts. Such additional mitigation measures may include:
Catalytic converter – typically a stainless steel box mounted in the exhaust system fitted with an autocatalyst (a ceramic or metallic substrate with an active coating incorporating alumina, ceria and other oxides and combinations of the precious metals - platinum, palladium and rhodium).
Diesel particulate trap filter (soot trap) – consist of a filter material positioned in the exhaust designed to collect solid and liquid particulate matter emissions.
Use of ultra low sulphur diesel (ULSD) – it is always desirable to use ultra low sulphur diesel (ULSD of at least 0.005% sulphur content), in particular in urban areas, for reducing the amount of sulphur dioxide to be emitted. The extra cost is expected to be comparatively very small. It is important to note that whenever catalytic converter is to be installed, the ULSD must be used so as not to poison the converter due to the presence of sulphur in the fuel.
Isolate the machine from the building structure by use of inertia blocks and vibration isolators
Provide flexible connectors between the machine and associated pipework to avoid structural vibration transmission
Use vibration isolators for attaching pipes to walls, ceilings or floors Make reference to the statutory noise limit and include noise levels
specification when ordering new equipment Conduct regular maintenance, check alignment and replace worn-out
components
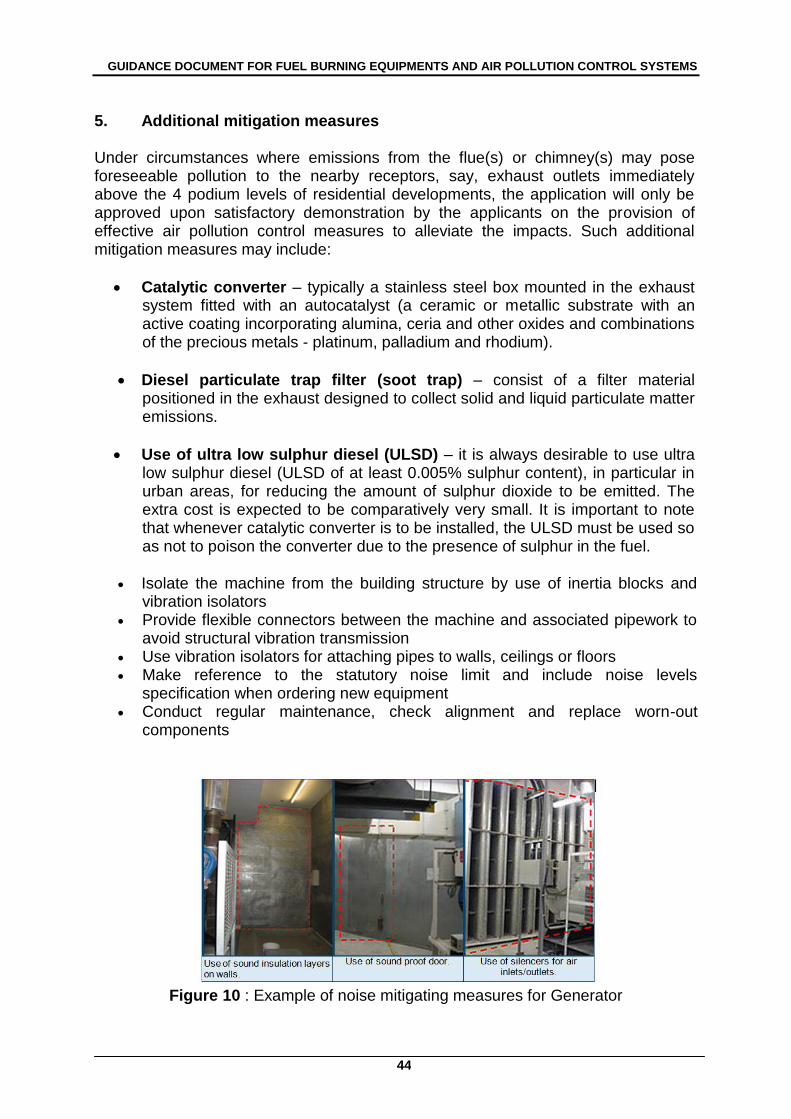
Figure 10 : Example of noise mitigating measures for Generator
GUIDANCE DOCUMENT FOR FUEL BURNING EQUIPMENTS AND AIR POLLUTION CONTROL SYSTEMS
45
SECTION E : FABRIC FILTER (BAG HOUSES)
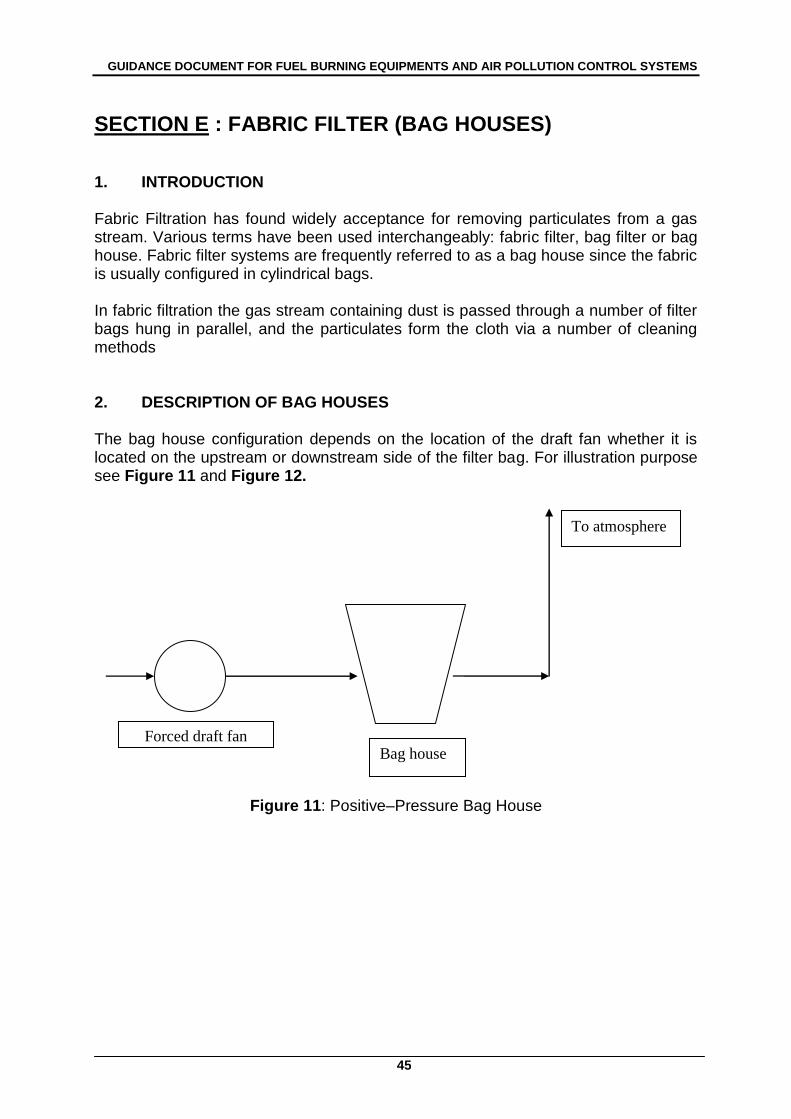
1. INTRODUCTION Fabric Filtration has found widely acceptance for removing particulates from a gas stream. Various terms have been used interchangeably: fabric filter, bag filter or bag house. Fabric filter systems are frequently referred to as a bag house since the fabric is usually configured in cylindrical bags. In fabric filtration the gas stream containing dust is passed through a number of filter bags hung in parallel, and the particulates form the cloth via a number of cleaning methods 2. DESCRIPTION OF BAG HOUSES The bag house configuration depends on the location of the draft fan whether it is located on the upstream or downstream side of the filter bag. For illustration purpose see Figure 11 and Figure 12.
Figure 11: Positive–Pressure Bag House
Forced draft fan Bag house
To atmosphere
GUIDANCE DOCUMENT FOR FUEL BURNING EQUIPMENTS AND AIR POLLUTION CONTROL SYSTEMS
46
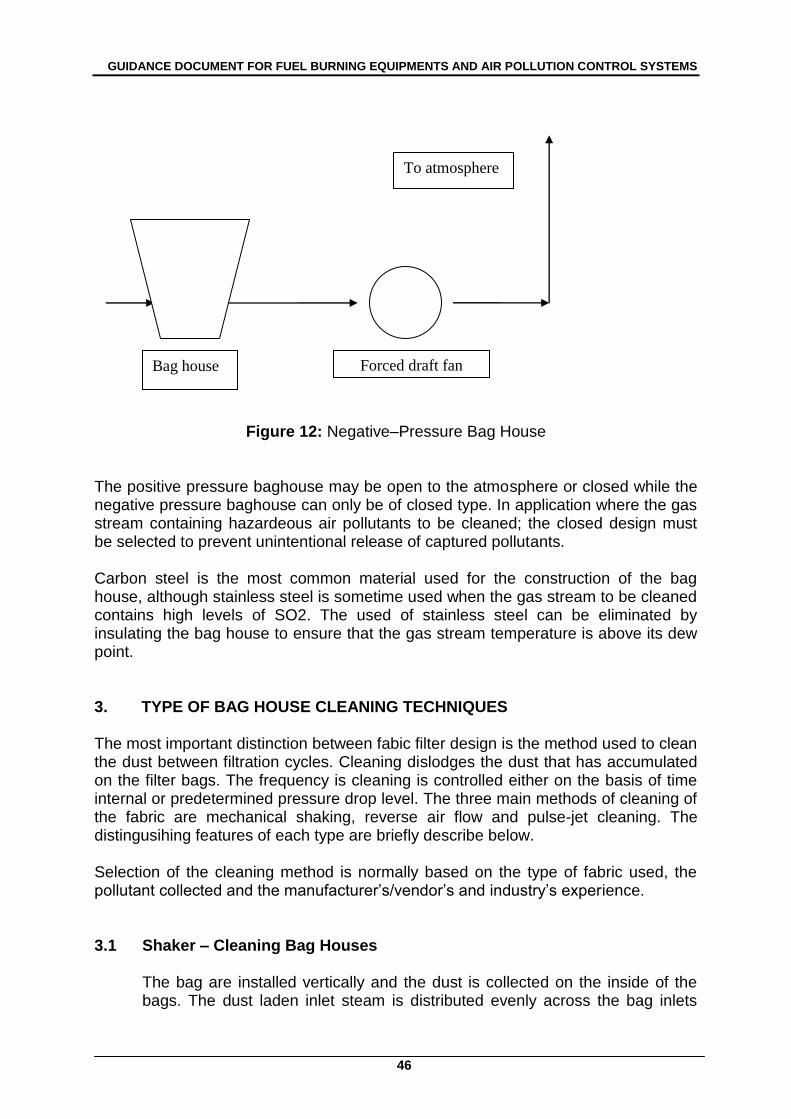
Figure 12: Negative–Pressure Bag House The positive pressure baghouse may be open to the atmosphere or closed while the negative pressure baghouse can only be of closed type. In application where the gas stream containing hazardeous air pollutants to be cleaned; the closed design must be selected to prevent unintentional release of captured pollutants. Carbon steel is the most common material used for the construction of the bag house, although stainless steel is sometime used when the gas stream to be cleaned contains high levels of SO2. The used of stainless steel can be eliminated by insulating the bag house to ensure that the gas stream temperature is above its dew point. 3. TYPE OF BAG HOUSE CLEANING TECHNIQUES The most important distinction between fabic filter design is the method used to clean the dust between filtration cycles. Cleaning dislodges the dust that has accumulated on the filter bags. The frequency is cleaning is controlled either on the basis of time internal or predetermined pressure drop level. The three main methods of cleaning of the fabric are mechanical shaking, reverse air flow and pulse-jet cleaning. The distingusihing features of each type are briefly describe below. Selection of the cleaning method is normally based on the type of fabric used, the pollutant collected and the manufacturer‘s/vendor‘s and industry‘s experience. 3.1 Shaker – Cleaning Bag Houses
The bag are installed vertically and the dust is collected on the inside of the bags. The dust laden inlet steam is distributed evenly across the bag inlets
Forced draft fan Bag house
To atmosphere
GUIDANCE DOCUMENT FOR FUEL BURNING EQUIPMENTS AND AIR POLLUTION CONTROL SYSTEMS
47
and clean air is exhausted to the atmosphere through the plenum and the blower.
After a predetermined operation time or allowable pressure drop, the filtering chamber is blocked for the cleaning process. The shaking action to clean the bags is accomplished by the use of a motor which moves a rod connected to the bags. The bags are closed at the top where they are attached to a shaking mechanism and are open at the bottom. During the cleaning process, the dust collected in the inside of the bag is dislodged and falls to the bottom and gets collected at the hopper. Sometimes, a slight reverse flow through the bag is used in combination with the shaking motion. Rupture bags are replaced manually and this exposes the worker to high dust level. Low superficial velocity (ie. Air to clotch ratio) is desirable to reduce the cleaning frequency. Optimum velocity range is 0.3 to 2.4 m/min and pressure drop of 2 to 6 inch water gauge (0.5 – 1.5 Kpa)
3.2 Reverse Air Cleaned Baghouses
The reverse flow or reverse air filter is similar to the shaker dust collector. As in the previous case, dust is collected on the internal bag surface, but in reverse air baghouses, dust is removed by back flushing with low pressure reverse flow. During the cleaning process the inlet flow of the dust laden gas is blocked. To maintain continuous flow stream, usually multiple chambers or isolatable compartments are employed or parallel collectors are installed. Reverse air flow baghouses are employed most frequently in high temperature applications (>149 0C) where synthetic material and woven fibre glass bags are used. The normal superficial velocity (ie. Air to clotch ratio) is 0.4 to 0.6 m/min and the allowable pressure drop is about 2 to 6 inch water gauge (0.5 – 1.5 Kpa) As before torn bags are replace manually where dust exposure to workers is a concern.
3.3 Pulse Jet Filters
These filters are also known as reverse pulse or reverse jet filters. As contrast to the previous two types of filters, here, the dust is collected on the outside surface of the bags. To prevent the collapse of bags due to pressure drop across the bags, the bags are installed on the outside of a cylindrical wire cage. The cage and bag filter are suspended from the fixed tube sheet. Bag cleaning is constructed with a reverse flow of air cleaned on-line while other bags filters are removing dust from the inlet dust –air stream. The cleaning action is normally programmed automatically on a desired cleaning frequency.
GUIDANCE DOCUMENT FOR FUEL BURNING EQUIPMENTS AND AIR POLLUTION CONTROL SYSTEMS
48
Felt fabrics are normally used in pulse-jet filters and the filtration velocities range from 0.9 – 4.6 m/min and pressure drop across the collector is generally 4 -6 inch water gauge (1 – 1.5 kPa). The collection efficiency is normally > 99.0% for a wide range of dusts. Cleaning frequency internals have reported as 2 – 15 min.
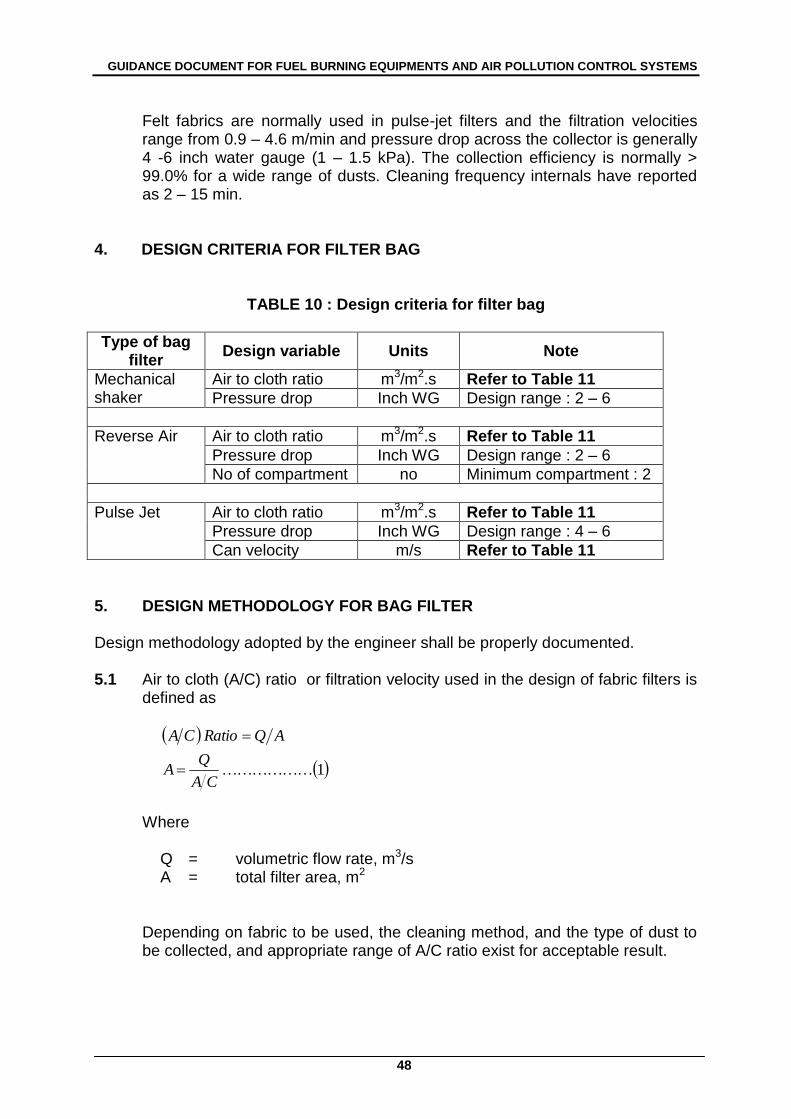
4. DESIGN CRITERIA FOR FILTER BAG
TABLE 10 : Design criteria for filter bag
Type of bag filter
Design variable Units Note
Mechanical shaker
Air to cloth ratio m3/m2.s Refer to Table 11
Pressure drop Inch WG Design range : 2 – 6
Reverse Air
Air to cloth ratio m3/m2.s Refer to Table 11
Pressure drop Inch WG Design range : 2 – 6
No of compartment no Minimum compartment : 2
Pulse Jet Air to cloth ratio m3/m2.s Refer to Table 11
Pressure drop Inch WG Design range : 4 – 6
Can velocity m/s Refer to Table 11
5. DESIGN METHODOLOGY FOR BAG FILTER Design methodology adopted by the engineer shall be properly documented.
5.1 Air to cloth (A/C) ratio or filtration velocity used in the design of fabric filters is
defined as
1CA
QA
AQRatioCA
Where
Q = volumetric flow rate, m3/s A = total filter area, m2
Depending on fabric to be used, the cleaning method, and the type of dust to be collected, and appropriate range of A/C ratio exist for acceptable result.
GUIDANCE DOCUMENT FOR FUEL BURNING EQUIPMENTS AND AIR POLLUTION CONTROL SYSTEMS
49
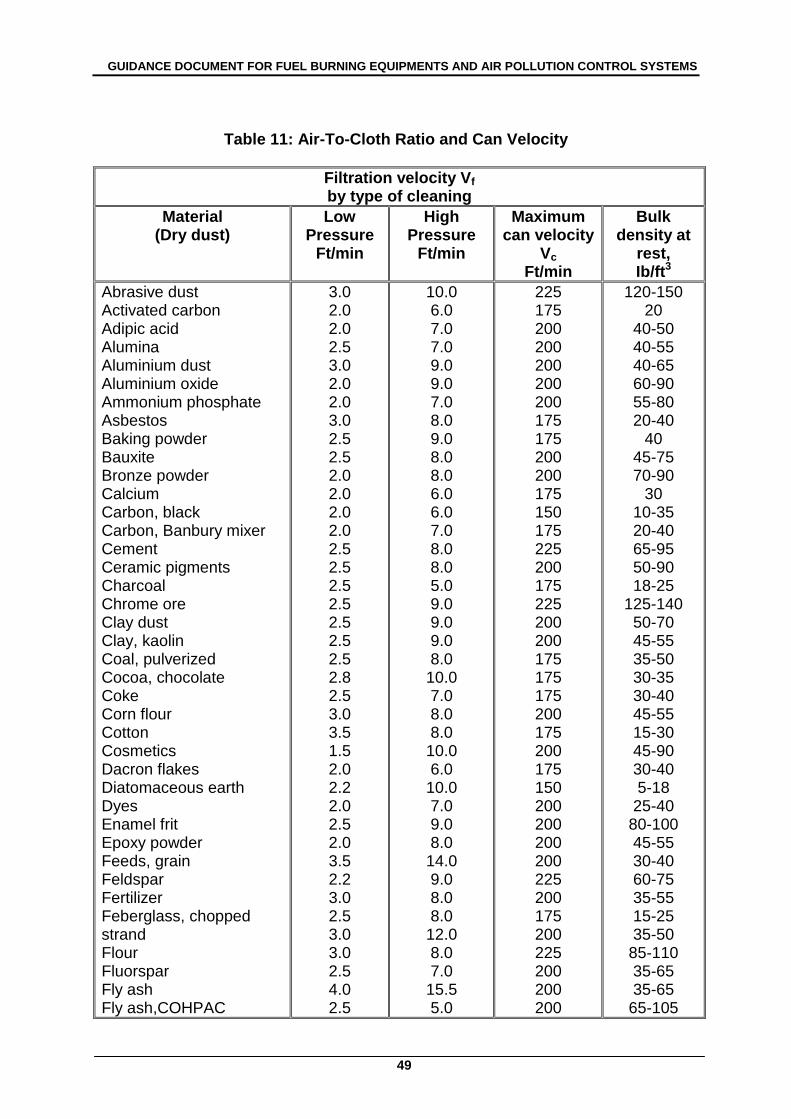
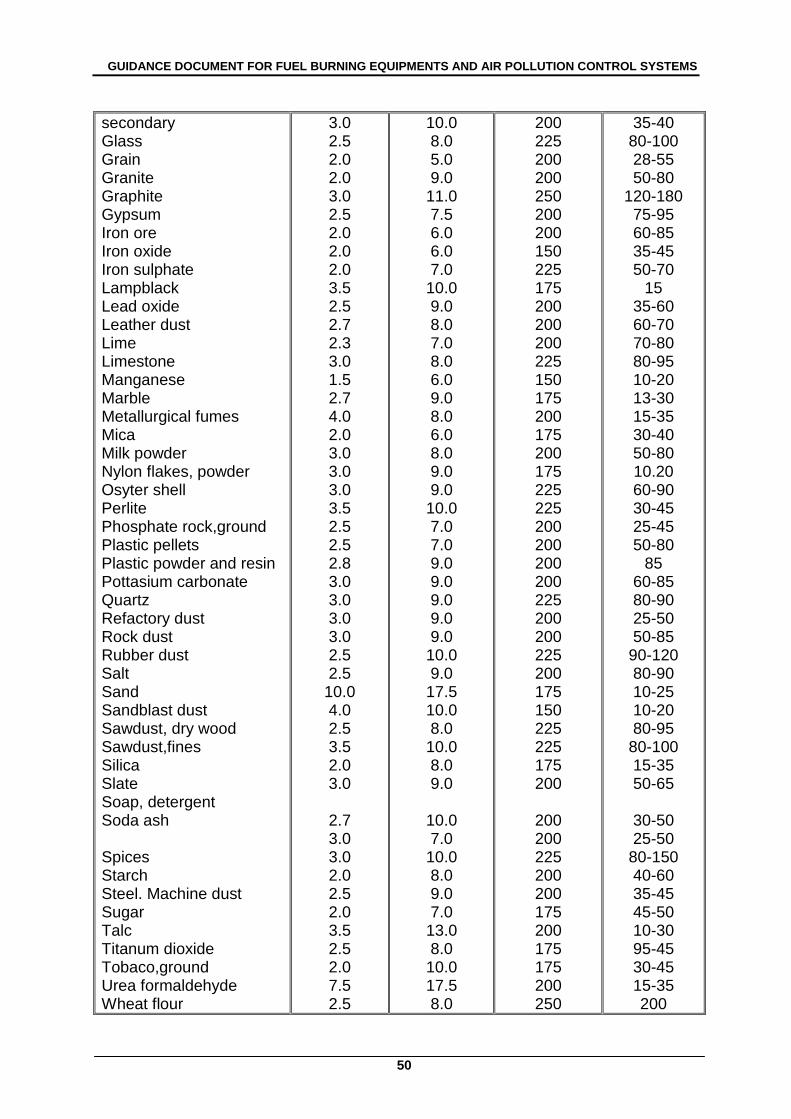
Table 11: Air-To-Cloth Ratio and Can Velocity
Filtration velocity Vf
by type of cleaning
Material (Dry dust)
Low Pressure
Ft/min
High Pressure
Ft/min
Maximum can velocity
Vc Ft/min
Bulk density at
rest, Ib/ft3
Abrasive dust Activated carbon Adipic acid Alumina Aluminium dust Aluminium oxide Ammonium phosphate Asbestos Baking powder Bauxite Bronze powder Calcium Carbon, black Carbon, Banbury mixer Cement Ceramic pigments Charcoal Chrome ore Clay dust Clay, kaolin Coal, pulverized Cocoa, chocolate Coke Corn flour Cotton Cosmetics Dacron flakes Diatomaceous earth Dyes Enamel frit Epoxy powder Feeds, grain Feldspar Fertilizer Feberglass, chopped strand Flour Fluorspar Fly ash Fly ash,COHPAC
3.0 2.0 2.0 2.5 3.0 2.0 2.0 3.0 2.5 2.5 2.0 2.0 2.0 2.0 2.5 2.5 2.5 2.5 2.5 2.5 2.5 2.8 2.5 3.0 3.5 1.5 2.0 2.2 2.0 2.5 2.0 3.5 2.2 3.0 2.5 3.0 3.0 2.5 4.0 2.5
10.0 6.0 7.0 7.0 9.0 9.0 7.0 8.0 9.0 8.0 8.0 6.0 6.0 7.0 8.0 8.0 5.0 9.0 9.0 9.0 8.0
10.0 7.0 8.0 8.0
10.0 6.0
10.0 7.0 9.0 8.0
14.0 9.0 8.0 8.0
12.0 8.0 7.0
15.5 5.0
225 175 200 200 200 200 200 175 175 200 200 175 150 175 225 200 175 225 200 200 175 175 175 200 175 200 175 150 200 200 200 200 225 200 175 200 225 200 200 200
120-150 20
40-50 40-55 40-65 60-90 55-80 20-40
40 45-75 70-90
30 10-35 20-40 65-95 50-90 18-25
125-140 50-70 45-55 35-50 30-35 30-40 45-55 15-30 45-90 30-40 5-18
25-40 80-100 45-55 30-40 60-75 35-55 15-25 35-50
85-110 35-65 35-65
65-105
GUIDANCE DOCUMENT FOR FUEL BURNING EQUIPMENTS AND AIR POLLUTION CONTROL SYSTEMS
50
secondary Glass Grain Granite Graphite Gypsum Iron ore Iron oxide Iron sulphate Lampblack Lead oxide Leather dust Lime Limestone Manganese Marble Metallurgical fumes Mica Milk powder Nylon flakes, powder Osyter shell Perlite Phosphate rock,ground Plastic pellets Plastic powder and resin Pottasium carbonate Quartz Refactory dust Rock dust Rubber dust Salt Sand Sandblast dust Sawdust, dry wood Sawdust,fines Silica Slate Soap, detergent Soda ash
Spices Starch Steel. Machine dust Sugar Talc Titanum dioxide Tobaco,ground Urea formaldehyde Wheat flour
3.0 2.5 2.0 2.0 3.0 2.5 2.0 2.0 2.0 3.5 2.5 2.7 2.3 3.0 1.5 2.7 4.0 2.0 3.0 3.0 3.0 3.5 2.5 2.5 2.8 3.0 3.0 3.0 3.0 2.5 2.5
10.0 4.0 2.5 3.5 2.0 3.0
2.7 3.0 3.0 2.0 2.5 2.0 3.5 2.5 2.0 7.5 2.5
10.0 8.0 5.0 9.0
11.0 7.5 6.0 6.0 7.0
10.0 9.0 8.0 7.0 8.0 6.0 9.0 8.0 6.0 8.0 9.0 9.0
10.0 7.0 7.0 9.0 9.0 9.0 9.0 9.0
10.0 9.0
17.5 10.0 8.0
10.0 8.0 9.0
10.0 7.0
10.0 8.0 9.0 7.0
13.0 8.0
10.0 17.5 8.0
200 225 200 200 250 200 200 150 225 175 200 200 200 225 150 175 200 175 200 175 225 225 200 200 200 200 225 200 200 225 200 175 150 225 225 175 200
200 200 225 200 200 175 200 175 175 200 250
35-40 80-100 28-55 50-80
120-180 75-95 60-85 35-45 50-70
15 35-60 60-70 70-80 80-95 10-20 13-30 15-35 30-40 50-80 10.20 60-90 30-45 25-45 50-80
85 60-85 80-90 25-50 50-85
90-120 80-90 10-25 10-20 80-95
80-100 15-35 50-65
30-50 25-50
80-150 40-60 35-45 45-50 10-30 95-45 30-45 15-35 200
GUIDANCE DOCUMENT FOR FUEL BURNING EQUIPMENTS AND AIR POLLUTION CONTROL SYSTEMS
51
Wood chips and dust Zinc, metallic dust Zinc oxide Zirconium oxide Intake filter-compressed air
2.0 2.5 40
7.0 7.0 -
200 225
-
25-55 70-85
-
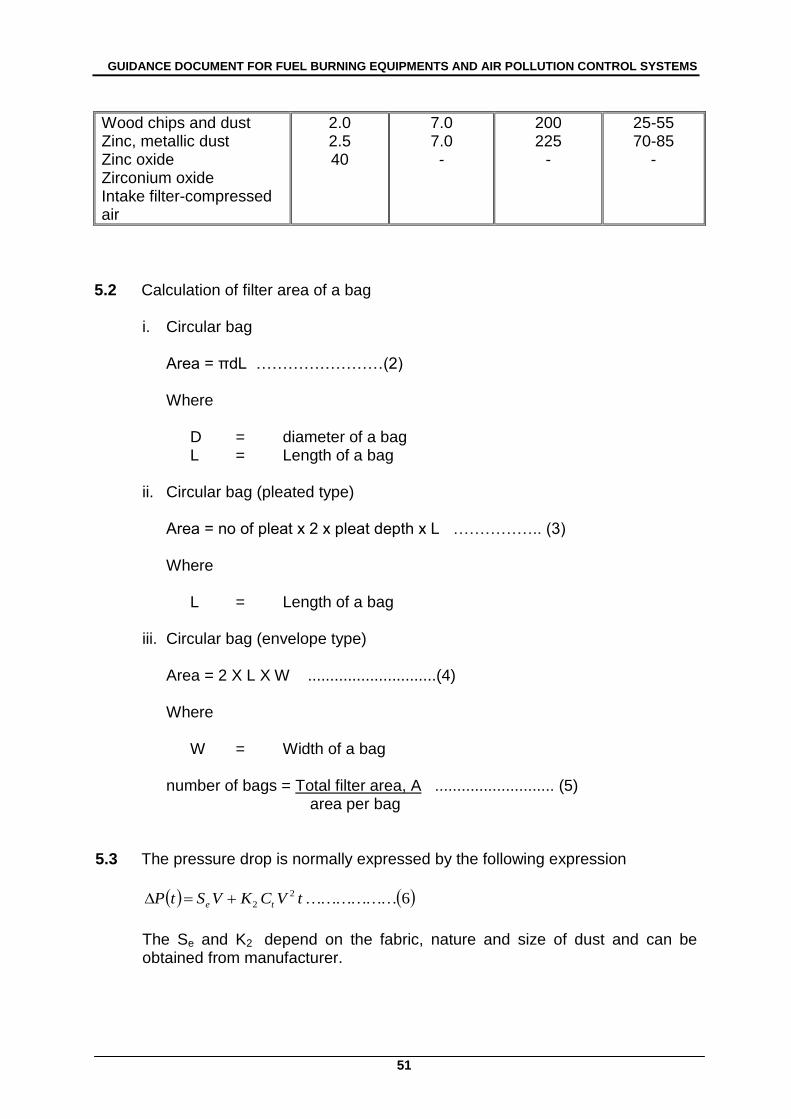
5.2 Calculation of filter area of a bag
i. Circular bag
Area = πdL ……………………(2)
Where
D = diameter of a bag L = Length of a bag
ii. Circular bag (pleated type)
Area = no of pleat x 2 x pleat depth x L …………….. (3)
Where L = Length of a bag
iii. Circular bag (envelope type)
Area = 2 X L X W .............................(4)
Where W = Width of a bag
number of bags = Total filter area, A ........................... (5) area per bag
5.3 The pressure drop is normally expressed by the following expression
62
2 tVCKVStP te
The Se and K2 depend on the fabric, nature and size of dust and can be obtained from manufacturer.
GUIDANCE DOCUMENT FOR FUEL BURNING EQUIPMENTS AND AIR POLLUTION CONTROL SYSTEMS
52
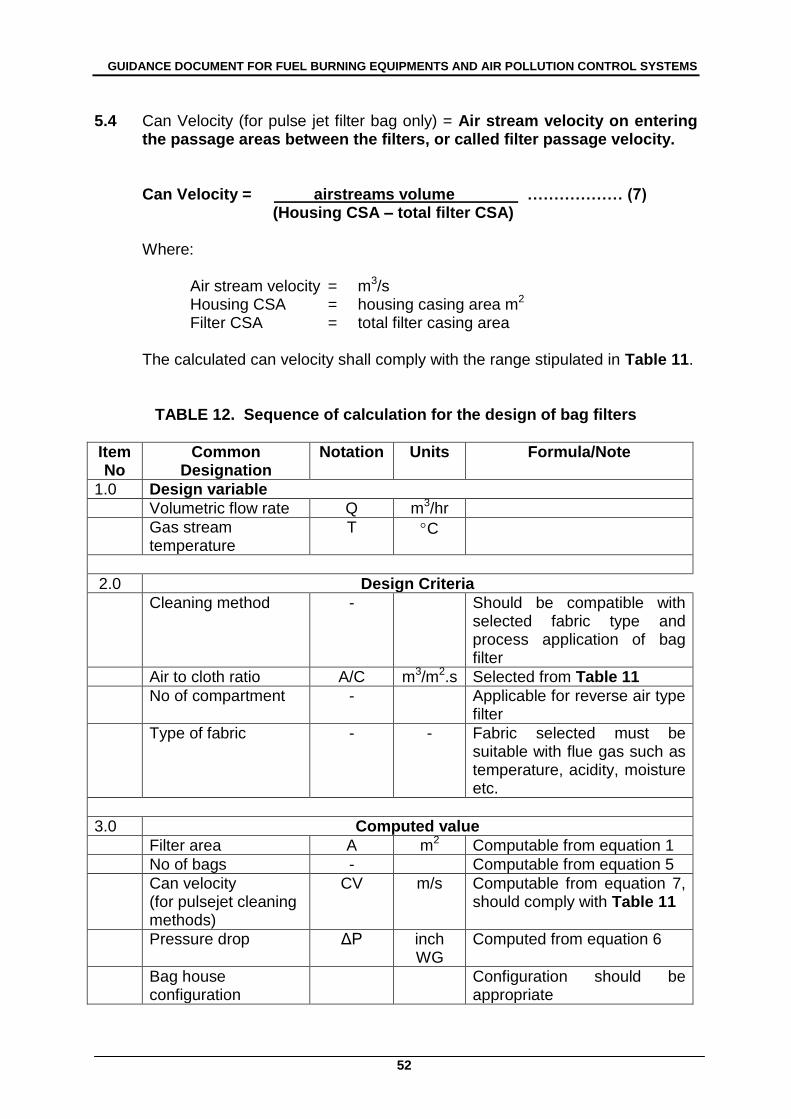
5.4 Can Velocity (for pulse jet filter bag only) = Air stream velocity on entering the passage areas between the filters, or called filter passage velocity.
Can Velocity = airstreams volume ……………… (7) (Housing CSA – total filter CSA)
Where:
Air stream velocity = m3/s Housing CSA = housing casing area m2 Filter CSA = total filter casing area
The calculated can velocity shall comply with the range stipulated in Table 11.
TABLE 12. Sequence of calculation for the design of bag filters
Item No
Common Designation
Notation Units Formula/Note
1.0 Design variable
Volumetric flow rate Q m3/hr
Gas stream temperature
T C
2.0 Design Criteria
Cleaning method - Should be compatible with selected fabric type and process application of bag filter
Air to cloth ratio A/C m3/m2.s Selected from Table 11
No of compartment - Applicable for reverse air type filter
Type of fabric - - Fabric selected must be suitable with flue gas such as temperature, acidity, moisture etc.
3.0 Computed value
Filter area A m2 Computable from equation 1
No of bags - Computable from equation 5
Can velocity (for pulsejet cleaning methods)
CV m/s Computable from equation 7, should comply with Table 11
Pressure drop ΔP inch WG
Computed from equation 6
Bag house configuration
Configuration should be appropriate
GUIDANCE DOCUMENT FOR FUEL BURNING EQUIPMENTS AND AIR POLLUTION CONTROL SYSTEMS
53
6. INSTRUMENTATION FOR PROCESS CONTROL The efficiency of bag filter operation is highly depending on incoming flue gas to be treated and differential pressure drop across bag filter. The design engineer shall incorporate instrumentation system to monitor the following parameter :
Pressure drop across bag
Temperature of flue gas entering bag filter
Volumetric flow rate or monitor fan ampere
Compress air supply to pulse jet (for pulse jet cleaning method) 7. ACCESSORIES EQUIPMENT Design engineer shall consider to install additional auxiliary equipment base on characteristic of flue gas or dust characteristic. Example of auxiliary equipment as follow
Vibrator install at hopper section
Dust level sensor
Dust screw conveyor
Explosion relief vent
Fluidization
Dust emission monitoring sensor
Bag leak detector
GUIDANCE DOCUMENT FOR FUEL BURNING EQUIPMENTS AND AIR POLLUTION CONTROL SYSTEMS
54
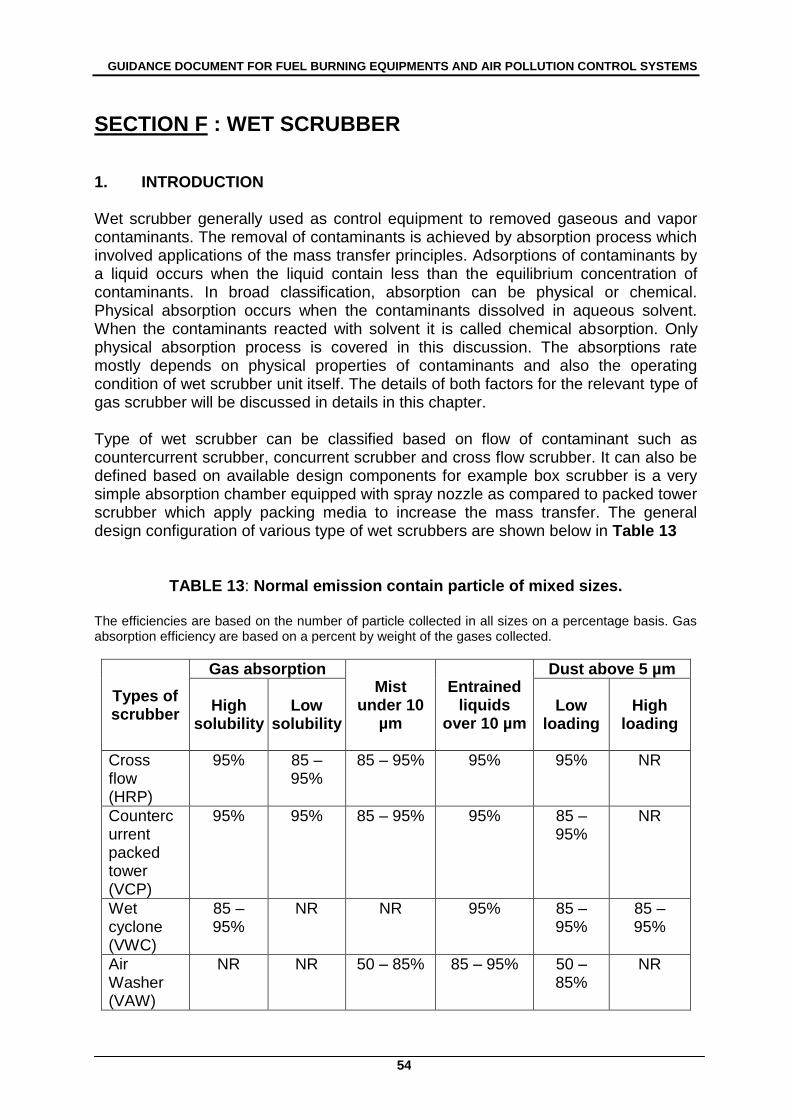
SECTION F : WET SCRUBBER
1. INTRODUCTION
Wet scrubber generally used as control equipment to removed gaseous and vapor contaminants. The removal of contaminants is achieved by absorption process which involved applications of the mass transfer principles. Adsorptions of contaminants by a liquid occurs when the liquid contain less than the equilibrium concentration of contaminants. In broad classification, absorption can be physical or chemical. Physical absorption occurs when the contaminants dissolved in aqueous solvent. When the contaminants reacted with solvent it is called chemical absorption. Only physical absorption process is covered in this discussion. The absorptions rate mostly depends on physical properties of contaminants and also the operating condition of wet scrubber unit itself. The details of both factors for the relevant type of gas scrubber will be discussed in details in this chapter. Type of wet scrubber can be classified based on flow of contaminant such as countercurrent scrubber, concurrent scrubber and cross flow scrubber. It can also be defined based on available design components for example box scrubber is a very simple absorption chamber equipped with spray nozzle as compared to packed tower scrubber which apply packing media to increase the mass transfer. The general design configuration of various type of wet scrubbers are shown below in Table 13
TABLE 13: Normal emission contain particle of mixed sizes.
The efficiencies are based on the number of particle collected in all sizes on a percentage basis. Gas absorption efficiency are based on a percent by weight of the gases collected.
Types of scrubber
Gas absorption Mist
under 10 µm
Entrained liquids
over 10 µm
Dust above 5 µm
High solubility
Low solubility
Low loading
High loading
Cross flow (HRP)
95% 85 – 95%
85 – 95% 95% 95% NR
Countercurrent packed tower (VCP)
95% 95% 85 – 95% 95% 85 – 95%
NR
Wet cyclone (VWC)
85 – 95%
NR NR 95% 85 – 95%
85 – 95%
Air Washer (VAW)
NR NR 50 – 85% 85 – 95% 50 – 85%
NR
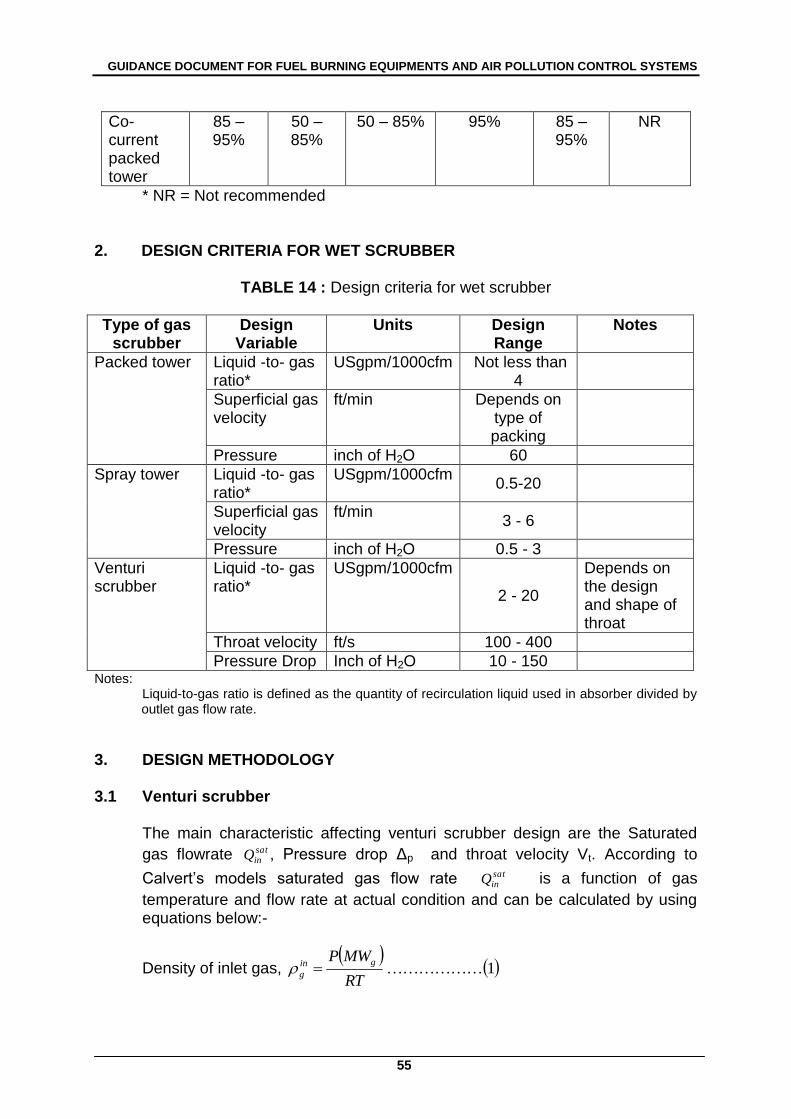
GUIDANCE DOCUMENT FOR FUEL BURNING EQUIPMENTS AND AIR POLLUTION CONTROL SYSTEMS
55
Co-current packed tower
85 – 95%
50 – 85%
50 – 85% 95% 85 – 95%
NR
* NR = Not recommended
2. DESIGN CRITERIA FOR WET SCRUBBER
TABLE 14 : Design criteria for wet scrubber
Type of gas scrubber
Design Variable
Units Design Range
Notes
Packed tower Liquid -to- gas ratio*
USgpm/1000cfm Not less than 4
Superficial gas velocity
ft/min Depends on type of packing
Pressure inch of H2O 60
Spray tower Liquid -to- gas ratio*
USgpm/1000cfm 0.5-20
Superficial gas velocity
ft/min 3 - 6
Pressure inch of H2O 0.5 - 3
Venturi scrubber
Liquid -to- gas ratio*
USgpm/1000cfm
2 - 20
Depends on the design and shape of throat
Throat velocity ft/s 100 - 400
Pressure Drop Inch of H2O 10 - 150 Notes:
Liquid-to-gas ratio is defined as the quantity of recirculation liquid used in absorber divided by outlet gas flow rate.
3. DESIGN METHODOLOGY
3.1 Venturi scrubber
The main characteristic affecting venturi scrubber design are the Saturated
gas flowrate satinQ , Pressure drop Δp and throat velocity Vt. According to
Calvert‘s models saturated gas flow rate satinQ is a function of gas
temperature and flow rate at actual condition and can be calculated by using equations below:-
Density of inlet gas,
1RT
MWP gin
g
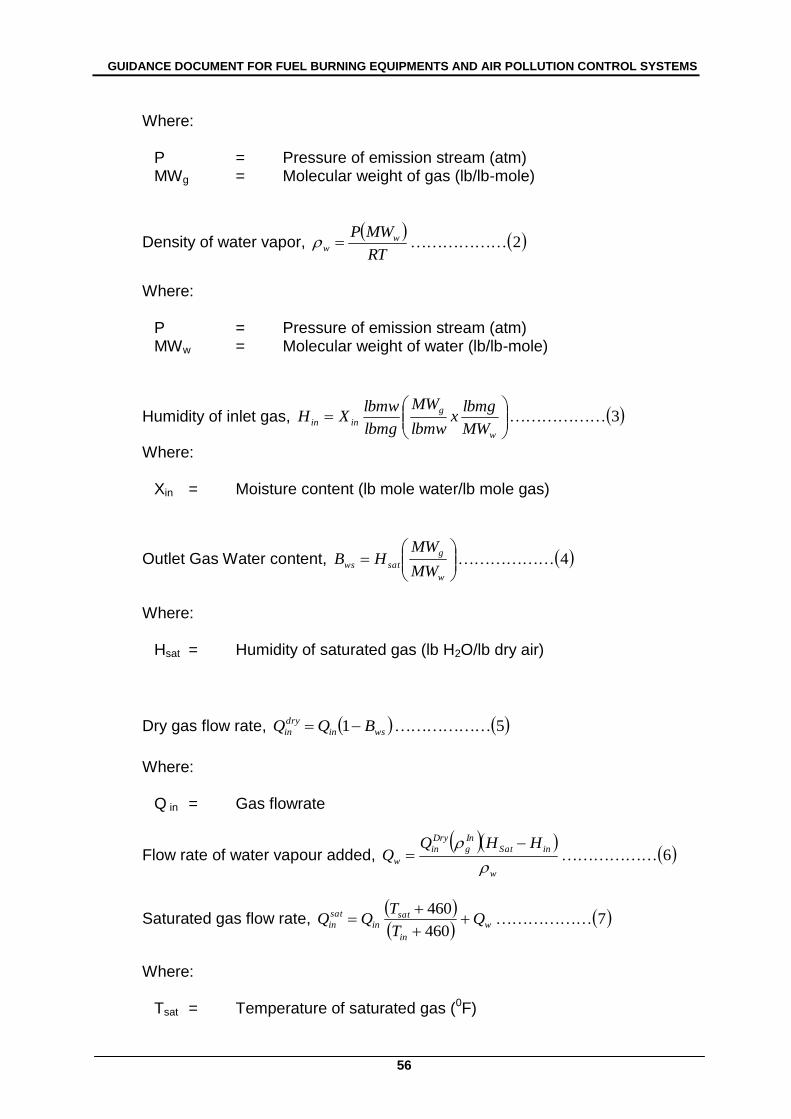
GUIDANCE DOCUMENT FOR FUEL BURNING EQUIPMENTS AND AIR POLLUTION CONTROL SYSTEMS
56
Where: P = Pressure of emission stream (atm) MWg = Molecular weight of gas (lb/lb-mole)
Density of water vapor,
2RT
MWP ww
Where: P = Pressure of emission stream (atm) MWw = Molecular weight of water (lb/lb-mole)
Humidity of inlet gas, 3
w
g
ininMW
lbmgx
lbmw
MW
lbmg
lbmwXH
Where: Xin = Moisture content (lb mole water/lb mole gas)
Outlet Gas Water content, 4
w
g
satwsMW
MWHB
Where: Hsat = Humidity of saturated gas (lb H2O/lb dry air)
Dry gas flow rate, 51 wsin
dry
in BQQ
Where:
Q in = Gas flowrate
Flow rate of water vapour added,
6w
inSat
In
g
Dry
in
w
HHQQ
Saturated gas flow rate,
7460
460w
in
satin
sat
in QT
TQQ
Where: Tsat = Temperature of saturated gas (0F)
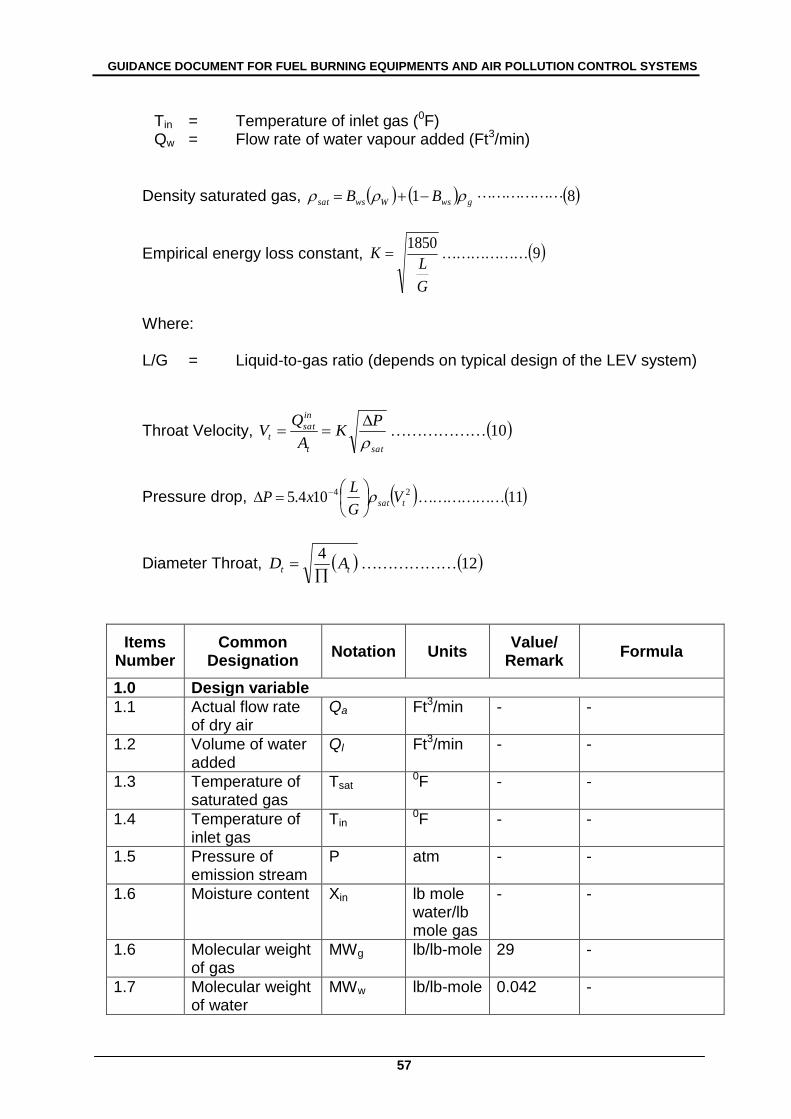
GUIDANCE DOCUMENT FOR FUEL BURNING EQUIPMENTS AND AIR POLLUTION CONTROL SYSTEMS
57
Tin = Temperature of inlet gas (0F) Qw = Flow rate of water vapour added (Ft3/min)
Density saturated gas, 81 gwsWwssat BB
Empirical energy loss constant, 91850
G
LK
Where:
L/G = Liquid-to-gas ratio (depends on typical design of the LEV system)
Throat Velocity, 10satt
in
satt
PK
A
QV
Pressure drop, 11104.5 24 tsat VG
LxP
Diameter Throat, 124
tt AD
Items Number
Common Designation
Notation Units Value/
Remark Formula
1.0 Design variable
1.1 Actual flow rate of dry air
Qa Ft3/min - -
1.2 Volume of water added
Ql Ft3/min - -
1.3 Temperature of saturated gas
Tsat 0F - -
1.4 Temperature of inlet gas
Tin 0F - -
1.5 Pressure of emission stream
P atm - -
1.6 Moisture content Xin lb mole water/lb mole gas
- -
1.6 Molecular weight of gas
MWg lb/lb-mole 29 -
1.7 Molecular weight of water
MWw lb/lb-mole 0.042 -
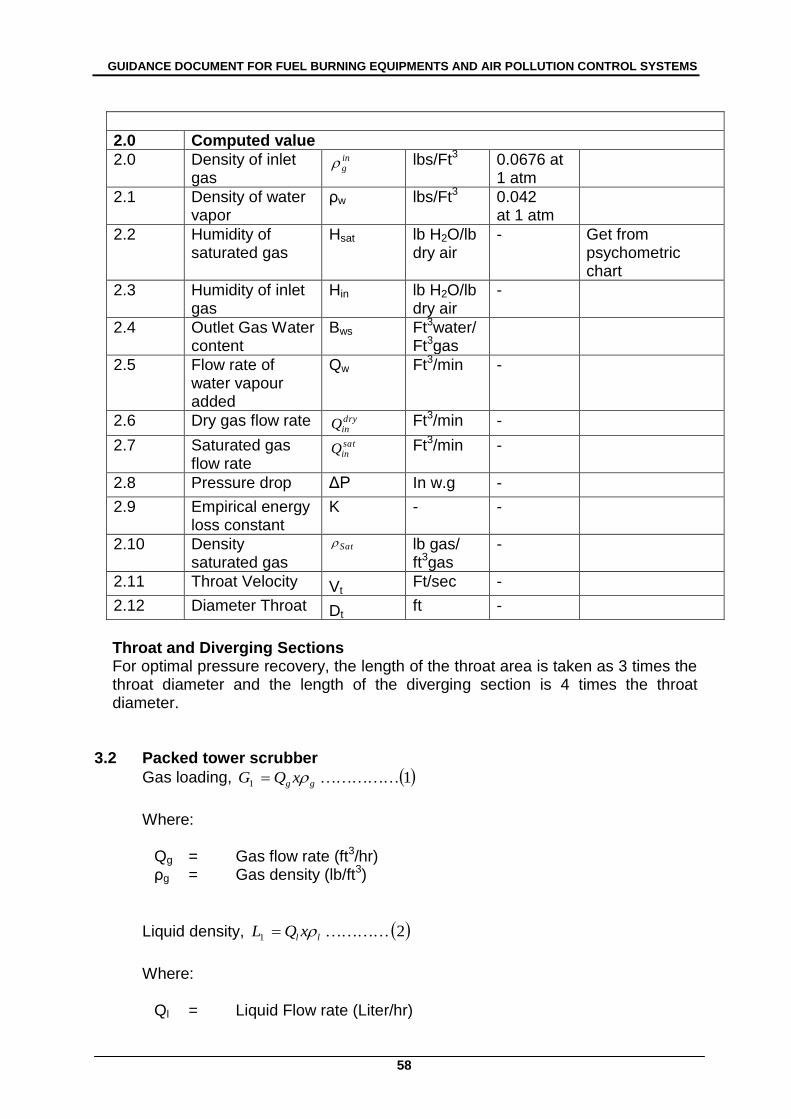
GUIDANCE DOCUMENT FOR FUEL BURNING EQUIPMENTS AND AIR POLLUTION CONTROL SYSTEMS
58
2.0 Computed value
2.0 Density of inlet gas
ing lbs/Ft3 0.0676 at
1 atm
2.1 Density of water vapor
ρw lbs/Ft3 0.042 at 1 atm
2.2 Humidity of saturated gas
Hsat lb H2O/lb dry air
- Get from psychometric chart
2.3 Humidity of inlet gas
Hin lb H2O/lb dry air
-
2.4 Outlet Gas Water content
Bws Ft3water/ Ft3gas
2.5 Flow rate of water vapour added
Qw Ft3/min -
2.6 Dry gas flow rate dryinQ Ft3/min -
2.7 Saturated gas flow rate
satinQ Ft3/min -
2.8 Pressure drop ΔP In w.g - 2.9 Empirical energy
loss constant K - -
2.10 Density saturated gas
Sat lb gas/ ft3gas
-
2.11 Throat Velocity Vt Ft/sec -
2.12 Diameter Throat Dt ft -
Throat and Diverging Sections For optimal pressure recovery, the length of the throat area is taken as 3 times the throat diameter and the length of the diverging section is 4 times the throat diameter.
3.2 Packed tower scrubber
Gas loading, 11 gg xQG
Where:
Qg = Gas flow rate (ft3/hr) ρg = Gas density (lb/ft3)
Liquid density, 21 ll xQL
Where:
Ql = Liquid Flow rate (Liter/hr)
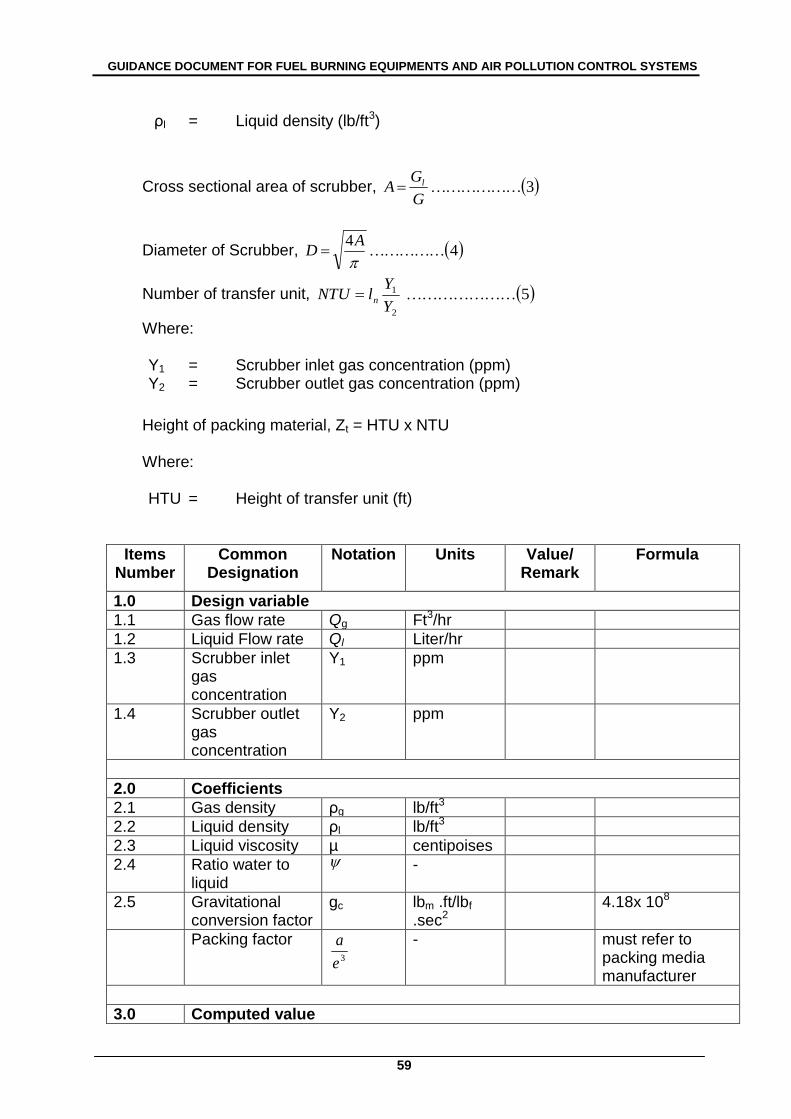
GUIDANCE DOCUMENT FOR FUEL BURNING EQUIPMENTS AND AIR POLLUTION CONTROL SYSTEMS
59
ρl = Liquid density (lb/ft3)
Cross sectional area of scrubber, 3G
GA l
Diameter of Scrubber, 44
AD
Number of transfer unit, 52
1 Y
YlNTU n
Where: Y1 = Scrubber inlet gas concentration (ppm) Y2 = Scrubber outlet gas concentration (ppm)
Height of packing material, Zt = HTU x NTU Where: HTU = Height of transfer unit (ft)
Items Number
Common Designation
Notation Units Value/ Remark
Formula
1.0 Design variable
1.1 Gas flow rate Qg Ft3/hr
1.2 Liquid Flow rate Ql Liter/hr
1.3 Scrubber inlet gas concentration
Y1 ppm
1.4 Scrubber outlet gas concentration
Y2 ppm
2.0 Coefficients
2.1 Gas density ρg lb/ft3
2.2 Liquid density ρl lb/ft3
2.3 Liquid viscosity µ centipoises
2.4 Ratio water to liquid
-
2.5 Gravitational conversion factor
gc lbm .ft/lbf
.sec2 4.18x 10⁸
Packing factor 3e
a
- must refer to packing media manufacturer
3.0 Computed value
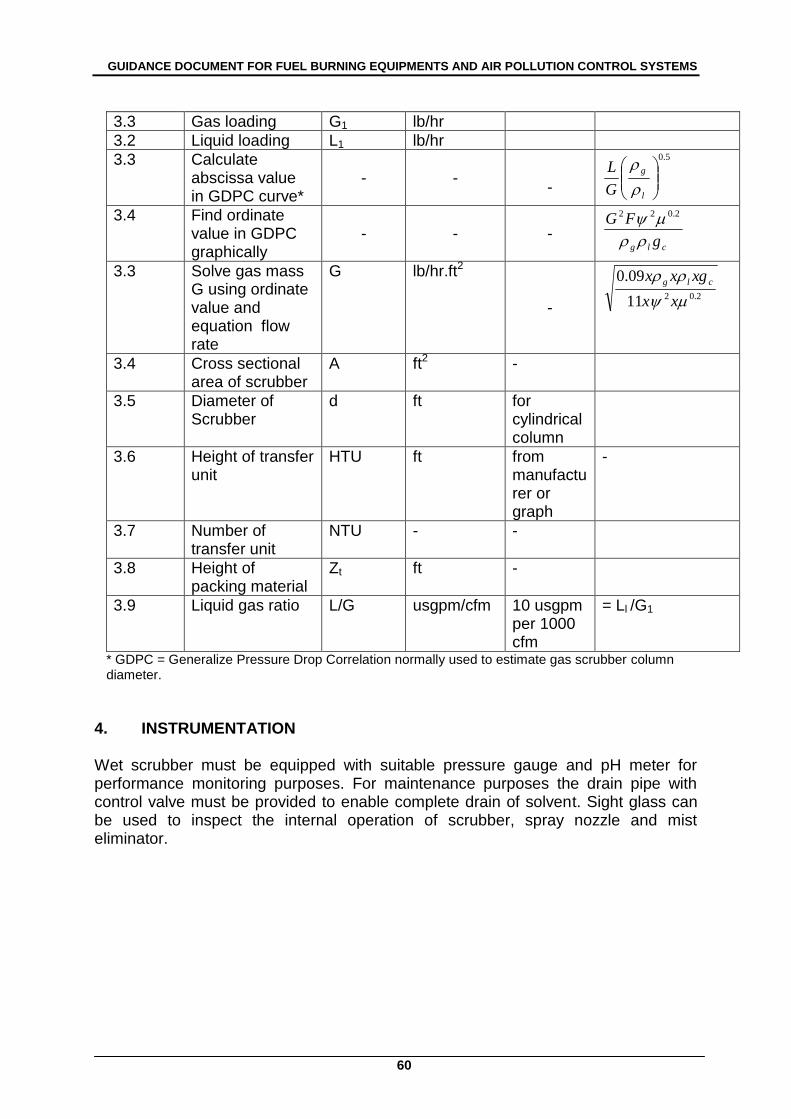
GUIDANCE DOCUMENT FOR FUEL BURNING EQUIPMENTS AND AIR POLLUTION CONTROL SYSTEMS
60
3.3 Gas loading G1 lb/hr
3.2 Liquid loading L1 lb/hr
3.3 Calculate abscissa value in GDPC curve*
- - -
5.0
l
g
G
L
3.4 Find ordinate value in GDPC graphically
- - - clg g
FG
2.022
3.3 Solve gas mass G using ordinate value and equation flow rate
G lb/hr.ft2
- 2.0211
09.0
xx
xgxx clg
3.4 Cross sectional area of scrubber
A ft2 -
3.5 Diameter of Scrubber
d ft for cylindrical column
3.6 Height of transfer unit
HTU ft from manufacturer or graph
-
3.7 Number of transfer unit
NTU - -
3.8 Height of packing material
Zt ft -
3.9 Liquid gas ratio L/G usgpm/cfm 10 usgpm per 1000 cfm
= Ll /G1
* GDPC = Generalize Pressure Drop Correlation normally used to estimate gas scrubber column diameter.
4. INSTRUMENTATION
Wet scrubber must be equipped with suitable pressure gauge and pH meter for performance monitoring purposes. For maintenance purposes the drain pipe with control valve must be provided to enable complete drain of solvent. Sight glass can be used to inspect the internal operation of scrubber, spray nozzle and mist eliminator.
GUIDANCE DOCUMENT FOR FUEL BURNING EQUIPMENTS AND AIR POLLUTION CONTROL SYSTEMS
61
SECTION G : FLUE GAS DESULFURIZATION (FGD)
1. INTRODUCTION
One of the control technology available to remove SO2 in flue gas emitted from power plant especially coal power plant is Flue Gas Desulfurization (FGD). Generally FGD can be classified in two main categories namely Once-Through and regenerable. The different between both categories depends on whether the solution that is use to absorbed SO2 is recycled or not. In Once-Through system the solution is not recycle as compare to regenerable system where the absorbed SO2 will be released and used to produce by-product whereas in regeneration process the solution will be recycled in absorber. Furthermore both category of FGD can also be breakdown as wet or dry types which refer to the form of absorbent used in the system and it could involve the use of absorbent in liquid slurry or dry form.
2. OPERATING PRINCIPLE
In industry, Once-Through system is being applied extensively as compared to regenerable system. Therefore in this guideline the focus will be more on Once-Through system. 2.1 Once-Through Wet FGD
Once-Through wet FGD normally involve used of absorber tower with alkaline slurry in counter current flow. Some plants may equipped with limestone preparation facilities which includes crushing and mixing processes. SO2 in flue gas is absorbed and partially reacted when in contact with lime slurry. The complete reaction process takes place in reaction tank places underneath the absorber tower. The overall reaction are given below :-
2242322
223232
2221
2121
COOHCaSOOHCaCOOSO
COOHCaSOOHCaCOSO
The Sulfite oxidation to sulfate could be in natural oxidation or forced oxidation and the later mode are more preferred because it can reduce scaling problem.
2.2 Once-Through Dry FGD
The operation of Once-Through dry FGD is based on absorbtion of SO2 in flue gas when in contact with alkaline sorbent either introduced in dry form or slurry form. In dry system the sorbent could be recycle to increase the process efficiency. Dry FGD system must includes the particulate control system such as Electrostatic Precipitator to control the emission particulate after the absorber. There are many design configuration of dry FGD system such as
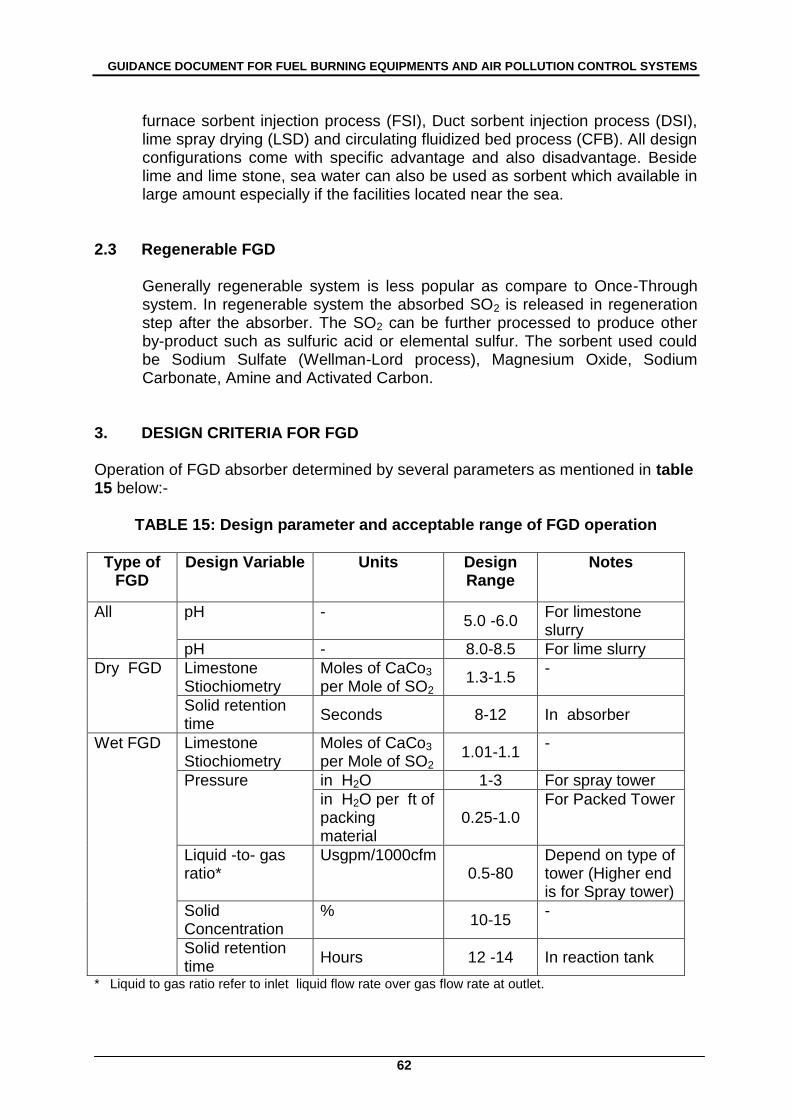
GUIDANCE DOCUMENT FOR FUEL BURNING EQUIPMENTS AND AIR POLLUTION CONTROL SYSTEMS
62
furnace sorbent injection process (FSI), Duct sorbent injection process (DSI), lime spray drying (LSD) and circulating fluidized bed process (CFB). All design configurations come with specific advantage and also disadvantage. Beside lime and lime stone, sea water can also be used as sorbent which available in large amount especially if the facilities located near the sea.
2.3 Regenerable FGD Generally regenerable system is less popular as compare to Once-Through system. In regenerable system the absorbed SO2 is released in regeneration step after the absorber. The SO2 can be further processed to produce other by-product such as sulfuric acid or elemental sulfur. The sorbent used could be Sodium Sulfate (Wellman-Lord process), Magnesium Oxide, Sodium Carbonate, Amine and Activated Carbon.
3. DESIGN CRITERIA FOR FGD
Operation of FGD absorber determined by several parameters as mentioned in table 15 below:-
TABLE 15: Design parameter and acceptable range of FGD operation
Type of FGD
Design Variable Units Design Range
Notes
All pH - 5.0 -6.0
For limestone slurry
pH - 8.0-8.5 For lime slurry
Dry FGD Limestone Stiochiometry
Moles of CaCo3 per Mole of SO2
1.3-1.5 -
Solid retention time
Seconds 8-12 In absorber
Wet FGD Limestone Stiochiometry
Moles of CaCo3 per Mole of SO2
1.01-1.1 -
Pressure in H2O 1-3 For spray tower
in H2O per ft of packing material
0.25-1.0 For Packed Tower
Liquid -to- gas ratio*
Usgpm/1000cfm 0.5-80
Depend on type of tower (Higher end is for Spray tower)
Solid Concentration
% 10-15
-
Solid retention time
Hours 12 -14 In reaction tank
* Liquid to gas ratio refer to inlet liquid flow rate over gas flow rate at outlet.
GUIDANCE DOCUMENT FOR FUEL BURNING EQUIPMENTS AND AIR POLLUTION CONTROL SYSTEMS
63
4. INSTRUMENTATION The reliability of instrument is important when dealing with FGD system because of the scaling problem and reactive reagent involve. There are limited numbers of instrumentation required in FGD system. The following are the instrumentation required for the system :
Manometer for measuring pressure drop across FGD unit, across packing and across mist eliminator
Volumetric gaseous flow rate or monitor fan ampere Thermometer for of flue gas entering and exit from FGD pH meter Scrubber water pressure gauge Scrubber water flowmeter
GUIDANCE DOCUMENT FOR FUEL BURNING EQUIPMENTS AND AIR POLLUTION CONTROL SYSTEMS
64
SECTION H : INITIAL SEPARATORS AND CENTRIFUGAL COLLECTORS
1. INTRODUCTION
Initial separators or settling chambers are widely used in industrial premises for the collection of medium sized and course particles. The most common type of initial separators is the cyclone. Centrifugal collector are principally similar to initial separators with a difference ie. They have a rotating vane in the collector body to move the air as well as to separate the dust. Air stream containing large particles can be cleaned by passing it through a cyclone. This dust arrestment device has low a capital as well as maintenance cost and it can be constructed to withstand harsh operating conditions. Cyclones are usually used as precleaners in combination with other more expensive dust control equipment such as the fabric filter or electrostatic precipitators. Cyclone removes large and abrasive particulates and reduces dust loading to the fabric filter. Typical situations where cyclones are used are in wood-working operations, palm oil mills and for handling grinding and machine dust in tool rooms. Sometimes a number of cyclones are used in parallel to handle large volumes of gas stream and such an arrangement is termed ‗multi cyclone‘.
The cyclones work on the centrifugal force which is proportional to the square of the tangential velocity and inversely proportional to the radius of curvature of the gas trajectory. Hence, the efficiency of a cyclone increases as the diameter of the device is reduced. To achieve higher efficiencies cyclones are constructed with small diameters. But, the disadvantage is the rapid increase in the pressure drop as the tangential velocity increases. The use of multi cyclone ensures that high efficiencies are achieved with a moderate pressure drop.
2. THE DESIGN OF A CYCLONE
The design of cyclones is usually based on geometric similarity such that ratios of the dimensions remain constant at different diameters. The dimensions are expressed in terms of the body diameter. Table 1 shows the values of the ratios which in turn determines the type of cyclone whether it falls into the conventional, high-efficiency or high-throughput type.
The cyclone dimensions to be determined by the design engineer are namely: cylinder diameter (Do), cylinder length (Lb), cone length (Lc), gas exit diameter (De), gas exit length or vortex finder (S), gas inlet height (H), gas inlet width (W) and dust outlet (Dd). High efficiency cyclones have smaller values of gas inlet width (W) whereas high-throughput cyclones have larger values of W and gas, exit diameter (De). Fig. 4.2 illustrates the schematics of a cyclone.
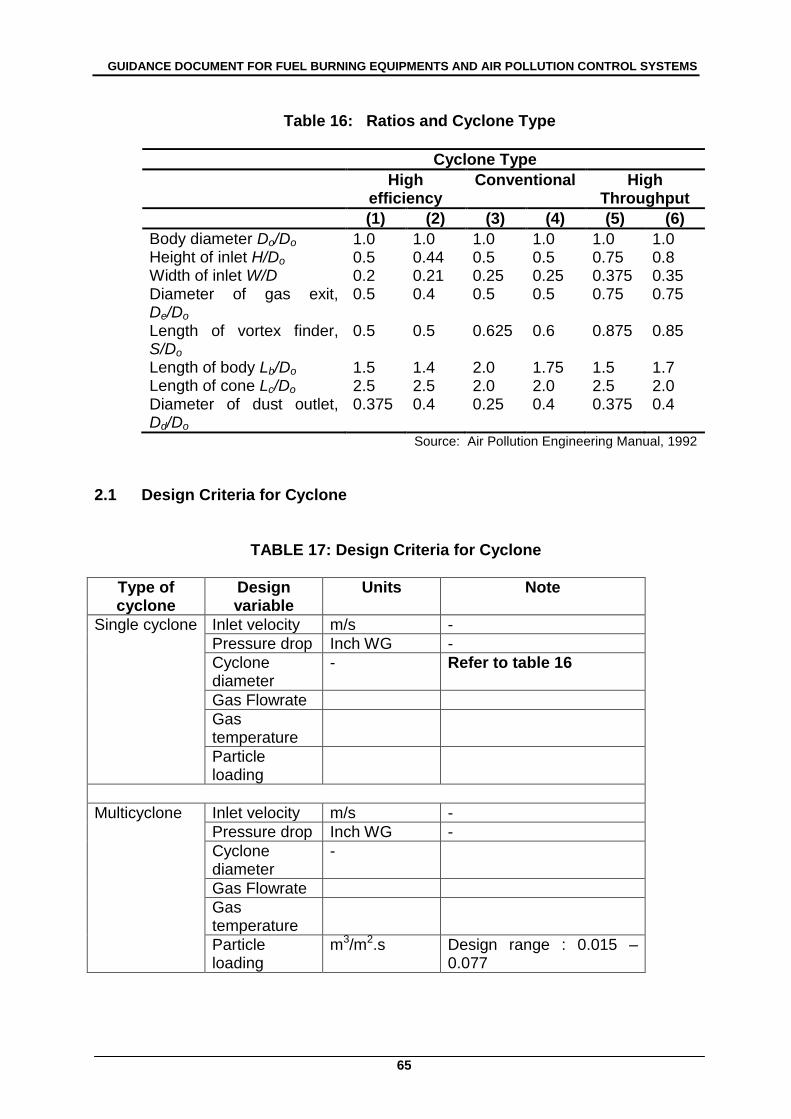
GUIDANCE DOCUMENT FOR FUEL BURNING EQUIPMENTS AND AIR POLLUTION CONTROL SYSTEMS
65
Table 16: Ratios and Cyclone Type
Cyclone Type
High efficiency
Conventional High Throughput
(1) (2) (3) (4) (5) (6)
Body diameter Do/Do 1.0 1.0 1.0 1.0 1.0 1.0 Height of inlet H/Do 0.5 0.44 0.5 0.5 0.75 0.8 Width of inlet W/D 0.2 0.21 0.25 0.25 0.375 0.35 Diameter of gas exit, De/Do
0.5 0.4 0.5 0.5 0.75 0.75
Length of vortex finder, S/Do
0.5 0.5 0.625 0.6 0.875 0.85
Length of body Lb/Do 1.5 1.4 2.0 1.75 1.5 1.7 Length of cone Lc/Do 2.5 2.5 2.0 2.0 2.5 2.0 Diameter of dust outlet, Dd/Do
0.375 0.4 0.25 0.4 0.375 0.4
Source: Air Pollution Engineering Manual, 1992
2.1 Design Criteria for Cyclone
TABLE 17: Design Criteria for Cyclone
Type of cyclone
Design variable
Units Note
Single cyclone Inlet velocity m/s -
Pressure drop Inch WG -
Cyclone diameter
- Refer to table 16
Gas Flowrate
Gas temperature
Particle loading
Multicyclone
Inlet velocity m/s -
Pressure drop Inch WG -
Cyclone diameter
-
Gas Flowrate
Gas temperature
Particle loading
m3/m2.s Design range : 0.015 – 0.077
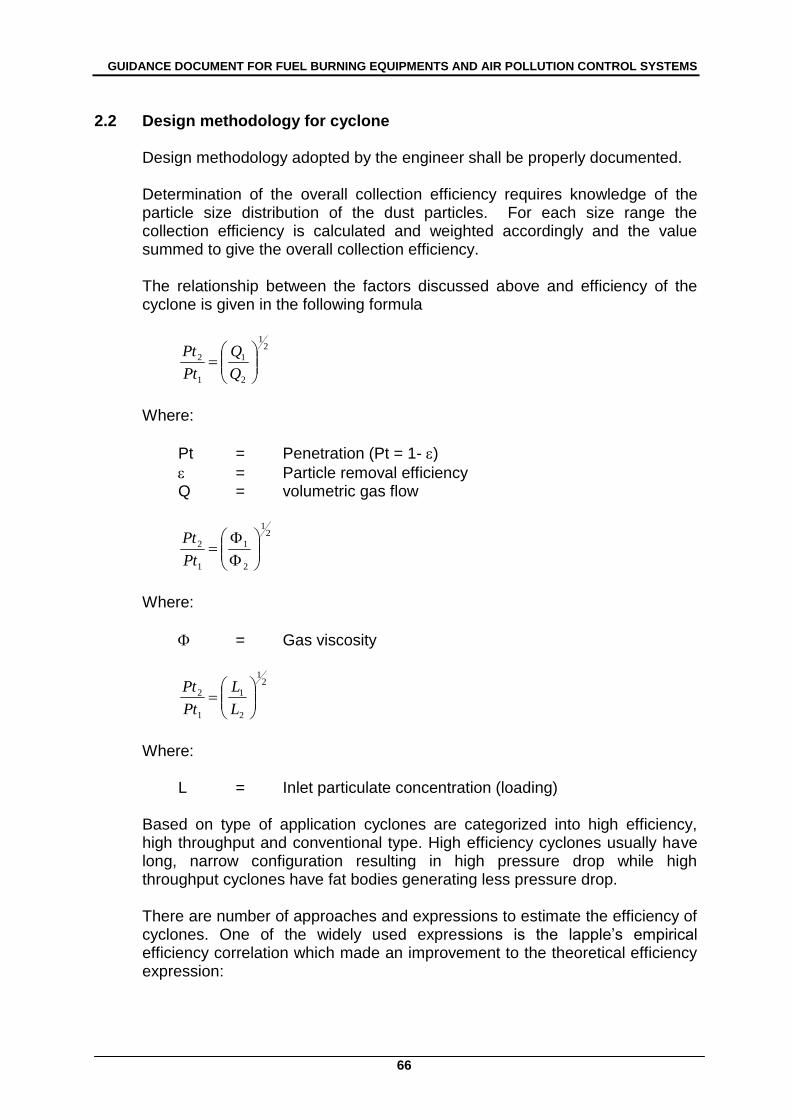
GUIDANCE DOCUMENT FOR FUEL BURNING EQUIPMENTS AND AIR POLLUTION CONTROL SYSTEMS
66
2.2 Design methodology for cyclone
Design methodology adopted by the engineer shall be properly documented.
Determination of the overall collection efficiency requires knowledge of the particle size distribution of the dust particles. For each size range the collection efficiency is calculated and weighted accordingly and the value summed to give the overall collection efficiency.
The relationship between the factors discussed above and efficiency of the cyclone is given in the following formula
21
2
1
1
2
Q
Q
Pt
Pt
Where:
Pt = Penetration (Pt = 1- )
= Particle removal efficiency Q = volumetric gas flow
21
2
1
1
2
Pt
Pt
Where:
= Gas viscosity
21
2
1
1
2
L
L
Pt
Pt
Where:
L = Inlet particulate concentration (loading)
Based on type of application cyclones are categorized into high efficiency, high throughput and conventional type. High efficiency cyclones usually have long, narrow configuration resulting in high pressure drop while high throughput cyclones have fat bodies generating less pressure drop.
There are number of approaches and expressions to estimate the efficiency of cyclones. One of the widely used expressions is the lapple‘s empirical efficiency correlation which made an improvement to the theoretical efficiency expression:
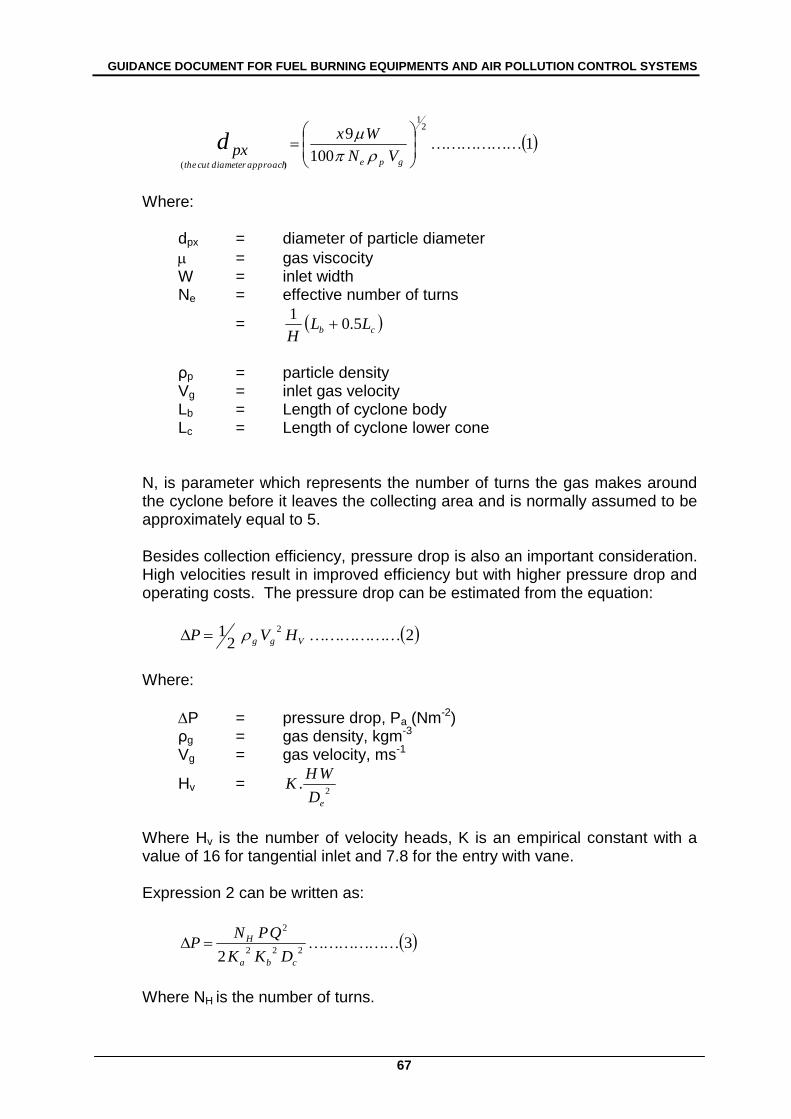
GUIDANCE DOCUMENT FOR FUEL BURNING EQUIPMENTS AND AIR POLLUTION CONTROL SYSTEMS
67
1100
92
1
)(
gpeapproachdiametercuttheVN
Wxpxd
Where:
dpx = diameter of particle diameter
= gas viscocity W = inlet width Ne = effective number of turns
= cb LLH
5.01
ρp = particle density Vg = inlet gas velocity Lb = Length of cyclone body Lc = Length of cyclone lower cone
N, is parameter which represents the number of turns the gas makes around the cyclone before it leaves the collecting area and is normally assumed to be approximately equal to 5. Besides collection efficiency, pressure drop is also an important consideration. High velocities result in improved efficiency but with higher pressure drop and operating costs. The pressure drop can be estimated from the equation:
22
1 2Vgg HVP
Where:
P = pressure drop, Pa (Nm-2) ρg = gas density, kgm-3
Vg = gas velocity, ms-1
Hv = 2
.eD
WHK
Where Hv is the number of velocity heads, K is an empirical constant with a value of 16 for tangential inlet and 7.8 for the entry with vane.
Expression 2 can be written as:
32
222
2
cba
H
DKK
QPNP
Where NH is the number of turns.
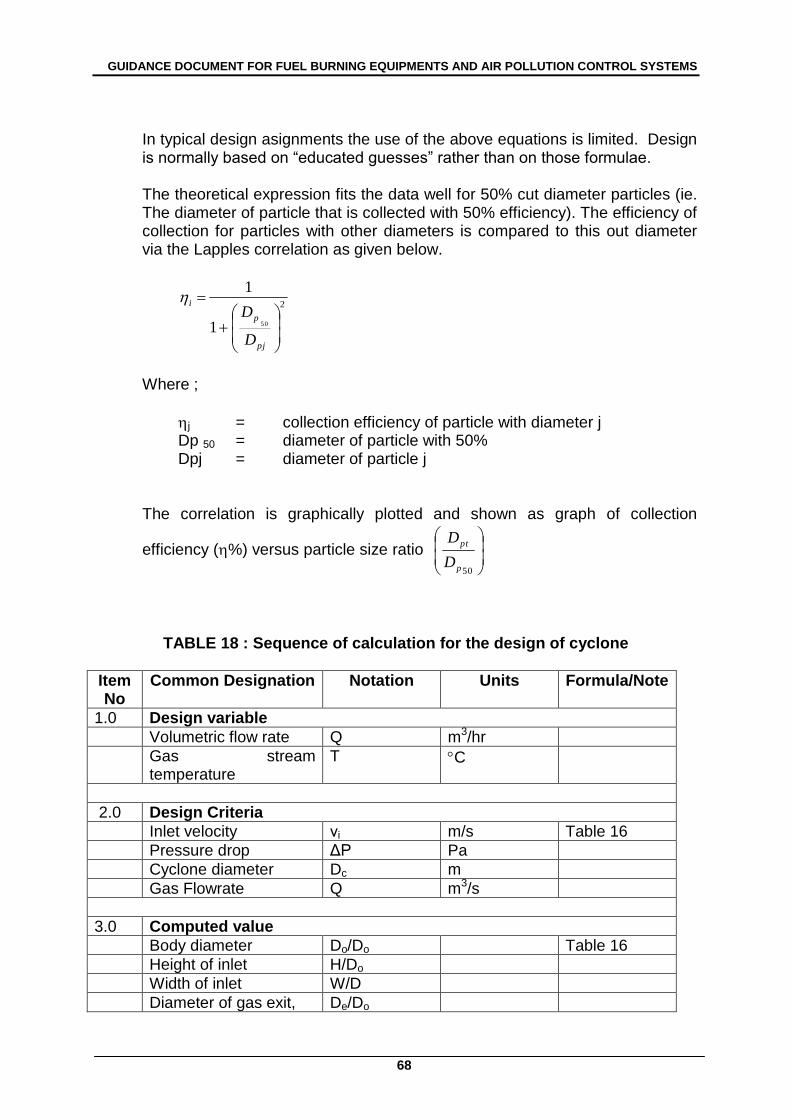
GUIDANCE DOCUMENT FOR FUEL BURNING EQUIPMENTS AND AIR POLLUTION CONTROL SYSTEMS
68
In typical design asignments the use of the above equations is limited. Design is normally based on ―educated guesses‖ rather than on those formulae. The theoretical expression fits the data well for 50% cut diameter particles (ie. The diameter of particle that is collected with 50% efficiency). The efficiency of collection for particles with other diameters is compared to this out diameter via the Lapples correlation as given below.
2
501
1
pj
p
i
D
D
Where ;
j = collection efficiency of particle with diameter j Dp 50 = diameter of particle with 50% Dpj = diameter of particle j
The correlation is graphically plotted and shown as graph of collection
efficiency (%) versus particle size ratio
50p
pt
D
D
TABLE 18 : Sequence of calculation for the design of cyclone
Item No
Common Designation Notation Units Formula/Note
1.0 Design variable
Volumetric flow rate Q m3/hr
Gas stream temperature
T C
2.0 Design Criteria
Inlet velocity νi m/s Table 16
Pressure drop ΔP Pa
Cyclone diameter Dc m
Gas Flowrate Q m3/s
3.0 Computed value
Body diameter Do/Do Table 16
Height of inlet H/Do
Width of inlet W/D
Diameter of gas exit, De/Do
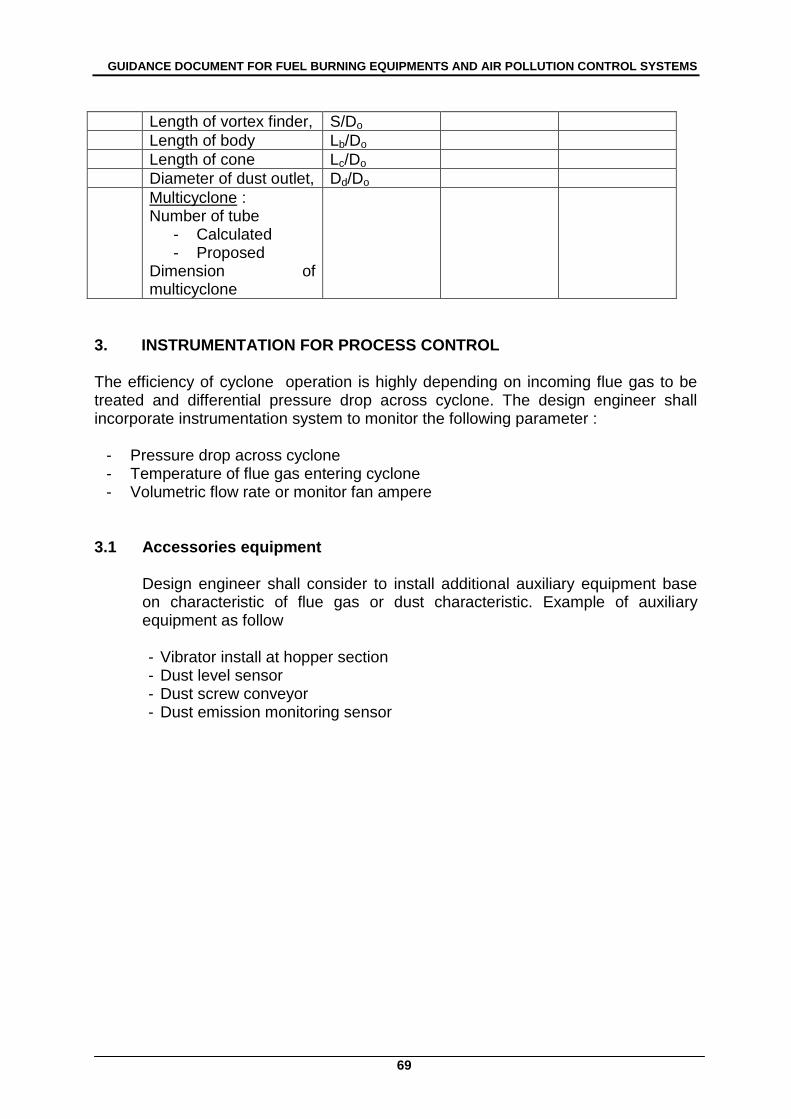
GUIDANCE DOCUMENT FOR FUEL BURNING EQUIPMENTS AND AIR POLLUTION CONTROL SYSTEMS
69
Length of vortex finder, S/Do
Length of body Lb/Do
Length of cone Lc/Do
Diameter of dust outlet, Dd/Do
Multicyclone : Number of tube
- Calculated - Proposed
Dimension of multicyclone
3. INSTRUMENTATION FOR PROCESS CONTROL
The efficiency of cyclone operation is highly depending on incoming flue gas to be treated and differential pressure drop across cyclone. The design engineer shall incorporate instrumentation system to monitor the following parameter :
- Pressure drop across cyclone - Temperature of flue gas entering cyclone - Volumetric flow rate or monitor fan ampere
3.1 Accessories equipment
Design engineer shall consider to install additional auxiliary equipment base on characteristic of flue gas or dust characteristic. Example of auxiliary equipment as follow
- Vibrator install at hopper section - Dust level sensor - Dust screw conveyor - Dust emission monitoring sensor
GUIDANCE DOCUMENT FOR FUEL BURNING EQUIPMENTS AND AIR POLLUTION CONTROL SYSTEMS
70
SECTION I : ELECTROSTATIC PRECIPITATOR
1. INTRODUCTION
An electrostatic precipitator or ESPs is a large industrial emission-control unit and have been used in industry for over 60 years. It is designed to trap and remove dust particles from the exhaust gas stream or an industrial process. They are generally more efficient at collecting fine particles and the major particulate collection devices used today. ESPs can handle large volumes with a wide range of inlet temperatures, pressures, dust volumes, and acid gas conditions. They can collect a wide range of particles sizes, and they can collect particles in dry and wet states. For many industries, the collection efficiency can go as high as 99%. ESPs aren‘t always the appropriate collection device, but they work because of electrostatic attraction. Widely used in power plants for removing fly ash from the gases prior to discharge, electrostatic precipitators apply electrical force to separate particles from the gas stream. ESPs have the advantages of low operating costs; capability for operation in high temperature applications(to 1300 oF); low pressure drop; and extremely high particulate (coarse and fine) collection efficiencies; however, they have the disadvantages of high capital costs and space requirements. 2. TYPES OF ELECTROSTATIC PRECIPITATORS ESPs can be grouped, or classified, according to a number of distinguishing features in their design. These fetures include the following:
The structural design and operation of the discharge electrodes,(rigid-frame, wires or plate) and collection electrodes (tubular or plate)
The method of charging (single stage or two-stage)
The temperature of operation (cold-side or hot-side)
The method of particle removal from collection surfaces (wet or dry)
In this guideline the focus will be more on dry ESPs system. 3. BASIC PRINCIPAL OF ELECTROSTATIC PRECIPITATOR Electrostatic precipitation removes particles from exhaust gas stream of an industrial process. Often the process involves combustion, but it can be any industrial that would otherwise emit particles to the atmosphere. It is a method of dust collection that uses electrostatic forces, and consists of discharge wires and collecting plates. A high voltage is applied to the discharge wires to form an electric field between the wires and collecting plates, and also ionizes the gas around the discharge wires to supply ions. When gas that contains an erosol (dust, mist) flows between the collecting plates and discharge wires, the aerosol particles in the gas are charged by the ions. The Coulomb force caused by electric field causes the
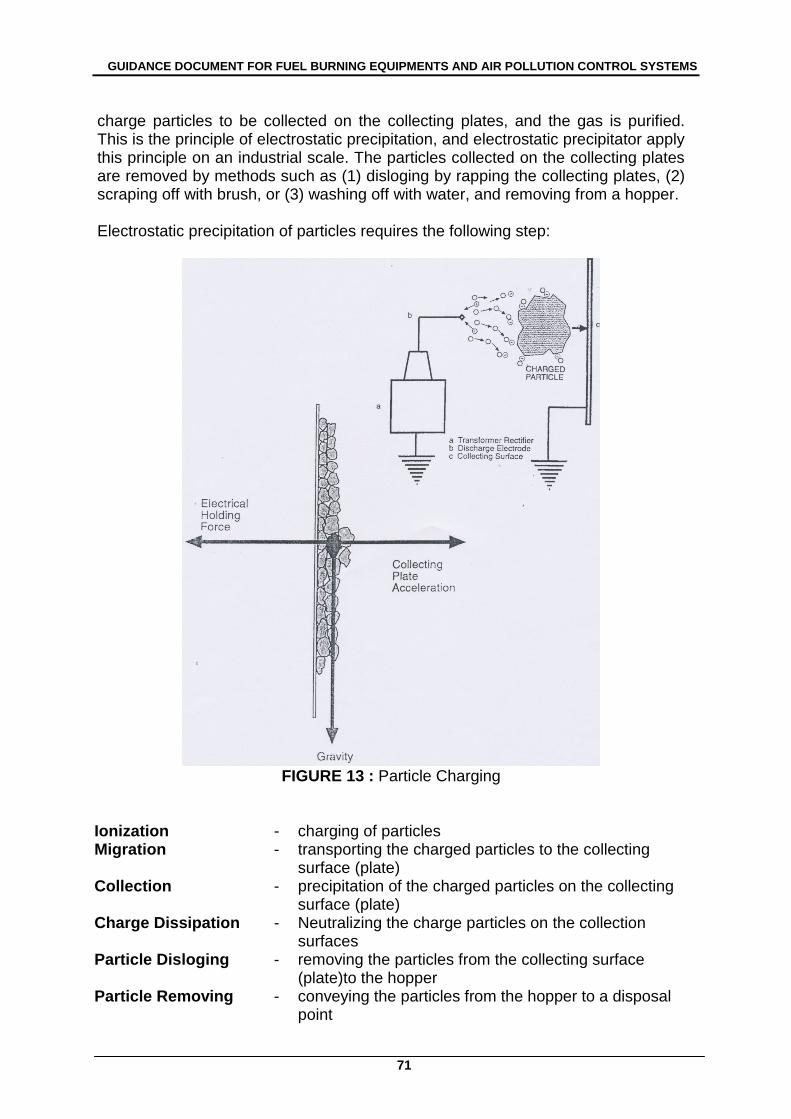
GUIDANCE DOCUMENT FOR FUEL BURNING EQUIPMENTS AND AIR POLLUTION CONTROL SYSTEMS
71
charge particles to be collected on the collecting plates, and the gas is purified. This is the principle of electrostatic precipitation, and electrostatic precipitator apply this principle on an industrial scale. The particles collected on the collecting plates are removed by methods such as (1) disloging by rapping the collecting plates, (2) scraping off with brush, or (3) washing off with water, and removing from a hopper. Electrostatic precipitation of particles requires the following step:
FIGURE 13 : Particle Charging
Ionization - charging of particles Migration - transporting the charged particles to the collecting
surface (plate) Collection - precipitation of the charged particles on the collecting
surface (plate) Charge Dissipation - Neutralizing the charge particles on the collection
surfaces Particle Disloging - removing the particles from the collecting surface
(plate)to the hopper Particle Removing - conveying the particles from the hopper to a disposal
point
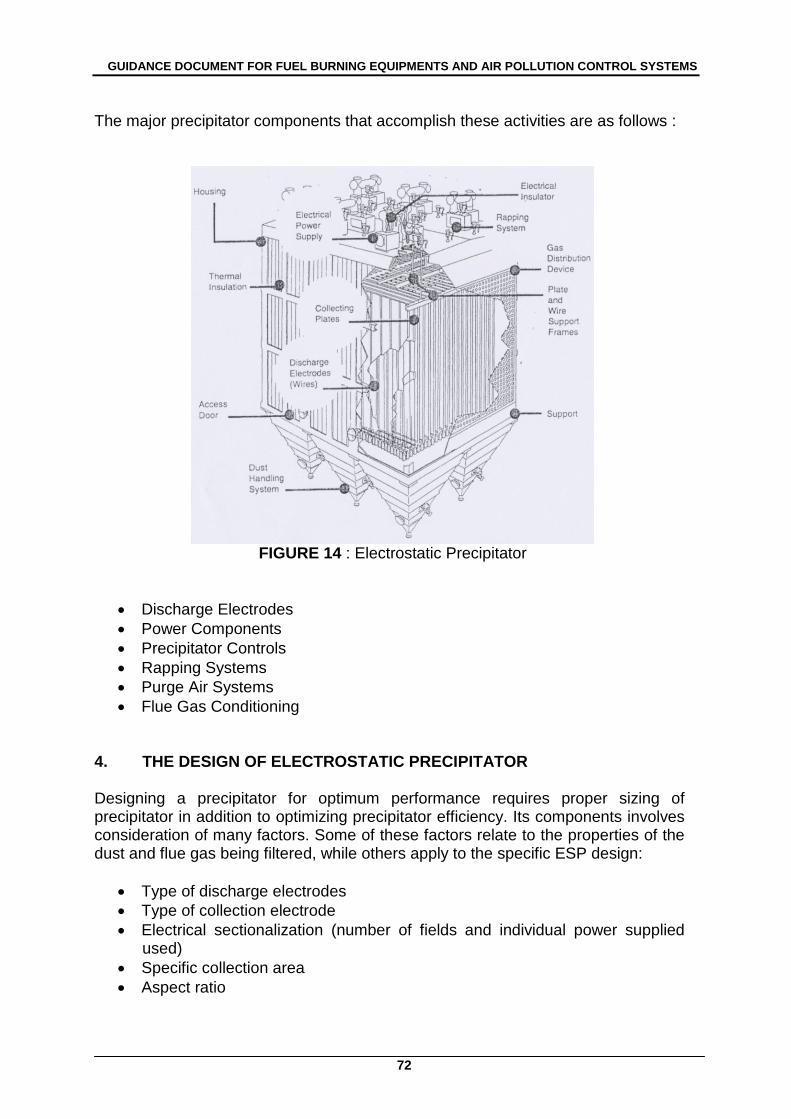
GUIDANCE DOCUMENT FOR FUEL BURNING EQUIPMENTS AND AIR POLLUTION CONTROL SYSTEMS
72
The major precipitator components that accomplish these activities are as follows :
FIGURE 14 : Electrostatic Precipitator
Discharge Electrodes
Power Components
Precipitator Controls
Rapping Systems
Purge Air Systems
Flue Gas Conditioning 4. THE DESIGN OF ELECTROSTATIC PRECIPITATOR Designing a precipitator for optimum performance requires proper sizing of precipitator in addition to optimizing precipitator efficiency. Its components involves consideration of many factors. Some of these factors relate to the properties of the dust and flue gas being filtered, while others apply to the specific ESP design:
Type of discharge electrodes
Type of collection electrode
Electrical sectionalization (number of fields and individual power supplied used)
Specific collection area
Aspect ratio
GUIDANCE DOCUMENT FOR FUEL BURNING EQUIPMENTS AND AIR POLLUTION CONTROL SYSTEMS
73
Construction details, such as shell insulation, inlet location, hopper design, and dust discharge devices are also important. 4.1 Design Method
ESPs can be designed using a number of techniques including mathematical equations to estimate collection efficiency or collection area, pilot plant studies to determine the parameters necessary to build, and computer modeling programs to test the design feature and operating parameters.
Using Estimates Of Collection Efficiency According to USEPA-81/10, ESP collection efficiency can be expressed by the following two equations:
Migration velocity equation
Deutsch-Anderson equation Particle migration velocity. Sometimes referred to as the drift velocity represents the parameter at which group of dust particles in a specific process can be collected in a precipitator; it is usually based on imperial data. The migration velocity can be expressed in terms of:
W = dp Eo Ep/(4) ..………………………(i)
Where: W = migration velocity
dp = diameter of the particle (m) Eo = strength of field in which particles are charged (represented by
peak of voltage), V/m (V/ft) Ep = strength of field in which particles are collected
(normally the field closed to the collecting plates), V/m (V/ft)
= viscocity of gas, pascal-seconds
= 3.14
Migration velocity is quite sensitive to the voltage also dependent on particle size; large particles are collected more easily than smaller ones.
Particle migration velocity can also be determined by the following equations:
W = qEp/(6r) …………………………(ii)
GUIDANCE DOCUMENT FOR FUEL BURNING EQUIPMENTS AND AIR POLLUTION CONTROL SYSTEMS
74
Where: W = migration velocity q = particle charge (s) Ep = strength of field in which particles are collected
(normallay the field closed to the collecting plates), V/m (V/ft)
= viscocity of gas, pascal-seconds r = radius of the particle, microns
The particle migration velocity can be calculataed using either Equations (i) or (ii), depending on the information available on the particle size and electric field strength. However, most ESPs are designed using a particle-migration velocity based on field experience rather than theory. Typical particle migration velocity rates, such as thoselisted in Table 19, have been published by various ESP vandors.
TABLE 19 : Typical Effective Particle Migration Velocity Rates for Various Applications
Application Migration velocity
(ft/sec) (cm/sec)
Utility fly ash Pulverized coal fly ash Pulp and paper mills Sulfuric acid mist Cement (wet process) Cement (dry process) Gypsum Smelter Open-hearth furnace Blast furnace Hot phosphorous Flash roaster Cupola Catalyst dust
0.13 - 0.67 0.33 - 0.44 0.21- 0.31 0.19 - 0.25 0.33 - 0.37 0.19 - 0.23 0.52 - 0.64
0.06 0.16 - 0.19 0.20 - 0.46
0.09 0.25
0.10 - 0.12 0.25
4.0 - 20.4 10.1 - 13.4 6.4 - 9.5
5.8 - 7.62 10.1 - 11.3 6.4 - 7.0
15.8 - 19.5 1.8
4.9 - 5.8 6.1- 14.0
2.7 7.6
3.0 - 3.7 7.6
Sources: Theodore and Buonicore 1976; U.S EPA 1979
Deutsch-Anderson Equation: This equation has been used to determine the collection efficiency of the precipitator under ideal conditions.The simplest form of the equation is:
= 1 – e-w(A/Q) …………………………. (iii)
A = - Q ln ( 1- ) ………………………….. (iv) W
GUIDANCE DOCUMENT FOR FUEL BURNING EQUIPMENTS AND AIR POLLUTION CONTROL SYSTEMS
75
Where :
= collection efficiency of the precipitator e = base of natural logarithm = 2.718 w = migration velocity, cm/s(ft/sec) A = the effective collecting plates area of the precipitator, m2 (ft2) Q = gas flow through the precipitator, m3/s (ft3/s) ln = natural logarithm 4.2 Design Parameters
Many parameters must be taken into consideration in the design and specification of electrostatic precipitators. The typical design parameters include (EPA-81/10):
Resistivity
Specific collection area
Aspect ratio
Gas flow distribution
Electrical sectionalization
Corona power
a) Resistivity
Particle resistivity is a condition of the particle in the gas stream that can alter the actual collection efficiency of an ESP design. Resistivity is a term that describes the resistance of the collected dust layer to the flow of electrical current.By definition, resistivity is the electrical resistance of a dust sample 1.0 cm2 in cross-sectional area, 1.0 cm thick; it is recoded in units of ohm-cm. Dust resistivity values can be classified roughly into three groups. Table 20 gives value ranges for low, normal and high resistivity.
TABLE 20 : Low, Normal and High Resistivity
Resistivity Range of measurement
Low Between 104 and 107 ohm-cm
Normal Between 107 and 1010 ohm-cm
High 1010 ohm-cm
(usually between 1010 and 1014 ohm-cm)
b) Specific Collection Area (SCA)
GUIDANCE DOCUMENT FOR FUEL BURNING EQUIPMENTS AND AIR POLLUTION CONTROL SYSTEMS
76
The specific collection area is defined as the ratio of collection surface area to the gas flow rate into the collector. The important of this term is that it represent the A/Q relationship in the Deutsch-Anderson equation.
SCA = total collection surface Gas flow rate SCA = total collection surface in m2 1000 m3/min
The General range of SCA is between 200 ft2 - 800 ft2 per 1000 acfm (between 11m2 - 45 m2 per 1000 m3/hr)
c) Aspect ratio (AR)
The aspect ratio is the ratio of the total length to height of collector surface. This aspect ratio can be calculated by: AR = effective length (m or ft) effective height (m or ft) The aspect ratio can range from 0.5 to 2.0. However, for high-efficiency ESPs (those having collection efficiencies of > 99 %), the aspect ratio should greater than 1.0 (usually 1.0 to 1.5) and in some installations may approach 2.0.
d) Gas flow distribution Gas flow through the ESP chamber should be slow and evenly distributed throughout the unit.The gas velocities in the duct ahead of the ESP are generally between 12 and 24 m/s (40 and 80 ft/s). Typical gas velocities in the ESP chamber range from 0.6 m/s to 2.4 m/s (2 ft/s to 8 ft/s). With AR of 1.5, the optimum gas velocity is generally between 1.5 m/s to 1.8 m/s (5 ft/s to 6 ft/s).
e) Electrical sectionalization
Precipitator performance is dependent on the number of individual sections or fields installed. The maximum voltage at which a given field can be maintained depends on the properties of gas and dust being collected. Most ESP vendors recommend that there be at least three or more fields in the precipitators.
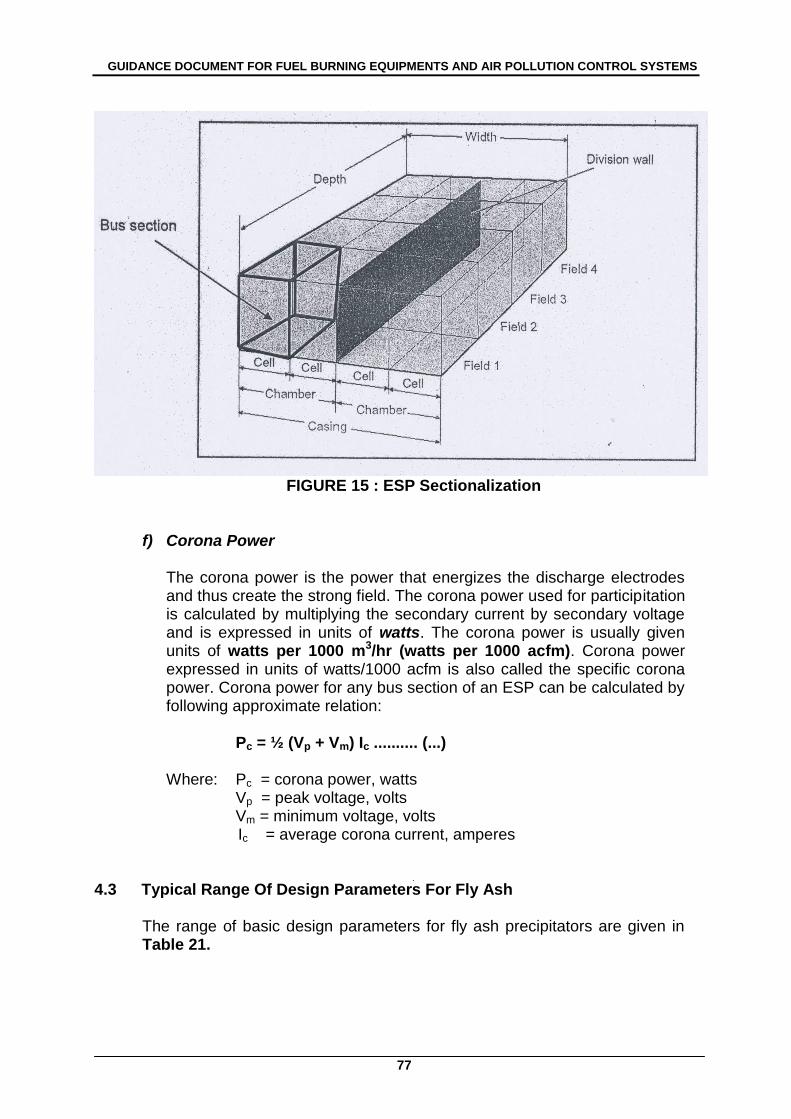
GUIDANCE DOCUMENT FOR FUEL BURNING EQUIPMENTS AND AIR POLLUTION CONTROL SYSTEMS
77
FIGURE 15 : ESP Sectionalization
f) Corona Power
The corona power is the power that energizes the discharge electrodes and thus create the strong field. The corona power used for participitation is calculated by multiplying the secondary current by secondary voltage and is expressed in units of watts. The corona power is usually given units of watts per 1000 m3/hr (watts per 1000 acfm). Corona power expressed in units of watts/1000 acfm is also called the specific corona power. Corona power for any bus section of an ESP can be calculated by following approximate relation:
Pc = ½ (Vp + Vm) Ic .......... (...)
Where: Pc = corona power, watts
Vp = peak voltage, volts Vm = minimum voltage, volts
Ic = average corona current, amperes 4.3 Typical Range Of Design Parameters For Fly Ash
The range of basic design parameters for fly ash precipitators are given in Table 21.
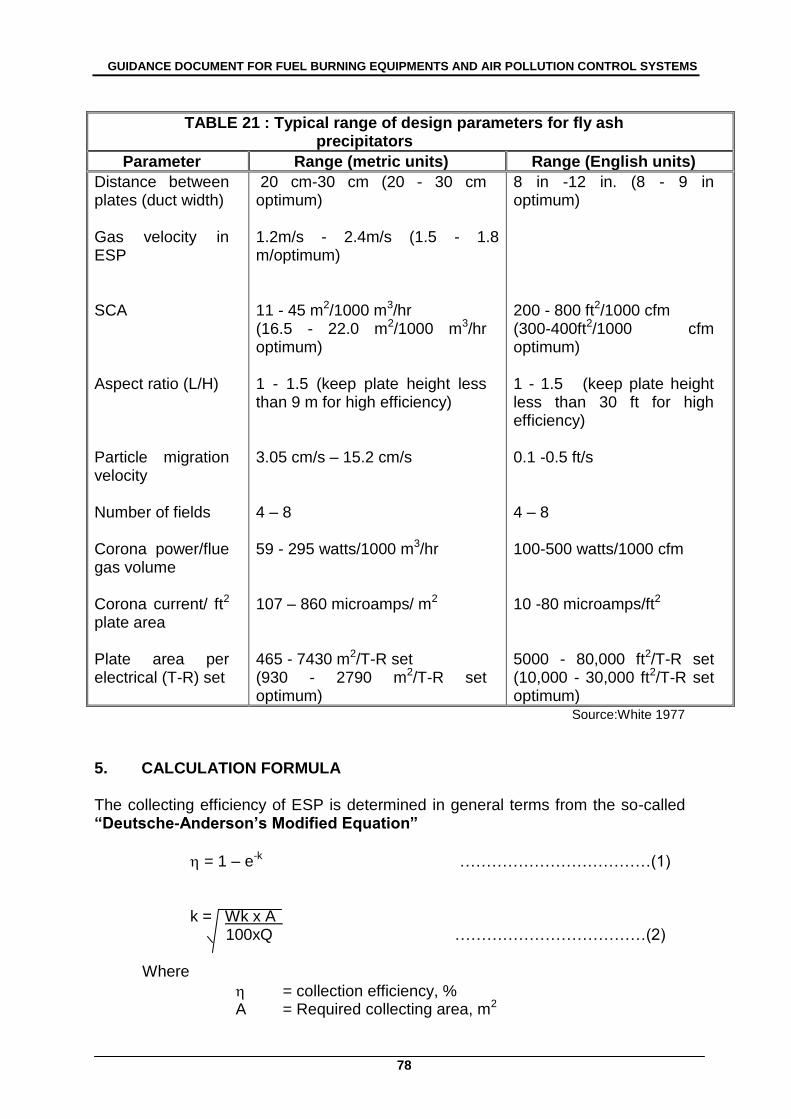
GUIDANCE DOCUMENT FOR FUEL BURNING EQUIPMENTS AND AIR POLLUTION CONTROL SYSTEMS
78
TABLE 21 : Typical range of design parameters for fly ash precipitators
Parameter Range (metric units) Range (English units)
Distance between plates (duct width) Gas velocity in ESP SCA Aspect ratio (L/H) Particle migration velocity Number of fields Corona power/flue gas volume Corona current/ ft2 plate area Plate area per electrical (T-R) set
20 cm-30 cm (20 - 30 cm optimum) 1.2m/s - 2.4m/s (1.5 - 1.8 m/optimum) 11 - 45 m2/1000 m3/hr (16.5 - 22.0 m2/1000 m3/hr optimum) 1 - 1.5 (keep plate height less than 9 m for high efficiency) 3.05 cm/s – 15.2 cm/s 4 – 8 59 - 295 watts/1000 m3/hr 107 – 860 microamps/ m2
465 - 7430 m2/T-R set (930 - 2790 m2/T-R set optimum)
8 in -12 in. (8 - 9 in optimum) 200 - 800 ft2/1000 cfm (300-400ft2/1000 cfm optimum) 1 - 1.5 (keep plate height less than 30 ft for high efficiency) 0.1 -0.5 ft/s 4 – 8 100-500 watts/1000 cfm 10 -80 microamps/ft2
5000 - 80,000 ft2/T-R set (10,000 - 30,000 ft2/T-R set optimum)
Source:White 1977
5. CALCULATION FORMULA The collecting efficiency of ESP is determined in general terms from the so-called “Deutsche-Anderson’s Modified Equation”
= 1 – e-k ………………………………(1) k = Wk x A 100xQ ………………………………(2)
Where
= collection efficiency, % A = Required collecting area, m2
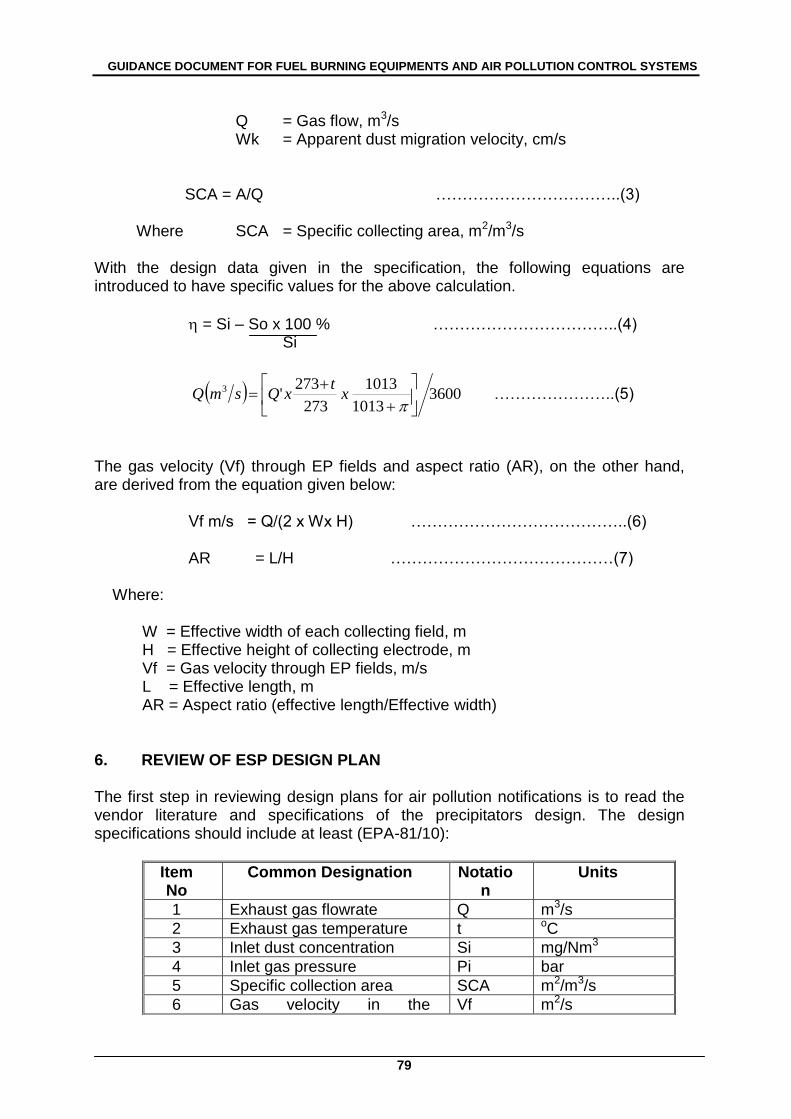
GUIDANCE DOCUMENT FOR FUEL BURNING EQUIPMENTS AND AIR POLLUTION CONTROL SYSTEMS
79
Q = Gas flow, m3/s Wk = Apparent dust migration velocity, cm/s SCA = A/Q ……………………………..(3)
Where SCA = Specific collecting area, m2/m3/s
With the design data given in the specification, the following equations are introduced to have specific values for the above calculation.
= Si – So x 100 % ……………………………..(4) Si
36001013
1013
273
273'3
x
txQsmQ …………………..(5)
The gas velocity (Vf) through EP fields and aspect ratio (AR), on the other hand, are derived from the equation given below:
Vf m/s = Q/(2 x Wx H) …………………………………..(6) AR = L/H ……………………………………(7)
Where:
W = Effective width of each collecting field, m H = Effective height of collecting electrode, m Vf = Gas velocity through EP fields, m/s L = Effective length, m AR = Aspect ratio (effective length/Effective width)
6. REVIEW OF ESP DESIGN PLAN The first step in reviewing design plans for air pollution notifications is to read the vendor literature and specifications of the precipitators design. The design specifications should include at least (EPA-81/10):
Item No
Common Designation Notation
Units
1 Exhaust gas flowrate Q m3/s
2 Exhaust gas temperature t oC
3 Inlet dust concentration Si mg/Nm3
4 Inlet gas pressure Pi bar
5 Specific collection area SCA m2/m3/s
6 Gas velocity in the Vf m2/s
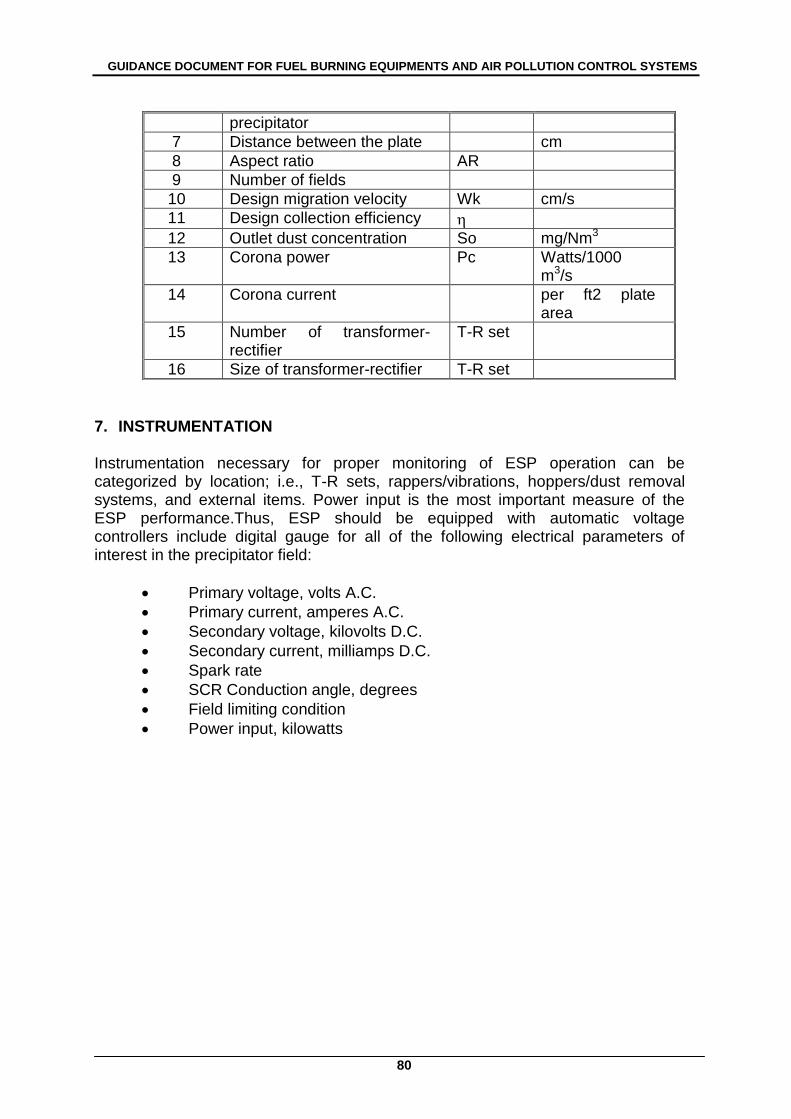
GUIDANCE DOCUMENT FOR FUEL BURNING EQUIPMENTS AND AIR POLLUTION CONTROL SYSTEMS
80
7. INSTRUMENTATION Instrumentation necessary for proper monitoring of ESP operation can be categorized by location; i.e., T-R sets, rappers/vibrations, hoppers/dust removal systems, and external items. Power input is the most important measure of the ESP performance.Thus, ESP should be equipped with automatic voltage controllers include digital gauge for all of the following electrical parameters of interest in the precipitator field:
Primary voltage, volts A.C.
Primary current, amperes A.C.
Secondary voltage, kilovolts D.C.
Secondary current, milliamps D.C.
Spark rate
SCR Conduction angle, degrees
Field limiting condition
Power input, kilowatts
precipitator
7 Distance between the plate cm
8 Aspect ratio AR
9 Number of fields
10 Design migration velocity Wk cm/s
11 Design collection efficiency
12 Outlet dust concentration So mg/Nm3
13 Corona power Pc Watts/1000 m3/s
14 Corona current per ft2 plate area
15 Number of transformer-rectifier
T-R set
16 Size of transformer-rectifier T-R set
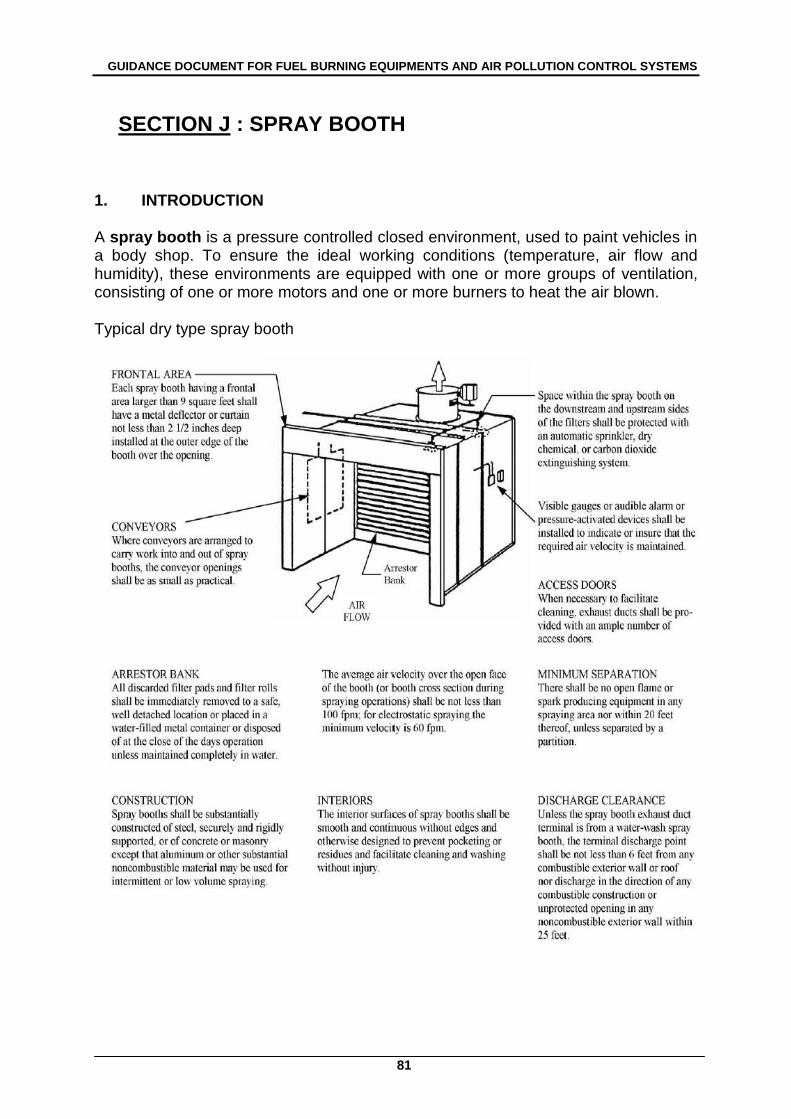
GUIDANCE DOCUMENT FOR FUEL BURNING EQUIPMENTS AND AIR POLLUTION CONTROL SYSTEMS
81
SECTION J : SPRAY BOOTH
1. INTRODUCTION
A spray booth is a pressure controlled closed environment, used to paint vehicles in a body shop. To ensure the ideal working conditions (temperature, air flow and humidity), these environments are equipped with one or more groups of ventilation, consisting of one or more motors and one or more burners to heat the air blown. Typical dry type spray booth
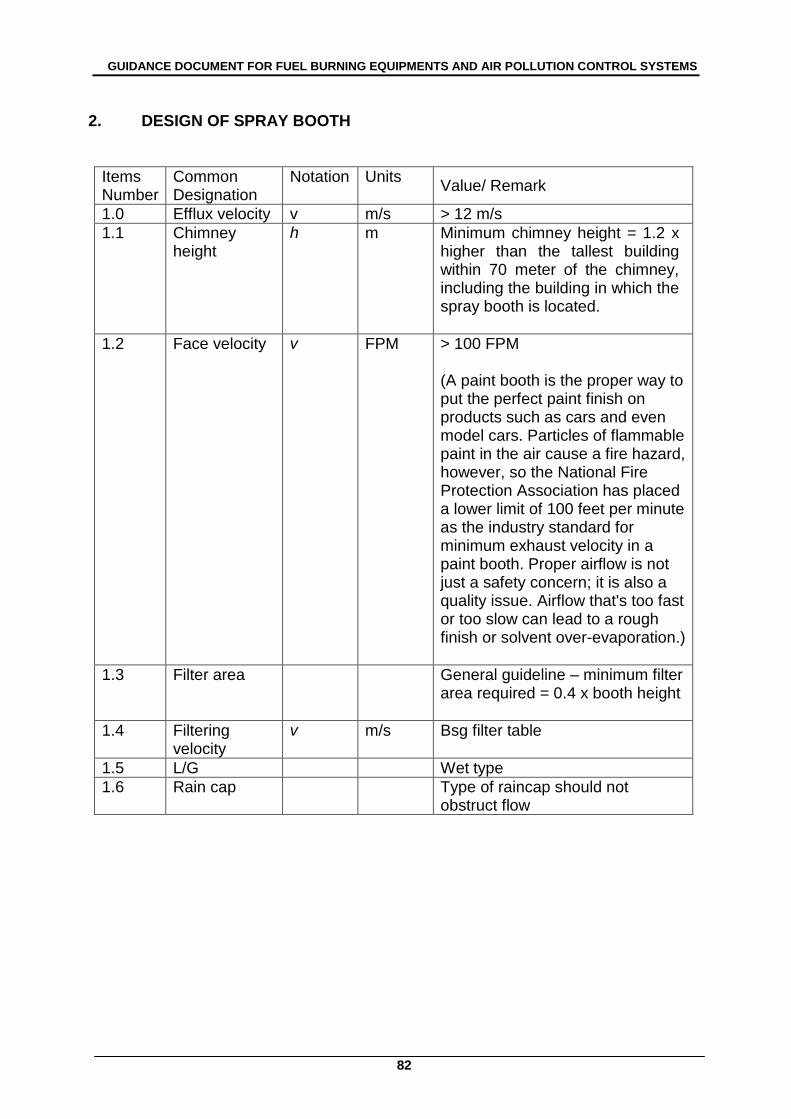
GUIDANCE DOCUMENT FOR FUEL BURNING EQUIPMENTS AND AIR POLLUTION CONTROL SYSTEMS
82
2. DESIGN OF SPRAY BOOTH
Items Number
Common Designation
Notation Units Value/ Remark
1.0 Efflux velocity v m/s > 12 m/s
1.1 Chimney height
h m Minimum chimney height = 1.2 x higher than the tallest building within 70 meter of the chimney, including the building in which the spray booth is located.
1.2 Face velocity
v FPM > 100 FPM (A paint booth is the proper way to put the perfect paint finish on products such as cars and even model cars. Particles of flammable paint in the air cause a fire hazard, however, so the National Fire Protection Association has placed a lower limit of 100 feet per minute as the industry standard for minimum exhaust velocity in a paint booth. Proper airflow is not just a safety concern; it is also a quality issue. Airflow that's too fast or too slow can lead to a rough finish or solvent over-evaporation.)
1.3 Filter area General guideline – minimum filter area required = 0.4 x booth height
1.4 Filtering velocity
v m/s Bsg filter table
1.5 L/G Wet type
1.6 Rain cap Type of raincap should not obstruct flow
GUIDANCE DOCUMENT FOR FUEL BURNING EQUIPMENTS AND AIR POLLUTION CONTROL SYSTEMS
83
SECTION K : INCINERATOR
1. INTRODUCTION
Properly designed and operated incineration system are capable of destroying hazardous organic components in the waste stream. On the other hand, improper design and operation of these systems could pose a threat to public health through emissions of hazardous and other contaminants including acid gasses, metals and toxic organics fumes. The inherent advantages of thermal destruction of waste, balanced against the potential problems resulting from such practice, have lead to the need to develop sound design and operating criteria for waste incineration facilities. This guideline are intended to provide minimum requirement for new incineration facilities burning industrial waste and municipal solid waste.
1.1 Operating Condition and Performance Standards
Waste incineration facilities for the incineration of non-halogenated or non polynuclear wastes must be designed for the minimum temperature at the outlet of the secondary chamber of 1100oC and must operate at or above 1000oC. For halogenated or polynuclear wastes, the minimum design temperature is 1300oC and minimum operating temperature is 1200oC. The incineration gasses must remain at or above the minimum operating temperature for at least 2 seconds. To ensure that this guideline can be met, the auxiliary burner capacity must provide 100% of the primary and secondary heat capacity of the incinerator.
The incinerator must operate at a minimum oxygen concentration of 3 % at the outlet of the secondary chamber. The minimum destruction and removal efficiency (DRE) must be 6 to 9 seconds (99.9999%) for specified chlorinated hazardous waste and 4 to 9 seconds (99.99%) for specified non-clorinated waste.
1.2 Monitoring requirement Continous in- stack monitoring must be provided for opacity, hydrogen chloride, oxygen, carbon monoxide or total hydrocarbon and temperature. Consideration should also be given to continuously monitoring carbon doxide, nitrogen oxides and sulphur dioxide.
2. DESIGN CONSIDERATION
Incinerator design shall incorporate a proper combination of temperature, residence time and gas mixing in the combustion zone. Parameter that influence temperature in the combustion process include the properties of the waste feed (e.g. heating value, calorific value), the use of auxiliary fuel, the amount of air supplied and the heat
GUIDANCE DOCUMENT FOR FUEL BURNING EQUIPMENTS AND AIR POLLUTION CONTROL SYSTEMS
84
losses due to conduction, convection and radiation. Once a maximum operating temperature is selected, the materials of construction of the incinerator must be chosen to be compatible with this temperature. Failures to achieve high destruction efficiency have been linked to non-uniform temperatures in the combustion chamber and have resulted in the discharge of products of incomplete combustion (PICs) from the system. The effects of non-uniform temperatures can be minimized by designing incinerators to operate at temperatures exceeding the theoretical limit necessary to achieve complete destruction of the organics in the waste feed. Incinerators shall also be designed to provide and maintain a high degree of gas phase turbulence and mixing prior to the secondary chamber. Provisions shall include any combination of:
appropriately located / directed primary and secondary air jets;
Changes in flow directions of the gases;
Constrictions of cross-sectional areas of the incinerator; and
Baffling The eddies forms by turbulent flow promote local mixing of combustion gasses and air. The degree of turbulence is typically assessed by use of the Reynolds number, NRE; the higher the Reynolds number, the better the mixing. Retention time (residence time) is also an important design parameter. The incinerator volume shall be large enough to allow sufficient time for fuel and combustible gasses to thoroughly mix and burn. The recommended design guidelines for waste incinerator are presented in Table 22. The following sections address the significance of the various parameters presented in Table 22.
Minimum design temperature – shall be high enough to ensure organic destruction. Temperature shall be measured in conjunction with residence time requirements. Some organic compound such as halogenated and polynuclear organics are more refractory than others and therefore require higher minimum temperatures for destruction.
Primary Air – the design shall ensure that there is proper primary air distribution to promote good contact between waste being burned and incoming air. Control systems shall provide the capability to adjust the distribution of primary air to compensate for the variability of the waste feed. The controls shall also be capable of controlling the air flow to an appropriate level to minimize the entrainment of particles while, at the same time, reducing the possibility of quenching the combustion reaction.
Secondary Air – shall be used to promote mixing and allow for completion of the combustion process. The introduction of secondary air is critical to complete the destruction of organics. The design of air injection ports and the amount of
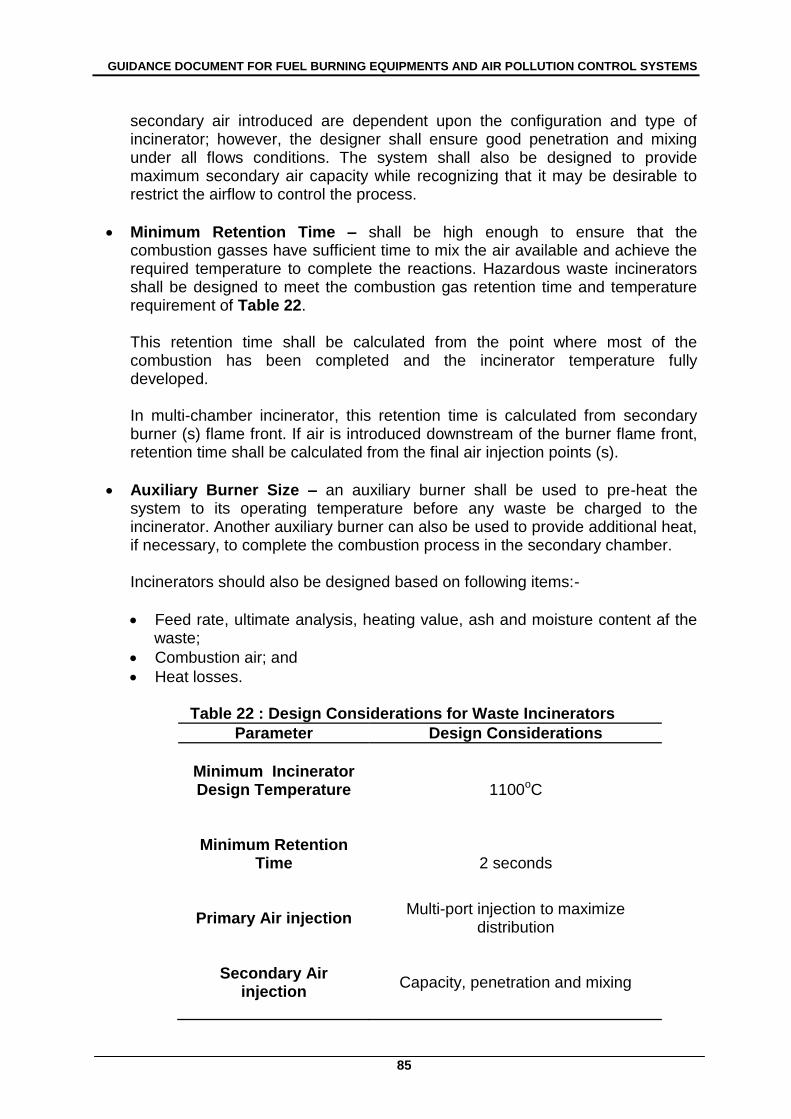
GUIDANCE DOCUMENT FOR FUEL BURNING EQUIPMENTS AND AIR POLLUTION CONTROL SYSTEMS
85
secondary air introduced are dependent upon the configuration and type of incinerator; however, the designer shall ensure good penetration and mixing under all flows conditions. The system shall also be designed to provide maximum secondary air capacity while recognizing that it may be desirable to restrict the airflow to control the process.
Minimum Retention Time – shall be high enough to ensure that the combustion gasses have sufficient time to mix the air available and achieve the required temperature to complete the reactions. Hazardous waste incinerators shall be designed to meet the combustion gas retention time and temperature requirement of Table 22.
This retention time shall be calculated from the point where most of the combustion has been completed and the incinerator temperature fully developed. In multi-chamber incinerator, this retention time is calculated from secondary burner (s) flame front. If air is introduced downstream of the burner flame front, retention time shall be calculated from the final air injection points (s).
Auxiliary Burner Size – an auxiliary burner shall be used to pre-heat the system to its operating temperature before any waste be charged to the incinerator. Another auxiliary burner can also be used to provide additional heat, if necessary, to complete the combustion process in the secondary chamber.
Incinerators should also be designed based on following items:-
Feed rate, ultimate analysis, heating value, ash and moisture content af the waste;
Combustion air; and
Heat losses.
Table 22 : Design Considerations for Waste Incinerators
Parameter Design Considerations
Minimum Incinerator Design Temperature
1100oC
Minimum Retention Time
2 seconds
Primary Air injection
Multi-port injection to maximize distribution
Secondary Air
injection
Capacity, penetration and mixing
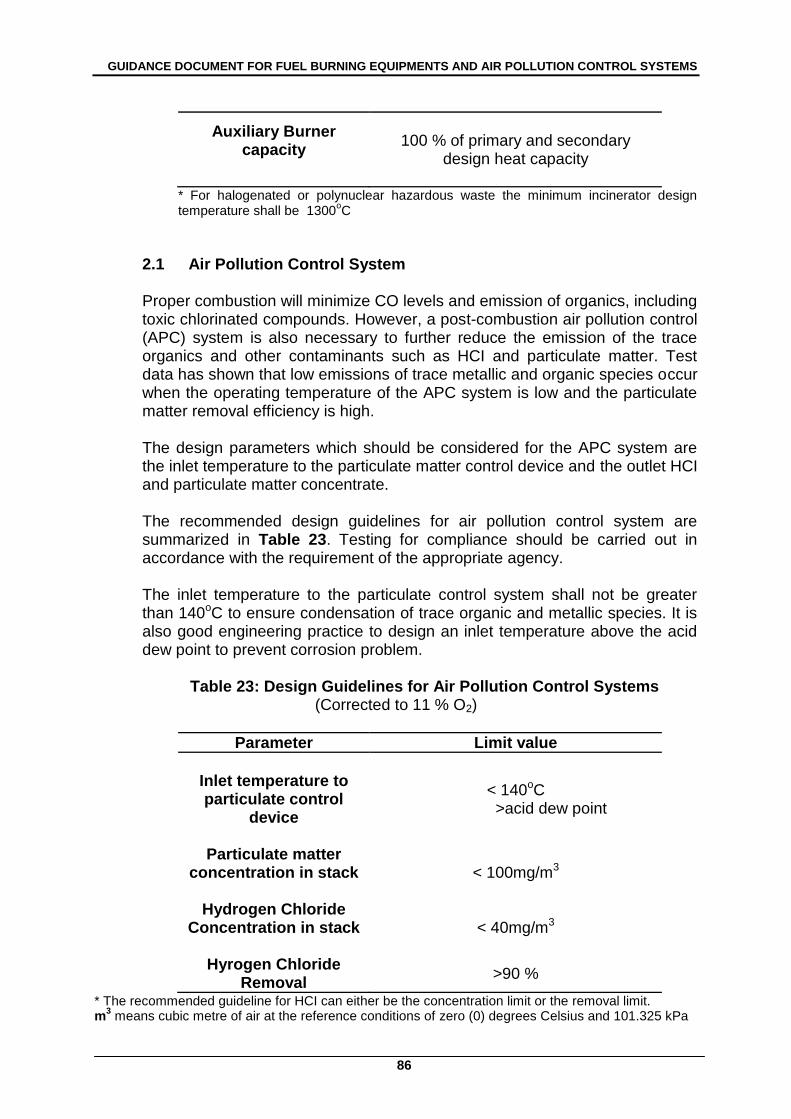
GUIDANCE DOCUMENT FOR FUEL BURNING EQUIPMENTS AND AIR POLLUTION CONTROL SYSTEMS
86
Auxiliary Burner capacity
100 % of primary and secondary
design heat capacity
* For halogenated or polynuclear hazardous waste the minimum incinerator design temperature shall be 1300
oC
2.1 Air Pollution Control System
Proper combustion will minimize CO levels and emission of organics, including toxic chlorinated compounds. However, a post-combustion air pollution control (APC) system is also necessary to further reduce the emission of the trace organics and other contaminants such as HCI and particulate matter. Test data has shown that low emissions of trace metallic and organic species occur when the operating temperature of the APC system is low and the particulate matter removal efficiency is high. The design parameters which should be considered for the APC system are the inlet temperature to the particulate matter control device and the outlet HCI and particulate matter concentrate. The recommended design guidelines for air pollution control system are summarized in Table 23. Testing for compliance should be carried out in accordance with the requirement of the appropriate agency. The inlet temperature to the particulate control system shall not be greater than 140oC to ensure condensation of trace organic and metallic species. It is also good engineering practice to design an inlet temperature above the acid dew point to prevent corrosion problem.
Table 23: Design Guidelines for Air Pollution Control Systems (Corrected to 11 % O2)
Parameter Limit value
Inlet temperature to particulate control
device
< 140oC >acid dew point
Particulate matter concentration in stack
< 100mg/m3
Hydrogen Chloride Concentration in stack
< 40mg/m3
Hyrogen Chloride Removal
>90 %
* The recommended guideline for HCI can either be the concentration limit or the removal limit. m
3 means cubic metre of air at the reference conditions of zero (0) degrees Celsius and 101.325 kPa
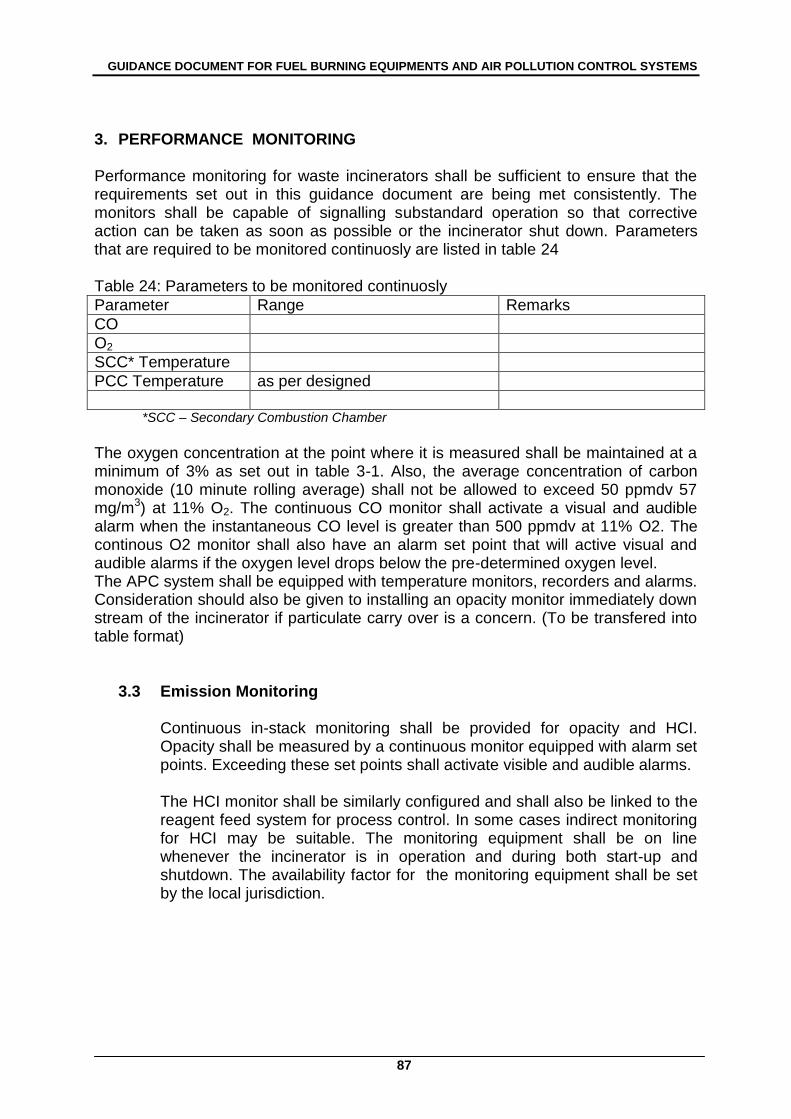
GUIDANCE DOCUMENT FOR FUEL BURNING EQUIPMENTS AND AIR POLLUTION CONTROL SYSTEMS
87
3. PERFORMANCE MONITORING
Performance monitoring for waste incinerators shall be sufficient to ensure that the requirements set out in this guidance document are being met consistently. The monitors shall be capable of signalling substandard operation so that corrective action can be taken as soon as possible or the incinerator shut down. Parameters that are required to be monitored continuosly are listed in table 24
Table 24: Parameters to be monitored continuosly
Parameter Range Remarks
CO
O2
SCC* Temperature
PCC Temperature as per designed
*SCC – Secondary Combustion Chamber
The oxygen concentration at the point where it is measured shall be maintained at a minimum of 3% as set out in table 3-1. Also, the average concentration of carbon monoxide (10 minute rolling average) shall not be allowed to exceed 50 ppmdv 57 mg/m3) at 11% O2. The continuous CO monitor shall activate a visual and audible alarm when the instantaneous CO level is greater than 500 ppmdv at 11% O2. The continous O2 monitor shall also have an alarm set point that will active visual and audible alarms if the oxygen level drops below the pre-determined oxygen level. The APC system shall be equipped with temperature monitors, recorders and alarms. Consideration should also be given to installing an opacity monitor immediately down stream of the incinerator if particulate carry over is a concern. (To be transfered into table format)
3.3 Emission Monitoring
Continuous in-stack monitoring shall be provided for opacity and HCI. Opacity shall be measured by a continuous monitor equipped with alarm set points. Exceeding these set points shall activate visible and audible alarms. The HCI monitor shall be similarly configured and shall also be linked to the reagent feed system for process control. In some cases indirect monitoring for HCI may be suitable. The monitoring equipment shall be on line whenever the incinerator is in operation and during both start-up and shutdown. The availability factor for the monitoring equipment shall be set by the local jurisdiction.
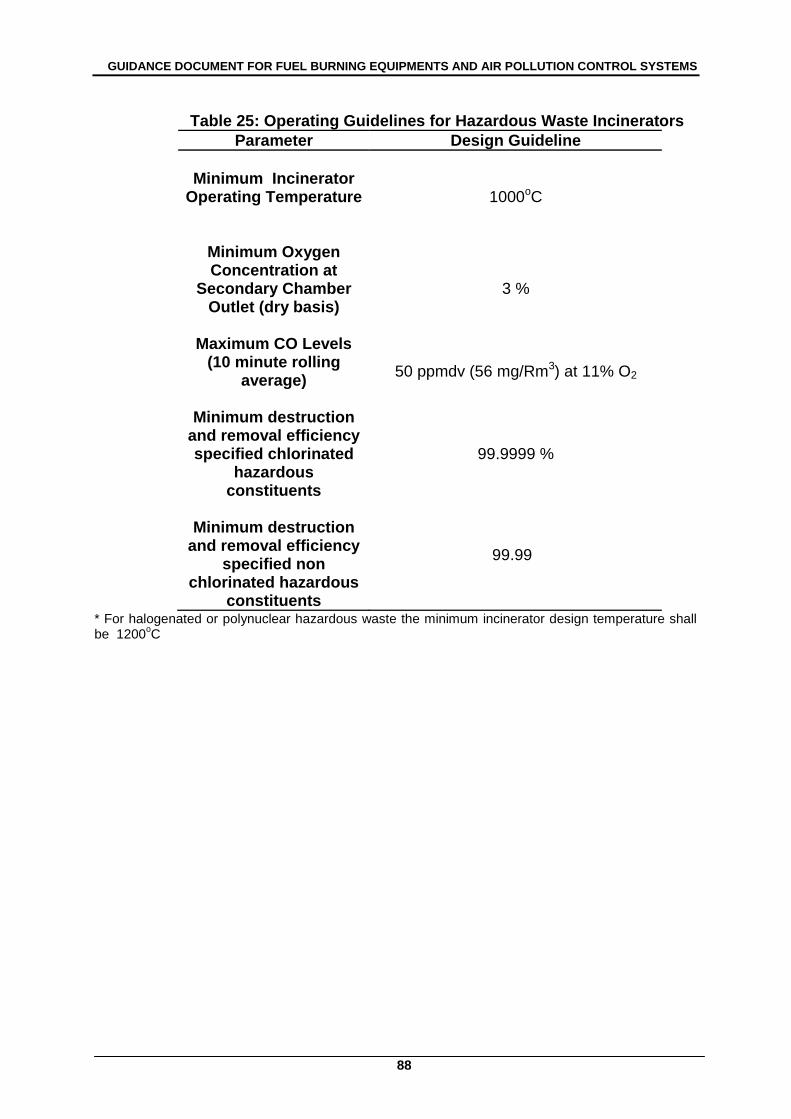
GUIDANCE DOCUMENT FOR FUEL BURNING EQUIPMENTS AND AIR POLLUTION CONTROL SYSTEMS
88
Table 25: Operating Guidelines for Hazardous Waste Incinerators
Parameter Design Guideline
Minimum Incinerator
Operating Temperature
1000oC
Minimum Oxygen Concentration at
Secondary Chamber Outlet (dry basis)
3 %
Maximum CO Levels (10 minute rolling
average)
50 ppmdv (56 mg/Rm3) at 11% O2
Minimum destruction and removal efficiency specified chlorinated
hazardous constituents
99.9999 %
Minimum destruction
and removal efficiency specified non
chlorinated hazardous constituents
99.99
* For halogenated or polynuclear hazardous waste the minimum incinerator design temperature shall be 1200
oC
GUIDANCE DOCUMENT FOR FUEL BURNING EQUIPMENTS AND AIR POLLUTION CONTROL SYSTEMS
89
REFERENCES
1. Environmental Insitute of Malaysia (EiMAS). Training Material for Course on Pollution
Control from the Operation of Solid Fuel Boiler
2. EPA Handbook Control Technologies for Hazardous Air Pollutants EPA625/6-
91/014 June 1991. (Source: Design steps: Furnace of A Steam Generator-
web.iitd.ac.in/)
3. Posokhin, V. N. 1984. Design of Local Ventilation Systems for the Process Equipment
with Heat and Gas Release (in Russian). Mashinostroyeniye, Moscow