Embed Size (px)
Citation preview

GuidanceforAssessingPesticideRiskstoBeesOfficeofPesticideProgramsUnitedStatesEnvironmentalProtectionAgencyWashington,D.C.20460
HealthCanadaPestManagementRegulatoryAgencyOttawa,ON,Canada
CaliforniaDepartmentofPesticideRegulation*Sacramento,CA *Currently, due to resource limitations, the California Department of Pesticide Regulation does not conduct full
ecological risk assessments, but reserves the right to do so in the future.
June 19, 2014

2
Executive Summary This document provides guidance to risk assessors for evaluating the potential risk of pesticides to bees, particularly honey bees (Apis mellifera). This guidance is not limited to identifying the risk assessment process but includes consideration of the underlying data on which the process is based. For purposes of brevity, this guidance refers to the White Paper in Support of the Proposed Risk Assessment Process for Bees1 submitted to the Federal Insecticide, Fungicide and Rodenticide Act (FIFRA) Scientific Advisory Panel (SAP) for review and comment in September 2012. The White Paper describes the basic framework of the risk assessment process and the data used to inform the various tiers of refinement that may be required to support risk management decisions. This guidance also considers recommendations2 provided by the FIFRA SAP in response to the White Paper, where such recommendations can be immediately implemented. Additional recommendations from the FIFRA SAP that cannot be implemented at this time, because the science supporting such efforts has not been sufficiently vetted, will be considered as the science evolves. The risk assessment process described in the White Paper identifies a tiered approach where data are collected on individual bees that are representative of different life stages (larval/pupal versus adults) and castes (e.g., worker bees). While additional data may be available on other bee species and these data can be included in the tiered risk assessment process as an additional line of evidence, the primary process relies on honey bee data as a surrogate for both Apis and non-Apis bees. In this process, laboratory-based studies of larval/pupal and adult honey bees provide data on individual bees that can be used as a surrogate for other species of bees, including solitary species. At the semi-field and full-field levels, studies of the colony can be used to represent effects to honey bees themselves and as a surrogate for other social bees. An advantage of using honey bees is that the husbandry and life cycle of the species and its significance in pollination services is well known and test protocols are available. As the science evolves, methods and studies using non-Apis bees may be considered and incorporated into the risk assessment. The risk assessment process for bees is consistent with that used for other taxa, as described in the Overview Document3, in that it consists of three phases (i.e., problem formulation, analysis, and risk characterization) and it is tiered. The first tier consists of a screening-level risk assessment that is intended to be sufficiently conservative such that chemicals that pass the screen are considered to represent a relatively low risk of adverse effects to bees. For those chemicals which do not pass the initial screen, refinements in exposure estimates and/or mitigation measures may sufficiently reduce risk quotients (RQs) below levels of concern (LOCs) such that further refinements are not needed. For chemicals where RQ values still exceed LOCs and, depending on risk management needs, additional refinements in exposure and/or effects estimates can be made based on studies with increasing levels of environmental realism. Although approaches for estimating exposure and effects differ across aquatic and terrestrial systems as well as between plants and
1 USEPA. 2012. White Paper in Support of the Proposed Risk Assessment Process for Bees. Submitted to the FIFRA Scientific Advisory Panel for Review and Comment September 11 – 14, 2012. Office of Chemical Safety and Pollution Prevention Office of Pesticide Programs Environmental Fate and Effects Division, Environmental Protection Agency, Washington DC; Environmental Assessment Directorate, Pest Management Regulatory Agency, Health Canada, Ottawa, CN; California Department of Pesticide Regulation http://www.regulations.gov/#!documentDetail;D=EPA-HQ-OPP-2012-0543-0004 2 USEPA 2012. Final FIFRA SAP Pollinator Meeting Report. SAP Minutes No. 2012-06. A Set of Scientific Issues Being Considered by the Environmental Protection Agency Regarding Pollinator Risk Assessment Framework. September 11 – 14, 2012, FIFRA Scientific Advisory Panel Meeting. http://www.regulations.gov/#!documentDetail;D=EPA-HQ-OPP-2012-0543-0047 3 USEPA. 2004. Overview of the Ecological Risk Assessment Process in the Office of Pesticide Programs, U. S. Environmental Protection Agency. Endangered and Threatened Species Effects Determinations. Office of Prevention, Pesticides and Toxic Substances Office of Pesticide Programs, Washington DC. January 23, 2004. http://www.epa.gov/espp/consultation/ecorisk-overview.pdf

3
animals, the basic process of moving from a screening-level assessment with conservative assumptions to more refined measures of exposure and effects is consistent across taxa. The guidance follows the generic structure of the risk assessment process, as described in the White Paper and Overview Document. While this guidance is not intended to be exhaustive, it provides staff with sufficient information with which to ensure consistency in ecological risk assessments written in support of new and existing pesticide registration decisions. The different levels of refinement described in the guidance are not intended to be prescriptive; the specific set of data used in assessing potential risks of a pesticide to bees ultimately depends on multiple lines of evidence and risk management objectives.

4
Acknowledgement
The following individuals and organizations contributed to this guidance document: U.S. Environmental Protection Agency Office of Pesticide Programs (OPP) Rueben Baris Joseph DeCant Frank Farruggia Kristina Garber Anita Pease Keith Sappington Mah Shamim Thomas Steeger Allen Vaughan Christina Wendel Health Canada Pest Management Regulatory Agency (PMRA) Connie Hart Wayne Hou California Department of Pesticide Regulation (CALDPR) Richard Bireley
5
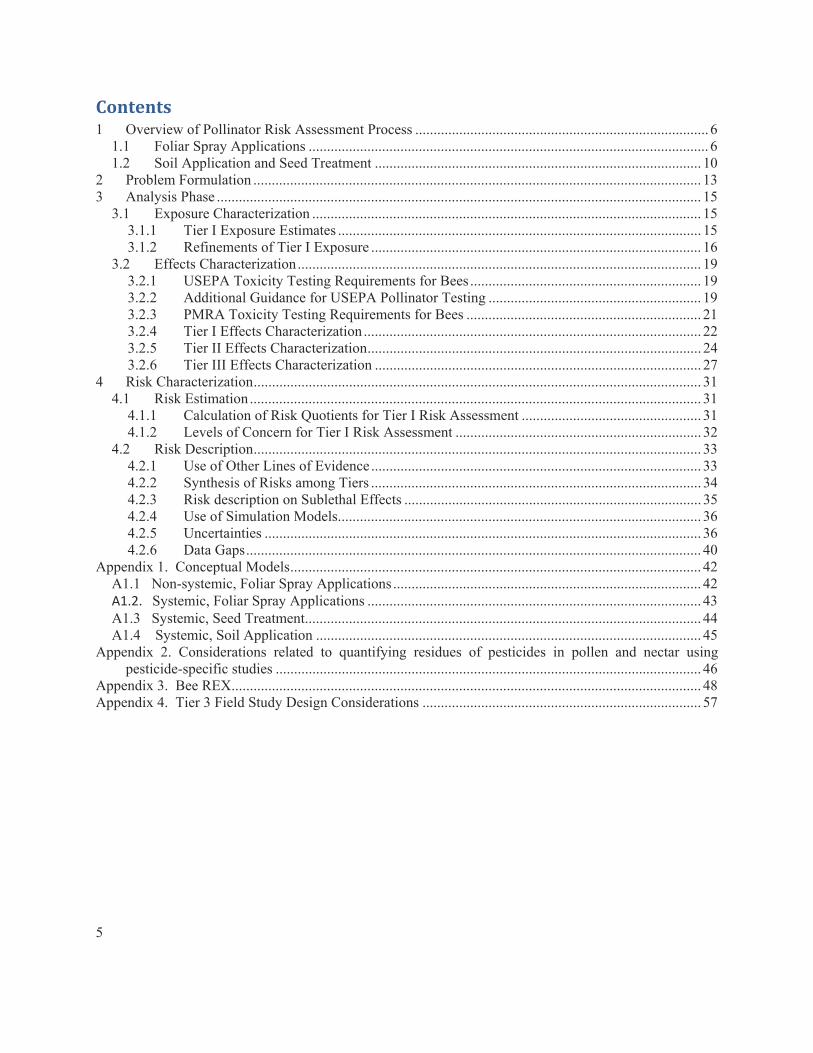
Contents1 Overview of Pollinator Risk Assessment Process ................................................................................ 6
1.1 Foliar Spray Applications ............................................................................................................. 6 1.2 Soil Application and Seed Treatment ......................................................................................... 10
2 Problem Formulation .......................................................................................................................... 13 3 Analysis Phase .................................................................................................................................... 15
3.1 Exposure Characterization .......................................................................................................... 15 3.1.1 Tier I Exposure Estimates ................................................................................................... 15 3.1.2 Refinements of Tier I Exposure .......................................................................................... 16
3.2 Effects Characterization .............................................................................................................. 19 3.2.1 USEPA Toxicity Testing Requirements for Bees ............................................................... 19 3.2.2 Additional Guidance for USEPA Pollinator Testing .......................................................... 19 3.2.3 PMRA Toxicity Testing Requirements for Bees ................................................................ 21 3.2.4 Tier I Effects Characterization ............................................................................................ 22 3.2.5 Tier II Effects Characterization ........................................................................................... 24 3.2.6 Tier III Effects Characterization ......................................................................................... 27
4 Risk Characterization .......................................................................................................................... 31 4.1 Risk Estimation ........................................................................................................................... 31
4.1.1 Calculation of Risk Quotients for Tier I Risk Assessment ................................................. 31 4.1.2 Levels of Concern for Tier I Risk Assessment ................................................................... 32
4.2 Risk Description .......................................................................................................................... 33 4.2.1 Use of Other Lines of Evidence .......................................................................................... 33 4.2.2 Synthesis of Risks among Tiers .......................................................................................... 34 4.2.3 Risk description on Sublethal Effects ................................................................................. 35 4.2.4 Use of Simulation Models ................................................................................................... 36 4.2.5 Uncertainties ....................................................................................................................... 36 4.2.6 Data Gaps ............................................................................................................................ 40
Appendix 1. Conceptual Models ................................................................................................................ 42 A1.1 Non-systemic, Foliar Spray Applications .................................................................................... 42 A1.2. Systemic, Foliar Spray Applications ........................................................................................... 43 A1.3 Systemic, Seed Treatment............................................................................................................ 44 A1.4 Systemic, Soil Application ......................................................................................................... 45
Appendix 2. Considerations related to quantifying residues of pesticides in pollen and nectar using pesticide-specific studies .................................................................................................................... 46
Appendix 3. Bee REX ................................................................................................................................ 48 Appendix 4. Tier 3 Field Study Design Considerations ............................................................................ 57

6
1 OverviewofPollinatorRiskAssessmentProcess This section summarizes the overall risk assessment process for characterizing the risks of pesticides to honey bees (Apis mellifera), which are used as a surrogate species for other Apis and non-Apis bees and other insect pollinators. It provides a brief overview of the key steps and decision points involved in the risk assessment process. As such, it should be not used in isolation; rather it should be considered in conjunction with the detailed risk assessment guidance described in the ensuing sections on Problem Formulation (Section 2), Analysis (Section 3), and Risk Characterization (Section 4). If acceptable data are available for non-Apis bees, that information should be considered as a line of evidence in determining potential risks to bees. An illustration of the decision-making process for assessing risks to honey bees from foliar spray applications of pesticides is shown in Figure 1 while that for pesticides applied via soil or seed treatments is shown in Figure 2. The overall approach is a tiered process whereby risks are first assessed using simple and conservative exposure screening models to generate estimated environmental concentrations (EECs) coupled with toxicity estimates derived from laboratory studies (Tier I) to calculate risk quotients (RQs) for individual bees. Pending results of the Tier I risk estimation, consideration is given to collecting and evaluating information at higher tiers (Tiers II and III), where results are based on effects to the colony, and are considered more environmentally realistic but also requiring greater resources to conduct and interpret. A step-by-step summary of the processes is provided below. The process described below is not intended to be prescriptive and risk assessors should evaluate multiple lines of evidence in determining which data to recommend and be cognizant of the timeline for risk management decisions. Across all of the scenarios described below, an initial determination must be made as to whether a reasonable potential exists for exposure of bees to the pesticide of concern. If there is no exposure, then the likelihood of adverse effects (i.e., risk) is presumed to be low and an additional assessment is not warranted. In such cases, the risk assessor should provide an explanation for why the use of the pesticide will not be likely to result in exposure of concern to bees. Also, and consistent with the process used to assess risk to other taxa, the risk assessment process is intended to be iterative, and the risk assessor should consider the effect that mitigation options may have on reducing exposure and thereby mitigating the need for additional refinements.
1.1 FoliarSprayApplications Step 1. Determine if Bees May Be Exposed. As part of Problem Formulation (Section 2), information on the pesticide use characteristics (Box 1, Figure 1), chemical properties and potential exposure routes are evaluated to determine the need for conducting a bee risk assessment. Information provided with the generic conceptual models for bee risk assessment should be consulted (Appendix 1. Conceptual Models). In general, outdoor spray applications are assumed to have a reasonable potential to result in exposure of adult bees and their brood (eggs, larvae, pupae) to pesticides if they are applied to pollinator attractive crops or drift to pollinator attractive plants during periods when bees are likely to be foraging. Exposure to bee brood and other castes of bees in hives is expected when exposure to foraging bees is identified, as foragers will bring residues back to the hive. Pre-bloom foliar application of pesticides to pollinator attractive crops may also result in exposure to bees if the pesticide is persistent and may translocate to pollen and nectar after spray application. In contrast, indoor uses are generally assumed not to have a reasonable potential for exposure of bees to pesticides. Exceptions do occur, such as in greenhouses where bees are used for pollination (e.g., bumble bee pollination of tomatoes).
7
Step 2. Calculate Tier I Screening-Level Risks. If a reasonable potential for exposure to the pesticide is identified, a screening-level risk assessment is conducted. This step involves a comparison of Tier I estimated exposure concentrations (EECs) for contact and oral routes of exposure to adults and larvae (Boxes 3a,b,c; Section 3.1) to Tier I acute and chronic levels of effects to individual bees using laboratory-based studies (e.g., acute median lethal dose (LD50), chronic no observable adverse effect concentration (NOAEC); Section 1.1). The Tier I EECs can be estimated using the Bee-REX model (see Appendix 3. Bee REX for additional details). The conservatism of the Tier I screening-level risk quotient (RQ) value results primarily from the model-generated exposure estimates that, while intended to represent environmentally relevant exposure levels, are nonetheless considered high-end estimates. The resulting acute and chronic RQ values (Boxes 4a,b,c) are then compared to the corresponding level of concern (LOC) values for acute and chronic risk (i.e., 0.4 and 1.0, respectively). Generally, if RQ values are below their respective LOCs, a presumption of minimal risk is made, since the Tier I risk estimation methods are designed to be conservative. Risk assessors should also consider other lines of evidence in making this determination, as explained in Section 3. It is also important that any uncertainties related to screening-level estimates of exposure and/or toxicity are characterized in the risk discussion section of the risk characterization. Step 3. Refine Tier I Screening-Level Risk Estimates. If risk concerns are identified, the Tier I assessment may be refined using additional data (Box 6; Section 3.1.2). The initial Tier I risk estimation is designed to produce conservative estimates of risk in order to minimize the occurrence of false negative findings. Refinements to Tier I risk estimates may include consideration of pesticide-specific residue data available from crop magnitude of residue studies that are relevant to bees or available studies that quantify pesticide residues in pollen and nectar (Box 9a). Refined RQ values, based on refined estimates of exposure coupled with the Tier 1 effects endpoints from individual bees, are then compared to the aforementioned LOCs to determine the potential for risk (Box 7). Step 4. Consider Uncertainties, Risk Mitigation Options and Need for Tier II Risk Estimation. If risks are identified from Tier I, the risk assessor should consider the uncertainties associated with risk estimation, information from other lines of evidence, and the impact of any risk mitigation options identified for the pesticide of concern (Box 8). These risk mitigation options may include reductions in application rates and restriction of application methods, and recalculation of Tier I risk estimates as a result of reduced environmental loading. Restrictions on the timing of pesticide applications and crops species may also be considered to minimize exposure to bees. The risk assessor should also consider whether information on pesticide exposure and effects collected using Tier II studies are needed (e.g., residues in pollen and nectar studies described in Appendix 2. Considerations related to quantifying residues of pesticides in pollen and nectar using pesticide-specific studies; semi-field tunnel studies as described in Section 3.2.5). Tier II studies may be used to identify more targeted risk mitigation options than those that could be identified based on Tier I data. Measured residues in pollen and nectar (Box 9a) from these studies may also be used to refine risk estimates for Tier I as described previously. Tier II effect studies characterize pesticide effects at the whole-colony level and therefore, reduce uncertainty associated with extrapolating effects on individual bees under laboratory conditions (Tier I toxicity studies) to effects on the colony. It is important to recognize that Tier II effect studies are conducted under semi-field conditions where the high-end exposure at the colony level is expected. In Tier II studies other stressors may be present and potential compensatory mechanisms of the colony may occur. Tier II studies should be designed to address potential uncertainties identified in the Tier I assessment or elsewhere (e.g., incident reports). Unlike Tier I, characterization of risk in Tier II does not involve the calculation of RQ values per se (Box 10). Rather, risks at the colony level are usually characterized in relation to pesticide application rate and/or measured residue levels (Section 3.2.6). Interpretation of such whole-colony effects studies is often much more
8
complex than Tier I studies, and relies on comprehensive considerations of whether adverse effects are likely to occur at the colony level. Step 5. Consider Uncertainties, Risk Mitigation Options and Need for Tier III Studies. Based on the risks identified at lower-tier assessments, their associated uncertainties, and other lines of evidence, the risk assessor should consider the impact of any risk mitigation options identified for the pesticide of concern (Box 11). The need for more refined information conducted at Tier III should be determined depending on the nature of the estimated risks, the associated uncertainties, and available risk mitigation options. Risk mitigation options may include reduced application rates, reduced application intervals, restrictions on applications at or near bloom or off-labeling use on a particular crop. As an example, effects on the ability of colonies to successfully emerge in the spring (e.g., produce sufficient brood and adult bees after over-wintering) may be a concern for some pesticides/uses which are not typically addressed in lower tiers. Tier III studies are full-field studies that are designed to mimic actual pesticide applications and exposure of bees encountered in the environment (Section 3.2.6; Box 12). Tier III field studies are usually highly complex and require a high level of effort to design and conduct so as to address specific sources of uncertainties and potential risks identified in lower tiers. Because of the length and complexity of these studies, other factors affecting colony survival (e.g., disease, pests, nutrition) may impact the successful completion and interpretation of these studies. As with any field study, the design and conduct of such studies is crucial to their interpretation and utility in risk assessment. Similar to risk characterization at Tier II, risk characterization at Tier III considers multiple lines of evidence available from lower Tiers and other information sources (e.g., open literature) that meet the respective Agency’s standard for inclusion in risk. Risk assessment conclusions are made based on the weight of evidence, available risk mitigation options, and uncertainties in the available data and methods (Section 4). At any stage of the risk assessment process, EPA/PMRA/CDPR may determine that risk mitigation is appropriate. The decision to implement risk mitigation is based on the existing analysis and does not necessarily depend on completing all three tiers of the full risk assessment process.

9
Figure 1. Tiered Approach for Assessing Risk to Honey Bees from Foliar Spray Applications.

10
1.2 SoilApplicationandSeedTreatment The risk assessment process for evaluating soil applications (e.g., soil drench) and seed treatments is similar to that described previously with foliar applications, except that risk from contact exposure is not evaluated. For soil application, it is generally assumed that exposure of honey bees from direct contact with the pesticide is minimal, given the nature of the application to bare soil, although exceptions may occur if applications are made with bee-attractive weeds present. Contact exposure of non-Apis bees (e.g., solitary and ground-nesting bees) may be significant with soil applications; however, the extent of this potential exposure is uncertain. It is also noted that for seed treatments, exposure of bees to pesticides has been documented via drift of abraded seed coat dust when planting under certain conditions; however, there are multiple factors determining the extent to which dust-off occurs. Modeling tools have not been developed to estimate exposure under these conditions. EPA and PMRA may determine that implementing best management practices designed to mitigate this route of exposure may be appropriate. As discussed in the preceding section, the decision to implement risk mitigation would be based on the existing analysis and does not necessarily depend on completing all three tiers of the full risk assessment process. Step 1. Determine if Bees May Be Exposed. As part of Problem Formulation (Section 2), information on the pesticide use characteristics (Box 1, Figure 2), chemical properties and potential exposure routes is evaluated to determine the need for conducting a bee risk assessment. Information provided with the generic conceptual models for bee risk assessment should be consulted (

11
Appendix 1. Conceptual Models). In absence of information to indicate otherwise, it is assumed that soil-applied and seed-treated pesticides are systemic and able to be transported to pollen and nectar. Therefore, seed treatments and outdoor application to soils are generally assumed to have a reasonable potential to result in exposure of bees, including both adult and immature stages of bees, to pesticides via consumption of contaminated pollen and/or nectar. Step 2. Calculate Tier I Screening-Level Risks. If a reasonable potential for exposure to the pesticide is identified, a screening-level risk assessment is conducted. This step is identical to that described in Step 2 for assessment of foliar spray applications except that the exposure modeling tools differ. Different methods are used to estimate pesticide residues in pollen and nectar from soil application and seed treatment (see Section 3.1.1). Otherwise, risk estimation, LOCs and consideration of multiple lines of evidence are identical to those described previously in Step 2 for foliar pesticide applications. All subsequent steps (i.e., Step 3. Refine Tier I Screening-Level Risk Estimates; Step 4. Consider Uncertainties, Risk Mitigation Options and Need for Tier II Refinements and Step 5. Consider Uncertainties, Risk Mitigation Options and Need for Tier III Studies) are identical to those described previously for foliar spray application of pesticides.

12
Figure 2. Tiered Approach for Assessing Risk to Honey Bees from Soil/Seed Treatments.

13
2 ProblemFormulation Problem formulation is a critical step in ecological risk assessment and is intended to articulate, among other things, the protection goals around which the assessment is conducted. Relative to bees, the protection goals include the maintenance of pollination services, hive product production and biodiversity (Table 1). These goals do not apply uniformly across Apis and non-Apis bees; however, they are considered protective for social and solitary bees, and honey bees are generally used a surrogate for non-Apis bees. These protection/management goals in turn dictate assessment endpoints for which specific measurement endpoints are identified. Ideally, problem formulations should articulate the protection/management goals as well as the risk hypothesis including how these goals may be compromised due to the proposed or existing use(s) of a pesticide. The risk hypothesis and conceptual model are used to depict the hypothesis in terms of the source of the stress, route of exposure, receptor, and changes in the receptor attribute(s) of concern. A number of generic conceptual models have been developed and these should be adapted to reflect, where appropriate, the potential risks to bees that will be evaluated. The White Paper discusses and Appendix 1. Conceptual Models of this guidance provides conceptual models (e.g., foliar application of non-systemic and systemic pesticides, soil-applied and seed-coated systemic4 pesticides) for honey bees that can be readily adapted and integrated into conceptual models that include other taxa or included as a stand-alone conceptual model. Table 1. Protection goals and examples of associated assessment and measurement (population and individual) endpoints for bees.
Protection Goal Assessment Endpoints Example Measurement Endpoints
Population level and higher
Individual Level
Contribution to Bee Biodiversity
Species richness1 and abundance
Individual bee survival (solitary bees) and colony strength and survival (social bees) Species richness and abundance1
Individual worker and larval survival assays; larval emergence; queen fecundity/reproduction
Provision of Pollination Services
Population size2 and stability of native bees and commercially managed bees
Colony strength and survival; colony development
Individual worker and larval survival assays; queen fecundity; brood success; worker bee longevity
Production of Hive Products
Quantity and quality of hive products
Quantity and quality of hive products; including pesticide residue levels on honey/wax
Individual worker and larval survival assays; queen fecundity/reproduction; larval emergence
1Use of honey bees as a surrogate for other insect pollinators has limitations; however, it is assumed that as with all surrogates, data on individual organisms as well as colony-level data would provide some relevant information on the potential effects of a pesticide on both solitary bees as well as “eusocial” taxa. In addition, protection of honey bees would contribute to pollinator diversity indirectly by preserving the pollination and propagation of the many plants species pollinated by honey bees, which also serve as food sources for other pollinating insects. 2 For managed honey bees, population size can include numbers of colonies.
For most pesticides used in an agricultural setting, the predominant exposure routes are through diet (i.e., consumption of nectar and pollen) and contact (i.e., direct spray). Exposure due to the vapor phase of a
4 Depending on physical-chemical properties, systemic pesticides can move within the vascular (xylem and/or phloem) tissues to untreated tissues of the plant or remain locally distributed through extracellular movement. Therefore, a pesticide may be xylem mobile, phloem mobile, both xylem and phloem mobile, or locally systemic.

14
pesticide is relatively small compared to diet and contact, with the exception of fumigants. Additionally, the importance of exposure through consumption of drinking water, relative to the dietary and contact routes of exposure is under investigation5. For pesticides that are applied to seeds, exposure to dust from treated seed during planting may also be of concern. The extent to which honey bees are exposed via contact with abraded seed coat dust is determined by many factors including the physical‐chemical properties of the seed coating, seed planting equipment, use of seed delivery agents (e.g., talc or graphite), environmental conditions (wind speed, humidity), existence of flowers nearby the sowing area, and hive location in relation to sowing. As recognized by the FIFRA SAP, the production of dust during planting should be minimized to the extent possible in order to minimize the exposure to bees; additional considerations and assessment of risk should be completed on a chemical-specific basis. The primary question risk assessors must address initially is whether, given the existing or proposed use(s) and physical-chemical properties of a pesticide, exposure is likely to occur for bees from the treated crop or resulting spray/dust drift to a blooming weed on the field or blooming plants near-field. If exposure is not likely for bees, then the problem formulation should state and the conceptual model should depict why the exposure is considered unlikely. Where exposure cannot be precluded, the problem formulation should identify the available body of information on exposure and effects that will be considered to support the screening-level risk assessment. If, during the risk assessment, further refinements are deemed necessary, the risk hypothesis and conceptual model can be modified accordingly and the analysis plan revised to identify additional exposure and effects data that will be considered thereby reflecting the iterative nature of the risk assessment process. Use of honey bees as a surrogate for other insect pollinators has limitations; however, it is assumed that, as with all surrogates, data on individual organisms as well as colony-level data would provide some relevant information on the potential effects of a pesticide on both solitary bees as well as social bees. In addition, protection of honey bees would contribute to pollinator diversity indirectly by preserving the pollination and propagation of the many plants species pollinated by honey bees, which also serve as food sources for other pollinating insects. In evaluating potential risks specific to honey bees, the most important commercial pollinators, the protection goals of preserving pollination services and production of hive products (e.g., honey, wax) are readily assessed through the assessment of population size and the stability (e.g., presence of a queen, uniform brood pattern) of the colony and through direct and indirect measures of the quantity and quality of hive products (Table 1). As such, the sensitivity of individual larval or adult honey bees based on laboratory-based acute and chronic toxicity studies serve as reasonable measurement endpoints for screening-level assessments of potential adverse effects on colony strength, survival and capacity of the colony to produce any products. While these measurement and assessment endpoints are tested using managed honey bee colonies, they apply to feral honey bee colonies and, in the absence of data specific to other bees, these measurement endpoints provide useful information for assessing the survival and development of solitary bees and potential effects on bee species richness and biodiversity. To the extent that data are available for other species such as the bumble bee (e.g., Bombus terrestris), blue orchard bee (Osmia lignaria), alfalfa leafcutting bee (Megachile rotundata), these species may also be considered in the risk assessment. As discussed in the White Paper, available information for the bumble bee, blue orchard bee and the alfalfa leafcutting bee indicate that the screening-level risk assessment based on effects to individual honey bees is likely to be protective for these three species; however, this is likely chemical specific and available data must be considered in determining whether this assumption is supported for chemical under consideration.
5 This investigation includes consideration of recommendations provided by the FIFRA SAP with regard to the model used for estimating the relative importance of drinking water as a significant exposure route. An in-depth analysis of the model used to estimated pesticide concentrations in puddles is currently being completed.

15
3 AnalysisPhase The analysis phase consists of the exposure characterization and the effects characterization relative to bees. A tiered approach, from the most conservative at lower tiers (Tier I) to more realistic at higher tiers (Tiers II and III) should be considered during the data requirement determinations and risk assessment. Steps that should be considered within each characterization are depicted in the relevant decision tree in Figure 1 and Figure 2.
3.1 ExposureCharacterization
3.1.1 TierIExposureEstimates Contact and dietary exposure are estimated separately using different approaches specific for different application methods. Table 2 summarizes the methods used for deriving Tier I estimated environmental concentrations (EECs) for contact and dietary routes of exposure for foliar, soil, seed treatments and tree-trunk injections. These EECs are calculated using the Bee-REX model. In the Tier I, pesticide exposures are estimated based on honey bee castes with known high-end consumption rates. For larvae, food consumption rates are based on 5-day old larvae, which consume the most food compared to other days of this life stage. For adults, the screening method relies upon nectar foraging bees, which consume the greatest amount of food (pollen and nectar) compared to other adult worker bees. It is assumed that this value will be comparable to the consumption rates of adult drones and will be protective for adult queens as well. Although the queen consumes more food than adult workers and drones, the queen consumes food that is assumed, based on currently available data, to contain orders of magnitude less pesticide than that consumed by workers since the queen is only fed a processed food, i.e., royal jelly. As described in the White Paper, nectar is the major food source for foraging honey bees as well as nurse bees. Therefore, pesticide residues in nectar likely account for most of the exposures to bees, and may represent most of the potential risk concerns for adult bees. However, if residues in pollen are of concern, exposures to nurse bees, which consume more pollen than any other adult honey bees, should be considered. This is the case especially when pesticide concentrations in pollen are much greater than in nectar, or for crops that mainly provide pollen to bees and would be assessed on a case-by-case basis. In fact, the Bee-Rex allows calculation of RQs for all types of bee castes. For chemicals with no empirical data to represent the concentration of the chemical in pollen and nectar, dietary exposure for Tier I risk assessment is estimated using generic residue data generated from other chemicals as well as other plant parts. For foliar applications for dietary exposure, it is assumed that pesticide residues on tall grass (from the Kenaga nomogram of T-REX which is incorporated into Bee-REX) are a suitable surrogate for residues in pollen and nectar of flowers that are directly sprayed. For soil applications, pesticide concentrations in pollen and nectar are assumed to be consistent with chemical concentrations in the xylem of barley (calculated using the Briggs’ model). For seed treatments, pesticide concentrations in pollen and nectar are based on concentrations in leaves and stems of treated plants (based on the European and Mediterranean Plant Protection Organization (EPPO) default value discussed in the White Paper), assumed to be 1 milligram per kilogram (mg/kg) or 1 part per million (ppm). More details on these methods are available in the White Paper and in the T-REX user’s guidance. For tree trunk injections, methods are still under development as discussed in the White Paper; one approach is where application rates are converted into a tree-foliage weight basis (Table 2). The Tier I method is intended to generate “reasonably conservative” estimates of pesticide exposure to honey bees, where reliable residue values (i.e., measured residue levels in pollen and/or nectar) are not

16
available. As noted in Table 2 (far right column), exposure estimates for foliar applications are derived using the application rate (AR) being assessed. Model users should follow the input parameter guidance contained in the Bee-REX user’s guide when running this model. Table 2. Summary of contact and dietary exposure estimates used for foliar applications, soil treatments, seed treatments and tree trunk injections of pesticides for Tier I risk assessments.
Measurement Endpoint
Exposure Route Exposure Estimate*
Foliar Applications
Individual Survival (adults) Contact AREnglish*(2.7 µg a.i./bee) ARMetric*(2.4 µg a.i./bee)
Individual Survival (adults) Diet AREnglish *(110 µg a.i /g)*(0.292 g/day) ARMetric *(98 µg a.i /g)*(0.292 g/day)
Brood size and success Diet AREnglish *(110 µg a.i /g)*(0.124 g/day) ARMetric *(98 µg a.i /g)*(0.124 g/day)
Soil Treatments Individual Survival (adults) Diet (Briggs EEC)*(0.292 g/day) Brood size and success Diet (Briggs EEC)*(0.124 g/day)
Seed Treatments Individual Survival (adults) Diet (1 µg a.i /g)*(0.292 g/day) Brood size and success Diet (1 µg a.i /g)*(0.124 g/day)
Tree Trunk Applications++ Individual Survival (adults) Diet (µg a.i. applied to tree/g of foliage)*(0.292 g/day) Brood size and success Diet (µg a.i. applied to tree/g of foliage)*(0.124 g/day)
AREnglish = application rate in lbs a.i./A; ARMetric = application rate in kg a.i./ha *Based on food consumption rates for larvae (0.124 g/day) and adult (0.292 g/day) worker bees and concentration in pollen and nectar. ++Note that concentration estimates for tree applications are specific to the type and age of the crop to which the chemical is applied.
In the Tier I approach, it is assumed that all chemicals applied as a soil drench, seed treatment, or trunk injection may be systemically transported. This assumption may be refuted using data such as Log Kow (Ryan et al. 1988) and monitoring data (e.g., crop rotation studies). Whether a chemical is transported systemically in plants could potentially be confirmed using empirical data submitted to EPA, PMRA and CADPR (e.g., plant metabolism studies); however, it would be up to pesticide registrants/applicants to submit sufficient data to demonstrate that a pesticide is not systemic.
3.1.2 RefinementsofTierIExposure In cases where RQs exceed the LOC (discussed below), estimates of exposure may be refined using measured pesticide concentrations in pollen and nectar of treated crops, and further calculated for other castes of bees using their food consumption rates (see Table 3). As discussed above in Section 3.1.1, the most conservative (highest) exposure estimates for contact and/or diet exposure routes are selected for the Tier I screening-level assessment. These exposure estimates are based on adult and larval bees with the highest food consumption rates among bees. The Bee-REX tool also calculates dietary exposure values and associated RQs for larvae of different ages, adult workers with different tasks (and associated energetic requirements) and the queen. This is accomplished using the food consumption rates provided in Table 3. Those food consumption rates are based on work described in the

17
White Paper (USEPA, PMRA, CDPR 2012)6 and updated to reflect comments from the Scientific Advisory Panel (SAP). Exposure values for other groups of bees within a hive along with their RQs can be used to characterize risks of dietary exposures of different bees within the hive. Empirical data may be used to refine conservative exposure estimates and reduce uncertainties associated with the Tier I exposure assessment by providing direct measurements of pesticide concentrations resulting from actual use settings. Studies investigating pesticide concentrations in pollen and nectar should be designed to provide residue data for crops and application methods of concern. Appendix 2. Considerations related to quantifying residues of pesticides in pollen and nectar using pesticide-specific studies includes considerations related to quantifying residues of pesticides in pollen and nectar using pesticide-specific studies.
6 USEPA, PMRA, CDPR (2012) White paper in support of the proposed risk assessment process for bees. United States Environmental Protection Agency, Office of Pesticide Programs, Washington DC. Pest Management Regulatory Agency, Health Canada, Ottawa. California Department of Pesticide Regulation, Sacramento, CA.

18
Table 3. Estimated food consumption rates of bees.
Life Stage
Caste (task in hivea) Average age
(in days)a
Daily consumption rate (mg/day)
Jelly Nectarb Pollen Total
Larval
Worker
1 1.9 0 0 1.9 2 9.4 0 0 9.4 3 19 0 0 19 4 0 60 c 1.8d 62 5 0 120 c 3.6d 124
Drone 6+ 0 130 3.6 134
Queen
1 1.9 0 0 1.9 2 9.4 0 0 9.4 3 23 0 0 23
4+ 141 0 0 141
Adult
Worker (cell cleaning and capping) 0-10 0 60f 1.3 - 12g,h 61 - 72 Worker (brood and queen tending, nurse bees) 6-17 0 113 - 167f 1.3 - 12g,h 114 - 179 Worker (comb building, cleaning and food handling) 11-18 0 60f 1.7g 62 Worker (foraging for pollen) >18 0 35 - 52f 0.041g 35 - 52
Worker (foraging for nectar) >18 0 292
(median)c 0.041g 292
Worker (maintenance of hive in winter) 0-90 0 29f 2g 31 Drone >10 0 133 - 337 c 0.0002c 133 - 337 Queen (laying 1500 eggs/day) Entire lifestage 525 0 0 525
a Winston (1987) b Consumption of honey is converted to nectar-equivalents using sugar contents of honey and nectar. c Calculated as described in this paper. d Simpson (1955) and Babendreier et al. (2004) e Pollen consumption rates for drone larvae are unknown. Pollen consumption rates for worker larvae are used as a surrogate. f Based on sugar consumption rates of Rortais et al. (2005). Assumes that average sugar content of nectar is 30%. g Crailsheim et al. (1992, 1993) hPain and Maugenet 1966

19
3.2 EffectsCharacterization
3.2.1 USEPAToxicityTestingRequirementsforBees USEPA data requirements for pollinator testing are currently specified in Title 40 (Protection of the Environment) of the Code of Federal Regulations, Part 158 (Data Requirements for Pesticides) Subpart G (Ecological Effects) § 158.630 (Terrestrial and Aquatic Non-target Organism Data Requirements Table).7 When certain pesticide use patterns or triggers are met, current test requirements include the honey bee acute contact toxicity test (OCSPP Guideline 850.3020)8, the honey bee toxicity of residues on foliage test (OCSPP Guideline 850.3030)9 and field testing for pollinators (OCSPP Guideline 850.3040)10. The honey bee acute contact toxicity test is required for pesticide technical grade active ingredients (TGAI) with terrestrial, forestry and residential outdoor uses and is conditionally required for pesticides with aquatic uses as a Tier I screen conducted under laboratory conditions. If the results of the honey bee acute contact toxicity test indicates that a pesticide has a median acute lethal dose to 50% of the animals tested, i.e., the LD50 value, of less than (<) 11 micrograms (µg) per bee and the use pattern indicates that honey bees may be exposed, then the toxicity of residues on foliage test is required as a laboratory-based test using the technical end-use product (TEP). As specified in CFR40 § 158.63011, field testing of pollinators is required if any of the following conditions are met: Data from other sources (Experimental Use Permit program, university research, registrant submittals, etc.) indicate potential adverse effects on colonies, especially effects other than acute mortality (reproductive, behavioral, etc.); data from residual toxicity studies indicate extended residual toxicity; or data derived from studies with terrestrial arthropods other than bees indicate potential chronic, reproductive or behavioral effects. Field studies are intended to represent real world conditions and are considered refined (Tier III) toxicity tests. Pollinator field study designs have in the past varied considerably; therefore, study design elements that are consistent with the specific hypothesis being testing in the field study should be identified in advance and considered in the development of the study protocol. Appendix 4. Tier 3 Field Study Design Considerations includes some generic study design elements.
3.2.2 AdditionalGuidanceforUSEPAPollinatorTesting In addition to the honey bee adult contact toxicity study identified in the 40CFR158, several additional studies are recommended to support the Tier I screen, as indicated in Figure 1 and Figure 2 and as discussed in the White Paper. These studies include:
Acute oral toxicity to adult honey bees Acute oral toxicity to larval honey bees Chronic oral toxicity to adult honey bees
7 CFR40. 2011. Part 158, subpart G, §158.630 http://ecfr.gpoaccess.gov/cgi/t/text/text-idx?c=ecfr;sid=fe712efed37d095118c7637457e011b3;rgn=div5;view=text;node=40%3A23.0.1.1.9;idno=40;cc=ecfr#40:23.0.1.1.9.7 8 USEPA. 1996a. Ecological Effects Test Guidelines OPPTS 850.3020. Honey Bee Acute Contact Toxicity. EPA 712-C-96-147. http://www.epa.gov/ocspp/pubs/frs/publications/OPPTS_Harmonized/850_Ecological_Effects_Test_Guidelines/Drafts/850-3020.pdf 9 USEPA 1996b. Ecological Effects Test Guidelines OPPTS 850.3030. Honey Bee Toxicity of Residues on Foliage. EPA 712-C-96-148. http://www.epa.gov/ocspp/pubs/frs/publications/OPPTS_Harmonized/850_Ecological_Effects_Test_Guidelines/Drafts/850-3030.pdf 10 USEPA 1996c. Ecological Effects Test Guidelines OPPTS 850.3040. Field Testing for Pollinators. EPA 712-C-96-150. http://www.epa.gov/ocspp/pubs/frs/publications/OPPTS_Harmonized/850_Ecological_Effects_Test_Guidelines/Drafts/850-3040.pdf 11 Ibid CFR40 2011.

20
Chronic oral toxicity to larval honey bees. Although EPA guidelines have not been developed for these studies, the Organization for Economic Cooperation and Development (OECD) has developed a formal test guideline for an acute oral toxicity study with adult honey bees (OECD 213)12 as well as a test guideline for acute oral toxicity study with honey bee larvae (OECD 237)13. As noted in the White Paper, OECD also has developed a test guideline for assessing acute contact toxicity with adult bees (OECD 214)14, that may provide sufficient data to fulfill the 40CFR158 adult contact toxicity test requirement ordinarily fulfilled by EPA 850.3020. A chronic (repeat dose) study guidance for assessing the oral toxicity to honey bee larvae is currently in development by OECD, as is a guideline for assessing chronic (10-day) oral toxicity to honey bee adults. In situations where formal guidelines do not exist, data recommendations are identified to address specific uncertainties regarding the potential for adverse effects; these studies should be recommended as “special studies” and reference the appropriate OECD test guideline and/or other applicable guidance. Typically, non-guideline studies recommended as “special studies” (e.g., acute adult oral and larval toxicity tests) are intended to address specific uncertainties and a suitable rational for the study should be included in the data recommendation. Semi-field (e.g., tunnel studies) and full-field studies have frequently been categorized as field pollinator studies falling under EPA 850.3040. As discussed in the White Paper, OECD has developed guidance for semi-field tests (e.g., OECD 75)15 and efforts are underway to further refine and standardized methods for conducting such tests. As discussed previously, Tier III studies of free-foraging bees are typically required to address specific uncertainties identified in lower tier studies and/or based on a concordance of multiple lines of evidence. Therefore, the methods used in these studies while described generically in EPA 850.3040 would likely be chemical/use specific and guidance is provided (see Appendix 4. Tier 3 Field Study Design Considerations) on elements to consider when recommending/evaluating such studies. The decision to recommend bee toxicity data should consider multiple factors including the pesticide use pattern, chemical properties, and the nature of uncertainties based on existing data for the chemical or similarly structured chemicals. For example, the Tier I toxicity studies are generally limited to outdoor use patterns, although some indoor uses in greenhouses may also warrant testing when plants are commercially pollinated (e.g., bumble bee pollination of tomatoes). As discussed in the White Paper and in this guidance, if exposure is not considered likely, then effects testing may not be warranted beyond the screening-level data collected at Tier 1 or may not be warranted at all if no exposure is considered likely. If a particular use is determined not to result in exposure to bees, then a suitable rationale should be developed to support this determination. However, toxicity data using the typical end use product (TEP) may be needed in addition to data on technical grade active ingredient (TGAI) if there are data to indicate that a typical end-use product is potentially more toxic than the technical grade active ingredient and bees may come directly in contact with the intact TEP. The need for additional data should be informed by whatever information has already been identified and should consider multiple lines of evidence. This may include data that may be available for similarly
12 OECD. 1998a. OECD Guidelines for the Testing of Chemicals. Honeybees, Acute Oral Toxicity Test. 213. http://lysander.sourceoecd.org/vl=5988235/cl=12/nw=1/rpsv/cgi-bin/fulltextew.pl?prpsv=/ij/oecdjournals/1607310x/v1n2/s14/p1.idx 13 OECD. 2013. OECD Guidelines for Testing Chemicals. Honey bee (Apis mellifera) larval toxicity test, single exposure.. http://www.oecd-ilibrary.org/environment/test-no-237-honey-bee-apis-mellifera-larval-toxicity-test-single-exposure_9789264203723-en 14 OECD.1998a. OECD Guidelines for the Testing of Chemicals. Test Number 214, Acute Contact Toxicity Test. http://www.oecd-ilibrary.org/environment/test-no-214-honey bees-acute-contact-toxicity-test_9789264070189-en;jsessionid=43gvto47wnue9.delta 15 OECD 2007. Guidance document on the honey bee (Apis mellifera) brood test under semi-field conditions. OECD Environment, Health and Safety Publications. Series on Testing and Assessment No. 75. ENV/JM/MONO (2007) 22.

21
structured chemicals with common modes of action to achieve an economy of effort and limit, to the extent possible, the need for animal testing that may ultimately prove to be redundant. While this guidance articulates a tiered progression of exposure and effects data, the agencies retain the right to ask for data in the order that is most relevant to risk management needs considering the multiple lines of evidence that are available.
3.2.3 PMRAToxicityTestingRequirementsforBees The PMRA has been requiring both acute oral and contact honey bee adult toxicity studies when there is potential for exposure for insect pollinators. Colony-level bee studies have also been required when there is a potential for colony exposure and effects on the colony and developing brood. These acute studies, together with colony-level studies, including Tier II semi-field and Tier III field studies, are incorporated in the risk assessment for insect pollinators. Based on the SAP Pollinator Risk Assessment Framework, additional studies are recommended to support the evaluation of insect pollinators where exposure is considered likely. These include both larval bee toxicity and adult bee chronic oral toxicity studies. Insect pollinator studies are generally not required for use site categories where pollinator exposure is not considered likely. In general, Tier I studies should be conducted under controlled laboratory conditions using the TGAI, while studies with the end-use products may be used to supplement the TGAI information. Additionally, information on potentially toxic transformation products may be required. Tier II and III studies should be conducted under progressively more realistic conditions using typical end-use products. A tiered approach is used for these data requirements; when a risk is identified at a lower tier, higher-tier studies are required to further assess the risk. Additionally, if other available information, such as scientific research and published literature, indicates potential for adverse effects on insect pollinators and/or colonies, then higher-tier studies or specific studies may be required to address the potential for concern. Data submitted to PMRA for other non-target arthropods (predators and parasitoids) may also be considered in risk assessment for insect pollinators. Generally, the following studies may be required to assess the risk to insect pollinators:
Tier I insect pollinator studies: o Bee adult acute contact toxicity o Bee adult acute oral toxicity o Bee larvae toxicity o Bee adult chronic oral toxicity
Higher Tier and other insect pollinator studies: o Residue study for insect pollinators o Semi-field study for insect pollinators o Field study for insect pollinators o Bee toxicity of residues on foliage o Other insect pollinator studies
22
3.2.4 TierIEffectsCharacterization
3.2.4.1 AcuteOralandContactStudies Acute toxicity testing with both adult and larval bees examines the short-term effect of the test material after a short-term exposure; chronic toxicity testing typically examines multiple exposures (repeat or continuous dosing) with an extended period of observation time. Acute and/or chronic oral and contact toxicity studies should be conducted according to available study guidelines described in the previous sections. In cases where established guidelines are not available either in North America or through the OECD, proposed study protocols should be reviewed and approved prior to the initiation of the definitive study. Ideally, these acceptable protocols should be made available for consideration by other risk assessors attempting to address similar uncertainties. Typically, the primary measurement endpoint derived from the acute oral and acute contact toxicity studies is the median lethal dose for 50% of the organisms tested (i.e., LD50). A. mellifera is used as a surrogate for assessing risks to bees. However, depending on the circumstances triggering the data requirements, risk assessors should be flexible in determining which species and studies are most relevant. Any biological effects and abnormal responses, including sublethal effects, other than the mortality should be reported during the acute contact and oral studies according to the requirement of the study guidelines. To the extent that these measurement endpoints are dose responsive, consideration should be given to developing a median effect dose for 50% of the organisms tested (i.e., ED50) in addition to a median lethal dose (LD50), if the data permit such an analysis. Alternatively, the risk assessment should note where sublethal measurement endpoints appear to exhibit a trend across treatment levels. Although it may be possible to extract both a no-observed adverse effect level (NOAEL) and an EDx or LDx value from the laboratory-based acute studies, it is important to note differences in hypothesis-based test designs needed to reliably support NOAEL versus regression-based study designs needed to support EDx and LDx estimates. Hypothesis-based endpoints require sufficient replication to test for treatment effects; whereas, regression-based estimates do not. The dose-response relationship derived from Tier I studies can provide useful information in terms of slope of the dose-response curve.
3.2.4.2 ChronicToxicityStudies Chronic effects on adult and/or larval bees are considered in Tier I of the new assessment framework. Such effects observed in guideline toxicity tests when protocols are sufficiently vetted and/or effects that have been reported in the open literature that could potentially affect the colony should be considered in determining which, if any, higher-tier tests are required and how the study should be designed. Studies under development include the adult 10-day toxicity test and the repeat-dose larval toxicity test. Appendix O of the European Food Safety Authority (EFSA) guidance document on bee risk assessment (EFSA 2013)16 discusses study design elements for the 10-day adult toxicity test and the OECD is currently evaluating a proposed guidance for repeat-dose testing with honeybee larvae that extends through emergence of adult bees. For the 10-day adult study, EFSA recommends the derivation of an LC50 and NOAEC while the draft OECD repeat-dose larval toxicity study recommends the derivation of an NOAEC; however, as discussed above, consideration should be given to the study design in determining the most appropriate endpoint to derive.
16 EFSA. Guidance on the risk assessment of plant protection products on bees (Apis mellifera, Bombus spp. and solitary bees. EFSA Journal 2013;11(7):3295, 266 pp. doi:10.2903/j.efsa.2013.3295. Available online: www.efsa.europa.eu/efsajournal
23
3.2.4.3 ToxicityStudiesInvolvingExposuretoVaporPhasePesticides For a limited number of compounds (e.g., fumigants), inhalation toxicity studies may be required as a special study. Since current acute toxicity testing with young adult bees is typically conducted using a small cage where bees are exposed through the diet (spiked sugar solution), it would be possible to conduct an inhalation study using a similar test design where bees are fed untreated sugar solution, but the cage is contained within a hermetic or flow-through container containing differing concentrations of the pesticide in air. Because this is a modification of the existing protocol, registrants should submit the proposed study protocol for review and approval by EPA and/or PMRA prior to conduct of the study. The protocol should contain a rationale for the proposed air concentrations and durations of exposure.
3.2.4.4 ToxicityofResiduesonFoliagetoHoneyBees Based on the contact LD50 value, the pesticide is classified as practically non‐toxic (LD50 ≥11 μg/bee), moderately toxic (10.9 > LD50 >2 μg/bee), or highly toxic (<2 μg/bee). Unless the pesticide is determined to be practically non‐toxic, EPA would then typically require a study on the toxicity of residues on foliage to honey bees (OSCPP 850.3030; USEPA 2012)17. The current OCSPP guideline study 850.3030 (USEPA 2012) evaluates the toxicity of residues on foliage to honey bees. In this study, a formulated product of a chemical is applied to a bee attractive plant (e.g., clover or alfalfa) at the maximum application rate with the minimum application interval. The crop is then harvested in a manner that provides different age residues (e.g., 0, 3, 8, 24, 48, 72 and 96 hours after application). The harvested foliage is brought back to the laboratory where it is placed into cages. Adult bees are placed in each cage with the foliage and allowed to come into contact with the foliage. Food and water are provided ad libitum. The bees exposed to weathered foliage are monitored for a period of time until mortality declines to below 25%. The measurement endpoint derived from this study is the residual time to 25% mortality (RT25), which is defined as the time needed to reduce the “residual toxicity” of the test substance, as measured by mortality, to 25% of the test organisms. The time period determined by this toxicity value is considered to be the time that the test substance is expected to remain toxic to bees in the field from the residual contact exposure of the test substance on vegetation at an expressed rate of application (typically expressed in terms of lbs a.i./A). The results of the foliar residue study may be useful in the characterization of effects and risks of a pesticide to honey bees through a contact exposure route with treated foliage and can be used to inform risk mitigation measures related to timing of pesticide application (e.g., how long a pesticide may be expected to present a risk from contact with foliage to foraging honey bees after its application). Currently, the residue on foliage study is not used to derive RQs as part of the Tier I risk assessment process; however, the test may provide useful information for characterizing the extent (duration of time) to which residues may remain toxic to bees and may be helpful in identifying particular formulations with extended residual toxicity. It is important to note that RT25 values are specific to formulations and may not be predictive across multiple formulations of a particular active ingredient Although it may be inferred from the White Paper that an RT25 >8 hrs represents a chemical with an extended residual toxicity (ERT), ERT has not been formally defined by EPA
17 USEPA. 2012. Ecological Effects Test Guidelines OCSPP 850.3030 Honey Bee Toxicity of Residues on Foliage. EPA 712‐C‐018. January 2012. http://www.regulations.gov/#!documentDetail;D=EPAHQ‐OPPT‐2009‐0154‐0017

24
3.2.5 TierIIEffectsCharacterization As discussed in the White Paper, the decision to move to more refined effects testing and to transition from laboratory-based studies with individual bees (i.e., Tier I) to colony-based studies (i.e., Tier II or Tier III) depends on whether Tier I LOCs are exceeded, the availability of data, and the nature of uncertainties that warrant further testing. The Tier II studies are typically considered “semi-field” studies where small colonies (referred to as nuclei colonies or “nucs”)18 are enclosed in tunnels, along with pesticide-treated crops. Tier II studies may also include feeding studies in which whole colonies are tested; however, the colonies are not confined to enclosures. Typical semi-field studies are usually conducted under conditions that represent the worst-case exposure scenario of proposed uses to the entire colony (over the duration of the study) or designed to address specific uncertainties with respect to effects on the colony; whereas, the feeding studies are usually conducted with diets spiked with known concentration of test chemical using colonies that are not confined to enclosures (i.e., free-foraging bees). The Tier II study designs may be amenable to additional treatment levels and replication, thus facilitating the quantification of an application rate-response (tunnel study) or dose-response (feeding study) relationship at the colony level and determination of a NOAEC. This information may be particularly useful and transferable from the test crop/concentration to other crops where residue concentrations in pollen and nectar are available in conjunction with associated application rates.
3.2.5.1 TunnelDesignStudies Semi-field tunnel studies provide a means of recording a number of measurement endpoints, e.g., adult and larval survival, larval/pupal development, queen fecundity, worker bee behavior, to estimate various attributes regarding the whole colony. The design of a Tier II tunnel study should be flexible in addressing the specific risks identified at the Tier I risk assessment for either foliar application, seed or soil treatments, or other exposure routes of concerns with reasonable modification. Although a general study guidance for conducting a semi-field study is still under development, the OECD 75 guidance document on honey bee brood testing19, and the European and Mediterranean Plant Protection Organization (EPPO) 170 describe basic semi-field study elements that should be considered. In a tunnel study there is typically a pesticide exposure period in the tunnel and an extended observation period when test bees are allowed to freely forage from the landscape. While typically colonies can only be maintained in enclosures for a limited exposure time (~10 days), these colonies may be monitored following their removal from the enclosure to evaluate extended effects resulting from the exposure period or delayed exposure from ingestion of stored pollen/nectar. Each of these phases of the study presents a number of concerns. Some of the most important considerations include the following topics: Bees in the tunnel: Food resource: It is important to ensure to the extent possible that bees have sufficient forage and that the source of pollen and nectar is not depleted during the study. In tunnel studies, small hives, referred to as “Nucs”, are used so as not to overwhelm the foraging capacity contained within the enclosure. Because of the limited bloom period for most plants used in enclosure studies and because of the stress on bees confined to a limited foraging area, the exposure duration of these studies is usually about 10 days, including acclimation period.
18 Nuclei colonies have been characterized as consisting of approximately 3000 brood cells respectively 750 cm’ with brood in all stages, 1 good comb with honey and pollen and approximately 6000 worker bees; the ratio of brood to food (pollen/nectar) should not exceed 4:1 (OECD 2007). 19 OECD. 2007. Guidance document on the honey bee (Apis mellifera L.) brood test under semi-field conditions. Series on Testing and Assessment No. 75. ENV/JM/MONO(2007)22.

25
Bees in the tunnel: Stress: Bees are intended to fly freely, and confinement to a tunnel may cause stress for the bees. Reducing confinement stress caused by the tunnels is another reason the duration of tunnel studies are generally limited to 10 days. Behavior of test bees: Honey bee foragers are intended to fly freely in a large area. Limited tent space may have an impact on the behavior of those bees. Therefore, caution should be taken in the interpretation the results that are related to the behavior of the test bees. Acclimation period: Long acclimation periods (i.e., >3 days) within the tunnel should be avoided as they can further limit the exposure period; however, if acclimation periods are not sufficient, bees may not begin foraging efficiently until after residues on treated plants have started to decline. Therefore, initial mortality counts for bees that have not been adequately acclimated to the enclosure may not be reliable estimates of treatment-related effects. On the other hand, for seed treatment and/or soil application of a systemic pesticide, residues in pollen and/or nectar are expected at some point in time post application. In these cases, information on application timing and maximum resulting residues are necessary to ensure appropriate exposures (e.g., peak concentrations) are included during the in-tunnel phase of the study. Such exposure considerations may negate the ability to include a pesticide-free acclimation period in the tunnels. Climate and Success: Since these studies are conducted outside, initiation of the study may have to be delayed due to inclement weather where it may not be feasible to move ahead with applications of the test material. Free Foraging Site Location: Depending on the objective of study where an extended observation period may be required, the study report must also describe potential forage sites for the colonies and once the hives are removed from the tunnel enclosures and allowed to free forage, the sites should ideally be removed from agricultural areas where exposure to pesticides may take place and confound the study. Semi-field studies also provide an opportunity to collect exposure data. Measurement of residues in pollen and nectar as well as on/in foliage is recommended to provide data to confirm the level of potential exposure to test hives as well as to refine RQs as part of the Tier I risk characterization. Therefore, consideration should be given to recommending residue data in pollen and nectar of treated plants in semi-field studies provided that such measurements do not interfere with the exposure to bees. Depending on the crop treated, samples of pollen and/or nectar may not be readily collected from treated plants and it may be necessary to consider alternative means of collecting these samples. One option may be to use the confined bees themselves to collect samples of pollen/nectar; otherwise, it may be necessary to use intact flowers as an indirect means of determining residues in pollen/nectar combined. Although the endpoint of a semi-field study can be represented in terms of an application rate, measuring pesticide residues in pollen and nectar allows for a more direct understanding of the concentrations to which the test bees are exposed and allows for transferability of the effect results of the study to other crops, for which empirical residue data may be available for pollen and nectar. Additionally, pollen and nectar (stored in hives as bee bread and honey or uncapped honey) may be sampled within the hive to further characterize the exposure to colony. For systemic compounds, application timing represents an uncertainty as movement of the compound to pollen and nectar varies with the plant species and cultivation techniques. As alluded to previously, semi-field studies conducted in tunnels/enclosures have limitations as the colonies can typically be maintained in the enclosures for only limited amounts of time before food reserves are exhausted and bees are stressed by the confined conditions. In addition, the foraging is not entirely natural because the tunnels may alter the foraging behavior of the bees. These stresses may impact the function of

26
the colonies over time and result in adverse impacts, such as reduced brood production or decreased food storage, from the enclosure itself. As with all higher tier studies, the statistical power of tunnel studies is often low due to high variability as well as low replication; however, as with any study, if sufficient resources are available, the number of replicates may be increased to increase the statistical power. Tier II tunnel studies provide relevant toxicity information, given the constraints noted above, from a limited exposure duration to characterize risk associated with specific use patterns based on the selected tunnel design. Not all crops bloom for extended periods, and some exposure periods will be short in duration as in the case of a foliar application with a relatively short foliar dissipation half-life. So the tunnel study is most appropriate for assessing scenarios in which a short exposure period (e.g., short bloom period or rapid degradation/dissipation) is anticipated. Multiple application rates may be tested for a specific crop to provide a NOAEC. This application rate may then be compared to proposed application rates to characterize the potential risk from exposure to a specific application use pattern or determine the utility of various mitigation options. In addition, the measurement of residues in pollen and nectar associated with the various application rates tested in the tunnel study may provide information relevant to other crops when data are available from targeted pollen and nectar residue studies. It is important to note, however, differences between the crop tested in the tunnel and the actual uses (e.g., the proposed crop uses on the label) to which the tunnel study results are intended to represent; these differences may include bee attractiveness, pollen and/or nectar production, bloom duration, etc., in order to identify if a comparison is appropriate. While tunnel studies have limited value in addressing uncertainties related to long-term chronic exposure and long-term chronic effects, they can provide valuable information on shorter exposure durations including effects from all exposure routes (e.g., contact and oral for foliar applications), and on actual residue exposure levels specific to application methods, rates and test crops under consideration.
3.2.5.2 FeedingDesignStudies The methodology described by Oomen et al. 199220, and the extended feeding field study design proposed in the SAP White Paper, may also be considered a useful study for assessing the potential effects of pesticides on bees at the colony level. Rather than restricting bees to tunnel enclosures with a treated crop, colonies are unrestricted and fed food sources spiked with known concentration of pesticides. The amount of pesticide can be monitored to provide an estimate of an overall amount of pesticide dose consumed in hives. The extended feeding study design offers some advantages over the tunnel design in that the duration of exposure can be extended (e.g., weeks or months compared to 10 days in tunnels) due to the lack of confinement stress caused by the tunnels. The exposure may also be timed with a dearth period in the available food resource to maximize the potential for exposure to treated diet. This design may be especially applicable to pesticides whose use pattern and fate properties suggest that prolonged exposure of bees may be likely. Some limitations of the feeding design include the fact that bees are free to forage on sources other than the spiked diet, which may introduce uncertainty in the exposure assessment. Currently available data from these studies suggests that the colony will completely consume the provided sucrose solutions, but freely foraged nectar and pollen also enter the hives. In the feeding study test bees are exposed through routes
20 Oomen, P. A. A. DeRuijter and J. Van der Steen. 1992. Method for honey bee brood feeding tests with insect growth-regulating insecticides. Bul OEPP/EPPO Bulletin 22: 613 – 616.

27
defined specifically by which spiked food sources are provided, while bees in the field are likely exposed concurrently via multiple exposure routes, including both pollen and nectar depending on crop species. It is noted that feeding studies may also include spiked pollen in addition to spiked sucrose. Test bees are also typically exposed to a range of chosen test concentrations. Such concentrations may not represent exposure resulting from proposed application methods/use patterns. Differences in the field exposure routes and residue levels from the tested exposure routes and test concentrations may contribute to the uncertainties associated with effects observed in the study. In addition, excessive sucrose and or pollen supply may have impact on the foraging behavior of foraging bees and cause uncertainty in effects on colony development. Similar to the tunnel studies, colonies in the field feeding studies also have high variability between colonies that decreases the statistical power of the tests; however, if sufficient resources are available, the number of replicates may be increased. Given the above limitations, the feeding study designs may provide useful information for the characterization of risk associated with various crop use patterns. The study design can incorporate multiple treatment levels of residues in spiked food to obtain a dose response and a NOAEC at the colony level for the specific route of dietary exposure (e.g., pollen, nectar, or both) employed in the study. The dose response from the extended feeding study may then be compared to residue levels measured in specially designed pollen and nectar residue studies that are tied to specific application rates. When evaluating these comparisons specifically for nectar, the risk assessor should consider the sugar content of the feeding solution relative to the sugar content of the nectar in a given crop as the amount of pesticide per amount of sugar may differ. In the absence of crop specific information, the Tier I exposure assumption of an average value of 30% for nectar may be assumed in order to provide a more refined comparison based on residue levels normalized by sugar content. These comparisons of the dose response with measured residue levels may provide colony-level information for the risk characterization of bee exposure to a given pesticide in a specific crop. The extended feeding study design also offers some advantages over the tunnel design in that the duration of exposure can be extended (e.g., weeks or months compared to 10 days in tunnels) due to the lack of confinement stress caused by the tunnels.
3.2.6 TierIIIEffectsCharacterization As indicated in the White Paper, full-field studies represent the highest level of refinement for pollinator studies since they are intended to reflect the potential effects of a pesticide on bee colonies under actual chemical use conditions. Tier III studies may be considered when pollinator risks cannot be excluded at lower tiers of the risk assessment. These studies are intended to address specific uncertainties, i.e., risk hypotheses, which have been identified through lower tier studies and/or through the open literature under reasonable worst case exposure scenarios in the field. While guidance is available for field pollinator testing (e.g., OCSPP Guideline 850.304021, EPPO 170), this information is relatively generic and is intended to provide information on study design elements that should be considered in conducting field pollinator studies. Additional general guidance is provided in the Field testing for Terrestrial Wildlife guidance document (OCSPP Guideline 850.2500)22. Because full-field studies are intended to address specific uncertainties, the study protocols should be reviewed and approved by the risk assessors prior to the conduct of the study. Similar to the semi-field study protocols intended to address specific uncertainties, approved study protocols should be made available to other risk assessors who may be confronted with similar uncertainties in the future. 21 Ibid USEPA.1996c. 22 USEPA 2012. Ecological Effects Test Guidelines OCSPP 850.2500: Field Testing for Terrestrial Wildlife. Office of Chemical Safety and Pollution Prevention (7101). EPA 712-C-021. January 2012. http://www.regulations.gov/#!documentDetail;D=EPA-HQ-OPPT-2009-0154-0014
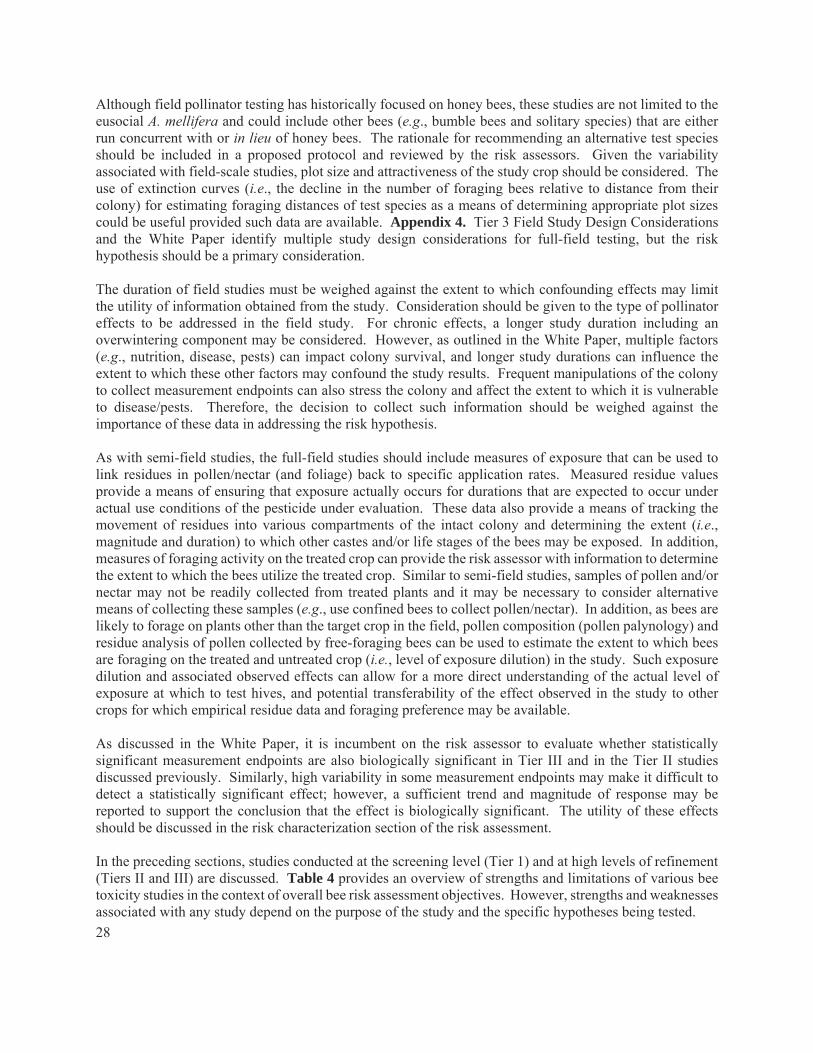
28
Although field pollinator testing has historically focused on honey bees, these studies are not limited to the eusocial A. mellifera and could include other bees (e.g., bumble bees and solitary species) that are either run concurrent with or in lieu of honey bees. The rationale for recommending an alternative test species should be included in a proposed protocol and reviewed by the risk assessors. Given the variability associated with field-scale studies, plot size and attractiveness of the study crop should be considered. The use of extinction curves (i.e., the decline in the number of foraging bees relative to distance from their colony) for estimating foraging distances of test species as a means of determining appropriate plot sizes could be useful provided such data are available. Appendix 4. Tier 3 Field Study Design Considerations and the White Paper identify multiple study design considerations for full-field testing, but the risk hypothesis should be a primary consideration. The duration of field studies must be weighed against the extent to which confounding effects may limit the utility of information obtained from the study. Consideration should be given to the type of pollinator effects to be addressed in the field study. For chronic effects, a longer study duration including an overwintering component may be considered. However, as outlined in the White Paper, multiple factors (e.g., nutrition, disease, pests) can impact colony survival, and longer study durations can influence the extent to which these other factors may confound the study results. Frequent manipulations of the colony to collect measurement endpoints can also stress the colony and affect the extent to which it is vulnerable to disease/pests. Therefore, the decision to collect such information should be weighed against the importance of these data in addressing the risk hypothesis. As with semi-field studies, the full-field studies should include measures of exposure that can be used to link residues in pollen/nectar (and foliage) back to specific application rates. Measured residue values provide a means of ensuring that exposure actually occurs for durations that are expected to occur under actual use conditions of the pesticide under evaluation. These data also provide a means of tracking the movement of residues into various compartments of the intact colony and determining the extent (i.e., magnitude and duration) to which other castes and/or life stages of the bees may be exposed. In addition, measures of foraging activity on the treated crop can provide the risk assessor with information to determine the extent to which the bees utilize the treated crop. Similar to semi-field studies, samples of pollen and/or nectar may not be readily collected from treated plants and it may be necessary to consider alternative means of collecting these samples (e.g., use confined bees to collect pollen/nectar). In addition, as bees are likely to forage on plants other than the target crop in the field, pollen composition (pollen palynology) and residue analysis of pollen collected by free-foraging bees can be used to estimate the extent to which bees are foraging on the treated and untreated crop (i.e., level of exposure dilution) in the study. Such exposure dilution and associated observed effects can allow for a more direct understanding of the actual level of exposure at which to test hives, and potential transferability of the effect observed in the study to other crops for which empirical residue data and foraging preference may be available. As discussed in the White Paper, it is incumbent on the risk assessor to evaluate whether statistically significant measurement endpoints are also biologically significant in Tier III and in the Tier II studies discussed previously. Similarly, high variability in some measurement endpoints may make it difficult to detect a statistically significant effect; however, a sufficient trend and magnitude of response may be reported to support the conclusion that the effect is biologically significant. The utility of these effects should be discussed in the risk characterization section of the risk assessment. In the preceding sections, studies conducted at the screening level (Tier 1) and at high levels of refinement (Tiers II and III) are discussed. Table 4 provides an overview of strengths and limitations of various bee toxicity studies in the context of overall bee risk assessment objectives. However, strengths and weaknesses associated with any study depend on the purpose of the study and the specific hypotheses being tested.

29
Table 4. Expected endpoint and consideration of the strengths and limitations of various bee toxicity studies.
Study Name Primary
Endpoints Strengths Limitations
Tier I
Adult, Acute Contact Mortality, Contact LD50
Quantifiable test doses Dose-response curve is
generated Some sublethal effects
can be measured
Only 1 exposure route considered
NOAECs are typically not generated
Acute exposure only Measurement of
sublethal effects is often limited in scope
Effects are assessed at the individual level
Adult, Acute Oral Mortality, Oral LD50
Adult, Chronic Oral Mortality, NOAEC
Quantifiable test doses NOAEC and/or dose-
response curve can be generated
Some sublethal effects can be measured
Only 1 exposure route considered
Measurement of sublethal effects is often limited in scope
Effects are assessed at the individual level
Test is currently under development
Larval Acute (single dose)
Mortality, Larval LD50/NOAEC
Quantifiable test concentrations
NOAEC and/or dose-response curve can be generated
Contact and oral exposure routes are included
Larval effects are important for some MOAs (insect growth regulators)
Actual consumed dose may vary
Assessment of effects through pupation is currently difficult
Effects are assessed at the individual level
Test is currently under development (chronic)
Larval Chronic (repeat dose)
Adult Emergence/NOAEC
Foliar Residue Mortality, Residual toxicity and/or RT25
Contact exposure through residues on foliage
Can assess pesticide residual toxicity
Acute exposure only Actual dose is not
quantified Effects are assessed at
the individual level Tier 2
Semi-field, Tunnel
Colony strength Brood pattern and development Foraging activity
Multiple exposure routes (contact, oral) related to pesticide use methods
Short-term exposure only (usually 7-10 days in tunnel)
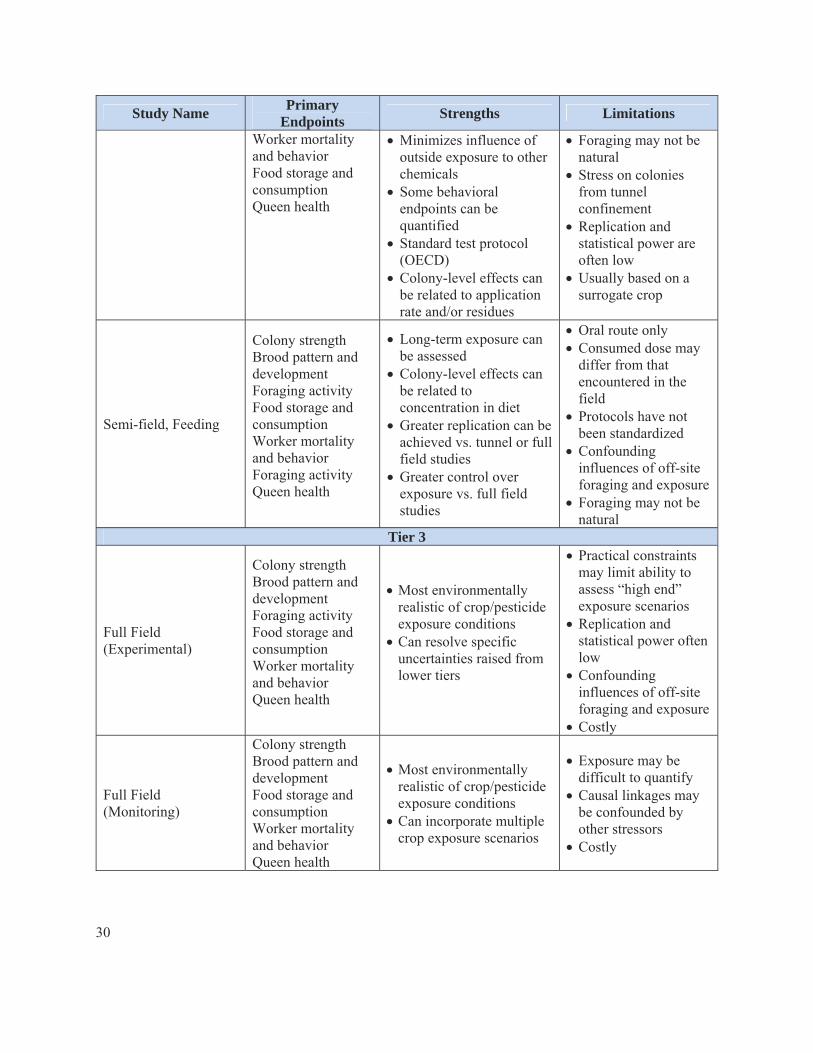
30
Study Name Primary
Endpoints Strengths Limitations
Worker mortality and behavior Food storage and consumption Queen health
Minimizes influence of outside exposure to other chemicals
Some behavioral endpoints can be quantified
Standard test protocol (OECD)
Colony-level effects can be related to application rate and/or residues
Foraging may not be natural
Stress on colonies from tunnel confinement
Replication and statistical power are often low
Usually based on a surrogate crop
Semi-field, Feeding
Colony strength Brood pattern and development Foraging activity Food storage and consumption Worker mortality and behavior Foraging activity Queen health
Long-term exposure can be assessed
Colony-level effects can be related to concentration in diet
Greater replication can be achieved vs. tunnel or full field studies
Greater control over exposure vs. full field studies
Oral route only Consumed dose may
differ from that encountered in the field
Protocols have not been standardized
Confounding influences of off-site foraging and exposure
Foraging may not be natural
Tier 3
Full Field (Experimental)
Colony strength Brood pattern and development Foraging activity Food storage and consumption Worker mortality and behavior Queen health
Most environmentally realistic of crop/pesticide exposure conditions
Can resolve specific uncertainties raised from lower tiers
Practical constraints may limit ability to assess “high end” exposure scenarios
Replication and statistical power often low
Confounding influences of off-site foraging and exposure
Costly
Full Field (Monitoring)
Colony strength Brood pattern and development Food storage and consumption Worker mortality and behavior Queen health
Most environmentally realistic of crop/pesticide exposure conditions
Can incorporate multiple crop exposure scenarios
Exposure may be difficult to quantify
Causal linkages may be confounded by other stressors
Costly

31
4 RiskCharacterization Risk characterization is the final phase of the risk assessment process and consists of two parts, i.e., risk estimation and risk description. Risk estimation involves integration of exposure and effects information to estimate the likelihood of adverse effects on the ecological receptors as a result of exposure. In Tier I, risk estimation involves the calculation of RQs. Risk description includes an interpretation of the risks in the context of uncertainty and sensitivity of risk estimates to underlying assumptions and quality of data. In addition, risk description considers how risk can be mitigated through restrictive label language and/or best management practices (BMPs). A weight-of-evidence approach should be used in the overall risk characterization. The risk characterization should also discuss data gaps and whether uncertainties could be readily addressed through additional data.
4.1 RiskEstimation
4.1.1 CalculationofRiskQuotientsforTierIRiskAssessment Table 5 lists the exposure and effect estimates used in quantifying risk in Tier I. As discussed in the White Paper, risks are quantified for individual bees in Tier I; however, RQ values are not derived for colony-level effects. As is the case with other taxa, the RQ value is calculated by dividing the exposure estimate by the effect endpoint. It is important that the measurement endpoint units are reported or can be converted to units that are consistent with exposure estimates such that a risk quotient can be reasonably derived for Tier 1 screening RQ values.
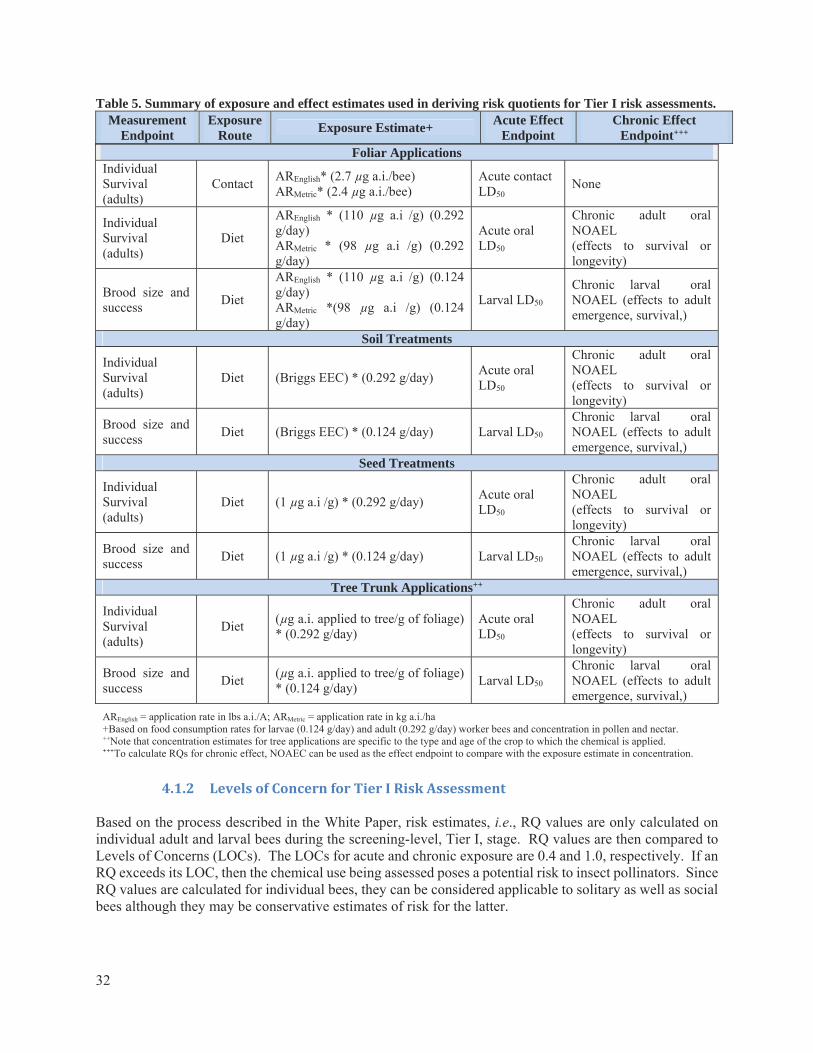
32
Table 5. Summary of exposure and effect estimates used in deriving risk quotients for Tier I risk assessments. Measurement
Endpoint Exposure
Route Exposure Estimate+
Acute Effect Endpoint
Chronic Effect Endpoint+++
Foliar Applications Individual Survival (adults)
Contact AREnglish* (2.7 µg a.i./bee) ARMetric* (2.4 µg a.i./bee)
Acute contact LD50
None
Individual Survival (adults)
Diet
AREnglish * (110 µg a.i /g) (0.292 g/day) ARMetric * (98 µg a.i /g) (0.292 g/day)
Acute oral LD50
Chronic adult oral NOAEL (effects to survival or longevity)
Brood size and success
Diet
AREnglish * (110 µg a.i /g) (0.124 g/day) ARMetric *(98 µg a.i /g) (0.124 g/day)
Larval LD50 Chronic larval oral NOAEL (effects to adult emergence, survival,)
Soil Treatments
Individual Survival (adults)
Diet (Briggs EEC) * (0.292 g/day) Acute oral LD50
Chronic adult oral NOAEL (effects to survival or longevity)
Brood size and success
Diet (Briggs EEC) * (0.124 g/day) Larval LD50 Chronic larval oral NOAEL (effects to adult emergence, survival,)
Seed Treatments
Individual Survival (adults)
Diet (1 µg a.i /g) * (0.292 g/day) Acute oral LD50
Chronic adult oral NOAEL (effects to survival or longevity)
Brood size and success
Diet (1 µg a.i /g) * (0.124 g/day) Larval LD50 Chronic larval oral NOAEL (effects to adult emergence, survival,)
Tree Trunk Applications++
Individual Survival (adults)
Diet (µg a.i. applied to tree/g of foliage) * (0.292 g/day)
Acute oral LD50
Chronic adult oral NOAEL (effects to survival or longevity)
Brood size and success
Diet (µg a.i. applied to tree/g of foliage) * (0.124 g/day)
Larval LD50 Chronic larval oral NOAEL (effects to adult emergence, survival,)
AREnglish = application rate in lbs a.i./A; ARMetric = application rate in kg a.i./ha +Based on food consumption rates for larvae (0.124 g/day) and adult (0.292 g/day) worker bees and concentration in pollen and nectar. ++Note that concentration estimates for tree applications are specific to the type and age of the crop to which the chemical is applied. +++To calculate RQs for chronic effect, NOAEC can be used as the effect endpoint to compare with the exposure estimate in concentration.
4.1.2 LevelsofConcernforTierIRiskAssessment Based on the process described in the White Paper, risk estimates, i.e., RQ values are only calculated on individual adult and larval bees during the screening-level, Tier I, stage. RQ values are then compared to Levels of Concerns (LOCs). The LOCs for acute and chronic exposure are 0.4 and 1.0, respectively. If an RQ exceeds its LOC, then the chemical use being assessed poses a potential risk to insect pollinators. Since RQ values are calculated for individual bees, they can be considered applicable to solitary as well as social bees although they may be conservative estimates of risk for the latter.

33
The LOC of 0.4 identified in the White Paper for assessing potential risks to individual bees was considered by the FIFRA SAP to be highly conservative. The value is based on the median probit dose-response slope across acute contact and oral toxicity studies. While the SAP correctly noted that the 10% level of mortality resulting from RQ values equal to an LOC of 0.4 has not been demonstrated as detrimental to intact colonies, this LOC was based on an effect level that would be consistent with background (i.e., control mortality) in laboratory-based studies. This LOC is intended to be conservative and serve as a reasonable screen for determining whether higher-tier testing is needed. As discussed in the White Paper and as depicted in Figure 1 and Figure 2, the RQ values estimated using screening-level exposure models can be refined using measured residue levels prior to determining whether additional colony-level (Tier II) data are needed. The LOC of 0.4 only applies to interpreting RQ values from laboratory-based acute toxicity studies of individual bees and does not apply to the higher-tier semi-field and full-field studies on whole colonies. The LOC of 0.4 also applies to interpreting RQ values for acute larvae toxicity since limited available data of dose-response slopes for larvae prevent determining an LOC using the same approach as for adults. Although laboratory-based chronic toxicity studies with adult and larval bees are still under development, protocols have been drafted for conducting such studies and these data may be available for review. As discussed in the White Paper, chronic RQ values are to be compared to an LOC of 1.0, i.e., risk is evaluated based on whether EECs exceed the NOAEC from chronic toxicity studies with individual bees. For those chemicals where RQ values exceed LOCs even after exposure estimates have been refined using measured residue values in pollen and nectar, more refined testing on honey bee colonies may be needed using Tier II semi-field studies and, depending on the nature of remaining uncertainties, Tier III full-field studies. Higher-tier studies with whole colonies are used to provide a more realistic characterization of potential adverse effects to colonies since the study design is intended to reflect actual exposure conditions. The risk assessor should use semi- and full-field studies to determine whether effects reported in laboratory-based studies on individual bees are apparent at the level of the whole colony and nature, magnitude and duration of these effects considering potential routes of exposure, and the biological relevancy of effects must be gauged, as well as sublethal effects that may not manifest in Tier I studies. To the extent possible, available estimates of exposure to colony bees through measured residues in pollen and nectar coming into the colony through the labeled use of the pesticide should be characterized relative to the reported effects.
4.2 RiskDescription
4.2.1 UseofOtherLinesofEvidence The risk description phase of the Risk Characterization provides an opportunity to discuss additional lines of evidence and uncertainties regarding potential risks to bees beyond the RQ values calculated in the risk estimation. All studies and relevant information are used to evaluate the likelihood and/or extent of risks to bees under various pesticide use scenarios. Risk assessments must provide a transparent description of assumptions and uncertainties surrounding the assessment and the lines of evidence considered. To the extent possible, the risk assessment should reference more detailed discussions regarding uncertainties surrounding these lines of evidence than contained in other documents such as the Overview Document, the White Paper and this guidance. It is not necessary to include all of the uncertainties noted in this document in a risk assessment; however, if the risk assessor thinks that an uncertainty is of particular concern for the chemical being assessed, a discussion of such uncertainty should be included in the risk assessment. In characterizing uncertainty, the risk assessor should consider the full weight-of-evidence. Application of a weight-of-evidence analysis is an integrative and interpretive process routinely used to evaluate ecological toxicity
34
data23 in a manner that takes into account all relevant scientific information. The analysis should consider whether the existing data provide relevant, robust and consistent evidence (e.g., agreement within and among the outcomes of laboratory and semi-/full-field studies) that a chemical has the potential to adversely affect bees and at what level of biological organization (i.e., individual bees or at the colony level) and under what conditions (e.g., at what application rate, exposure duration). As part of this analysis, the risk assessor should consider the biological plausibility of the effect, the coherence, strength and consistency of the body of information as evaluated across all of the relevant information that are available. Incident data from the EPA Ecological Incident Information System (EIIS), PMRA Pesticide Incident Reporting Program (IRP) and other aggregate databases (e.g., the EPA Incident Data System) should be considered in the context of the certainty index applied to these data. Open literature studies that have met the applicable agency standards for inclusion in ecological risk assessments should be discussed in the risk description as well. Such studies may provide useful information in considering the overall weight of evidence for the risk characterization. Careful consideration should be given to the relevance of endpoints derived from open literature studies in relation to the assessment endpoints of concern. Additionally, the risk description section is a good place to incorporate potential mitigation options and describe how specific mitigations could impact risk conclusions. Through the engagement of risk managers, risk assessors can incorporate multiple lines of evidence and alternative exposure scenarios into the risk description.
4.2.2 SynthesisofRisksamongTiers The risk description should provide a synthesis of the various levels of refinement for both exposure and effects that were considered and discuss the extent to which semi-field and, when available, full-field studies of whole colonies provide information consistent with laboratory-based studies with individual bees. For example, if acute mortality was observed for larval bees under laboratory conditions, did semi-field studies identify effects in the developing brood of colonies? For social bees while the risk to individual bees quantified in Tier I are important, a critical question is whether adverse effects occur at the level of the whole colony. The Tier I toxicity testing with honey bees typically involves summer bees as opposed to winter bees. This is primarily due to the logistical constraints of collecting suitable numbers of winter bees without irreparably damaging the colony from which they were derived. Worker bees can be potentially replaced by the queen in summer whereas they cannot in winter. The assessment should note this distinction and that reduced survival in winter bees, which cannot be replaced and which must survive for a longer duration in order to ensure that the colony successfully overwinters, can be more detrimental to the colony survival. Therefore, the timing when potential exposure to bees may occur in the field should be considered during the course of risk assessment. Compared to worker bees in hives that are many and typically replaced, there is only one queen in each hive. The loss of the single queen can result in the loss of the entire colony although colonies may attempt to supersede a queen that is failing. Effect on queens may be tested in Tier I level by modifying the laboratory toxicity study protocol that is currently designed for worker bee individuals. As part of the evaluation of whole colonies, consideration should be given to whether there are any data with which to determine whether the queen is functioning properly. If no direct measurements of toxicity to the queen
23USEPA. 1998. Guidelines for Ecological Risk Assessment. Published on May 14, 1998, Federal Register 63(93): 26846 – 26924. http://www.epa.gov/raf/publications/pdfs/ECOTXTBX.PDF
35
bee are available, the condition of the brood may serve as an indirect measure of queen performance. Brood pattern (i.e., spotty versus uniform), presence of eggs, and relatively uniform development of the larvae and pupae can be useful indicators. Another useful indicator of queen performance can be whether there are any supersedure (presence of queen cells intended to replace an old or failing queen) in the brood comb and queen replacement; colonies in which the queen is failing may attempt to replace (supersede) the queen. Additionally, an over-abundance of drone cells may be indicative of an unfertilized queen that will lead to colony loss. Studies of the whole colony should avoid over manipulation of the colony, general observations of colony activity and health should be included as part of the assessment. Colonies confined to enclosures in a Tier II study will likely exhibit increased stress from a variety of factors linked to the limited space within the enclosure. These factors should be described even if they are not considered treatment-related as they can affect the power of the study to detect treatment effects. Additional descriptions of pre- and post-application levels of pest and diseases should be assessed as an indicator of bee health.
4.2.3 RiskdescriptiononSublethalEffects In addition to the measurement endpoints that have direct linkages to assessment endpoints and that were used quantitatively in the risk estimation section of the risk characterization, the risk description should also include, if available, sublethal endpoints (e.g., behavioral effects, proboscis extension reflex) that are associated with the chemical under evaluation. However, these sublethal endpoints often lack information on subsequent effects on survival, growth or reproduction. Although the FIFRA SAP recommended an increased use of sublethal endpoints, until suitable linkages have been developed between sublethal measurement endpoints to assessment endpoints, their use in risk assessment should remain qualitative; this is consistent with the process used for other taxa as described in the Overview Document as well as in the open literature guidance. Observation of sublethal effects is required for Tier I laboratory toxicity studies. However, these studies are tested using individual bees. The ability of these studies to test social interactions between bees (such as tropholaxis (i.e., the transfer of food between bees) and flight and/or foraging behavior is limited. However, such sublethal effects information should be considered as part of the weight of evidence in deciding whether to proceed with higher tier testing and in the overall risk characterization. It is important that sublethal effects are described even when their association with apical endpoints (e.g., colony survival) may not be apparent since the absence of such an effect may be the result of limitations in study design (e.g., insufficient study duration). For example, radiofrequency identification (RFID technology) has been employed to mark and track bee movement and can help to quantify foraging activity; however, situations where marked declines in foraging activity may not have been reflected in adult and/or larval survival estimates could indicate that there were compensatory mechanisms (e.g., sufficient food stores in the comb) that obscured the effect. The extent to which forage bee and/or hive bee behavior is affected by pesticide treatments should be discussed in the context of whether other measurement endpoints were affected. While impaired behavior can affect proper functioning of the hive, it is frequently difficult to detect such effects during short-term studies. Similarly, longer-term studies can be impacted by a number of factors (e.g., weather, pests, disease, and available forage) that can increase variability in measurement endpoints and make it difficult to detect statistically significant effects at the colony level. To the extent possible, where behavioral effects are reported either in studies submitted in response to testing requirements or in acceptable open literature studies, an effort should be made to determine whether these effects are evident in other endpoints that would most likely be impacted. For example, impaired foraging success may affect the quantity of food

36
reserves in the comb and may be accompanied by decreased brood production by the queen due to a reduction in available food. When reviewing single studies, all available information should be considered in evaluating the dynamics of colony development and potential interactions among many of the measured endpoints.
4.2.4 UseofSimulationModels Different applications of colony simulation models for pesticides are currently under evaluation. Some of these potential applications include: estimating exposures and characterizing risks of bees exposed to pesticides when little data are available, and completing a sensitivity analysis of lethal and sublethal measurement endpoints to determine which endpoints are critical to the survival of a colony (this could be used to inform toxicity test study designs or regulatory LOCs for risk assessments). The White Paper discussed simulation models and, while the SAP agreed that such models may prove useful, none of the models available were deemed suitable at this time. However, the SAP recommended that components of existing models (e.g., analytical subroutines) may be appropriate for use at this time. EPA and PMRA are working with researchers in government, academia and industry both domestically and internationally to evaluate and adapt models for their use in risk assessments intended for regulatory purposes.
4.2.5 Uncertainties The primary sources of uncertainties for the risk assessment are related to estimating pesticide exposures to bees and effect of those exposures to bees. With respect to dietary exposure, the first source of uncertainty may be related to the extent to which the amount of food consumed by bees for the Tier I exposure estimate represents pesticide concentration in bee food sources. With respect to contact exposure, there is uncertainty as to the extent that residues on leaves and even soil may be available to bees for uptake. There is also uncertainty as to the extent to which bees may be exposed to pesticide residues through various sources of water, including puddle and plant exudates, and whether that water is ingested, used to dilute honey, or used to cool the colony. The second source of uncertainty is related to differences in bee biology and their foraging behaviors that may directly impact exposure routes and the extent to which bees forage on the treated crop. All these sources of uncertainty may be reflected in the study designs at different tiers.
4.2.5.1 Uncertainties:TierIexposureestimate In the Tier I assessment, dietary exposure is estimated based on upper-bound food consumption rates for honey bees. These rates are estimated based on laboratory studies conducted under controlled conditions. Uncertainties may exist in relation to bee physiology changes that occur naturally, for example difference between summer bees and winter bees. However, the upper-bound food consumption rates using in the screening-level assessment are expected to be conservative. The Brigg’s model is currently used to estimate Tier I EECs resulting from a soil application. There are five notable limitations to using the modified Briggs’ model approach. The first is that this methodology is based on empirical data from only one species of plant. The second limitation is that the data set used to derive elements of the model is based on a limited number of chemicals that represent only two classes of pesticides (i.e., O-methylcarbamoyloximes and substituted phenylureas). The third limitation is that this approach is based on data from non-ionic organic chemicals and may have limited utility for ionic chemicals that whose transport may not be predicted well using Kow and Koc. The fourth limitation of the Briggs’ model is that it is based on passive transport of chemicals into xylem, therefore, this approach does not directly estimate pesticide concentrations in plants that are the result of phloem transport. The fifth limitation involves the use of estimated pesticide concentrations in vegetative plant matrix (i.e., shoots) as a surrogate for nectar and pollen. As additional data become available, the utility of the Brigg’s model for
37
providing screening-level estimates of exposure from soil applications will be assessed and the model will either be revised or more appropriate means of estimating exposure will be adopted.
4.2.5.2 Uncertainties:Useofresiduedata Use of chemical-specific pollen and nectar residue data reduces the uncertainties associated with the methods discussed above; however, these data should be used with caution. Care should be taken to ensure that the available empirical data are representative of the registered/proposed uses of the chemical of interest and do not under-represent exposures to bees. Samples collected from free-foraging bees that may forage on non-targeted crops could underestimate the actual concentration in pollen and nectar from a treated crop as the bees may not have exclusively foraged on the treated crop.
4.2.5.3 Uncertainties:AgronomicPractices One of the most important considerations within the agronomic practices is the use of managed pollinators for crop production. For some crops, growers will bring in managed bees to augment the pollination services of local bees if the crop requires pollination and wild bee populations are insufficient for adequate pollination. These commercially managed bees may include honey bees, bumble bees, blue orchard bees, alfalfa leafcutting bees, etc. When commercially managed bees are used to pollinate a crop, the potential for exposure and the magnitude of that exposure to the pollinating bees may be greatly increased. Depending on the physical-chemical property of a pesticide and use methods, agronomic practices, such as irrigation, may affect the translocation of systemic pesticides and have effects on the residues in bee food sources. The agronomic practices may also be related to the extent to which a particular registered use may be applied across the landscape of the use. Different use patterns may occupy varying spatial extents of coverage.
4.2.5.4 Uncertainties:PollinationBiology Uncertainties on the exposure of pesticides to pollinators in the field are also associated with plant/crop pollination biology. Risk assessment usually encompasses a wide variety of crops or plants that have unique pollination characteristics. These plants may include ornamental annuals or perennials, trees or bushes covered under forestry uses, or annual or perennial crops. The pollination biology of each of these plants is important to consider when developing a description of the potential risk to bees. In the problem formulation stage of the assessment, information on the attractiveness of plants to pollinators covered by the proposed uses should be considered to determine whether exposure may occur and the scope of a risk assessment. At the risk description phase of the assessment, information on the pollinator attractiveness of the plant as well as acreages and application methods will help the risk assessor to determine the spatial and temporal aspect of risk to the bee pollinators identified in the problem formulation as well as potential mitigation solutions. The pollination biology of plants relates to the intrinsic characteristics of the plant itself. These characteristics include the following considerations: Bee visitation to the flowers of the ornamental, forestry tree, or crop: Not all plants produce flowers that are attractive sources of forage for honey bees, bumble bees, or solitary bees. Conversely, flowers of
38
some plant species last only short period. The short blooming duration reduces the potential exposure of flower visitors. Harvest period of the crop: While a crop or plant may produce flowers that are attractive to bees, some of these crops are harvested prior to bloom. Bloom period of the crop: Different plant species will bloom at different times of the year. In addition, the length of the bloom period can differ between plants. Some plants bloom within a specific, relatively narrow window of time called a determinate bloom period. Other crops may produce blossoms continuously over the course of the growing season or for an extended period of time, which is called indeterminate bloom. Indeterminate blooming crops provide a much longer window of potential exposure to pollinating bees. Pollen versus nectar as the food source of the bees: Not all flowers produce a nectar reward for bees, while for some species of plants, flowers may not be the only source of nectar.(e.g., cotton). Depending on the species of plant, some flowers do not produce pollen that bees will collect. For example, some varieties of citrus produce only minimal quantities of pollen, while at the same time provide a rich source of nectar for pollinating bees. On the other hand, corn is a grass monocot that produces copious amounts of pollen that bees have been shown to use to varying extents, while it produces virtually no nectar. The type of food source produced by the plant may be an important consideration for the specific crop. Bee diversity: In terms of the types of bees, honey bees and bumble bees are colonial while there are a variety of bees, both managed and wild, that are solitary and, depending on the plant, their foraging strategies may differ substantially; therefore, potential exposure may differ.
4.2.5.5 Uncertainties:DifferencesinBeeLifeHistory As noted in the White Paper and as discussed in the SAP’s response, there is uncertainty regarding the extent to which any risk assessment process that relies on data on a specific species, e.g., A. mellifera, can be considered representative of an entire taxon or multiple taxa. This is especially true for honey bees, which are a highly social (eusocial) species, where the colony/hive is dependent on the collective tasks of multiple castes and function as a “superorganism”; whereas, the majority of other bee species, particularly those species native to North America, are solitary.
4.2.5.6 Uncertainties:DifferencesinPests/Pathogens/Nutrition/Management Multiple factors can influence the strength and survival of bees whether they are solitary or social. These factors, including disease, pests (e.g., mites), nutrition, bee management practices, can confound the interpretation of studies intended to examine the relationship of the test chemical to a receptor (i.e., larval or adult bee). Therefore, most studies attempt to minimize the extent to which these other factors impact the study; however, higher tier studies afford less control over these other factors, and their role may become increasingly prominent as the duration of the study is extended. Although studies attempt to minimize the confounding effects of other environmental factors, there is uncertainty regarding the extent to which the effects of a chemical may be substantially different had these other factors been in place.
4.2.5.7 Uncertainties:UncertaintyinStudyDesigns Data from the toxicity of residues on foliage study are used qualitatively to characterize the length of time that residues remain toxic to bees. The results of the guideline study may result in precautionary label

39
statements similar to those discussed in the EPA Label Review Manual24 or in guidance documents intended to reduce the potential effects of pesticides on bees (e.g., Riedl et al. 2006)25. Studies in which colonies are provided a source of spiked food (i.e., either spiked sugar solution or spiked pollen) are referred to as “feeding studies”. Feeding studies are used as a means of examining the potential effects of pesticides on whole bee colonies that are free foraging; however, there are uncertainties associated with these studies. Since bees are provided a specific diet, e.g., spiked sugar solution as proposed by Oomen et al. 199226, there is uncertainty whether the specific diet may afford limited nutritional diversity to the test bees. Although the quantity of food consumed is recorded, consumption rates within treatments can vary widely, and there is uncertainty as to the extent to which the test material is actually consumed versus stored in the comb. The richness of other food sources in the test area may also influence the actual consumption of spiked test chemicals. Although the colonies are typically positioned away from agricultural areas, the extent to which the free foraging bees may have access to plants that may be contaminated with other pesticides is uncertain. Additionally, these studies may frequently have large numbers of colonies, belonging to different treatment groups, in close proximity where bees may potentially cross between treatments through robbing and/or scavenging activity in impaired colonies; this activity may be enhanced in areas where alternative forage may be sparse. Finally, failing colonies may be robbed of resources by bees from other treatment/controls groups resulting in exposure to different doses of the test material than planned. Tier II tunnel studies contain challenges inherent to the design itself. In these studies, a mesh enclosure is placed over the colonies and contains within its boundaries a specified area of a test crop to serve as a food source. The enclosures can impact the performance of the colonies and ultimately limit the development of the colonies either from the stress of the tunnels placed on the colonies or from inadequate forage for the bees within the tunnels. The availability of food source and impact on the behavior of test bees limit the exposure duration of a tunnel study. Although a Tier II study should be carefully designed, by considering the test hive size, exposure duration and adequacy of feed sources, to minimize the effect of tent enclosure itself, the reviewer should be attentive to the performance of the control colonies within the tunnels to ascertain if stress placed on the colonies has a notable effect on colony performance that may impact the ability to derive meaningful results from the study data. Evaluating Tier II or full-field Tier III studies can be challenging because the study environment is relatively uncontrolled and a number of factors can impact the study. In the case of tunnel studies these factors can include the weather, disease/parasites, extent to which bees feed on the treated crop as opposed to simply storing the food, and the potential for contaminated or inadequate forage once the colonies are placed outside of the tunnel for extended evaluation. In the case of full-field studies, confounding factors can also include the weather, disease/parasites, the extent to which bees feed on the treated crop as opposed to simply storing the food, in addition to the alternative (untreated or treated with other pesticides) forage areas and the distance that worker bees can forage even during the exposure phase of the study. When confounding effects are encountered in these studies, it is incumbent on the reviewer to determine whether any information is contained in the study, given the complexity and expense of these studies. The SAP accurately noted that the longer a study is conducted, the greater the opportunity for other factors to affect study colonies; appropriate study designs and replication can provide a means of accounting for these other factors particularly where studies are conducted over an extended spatial-temporal framework. Direct measures of effects on specific castes (e.g., queens) may be limited due to inadequate numbers of test organisms or logistical constraints to isolating particular elements of the colony for study. Therefore, 24 USEPA. 2012. Label Review Manual. http://www.epa.gov/oppfead1/labeling/lrm/ 25 Riedl, H. E. Johansen, L. Brewer and J. Barbour. 2006. How to Reduce Bee Poisoning from Pesticides. A Pacific Northwest Extension Publication. Oregon State University, University of Idaho, and Washington State University. http://extension.oregonstate.edu/catalog/pdf/pnw/pnw591.pdf 26 Ibid Oomen et al. 1992.

40
potential effects or lack thereof are frequently inferred based on other colony-level measures. For example, queen performance may be indirectly assessed through evaluation of egg laying, supersedures, and the extent of drone cell production. The risk assessment should be transparent in acknowledging the uncertainties associated with making such inferences. Due to the high cost and large variation of field conditions associated with a field study, design of an appropriate field study can be challenging. Additionally due to concerns of using toxic reference compounds in open field studies, these studies do not typically include toxic reference compounds such as those used in laboratory-based and semi-field studies. Field studies also do not typically have high numbers of replicates; therefore, the statistical detection power of a study may be low However, full-field studies are conducted under more realistic exposure conditions (actual application rates) and are expected to reflect the potential impact of a pesticide in the field. Although the risk assessment considers the full weight of evidence across all of the studies evaluated, results from Tier III studies provide the most realistic understanding of effects on colonies from the proscribed use of the pesticide.
4.2.6 DataGaps One of the largest challenges facing risk assessors is the extent of variability and uncertainty associated with estimating the potential likelihood and magnitude of adverse effects to bees. The decision to recommend additional studies should be based on a reasonable risk hypothesis that has considered all of the available lines of evidence for a study. As indicated in this guidance, the screening-level risk assessment can be refined using chemical-specific residue data. Residue studies to support screening-level assessments should focus on a small number of pollinator-attractive crops that may serve as a good source of pollen or nectar for foraging bees and will be used to be representative of the broader list of crop uses. Additional considerations for crop selection could include the acreage of the crop that may be potentially treated in an area, or the percent of the crop treated as well as application methods. In examining other lines of evidence, risk assessors should determine whether exposure data on similarly structured chemicals may be of utility and/or whether data required by other regulatory authorities may be accessible. While a number of uses may be proposed, it may not be practical and/or reasonable to attempt to collect residue data on all crops in order to refine risk estimates. While the data used in residue studies are typically used to refine screening-level RQ values, test data can be useful in putting colony-level data into context particularly when similar data are collected during the conduct of semi- and full-field level studies. Based on the property of chemicals of interest, proposed uses, and available lines of evidence, a tiered approach should be adopted in determining what effect data are necessary in order to conduct an appropriate risk assessment for pollinators. Potential exposure routes and exposure duration, as well as level of exposure should be considered to determine the types of studies required. For example, if multiple exposures are expected, a chronic study may be needed. Higher tier studies are required when risk concerns cannot be addressed at lower tiers. In addition and if possible, higher tier studies should be designed and conducted to address specific risk concerns identified at lower tiers or through other available information (see Section 3.2.1 for details for data requirement). As noted in this guidance, the need for additional data and the order of data recommendations are not dictated by a regimented sequence. Rather, multiple lines of evidence should be considered in conjunction with an understanding of risk management needs. An effort should be made to determine whether data are available for similarly structured chemicals with a common mode of action; these data may be able to address some uncertainties and reduce the need for additional testing. Similarly though, data for other compounds may inform decisions to deviate from the typical sequence of studies to recommend special studies to address particular uncertainties. At each step of the process, potential risk mitigation measures
41
and management options should be considered that may reduce the need for additional studies since the likelihood of exposure has been sufficiently mitigated.

42
Appendix1.ConceptualModels
A1.1Non‐systemic,FoliarSprayApplications For non-systemic pesticides applied via foliar spray, dominant exposure routes of foraging bees include direct deposition of spray droplets onto bees, deposition onto plant surfaces (leaf, flower, pollen, nectar, extra-floral nectaries) followed by contact and/or ingestion, and inhalation of gaseous phase chemical (for highly volatile pesticides; Figure A1.1).
Figure A1.1 Generic Conceptual Model of Non-Systemic, Foliar-Applied Pesticides for Honey Bee Risk Assessment. Dashed lines represent routes of exposure that are not considered to be major.

43
A1.2. Systemic,FoliarSprayApplications Foliar applications of systemic pesticides are likely to result in many of the same routes of exposure to honey bees as described previously for non-systemic, foliar-applied pesticides, with several important exceptions. First, deposition onto plant surfaces and soil will lead to translocation of the pesticide to other plant tissues, potentially contributing to higher quantities of pesticide residues in pollen and nectar. For persistent systemic pesticides, the exposure window could include longer periods of time (red arrows, Figure A1.2) compared to similar applications of non-systemic pesticides. Second, pesticide residues in plant exudates (guttation fluid, honey dew) also become a potentially relevant route of exposure.
Figure A1.2. Generic Conceptual Model of Systemic, Foliar-Applied Pesticides for Honey Bee Risk Assessment. Red depicts systemic pathways. Dashed lines represent routes of exposure that are not considered to be major.
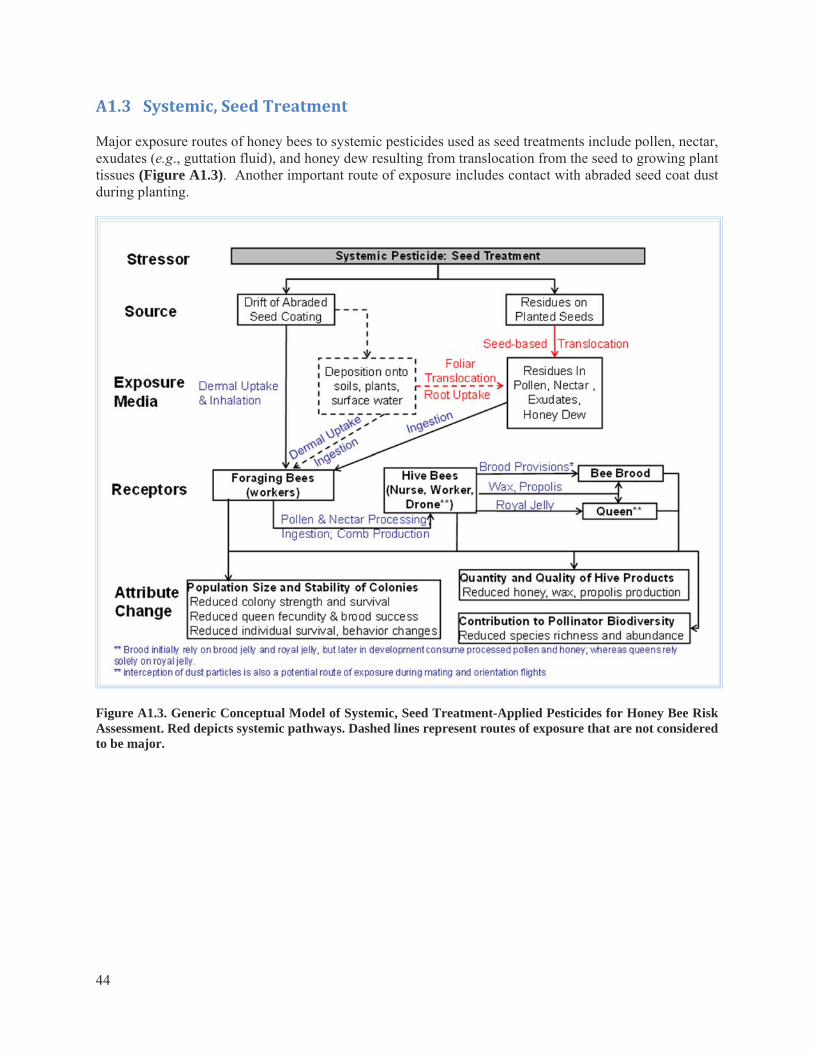
44
A1.3Systemic,SeedTreatment Major exposure routes of honey bees to systemic pesticides used as seed treatments include pollen, nectar, exudates (e.g., guttation fluid), and honey dew resulting from translocation from the seed to growing plant tissues (Figure A1.3). Another important route of exposure includes contact with abraded seed coat dust during planting.
Figure A1.3. Generic Conceptual Model of Systemic, Seed Treatment-Applied Pesticides for Honey Bee Risk Assessment. Red depicts systemic pathways. Dashed lines represent routes of exposure that are not considered to be major.
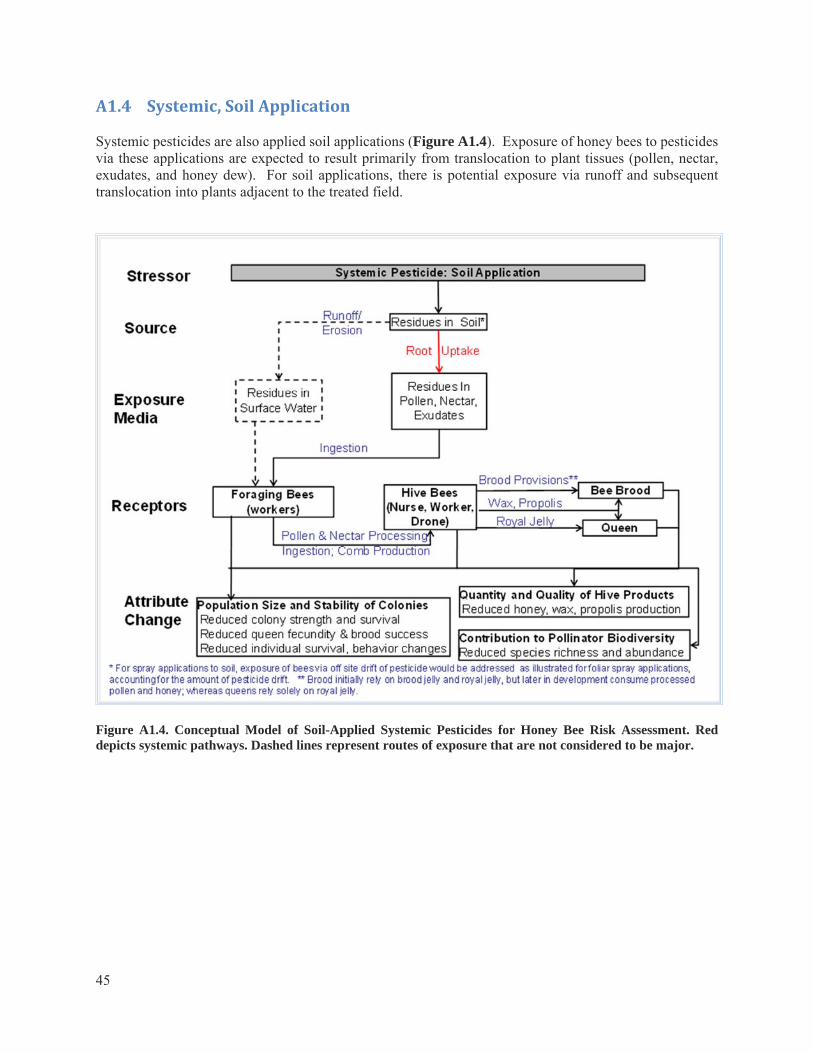
45
A1.4Systemic,SoilApplication Systemic pesticides are also applied soil applications (Figure A1.4). Exposure of honey bees to pesticides via these applications are expected to result primarily from translocation to plant tissues (pollen, nectar, exudates, and honey dew). For soil applications, there is potential exposure via runoff and subsequent translocation into plants adjacent to the treated field.
Figure A1.4. Conceptual Model of Soil-Applied Systemic Pesticides for Honey Bee Risk Assessment. Red depicts systemic pathways. Dashed lines represent routes of exposure that are not considered to be major.

46
Appendix2.Considerationsrelatedtoquantifyingresiduesofpesticidesinpollenandnectarusingpesticide‐specificstudies
Empirical data may be used to refine conservative assumptions and reduce uncertainty associated with the Tier I exposure assessment by providing direct measurements of pesticide concentrations resulting from actual use settings. Studies investigating pesticide concentrations in pollen and nectar should be designed to provide residue data for crops and application methods of concern. It is preferable that residues are measured from pollen and nectar samples collected directly from a crop. Otherwise they may be measured from pollen and nectar samples taken from bees that have collected the samples (e.g., during Tier II tunnel studies). Measures should be taken to avoid degradation during sampling. The use of honey bees to collect samples may be desirable for crops that have flower structures that complicate the direct collection of pollen and nectar by humans. However, when honey bees are used for sampling pollen/nectar, caution should be taken to ensure that the residue data are representative of the target crop; otherwise, residue data may underestimate the target crop exposure. Chemical degradation in pollen and nectar may occur on/in bees after being collected. Bees should be limited from collecting pollen and nectar from sources other than the crop of interest. Additional considerations may include the collection of vegetative portions of the treated crop ensuring the peak residue concentration is captured. These data, taken over a period of time, may reflect the accumulation/depuration curve of the chemical and may provide information about the transport and potential duration/concentration measures in the plant. It is not necessary to have residue data for each crop for which a pesticide is registered/proposed. For refinement purposes, reliance on data for a select number of crops that adequately represent the diversity pollinator-attractive crops and registered uses is typically considered sufficient. In this approach, individual crops are used as surrogates for other crops. In selecting the surrogate crops, the nature of the crop (i.e., whether it blooms within a specified (determinant) period or is indeterminant), its attractiveness to bees, application method, and site selection should be considered for selecting exposures that would yield a reasonably conservative estimate for exposure through pollen and nectar (e.g., higher magnitude, duration and spatial extent of residues). Regarding the number and nature of residue studies to recommend, risk assessors should consider how these data will be used in the risk assessment. To the extent possible, studies should focus on those scenarios that are believed to represent high-end exposure potential (application method/crop/soil/location). As with any study, consideration must be not only be given to the resources involved in conducting the study but also in reviewing the studies, as well as its contribution to the entire risk assessment. The following considerations are relevant to evaluating the breadth and design of residue study protocols:
-Attractiveness of the studied crop to bees -Spatial extent of the crop (e.g., expected use acreage) -Duration and timing of blooming period in relation to bee pollination/foraging -Pesticide application rates, methods and timing -Influence of soil factors and agronomic practices on residues in the crop -Influence of soil hydric/meteorological/and transpiration conditions on crop residues -Diversity of crop biology and physiology within a crop group, and -The temporal nature of pesticide residues in pollen and nectar (e.g., time to peak residue occurrence and the potential for season to season accumulation of pesticide residues)
Although the aforementioned list of considerations is substantial, it most likely will not be necessary to quantify the effect of all such factors on residues in each surrogate crop. Insight into the nature of pesticide

47
residues in crops may be obtained from magnitude of residue, plant metabolism and rotational crop studies conducted for human health assessment. Furthermore, crop residue studies can be structured so that results from earlier studies can help inform the design and need for subsequent studies.

48
Appendix3.BeeREX The Bee-REX model is a screening level tool that is intended for use in a Tier I risk assessment to assess exposures of bees to pesticides and to calculate risk quotients. This model is individual-based, and is not intended to assess exposures and effects at the colony-level (i.e., for honey bees). The Tier I exposure method is intended to account for the major routes of pesticide exposure that are relevant to bees (i.e., through diet and contact). Exposure routes for bees differ based on application type. In the model, bees foraging in a field treated with a pesticide through foliar spray could potentially be exposed to the pesticide through direct spray as well through consuming contaminated food. For honey bees foraging in fields treated with a pesticide through direct application to soil (e.g., drip irrigation), through seed treatments, or through tree injection, direct spray onto bees is not expected. For these application methods, pesticide exposure through consumption of residues in nectar and pollen are expected to be the dominant routes. Foraging honey bees may also be exposed to pesticides via contact with dust from seed treatments or via consumption of water from surface water, puddles, dew droplet formation on leaves and guttation fluid; however, the Bee-REX tool does not include quantification of exposures via these routes. Appendix 3, Table 1 summarizes the exposure and effect estimates used in developing the Tier 1 screening-level risk quotients (RQs) for individual adult bees and larvae for foliar spray applications, soil applications, seed treatments and tree trunk applications. The appropriate exposure values and effect endpoints would be used to derive these RQs. The resulting RQ values would then be compared to the LOCs for acute and chronic exposures, which are 0.4 and 1.0, respectively.

49
Appendix 3, Table 1. Summary of exposure and effect estimates used in deriving risk quotients for Tier I risk assessments.
Measurement Endpoint
Exposure Route
Exposure Estimate+ Acute Effect
Endpoint Chronic Effect
Endpoint+++ Foliar Applications
Individual Survival (adults)
Contact AREnglish* (2.7 µg a.i./bee) ARMetric* (2.4 µg a.i./bee)
Acute contact LD50
None
Individual Survival (adults)
Diet
AREnglish * (110 µg a.i /g) (0.292 g/day) ARMetric * (98 µg a.i /g) (0.292 g/day)
Acute oral LD50
Chronic adult oral NOAEL (effects to survival or longevity)
Brood size and success
Diet
AREnglish * (110 µg a.i /g) (0.124 g/day) ARMetric *(98 µg a.i /g) (0.124 g/day)
Larval LD50 Chronic larval oral NOAEL (effects to adult emergence, survival,)
Soil Treatments
Individual Survival (adults)
Diet (Briggs EEC) * (0.292 g/day) Acute oral LD50
Chronic adult oral NOAEL (effects to survival or longevity)
Brood size and success
Diet (Briggs EEC) * (0.124 g/day) Larval LD50 Chronic larval oral NOAEL (effects to adult emergence, survival,)
Seed Treatments
Individual Survival (adults)
Diet (1 µg a.i /g) * (0.292 g/day) Acute oral LD50
Chronic adult oral NOAEL (effects to survival or longevity)
Brood size and success
Diet (1 µg a.i /g) * (0.124 g/day) Larval LD50 Chronic larval oral NOAEL (effects to adult emergence, survival,)
Tree Trunk Applications++
Individual Survival (adults)
Diet (µg a.i. applied to tree/g of foliage) * (0.292 g/day)
Acute oral LD50
Chronic adult oral NOAEL (effects to survival or longevity)
Brood size and success
Diet (µg a.i. applied to tree/g of foliage) * (0.124 g/day)
Larval LD50 Chronic larval oral NOAEL (effects to adult emergence, survival,)
AREnglish = application rate in lbs a.i./A; ARMetric = application rate in kg a.i./ha +Based on food consumption rates for larvae (0.124 g/day) and adult (0.292 g/day) worker bees and concentration in pollen and nectar. ++Note that concentration estimates for tree applications are specific to the type and age of the crop to which the chemical is applied. +++To calculate RQs for chronic effect, NOAEC can be used as the effect endpoint to compare with the exposure estimate in concentration.
50
1.1. Toxicity inputs Estimated exposure concentrations are integrated with available toxicity data in order to characterize risks of a pesticide to honey bees. In doing so, Tier I estimated exposures and toxicity endpoints are compared based on the same exposure routes. For instance, estimated exposures through direct spray onto foraging bees are combined with toxicity endpoints from contact toxicity test, while estimated dietary exposures are matched with oral toxicity data. For acute exposures, the endpoints are LD50 values for adult and larval bees exposed to a single dose of a pesticide and observed for several days. For adult bees, the contact LD50 value should be derived from a study conducted in a manner consistent with guideline 850.202027 or OECD 214. The oral exposure endpoint for adult bees should be from a study that is similar to the OECD 21328. For larvae, the acute oral LD50 should be from a study that is conducted in a manner consistent with OECD 23729. A larval chronic study is under development and endpoint for chronic toxicity should be generated in a manner consistent with the potential guidance. At this time, standard guideline methods are not available for laboratory-based chronic tests of bees. If a scientifically-valid no-observed adverse effect level (NOAEL) or concentration (NOEAC) from a chronic study with adult bees or larvae is available, the model user can enter these into the Bee-REX tool in order to calculate chronic RQs. It should be noted that although it may be possible to extract both a NOAEL or NOEAC and an ECx or LCx value from the laboratory-based studies, it is important to note differences in hypothesis-based test designs needed to reliably support NOAEL/NOAEC versus regression-based study designs needed to support ECx and LCx estimates. When a NOAEC, or ECx or LCx are used as endpoints, the exposure estimates in concentrations should be used. In this case, RQs can be generated outside of the BeeREX tool by dividing the concentration based estimates of exposure by the appropriate endpoint. It should be noted that the tool uses toxicity data for worker bees to calculate RQ values for queens and drones. There is uncertainty in using worker bees as surrogates for the royal cast due to the size differences in the bees (i.e., queens and drone adults are larger than workers). 1.2. Food consumption rates
As discussed in the effects characterization, oral toxicity data are necessary for adult and larvae in order to characterize the risks of a pesticide. It is important that both exposure and toxicity endpoints are in the same unit for RQ calculation; otherwise unit conversion must be conducted. When toxicity endpoints are expressed as concentration (e.g., NOAEC), exposure estimates should be in the same concentration units, and conversion using food consumption rate is not needed. When toxicity endpoints are expressed on a dose basis (i.e., μg a.i./bee), it is necessary to convert estimated concentrations of pesticides in food (expressed as mg a.i./kg) into doses. The major nutritional requirements for honey bees are met through consumption of nectar, honey, pollen and bee bread as well as royal jelly and brood food. Pesticide doses received by bees can be calculated using nectar and pollen consumption rates for larval and adult worker bees. For larvae, the proposed total food consumption rate is 124 mg/day, which is based on the total daily consumption of pollen and nectar by larvae during the last days in the life
27 USEPA. 2012. Ecological Effects Test Guidelines. OCSPP 850.3020 Honey Bee Acute Contact Toxicity. EPA 712-C-019. January 2012. http://www.regulations.gov/#!documentDetail;D=EPA-HQ-OPPT-2009-0154-0016 28 OECD. 1998. OECD Guidelines for the Testing of Chemicals. Test Number 213: Honey bees, Acute Oral Toxicity Test. http://www.oecd-ilibrary.org/environment/test-no-213-honey bees-acute-oral-toxicity-test_9789264070165-en;jsessionid=5p2ngklfmv8p4.epsilon 29 OECD. 2013. OECD Guidelines for the Testing of Chemicals. Test Number 237: Honey bee (Apis mellifera) larval toxicity test, single exposure. http://www.oecd-ilibrary.org/environment/test-no-237-honey-bee-apis-mellifera-larval-toxicity-test-single-exposure_9789264203723-en

51
stage. For adult worker bees, the proposed food consumption rate is 292 mg/day, based on nectar consumption rates of nectar foraging bees, which are expected to receive the highest dietary exposures among different types of worker bees. In addition, it is likely that these food consumption rates are protective of drones and queens. The Bee-REX tool calculates dietary exposure values for larvae of different ages, adult workers with different tasks (and associated energetic requirements) and royal castes. The most conservative RQ is selected for the Tier I screen. All of the RQs can be used for risk characterization purposes. Those food consumption rates, which are provided in Appendix 3, Table 2, are based on work described in Appendix 1 of USEPA, PMRA and CADPR 201230 and updated by Garber (unpublished)31. The tool also has the ability to override estimated concentrations with empirical data for pesticide concentrations in pollen, nectar, jelly and bee bread. When pesticide concentrations in pollen are an order of magnitude greater or more than in nectar, the most conservative adult may be the nurse bee, which consumes 1.3-12 mg pollen/day, combined with 113-167 mg nectar/day (Appendix 3, Table 2). The BeeREX tool uses food consumption rates that are meant to represent typical bees within a worker group or royal caste. For nurse bees, the food consumption rates of 9.6 mg pollen/day and 140 mg nectar/day were used to represent central tendencies in food consumption. The pollen consumption rate reflects the highest average daily consumption rate measured for nurse bees given the limited availability of data (only two empirical studies were located). If the refined RQ values (derived using empirical concentration data) are close to the LOC, the risk assessor may explore the influence in the variability in concentrations and in food consumption rates on risk conclusions (e.g., by bounding the exposure using high and low food consumption values combined with high and low pesticide concentrations).
30 USEPA, PMRA, and CADPR (2012) White paper in support of the proposed risk assessment process for bees. United States Environmental Protection Agency, Office of Pesticide Programs, Washington DC. Pest Management Regulatory Agency, Health Canada, Ottawa. California Department of Pesticide Regulation, Sacramento, CA. 31 Garber, K.V. manuscript in preparation: Estimation of food consumption rates of honey bees (Apis mellifera) by caste and worker task for use in assessing dietary risks of pesticides.
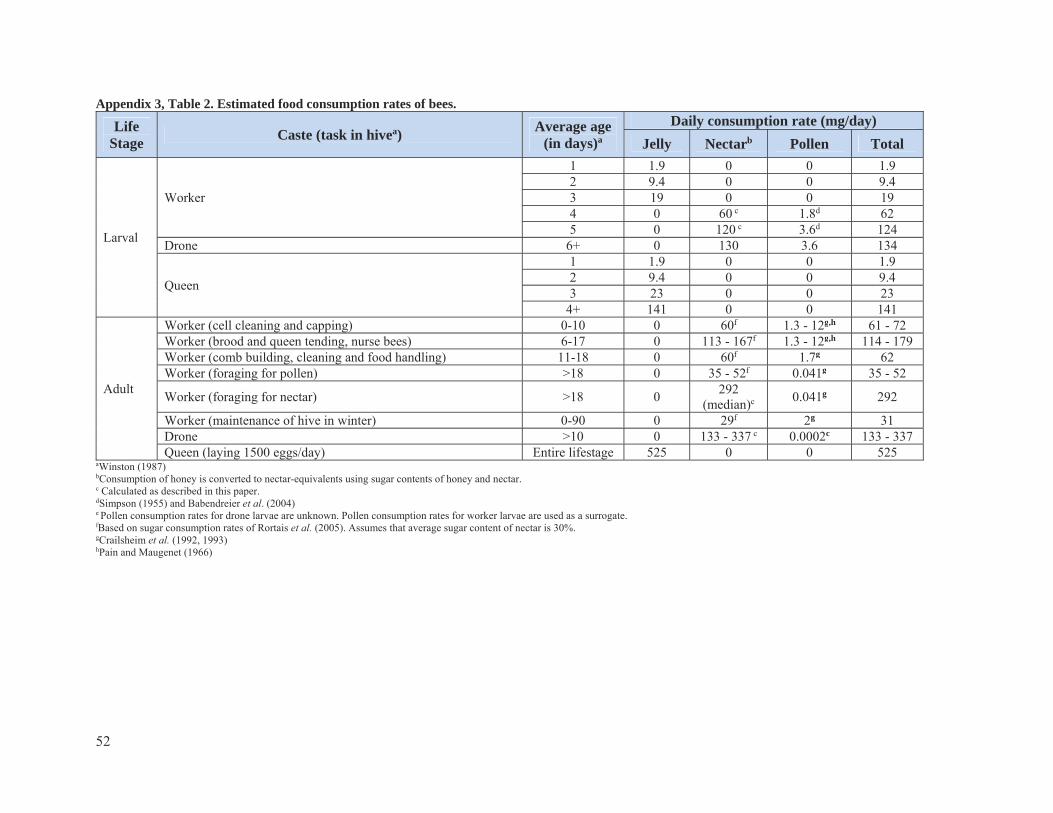
52
Appendix 3, Table 2. Estimated food consumption rates of bees.
Life Stage
Caste (task in hivea) Average age
(in days)a
Daily consumption rate (mg/day)
Jelly Nectarb Pollen Total
Larval
Worker
1 1.9 0 0 1.9 2 9.4 0 0 9.4 3 19 0 0 19 4 0 60 c 1.8d 62 5 0 120 c 3.6d 124
Drone 6+ 0 130 3.6 134
Queen
1 1.9 0 0 1.9 2 9.4 0 0 9.4 3 23 0 0 23
4+ 141 0 0 141
Adult
Worker (cell cleaning and capping) 0-10 0 60f 1.3 - 12g,h 61 - 72 Worker (brood and queen tending, nurse bees) 6-17 0 113 - 167f 1.3 - 12g,h 114 - 179 Worker (comb building, cleaning and food handling) 11-18 0 60f 1.7g 62 Worker (foraging for pollen) >18 0 35 - 52f 0.041g 35 - 52
Worker (foraging for nectar) >18 0 292
(median)c 0.041g 292
Worker (maintenance of hive in winter) 0-90 0 29f 2g 31 Drone >10 0 133 - 337 c 0.0002c 133 - 337 Queen (laying 1500 eggs/day) Entire lifestage 525 0 0 525
aWinston (1987) bConsumption of honey is converted to nectar-equivalents using sugar contents of honey and nectar. c Calculated as described in this paper. dSimpson (1955) and Babendreier et al. (2004) e Pollen consumption rates for drone larvae are unknown. Pollen consumption rates for worker larvae are used as a surrogate. fBased on sugar consumption rates of Rortais et al. (2005). Assumes that average sugar content of nectar is 30%. gCrailsheim et al. (1992, 1993) hPain and Maugenet (1966)

53
In the proposed approach for representing food consumption rates of larvae and adults, it is assumed that exposures through consumption of nectar and pollen are conservative representations of potential exposures through consumption of honey and bee bread, respectively. This approach is likely to be conservative because it assumes that pesticides do not degrade while honey and bee bread are stored in the hive. For bees that consume honey, it is assumed that the estimated pesticide exposures can be related back to the original concentration in nectar by accounting for the amount of sugar consumed by bees. It is also assumed that pollen and nectar consumption rates and resulting exposures are protective of exposures of bees to pesticides through consumption of royal jelly and brood food. This is supported by work by Davis and Shuel 1988 32 and Kamel et al. (unpublished) 33 demonstrating that pesticide concentrations in food consumed by nurse bees are 2-4 orders of magnitude higher than concentrations measured in royal jelly. Based on these observations, for calculating RQ for queens, concentrations in royal jelly are 100X less compared to the residue in nectar or pollen, whichever is greater. 1.3. Estimating pesticide concentrations in pollen and nectar In an ideal situation, the Tier I exposure estimates for honey bees would be based on residue values measured directly in nectar and pollen of flowers sprayed with pesticides. This cannot be achieved at this time because there is an insufficient amount of data that may be used to adequately describe the distribution of pesticide residues that occur in pollen and nectar relative to pesticide application rate. As an alternative, the proposed method relies on upper-bound pesticide residue values plant leaves, which will serve as a surrogate for pollen and nectar. Methods for estimating dietary exposures to bees differ in the nature of the estimated concentrations in pollen and nectar. For foliar spray applications, the approach involves the use of the tall grass residue value from the T-REX model (v. 1.5) as a surrogate for pesticide concentrations in nectar and pollen. For soil treatments, the method is based on a modification to a plant-soil uptake model developed by Briggs et al. 1982 and 1983, which is designed to estimate pesticide concentrations in plant shoots; the concentrations in plant shoots are proposed as a surrogate for concentrations in pollen and nectar (following systemic transport). For seed treatments, the Tier I exposure method is based on the International Commission for Plant-Bee Relationships’ (ICP-BR) 1 mg a.i./kg concentration to represent an upper-bound concentration in nectar and pollen. For tree injections and trunk drenches, the method is a simplistic approach that considers the mass of the pesticide applied to a tree and the mass of the leaves of the tree. At the Tier I level, both acute and chronic exposure estimates are represented by the highest single day exposure value. Although a time weighted estimated exposure value may be more representative of the exposure used in a chronic toxicity test, exposure occurring over at the highest residue estimate could potentially be sufficient to elicit effects while assume no degradation occurs. Therefore, in the Tier I approach, chronic exposure is conservatively represented by the highest single day estimated exposure. 1.3.1. Foliar sprays For dietary exposure, the method includes the use of the upper-bound residue for tall grass used in the T-REX model (i.e., 110 ug a.i./g per 1 lb a.i./A or 98 ug a.i./g per 1 kg a.i./ha) as a surrogate for pesticide concentrations in pollen and nectar of flowers that are directly sprayed with a pesticide. This exposure
32 Davis, A.R. and Shuel, R.W. (1988) Distribution of C(14)-Labeled carbofuran and dimethoate in royal jelly, queen larvae and nurse honeybees. Apicologie, 19 (1), 37-50. 33 Kamel, A.; Dively, G.; Hawthorn, D. and Pettis, J. Unpublished research examining the fate of imidacloprid and its metabolites in honey bee hives.
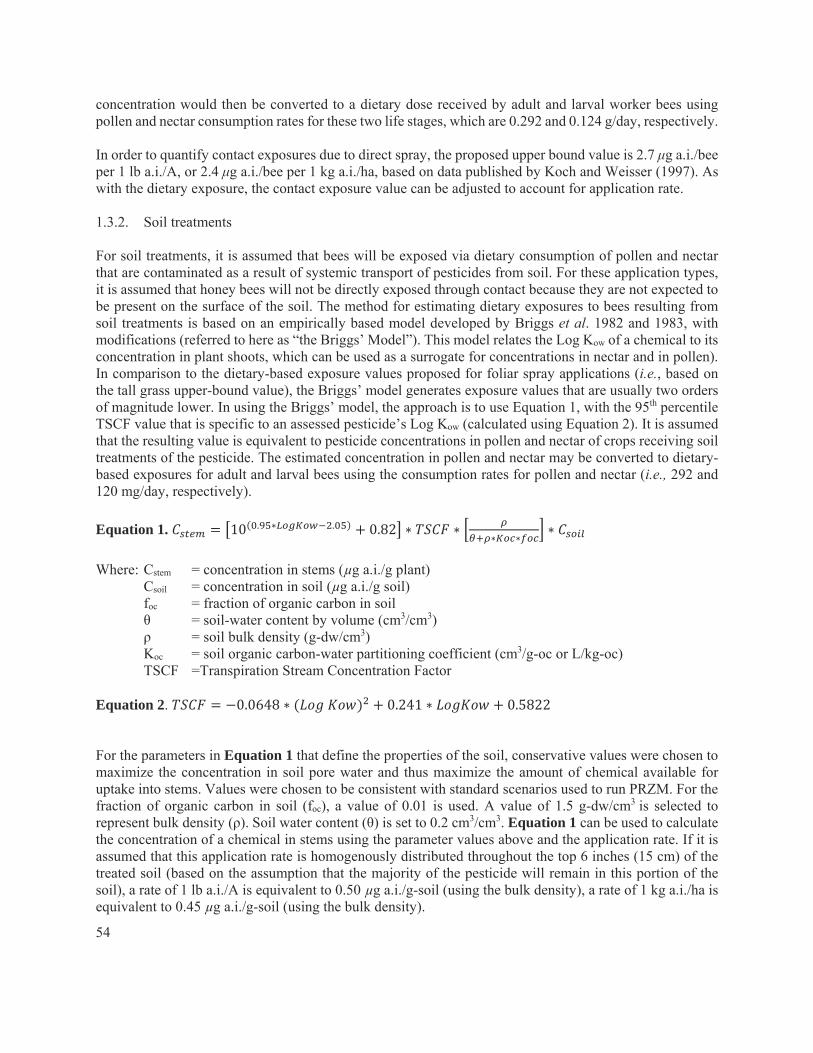
54
concentration would then be converted to a dietary dose received by adult and larval worker bees using pollen and nectar consumption rates for these two life stages, which are 0.292 and 0.124 g/day, respectively. In order to quantify contact exposures due to direct spray, the proposed upper bound value is 2.7 μg a.i./bee per 1 lb a.i./A, or 2.4 μg a.i./bee per 1 kg a.i./ha, based on data published by Koch and Weisser (1997). As with the dietary exposure, the contact exposure value can be adjusted to account for application rate. 1.3.2. Soil treatments For soil treatments, it is assumed that bees will be exposed via dietary consumption of pollen and nectar that are contaminated as a result of systemic transport of pesticides from soil. For these application types, it is assumed that honey bees will not be directly exposed through contact because they are not expected to be present on the surface of the soil. The method for estimating dietary exposures to bees resulting from soil treatments is based on an empirically based model developed by Briggs et al. 1982 and 1983, with modifications (referred to here as “the Briggs’ Model”). This model relates the Log Kow of a chemical to its concentration in plant shoots, which can be used as a surrogate for concentrations in nectar and in pollen). In comparison to the dietary-based exposure values proposed for foliar spray applications (i.e., based on the tall grass upper-bound value), the Briggs’ model generates exposure values that are usually two orders of magnitude lower. In using the Briggs’ model, the approach is to use Equation 1, with the 95th percentile TSCF value that is specific to an assessed pesticide’s Log Kow (calculated using Equation 2). It is assumed that the resulting value is equivalent to pesticide concentrations in pollen and nectar of crops receiving soil treatments of the pesticide. The estimated concentration in pollen and nectar may be converted to dietary-based exposures for adult and larval bees using the consumption rates for pollen and nectar (i.e., 292 and 120 mg/day, respectively).
Equation 1. 10 . ∗ . 0.82 ∗ ∗∗ ∗
∗
Where: Cstem = concentration in stems (µg a.i./g plant)
Csoil = concentration in soil (µg a.i./g soil) foc = fraction of organic carbon in soil θ = soil-water content by volume (cm3/cm3) ρ = soil bulk density (g-dw/cm3) Koc = soil organic carbon-water partitioning coefficient (cm3/g-oc or L/kg-oc) TSCF =Transpiration Stream Concentration Factor
Equation 2. 0.0648 ∗ 0.241 ∗ 0.5822 For the parameters in Equation 1 that define the properties of the soil, conservative values were chosen to maximize the concentration in soil pore water and thus maximize the amount of chemical available for uptake into stems. Values were chosen to be consistent with standard scenarios used to run PRZM. For the fraction of organic carbon in soil (foc), a value of 0.01 is used. A value of 1.5 g-dw/cm3 is selected to represent bulk density (ρ). Soil water content (θ) is set to 0.2 cm3/cm3. Equation 1 can be used to calculate the concentration of a chemical in stems using the parameter values above and the application rate. If it is assumed that this application rate is homogenously distributed throughout the top 6 inches (15 cm) of the treated soil (based on the assumption that the majority of the pesticide will remain in this portion of the soil), a rate of 1 lb a.i./A is equivalent to 0.50 µg a.i./g-soil (using the bulk density), a rate of 1 kg a.i./ha is equivalent to 0.45 µg a.i./g-soil (using the bulk density).
55
In the Tier I approach, it is assumed that all chemicals may be systemically transported. This assumption may be limited based on Log Kow (Ryan et al. 1988). Therefore, it could be limited to the bounds of the Log Kow values used in the empirical data set generated by the Briggs’ model (i.e., for chemicals with Log Kow<5; which is the bound on the data set used by Briggs). Whether a chemical is transported systemically in plants could potentially be confirmed using empirical data submitted to EPA and PMRA (e.g., plant metabolism studies); however, it would be up to pesticide registrants to submit sufficient data to demonstrate that a pesticide is not systemic.
There are five notable limitations to using the modified Briggs’ model approach. The first is that this methodology is based on empirical data from only one type of plant. The second limitation is that the data set used to derive Equation 1 is based on a limited number of chemicals that represent only two classes of pesticides. The third limitation is that this approach is based on data from non-ionic organic chemicals and may have limited utility for ionic chemicals that whose transport may not be predicted well using Kow and Koc. The fourth limitation of the Briggs’ model is that it is based on passive transport of chemicals into xylem, therefore, this approach does not directly estimate pesticide concentrations in plants that are the result of phloem transport. The fifth limitation involves the use of estimated pesticide concentrations in vegetative plant matrix (i.e., shoots) as a surrogate for nectar and pollen. At this time, the modified Briggs method represents the best available approach for estimating pesticide concentrations in pollen and nectar of crops on soil treated with pesticides. The use of this approach was supported by the FIFRA SAP. As more data become available (e.g., measured pesticide residues in pollen and nectar from crops on treated soil), EPA, PMRA and CADPR will reevaluate the modified Briggs method.
1.3.3. Seed treatments The Tier I exposure method for seed treatments is based on the EPPO 2010 screening value of 1 mg a.i./kg in pollen and nectar of plants to which seed treatments were made. For these application types, it is assumed that bees will only be exposed through the diet. In the Tier I approach, it is assumed that all pesticides that are applied to seeds are systemic, and therefore can be transported into pollen and nectar that may be consumed by honey bees. This approach may be used for all pesticides that are applied via seed treatment, by assuming that the upper-bound exposure value for pollen and nectar is 1 mg a.i./kg. This value can be multiplied by nectar and pollen consumption for adult and larval worker bees to determine the upper-bound doses potentially received by bees. This method can be applied to all chemicals that are applied to seeds, with no need for adjustment based on application rate or chemical properties. 1.3.4. Tree trunk applications The method involves estimating the concentration in the vegetative part of the treated tree (excluding woody parts) by dividing the mass of the pesticide applied to the tree by the mass of tree vegetation represented primarily by leaves, but also by flowers. The application rate should be entered as the total mass of pesticide applied per tree. The mass of the leaves of the tree must be estimated based on the expected characteristics of the tree to which the pesticide may be applied. It is expected that the mass of leaves and flowers of a tree will vary by species and by age of the tree, therefore a standard equation is not provided here. There are various sources available through government publications, extension offices and scientific literature that provide equations

56
for estimating the mass of tree leaves. For example, Jenkins et al. 200334 provides equations for various tree species that may be used to estimate the mass of foliage for hard and softwood species. Alva et al. 200335 provide data on masses of citrus tree leaves. This mass of leaves should be entered as a wet weight value. In some cases, it may be necessary to convert from dry weight to wet weight. In that case a standard assumption of 80% water content in leaves may be used (this is consistent with the T-REX approach for grass and leaves). This approach assumes that the applied pesticide is homogenously distributed in the tree’s leaves and flowers and is not present in other parts of the tree. One major uncertainty associated with this approach is the estimate of the vegetative mass of the tree, which can vary greatly based on species, age, time of the year and geography. In addition, in this approach, it is assumed that 100% of the active ingredient is taken up into the tree and moved into the leaves and flowers. It is unlikely that all of the pesticide mass applied to the tree actually enters solely to the leaves. 1.4. Using empirical exposure data
If empirical data are available for a chemical, these data may be entered into the Bee-REX tool to calculate RQs. User-entered empirical exposure values will automatically over-ride estimated values. This can be accomplished by selecting “yes” to the question “Are empirical residue data available?” Once that is done, the user should enter the available values for pollen, nectar and jelly.
34 Jenkins, J., D. Chojinacky, L. Heath, and R. Birdsey. 2003. Comprehensive database of diameter-based biomass regressions for North American tree species. General Technical Report NE-319, Forest Service, United States Department of Agriculture. 35 Alva, A.K.; Fares, A. and H. Dou. 2003. Managing citrus trees to optimize dry mass and nutrient partitioning. Journal of Plant Nutrition, 26 (8): 1541-1559.

57
Appendix4.Tier3FieldStudyDesignConsiderations Tier III studies conducted under full-field conditions where bees are free foraging are intended to address specific uncertainties/risks that have been identified in lower-tier studies. The design of these studies will depend on the specific questions that need to be answered; therefore, it is not possible to define a single study design or specific design elements that must be incorporated into every full-field study. Below are elements that the risk assessor should consider; however, these are not intended to be prescriptive. It is incumbent on the review team to ultimately identify the study design elements that should be considered by the pesticide registrant/applicant in developing a study protocol that is responsive to the Tier III study requirement. It should also be noted that the data package submitted by the registrant may already include a series of bee studies spanning multiple tiers; it such cases, the reviewer should ensure that the studies address the uncertainties identified by review team to determine whether additional studies may be necessary. Chronic Field Pollinator Study Design Considerations Application Conditions
Maximum application rate Minimum reapplication interval Maximum number of applications Use of formulated end-product Application method
o Foliar o Soil treatment o Seed treatment o Combination
Suitable weather o Avoid applications when rain and/or high winds are predicted.
Season Test crop
Attractive to test bees Long bloom period to address concerns identified at lower tiers Large area to ensure majority of foraging on test crop Follow standard [local] agriculture practices
Colonies
Package bees/new equipment to limit incidence of disease; if older colonies are used, they should be as pest/disease free as possible.
o Colonies should not be used if they have received any chemical treatments within last 4 weeks. Colonies suspected of having American foulbrood should not be utilized. Other disease treatments should be reported.
o Beekeeper standard practice for maintain colony health during study All treatments must be uniform across study colonies.
Queen-right (healthy queen present); sister queens for each replicate. Acclimation period: 2 months minimum to establish representative age distribution in newly
established hives;
58
Homogeneous colony strength, brood pattern as close as possible If existing colonies are to be used; broad spectrum residue analysis in hive products (honey/nectar,
pollen, wax); must document low incidence of diseases/parasites. Size of the colonies may vary depending on the focus of the study and when the study is initiated.
Typically, each hive should at least 10,000 bees to cover 10 frames and include at least 5 brood frames. Excessive food storage should be avoided.
Colonies can be positioned in plots when test crops are blooming enough to minimize test bees foraging on plants other than the test crop, e.g., 20-25% bloom
Study Design Considerations Historically there has been difficulty in controlling the extent to which the free-foraging bees utilize the treated crop or that treatment groups cross-over. Sufficiently large field plots, if feasible, will overcome the cross-over issue between plots and problems of ensuring exposure to treated crops due to competing vegetation.
Mean honey bee foraging distance 1.5 – 3 km with extreme distances of 10 km; average surface area range 7 – 100 km2 (Medrzycki et al. 201336).
o EFSA 201337 recommends minimum of 2 ha to provide sufficient flowers and support exclusive foraging; Medrzycki et al. 2013 recommends minimum of 5 ha.
Suitable crop that is representative of actual use; good source of both pollen and nectar, (e.g., phacelia (Phacelia tanacetifolia), oilseed rape, mustard, buckwheat)
o Pollinator-attractive Account for crops/alternative forage within 3 km of colonies.
Distance of treated crop from other nectar producing plants is essential to ensure exposure and must be documented.
Pollen traps should be used to demonstrate extent to which bees have foraged on treated crop. Pollen identification (palynological analysis) may be used to ensure origin of pollen Pollen/nectar collection for residue analyses
o Collected by bees and sampled using pollen traps (corbicular pollen) o Collected directly from plants o Sampling of nectar forager honey stomachs o Sampling comb pollen/nectar
Minimum number of replicate colonies: 6 - 10 per treatment (Medrzycki et al. 2013); the number of replicates per treatment will depend on the targeted magnitude of effects and desired statistical power. Study duration should assess at least two brood cycles (42 days) to ensure brood is exposed to residues stored in the colony (EFSA 2013). Measurement Endpoints: depend on the risk hypothesis tested and the nature of uncertainties identified in lower-tier tests. Possible measurement endpoints may include. Adult Forage Bees
36 Medrzycki, P. H. Giffard, P. Aupinel, L. P. Belzunces, M-P. Chauzat, C. Classen, M. E. Colin, T. Dupont, V. Girolami, R. Johnson, Y. LeConte, J. Lückmann, M. Marzaro, J. Pistorius, C. Porrini, A. Schur, F. Sgolastra, N. S. Delso, J van der Steen, K. Wallner, C. Alaux, D. G. Biron, N. Blot, G. Bogo, J-L Burnet, F. Delbac, M. Diogon, H. El Alaoui, B. Provost, S. Tosi and C. Vidau. 2013. Standard methods for toxicology research in Apis mellifera. Journal of Apicultural Research 52(4): http://dx.doi.org/10.3896/IBRA.1.52.4.14 37 EFSA..Guidance on the risk assessment of plant protection products on bees (Apis mellifera, Bombus spp. and solitary bees. EFSA Journal 2013;11(7):3295, 266 pp. doi:10.2903/j.efsa.2013.3295. Available online: www.efsa.europa.eu/efsajournal
59
Adult bee survival/longevity Adult bee foraging activity (visual counts of returning foragers; mark-and-recapture; calibrate Dead
Bee Dead Zone traps) Queen status over the course of the exposure Colony health (disease/pest incidence) Colony Strength
Brood (quantify number of eggs; larvae, capped cells, pollen, honey/nectar cells) Monitoring of brood in a minimum of two staggered cohorts, mid-way and late in the exposure
period Adult longevity: measured by using 30 newly-emerged adult bees from each colony (minimum n=6
colonies/treatment) in a controlled laboratory cage experiment monitoring daily mortality. Newly-emerged bee weights Hive weight
Other potential endpoints
Overwintering Success Fitness measure: Pathogen challenge (e.g., Nosema exposure) to newly emerged bees Assess the ability of colonies to re-queen themselves by removing all queens and determining the
success of each colony in rearing a replacement queen. Documenting Exposure
Residue analysis in pollen/nectar collected from crop Residue analyses in pollen/nectar collected from bees Residue analysis in pollen/nectar/honey collected from hive Residue analyses in bee carcasses Residue analyses in wax Foliar Residue analysis Measure total residues of concern (parent + degradate(s))
Suitable control bees (residue analyses to demonstrate lack of exposure). Utility of mark-and-recapture to document drift of bees from treated colonies.