Embed Size (px)
Citation preview
i
Acknowledgements
For his advice and support in preparing the experimental work, my thanks to
Professor Jan Paca.
For his advice and support in preparing the report, my gratitude to Dr. Isabel
Brás.
For their unselfish support in helping me when I needed, my sincere thanks to my
fellows in the laboratory.
I want to thank my family and friends for their patience and understanding.
Special thanks to my boyfriend for being always there when I needed!
For the patience to clarify my doubts in English, thank you Diana.
Finally, I want to thank all my Erasmus colleagues for helping me to overcome
the missed!
Biofiltration of Air/Styrene and Air/Styrene/Acetone mixtures in a bubble column reactor
ii
Abstract
The goal of this work was the treatment of polluted waste gases in a bubble column
reactor (BCR), in order to determinate the maximum value of reactor’s efficiency (RE), varying
the inlet concentration (C in) of the pollutants.
The gaseous mixtures studied were: (i) air with styrene and (ii) air with styrene and
acetone. The liquid phase used to contain the biomass in the reactor was a basal salt medium
(BSM), fundamental for the microorganisms’ development.
The reactor used in this project consists of a glass column of 620mm height and inside
diameter 75mm. In all essays there were continually measured: pH, dissolved oxygen and
liquid’s temperature. Temperature and pH were controlled (T=24ºC,
7.0 ≤ pH ≤ 7.7). In all experiments the liquid volume (including the biomass) used in the reactor
was kept constant (1.5L) as well as the total gas flowrate (1 L/min).
Concerning the goal of the work, some parameters were calculated: the organic load
(OL), removal efficiency (RE), elimination capacity (EC), biomass concentration (xf) and dry
biomass concentration (Xdw).
In a first series of experiments, the gas mixture used was air with styrene, varying its
concentration from 191 mg.m-3 to 6500 mg.m-3.It was concluded that the RE maximum value
(97%) was obtained for C in Sty = 4200 mg.m-3. For the maximum tested value of C in
Sty, RE
obtained was 20%. In a second step, the gaseous mixture included acetone, varying
C in Sty between 225 mg.m-3 and 2659 mg.m-3 and C in
Ac between 153mg.m-3 and
1389 mg.m-3. The aim of these tests was the determination of C in Ac for which RE was
maximum, obtaining C in Ac = 750 mg.m-3. A third series of experiments was performed, in which
C in Ac was maintained equal to that value and C in
Sty was varied until higher values (5422 mg.m-
3). RE maximum values obtained in this last series were 100% for styrene and 40% for acetone.
One important conclusion is the fact that the microorganisms available degrade better
styrene than acetone.
On the ambit of this study, it was possible to identify the species available in biomass:
Xanthobacter antotrophicus py2, Enterobacter aerogenes, Nocardia, Corynebacterium Spp.,
Rhodococcus rhodochrous e Pseudomonas Sp.

Biofiltration of Air/Styrene and Air/Styrene/Acetone mixtures in a bubble column reactor
iii
Resumo
O objectivo deste trabalho consistiu no tratamento de gases residuais poluentes num
reactor biológico com borbulhamento do gás (BCR, bubble column reactor), a fim de determinar
o valor máximo da eficiência do reactor (RE), variando a concentração desses gases na
corrente de entrada (C in).
As misturas gasosas estudadas foram: (i) ar com estireno e (ii) ar com estireno e
acetona. A fase líquida usada no reactor para conter a biomassa era constituída por um meio
mineral (BSM), fundamental para o desenvolvimento dos microrganismos.
O reactor usado neste projecto consiste numa coluna em vidro de altura 620mm e
diâmetro interno 75mm. Em todos os ensaios eram medidos em contínuo: o pH, o oxigénio
dissolvido, e a temperatura do líquido. O pH e a temperatura eram controlados (7,0 ≤ pH ≤ 7,7;
T=24ºC). Em todos os ensaios, o volume de líquido (incluindo a biomassa) usado no reactor foi
sempre o mesmo (1,5L), bem como o caudal da corrente gasosa (1 L/min).
No que concerne o objectivo deste trabalho, foram calculadas: taxa de carga orgânica
(OL), eficiência de remoção (RE), capacidade de eliminação (EC), concentração de biomassa
(xf) e a concentração de biomassa seca (Xdw).
Numa primeira série de ensaios, usou-se como corrente gasosa a mistura ar- estireno,
fazendo variar a concentração deste de 191mg.m-3 a 6500 mg.m-3 Conclui-se que o valor
máximo de RE (97%) foi obtido para C in Sty de 4200 mg.m-3. Para o valor máximo testado de
CinSty, o valor obtido da RE foi de 20%. Numa segunda série de ensaios, a mistura gasosa
passou a incluir acetona, fazendo variar Cin Sty entre 225 mg.m-3 e
2659 mg.m-3 e C in Ac entre 153 mg.m-3 e 1389 mg.m-3. O objectivo destes ensaios foi
determinar o valor de C in Ac para o qual a RE deste poluente fosse máxima, tendo-se obtido C
in Ac = 750 mg.m-3. Na última fase de ensaios, manteve-se C in
Ac igual àquele valor, variando C
in Sty até 5422mg.m-3. Os valores máximos de RE obtidos neste conjunto de ensaios foram de
100% para o estireno e 40% para a acetona.
Uma importante conclusão é o facto de os microrganismos utilizados degradarem
melhor o estireno do que a acetona.
No âmbito deste estudo, foi ainda possível identificar as espécies presentes na
biomassa: Xanthobacter antotrophicus py2, Enterobacter aerogenes, Nocardia,
Corynebacterium Spp., Rhodococcus rhodochrous e Pseudomonas Sp.

Biofiltration of Air/Styrene and Air/Styrene/Acetone mixtures in a bubble column reactor
iv
Contents
Acknowledgements ........................................................................................ i
Contents ................................................................................................... iv
Index of Figures .......................................................................................... vi
Index of Tables........................................................................................... viii
List of abbreviations and symbols .................................................................... ix
1 Introduction........................................................................................... 1
2 State of the Art ....................................................................................... 2
2.1 Pollutants characteristics .................................................................... 2
2.1.1 Styrene ......................................................................................................2
2.1.2 Acetone .....................................................................................................3
2.2 Biological treatment of waste gases containing VOC .................................. 5
2.2.1 Reactors for biofiltration ................................................................................6
2.2.2 Microorganisms used for biofiltration ............................................................... 14
3 Experimental ....................................................................................... 20
3.1 Introduction ................................................................................... 20
3.2 Experimental setup ......................................................................... 21
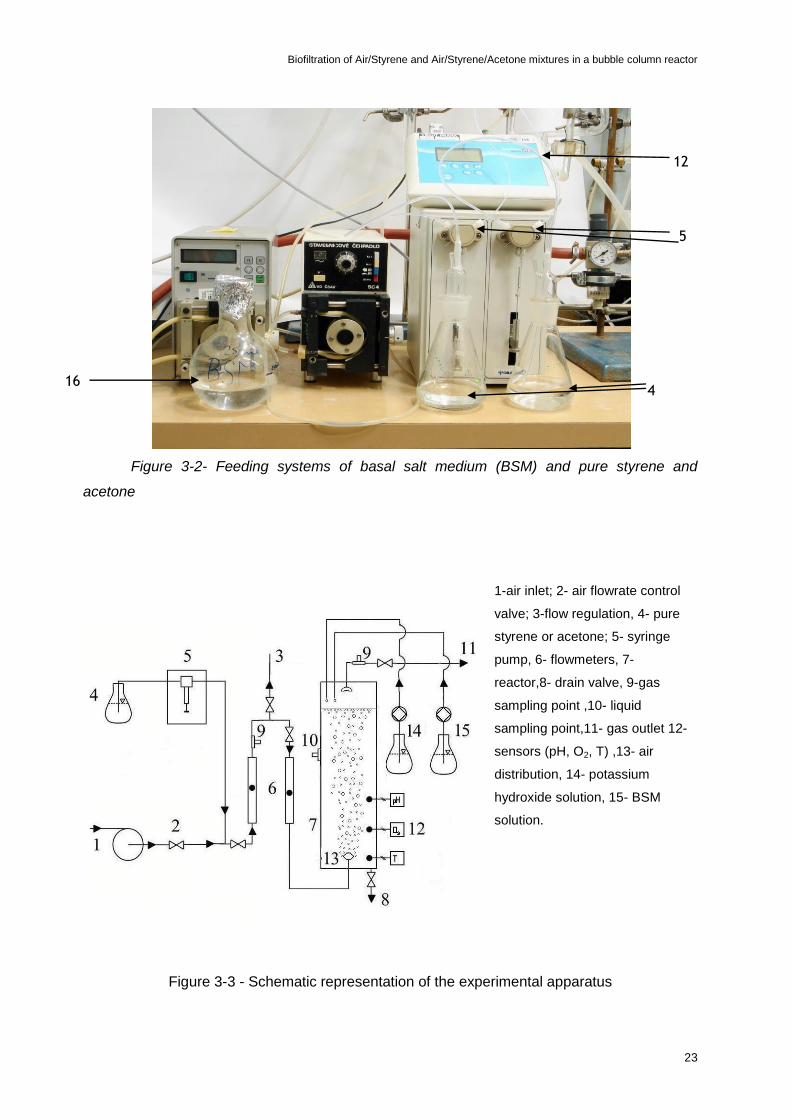
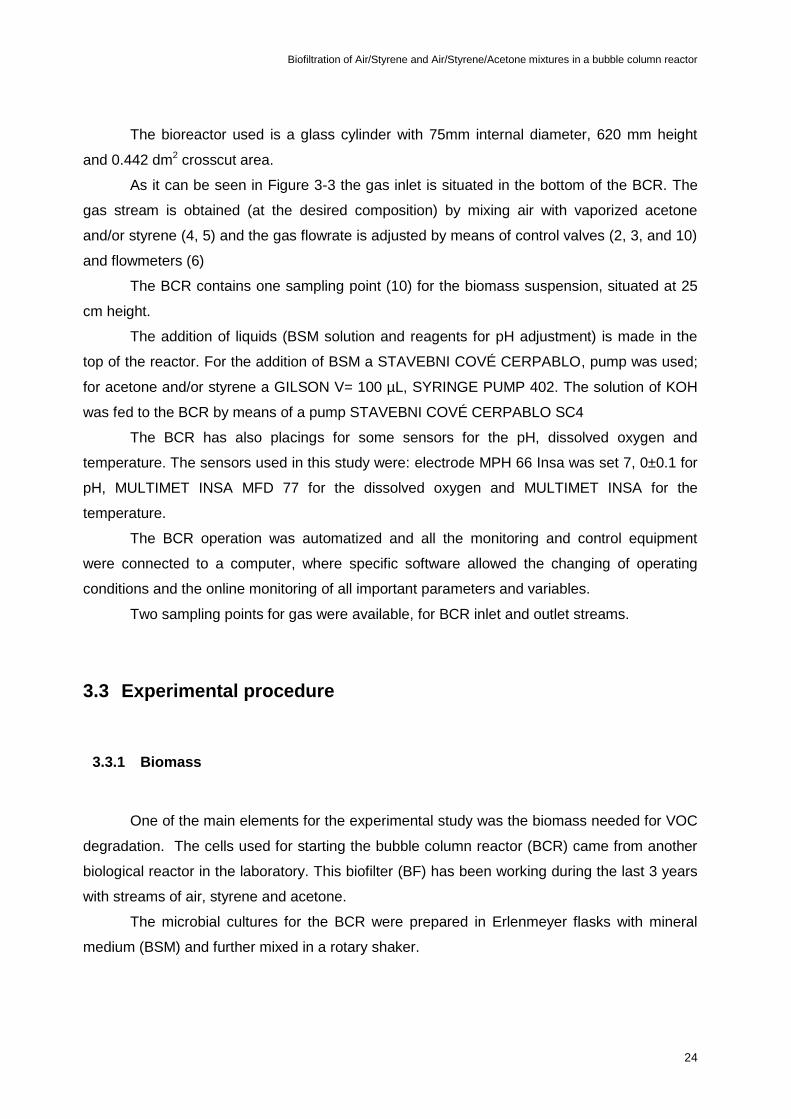
Figure 3-2- Feeding systems of basal salt medium (BSM) and pure styrene and acetone ........... 23
3.3 Experimental procedure ................................................................... 24
3.3.1 Biomass ................................................................................................... 24
3.3.1.1 Basal Salt Medium (BSM) ............................................................................ 25
3.3.1.2 Characterization of microbiological species present in the BCR ............................ 26
3.3.2 Experiment description ................................................................................ 27
3.4 Analysis of VOC ............................................................................. 28
3.4.1 VOC in gas streams ..................................................................................... 28
3.4.2 Determination of acetone in liquid medium (BSM)................................................ 29
3.5 Characterisation of the BCR biomass ................................................... 30

Biofiltration of Air/Styrene and Air/Styrene/Acetone mixtures in a bubble column reactor
v
3.5.1 Optical density .......................................................................................... 30
3.5.2 Dry mass .................................................................................................. 31
4 Results and discussion .......................................................................... 32
4.1 Overview ...................................................................................... 32
4.1.1 Styrene degradation in the bubble column reactor (Part I) ..................................... 32
4.1.2 Styrene and acetone degradation in the bubble column reactor (Part II) .................... 40
4.1.3 Loading styrene at Cin Ac= 750 mg.m-3 = constant. .............................................. 47
4.1.4 Biomass vs. dry mass ................................................................................... 49
4.1.5 Microbiologic ............................................................................................. 50
5 Conclusions ........................................................................................ 51
6 References .......................................................................................... 53
I. Annexes I............................................................................................ 57
I.1 Examples of calculation ....................................................................... 57
I.1.1 Determination of the degradation of pollutant mixture air- styrene in a bubble column
reactor 57
I.1.2 Calculus of the mixture air + styrene+ acetone degradation in a bubble column reactor
(BCR) 58
I.1.3 Calculus of the degradation of mixture air+ styrene+ acetone in a bubble column reactor
(BCR), using the Cin Ac= 750 mg.m-3 = constant. .............................................................. 59
I.2 Experimental results ........................................................................... 59
I.2.1 Overview .................................................................................................. 59
I.2.1.1 Styrene degradation in the bubble column reactor ........................................... 59
II. Annexes II ........................................................................................... 66
II.1 Examples of dry mass calculation ....................................................... 66
III. Annexes II ........................................................................................ 68
III.1 Safety data sheet ............................................................................ 68
III.1.1 Acetone ................................................................................................ 68
III.1.2 Styrene ................................................................................................ 73
III.1.3 Potassium hydroxide ................................................................................ 79
Biofiltration of Air/Styrene and Air/Styrene/Acetone mixtures in a bubble column reactor
vi
Index of Figures
Figure 2-1- Chemical structure of styrene [7] .........................................................................2
Figure 2-2- Chemical structure of acetone [9] ........................................................................4
Figure 2-3- VOC degradation [2] ........................................................................................5
Figure 2-4- Design and control parameters [21] ......................................................................7
Figure 2-5- Design and control parameters [21] ......................................................................9
Figure 2-6- Design and control parameters [21] .................................................................... 11
Figure 2-7- Pathway for the catabolism of styrene in Pseudomonas Sp. Strain Y2........................... 15
Figure 2-8- A summary of the major pathways of bacterial styrene degradation. The number(s) associated
with each pathway identifies the organism(s) that have been shown to perform the particular
transformation: 1, P. putida CA-3; 2, Xanthobacter strain 124X; 3, Xanthobacter strain S5; 4, P.
fluorescens ST; 5, Pseudomonas sp. strain Y2; 6, Corynebacterium strain ST-10; 7, Rhodococcus
rhodochrous NCIMB 13259. Dotted lines indicate proposed degradative routes yet to be formally
demonstrated. [26] ....................................................................................................... 16
Figure 2-9- Aerobic degradation of acetone [2] ..................................................................... 19
Figure 2-10- Carboxylation of acetone [2] ........................................................................... 19
Figure 3-1- Bubble column reactor (BCR) ........................................................................... 22
Figure 3-2- Feeding systems of basal salt medium (BSM) and pure styrene and acetone .................. 23
Figure 3-3 - Schematic representation of the experimental apparatus .......................................... 23
Figure 3-4- Gas chromatograph (Hewlett Packard 6890 N series, California, USA) ......................... 28
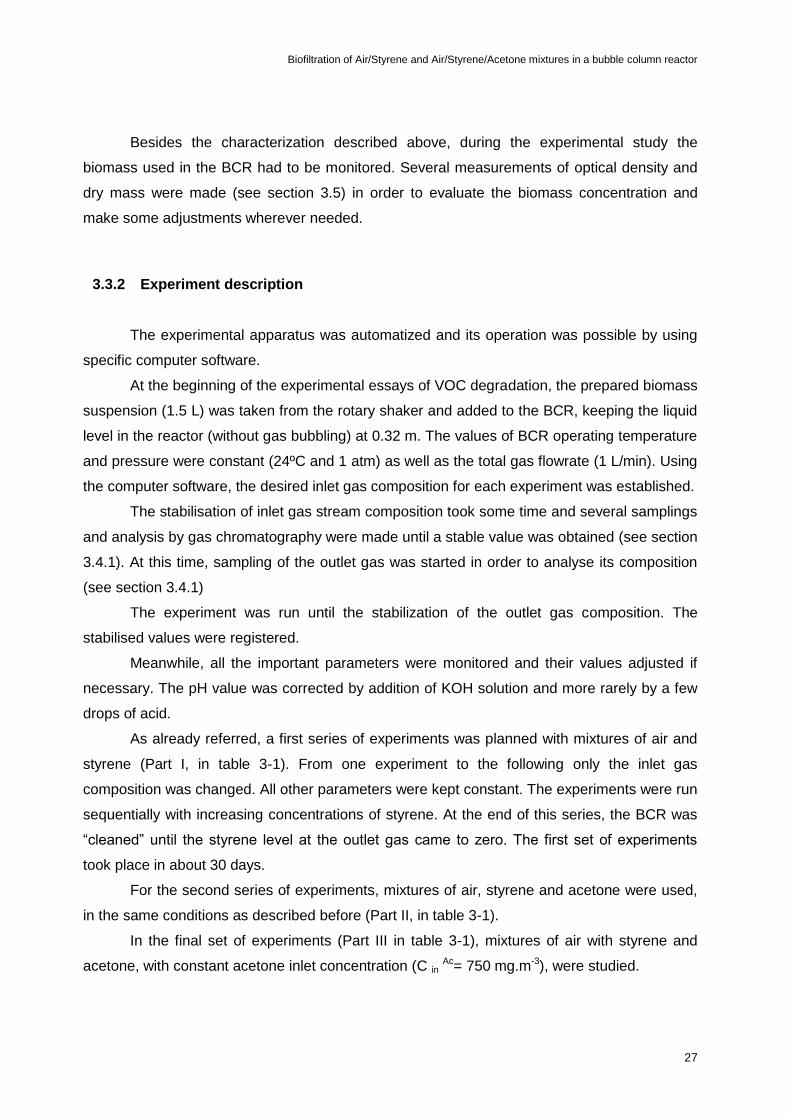
Figure 3-5- Injector (Microliter Syringes, Hamilton CO, Reno, Nevada) ........................................ 29
Figure 4-1 –Inlet, □ and outlet, Δ, concentrations(C Sty
), organic load rate (OL Sty
), ○ for styrene in time
(day) ....................................................................................................................... 33
Figure 4-2- Inlet Styrene concentration (Cin Sty
), □ and Removal efficiency (RE), Δ, for styrene in time
(day) ....................................................................................................................... 35
Figure 4-3- Removal efficiency (RE sty
), Δ, elimination capacity (EC sty
), ○, for styrene in time (day) ...... 36
Figure 4-4- Biomass concentration (Xf), □ and dissolved oxygen (DOC)○ along styrene degradation study
.............................................................................................................................. 37
Figure 4-5- Inlet concentration of styrene,○, and acetone, Δ, and total organic load rate, ○, in time(day)
during styrene and acetone degradation period .................................................................... 41
Figure 4-6- Outlet concentrations (C out) variation for styrene,□, and acetone, Δ, with total organic load
rate(OLw). ................................................................................................................. 42
Biofiltration of Air/Styrene and Air/Styrene/Acetone mixtures in a bubble column reactor
vii
Figure 4-7- Performance characteristics: A- □- RE sty
, Δ- RE Ac
; B- □-EC Sty
, Δ – ECAc
...................... 44
Figure 4-8- Variation of overall removal capacity(REw), ○, total elimination capacity (EC w),○, with total
organic loud (OL w)....................................................................................................... 46
Figure 4-9- Performance characteristics: A- □- C in sty
, Δ- C in Ac
; B- □-RE Sty
, Δ - RE AC
. .................... 48

Biofiltration of Air/Styrene and Air/Styrene/Acetone mixtures in a bubble column reactor
viii
Index of Tables
Table 2-1- Summary of the main characteristics of bioscrubbers for odour treatment biotechnologies [2] .8
Table 2-2- Summary of the main characteristics of biofiltration for odour treatment [2] ...................... 10
Table 2-3- Summary of biotrickling filters characteristics for odour treatment [2] ............................. 12
Table 3-1- Summary of the experimental conditions ............................................................... 21
Table 3-2- Composition of the basal salt medium (BSM) ......................................................... 25
Table 3-3- Composition of trace elements, V= 50µL (BSM) ...................................................... 25
Table 3-4- Number of samples analyzed for the different cultures and different dilutions ................... 26
Table 3-5- Conditions for acetone determination by chromatography (HPLC) ................................ 30
Table I-1- Experimental results of styrene degrade in bubble column reactor (BCR) ........................ 60
Table I-2 Calculated results for styrene degradation in bubble column reactor. .............................. 61
Table I-3 - Experimental results for the pollutant styrene and acetone ......................................... 62
Table I-4- Calculated results for the pollutant styrene and acetone ............................................. 63
Table I-5- Experimental results for the pollutant styrene and acetone (C in Ac
=750 mg.m-3
). ................ 64
Table I-6- Calculated results for the pollutant styrene and acetone (C in Ac
=750 mg.m-3
). ................... 65
Table II-1- Biomass changes during the reactor operation ........................................................ 67
Biofiltration of Air/Styrene and Air/Styrene/Acetone mixtures in a bubble column reactor
ix
List of abbreviations and symbols
Ac- Acetone
C Ac – Acetone concentration (mg.m-3)
OL Ac- Acetone organic loading rate (g.m-3.h-1)
Vf-air velocity (m/h)
BSM- Basal Salt Medium
Xf –Biomass (g.L-1)
Xdm –biomass dry weight concentration (g.L-1)
BF - biofilter
BSC – bioscrubber filter
BTF- biotrickling filter
CAS- Chemical Abstracts Service
C- Concentration (mg.m-3)
DOC-dissolved oxygen content(mg/L)
EBRT- empty bed residence time (s)
V- Empty bed volume (m3)
Vevap- evaporation volume (mL)
GC- gas chromatography
Q- Gas velocity (m/h)
C in Ac-inlet acetone concentration (mg.m-3)
C in-inlet concentration (mg.m-3)
EC in-inlet elimination capacity (g.m-3.h-1)
C in Sty-inlet styrene concentration (mg.m-3)
H- level height (m)
H- liquid level height
m- mass (g)
M- molecular mass
OL- organic loading rate (g.m-3.h-1)
C out Ac-outlet acetone concentration (mg.m-3)
C out- outlet concentration (mg.m-3)
EC out-outlet elimination capacity (g.m-3.h-2)
C out Sty-outlet styrene concentration (mg.m-3)
EC w- overall elimination capacity (g.m-3.h-2)
OL w- overall organic loading rate (g.m-3.h-1)
Vt- Overall volume reactor (m3)

Biofiltration of Air/Styrene and Air/Styrene/Acetone mixtures in a bubble column reactor
x
PA- Pseudomonas
RE- Removal efficiency (%)
RA- Rose- Bengal
ST- standard
Sty- Styrene
C sty – Styrene concentration (mg.m-3)
OL Sty- Styrene organic loading rate (g.m-3.h-1)
VOC- volatile organic compounds
Vg-volumetric flow (L/min)
VL- working volume (mL)

Biofiltration of Air/Styrene and Air/Styrene/Acetone mixtures in a bubble column reactor
1
1 Introduction
Since the Industrial revolution humankind is particularly concerned at new discoveries,
which make life easier; consequently, different kinds of industries and technologies were
developed. Unfortunately, this progress was accomplished with environmental negative
aspects such as atmospheric pollution because of emanations from industrial plants (chemical,
petrochemical, etc.) and vehicles. In order to contradict this tendency, it is crucial to develop
measures for environmental protection and in the last decades there were being made many
scientific and technical improvements in this area.
“Industrial and Manufacturing operations release, on a large scale, VOC to the air.” [1]
Volatile Organic Compounds (VOC) are very important for the environment as they contribute
to the ozone depletion potential, creation of potential photochemical ozone, carcinogenicity,
local nuisance from odour and global warming potential. [1] The selection of a particular
technology or combination of technologies, for the treatment of VOCs, depends on such
factors as: foul air flow rates, site characteristics including operation and preservation
capabilities, treatment objectives, the characteristics and strength of air odors, and
contaminant loading patterns. [2] New treatment techniques have been developed over the
years, so that nowadays in developed countries, biological degradation of pollutants through
microorganisms to treat the contaminated environment is being often used. One of the main
advantages of biological degradation is a decline of biological wastes generation, compared to
conventional techniques. Xanthobacter, Pseudomonas are, among others, excellent examples
of microorganisms very useful and suitable for VOC pollutants depletion and environment
treatment, as these pollutants belong to the microorganisms’ food chain. The compounds with
the best biodegradability are the ones with low molecular weight, with simple bond structures
and those that are highly soluble. “The contaminants are degraded into innocuous, less-
contaminating products or all the way to carbon dioxide and water.”[3] In this case, in order to
prevent a climb of carbon dioxide (greenhouse gas) release as a result of VOC treatment that
would contribute to the greenhouse effect and would lead to the global warming, biological
methods are not appropriated to use in case of high VOC concentrations. [3]. In other words,
these biological treatments are only strongly efficient and suitable in case of low VOC
concentrations.
In the present work an experimental study is presented where the removal of two VOC
from air: styrene and acetone, is performed in a biological reactor, at laboratory scale.

Biofiltration of Air/Styrene and Air/Styrene/Acetone mixtures in a bubble column reactor
2
2 State of the Art
As previously referred the gaseous contaminants considered in this work were styrene
and acetone. In this chapter some of their characteristics are described as well as the
possibilities of their microbial degradation.
2.1 Pollutants characteristics
2.1.1 Styrene
Styrene is a colorless oily liquid with a water solubility value of 310 mg/L at 25ºC, which
evaporates easily (its melting and boiling points are -30.6ºC (242.6 K) and 145ºC (418.15K)
and doesn’t dissolve appreciably in water. It´s soluble in organic solvents, it has a sweet odour
at low concentration, but can have a sharp unpleasant smell at high concentrations [4, 5].
Figure 2-1 represents the chemical structure of styrene. The chemical and molecular
formulas are, respectively, C6H5CH=CH2 and C8H8 (M= 104.15 g/mol) its density, in liquid state
is 0.906 g/cm3 (T= 20ºC). The styrene Chemical Abstracts Service (CAS) number’s 100-42-5
[6].
Figure 2-1- Chemical structure of styrene [7]
Biofiltration of Air/Styrene and Air/Styrene/Acetone mixtures in a bubble column reactor
3
Styrene is a predominantly man-made chemical used for plastics manufacture,
although low levels of this compound also occur naturally in a variety of foods such as fruit,
vegetables, nuts and meats. General population exposure levels are usually orders of
magnitude lower than occupational exposure levels. It is a commercially important chemical
used in a wide variety of chemical processes, it´s the most used aromatic hydrocarbon in
chemical industries, a basic building block for the plastic polystyrene, latex among others.
Huge quantities of styrene are produced to make products such as rubber, plastic, resins,
insulation, fiberglass, pipes, automobile parts, food containers and carpet backing. Styrene is a
compound which easily liberates itself for the atmosphere. The atmosphere is the major sink
for styrene losses and wastes. [8, 4]
Styrene is a VOC, which can contribute to the formation of harmful ground-level ozone
and can enter the environment during the manufacture, use and disposal of styrene-based
products. Significant sources of release are from emissions and effluents emitted during the
production process and its use in polymer manufacture, e.g. adhesives and sealants
industries. It may also be released from manufacturing processes, cigarette smoke, and stack
emissions from waste incineration. There are also a few very minor natural sources of styrene
in the environment. Styrene can be found in air, water and soil. It is quickly broken down in the
air, usually within 1 to 2 days. It evaporates easily from soils and surface water, and is broken
down by bacteria. It is not expected to build up in animals. It does not bind well to soils and
may leach to groundwater, but its rapid breakdown minimizes this process. As a VOC it can be
involved in reactions with other air pollutants that form ground-level ozone, which can cause
damage to crops and materials as well as having potential effects on human health. [4]
2.1.2 Acetone
Acetone is an organic compound completely soluble in water at 20ºC. It is a colorless
liquid with sweetish smell and a distinctive taste. The greatest danger regarding acetone use is
that it poses a serious fire hazard. It has a flash point of -20ºC (253.2 K). The melting point is -
95.4 ºC (177.8 K) and the boiling point 56.2ºC (329.4 K) at 1 atm.
Figure 2-2 represents the chemical structure of acetone. The chemical and molecular formulas
are CH3-CO-CH3 and C3H6O (M= 58.08 g/mol). Its density in liquid state is 0.789 g/cm3
(T= 20ºC).The acetone CAS number’s 67- 64-1.

Biofiltration of Air/Styrene and Air/Styrene/Acetone mixtures in a bubble column reactor
4
Figure 2-2- Chemical structure of acetone [9]
Acetone is the simplest and most important of the ketones. It is a colourless liquid with
a mildly pungent and somewhat aromatic odour. It is primarily used as a chemical intermediate
and as a solvent for cellulose acetate and nitrocellulose. It is used as a carrier for acetylene,
and as a raw material for the chemical synthesis of a wide range of products such as ketene,
methyl methacrylate, bisphenol A, diacetone alcohol, mesityl oxide, methyl isobutyl ketone,
hexylene glycol, and isophorone. This compound is a mobile, flammable liquid that is miscible
in all proportions with water and with organic solvents such as ether, methanol, ethyl alcohol,
and esters. It is incompatible and reactive with oxidizers and acids. Containers of acetone may
explode in a fire, producing poisonous gases. Acetone fires may be controlled with carbon
dioxide or dry chemical extinguishers. Acetone undergoes many condensation reactions; in the
presence of an amine, or ammonia, various esters condense readily with acetone. Acetone is
considered a volatile organic compound by the U.S. Environmental Protection Agency. [10, 11]

Biofiltration of Air/Styrene and Air/Styrene/Acetone mixtures in a bubble column reactor
5
2.2 Biological treatment of waste gases containing VOC
Gaseous emissions containing volatile organic compounds (VOC) may be treated by
usual technologies, such as absorption, condensation, thermal and catalytic oxidation and
active carbon adsorption. These physical-chemical treatments present some problems,
including high costs and secondary wastes. [1] Furthermore some of these technologies
present low selectivity and insufficient values of efficiency for some VOC removal.
“Biofiltration is the removal and oxidation of organic gases (VOCs) in contaminated air
by beds of compost soil (biofilter media). “[12, 13] Biological treatment of waste gases and
specifically of gases containing VOC is an attractive alternative, with several advantages when
compared to chemical technologies. “Since the early sixties, biological processes have been
introduced as a technique for odour abatement of waste gases.” [12, 13] Currently, these
systems have a tendency of being used and developed all over the world, demonstrating their
increasing importance as a great technique for air pollution control. [12, 13]
The biological technologies used for waste gases treatment are generally referred as
“Biofiltration”. Biofiltration is a well established air pollution control technology successfully
applied in a wide variety of applications to control odors and emissions containing VOC.
Biofiltration consists in removing biologically gaseous contaminants by passing the carrier gas
through a packed bed with aerobic microorganisms. Either the organic and inorganic air
pollutants are degraded and transformed to innocuous products, such as water, carbon dioxide
and biomass. These pollutants are used as unique carbon and energy sources and,
consequently, biofiltration is limited by non toxic gases. [14]
Figure 2-3 shows the output of VOC biodegradation by the microorganisms in the
biofilter. This process is naturally involved in an environment rich in oxygen, whereby the
microorganism are classified as aerobic ones. [12]
Figure 2-3- VOC degradation [2]

Biofiltration of Air/Styrene and Air/Styrene/Acetone mixtures in a bubble column reactor
6
The efficiency of this process depends on various characteristics, such as inlet
pollutant concentration, nutrient supplies and gas residence times (gas flow rate). Nutrient
supplies must be securely provided by the biofilter media to the microorganisms. Residence
time represents the amount of time the microorganisms are in contact with the contaminated
air stream. Consequently, longer residence times produce higher efficiencies; however, the
equipment must minimize residence time to allow the biofilter to accommodate larger flow
rates. [15, 16]
Comparing air waste treatment biologically and chemically, it is possible to say that
conventional techniques (adsorption, incineration and activated carbon) are more expensive
than biological treatments. Biological treatment is environmentally friendly, generates depleted
output products to be eliminated, it has lower operating costs and doesn’t constitute a
combustion source. It has a great stability on the steady-state and is performed at room
temperatures. Moreover, biofiltration is a simple control system with restrictive energy
consumptions.
The air waste biological treatment can be divided into three different technologies:
bioscrubber, biofilter and biotrickling. “Biological treatment can be distinguished either by the
mobility of the microorganisms and the liquid fase (as in trickling filter). In biofilters and trickling
filters, the microorganisms are fixed in a support or a packing material.”[17]
2.2.1 Reactors for biofiltration
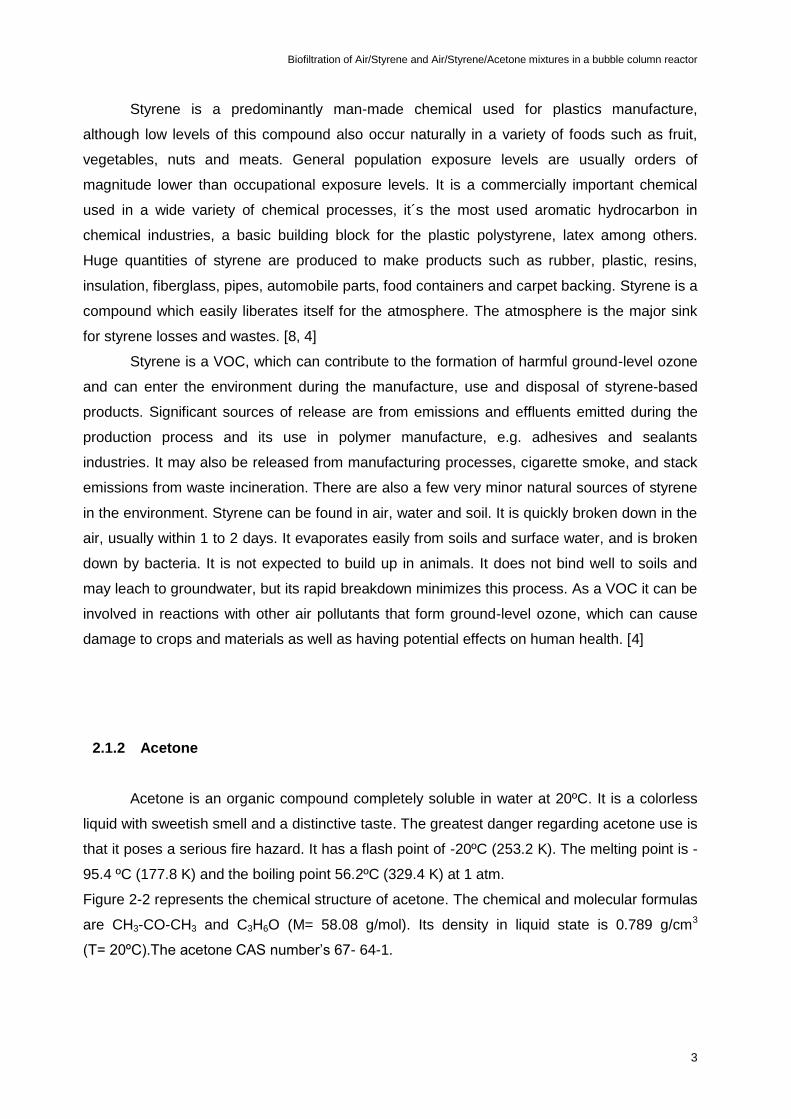
2.2.1.1 Bioscrubbing
“Bioscrubbers (BSC) use counter current gas-liquid spray columns with
microorganisms freely suspended in the aqueous phase.”[18]
“A bioscrubber basically consists of a scrubber and a deposit vessel.” [19] As soon the
absorption process is over, the organic compounds of the waste gas must be removed from
the absorbent. The major advantages of the absorbent regeneration are its influence on the
cleaning efficiency and on the energy consumption of the absorber. This regeneration is
carried out by the microbial species, which use the scrubbed gas compounds as a nutriment.
[19]
There are several scrubber designs in the BSC system such as: tower packing, gas
bubble, bottom column, spraying or nozzle scrubber. In this work, the biofiltration was
developed and studied with the use of bubble column reactor. [20]
Biofiltration of Air/Styrene and Air/Styrene/Acetone mixtures in a bubble column reactor
7
Next figure 2-4 represents an example of a design of the system and its parameters.
Figure 2-4- Design and control parameters [21]

Biofiltration of Air/Styrene and Air/Styrene/Acetone mixtures in a bubble column reactor
8
In table 2-1, the main advantages and disadvantages of BSC are presented.
Table 2-1- Summary of the main characteristics of bioscrubbers for odour treatment
biotechnologies [2]
Advantages Disadvantages
Bioscrubbing is more easily controlled
because the pH, temperature, nutrient
balance, and removal metabolic
products can be altered in the reactor.
Reliant on good gas dissolution, thus,
it removes only highly soluble
contaminants efficiently (gaseous
pollutants with an air/water partition
coefficient of less than 0.01)
Removal of the products of pollutant
degradation by washout ( thus,
avoiding of the biomass)
Biomass growth has to be controlled
to reduce solid waste output and to
increase gas treatment efficiency.
Acclimation capacity of the biomass
provides efficient degradation of the
pollutants.
Controlled inputs of phosphate and
potassium in the liquid media are
required for efficient pollutant
degradation, but this is not suitable
for low concentration, wastewater
treatment- generated odorants.
Bioscrubbing is reliant on good gas
dissolution, as it employs the
absorption of pollutants into aqueous
phase in a gas/liquid exchange
column
The liquid phase bioreactor effluent is
recirculated into the absorption
column, providing excellent gas
cleaning of highly soluble pollutants.
Biofiltration of Air/Styrene and Air/Styrene/Acetone mixtures in a bubble column reactor
9
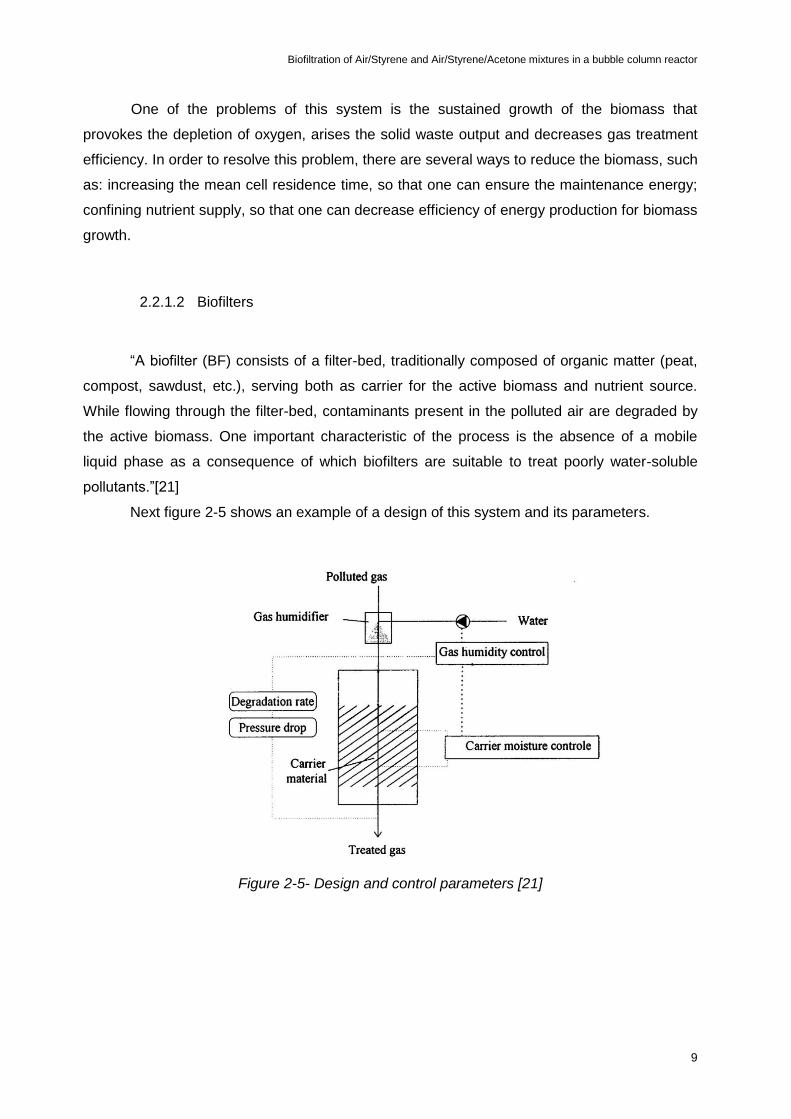
One of the problems of this system is the sustained growth of the biomass that
provokes the depletion of oxygen, arises the solid waste output and decreases gas treatment
efficiency. In order to resolve this problem, there are several ways to reduce the biomass, such
as: increasing the mean cell residence time, so that one can ensure the maintenance energy;
confining nutrient supply, so that one can decrease efficiency of energy production for biomass
growth.
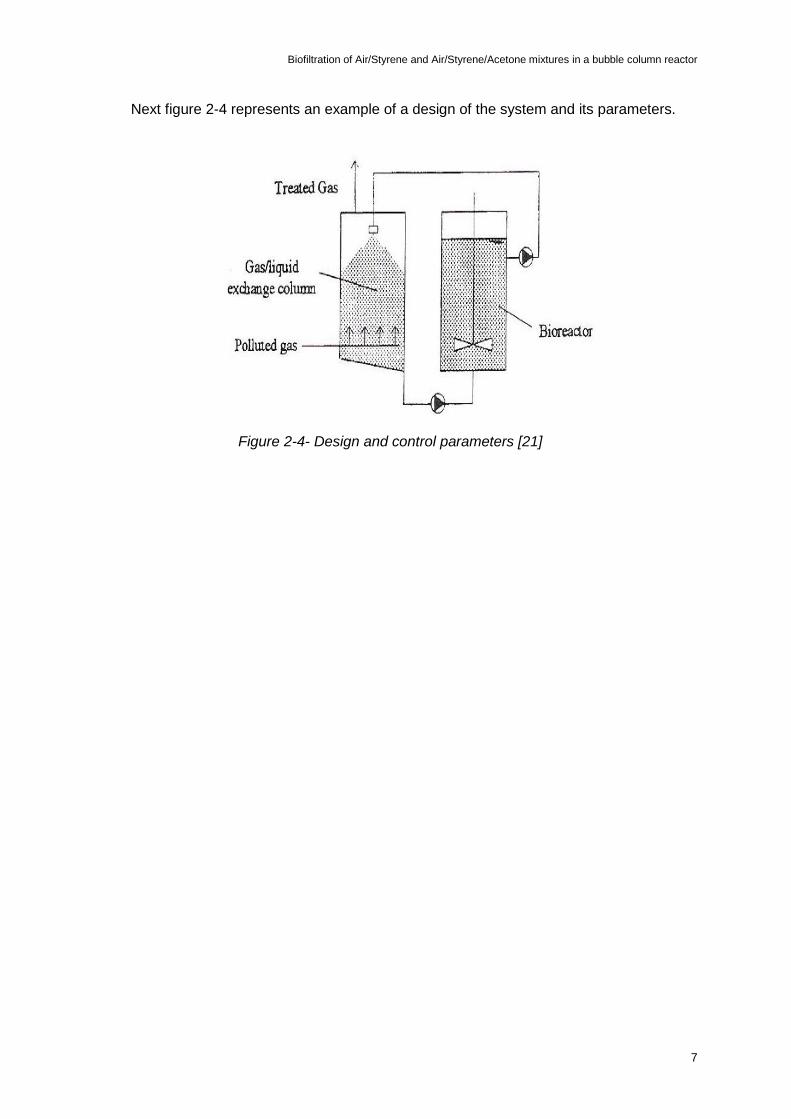
2.2.1.2 Biofilters
“A biofilter (BF) consists of a filter-bed, traditionally composed of organic matter (peat,
compost, sawdust, etc.), serving both as carrier for the active biomass and nutrient source.
While flowing through the filter-bed, contaminants present in the polluted air are degraded by
the active biomass. One important characteristic of the process is the absence of a mobile
liquid phase as a consequence of which biofilters are suitable to treat poorly water-soluble
pollutants.”[21]
Next figure 2-5 shows an example of a design of this system and its parameters.
Figure 2-5- Design and control parameters [21]

Biofiltration of Air/Styrene and Air/Styrene/Acetone mixtures in a bubble column reactor
10
Unlike the BSC system, there is only in BF system one stage where adsorption and
biodegradation by microorganisms occur (column containing a material of immobilized
microorganisms); the liquid phase is stationary (biofilm).
BF is often a high efficient and cheap system comparing with other atmospheric
pollutants control technologies.
Table 2-2 summarizes the main advantages and disadvantages of biofiltration.
Table 2-2- Summary of the main characteristics of biofiltration for odour treatment [2]
Advantages Disadvantages
Simple, flexible design with low
capital costs
Design criteria still developing
Good for treating high volumes of low
concentration sulphurous odorants
Large land area required
99% removal efficiency in streams
containing aldehydes, organic acids,
sulphur dioxide, nitrous oxides, and
hydrogen sulphide
>15 ppmH2S can lead to rapid
acidification of the biofilter media
90% removal of methane, propane,
and isobutene.
Dissolution of gas into liquid is the
rate- limiting step, so long gas
residence times are required
Compounds with air/water partition
coefficients of up to 10 can be treated
in recirculating biofilters because the
residence time 930-60s and specific
surface area (300-1000m2/m3) are
both high.
Large media bed volumes are
required to obtain such a long gas
residence time, and operational
control is limited, as there is no liquid
phase involved.

Biofiltration of Air/Styrene and Air/Styrene/Acetone mixtures in a bubble column reactor
11
2.2.1.3 Trickling biofilters
“Waste gas treatment in trickling biofilter (BTF) involves the use of a biological filter
continuously fed with a liquid medium and packed with a synthetic carrier on which a biofilm
grows.” [21] The polluted gas passes through the carrier material, counter-currently to the
mobile liquid phase, which ensures nutrient supply to the microorganisms. “Fresh medium fed
to the reactor may be mixed with drain water recirculated to the system. “[21]
Next figure 2-6 shows an example of a design of this system and its parameters.
Figure 2-6- Design and control parameters [21]
BTF is a suitable and efficient technology for air treatment when working with high inlet
loads of VOC. The BTF is an aerobic bioreactor composed by inert materials that can ensure
a support for the biofilm. “In the BTF, a nutrient solution is trickled downwards trough the bed
while the counter current undergoing treatment gases effluent flows upward”. [22]
Like the BF system, there is in BTF system only one stage where adsorption and
biodegradation by microorganisms occur (column containing a material of immobilized
microorganisms); nevertheless, unlike the BF system, the liquid phase is not stationary.
“BTF present similar advantages to BSC: (i) easy control of biological process, (ii) easy
elimination of reaction products by washing-out and (iii) good adaptation capacity of the active
biomass.” However BTF are not so frequently applied as BF systems nowadays. [21]
Table 2-3 summarizes the main advantages and disadvantages of BTF.

Biofiltration of Air/Styrene and Air/Styrene/Acetone mixtures in a bubble column reactor
12
Table 2-3- Summary of biotrickling filters characteristics for odour treatment [2]
Advantages Disadvantages
Simple, flexible design Design criteria still developing
Low capital costs, especially where
existing trickling filters can be used
Dissolution of gas into liquid is the rate-
limiting step, so long gas residence times
are required, necessitating recirculation of
foul air.
Acidification slower in nitrifying filters and
with calcareous filter media (such as
mussel shells- good buffering capacity to
counteract acidification)
Media require regular replacement
( high costs)
Only approximately 60% hydrogen
sulphide removal efficiency
Increased structure maintenance
(corrosion concrete units).
Accumulation of excess biomass in the
media bed reduces the specific surface area and bed volume and causes pressure drop, resulting in performance fall- off or requiring control techniques which compromise long- term performance.
Biofiltration of Air/Styrene and Air/Styrene/Acetone mixtures in a bubble column reactor
13
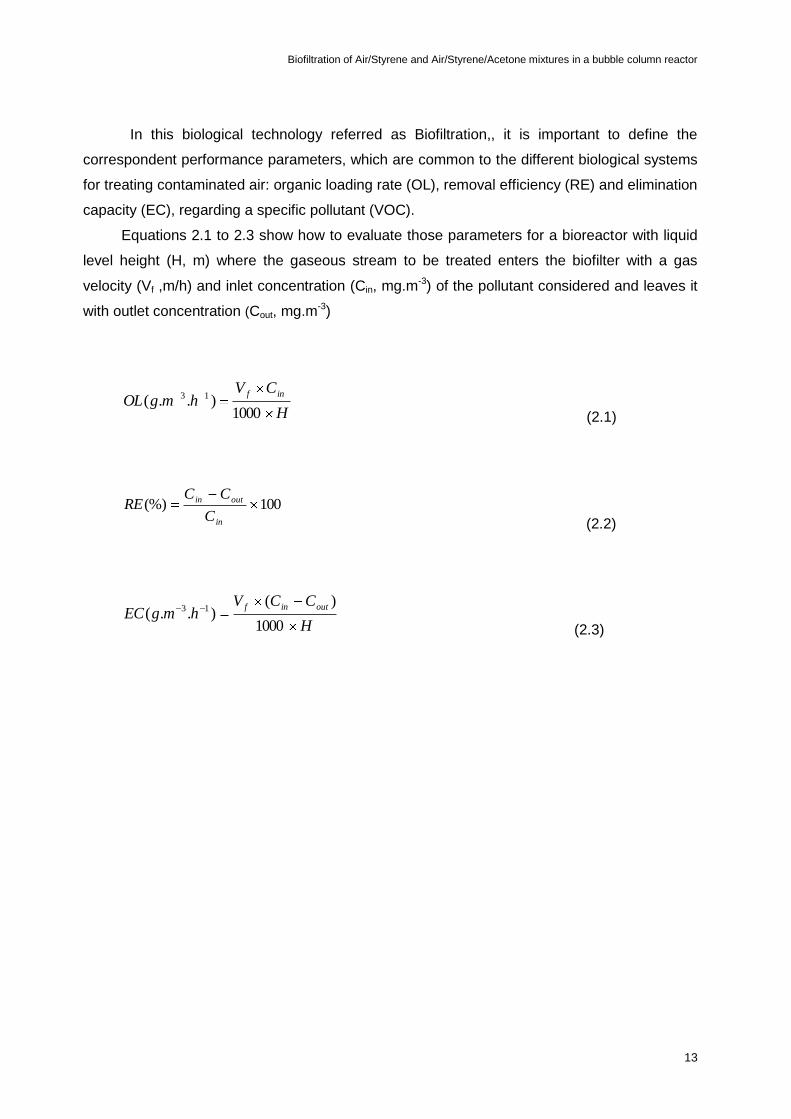
In this biological technology referred as Biofiltration,, it is important to define the
correspondent performance parameters, which are common to the different biological systems
for treating contaminated air: organic loading rate (OL), removal efficiency (RE) and elimination
capacity (EC), regarding a specific pollutant (VOC).
Equations 2.1 to 2.3 show how to evaluate those parameters for a bioreactor with liquid
level height (H, m) where the gaseous stream to be treated enters the biofilter with a gas
velocity (Vf ,m/h) and inlet concentration (Cin, mg.m-3) of the pollutant considered and leaves it
with outlet concentration (Cout, mg.m-3)
H
CVhmgOL
inf
1000)..( 13
(2.1)
100(%)in
outin
C
CCRE
(2.2)
H
CCVhmgEC
outinf
1000
)()..( 13
(2.3)

Biofiltration of Air/Styrene and Air/Styrene/Acetone mixtures in a bubble column reactor
14
2.2.2 Microorganisms used for biofiltration
2.2.2.1 Styrene microbial degradation
Styrene is more and more used in chemical industry as a starting material in the
production of synthetic polymers. It can also appear in the nature as a result of decarboxylation
of cinnamic acid. It is very easy to transport styrene at low concentrations in the air. A major
problem implicit to the transport of styrene is that styrene, as a toxic and carcinogenic gas,
spreads easily and can prejudice human health. “In 1992, the annual worldwide production of
styrene was estimated to be over 16 milion metric tons.” [23, 24] Gaseous styrene emission or
effluent from industries and manufactures have been growing over the decades. Therefore,
there are microorganisms in the nature that are capable to degrade styrene and are, thus,
crucial to reduce the reported gas concentration in the air. [23, 24]
Some microorganisms can generate styrene, like Pichia carsonni which produces
styrene from a ground fish decomposition product. [25]
Styrene degradation is possible with other microorganisms such as Xanthobacter Py2.,
Pseudomonas sp, Nocardia sp., Enterobacter, Rhodococcus and Corynebacterium species as
well as the black yeast Exophiala jeanselmei. [24, 14, 26]
2.2.2.2 Aerobic styrene degradation
By using the Pseudomonas sp. for its biodegradation, it would be possible to remove
styrene from industrial gases. However, there is little information about styrene microbial
metabolism. The Pseudomonas sp. represents the best group capable of degrading styrene
and produce styrene mono-oxygenase (very important for the degradation of styrene). [23, 11]
In order to get some information about styrene degradation, it was found in literature
two references, which will be forwards described. The first reference says: “The only
information about the organization of the styrene catabolic genes has been recently obtained
for Pseudomonas fluorescens ST. This strain degrades styrene oxidation of its lateral chain
and it has been shown that the upper pathway for the conversion of styrene to phenylacetate is
encoded by four catabolic genes styABCD(…) The genes responsible for the catabolism of
phenylacetate (lower pathway) remain to be investigated”. [23, 25]
Biofiltration of Air/Styrene and Air/Styrene/Acetone mixtures in a bubble column reactor
15
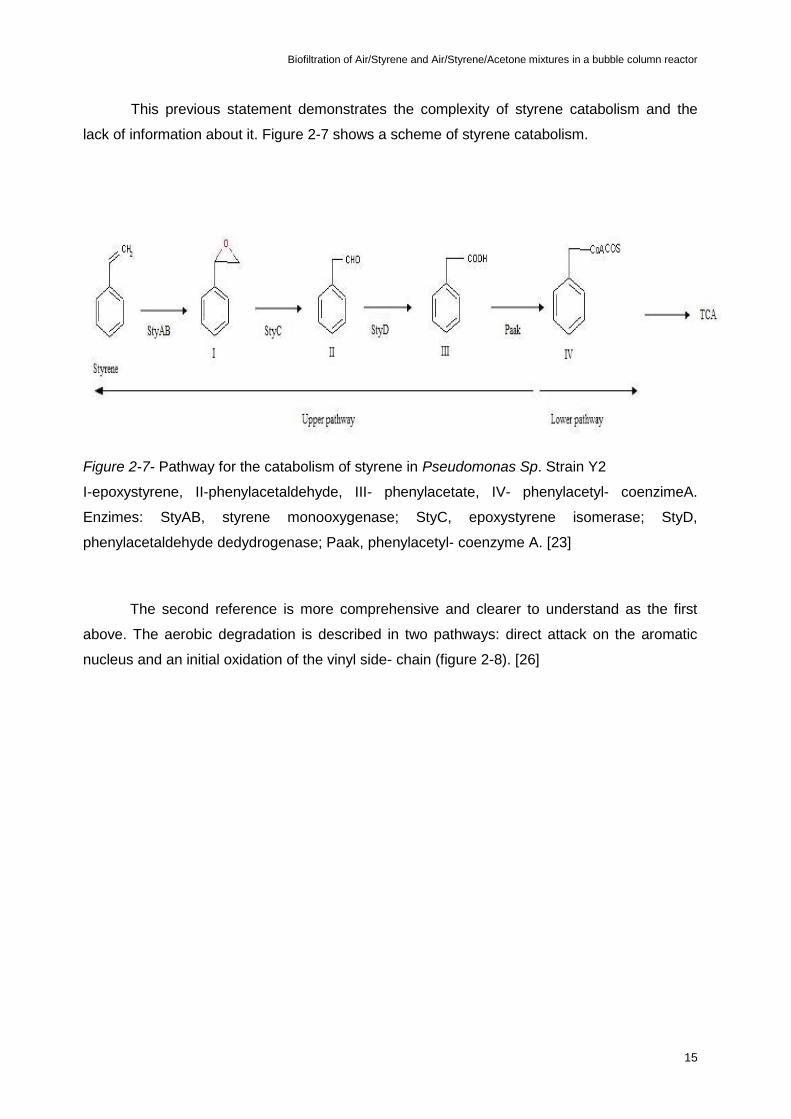
This previous statement demonstrates the complexity of styrene catabolism and the
lack of information about it. Figure 2-7 shows a scheme of styrene catabolism.
Figure 2-7- Pathway for the catabolism of styrene in Pseudomonas Sp. Strain Y2
I-epoxystyrene, II-phenylacetaldehyde, III- phenylacetate, IV- phenylacetyl- coenzimeA.
Enzimes: StyAB, styrene monooxygenase; StyC, epoxystyrene isomerase; StyD,
phenylacetaldehyde dedydrogenase; Paak, phenylacetyl- coenzyme A. [23]
The second reference is more comprehensive and clearer to understand as the first
above. The aerobic degradation is described in two pathways: direct attack on the aromatic
nucleus and an initial oxidation of the vinyl side- chain (figure 2-8). [26]

Biofiltration of Air/Styrene and Air/Styrene/Acetone mixtures in a bubble column reactor
16
Figure 2-8- A summary of the major pathways of bacterial styrene degradation. The number(s)
associated with each pathway identifies the organism(s) that have been shown to perform the
particular transformation: 1, P. putida CA-3; 2, Xanthobacter strain 124X; 3, Xanthobacter
strain S5; 4, P. fluorescens ST; 5, Pseudomonas sp. strain Y2; 6, Corynebacterium strain ST-
10; 7, Rhodococcus rhodochrous NCIMB 13259. Dotted lines indicate proposed degradative
routes yet to be formally demonstrated. [26]
Biofiltration of Air/Styrene and Air/Styrene/Acetone mixtures in a bubble column reactor
17
Side chain oxidation
“The side-chain oxidation pathway involves epoxidation of the vinyl side-chain by a
flavin adenine dinucleotidependent, two-subunit monooxygenase followed by isomerisation of
the epoxystyrene formed to phenylacetaldehyde (PAAL). This compound is subsequently
oxidised to phenylacetic (PAA) (...). This conversion of styrene to PAA is generally referred to
as the upper pathway of styrene degradation and appears to operate in many of the bacterial
strains studied to date; examples include Pseudomonas putida, Xanthobacter strain 124X,
Xanthobacter strain S5, Pseudomonas fluorescences ST, Pseudomonas Sp. Strain VLBI20
and Pseudomonas Sp. Strain Y2(…) The lower pathway is thought to involve the conversion
of PAA to Krebs cycle intermediates but this has not been formally demonstrated in any
styrene-degrading bacterium thus far.”[26]
Direct ring cleavage
Rhodococcus rhodochrous NCIMB 13259, a chemical dump isolate capable of growth
on a diverse range of aromatic hydrocarbons, degrades styrene via direct oxidation of the
aromatic nucleus.(…) An NAD+-dependent cis-glycol dehydrogenase activity was detected in
cells grown on nutrient broth and styrene. Cells grown under these conditions were also able
to oxidise toluene cis-glycol.(…) 3-Vinylcatechol is further degraded via meta-cleavage to
acetaldehyde and pyruvate.(…) Evidence of direct ring cleavage has also been reported in P.
putida MST and Xanthobacter strain 124.(…)”[26]
2.2.2.3 Acetone microbial degradation
Acetone belongs to ketones class and is a toxic organic compound. Acetone vapors
reduce oxygen concentration in the air, inducing a stifling and extremely explosive
environment. When these vapors are inhalated, they can cause irritation to mucous
membrane. Inhalation of higher concentration may cause a headache, nausea, confusion,
drowsiness, convulsions and coma.
There is a variety of anaerobic and aerobic bacteria that grow up using acetone as a
source of carbon and energy, in spite of acetone’s toxicity. “While the biological production and
consumption of these compounds has been well-documented, the bioquimical pathways and
enzymes involved in their catabolism have only recently investigated.”[28, 29, 30]

Biofiltration of Air/Styrene and Air/Styrene/Acetone mixtures in a bubble column reactor
18
With regard to anaerobic catabolism, it “appears to involve an initial carboxylation of
acetone to acetoacetate (…), followed by thiolytic cleavage to two acetyl-CoA residues.”
Furthermore, “carboxylation reactions appear to play a role in a number of anaerobic
transformations…”, although these reaction are to date not well known. In many bacteria such
as Desulfococcus biacutus, Rhodocyclus gelatinosus among others, these reactions take
place.
Towards aerobic catabolism, “for some aerobic bacteria, the metabolism of acetone
has been proposed to proceed via an O2- and reductant-dependent hydroxylation reaction
producing acetol-(1-hydroxyacetone) as the initial product.” It was found in literature that in
aerobic enrichment cultures with acetone as substrate, “Gram-positive bacteria were isolated
which attack acetone by oxygenase-dependent oxidation to acetol.”[30, 31]
There are even bacteria, such as Xanthobacter strain Py2, that are capable of
degrading acetone either in aerobic and anaerobic metabolisms and are “capable of growth by
using acetone as a source of carbon and energy”.[29]
2.2.2.4 Aerobic acetone degradation
The aerobic pathway of acetone degradation is shown in figure 2-7. Acetone is oxidized
to acetol, then degraded to acetic acid or to pyruvate or to formic acid and finally to carbon
dioxide and water. Various microorganisms can degrade acetone after initial carboxylation to
acetoacetate, (mechanism shown in figure 2-8).

Biofiltration of Air/Styrene and Air/Styrene/Acetone mixtures in a bubble column reactor
19
Figure 2-9- Aerobic degradation of acetone [2]
Figure 2-10- Carboxylation of acetone [2]
Biofiltration of Air/Styrene and Air/Styrene/Acetone mixtures in a bubble column reactor
20
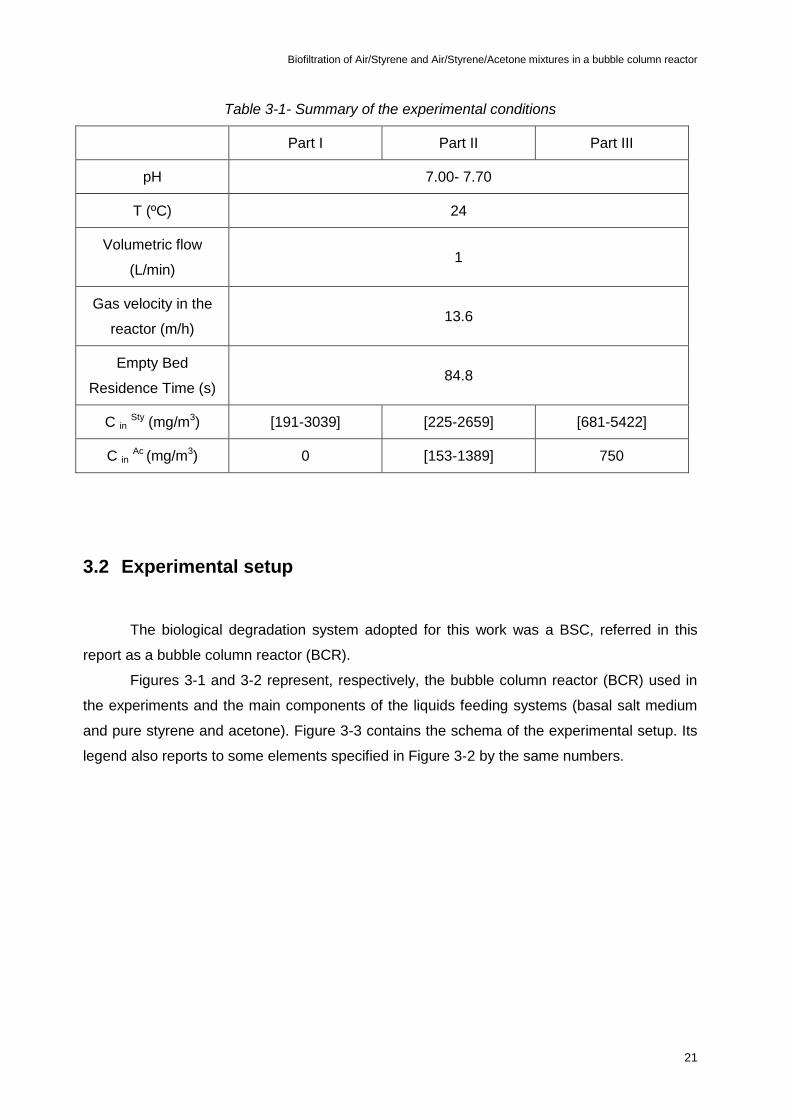
3 Experimental
3.1 Introduction
A bubble column reactor (BCR) was used to study the microbiological degradation of
styrene and/or acetone in air streams.
. These two compounds, available as pure liquids (99% purity) were vaporized
(separately or together) in air streams, in order to study the effect of VOC concentration. The
liquid used for microorganisms culture and suspension was a basal salt medium (BSM),
usually adopted in the laboratory, and described in table3-2. The microbiological species were
discovered and identified through the preparation of different cultures, wherein in different
species of microorganisms grow up. The identity of these species is described in “Results and
discussion” section and the culture preparation is described in section 3.3.1.
A fixed volume of biomass suspension media (1.5 L) was used for all experiments. The
total gas flow rate was kept the same in all experiments. The pH value of the suspension and
the temperature were controlled and kept constant.
Three sets of essays were performed, in which the influence of concentration and
composition of VOC mixture were studied (see section 3.4).
The monitoring of gas flow rate, pH, temperature (T), and dissolved oxygen was made
continuously in each experiment.
In table 3-1 the range of values for the different variables and parameters are
summarized for the three experimental parts.
Biofiltration of Air/Styrene and Air/Styrene/Acetone mixtures in a bubble column reactor
21
Table 3-1- Summary of the experimental conditions
Part I Part II Part III
pH 7.00- 7.70
T (ºC) 24
Volumetric flow
(L/min) 1
Gas velocity in the
reactor (m/h) 13.6
Empty Bed
Residence Time (s) 84.8
C in Sty (mg/m3) [191-3039] [225-2659] [681-5422]
C in Ac (mg/m3) 0 [153-1389] 750
3.2 Experimental setup
The biological degradation system adopted for this work was a BSC, referred in this
report as a bubble column reactor (BCR).
Figures 3-1 and 3-2 represent, respectively, the bubble column reactor (BCR) used in
the experiments and the main components of the liquids feeding systems (basal salt medium
and pure styrene and acetone). Figure 3-3 contains the schema of the experimental setup. Its
legend also reports to some elements specified in Figure 3-2 by the same numbers.

Biofiltration of Air/Styrene and Air/Styrene/Acetone mixtures in a bubble column reactor
22
Figure 3-1- Bubble column reactor (BCR)
Biofiltration of Air/Styrene and Air/Styrene/Acetone mixtures in a bubble column reactor
23
Figure 3-2- Feeding systems of basal salt medium (BSM) and pure styrene and
acetone
1-air inlet; 2- air flowrate control
valve; 3-flow regulation, 4- pure
styrene or acetone; 5- syringe
pump, 6- flowmeters, 7-
reactor,8- drain valve, 9-gas
sampling point ,10- liquid
sampling point,11- gas outlet 12-
sensors (pH, O2, T) ,13- air
distribution, 14- potassium
hydroxide solution, 15- BSM
solution.
Figure 3-3 - Schematic representation of the experimental apparatus
4
5
16
12
Biofiltration of Air/Styrene and Air/Styrene/Acetone mixtures in a bubble column reactor
24
The bioreactor used is a glass cylinder with 75mm internal diameter, 620 mm height
and 0.442 dm2 crosscut area.
As it can be seen in Figure 3-3 the gas inlet is situated in the bottom of the BCR. The
gas stream is obtained (at the desired composition) by mixing air with vaporized acetone
and/or styrene (4, 5) and the gas flowrate is adjusted by means of control valves (2, 3, and 10)
and flowmeters (6)
The BCR contains one sampling point (10) for the biomass suspension, situated at 25
cm height.
The addition of liquids (BSM solution and reagents for pH adjustment) is made in the
top of the reactor. For the addition of BSM a STAVEBNI COVÉ CERPABLO, pump was used;
for acetone and/or styrene a GILSON V= 100 µL, SYRINGE PUMP 402. The solution of KOH
was fed to the BCR by means of a pump STAVEBNI COVÉ CERPABLO SC4
The BCR has also placings for some sensors for the pH, dissolved oxygen and
temperature. The sensors used in this study were: electrode MPH 66 Insa was set 7, 0±0.1 for
pH, MULTIMET INSA MFD 77 for the dissolved oxygen and MULTIMET INSA for the
temperature.
The BCR operation was automatized and all the monitoring and control equipment
were connected to a computer, where specific software allowed the changing of operating
conditions and the online monitoring of all important parameters and variables.
Two sampling points for gas were available, for BCR inlet and outlet streams.
3.3 Experimental procedure
3.3.1 Biomass
One of the main elements for the experimental study was the biomass needed for VOC
degradation. The cells used for starting the bubble column reactor (BCR) came from another
biological reactor in the laboratory. This biofilter (BF) has been working during the last 3 years
with streams of air, styrene and acetone.
The microbial cultures for the BCR were prepared in Erlenmeyer flasks with mineral
medium (BSM) and further mixed in a rotary shaker.
Biofiltration of Air/Styrene and Air/Styrene/Acetone mixtures in a bubble column reactor
25
3.3.1.1 Basal Salt Medium (BSM)
The composition of the culture media (BSM) used in the experiments is described in
table 3-2. The composition of the trace elements (V= 50µL) is represented in table 3-3.
Table 3-2- Composition of the basal salt medium (BSM)
Component Concentration (g/l)
(NH4)2SO4 1,5
KNO3 0,5
K2HPO4 4,3
KH2PO4 3,4
MgCl2.6H2O 0,34
Trace elements See table 3-3
Table 3-3- Composition of trace elements, V= 50µL (BSM)
Component Concentration (g/l)
FeSO4.7H2O 1,5
ZnSO4.7H2O 0,5
MnSO4 0,1
CuSO4 4,3
COCl2 3,4
NaBO2 0,02
Biofiltration of Air/Styrene and Air/Styrene/Acetone mixtures in a bubble column reactor
26
3.3.1.2 Characterization of microbiological species present in the BCR
The characterization of biomass was performed twice, during all the experimental
study, at the end of Part I and at the end of Part II (see Table 3-1).
In order to identify and quantify the species present in the microbial medium used in the
BCR, some cultures were tested using different media as follows:
RB: ROSE BENGAL CHLORAMPHENICOL AGAR, with 100 mg/l chloramphenicol. The
microorganisms developed in this culture are only eucariotes.
PA: PSEUDOMONAS AGAR BASE, with cetrimide 10.0 mg/l and cephalosporin
50.0mg/l).
ST: STANDARD PLATE COUNT AGAR (APHA). This culture allows determining the
total number of microorganisms in the reactor.
AGAR BACTERIOLOGICAL (AGAR NO 1) (LP 11 B). This is a clean culture, for which
the gaseous components being studied (air+styrene: BSM Sty, air+acetone: BSM Ac and
air+ styrene+ acetone: BSM Ac+Sty) were used as substrate for microbiological growth.
For each characterization, a 5ml sample was taken from the liquid in the reactor (BCR)
and it was mixed with 25ml of BSM. Afterwards, all the volume (30 ml) was placed in a test tub
to prepare different dilutions as presented in Table 3-4. The cultures were kept in a laboratory
for two days at 25ºC.
Table 3-4- Number of samples analyzed for the different cultures and different dilutions
100 1000 10000 100000
RB 1× 2× 1×
PA 1× 2× 1×
ST 1× 2× 1x
BSM Ac 1x 2× 1×
BSM Sty 1× 2× 1×
BSM Ac+Sty 1× 2× 1×
Biofiltration of Air/Styrene and Air/Styrene/Acetone mixtures in a bubble column reactor
27
Besides the characterization described above, during the experimental study the
biomass used in the BCR had to be monitored. Several measurements of optical density and
dry mass were made (see section 3.5) in order to evaluate the biomass concentration and
make some adjustments wherever needed.
3.3.2 Experiment description
The experimental apparatus was automatized and its operation was possible by using
specific computer software.
At the beginning of the experimental essays of VOC degradation, the prepared biomass
suspension (1.5 L) was taken from the rotary shaker and added to the BCR, keeping the liquid
level in the reactor (without gas bubbling) at 0.32 m. The values of BCR operating temperature
and pressure were constant (24ºC and 1 atm) as well as the total gas flowrate (1 L/min). Using
the computer software, the desired inlet gas composition for each experiment was established.
The stabilisation of inlet gas stream composition took some time and several samplings
and analysis by gas chromatography were made until a stable value was obtained (see section
3.4.1). At this time, sampling of the outlet gas was started in order to analyse its composition
(see section 3.4.1)
The experiment was run until the stabilization of the outlet gas composition. The
stabilised values were registered.
Meanwhile, all the important parameters were monitored and their values adjusted if
necessary. The pH value was corrected by addition of KOH solution and more rarely by a few
drops of acid.
As already referred, a first series of experiments was planned with mixtures of air and
styrene (Part I, in table 3-1). From one experiment to the following only the inlet gas
composition was changed. All other parameters were kept constant. The experiments were run
sequentially with increasing concentrations of styrene. At the end of this series, the BCR was
“cleaned” until the styrene level at the outlet gas came to zero. The first set of experiments
took place in about 30 days.
For the second series of experiments, mixtures of air, styrene and acetone were used,
in the same conditions as described before (Part II, in table 3-1).
In the final set of experiments (Part III in table 3-1), mixtures of air with styrene and
acetone, with constant acetone inlet concentration (C in Ac= 750 mg.m-3), were studied.

Biofiltration of Air/Styrene and Air/Styrene/Acetone mixtures in a bubble column reactor
28
The biomass in the BCR was taken out from the reactor and centrifuged whenever
need. This was evaluated by its visual aspect and the results of optical density measurements.
The quantity of acetone in the liquid was also evaluated by HPLC a few times in the last
period of experiments (See section 3.4.2).
3.4 Analysis of VOC
3.4.1 VOC in gas streams
The analytical method used for VOC determination in gas streams was gas
chromatography. The equipment used was a gas chromatograph (Hewlett Packard 6890 N
series, California, USA) with a flame ionization detector FID, figure3.4. Gas sampling was
performed at the BCR inlet and outlet (figure 3-5) by means of a chromatographic syringe
(Microliter Syringes gastight H 1750, V= 500 µL, Hamilton CO, Reno, Nevada) and detection
temperatures was 250 ºC.
Figure 3-4- Gas chromatograph (Hewlett Packard 6890 N series, California, USA)
-
Biofiltration of Air/Styrene and Air/Styrene/Acetone mixtures in a bubble column reactor
29
Figure 3-5- Injector (Microliter Syringes, Hamilton CO, Reno, Nevada)
3.4.2 Determination of acetone in liquid medium (BSM)
As already referred (3.3.2) in specific cases and in order to complete the evaluation of
the bioreactor performance, and particularly the acetone retention time in the BSM before
degradation, it was necessary to measure the concentration of acetone in the liquid medium.
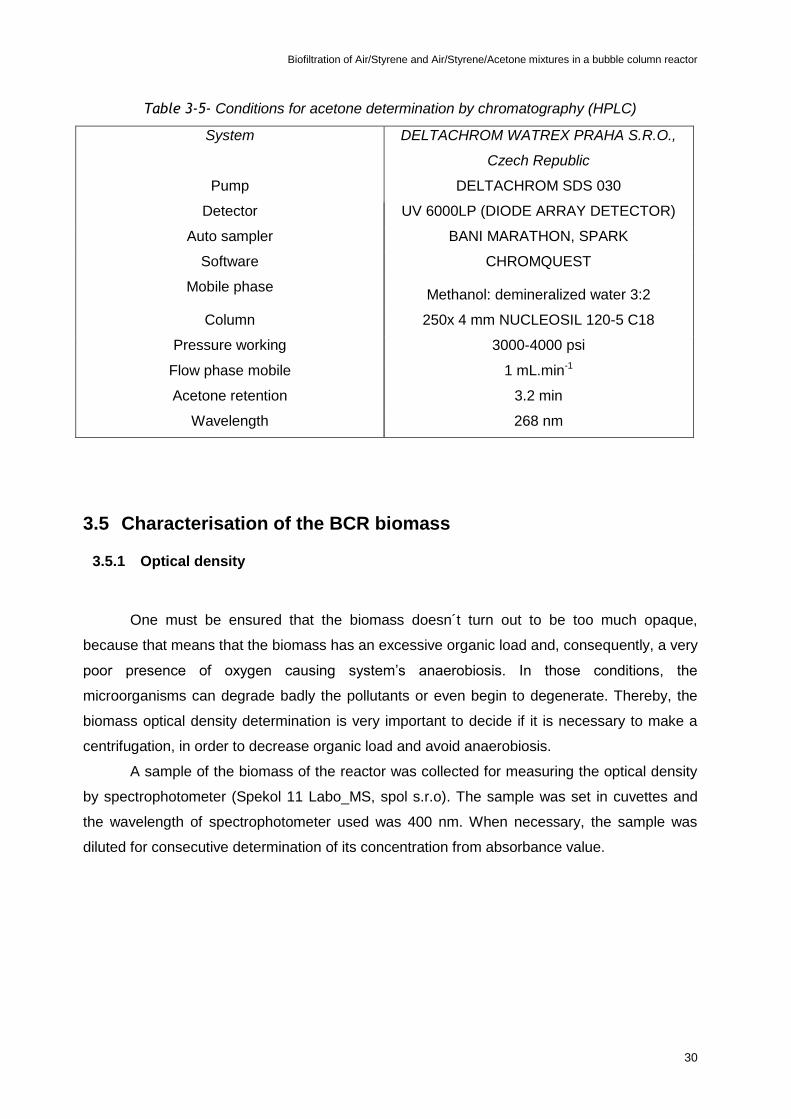
The analytical method chosen was High performance Liquid chromatography.
The liquid BSM samples from the BCR were centrifuged (Biofuge stratus, HEREAUS)
and further analyzed by HPLC (RP- HPLC_ DELTACHROM WATREX), for determination of
the quantity of acetone.
The analytical conditions are presented in table 3-5,
Biofiltration of Air/Styrene and Air/Styrene/Acetone mixtures in a bubble column reactor
30
Table 3-5- Conditions for acetone determination by chromatography (HPLC)
System DELTACHROM WATREX PRAHA S.R.O.,
Czech Republic
Pump DELTACHROM SDS 030
Detector UV 6000LP (DIODE ARRAY DETECTOR)
Auto sampler BANI MARATHON, SPARK
Software CHROMQUEST
Mobile phase Methanol: demineralized water 3:2
Column 250x 4 mm NUCLEOSIL 120-5 C18
Pressure working 3000-4000 psi
Flow phase mobile 1 mL.min-1
Acetone retention 3.2 min
Wavelength 268 nm
3.5 Characterisation of the BCR biomass
3.5.1 Optical density
One must be ensured that the biomass doesn´t turn out to be too much opaque,
because that means that the biomass has an excessive organic load and, consequently, a very
poor presence of oxygen causing system’s anaerobiosis. In those conditions, the
microorganisms can degrade badly the pollutants or even begin to degenerate. Thereby, the
biomass optical density determination is very important to decide if it is necessary to make a
centrifugation, in order to decrease organic load and avoid anaerobiosis.
A sample of the biomass of the reactor was collected for measuring the optical density
by spectrophotometer (Spekol 11 Labo_MS, spol s.r.o). The sample was set in cuvettes and
the wavelength of spectrophotometer used was 400 nm. When necessary, the sample was
diluted for consecutive determination of its concentration from absorbance value.
Biofiltration of Air/Styrene and Air/Styrene/Acetone mixtures in a bubble column reactor
31
3.5.2 Dry mass
A sample of the biomass (20.00 ml) of the reactor was centrifuged (BIOFUGE
STRATOS HERAEUS) during 20 minutes under 10000 rotation/min, twice. After the first
centrifugation, the liquid was removed and replaced by distilled water.
After the second centrifugation, the solid phase was separated and placed in a
volumetric flask (10.00 mL) and the 10.00 mL were completed with distilled water.
This biomass solution was placed in 9 platinum dishes, previously weighted. The
dishes were put in a drying oven (ZSK-1, KCW 100) for 2 hours (60 min at 70ºC and 60 min at
105ºC). After drying and back to ambient temperature (in an excicator), the dishes were
weighted, for dry mass quantification.
Biofiltration of Air/Styrene and Air/Styrene/Acetone mixtures in a bubble column reactor
32
4 Results and discussion
4.1 Overview
In this chapter the results obtained in the different parts of the experimental study and
their further discussion are presented.
Sections 4.1.1, 4.1.2 and 4.1.3 are related to Part I (air+ styrene), Part II and Part III
respectively. The 4.1.4 and 4.1.5 sections present the evaluation of the biomass compared
with dry mass and the microbiology species, respectively.
The experimental values registered in all experiments are available in Annex I.2
As referred in chapter 3, all experiments were run with total gas flow rate kept constant
(1 L/min, 24ºC). The gas velocity in the BCR was then 13.6 m/h and the EBRT 84.8 sec. The
volume of biomass was also constant and equal to 1.5 L.
4.1.1 Styrene degradation in the bubble column reactor (Part I)
The main goal of these experiments was to find out the inlet styrene concentration
(C in Sty) when removal efficiency (RE) is maximum: as RE reaches a peak and starts to decay,
it is possible to identify the value of C in Sty responsible for that maximum. Furthermore, there
were also calculated the styrene organic loading rate (OL Sty) and styrene elimination capacity
(EC sty): the first variable is very important to evaluate and control the aerobic/anaerobic
environment of the system; the second variable expresses the removal of styrene quantity
from air stream. EC sty and RE are, then, interrelated.
The values of OL Sty, RE, and EC sty are obtained by equations 2.1, 2.2 and 2.3,
respectively.
In figures 4-1 to 4-6, there are represented several results related to styrene
degradation; in Annex I.2 it is possible to find the corresponding tables.
In figure 4-1 it is possible to see the evolution of inlet/outlet concentrations of styrene in
time and to compare these with OL Sty values obtained along the experimental period (30
days).

Biofiltration of Air/Styrene and Air/Styrene/Acetone mixtures in a bubble column reactor
33
Figure 4-1 –Inlet, □ and outlet, Δ, concentrations(C Sty), organic load rate (OL Sty), ○ for styrene
in time (day)
Each experiment is then represented by a group of three marks (□, Δ and ○). In each
day a variable number of experiments could be performed. As it can be seen in figure 4-1 the
styrene inlet concentration (C in sty) was gradually increased from 250 to 6500 mg.m-3. Until the
19th day, C in sty has increased slowly (with exception for days 9 and 12, when smaller C in
values were tested); however, from day 20, it has increased rapidly. As one can see through
the graphic, the maximum C in sty values were used on day 30 and the minimum values were
tested between the days 8 and 12.
The OL sty and C in sty vary at the same ratio, and obviously OL sty values follow the same
behavior as that of C in sty along the several days. The maximum values of OLsty (between 250
and 300 g.m-3.h-1) corresponds to C in sty between [6500-7000] mg.m-3.
0
50
100
150
200
250
300
0
500
1000
1500
2000
2500
3000
3500
4000
4500
5000
5500
6000
6500
7000
0 2 4 6 8 10 12 14 16 18 20 22 24 26 28 30 32
OL
Sty
(g.m
-3.h
-1)
CS
ty(m
g.m
-3)
time(day)

Biofiltration of Air/Styrene and Air/Styrene/Acetone mixtures in a bubble column reactor
34
The range of OL sty values studied was at an interval of values acceptable, according to
the literature (Hanna et al.) [8]. This fact is important, as it indicates that the microorganisms
can degrade styrene in a normal aerobic environment (the microorganisms are exclusively
aerobic in this study); on the contrary, if OL Sty values exceeded a specific value-limit, then
oxygen wouldn´t be completely available in BSM liquid, the system would become less
aerobic, and consequently, microorganisms would degenerate with the lack of oxygen , what
could cause drastic consequences for RE and EC values, reaching rapidly minimum values.
Another important aspect to emphasize is the experience duration of thirty days. The
main criterion was the outlet styrene concentration (C out Sty) increasing in air stream: the less
the microorganisms can degrade styrene, the more styrene is present in air stream. As one
can observe, on day thirty C out Sty is very high, expressing that microorganisms already had
begun to degenerate.
Figure 4-2 represents the evolution of styrene inlet concentration (C in Sty) en removal
efficiency (RE) in time
Biofiltration of Air/Styrene and Air/Styrene/Acetone mixtures in a bubble column reactor
35
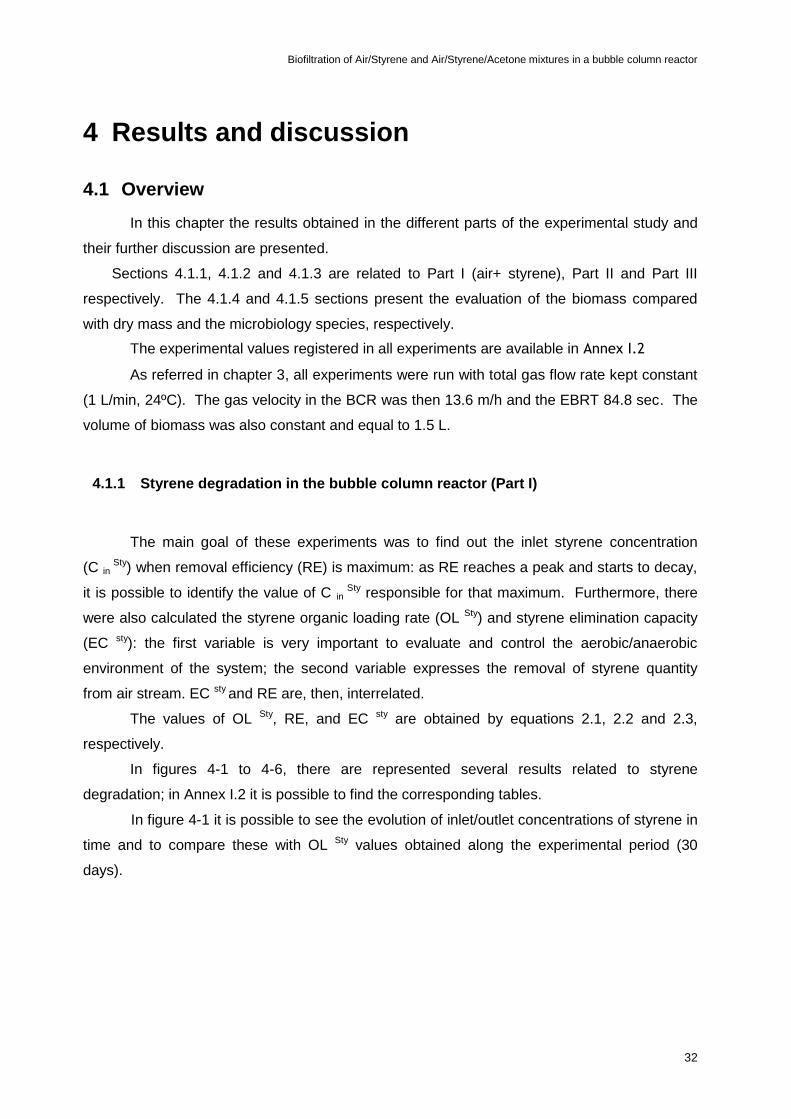
Figure 4-2- Inlet Styrene concentration (Cin Sty), □ and Removal efficiency (RE), Δ, for styrene
in time (day)
Figure 4-3 represents the variation between the elimination capacity for the styrene
(EC sty) and the removal efficiency (RE) in time (days).
0
20
40
60
80
100
0
500
1000
1500
2000
2500
3000
3500
4000
4500
5000
5500
6000
6500
7000
0 2 4 6 8 10 12 14 16 18 20 22 24 26 28 30 32
RE
( %
)
Cin
sty(m
g.m
-3)
time(day)

Biofiltration of Air/Styrene and Air/Styrene/Acetone mixtures in a bubble column reactor
36
Figure 4-3- Removal efficiency (RE sty), Δ, elimination capacity (EC sty), ○, for styrene in time
(day)
As showed by equation 2.2, RESty is the ratio between the concentration difference
(inlet minus outlet) and the inlet styrene concentration; EC sty only considers the difference
between inlet and outlet concentrations, divided by the empty bed volume.
In relation to RE Sty, at the beginning (days [0-2]), its higher values can be explained by
OL Sty minimum values: as OL Sty is low, the microorganisms can easily and practically degrade
the total styrene, what explains high RE Sty values. On days [4-5], RE Sty reaches a low point
(≈50%), due to C out Sty increasing, as it is possible to see in the previous figure. Another
important aspect is the fluctuating line between the days [26-28]: this fluctuating line is derived
from the fluctuating behavior of C out Sty shown in figure 4-1: the C out
Sty fluctuation represents a
certain instability of the system. On days [28-30] it is observed a great decline of RE Sty that
signifies the weak styrene degradation (minimum ≈20%).
As it is shown, EC sty has generally the same behavior as RE Sty, although there are
some specific cases where their behaviors lightly diverge, as for example, on days [8-12].
0
20
40
60
80
100
120
140
160
180
200
220
0
20
40
60
80
100
0 2 4 6 8 10 12 14 16 18 20 22 24 26 28 30 32
EC
ST
Y(g
.m-3
.h-1
)
RE
ST
Y(%
)
time (day)
Biofiltration of Air/Styrene and Air/Styrene/Acetone mixtures in a bubble column reactor
37
Normally, when C in Sty increases RESty increases too (according to figure 4-2), only if
C out Sty remain practically constant. This fact can be explained through microorganisms’
degradation: the more styrene exists in BSM, the more styrene is degraded by
microorganisms. Consequently, RESty increases. On the contrary, when styrene degradation
starts to decline, it is observed that C out Sty considerably varies, and in these circumstances
there is not a constant relation between C in Sty and RESty behaviors.
It is essential to interpret the fact that the microorganisms degrade less styrene as time
reaches the day thirty. In order to explain that, a study was made between biomass
concentration (Xf) values and dissolved oxygen (DOC). These values are represented in figure
4-4.
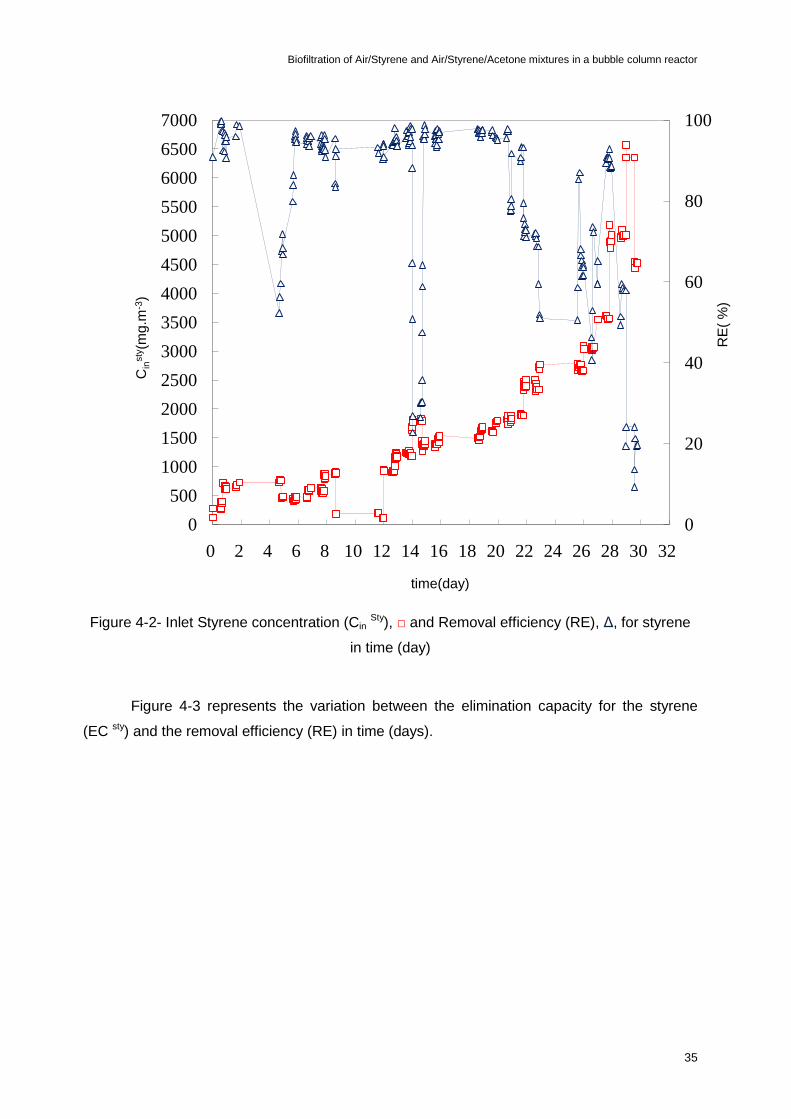
Figure 4-4- Biomass concentration (Xf), □ and dissolved oxygen (DOC)○ along styrene
degradation study
0
2
4
6
8
10
0
1
2
3
4
5
6
7
8
9
0 2 4 6 8 10 12 14 16 18 20 22 24 26 28 30 32
DO
C (
mg
.L-1
)
xf(g
.L-1
)
time (day)
Centrifugation

Biofiltration of Air/Styrene and Air/Styrene/Acetone mixtures in a bubble column reactor
38
It’s possible to see an exponential increasing of xf along time, unlike DOC which has an
opposite behaviour.
The vertical dashed lines indicate when the overall suspension volume (BSM) in the
BCR was centrifuged; centrifugation has in this experiment an outstanding role: whenever a
BSM centrifugation occurs, biomass concentration goes down and, consequently, DOC rises.
Biomass concentration decreases, due to solid mass elimination, allowing more contact points
between O2 molecules and microorganisms, and consequently, there´s more O2 available for
the degradation mechanism. Thus, centrifugation is very important to ensure the aerobic
nature of the system, so that styrene degradation is not jeopardized along the process.
The minimum DOC value (1.5 mg.L-1) is situated between days [28-30], coincident with
the maximum C in sty values used.
It is also important to outstand the influence of DOC on C out sty evolution: less O2
available for the microorganisms prejudices their efficiency, and consecutively, less styrene is
degraded and C out sty is increased.
Along the process, biomass has a natural tendency to rise, due to new
microorganisms, degradation byproducts…
To conclude, it is possible to say that DOC and Xf are inversely proportional.
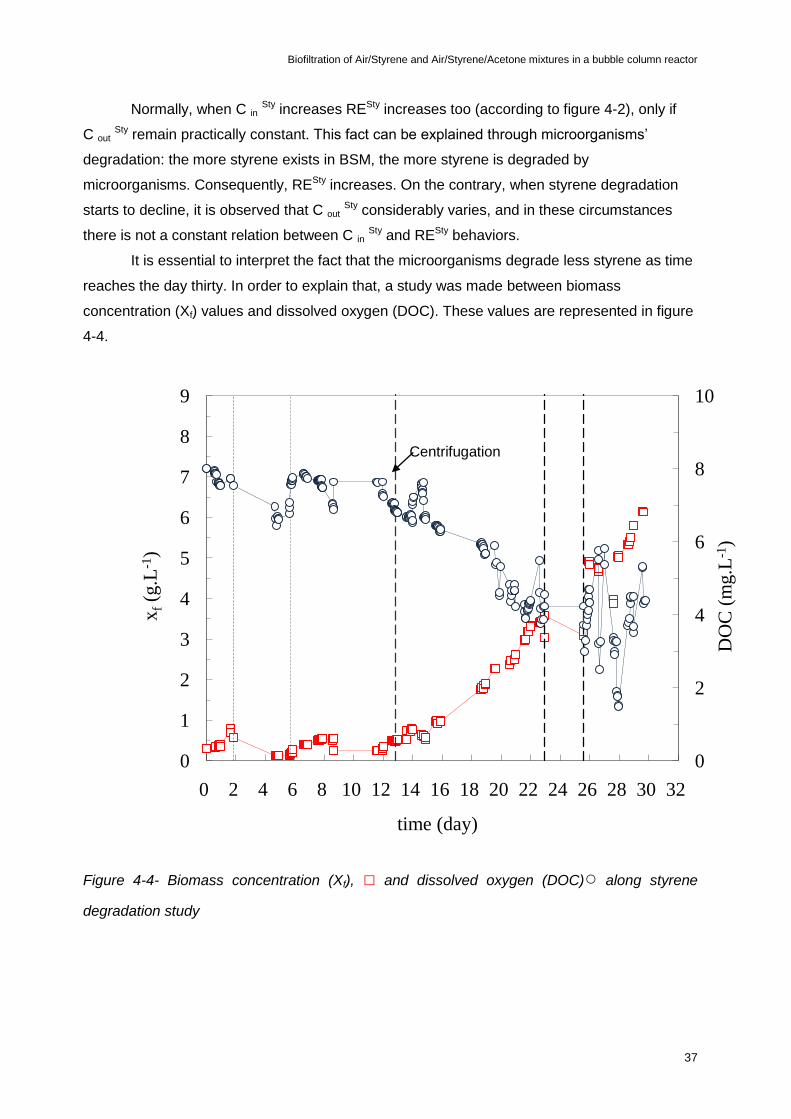
In figure 4-5 the variation between the ECw and RE sty with OLw is represented.
Biofiltration of Air/Styrene and Air/Styrene/Acetone mixtures in a bubble column reactor
39
Figure 4-5- Overall elimination capacity (EC w), ○, and removal efficiency (RE), Δ, related to
organic load rate (OLw) during styrene degradation
At the beginning, one can observe that ECw and RE w seem to have different
tendencies, what seems to be contradictory, this is, it was supposed, at first impression, that
these variables would have the same behavior as they have similar equations and meanings.
In relation to RE w, its declining is due to OLw increasing: as organic matter increases,
microorganisms have to degrade more and more styrene, and besides that, O2 available is
even less, evolving microorganisms to their saturation state; therefore, microorganisms´
efficiency decreases, C out sty naturally increases, and in this way, RE w decreases (consult
equation 2.2).
)2.2(100(%)in
outin
C
CCRE
Till approximately 80 g.m-3.h-1 of OLw the RE w is practically stable (RE≈100%); from
that OLw value the RE decrease significantly till 20%.
0,0
10,0
20,0
30,0
40,0
50,0
60,0
70,0
80,0
0,0
20,0
40,0
60,0
80,0
100,0
120,0
0 20 40 60 80 100 120 140
Re
w(%
)
EC
W(g
.m-3
.h-1
)
OLW (g.m-3.h-1)
Biofiltration of Air/Styrene and Air/Styrene/Acetone mixtures in a bubble column reactor
40
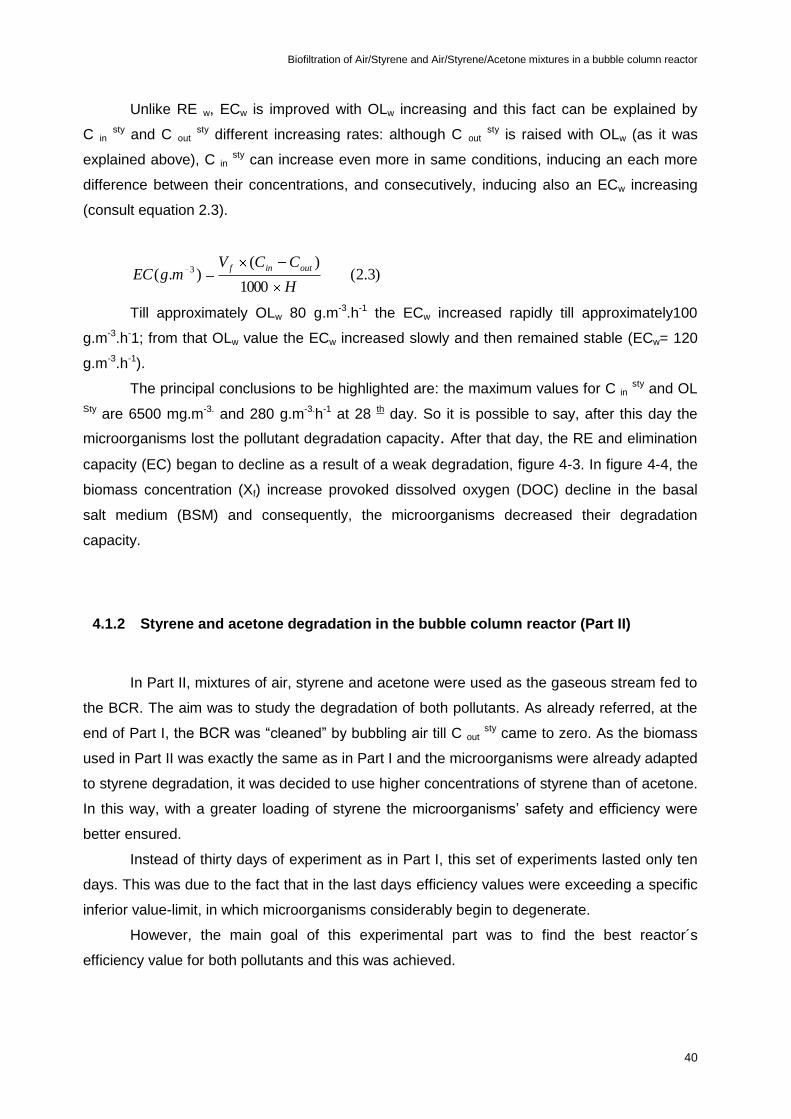
Unlike RE w, ECw is improved with OLw increasing and this fact can be explained by
C in sty and C out
sty different increasing rates: although C out sty is raised with OLw (as it was
explained above), C in sty can increase even more in same conditions, inducing an each more
difference between their concentrations, and consecutively, inducing also an ECw increasing
(consult equation 2.3).
)3.2(1000
)().( 3
H
CCVmgEC
outinf
Till approximately OLw 80 g.m-3.h-1 the ECw increased rapidly till approximately100
g.m-3.h-1; from that OLw value the ECw increased slowly and then remained stable (ECw= 120
g.m-3.h-1).
The principal conclusions to be highlighted are: the maximum values for C in sty and OL
Sty are 6500 mg.m-3. and 280 g.m-3.h-1 at 28 th day. So it is possible to say, after this day the
microorganisms lost the pollutant degradation capacity. After that day, the RE and elimination
capacity (EC) began to decline as a result of a weak degradation, figure 4-3. In figure 4-4, the
biomass concentration (Xf) increase provoked dissolved oxygen (DOC) decline in the basal
salt medium (BSM) and consequently, the microorganisms decreased their degradation
capacity.
4.1.2 Styrene and acetone degradation in the bubble column reactor (Part II)
In Part II, mixtures of air, styrene and acetone were used as the gaseous stream fed to
the BCR. The aim was to study the degradation of both pollutants. As already referred, at the
end of Part I, the BCR was “cleaned” by bubbling air till C out sty came to zero. As the biomass
used in Part II was exactly the same as in Part I and the microorganisms were already adapted
to styrene degradation, it was decided to use higher concentrations of styrene than of acetone.
In this way, with a greater loading of styrene the microorganisms’ safety and efficiency were
better ensured.
Instead of thirty days of experiment as in Part I, this set of experiments lasted only ten
days. This was due to the fact that in the last days efficiency values were exceeding a specific
inferior value-limit, in which microorganisms considerably begin to degenerate.
However, the main goal of this experimental part was to find the best reactor´s
efficiency value for both pollutants and this was achieved.

Biofiltration of Air/Styrene and Air/Styrene/Acetone mixtures in a bubble column reactor
41
Figure 4-5 represents inlet concentrations variation for styrene and acetone during the
experimental period of 10 days between day 32 and day 42 as well as the total organic load
rate (OLw).
Figure 4-5- Inlet concentration of styrene,○, and acetone, Δ, and total organic load rate, ○, in
time(day) during styrene and acetone degradation period
As was already mentioned before, a larger variation (increasing) on inlet styrene
concentration (C in Sty), for a question of microorganisms’ security and efficiency.
It is observed also that OLw has naturally increased in time, as C in Sty and C in
Ac are its
constituents and have influenced its increment.
The acetone inlet concentration (C in Ac) varied between [153-1389] mg.m-3 and styrene
inlet concentration (C in Sty) between [225-2659] mg.m-3, OLw shows the quantity of substrate
in the liquid that was in the reactor. So if the Cin increases the OLw (g.m-3.h-1) increases in the
same ratio. According with figure 4-5, the OLw (g.m-3.h-1) varied between [10-180] g.m-3h-1.
The figure 4-7, shows the outlet concentrations variation with total organic load (OLW)
for the air mixture with styrene and acetone.
0
20
40
60
80
100
120
140
160
180
200
0
500
1000
1500
2000
2500
3000
32 33 34 35 36 37 38 39 40 41 42
OL
W(g
.m-3
.h-1
.)
Cin
(mg.m
-3)
time(day)

Biofiltration of Air/Styrene and Air/Styrene/Acetone mixtures in a bubble column reactor
42
Figure 4-6- Outlet concentrations (C out) variation for styrene,□, and acetone, Δ, with total
organic load rate(OLw).
The outlet styrene concentration is smaller than outlet acetone concentration, what
allows to deduce that the microorganisms used degrade styrene better.
From figure 4-6 it may be seen that Cout increases with OL w (consult equation 4.1), for
both pollutants. However this behavior is more accentuated for acetone than for styrene. The
outlet styrene concentration is smaller than outlet acetone concentration along the
experience, what is possible to deduce the microorganisms degraded better the styrene.
Furthermore, it is observed more styrene degradation, in spite of larger C in sty
increasing in relation to C in Ac (check previous figure); it is obvious to conclude that
microorganisms prefer styrene to their function.
0
100
200
300
400
500
600
700
800
900
1000
0 25 50 75 100 125 150 175
Co
ut(m
g.m
-3)
OLw(g.m-3.h-1)
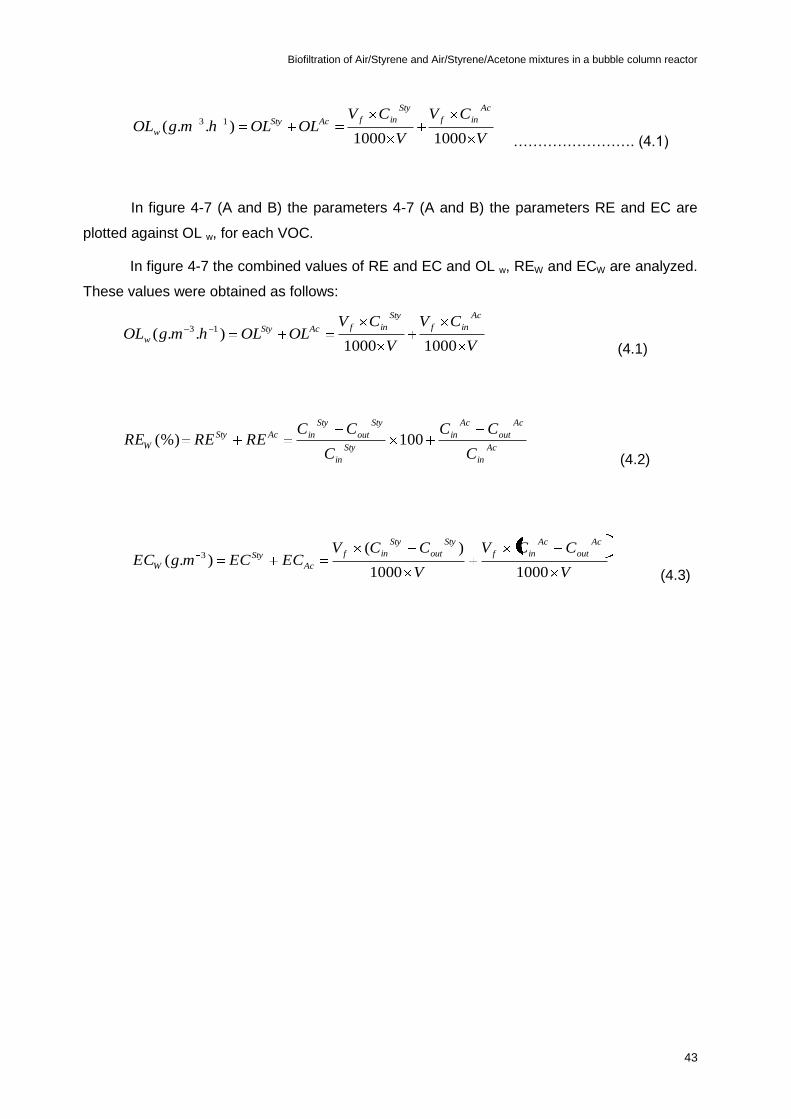
Biofiltration of Air/Styrene and Air/Styrene/Acetone mixtures in a bubble column reactor
43
V
CV
V
CVOLOLhmgOL
Ac
inf
Sty
infAcSty
w10001000
)..( 13
……………………. (4.1)
In figure 4-7 (A and B) the parameters 4-7 (A and B) the parameters RE and EC are
plotted against OL w, for each VOC.
In figure 4-7 the combined values of RE and EC and OL w, REW and ECW are analyzed.
These values were obtained as follows:
V
CV
V
CVOLOLhmgOL
Ac
inf
Sty
infAcSty
w10001000
)..( 13
(4.1)
Ac
in
Ac
out
Ac
in
Sty
in
Sty
out
Sty
inAcSty
WC
CC
C
CCRERERE 100(%)
(4.2)
V
CCV
V
CCVECECmgEC
Ac
out
Ac
inf
Sty
out
Sty
inf
Ac
Sty
W10001000
)().( 3
(4.3)

Biofiltration of Air/Styrene and Air/Styrene/Acetone mixtures in a bubble column reactor
44
Figure 4-7- Performance characteristics: A- □- RE sty, Δ- RE Ac; B- □-EC Sty, Δ – ECAc
0
20
40
60
80
100
0 25 50 75 100 125 150 175
RE
(%)
OLw(g.m-3.h-1.l-1) RE(Sty) RE(Ac)
0
20
40
60
80
100
120
0 25 50 75 100 125 150 175
EC
(mg
m-3
)
OLw(g.m-3.h-1)
A
B

Biofiltration of Air/Styrene and Air/Styrene/Acetone mixtures in a bubble column reactor
45
Observed figure 4-7, it is possible to conclude the same than figure 4-6. The
microorganisms degraded better styrene than acetone: RE Sty is larger than RE Ac along OLw
increasing and EC Sty is greater than EC Ac(C out Ac bigger than C out
Sty - check previous
figure).
It is curious to see that RE sty was continuous very high (almost one hundred per cent)
along OLw increasing, expressing that not only C in Sty rapidly increases but also C out
Sty is very
low; RE sty was not affected by OLw increasing. On the contrary, OLw increasing affected RE
Ac.
At last, it is obtained C in Ac on which RE Ac was maximum: this maximum (≈40%)
corresponds to OLw value of, approximately, 50 g.m-3.h-1. From this value is possible to obtain
the correspondent C in Ac of 750 mg.m-3(see figure 4-5).
In figure 4-7A, RE sty is practically a hundred per cent, due to a very low C out Sty
compared to C in Sty: as OL w is increased, the microorganisms degraded effectively the
styrene;
In the next figure is possible to evaluate the distribution of overall removal capacity
(REW), total elimination capacity (ECW) with total organic load (OLW).
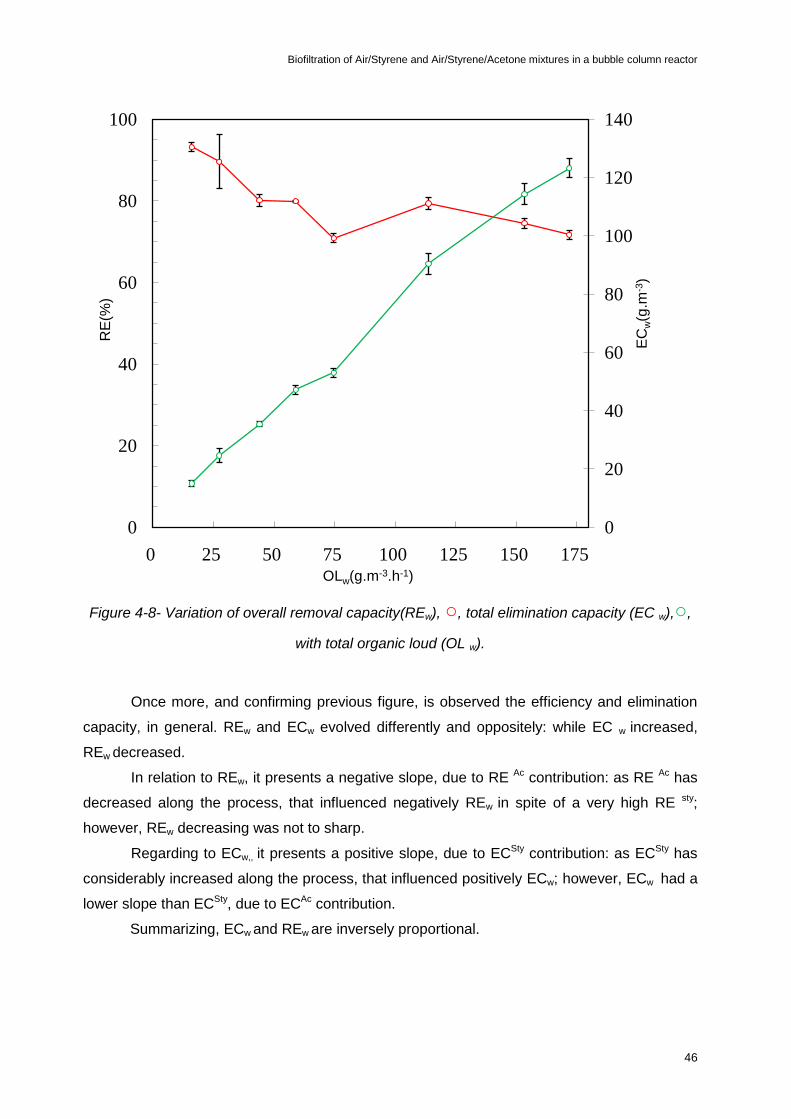
Biofiltration of Air/Styrene and Air/Styrene/Acetone mixtures in a bubble column reactor
46
Figure 4-8- Variation of overall removal capacity(REw), ○, total elimination capacity (EC w),○,
with total organic loud (OL w).
Once more, and confirming previous figure, is observed the efficiency and elimination
capacity, in general. REw and ECw evolved differently and oppositely: while EC w increased,
REw decreased.
In relation to REw, it presents a negative slope, due to RE Ac contribution: as RE Ac has
decreased along the process, that influenced negatively REw in spite of a very high RE sty;
however, REw decreasing was not to sharp.
Regarding to ECw,, it presents a positive slope, due to ECSty contribution: as ECSty has
considerably increased along the process, that influenced positively ECw; however, ECw had a
lower slope than ECSty, due to ECAc contribution.
Summarizing, ECw and REw are inversely proportional.
0
20
40
60
80
100
120
140
0
20
40
60
80
100
0 25 50 75 100 125 150 175
EC
w(g
.m-3
)
RE
(%)
OLw(g.m-3.h-1)
Biofiltration of Air/Styrene and Air/Styrene/Acetone mixtures in a bubble column reactor
47
4.1.3 Loading styrene at Cin Ac= 750 mg.m-3 = constant.
In the previous chapter, the best acetone efficiency for a pollutant mixture air-
styrene/acetone was the centre of study, in which after knowing the referred efficiency, it was
possible to know the correspondent C in Ac (750 mg.m-3).
In this chapter, it was pretended to study the behaviour of the microorganisms
biodegradation, using C in Ac =750 mg.m-3=constant and increasing progressively C in
Sty.
In figure 4-11 are demonstrated two graphics, representing styrene/acetone inlet
concentration and RE Sty and RE Ac along the increase of OLW, respectively.
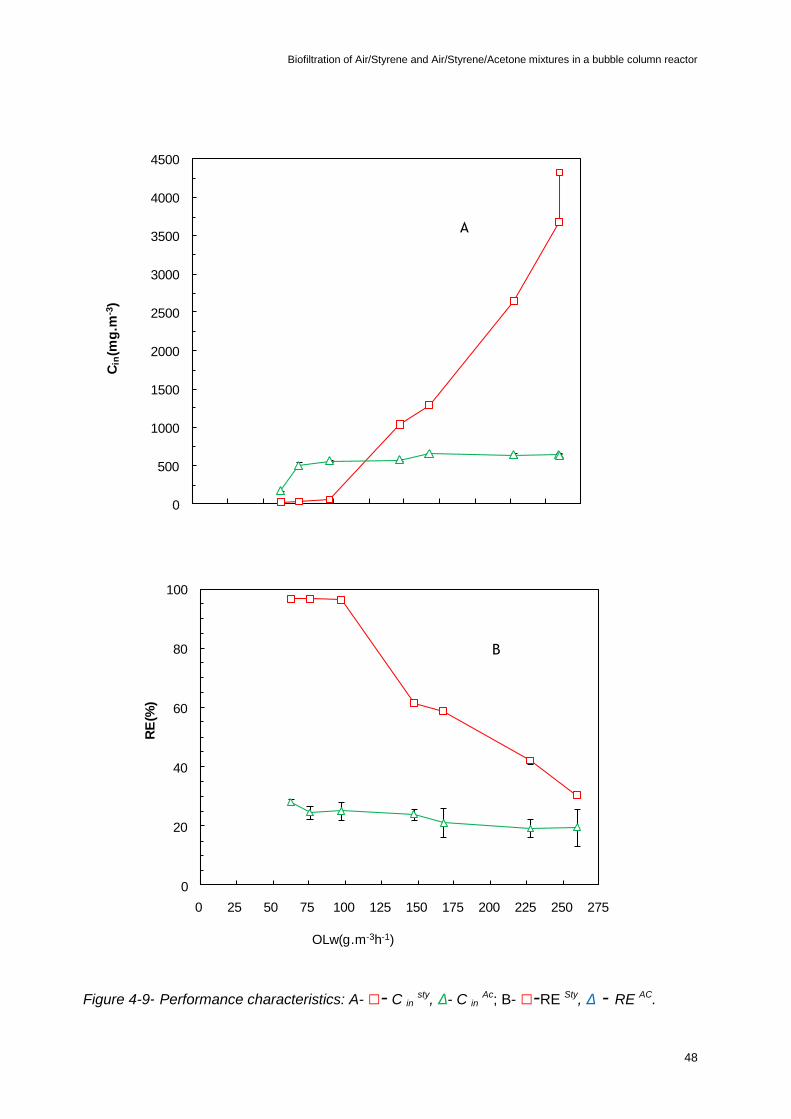
Biofiltration of Air/Styrene and Air/Styrene/Acetone mixtures in a bubble column reactor
48
Figure 4-9- Performance characteristics: A- □- C in sty, Δ- C in
Ac; B- □-RE Sty, Δ - RE AC.
0
500
1000
1500
2000
2500
3000
3500
4000
4500
0 25 50 75 100 125 150 175 200 225 250 275
Cin
(mg
.m-3
)
OLw(g.m-3.h-1.l-1)
Cout(Sty) Cout(Ac)
0
20
40
60
80
100
0 25 50 75 100 125 150 175 200 225 250 275
RE
(%)
OLw(g.m-3h-1)
A
B
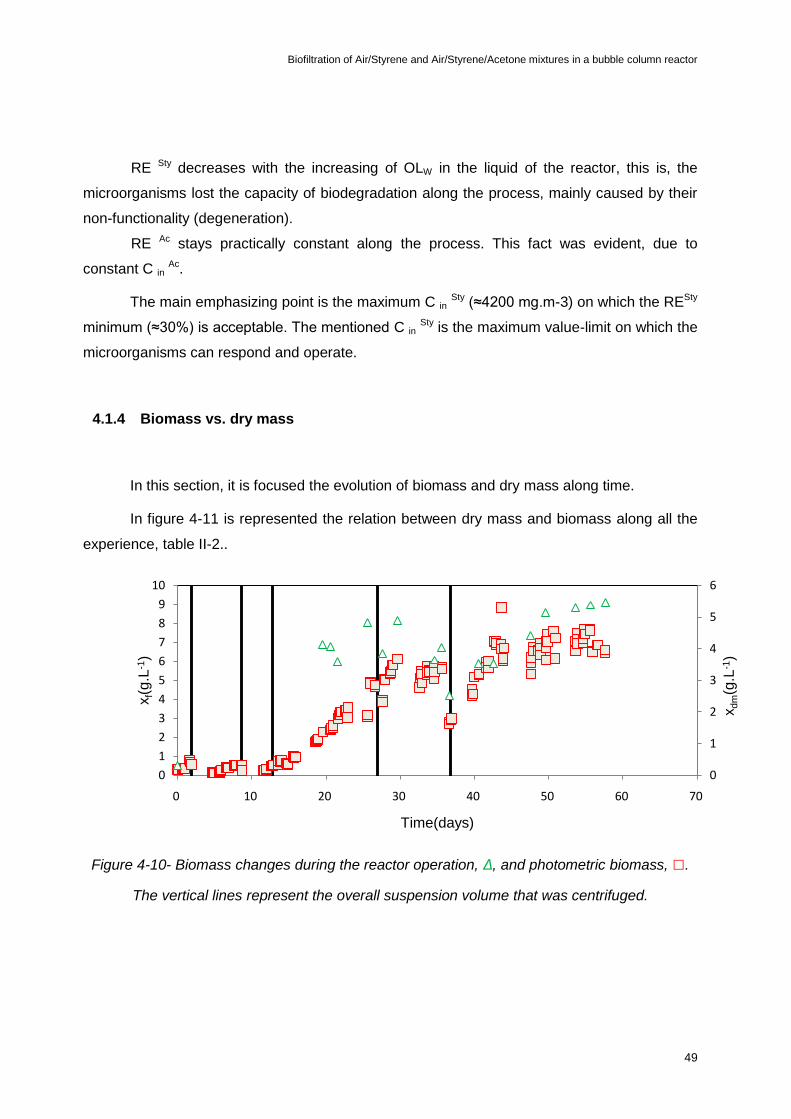
Biofiltration of Air/Styrene and Air/Styrene/Acetone mixtures in a bubble column reactor
49
RE Sty decreases with the increasing of OLW in the liquid of the reactor, this is, the
microorganisms lost the capacity of biodegradation along the process, mainly caused by their
non-functionality (degeneration).
RE Ac stays practically constant along the process. This fact was evident, due to
constant C in Ac.
The main emphasizing point is the maximum C in Sty (≈4200 mg.m-3) on which the RESty
minimum (≈30%) is acceptable. The mentioned C in Sty is the maximum value-limit on which the
microorganisms can respond and operate.
4.1.4 Biomass vs. dry mass
In this section, it is focused the evolution of biomass and dry mass along time.
In figure 4-11 is represented the relation between dry mass and biomass along all the
experience, table II-2..
Figure 4-10- Biomass changes during the reactor operation, Δ, and photometric biomass, □.
The vertical lines represent the overall suspension volume that was centrifuged.
0
1
2
3
4
5
6
0
1
2
3
4
5
6
7
8
9
10
0 10 20 30 40 50 60 70
xd
m(g
.L-1
)
xf(g
.L-1
)
Time(days)

Biofiltration of Air/Styrene and Air/Styrene/Acetone mixtures in a bubble column reactor
50
Xf and Xdm increases gradually during the experience and they seem to share the same
behavior.
On each centrifugation, both Xdm and Xf generally decreased: centrifugation can cause
a reducing of density in the liquid of reactor. Centrifugation was always needed whenever it
was considerably difficult for the microorganisms to degrade pollutant gases, and therefore, it
was essential that both Xdm and Xf could decrease, in order to maintain their functionality
4.1.5 Microbiologic
In this section, it is focused the several microorganisms in the biomass. For this
purpose, it were prepared four different cultures (see section 3.3.1.2).
After two days, in all cultures were observed microorganisms colonies. Observing the
growing inside the cultures, it was possible to identify these species, namely pseudomonas
and eukaryotes. The microorganisms available in biomass are: Xanthobacter, Enterobacter,
Nocardia, Corynebacterium, Rhodococcus and Pseudomonas Sp.
One of four cultures was prepared only with gas (styrene, acetone, styrene/acetone) and
without carbon. The gas used was the energy source for microorganisms growing- up inside
the culture. In all of these types of cultures appeared several microorganisms colonies, so is
possible to conclude the microorganisms were able to degrade the gases mixtures mentioned
above.
Biofiltration of Air/Styrene and Air/Styrene/Acetone mixtures in a bubble column reactor
51
5 Conclusions
The experience was divided in three parts, so the conclusions are divided in the same
way.
The first part is related only to styrene pollutant degradation. According to figure 4-1, it has
occurred an exponential increasing of styrene inlet concentration (C in sty) and styrene organic
load (OL sty); they varied between 250 to 6500 mg.m-3. and 0 to 280 g.m-3.h-1, respectively. The
maximum values are 6500 mg.m-3. and 280 g.m-3.h-1 at 28 th day. So it is possible to say, after
this day the microorganisms lost the pollutant degradation capacity, in other words, the styrene
outlet concentration(C out sty) increased abruptly. In figure 4-3, the removal efficiency (RE) was
practically maintained 100%, although it had some minimum values according to C out sty
increasing. This means that there was excellent pollutant degradation by the microorganisms,
despite the C in sty exponential increasing. After 28 th day, the RE and elimination capacity (EC)
began to decline as a result of a weak degradation, figure 4-3. In figure 4-4, the biomass
concentration (Xf) increasing provoked dissolved oxygen (DOC) decline in the basal salt
medium (BSM) and consequently, the microorganisms decreased their degradation capacity.
Furthermore, the system had a tendency of becoming anaerobiotic. The centrifugations
represented by vertical dashed lines, interfered on the system, decreasing the Xf and
increasing the DOC quantities. In figure 4-5, the RE decreased as a result of C out sty
increasing, due also to overall organic loading rate (OL W) increasing. The overall elimination
capacity (ECW) increasing is related to different raising ratios: C in sty increasing (manipulated)
had been superior to C out sty and their difference had been increased along the experience.
The second part is related to a mixture of gas streams degradation, namely styrene,
acetone and air. In figure 4-6 OLw increased along with the mixture inlet concentration (Cin.)
increasing, in other words, the styrene and acetone injection interfered on the OLw quantity in
the BSM. In figures 4-7 and 4-8, it is possible to conclude that microorganisms degraded better
the styrene than acetone: in figure 4-7 it is shown that C out sty is always inferior than acetone
outlet concentration (C out Ac); in figure 4-8 styrene removal efficiency (RE Sty) and the styrene
elimination capacity (EC Sty) are always superior than acetone removal efficiency (RE Ac) and
the acetone elimination capacity (EC Ac) in course of the experiment. In figure 4-8A, it is clear
that the microorganisms degradation of styrene is highly efficient (RE≈100%), while in figure
4-8B, it is obvious that microorganisms degradation of acetone is lowly efficient
(EC≈20mg-m-3).
At last, it is obtained C in Ac on which RE Ac was maximum: this maximum (≈40%)
corresponds to OLw value of, approximately, 50 g.m-3.h-1. From this value is possible to obtain
the correspondent C in Ac of 750 mg.m-3(see figure 4-6).

Biofiltration of Air/Styrene and Air/Styrene/Acetone mixtures in a bubble column reactor
52
The third part is related to a mixture of gases streams degradation, styrene, acetone and
air, using a constant acetone inlet concentration (C inAc) equal to 750mg.m-3 in which the
acetone removal efficiency (RE Ac) was maximum. In figure 4-10 it is possible to conclude that
microorganisms could degrade a higher C in sty than in the previous part. The constant C in
Ac has
improved indeed the microorganisms’ degradation capacity in the presence of high quantity of
the pollutant and amplified their performance capacity.
At the end of the experimental work, it is studied the microorganisms presented in the
biomass. They were namely: Xanthobacter, Enterobacter, Nocardia, Corynebacterium,
Rhodococcus and Pseudomonas Sp
Biofiltration of Air/Styrene and Air/Styrene/Acetone mixtures in a bubble column reactor
53
6 References
[1]- Carvalho M.F., Duque A.F., Moura S.C., Amorim C.L., Jorge Ferreira R.M., Castro
P.M.L., “ Biological treatment of a contaminated gaseous emission from a leather industry
in a suspended- growth bioreactor”, Chemosphere 74, 232-238 (2009)
[2]- Burgess Joanna E., Parsons Simon A., Stuetz Richard M., “Developments in odour
control and waste gas treatment biotechnology: a review”, Biotechnology Advances 19,
35-63 (2001).
[3]- Hájková Dagmar,”Degradace tekavých polutantu z odpadních plynu v
biofiltrech”Diplomová práce, Vysoká skola chemicko- technologická v Praze, Ústav kvasné
chemie a bioinzénýrství, 2002/2003.
[4]-http://www.environment-agency.gov.uk/business/topics/pollution/232.aspx
(appointment: 18/8/09)
[5]- http://www.epa.gov/chemfact/styre-sd.txt (appointment: 18/8/9)
[6]- Shimada Kunio, Kimura Eiji, Yasui Yohko, Tanaka Hideki et all.;” Styrene formation by
the decomposition by Pichia Carsonii of trans- cinnamic acid added a grand fish product”
applied and environmental microbiology; 1577- 1582 (1992).
[7] http://upload.wikimedia.org/wikipedia/commons/c/c5/Styrene.svg (appointment:
10/06/09).
[8]- Jorio Hasnaa, Bibeau Louise, Heitz Michele;” Biofiltration of air contamined by styrene:
effect of nitrogen supply, gas flower rate, and inlet concentration”, Environ.Sci.Technol.34,
1764-1771(2000).
[9] - http://www.epa.gov/chemfact/styre-sd.txt (appointment: 18/8/9)

Biofiltration of Air/Styrene and Air/Styrene/Acetone mixtures in a bubble column reactor
54
[10]- http://www.atsdr.cdc.gov/toxprofiles/tp21-c3.pdf (appointment: 18/8/9)
[11]-http://www.environmentwriter.org/resources/backissues/chemicals/acetone.htm
(appointment: 18/8/9)
[12]- http://www.bohnbiofilter.com/html/what_is_biofiltration_.html (appointment:
16/06/09)
[13]- http://alexandria.tue.nl/repository/freearticles/620777.pdf (appointment: 20/8/9)
[14]- Jang J.H., Hirai M., Shoda M.; “ Styrene degradation by Pseudomonas Sp. SR-5 in
biofilters with organic and inorganic packing materials”; Appl Microbiol Biotechnol 65: 349-
355(2004).
[15]- Deshusses Marc A, “Biological waste air treatment in biofilters”, Current Opinion in
Biotechnology, 8: 335-339 (1997).
[16]-http://128.113.2.9/dept/chem-eng/Biotech-Environ/MISC/biofilt/biofiltration.htm
(appointment: 19/8/9)
[17]- Lens Piet N.L., Kennes Christian, Cloirec Pierre Le; “ Waste gases treatment for
resource recovery”; IWA publishing, 250- 252 (2006).
[18]- http://www.p2pays.org/ref/37/36915.pdf (appointment: 19/8/9)
[19]- VDI(ed.): VDI- Richtiline 3477: Biologische Abluftreinigung, Biofilter, Dusseldorf,1985.
[20]- Breihofer, D.; Mielenz, A., Rentz, O. :Maβnahmen zur Minderung der Emissionen von
SO2, NOx und VOC bei stationaren Quellen in der Bundersrepublik Deutschland,
Karlsruhe, May 1991.
Biofiltration of Air/Styrene and Air/Styrene/Acetone mixtures in a bubble column reactor
55
[21]- Kennes Christian, Thalasso Fréderic, “Waste gas biotreatment technology”, J. Chem.
Technol, Biotechnol, 72, 303-319 (1998).
[22] - Ramirez Antonio Avalos, Jones J. Peter, Heitz Michéle; “Control of methanol
vapours in a biotrickling filter: performance analysis and experimental determination of
partition coefficient”; Bioresource Technology 100, 1573- 1581 (2009).
[23] - Velasco Ana, Alonso Sergio, Gracia José L., Pereira J., Diaz Eduardo; “Genetic and
functional analysis of the styrene catabolic cluster of Pseudomonas Sp. Strain Y2”; 180
(5); 1063- 1071 (1998).
[24]- Itok Nobuya, Morihana Ritsuko et all; “Purification and characterization of
Phenylacetaldehyde reductase from a styrene- assimilating Corynebacterium Strain-
ST10”; Applied and environmental microbiology; 3783-3788; (1997).
[25]- Shimada Kunio, Kimura Eiji, Yasui Yohko, Tanaka Hideki et all.;” Styrene formation
by the decomposition by Pichia Carsonii of trans- cinnamic acid added a grand fish
product” applied and environmental microbiology; 1577- 1582 (1992).
[26]- O’ Leary Niall, O´Connor Kevin E., Dobson Alan D.W.; “Biochemistry genetics and
physiology of microbial styrene degradation”; FEMS Microbiology reviews 26; 403- 417
(2002).
[27]- O’ Leary Niall D., O’ Connor Kevin E., Duetz Wouter, Dobson Alan D.W.;
“Transcriptional regulation of styrene degradation in Pseudomonas putida CA-3”;
Microbiology; 147; 973-979 (2001).
[28] - Ensign Scott A., Small Frederick J., Allen Jeffrey R., Sluis Miriam K.; “New roles for
CO2 in the microbial metabolism of aliphatic epoxides and ketones”; Arch microbial 169;
179-187 (1998).
Biofiltration of Air/Styrene and Air/Styrene/Acetone mixtures in a bubble column reactor
56
[29]- Sluis Miriam K., Small Frederick J., Allen Jeffrey R., Ensign Scott A.; “Involvement of
an ATP- dependent carboxylase in a CO2- Dependent pathway of acetone metabolism by
Xanthobacter strain PY2”; Journal of Bacteriology, 4020-4026 (1996).
[30]- Platen herald, Schink Bernhard; “Enzymes involved in anaerobic degradation of
acetone by a denitrifying bacterium”; Biodegradation 1; 243-251 (1990).
[31]- Janssen Peter H., Schink Bernhard; “Catabolic and anabolic enzyme activities and
energetics of acetone metabolism”; Journal of Bacteriology; 277- 282 (1995).
[32]-http://128.113.2.9/dept/chem-eng/Biotech-Environ/MISC/biofilt/biofiltration.htm
(appointment: 19/8/9)
[33]-www.unioeste.br/cursos/cascavel/biotecnologia/aulas/2008/biofiltra%C3%A7%C3%A3o.pdf
(appointment: 20/8/9)
[34] - http://alexandria.tue.nl/repository/freearticles/620777.pdf (appointment: 20/8/9)

Biofiltration of Air/Styrene and Air/Styrene/Acetone mixtures in a bubble column reactor
57
I. Annexes I
I.1 Examples of calculation
The empty bed residence time (EBRT) was maintained 84.8 sec, i.e., the Vg = 1L/min. In
order to determine the parameters was necessary some considerations:
Vf= 13.6 m.h-1
H= 0.32 m
I.1.1 Determination of the degradation of pollutant mixture air- styrene in a bubble
column reactor
The calculus of parameters was made by the average of the experimental results. In
this example are used the C in Sty = 191mg.m-3, C out
Sty =14 mg.m-3 and time of inoculation [8-
11] days.
13 ..8.732.01000
1916.13
1000hmg
H
CVOL
infSty
%48.96100191
14191100
in
outinSty
C
CCRE
13 ..52.732.01000
)14191(6.13)(hmg
H
CCVEC
outinfSty

Biofiltration of Air/Styrene and Air/Styrene/Acetone mixtures in a bubble column reactor
58
I.1.2 Calculus of the mixture air + styrene+ acetone degradation in a bubble column
reactor (BCR)
The determination of parameters was calculated from the average of the experimental
results. In this example are used the C in Sty = 255mg.m-3, C in
Ac = 153mg.m-3, C out Sty =9.7
mg.m-3, C out Ac = 16mg.m-3 and time of inoculation [30-32] days.
This example is first calculated only for the mixture air+ styrene, then, it is calculated for
the mixture air+ acetone and finally is calculated the two mixtures.
Pollutant mixture air+ styrene
13 ..1.932.01000
2556.13
1000hmg
H
CVOL
infSty
%7.95100255
7.9255100
in
outinSty
C
CCRE
13 ..1.932.01000
)7.9255(6.13
1000
)(hmg
H
CCVEC
outinfSty
Pollutant mixture air+ acetone
13..0.732.01000
1536.13
1000hmg
H
CVOL
infAc
%5.89100153
0.16153100
in
outinAc
C
CCRE
13 ..8.532.01000
)0.16153(6.13
1000
)(hmg
H
CCVEC
outinfAc

Biofiltration of Air/Styrene and Air/Styrene/Acetone mixtures in a bubble column reactor
59
Pollutant mixture air+ styrene+ acetone
13 ..5.160.71.9 hmgOLOLOL AcSty
W
13 ..0.158.51.9 hmgEcyECEC AcSt
W
%2.931001.16
0.15
w
w
WOl
ECRE
I.1.3 Calculus of the degradation of mixture air+ styrene+ acetone in a bubble
column reactor (BCR), using the Cin Ac= 750 mg.m-3 = constant.
The results are calculated in the same manner as in 1.1.2. The only difference is that
the C inAc is constant and equal to 750mg.min -3.
I.2 Experimental results
I.2.1 Overview
I.2.1.1 Styrene degradation in the bubble column reactor
In the next table are represented the experimental results for the Part I of the
experimental work, pollutant mixture air+ styrene. The experience was realized in BCR, with
the following parameters:
EBRT=84.8 sec
Vg= 1 L/min.
Vf= 13.6 mg.m-3
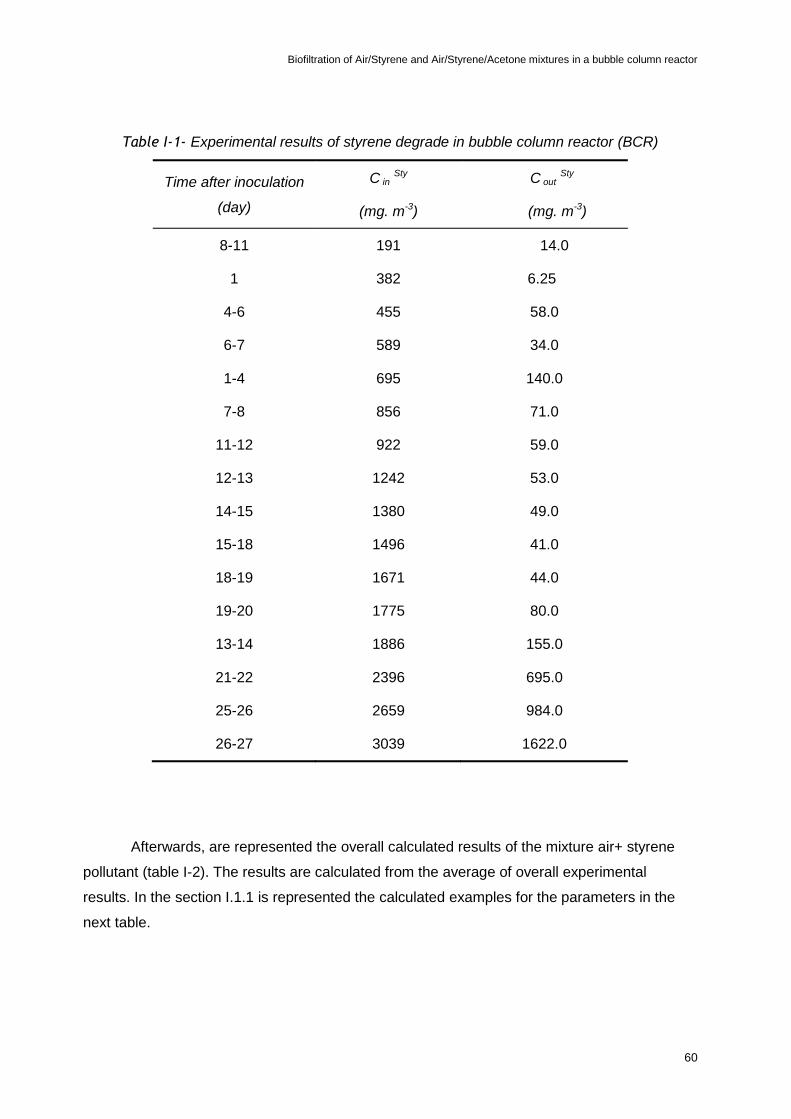
Biofiltration of Air/Styrene and Air/Styrene/Acetone mixtures in a bubble column reactor
60
Table I-1- Experimental results of styrene degrade in bubble column reactor (BCR)
Time after inoculation
(day)
C in Sty
(mg. m-3)
C out Sty
(mg. m-3)
8-11 191 14.0
1 382 6.25
4-6 455 58.0
6-7 589 34.0
1-4 695 140.0
7-8 856 71.0
11-12 922 59.0
12-13 1242 53.0
14-15 1380 49.0
15-18 1496 41.0
18-19 1671 44.0
19-20 1775 80.0
13-14 1886 155.0
21-22 2396 695.0
25-26 2659 984.0
26-27 3039 1622.0
Afterwards, are represented the overall calculated results of the mixture air+ styrene
pollutant (table I-2). The results are calculated from the average of overall experimental
results. In the section I.1.1 is represented the calculated examples for the parameters in the
next table.

Biofiltration of Air/Styrene and Air/Styrene/Acetone mixtures in a bubble column reactor
61
Table I-2 Calculated results for styrene degradation in bubble column reactor.
Time of operation
(day)
OLW
(g.m-3.h-1)
RE Sty
(%)
EC Sty
(g.m-3.h-1)
8-11 7.8 96.5 7.5
1 16.2 15.6 98.4
4-6 19.4 16.9 87.5
6-7 25.0 23.6 94.2
1-4 29.7 23.6 81.0
7-8 36.3 33.4 91.8
11-12 39.2 36.7 93.7
12-13 52.7 50.5 95.7
14-15 58.6 56.5 96.4
15-18 63.5 61.8 97.3
18-19 70.9 69.1 97.3
19-20 75.3 72.0 95.5
13-14 80.1 73.5 91.8
21-22 101.7 72.2 71.0
25-26 112.9 71.2 63.0
26-27 129.1 60.2 46.6
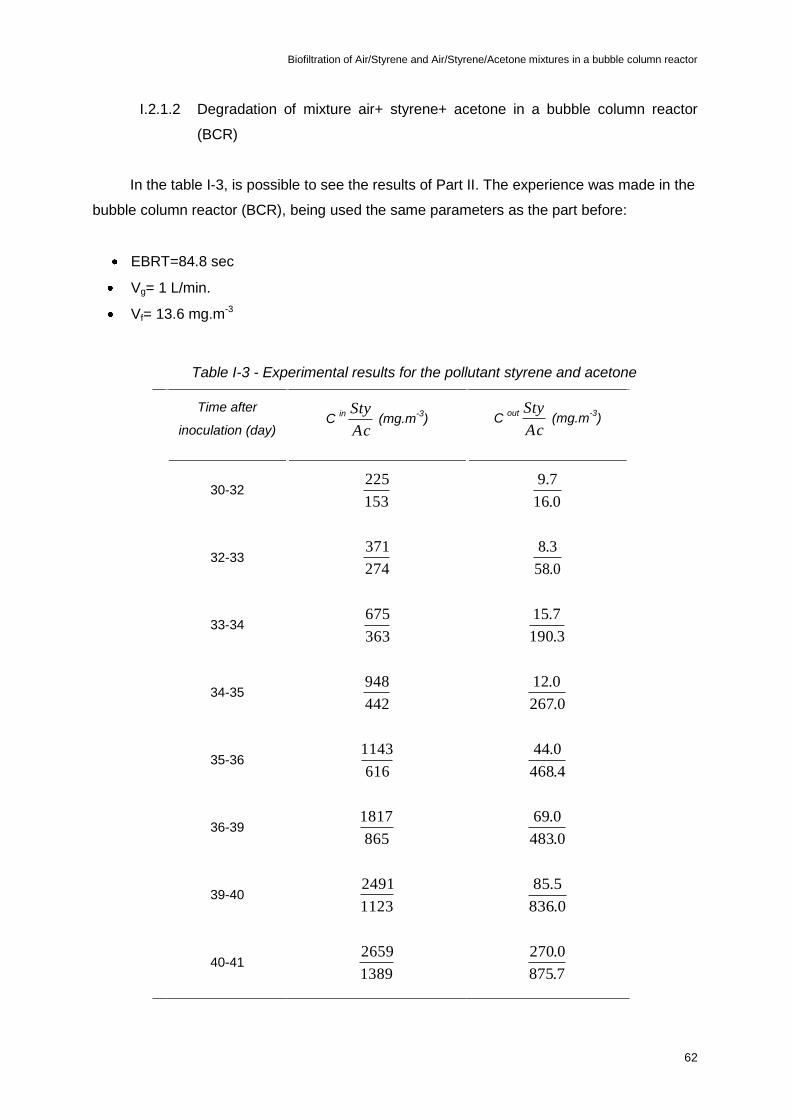
Biofiltration of Air/Styrene and Air/Styrene/Acetone mixtures in a bubble column reactor
62
I.2.1.2 Degradation of mixture air+ styrene+ acetone in a bubble column reactor
(BCR)
In the table I-3, is possible to see the results of Part II. The experience was made in the
bubble column reactor (BCR), being used the same parameters as the part before:
EBRT=84.8 sec
Vg= 1 L/min.
Vf= 13.6 mg.m-3
Table I-3 - Experimental results for the pollutant styrene and acetone
Time after
inoculation (day) C
in
Ac
Sty (mg.m
-3) C
out
Ac
Sty (mg.m
-3)
30-32 153
225
0.16
7.9
32-33 274
371
0.58
3.8
33-34 363
675
3.190
7.15
34-35 442
948
0.267
0.12
35-36 616
1143
4.468
0.44
36-39 865
1817
0.483
0.69
39-40 1123
2491
0.836
5.85
40-41 1389
2659
7.875
0.270
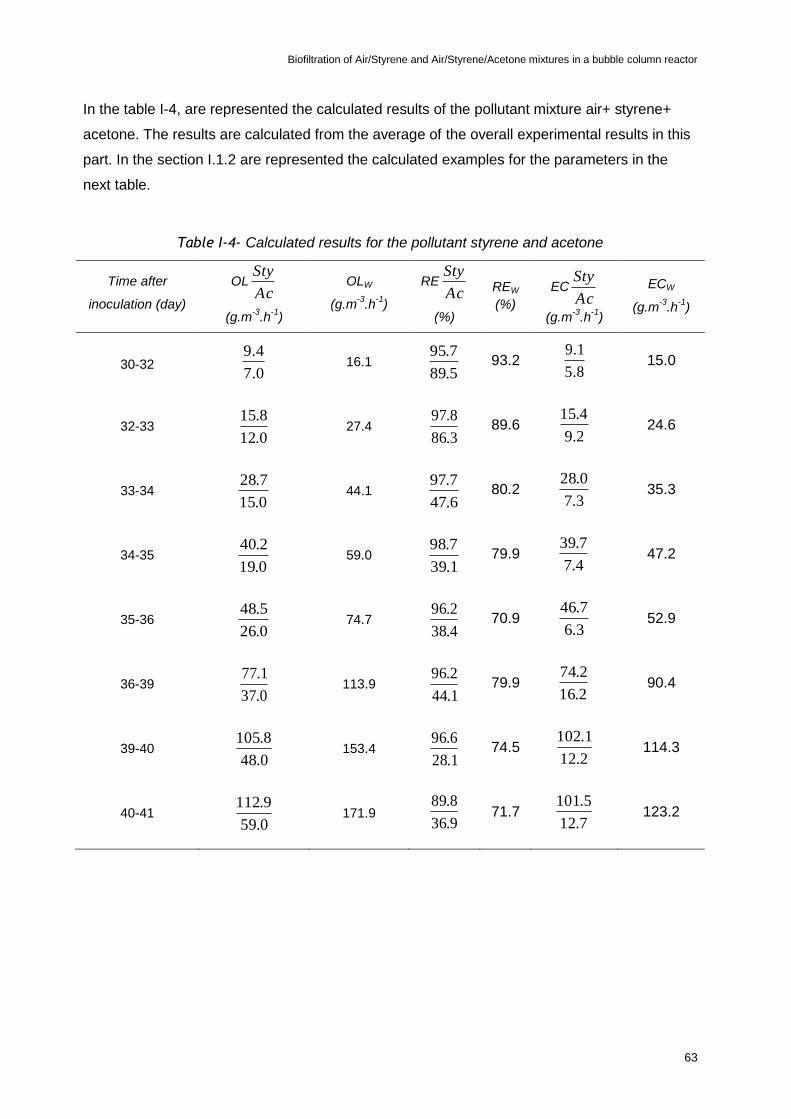
Biofiltration of Air/Styrene and Air/Styrene/Acetone mixtures in a bubble column reactor
63
In the table I-4, are represented the calculated results of the pollutant mixture air+ styrene+
acetone. The results are calculated from the average of the overall experimental results in this
part. In the section I.1.2 are represented the calculated examples for the parameters in the
next table.
Table I-4- Calculated results for the pollutant styrene and acetone
Time after
inoculation (day)
OLAc
Sty
(g.m-3
.h-1
)
OLW
(g.m-3
.h-1
)
REAc
Sty
(%)
REW
(%)
ECAc
Sty
(g.m-3
.h-1
)
ECW
(g.m-3
.h-1
)
30-32 0.7
4.9 16.1
5.89
7.95 93.2
8.5
1.9 15.0
32-33 0.12
8.15 27.4
3.86
8.97 89.6
2.9
4.15 24.6
33-34 0.15
7.28 44.1
6.47
7.97 80.2
3.7
0.28 35.3
34-35 0.19
2.40 59.0
1.39
7.98 79.9
4.7
7.39 47.2
35-36 0.26
5.48 74.7
4.38
2.96 70.9
3.6
7.46 52.9
36-39 0.37
1.77 113.9
1.44
2.96 79.9
2.16
2.74 90.4
39-40 0.48
8.105 153.4
1.28
6.96 74.5
2.12
1.102 114.3
40-41 0.59
9.112 171.9
9.36
8.89 71.7
7.12
5.101 123.2
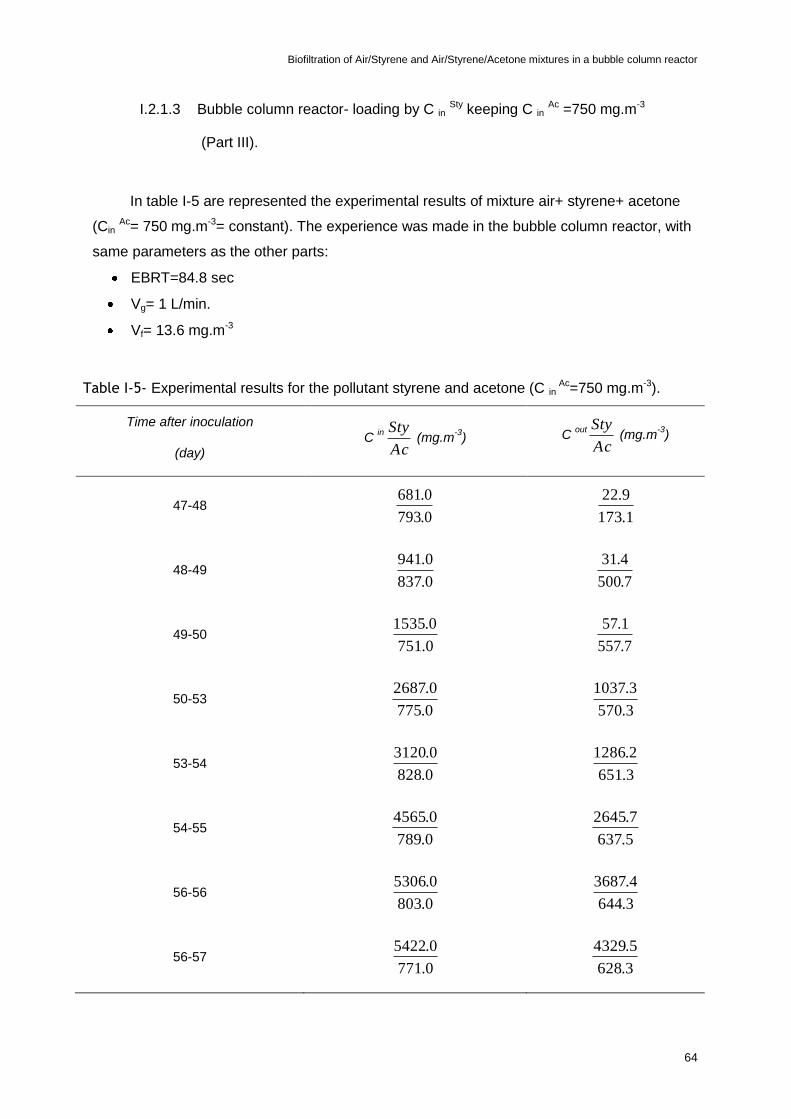
Biofiltration of Air/Styrene and Air/Styrene/Acetone mixtures in a bubble column reactor
64
I.2.1.3 Bubble column reactor- loading by C in Sty keeping C in
Ac =750 mg.m-3
(Part III).
In table I-5 are represented the experimental results of mixture air+ styrene+ acetone
(Cin Ac= 750 mg.m-3= constant). The experience was made in the bubble column reactor, with
same parameters as the other parts:
EBRT=84.8 sec
Vg= 1 L/min.
Vf= 13.6 mg.m-3
Table I-5- Experimental results for the pollutant styrene and acetone (C in Ac=750 mg.m-3).
Time after inoculation
(day) C
in
Ac
Sty (mg.m
-3) C
out
Ac
Sty (mg.m
-3)
47-48 0.793
0.681
1.173
9.22
48-49 0.837
0.941
7.500
4.31
49-50 0.751
0.1535
7.557
1.57
50-53 0.775
0.2687
3.570
3.1037
53-54 0.828
0.3120
3.651
2.1286
54-55 0.789
0.4565
5.637
7.2645
56-56 0.803
0.5306
3.644
4.3687
56-57 0.771
0.5422
3.628
5.4329
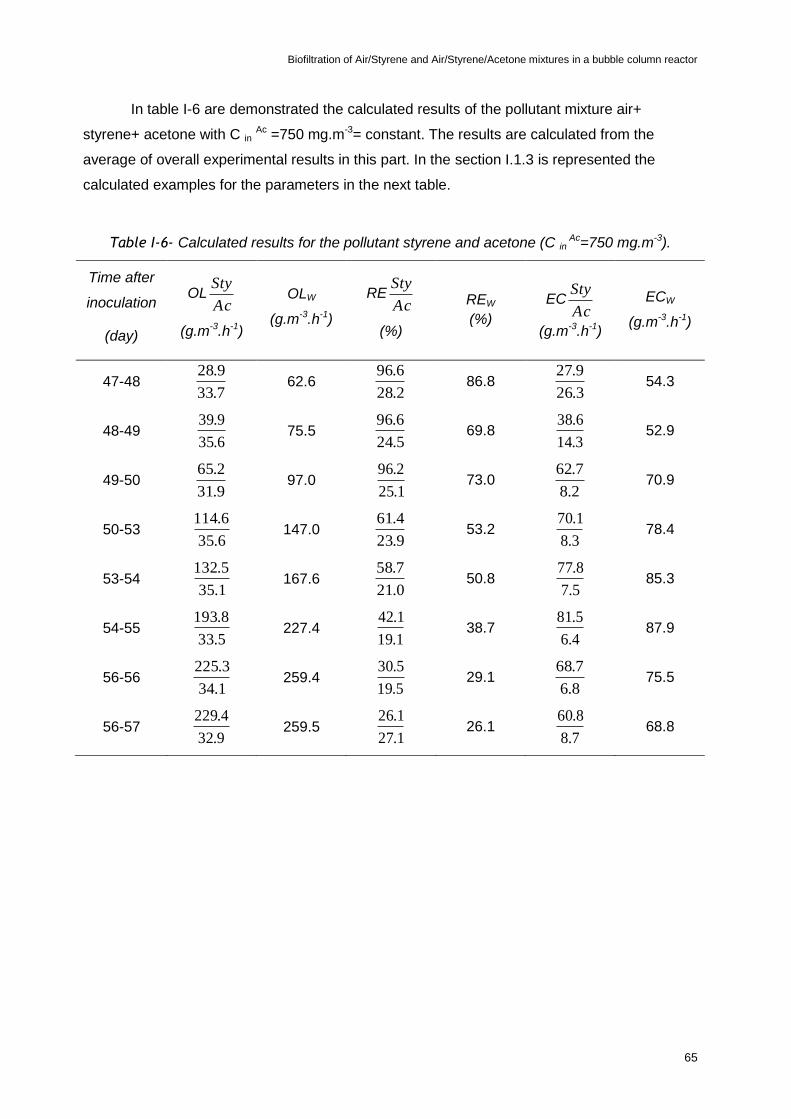
Biofiltration of Air/Styrene and Air/Styrene/Acetone mixtures in a bubble column reactor
65
In table I-6 are demonstrated the calculated results of the pollutant mixture air+
styrene+ acetone with C in Ac =750 mg.m-3= constant. The results are calculated from the
average of overall experimental results in this part. In the section I.1.3 is represented the
calculated examples for the parameters in the next table.
Table I-6- Calculated results for the pollutant styrene and acetone (C in Ac=750 mg.m-3).
Time after
inoculation
(day)
OLAc
Sty
(g.m-3.h-1)
OLW
(g.m-3.h-1)
REAc
Sty
(%)
REW
(%)
ECAc
Sty
(g.m-3.h-1)
ECW
(g.m-3.h-1)
47-48 7.33
9.28 62.6
2.28
6.96 86.8
3.26
9.27 54.3
48-49 6.35
9.39 75.5
5.24
6.96 69.8
3.14
6.38 52.9
49-50 9.31
2.65 97.0
1.25
2.96 73.0
2.8
7.62 70.9
50-53 6.35
6.114 147.0
9.23
4.61 53.2
3.8
1.70 78.4
53-54 1.35
5.132 167.6
0.21
7.58 50.8
5.7
8.77 85.3
54-55 5.33
8.193 227.4
1.19
1.42 38.7
4.6
5.81 87.9
56-56 1.34
3.225 259.4
5.19
5.30 29.1
8.6
7.68 75.5
56-57 9.32
4.229 259.5
1.27
1.26 26.1
7.8
8.60 68.8

Biofiltration of Air/Styrene and Air/Styrene/Acetone mixtures in a bubble column reactor
66
II. Annexes II
II.1 Examples of dry mass calculation
In order to calculate the dry mass, the biomass in the reactor was centrifuged, putted in
a drying- oven and weighted.
Afterwards is represented one example of dry mass calculation (example: 29.58 day).
gm massdry 01466.0 in dishes.
Each dish was 1.5 ml.
Biomass placed in volumetric flask with 10.00 ml.
20.00 ml sample of biomass.
LgV
VCC
mlfor
mlgC
mlV
mlgV
VmC
mlV
gm
ml
amplesmassdry
massdry
massdry
sample
flaskvolumetric
ishesdmassdry
massdry
dishesvolumetric
massdry
/887.40.1000
00.200977.0
1000
00.20/0977.0
00.20
00.10/0977.000.10
5.101466.0
00.10
01466.0
1000
In table II-1 (figure 4-10), are demonstrated the experimental results of the Xf and Xdm. In
this table are represented only the Xf and Xdm, average results, not the overall results.
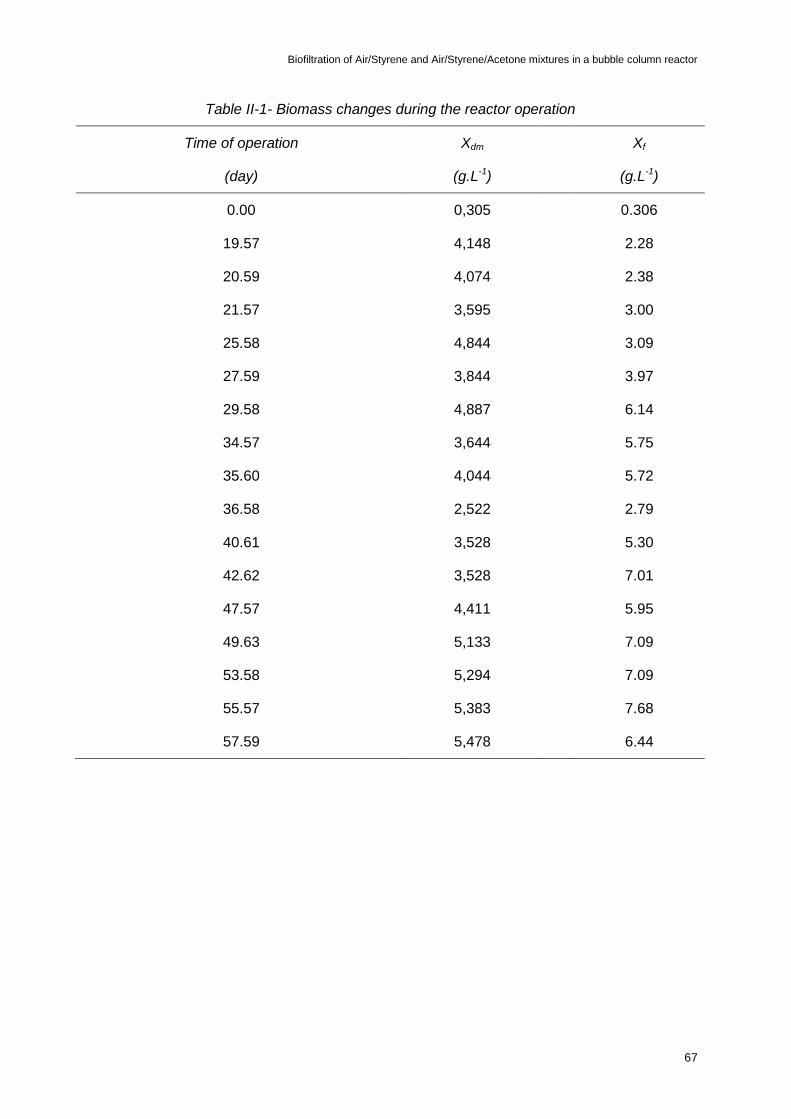
Biofiltration of Air/Styrene and Air/Styrene/Acetone mixtures in a bubble column reactor
67
Table II-1- Biomass changes during the reactor operation
Time of operation
(day)
Xdm
(g.L-1)
Xf
(g.L-1)
0.00 0,305 0.306
19.57 4,148 2.28
20.59 4,074 2.38
21.57 3,595 3.00
25.58 4,844 3.09
27.59 3,844 3.97
29.58 4,887 6.14
34.57 3,644 5.75
35.60 4,044 5.72
36.58 2,522 2.79
40.61 3,528 5.30
42.62 3,528 7.01
47.57 4,411 5.95
49.63 5,133 7.09
53.58 5,294 7.09
55.57 5,383 7.68
57.59 5,478 6.44

Biofiltration of Air/Styrene and Air/Styrene/Acetone mixtures in a bubble column reactor
68
III. Annexes II
III.1 Safety data sheet
III.1.1 Acetone

Biofiltration of Air/Styrene and Air/Styrene/Acetone mixtures in a bubble column reactor
69
(Continuation)

Biofiltration of Air/Styrene and Air/Styrene/Acetone mixtures in a bubble column reactor
70
(Continuation)
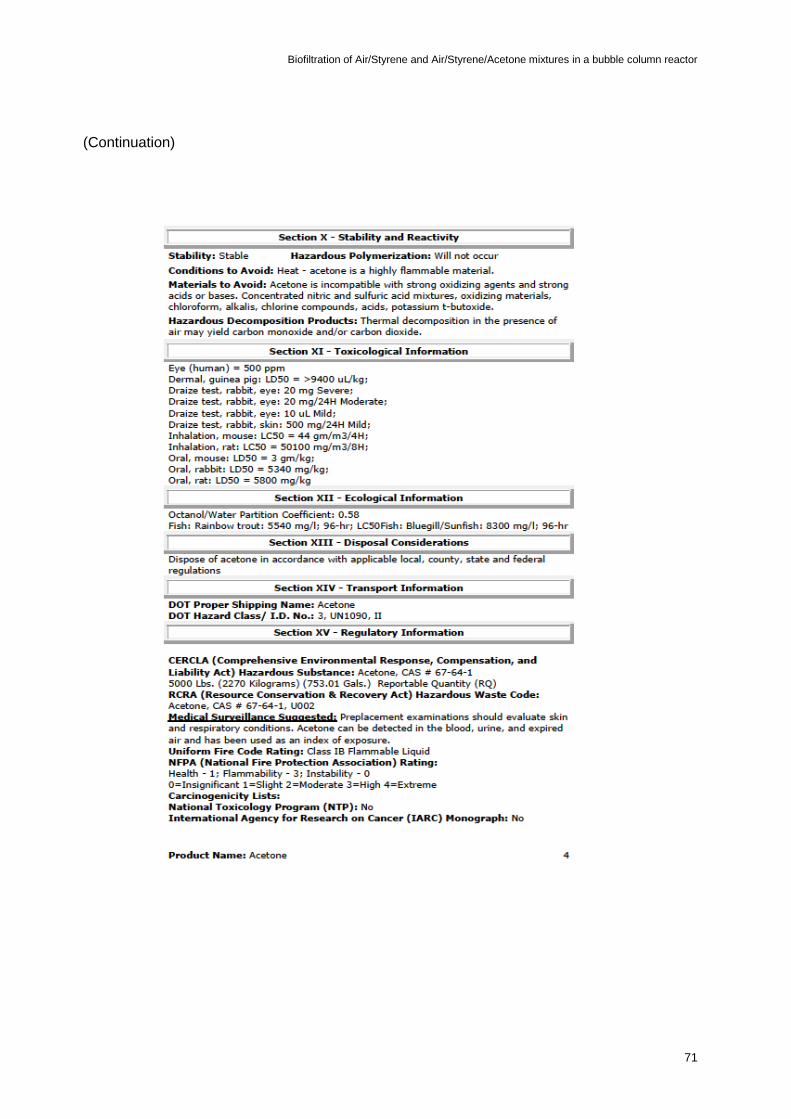
Biofiltration of Air/Styrene and Air/Styrene/Acetone mixtures in a bubble column reactor
71
(Continuation)

Biofiltration of Air/Styrene and Air/Styrene/Acetone mixtures in a bubble column reactor
72
(Continuation)
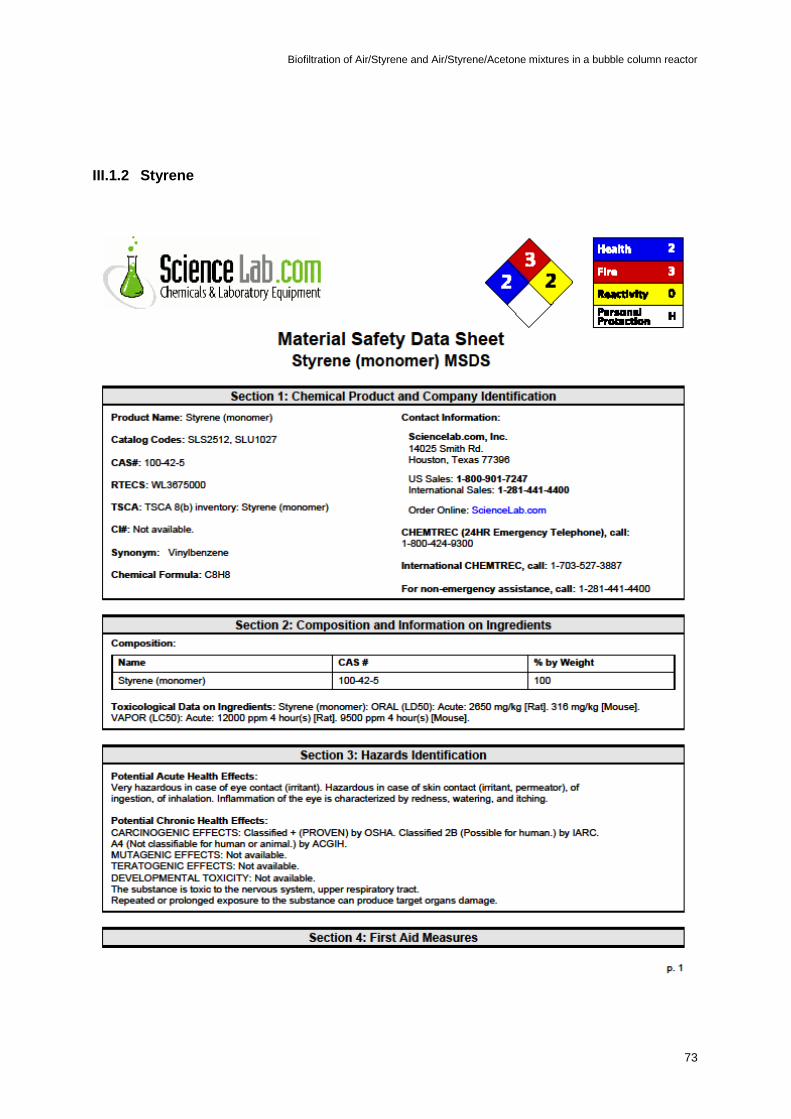
Biofiltration of Air/Styrene and Air/Styrene/Acetone mixtures in a bubble column reactor
73
III.1.2 Styrene
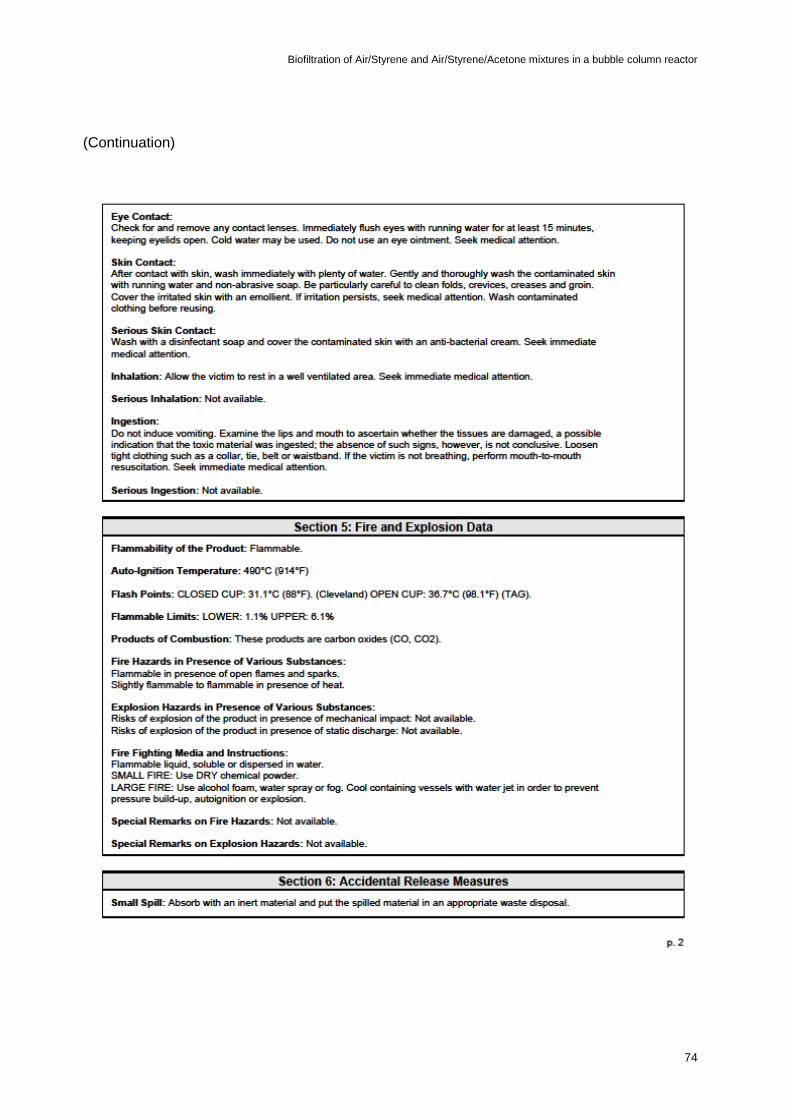
Biofiltration of Air/Styrene and Air/Styrene/Acetone mixtures in a bubble column reactor
74
(Continuation)
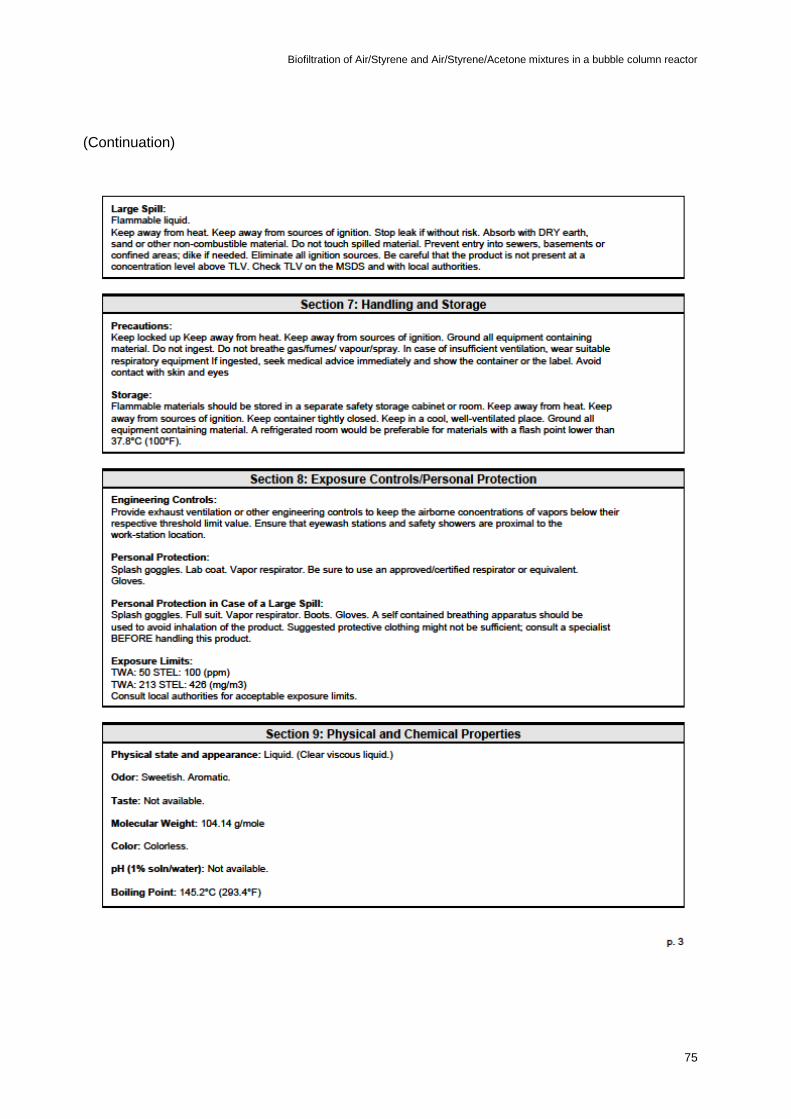
Biofiltration of Air/Styrene and Air/Styrene/Acetone mixtures in a bubble column reactor
75
(Continuation)
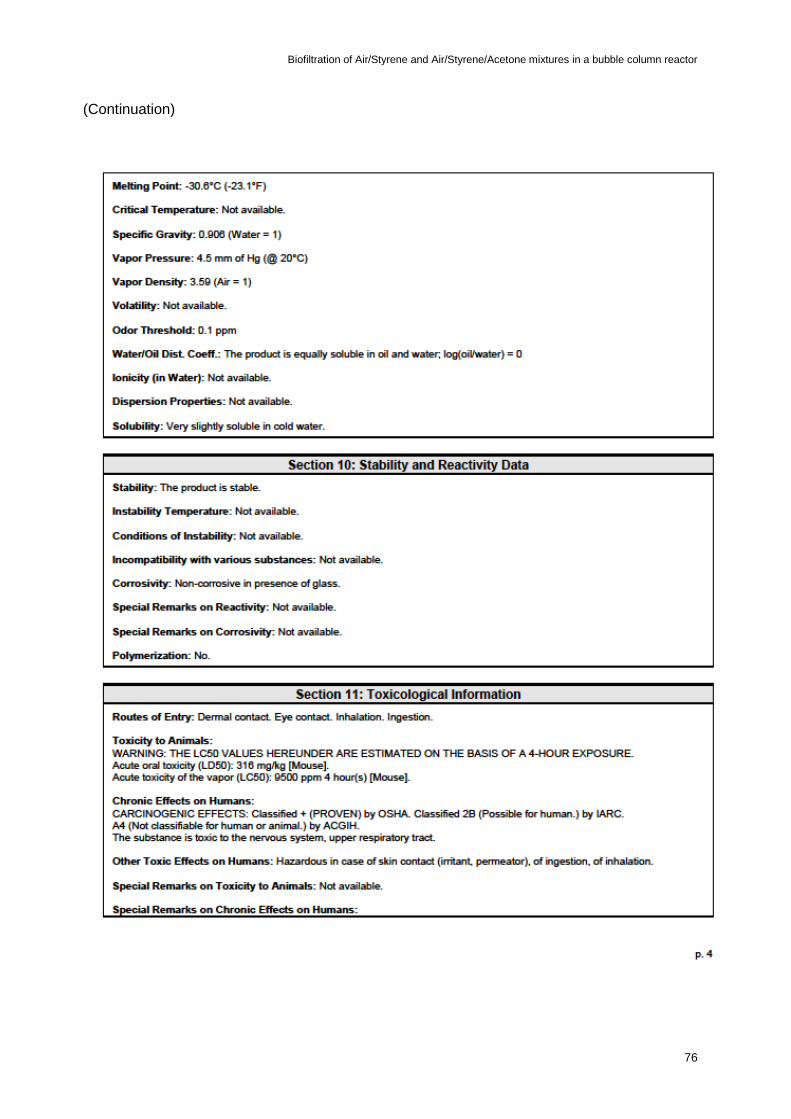
Biofiltration of Air/Styrene and Air/Styrene/Acetone mixtures in a bubble column reactor
76
(Continuation)

Biofiltration of Air/Styrene and Air/Styrene/Acetone mixtures in a bubble column reactor
77
(Continuation)

Biofiltration of Air/Styrene and Air/Styrene/Acetone mixtures in a bubble column reactor
78
(Continuation)
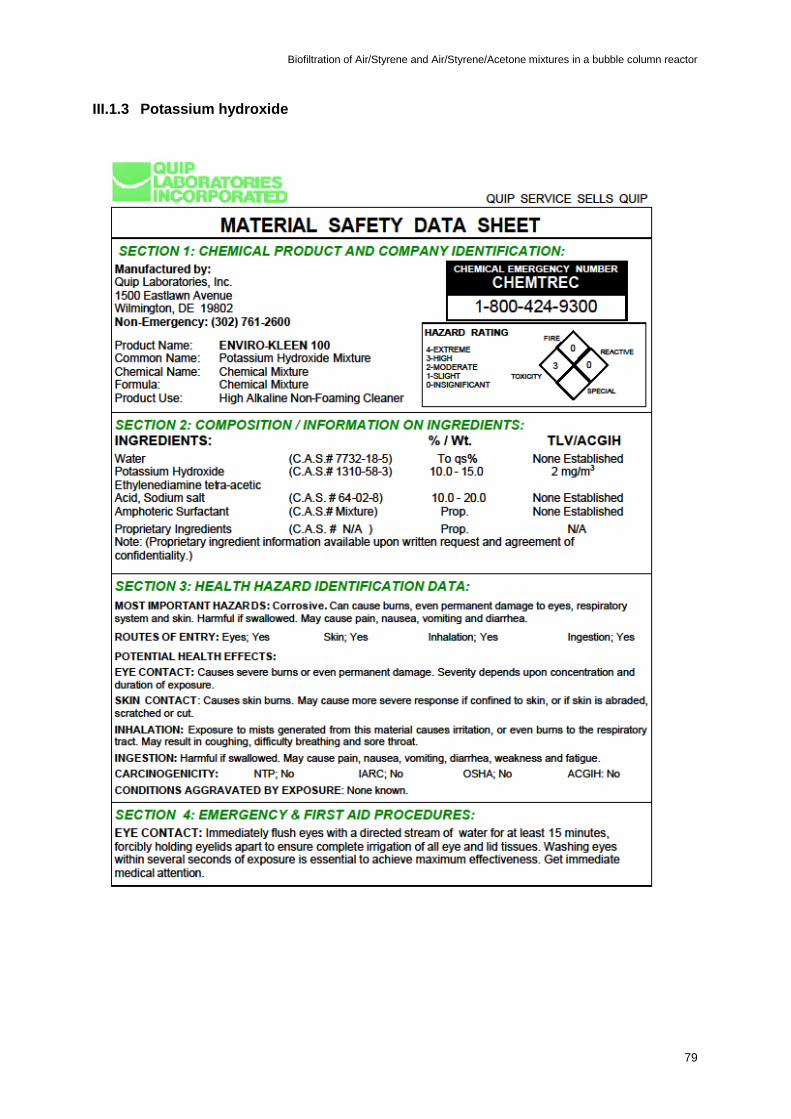
Biofiltration of Air/Styrene and Air/Styrene/Acetone mixtures in a bubble column reactor
79
III.1.3 Potassium hydroxide

Biofiltration of Air/Styrene and Air/Styrene/Acetone mixtures in a bubble column reactor
80
(Continuation)
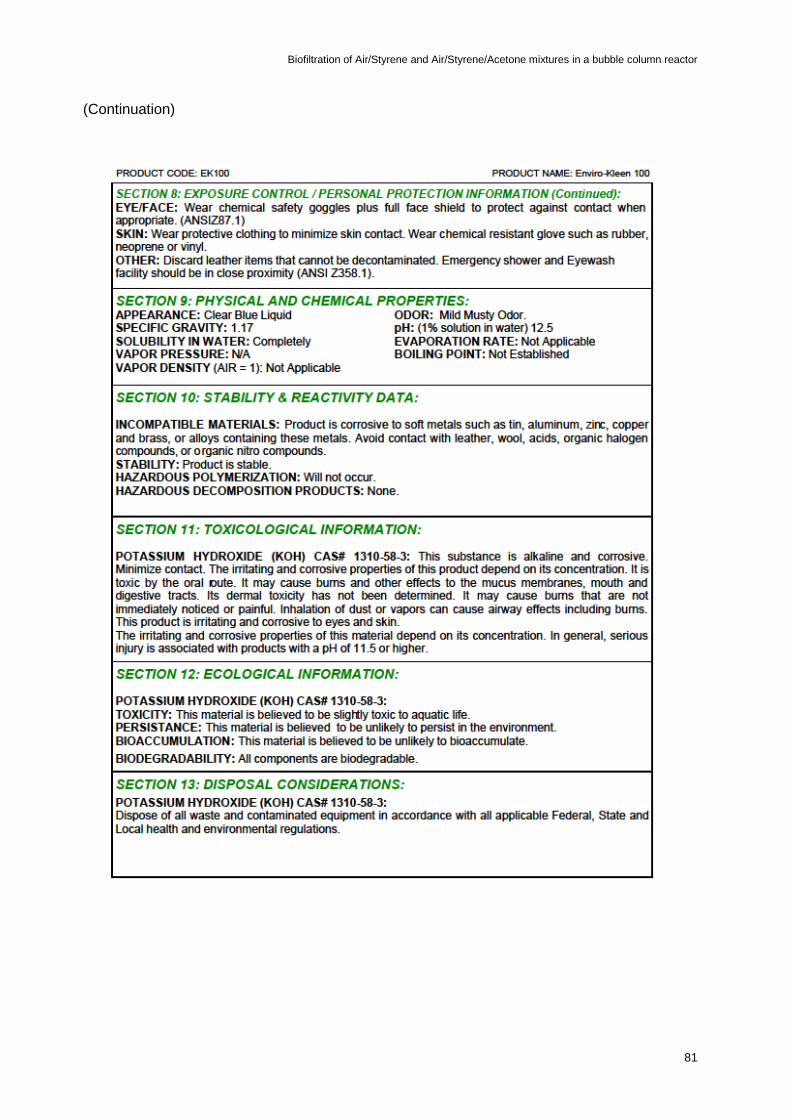
Biofiltration of Air/Styrene and Air/Styrene/Acetone mixtures in a bubble column reactor
81
(Continuation)
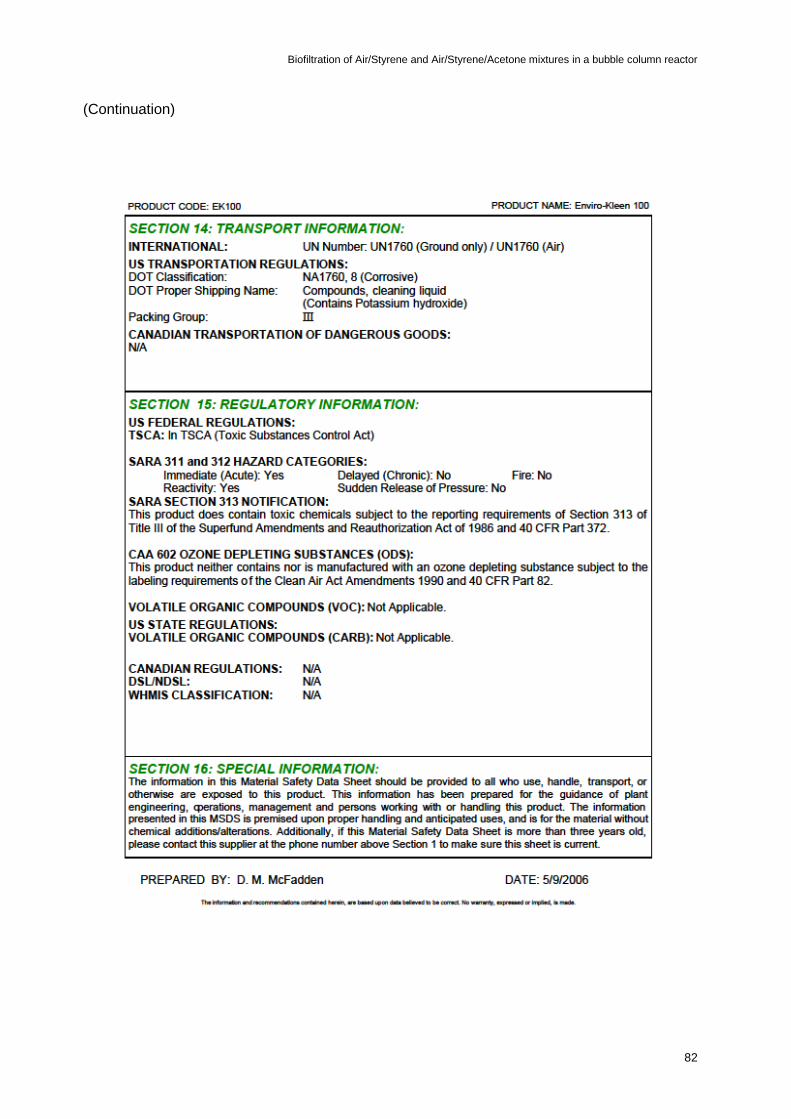
Biofiltration of Air/Styrene and Air/Styrene/Acetone mixtures in a bubble column reactor
82
(Continuation)