Embed Size (px)
DESCRIPTION
PERSPECTIVE FROM INDIA. Gufran Beig Indian Institute of Tropical Meteorology, Pune, India. International Forecasting Perspectives IWAQFR-2011, Wasington,DC. Gufran Beig (Program Director) Indian Institute of Tropical Meteorology, Pune (Ministry of Earth Sciences, Govt. of India). - PowerPoint PPT Presentation
Citation preview

Gufran Beig Indian Institute of Tropical Meteorology, Pune, India
International Forecasting PerspectivesIWAQFR-2011, Wasington,DC
PERSPECTIVE FROM INDIA

Gufran Beig (Program Director)
Indian Institute of Tropical Meteorology, Pune(Ministry of Earth Sciences, Govt. of India)
SYSTEM OF AIR QUALITY FORECASTING &
RESEARCH (SAFAR-India)

MISSION GOAL • Develop and dedicate the System of Air Quality
Forecasting & Research (SAFAR) to nation as an operational service in 7 Indian Metropolitan cities namely- Delhi, Pune, Ahmedabad, Mumbai, Kolkata, Chennai and Hyderabad.
• Synthesizing the air quality and health data, enhancing capacity building and developing the air quality health forecasting model to strengthen the national decision support system (DSS) through RCs.
What is SAFAR ?
(1) Weather Forecasting Model: Drives Air PollutantsMUST: Monitor Weather Parameters (24x7) WHY: Validating Forecast, Assimilate and Input back
(2) High resolution Emission inventories –Drives Forecast
(3) Air Quality Forecasting ModelMUST: Monitor Air Pollutants Strategically (24x7) WHY: Validating Forecast , Assimilate and input back
(4) Reaching to Public (a) Translate Data to Information; HOW- Develop AQI Concept (b) Issue Advisories & Alerts; HOW- Advise on Health via AQI
4
FORECASTING AIR OF TOMORROW(O3, NOx, CO, PM2.5, PM10, BC, BTX)

Regional Responsibilities
1. SAFAR System Development and Scientific Research:Indian Institute of Tropical Meteorology, Pune
2. Weather Forecasting Skill & Assimilation: NCMRWF, New Delhi
3. Operational Services of SAFAR: India Meteorological Department, New Delhi


M-23Pride of India -Mega Sports Event Begins

M30SAFAR Components -At a Glance

Online AQMS Data Input
Mumbai Ahmedabad Delhi
Pune
Bengaluru
Kolkata
Chennai
Regional Control Center -PUNE
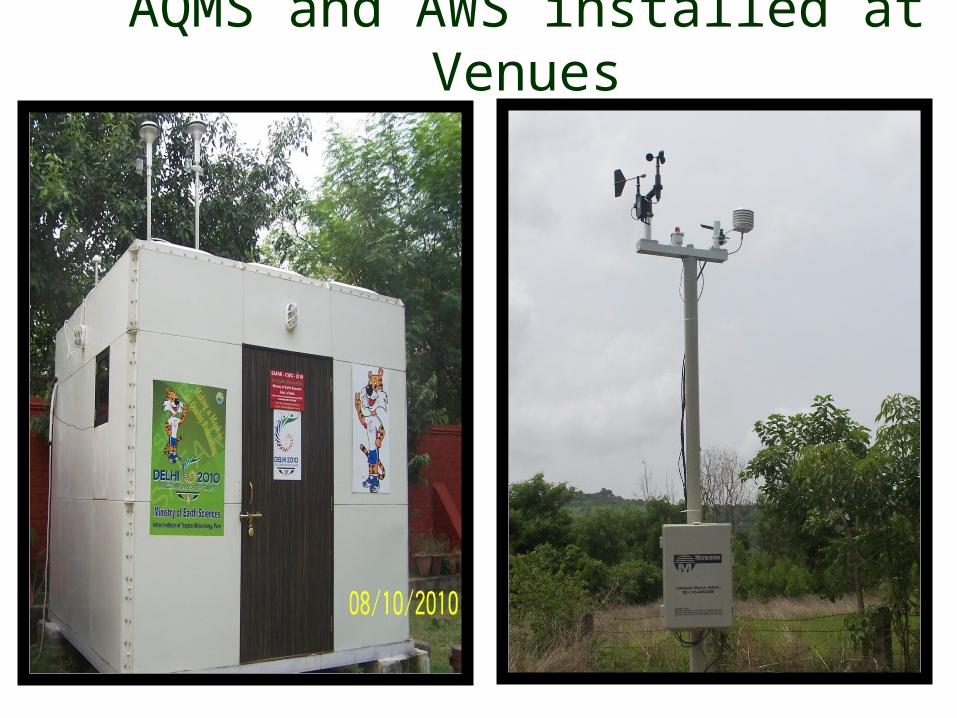
AQMS and AWS installed at Venues

Monitoring Station- Outer View
Monitoring Station- Inner View
Control Room


Air Quality in terms of AQIAir Quality in terms of AQI

AQMS Network of SAFAR at Delhi for CWG-2010
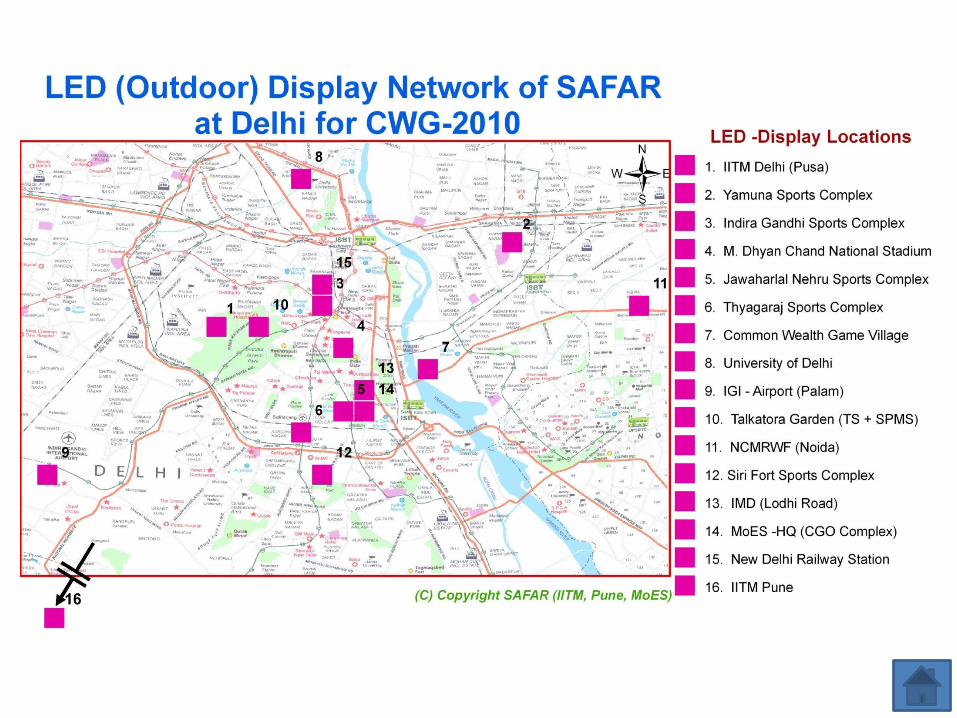
LED (Outdoor) Display Network of SAFAR at Delhi for CWG-2010
Delhi
Area : 1483 Km2 Density 2001 : 9294 Density 1991 : 6352
House Hold : 2554149Population 2011 : 18451000

Mumbai , Maharashtra
Area : 69 Km2 Density 2001 : 21190 Density 1991 : 20222
House Hold : 19063149 Population 2011 : 3873827

Pune , Maharashtra
Area : 15643 Km2
Density 2001 : 462 Density 1991 : 354 House Hold : 19063149 Population 2011 : 8412012


22
SAFAR –Scientific -6Air Quality Forecasting System
Meteorological Forecasting Model
(REMO /WRF)
Atmospheric Chemistry-Transport AQ-Model (CMAQ /WRF-Chem /REMO-Ch)IC, BCn, MOZART, VI, LULC, TRN, etc.
GIS-Based IITM Emission Inventory
Model / Sparse Matrix Invy. Model (SMOKE)
Air Pollution Monitoring Network (Ozone, NOx, CO, PM2.5, PM10, Benzene, Touline, Xylene, BC)
QC &QA (Quality Control
& Quality Assurance)
Air Quality Forecast Gridded (1.6 x1.6 km2)
Common ManData to Air Quality
Index (AQI)
Convey –SpeakMaps, Hot Spots,
Graphics, Animation
AWS Network Data + Assimilation
Temperature, Winds, Humidity, Rainfall, etc.
Base Line Emission Fossil fuel, Bio-fuel, Industries, Biogenic
sources, etc.
54
3
21
6

ATMOSPHPHERIC CHEMISTRY TRANSPORT FORECASTING MODEL
SYSTEM-1:Meteorological Model -WRF
Emission Model –GIS based Statistical Model (EGIS)Atmospheric Chemistry Transport Model –WRF-CHEM
Complete System: WRF-CHEM-EGIS

How to Communicate ?Common Public Need Simple Ways
Let Colors and Numbers Speaks Pollution and Health
Like Ballot Paper

25
Thyagaraj Stadium
POLLUTANTS AQI Quality
Ozone 46 Good
Oxides of Nitrogen
107Moderate
Carbon Monoxide
69Good
Particulate Matter < 2.5µm
210 Poor
Particulate Matter < 10µm
120 Moderate
Date: 8th Oct. 2010 Time: 11:00 h
AIR QUALITY – NOW


LED Display at Jawaharlal Nehru Stadium (JNS)

VERY POO
R
MO
DER
ATEG
OO
D
POO
R
Communication to Public: Your MOOD Stress Level

VERY UN
HEA
LTHY
Communication to Public: Your MOOD Stress Level

Communication to Public Pollution MOOD How Fearful
VERY POO
R
MO
DER
ATEG
OO
D
POO
R
Upset
Arrogantly A
ngryA
ngry
Co-operative

VERY UN
HEA
LTHY
Violent -Dragon
Communication to Public Pollution MOOD How Fearful

VisionTranslate Science to public
for Decision Support System Bridging the Gap
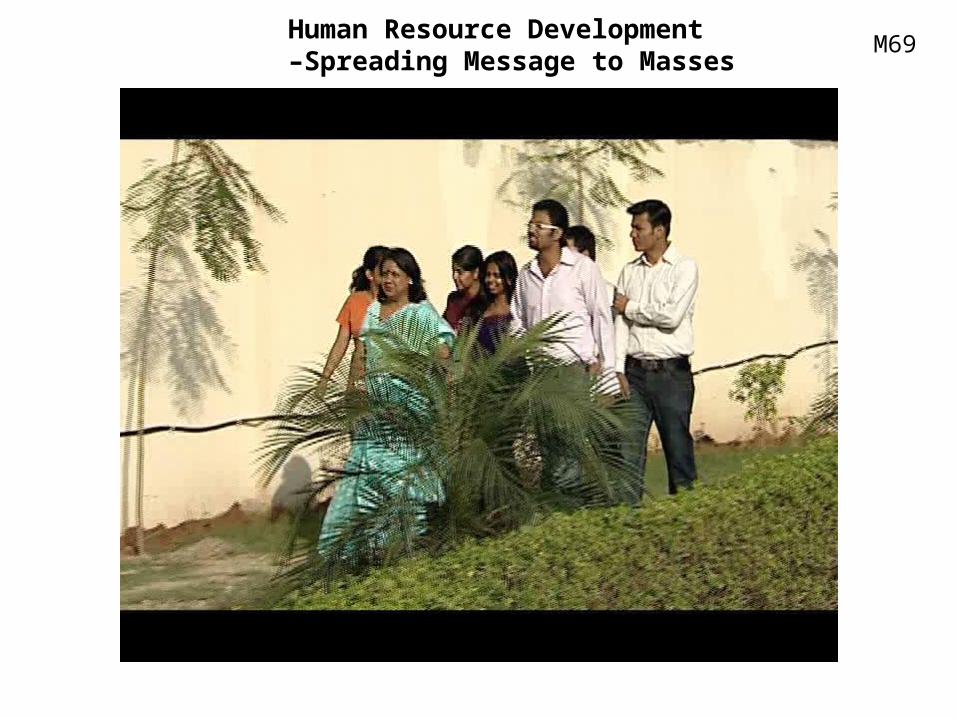
M69Human Resource Development –Spreading Message to Masses

M62Feedback on SAFAR from Youngest Swimmer of India in CWG-2010

FINALLYPublic Advisory
How are you and your health will be – TOMORROW (15:00h)
STAGE = 3
WORSE 1 2 3 4 5 BEST
< 1 = WORSEThe environment degraded to the point where rehabilitation is impossible
> 5 = BEST
The environment is clean and in perfect condition. No any
anthropogenic influences

Ahmedabad , Gujrat
Area : 8707 Km2 Density 2001 : 718 Density 1991 : 567
House Hold : 9643989Population 2011 : 6775313

Bengaluru ,Karnataka
Area : 2190 Km2 Density 2001 : 2979 Density 1991 : 2210
House Hold : 10232133Population 2011 : 7350039
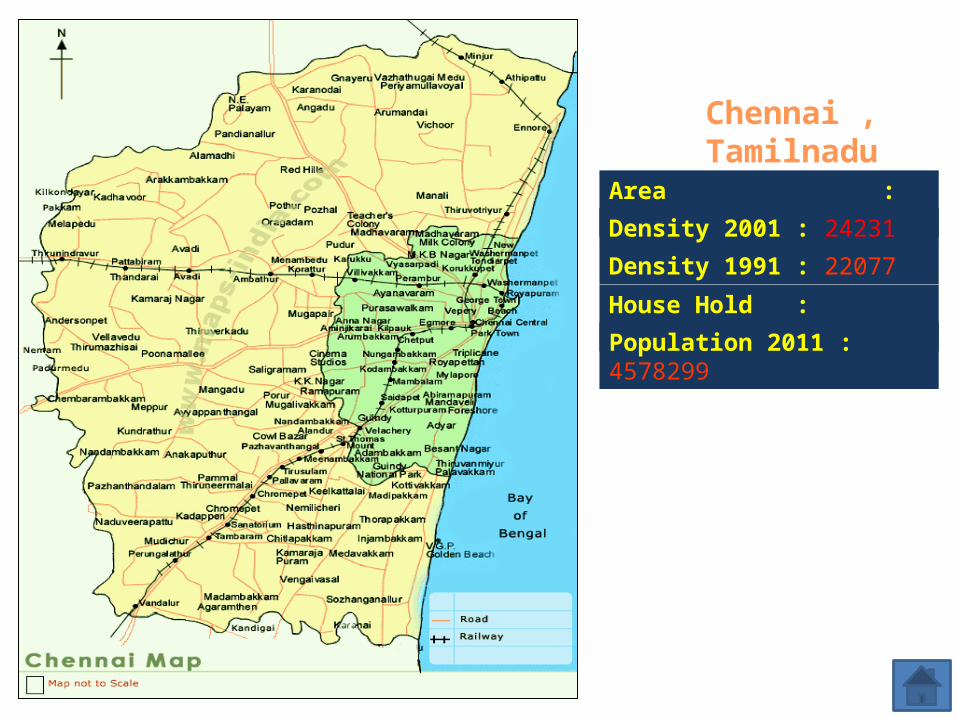
Chennai , Tamilnadu
Area : 174 Km2 Density 2001 : 24231 Density 1991 : 22077
House Hold : 14173626Population 2011 : 4578299

Kolkata , WB
Area : 185 Km2 Density 2001 : 24760
Density 1991 : 23783House Hold : 15715915 Population 2011 : 5110298