Embed Size (px)
Citation preview

Guam Power AuthorityComprehensive Management and Organizational Assessment, Phase 2 Executive Summary
September 2009
©Baker Tilly Virchow Krause, LLP

1-2
Phase 2 executive summary
Table of contents› Performance and productivity summary› Results› Recommendations › Roadmap and implementation waves

1-3
ThemesThe following themes were used to discuss performance and productivity at GPA:
Theme Description
Strategy The ability to set, drive and measure execution against strategy throughout the organization.
People Increasing the level of accountability of all employees and developing the skills needed to deliver against targets.
Process Identifying and managing core processes against appropriate targets with the ability to analyze and improve.
Technology & infrastructure
Establishing the right technology and infrastructure enabling the right information to support strategies, people and processes.
Phase 2 executive summary

1-4
Results - GPA performance strengthsTheme Performance points
Strategy › Ability to meet and address critical regulatory requirements› Considering outsourcing of non-core, variable effort functions
such as vegetation management› PMC program has improved generation management and
performance› CCU role and governance has evolved since inception
People › Development of the Certified, Technical and Professional (CTP) program and definitions of position requirements
› Successful implementation of the apprenticeship program to address workforce gaps
› Staff does what it takes to get the job doneProcess › Improved generation performance
› Overall significant reduction in overtime over last 6 years› Improved analyst ratings› Payroll process has gained efficiencies through direct deposit
initiativeTechnology & Infrastructure
› Improved infrastructure built to weather storms› IT user security and desktop support is sound› Management of the IT network is good
Phase 2 executive summary

1-5
Improvement theme
Corporate Governance
Strategy Planning & Execution Financial Strength Customer Service Operations
Strategy • Formal strategy not communicated and driven across business units or through employee levels
People • Training gap – specifically in usage of information systems and technology• Lack of accountability through performance measures
• Limited succession plan • Limited workforce planning
• Without a comprehensive set of the metrics, staff may not be focused on the right actions to drive customer satisfaction
• Inability to keep up with work backlog
• Open manager position• Inefficient crews (crew sizes
can be reduced)
• Unbalanced span of control
• Performance not linked to strategies
Process • Few KPIs or metrics managed or tracked for improvement• Lack of communication between departments
• Lack of goal setting• Lack of management
evaluations by CCU
• Identified strategies were not executed nor integrated across the utility
• Process metrics not adequately linked to strategies
• Inefficient processes:o Budgetingo Reporting and
forecastingo Close the bookso Payroll
• Meter repairs and MV90 reading in T&D, not customer service
• Dissatisfied customers• Inefficient disconnect /
reconnect process
• Low electric system reliability• Inadequate procurement
process relative to needs• Inefficient maintenance process• Inadequate distribution planning
guidelines
Technology & Infrastructure
• Not using reporting abilities to monitor health of GPA
• System utilization is sub-optimized to support strategies
• Inadequate training on JDE
• High number of system work-arounds
• Poor utilization of Utiligy
• Inadequate field technology
• Inadequate field technology• Economic Dispatch Model
improvements
Results - GPA performance impacting issues
Phase 2 executive summary

1-6
Results - GPA productivity› GPA requires more staff than expected (based on comparable mainland
utilities) to deliver and manage energy for its customers.
* See Staffing and Productivity section for analysis
Phase 2 executive summary
(1) Includes allocated resources from Engineering and PSCC(2) Includes apprentices and contractors(3) See the following page for explanation of Generation conclusion
Business unitGPA
Today(2)Expected
range Variance Key aspects related to GPA
Generation (1) 236 No Conclusion(3) 0
> High percentage of oil and diesel fueled generation> Significantly higher capacity built into system
Transmission & Distribution (1) 167 160 – 170 0
> Less use of technology (smart meters, mobile data terminals, GPS)
> More outages due to load balance, storms
Customer Service 55 38 - 48 +7
> High percentage of walk-in payments> Inefficient field service scheduling
Meter Reading 13 10 - 12 +1> More difficult geography and terrain> More limited use of technology and Information Systems
Administrative and General 126 113 - 123 +3
> More limited use of technology and Information Systems> Limited shared services
TOTAL 597 557 – 589 +11

1-7
Results - GPA productivityDetermination of appropriate generation staffing level was inconclusive based upon the following facts:›Staffing at mainland utilities was highly correlated with demand attributes such as total production (MWh) and peak demand (MW);›GPA maintains significantly more capacity compared to its demand than surveyed utilities;
–The number of generating units (25) maintained and operated by GPA is almost 80% higher than the next highest surveyed utility (14);–GPA’s ratio of capacity to peak demand is 13% higher than the next highest surveyed utility;
›If the current capacity levels and generation units are determined to be appropriate based on GPA’s unique position as an isolated power provider, it is possible that that the staffing levels are reasonable, though a more detailed, work unit based staffing analysis would need to occur to conclude accurately on the staffing level.
Phase 2 executive summary

1-8
RecommendationsStaffing changes›GPA’s staffing level is close to what would be expected›Higher productivity can lead to less staff (per equivalent output). By increasing productivity, GPA can utilize its capacity to ramp up for expected future demand›The following roadmap, based on our assessment, will guide the utility toward improved efficiency and effectiveness, however resources will be needed to implement the recommendations›We recommend a slow reduction in staff over a couple of years where, when attrition occurs, staffing changes are made›Hiring of key positions, such as the IT manager and Generation manager should not be delayed›Workforce planning and succession planning efforts, when implemented, will aid the organization in identification of required skills and positions for the future
Phase 2 executive summary

1-9
B4. Change cultureB5. Improve safetyB6. Improve workforce productivity controls
C5. Improve financial processC6. Improve T&D efficiencyC7. Improve account management
D3. Improve data integrity and reportingD4. Implement IT Risk Management controlsD5. Increase use of technology in T&D
Phase 2 executive summary
Recommendation themes

1-10
Recommendation themes – strategyRef Sub-themes InitiativesA1 Improve strategic focus 1. Implement strategic planning process
A2 Improve focus in performance and accountability
1. Implement monitoring process for KPIs and metrics
Phase 2 executive summary

1-11
Recommendation themes – peopleRef Sub-themes InitiativesB1 Develop workforce
planning process1. Develop workforce planning process2. Develop succession planning process
B2 Enhance performance, accountability and transparency
1. Revise management reporting structure and improve transparency of information and decisions (move accountability downward in GPA)
B3 Fill critical positions 1. Fill the open Generation Manager position2. Hire Business Analyst to improve analysis3. Hire IT Manager
B4 Change culture 1. Change culture to become more customer focused
B5 Improve safety 1. Improve safety and awareness
B6 Improve workforce productivity controls
1. Improve overtime controls2. Manage absenteeism3. Update policy on military leave
Phase 2 executive summary

1-12
Recommendation themes – processRef Sub-themes InitiativesC1 Increase focus on
customer needs1. Use metrics to measure customer needs and
satisfactionC2 Improve equipment
performance1. Use economic dispatch to revise annual
maintenance schedulesC3 Improve operational
reliability1. Control externally-owned generation2. Evaluate Automatic Generation Control use3. Improve spinning reserve process for continual
operation4. Improve parts and material availability5. Improve reliability by reducing outage time6. Improve preventative maintenance7. Improve generation scheduling8. Improve relay management9. Improve meter replacement
Phase 2 executive summary

1-13
Recommendation themes – process (cont.)Ref Sub-themes InitiativesC4 Improve customer service
experience process1. Expedite customer wait times2. Improve / automate disconnects and reconnects
C5 Improve financial process 1. Improve the budgeting process2. Improve variance reporting and forecasting3. Improve the close the books process4. Move collections to accounts receivable5. Improve time entry and payroll process6. Automate monthly clearings 7. Revise fuel and operating cost acquisition model8. Improve repair and replace decisions
C6 Improve T&D efficiency 1. Improve T&D planning2. Reduce meter reading by T&D staff3. Transition to one-person trouble truck crew size4. Implement Geographic Information System
C7 Improve account management
1. Improve account management
Phase 2 executive summary

1-14
Recommendation themes – information and technology
Ref Sub-themes InitiativesD1 Develop IT Strategy 1. Develop IT strategy
D2 Improve utilization of systems
1. Optimize technology investments2. Develop training program for JDE users and IT
support3. Improve utilization of Utiligy for customer service
D3 Improve data integrity and reporting
1. Improve data integrity and reporting in JDE and Utiligy
D4 Implement IT risk management controls
1. Implement risk management and IT controls2. Develop controls over 3rd party service
agreementsD5 Increase use of technology
in T&D1. Utilize mobile data equipment2. Implement Work Management System
Phase 2 executive summary

1-15
Phase 2 executive summary
Roadmap for implementation› The following slides provide a guide or roadmap for implementation. The
48 identified initiatives are organized into four “waves” over the next three years.
› Priority and impact on the organization was evaluated and the initiatives were sequenced based on importance, dependencies between initiatives and time to implement.
› The order of initiatives in the proposed waves gives priority to initiatives with strategic importance first such that the necessary infrastructure is in place to enable effective operations and enhancement in the overall performance of the organization. The filling of essential positions was also given priority, as these key leadership positions are critical policy and operations leaders. Improving the focus on the ratepayer was also determined important.
› Gantt charts present waves with suggested timetable for initiatives’implementation.
› It is recommended that GPA review the initiatives and prioritize the recommendations based on available financial and personnel resources.

1-16
Phase 2 executive summary
1. Enhance performance, accountability, and transparency(B2.1)2. Implement strategic planning process (A1.1 )3. Implement monitoring process for KPIs and metrics (A2.1)4. Develop workforce planning process (B1.1)5. Develop succession planning process (B1.2)6. Use metrics to measure customer needs and satisfaction
(C1.1)
7. Improve meter replacement (C3.9)8. Hire IT Manager (B3.3)9. Fill the open Generation Manager position (B3.1)10. Improve the close the books process (C5.3)11. Evaluate Automatic Generation Control use (C3.2)12. Develop IT strategy (D1.1)13. Optimize technology investments (D2.1)W
AVE
1
14. Use economic dispatch process to revise annual maintenance schedules (C2.1)
15. Control externally-owned generation (C3.1)16. Improve generation scheduling (C3.7)17. Improve T&D planning (C6.1)18. Utilize mobile data equipment (D5.1)19. Improve safety and awareness (in T&D) (B5.1)
20. Improve parts and material availability (C3.4)21. Improve reliability by reducing outage time (C3.5)22. Improve spinning reserve for continual operation (C3.3)23. Improve / automate disconnects and reconnects (C4.2)24. Improve the budgeting process (C5.1)25. Improve utilization of Utiligy for customer service (D2.3)26. Revise fuel and operations cost acquisition model (C5.7)
WA
VE 2
27. Improve repair/replace decisions (C5.8)28. Move collections to accounts receivable (C5.4)29. Hire Business Analyst to improve analysis (B3.2)30. Automate monthly clearings (C5.6)31. Transition to one-person trouble truck crew size (C6.3)32. Improve overtime controls (B6.1)
33. Implement risk management and IT controls (D4.1)34. Reduce meter reading by T&D staff (C6.2)35. Expedite customer wait times (C4.1)36. Change culture to become more customer focused (B4.1)37. Improve data integrity and reporting in JDE and Utiligy (D3.1)38. Implement Geographic Information System GPA-Wide (C6.4)W
AVE
3
39) Improve account management (C7.1)40) Improve relay management (C3.8)41) Improve variance reporting and forecasting (C5.2)42) Manage absenteeism (B6.2)43) Update policy on military leave (B6.3)44) Improve preventative maintenance (C3.6)
45. Develop training program for JDE users and IT support (D2.2)
46. Develop controls over 3rd party service agreements (D4.2)47. Implement Work Management System (D5.2)48. Improve time entry and payroll process (C5.5)W
AVE
4
Initiative waves

1-17
Phase 2 executive summary
Wave 1 ID Wave 1 Inititives
Q4 09 Q1 10 Q3 10Q2 10 Q4 10
May Jun Aug OctAprFeb DecMar SepJan NovOct Nov JulDec
1 Enhance performance, accountability, and transparency (B2.1)
2 Improve strategic planning process (A1.1)
3 Implement monitoring process for KPIs and metrics (A2.1)
4 Develop workforce planning process (B1.1)
5 Develop succession planning process (B1.2)
6 Use metrics to measure customer needs and satisfaction (C1.1)
7 Improve meter replacement (C3.9)
8 Hire IT manager (B3.3)
9 Fill the open Generation Manager position (B3.1)
10 Improve the close the books process (C5.3)
11 Evaluate Automatic Generation Control use (C3.2)
12 Develop IT strategy (D1.1)
13 Optimize technology investments (D2.1)
Duration
8w
12w
10w
16w
8w
13w
12w
8w
12w
12w
8w
12w
20w
1-18
Phase 2 executive summary
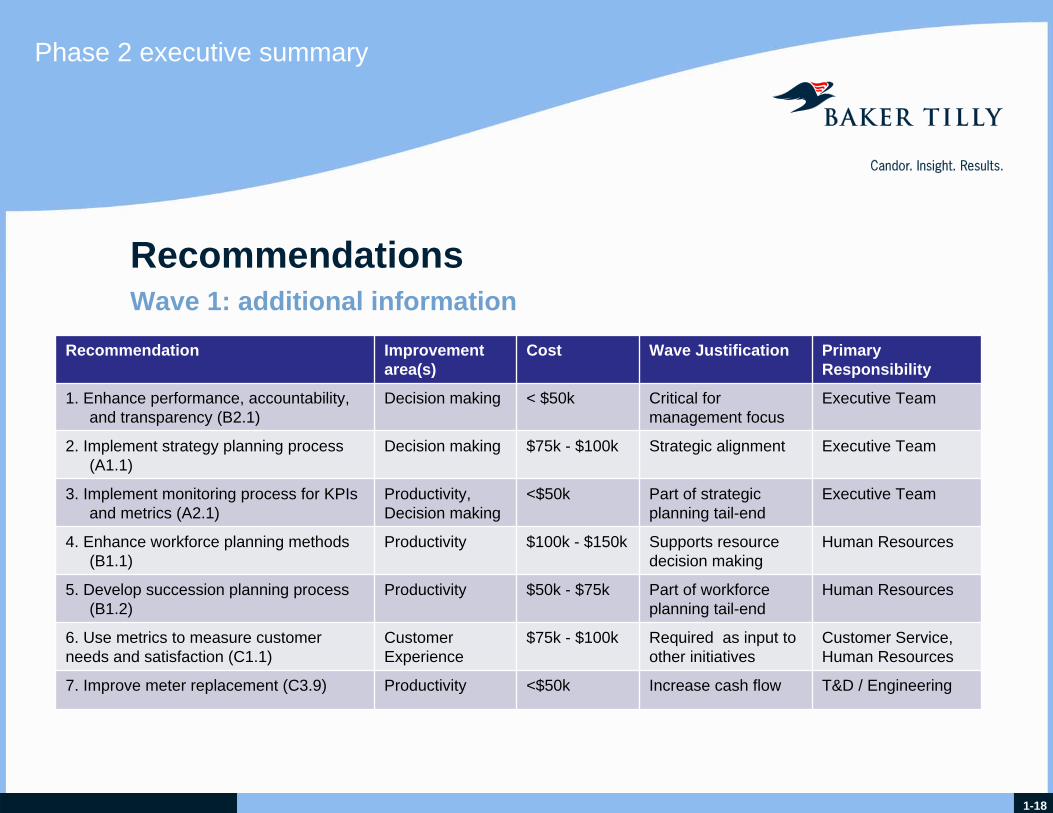
Recommendation Improvement area(s)
Cost Wave Justification Primary Responsibility
1. Enhance performance, accountability, and transparency (B2.1)
Decision making < $50k Critical for management focus
Executive Team
2. Implement strategy planning process (A1.1)
Decision making $75k - $100k Strategic alignment Executive Team
3. Implement monitoring process for KPIs and metrics (A2.1)
Productivity, Decision making
<$50k Part of strategic planning tail-end
Executive Team
4. Enhance workforce planning methods (B1.1)
Productivity $100k - $150k Supports resource decision making
Human Resources
5. Develop succession planning process (B1.2)
Productivity $50k - $75k Part of workforce planning tail-end
Human Resources
6. Use metrics to measure customer needs and satisfaction (C1.1)
Customer Experience
$75k - $100k Required as input to other initiatives
Customer Service, Human Resources
7. Improve meter replacement (C3.9) Productivity <$50k Increase cash flow T&D / Engineering
RecommendationsWave 1: additional information

1-19
Phase 2 executive summary
Recommendation Improvement area(s)
Cost Wave Justification Primary Responsibility
8. Hire IT Manager (B3.3) Decision making <$50k Required for decision making
Executive Team
9. Fill the open Generation Manager position (B3.1)
Decision making $75k - $100k Required for decision making
Executive Team
10. Improve the close the books process (C5.3)
Decision making, productivity
$75k - $100k Improve cash flow Finance
11. Evaluate Automatic Generation Control use (C3.2)
Economic (cost avoidance)
< $50k Required as input to other initiatives
Generation / Engineering
12. Develop IT strategy (D1.1) Decision making <$50k Set direction for other initiatives
IT
13. Optimize technology investments (D2.1)
Productivity $200k -$250k
Input for other initiatives
IT, Finance, Customer Service
RecommendationsWave 1: additional information (cont.)

1-20
Phase 2 executive summary
Wave 2

1-21
Phase 2 executive summary
RecommendationsWave 2: additional information
Recommendation Improvement area(s)
Cost Wave Justification Responsibility
14. Use economic dispatch to revise annual maintenance schedules (C2.1)
Economic Benefit **
< $50k Further detailed studies required
Generation / Engineering
15. Control externally-owned generation (C3.1)
Reliability $300 -$1,450k
Ease of implementation
Generation / Engineering
16. Improve Generation scheduling (C3.1)
Economic Benefit
< $50k Evaluate Automatic Generation Control Use first
Generation / Engineering
17. Improve T&D planning (C6.1) Economic Benefit
> $100k Ease of implementation
T&D / Engineering
18. Utilize mobile data equipment (D5.1) Productivity $150 -$200k
Ease of implementation
T&D / Engineering
19. Improve safety and awareness (B5.1)
Productivity < $50k Safety metrics T&D / Engineering
20. Improve parts and material availability (C3.4)
Reliability $50 - $75k Metrics Generation / Engineering
** Further studies will indicate cost savings level.

1-22
Phase 2 executive summary
RecommendationsWave 2: additional information (cont.)
Recommendation Improvement area(s)
Cost Wave Justification Responsibility
21. Improve reliability by reducing outage time (C3.5)
Reliability $205 –$240k Ease of implementation
T&D / Engineering
22. Improve spinning reserve for continual operation (C3.3)
Reliability $675-$1,300k
Ease of implementation
Generation / Engineering
23. Improve / automate disconnects and reconnects (C4.2)
Productivity $75 - $100k Metrics Customer Service / IT
24. Improve the budgeting process (C5.1)
Decision making > $100k Metrics and report writing ability
Finance
25. Improve utilization of Utiligy for customer service (D2.3)
Productivity, Customer Experience
$150 -$200k
Optimize technology IT / Customer Service / T&D
26. Revise fuel and operating cost acquisition model (C5.7)
Economic Benefit
< $50k Ease of implementation
Finance

1-23
Wave 3
Phase 2 executive summary

1-24
Phase 2 executive summary
Recommendation Improvement area(s)
Cost Wave Justification Responsibility
27. Improve repair and replace decisions (C5.8)
Decision making $50 - $75k Ease of implementation
T&D / Engineering / Finance
28. Move collections to accounts receivable (C5.4)
Productivity < $50k Ease of implementation
Customer Service / Finance
29. Hire Business Analyst to improve analysis (B3.2)
Productivity, Decision making
< $50k Identify report writing required
Finance
30. Automate monthly clearings (C5.6) Productivity, Decision making
< $50k Optimize technology investments
Finance
31. Transition to one-person trouble truck crew size (C6.3)
Productivity $75 - $100k After Improve Safety Awareness
T&D / Engineering
32. Improve overtime controls (B6.1) Economic Benefit *
< $50k Staffing metrics Executive Team
33. Implement risk management and IT controls (D4.1)
Reliability $50 - $75k IT strategy IT
34. Reduce meter reading by T&D staff (C6.2)
Productivity $75 - $100k Training T&D / Engineering/ Customer Service
RecommendationsWave 3: additional information
* $100k - $200k annual savings assuming 5-10% reduction.

1-25
Phase 2 executive summary
Recommendation Improvement area(s)
Cost Wave Justification Responsibility
35. Expedite customer wait times (C4.1) Customer Experience
< $25k Customer Service metrics
Customer Service
36. Change culture to become more customer focused (B4.1)
Customer Experience
< $50k Ease of implementation
Customer Service / Executive Team
37. Improve data integrity and reporting in JDE and Utiligy (D3.1)
Productivity, Decision making
< $50k Optimize technology, hire Business Analyst
IT
38. Implement Geographic Information System GPA-Wide (C6.4)
T&D > $1.0M Ease of implementation
T&D / Engineering
RecommendationsWave 3: additional information (cont.)

1-26
Wave 4
Phase 2 executive summary
ID Wave 4 Initiatives DurationQ4 11Q3 11Q2 11Q1 11
Sep DecNov NovDec SepJul AugOct Oct
1
2
3
4
5
6
7
8
9
10
8wImprove account management (C7.1)
12wImprove relay management (C3.8)
8wImprove variance reporting and forecasting (C5.2)
4wManage absenteeism (B6.2)
52wUpdate policy on military leave (B6.3)
12wImprove preventative maintenance (C3.6)
4wDevelop training program for JDE users and IT support (D2.2)
8wDevelop controls over 3rd party service agreements (D4.2)
12wImplement Work Management System (D5.2)
12wImprove time entry and payroll process (C5.5)
Q4 10Q3 10
May JunFeb AprAug MarJanJul

1-27
Phase 2 executive summary
RecommendationsWave 4: additional information
Recommendation Improvement area(s)
Cost Wave Justification Responsibility
39. Improve account management (C7.1)
Customer Experience
< $50k Optimize technology Customer Service
40. Improve relay management (C3.8) Productivity < $50k Ease of implementation
T&D / Engineering
41. Improve variance reporting and forecasting (C5.2)
Decision making $75 - $100k Budgeting Finance / IT
42. Manage absenteeism (B6.2) Economic Benefit
< $50k Metrics HR
43. Update military leave policy (B6.3) Productivity, Economic Benefit
< $50k Ease of implementation
HR
44. Improve preventative maintenance (C3.6)
Reliability $50 - $75k Staff availability T&D / Engineering
45. Develop training program for JDE users and IT support (D2.2)
Productivity < $50k Optimize technology IT / Customer Service / Finance / T&D
46. Develop procedures and controls over 3rd party service agreements (D4.2)
Reliability < $50k Risk assessment IT

1-28
Phase 2 executive summary
RecommendationsWave 4: additional information (cont.)
Recommendation Improvement area(s)
Cost Wave Justification Responsibility
47. Implement Work Management System (D5.2)
Productivity $750k Ease of implementation
T&D . Engineering
48. Improve time entry and payroll process (C5.5)
Productivity, Decision making
< $50k Metrics Finance / IT

1-29
RecommendationsManagement support for change›Management recommendations have been introduced and executed in the past with varying success.
– 2006 Renoir study identified some similar issues and recommendations. Our team did not find evidence of initiatives to address many of these issues
– 2007 IT strategic plan recommendations not implemented.›Given the scope and potential impact of the proposed roadmap, it is imperative that the executive management team devote required focus to strategic initiatives and less on day-to-day issues that will distract them from achieving strategic goals.
Phase 2 executive summary

1-30
How do you effectively manage through the roadmap at GPA?
›Prepare organization to take on initiatives– Engage leaders in the process and provide forum and
environment for input– Evaluate the initiatives, prioritize and customize the roadmap to
meet GPA’s needs›Prepare people to succeed
– Identify leaders with the right skills, motivation and capabilities to lead and build capacity in workforce to meet new demands on top of day to day tasks
– Motivate staff to build and operate in new environment– Develop clear and common vision across organization– Clearly define and communicate new job roles, responsibilities
and expected behaviors
Phase 2 executive summary

1-31
› Identify existing cost and benefit data
› Prepare high level work plan including identification of needed resources
› Finalize data collection plan› Conduct project kick-off› Conduct workshops
› Identify and measure process improvement opportunities
› Build financial model› Assess change readiness
› Conduct process design meetings including identifying the gaps between current state and future state
› Update findings documentation› Iterate financial model› Sign off on findings
documentation
› Develop business case presentation based on data request responses and on-site visits and interviews
› Present business case› Prepare implementation plan› Manage change
For each chosen initiative, GPA should employ a standard process for managing the scope, workplan, design and implementation. The process below is a high level structure which should assist GPA in implementation.
Evolve future state process design
Begin organizational change adoption
Phase 2 executive summary

1-32
Begin organizational adoption to change
Evolve future state process design
Option 5 Cash Flow Analysis Total Project2006 2007 2008 2009 2010 2011 2012 2013 2014
Project InvestmentHardw are (Capitalized) 1,439$ 125$ 159$ 980$ 175$ -$ -$ -$ -$ -$ Softw are (Capitalized) 5,127$ 345$ 529$ 3,404$ 849$ -$ -$ -$ -$ -$ Technology Development (Capitalized) 303$ - -$ 121$ 182$ -$ -$ -$ -$ -$ Implementation (Capitalized) 7,599$ 505 728$ 5,097$ 1,269$ -$ -$ -$ -$ -$
Discretionary Capital (15%) 2,170$ 146 212 1,440 371 - - - - - Total Investment 16,638$ 1,121$ 1,628$ 11,043$ 2,846$ -$ -$ -$ -$ -$
Project BenefitsIdentified Hard Savings 8,946$ - 31$ 243$ 1,133$ 2,231$ 2,231$ 1,560$ 1,200$ 316$ Identified Soft Savings 2,577 99 592$ 592$ 314$ 490$ 490$ -$ -$ -$
Total Identified Benefit 11,523$ 99$ 623$ 835$ 1,447$ 2,721$ 2,721$ 1,560$ 1,200$ 316$
Yet To Be Identified SavingsFinance -$ -$ -$ -$ -$ -$ -$ -$ -$ -$ IT -$ - - - - - - - - - Operations -$ - - - - - - - - - Sales/Engineering -$ - - - - - - - - -
Total Unidentified Benefit -$ -$ -$ -$ -$ -$ -$ -$ -$ -$
Project CostsMaintenance 3,939$ 15 83$ 178$ 707$ 753$ 705$ 692$ 701$ 105$
Reorg/Recruit/Backfill -$ - -$ -$ -$ -$ -$ -$ -$ -$ Implementation/Program Mgmt 2,144$ 768 544$ 448$ 384$ -$ -$ -$ -$ -$ Depreciation 16,638$ - 224 550 2,758 3,328 3,328 3,103 2,778 569
Total P&L Costs 22,722$ 783$ 851$ 1,176$ 3,849$ 4,081$ 4,033$ 3,795$ 3,479$ 674$
Net BenefitNet P&L Based on Identified Benefits (11,199)$ (685)$ (228)$ (341)$ (2,402)$ (1,360)$ (1,312)$ (2,235)$ (2,279)$ (358)$ Net P&L Based on Total Benefits (11,199) (685) (228) (341) (2,402) (1,360) (1,312) (2,235) (2,279) (358)
EPS Impact ($0.40) ($0.02) ($0.01) ($0.01) ($0.09) ($0.05) ($0.05) ($0.08) ($0.08) ($0.01)
Net Present Value (9,211)
Organization 1 Organization 2 Organization 3
Organization Profile $528M Budget
3,000 Employees
287,000 Citizens
$1,000 M Budget
4,700 Employees
735K Citizens
$860M Budget
3,200 Employees
410,000 Citizens
Software Package TBD SAP SAP
Users TBD 235 named users, 5 developers 500
Approx External Cost (Software, Implementation)
TBD $6.3M $6.6M
Functionality Implemented
• AP/AR/GL
• Budgeting
• Procurement & Contracts
• Human Capital
• Project Accounting
• Assets
• Grants
• Treasury
• Procurement & contracts
• Cash & debt management
• Human capital
• Grants
• Assets
• Project accounting
• AP/AR/GL
• AP/AR/GL
• Budgeting
• Procurement & Contracts
• Human Capital
• Project Accounting
• Assets
Implementation Team TBD 21.5 FTE 24 FTE
Ongoing Team TBD 3.75 FTE (externally hosted) 15 FTE
Implementation Duration
TBD Finance – 11 Months
HR/Payroll – 18 Months
Finance – 9 Months
HR / Payroll – 12 Months
Financing Method TBD Special Development Corporation & Outsourced
Capital project
Efficiency Client Industry Sector S&P 500
Revenue/Employee (*TTM) 82,682 211,185 378,148 544,147
Net Income/Employee (TTM) 2003 : 5 2002 : 2,318
15,079 25,674 83,057
Receivable Turnover (TTM) 6.82 6.65 8.54 9.73
Inventory Turnover (TTM) 5.15 6.44 7.85 10.41
Asset Turnover (TTM) 0.87 1.18 1.10 0.92
Option 5 Description or Area Div 1 Div 2 Div 3 Div 4 Div 5 Div 6 CorpIdentified Hard SavingsHeadcount Reduction Accounts Payable 2.00 2.00 -1.00 1.00 0.50Headcount Reduction AR - Cash Application 0.25 0.25Headcount Reduction AR - Customer Billing 0.25Headcount Reduction AR - Credit & Collections 1.50Headcount Reduction General Acctg. & Consolidation 1.50 0.50 1.00Headcount Reduction Tax Filing & ReportingHeadcount Reduction Financial ManagementHeadcount Reduction Customer Service 3.00Headcount Reduction Freight Management 3.00 1.00Headcount Reduction Mfg. Labor 4.00 1.00Headcount Reduction Production Scheduling 1.00
Number of non-IT FTE's eliminated 5.00 0.00 3.75 8.00 1.00 3.50 1.50Value of non-IT FTE's eliminated 250$ -$ 188$ 400$ 50$ 175$ 75$
Headcount Reduction Number of IT FTE's eliminated 2.00 2.00Value of IT FTE's eliminated 160$ -$ -$ 160$ -$ -$ -$
Cost Savings Value of legacy system/maintenance elimination 167$ 86$ 120$ 111$ 185$ 55$ 50$
Total Hard Savings 577$ 86$ 308$ 671$ 235$ 230$ 125$
Cash Flow AnalysisBusiness Transformation Roadmap
1 2 3 4 5Costs (34,783,947) (15,214,910) (4,578,128) (1,544,285) (1,544,285)Benefits 7,657,491$ 23,218,998$ 33,402,542$ 39,810,779$ 33,560,530$ Net (27,126,456) 8,004,088 28,824,414 38,266,494 32,016,246Cumulative (27,126,456) (19,122,367) 9,702,046 47,968,540 79,984,786
(60,000,000)
(40,000,000)
(20,000,000)
0
20,000,000
40,000,000
60,000,000
80,000,000
100,000,000
1 2 3 4 5
Costs
Benefits
Net
Cumulative
Manufacturing to Actual Costing - Level 1Planning production, producing and shipping the product and collecting actual cost data to do so.
Inputs OutputsProcesses
5.1 Production Planning
5.3 Work Order/
Work Dispatch
5.4 Material Issue/
Transfer
5.5 Production of
Product
5.6 Shipping
5.2 Production Scheduling
Raw Materials
Components
Finished Product Delivery
Invoicing
Service Information
Sequenced Material
Non Replenishables
Production Request
Documents
Drawings
Change Orders
Quality Control Release
Freight Quotes
Loose List Items
CapacityEquipment
Product Offering
Market & Economic Indicators
Factory
Order Backlog
Material Requirements
Ship Dates
Resource Availability
Labor Plan
Material Plan
BOM
Drawings
Change Orders
Routings / SOE
Job Folder Package
Strongly Agree
Agree
Neutral
Disagree
Strongly DisagreeStrongly Agree
Agree
Neutral
Disagree
Strongly Disagree
Key Findings - Change ConfidenceOverall confidence in Loram’s experience with implementing operational change scored low, with the majority of respondents disagreeing or neutral.The survey indicated that the project team is motivated and has a clear vision of what the future will look like upon completion of the project. Some uncertainty exists as to whether IFS is the appropriate tool for Loram.
“With the management change this year comes different priorities. What may have been a priority to one executive may not be as important for another. We have already had team decisions questioned by upper management and I wonder if they really understand the scope of the changes that are being proposed by this team.”
~ Manufacturing, More than 10 years with Loram
“Loram has a large number of employees who have been with the company for many years. It is difficult to change old habits.”
~ Finance/Accounting, More than 10 years with Loram
Loram has experience with major cultural, process, and operational change and is prepared to support the adoption of the IFS solution.
Strongly Agree
Strongly Disagree
Disagree Neutral Agree
Loram Combined Score
The ERP solution selected, IFS, was the appropriate selection to be Loram’s tool.
Strongly Agree
Agree
Neutral
DisagreeStrongly Agree
Agree
Neutral
DisagreeStrongly Agree
Agree
NeutralStrongly Agree
Agree
Neutral
Disagree
Key Findings - Project LeadershipIn general, respondents of the survey felt that the employee moral and support of the project was high and that the project has strong leadership and executive support. One-third of respondents did not agree that the project is supported by all levels of employees.
The project has clear senior and executive sponsorship and strong support.
Strongly Disagree
Disagree Neutral Agree Strongly Agree
Combined Score
There is strong project leadership.An inspired, trusting, and professional senior level individual…is leading the ERP initiative.
The organization and project team possess high morale.
The project has support from employees of all levels.
Phase 2 executive summary

1-33
The final product will combine process design and improvements, utilize industry data, and planning assumptions to produce a business case including return on investment and supporting narrative
Total Costs = $16.5M Total Benefits = $302MHardware
Software
ResourcesIRR = 127%Payback = 2.20 YearsExternal Cost = $22.M
Internal Cost = $ 4.5MSunset Systems Savings = ($10.0)M
dollars in millions t=0 2002 2003 2004 2005 2006
Cash In 1.0$ 1.0$ 1.0$ 1.0$ 1.0$ Cash Out (3.0)$ (0.5)$ (0.5)$ (0.5)$ (0.5)$ (0.5)$
Net Cash Flow (3.0)$ 0.5$ 0.5$ 0.5$ 0.5$ 0.5$
Net Present Value (1.1)$ IRR -6%
CAPEXP&L Impact
Efficiency Client Industry Sector S&P 500
Revenue/Employee (*TTM) 82,682 211,185 378,148 544,147
Net Income/Employee (TTM) 2003 : 5 2002 : 2,318
15,079 25,674 83,057
Receivable Turnover (TTM) 6.82 6.65 8.54 9.73
Inventory Turnover (TTM) 5.15 6.44 7.85 10.41
Asset Turnover (TTM) 0.87 1.18 1.10 0.92
Company Name COGS as % of Revenue
SG&A as % of Revenue
Competitor 1 60.7 21
Competitor 2 70.1 17
Client avg. 2002/2003 85.9 8.9
Competitor 3 77.3 13.4
Phase 2 executive summary

1-34
Detail supporting sections follow› Staffing and Productivity summary› Corporate Governance› Strategic Planning› Accountability and Performance Metrics› Operations
– Transmission & Distribution – Generation– Customer Service
› Administrative and Support– Information Technology– Financial Strength
Phase 2 executive summary