Embed Size (px)
Citation preview

Texas Education Agency July 13, 2012
GTC Southwest 2012 David Butler

This term was used as early as September, 1996, when a Gartner Group report said: By 2000, Information Democracy will emerge in forward-
thinking enterprises, with Business Intelligence information and applications available broadly to employees, consultants, customers, suppliers, and the public. The key to thriving in a competitive marketplace is staying ahead of the competition. Making sound business decisions based on accurate and current information takes more than intuition. Data analysis, reporting, and query tools can help business users wade through a sea of data to synthesize valuable information from it - today these tools collectively fall into a category called “Business Intelligence”.

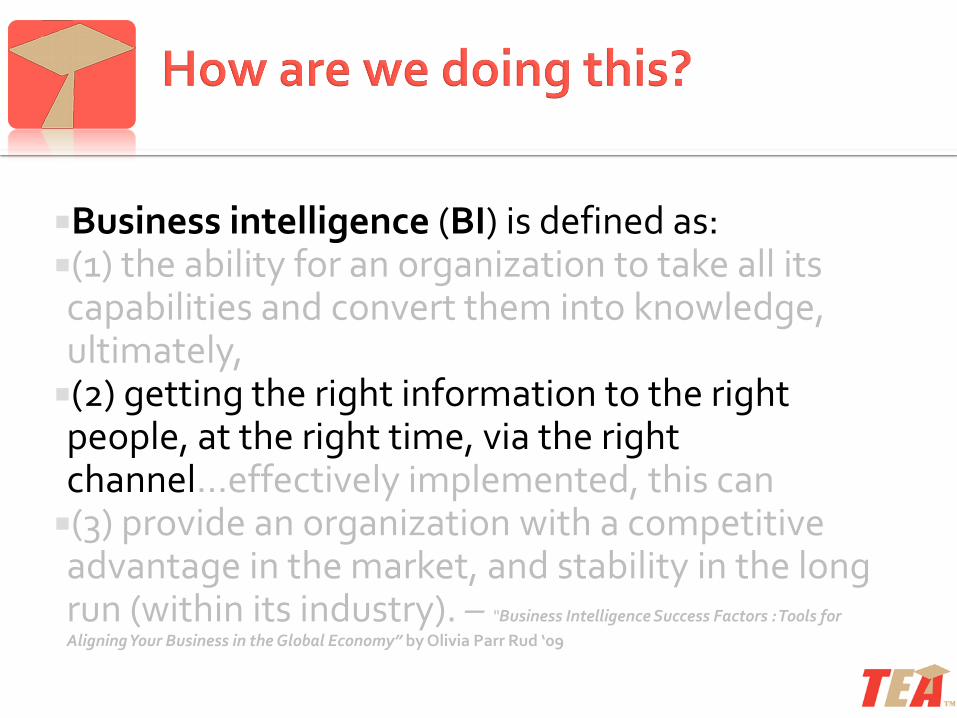
Business Intelligence (BI) is defined as: (1) the ability for an organization to take all its capabilities and convert them into knowledge, ultimately, (2) getting the right information to the right people, at the right time, via the right channel…effectively implemented, this can (3) provide an organization with a competitive advantage in the market, and stability in the long run (within its industry). – “Business Intelligence Success Factors : Tools for
Aligning Your Business in the Global Economy” by Olivia Parr Rud ‘09

The application of Business intelligence (BI) requires bringing together a broad category of applications and technologies for gathering, storing, analyzing, and providing access to data to help enterprise users make better business decisions.
BI applications - also referred to as Decision Support Systems (DSS), include the activities of query and reporting, Online Analytical Processing (OLAP), statistical analysis, forecasting, and data mining.
Business intelligence applications can be: ▪ Mission-critical and integral to an enterprise’s operations or occasional to meet a special requirement ▪ Enterprise-wide or local to one division, department, or project ▪ Centrally initiated or driven by user demand
Some tools that you may be aware of: Cognos, Business Objects, SAS BI,
Oracle BI
Technologies: ETL, SQL, Teradata (Emerging: Mobile Solutions and Cloud (BIaaS))

Business intelligence (BI) is defined as: (1) the ability for an organization to take all its capabilities and convert them into knowledge, ultimately, (2) getting the right information to the right people, at the right time, via the right channel…effectively implemented, this can (3) provide an organization with a competitive advantage in the market, and stability in the long run (within its industry). – “Business Intelligence Success Factors : Tools for
Aligning Your Business in the Global Economy” by Olivia Parr Rud ‘09

Whether or not your have external competitors, you won’t know if you are improving without collecting and analyzing supporting data. “Am I beating my last performance?” The question you (or your
users) should get an answer to by using the BI system.
What is it that your agency is out to overcome or diminish? Poverty? Hunger? Crime? Disease? Illness? Homelessness?
TEA’s competitors (for TSDS) are external vendors and district self implementations. The social problems we are out to overcome are student illiteracy,
ignorance, and improved high school graduation rate (currently 82%).

Because we believe that educating the kids in Texas is very important
We believe the ESCs, Districts and charters around the state are doing everything they can afford to….
Because we want to help LEA’s make this happen
We have the resource…. What is the resource? Data…

Business intelligence (BI) is defined as: (1) the ability for an organization to take all its capabilities and convert them into knowledge, ultimately, (2) getting the right information to the right people, at the right time, via the right channel…effectively implemented, this can (3) provide an organization with a competitive advantage in the market, and stability in the long run (within its industry). – “Business Intelligence Success Factors : Tools for
Aligning Your Business in the Global Economy” by Olivia Parr Rud ‘09
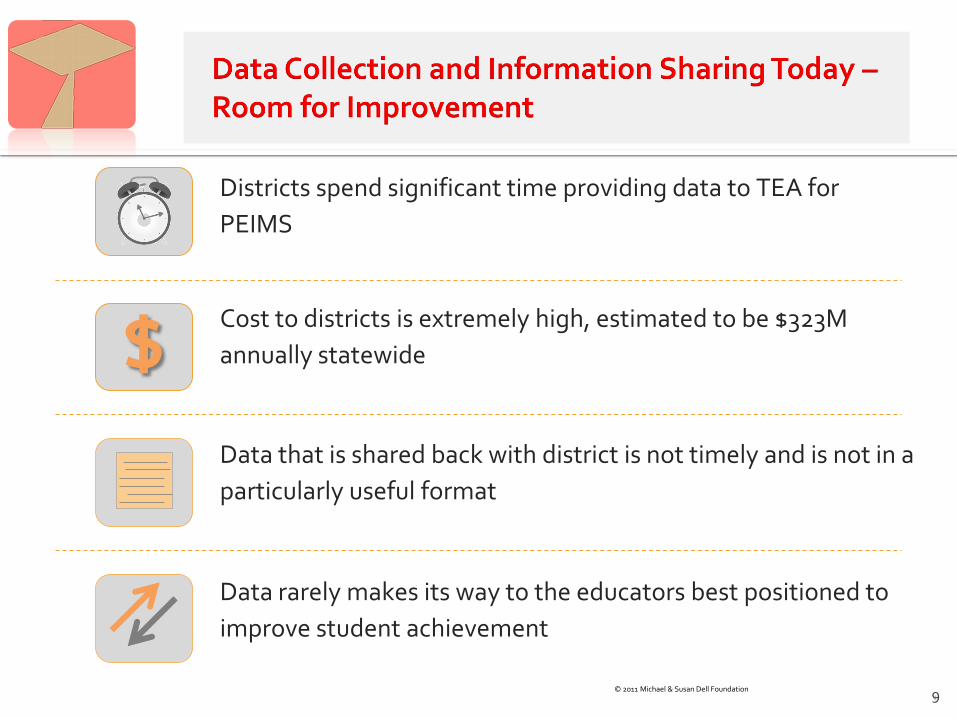
Districts spend significant time providing data to TEA for
PEIMS
$ Data that is shared back with district is not timely and is not in a
particularly useful format
Cost to districts is extremely high, estimated to be $323M
annually statewide
Data rarely makes its way to the educators best positioned to
improve student achievement
© 2011 Michael & Susan Dell Foundation 9

333,007 Teachers
58, 576 Professional Support
18,543 Campus Administrators
6,853 Central Office Administrators
1,030 Superintendents of ISDs
207 CEOs/CAOs/Presidents of Charters
1,237 Districts & charters
8,435 Campuses
20 Education Service Centers
15 SBOE Districts
4.8M Students
Source: 2009-2010 TEA Pocket Edition
Quick Facts

A data system for teachers, designed by teachers.
Delivers relevant, timely and actionable student data back to
educators to continually improve performance
A comprehensive, easy to use resource for student data –
brings together student information from multiple sources
Reduces reporting and collection burden to districts
Requires no additional data input
User friendly and intuitive and accessible from any location
Available free of charge to all Texas districts
Enable 100% of educators to have access to timely, relevant,
actionable data to drive classroom and student success
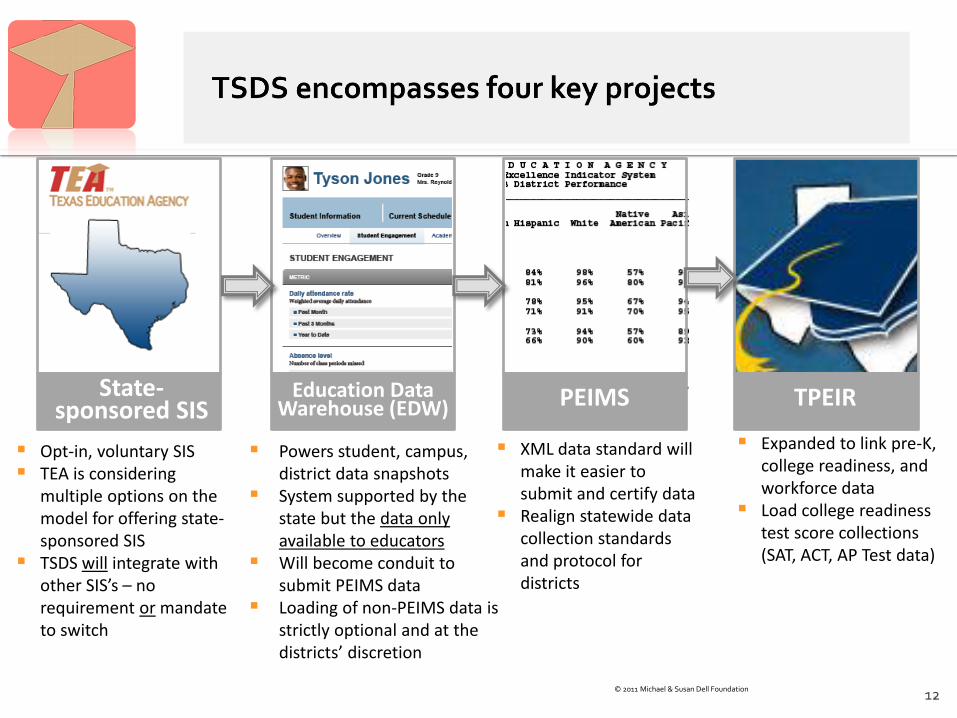
State-sponsored SIS
Education Data Warehouse (EDW) PEIMS TPEIR
Opt-in, voluntary SIS TEA is considering
multiple options on the model for offering state-sponsored SIS
TSDS will integrate with other SIS’s – no requirement or mandate to switch
Powers student, campus, district data snapshots
System supported by the state but the data only available to educators
Will become conduit to submit PEIMS data
Loading of non-PEIMS data is strictly optional and at the districts’ discretion
XML data standard will make it easier to submit and certify data
Realign statewide data collection standards and protocol for districts
Expanded to link pre-K, college readiness, and workforce data
Load college readiness test score collections (SAT, ACT, AP Test data)
© 2011 Michael & Susan Dell Foundation 12

District Environment Only TEA Environment Only
SSIS &
Other
Source
Systems
District
SIS &
Other
Source
Systems
EDW PEIMS TPEIR PEIMS
data
PEIMS data
Districts submit data
4×/year
Voluntary data
Voluntary data
Dashboards filled out with as much data as you upload
TEA will connect K-12 data with pre-K, college
readiness, workforce data
Cer
tify
/Val
idat
e
13 slide
Business intelligence (BI) is defined as: (1) the ability for an organization to take all its capabilities and convert them into knowledge, ultimately, (2) getting the right information to the right people, at the right time, via the right channel…effectively implemented, this can (3) provide an organization with a competitive advantage in the market, and stability in the long run (within its industry). – “Business Intelligence Success Factors : Tools for
Aligning Your Business in the Global Economy” by Olivia Parr Rud ‘09


The Education Data Warehouse (EDW) is the core of a district-facing statewide education data warehouse solution. This solution will provide a new environment that will collect granular operational data from the districts’ local source systems into the EDW.
The EDW is intended to drive the district-facing Performance Dashboards and Reporting Services as well as the PEIMS data submissions.
The EDW will be used by the districts for their own operational analysis and reporting needs and only local educators will be allowed to see the data housed in the EDW.

EDW Based Upon Texas Education Data Standard
17
TEDS • XML based standard • Common Data Model across all
1237+ LEAs • 18 interchanges in total • For both PEIMS and dashboards • 2013-14 standard stable,
released to public in March
Texas Extensions • PEIMS specific elements
that can’t be full-filled through Ed-Fi
• 7 interchanges
Ed-Fi • National CEDS compliant
standard • 11 interchanges • Some elements dashboard
specific, other used for PEIMS and dashboards

Nationwide Best Practices Audit
Academic Research
Focus Groups with 2,600 Educators
• Initial dashboards based on national education research and review of best practices across the country
• Received and incorporated feedback on dashboard from 2,600 educators in Texas
• Enhancements to dashboards based on stakeholder feedback

Why measure Algebra I vs. other courses? Research indicates that students who enroll and complete Algebra I by the 9th grade (a key
prerequisite for higher math) will graduate in higher numbers and are more likely to be college ready.
Algebra I Metrics-High School: Taking or have Taken: % of students who have taken Algebra I by the 9th grade. In the case of
students who have never enrolled, teachers and counselors can quickly identify students who need to be enrolled and, based on each student’s academic history, provide the necessary support to register and prepare them for Algebra I.
Passing or have Passed: % who are passing/have passed by the 9th grade. For students who are currently enrolled in Algebra I, teachers can quickly identify students who need additional academic support to successfully complete the course. In the case of former Algebra I students, teachers of advanced math courses can view Algebra I performance to evaluate the level of support students may require as they engage in more rigorous coursework.
Algebra I Metrics - Middle School: This measure, defined as enrolling and successfully completing Algebra I by the 8th grade, helps
campuses identify the level of students who show potential for more advanced coursework and their ability to master higher level math skills to be successful at the post-secondary level.

Common measure used by districts to track attendance and for state reporting
Use to pinpoint specific students negatively impacting ADA. Value often lower than ADA.
Catch students with attendance problems that aren’t reflected in daily attendance measures above

All Discipline Incidents: percentage of students with repeat occurrences (5 or more) of discipline incidents representing minor infractions (school code of conduct incidents) or one or more discipline incidents representing the most serious incidents, excluding school code of conduct incidents.
School Code of Conduct Incidents: percentage of students who have one or more minor infractions (school code of conduct incidents) in a given grading period.
Identifies students with chronic discipline issues
Identifies students with early signs of discipline problems

District/LEA
Campus
Classroom
Student
Drill down to the individual
Student level from any
aggregate view
Data originates at the Student
Level and rolls up to aggregate
views
OLAP

Dashboard Provides
* 360 view of student: attendance, grades, district assessments, student profile & academic history
* Accesses data from multiple district systems
*GPS - Identifies and highlights issues for further action
* Accessible to all teachers via web
Other Campus Tools Provide
* Captures state, district, campus and classroom assessments
* Deep dive on assessment data
* Detailed information: assessment scores, SE and item and question-level detail
* Directly available to teachers
SIS Provides
* System of record for all student information -demographic, program participation, transcript
* Student scheduling tool
* Detailed attendance and discipline data
* Less user-friendly for providing summary data and identifying issues and trends; “more clicks to get to data”

It takes 10 – 15 screens in the student information system to get the information on the dashboard student profile page

Attendance & Discipline
• Daily attendance
• Class period attendance
• Tardy rates
• Discipline
Assessments & Grades
• State assessments
• Language assessment
• Early reading
• District benchmarks
• Course / subject area grades
• Credit accumulation and 4x4
Academic Potential
• Advanced course potential
• College entrance exams (SAT, ACT, PSAT)
• College readiness indicators
Student Information
• Program participation
• Enrollment dates
• Contact information
• Key transcript data:
• Current and historical courses and grades
• TAKS history
Highlights trends over time and flags negative trends Easily drill down for more detail (e.g., finer grain, historical data, student exception lists) Highlights where students are not meeting performance goals

http://www.tea.state.tx.us/Workarea/downloadasset.aspx?id=2147506494

slide 27

Common settings where users site that the dashboards are valuable
Parent / teacher conference – print and share student dashboards
Student Support Team (SST) meetings – data across performance measures
ARD meetings – requires broad student data that is included in dashboards
PLC/departmental meetings – assessment, discipline data
RTI committee meetings – benchmarks, grades, assessment data
Intervention groups – TAKS prep, post-benchmark pull-out groups
Truancy warning – identity and track students with chronic attendance issues
Student goal setting – set individual goals for benchmark performance
Campus tracking for at-risk students
There are several critical times to use the dashboards including the beginning of the school year or a new grading period, when organizing intervention groups, and after benchmark results are reported.

© 2011 Michael & Susan Dell Foundation 29
“This will be so valuable in communicating with parents.”
“I do LOVE that now I can access info about absences,
credits, college readiness, etc. at the same time!”
“With this data we would be able to identify and challenge
our power kids!”
100% of Lubbock ISD and 98% of PSJA ISD users said they are likely or very likely to recommend the dashboards to their colleagues

“Attendance did surprise me! Our goal is set at 95% and we
are still missing the mark.”
“It surprised me to see all the red for TAKS. Our campus goals
are high!”
“WOW! Everything about my school is here. Unbelievable! It’s everything I need to do my job.”
87% of PSJA users could see themselves using this tool on a regular basis to make decisions about instruction

Next phase will include 4 more Limited Production Releases (LPRs) for a total of 7 (along with their Vendor/Student Information System).
LPR District SIS Vendor 1. Lubbock ISD* - Prologic/TEAMS 2. Allen ISD* - Skyward/Skyward 3. Pharr – San Juan – Alamo ISD* - Sungard/eSchool Plus 4. Taylor ISD - TCC/TxEIS** 5. Hays CISD - Prologic/TEAMS 6. Lewisville ISD - Skyward/Skyward** 7. Alief ISD - Sungard/eSchool Plus * - MSDF/DLP supplied the extracts from all the systems for these districts as well as all the extracts
not supplied by the SIS vendors for the remaining districts. ** - SSIS Vendor Implementation

Initial EDW
(Dashboards)
prototype
Draft data
standard defined
FY10
Draft data
dashboards defined
SLDS 2009 ARRA
Grant Awarded
Dashboards
finalized based on
feedback
Stakeholder
engagement
Continued
Deployment to all
Districts
FY14 FY13 FY12 FY11
RFI for DW
Solution Issued
Begin Limited
Prod Releases 1-2
Limited Prod
Releases 3-5
Dashboard
Enhancements
Limited Prod
Release 6 & 7
Integration with
SSIS
Integration with
other SIS’s
Interface with
other Source
Systems
PEIMS Data
Standards
Published
Begin Production
Deployment
Hosted EDW
Dashboard
Enhancements
PEIMS Collection
through EDW
Draft Data
Standards for EDW
Evaluate RFI
Responses
Re-engineer Data
Collection Business
Processes
Requirements (Solution
Components)
Issue 3 RFOs
Select Vendors

• The importance of prototyping and piloting activities was reinforced as significant learning and discovery continued during subsequent phases of the project.
• Sufficient time needs to be allocated for iterative change and refinement.
• The high level of stakeholder feedback is worth the additional efforts associated with the refinements.
• Communication with key stakeholders is critical to minimize misinformation.
Lessons learned

www.TexasStudentDataSystem.org
Contact: [email protected] about any additional TSDS questions and/or assistance