Embed Size (px)
Citation preview
1
GSI EXPERIMENTS FOR RUA REFLECTIVITY/CLOUD AND CONVENTIONAL OBSERVATIONS
Ming Hu, Stan Benjamin, Steve Weygandt, David Dowell, Terra Ladwig, and Curtis Alexander
NOAA/ESRL/GSD/EMB
RUA workshop, Boulder06/03/2015
2
GSI overview• The Global Statistical Interpolation (GSI) was developed mainly as NCEP operational data analysis system for improving model forecast:• GFS, NAM, RAP/HRRR, HWRF, …
• GSI can analyze many kinds of observations:• Conventional, radiance, radar, GPS, …
• GSI analysis cores:• 3DVAR, ensemble-var hybrid
• GSI background can be:• GFS, NMMB, NNM, ARW, …
3
Analysis versus initial condition
• GSI aims to generate better initial condition which make the forecast better:• GSI analysis results may not fit to the observations
closely.
• Analysis requires the analysis results fit to the observation closely to reflect the “true” atmosphere status.
• RTMA is the only function in GSI to do 2D analysis
• But GSI can be configured to conduct 3D analysis

4
GSI is analysis system• GSI modifies the background to fit to the observations
based on the ratio of observation error and background error• For forecast
• Balance the weight between background and observation
• For analysis:• Weight the observation more (small observation error)• Reduce the impact radius• Less balance
• Benefit of using GSI:• Work with WRF-arw, nmm, nmmb, and GFS• Advanced analysis method: 3DVAR, hybrid• Observation operators available for many kinds of obs• Observations are QCed inside and outside GSI• Community code
5
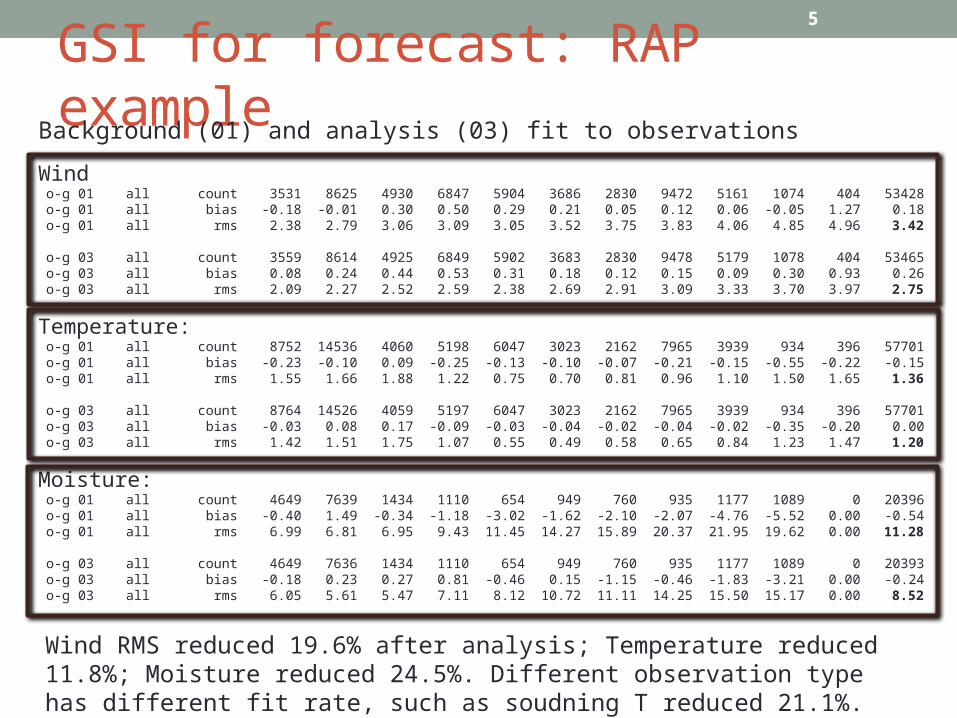
GSI for forecast: RAP exampleBackground (01) and analysis (03) fit to observations
Wind o-g 01 all count 3531 8625 4930 6847 5904 3686 2830 9472 5161 1074 404 53428 o-g 01 all bias -0.18 -0.01 0.30 0.50 0.29 0.21 0.05 0.12 0.06 -0.05 1.27 0.18 o-g 01 all rms 2.38 2.79 3.06 3.09 3.05 3.52 3.75 3.83 4.06 4.85 4.96 3.42
o-g 03 all count 3559 8614 4925 6849 5902 3683 2830 9478 5179 1078 404 53465 o-g 03 all bias 0.08 0.24 0.44 0.53 0.31 0.18 0.12 0.15 0.09 0.30 0.93 0.26 o-g 03 all rms 2.09 2.27 2.52 2.59 2.38 2.69 2.91 3.09 3.33 3.70 3.97 2.75
Temperature: o-g 01 all count 8752 14536 4060 5198 6047 3023 2162 7965 3939 934 396 57701 o-g 01 all bias -0.23 -0.10 0.09 -0.25 -0.13 -0.10 -0.07 -0.21 -0.15 -0.55 -0.22 -0.15 o-g 01 all rms 1.55 1.66 1.88 1.22 0.75 0.70 0.81 0.96 1.10 1.50 1.65 1.36
o-g 03 all count 8764 14526 4059 5197 6047 3023 2162 7965 3939 934 396 57701 o-g 03 all bias -0.03 0.08 0.17 -0.09 -0.03 -0.04 -0.02 -0.04 -0.02 -0.35 -0.20 0.00 o-g 03 all rms 1.42 1.51 1.75 1.07 0.55 0.49 0.58 0.65 0.84 1.23 1.47 1.20
Moisture: o-g 01 all count 4649 7639 1434 1110 654 949 760 935 1177 1089 0 20396 o-g 01 all bias -0.40 1.49 -0.34 -1.18 -3.02 -1.62 -2.10 -2.07 -4.76 -5.52 0.00 -0.54 o-g 01 all rms 6.99 6.81 6.95 9.43 11.45 14.27 15.89 20.37 21.95 19.62 0.00 11.28
o-g 03 all count 4649 7636 1434 1110 654 949 760 935 1177 1089 0 20393 o-g 03 all bias -0.18 0.23 0.27 0.81 -0.46 0.15 -1.15 -0.46 -1.83 -3.21 0.00 -0.24 o-g 03 all rms 6.05 5.61 5.47 7.11 8.12 10.72 11.11 14.25 15.50 15.17 0.00 8.52
Wind RMS reduced 19.6% after analysis; Temperature reduced 11.8%; Moisture reduced 24.5%. Different observation type has different fit rate, such as soudning T reduced 21.1%.
6
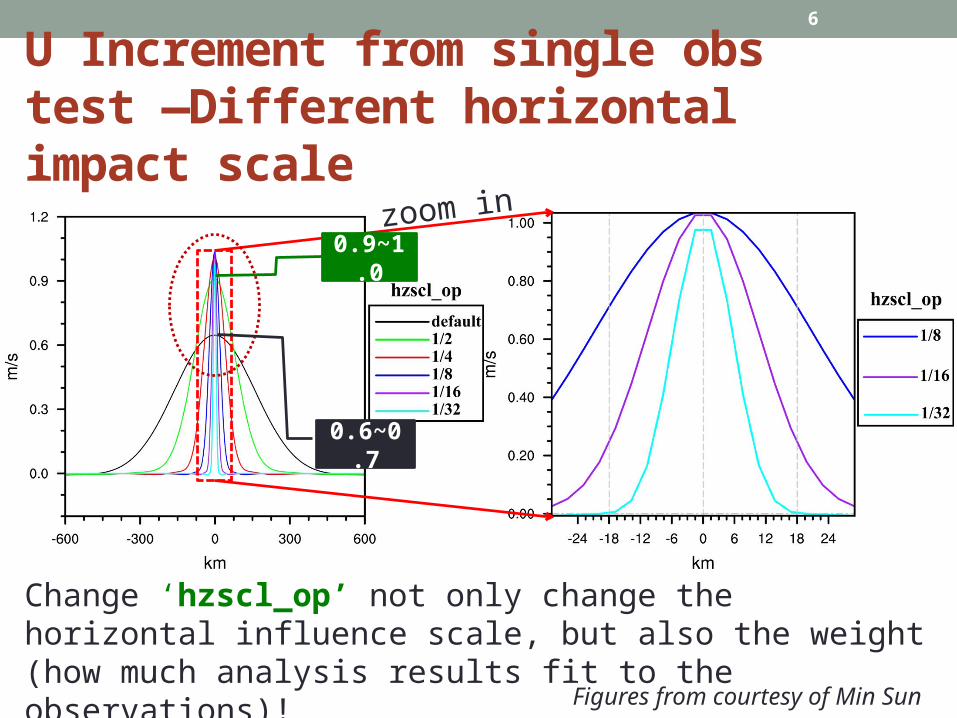
U Increment from single obs test —Different horizontal impact scale
zoom in
Change ‘hzscl_op’ not only change the horizontal influence scale, but also the weight (how much analysis results fit to the observations)!
0.6~0.7
0.9~1.0
Figures from courtesy of Min Sun
7
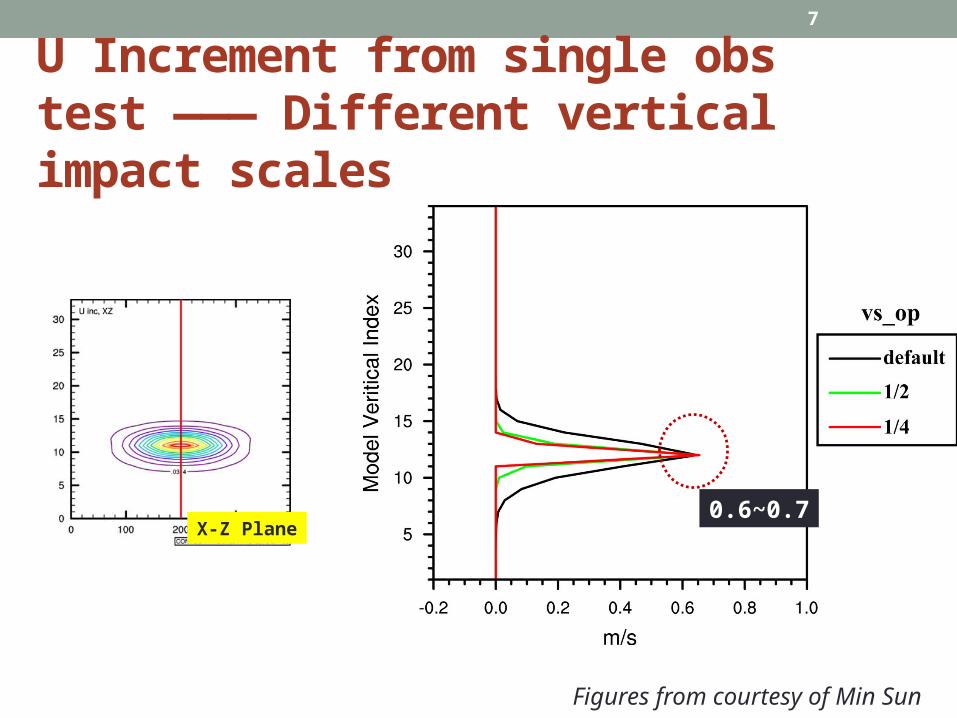
U Increment from single obs test ——— Different vertical impact scales
0.6~0.7X-Z Plane
Figures from courtesy of Min Sun
8
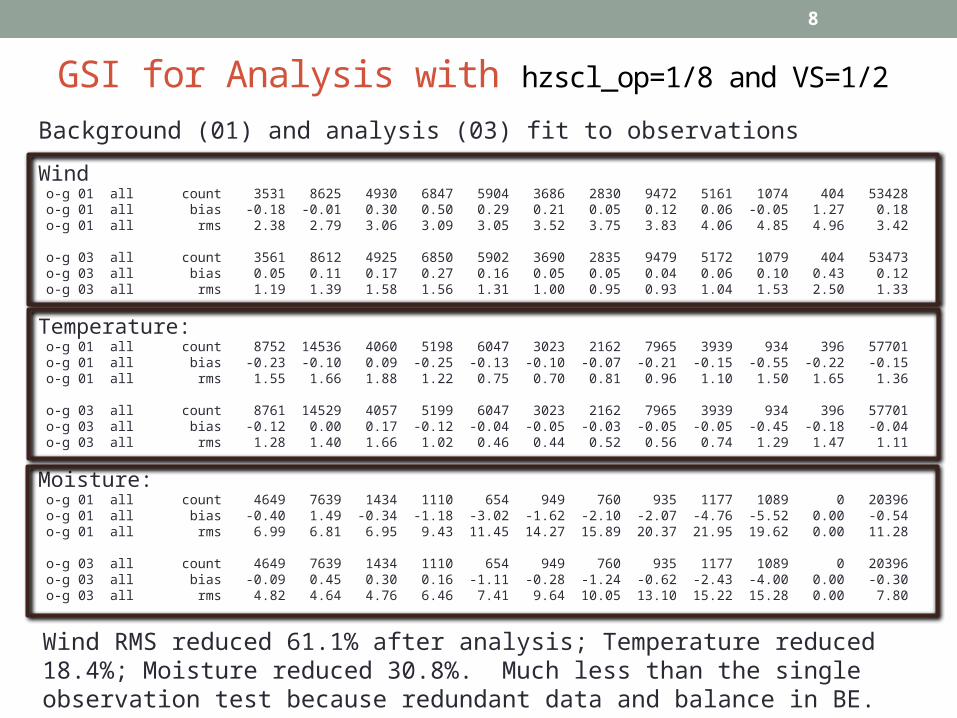
GSI for Analysis with hzscl_op=1/8 and VS=1/2
Background (01) and analysis (03) fit to observations
Wind o-g 01 all count 3531 8625 4930 6847 5904 3686 2830 9472 5161 1074 404 53428 o-g 01 all bias -0.18 -0.01 0.30 0.50 0.29 0.21 0.05 0.12 0.06 -0.05 1.27 0.18 o-g 01 all rms 2.38 2.79 3.06 3.09 3.05 3.52 3.75 3.83 4.06 4.85 4.96 3.42
o-g 03 all count 3561 8612 4925 6850 5902 3690 2835 9479 5172 1079 404 53473 o-g 03 all bias 0.05 0.11 0.17 0.27 0.16 0.05 0.05 0.04 0.06 0.10 0.43 0.12 o-g 03 all rms 1.19 1.39 1.58 1.56 1.31 1.00 0.95 0.93 1.04 1.53 2.50 1.33
Temperature: o-g 01 all count 8752 14536 4060 5198 6047 3023 2162 7965 3939 934 396 57701 o-g 01 all bias -0.23 -0.10 0.09 -0.25 -0.13 -0.10 -0.07 -0.21 -0.15 -0.55 -0.22 -0.15 o-g 01 all rms 1.55 1.66 1.88 1.22 0.75 0.70 0.81 0.96 1.10 1.50 1.65 1.36
o-g 03 all count 8761 14529 4057 5199 6047 3023 2162 7965 3939 934 396 57701 o-g 03 all bias -0.12 0.00 0.17 -0.12 -0.04 -0.05 -0.03 -0.05 -0.05 -0.45 -0.18 -0.04 o-g 03 all rms 1.28 1.40 1.66 1.02 0.46 0.44 0.52 0.56 0.74 1.29 1.47 1.11
Moisture: o-g 01 all count 4649 7639 1434 1110 654 949 760 935 1177 1089 0 20396 o-g 01 all bias -0.40 1.49 -0.34 -1.18 -3.02 -1.62 -2.10 -2.07 -4.76 -5.52 0.00 -0.54 o-g 01 all rms 6.99 6.81 6.95 9.43 11.45 14.27 15.89 20.37 21.95 19.62 0.00 11.28
o-g 03 all count 4649 7639 1434 1110 654 949 760 935 1177 1089 0 20396 o-g 03 all bias -0.09 0.45 0.30 0.16 -1.11 -0.28 -1.24 -0.62 -2.43 -4.00 0.00 -0.30 o-g 03 all rms 4.82 4.64 4.76 6.46 7.41 9.64 10.05 13.10 15.22 15.28 0.00 7.80
Wind RMS reduced 61.1% after analysis; Temperature reduced 18.4%; Moisture reduced 30.8%. Much less than the single observation test because redundant data and balance in BE.
9
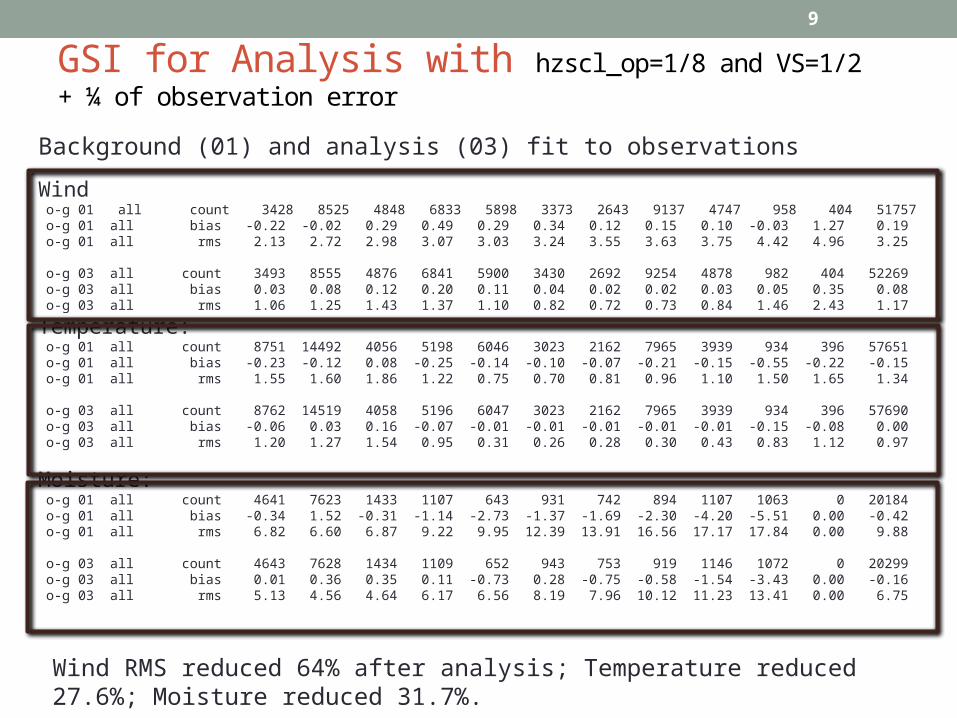
GSI for Analysis with hzscl_op=1/8 and VS=1/2 + ¼ of observation error
Background (01) and analysis (03) fit to observations
Wind o-g 01 all count 3428 8525 4848 6833 5898 3373 2643 9137 4747 958 404 51757 o-g 01 all bias -0.22 -0.02 0.29 0.49 0.29 0.34 0.12 0.15 0.10 -0.03 1.27 0.19 o-g 01 all rms 2.13 2.72 2.98 3.07 3.03 3.24 3.55 3.63 3.75 4.42 4.96 3.25
o-g 03 all count 3493 8555 4876 6841 5900 3430 2692 9254 4878 982 404 52269 o-g 03 all bias 0.03 0.08 0.12 0.20 0.11 0.04 0.02 0.02 0.03 0.05 0.35 0.08 o-g 03 all rms 1.06 1.25 1.43 1.37 1.10 0.82 0.72 0.73 0.84 1.46 2.43 1.17
Temperature: o-g 01 all count 8751 14492 4056 5198 6046 3023 2162 7965 3939 934 396 57651 o-g 01 all bias -0.23 -0.12 0.08 -0.25 -0.14 -0.10 -0.07 -0.21 -0.15 -0.55 -0.22 -0.15 o-g 01 all rms 1.55 1.60 1.86 1.22 0.75 0.70 0.81 0.96 1.10 1.50 1.65 1.34
o-g 03 all count 8762 14519 4058 5196 6047 3023 2162 7965 3939 934 396 57690 o-g 03 all bias -0.06 0.03 0.16 -0.07 -0.01 -0.01 -0.01 -0.01 -0.01 -0.15 -0.08 0.00 o-g 03 all rms 1.20 1.27 1.54 0.95 0.31 0.26 0.28 0.30 0.43 0.83 1.12 0.97
Moisture: o-g 01 all count 4641 7623 1433 1107 643 931 742 894 1107 1063 0 20184 o-g 01 all bias -0.34 1.52 -0.31 -1.14 -2.73 -1.37 -1.69 -2.30 -4.20 -5.51 0.00 -0.42 o-g 01 all rms 6.82 6.60 6.87 9.22 9.95 12.39 13.91 16.56 17.17 17.84 0.00 9.88
o-g 03 all count 4643 7628 1434 1109 652 943 753 919 1146 1072 0 20299 o-g 03 all bias 0.01 0.36 0.35 0.11 -0.73 0.28 -0.75 -0.58 -1.54 -3.43 0.00 -0.16 o-g 03 all rms 5.13 4.56 4.64 6.17 6.56 8.19 7.96 10.12 11.23 13.41 0.00 6.75
Wind RMS reduced 64% after analysis; Temperature reduced 27.6%; Moisture reduced 31.7%.
10
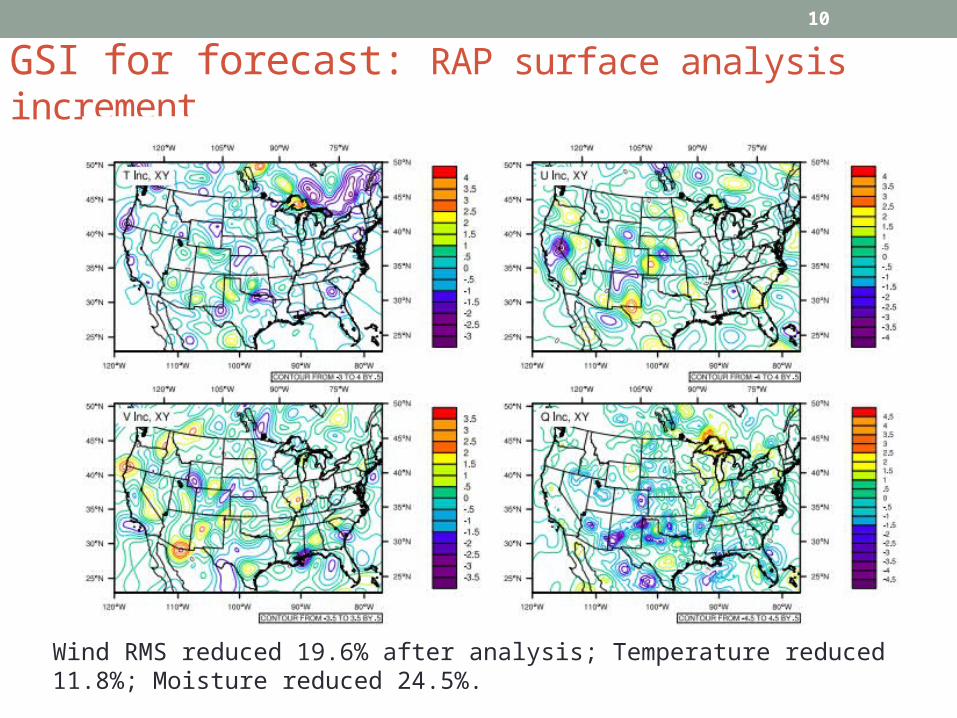
GSI for forecast: RAP surface analysis increment
Wind RMS reduced 19.6% after analysis; Temperature reduced 11.8%; Moisture reduced 24.5%.
11
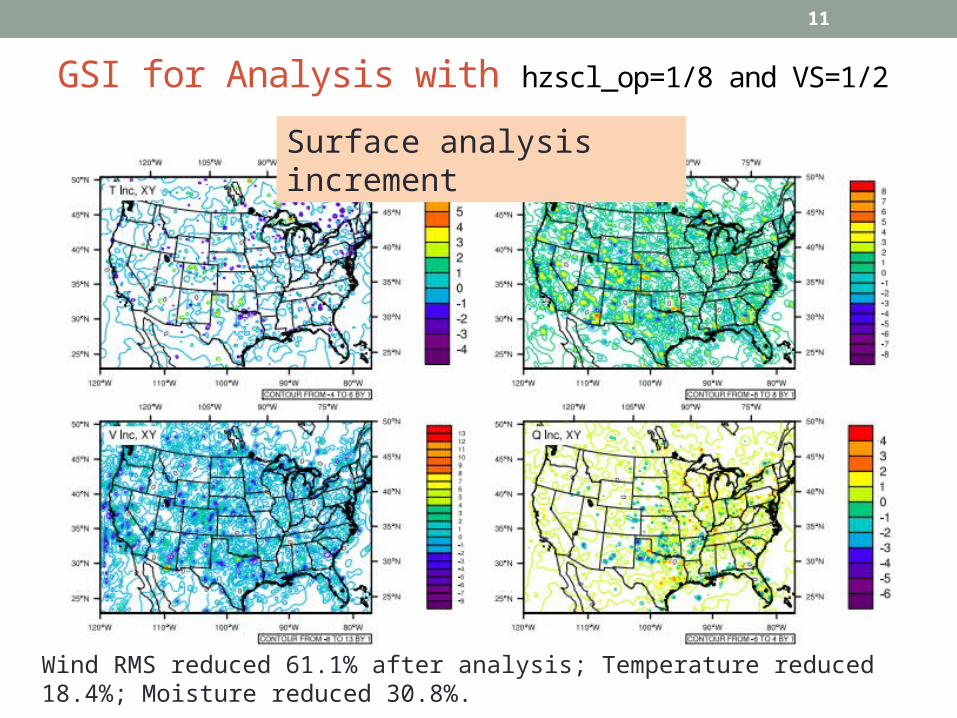
GSI for Analysis with hzscl_op=1/8 and VS=1/2
Surface analysis increment
Wind RMS reduced 61.1% after analysis; Temperature reduced 18.4%; Moisture reduced 30.8%.
12
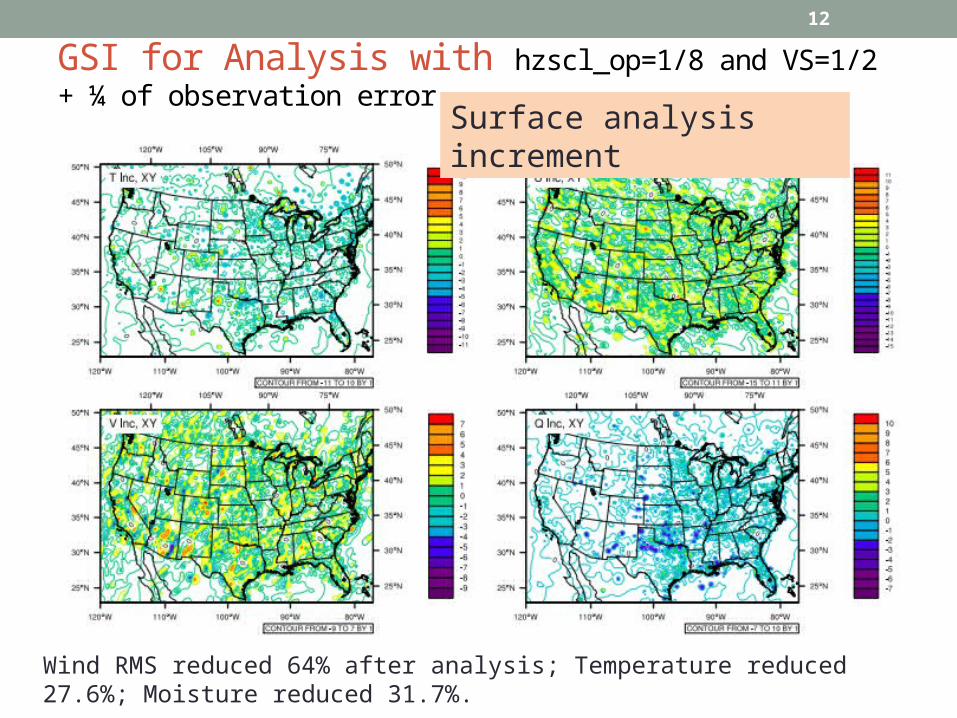
GSI for Analysis with hzscl_op=1/8 and VS=1/2 + ¼ of observation error
Wind RMS reduced 64% after analysis; Temperature reduced 27.6%; Moisture reduced 31.7%.
Surface analysis increment
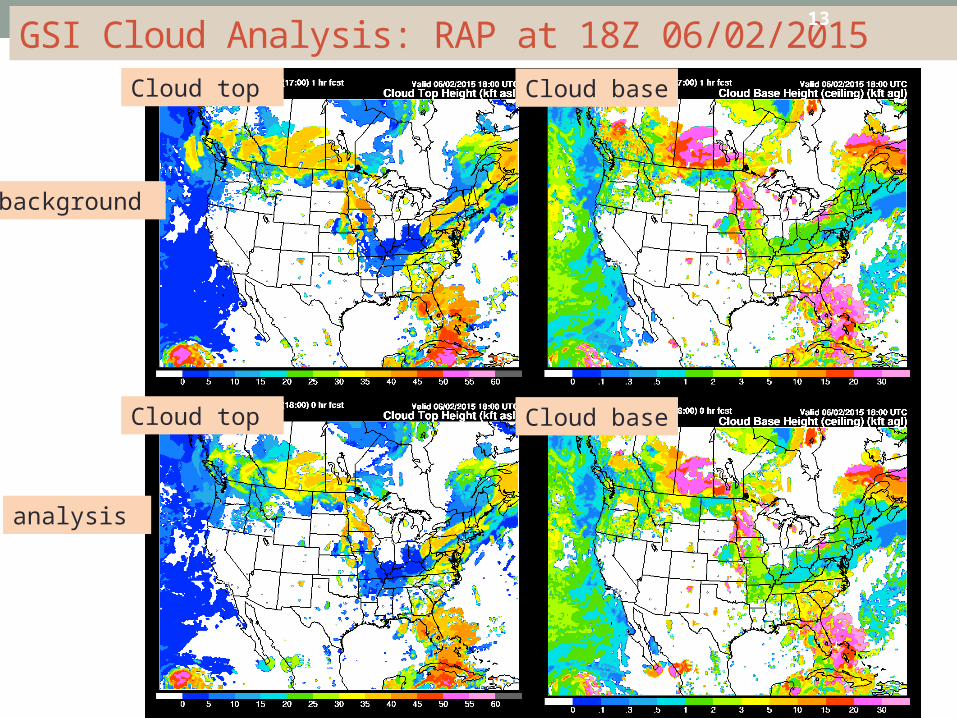
13GSI Cloud Analysis: RAP at 18Z 06/02/2015
background
analysis
Cloud top Cloud base
Cloud baseCloud top
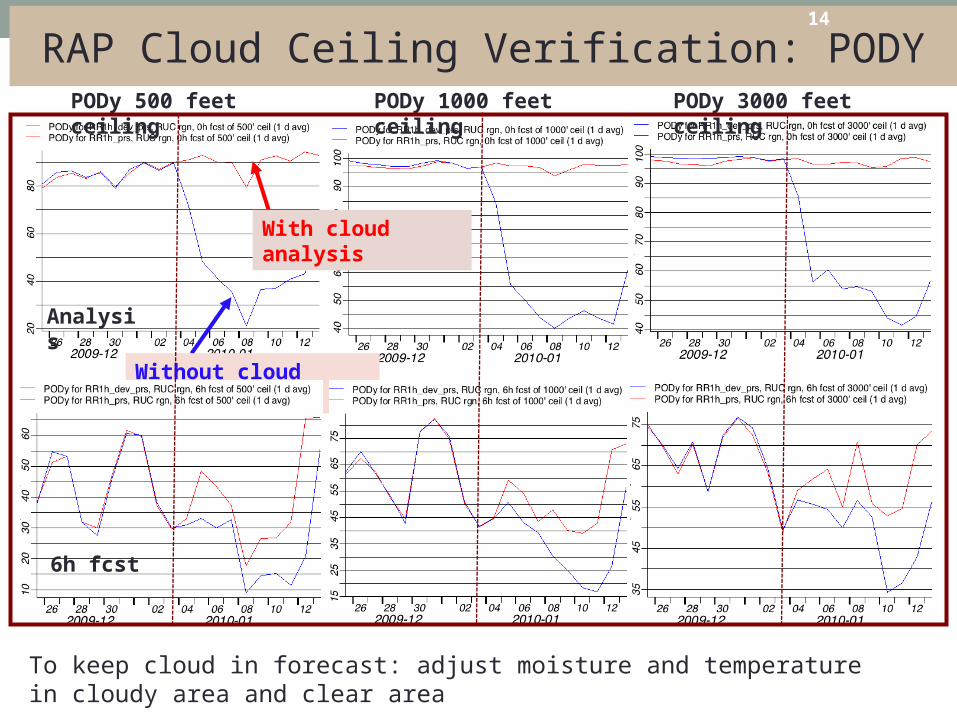
14
Analysis
PODy 1000 feet ceiling PODy 3000 feet ceilingPODy 500 feet ceiling
With cloud analysis
Without cloud analysis
6h fcst
RAP Cloud Ceiling Verification: PODY
To keep cloud in forecast: adjust moisture and temperature in cloudy area and clear area
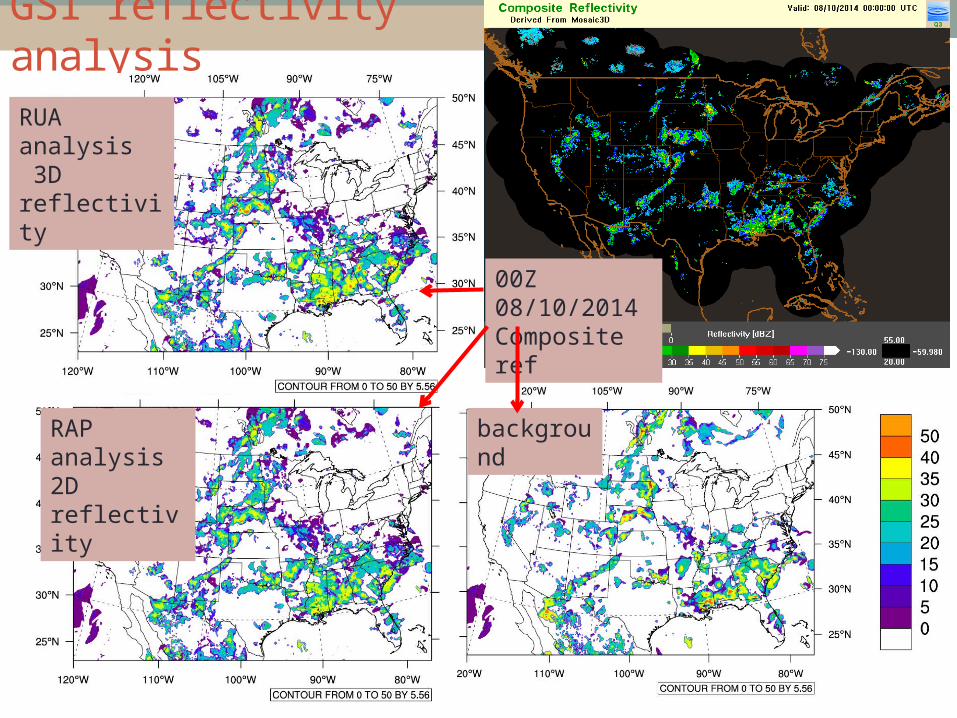
15GSI reflectivity analysis
background
RAP analysis2D reflectivity
RUA analysis 3D reflectivity
00Z 08/10/2014Composite ref
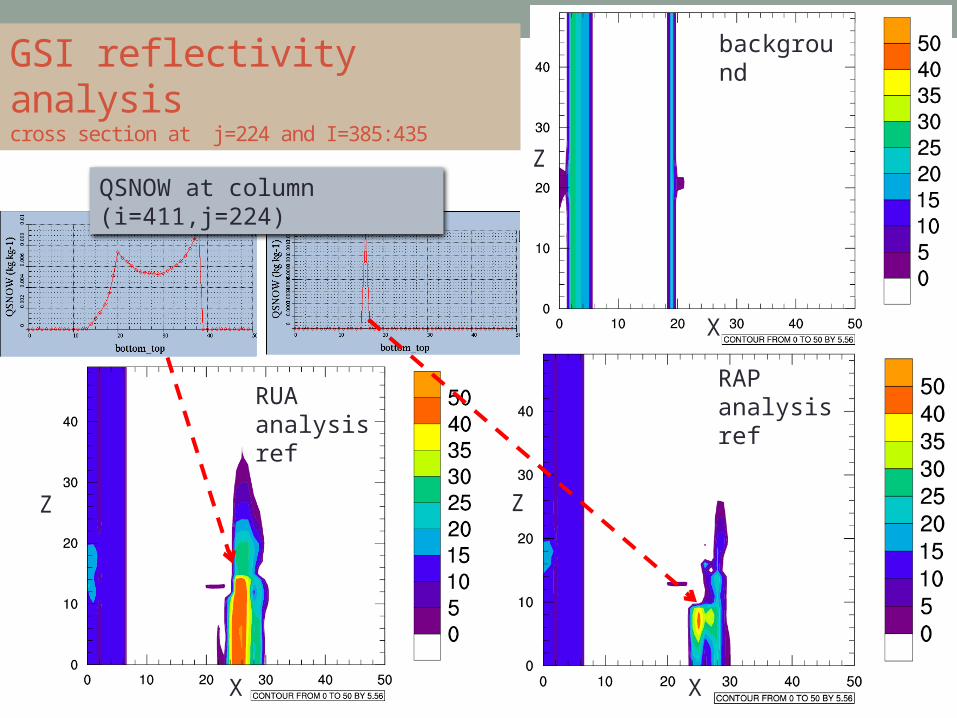
16
GSI reflectivity analysiscross section at j=224 and I=385:435
X
XX
Z
ZZ
background
RAP analysis ref
RUA analysis ref
QSNOW at column (i=411,j=224)
17
Summary
• GSI is ready to be used for the analysis• GSI analysis can include conventional observation, cloud, radar and other observations
• Background error covariance and observation errors should tuned for the analysis
• GSI has many advantages, most important one is function to use ensemble to add flow depend information into the analysis (David’s talk)


![125383582 Dowell Manual Schlumberger[1]](https://img.pdfslide.us/doc/110x75/55cf9941550346d0339c6ee6/125383582-dowell-manual-schlumberger1.jpg)