Embed Size (px)
Citation preview

1We would like to thank Eric Engen, Kathleen Johnson, Andreas Lehnert, Dean Maki, and SteveOliner for their useful comments. Also, we would like to thank Gillian Burgess for her excellent researchassistance. We take responsibility for all errors. The analysis and conclusions set forth are those of theauthors and do not indicate concurrence by other members of the research staff, by the Board ofGovernors, or by the Federal Reserve Banks. Please send correspondence to Wayne Passmore, AssistantDirector, Mail Stop 93, Federal Reserve Board, Washington D.C. 20551 or send e-mail [email protected].
GSEs, Mortgage Rates, and the Long-Run Effects of MortgageSecuritization 1
Wayne PassmoreBoard of Governors
Federal Reserve System
Roger SparksMills College
Jamie IngpenBoard of Governors
Federal Reserve System
December, 2001

GSEs, Mortgage Rates, and the Long-Run Effects of MortgageSecuritization
Abstract
Our paper compares mortgage securitization undertaken by government-sponsored enterprises
(GSEs) with that undertaken by private firms, with an emphasis on how each type of mortgage
securitization affects mortgage rates. We build a model illustrating that market structure,
government sponsorship, and the characteristics of the mortgages securitized are all important
determinants of mortgage rates. We find that GSEs generally–but not always—lower mortgage
rates, particularly when the GSEs behave competitively, because the GSEs’ implicit government
backing allows them to sell securities without the credit enhancements needed in the private
sector. Using our simulation model, we demonstrate that when mortgages eligible for purchase
by the GSEs have characteristics similar to other mortgages, the GSEs’ implicit government-
backing generates differences in mortgage rates similar to those currently observed in the
mortgage market (which range between zero and fifty basis points). However, if the mortgages
purchased by GSEs are less costly to originate and securitize, and the if the GSEs behave
competitively, then the simulated spread in mortgage rates can be much larger than that observed
in the data.

2 Fannie and Freddie also directly held about $1.0 trillion of mortgages and mortgage-backedsecurities at year-end 2000. During the 1990s, their yearly securitization rate is estimated to havefluctuated between 45 percent and 78 percent of conventional conforming mortgage originations. Information about Fannie’s and Freddie’s holdings is from their quarterly and annual reports, whereasinformation about the fully private market is from Inside MBS & ABS, February 2, 2000, page 7. Thesecuritization rate is from Inside Mortgage Finance Publications (2000).
3 For a review of efforts to measure the size of the GSE subsidy, see Feldman (1999). For anexposition of how the GSE subsidy benefits shareholders and others, see Congressional Budget Office(1996, 2001) and General Accounting Office (1996).
4Note that Fannie and Freddie—like all insurers of credit risk—face an adverse selectionproblem that requires they include a “lemons premium” in the purchase price they offer for mortgages. Theoretically, their subsidy could be completely absorbed by the GSEs’ efforts to avoid adverse selection(Passmore and Sparks, 1996 & 2000).
1
IntroductionThe mortgage-backed securities market in the United States is dominated by two
privately-owned but government-sponsored institutions--the Federal National Mortgage
Association (Fannie Mae) and the Federal Home Loan Mortgage Corporation (Freddie
Mac)—and includes a variety of smaller, fully private firms that securitize the remaining
mortgages, which are not eligible for securitization by Fannie Mae or Freddie Mac. The
outstanding stock of mortgages securitized and made available to investors by Fannie Mae and
Freddie Mac totaled more than $1.2 trillion at the end of 2000, roughly four times the amount
securitized by the fully private part of the market.2
Investors generally perceive Fannie Mae and Freddie Mac as having the implicit
backing of the U.S. government, which allows these government-sponsored enterprises (GSEs)
to issue debt at lower interest rates than they could otherwise and to securitize mortgages
without providing or purchasing credit enhancements. This implicit subsidy benefits Fannie
Mae and Freddie Mac’s shareholders, though part of the subsidy may flow through to the
primary mortgage market.3
At first blush, one might wonder why any of the subsidy would pass through to
homeowners, particularly since in competitive markets, if only two producers among many
receive a subsidy, then those two subsidized producers simply have increased profits and there
is no effect on prices for the product.4 Goodman and Passmore (1992) and Hermalin and

5 Neither study was able to establish definitely that Fannie and Freddie actually collude.
2
Jaffee (1996) argue that the subsidy may be partly transmitted because the secondary market
has many of the conditions required for collusion—two rivals with roughly equal market share
and almost infinite production capacity, homogeneity of product, and high entry and exit
barriers—and thus these two firms are cognizant of the effects their prices have on demand.5
Given these conditions, if Fannie Mae and Freddie Mac compete vigorously with each other
(they are “Bertrand competitors”), then most of the GSE subsidy is likely to be passed on to
mortgage borrowers. Evidence of a subsidy pass- through comes from three previous studies
(Hendershott and Shilling, 1989; ICF, 1990; and Cotterman and Pearce, 1996), which found
that interest rates for mortgages eligible for purchase by the GSEs are about 30 basis points
less than mortgage rates for other mortgages.
How does the GSEs’ implicit subsidy affect mortgage securitization, and under what
conditions does it lower mortgage rates? Unlike when GSEs buy and hold mortgages, and thus
then fund with implicitly guaranteed debt, when the GSEs issue mortgage-backed securities, they
do not fund the mortgages directly. Thus, the implicit subsidy on the GSEs’ debt cannot directly
affect the yields on the mortgage-backed securities because debt is not used. With securitization,
the mortgages are funded by the purchasers of the mortgage-backed securities. However, we find
that GSEs generally—but not always—cause mortgage rates to be lower in the long run than they
would be with private securitization because the GSEs have implicit public backing. When
GSEs securitize mortgages, their implicit government backing allows them to sell securities
without holding the capital or purchasing the credit enhancements needed in the private sector.
We use a simulation model to study the conditions under which implicit government
backing of mortgage-backed securities lowers mortgage rates, and we compare the simulated
spread between GSE and private mortgage rates to empirical spread to infer the underlying
market structure. Under the assumption that conforming mortgages (and their associated
mortgage-backed securities) are identical to nonconforming mortgages (and their associated
mortgage-backed securities), our simulations generally suggest that the observed difference in
mortgage rates is greater than the simulated difference when Fannie and Freddie are modeled as

3
monopolists and similar to the simulated difference when they are modeled as competitors.
However, if GSE mortgage-backed securities are more liquid than non-GSE mortgage-backed
securities, or if conforming mortgages are less expensive to originate or evaluate than
nonconforming mortgages, then our simulations suggest the observed mortgage spread is less
than would be realized if Fannie and Freddie behaved competitively. Our results highlight the
difficulty in analyzing the causes of the small differences between the GSE and non-GSE
mortgage rates, suggesting that more information is needed before definitive conclusions can be
drawn about the effects of GSEs on mortgage rates.
The GSEs and the Conforming Mortgage MarketFannie Mae and Freddie Mac were chartered many years ago as government-sponsored
enterprises, or GSEs, partly to correct perceived deficiencies in the mortgage market. (Fannie
Mae converted to GSE status in 1968; Freddie Mac was chartered in 1970). In return for a GSE
charter, which is not made available to other firms that securitize mortgages, Fannie Mae and
Freddie Mac shouldered a public mission: to develop a strong secondary market for mortgages by
integrating the mortgage markets with the capital markets and making funds more readily
available to mortgage borrowers. These objectives have been largely achieved, and the primary
remaining public function of these GSEs is to deliver a part of an implicit federal subsidy to
mortgage borrowers. In addition to this function, the GSEs were mandated in 1992 by Congress
to make a special effort to ensure that mortgages are provided to low- and moderate-income
home buyers.
The charters of Fannie Mae and Freddie Mac also restrict the types of mortgages they
may purchase. The restrictions include limiting the loan-to-value ratio to 80 percent or less
(unless other measures are taken to limit the credit risk incurred by buying the mortgage) and
limiting the size of mortgages purchased. Loans that meet the GSEs’ charter restrictions are
known as conforming. The conforming loan limit for a mortgage backed by a single-family
residence, which is adjusted annually, was $252,700 for mortgages originated in 2000. As will
be discussed below, the bulk of the nonconforming mortgages securitized by private firms are
jumbo mortgages, or mortgages that exceed the GSE size limit.
The most common procedure for securitizing mortgages involves a trade. In many cases,

6 The GSEs were issuing mortgage-backed securities (MBS) in volume by the mid-1980s.
4
although not all, a large originator assembles a pool of conforming mortgages from its portfolio
and trades the pool to the GSE in return for securities backed by the mortgages.6 In this process,
lenders transfer the credit risk of the mortgages to the GSE. In return, the GSE receives a
guarantee fee and a guaranteed cash flow from the mortgages (until the mortgage borrower pays
off or prepays the mortgage).
The GSEs’ charters give them several competitive advantages over private firms when
issuing securities, including an exemption from SEC registration requirements and permission to
clear GSE securities transactions through the Federal Reserve’s book-entry system. In addition,
their securities are treated as government securities in the context of the Securities Exchange Act
of 1934, which allows many trusts and other non-profit organizations to purchase them. One
other notable, explicit advantage is that the risk-based capital requirements for banks’ holdings of
GSE-issued MBS are substantially lower than for their holdings of private MBS.
The most valuable advantage to the GSEs, however, is the implicit U.S. government
guarantee that backs GSE securities. Because these housing-related GSEs were initially
established to carry out specific government policies and continue to have government missions,
they have a special status in the eyes of many investors. The private market assumes that in
almost any adverse circumstances, the government will aid the GSEs; thus, Fannie Mae and
Freddie Mac are able to issue debt at a lower cost. This implicit subsidy also gives them an
advantage in MBS issuance: the Congressional Budget Office (1996) estimated that an issuer’s
GSE status lowers interest rates on MBS by 40 basis points from what a private firm would pay
on a comparable issue.
Mortgage Securitization by Private Firms The presence of the GSEs effectively splits the primary mortgage market into three
segments: conforming, jumbo, and other nonconforming mortgages. The conforming market
consists of mortgages that are generally low-risk and fall beneath the conforming loan size limit.

7For a detailed overview of this market, see Bruskin, Sanders and Sykes (1999).
5
The jumbo market is made up of loans that exceed the conforming loan size limit. The
remaining mortgages are non-jumbo and nonconforming: some of these may be high risk, such as
mortgages with high loan-to-value ratios and no form of mortgage insurance, and some are low
risk, such as loans with inadequate documentation but very low loan-to-value ratios. Most
private-sector securitizations are backed by jumbo mortgages or mortgages held by “sub-prime”
borrowers, the bulk of which have blemished credit histories but adequate assets or income to
support a mortgage.
Lacking government backing, private securitizations usually use one of three methods to
mitigate credit risk for the holders of the securities: a senior/subordinate structure,
overcollateralization, or credit enhancement.7 In the first method, the cash flows from the
underlying mortgages are split into separate securities or tranches. These securities are usually
ordered by their relative riskiness, with the highest-rated tranche bearing little, if any, of the
underlying credit risk associated with the mortgages. At the other extreme, an unrated tranche,
sometimes referred to as the “toxic waste,” is either retained by the originator or sold privately to
unregulated purchasers such as hedge funds or private partnerships (or—during the 1980s—to
savings and loans). Between the almost riskless and riskiest security can lie many other
securities, each with its own risk rating.
Overcollateralization, where the originator backs the security with a stock of mortgages
whose value exceeds the face value of the security, is sometimes used in securitization.
However, these days the technique is almost always combined with the senior/subordinated
structure described above. Finally, credit enhancements for the securities, which protect the
investors should the underlying assets default, can be purchased from banks, insurance
companies, or even the GSEs.
We now formally model this contrast between the GSE sector, where guarantees are
created by the GSEs without an explicit cost imposed on the GSEs (but may present a contingent
liability to taxpayers), and the private sector, where credit guarantees are costly for securitizers to
create.

6
(1)
(2)
Modeling Mortgage Securitization for Conforming LoansThe Bank and the Mortgage Borrower
In our model, a mortgage is originated in the first period and securitized or not securitized
in the second period. In the third period, the homeowner either pays off the mortgage or defaults
and the bank’s balance sheet is “marked-to-market.” Both the mortgage originator and
securitizer are risk neutral, and they know that the expected return from holding a mortgage is:
where r is the mortgage contract rate, q is the default probability, and rd is the return on a
defaulted mortgage. We assume that these parameters are identical across mortgages.
We assume the mortgage originator is a bank that has the option of holding the mortgage
in its portfolio or swapping it for a mortgage-backed security issued by the mortgage securitizer.
The principal and interest on the security are guaranteed by the securitizer. If the bank
securititizes the mortgage, it receives a benefit (denoted �) because the security is more easily
traded—in other words, is more liquid—than the mortgage.
The cost of government-insured deposits is assumed to be less than the cost of equity, so
our bank always funds with deposits if possible (which implies that banks hold the minimum
amount of equity capital required by regulators). If the bank holds the mortgage, its weighted
average cost of funding is:
where km is the regulatory minimum capital-to-asset ratio, rf is the yield on deposits, and re is the
minimum expected return to capital. If the bank swaps the mortgage for a mortgage-backed
security, the cost of funds, denoted fmbs, is the same, with the exception that the minimum capital
ratio becomes kmbs. Thus, if regulators view the mortgage-backed security as less risky than the
mortgage, the cost of funds is lower.
Banking is assumed to be a perfectly competitive industry, in which economic profits are
zero. We assume that each borrower’s mortgage costs the originator a different amount
(denoted ki) to securitize. The cost of making a mortgage securitizable varies across borrowers,

8In this paper, we ignore the possibility of adverse selection, where banks try to pass mortgagesto the securitizer that are expected to perform relatively worse, and the securitizer tries to defend itself. This possibility is discussed at length in Passmore and Sparks (1996, 1997). In addition, we ignore thepossibility of a corner solution because, while some individual institutions may securitize none or all oftheir mortgage originations, originators as a whole—as represented by our stylized originator—securitizesome mortgages and hold some mortgages.
9The effective coupon or yield on a mortgage-backed security for the bank is determined by thecoupon, the guaranty fee charged by the securitizer, the servicing relationship between the originator andsecuritizer, and by other contractual features of the originator/securitizer relationship. For a review ofthe mechanics of mortgage-backed securitization, see Fabozzi (2001).
7
(3)
and is distributed uniformly over [0,�]. For example, some borrowers’ credit histories can be
quickly discovered from computer databases, whereas uncovering other borrowers’ histories can
be quite time consuming. A bank may be willing to extend credit to a borrower in the latter
group without the extensive documentation that would be required to securitize the mortgage.
The bank chooses to securitize the mortgages of borrowers with smaller standardization
costs, but not the mortgages of borrowers with higher standardization costs.8 In other words,
the bank chooses a value for ki such that securitized mortgages have ki � [0,p], where p is the
cutoff value for ki that divides the population between securitized and non-securitized mortgages.
The proportion of mortgages securitized is then p/�.
The bank’s profit function (its expected profit per mortgage originated) is written as:
where c is the total return on the mortgage security to the bank (which we will refer to as its
effective coupon, which is the stated coupon plus servicing income to the bank), t is the audit
cost incurred by an outsider to the bank when determining the value of a mortgage held in
portfolio (which the bank takes into account when considering the market value of its portfolio),
� is the liquidity benefit derived from holding the mortgage as a security, and cm is the marginal
cost of originating the mortgage.9 The average cost of securitizing mortgages is p/2.
The bank chooses p to maximize profits. The first-order condition for this maximization
sets p equal to the difference between the return to holding the mortgage and the return to

10Note that mortgages are securitized until the cost of securitizing the marginal borrower equalsthe difference between the gains to securitization (enhanced liquidity and lower funding costs) and thelosses in interest income. Thus, if liquidity is not enhanced and if the capital charge for whole mortgageloans versus mortgage-backed securities is the same, there will be no securitization.
8
(4)
(5)
holding the security, or 10:
Thus, equation 4 describes the originator’s behavioral response to the securitizer’s choice of
effective coupon rate, to which our analysis now turns.
The Mortgage Securitizer
The mortgage securitizer chooses the effective coupon (c) to offer on the mortgage-
backed security when it swaps the security for the mortgage. The securitizer guarantees the
security from credit losses and holds capital in a reserve to absorb potential losses (or,
equivalently, “haircuts” the mortgages so that the dollar amount of securities issued is less than
the dollar amount of mortgages held by the securitizer).
The securitizer’s profit per originated mortgage is:
where ks is the securitizer’s regulatory minimum capital-to-asset ratio. In our model, capital is
kept as a “reserve” against possible mortgage defaults and re - rf is the opportunity cost of
holding this capital. The securitizer chooses the effective coupon rate on the mortgage-backed
security to maximize profits, while knowing the bank’s optimal response in setting the
securitization cutoff. Increasing c raises the securitizer’s costs, but induces the bank to securitize
a higher proportion of mortgages (p* rises). The securitizer’s problem differs depending on
whether the securitizer operates in the conforming or nonconforming mortgage market.
The Conforming Loan Market
As discussed earlier, the mortgages eligible for purchase by Fannie Mae and Freddie Mac

11In the short run, if profits are not forced to zero, securitization may not have much (or any)effect on the mortgage rate, depending on the characteristics of household demand for mortgages. Thispossibility is explored at length in Heuson, Passmore and Sparks (2000).
12 Generally, in our simulations we set the securitizer’s capital equal to the legislated minimum of45 basis points. By doing this, we assume that Fannie’s and Freddie’s government backing means thattheir debt holders do not care about the level of capital held by the government-sponsored enterprises andonly the statutory constraints on capital are binding.
9
(6)
define the conforming market. Using the framework outlined above, we model equilibrium in
the conforming market as the pair of {r,c} such that the economic profits on originated
mortgages are zero and the securitizer is choosing the effective coupon yield on mortgage-backed
securities to maximize profits, or:
If the banking industry is competitive, then its long-run economic profits are equal to zero
because any extra profit is dissipated as competition lowers the mortgage rate.11 Under the
constraint of zero profits, there is an inverse relationship between the yield on the mortgage-
backed security and the mortgage rate for any given level of bank profits because a higher level
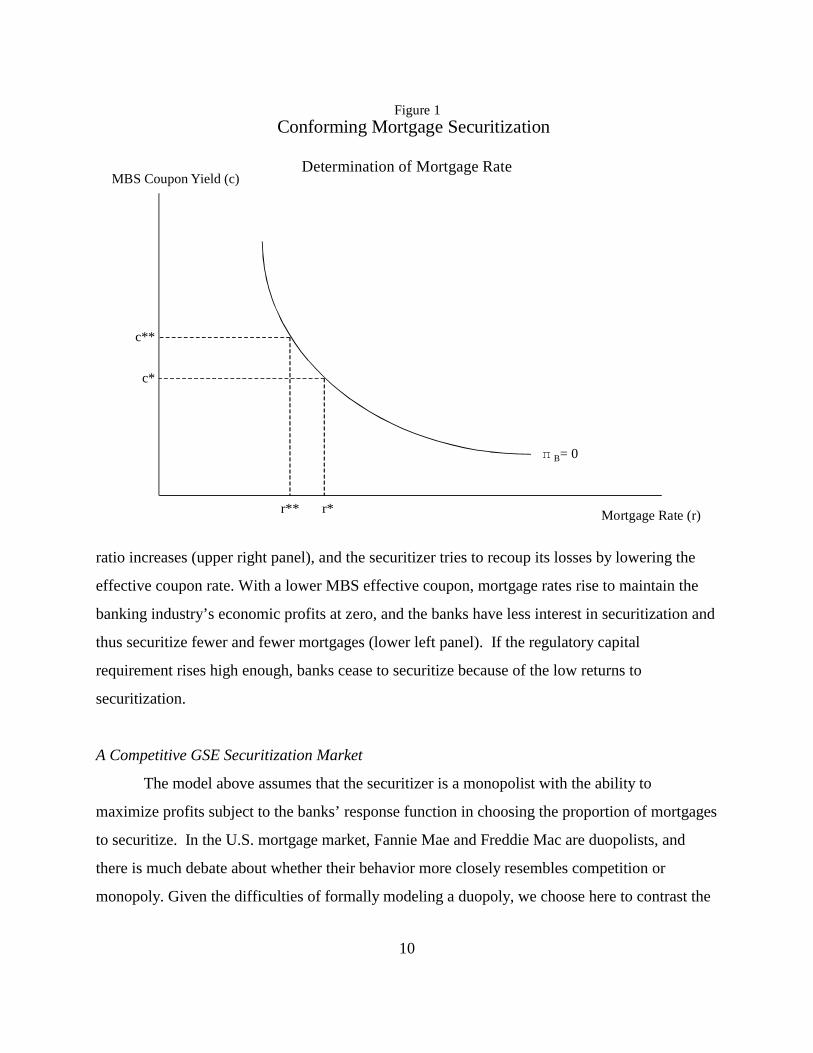
for both implies additional profits to the bank. The zero profit function is smooth and convex to
the origin, as shown in figure 1. Once c* is determined, the zero profit condition determines r*,
as illustrated in the figure.
We use Mathematica to solve these equations algebraically. While Mathematica can
easily find solutions to this system, they are lengthy combinations of the parameters described
above. However, we can simulate the comparative statics of the system by choosing some
realistic parameter values (which are described later in table 1).
To illustrate that the simulation model works as expected, figure 2 shows the effect of
varying the regulatory capital requirement over a range of 0 to 65 basis points (ks in the model
above).12 As regulatory capital increases, mortgage rates rise slightly while the MBS effective
coupon rate falls (upper left panel). The securitizer’s profits fall as the required capital-to-asset
10
Determination of Mortgage RateMBS Coupon Yield (c)
c**
c*
r*r** Mortgage Rate (r)
� B= 0
Figure 1Conforming Mortgage Securitization
ratio increases (upper right panel), and the securitizer tries to recoup its losses by lowering the
effective coupon rate. With a lower MBS effective coupon, mortgage rates rise to maintain the
banking industry’s economic profits at zero, and the banks have less interest in securitization and
thus securitize fewer and fewer mortgages (lower left panel). If the regulatory capital
requirement rises high enough, banks cease to securitize because of the low returns to
securitization.
A Competitive GSE Securitization Market
The model above assumes that the securitizer is a monopolist with the ability to
maximize profits subject to the banks’ response function in choosing the proportion of mortgages
to securitize. In the U.S. mortgage market, Fannie Mae and Freddie Mac are duopolists, and
there is much debate about whether their behavior more closely resembles competition or
monopoly. Given the difficulties of formally modeling a duopoly, we choose here to contrast the

11
Figure 2
10
20
30
40
50
0 10 20 30 40 50 60
Effect of Regulatory Capital on Securitizer Profits
Extranormal Return (%)
Capital-to-MBS Ratio (Bps)

12
two extremes—monopoly and perfect competition. We model a competitive GSE by assuming
that the securitizer’s economic profits are driven to zero, so that equilibrium satisfies:
ΠΠ
B
S
r c pc r p
( *; *, *)( *; *, *)
==
00 (7)
With bank profits constrained to zero, a higher MBS yield implies the mortgage rate is
lower. This result is confirmed by our simulations, as shown in figure 2 (lower right panel). In
the competitive GSE model, mortgage rates are generally lower than in the monopolistic
GSEmodel, as the ex ante return to capital is arbitrarily held at 15 percent (a figure slightly above
recent returns in the financial services industry) and any excess is passed along to borrowers
through the mortgage rate. The difference between the competitive mortgage rate and the
monopolistic mortgage rate diminishes as the amount of capital required to be held by the
securitizer increases, which drives the securitizer’s profitability down to that in the competitive
case.
A Graphical Comparison of Mortgage Rates with Competitive versus
Monopolistic GSEsWhen banks are competitive, the banks’ supply of mortgages to the GSEs can be derived
from equation (4) and the bank’s zero profit condition:
r f t c pa m m= + + −
2
2α(8)
When GSEs behave competitively, their profit per mortgage is invariant to the proportion
of mortgages securitized and the resulting competitive equilibrium can be illustrated in a supply
and demand diagram (as shown in the upper quadrant of figure 3).
When the GSEs behave strategically, they maximize profits with the knowledge that
banks will respond to the return on mortgage-backed securities by altering the proportion of
mortgages securitized. The tangency between the GSE’s iso-profit curves (equation 5) and the
bank’s decision rule for securitization (equation 4) define this equilibrium, as shown in bottom
quandrant of figure 3. Solving algebraically for both solutions yields the result that if GSEs are

13
securitizer’siso-profit curve
GSE Secondary Market
bank’s decision rule for securitization
Expected Return on Holding Mortgage
ram
ra
rac
cm
MBS Couponc
mortgage supply
monopolist equilibrium
competitive equilibrium
�s
�s increasing
pim pi
c
demand when GSE profit zero
cc
Proportion of mortgages securitized
Figure 3
GSE Secondary Market
bank’s decision rule for securitization
Expected Return on Holding Mortgage
ram
ra
rac
cm
MBS Couponc
mortgage supplymortgage supply
monopolist equilibriummonopolist equilibrium
competitive equilibriumcompetitive equilibrium
�s
�s increasing�s increasing
pim pi
c
demand when GSE profit zero demand when GSE profit zero
cc
Proportion of mortgages securitized
Figure 3

13There are a variety of reasons investors may prefer more-liquid securities to illiquid loans, andthus are willing to pay for intermediation that converts loans to securities, especially if the investor neednot to be concerned about credit risk. For example, mutual funds are required to meet redemptions inseven days or less, which motivates them to hold more liquid instruments. In addition, long-term mutualfunds are required to keep 85 percent of their assets in liquid securities. Furthermore, regulatorytreatment of mortgage-backed securities relative to mortgage loans is generally more favorable bothinside and outside the banking industry. And, at insurance companies, the capital requirement is smallerfor securities than for loans.
14
competitive, the proportion of mortgages securitized are greater than when GSEs are non-
competitive, and that mortgage rates are lower when GSEs behave competitively.
The Nonconforming Loan MarketThe securitization of nonconforming mortgages is fundamentally different from the
securitization of conforming mortgages because the securitizers do not have government charters
and the associated implicit guarantees. In the nonconforming market, investors—both the
shareholders of the securitizer and the holders of the securities—care about how much capital is
held by the securitizer because it limits their downside risk. In addition, many investors
—particularly trusts, mutual funds, insured depositories, wealthy individuals, and institutions in
foreign countries—are unlikely to buy, or are even legally restricted from buying, the security
unless a rating agency virtually assures that the credit risk has been removed by giving the
security a high rating. Many institutional investors, and almost all retail investors, do not have
the ability to analyze the credit risk associated with mortgages. We assume that purchases of
securities by these groups of uninformed investors (without the capacity to assess credit risk)
create the “depth” and “breadth” in a securities market, and thus enhances its liquidity.13
The bank is motivated to securitize because it desires to capture the liquidity value
provided by holding a mortgage-backed security instead of a mortgage. However, the liquidity
value depends on the credibility of the securitizer’s guarantee. If the securitizer does not have
either implicit or explicit government backing, the value of the guarantee is determined by the
amount of capital or collateral held by the securitizer, because that collateral can be used to offset
losses should mortgage borrowers default. Since the value of securitization to many potential
14Of course, in most non-GSE securitization structures, the securities holders must rely only onthe loss absorption of the subordinate piece of the security and do not recourse to the capital of thesecuritizer. However, in practice, originators/securitizers sometimes pledge additional collateral or injectcash into securitization trusts when the existing collateral become impaired because they do not want tohurt their reputation for providing investment-grade securities to the market. Regardless of the form ofthe contract, we believe the purchasers of the high credit quality portions of the trust demand theequivalent to a risk-free security and that prices and contracts will reflect this demand.
15The uninformed investor can be thought of as caring only about the rating given the security byan independent rating agency, which certifies that the securitizer has sufficient resources to make timelypayments on the securities.
16In practice, the residual tranche might be sold to a mortgage servicer that specializes inhandling foreclosed or delinquent mortgages. Regardless, the bank represents “informed investors,” whoreceive the economic value associated with the residual tranche because they invest in the technology toassess the credit risk associated with pools of mortgage loans.
15
(9)
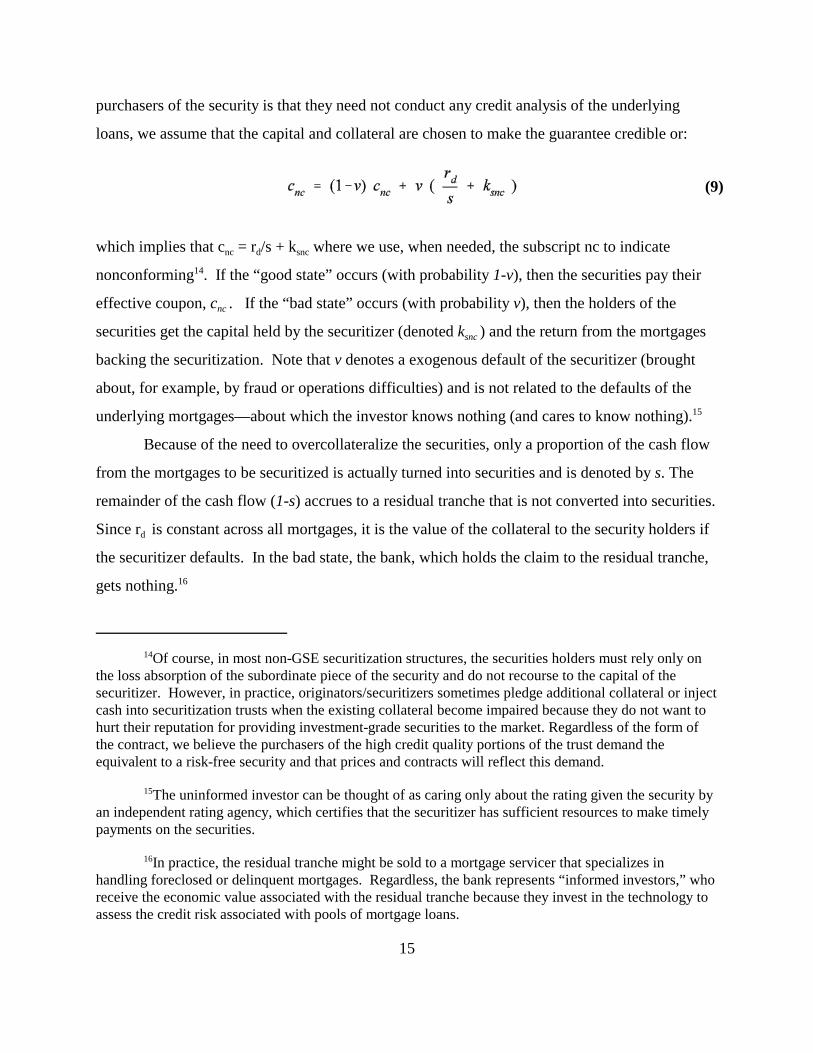
purchasers of the security is that they need not conduct any credit analysis of the underlying
loans, we assume that the capital and collateral are chosen to make the guarantee credible or:
which implies that cnc = rd/s + ksnc where we use, when needed, the subscript nc to indicate
nonconforming14. If the “good state” occurs (with probability 1-v), then the securities pay their
effective coupon, cnc . If the “bad state” occurs (with probability v), then the holders of the
securities get the capital held by the securitizer (denoted ksnc ) and the return from the mortgages
backing the securitization. Note that v denotes a exogenous default of the securitizer (brought
about, for example, by fraud or operations difficulties) and is not related to the defaults of the
underlying mortgages—about which the investor knows nothing (and cares to know nothing).15
Because of the need to overcollateralize the securities, only a proportion of the cash flow
from the mortgages to be securitized is actually turned into securities and is denoted by s. The
remainder of the cash flow (1-s) accrues to a residual tranche that is not converted into securities.
Since rd is constant across all mortgages, it is the value of the collateral to the security holders if
the securitizer defaults. In the bad state, the bank, which holds the claim to the residual tranche,
gets nothing.16

16
(10)
The probability that the securitizer defaults (v) is irrelevant to the uninformed investor in
the MBS (and thus it falls out of equation 9). Uninformed investors are assumed to desire a
security where the value is readily determined, and thus the focus only on the securitizer’s capital
and overcollateralization. These investors do not desire to become knowledgeable about the
characteristics of the underlying mortgages.
As discussed earlier, private-sector securitizations usually break the cash flows from the
underlying mortgages into separate securities, and the equation above incorporates this contract
design. The contract between the securitizer and the originator is straightforward: the securitizer
issues a security based on only the fraction of the cash flow of the mortgages that the bank
desires to securitize, but the security holders have claim to all of the collateral backing these
mortgages should the mortgages default, enhancing the ex ante return from the securities.
As in the conforming market, we assume that the mortgage rate in the nonconforming
market is set so that economic profits per mortgage originated by the bank are zero (and the
choice of which mortgages to securitize maximizes bank profits). (The bank can be viewed as
having two departments, as many do—one that originates and securitizes conforming mortgages
and one that originates and securitizes nonconforming mortgages.) But unlike in the
monopolistic conforming market, we assume that competition among mortgage securitizers
drives their profits to zero.
The bank’s profits, as in the case of GSE securitization, depend on the returns from the
mortgages it holds and those it securitizes. The returns on the mortgages held directly are
parallel to those in the GSE case, but returns from securitization are different because of the need
to account for the two tranches. Two tranches—one investment grade securities (accounting for
s percent of the mortgages securitized and with a payoff to the bank of the MBS effective coupon
yield plus the liquidity premium) and the other “toxic waste” (accounting for 1-s percent of the
mortgages securitized and with its payoff the residual mortgage cash flow when a mortgage does
not default and zero when a mortgage does default)—are embedded in the bank’s profit function
as follows:

17
(11)
(12)
Note that we assume that the bank regulator is not “fooled” by the securitization, and applies the
capital weight for all the mortgages to the holder of the residual tranche.
As in the conforming market, the bank maximizes profits by choosing the proportion of
mortgages to securitize, pnc, producing the first-order condition:
This first-order condition simply equates the marginal profit of securitizing to the marginal profit
of holding a mortgage in portfolio.
The securitizer’s profit function, which incorporates s but not (1-s) because the securitizer
produces the securities and the bank holds the residual tranche, is written as:
Note that if a mortgages defaults, the securitizer receives all of the value of the collateral
underlying the mortgage and the holder of the residual tranche (in this case, the bank) receives
nothing. Should the securitizer default, all of the value (both capital and mortgage collateral)
goes to the securities’ holders (the uninformed investors).
Unlike in the GSE case, the securitizer does not choose cnc. In the nonconforming case,
the only purpose of the securitizer is to help the bank capture the liquidity premium from
securitization. Competition among securitizers—who are competing to be the bank’s
securitizer—causes securitizer capital, ksnc , to adjust until economic profits are zero.
In equilibrium, uninformed investors hold the securities and informed investors hold the
residual tranche. Since informed investors always have the choice of holding the security (and
all agents are risk-neutral), the effective coupon rate is set so that the expected return to the bank
of holding the security equals the return to holding the residual tranche of the securitization.
Thus, the following equation characterizes equilibrium:
c r qnc + = −δ ( )1 (13)

18
Combining the bank’s zero profit function (by setting equation 9 to zero), its first-order
condition (equation 10), and equation 12, we obtain the solutions for c*nc, p*, and r*.
Combining these solutions with the securitizer’s zero profit condition (equation 11) and the
equation for creating a risk-free security (equation 8), we find solutions for s and ksnc.
A Graphical Comparison of Three Possible Equilibrium Mortgage RatesIn our model of the nonconforming mortgage market, we assume securitizers are
competitive and, in essence, this model is similar to the competitive GSE model—the primary
difference is that nonconforming securitizers have a higher cost structure because of their lack of
an implicit government guarantee. As shown in the upper quadrant of figure 4, this higher cost
structure yields a higher primary mortgage rate than the competitive GSE mortgage rate.
However, the jumbo mortgage rate may be higher or lower than the monopolistic GSE mortgage
rate. Similarly, the proportion of mortgages securitized in the jumbo market will be less than the
proportion in the competitive GSE market, as shown on the horizontal axis of figure 4.
Simulation ResultsUsing the model developed above, we simulate both the differences between effective
mortgage and MBS rates for all three types of markets (monopolistic GSE, competitive GSE and
nonconforming mortgages) and the difference between GSE and nonconforming market
mortgage rates. There are eleven exogenous parameters in these models, some of which have
values that are well-known. For example, the minimum risk-adjusted capital requirement on
banks for mortgages and for private mortgage-backed securities with a high investment-grade
rating is 4 percent (km), the minimum risk-adjusted capital requirement for banks on GSE
mortgage-backed securities is 1.6 percent (kmbs), and the minimum capital requirement on Fannie
Mae and Freddie Mac for mortgage-backed securities is 45 basis points (ks).
Other parameters are independent of the particular mortgage system. For example, we
assume that the ex ante risk-adjusted return to capital is 15 percent (re) and that a bank’s cost of

19
N onconform ing Secondary M arket
Expected Return on Holding M ortgage
ram
ra
rac
cm
M BS Couponc
m ortgage supply
p im pi
c
bank’s decision rule for securitization
dem and when GSE profit zero
cc
raj
private sector coupon ratecj
p ij
nonconform ing com petitive equilibrium
Figure 4
Proportion of m ortgages securitized
GSE m onopolist equilibrium
GSE com petitive equilibrium
N onconform ing Secondary M arket
Expected Return on Holding M ortgage
ram
ra
rac
cm
M BS Couponc
M BS Couponc
m ortgage supplym ortgage supply
p im pi
c
bank’s decision rule for securitizationbank’s decision rule for securitization
dem and when GSE profit zero dem and when GSE profit zero
cc
raj
private sector coupon ratecj
p ij
nonconform ing com petitive equilibrium nonconform ing com petitive equilibrium
Figure 4
Proportion of m ortgages securitized
GSE m onopolist equilibrium
GSE com petitive equilibrium

17Our model ignores interest rate risk or maturity-mismatch risk. We solve the latter problem byassuming that the model periodicity is annual over a long horizon. Thus, the appropriate deposit rate isfor a long-term deposit or bond. As for interest rate risk, it is outside the scope of this model butgenerally one would add from 60 to 120 basis points to our simulated mortgage rates to account for theprepayment option.
18See Canner, Passmore and Surette (1996).
20
deposits is 6 percent (rf)17. It seems unlikely that either of these values would vary by mortgage
system, although different values for these parameters—even when the same for both mortgage
systems—can have different effects in the two systems.
Finally, six of the parameters may or may not vary by type of mortgage. Three of these
parameters can be chosen with reference to some previous empirical work. The expected annual
default rate is assumed to be 10 basis points (the GSEs’ “serious delinquency rates” are about 50
basis points, but actual default rates are far smaller), the marginal cost of mortgage origination is
assumed to be 1 percent (an amount consistent with industry studies), and the loss incurred on a
defaulted mortgage is 20 percent of the balance (so that rd = 0.8).18
The three other parameters have unknown values and thus are chosen based on the
authors’ beliefs about what might be reasonable. The value to the bank of the liquidity from
holding a security is assumed to be 50 basis points (�), the cost of an outsider (an institution that
did not originate the mortgage) evaluating a mortgage (denoted t in the model) is 15 basis points,
and the maximum cost of converting a mortgage into a security (�) is 100 basis points.
By varying the parameters described above, we simulated the spread between effective
mortgage and MBS rates (tables 1A and 1B). The parameter that varies in the simulation is
described in columns 1 and 2 on the table. The range over which the parameter varies is given in
column 3, and column 4 shows the value of the parameter when other parameters are chosen to
vary.
Table 1A covers the monopolistic and competitive GSE cases. For each case, we used
three different values of a parameter—the minimum in the range, the midpoint, and the
maximum. Using three cases provides a sense of how varying the parameter affects the
mortgage-MBS spread. We also provide the proportion of mortgages securitized for each case in
this table.

19See pages 3-5, The 2001 Mortgage Market Statistical Annual, op. cit.
21
Given how we define effective rates, the spread between mortgage and MBS rates in the
conforming market is equivalent to the guarantee fee charged by the GSEs, which generally runs
between 17 and 23 basis points for most transactions between GSEs and mortgage originators.
In our simulations for the monopolistic GSE case (columns 5 through 7), the mortgage-MBS
spread ranges from 27 basis point to 77 basis points, somewhat higher than the fee normally
charged by the GSEs in practice. Also, in this case, the proportion of mortgages securitized
ranges from 5 percent to 55 percent. The actual proportion of the mortgage market securitized by
the GSEs is difficult to estimate, but it appears to range between 45 percent and 65 percent.19
Finally, in the monopolistic case, securitizers earn positive economic profits. The simulated
GSE’s accounting profits (columns 11 to 13) vary from a low of 15 percent to a high of 45
percent, with most values around 24 percent. Fannie Mae’s and Freddie Mac’s return to equity
has average around 25 percent during the past decade.
In the competitive GSE case (columns 8 to 10), the simulated spreads run from 7 basis
point to 37 basis points, with most values in the low twenties. The proportion of mortgages
securitized varies from 9 percent to 109 percent (a value that is “out of bounds”), with most
between 50 percent to 70 percent. By definition, economic profits are zero in the competitive
case.
In both the monopolistic and competitive cases, the liquidity value of securitization
creates the large changes. In the monopolistic case, these changes are reflected in the mortgage-
MBS rate spreads, whereas in the competitive case they are reflected in the proportion of
mortgages securitized. The monopolist captures the liquidity premium, while the competitor
passes it on in the mortgage rate.
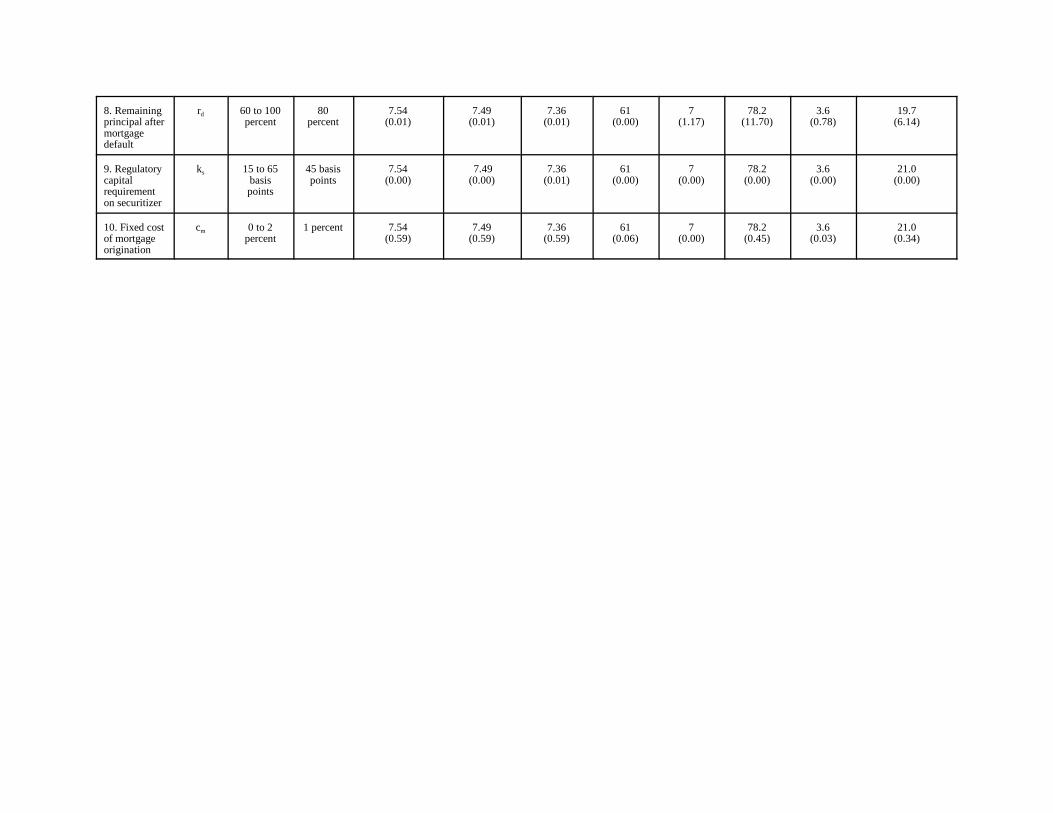
The nonconforming mortgage market is described in table 1B. There are more
endogenous variables in this case; thus, we present the simulations in a different format from that
of the other table 1A. Here, we run 100 simulations for values equally spaced across the range
for the parameter (holding all other parameters at their fixed value, as described in column 4) and
present the mean and standard deviation of the simulation results.

22
Unfortunately, for this market, there are no readily available industry statistics to compare
with the simulation results. As shown in columns 5 through 7, mortgage rates in our simulations
are about 7.5 percent (recall, these rates do not include a charge for the prepayment option). Like
the competitive GSE spread, the mortgage-MBS spread is relatively constant across simulations
(at 61 basis points) because the securitizer simply “marks up” the costs of securitization to
provide the return on capital (column 8). But unlike the GSE market, securitization occurs for
only a small percentage of the nonconforming mortgages, reflecting the higher cost of credit
enhancement required in this purely private-sector endeavor (column 9).
The key to private sector securitization is the provision of the residual tranche (column
10). In these simulations, 78 percent of the cash flow from the mortgages purchased by the
securitizer is issued as securities, while the remaining 22 percent is held to protect the first
tranche against losses. The securitizer’s capital—another layer of protection for the first tranche
security holders—runs between 3.6 percent to 4.1 percent of mortgage assets (column 11).
Investors in nonconforming MBS have both recourse to this capital and priority over the holders
of the residual tranche for the collateral should the mortgage securities default. Combining the
securitizer’s capital with the collateral backing the residual tranche, the first tranche security
holders effectively have claim to about 21 percent of the value of the mortgages (column 12).
Given that in the case of default, the loss rate is between zero and 40 percent, the first mortgage
holders reasonably expect no losses on their securities.
Simulating the Conforming-Nonconforming Mortgage SpreadWe use a a similar simulation exercise to investigate the spread between conforming
mortgage rates and nonconforming mortgage rates (table 2). We vary the parameters in the same
way as before (columns 1 through 4). Column 5 shows the mean and standard deviation of the
difference between the nonconforming and monopolistic conforming mortgage rate for 100
simulations that span the range of parameters (as was done in table 1B). It is striking how little
difference there is in the means of the spreads across parameters for the monopolistic case—all
of these spreads are less than 10 basis points (column 5). When the GSEs are treated as
competitive, the resulting mortgage rate is always somewhat lower than when they are treated as
monopolists, and the spread between the nonconforming and conforming rate is centered around

20There are a variety of reasons different securities may have different market liquidity. Forexample, Grossman and Miller (1988) point to greater frequency of trading, Pagano and Roell (1996)suggest that transparency of pricing is important, and Glaeser and Kall (1997) develop a model showingthat more information about a security may either increase or decrease liquidity.
23
17 basis points, with a standard deviation that suggests a range from about 5 to 40 basis points
(column 6).
Rather than focusing on the average differences, we might look instead at the maximum
difference between the nonconforming rate and the conforming rate for any particular parameter
value (columns 7 and 8). Here, again, the spreads in the monopolistic case are relatively small,
whereas for the competitive case they are larger. Again, the value of liquidity and the bank’s
regulatory capital requirement on a mortgage portfolio can yield sizable differences in rates.
We also compute the maximum difference between the nonconforming mortgage rate and
the GSE rate, where either can be derived from any value of the parameter over the relevant
range (columns 9 and 10). As noted earlier, some of these parameters are unlikely to be different
in actual markets. For example, the bank’s cost of deposits or the risk-adjusted return to capital
should not depend on whether the bank holds conforming mortgages or nonconforming
mortgages. Other parameters, such as the marginal valuation costs or fixed costs of origination,
might arguably differ between conforming and nonconforming mortgage originations because of
the greater volume or greater standardization of conforming mortgages. Finally, some
parameters likely are different across the GSE and private-sector markets. These parameters
include the regulatory capital requirements imposed on banks, which are usually lower when
banks hold GSE mortgage-backed securities than when they hold private-sector mortgage-backed
securities, and the liquidity of the markets, where GSE mortgage-backed securities have agency
status, allowing them to be purchased by a variety of trusts and other fiduciaries, whereas private-
sector securities lack this status.
The liquidity premium is perhaps the most interesting parameter of the model. Recall
that the liquidity premium is the value to the originator of holding a mortgage as a security
compared with holding it as a loan20. The liquidity advantage of the GSE-created securities
arguably stems directly from the GSE’s implicit government backing. If liquidity is mainly the
result of size, and if the large sizes of the GSEs are mainly a result of their advantages over

21The debate about the source of the liquidity advantage is noted in the U.S. Treasury’s report onFannie and Freddie: “In comments provided to the Treasury, Freddie Mac stated that a funding advantageof 30 basis points in issuing mortgage-backed securities was reasonable, but this was not a fair measureof their GSE benefits since their securities also benefit from a liquidity advantage. Any liquiditypremium accruing to the GSE’s mortgage-backed securities however, reflects to some (probably large)degree, liquidity advantages derived from their GSE status.” (U.S. Treasury, 1996, p.31)
24
private-sector securitizers, then their liquidity advantage can be seen as an extension of their GSE
status. However, if their liquidity advantage arises mainly because of better execution and
management of securities transactions, then the advantage may not be associated with GSE
status.21 Regardless, if this parameter differs across nonconforming and conforming mortgages,
the resulting mortgage rate spread can be large.
All things considered, if GSE behavior is competitive or if there are stark differences
between parameter values across the nonconforming and conforming mortgage markets, then
many other parameters, including banks’ cost of deposits, bank capital standards, and the fixed
costs of mortgage origination, can yield big differences in simulated mortgage rates (rows 2, 3
and 10; columns 8 and 9). However, as mentioned above, it is difficult to see why the cost of
deposits would vary by the type of mortgage originated by the bank. Similarly, large differences
in the minimum bank capital requirements can generate large differences in mortgage rates, but
this value is pegged at 4 percent for both conforming and nonconforming mortgages.
Differences in the fixed costs of origination can create large differences in mortgage rate
spreads. This cost, however, is relatively uninteresting analytically because it is simply passed
through to the mortgage borrower. Thus, if origination costs for nonconforming mortgages were,
for example, 50 basis points higher, the nonconforming mortgage rates would be about 50 basis
points higher.
Other parameters that may differ across mortgages—the marginal valuation cost, annual
mortgage default rate and the losses on a defaulted mortgage—can create differences in mortgage
rates that are large enough to account for observed differences in rates. However, while these
costs may well vary significantly between some jumbo and conforming mortgages, there is some
evidence that the average the credit quality of jumbo mortgages eligible for securitization and
conforming mortgages does not differ much (see Mansukhani and Kramer, 2000).

25
How to interpret these simulation results depends on one’s view of the similarity between
conforming and nonconforming mortgages. If these mortgages are identical, monopolistic
behavior by the GSEs yields small differences between conforming and nonconforming rates (up
to 15 basis points), whereas competitive behavior might yield differences as large as 60 basis
points. If these mortgages are different, then large differences in rates emerge regardless of the
competitive behavior of the GSEs.
Theoretically, the nonconforming mortgage rate can be below the GSE conforming
mortgage rate. If the liquidity benefits of securitization are small and the regulatory capital
advantages granted to securitization of minimal, then the value of the implicit government
guarantee does not yield a substantial cost advantage to the GSEs. Of course, with the small
liquidity or capital benefits, few mortgages would be securitized in any case. For example, if
liquidity benefits are assumed to be zero but the capital advantage is large (providing a
motivation to securitize some mortgages), then the simulated value of the nonconforming
mortgage rate can be a few basis points below that of the GSE mortgage rates (this is true for
both the monopolistic and competitive GSE rates) for simulations where the other parameters are
within the ranges described in the tables. Only a small percent of conforming mortgages are
securitized in these cases, but GSE securitizer profits are positive.
An Empirical Investigation of the Jumbo-Conforming SpreadThe bulk of nonconforming mortgages that are securitized are jumbo mortgages. The
difference between rates paid on jumbo mortgages, which are too large to be securitized by the
GSEs, and those paid on conforming mortgages is often used as a proxy for the influence of
GSEs on mortgage rates, and we will use it here as such. However, the jumbo mortgage rate is
not a direct measure of the mortgage rate that would prevail if the GSE subsidy did not exist. For
example, the poorer liquidity of jumbo mortgage-backed securities might be significantly
improved if the jumbo and conforming mortgage markets were combined. As shown above, the
liquidity for the securities makes a significant difference in the resulting mortgage rates.
On the other hand, to the degree that homeowners can substitute between jumbo and

26
conforming mortgages, lower mortgage rates in the GSE market may also push down mortgage
rates in the jumbo market, implying that current jumbo rates might understate the possible rise in
mortgage rates were GSEs not present (assuming that all mortgages would rise to the “no-GSE”
jumbo rate without GSEs). As shown below, we attempt to control for this effect by looking
only at jumbo mortgages that are substantially above the GSE size limit.
The primary source of data on mortgage rates is the Mortgage Interest Rate Survey
(MIRS), a large monthly survey of terms on single-family first mortgages, which is collected by
the Federal Housing Finance Board. This loan-level data set is gathered from a number of thrifts,
as well as some commercial banks and mortgage companies. The data collected for each
mortgage include the outstanding principal, the contract interest rate, fees, the effective interest
rate, the type of mortgage (adjustable or fixed), term to maturity, loan-to-value ratio, and state of
origination.
We attempt to select data from MIRS so that the jumbo and conforming mortgages used
in our analysis are as similar as possible. We control for a variety of factors by limiting our
analysis to the state level. For example, default risk, in particular, is an important determinant of
the nonconforming-conforming spread, and default rates and foreclosure laws vary by state.
Moreover, state variation in laws concerning matters related to mortgages (e.g. title insurance,
escrow accounts, etc.) can result in small variations in mortgage rates—variations that may be a
sizable part of the nonconforming-conforming spread. Finally, a small number of mortgages
within a state may indicate the jumbo market within the state is too thin to provide a reliable
gauge of the jumbo rate in a hypothetical well-functioning market.
Unfortunately, the average monthly sample sizes vary substantially across states and are
often very small. For jumbo loans, California offers a sample averaging around 613 loans per
month. For the rest of the states, however, samples are sparse. Illinois, Maryland, New Jersey,
Virginia, and Washington each average between 60 and 70 jumbo mortgages per month in the
survey, but 30 states have fewer than 15 observations per month for jumbos.
As a result, we choose to focus only on loans originated in California (as was done in
some of the earlier studies making this comparison). We also select only 30-year fixed-rate
mortgages with principal of at least $125,000 and with loan-to-value ratios no greater than 80

22After these screens are applied, no other state has more than twenty jumbo loans per month andall but five have fewer than ten. The screen that removes adjustable-rate mortgages accounts for much ofthe drop in the number of jumbo loans. Unfortunately, the terms on adjustable-rate mortgages are sovaried it is not possible to determine how to aggregate these mortgages.
27
percent. We set a minimum size on conforming mortgages because smaller mortgages may be
more costly to underwrite than larger mortgages. As for the loan-to-value ratio, it is perhaps the
best measure of credit risk for the mortgage per se and, by restricting it to 80 percent or less, we
limit our discussion to rather ordinary low-risk mortgages that potentially could be purchased by
a GSE. Even so, without additional information, such as information about the borrower’s credit
history, we cannot be certain that the mortgage is truly conforming.
We choose jumbo loans that are less than twice the GSE loan limit but greater than
$20,000 over that limit. We set a maximum size because extremely large mortgages are often
unique and fall within the realm of “private banking.” We exclude mortgages within $20,000 of
the GSE loan limit because most mortgage holders with low-risk loans would usually stretch to
fall under the GSE limit to get the generally lower mortgage rate or split their mortgage into a
conforming first mortgage combined with a second mortgage. Thus, a mortgage within this limit
might be unusual; otherwise it would have been split into a conforming first mortgages and a
small second mortgage.
Finally, we screen the mortgage rate data and delete mortgages with rates greater than 12
percent or less than 5 percent because for fixed-rate mortgages over this time period, values
outside this range are likely data-entry errors or (on the high end) represent “subprime”
mortgages. We also limit our time frame to 1992 through 1999, partly because private-sector
securitization is a relatively recent phenomenon and partly because MIRS underwent a
substantial revision in 1991 that improved the data collection, but made comparison to earlier
years difficult. With this screened data set, observations are even sparser, with California having
an average of around 308 conforming loans and 102 jumbos per month.22
As shown in the top panel of figure 5, we find that the difference between the median
jumbo and conforming rates varies considerably over the 1992-1998 period. However, this
spread is consistently positive with the exception of 1994. Over the entire period, the mean
difference of this spread is 18 basis points. Excluding the years 1992 through 1994 (because one

28
1992 1993 1994 1995 1996 1997 1998 1999 2000160
120
80
40
0±+
40
80
120
160
Figure 5
Difference Between Median Rates
Jumbo less conforming
Basis points
1992 1993 1994 1995 1996 1997 1998 1999 2000160
120
80
40
0±+
40
80
120
160
Difference Between Median Rates
Jumbo less conforming
Basis pointsSet To Zero Where Statistically Insignificant
and interest rate between 5%purchase limit to twice the limit.

29
might think the negative spreads observed during 1994 were unusual and signaled a transition to
a new regime in MBS pricing) results in a mean difference of 23 basis points.
Unfortunately, the substantial variation in this spread means that we have little confidence
in any point estimate of the spread. For example, the standard deviation of the mean difference
over the entire sample is 24 basis points, greater than the point estimate of 18 basis points. When
the years 1992 through 1994 are removed, the standard deviation falls to 11 basis points. Using
the rule of thumb that two standard deviations cover almost all possible observations, this
measure would suggest that the spread ranges from zero to around 50 basis points.
Since we have a cross-section of mortgages for each month, we can perform a test to see
if the difference between the two median rates in a given month is statistically significant. Doing
so, we find that the large negative values observed in 1994 are insignificant because the number
of jumbo loans during these months is small, making the standard error of the median estimate
large. If we set the spreads in 1994 to zero, the mean difference between the median conforming
and jumbo rate is little changed, at 19 basis points. And, again, the standard deviation is
large—13 basis points.
ConclusionOur data analysis indicates that the typical spread between mortgages conforming for
purchase by Fannie Mae or Freddie Mac—the two largest mortgage-related GSEs—and
mortgages that are not eligible for purchase by these GSEs is between 18 and 23 basis points,
although the range of this difference varies substantially over time, suggesting there can be little
confidence in these type of point estimates. Regardless, our simulations suggest a similar
difference if conforming and nonconforming mortgages are identical in their liquidity and other
characteristics, and if the GSEs behave as perfect competitors. If nonconforming mortgages are
either less liquid when converted to securities or more expensive to originate or evaluate than
conforming mortgages, then our simulations suggest that the observed mortgage spread is smaller
than would be realized if Fannie and Freddie behaved competitively.

Table 1ASimulated Mortgage-MBS Spreads, Securitization Proportions and Profits for GSE Markets
Changes in these statistics in Response to Changes in Exogenous Parameters
(1)Parameter
(2)Symbol
(3)Parameter
Range Used inSimulation
(4)Parametervalue used
whenparameter is
fixed
Difference between the Mortgage Rate and the MBSCoupon at Varying Parameter Values with
Corresponding Proportion of Mortgages Securitized inParentheses.
Securitizer’s Profits at VaryingParameter Values
Monopolistic Case(Spread in Basis Points;Proportion in Percent)
Competitive Case(Spread in Basis Points;Proportion in Percent)
Monopolistic Case(Basis Points)
(5) Min
(6)Mid
(7)Max
(8) Min
(9) Mid
(10)Max
(11)Min
(12)Mid
(13)Max
1. Liquidity value ofsecuritization
� 0 to 100 basispoints
50 basispoints
27(5)
54(30)
77(55)
22(9)
22(95)
22(109)
15 24 45
2. Bank’s cost of deposits
rf 4 percent to 8percent
6 percent 53(31)
52(30)
50(29)
22(62)
22(59)
21(57)
24 24 23
3 Bank mortgagesmarginal capitalrequirement
km 1.6 percent to 8percent
4 percent 41(19)
55(33)
70(48)
22(38)
22(67)
22(95)
19 26 38
4. Annual mortgagedefault rate
q 0 to 25 basispoints
10 basispoints
49(30)
52(30)
56(30)
19(59)
22(59)
26(59)
24 24 24
5. Marginalvaluation cost
t 0 to 30 basispoints
15 basispoints
37(30)
52(30)
67(30)
7(59)
22(59)
37(59)
24 24 24
6. Expected risk-adjusted return tocapital
re 10 to 20percent
15 percent 47(27)
52(30)
56(32)
20(54)
22(59)
24(65)
17 22 27
7. Bank regulatorymarginal capitalrequirement forMBS portfolio
kmbs 1.6 percent to 4percent
2.5 percent 56(34)
50(28)
45(23)
22(68)
22(67)
22(46)
26 23 20

8. Remainingprincipal aftermortgage default
rd 60 to 100percent
80 percent 54(30)
52(30)
50(30)
24(59)
22(59)
20(59)
24 24 24
9. Regulatory capitalrequirement onsecuritizer
ks 15 to 65 basispoints
45 basispoints
50(31)
51(30)
52(29)
19(62)
21(60)
24(58)
25 24 23
10. Fixed cost of mortgageorigination
cm 0 to 2 percent 1 percent 51(30)
52(30)
52(30)
22(59)
22(59)
22(59)
24 24 24

Table 1BSimulated Mortgage-MBS Spreads, Securitization Proportions and Profits for Nonconforming Market
Changes in these statistics in Response to Changes in Exogenous Parameters
(1)Parameter
(2)Symbol
(3)Parameter
RangeUsed in
Simulation
(4)Parameter
valueused when
parameteris fixed
Mean Values over Varying Parameter Values with Standard Deviations in parentheses
(5) NonconformingMortgage Rate
(Percent)
GSE Rates Nonconforming Mortgage Market
(6)Monopolistic
Case(Percent)
(7)Competitive
Case(Percent)
(8)Rate -
CouponSpread(BasisPoints)
(9) ProportionSecuritized
(Percent)
(10)Proportion
of CashFlow
Securitized(Percent)
(11)Securitized
Capital(Percent)
(12)Securitized Capitaland Default Value
of the ResidualTranche(Percent)
1. Liquidityvalue ofsecuritization
� 0 to 100basispoints
50 basispoints
7.54(0.00)
7.48(0.04)
7.32(0.18)
61(29.30)
7(0.00)
78.2(2.74)
3.7(2.70)
21.1(0.51)
2. Bank’s costof deposits
rf 4 percentto 8
percent
6 percent 7.54(1.13)
7.49(1.13)
7.36(1.13)
61(0.11)
7(0.00)
78.2(0.40)
3.6(0.46)
21.1(0.77)
3 Bankmortgagesmarginalcapitalrequirement
km 1.6 percentto 8
percent
4 percent 7.61(0.17)
7.55(0.14)
7.37(0.06)
61(0.02)
7(0.00)
78.1(0.13)
3.6(0.01)
21.1(0.10)
4. Annual mortgagedefault rate
q 0 to 25basispoints
10 basispoints
7.54(0.02)
7.50(0.02)
7.37(0.02)
63(7.88)
5(5.86)
78.4(0.69)
3.8(0.69)
21.1(0.14)
5. Marginalvaluation cost
t 0 to 30basispoints
15 basispoints
7.53(0.08)
7.49(0.09)
7.36(0.09)
61(0.01)
7(8.79)
78.2(1.03)
3.6(1.03)
21.0(0.21)
6. Expectedrisk-adjustedreturn tocapital
re 10 to 20percent
15percent
7.54(0.12)
7.49(0.11)
7.36(0.10)
61(0.01)
7(0.00)
78.7(1.65)
4.1(1.68)
21.2(0.36)
7. Bankregulatorymarginalcapitalrequirementfor MBSportfolio
kmbs 1.6 percentto 4
percent
2.5percent
7.54(0.00)
7.50(0.01)
7.37(0.04)
61(0.00)
7(0.00)
78.2(0.00)
3.6(0.00)
21.0(0.00)
8. Remainingprincipal aftermortgagedefault
rd 60 to 100percent
80percent
7.54(0.01)
7.49(0.01)
7.36(0.01)
61(0.00)
7(1.17)
78.2(11.70)
3.6(0.78)
19.7(6.14)
9. Regulatorycapitalrequirementon securitizer
ks 15 to 65basispoints
45 basispoints
7.54(0.00)
7.49(0.00)
7.36(0.01)
61(0.00)
7(0.00)
78.2(0.00)
3.6(0.00)
21.0(0.00)
10. Fixed cost of mortgageorigination
cm 0 to 2percent
1 percent 7.54(0.59)
7.49(0.59)
7.36(0.59)
61(0.06)
7(0.00)
78.2(0.45)
3.6(0.03)
21.0(0.34)

Table 2Simulated Comparative Statics
Changes in the Spread between GSE and Nonconforming Mortgage Rates in Response to Changes in Exogenous Parameters
(1)Parameter
(2)Symbol
(3)Parameter
RangeUsed in
Simulation
(4)Parametervalue used
whenparameter is
fixed
Mean and Standard Deviationof Differences (with all
parameters the same) betweenNonconforming Mortgage
Rates and ...
Maximum Difference between Nonconforming Mortgage Rates and ...
(5)MonopolisticGSE Rates (Basis Points)
(6)CompetitiveGSE Rates (Basis Points)
(7)MonopolisticGSE Rates at
SameParameters(Basis Points)
(8)CompetitiveGSE Rates at
SameParameters(Basis Points)
(9)MonopolisticGSE Rates for
DifferentParameters
withinParameter
Range(Basis Points)
(10)Competitive
GSE Rates forDifferent
Parameterswithin
ParameterRange
(Basis Points)
1. Liquidityvalue ofsecuritization
� 0 to 100basispoints
50 basispoints
5(4)
22(18)
15 60 15 60
2. Bank’scost of deposits
rf 4 percentto 8
percent
6 percent 4(0)
17(1)
4 19 389 403
3 Bankmortgagesmarginalcapitalrequirement
km 1.6percent to8 percent
4 percent 6(3)
23(11)
11 45 59 65
4. Annual mortgagedefault rate
q 0 to 25basispoints
10 basispoints
4(0)
17(0)
4 18 11 24

5. Marginalvaluationcost
t 0 to 30basispoints
15 basispoints
4(1)
17(1)
4 18 32 45
6. Expectedrisk-adjustedreturn tocapital
re 10 to 20percent
15 percent 4(0)
17(2)
5 21 43 54
7. Bankregulatorymarginalcapitalrequirementfor MBSportfolio
kmbs 1.6percent to4 percent
2.5 percent 4(1)
16(4)
5 23 5 23
8.Remainingprincipalaftermortgagedefault
rd 60 to 100percent
80 percent 4(0)
17(0)
4 18 8 21
9.Regulatorycapitalrequirementonsecuritizer
ks 15 to 65basispoints
45 basispoints
4(0)
18(1)
5 19 5 19
10. Fixedcost of mortgageorigination
cm 0 to 2percent
1 percent 4(0)
17(0)
4 17 204 218

REFERENCES
Ambrose, Brent W., Buttimer, Richard and Thibodeau, Thomas (2000), “A New Spin on theJumbo/Conforming Loan Rate Differential” in mimeo, April 20, 2000.
Bruskin, Eric, Sanders, Anthony B., and Sykes, David (1999), “The Nonagency MortgageMarket: Background and Overview” in mimeo, March.
Canner, Glenn B., Passmore, Wayne, and Surette, Brian J. (1996), “Distribution of Credit Riskamong Providers of Mortgages to Lower-Income and Minority Homebuyers,” Federal ReserveBulletin, (82), pp.1077-11-2.
Congressional Budget Office, (1996), Assessing the Public Costs and Benefits of Fannie Maeand Freddie Mac, Washington D.C.: Government Printing Office
Congressional Budget Office, (2001), Federal Subsidies and Housing GSEs, Washington D.C.:Government Printing Office
Cotterman, Robert F. and Pearce, James E. (1996), “The Effects of the Federal NationalMortgage Association and the Federal Home Loan Mortgage Corporation on ConventionalFixed-Rate Mortgage Yields” in U.S. Department of Housing and Urban Development (Ed.),Studies on Privatizing Fannie Mae and Freddie Mac, U.S. Department of Housing and UrbanDevelopment, Washington D.C.: U.S. Department of Housing and Urban Development, 97-168.
Feldman, Ron (1999), “Estimating and Managing the Federal Subsidy of Fannie Mae and FreddieMac: Is Either Task Possible?,” Journal of Public Budgeting, Accounting and FinancialManagement, 11, Spring, pp. 81-116.
Glaeser, Edward L. and Kallal, Hedi D. (1997), “Thin Markets, Asymmetric Information, andMortgage-Backed Securities,” Journal of Financial Intermediation, 6-1,64-86.
Goodman, John L. Jr. and Passmore, S. Wayne (1992), “Market Power and the Pricing ofMortgage Securitization,” Federal Reserve Board Finance and Economics Discussion Series,187, 1-31.
Grossman, Sanford J. and Miller, Merton H. (1988), “Liquidity and Market Structure,” TheJournal of Finance, 43-3,617-633.
Hendershott, Patric H. and Shilling, James D. (1989), “The Impact of Agencies on ConventionalFixed-Rate Mortgage Yields.” The Journal of Real Estate Finance and Economics, 2, 101-115.
Hermalin, Benjamin E. and Jaffee, Dwight M. (1996), “The Privatization of Fannie Mae andFreddie Mac: Implications for Mortgage Industry Structure,” in U.S. Department of Housing andUrban Development (Ed.), Studies on Privatizing Fannie Mae and Freddie Mac, U.S.

Department of Housing and Urban Development, Washington D.C.: U.S. Department ofHousing and Urban Development, 225-302.
Heuson, Andrea, Passmore, S. Wayne and Sparks, Roger (2000), “Credit Scoring and MortgageSecuritization: Do They Lower Mortgage Rates?,” Finance and Economics Discussion Series(FEDS), 2000-44.
ICF Inc. (1990), Effects of the Conforming Loan Limit on Mortgage Markets, Final ReportPrepared for the U.S. Department and Urban Development, Office of Policy Development andResearch, Fairfax, VA: ICF Incorporated.
Inside Mortgage Finance Publications, Inc. (2000), The Mortgage Market Statistical Annual for2000, Volume II: The Secondary Mortgage Market, P.O. Box 42387, Washington D.C. 20015
Mansukhani, Satish M., and Kramer, Bruce (2000), “Analyzing Loan-level Default Performancein the Jumbo MBS Sector,” Bear Stearns’ Residential Credit Research, Spring.
Pagano, Marco and Roell, Ailsa (1996), “Transparency and Liquidity: A Comparison of Auctionand Dealer Markets with Informed Trading, The Journal of Finance, 51-2, 579-611.
Passmore, Wayne and Sparks, Roger (1996), “Putting the Squeeze on a Market for Lemons: Government-Sponsored Mortgage Securitization,” Journal of Real Estate Finance andEconomics, 96-13, 27-43.
Passmore, Wayne and Sparks, Roger (2000), “Automated Underwriting and the Profitability ofMortgage Securitization,” Real Estate Economics, (28) Summer, Number 2.
U.S. Department of Treasury (1996), Government Sponsorship of the Federal NationalMortgage Association and the Federal Home Loan Mortgage Corporation, Washington D.C.:Government Printing Office.
U.S. General Accounting Office (1996), Housing Enterprises: Potential Impacts of SeveringGovernment Sponsorship, Washington D.C.: Government Printing Office.