Embed Size (px)
Citation preview
GSA DATA REPOSITORY 2018209 Supplementary text, figures and tables to “Rapid formation of porphyry copper deposits evidenced by diffusion of oxygen and titanium in quartz” F. Cernuschi, J. H. Dilles, S. B. Grocke, J. W. Valley, K. Kitajima, and F. J. Tepley III
INDEX
Porphyry Cu±Mo±Au Deposits .......................................................................................... 2
The Haquira East Porphyry Copper Deposit ...................................................................... 3
Extended Methods .............................................................................................................. 5
Figures................................................................................................................................. 9
Figure DR1. Geologic map of Haquira East ........................................................ 9
Figure DR2. Cross-section 1200NE ................................................................... 10
Figure DR3. δ18O on SEM-CL images ............................................................... 11
Figure DR4. Additional SEM-CL images .......................................................... 12
Figure DR5. Ti in quartz diffusion models for sample FC-HAQ-002 ............... 13
Figure DR6. Ti in quartz diffusion models for sample FC-HAQ-027 (a) .......... 14
Figure DR7. Ti in quartz diffusion models for sample FC-HAQ-027 (b) .......... 15
Figure DR8. Figure 3 in main text reproduced at higher SEM-CL contrast ...... 16
Figure DR9. Distance to fracture in sample FC-HAQ-027. ............................... 17
Figure DR10. Spherical diffusion models for sample FC-HAQ-027 ................. 18
Figure DR11. Oxygen diffusion model for sample FC-HAQ-048 ..................... 19
Tables ................................................................................................................................ 20
Table DR1. Sample Location ............................................................................. 20
Table DR2. Titanium-Aluminum in quartz data (EMP).. .................................. 21
Table DR3. Trace element in quartz data (LA-ICP-MS).. ................................. 23
Table DR4. δ18O (V-SMOW) of quartz data (SIMS) ....................................... 24
Table DR5. Porphyry and vein formation temperature ...................................... 26
Table DR6. Diffusion timescales ....................................................................... 26
Table DR7. Linear cooling summary ................................................................. 27
Table DR8. Formation temperature summary .................................................... 28
Table DR9. Raw δ18O in quartz SIMS data ....................................................... 29
References ......................................................................................................................... 35

Porphyry Cu±Mo±Au Deposits
Porphyry copper deposits include porphyry Cu±Mo±Au deposits in which copper is the chief economic metal. These deposits are large, ranging from <0.1 Mt (megatonnes) to >90 Mt contained copper, with ore grades ranging from <0.2 to >1.2 wt.% Cu with variable amounts of Mo and Au. The largest single deposit, albeit formed in multiple temporally spaced hydrothermal events introduced over several million years, is the El Teniente deposit, Chile (~96 Mt contained Cu), and perhaps the largest single hydrothermal event (<100,000 years; von Quadt et al., 2011) is the Bingham, Utah, Cu-Au orebody (~28 Mt contained Cu). Porphyry copper deposits can be subdivided according to the tonnage of contained copper: <0.1 Mt Cu (small); 0.1 to 0.3162 Mt Cu (moderate); 0.3162 to 1.0 Mt Cu (large); 1.0 to 3.162 Mt Cu (very large); 3.162 to 10 Mt Cu (giant); 10 to 31.62 Mt Cu (supergiant); >31.62 Mt Cu (behemoths; Clark, 1993 and Cooke and Hollings, 2005).
In well-exposed porphyry deposits, a deep source intrusion, commonly estimated at >50 km3 but as much as 500 km3 (Ruby Star Granodiorite: Stavast et al., 2008; El Abra Fiesta Granodiorite; Brimhall et al., 2006; Dilles et al., 2011) that is an equigranular granitoid is commonly exposed (see Burnham, 1979). These intrusions range from quartz diorite to granite to monzonite, and span the range from Na-rich to K-rich calc-alkaline to alkaline. Most intrusions are metaluminous, but some are weakly peraluminous or near the boundary of metaluminous to peralkaline (Seedorff et al., 2005). The deep granitoid is the source of porphyry dikes of identical composition but with a porphyritic texture characterized by ~50 vol.% fine-grained groundmass that is commonly <0.1 mm in grain size, granitic in composition, and aplitic in texture. Such aplite represents a pressure-quench via water-vapor loss on ascent of magma at relatively low temperature (~700°C) (Burnham, 1979; Dilles, 1987). At Yerington and several porphyry deposits in the southwest of the USA, such porphyry dikes can be observed to grade downward into the deep granite, and moreover that younger dikes are more deeply sourced and cross-cut older dikes with slightly coarser groundmass (Dilles, 1987).
The formation of large and giant porphyry copper deposits requires the release of a large mass of magmatic-hydrothermal fluid from the source intrusion. This can be estimated by calculating the mass required to form the amount of quartz added in veins by hydrothermal fluids. To form the quartz veins observed in the Ann-Mason deposit in the Yerington district, 11 Mt of silica had to be transported by the hydrothermal fluid. This requires the release of 2.6 Gt of magmatic water from the Luhr Hill granite (Anne Schopa and John Dilles personal communication and Schopa et al., 2017). According to Dilles (1987), the Luhr Hill granite volume can be estimated in 80 km3 of magma or 200 Gt. The water content of the granite is ~ 4 wt. %, therefore, the granite hosted ~ 8 Gt of magmatic fluid. The amount of Cu lost from the 200 Gt Luhr Hill granite was estimated in 50 ppm, therefore, the 8 Gt of released fluid could have form up to 10 Mt of Cu. This estimate suggests that the released fluids from the granite may have formed the ~ 8 Mt PCD ore hosted in the district. In summary, at least 2Gt of fluid are required to form ~4Mt of Cu-ore.
As reviewed by Seedorff et al. (2005), porphyry deposits may form at a variety of depths in the upper crust ranging from as shallow as ~1 km for copper mineralization

(e.g., Batu Hijau, Yerington Mine) to ~10 km (e.g., Butte, Montana; 6-8 km). Shallow deposits are characterized by “A” type granular quartz-sulfide veins, whereas deep deposits lack these veins but instead contain early dark micaceous (EDM) veins as at Butte (Proffett, 2009). Shallower deposits likely form at slightly lower temperature and presumably may cool more quickly after fluid flow ceases. The range of observed hydrothermal temperatures in such deposits ranges from ~700°C at Butte (Brimhall, 1977; Field et al., 2005; Rusk et al., 2006; Mercer et al., 2013) to about 300°C for late base metal veins associated with strong sericitic alteration (e.g. Rusk et al., 2008; Landtwing et al., 2005). Oxygen and hydrogen isotopic data suggest that all hydrothermal fluids that produce K-silicate and sericitic alteration are magmatic in origin at temperatures of 700 to 350°C (Harris and Golding, 2002; Zhang, 1995), consistent with thermal models of fluid flow (Weis et al., 2012).
The Haquira East Porphyry Copper Deposit
The Haquira district contains two known porphyry copper centers. Haquira East is the focus of this study (-14.164877º, -72.345922º), and is the subject of the PhD thesis of Cernuschi (2015). Haquira East is a relatively large porphyry copper deposit with minor Mo and Au that contains measured, indicated, and inferred resources of 689 Mt ore containing 4.2 Mt Cu (~9 B lb), about 37,000 t Mo, and 28 t (0.9 M oz) Au (Antares, 2010). Haquira East is a relatively typical, but also a relatively deeply formed, porphyry copper deposit. A variety of evidence suggests Haquira formed at relatively great depth for a porphyry deposit. “A” type quartz veins are rare, and EDM veins are the largest contributors to Cu grades (Proffett, 2009; Cernuschi et al., 2012). Late, low-temperature ~350 °C D pyrite-quartz veins with sericitic selvages and late <300 ºC pyrite veins with intermediate argillic alteration are rare (affecting <5% of the granodiorite porphyry stock). All observed fluid inclusions contain liquid and a moderate-sized vapor bubble, and were therefore trapped in quartz veins that formed at pressures greater than those that lead to fluid immiscibility (i.e. in the single-phase field); there are no observations of brine or vapor-rich inclusions indication fluid immiscibility. These inclusions were therefore trapped at >1.4 kb pressure. Fluid inclusion heating / freezing experiments provide homogenization temperatures and bulk salinities, which may be used together with appropriate P-T isochores, and comparison with Ti-in-quartz and phase petrology temperature estimates to estimate trapping pressures of between 1.6 kb and 3 kb at near-lithostatic pressures (Cernuschi, 2015). The fluid inclusion population more closely resembles the population at Butte, Montana where liquid plus vapor fluid inclusions dominate. However, at Butte fluid inclusions with trapped brines and vapors are rarely observed, and indicate that some fluid un-mixing occurred. Therefore, it is likely that Haquira East was emplaced at a greater depth than Butte where Rusk et al. (2008) estimated pressures of 2.0 to 2.5 kb for high temperature veins and a depth of emplacement of ~8 km.
Hydrostatic conditions must have prevailed at low temperatures below ca. 300-400°C in a zone that initially was above the Haquira East porphyry deposit but extended into the ore zones during formation of the late stage sericitic alteration and even later intermediate argillic alteration.

Moreover, geologic considerations also indicate great depth. Hornblende barometry of the nearby exposed and shallower Acojasa granodiorite pluton yields a pressure estimate of ~ 2 (±0.5) kb (Cernuschi, 2015, and references therein). The Acojasa and other associated intrusions are inferred to be concealed at depth below the meta-sedimentary succession that is preserved at Haquira East and are likely the source of the granodioritic stock, dikes and magmatic-hydrothermal fluids. One-kilometer deep drill-holes did not reach the top of the inferred source intrusion below it. Therefore, the lithostatic pressure during the emplacement of Haquira East could have been > 2 kb. Furthermore, hornblende barometry of other intrusions in the Andahuyalas batholith at the Coroccohuayco Cu-skarn/porphyry deposit (Tintaya cluster) also yield high pressure, ranging from 1.4 to 2.4 Kbar (Chelle–Michou, 2013).
Nonetheless for purposes of this manuscript, we use conservative estimates of ~1.4 kb lithostatic pressure for high temperature hydrothermal conditions that transition to close to hydrostatic pressures at ~1.1 kb. Quartz phenocrysts (except the bright-CL rims) formed in an underlying magma chamber, so they likely formed at 2-3 kb pressure.
The Haquira East deposit is hosted in a granodiorite porphyry plug that intrudes a folded and ductile deformed quartzite sequence. Hydrothermal banded molybdenite-quartz (BMQ) veins cutting the quartzite are locally folded, and hydrothermal biotite in the porphyry plug is aligned into a foliation by deformation. This deformation does not affect the last porphyry dikes, which has an isotopic age that is indistinguishable from the earlier porphyries. Therefore, deformation was ongoing during porphyry emplacement, and suggests significant depth and >350°C for the rocks surrounding the deposit. As muscovite has a closure temperature to Ar diffusion of ~325-350°C (depending on grain size), the 40Ar/39Ar age of muscovite likely reflects slow cooling after the end of hydrothermal alteration. Hence, the hydrothermal lifespan is likely shorter than the 200,000 to 600,000 year interval defined by the Re-Os age of molybdenite and the 40Ar/39Ar age of muscovite. Average of 3 molybdenite ages is 33.75 ± 0.15 Ma and one 40Ar/39Ar age of muscovite yields 33.18 ± 0.21 Ma (Cernuschi et al., 2013).

Extended Methods Secondary Electron Microscope Cathodoluminescence (SEM-CL)
SEM-CL images of 30 and 200 μm thick polished sections were obtained at the Oregon State University Microscopy facility using a FEI Quanta 600FEG with a Gatan mini-CL detector with a wavelength range between 185 and 850 nm. Images were obtained while operating the instrument between 10 and 15 KeV, a spot size of 6 μm, scanning time between 50 and 200 μs and resolution of 1024x884 pixels. Thin sections were carbon coated or gold coated (< 100 nm thick) prior to the analyses. Gray scale profiles were obtained using NIH ImageJ software. For each profile the gray line shows the raw gray scale data and the black line represents a smoothed profile calculated by ImageJ. The smoothed profile is calculated by averaging contiguous pixel scale CL-intensity variations and is considered a better representation of the gray scale variations at the micron scale.
Electron Microprobe (EMP) Titanium and aluminum in quartz on the thin section samples previously imaged by SEM-CL were obtained at Oregon State University using a CAMECA SX-100 Electron microprobe (EMP), by simultaneously collecting Ti x-rays on one LPET and two PET diffracting crystals, and collecting Al x-rays on one TAP and one LTAP diffracting crystals, a 15 keV accelerating voltage, a 200 nA beam current, a 1 um spot diameter and 600 second counting times on peak and 300 seconds on each background peak. Ti and Al detection limits of 13 ppm are calculated using three standard deviations of the counting rate for the background (3 sigma). With multiple diffraction crystals, this is the equivalent of 1800 seconds on peak and 900 seconds on each background peak for Ti, and 1200 seconds on peak and 600 seconds on each background peak for Al. We used rutile and as the primary standards for Ti and Al, and analyzed a Shandong quartz as a secondary standard (Shandong, Audétat et al., 2014) routinely for Ti and Al concentrations between analyzes of unknown samples (Table A1). We obtained 58 ± 6 ppm Ti and 133 ± 7 ppm Al for 18 analyses of Shandong, which is comparable to the 57 ± 4 Ti ppm and 154 ± 15 ppm Al reported by Audetat et al. (2015). Laser Ablation Inductively Coupled Plasma Mass Spectroscopy (LA-ICP-MS)
The LA-ICP-MS analyses at Oregon State University were obtained by using a Photon Machines Analyte G2 laser operating at 7 Hz with a 85 µm fixed spot and drilled to ~ 20 µm depth (Loewen and Kent, 2012; Dumitru et al., 2013). The total number of laser shot was 225 per analysis, with a pre-ablation shot count of 2. A He-Ar gas carried the ablated material to the plasma chamber and then into a Thermo XseriesII Quadrupole mass spectrometer, where the following elements were analyzed: 7Li, 11B, 23Na, 27Al, 28Si, 31P, 39K, 47Ti, 48Ti, 49Ti, 55Mn, 56Fe, 65Cu, 72Ge, 85Rb, 88Sr, 205Tl, 208Pb. Trace element concentrations were standardized to NIST-612 (Jochum et al., 2011), and 28Si in stoichiometry quartz as an internal standard, using an Excel application (LaserTram, Kent et al., 2004). Spot analyses that included melt or fluid inclusions or accidental analyses of other minerals (i.e. sericite in D veins) were discarded by monitoring P, Al, Si, K, Sr, Rb. NIST-616 (Jochum et al., 2011) was analyzed in between unknowns as a secondary

standard. Based on the reproducibility, 49Ti was preferred over 47Ti and 48Ti and yields a detection limit of 0.2 ppm Ti (3 sigma on background, Table 2). Secondary Ion Mass Spectrometer (SIMS) In situ SIMS δ18O measurements were made on the CAMECA IMS 1280 ion microprobe at the University of Wisconsin-Madison WiscSIMS lab. Values standardized with bracketing analyses of UWQ-1 quartz standard (Valley and Kita, 2009) are reported in per mil (‰) relative to V-SMOW with spot-to-spot precision of <0.3‰ (see Supp. 4: Table DR4). Oxygen isotope measurements were collected along several traverses with a 1.7-1.9 nA Cs+ primary beam. Analyses spots were ~10 μm diameter and 1 μm deep. Operating and analytical conditions are described in detail by Kita et al. (2009); Valley and Kita (2009); and Ferry et al. (2010). Secondary 16O, 16O1H– and 18O– ions were measured simultaneously using three Faraday cup detectors (C, FC2 and H1, respectively). 16O1H– ions were measured for monitoring OH in quartz and contaminant such as mineral inclusions. The duration of the analyses was 3-4 minutes and the working standard was UWQ1 quartz (12.33‰ ± 0.3‰ (2 SD); ± 0.1‰ (2SE): Kelly et al. (2007), Ferry et al. (2014) appendix A). The working standard was measured 4-5 times before and after every 10 to 15 unknown analyses on every sample. The 2 standard deviation error for each bracketing set of the UWQ1 analyses was 0.27‰, and is considered the internal error. The raw 18O/16O ratios and δ18O data were corrected to VSMOW using 83 measurements of UWQ1 during the run with a mean of 5.75‰, and errors of 2SD = 0.44‰, and 2SE = 0.05‰. These standard procedures are described by Ushikubo et al. (2012); Nakashima et al. (2013) and Tenner et al. (2013) and Ferry et al. (2014). (Table DR3). TitaniQ geothermometry Formation temperatures were estimated by TitaniQ geothermometry of Huang and Audétat (2012).
Ti activity was estimated as 1 for the hydrothermal quartz based on the presence of rutile in quartz veins, and as 0.65 for magmatic quartz based on estimates for analogous arc rocks (Walker et al., 2013).

Diffusion Calculations Isothermal diffusion expression:
a. One dimensional
See Crank (1975) and Valley (2001) for additional information
b. Spherical
See Crank (1975) for additional information
Linear cooling
See Watson and Cherniak (2015) for additional information
Diffusion Constants (Arrhenius equations):
Experimental wet diffusivities are available at temperatures that overlap only with the upper range of porphyry hydrothermal quartz precipitation: 648 - 1200 °C for Ti (Cherniak et al., 2007) and 515 - 850 °C for oxygen under hydrothermal conditions (Dennis, 1984). The Arrhenius equation and experimentally determined activation energies for diffusion parallel to the c-axis of quartz were used to model diffusion perpendicular to growth zones of quartz, which are mainly on { } pyramidal faces.
a. Titanium (perpendicular to c-axis)
b. Oxygen (perpendicular to c-axis)
Chi-Square goodness-of-fit test

Chi-Square ( 2) is a standard statistical test (Borradaile, 2003) that can be used to evaluate how well a model reflects the data. We used this test to evaluate how the measured Ti and/or O contents compare with those which would be expected under the fitted diffusion model. In this way, the Chi-Square test provides an objective tool to select the model that best fits the data, instead of selecting the preferred model by a traditional and more subjective visual fit of the model to the data. The preferred model was selected in order to minimize the Chi-Square using the formula:
Whereas a small Chi-Square statistical test value means that the observed data fits the expected data well, a large Chi-Square statistical test means that the observed data fits the expected data in a poor manner. The absolute number of the Chi-Square test statistic has no intrinsic meaning; therefore, the goodness of fitness cannot be compared between models on different samples.
The Chi-Square test was also used to evaluate the error of each diffusion model. Minimum and maximum timescales (also expressed as ± errors of the preferred timescale), were estimated using the range of “acceptable” good fitness. The “acceptable” good fitness range is the range of timescales with similar calculated sum of Chi-Square. Outside this range, the sum of Chi-Square increases rapidly. The acceptable range can be visualized as inflexion points in the curve that results from plotting the sum of Chi-Square versus estimated timescales.
time (years)
0 0 100,000 300,000 500,000
100,000 0.09200,000 0.11300,000 0.14500,000 0.20600,000 0.23700,000 0.25800,000 0.27
1,000,000 0.31
time (years)2
90,000 0.0980,000 0.0875,000 0.08
100 0.221,000 0.13
60,000 0.08
Sum
of 2
0.07
0.11
0.15
0.19
0.23
“Acc
epta
ble
” ran
ge “Acceptable”
rangePreferredtimescale
Preferred:75,000 (+25,000 / -15,000) years

Figures
Figure DR1. Geologic map of Haquira East modified from Gans (2009) showing the location of cross-sections 1900NW, 2100NW and 1200NE (reproduced from Cernuschi, 2015). The footprint of the non-outcropping Haquira granodiorite stock is projected from a 3500 m altitude.

Figure DR2. Cross-section 1200NE (Cernuschi, 2015) showing location of analyzed samples in relation to the copper mineralization (>0.5 wt.% Cu) and K-silicate alteration illustrated by the extent of hydrothermal biotite after hornblende. The location of the cross-section is shown in Figure DR1.

Figure DR3. δ18O (‰) plotted on SEM-CL images of quartz from veins. A) B vein with chalcopyrite and late dark-CL quartz in fractures (FC-HAQ-048). B) Mosaic textured EDM related quartz overgrown by euhedral B vein quartz in contact with chalcopyrite (FC-HAQ-027). C) Euhedral quartz in D vein with medium gray-CL quartz and dark-CL quartz growth zones in contact with muscovite and pyrite (FC-HAQ-009). D) Euhedral quartz in B vein rimmed by dark-CL quartz in contact with chalcopyrite (FC-HAQ-048).

Figure DR4. Additional SEM-CL images of medium gray-CL and dark-CL quartz with muscovite and pyrite in D veins and spot location of Ti-in-Quartz data. A) FC-HAQ-098 with LA-ICP-MS spots in red showing Ti concentration. B) FC-HAQ-009, area shown in C is marked with a red square. C-D) EMP spots shown in red and indicating Ti concentration (BDL: below detection limit <13 ppm). C) FC-HAQ-098. D) FC-HAQ-009.

Figure DR5. A) Ti (ppm) in quartz spot analyses by EMP (Gray circles) and SEM-CL grayscale images for FC-HAQ-002. Insert shows the position of transects 1a and 1b. B) SEM-CL grayscale raw values (gray line) and smoothed grayscale (black lines) along transect 1a and 1b that are perpendicular to growth zones. Note the location of profile 1. C) Ti in quartz diffusion models for sample FC-HAQ-002 Profile 1. B) Modeled diffusion timescales versus temperature of diffusion used in the model at a fixed Sum of 2. The grey box shows the range of calculated diffusion timescales. The maximum timescale is the preferred. C) Sum of 2 versus time. The red circles show the preferred timescale based on the best fit of the model to the data as represented by the Sum of 2. The orange circles show the range of timescales that produce a reasonable fit of the model to the data as represented by a Sum of 2 smaller than 1.4.
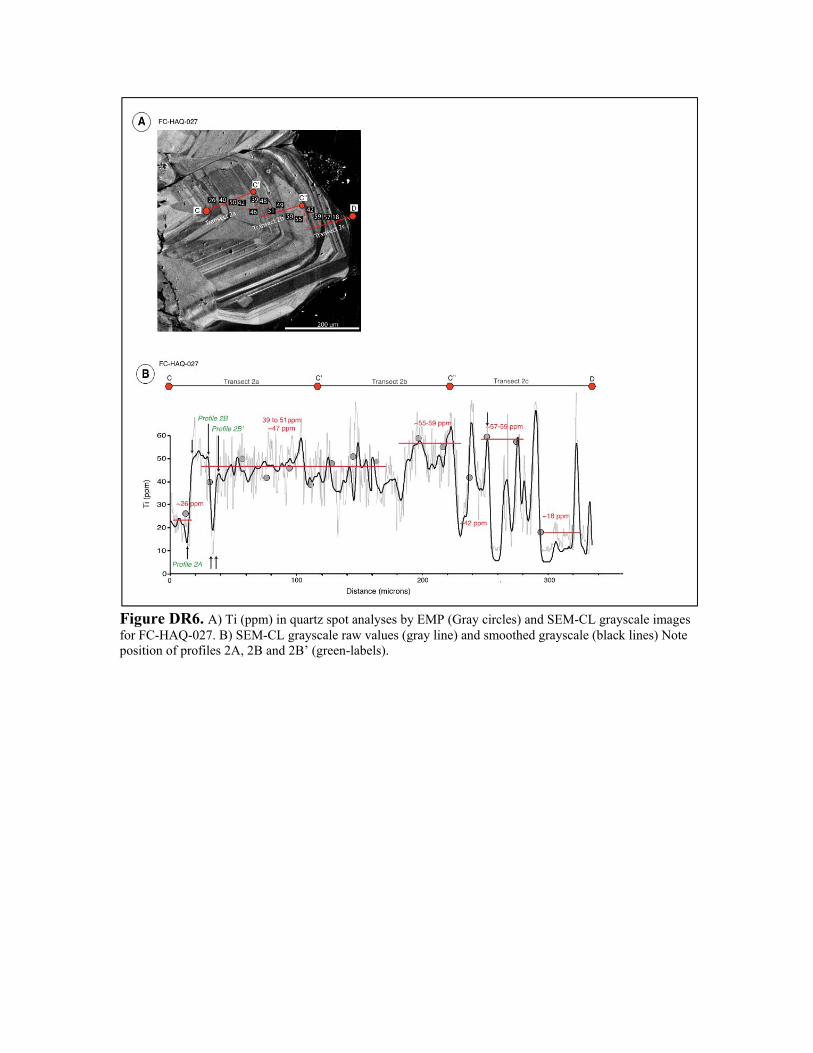
Figure DR6. A) Ti (ppm) in quartz spot analyses by EMP (Gray circles) and SEM-CL grayscale images for FC-HAQ-027. B) SEM-CL grayscale raw values (gray line) and smoothed grayscale (black lines) Note position of profiles 2A, 2B and 2B’ (green-labels).

Figure DR7. Ti in quartz diffusion models for sample FC-HAQ-027 (Figure DR6): A) Profile 2A, B) Profile 2B, and C) Profile 2B´. D) Modeled diffusion timescales versus temperature of diffusion used in the model at a fixed Sum of 2 for model of transect 2B’. The grey box shows the range of calculated diffusion timescales. The maximum timescale is the preferred. E) Sum of 2 versus time, for model of transect 2B’. The red circles show the preferred timescale based on the best fit of the model to the data as represented by the Sum of 2. The orange circles show the range of timescales that produce a reasonable fit of the model to the data as represented by a Sum of 2 smaller than 5.2.

Figure DR8. Figure 3 in main text reproduced with SEM-CL image at higher contrast to highlight the fractures filled with late dark-CL quartz.
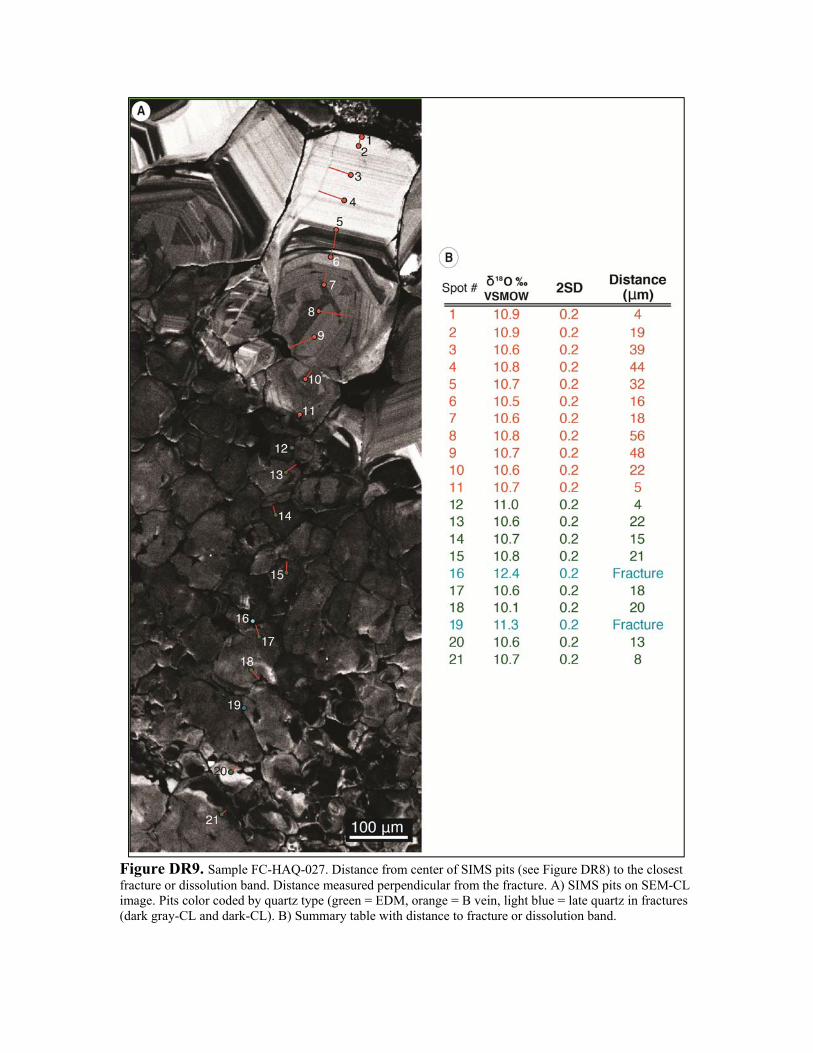
Figure DR9. Sample FC-HAQ-027. Distance from center of SIMS pits (see Figure DR8) to the closest fracture or dissolution band. Distance measured perpendicular from the fracture. A) SIMS pits on SEM-CL image. Pits color coded by quartz type (green = EDM, orange = B vein, light blue = late quartz in fractures (dark gray-CL and dark-CL). B) Summary table with distance to fracture or dissolution band.

Figure DR10. A) Spherical diffusion models for partial re-equilibration of B vein and EDM quartz at 450 ºC (sample FC-HAQ-027, Figure DR8). Most of the measured distances from a SIMS-spot to the closest fractures or dissolution band are <20 μm (black dots). Partial re-equilibration can be achieved in ~1,000 years if fluid migrated through fractures spaced every 20 μm (green line). Some SIMS-spots are further away from fractures or dissolution bands. For these spots, the distances range from 20 μm to 60 μm (gray dots). These distances may be overestimates, if we assume that closely spaced fractures are present in other directions than in the observed surface. A partial re-equilibration of the quartz to the maximum measured distance to fracture (~60 μm) requires ~10,000 years (orange line). B) Modeled diffusion timescales versus temperature of diffusion used in the model at a fixed Sum of 2 the 10,000 year model. The grey box shows the range of calculated diffusion timescales. The maximum timescale is the preferred. C) Sum of 2 versus time. The red circles show the preferred timescale based on the best fit of the model to the data as represented by the Sum of 2. The orange circles show the range of timescales that produce a reasonable fit of the model to the data as represented by a Sum of 2 smaller than 0.0090.

Figure DR11. A, B) Diffusion model shown in Figure 4 in the manuscript with distances used for linear cooling modelling. C) Modeled diffusion timescales versus temperature of diffusion used in the model at a fixed Sum of 2. The grey box shows the range of calculated diffusion timescales. The maximum timescale is the preferred. D) Sum of 2versus time. The red circles show the preferred timescale based on the best fit of the model to the data as represented by the Sum of 2. The orange circles show the range of timescales that produce a reasonable fit of the model to the data as represented by a Sum of 2 smaller than 0.09.

Tables
Table DR1. SAMPLE LOCATION
Sample Drillhole Depth (m) Latitude Longitude Figure Description
FC-HAQ-002 AHAD-098A 125.8 2 Quartz phenocryst FC-HAQ-009 AHAD-098A 545 5 D veinFC-HAQ-027 AHAD-185 235.3 3 EDM selvage with B vein and late quartz fracturesFC-HAQ-048 AHAD-185 640.5 4 B vein with late quartz rimFC-HAQ-098 AHAD-209 494.5 -14.16678 -72.34653 DR4 D vein
-14.16567 -72.34654
-72.34653-14.16678

Table DR2. TITANIUM-ALUMINUM IN QUARTZ (EMP).
Sample/Spot Al (ppm) Ti (ppm) Description
Figure 2 (FC‐HAQ‐002)FC-HAQ-002-1 42 73 Gray-CL phenocryst core
FC-HAQ-002-2 47 68 Gray-CL phenocryst core
FC-HAQ-002-3 79 84 Bright-CL inner narrow zone
FC-HAQ-002-4 47 37 Gray-CL phenocryst core
FC-HAQ-002-5 43 54 Gray-CL phenocryst core
FC-HAQ-002-6 27 32 Gray-CL phenocryst core
FC-HAQ-002-7 30 24 Gray-CL phenocryst core
FC-HAQ-002-8 19 72 Bright-CL phenocryst rim
FC-HAQ-002-8 26 76 Bright-CL phenocryst rim
FC-HAQ-027 157 84 Bright-CL banded B vein quartz
FC-HAQ-027 121 68 Bright-CL banded B vein quartz
FC-HAQ-027 84 69 Bright-CL banded B vein quartz
FC-HAQ-027 64 77 Bright-CL banded B vein quartz
FC-HAQ-027 38 47 Gray-CL banded B vein quartz
FC-HAQ-027 126 75 Bright-CL banded B vein quartz
FC-HAQ-027 100 47 Gray-CL banded B vein quartz
FC-HAQ-027 100 51 Gray-CL banded B vein quartz
FC-HAQ-027 107 53 Gray-CL banded B vein quartz
FC-HAQ-027 78 43 Gray-CL banded B vein quartz
FC-HAQ-027 28 36 Gray-CL banded B vein quartz
FC-HAQ-027 44 45 Gray-CL mosaic EDM vein quartz
FC-HAQ-027 34 31 Gray-CL mosaic EDM vein quartz
FC-HAQ-027 49 31 Gray-CL mosaic EDM vein quartz
FC-HAQ-027 54 47 Gray-CL mosaic EDM vein quartz
FC-HAQ-027 41 27 Gray-CL mosaic EDM vein quartz
FC-HAQ-027 48 33 Gray-CL mosaic EDM vein quartz
FC-HAQ-027 35 49 Gray-CL mosaic EDM vein quartz
FC-HAQ-027 60 34 Gray-CL mosaic EDM vein quartz
Figure 3 (FC‐HAQ‐027) Correlative to δ18O Transect 027
Sample/Spot Al (ppm) Ti (ppm) Description
FC-HAQ-048 BDL BDL Dark-CL quartz rim
FC-HAQ-048 BDL BDL Dark-CL quartz rim
FC-HAQ-048 97 39 Gray-CL banded B vein quartz
FC-HAQ-048 23 49 Gray-CL banded B vein quartz
FC-HAQ-048 45 59 Gray-CL banded B vein quartz
FC-HAQ-048 55 79 Bright-CL banded B vein quartz
FC-HAQ-048 59 65 Bright-CL banded B vein quartz
FC-HAQ-048 115 98 Bright-CL banded B vein quartz
FC-HAQ-048 80 92 Bright-CL banded B vein quartz
FC-HAQ-048 123 105 Bright-CL banded B vein quartz
FC-HAQ-048 278 114 Bright-CL banded B vein quartz
FC-HAQ-048 250 109 Bright-CL banded B vein quartz
Data Repository Figure DR4a‐c (FC‐HAQ‐098)FC-HAQ-098-1 1602 13 Medium gray-CL quartz D vein
FC-HAQ-098-2 793 19 Medium gray-CL quartz D vein
FC-HAQ-098-3 1085 BDL Medium gray-CL quartz D vein
FC-HAQ-098-4 2043 24 Medium gray-CL quartz D vein
FC-HAQ-098-5 644 24 Medium gray-CL quartz D vein
FC-HAQ-098-6 197 BDL Dark CL-quartz D vein
FC-HAQ-098-7 19 BDL Dark CL-quartz D vein
FC-HAQ-098-8 1303 BDL Dark CL-quartz D vein
FC-HAQ-098-9 215 BDL Dark CL-quartz D vein
Data Repository Figure DR4b‐d (FC‐HAQ‐009)FC-HAQ-009-2 125 23 Medium gray-CL quartz D vein
FC-HAQ-009-4 161 BDL Dark CL-quartz D vein
FC-HAQ-009-5 77 BDL Dark CL-quartz D vein
FC-HAQ-009-7 45 BDL Dark CL-quartz D vein
FC-HAQ-009-10 193 BDL Dark CL-quartz D vein
FC-HAQ-009-12 91 BDL Dark CL-quartz D vein
Figure 4 (FC‐HAQ‐048) Correlative to δ18O Transect 048

Table DR2. (Cont.)
Sample/Spot Al (ppm) Ti (ppm) Description
Data Repository Figure DR6a‐bFC-HAQ-027-b1 63 26 Gray-CL banded B vein quartz
FC-HAQ-027-b2 125 40 Gray-CL banded B vein quartz
FC-HAQ-027-b3 152 50 Gray-CL banded B vein quartz
FC-HAQ-027-b4 203 42 Gray-CL banded B vein quartz
FC-HAQ-027-b5 189 46 Gray-CL banded B vein quartz
FC-HAQ-027-b6 162 39 Gray-CL banded B vein quartz
FC-HAQ-027-b7 191 48 Gray-CL banded B vein quartz
FC-HAQ-027-b8 218 51 Gray-CL banded B vein quartz
FC-HAQ-027-b9 177 49 Gray-CL banded B vein quartz
FC-HAQ-027-b10 190 59 Gray-CL banded B vein quartz
FC-HAQ-027-b11 179 55 Gray-CL banded B vein quartz
FC-HAQ-027-b12 111 42 Gray-CL banded B vein quartz
FC-HAQ-027-b13 101 59 Gray-CL banded B vein quartz
FC-HAQ-027-b14 612 57 Gray-CL banded B vein quartz
FC-HAQ-027-b15 82 18 Gray-CL banded B vein quartz
Spot Al (ppm) Ti (ppm)
Shandong Standard1 145 57
1 146 60
3 146 62
4 131 57
5 138 59
6 130 53
7 133 56
8 131 55
9 130 58
10 131 57
11 132 56
12 132 65
13 130 57
14 129 54
15 132 59
16 121 59
17 128 55
18 128 64
Average: 133 58
2 Stdev: 7 6
Preferred values
Average: 154 57
2 stdev: 15 4
Audetat et al., 2015

Table DR3. TRACE ELEMENTS IN QUARTZ (LA-ICP-MS).
Sample Al (ppm) Li (ppm) 49Ti (ppm) Ge (ppm) Quartz type
FC-HAQ-009-20 49.09 ‐ 11.89 0.79 Medium gray-CL D vein
FC-HAQ-098-22 539.14 4.84 12.90 0.73 Medium gray-CL D vein
FC-HAQ-009-19 123.00 1.02 19.26 1.34 Medium gray-CL D vein
Average: 237.08 2.93 14.68 0.95
2 stdev: 528.38 5.40 7.99 0.67
FC-HAQ-009-1 684.68 5.75 2.23 1.07 Dark-CL D vein
FC-HAQ-009-2 559.36 3.35 3.26 1.00 Dark-CL D vein
FC-HAQ-009-21 45.07 0.77 5.65 1.32 Dark-CL D vein
FC-HAQ-009-32 240.17 2.62 0.73 1.79 Dark-CL D vein
Average: 382.32 3.12 2.97 1.30
2 stdev: 585.05 4.13 4.13 0.72
Standard Al (ppm) Li (ppm) 49Ti (ppm) Ge (ppm)
NISTSRM616-1 10751.43 0.95 1.83 0.20
NISTSRM616-2 11415.58 0.91 1.70 0.24
NISTSRM616-3 11734.98 0.81 1.93 0.25
NISTSRM616-4 10471.51 0.91 1.59 0.28
NISTSRM616-4b 11819.21 0.90 2.23 -
NISTSRM616-7 11850.67 0.82 2.75 0.24
NISTSRM616-8 10957.49 0.87 2.05 0.17
NISTSRM616-9 11432.72 0.79 1.83 0.23
NISTSRM616-10 11462.42 1.02 2.26 0.20
NISTSRM616-12 11071.23 1.05 2.23 0.21
NISTSRM616-13 11149.52 0.85 2.06 0.40
Average: 11283.34 0.90 2.04 0.24
2 stdev: 893.52 0.17 0.65 0.13
NISTSRM616 preferred values
Average: 0.895 2.65 0.283
2 stdev: 0.059 0.29 0.039
Jochum et al., 2011
Data Repository Figure DR4a (FC‐HAQ‐098)
Data Repository Figure DR4b (FC‐HAQ‐009)

Table DR4. δ18O (V-SMOW) OF QUARTZ (SIMS).
Commentδ18O ‰
VSMOW2SD (ext.)
Number Analys.
(Figure 3) FC-HAQ-027
027 B vein 10.91 0.20027 B vein 10.91 0.20027 B vein 10.63 0.20027 B vein 10.80 0.20027 B vein 10.66 0.20027 B vein 10.49 0.20027 B vein 10.61 0.20027 B vein 10.80 0.20027 B vein 10.65 0.20027 B vein 10.64 0.20027 B vein 10.72 0.20 Mean, B vein quartz 10.71 0.26 11
027 EDM 10.96 0.20027 EDM 10.63 0.20027 EDM 10.73 0.20027 EDM 10.76 0.20027 Dark-CL fracture 12.39 0.20027 EDM 10.62 0.20027 EDM 10.11 0.20027 Medium-CL fracture 11.32 0.20027 EDM 10.64 0.20027 EDM 10.74 0.20027 EDM 10.78 0.20 Mean, EDM quartz - All 10.66 0.46 11
027 B vein 10.59 0.20027 B vein 10.49 0.20027 B vein 10.39 0.20027 B vein 10.44 0.20027 B vein 10.48 0.20027 B vein 10.36 0.20027 B vein 10.84 0.20027 B vein 10.85 0.20 Mean, B vein quartz 10.55 0.39 8 Mean, B vein quartz - All 10.64 0.35 19
All EDM and B vein in FC‐HAQ‐027 10.67 0.36
Commentδ18O ‰
VSMOW2SD (ext.)
Number Analys.
(Figure 4) FC-HAQ-048
048 Late dark CL quartz 12.75 0.22048 Late dark CL quartz 12.57 0.22048 Late dark CL quartz 12.76 0.22048 Late dark CL quartz 13.07 0.22048 Late dark CL quartz 12.52 0.22048 Late dark CL quartz 11.57 0.22 Mean, Late dark CL quartz 12.54 1.03 6
048 B vein 10.54 0.22048 B vein 10.61 0.22048 B vein 10.35 0.22048 B vein 10.24 0.22048 B vein 10.51 0.22048 B vein 10.36 0.22048 B vein 10.10 0.22048 B vein 10.34 0.22048 B vein 10.29 0.22048 B vein 10.42 0.27048 B vein 10.47 0.27048 B vein 10.31 0.27 Mean, B vein quartz 10.38 0.28 12
048 Late dark CL quartz 12.40 0.27048 Late dark CL quartz 12.71 0.27048 Late dark CL quartz 12.96 0.27048 Late dark CL quartz 11.71 0.27 Mean, Late dark CL quartz 12.44 1.08 4
048 B vein 10.76 0.27048 B vein 10.90 0.27048 B vein 10.52 0.27048 B vein 10.60 0.27048 B vein 10.08 0.27048 B vein 10.21 0.27048 B vein 10.20 0.27048 B vein 10.09 0.27 Mean, session 2 B vein quartz 10.42 0.63 8 Mean, B vein quartz - All 10.40 0.44 20 Mean, Late dark CL quartz -All 12.49 0.94 10
Commentδ18O ‰
VSMOW2SD (ext.)
Number Analys.
(Figure 5) FC-HAQ-009
009 D-vein, medium gray-CL 9.71 0.32009 D-vein, dark-CL 13.62 0.32009 D-vein, dark-CL 10.78 0.32009 D-vein, dark-CL 13.60 0.32009 D-vein, medium gray-CL 10.60 0.32009 D-vein, medium gray-CL 11.49 0.32009 D-vein, medium gray-CL 11.13 0.32009 D-vein, medium gray-CL 11.38 0.32009 D-vein, medium gray-CL 10.89 0.32009 D-vein, dark-CL 11.02 0.32 Mean, medium gray-CL session 11.52 1.30 6 Mean, dark-CL session 1 12.26 3.14 4
009 D-vein, dark-CL 13.34 0.22009 D-vein, dark-CL 12.53 0.22009 D-vein, dark-CL 13.01 0.22009 D-vein, dark-CL 12.93 0.22009 D-vein, dark-CL 13.10 0.22009 D-vein, dark-CL 11.39 0.22009 D-vein, dark-CL 13.15 0.25009 D-vein, medium gray-CL 11.18 0.25009 D-vein, medium gray-CL 11.19 0.25009 D-vein, medium gray-CL 11.09 0.25009 D-vein, medium gray-CL 11.13 0.25009 D-vein, medium gray-CL 10.69 0.25009 D-vein, medium gray-CL 12.98 0.25009 D-vein, dark-CL 13.15 0.25009 D-vein, dark-CL 13.02 0.25009 D-vein, dark-CL 13.14 0.25009 D-vein, medium gray-CL 11.91 0.25009 D-vein, dark-CL 12.02 0.25009 D-vein, dark-CL 11.43 0.25009 D-vein, dark-CL 12.41 0.25009 D-vein, medium gray-CL 10.84 0.25 Mean, medium gray-CL session 11.16 1.45 8
Mean, dark-CL session 2 12.57 1.82 13
Mean, medium gray-CL -all 11.16 1.45 14
Mean, dark-CL session -all 12.57 1.82 17
session 1
session 2

Table DR4. (Cont.)
Commentδ18O ‰
VSMOW2SD (ext.)
Number Analys.
(Figure DR4a) FC-HAQ-004
004 Late dark CL quartz 13.14 0.22004 B vein 10.66 0.22004 B vein 10.46 0.22004 B vein 10.43 0.22004 B vein 10.61 0.22004 B vein 10.51 0.22004 B vein 12.88 0.22004 B vein 10.79 0.22004 B vein 10.62 0.22004 Late dark CL quartz 13.08 0.22004 Late dark CL quartz 11.28 0.22004 Late dark CL quartz 11.05 0.22004 B vein 10.74 0.22
Mean, B vein quartz - All 10.86 1.54 9 Mean, Late dark CL quartz -All 12.14 2.25 4
All standardsMean 2 sdev5.757 0.302 53
UWQ-1 garnet
2SD (ext.)Number Analys.
Max. 11.10
Avg. 10.66 0.44 9
Min. 10.23
Max. 11.39
Avg. 10.58 0.81 48
Min. 9.77
Max. 12.61
Avg. 11.16 1.45 14
Min. 9.71
Medium gray-CL quartz in fractures 11.32 0.20 1
Max. 12.61
Avg. 11.17 1.40 15
Min. 9.71
Max. 14.39
Avg. 12.57 1.82 17
Min. 10.75
Max. 13.07
Avg. 12.40 1.45 15
Min. 11.57
Max. 14.39
Avg. 12.49 1.60 32
Min. 10.75
Dark CL quartz in D veins, rims and fractures
Medium gray-CL quartz in D vein and fractures
EDM quartz
B vein quartz
Medium gray-CL quartz in D vein
Dark CL quartz in D vein
Dark CL quartz in rims and fractures
Averages all of assays by quartz type

26
Table DR5. PORPHYRY AND VEIN FORMATION TEMPERATURES BASED ON PHASE EQUILIBRIA, TITANIQ GEOTHERMOMETER AND
FLUID INCLUSION DATA
Table DR6. DIFFUSION TIMESCALES.
T (ºC) αTiO2
Igneous (gray-CL) 650-700 24-54 650-737 3.0 L. 0.65 650
B (gray-CL) 550-600 18-59 543-640 1.4 L. 1.0 550
EDM (gray-CL) 500-550 27-49 566-621 1.4 L. 1.0 500
D (medium gray-CL) 450-500 13–25 494-546 1.1 L.-H. 1.0 450
D (dark-CL) 350-450 1–6 343-441 1.1 L.-H. 1.0 350
Notes: T (ºC) [phase] was estimated based on the phase stability of quartz – K-feldspar – Muscovite –
Andalusite (Seedorff et al., 2005). T (ºC) [Ti] was calculated using the Ti-in-Q geothermometer (Huang and Audétat, 2012) of the lowest Ti zones, together with pressure constraints from fluid
inclusion and hornblende barometry (Cernuschi unpub. ). P (kbar) = Pressure in kbars, L. = Lithostatic,
H. = Hydrostatic, αTiO2 = Titanium activity. T (ºC) [pref. min.] is the preferred minimum formation temperature used for the diffusion modeling.
Table A5. PORPHYRY AND VEIN FORMATION TEMPERATURES BASED ON PHASE EQUILIBRIA, TITANIQ GEOTHERMOMETER AND FLUID
INCLUSION DATA
Quartz typeT(°C) [phase]
Ti (ppm)
T(ºC) [Ti] T(°C) [pref. min.]P (kbar)
Min. -Preferred-
Max.Min. from
Max. T(ºC)
Max. from
Min. T(ºC) - Preferred
-
(-) (+)
1: Magmatic and main Cu-
Mo stage
2.50x10-
23 650 700 6,000 35,000 15,000 15,000
2: Second Cu-Mo stage
3.32x10-
25 550 640 990 50,000 30,000 50,000
1,200 10,000
3D (20
µm)300 1,000
3D (60
µm)790 10,000
4: Late quartz in D veins and
fractures
1D5.38x10-
23 350 441 2,400 75,000 15,000 25,000
Total: 10,590 170,000 64,000 100,000
Stage D (m2/s)
Calculated Timescale (years)
DiffusionAlteratio
n
Ti
δ18
O
2.14x10-
21 4,000 10,000
Estimated Temperature (ºC)
450 546
Error for Max. estimate (based on
Chi-Square)
Note: Ppy = porphyry, Ap = aplite, DQ = deep quartz veins, EDM = early dark micaceous halos, BMQ = banded molybdenite quartz veins. Min. = Minimum, Max.
= Maximum. Minimum calculated timescale based on maximum estiamted temparature. Maximum calculated timescale based on minimum estimated temperature. The
maximum timescale is the preferred timescale. The error of the preferred timescale is based on the error of the Chi-Square goodness of fitness. 1D = one dimensional
diffusion. 3D=spherical diffusion, sphere radius in microns reflects the spacing of fractures in quartz.
3: 450ºC δ18O homogenization
of early high temperature
quartz
1DK-s
ilic
ate
Ser
icit
ic

27
Table DR7. LINEAR COOLING SUMMARY.
*Linear Cooling Calculation: Linear cooling is estimated using the formulation and equations of Watson and Cherniak (2015). See details in page 7. For each diffusion profile, the slope of the diffusion profile, So, was calculated the midpoint of the diffusion profile. The intercept of the slope with the upper Ti concentration (Ch) and lower Ti concentration (Co) at infinite distance provides a diffusion length, d (m)
(see Fig. 1 of Cherniak and Watson, 2015). Using the measured diffusion length, So (%/m) = [100%/d
(m)]*10exp(‐6) m/m. The cooling rate (°/s) (shown above in °C/yr and °C/1000 yr) can be solved by iteration using the diffusivity parameters (Ea, Do) for Ti and O in quartz and the initial temperature from the observed log(So) using the equation of Watson and Cherniak (2015). The total time (yr) from estimated initial to final temperature of each Stage can then be calculated. Note that for cooling from initial magmatic temperatures (~700°C) to low temperature hydrothermal conditions (325°C), we choose 700-600°C for Stage 1 and 475-375°C for Stage 3. This allows continual thermal cooling (without overlap or gaps in temperature intervals). Nonetheless, during each of these individual cooling intervals (Stages 1 to 4), there may have been one or more heating events followed by cooling, and the modeled linear cooling rate in the interval therefore represents an average cooling rate for the interval. Total cooling time estimates using linear cooling are less than isothermal cooling because diffusion occurs most rapidly at higher temperatures of the cooling interval (this also means that we can neglect diffusion at lower temperature stages, i.e., diffusion in Stages 2, 3, and 4 has negligible effects on the diffusion profile established in Stage 1 (700-600°C). Cooling rates using these estimates are relatively uniform at 2.5 to 6.7°C/1000 yr, excepting the 0.7°C/1000 yr Stage 4 estimate for the 43 m wide diffusion profile. This latter is considered likely to be too low a cooling rate, as convective cooling by groundwater will likely accelerate cooling below 375°C; alternatively, regional cooling at great depth at Haquira may cause a slowing of cooling rates to 2.5 °C/1000 yr. Therefore, linear estimate #3 (152,700 yr) is not likely, and estimates #1 and #2 provide a minimum and maximum cooling time from 675-700°C to 325°C. We note that the three time estimates of 14,900 to 27,600 yr for Stage 1 provide an estimate for the duration of magmatic intrusions associated with the Cu-Mo ores.
T (°C) Model T range Length Dif. Time (yr)(estimated) type (for calc.) °/ yr °/1,000 yr Prof. d (μm) (for T range)
700‐550 0.0067 6.7 22,400700‐600 0.0067 6.7 14,900675‐600 0.00272 2.7 27,600
50,000 1D 2A 600‐475 0.00306 3.1 3.04 40,90040,000 1D 2B 600‐475 0.00448 4.5 2.52 27,900
50,000 1D2B'
600‐475 0.00493 4.9 2.04 25,400
475‐425 0.00657 6.6 7,600
450 10,000 1D 475‐400 0.00657 6.6 11,400450 10,000 3D 475‐375 0.00657 6.6 15,200
450‐350 0.0028 2.8 35,000375‐325 0.00254 2.5 23 20,000
375‐325** 0.0007 0.7 43 69,000Total Cooling time (Min) 700‐325°C Estimate #1 75,500Total Cooling time (Max) 650‐350°C 170,000 675‐325°C, excludes ** Estimate #2 103,700Total Cooling time (Max) 675‐325°C Estimate #3 152,700
4: Late quartz in D veins and fractures
FC‐HAQ‐048350 75,000 1D
92
1: Magmatic and main Cu-Mo stage
650 35,000 1D FC‐HAQ‐002 20
FC‐HAQ ‐027
5502: Second Cu-Mo stage
FC‐HAQ‐0273: 450ºC δ 18 O homogenization of early high temperature quartz
Isothermal conditions Linear Cooling*
Stage Time (yr)
Transect Cooling Rate

28
Table DR8. ESTIMATED FORMATION TEMPERATURES BASED ON MEASURED OXYGEN ISOTOPIC COMPOSITION OF QUARTZ AND
DIFFERENT FRACTIONATION FACTORS.
Introduction to Table DR8: Known fractionation factors for δ18O of quartz-water were used to estimate the range of permissive δ18O of the magmatic water. Depending on the fractionation factor used, the possible values for water range from ~7.5 to 8.0 ‰ to yield the observed δ18O of quartz at temperatures that are estimated independently from TitaniQ, fluid inclusion data and phase petrology. Note that since the EDM and B vein quartz appears to have partially re-equilibrated at ~ 450 ºC, the calculations of magmatic water composition are based on the ~450 ºC and ~350 ºC D vein quartz. We assume that a single composition of magmatic-hydrothermal fluid produced all veins from high to low temperature (BQ to D veins), as proposed by Reed et al. (2013). It is not possible to assess whether the δ18O of the magmatic water changes from one fluid input to another. However, this seems unlikely given that the composition of the intrusions in porphyry copper deposits is relatively fixed. Where the roots of other large porphyry copper deposits can be observed (e.g. Yerington, Dilles, 1987), they are underlain by a source granite that has uniform composition. The intrusions range from tonalite to granite, but at Haquira East are presumed to be granodiorite as this is the composition of the Haquira stock and the porphyry dikes. It is also not possible to assess whether the δ18O of the water is significantly modified from the magmatic value by water-rock exchange between ~700 °C magmatic temperatures and the ~450 °C temperatures at which we calculate the quartz-water fractionation factor and water composition. However, it is unlikely that the magmatic water changed significantly on the basis that the quartz vein volume is very high (3 to >10 vol. %) and therefore the water : rock ratio was also high. Quartz solubility changes suggest that ~1000 ppm quartz would be precipitated during cooling, so this would require ~1000:1 water mass to vein quartz mass precipitated (Fournier, 1985). Furthermore, the water is ascending from the magma quickly by hydro-fracturing the wall-rock and therefore quickly depressurizing and cooling along a path that is close to adiabatic. Therefore, it is unlikely that at >350°C there is any meteoric water that mixes with the magmatic fluid (cf. Weis et al., 2012)

29
Table DR9. RAW δ18O IN QUARTZ SIMS DATA

30

31
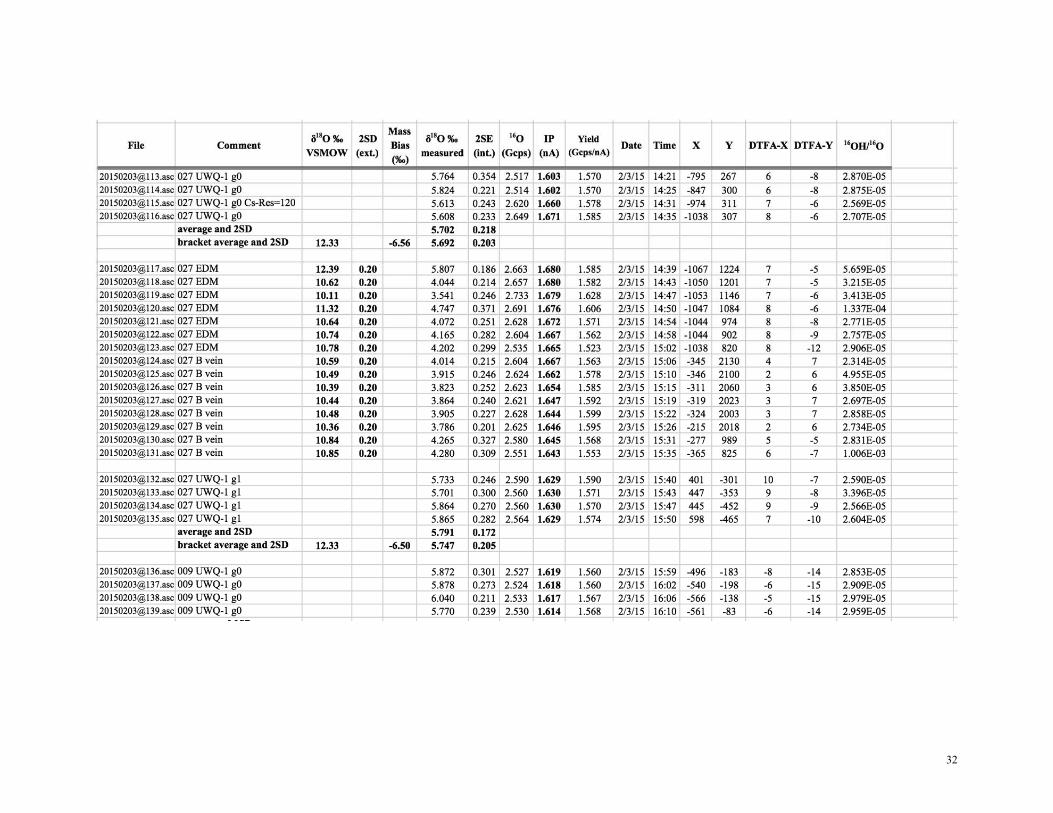
32

33

34

35
References Antares, 2010, Antares press-release: New Haquira global resource. February 26th, 2010. 6 p. Audétat, A., Garbe-Schönberg, D., Kronz, A., Pettke, T., Rusk, B., Donovan, J. J. and Lowers, H.
A., 2014, Characterisation of a Natural Quartz Crystal as a Reference Material for Microanalytical Determination of Ti, Al, Li, Fe, Mn, Ga and Ge: Geostandards and Geoanalytical Research, v. 39, no. 2, p. 171-184.
Borradaile, G., 2003. Statistics of Earth Science Data. Their distribution in time, space and orientation. Springer, 352 pp.
Brimhall, G.H, Dilles, J.H., and Proffett, J.M., Jr., 2006, The role of geologic mapping in mineral exploration, in Doggett, M. D., and Parry, J. R., eds., Wealth creation in the minerals industry: Integrating, science, business, and education: Society of Economic Geologists Special Publication 12, p. 221-241.
Brimhall, G.H, Jr., 1977, Early fracture-controlled disseminated mineralization at Butte, Montana: Economic Geology, v. 72, p. 37-59.
Burnham, C.W., 1979, Magmas and hydrothermal fluids, in Barnes, H.L., ed., Geochemistry of hydrothermal ore deposits: New York, Wiley Interscience, v. II, p. 71-136.
Cernuschi, F., 2015, The geology and geochemistry of the Haquira East porphyry copper deposit of southern Peru: Insights on the timing, temperature and lifespan of the magmatic-hydrothermal alteration and mineralization: Unpub. PhD thesis, Oregon State University, 258 p.
Cernuschi, F., Dilles, J.H., and Creaser, R., 2013, Hydrothermal alteration, SWIR-mineral mapping, vein distribution and age of the Haquira-East Cu-Mo porphyry: 12th SGA Biennial Meeting 2013, Proceedings, v. 2, p. 782-785.
Cernuschi, F., Einaudi, M.T, Dilles, J.H., Heather, K.B., and Barr, N.C., 2012, Hydrothermal veins, porphyry geochemistry and mineralization zonation of the Haquira-East porphyry Cu-Mo deposit, Perú: SEG Conference 2012, Lima, Perú.
Chelle–Michou, C., 2013, Geochronologic and petrologic evolution of the magmatic suit associated with the Eocene Coroccohuayco deposit, and its role in the genesis of the associated Cu(-Au) porphyry-skarn mineralization, Tintaya District, Perú. Unpub. PhD thesis, University de Geneve, 254 pp.
Cherniak, D., Watson, E., and Wark, D., 2007, Ti diffusion in quartz: Chemical Geology, v. 236, p. 65–74, https://doi.org/10.1016/j.chemgeo.2006.09.001.
Clark, A.H., 1993, Are outsize porphyry copper deposits either anatomically or environmentally distinctive? : Society of Economic Geologists Special Publication 2, p. 213–282.
Cooke, DR, Hollings, P and Walshe, JL 2005 , 'Giant Porphyry Deposits: Characteristics, Distribution, and Tectonic Controls' , Economic Geology, vol. 100, no. 5 , pp. 801-818 ,
Crank, J., 1975, The mathematics of diffusion (2nd ed.). Oxford, Clarendon Press, 414 pp. Dennis, P.F., 1984, Oxygen self-diffusion in quartz under hydrothermal conditions: Journal of
Geophysical Research, v. 89, p. 4047–4057, https://doi.org/10.1029/JB089iB06p04047. Dilles, J.H., 1987, Petrology of the Yerington batholith, Nevada: Evidence for evolution of
porphyry copper ore fluids: Economic Geology, v. 82, p. 1750–1789. Dilles, J.H., Tomlison, A.H., Garcia, M., and Alcota, H., 2011, The geology of the Fortuna
Granodiorite Complex, Chuquicamata district, Northern Chile. Relation to porphyry copper deposits: 11th SGA Biennial Meeting 2011, Proceedings, v. 2, p. 398-400.
Dumitru, T.A., Ernst, W.G., Wright, J.E., Wooden, J.L., Wells, R.E., Farmer, L.P., Kent, A.J.R., Graham, S.A., 2013, Eocene extension in Idaho generated massive sediment floods into the Franciscan Trench and into the Tyee, Great Valley, and Green River Basins: Geology 41 (2), 187–190.
Ferry, J. M., Kitajima, K., Strickland, A and Valley, J. W., 2014, Ion microprobe survey of the grain-scale oxygen isotope geochemistry of minerals in metamorphic rocks: Geochimica et Cosmochimica Acta, v. 144, p. 403-433.

36
Field, C.W., Zhang, L., Dilles, J.H., Rye, R. O., and Reed, M.H., 2005, Sulfur and oxygen isotopic record in sulfate and sulfide minerals of early, deep, pre-main stage porphyry Cu-Mo and late main stage base-metal mineral deposits, Butte district, Montana: Chemical Geology, v. 215, no. 1-4, p. 61–93.
Fournier, R.O., 1985, The behavior of silica in hydrothermal solution: Reviews in Economic Geology, v. 2, p. 45-72.
Gans, P., 2009, Geology of the Haquira copper deposit: New information and synthesis: Internal report for Antares Minerals, 9 p.
Harris, A.C., and Golding, S.D., 2002, New evidence of magmatic-fluid-related phyllic alteration: Implications for the genesis of porphyry Cu deposits: Geology v. 30, p. 335–338.
Hu, G., & Clayton, R. N., 2003, Oxygen isotope salt effects at high pressure and high temperature and the calibration of oxygen isotope geothermometers. A Special Issue Dedicated to Robert Clayton, 67(17), 3227–3246.
Jochum, K. P., Weis, U., Stoll, B., Kuzmin, D., Yang, Q., Raczek, I., Jacob, D. E., Stracke, A., Birbaum, K., Frick, D. A., Günther, D. and Enzweiler, J., 2011, Determination of Reference Values for NIST SRM 610-617 Glasses Following ISO Guidelines: Geostandards and Geoanalytical Research, v. 35, no. 4, p. 397-429.
Kelly JL, Fu B, Kita NT, Valley JW (2007) Optically Continuous Silcrete Cements Of The St. Peter Sandstone: Oxygen Isotope Analysis By Ion Microprobe And Laser Fluorination. Geochem. Cosmochim. Acta. 71:3812-3832.
Kent, A.J.R., Jacobsen, B., Peate, D.W., Waight, T.E., and Baker, J.A., 2004, Isotope dilution MC-ICP-MS rare earth element analysis of geochemical reference materials NIST SRM 610, NIST SRM 612, NIST SRM 614, BHVO-2G, BHVO-2, BCR-2G, JB-2, WS-1, W-2, AGV-1, AGV-2. Geostandards Newsletter, 28(3), 417-430.
Kita, N.T., Ushikubo, T., Fu, B., Valley, J.W., 2009, High precision SIMS oxygen isotope analysis and the effect of sample topography: Chemical Geology, v. 264, p. 43–57.
Landtwing, M.R., Pettke, T., Halter, W.E., Heinrich, C.A., Redmond, P.B., Einaudi, M.T., and Kunze, K., 2005, Copper deposition during quartz dissolution by cooling hydrothermal fluids: The Bingham porphyry: Earth and Planetary Science Letters, v. 235, p. 229-243.
Loewen, M.W., and Kent, A.J., 2012, Sources of elemental fractionation and uncertainty during the analysis of semi-volatile metals in silicate glasses using LA-ICP-MS: Journal of Analytical and Atomic Spectrometry, v. 27, p. 1502-1508
Matsuhisa, Y., Goldsmith, J.R., and Clayton, R.N., 1979, Oxygen isotopic fractionation in the system quartz-albite-anorthite-water: Geochimica et Cosmochimica Acta, v. 43, no. 7, p. 1131–1140.
Mercer, C.N., and Reed, M.H., 2013, Porphyry Cu-Mo stockwork formation by dynamic, transient hydrothermal pulses: mineralogic insights from the deposit at Butte, Montana: Economic Geology, v. 108, no. 6, p. 1347–1377.
Nakashima D., Kita N. T., Ushikubo T., Noguchi T., Nakamura T. and Valley J. W. (2013) Oxygen three-isotope ratios of silicate particles returned from asteroid Itokawa by the Hay- abusa spacecraft: a strong link with equilibrated LL chondrites: Earth and Planetary Science Letters, v. 379, p. 127–136.
Proffett, J.M., 2009, High Cu grades in porphyry Cu deposits and their relationship to emplacement depth of magmatic sources: Geology, v. 37 (8), p. 675–678.
Reed, M., Rusk, B., and Palandri, J., 2013, The Butte magmatic-hydrothermal system: One fluid yields all alteration and veins: Economic Geology, v. 108, p. 1379–1396.
Rusk, B.G., Reed, M.H., and Dilles, J.H., 2008, Fluid inclusion evidence for magmatic-hydrothermal fluid evolution in the porphyry copper-molybdenum deposit at Butte, Montana: Economic Geology, v. 103, p. 307-334.

37
Rusk, B.G., Reed, M.H., Dilles, J.H., and Kent, A.J.R., 2006, Intensity of quartz cathodoluminescence and trace element content of quartz from the porphyry copper deposit in Butte, Montana: American Mineralogist, v. 91, p. 1300-1312.
Seedorff, E., Dilles, J.H., Proffett, J.M., Jr, Einaudi, M.T., Zurcher, L., Stavast, W.J.A., Johnson, D.A., Barton, M.D., 2005, Porphyry deposits: Characteristics and origin of hypogene features, in Hedenquist, J. W., Thompson, J. F. H., Goldfarb, R. J., and Richards, J. P., eds., Economic Geology 100th Anniversary Volume, p. 251-298.
Schöpa, A., Annen, C., Dilles, J. H., Sparks, R. S. J., and Blundy, J. D., 2017, Magma Emplacement Rates and Porphyry Copper Deposits: Thermal Modeling of the Yerington Batholith, Nevada. Economic Geology, 112(7), 1653-1672.
Stavast, W.J.A., Butler, B.F., Seedorff, E., Barton, M.D., and Ferguson, C.A., 2008, Tertiary tilting and dismemberment of the Laramide arc and related hydrothermal systems, Sierrita Mountains, Arizona: Economic Geology, v. 103, p. 629-636.
Taylor H.P., Jr., 1986, Igneous rocks: II. Isotopic case studies of circumpacific magmatism. Rev Mineral v. 16, p. 273-316.
Tenner T. J., Ushikubo T., Kurahashi E., Kita N. T. and Nagahara H. (2013) Oxygen isotope systematics of chondrule phenocrysts from the CO3.0 chondrite Yamato 82120: evidence for two distinct oxygen isotope reservoirs: Geochimica et Cosmochimica Acta, v. 102, p. 226–245.
Ushikubo T., Kimura M., Kita N. T. and Valley J. W. (2012) Primordial oxygen isotope reservoirs of the solar nebula recorded in chondrules in Acfer 094 carbonaceous chondrite: Geochimica et Cosmochimica Acta, v. 90, p. 242–264.
Valley, J. W., 2001, Stable isotope thermometry at high temperatures, in Reviews in Mineralogy and Geochemistry, v. 43, no. 1, p. 365–413.
Valley, J.W., Kita, N.T., 2009, In situ oxygen isotope geochemistry by ion microprobe, in Fayek, M. Ed., Secondary ion mass spectrometry in the earth sciences: Mineralogical Society of Canada Short Course, p. 19–63.
Von Quadt, A., Erni, M., Martinek, K., Moll, M., Peytcheva, I., and Heinrich, C.A., 2011, Zircon crystallization and the lifetimes of ore-forming magmatic-hydrothermal systems: Geology, v. 39, no. 8, p. 731–734.
Walker, B.A., Klemetti, E.W., Grunder, A.L., Dilles, J.H., Tepley, F.J., and Giles, D., 2013, Crystal reaming during the assembly, maturation, and waning of an eleven-million-year crustal magma cycle: thermobarometry of the Aucanquilcha Volcanic Cluster: Contributions to Mineralogy and Petrology, v. 165, no. 4, 663–682.
Watson, E. B., and Cherniak, D. J., 2015, Quantitative cooling histories from stranded diffusion profiles. Contributions to Mineralogy and Petrology, 169 (6).
Weis, P., Driesner, T. & Heinrich, C. A., 2012, Porphyry-copper ore shells form at stable pressure–temperature fronts within dynamic fluid plumes: Science, v. 338, p. 1613–1616.
Zhang L.-G., Liu J.-X., Zhou H.B. and Chen Z.-S., 1989, Oxygen isotope fractionation in the quartz-water-salt system. Economic Geology, 89, p. 1643-1650.