Embed Size (px)
Citation preview
GSA Data Repository 2016188
The control of silicate weathering by interface coupled dissolution-
precipitation processes at the mineral-solution interface
Encarnación Ruiz-Agudo (1)*, Helen E. King(2), Luis D. Patiño-López(3), Christine V. Putnis(4,5),
Thorsten Geisler (6), Carlos Rodriguez-Navarro (1) and Andrew Putnis (4,7)
(1) Departamento de Mineralogía y Petrología, Universidad de Granada, 18071 Granada,
Spain
(2) Department of Earth Sciences, Utrecht University, 3584 CD Utrecht, The Netherlands
(3) Centro de Investigación Científica de Yucatán, 97302 Mérida, México
(4) Institut für Mineralogie, Universität Münster, 48149 Münster, Germany
(5) Nanochemistry Research Institute, Department of Chemistry, Curtin University, Perth 6102,
Australia
(6) Steinmann Institut für Geologie, Mineralogie und Paläontologie, University of Bonn. 53115
Bonn, Germany
(7) The Institute for Geoscience Research (TIGeR), Curtin University, Perth 6102, Australia
(*) corresponding author: [email protected]
SUPPLEMENTARY INFORMATION
DR1. MATERIALS AND METHODS.
- Materials. High purity wollastonite crystals from Barberton District, Mpumalanga
Province, (South Africa) were cleaved with a knife blade to obtain mm-size fragments and used
in the dissolution experiments. Solutions were prepared immediately before the experiments
using double-deionized water (resistivity >18 m cm-1) and adjusting the solution pH down to
pH 1.5 using HCl. The absence of calcium and silicon in the input solutions ensured initial far-
from-equilibrium conditions with respect to the original wollastonite.
- Ca and pH measurements using microelectrodes. Batch dissolution experiments were
performed in open Teflon® reactors of 30 mL inner volume. Wollastonite crystals of ca. 8 mg
were glued to the bottom of the reactor using carbon glue before contact with 30 mL of stagnant
or flowing (60 mL h-1) acidic aqueous solution (HCl pH 1.5). Microelectrodes were used for
on-line measurement of pH (micro combination electrode mod. PHR-146B, Lazar Laboratories)
and calcium concentration, [Ca] (micro-Ion Selective Electrode mod. LIS-146CACM with
microdouble junction reference electrode mod. DDM-146, Lazar laboratories) during
dissolution. The detection limit of the Ca probe is 1 ppm, and the instrumental error is ± 2%.
Electrodes were placed at different distances (0 to 3.8 mm) from the mineral surface using
home-built equipment. Free-Ca and pH data were collected at 0, 254 and 653 m from the
mineral surface and subsequently at 653 m intervals. A mechanical step-displacement
micrometer (Model 9664-0107, Limit, Sweden) was used to set the height of the microprobes.
The response time of the pH electrode is 1 second, and the time in each position (total number
of positions = 6) was 10 seconds. Therefore, at the time in which the reading was recorded, the
probe had had enough time to settle in the corresponding position, reporting a constant value.
Measurements in each point were carried out every 60 seconds. Once the data were collected,
going up and down in distance from the mineral surface with the time, the plot was constructed
by interpolation of the information between measured points using Microcal Origin 6.0
software. Microelectrodes were calibrated using standard pH buffered solutions and CaCl2
solutions of known concentration (0.1 to 100 mM). Experiments were repeated up to three times
to test the reproducibility of the results.
The time evolution of the maximum saturation index, SI (SI = log(IAP/Ksp), where IAP
and Ksp are the ion activity product and solubility product of a relevant phase, respectively) with
respect to wollastonite and amorphous silica was calculated using PHREEQC (Parkhust and
Appello, 1996) for the different values of pH and [Ca] (assuming stoichiometric release of Ca
and Si) with respect to wollastonite and amorphous silica. All calculations were performed
considering STP conditions. For the calculation of SI, we used Ksp values of amorphous silica
and wollastonite in the minteq.dat database (-3.0 and 13.0 at 25 ºC, respectively), for the
following dissociation reactions:
SiO2 + 2H2O = H4SiO4 (1)
CaSiO3 + H2O + 2H+ = H4SiO4 + Ca+2 (2)
Because of the lack of direct Si concentration measurements (micro-Si probes are not
available on the market), the observation of regular etch pits forming and spreading (Ruiz-
Agudo et al. 2012) is critical to demonstrate that Ca and Si are released stoichiometrically
(otherwise etch pits could not expand regularly). However, big silicate units cannot diffuse in
the fluid as fast as Ca2+. Note that the concentration gradients calculated here represent limit
(lowest) values; differences in diffusion rates between silica species and calcium would only
result in higher Si concentrations and SI with respect to amorphous silica (and thus silica would
be more likely to precipitate). Therefore, even without quantifying this effect, the conclusions
are fully valid and our calculations can be considered as conservative.
No other phases are considered since experimental studies have shown that surface
altered layers formed upon incongruent dissolution of silicate minerals correspond to
amorphous silica (e.g., Casey et al. 1993; Ruiz-Agudo et al. 2012).
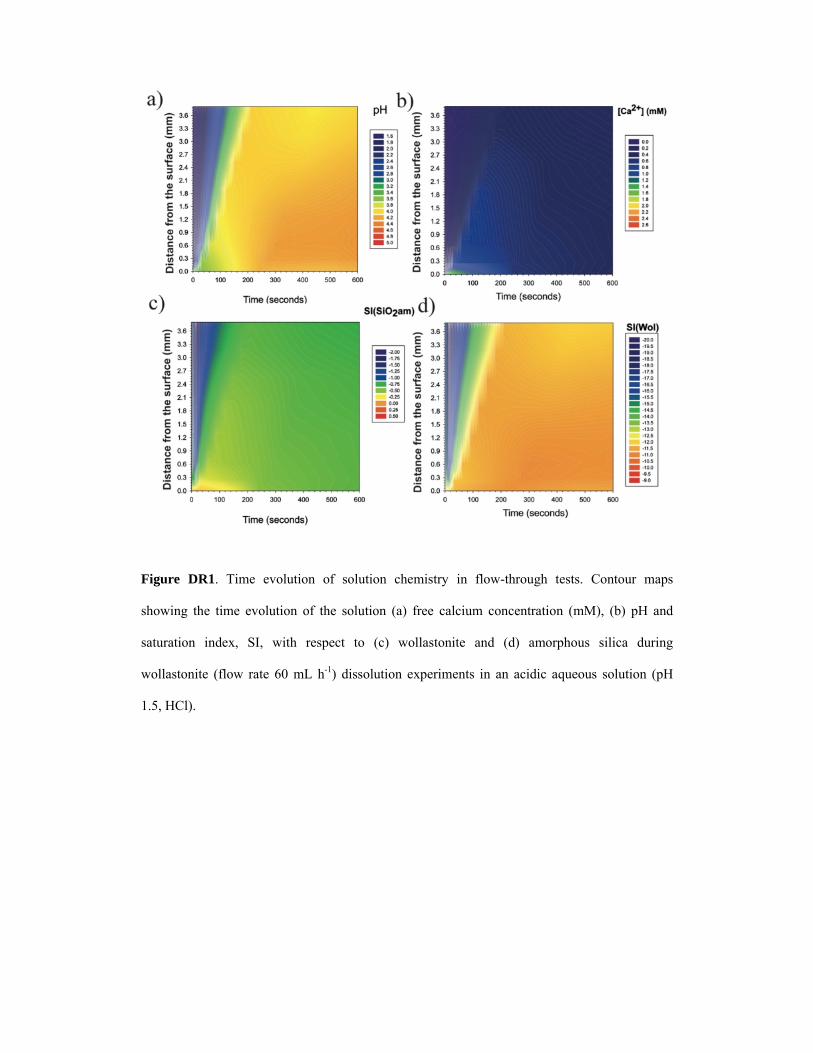
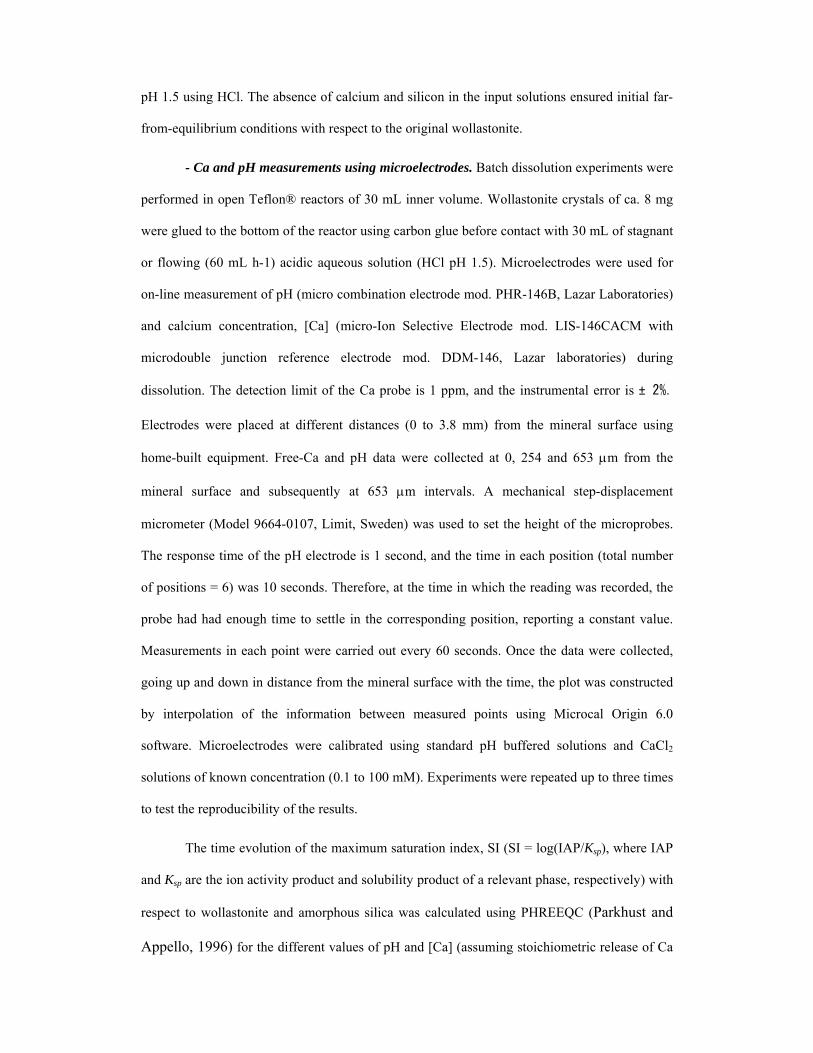
Figure DR1. Time evolution of solution chemistry in flow-through tests. Contour maps
showing the time evolution of the solution (a) free calcium concentration (mM), (b) pH and
saturation index, SI, with respect to (c) wollastonite and (d) amorphous silica during
wollastonite (flow rate 60 mL h-1) dissolution experiments in an acidic aqueous solution (pH
1.5, HCl).
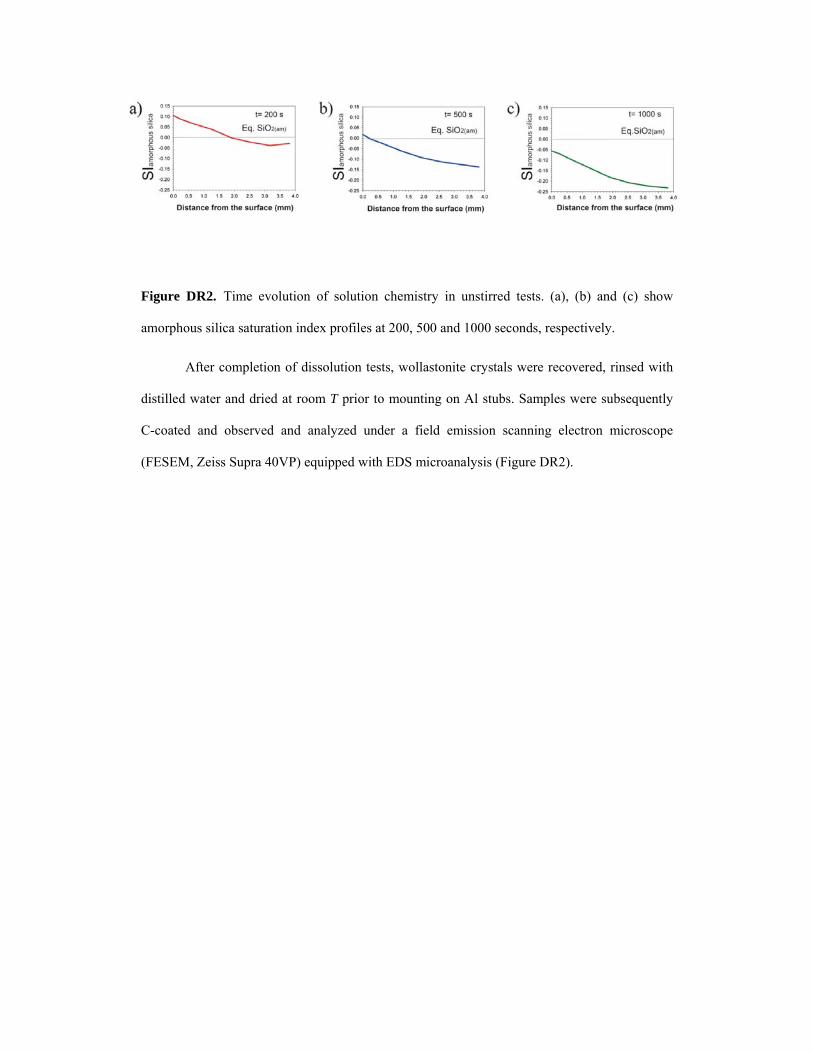
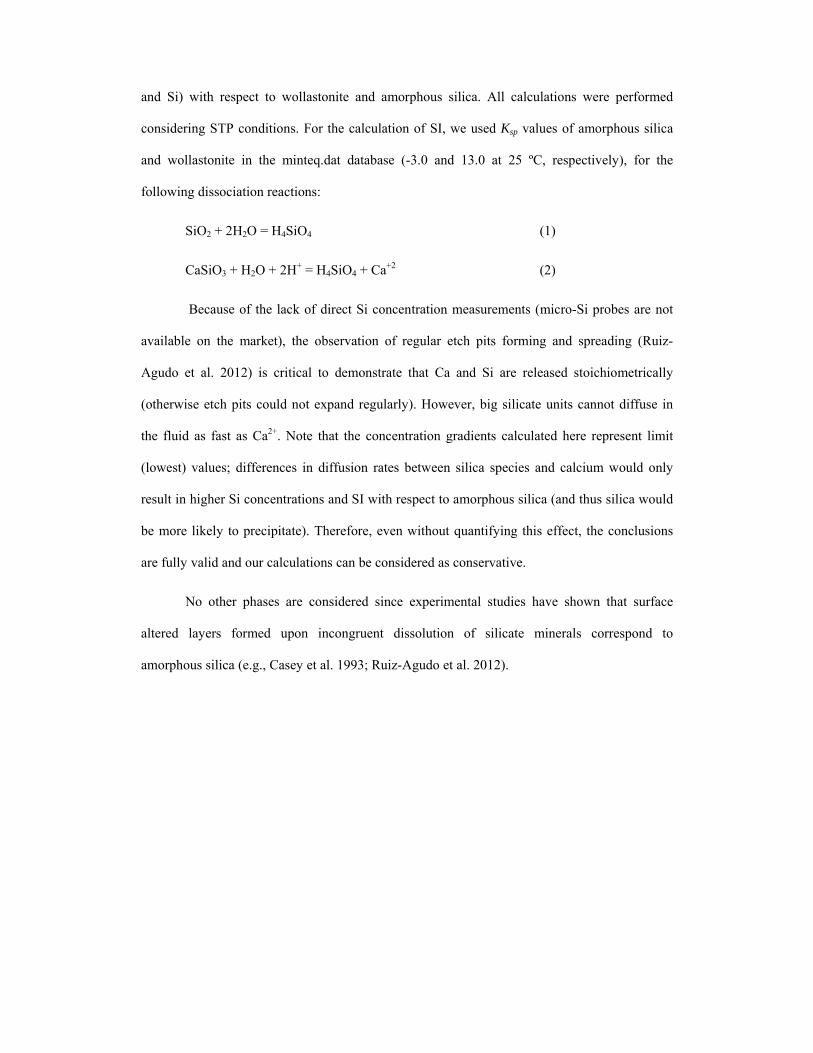
Figure DR2. Time evolution of solution chemistry in unstirred tests. (a), (b) and (c) show
amorphous silica saturation index profiles at 200, 500 and 1000 seconds, respectively.
After completion of dissolution tests, wollastonite crystals were recovered, rinsed with
distilled water and dried at room T prior to mounting on Al stubs. Samples were subsequently
C-coated and observed and analyzed under a field emission scanning electron microscope
(FESEM, Zeiss Supra 40VP) equipped with EDS microanalysis (Figure DR2).
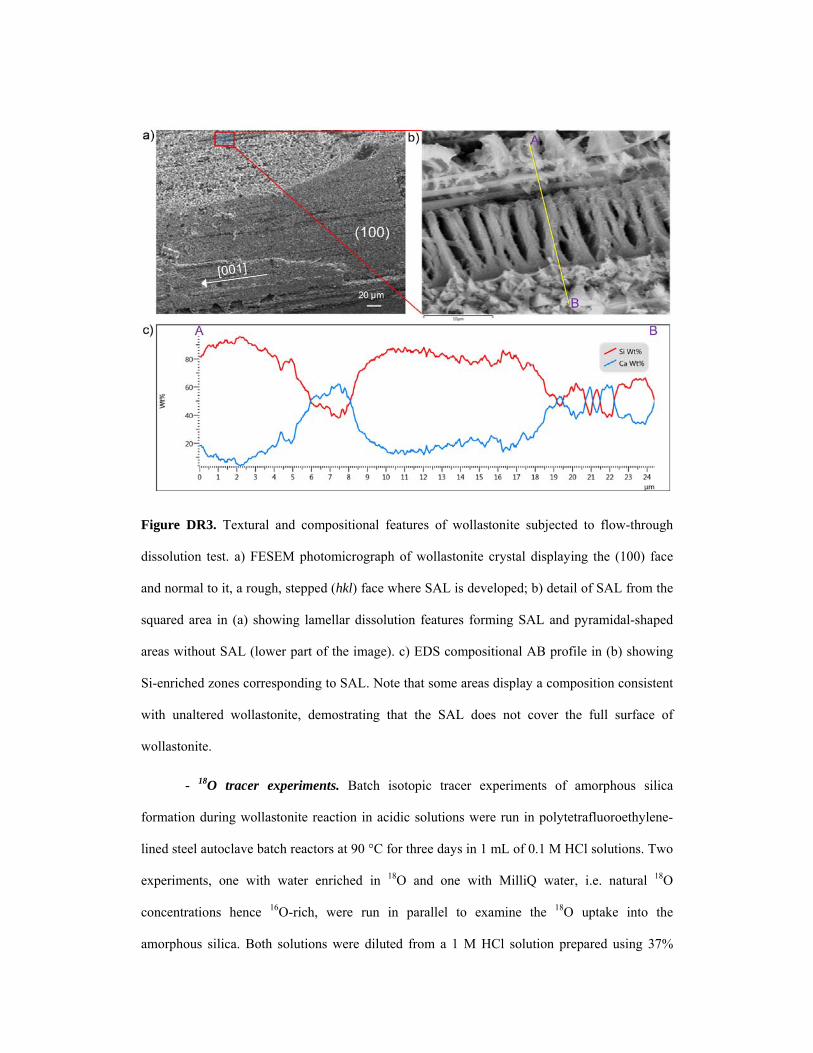
Figure DR3. Textural and compositional features of wollastonite subjected to flow-through
dissolution test. a) FESEM photomicrograph of wollastonite crystal displaying the (100) face
and normal to it, a rough, stepped (hkl) face where SAL is developed; b) detail of SAL from the
squared area in (a) showing lamellar dissolution features forming SAL and pyramidal-shaped
areas without SAL (lower part of the image). c) EDS compositional AB profile in (b) showing
Si-enriched zones corresponding to SAL. Note that some areas display a composition consistent
with unaltered wollastonite, demostrating that the SAL does not cover the full surface of
wollastonite.
- 18O tracer experiments. Batch isotopic tracer experiments of amorphous silica
formation during wollastonite reaction in acidic solutions were run in polytetrafluoroethylene-
lined steel autoclave batch reactors at 90 °C for three days in 1 mL of 0.1 M HCl solutions. Two
experiments, one with water enriched in 18O and one with MilliQ water, i.e. natural 18O
concentrations hence 16O-rich, were run in parallel to examine the 18O uptake into the
amorphous silica. Both solutions were diluted from a 1 M HCl solution prepared using 37%
HCl and MilliQ double deionized water (resistivity >18 m cm-1). To produce the 18O enriched
solution 97 at % 18O-enriched water (Campy Scientific) was used to dilute the 1 M HCl solution
to 0.1 M and a similar enrichment (67 at %) to that used in O isotopic tracer experiments with
the isosilicate olivine (King et al. 2011). The solutions were then added immediately to a pre-
weighed wollastonite fragment (~0.2 g) in the polytetrafluoroethylene liner and sealed. The
autoclaves were weighed whilst sealed before the experiment, after 24 hours and upon
completion of the experiment to ensure that no solution had been lost. The oven was preheated
to 90 °C before the autoclave was placed inside. Upon termination of the experiment each
autoclave was quenched using pressurized air. After reaching room temperature the autoclaves
were opened and the solution removed. The remnant wollastonite grains were then placed on
filter paper to remove any remaining solution before being left to dry in air for 24 hours. When
dry the samples were embedded in epoxy and cross-sectioned for scanning electron microscopy
(SEM) and Raman spectroscopic analysis.
Measurements of isotope incorporation into the amorphous silica were conducted using
a Horiba Scientific LabRam HR800 confocal micro-Raman spectrometer at Bonn University.
Raman scattering was excited using a solid state Nd:YAG laser (532.09 nm) with an intensity of
about 150 mW at the surface. A 100x objective lens with numerical aperture of 0.9 provided a
laser spot size of less than 1 µm at the surface. The confocal hole was opened to 300 µm to limit
the depth penetration of the laser and therefore the amount of wollastonite sampled from the
underlying material. After passing through a 50 µm entrance slit and being dispersed by a
grating of 1800 grooves/mm the scattered Raman light was collected in 180° geometry by an
electron-multiplier charge-coupled device. The Raman microspectrometer was calibrated using
the 520.7 cm-1 band of a silicon wafer standard.
The rim material was identified as amorphous silica in both experiments based on the
development of the bands relating to siloxane ring structures below 485 cm-1. At least six
locations within the amorphous silica rim were examined for each of the samples to examine the
consistency of isotope incorporation. Similar to reports by Casey et al. (1993), wollastonite
peaks were also present in the majority of the Raman spectra. A few areas were observed with
minimal contamination from the wollastonite; however, due to the porous nature of the
amorphous silica these spectra also had contributions from the epoxy used to embed the samples
(e.g., Figure DR4a), which obstructed some of the amorphous silica bands. The Rayleigh
scattering contribution to the background in the low wavenumbers region was removed using
the procedure described by Long (1976) and recently used by Behrens et al. (2006) for the study
of amorphous silica. Final background removal for the entire spectrum was subsequently
completed using a spline cubic baseline. Further data reduction, such as removal of the epoxy
related spectrum, and peak fitting was conducted using the LabSpec5 program also from Horiba
Scientific.
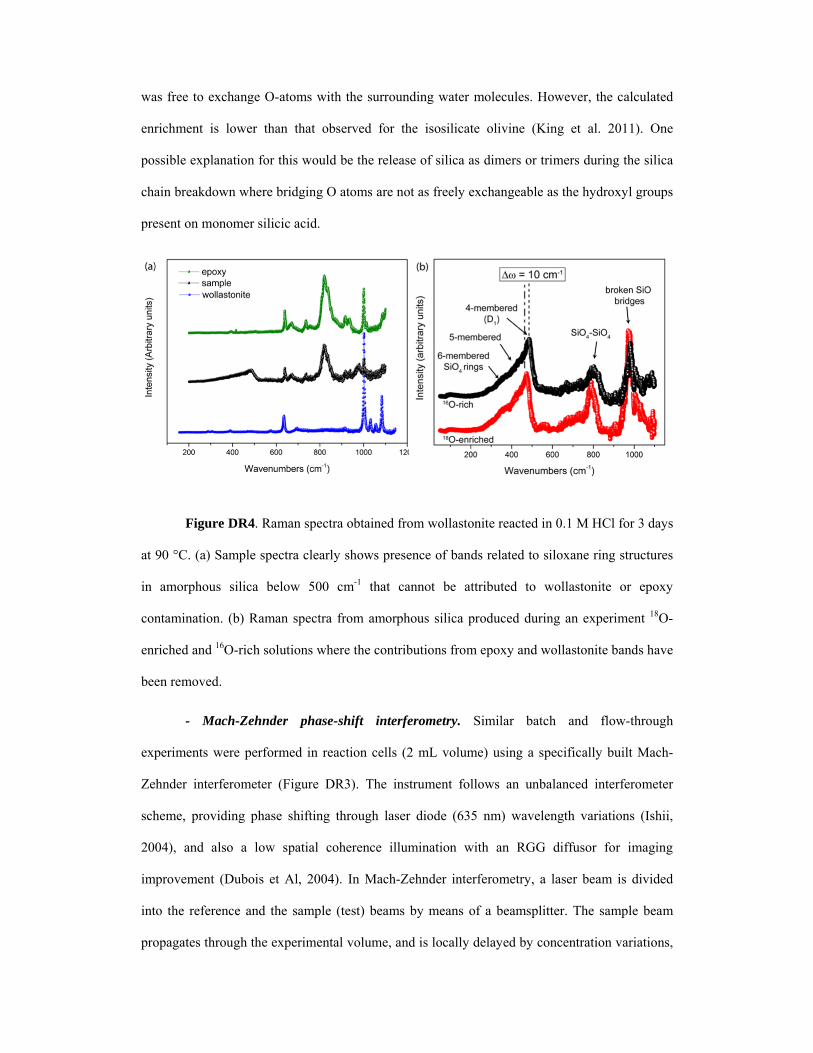
All locations within the amorphous silica produced during the 18O-enriched experiments
showed a red shift in the D1 peak of 10 cm-1 in comparison to the 16O-rich experiment, which
was confirmed by the same shift of the SiO4-SiO4 peak (Figure DR4b). This red shift is
consistent with 18O incorporation into the amorphous silica structure. Si18O2, i.e. amorphous
silica with only 18O atoms, produces a frequency shift of -30 cm-1 for the D1 band (Galeener and
Mikkelsen, 1981). The principle behind analyzing the 18O content in condensed matter by
vibrational spectroscopy is that the energies or frequencies associated with vibrational motions
are dependent on the masses of the vibrating atoms (Herzberg 1944). In the simple harmonic
approximation, the vibrational frequency shift is proportional to the square root of the mass ratio
between the atoms involved in the vibration (Herzberg 1944). A complete substitution of 16O by
18O in a silica network was found to give a mass-related frequency shift of −30 cm-1, i.e., −0.3
cm-1/at.% 18O (Galeener and Mikkelsen 1981). The measured 10 cm-1 shift of the D1 band to
lower wavenumbers thus corresponds to ~30 at.% 18O within the amorphous silica structure.By
assuming a simple linear relationship between the 18O content and frequency shift we calculate
that the observed shift is caused by about 34 at% 18O within the amorphous silica structure. A
shift of up to 17 at% can be related to the hydroxylation of the silica chain during dissolution,
therefore the calculated enrichment indicates that silica was also released into solution where it
was free to exchange O-atoms with the surrounding water molecules. However, the calculated
enrichment is lower than that observed for the isosilicate olivine (King et al. 2011). One
possible explanation for this would be the release of silica as dimers or trimers during the silica
chain breakdown where bridging O atoms are not as freely exchangeable as the hydroxyl groups
present on monomer silicic acid.
Figure DR4. Raman spectra obtained from wollastonite reacted in 0.1 M HCl for 3 days
at 90 °C. (a) Sample spectra clearly shows presence of bands related to siloxane ring structures
in amorphous silica below 500 cm-1 that cannot be attributed to wollastonite or epoxy
contamination. (b) Raman spectra from amorphous silica produced during an experiment 18O-
enriched and 16O-rich solutions where the contributions from epoxy and wollastonite bands have
been removed.
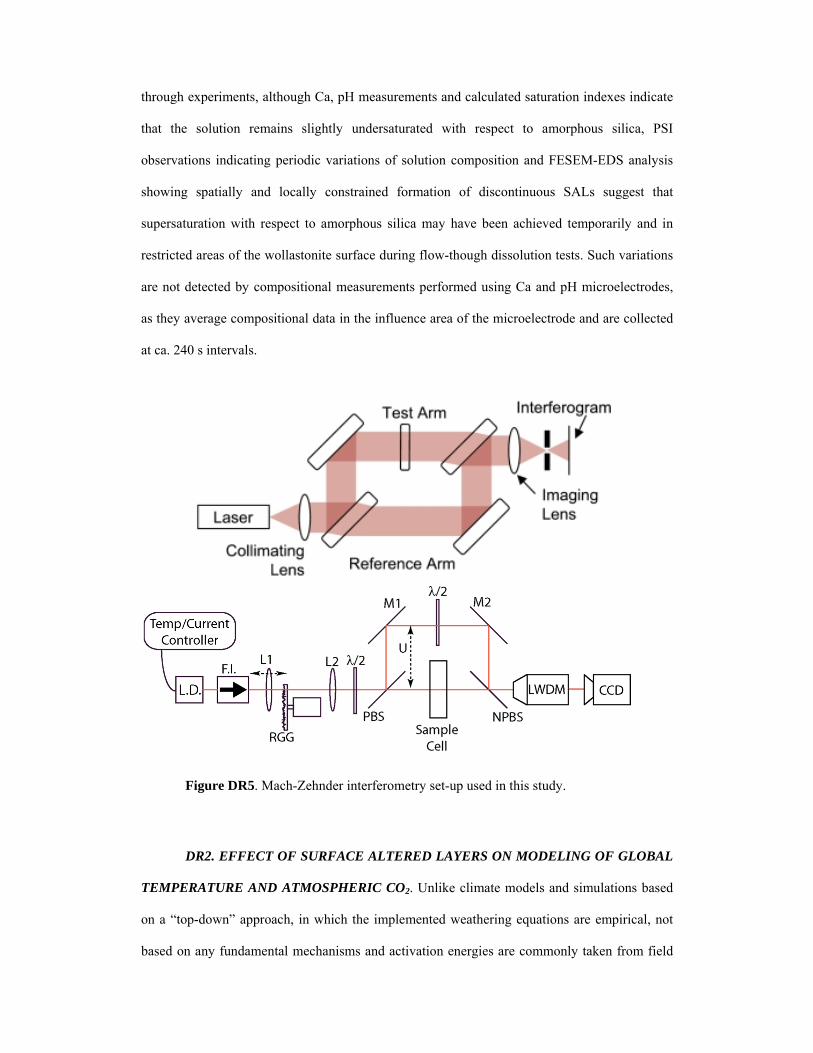
- Mach-Zehnder phase-shift interferometry. Similar batch and flow-through
experiments were performed in reaction cells (2 mL volume) using a specifically built Mach-
Zehnder interferometer (Figure DR3). The instrument follows an unbalanced interferometer
scheme, providing phase shifting through laser diode (635 nm) wavelength variations (Ishii,
2004), and also a low spatial coherence illumination with an RGG diffusor for imaging
improvement (Dubois et Al, 2004). In Mach-Zehnder interferometry, a laser beam is divided
into the reference and the sample (test) beams by means of a beamsplitter. The sample beam
propagates through the experimental volume, and is locally delayed by concentration variations,
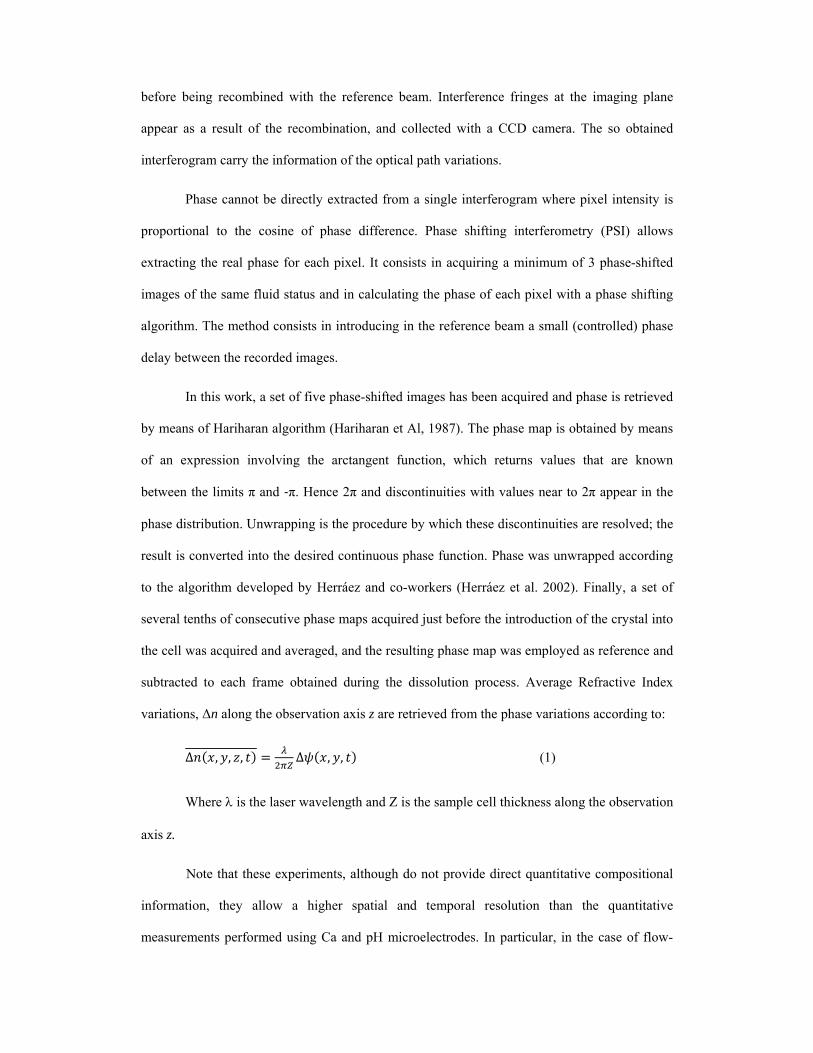
before being recombined with the reference beam. Interference fringes at the imaging plane
appear as a result of the recombination, and collected with a CCD camera. The so obtained
interferogram carry the information of the optical path variations.
Phase cannot be directly extracted from a single interferogram where pixel intensity is
proportional to the cosine of phase difference. Phase shifting interferometry (PSI) allows
extracting the real phase for each pixel. It consists in acquiring a minimum of 3 phase-shifted
images of the same fluid status and in calculating the phase of each pixel with a phase shifting
algorithm. The method consists in introducing in the reference beam a small (controlled) phase
delay between the recorded images.
In this work, a set of five phase-shifted images has been acquired and phase is retrieved
by means of Hariharan algorithm (Hariharan et Al, 1987). The phase map is obtained by means
of an expression involving the arctangent function, which returns values that are known
between the limits π and ‐π. Hence 2π and discontinuities with values near to 2π appear in the
phase distribution. Unwrapping is the procedure by which these discontinuities are resolved; the
result is converted into the desired continuous phase function. Phase was unwrapped according
to the algorithm developed by Herráez and co-workers (Herráez et al. 2002). Finally, a set of
several tenths of consecutive phase maps acquired just before the introduction of the crystal into
the cell was acquired and averaged, and the resulting phase map was employed as reference and
subtracted to each frame obtained during the dissolution process. Average Refractive Index
variations, Δn along the observation axis z are retrieved from the phase variations according to:
Δ , , , Δ , , (1)
Where is the laser wavelength and Z is the sample cell thickness along the observation
axis z.
Note that these experiments, although do not provide direct quantitative compositional
information, they allow a higher spatial and temporal resolution than the quantitative
measurements performed using Ca and pH microelectrodes. In particular, in the case of flow-
through experiments, although Ca, pH measurements and calculated saturation indexes indicate
that the solution remains slightly undersaturated with respect to amorphous silica, PSI
observations indicating periodic variations of solution composition and FESEM-EDS analysis
showing spatially and locally constrained formation of discontinuous SALs suggest that
supersaturation with respect to amorphous silica may have been achieved temporarily and in
restricted areas of the wollastonite surface during flow-though dissolution tests. Such variations
are not detected by compositional measurements performed using Ca and pH microelectrodes,
as they average compositional data in the influence area of the microelectrode and are collected
at ca. 240 s intervals.
Figure DR5. Mach-Zehnder interferometry set-up used in this study.
DR2. EFFECT OF SURFACE ALTERED LAYERS ON MODELING OF GLOBAL
TEMPERATURE AND ATMOSPHERIC CO2. Unlike climate models and simulations based
on a “top-down” approach, in which the implemented weathering equations are empirical, not
based on any fundamental mechanisms and activation energies are commonly taken from field
studies (e.g. GEOCARB, Berner and Kothavala, 2001), in calculations based on a “bottom-up”
approach, weathering is approximated by means of quantitative expressions, which mostly
depend on mechanisms and rates determined in the laboratory (Brady 1991). As in Brady
(1991), we will use Volk’s carbon cycle model (Volk, 1987) as a tool to quantify the influence
of surface altered layers (SALs) on global carbon cycling. This relatively simple model has been
shown to give essentially the same results as other computationally more complex model, such
as BLAG (Volk, 1987 in Brady 1991). In this model, the relationships
1 0.0381 1
2.88,
can be used to calculate atmospheric CO2 concentrations and paleotemperatures as a function of
Ea and the independently measured geophysical forcing parameters fsr and fa (Volk, 1987).
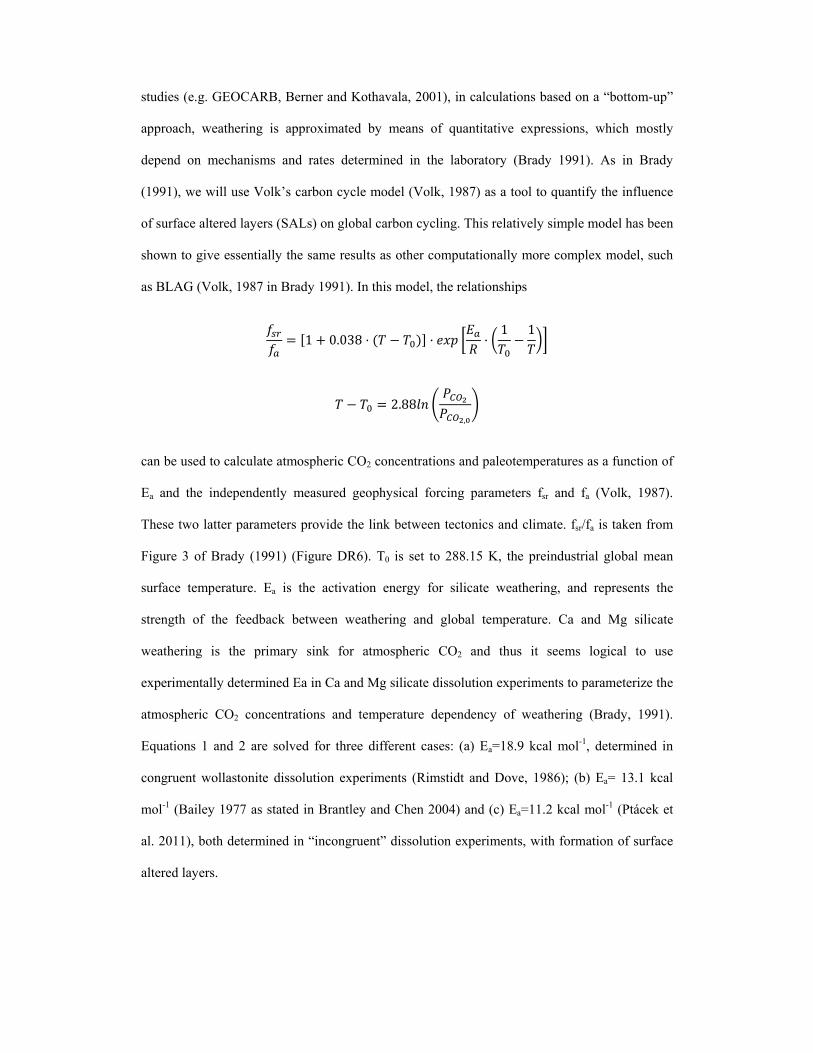
These two latter parameters provide the link between tectonics and climate. fsr/fa is taken from
Figure 3 of Brady (1991) (Figure DR6). T0 is set to 288.15 K, the preindustrial global mean
surface temperature. Ea is the activation energy for silicate weathering, and represents the
strength of the feedback between weathering and global temperature. Ca and Mg silicate
weathering is the primary sink for atmospheric CO2 and thus it seems logical to use
experimentally determined Ea in Ca and Mg silicate dissolution experiments to parameterize the
atmospheric CO2 concentrations and temperature dependency of weathering (Brady, 1991).
Equations 1 and 2 are solved for three different cases: (a) Ea=18.9 kcal mol-1, determined in
congruent wollastonite dissolution experiments (Rimstidt and Dove, 1986); (b) Ea= 13.1 kcal
mol-1 (Bailey 1977 as stated in Brantley and Chen 2004) and (c) Ea=11.2 kcal mol-1 (Ptácek et
al. 2011), both determined in “incongruent” dissolution experiments, with formation of surface
altered layers.
Figure DR6. Ratio of and seafloor spreading rates fsr to continental surface area fa over the past
90 m.y. Values of fa from Barron et al. [1980] and values of fsr from BLAG are taken from
Figure 3 of Brady (1991).
When low Ea (down to 10 kcal/mol) determined for incongruent dissolution of
wollastonite (with formation of surface-altered layers (Bailey, 1976; Brantley and Chen, 1995;
Ptáček et al. 2011) are input into existing models that calculate paleo-T and atmospheric CO2
levels over the past 90 Myr based on a mechanistic approach of mineral reactivity, the result is
higher CO2 levels and temperatures up to ca. 2 °C warmer than those estimated by assuming
higher Ea (20 kcal/mol) determined in congruent dissolution experiments (Rimstidt and Dove
1986) (Figure DR7a). Note that the low and high Ea values for wollastonite used in our
modeling bracket the values determined in the laboratory for common primary silicates such as
feldspar, olivine, amphiboles and other pyroxenes such as augite and diopside (Brantley 2008;
Brady 1991). They also fall within the range of Ea values (5.7-20.5 kcal/mol) determined in the
field for the dissolution of different silicate minerals and glasses (Velbel 1993), the lower values
suggesting a diffusion control. Despite its simplicity, this modeling yields a good match with
pCO2 levels determined using independent proxies (Beerling and Royer, 2011) (Fig. DR7b).
Interestingly, the best match is achieved when considering the low Ea value, that is, when
considering the case of wollastonite dissolution under transport-controlled kinetics and resulting
in the development of a SAL. These results illustrate the impact that different weathering
mechanisms and rate-controlling steps in laboratory experiments may have on estimates of
paleo-T and pCO2 levels in the past as well as in the prediction of future climate evolution using
models in which the kinetic rate laws for the weathering dependence on temperature are based
on a mechanistic approach of mineral reactivity. For instance, following a similar reasoning, the
long intervals between snowball glaciations (750-550 My), several orders of magnitude longer
than expected from typical rates of CO2 drawdown by silicate weathering (Mills et al. 2011),
could be explained by considering the effect of transport-limited silicate weathering on
atmospheric CO2 levels. Initial silicate weathering in a CO2-rich, acidic aqueous environment
would result in the quick coating of SALs on reactive rock-forming minerals. This would in turn
lead to a stage of transport-limited silicate weathering in which CO2 would be removed from the
atmosphere at a slower rate than in the case of reaction-limited weathering, reducing the rate of
atmospheric CO2 drawdown to threshold values needed for the beginning of a new glaciation.
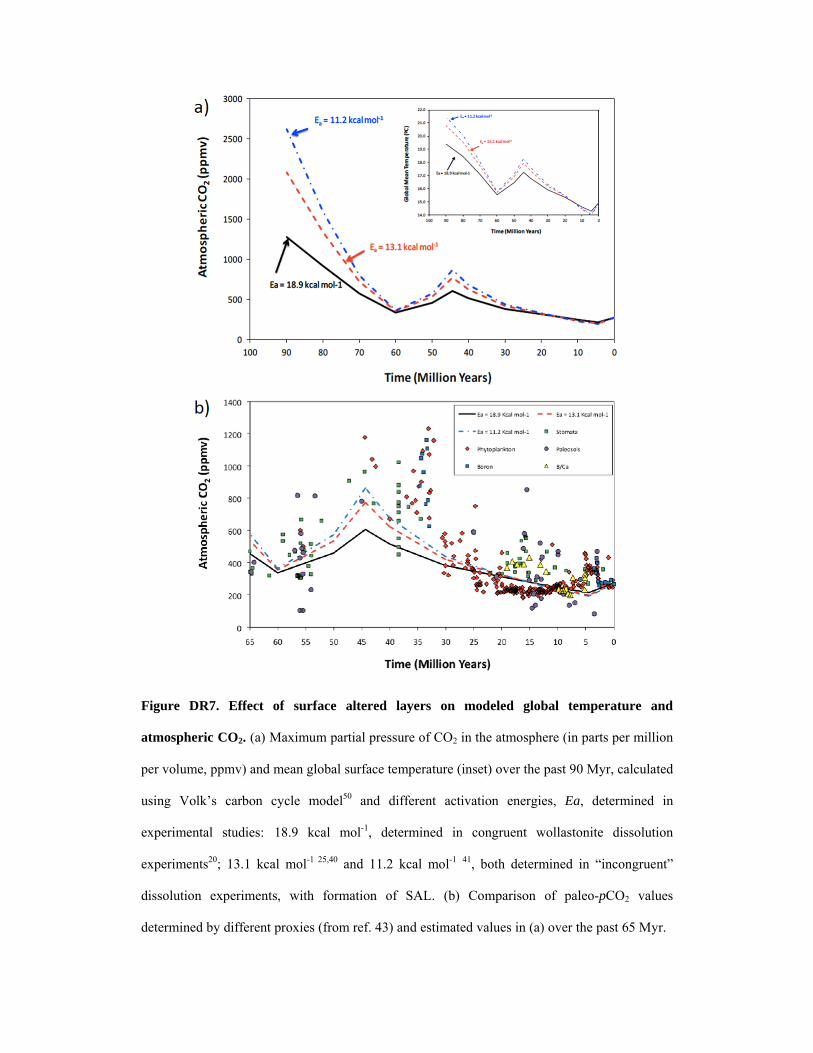
Figure DR7. Effect of surface altered layers on modeled global temperature and
atmospheric CO2. (a) Maximum partial pressure of CO2 in the atmosphere (in parts per million
per volume, ppmv) and mean global surface temperature (inset) over the past 90 Myr, calculated
using Volk’s carbon cycle model50 and different activation energies, Ea, determined in
experimental studies: 18.9 kcal mol-1, determined in congruent wollastonite dissolution
experiments20; 13.1 kcal mol-1 25,40 and 11.2 kcal mol-1 41, both determined in “incongruent”
dissolution experiments, with formation of SAL. (b) Comparison of paleo-pCO2 values
determined by different proxies (from ref. 43) and estimated values in (a) over the past 65 Myr.
REFERENCES
Bailey, A., 1976, Effects of temperature on the reaction of silicates with aqueous solutions in
the low temperature range, paper presented at 2nd International Symposium on Water-
Rock Interaction, Intl. Assoc. of Geochem. and Cosmochem., Prague, Czechoslovakia,
Sept. 9-13.
Behrens, H., Roux, J., Neuville, D.R., Siemann, M., 2006, Quantification of dissolved H2O in
silicate glasses using confocal microRaman spectroscopy. Chemical Geology, v. 229, p.
96-112.
Beerling, D.J. & Royer, D. L., 2011, Convergent Cenozoic CO2 history: Nature Geoscience, v.
4, p- 418–420
Berner, R.A. & Kothavala, Z., 2001, GEOCARB III: A revised model of atmospheric CO2 over
Phanerozoic time: American Journal of Science, v. 426, p. 323-326.
Bioucas-Dias, J. M., Valadão, G., 2007, Phase unwrapping via graph cuts: Image Processing,
IEEE Transactions on Image Processing16, v. 3, p. 698-709.
Brady, P.V., 1991, The effect of silicate weathering on global temperature and atmospheric
CO2: Journal of Geophysical Research: Solid Earth, v. 96, p. 18101–18106
Brantley, S. L. & Chen, Y., 1995 Chemical weathering rates of pyroxenes and amphiboles. In
Chemical Weathering Rates of Silicate Minerals, Vol. 31 (ed. A. F. White and S. L.
Brantley), p. 119–172. Mineralogical Society of America.
Brantley, S.L., 2003, Reaction Kinetics of Primary Rock-forming Minerals under Ambient
Conditions: Treatise on Geochemistry, v. 5, p. 73–117.
Casey, W. H., Westrich, H. R., Banfield, J. F., Ferruzzi, G., and Arnold, G. W., 1993, Leaching
and reconstruction at the surfaces of dissolving chain-silicate minerals: Nature, v. 366, p.
253-256.
Dubois, F., Novella Requena, M.L., Minetti, C., Monnom, O., Istasse, E., 2004, Partial spatial
coherence effects in digital holographic microscopy with a laser source: Applied optics, v.
43, p. 1131-1139.
Galeener, F.L. and Mikkelsen, J.C.Jr., 1981, Vibrational dynamics in 18O-substituted vitreous
SiO2. Physical Reviews B, v. 23, p. 5527-5530Hariharan, P., Oreb, B.F., Eiju. T., 1987,
Digital phase-shifting interferometry: a simple error-compensating phase calculation
algorithm: Applied Optics, v. 26, p. 2504-2506.
Herráez, M. A., Burton, D.R., Lalor, M.J. & Gdeisat, M.A., 2002, Fast two-dimensional phase-
unwrapping algorithm based on sorting by reliability following a noncontinuous path:
Applied Optics, v. 41, p. 7437-7444.
Herzberg G. (1944) Atomic Spectra and Atomic Structure. Dover Publications, New York, pp.
257.
Ishii, Y., 2004, Laser-diode interferometry: Progress in Optics, v. 46, p. 243-310.
King, H.E., Plümper, O., Geisler, T., Putnis, A., 2011, Experimental investigations into the
silicification of olivine: Implications for the reaction mechanism and acid neutralization:
American Mineralogist, v. 96, p. 1503-1511.
Long, D.A., 1977, Raman Spectroscopy. MacGraw-Hill, New York.
Mills, B., Watson, A. J., Goldblatt, C., Boyle, R. & Lenton, T. M., 2011, Timing of
Neoproterozoic glaciations linked to transport-limited global weathering: Nature
Geosciences, v. 4, p. 861-864.
Ptáček, P., Nosková, M., Brandštetr, J., Šoukal, F. & Opravil, T., 2011, Mechanism and kinetics
of wollastonite fibre dissolution in the aqueous solution of acetic acid: Powder Technology,
v. 206, p. 338–344
Rimstidt, J.D. & Dove, P.M., 1986, Mineral solution reaction rates in a mixed flow reactor-
wollastonite hydrolysis: Geochimica et Cosmochimica Acta, v. 50, p. 2509-2516
Ruiz-Agudo, E., Putnis, C.V., Rodriguez-Navarro, C., Putnis, A., 2012. The mechanism of
leached layer formation during chemical weathering of silicate minerals. Geology, v. 40, p.
947-950.

Velbel, M.A., 1993, Constancy of silicate-mineral weathering-rate ratios between natural and
experimental weathering: implications for hydrologic control of differences in absolute
rates: Chemical Geology, v. 105, p. 89-99.