Embed Size (px)
DESCRIPTION
GS Rocks Ores - Thermal Coal July 2013
Citation preview
July 24, 2013
Rocks & Ores
The window for thermal coal
investment is closing
Commodities Research
The window to invest profitably in new mining capacity is closing
Earning a return on incremental investment in thermal coal mining and
infrastructure capacity is becoming increasingly difficult. In the short term,
a sharp deceleration in seaborne demand (we expect average annual
growth to decline to 1% in 2013-17 from 7% in 2007-12) has moved the
market into oversupply and caused a downward shift in the cost curve; we
downgrade our price forecasts to US$83/t in 2014 and US$85/t in 2015
(down 13% and 11% respectively) and maintain a relatively flat outlook for
the rest of our forecast period to 2017.
Mines are long-lived assets with a long payback period, and investment
decisions today are sensitive not just to prices and margins today, but also
to projections going well into the next decade. We believe that thermal
coal’s current position atop the fuel mix for global power generation will be
gradually eroded by the following structural trends: 1) environmental
regulations that discourage coal-fired generation, 2) strong competition
from gas and renewable energy and 3) improvements in energy efficiency.
The prospect of weaker demand growth (we believe seaborne demand
could peak in 2020) and seaborne prices near marginal production costs
suggest that most thermal coal growth projects will struggle to earn a
positive return for their owners; in our view, this is reflected in the way
diversified mining companies are reallocating their capital towards more
attractive sectors.
Insights from an equipment manufacturer: Alstom interview
We interview Mr. Wouter van Wersch, President of Alstom Singapore.
Equipment manufacturers are directly involved in the decision-making
process of power utilities and are thus ideally placed to comment on the
future trends in the power sector which accounts for ~80% of global
thermal coal demand. The key insights we take away are 1) even when
carbon prices are low or non-existent, the downside risks of future
regulation can offset the cost advantage of thermal coal relative to
alternative energy sources, 2) demand for coal-fired generation remains
strong in India and southeast Asia but the number of new plants is
expected to decline by the end of the decade and 3) the energy sources
with the most upside potential include gas and solar power.
Christian Lelong
+61(2)9321-8635 [email protected] Goldman Sachs Australia Pty Ltd
Jeffrey Currie
(212) 357-6801 [email protected] Goldman, Sachs & Co.
Samantha Dart
+44(20)7552-9350 [email protected] Goldman Sachs International
Philipp Koenig
+44(20)7774-2535 [email protected] Goldman Sachs International
Investors should consider this report as only a single factor in making their investment decision. For Reg AC certificationand other important disclosures, see the Disclosure Appendix, or go to www.gs.com/research/hedge.html.
The Goldman Sachs Group, Inc. Goldman Sachs Global Economics, Commodities and Strategy Research
July 24, 2013 Global
Goldman Sachs Global Economics, Commodities and Strategy Research 2
Contents
Executive Summary: Constrained demand will cap investment 3
Oversupply shifts the price range downwards 5
Demand has transitioned from high growth to low growth 9
The viability of growth projects is being eroded 13
Insights from an equipment manufacturer: Alstom interview 16
Structural trend #1: Environmental regulation 20
Structural trend #2: The shift to gas and renewable energy 23
Structural trend #3: Energy efficiency 28
Risks to our view 30
Disclosure Appendix 31
The authors wish to thank Amber Cai for her contribution to this report.
July 24, 2013 Global
Goldman Sachs Global Economics, Commodities and Strategy Research 3
Executive Summary: Constrained demand will cap investment
In July 2013 the World Bank announced a new policy to limit financing of coal-fired power
plants to rare circumstances where no feasible alternatives are available. A few days later,
the US Export-Import Bank declined to participate in the financing of a large coal-fired plant
in Vietnam on environmental grounds. Coming on the back of China’s first emissions
trading program, we believe these events are indicative of a gradually worsening outlook
for thermal coal demand, with implications for equity investors in particular.
The window for profitable investment in coal mining is closing
Thermal coal has enjoyed a long period of strong demand growth but in our view the next
10 years will not be as benign. Coal currently sits comfortably at the top of the global fuel
mix with a 36% share of electricity generation, well ahead of gas (23%), hydro (16%) and
nuclear energy (13%). In no small part because of China’s rapid transition from a mid-sized
exporter to the world’s largest importer, seaborne demand growth in the period 2007-12
increased to an average annual rate of 7.2%. However, a sharp deceleration in seaborne
demand (we expect average annual growth to decline to 1% in 2013-17 from 7% in 2007-12)
has moved the market into oversupply and caused a downward shift in the cost curve; we
downgrade our price forecasts and expect a narrow price range around US$85/t FOB
Newcastle (vs. US$95/t previously) for the rest of our forecast period to 2017.
Earning a return on incremental investment in thermal coal mining and infrastructure
capacity is becoming increasingly difficult. Mines are long-lived assets with a long payback
period, while thermal coal is a geologically abundant resource in an industry with relatively
low barriers to entry. As coal demand becomes increasingly constrained, the competition
among suppliers is likely to intensify. This change in outlook is reflected in the way
diversified mining companies are reallocating their capital towards more attractive sectors.
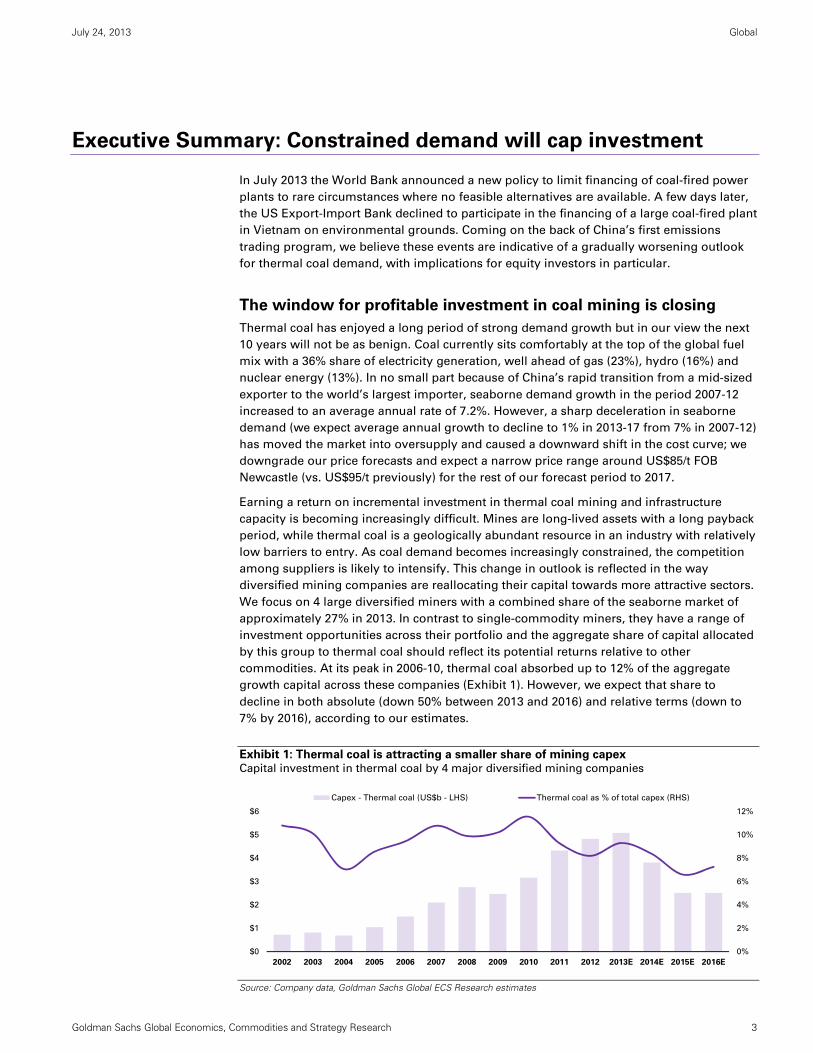
We focus on 4 large diversified miners with a combined share of the seaborne market of
approximately 27% in 2013. In contrast to single-commodity miners, they have a range of
investment opportunities across their portfolio and the aggregate share of capital allocated
by this group to thermal coal should reflect its potential returns relative to other
commodities. At its peak in 2006-10, thermal coal absorbed up to 12% of the aggregate
growth capital across these companies (Exhibit 1). However, we expect that share to
decline in both absolute (down 50% between 2013 and 2016) and relative terms (down to
7% by 2016), according to our estimates.
Exhibit 1: Thermal coal is attracting a smaller share of mining capex Capital investment in thermal coal by 4 major diversified mining companies
Source: Company data, Goldman Sachs Global ECS Research estimates
0%
2%
4%
6%
8%
10%
12%
$0
$1
$2
$3
$4
$5
$6
2002 2003 2004 2005 2006 2007 2008 2009 2010 2011 2012 2013E 2014E 2015E 2016E
Capex - Thermal coal (US$b - LHS) Thermal coal as % of total capex (RHS)
July 24, 2013 Global
Goldman Sachs Global Economics, Commodities and Strategy Research 4
Structural drivers will constrain demand in the long term
We believe that the following trends will gradually erode coal’s dominant position in the
long term; in our view, these structural trends are already shaping the power sector and
their impact will become increasingly visible.
1. Environmental regulations that discourage investment in coal-fired power plants
in OECD countries, and to a lesser degree in non-OECD countries as well.
2. Strong competition from gas and renewable energy, partly driven by the shale gas
revolution on the one hand (with other regions poised to emulate the success of
US producers) and the maturing of wind and solar technology on the other hand
(for instance in China, Europe and the US).
3. Improvements in energy efficiency at the macro level (e.g. lower electricity
demand per unit of GDP) and in the power sector (e.g. lower coal burn per unit of
electricity) which do not impact directly the share of coal in the mix, but can lead
to lower coal consumption relative to business-as-usual scenarios.
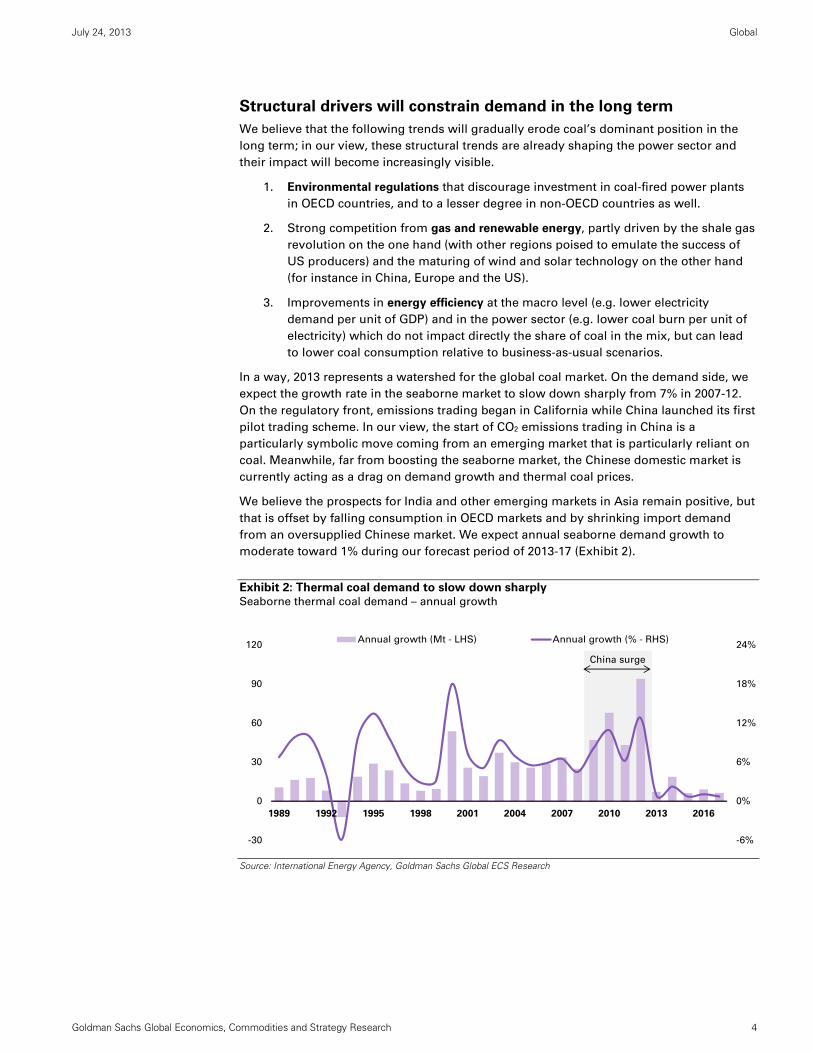
In a way, 2013 represents a watershed for the global coal market. On the demand side, we
expect the growth rate in the seaborne market to slow down sharply from 7% in 2007-12.
On the regulatory front, emissions trading began in California while China launched its first
pilot trading scheme. In our view, the start of CO2 emissions trading in China is a
particularly symbolic move coming from an emerging market that is particularly reliant on
coal. Meanwhile, far from boosting the seaborne market, the Chinese domestic market is
currently acting as a drag on demand growth and thermal coal prices.
We believe the prospects for India and other emerging markets in Asia remain positive, but
that is offset by falling consumption in OECD markets and by shrinking import demand
from an oversupplied Chinese market. We expect annual seaborne demand growth to
moderate toward 1% during our forecast period of 2013-17 (Exhibit 2).
Exhibit 2: Thermal coal demand to slow down sharply
Seaborne thermal coal demand – annual growth
Source: International Energy Agency, Goldman Sachs Global ECS Research
-6%
0%
6%
12%
18%
24%
-30
0
30
60
90
120
1989 1992 1995 1998 2001 2004 2007 2010 2013 2016
Annual growth (Mt - LHS) Annual growth (% - RHS)
China surge
July 24, 2013 Global
Goldman Sachs Global Economics, Commodities and Strategy Research 5
Oversupply shifts the price range downwards
The price cap and cost support have fully converged this year and we expect prices to be
range bound for the duration of our forecast period. The Chinese thermal coal market is
well supplied, cost inflation appears to have come to a halt and demand growth has
moderated. As a result, the price cap set by China has come down to ~$85/t for benchmark
Newcastle coal. On the supply side, the pressure to improve competitiveness and reduce
unit costs, combined with a weaker A$, has reduced our estimate of cost support to $85/t
(vs. $90/t previously).
Cost support and price ceiling converge fully
The price range for seaborne thermal coal prices has been gradually narrowing in recent
months, and we believe the price ceiling set by China and the cost support set by seaborne
suppliers have finally converged at the US$85/t level (on a 6,000kcal/kg NAR, FOB
Newcastle basis). In practice, spot prices can trade below cost support in an oversupplied
market for extended periods of time. On that basis, we expect seaborne thermal coal to
trade slightly below cost support in the short term, and to gradually converge towards the
US$85/t level from 2015 onwards (Exhibit 3).
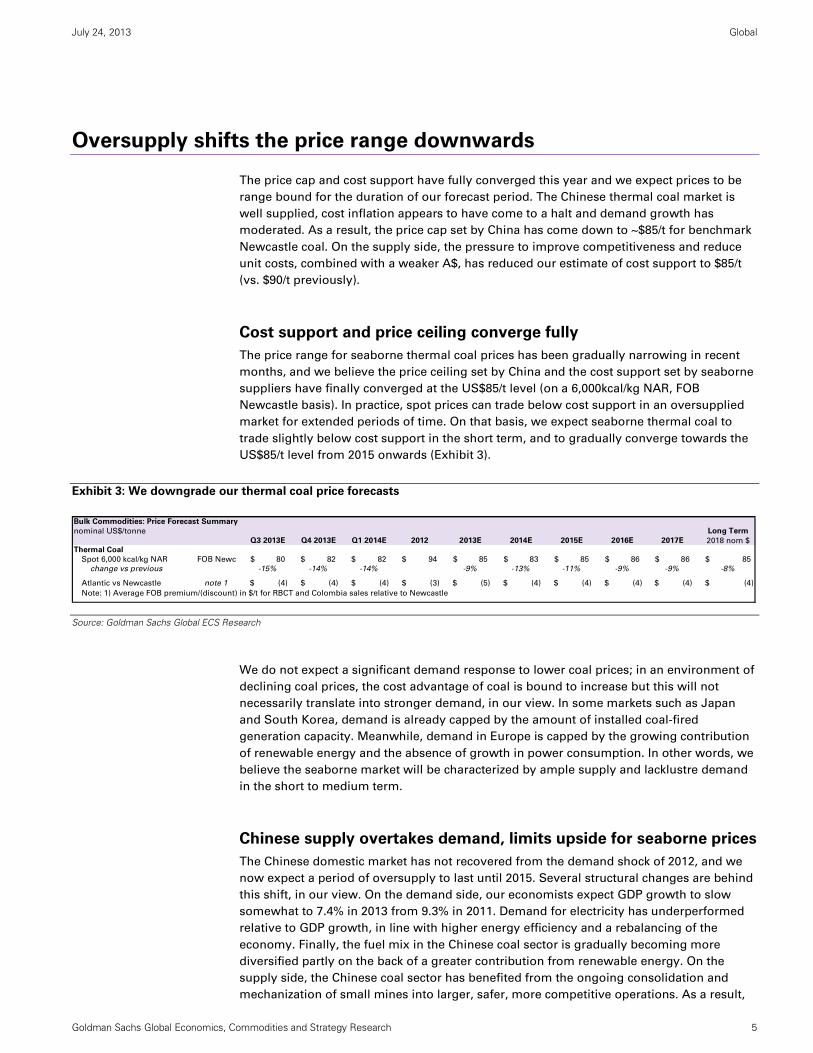
Exhibit 3: We downgrade our thermal coal price forecasts
Source: Goldman Sachs Global ECS Research
We do not expect a significant demand response to lower coal prices; in an environment of
declining coal prices, the cost advantage of coal is bound to increase but this will not
necessarily translate into stronger demand, in our view. In some markets such as Japan
and South Korea, demand is already capped by the amount of installed coal-fired
generation capacity. Meanwhile, demand in Europe is capped by the growing contribution
of renewable energy and the absence of growth in power consumption. In other words, we
believe the seaborne market will be characterized by ample supply and lacklustre demand
in the short to medium term.
Chinese supply overtakes demand, limits upside for seaborne prices
The Chinese domestic market has not recovered from the demand shock of 2012, and we
now expect a period of oversupply to last until 2015. Several structural changes are behind
this shift, in our view. On the demand side, our economists expect GDP growth to slow
somewhat to 7.4% in 2013 from 9.3% in 2011. Demand for electricity has underperformed
relative to GDP growth, in line with higher energy efficiency and a rebalancing of the
economy. Finally, the fuel mix in the Chinese coal sector is gradually becoming more
diversified partly on the back of a greater contribution from renewable energy. On the
supply side, the Chinese coal sector has benefited from the ongoing consolidation and
mechanization of small mines into larger, safer, more competitive operations. As a result,
Bulk Commodities: Price Forecast Summary
nominal US$/tonne Long Term
Q3 2013E Q4 2013E Q1 2014E 2012 2013E 2014E 2015E 2016E 2017E 2018 nom $
Thermal Coal
Spot 6,000 kcal/kg NAR FOB Newc 80$ 82$ 82$ 94$ 85$ 83$ 85$ 86$ 86$ 85$
change vs previous -15% -14% -14% -9% -13% -11% -9% -9% -8%
Atlantic vs Newcastle note 1 (4)$ (4)$ (4)$ (3)$ (5)$ (4)$ (4)$ (4)$ (4)$ (4)$
Note: 1) Average FOB premium/(discount) in $/t for RBCT and Colombia sales relative to Newcastle
July 24, 2013 Global
Goldman Sachs Global Economics, Commodities and Strategy Research 6
the Chinese cost curve has shifted downwards, while the shift into oversupply has led to
the closure of marginal mines and contributed to the easing of rail transportation
bottlenecks.
In summary, the domestic outlook has been transformed in a relatively short period of time
and we expect Chinese production to keep the market well supplied in spite of lower prices.
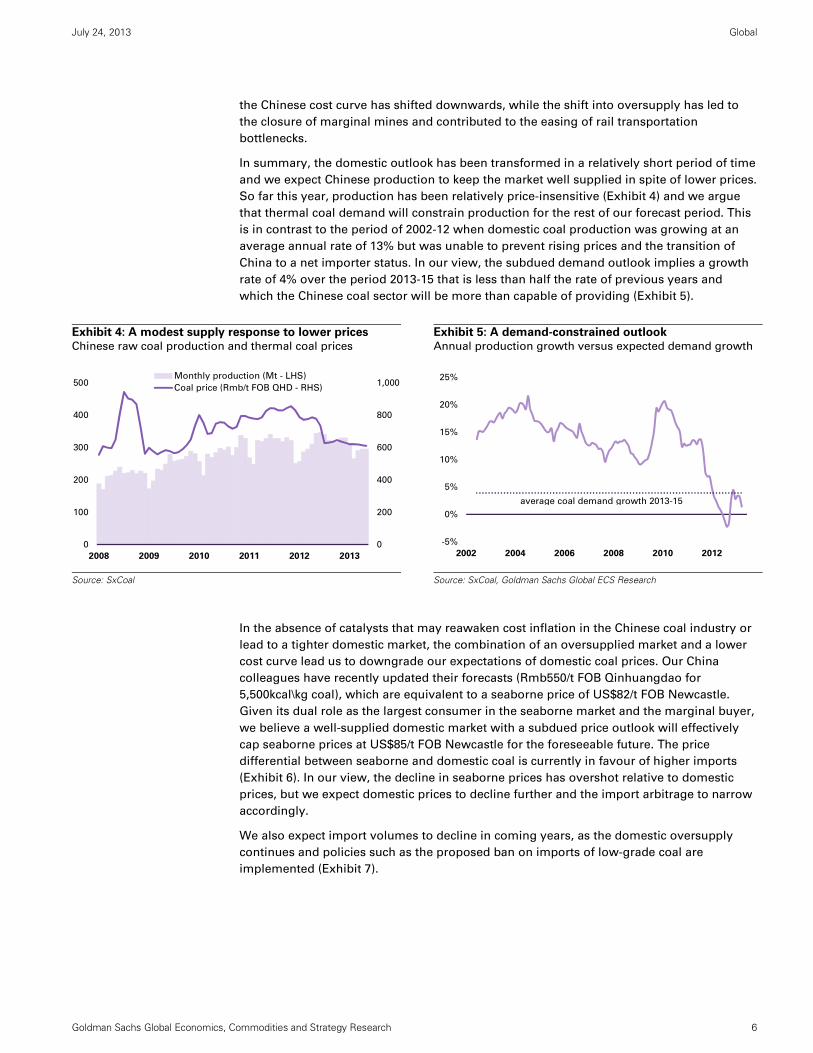
So far this year, production has been relatively price-insensitive (Exhibit 4) and we argue
that thermal coal demand will constrain production for the rest of our forecast period. This
is in contrast to the period of 2002-12 when domestic coal production was growing at an
average annual rate of 13% but was unable to prevent rising prices and the transition of
China to a net importer status. In our view, the subdued demand outlook implies a growth
rate of 4% over the period 2013-15 that is less than half the rate of previous years and
which the Chinese coal sector will be more than capable of providing (Exhibit 5).
Exhibit 4: A modest supply response to lower prices
Chinese raw coal production and thermal coal prices
Exhibit 5: A demand-constrained outlook
Annual production growth versus expected demand growth
Source: SxCoal
Source: SxCoal, Goldman Sachs Global ECS Research
In the absence of catalysts that may reawaken cost inflation in the Chinese coal industry or
lead to a tighter domestic market, the combination of an oversupplied market and a lower
cost curve lead us to downgrade our expectations of domestic coal prices. Our China
colleagues have recently updated their forecasts (Rmb550/t FOB Qinhuangdao for
5,500kcal\kg coal), which are equivalent to a seaborne price of US$82/t FOB Newcastle.
Given its dual role as the largest consumer in the seaborne market and the marginal buyer,
we believe a well-supplied domestic market with a subdued price outlook will effectively
cap seaborne prices at US$85/t FOB Newcastle for the foreseeable future. The price
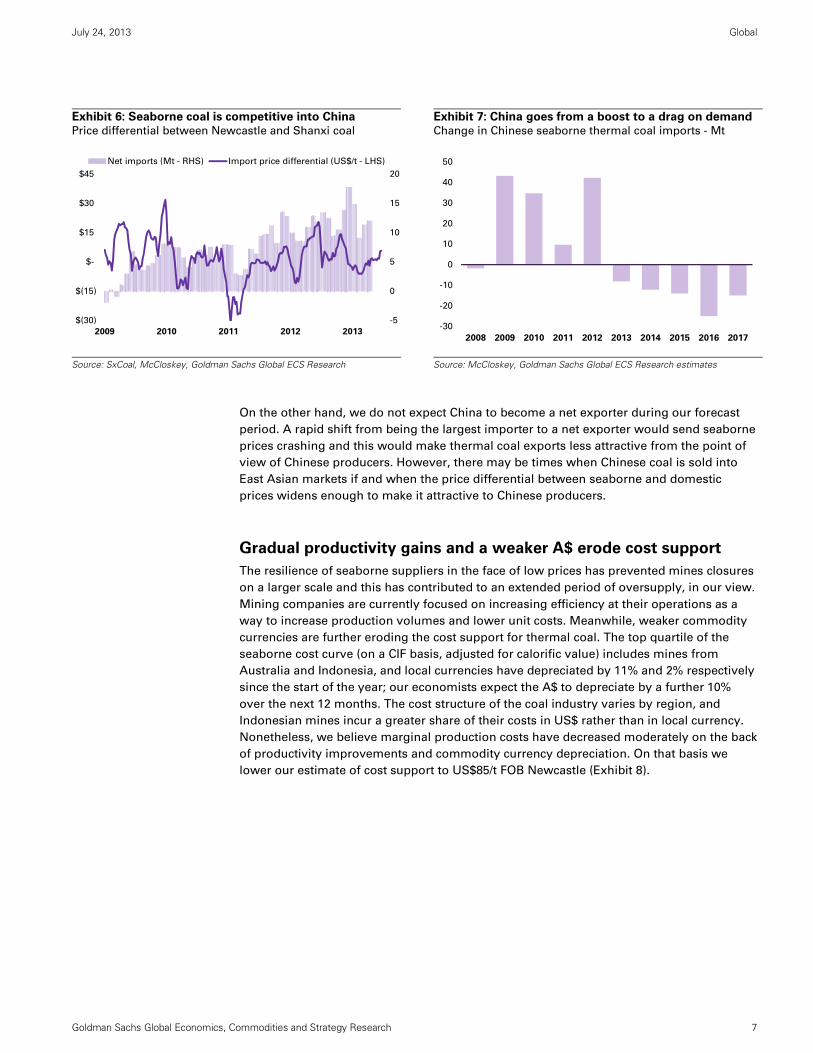
differential between seaborne and domestic coal is currently in favour of higher imports
(Exhibit 6). In our view, the decline in seaborne prices has overshot relative to domestic
prices, but we expect domestic prices to decline further and the import arbitrage to narrow
accordingly.
We also expect import volumes to decline in coming years, as the domestic oversupply
continues and policies such as the proposed ban on imports of low-grade coal are
implemented (Exhibit 7).
0
200
400
600
800
1,000
0
100
200
300
400
500
2008 2009 2010 2011 2012 2013
Monthly production (Mt - LHS)
Coal price (Rmb/t FOB QHD - RHS)
-5%
0%
5%
10%
15%
20%
25%
2002 2004 2006 2008 2010 2012
average coal demand growth 2013-15
July 24, 2013 Global
Goldman Sachs Global Economics, Commodities and Strategy Research 7
Exhibit 6: Seaborne coal is competitive into China
Price differential between Newcastle and Shanxi coal
Exhibit 7: China goes from a boost to a drag on demand
Change in Chinese seaborne thermal coal imports - Mt
Source: SxCoal, McCloskey, Goldman Sachs Global ECS Research
Source: McCloskey, Goldman Sachs Global ECS Research estimates
On the other hand, we do not expect China to become a net exporter during our forecast
period. A rapid shift from being the largest importer to a net exporter would send seaborne
prices crashing and this would make thermal coal exports less attractive from the point of
view of Chinese producers. However, there may be times when Chinese coal is sold into
East Asian markets if and when the price differential between seaborne and domestic
prices widens enough to make it attractive to Chinese producers.
Gradual productivity gains and a weaker A$ erode cost support
The resilience of seaborne suppliers in the face of low prices has prevented mines closures
on a larger scale and this has contributed to an extended period of oversupply, in our view.
Mining companies are currently focused on increasing efficiency at their operations as a
way to increase production volumes and lower unit costs. Meanwhile, weaker commodity
currencies are further eroding the cost support for thermal coal. The top quartile of the
seaborne cost curve (on a CIF basis, adjusted for calorific value) includes mines from
Australia and Indonesia, and local currencies have depreciated by 11% and 2% respectively
since the start of the year; our economists expect the A$ to depreciate by a further 10%
over the next 12 months. The cost structure of the coal industry varies by region, and
Indonesian mines incur a greater share of their costs in US$ rather than in local currency.
Nonetheless, we believe marginal production costs have decreased moderately on the back
of productivity improvements and commodity currency depreciation. On that basis we
lower our estimate of cost support to US$85/t FOB Newcastle (Exhibit 8).
-5
0
5
10
15
20
$(30)
$(15)
$-
$15
$30
$45
2009 2010 2011 2012 2013
Net imports (Mt - RHS) Import price differential (US$/t - LHS)
-30
-20
-10
0
10
20
30
40
50
2008 2009 2010 2011 2012 2013 2014 2015 2016 2017
July 24, 2013 Global
Goldman Sachs Global Economics, Commodities and Strategy Research 8
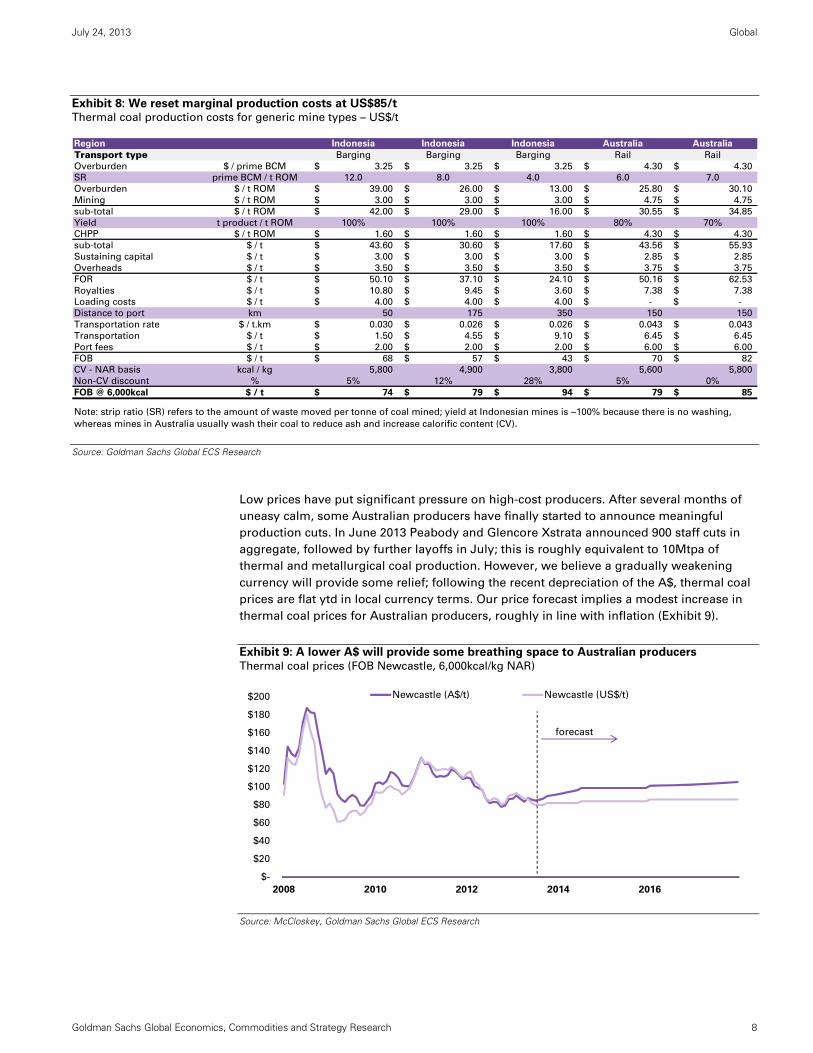
Exhibit 8: We reset marginal production costs at US$85/t Thermal coal production costs for generic mine types – US$/t
Source: Goldman Sachs Global ECS Research
Low prices have put significant pressure on high-cost producers. After several months of
uneasy calm, some Australian producers have finally started to announce meaningful
production cuts. In June 2013 Peabody and Glencore Xstrata announced 900 staff cuts in
aggregate, followed by further layoffs in July; this is roughly equivalent to 10Mtpa of
thermal and metallurgical coal production. However, we believe a gradually weakening
currency will provide some relief; following the recent depreciation of the A$, thermal coal
prices are flat ytd in local currency terms. Our price forecast implies a modest increase in
thermal coal prices for Australian producers, roughly in line with inflation (Exhibit 9).
Exhibit 9: A lower A$ will provide some breathing space to Australian producers
Thermal coal prices (FOB Newcastle, 6,000kcal/kg NAR)
Source: McCloskey, Goldman Sachs Global ECS Research
Region Indonesia Indonesia Indonesia Australia Australia
Transport type Barging Barging Barging Rail Rail
Overburden $ / prime BCM 3.25$ 3.25$ 3.25$ 4.30$ 4.30$
SR prime BCM / t ROM 12.0 8.0 4.0 6.0 7.0
Overburden $ / t ROM 39.00$ 26.00$ 13.00$ 25.80$ 30.10$
Mining $ / t ROM 3.00$ 3.00$ 3.00$ 4.75$ 4.75$
sub-total $ / t ROM 42.00$ 29.00$ 16.00$ 30.55$ 34.85$
Yield t product / t ROM 100% 100% 100% 80% 70%
CHPP $ / t ROM 1.60$ 1.60$ 1.60$ 4.30$ 4.30$
sub-total $ / t 43.60$ 30.60$ 17.60$ 43.56$ 55.93$
Sustaining capital $ / t 3.00$ 3.00$ 3.00$ 2.85$ 2.85$
Overheads $ / t 3.50$ 3.50$ 3.50$ 3.75$ 3.75$
FOR $ / t 50.10$ 37.10$ 24.10$ 50.16$ 62.53$
Royalties $ / t 10.80$ 9.45$ 3.60$ 7.38$ 7.38$
Loading costs $ / t 4.00$ 4.00$ 4.00$ -$ -$
Distance to port km 50 175 350 150 150
Transportation rate $ / t.km 0.030$ 0.026$ 0.026$ 0.043$ 0.043$
Transportation $ / t 1.50$ 4.55$ 9.10$ 6.45$ 6.45$
Port fees $ / t 2.00$ 2.00$ 2.00$ 6.00$ 6.00$
FOB $ / t 68$ 57$ 43$ 70$ 82$
CV - NAR basis kcal / kg 5,800 4,900 3,800 5,600 5,800
Non-CV discount % 5% 12% 28% 5% 0%
FOB @ 6,000kcal $ / t 74$ 79$ 94$ 79$ 85$
Note: strip ratio (SR) refers to the amount of waste moved per tonne of coal mined; yield at Indonesian mines is ~100% because there is no washing,
whereas mines in Australia usually wash their coal to reduce ash and increase calorific content (CV).
$-
$20
$40
$60
$80
$100
$120
$140
$160
$180
$200
2008 2010 2012 2014 2016
Newcastle (A$/t) Newcastle (US$/t)
forecast
July 24, 2013 Global
Goldman Sachs Global Economics, Commodities and Strategy Research 9
Demand has transitioned from high growth to low growth
We believe thermal coal demand growth will slow down in the coming years. The
structural drivers behind its current position atop the global fuel mix (namely the
exceptional growth in Chinese GDP and its reliance on energy-intensive sectors of the
economy) are giving way to a different set of drivers that will undermine further coal
demand, in our view. These drivers include a shift towards greater energy efficiency, the
increasing pressure of environmental regulation and the prospect of cheap gas and the
spread of non-hydro renewable energy. We develop our thesis on each of these structural
drivers in subsequent sections of this report. In this section we highlight the implications of
slower demand on coal prices, and argue that the potential for profitable investments in
new thermal coal mining capacity is becoming increasingly limited.
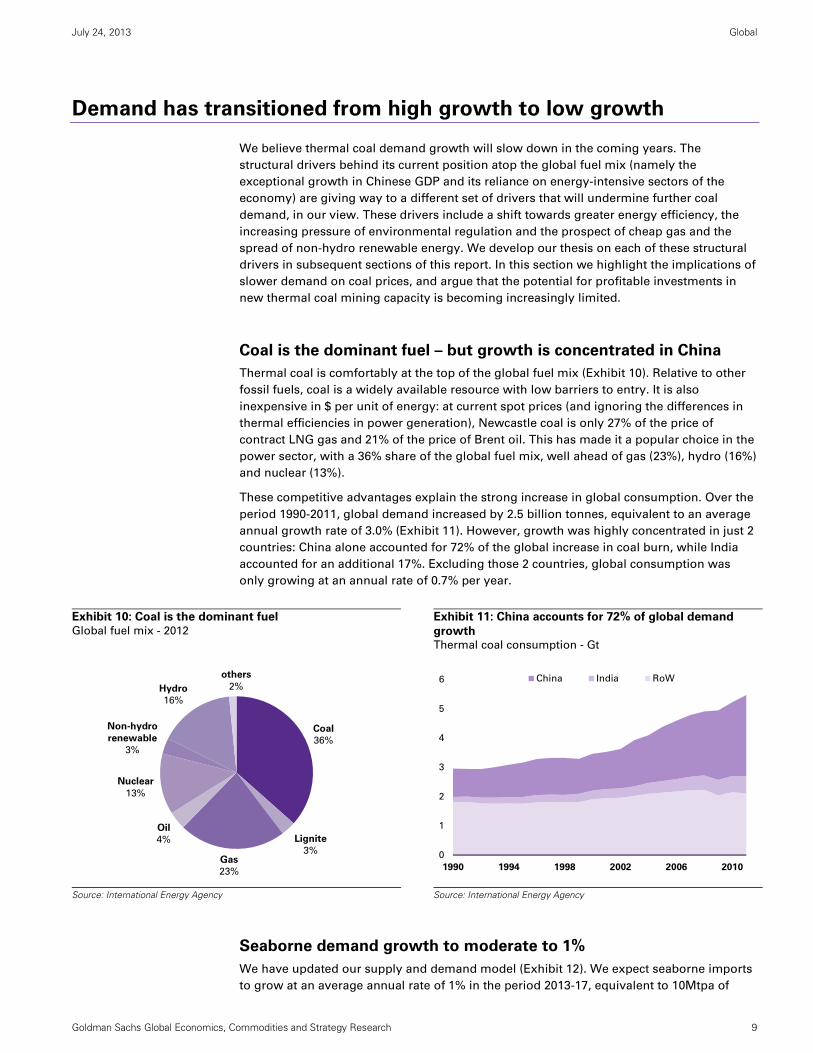
Coal is the dominant fuel – but growth is concentrated in China
Thermal coal is comfortably at the top of the global fuel mix (Exhibit 10). Relative to other
fossil fuels, coal is a widely available resource with low barriers to entry. It is also
inexpensive in $ per unit of energy: at current spot prices (and ignoring the differences in
thermal efficiencies in power generation), Newcastle coal is only 27% of the price of
contract LNG gas and 21% of the price of Brent oil. This has made it a popular choice in the
power sector, with a 36% share of the global fuel mix, well ahead of gas (23%), hydro (16%)
and nuclear (13%).
These competitive advantages explain the strong increase in global consumption. Over the
period 1990-2011, global demand increased by 2.5 billion tonnes, equivalent to an average
annual growth rate of 3.0% (Exhibit 11). However, growth was highly concentrated in just 2
countries: China alone accounted for 72% of the global increase in coal burn, while India
accounted for an additional 17%. Excluding those 2 countries, global consumption was
only growing at an annual rate of 0.7% per year.
Exhibit 10: Coal is the dominant fuel
Global fuel mix - 2012
Exhibit 11: China accounts for 72% of global demand
growth Thermal coal consumption - Gt
Source: International Energy Agency
Source: International Energy Agency
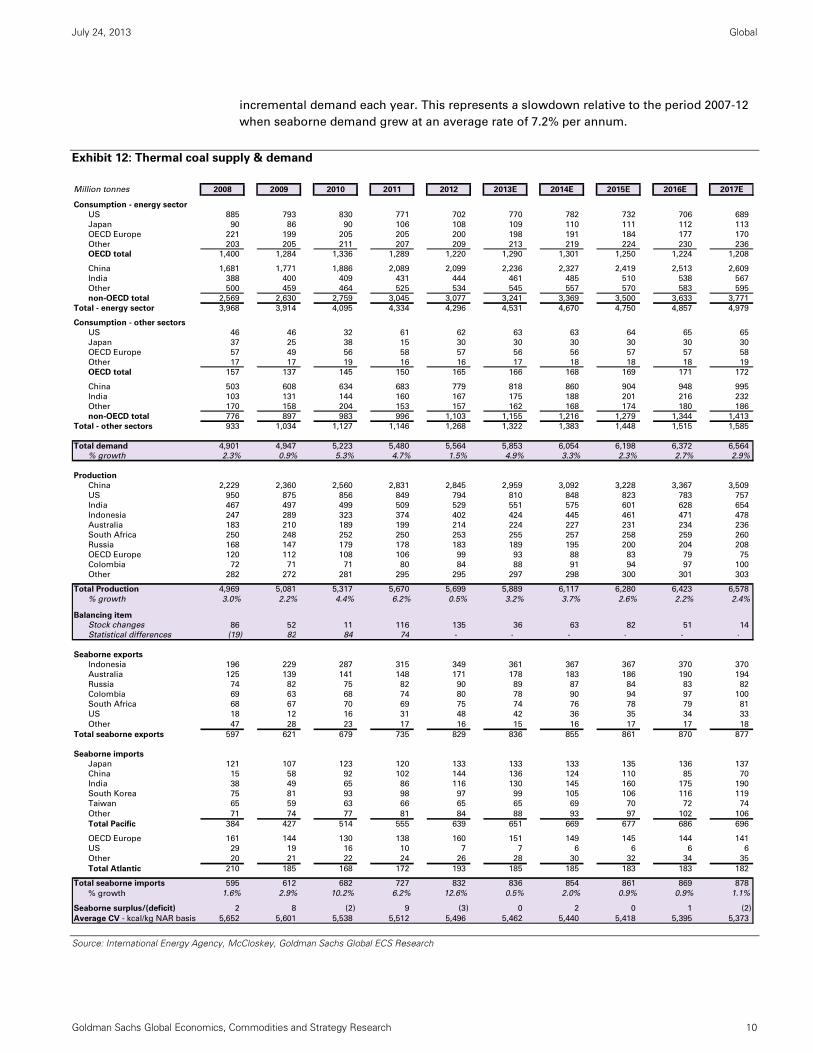
Seaborne demand growth to moderate to 1%
We have updated our supply and demand model (Exhibit 12). We expect seaborne imports
to grow at an average annual rate of 1% in the period 2013-17, equivalent to 10Mtpa of
Coal
36%
Lignite
3%Gas
23%
Oil
4%
Nuclear
13%
Non-hydro
renewable
3%
Hydro
16%
others
2%
0
1
2
3
4
5
6
1990 1994 1998 2002 2006 2010
China India RoW
July 24, 2013 Global
Goldman Sachs Global Economics, Commodities and Strategy Research 10
incremental demand each year. This represents a slowdown relative to the period 2007-12
when seaborne demand grew at an average rate of 7.2% per annum.
Exhibit 12: Thermal coal supply & demand
Source: International Energy Agency, McCloskey, Goldman Sachs Global ECS Research
Million tonnes 2008 2009 2010 2011 2012 2013E 2014E 2015E 2016E 2017E
Consumption - energy sector
US 885 793 830 771 702 770 782 732 706 689
Japan 90 86 90 106 108 109 110 111 112 113
OECD Europe 221 199 205 205 200 198 191 184 177 170
Other 203 205 211 207 209 213 219 224 230 236
OECD total 1,400 1,284 1,336 1,289 1,220 1,290 1,301 1,250 1,224 1,208
China 1,681 1,771 1,886 2,089 2,099 2,236 2,327 2,419 2,513 2,609
India 388 400 409 431 444 461 485 510 538 567
Other 500 459 464 525 534 545 557 570 583 595
non-OECD total 2,569 2,630 2,759 3,045 3,077 3,241 3,369 3,500 3,633 3,771
Total - energy sector 3,968 3,914 4,095 4,334 4,296 4,531 4,670 4,750 4,857 4,979
Consumption - other sectors
US 46 46 32 61 62 63 63 64 65 65
Japan 37 25 38 15 30 30 30 30 30 30
OECD Europe 57 49 56 58 57 56 56 57 57 58
Other 17 17 19 16 16 17 18 18 18 19
OECD total 157 137 145 150 165 166 168 169 171 172
China 503 608 634 683 779 818 860 904 948 995
India 103 131 144 160 167 175 188 201 216 232
Other 170 158 204 153 157 162 168 174 180 186
non-OECD total 776 897 983 996 1,103 1,155 1,216 1,279 1,344 1,413
Total - other sectors 933 1,034 1,127 1,146 1,268 1,322 1,383 1,448 1,515 1,585
Total demand 4,901 4,947 5,223 5,480 5,564 5,853 6,054 6,198 6,372 6,564
% growth 2.3% 0.9% 5.3% 4.7% 1.5% 4.9% 3.3% 2.3% 2.7% 2.9%
Production
China 2,229 2,360 2,560 2,831 2,845 2,959 3,092 3,228 3,367 3,509
US 950 875 856 849 794 810 848 823 783 757
India 467 497 499 509 529 551 575 601 628 654
Indonesia 247 289 323 374 402 424 445 461 471 478
Australia 183 210 189 199 214 224 227 231 234 236
South Africa 250 248 252 250 253 255 257 258 259 260
Russia 168 147 179 178 183 189 195 200 204 208
OECD Europe 120 112 108 106 99 93 88 83 79 75
Colombia 72 71 71 80 84 88 91 94 97 100
Other 282 272 281 295 295 297 298 300 301 303
Total Production 4,969 5,081 5,317 5,670 5,699 5,889 6,117 6,280 6,423 6,578
% growth 3.0% 2.2% 4.4% 6.2% 0.5% 3.2% 3.7% 2.6% 2.2% 2.4%
Balancing item
Stock changes 86 52 11 116 135 36 63 82 51 14
Statistical differences (19) 82 84 74 - - - - - -
Seaborne exports
Indonesia 196 229 287 315 349 361 367 367 370 370
Australia 125 139 141 148 171 178 183 186 190 194
Russia 74 82 75 82 90 89 87 84 83 82
Colombia 69 63 68 74 80 78 90 94 97 100
South Africa 68 67 70 69 75 74 76 78 79 81
US 18 12 16 31 48 42 36 35 34 33
Other 47 28 23 17 16 15 16 17 17 18
Total seaborne exports 597 621 679 735 829 836 855 861 870 877
Seaborne imports
Japan 121 107 123 120 133 133 133 135 136 137
China 15 58 92 102 144 136 124 110 85 70
India 38 49 65 86 116 130 145 160 175 190
South Korea 75 81 93 98 97 99 105 106 116 119
Taiwan 65 59 63 66 65 65 69 70 72 74
Other 71 74 77 81 84 88 93 97 102 106
Total Pacific 384 427 514 555 639 651 669 677 686 696
OECD Europe 161 144 130 138 160 151 149 145 144 141
US 29 19 16 10 7 7 6 6 6 6
Other 20 21 22 24 26 28 30 32 34 35
Total Atlantic 210 185 168 172 193 185 185 183 183 182
Total seaborne imports 595 612 682 727 832 836 854 861 869 878
% growth 1.6% 2.9% 10.2% 6.2% 12.6% 0.5% 2.0% 0.9% 0.9% 1.1%
Seaborne surplus/(deficit) 2 8 (2) 9 (3) 0 2 0 1 (2)
Average CV - kcal/kg NAR basis 5,652 5,601 5,538 5,512 5,496 5,462 5,440 5,418 5,395 5,373
July 24, 2013 Global
Goldman Sachs Global Economics, Commodities and Strategy Research 11
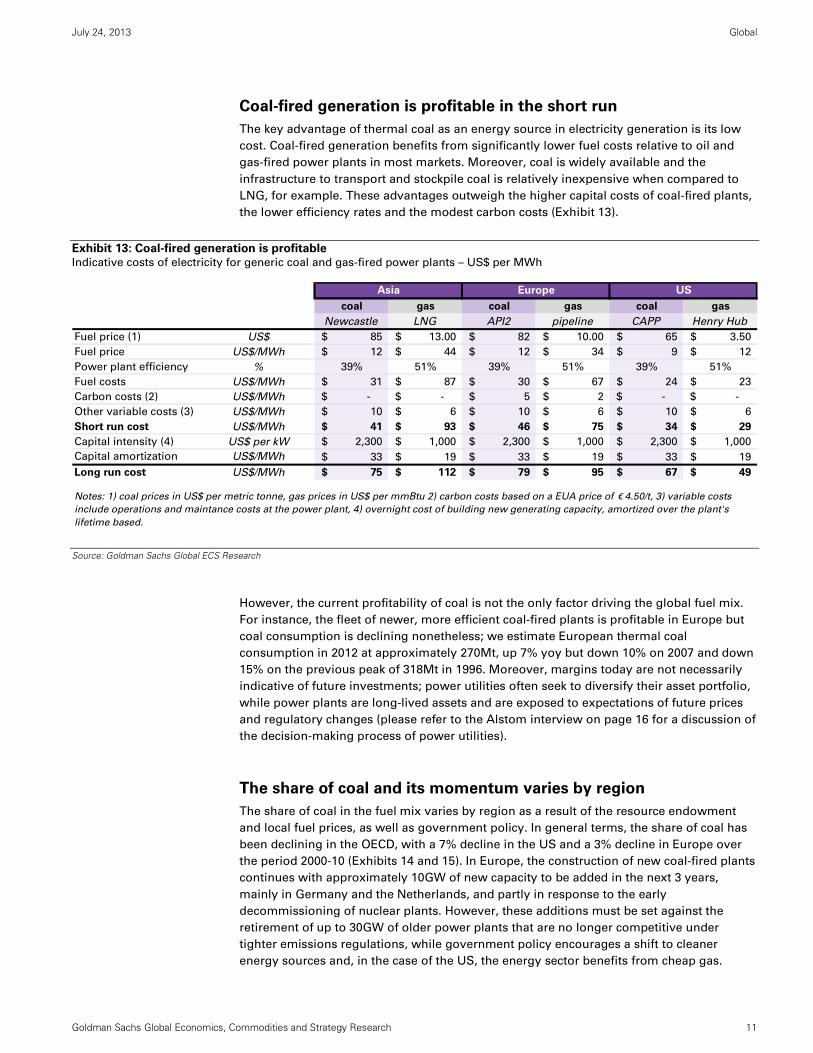
Coal-fired generation is profitable in the short run
The key advantage of thermal coal as an energy source in electricity generation is its low
cost. Coal-fired generation benefits from significantly lower fuel costs relative to oil and
gas-fired power plants in most markets. Moreover, coal is widely available and the
infrastructure to transport and stockpile coal is relatively inexpensive when compared to
LNG, for example. These advantages outweigh the higher capital costs of coal-fired plants,
the lower efficiency rates and the modest carbon costs (Exhibit 13).
Exhibit 13: Coal-fired generation is profitable
Indicative costs of electricity for generic coal and gas-fired power plants – US$ per MWh
Source: Goldman Sachs Global ECS Research
However, the current profitability of coal is not the only factor driving the global fuel mix.
For instance, the fleet of newer, more efficient coal-fired plants is profitable in Europe but
coal consumption is declining nonetheless; we estimate European thermal coal
consumption in 2012 at approximately 270Mt, up 7% yoy but down 10% on 2007 and down
15% on the previous peak of 318Mt in 1996. Moreover, margins today are not necessarily
indicative of future investments; power utilities often seek to diversify their asset portfolio,
while power plants are long-lived assets and are exposed to expectations of future prices
and regulatory changes (please refer to the Alstom interview on page 16 for a discussion of
the decision-making process of power utilities).
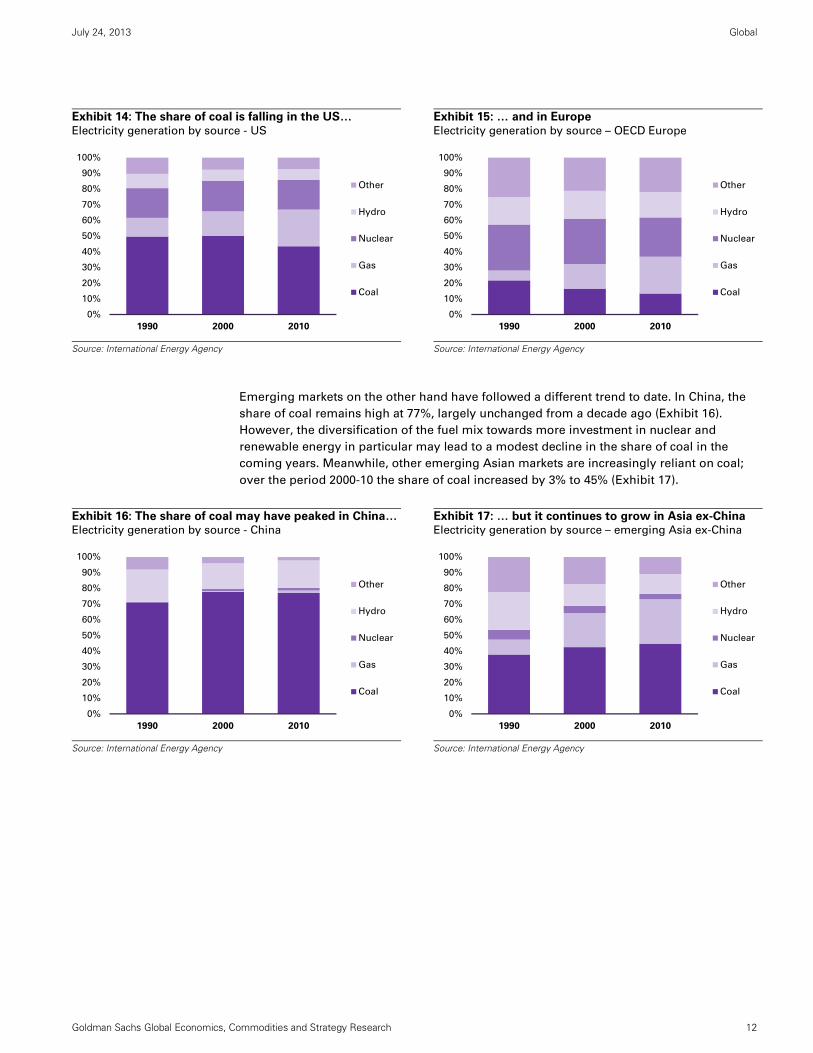
The share of coal and its momentum varies by region
The share of coal in the fuel mix varies by region as a result of the resource endowment
and local fuel prices, as well as government policy. In general terms, the share of coal has
been declining in the OECD, with a 7% decline in the US and a 3% decline in Europe over
the period 2000-10 (Exhibits 14 and 15). In Europe, the construction of new coal-fired plants
continues with approximately 10GW of new capacity to be added in the next 3 years,
mainly in Germany and the Netherlands, and partly in response to the early
decommissioning of nuclear plants. However, these additions must be set against the
retirement of up to 30GW of older power plants that are no longer competitive under
tighter emissions regulations, while government policy encourages a shift to cleaner
energy sources and, in the case of the US, the energy sector benefits from cheap gas.
coal gas coal gas coal gas
Newcastle LNG API2 pipeline CAPP Henry Hub
Fuel price (1) US$ 85$ 13.00$ 82$ 10.00$ 65$ 3.50$
Fuel price US$/MWh 12$ 44$ 12$ 34$ 9$ 12$
Power plant efficiency % 39% 51% 39% 51% 39% 51%
Fuel costs US$/MWh 31$ 87$ 30$ 67$ 24$ 23$
Carbon costs (2) US$/MWh -$ -$ 5$ 2$ -$ -$
Other variable costs (3) US$/MWh 10$ 6$ 10$ 6$ 10$ 6$
Short run cost US$/MWh 41$ 93$ 46$ 75$ 34$ 29$
Capital intensity (4) US$ per kW 2,300$ 1,000$ 2,300$ 1,000$ 2,300$ 1,000$
Capital amortization US$/MWh 33$ 19$ 33$ 19$ 33$ 19$
Long run cost US$/MWh 75$ 112$ 79$ 95$ 67$ 49$
Asia Europe US
Notes: 1) coal prices in US$ per metric tonne, gas prices in US$ per mmBtu 2) carbon costs based on a EUA price of € 4.50/t, 3) variable costs
include operations and maintance costs at the power plant, 4) overnight cost of building new generating capacity, amortized over the plant's
lifetime based.
July 24, 2013 Global
Goldman Sachs Global Economics, Commodities and Strategy Research 12
Exhibit 14: The share of coal is falling in the US…
Electricity generation by source - US
Exhibit 15: … and in Europe
Electricity generation by source – OECD Europe
Source: International Energy Agency
Source: International Energy Agency
Emerging markets on the other hand have followed a different trend to date. In China, the
share of coal remains high at 77%, largely unchanged from a decade ago (Exhibit 16).
However, the diversification of the fuel mix towards more investment in nuclear and
renewable energy in particular may lead to a modest decline in the share of coal in the
coming years. Meanwhile, other emerging Asian markets are increasingly reliant on coal;
over the period 2000-10 the share of coal increased by 3% to 45% (Exhibit 17).
Exhibit 16: The share of coal may have peaked in China…Electricity generation by source - China
Exhibit 17: … but it continues to grow in Asia ex-China Electricity generation by source – emerging Asia ex-China
Source: International Energy Agency
Source: International Energy Agency
0%
10%
20%
30%
40%
50%
60%
70%
80%
90%
100%
1990 2000 2010
Other
Hydro
Nuclear
Gas
Coal
0%
10%
20%
30%
40%
50%
60%
70%
80%
90%
100%
1990 2000 2010
Other
Hydro
Nuclear
Gas
Coal
0%
10%
20%
30%
40%
50%
60%
70%
80%
90%
100%
1990 2000 2010
Other
Hydro
Nuclear
Gas
Coal
0%
10%
20%
30%
40%
50%
60%
70%
80%
90%
100%
1990 2000 2010
Other
Hydro
Nuclear
Gas
Coal
July 24, 2013 Global
Goldman Sachs Global Economics, Commodities and Strategy Research 13
The viability of growth projects is being eroded
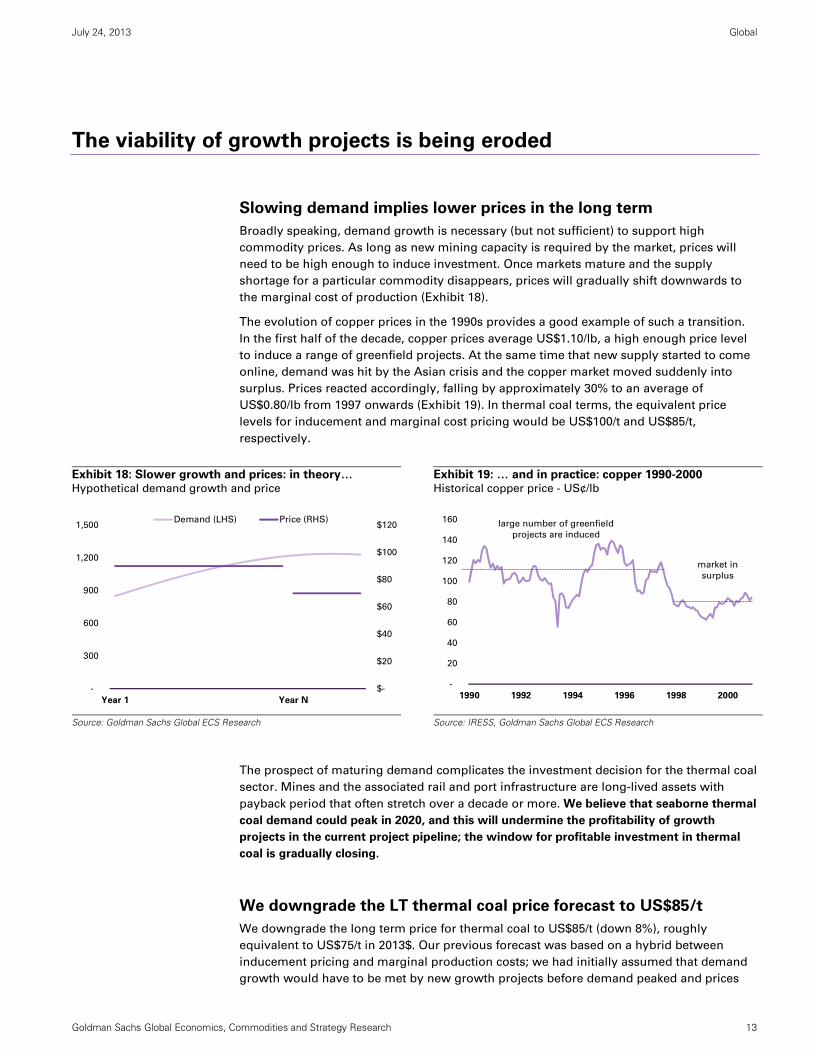
Slowing demand implies lower prices in the long term
Broadly speaking, demand growth is necessary (but not sufficient) to support high
commodity prices. As long as new mining capacity is required by the market, prices will
need to be high enough to induce investment. Once markets mature and the supply
shortage for a particular commodity disappears, prices will gradually shift downwards to
the marginal cost of production (Exhibit 18).
The evolution of copper prices in the 1990s provides a good example of such a transition.
In the first half of the decade, copper prices average US$1.10/lb, a high enough price level
to induce a range of greenfield projects. At the same time that new supply started to come
online, demand was hit by the Asian crisis and the copper market moved suddenly into
surplus. Prices reacted accordingly, falling by approximately 30% to an average of
US$0.80/lb from 1997 onwards (Exhibit 19). In thermal coal terms, the equivalent price
levels for inducement and marginal cost pricing would be US$100/t and US$85/t,
respectively.
Exhibit 18: Slower growth and prices: in theory… Hypothetical demand growth and price
Exhibit 19: … and in practice: copper 1990-2000 Historical copper price - US¢/lb
Source: Goldman Sachs Global ECS Research
Source: IRESS, Goldman Sachs Global ECS Research
The prospect of maturing demand complicates the investment decision for the thermal coal
sector. Mines and the associated rail and port infrastructure are long-lived assets with
payback period that often stretch over a decade or more. We believe that seaborne thermal
coal demand could peak in 2020, and this will undermine the profitability of growth
projects in the current project pipeline; the window for profitable investment in thermal
coal is gradually closing.
We downgrade the LT thermal coal price forecast to US$85/t
We downgrade the long term price for thermal coal to US$85/t (down 8%), roughly
equivalent to US$75/t in 2013$. Our previous forecast was based on a hybrid between
inducement pricing and marginal production costs; we had initially assumed that demand
growth would have to be met by new growth projects before demand peaked and prices
$-
$20
$40
$60
$80
$100
$120
-
300
600
900
1,200
1,500
Year 1 Year N
Demand (LHS) Price (RHS)
-
20
40
60
80
100
120
140
160
1990 1992 1994 1996 1998 2000
large number of greenfield
projects are induced
market in
surplus
July 24, 2013 Global
Goldman Sachs Global Economics, Commodities and Strategy Research 14
fell to marginal production costs. In our view, the outlook has changed and we adjust our
forecast to reflect our assessment of long term marginal production costs (Exhibit 20).
Exhibit 20: We reset the long term price to a marginal production cost level
Methodology behind long term price forecasts – bulk commodities under GS coverage
Source: Goldman Sachs Global ECS Research
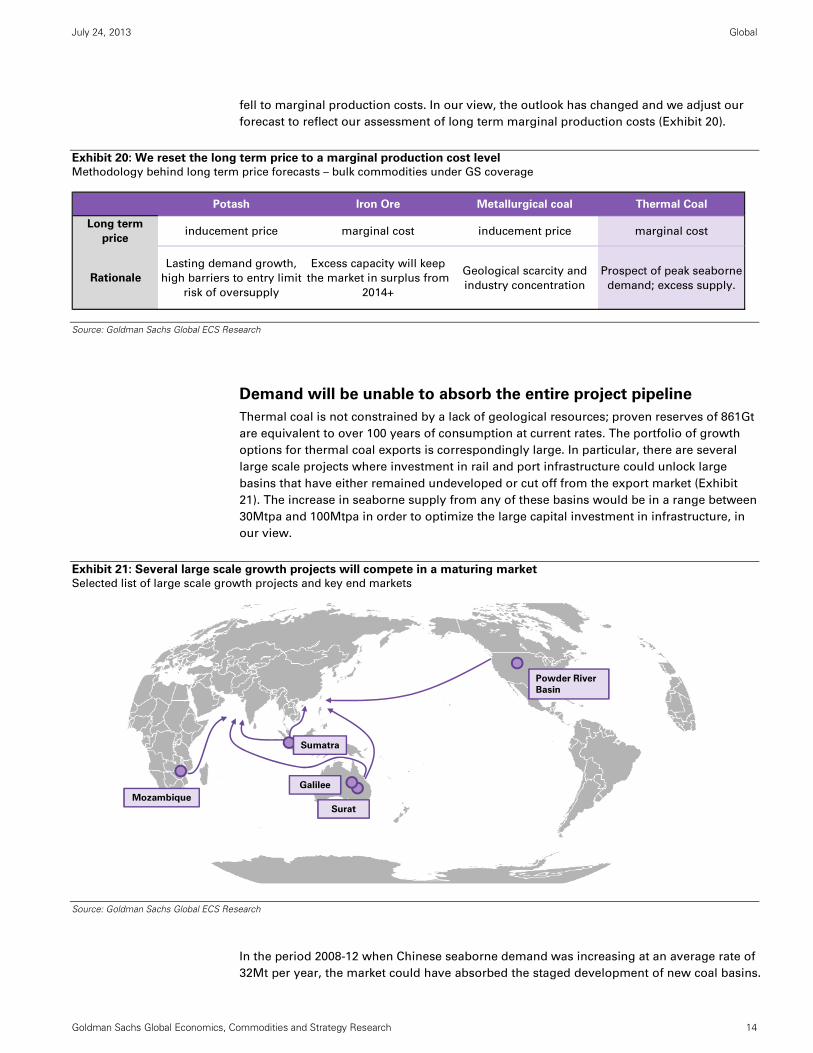
Demand will be unable to absorb the entire project pipeline
Thermal coal is not constrained by a lack of geological resources; proven reserves of 861Gt
are equivalent to over 100 years of consumption at current rates. The portfolio of growth
options for thermal coal exports is correspondingly large. In particular, there are several
large scale projects where investment in rail and port infrastructure could unlock large
basins that have either remained undeveloped or cut off from the export market (Exhibit
21). The increase in seaborne supply from any of these basins would be in a range between
30Mtpa and 100Mtpa in order to optimize the large capital investment in infrastructure, in
our view.
Exhibit 21: Several large scale growth projects will compete in a maturing market
Selected list of large scale growth projects and key end markets
Source: Goldman Sachs Global ECS Research
In the period 2008-12 when Chinese seaborne demand was increasing at an average rate of
32Mt per year, the market could have absorbed the staged development of new coal basins.
Potash Iron Ore Metallurgical coal Thermal Coal
Long term
priceinducement price marginal cost inducement price marginal cost
Rationale
Lasting demand growth,
high barriers to entry limit
risk of oversupply
Excess capacity will keep
the market in surplus from
2014+
Geological scarcity and
industry concentration
Prospect of peak seaborne
demand; excess supply.
Powder River
Basin
Surat
Galilee
Mozambique
Sumatra
July 24, 2013 Global
Goldman Sachs Global Economics, Commodities and Strategy Research 15
However, in an environment of slowing growth, large scale projects can push the market
into oversupply once they are added to the range of brownfield expansions.
Cost remains a key differentiating factor – but so is timing
Against a background of lower investment on the one hand and a more challenging
demand environment on the other, we expect greater competition for capital among
thermal coal growth projects in the years ahead. The projects that deliver positive returns
will not only have to be competitive in terms of capital intensity and operating costs; timing
will also be crucial, in our view. We illustrate this point by comparing two hypothetical
projects with the following characteristics:
Production capacity of 10Mpta with a 3-year ramp-up period, equivalent to a mid-
sized opencast mine.
Capital intensity of US$125 per tonne of installed capacity, in line with a typical
owner-operated opencast mine with modest infrastructure requirements.
Production costs of US$65/t on an FOB basis, inclusive of sustaining capital,
adjusted to a benchmark calorific value of 6,000kcal/kg NAR. This would place the
project approximately in the 2nd quartile of the current industry cost curve.
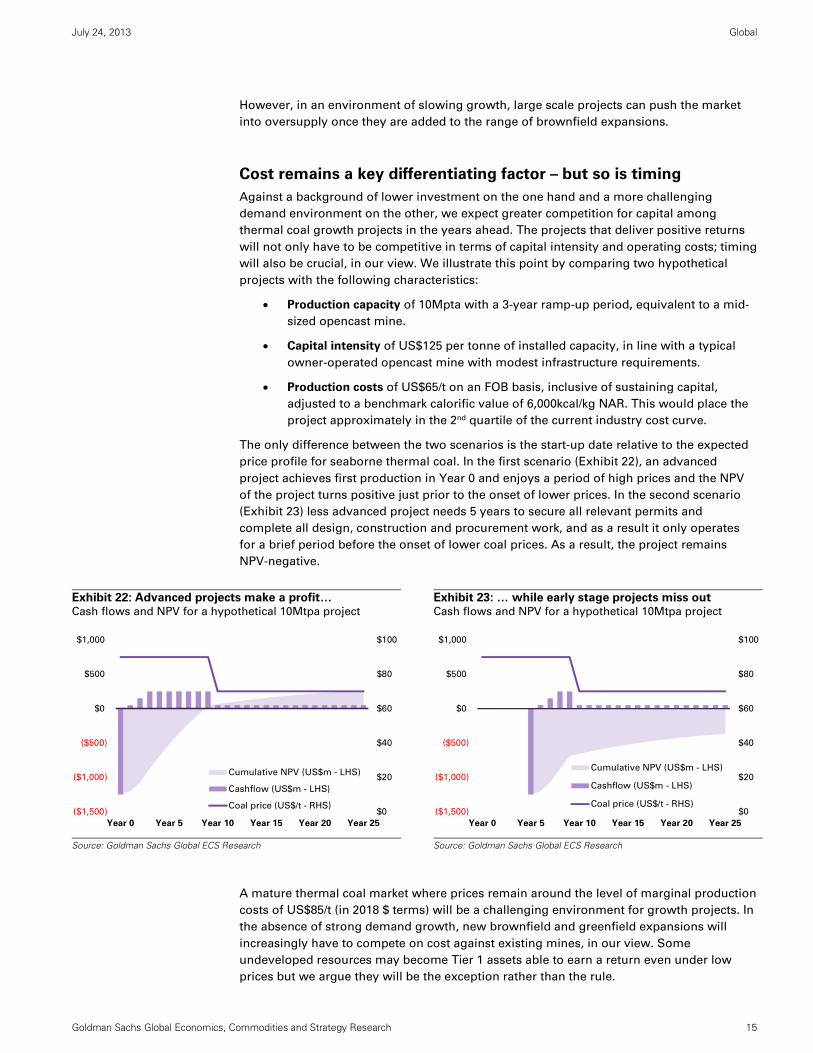
The only difference between the two scenarios is the start-up date relative to the expected
price profile for seaborne thermal coal. In the first scenario (Exhibit 22), an advanced
project achieves first production in Year 0 and enjoys a period of high prices and the NPV
of the project turns positive just prior to the onset of lower prices. In the second scenario
(Exhibit 23) less advanced project needs 5 years to secure all relevant permits and
complete all design, construction and procurement work, and as a result it only operates
for a brief period before the onset of lower coal prices. As a result, the project remains
NPV-negative.
Exhibit 22: Advanced projects make a profit… Cash flows and NPV for a hypothetical 10Mtpa project
Exhibit 23: … while early stage projects miss out Cash flows and NPV for a hypothetical 10Mtpa project
Source: Goldman Sachs Global ECS Research
Source: Goldman Sachs Global ECS Research
A mature thermal coal market where prices remain around the level of marginal production
costs of US$85/t (in 2018 $ terms) will be a challenging environment for growth projects. In
the absence of strong demand growth, new brownfield and greenfield expansions will
increasingly have to compete on cost against existing mines, in our view. Some
undeveloped resources may become Tier 1 assets able to earn a return even under low
prices but we argue they will be the exception rather than the rule.
$0
$20
$40
$60
$80
$100
($1,500)
($1,000)
($500)
$0
$500
$1,000
Year 0 Year 5 Year 10 Year 15 Year 20 Year 25
Cumulative NPV (US$m - LHS)
Cashflow (US$m - LHS)
Coal price (US$/t - RHS)$0
$20
$40
$60
$80
$100
($1,500)
($1,000)
($500)
$0
$500
$1,000
Year 0 Year 5 Year 10 Year 15 Year 20 Year 25
Cumulative NPV (US$m - LHS)
Cashflow (US$m - LHS)
Coal price (US$/t - RHS)
July 24, 2013 Global
Goldman Sachs Global Economics, Commodities and Strategy Research 16
Insights from an equipment manufacturer: Alstom interview
We interview Mr. Wouter van Wersch, Senior VP Sales and Marketing Asia Pacific of
Alstom Power and President of Alstom Singapore. Alstom has annual sales of over €20
billion, with 93,500 employees in 100 countries and is active in the power generation sector
across the entire energy spectrum, from conventional thermal (coal, gas and oil) to
renewable (hydro, wind and solar) and nuclear energy.
Equipment manufacturers are directly involved in the decision-making process of power
utilities and are thus ideally placed to comment on the future trends in the power sector
which accounts for ~80% of global thermal coal demand. The key insights we take away are
1) even when carbon prices are low or non-existent, the downside risks of future
regulation can offset the cost advantage of thermal coal relative to alternative energy
sources, 2) demand for coal-fired generation remains strong in India and southeast Asia
but the number of new plants is expected to decline by the end of the decade and 3) the
energy sources with the most upside potential include gas and solar power.
The views stated herein are those of the interviewee and do not necessarily reflect those of
Goldman Sachs.
Christian Lelong: The profitability of existing power plants is determined by the power
tariff and the fuel costs of the day. However, power generation assets can have a lifetime of
40 years or more. What can you tell us about the way in which power companies think
about the decision to invest in one energy source over another?
Wouter van Wersch: We find that our customers, the power companies, have the objective
of building and then operating a generating portfolio that is properly diversified in terms of
technology and fuel-mix for their respective markets. Such a strategy results in them
managing a power system that is balanced in terms of meeting reliability standards, but
also allows them to be sufficiently hedged to achieve satisfactory operating margins, as
well as complying with environmental rules and regulations. Therefore, power companies
not only will be looking to add generating assets that are the most efficient and lowest-cost,
but also to develop a group of plants that best matches a desired risk profile over an
extended period. Thanks to its broad portfolio, Alstom can provide the power companies
with the optimum solution answering their new power plant requirements, and besides
this, we can help them to keep their assets efficient during their lifetime, thanks to our
extensive range of optimization services.
Christian Lelong: Following the Doha conference, the likelihood of a globally binding
agreement appears remote. Instead we are seeing climate change regulation at the
national level across both OECD and emerging economies. How sensitive are policy
makers in Asia to reducing carbon emissions?
Wouter van Wersch: In my view policy makers in Asia are very sensitive about carbon
emissions and are considering plans to curb those emissions. However, they must follow a
different model than OECD countries. Emerging markets in Asia also must effectively deal
with sustained growth in electricity demand, which is not the case in most OECD countries.
Therefore, renewable or CO2-free energy resources in Asia such as hydro, wind, solar and
geothermal, must be developed in tandem with more conventional sources that use fossil
fuels. Electricity demand is expanding rapidly in Asia, due to strong economic growth and
a need to bring electricity to a large number of people who are without it today. That
means there is a pressing need to build large amounts of generating capacity very quickly.
While renewable sources, which have a much lower emissions profile, are available and
July 24, 2013 Global
Goldman Sachs Global Economics, Commodities and Strategy Research 17
can contribute to this effort, they have yet to be crafted at the proper scale to meet the
urgent need for electric power throughout Asia. Policies to control, or limit carbon
emissions will be instituted, but they must be consistent with a model based upon meeting
growing demand.
Christian Lelong: The current price of CO2 emission permits in countries that have
introduced a carbon price is considered too low to have a material impact on power
generation. What assumptions do power utilities make about future carbon prices in their
financial models when assessing which type of power plant to build?
Wouter van Wersch: When planning to build new generating capacity we have seen that
our power company customers definitely consider current and future costs for CO2
emissions. Those considerations can take two forms. First, whether they plan to only build
CO2-free sources of power and avoid any and all CO2 costs in the future, or second, whether
they insert a specific cost in economic evaluations to cover CO2 emissions from the
generating asset to be built. As you say, current prices for CO2 emission credits in regions
where such markets are active appear to be too low to influence company decisions.
However, concerns over future costs are sufficient to sway a broader, long-term strategy
among those same companies. For example, in Europe the levelized cost of building a new
coal-fired power plant are more attractive today than building a gas-fired plant (due in part
to low CO2 prices), yet power companies are still more likely to build a gas plant due to
concerns over potential costs associated with CO2 emissions over the long-term.
Christian Lelong: Before moving to Asia you spent several years covering the European
market. Is there a difference in the way your European clients think about the fuel mix
relative to your clients in China, India, Japan and others Asian markets?
Wouter van Wersch: Absolutely there is a difference. In Asia there is a much stronger
preference to use fossil fuels today, especially coal and natural gas. Both of those fuels are
available throughout the region, and when used with highly efficient combustion
technologies, become an effective way to add capacity. To better understand the
difference, I point back to my earlier response that Asian markets must consider strong
growth in power demand when considering fuel mix. In Europe there is no growth today,
and since there are mandates to increase renewable energy, plants using fossil fuels
generally are not being considered. At the same time, I should note that prior to the 2009
economic slowdown, or when electricity demand was growing in Europe, I sold new coal-
and gas-fired power plants to customers in Germany, the Netherlands and the United
Kingdom.
Christian Lelong: What changes have you noticed in the past few years regarding the fuel
mix of new generating capacity in the markets you operate in – has there been a switch
from one energy source to another?
Wouter van Wersch: Following up on my response to the preceding question, there has
been a broad shift away from fossil fuels to renewable sources for new capacity builds.
However, any shifts are very sensitive to regional trends. For example, while China has
been very active in adding more hydro and wind capacity, coal still is a mainstay, and is
now being accompanied by a surge in demand for gas turbines. Once more, power
companies in Malaysia, Indonesia and Vietnam that have for years relied heavily upon
natural gas and oil, are now turning more to coal to meet rising energy needs. Those
trends are likely to shift again in the future, but if I had to bet, I would expect to see an
expanding role for generating capacity that uses natural gas. New discoveries of natural
gas, especially that involving shale, are changing the business in ways not fully seen as yet.
Christian Lelong: And what changes would you expect in the next 5 years in the way that
power utilities will allocate their capex spending?
July 24, 2013 Global
Goldman Sachs Global Economics, Commodities and Strategy Research 18
Wouter van Wersch: The key to answering your question is the 5 year term. As you
mentioned in your first question, power plants can have a 40-year life or more. Therefore,
when considering only 5 years, my view is that most power companies are unlikely to be
making any major or sudden change to the trends we see today. In growth markets like
Asia, we will continue to see capex allocated to support new plant builds and to add
emission control equipment. For non-growth markets, especially in Europe, capex likely
will go to transmission or distribution projects, aimed at improving delivery and making
systems more efficient.
Christian Lelong: Regarding energy efficiency and smart grids, what measures are
countries implementing and how does it affect the fuel mix?
Wouter van Wersch: Your question is very broad, both in terms of geography and the topic
itself. Clearly, most countries would like to improve energy efficiency, and using a more
effective power distribution system (Smart Grid) is one way to do that. The challenge
becomes how to make the actual distribution system more efficient, and to ensure that
money spent in this area truly results in a cost saving. Toward that end, customers are
likely to be very responsive to receive power in new ways; perhaps through the use of
smart meters, but only if it results in lower costs. As distribution systems become more
efficient there are likely to be two impacts. First, it should reduce the number of new
power plant to be built, by allowing power companies to reduce the amount of capacity
needed to be held in reserve to meet peak loads, and second, it should allow for more
reliable delivery of renewable sources of electric, which today suffer from intermittency
when supplying power to the grid. Developing efficient energy storage systems likely are
necessary to fully integrate renewable sources of electric energy.
Christian Lelong: Some European countries such as Denmark and Germany have invested
heavily in renewable energy, and as the contribution of wind and solar power increases it
makes it difficult to balance power supply and demand across the grid. Is there a limit that
intermittent renewable such as wind and solar can’t exceed without disrupting the
electricity grid?
Wouter van Wersch: There are two ways I can answer this question. First, is to assess how
the increase in wind and solar capacity affects reliability on the European grid, and second
how it affects the economics of individual plants and the overall power system. With
regard to reliability, grid operators are greatly improving their ability to schedule capacity
based upon expected climate conditions affecting the availability of wind and sunshine.
However, for scheduling to become even more effective, system operators will need to
switch to an intraday dispatching system versus the day-ahead model that mostly is being
used today. However, even with improved scheduling, there is a growing need for back-up
generating capacity from conventional sources that can be ramped-up and ramped down
quickly to account for the intermittency of renewable energy. Second, and with regard to
economics, renewable energy is having a major impact on power company decisions to
invest in new capacity. Since renewable energy primarily is dispatched first and can have
an attractive feed-in tariff, its availability can significantly depress wholesale power prices,
which in turn can reduce operating margins, or spreads for conventional power plants
(nuclear, coal, gas). As a result, power companies are becoming very reluctant to build
new capacity, even if projections show the need for it later in the decade.
Christian Lelong: In your view, which energy source (coal, gas, wind, solar, nuclear) has the
greatest upside potential in terms of technological innovation over the next 5-10 years?
Where are the biggest gains in terms of capital costs and efficiency likely to be made?
Wouter van Wersch: In my view all forms of power generation will see technological
innovation and advancement over the next 5-10 years. Alstom is committed to making
those advancements as we have done in the past. However, if I had to select one from
your list, it would be solar. And this choice is based upon solar holding such a small part
July 24, 2013 Global
Goldman Sachs Global Economics, Commodities and Strategy Research 19
of the power supply today, but with a huge opportunity to expand that share in the future.
However, one caution with regard to solar is that while advancements and cost reductions
are being made to the technology itself, whether it is Solar CSP (Concentrated Solar Power)
or Solar PV (photovoltaic), the extent to which it captures a larger share of the power
market will depend upon factors related to transmission and delivery. Solar is a much
more decentralized source of electricity and its ultimate cost-effectiveness will depend
upon how that energy is harnessed and delivered to the system. If those challenges are
overcome, in part through more effective means of energy storage, then solar likely is to be
the energy source with the greatest upside potential. However, at the same time
advancements will be occurring in all other power generation technologies.
Christian Lelong: Focusing on thermal coal, where do you see the biggest opportunities
and threats for the coal mining sector?
Wouter van Wersch: This question is outside of my expertise, since I focus on power
equipment markets. However, I do have some broad observations. With regard to
opportunities, companies that mine and sell thermal coal should see a growing market
throughout Asia, especially in India, Indonesia and Vietnam. Given the huge need for new
generating capacity in those countries, and the low-cost of coal versus natural gas and oil,
we expect to see many more coal-fired power plants built through 2020. The same would
apply to coal having a cost advantage over nuclear power in those countries. With regard
to threats, the most obvious ones are related to policies aimed at reducing CO2 emissions,
which in turn would increase the economic attractiveness of plants using natural gas or
based upon renewable energy. By 2020, the number of coal-fired plants built in Asia is
likely to decline. However, I should point out that Alstom has a well-developed and
commercially tested system that can capture CO2 from the stack of a coal-fired plant and
sequester those emissions underground. Widespread application of CCS technology would
ensure coal’s role in the power sector long past 2020.
July 24, 2013 Global
Goldman Sachs Global Economics, Commodities and Strategy Research 20
Structural trend #1: Environmental regulation
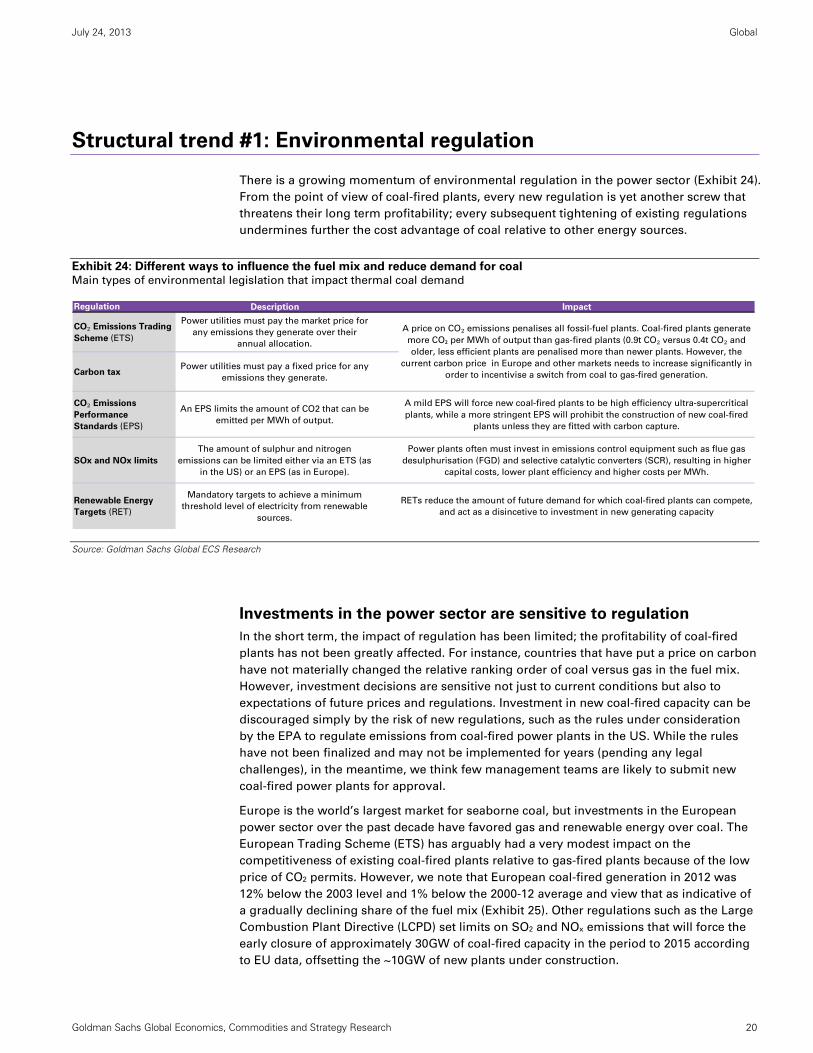
There is a growing momentum of environmental regulation in the power sector (Exhibit 24).
From the point of view of coal-fired plants, every new regulation is yet another screw that
threatens their long term profitability; every subsequent tightening of existing regulations
undermines further the cost advantage of coal relative to other energy sources.
Exhibit 24: Different ways to influence the fuel mix and reduce demand for coal Main types of environmental legislation that impact thermal coal demand
Source: Goldman Sachs Global ECS Research
Investments in the power sector are sensitive to regulation
In the short term, the impact of regulation has been limited; the profitability of coal-fired
plants has not been greatly affected. For instance, countries that have put a price on carbon
have not materially changed the relative ranking order of coal versus gas in the fuel mix.
However, investment decisions are sensitive not just to current conditions but also to
expectations of future prices and regulations. Investment in new coal-fired capacity can be
discouraged simply by the risk of new regulations, such as the rules under consideration
by the EPA to regulate emissions from coal-fired power plants in the US. While the rules
have not been finalized and may not be implemented for years (pending any legal
challenges), in the meantime, we think few management teams are likely to submit new
coal-fired power plants for approval.
Europe is the world’s largest market for seaborne coal, but investments in the European
power sector over the past decade have favored gas and renewable energy over coal. The
European Trading Scheme (ETS) has arguably had a very modest impact on the
competitiveness of existing coal-fired plants relative to gas-fired plants because of the low
price of CO2 permits. However, we note that European coal-fired generation in 2012 was
12% below the 2003 level and 1% below the 2000-12 average and view that as indicative of
a gradually declining share of the fuel mix (Exhibit 25). Other regulations such as the Large
Combustion Plant Directive (LCPD) set limits on SO2 and NOx emissions that will force the
early closure of approximately 30GW of coal-fired capacity in the period to 2015 according
to EU data, offsetting the ~10GW of new plants under construction.
Regulation Description Impact
CO₂ Emissions Trading
Scheme (ETS)
Power utilities must pay the market price for
any emissions they generate over their
annual allocation.
Carbon taxPower utilities must pay a fixed price for any
emissions they generate.
CO₂ Emissions
Performance
Standards (EPS)
An EPS limits the amount of CO2 that can be
emitted per MWh of output.
A mild EPS will force new coal-fired plants to be high efficiency ultra-supercritical
plants, while a more stringent EPS will prohibit the construction of new coal-fired
plants unless they are fitted with carbon capture.
SOx and NOx limits
The amount of sulphur and nitrogen
emissions can be limited either via an ETS (as
in the US) or an EPS (as in Europe).
Power plants often must invest in emissions control equipment such as flue gas
desulphurisation (FGD) and selective catalytic converters (SCR), resulting in higher
capital costs, lower plant efficiency and higher costs per MWh.
Renewable Energy
Targets (RET)
Mandatory targets to achieve a minimum
threshold level of electricity from renewable
sources.
RETs reduce the amount of future demand for which coal-fired plants can compete,
and act as a disincetive to investment in new generating capacity
A price on CO₂ emissions penalises all fossil-fuel plants. Coal-fired plants generate
more CO₂ per MWh of output than gas-fired plants (0.9t CO₂ versus 0.4t CO₂ and
older, less efficient plants are penalised more than newer plants. However, the
current carbon price in Europe and other markets needs to increase significantly in
order to incentivise a switch from coal to gas-fired generation.
July 24, 2013 Global
Goldman Sachs Global Economics, Commodities and Strategy Research 21
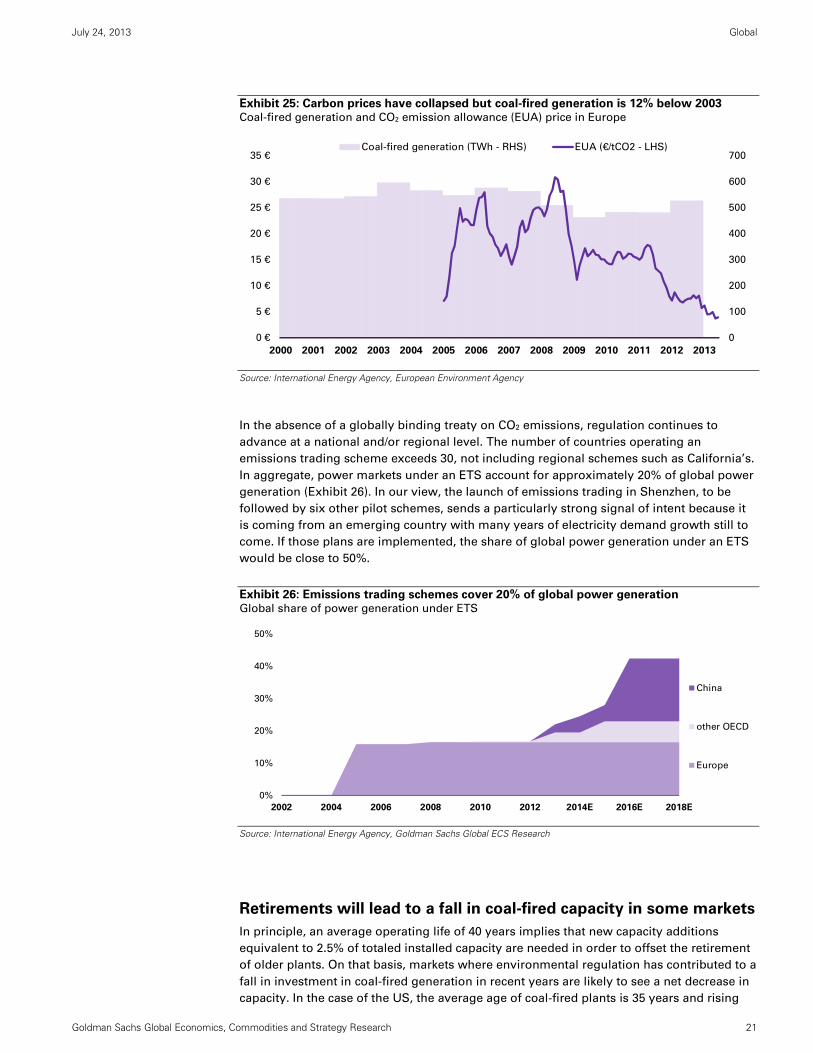
Exhibit 25: Carbon prices have collapsed but coal-fired generation is 12% below 2003 Coal-fired generation and CO2 emission allowance (EUA) price in Europe
Source: International Energy Agency, European Environment Agency
In the absence of a globally binding treaty on CO2 emissions, regulation continues to
advance at a national and/or regional level. The number of countries operating an
emissions trading scheme exceeds 30, not including regional schemes such as California’s.
In aggregate, power markets under an ETS account for approximately 20% of global power
generation (Exhibit 26). In our view, the launch of emissions trading in Shenzhen, to be
followed by six other pilot schemes, sends a particularly strong signal of intent because it
is coming from an emerging country with many years of electricity demand growth still to
come. If those plans are implemented, the share of global power generation under an ETS
would be close to 50%.
Exhibit 26: Emissions trading schemes cover 20% of global power generation Global share of power generation under ETS
Source: International Energy Agency, Goldman Sachs Global ECS Research
Retirements will lead to a fall in coal-fired capacity in some markets
In principle, an average operating life of 40 years implies that new capacity additions
equivalent to 2.5% of totaled installed capacity are needed in order to offset the retirement
of older plants. On that basis, markets where environmental regulation has contributed to a
fall in investment in coal-fired generation in recent years are likely to see a net decrease in
capacity. In the case of the US, the average age of coal-fired plants is 35 years and rising
0
100
200
300
400
500
600
700
0 €
5 €
10 €
15 €
20 €
25 €
30 €
35 €
2000 2001 2002 2003 2004 2005 2006 2007 2008 2009 2010 2011 2012 2013
Coal-fired generation (TWh - RHS) EUA (€/tCO2 - LHS)
0%
10%
20%
30%
40%
50%
2002 2004 2006 2008 2010 2012 2014E 2016E 2018E
China
other OECD
Europe
July 24, 2013 Global
Goldman Sachs Global Economics, Commodities and Strategy Research 22
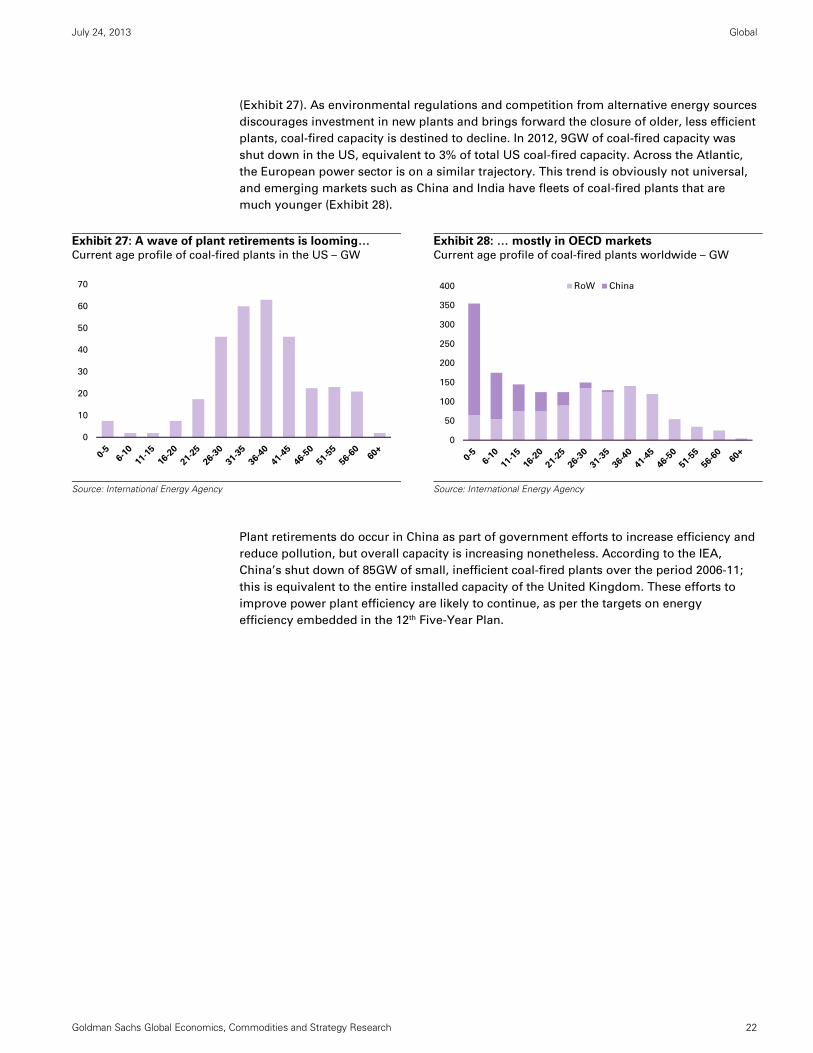
(Exhibit 27). As environmental regulations and competition from alternative energy sources
discourages investment in new plants and brings forward the closure of older, less efficient
plants, coal-fired capacity is destined to decline. In 2012, 9GW of coal-fired capacity was
shut down in the US, equivalent to 3% of total US coal-fired capacity. Across the Atlantic,
the European power sector is on a similar trajectory. This trend is obviously not universal,
and emerging markets such as China and India have fleets of coal-fired plants that are
much younger (Exhibit 28).
Exhibit 27: A wave of plant retirements is looming…
Current age profile of coal-fired plants in the US – GW
Exhibit 28: … mostly in OECD markets
Current age profile of coal-fired plants worldwide – GW
Source: International Energy Agency
Source: International Energy Agency
Plant retirements do occur in China as part of government efforts to increase efficiency and
reduce pollution, but overall capacity is increasing nonetheless. According to the IEA,
China’s shut down of 85GW of small, inefficient coal-fired plants over the period 2006-11;
this is equivalent to the entire installed capacity of the United Kingdom. These efforts to
improve power plant efficiency are likely to continue, as per the targets on energy
efficiency embedded in the 12th Five-Year Plan.
0
10
20
30
40
50
60
70
0
50
100
150
200
250
300
350
400 RoW China
July 24, 2013 Global
Goldman Sachs Global Economics, Commodities and Strategy Research 23
Structural trend #2: The shift to gas and renewable energy
Shale gas has transformed the outlook for gas-fired generation. Following the example of
the US where gas has gained market share in the fuel mix, power utilities in other regions
may benefit from cheaper gas supplies in the coming years and will plan their investments
accordingly. Meanwhile, non-hydro renewable energy has enjoyed several years of strong
growth, and annual investment in new capacity is on a scale similar to investment in fossil-
fueled generating capacity. Importantly, the growth in wind and solar energy is now more
widely spread between OECD and non-OECD countries. We expect this shift towards gas
and renewable energy to continue in the absence of viable technology to deliver low-
emissions coal-fired generation at a competitive cost.
Shale gas has benefited the US first, other countries to follow
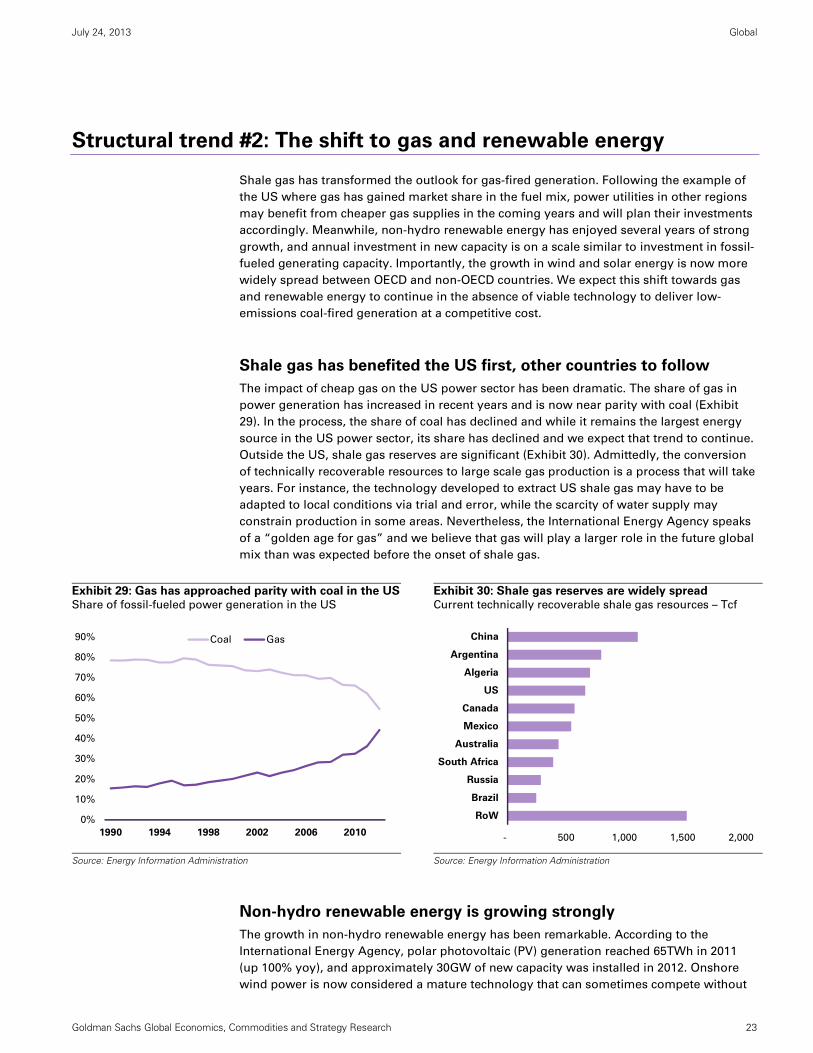
The impact of cheap gas on the US power sector has been dramatic. The share of gas in
power generation has increased in recent years and is now near parity with coal (Exhibit
29). In the process, the share of coal has declined and while it remains the largest energy
source in the US power sector, its share has declined and we expect that trend to continue.
Outside the US, shale gas reserves are significant (Exhibit 30). Admittedly, the conversion
of technically recoverable resources to large scale gas production is a process that will take
years. For instance, the technology developed to extract US shale gas may have to be
adapted to local conditions via trial and error, while the scarcity of water supply may
constrain production in some areas. Nevertheless, the International Energy Agency speaks
of a “golden age for gas” and we believe that gas will play a larger role in the future global
mix than was expected before the onset of shale gas.
Exhibit 29: Gas has approached parity with coal in the US Share of fossil-fueled power generation in the US
Exhibit 30: Shale gas reserves are widely spread Current technically recoverable shale gas resources – Tcf
Source: Energy Information Administration
Source: Energy Information Administration
Non-hydro renewable energy is growing strongly
The growth in non-hydro renewable energy has been remarkable. According to the
International Energy Agency, polar photovoltaic (PV) generation reached 65TWh in 2011
(up 100% yoy), and approximately 30GW of new capacity was installed in 2012. Onshore
wind power is now considered a mature technology that can sometimes compete without
0%
10%
20%
30%
40%
50%
60%
70%
80%
90%
1990 1994 1998 2002 2006 2010
Coal Gas
- 500 1,000 1,500 2,000
RoW
Brazil
Russia
South Africa
Australia
Mexico
Canada
US
Algeria
Argentina
China
July 24, 2013 Global
Goldman Sachs Global Economics, Commodities and Strategy Research 24
subsidies against conventional energy sources in some markets. Offshore wind power on
the other hand still faces challenges, but there are several large projects in the pipeline.
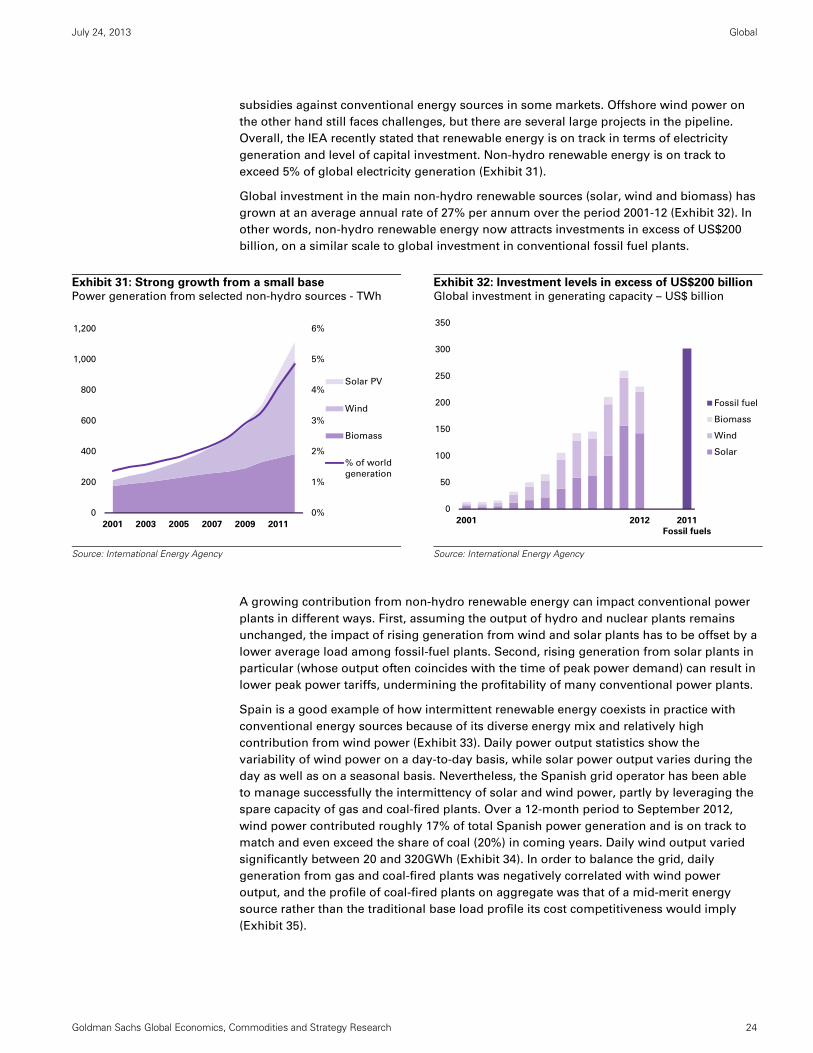
Overall, the IEA recently stated that renewable energy is on track in terms of electricity
generation and level of capital investment. Non-hydro renewable energy is on track to
exceed 5% of global electricity generation (Exhibit 31).
Global investment in the main non-hydro renewable sources (solar, wind and biomass) has
grown at an average annual rate of 27% per annum over the period 2001-12 (Exhibit 32). In
other words, non-hydro renewable energy now attracts investments in excess of US$200
billion, on a similar scale to global investment in conventional fossil fuel plants.
Exhibit 31: Strong growth from a small base Power generation from selected non-hydro sources - TWh
Exhibit 32: Investment levels in excess of US$200 billionGlobal investment in generating capacity – US$ billion
Source: International Energy Agency
Source: International Energy Agency
A growing contribution from non-hydro renewable energy can impact conventional power
plants in different ways. First, assuming the output of hydro and nuclear plants remains
unchanged, the impact of rising generation from wind and solar plants has to be offset by a
lower average load among fossil-fuel plants. Second, rising generation from solar plants in
particular (whose output often coincides with the time of peak power demand) can result in
lower peak power tariffs, undermining the profitability of many conventional power plants.
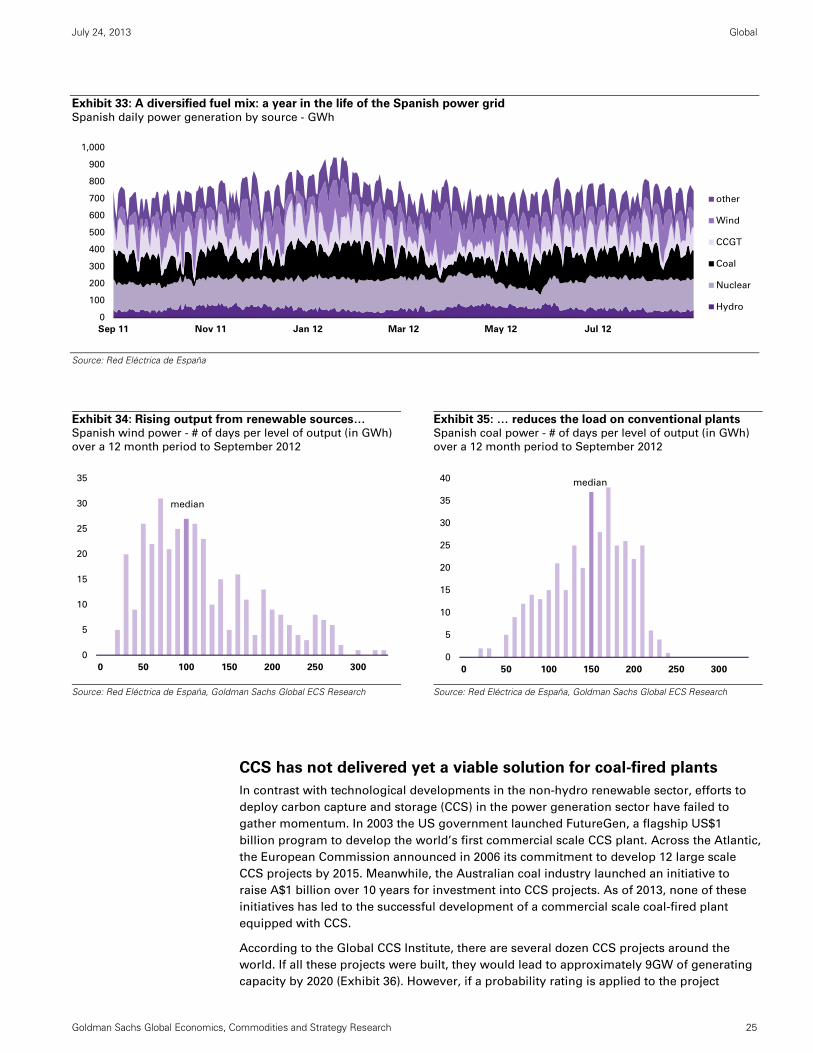
Spain is a good example of how intermittent renewable energy coexists in practice with
conventional energy sources because of its diverse energy mix and relatively high
contribution from wind power (Exhibit 33). Daily power output statistics show the
variability of wind power on a day-to-day basis, while solar power output varies during the
day as well as on a seasonal basis. Nevertheless, the Spanish grid operator has been able
to manage successfully the intermittency of solar and wind power, partly by leveraging the
spare capacity of gas and coal-fired plants. Over a 12-month period to September 2012,
wind power contributed roughly 17% of total Spanish power generation and is on track to
match and even exceed the share of coal (20%) in coming years. Daily wind output varied
significantly between 20 and 320GWh (Exhibit 34). In order to balance the grid, daily
generation from gas and coal-fired plants was negatively correlated with wind power
output, and the profile of coal-fired plants on aggregate was that of a mid-merit energy
source rather than the traditional base load profile its cost competitiveness would imply
(Exhibit 35).
0%
1%
2%
3%
4%
5%
6%
0
200
400
600
800
1,000
1,200
2001 2003 2005 2007 2009 2011
Solar PV
Wind
Biomass
% of world
generation
0
50
100
150
200
250
300
350
2001 2012 2011
Fossil fuels
Fossil fuel
Biomass
Wind
Solar
July 24, 2013 Global
Goldman Sachs Global Economics, Commodities and Strategy Research 25
Exhibit 33: A diversified fuel mix: a year in the life of the Spanish power grid Spanish daily power generation by source - GWh
Source: Red Eléctrica de España
Exhibit 34: Rising output from renewable sources… Spanish wind power - # of days per level of output (in GWh)
over a 12 month period to September 2012
Exhibit 35: … reduces the load on conventional plants Spanish coal power - # of days per level of output (in GWh)
over a 12 month period to September 2012
Source: Red Eléctrica de España, Goldman Sachs Global ECS Research
Source: Red Eléctrica de España, Goldman Sachs Global ECS Research
CCS has not delivered yet a viable solution for coal-fired plants
In contrast with technological developments in the non-hydro renewable sector, efforts to
deploy carbon capture and storage (CCS) in the power generation sector have failed to
gather momentum. In 2003 the US government launched FutureGen, a flagship US$1
billion program to develop the world’s first commercial scale CCS plant. Across the Atlantic,
the European Commission announced in 2006 its commitment to develop 12 large scale
CCS projects by 2015. Meanwhile, the Australian coal industry launched an initiative to
raise A$1 billion over 10 years for investment into CCS projects. As of 2013, none of these
initiatives has led to the successful development of a commercial scale coal-fired plant
equipped with CCS.
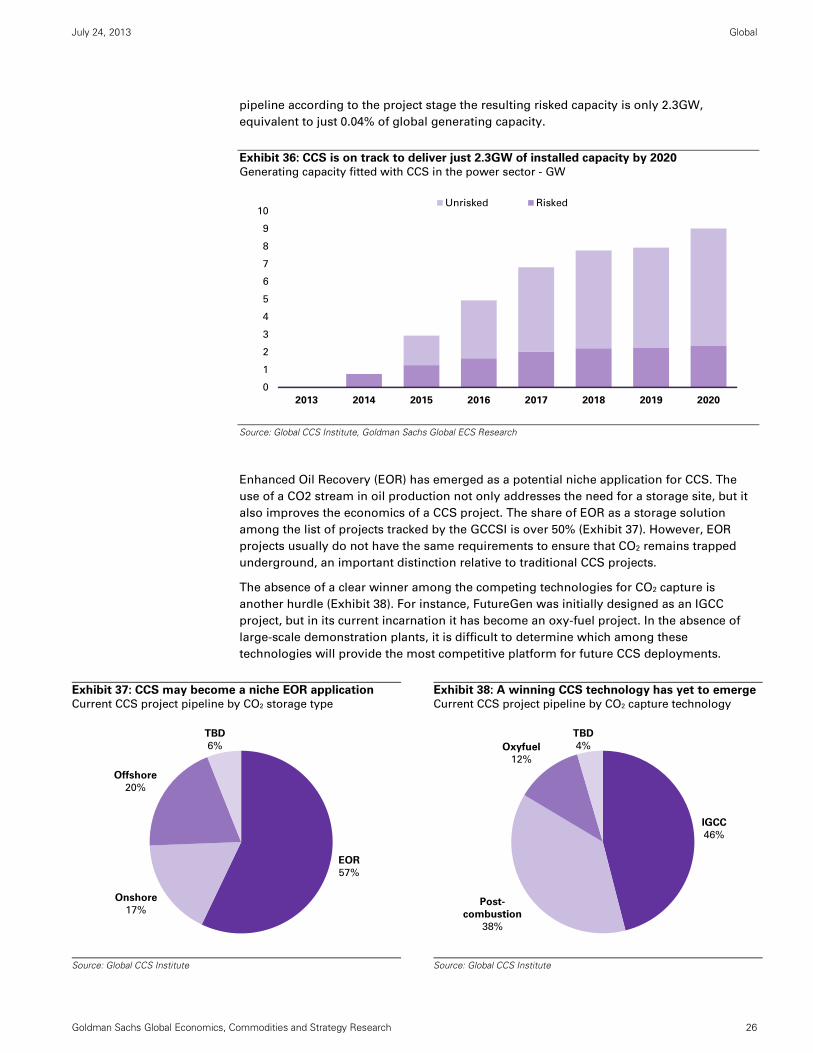
According to the Global CCS Institute, there are several dozen CCS projects around the
world. If all these projects were built, they would lead to approximately 9GW of generating
capacity by 2020 (Exhibit 36). However, if a probability rating is applied to the project
0
100
200
300
400
500
600
700
800
900
1,000
Sep 11 Nov 11 Jan 12 Mar 12 May 12 Jul 12
other
Wind
CCGT
Coal
Nuclear
Hydro
0
5
10
15
20
25
30
35
0 50 100 150 200 250 300
median
0
5
10
15
20
25
30
35
40
0 50 100 150 200 250 300
median
July 24, 2013 Global
Goldman Sachs Global Economics, Commodities and Strategy Research 26
pipeline according to the project stage the resulting risked capacity is only 2.3GW,
equivalent to just 0.04% of global generating capacity.
Exhibit 36: CCS is on track to deliver just 2.3GW of installed capacity by 2020
Generating capacity fitted with CCS in the power sector - GW
Source: Global CCS Institute, Goldman Sachs Global ECS Research
Enhanced Oil Recovery (EOR) has emerged as a potential niche application for CCS. The
use of a CO2 stream in oil production not only addresses the need for a storage site, but it
also improves the economics of a CCS project. The share of EOR as a storage solution
among the list of projects tracked by the GCCSI is over 50% (Exhibit 37). However, EOR
projects usually do not have the same requirements to ensure that CO2 remains trapped
underground, an important distinction relative to traditional CCS projects.
The absence of a clear winner among the competing technologies for CO2 capture is
another hurdle (Exhibit 38). For instance, FutureGen was initially designed as an IGCC
project, but in its current incarnation it has become an oxy-fuel project. In the absence of
large-scale demonstration plants, it is difficult to determine which among these
technologies will provide the most competitive platform for future CCS deployments.
Exhibit 37: CCS may become a niche EOR application
Current CCS project pipeline by CO2 storage type
Exhibit 38: A winning CCS technology has yet to emerge
Current CCS project pipeline by CO2 capture technology
Source: Global CCS Institute
Source: Global CCS Institute
0
1
2
3
4
5
6
7
8
9
10
2013 2014 2015 2016 2017 2018 2019 2020
Unrisked Risked
EOR
57%
Onshore
17%
Offshore
20%
TBD
6%
IGCC
46%
Post-
combustion
38%
Oxyfuel
12%
TBD
4%

July 24, 2013 Global
Goldman Sachs Global Economics, Commodities and Strategy Research 27
According to a range of studies quoted by the Congressional Budget Office (CBO),
electricity generation at CCS plants is expected to be approximately 75% more expensive
than for coal-fired plants without CCS. In the same report1, the CBO states:
“The Department [of Energy, or DOE]’s analysts believe that the current technology for
capturing CO2 could never meet DOE’s goal of reducing the cost of CCS-generated
electricity. Consequently, DOE has been seeking to develop next-generation CCS
equipment and processes that would capture CO2 more quickly and more completely but
use less energy than today’s technology does.”
CCS projects other hurdles besides the challenge to develop technology at lower cost. First,
the liabilities related to the transportation and storage of CO2 need to be addressed; will the
power utility continue to have title on the CO2 and be responsible for monitoring the
storage site for decades? Second, the risks of a potential CO2 leak (whether real or
imaginary) may lead to opposition from local communities.
1 Federal Efforts to Reduce the Cost of Capturing and Storing Carbon Dioxide, Congressional Budget Office, 2012
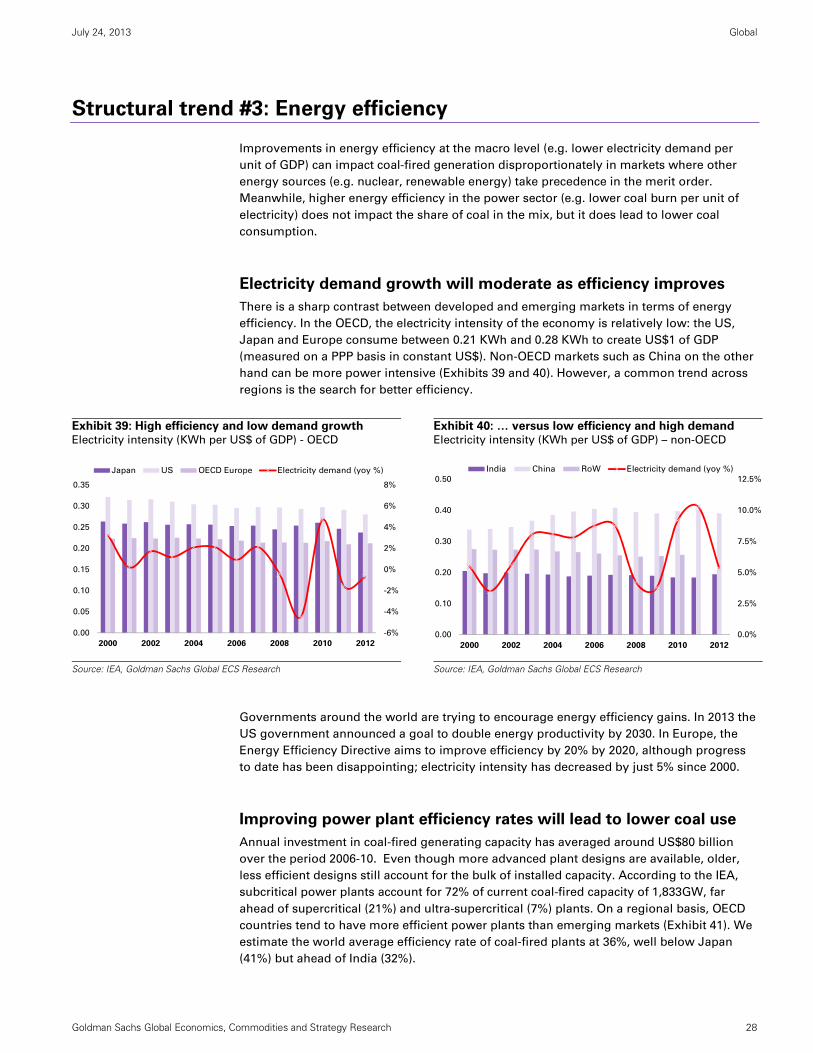
July 24, 2013 Global
Goldman Sachs Global Economics, Commodities and Strategy Research 28
Structural trend #3: Energy efficiency
Improvements in energy efficiency at the macro level (e.g. lower electricity demand per
unit of GDP) can impact coal-fired generation disproportionately in markets where other
energy sources (e.g. nuclear, renewable energy) take precedence in the merit order.
Meanwhile, higher energy efficiency in the power sector (e.g. lower coal burn per unit of
electricity) does not impact the share of coal in the mix, but it does lead to lower coal
consumption.
Electricity demand growth will moderate as efficiency improves
There is a sharp contrast between developed and emerging markets in terms of energy
efficiency. In the OECD, the electricity intensity of the economy is relatively low: the US,
Japan and Europe consume between 0.21 KWh and 0.28 KWh to create US$1 of GDP
(measured on a PPP basis in constant US$). Non-OECD markets such as China on the other
hand can be more power intensive (Exhibits 39 and 40). However, a common trend across
regions is the search for better efficiency.
Exhibit 39: High efficiency and low demand growth Electricity intensity (KWh per US$ of GDP) - OECD
Exhibit 40: … versus low efficiency and high demand Electricity intensity (KWh per US$ of GDP) – non-OECD
Source: IEA, Goldman Sachs Global ECS Research
Source: IEA, Goldman Sachs Global ECS Research
Governments around the world are trying to encourage energy efficiency gains. In 2013 the
US government announced a goal to double energy productivity by 2030. In Europe, the
Energy Efficiency Directive aims to improve efficiency by 20% by 2020, although progress
to date has been disappointing; electricity intensity has decreased by just 5% since 2000.
Improving power plant efficiency rates will lead to lower coal use
Annual investment in coal-fired generating capacity has averaged around US$80 billion
over the period 2006-10. Even though more advanced plant designs are available, older,
less efficient designs still account for the bulk of installed capacity. According to the IEA,
subcritical power plants account for 72% of current coal-fired capacity of 1,833GW, far
ahead of supercritical (21%) and ultra-supercritical (7%) plants. On a regional basis, OECD
countries tend to have more efficient power plants than emerging markets (Exhibit 41). We
estimate the world average efficiency rate of coal-fired plants at 36%, well below Japan
(41%) but ahead of India (32%).
-6%
-4%
-2%
0%
2%
4%
6%
8%
0.00
0.05
0.10
0.15
0.20
0.25
0.30
0.35
2000 2002 2004 2006 2008 2010 2012
Japan US OECD Europe Electricity demand (yoy %)
0.0%
2.5%
5.0%
7.5%
10.0%
12.5%
0.00
0.10
0.20
0.30
0.40
0.50
2000 2002 2004 2006 2008 2010 2012
India China RoW Electricity demand (yoy %)
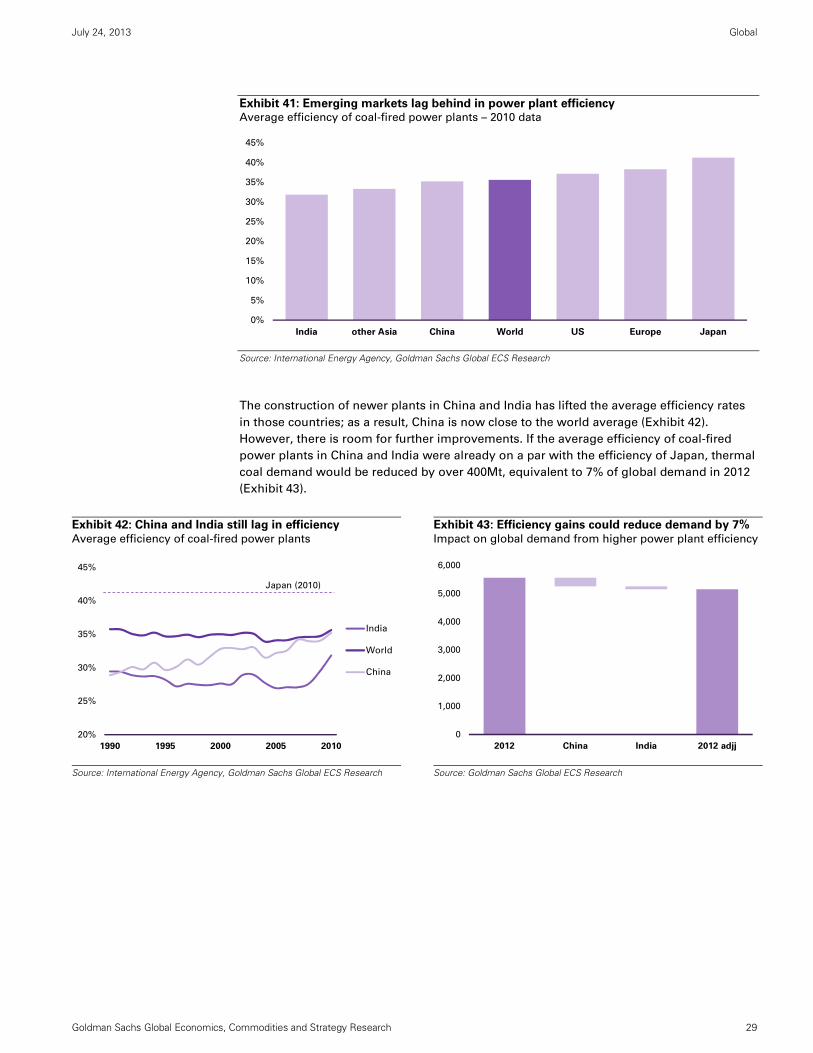
July 24, 2013 Global
Goldman Sachs Global Economics, Commodities and Strategy Research 29
Exhibit 41: Emerging markets lag behind in power plant efficiency Average efficiency of coal-fired power plants – 2010 data
Source: International Energy Agency, Goldman Sachs Global ECS Research
The construction of newer plants in China and India has lifted the average efficiency rates
in those countries; as a result, China is now close to the world average (Exhibit 42).
However, there is room for further improvements. If the average efficiency of coal-fired
power plants in China and India were already on a par with the efficiency of Japan, thermal
coal demand would be reduced by over 400Mt, equivalent to 7% of global demand in 2012
(Exhibit 43).
Exhibit 42: China and India still lag in efficiency
Average efficiency of coal-fired power plants
Exhibit 43: Efficiency gains could reduce demand by 7%
Impact on global demand from higher power plant efficiency
Source: International Energy Agency, Goldman Sachs Global ECS Research
Source: Goldman Sachs Global ECS Research
0%
5%
10%
15%
20%
25%
30%
35%
40%
45%
India other Asia China World US Europe Japan
20%
25%
30%
35%
40%
45%
1990 1995 2000 2005 2010
India
World
China
Japan (2010)
0
1,000
2,000
3,000
4,000
5,000
6,000
2012 China India 2012 adjj
July 24, 2013 Global
Goldman Sachs Global Economics, Commodities and Strategy Research 30
Risks to our view
We highlight a set of risks with the potential to undermine our forward view of the thermal
coal market.
A catastrophic weather event: Climate change has been displaced by other issues
as a top concern. However, public opinion could swing as a result of a weather
event such as an ice-free summer at the North Pole, a particularly destructive
hurricane season in North America or a weather disruption that materially impacts
agricultural output. Under such a scenario, governments may be forced to respond
with drastically tighter environmental regulations that would further erode the
long term demand for coal.
Gas prices: The rise of unconventional gas has significantly improved its
competitiveness in the US against coal and other energy sources. Other markets
have not yet experienced the same degree of success in increasing production and
lowering prices. However, if future exploration in Europe and China in particular
point towards a world of cheap gas beyond the US (i.e. via cheaper LNG), in our
view the rate of investment in coal-fired plants is likely to slow down.
China and India: Global coal demand growth has been supported by China and
India over the past decade. Their aggregate demand currently accounts for 32% of
the seaborne market; the macroeconomic outlook, the potential rebalancing of the
Chinese economy away from energy intensive sectors towards light industry and
services, and the future direction of energy policy will continue to shape the
outlook for thermal coal demand and prices.
Technological innovation: Future investments in the power sector will be affected
by the way technological innovation drives further reduction in costs (in US$ per
MW of installed capacity) and increases in efficiency. The long term prospects for
thermal coal would improve if CCS is eventually deployed on a cost competitive
basis without the support of EOR. For non-hydro renewables, onshore wind is
considered a mature technology, but offshore wind and in particular solar PV still
have further upside.
July 24, 2013 Global
Goldman Sachs Global Economics, Commodities and Strategy Research 31
Disclosure Appendix
Reg AC
We, Christian Lelong, Jeffrey Currie, Samantha Dart and Philipp Koenig, hereby certify that all of the views expressed in this report accurately reflect
our personal views, which have not been influenced by considerations of the firm's business or client relationships.
Disclosures
Global product; distributing entities
The Global Investment Research Division of Goldman Sachs produces and distributes research products for clients of Goldman Sachs on a global
basis. Analysts based in Goldman Sachs offices around the world produce equity research on industries and companies, and research on
macroeconomics, currencies, commodities and portfolio strategy. This research is disseminated in Australia by Goldman Sachs Australia Pty Ltd
(ABN 21 006 797 897); in Brazil by Goldman Sachs do Brasil Corretora de Títulos e Valores Mobiliários S.A.; in Canada by Goldman, Sachs & Co.
regarding Canadian equities and by Goldman, Sachs & Co. (all other research); in Hong Kong by Goldman Sachs (Asia) L.L.C.; in India by Goldman
Sachs (India) Securities Private Ltd.; in Japan by Goldman Sachs Japan Co., Ltd.; in the Republic of Korea by Goldman Sachs (Asia) L.L.C., Seoul
Branch; in New Zealand by Goldman Sachs New Zealand Limited; in Russia by OOO Goldman Sachs; in Singapore by Goldman Sachs (Singapore)
Pte. (Company Number: 198602165W); and in the United States of America by Goldman, Sachs & Co. Goldman Sachs International has approved this
research in connection with its distribution in the United Kingdom and European Union.
European Union: Goldman Sachs International authorised by the Prudential Regulation Authority and regulated by the Financial Conduct Authority
and the Prudential Regulation Authority, has approved this research in connection with its distribution in the European Union and United Kingdom;
Goldman Sachs AG and Goldman Sachs International Zweigniederlassung Frankfurt, regulated by the Bundesanstalt für
Finanzdienstleistungsaufsicht, may also distribute research in Germany.
General disclosures
This research is for our clients only. Other than disclosures relating to Goldman Sachs, this research is based on current public information that we
consider reliable, but we do not represent it is accurate or complete, and it should not be relied on as such. We seek to update our research as
appropriate, but various regulations may prevent us from doing so. Other than certain industry reports published on a periodic basis, the large
majority of reports are published at irregular intervals as appropriate in the analyst's judgment.
Goldman Sachs conducts a global full-service, integrated investment banking, investment management, and brokerage business. We have
investment banking and other business relationships with a substantial percentage of the companies covered by our Global Investment Research
Division. Goldman, Sachs & Co., the United States broker dealer, is a member of SIPC (http://www.sipc.org).
Our salespeople, traders, and other professionals may provide oral or written market commentary or trading strategies to our clients and our
proprietary trading desks that reflect opinions that are contrary to the opinions expressed in this research. Our asset management area, our
proprietary trading desks and investing businesses may make investment decisions that are inconsistent with the recommendations or views
expressed in this research.
The analysts named in this report may have from time to time discussed with our clients, including Goldman Sachs salespersons and traders, or may
discuss in this report, trading strategies that reference catalysts or events that may have a near-term impact on the market price of the equity
securities discussed in this report, which impact may be directionally counter to the analysts' published price target expectations for such stocks. Any
such trading strategies are distinct from and do not affect the analysts' fundamental equity rating for such stocks, which rating reflects a stock's
return potential relative to its coverage group as described herein.
We and our affiliates, officers, directors, and employees, excluding equity and credit analysts, will from time to time have long or short positions in,
act as principal in, and buy or sell, the securities or derivatives, if any, referred to in this research.
This research is not an offer to sell or the solicitation of an offer to buy any security in any jurisdiction where such an offer or solicitation would be
illegal. It does not constitute a personal recommendation or take into account the particular investment objectives, financial situations, or needs of
individual clients. Clients should consider whether any advice or recommendation in this research is suitable for their particular circumstances and, if
appropriate, seek professional advice, including tax advice. The price and value of investments referred to in this research and the income from them
may fluctuate. Past performance is not a guide to future performance, future returns are not guaranteed, and a loss of original capital may occur.
Fluctuations in exchange rates could have adverse effects on the value or price of, or income derived from, certain investments.
Certain transactions, including those involving futures, options, and other derivatives, give rise to substantial risk and are not suitable for all investors.
Investors should review current options disclosure documents which are available from Goldman Sachs sales representatives or at
http://www.theocc.com/about/publications/character-risks.jsp. Transaction costs may be significant in option strategies calling for multiple purchase
and sales of options such as spreads. Supporting documentation will be supplied upon request.
In producing research reports, members of the Global Investment Research Division of Goldman Sachs Australia may attend site visits and other
meetings hosted by the issuers the subject of its research reports. In some instances the costs of such site visits or meetings may be met in part or in
whole by the issuers concerned if Goldman Sachs Australia considers it is appropriate and reasonable in the specific circumstances relating to the
site visit or meeting.
All research reports are disseminated and available to all clients simultaneously through electronic publication to our internal client websites. Not all
research content is redistributed to our clients or available to third-party aggregators, nor is Goldman Sachs responsible for the redistribution of our
research by third party aggregators. For all research available on a particular stock, please contact your sales representative or go to
http://360.gs.com.
Disclosure information is also available at http://www.gs.com/research/hedge.html or from Research Compliance, 200 West Street, New York, NY
10282.
© 2013 Goldman Sachs.
No part of this material may be (i) copied, photocopied or duplicated in any form by any means or (ii) redistributed without the prior written consent of The Goldman Sachs Group, Inc.