Embed Size (px)
DESCRIPTION
GS Market Know How 3Q15
Citation preview

3Q 2015
Market Know-HowInsights and Implementation
Strategic Advisory Solutions
2015How to Use the Market Know-HowGSAM’s ‘Market Know-How’ explains what investors should
KNOW about current market conditions, and HOW they can
implement an investable strategy. The ideas presented in
the Market Know-How are based on our expectations of global
macro conditions, asset class performance, and sound
portfolio construction.
We begin with our key views.

GEOPOLITICSThe frequency of geopolitical flare-ups and 11th-hour compromises is elevated, but their disruptive potential should be regional and limited.
CREDITDefault and downgrade risk remain low. Range-bound spreads are supported by a friendly mix of growth, inflation, and policy. Poor market liquidity continues to be a chief concern.
GLOBAL GROWTHUS macro conditions appear to be thawing from yet another cold patch. Globally, growth looks to be stabilizing, with policy-induced improvements in Europe and Japan.
EQUITIESOur return expectations are aligned with earnings growth. While equities remain attractive relative to other asset classes, rich valuations limit the potential for additional outsized gains.
ENERGYOil prices have partially recovered, but the global market is oversupplied. Further industry consolidation is required, but volume and infrastructure growth remain promising.
CURRENCYDiverging global monetary policy should support additional Dollar strength, albeit at a flatter trajectory than the last 12 months.
MONETARY POLICYAn uneven global recovery should elicit further divergent monetary responses. While US data is supportive of a late 2015 tightening, risk asymmetry makes an extension possible.
FIXED INCOMEWhile the recent rate sell-off should slow, we believe fair value lies higher. Global rates are vulnerable to macro stabilization, rising inflation, and looming Fed tightening.
BIG DATAThe integration of advanced data analysis across commerce and industry represents a transformative opportunity to convert the volume and variety of data into investment value.
VOLATILITYWhile equity volatility has been remarkably low, big swings have dominated currency, rate, and commodity markets. We expect equity volatility to trend higher ahead of Fed tightening.
Macro
Market
2015

3Q
Situational AwarenessBeing a perceptive judge of your environment remains essential—
especially in anticipating what may come next. Investors today
face increasingly rich equity valuations, tighter high yield credit
spreads, and volatile price moves in energy, rates, and currency
markets. The occurrence of rare or “high sigma”1 events
highlights how quickly the market tone can shift.
Even so, we are confident that the macroeconomic and monetary
backdrop is supportive of broad equity gains. While central banks
continue to drive markets in Europe and Japan, we see global
markets migrating from a period of policy domination to one of
data dependency. Consequently, improving fundamentals
may be required to support higher valuations.
As we address prevailing market conditions in the latest edition
of the Market Know-How, our key takeaways are as follows:
n Despite higher valuations, we believe global equities continue
to offer risk-adjusted potential versus global sovereign debt
n As equity returns moderate, cash flow generation and earnings growth should grow in importance
n Idiosyncratic opportunities can emerge from Big Data and technological disruption
n Alternative investments can potentially fill a constructive role in mitigating downside risk
As we see global divergence take shape across regions and
asset classes, we think it is key to be strategically allocated
and situationally aware.
1. High sigma refers to low probability events.
2
3Q
Market Know-How 3Q 2015
1
6
2
7
3
4
5
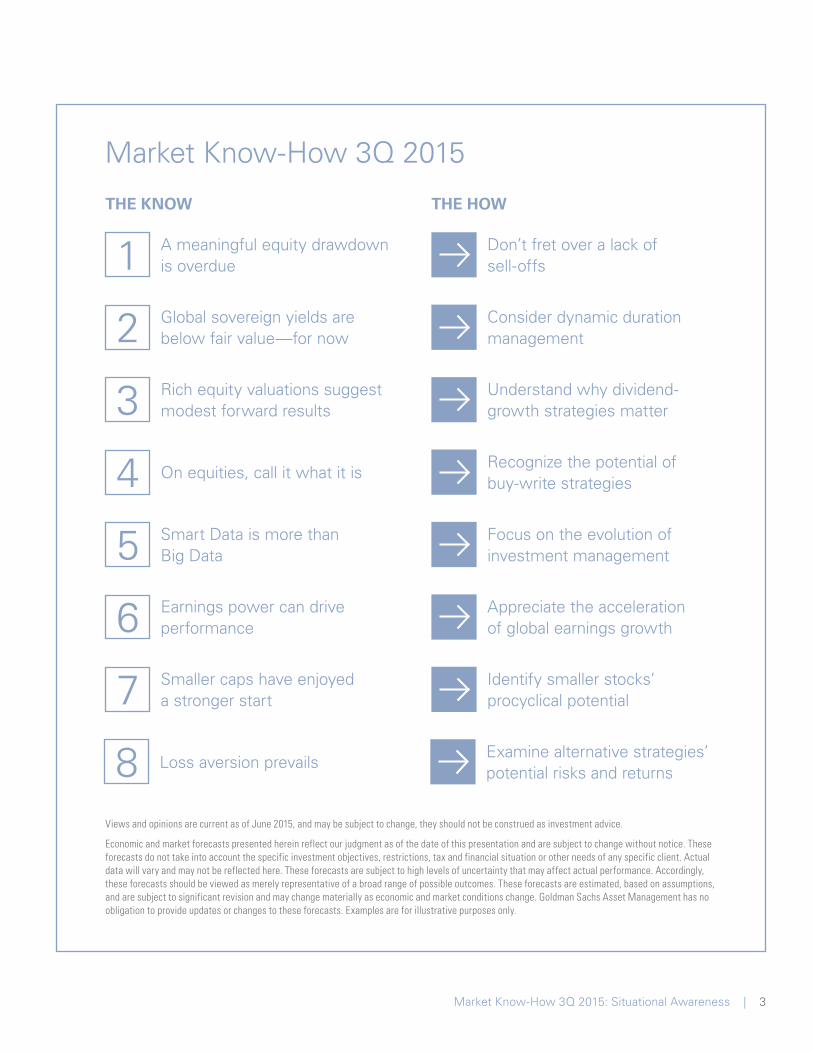
A meaningful equity drawdown is overdue
Views and opinions are current as of June 2015, and may be subject to change, they should not be construed as investment advice.
Economic and market forecasts presented herein reflect our judgment as of the date of this presentation and are subject to change without notice. These forecasts do not take into account the specific investment objectives, restrictions, tax and financial situation or other needs of any specific client. Actual data will vary and may not be reflected here. These forecasts are subject to high levels of uncertainty that may affect actual performance. Accordingly, these forecasts should be viewed as merely representative of a broad range of possible outcomes. These forecasts are estimated, based on assumptions, and are subject to significant revision and may change materially as economic and market conditions change. Goldman Sachs Asset Management has no obligation to provide updates or changes to these forecasts. Examples are for illustrative purposes only.
Earnings power can drive performance
Global sovereign yields are below fair value—for now
Smaller caps have enjoyed a stronger start
Rich equity valuations suggest modest forward results
On equities, call it what it is
Smart Data is more than Big Data
Don’t fret over a lack of sell-offs
Appreciate the acceleration of global earnings growth
THE KNOW THE HOW
Consider dynamic duration management
Identify smaller stocks’ procyclical potential
Understand why dividend-growth strategies matter
Recognize the potential of buy-write strategies
Focus on the evolution of investment management
8 Loss aversion prevailsExamine alternative strategies’ potential risks and returns
Market Know-How 3Q 2015: Situational Awareness | 3
Days
222 225 226
1089 1089
1318
Average Days in between DrawdownsDays since Last Drawdown
5%+ 6%+ 7%+ 8%+ 9%+ 10%+Size of Drawdown
Inde
x Le
vel
0
500
1000
1500
2000
2500
1991 1994 1997 2000 2003 2006 2009 2012 2015
S&P 500 10%+ DrawdownsS&P 500 Index
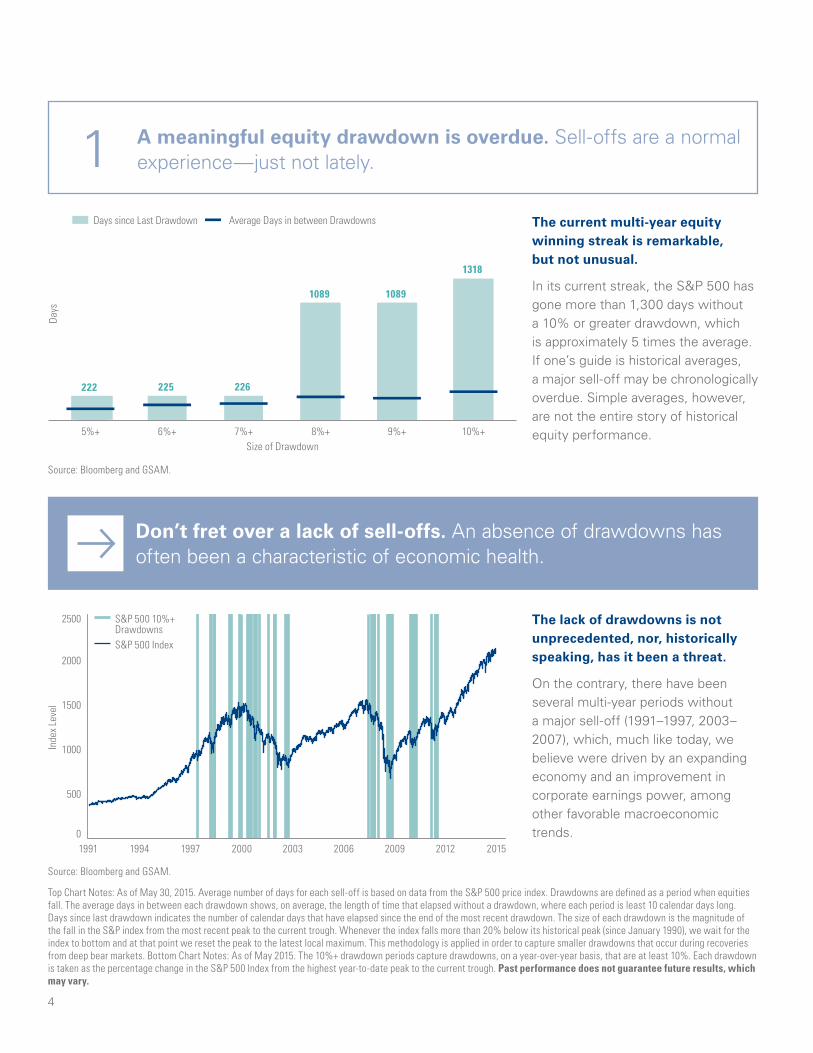
The current multi-year equity winning streak is remarkable, but not unusual.
In its current streak, the S&P 500 has gone more than 1,300 days without a 10% or greater drawdown, which is approximately 5 times the average. If one’s guide is historical averages, a major sell-off may be chronologically overdue. Simple averages, however, are not the entire story of historical equity performance.
The lack of drawdowns is not unprecedented, nor, historically speaking, has it been a threat.
On the contrary, there have been several multi-year periods without a major sell-off (1991–1997, 2003–2007), which, much like today, we believe were driven by an expanding economy and an improvement in corporate earnings power, among other favorable macroeconomic trends.
Source: Bloomberg and GSAM.
Source: Bloomberg and GSAM.
A meaningful equity drawdown is overdue. Sell-offs are a normal experience—just not lately.1
Don’t fret over a lack of sell-offs. An absence of drawdowns has often been a characteristic of economic health.
Top Chart Notes: As of May 30, 2015. Average number of days for each sell-off is based on data from the S&P 500 price index. Drawdowns are defined as a period when equities fall. The average days in between each drawdown shows, on average, the length of time that elapsed without a drawdown, where each period is least 10 calendar days long. Days since last drawdown indicates the number of calendar days that have elapsed since the end of the most recent drawdown. The size of each drawdown is the magnitude of the fall in the S&P index from the most recent peak to the current trough. Whenever the index falls more than 20% below its historical peak (since January 1990), we wait for the index to bottom and at that point we reset the peak to the latest local maximum. This methodology is applied in order to capture smaller drawdowns that occur during recoveries from deep bear markets. Bottom Chart Notes: As of May 2015. The 10%+ drawdown periods capture drawdowns, on a year-over-year basis, that are at least 10%. Each drawdown is taken as the percentage change in the S&P 500 Index from the highest year-to-date peak to the current trough. Past performance does not guarantee future results, which may vary.
4

2015 Low Current 2015 Fair Value
Australia
US
UK
Japan
Germany
Switzerland
-1% 0% 1% 2% 3% 4%
Total Return Given Norm
alization to Fair Valueover a 1 Year Horizon
-8% -6% -4% -2% 0%
UK
Japan
Australia
US
Germany
Switzerland
The change in global rate markets is accelerating.
From European markets to the US, Japan, and Australia, rates have advanced from their recent lows. As economic data improves, inflation moves higher, and the Federal Reserve gets closer to a rate hike, we believe fundamentals might trump policy. We believe the move towards fair value may continue.
Notwithstanding the recent rise in rates, a move to fair value would continue to pressure prices in the bond market.
In the event of rate normalization, the ability to adjust duration may reduce sensitivity to higher rates. As developed economies expand, we believe that the importance of managing duration may increase.
Global sovereign yields are below fair value—for now. Improving US and European data are driving rates higher.2
Consider dynamic duration management. Rate normalization in the coming years may require advanced thinking.
Source: Bloomberg, Goldman Sachs Global Investment Research, and GSAM.
Source: Bloomberg, Global Sachs Global Investment Research, and GSAM.
Top Chart Notes: As of May 2015. Sovereign debt yields are tracked by the respective country’s 10-year government bond index. For example, the German yield is represented by the German 10-year Bund. ‘2015 Low’ represents the lowest historical yield for each sovereign debt from January 1, 2015 to May 30, 2015. ‘Current’ represents the yield as of May 30, 2015. ‘2015 Fair Value’ is derived from the Goldman Sachs Global Investment Research (GIR) Fair Value model. Fair Value is the yield based on GIR economists’ outlook for growth and inflation, and the expected stance of monetary policy. Bottom Chart Notes: As of May 2015. The chart shows total return for sovereign debt assuming current rates will rise to the 2015 Fair Value over the next 12 months. Total return given 2015 Fair Value forecasts are calculated as of May 15, 2015. The coupon reinvestment assumption for each sovereign debt is: US 2.5%, Australia 3%, UK 2%, Japan 0.5%, Germany 1%, Switzerland 0%. The reinvestment rate assumption was made in accordance with the coupon. Duration is defined as the interest rate sensitivity of a bond. These examples are for illustrative purposes only and are not actual results. If any assumptions used do not prove to be true, results may vary substantially. Please see end disclosures for additional definitions. Past performance does not guarantee future results, which may vary.
Market Know-How 3Q 2015: Situational Awareness | 5

S&P
Aver
age
Annu
alize
d Fo
rwar
d 10
-Yea
r Tot
al R
etur
n (%
)
CAPE Ratio at Investment
15.5%14.7%
12.5% 12.5%
9.9%8.7%
5.7% 5.1%
2.7%
≤ 10x 10x−12x 12x−14x 14x−16x 16x−18x 18x−20x 20x−22x 22x−24x ≥ 24x
-15
-10
-5
5
10
15
20
25
-15 -10 -5 5 10 15 20
Dividend Growers IndexDividend Growers Performance during Periods of Moderate Return for the S&P 500
S&P 500 Total Return Index (%)
Divi
dend
Gro
wer
s In
dex
(%)
Dividend Growers Outperforming
Dividend Growers Underperforming
Equities are near all-time highs and the Cyclically Adjusted Price-to-Earnings (CAPE) Ratio, a popular valuation metric, looks stretched.
Historically, valuations have been less informative about short-term market moves, but more useful in setting longer-term expectations. The historical relationship between the CAPE ratio (currently 23x) and forward equity returns corresponds to 10-year annualized results of about 5.1%.
We believe dividend growers remain an essential large-cap diversifier.
During periods when the S&P 500 exhibits mid single-digit returns, dividend growers have outperformed the S&P 500 total return index. As current valuations suggest, more moderate returns may be likely, underscoring the potential for dividend-growth strategies to outperform.
Source: Goldman Sachs Global Investment Research.
Source: Bloomberg and GSAM.
Rich equity valuations suggest modest forward results. After a six-year equity rally, data suggest returns may moderate.3
Understand why dividend-growth strategies matter. Dividend growth has historically outperformed as returns have moderated.
Top Chart Notes: Analysis is based on data from 1929 to 2012. The CAPE ratio is the price-to-earnings ratio, where earnings is calculated as the average inflation-adjusted earnings from the previous 10 years. For example, a CAPE ratio between 22 to 24x has preceded 10-year S&P annualized returns of 5.1%. Bottom Chart Notes: Chart shows monthly data from April 2005 to April 2015. The chart depicts the distribution of Dividend Growers annualized monthly returns when plotted against annualized monthly S&P Total Returns. The Dividend Growers Index is represented by the S&P Dividend Aristocrats Total Return Index. Please see end disclosures for additional definitions. Periods of moderate performance refers to mid single-digit S&P 500 Index returns that are below the long-term average. Past performance does not guarantee future results, which may vary.
6
Long
-Ter
m R
etur
ns (%
)
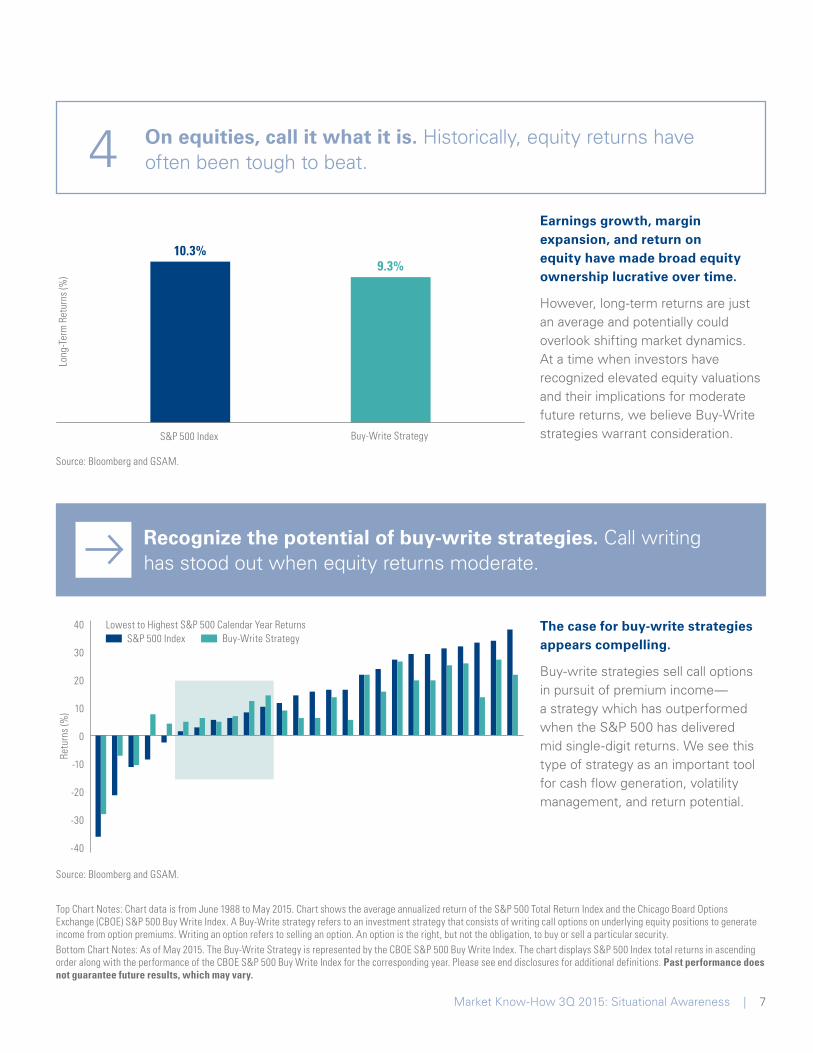
10.3% 9.3%
S&P 500 Index Buy-Write Strategy
S&P 500 Index Buy-Write Strategy Lowest to Highest S&P 500 Calendar Year Returns
-40
-30
-20
-10
0
10
20
30
40
Retu
rns
(%)
Earnings growth, margin expansion, and return on equity have made broad equity ownership lucrative over time.
However, long-term returns are just an average and potentially could overlook shifting market dynamics. At a time when investors have recognized elevated equity valuations and their implications for moderate future returns, we believe Buy-Write strategies warrant consideration.
The case for buy-write strategies appears compelling.
Buy-write strategies sell call options in pursuit of premium income— a strategy which has outperformed when the S&P 500 has delivered mid single-digit returns. We see this type of strategy as an important tool for cash flow generation, volatility management, and return potential.
On equities, call it what it is. Historically, equity returns have often been tough to beat.4
Recognize the potential of buy-write strategies. Call writing has stood out when equity returns moderate.
Source: Bloomberg and GSAM.
Source: Bloomberg and GSAM.
Top Chart Notes: Chart data is from June 1988 to May 2015. Chart shows the average annualized return of the S&P 500 Total Return Index and the Chicago Board Options Exchange (CBOE) S&P 500 Buy Write Index. A Buy-Write strategy refers to an investment strategy that consists of writing call options on underlying equity positions to generate income from option premiums. Writing an option refers to selling an option. An option is the right, but not the obligation, to buy or sell a particular security. Bottom Chart Notes: As of May 2015. The Buy-Write Strategy is represented by the CBOE S&P 500 Buy Write Index. The chart displays S&P 500 Index total returns in ascending order along with the performance of the CBOE S&P 500 Buy Write Index for the corresponding year. Please see end disclosures for additional definitions. Past performance does not guarantee future results, which may vary.
Market Know-How 3Q 2015: Situational Awareness | 7
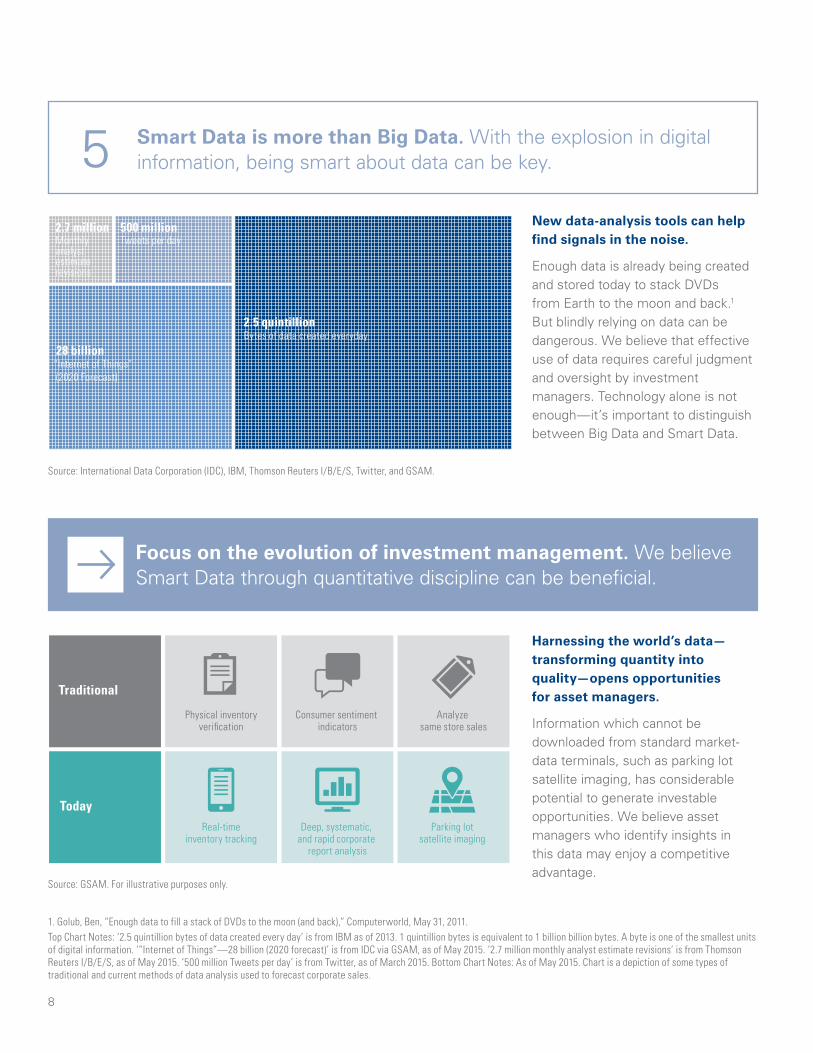
2.5 quintillionBytes of data created everyday
“Internet of Things” (2020 Forecast)
Monthlyanalyst estimate revisions
Tweets per day
28 billion
2.7 million 500 million New data-analysis tools can help find signals in the noise.
Enough data is already being created and stored today to stack DVDs from Earth to the moon and back.1 But blindly relying on data can be dangerous. We believe that effective use of data requires careful judgment and oversight by investment managers. Technology alone is not enough—it’s important to distinguish between Big Data and Smart Data.
Harnessing the world’s data—transforming quantity into quality—opens opportunities for asset managers.
Information which cannot be downloaded from standard market-data terminals, such as parking lot satellite imaging, has considerable potential to generate investable opportunities. We believe asset managers who identify insights in this data may enjoy a competitive advantage.
Source: International Data Corporation (IDC), IBM, Thomson Reuters I/B/E/S, Twitter, and GSAM.
Source: GSAM. For illustrative purposes only.
Smart Data is more than Big Data. With the explosion in digital information, being smart about data can be key.5
Focus on the evolution of investment management. We believe Smart Data through quantitative discipline can be beneficial.
1. Golub, Ben, “Enough data to fill a stack of DVDs to the moon (and back),” Computerworld, May 31, 2011. Top Chart Notes: ‘2.5 quintillion bytes of data created every day’ is from IBM as of 2013. 1 quintillion bytes is equivalent to 1 billion billion bytes. A byte is one of the smallest units of digital information. ‘“Internet of Things”—28 billion (2020 forecast)’ is from IDC via GSAM, as of May 2015. ‘2.7 million monthly analyst estimate revisions’ is from Thomson Reuters I/B/E/S, as of May 2015. ‘500 million Tweets per day’ is from Twitter, as of March 2015. Bottom Chart Notes: As of May 2015. Chart is a depiction of some types of traditional and current methods of data analysis used to forecast corporate sales.
Today
Physical inventoryverification
Real-timeinventory tracking
Consumer sentiment indicators
Analyze same store sales
Deep, systematic, and rapid corporate
report analysis
Traditional
Parking lotsatellite imaging
8

In global equity markets’ growth phase, multiple expansion has played less of a role in investment returns.
In markets such as Europe and Japan, rising price-to-earnings multiples played a significant role in what we call the “hope” phase of the equity cycle. In the more mature “growth” phase, earnings growth is an important factor to watch.
European and Japanese equities are forecast to deliver higher 2015 earnings growth than that of the US.
In an earnings-driven market, we believe investors should appreciate the breadth of global opportunities, including international developed equities and international small-cap equities. Macro stabilization and competitive currencies should help amplify earnings growth globally.
Earnings power can drive performance. As the equity cycle advances, earnings may matter more. 6
Appreciate the acceleration of global earnings growth. Equities across Europe and Japan lead growth expectations.
Source: Datastream, Worldscope, Goldman Sachs Global Investment Research, and GSAM.
Top Chart Notes: Based on the Europe ex-UK market, from 1973–2007, using Datastream’s “total market indices,” which aim to capture the performance of an entire region or country. The width of each equity cycle phase reflects the average length of time that it lasted for historically. In the “despair” phase, negative earnings growth and multiple contraction generate negative returns. In the “hope” phase, multiple expansion generates the majority of positive returns. In the “growth” phase, earnings growth drives positive returns as multiples could potentially contract. In the “optimism” phase, multiple expansion once again generates the majority of positive returns. P/E multiple expansion refers to the percentage change in the price-to-earnings ratio. Real earnings growth refers to the percentage change in EPS on an inflation-adjusted basis. Real price returns refers to the percentage change in the price index on an inflation-adjusted basis. Bottom Chart Notes: Forecasts for year-ending 2015. TOPIX data based on March-ending fiscal year. International Small Cap refers to the S&P Developed ex US Small Cap Index. Japan refers to the TOPIX Index. Europe refers to the STOXX Europe 600 Index. Asia ex-Japan refers to the MSCI AC Asia Pacific ex Japan Index. US refers to the S&P 500 Index. Please see end disclosures for definitions. The economic and market forecasts presented herein have been generated by Goldman Sachs Global Investment Research for informational purposes as of the date of this presentation. They are based on proprietary models and there can be no assurance that the forecasts will be achieved. Please see additional disclosures at the end of this presentation. Past performance does not guarantee future results, which may vary.
Despair Hope Growth Optimism
More Earnings per Share (EPS)
Less Price/Earnings (P/E)
51.2
0.7
50.2
10.9
22.5
-9.5
27.124.2
2.3
-24.9
-7.3
-19.0
Chan
ge (%
)
Real Earnings GrowthEurope ex-UK
Average P/E Multiple ExpansionReal Price Returns, Annualized
2015 Forecasted EPS Growth
8%Japan
2%US
9%International Small Cap
7%Europe
5%Asia ex-Japan
Source: FactSet and Goldman Sachs Global Investment Research.
Market Know-How 3Q 2015: Situational Awareness | 9
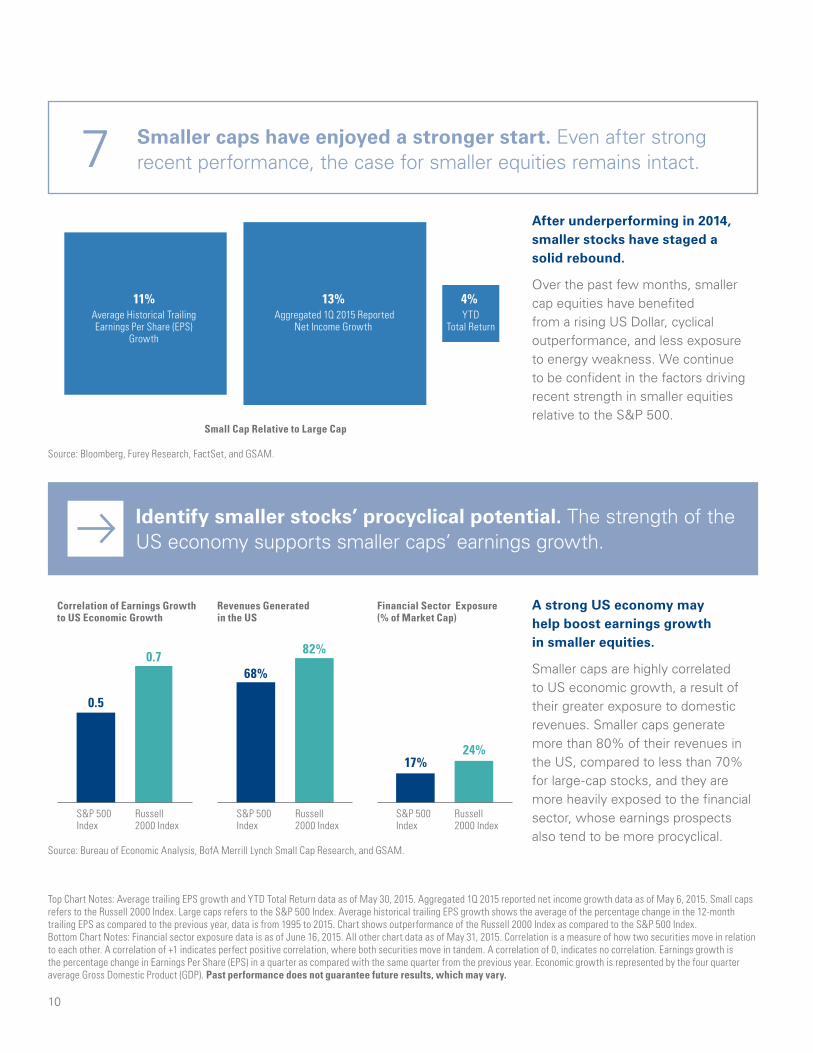
Small Cap Relative to Large Cap
11% 13% Average Historical Trailing Earnings Per Share (EPS)
Growth
Aggregated 1Q 2015 ReportedNet Income Growth
4% YTD
Total Return
Correlation of Earnings Growth to US Economic Growth
S&P 500Index
0.5
0.768%
82%
17%24%
Russell2000 Index
S&P 500Index
Russell2000 Index
Financial Sector Exposure(% of Market Cap)
S&P 500Index
Russell2000 Index
Revenues Generated in the US
After underperforming in 2014, smaller stocks have staged a solid rebound.
Over the past few months, smaller cap equities have benefited from a rising US Dollar, cyclical outperformance, and less exposure to energy weakness. We continue to be confident in the factors driving recent strength in smaller equities relative to the S&P 500.
A strong US economy may help boost earnings growth in smaller equities.
Smaller caps are highly correlated to US economic growth, a result of their greater exposure to domestic revenues. Smaller caps generate more than 80% of their revenues in the US, compared to less than 70% for large-cap stocks, and they are more heavily exposed to the financial sector, whose earnings prospects also tend to be more procyclical.
Source: Bloomberg, Furey Research, FactSet, and GSAM.
Source: Bureau of Economic Analysis, BofA Merrill Lynch Small Cap Research, and GSAM.
Smaller caps have enjoyed a stronger start. Even after strong recent performance, the case for smaller equities remains intact.7
Identify smaller stocks’ procyclical potential. The strength of the US economy supports smaller caps’ earnings growth.
Top Chart Notes: Average trailing EPS growth and YTD Total Return data as of May 30, 2015. Aggregated 1Q 2015 reported net income growth data as of May 6, 2015. Small caps refers to the Russell 2000 Index. Large caps refers to the S&P 500 Index. Average historical trailing EPS growth shows the average of the percentage change in the 12-month trailing EPS as compared to the previous year, data is from 1995 to 2015. Chart shows outperformance of the Russell 2000 Index as compared to the S&P 500 Index. Bottom Chart Notes: Financial sector exposure data is as of June 16, 2015. All other chart data as of May 31, 2015. Correlation is a measure of how two securities move in relation to each other. A correlation of +1 indicates perfect positive correlation, where both securities move in tandem. A correlation of 0, indicates no correlation. Earnings growth is the percentage change in Earnings Per Share (EPS) in a quarter as compared with the same quarter from the previous year. Economic growth is represented by the four quarter average Gross Domestic Product (GDP). Past performance does not guarantee future results, which may vary.
10

$300
Risk-Seeker Average Conservative Risk-Avoider
Gain required to offset fear of losing $100 on a coin flip
The average investoris averse to lossesPr
efer
red
Gain
($)
32%
-10%
≈3
Alternative strategies’ Upside to Downside Capture Ratiohas been similar to the averageinvestor’s risk preference.
Upside Capture
Downside Capture
AbsoluteUpside/Downside
Capture Ratio
3210
Few investing theories have proven truly immutable, but the lessons of behavioral finance come close.
The concept of loss aversion—developed by psychologists Daniel Kahneman and Amos Tversky—demonstrates that the average investor prefers loss avoidance about 3 times as much as gain accumulation. In other words, the possibility of losing is graver than the chance of winning is gratifying.
Alternative strategies potentially create an opportunity for risk-averse investors.
Given investors’ understandable desire for loss avoidance, we believe alternatives’ potential to capture some of equities’ upside with comparably smaller downside is noteworthy. From 1990 to 2015, alternatives achieved 32% of the S&P 500’s monthly gains, with only 10% of its monthly losses.
Loss aversion prevails. Time and again, behavioral finance shows that investors loathe losses more than they love gains.8
Examine alternative strategies’ potential risks and returns. These strategies may align with investors’ risk preferences.
Source: Daniel Kahneman, Amos Tversky, and GSAM.
Source: Bloomberg and GSAM.
Top Chart Notes: As of May 2015. The average investor type is based on analysis conducted in ‘Choices, Values, and Frames’ by Daniel Kahneman and Amos Tversky. The remaining investor types are defined by GSAM as hypothetical illustrative examples of risk preferences. Loss aversion expresses an individual’s tendency to prefer avoiding losses rather than accruing gains. Bottom Chart Notes: Analysis is based on chart data from January 1990, earliest common inception, to May 2015. Alternative strategies refers to the HFRI Fund of Funds Composite Index (HFRI FoF). Upside/Downside Capture ratio measures how much a given security has outperformed the broad market benchmark during periods of market strength and weakness. In the chart, Upside Capture is the performance of HFRI FoF relative to the S&P 500 during periods of positive S&P 500 returns. Downside Capture is the performance of HFRI FoF relative to the S&P 500 during periods of negative S&P 500 returns. The Upside Capture and Downside Capture ratio is the ratio of Upside Capture relative to Downside Capture. HFRI and related indices are trademarks and service marks of Hedge Fund Research, Inc. (“HFR”) which has no affiliation with GSAM. Information regarding HFR indices was obtained from HFR’s website and other public sources and is provided for comparison purposes only. Please see end disclosures for additional definitions. Past performance does not guarantee future results, which may vary.
Market Know-How 3Q 2015: Situational Awareness | 11

Our Contributors
Heather Kennedy Miner, CFA Managing Director, Global Head of Strategic Advisory Solutions
Heather is the global head of Strategic Advisory Solutions, which delivers GSAM’s perspectives on global markets, strategic asset allocation, and innovative business practices. Strategic Advisory Solutions provides this suite of integrated solutions to help our clients grow and enhance their businesses.
John Tousley, CFA Managing Director, Head of Market Strategy
John is a senior market strategist with GSAM’s Strategic Advisory Solutions. He leads the Market Strategy team, focusing on global capital markets, macro strategy, and implementation. John specializes in developing tactical and strategic investment insights within a risk-aware framework.
Candice Tse Vice President, Senior Market Strategist
Candice is a senior market strategist with GSAM’s Strategic Advisory Solutions. She is responsible for economic and market strategy, along with client engagement on investment solutions. Candice’s areas of expertise include Womenomics and emerging markets.
Allen Sukholitsky, CFA Vice President, Senior Market Strategist
Allen is a senior market strategist with GSAM’s Strategic Advisory Solutions. He focuses on economic and market strategy as well as client engagement on investment implementation. Allen is responsible for helping clients make sense of the markets and turning insights into actionable strategies.
Brendan Conway Vice President, Senior Financial Writer
Brendan is a senior financial writer with GSAM’s Strategic Advisory Solutions. He helps drive content production for Market Strategy, Portfolio Strategy, and Business Practices, as well as for other teams across GSAM.
Steven Russolillo Associate, Financial Writer
Steven is a financial writer with GSAM’s Strategic Advisory Solutions. He is responsible for producing content for Market Strategy, Portfolio Strategy, and Business Practices. Steven contributes to the weekly Market Monitor, monthly Market Pulse, and various other publications across GSAM.
12

3Q2015
Market Know-How 3Q 2015: Situational Awareness | 13

Investors should also consider some of the potential risks of alternative investments: Alternative Strategies. Alternative strategies often engage in leverage and other investment practices that are speculative and involve a high degree of risk. Such practices may increase the volatility of performance and the risk of investment loss, including the entire amount that is invested. Manager experience. Manager risk includes those that exist within a manager’s organization, investment process or supporting systems and infrastructure. There is also a potential for fund-level risks that arise from the way in which a manager constructs and manages the fund. Leverage. Leverage increases a fund’s sensitivity to market movements. Funds that use leverage can be expected to be more “volatile” than other funds that do not use leverage. This means if the investments a fund buys decrease in market value, the value of the fund’s shares will decrease by even more. Counterparty risk. Alternative strategies often make significant use of over- the- counter (OTC) derivatives and therefore are subject to the risk that counterparties will not perform their obligations under such contracts. Liquidity risk. Alternative strategies may make investments that are illiquid or that may become less liquid in response to market developments. At times, a fund may be unable to sell certain of its illiquid investments without a substantial drop in price, if at all. Valuation risk. There is risk that the values used by alternative strategies to price investments may be different from those used by other investors to price the same investments. The above are not an exhaustive list of potential risks. There may be additional risks that should be considered before any investment decision.
Equity securities are more volatile than fixed income securities and subject to greater risks. Small and mid-sized company stocks involve greater risks than those customarily associated with larger companies. An investment in real estate securities is subject to greater price volatility and the special risks associated with direct ownership of real estate.
Dividends are not guaranteed and a company’s future ability to pay dividends may be limited.
Investments in fixed-income securities are subject to credit and interest rate risks. Bond prices fluctuate inversely to changes in interest rates. Therefore, a general rise in interest rates can result in the decline in the bond’s price. Credit risk is the risk that an issuer will default on payments of interest and principal. This risk is higher when investing in high yield bonds, also known as junk bonds, which have lower ratings and are subject to greater volatility. All fixed income investments may be worth less than their original cost upon redemption or maturity.
Although Treasuries are considered free from credit risk, they are subject to interest rate risk, which may cause the underlying value of the security to fluctuate.
The currency market affords investors a substantial degree of leverage. This leverage presents the potential for substantial profits but also entails a high degree of risk including the risk that losses may be similarly substantial. Such transactions are considered suitable only for investors who are experienced in transactions of that kind. Currency fluctuations will also affect the value of an investment.
Investments in commodities may be affected by changes in overall market movements, commodity index volatility, changes in interest rates or factors affecting a particular industry or commodity. Energy infrastructure companies may be adversely affected by changes in worldwide energy prices, exploration, reduction spending, government regulation, and changes in exchange rates, depletion of natural resources and the risks that arise from extreme weather conditions. Investments in foreign securities entail special risks such as currency, political, economic, and market risks. These risks are heightened in emerging markets.
A covered call writing (selling) strategy involves special risks. Successful options strategies may require the anticipation of future movements in securities prices, interest rates and other economic factors. No assurance can be given that such judgments will be correct.
In a rising market, the strategy could significantly underperform the market, and the options strategies may not fully protect it against declines in the value of the market.
Risk Disclosures
14

Goldman Sachs does not provide accounting, tax, or legal advice. Notwithstanding anything in this document to the contrary, and except as required to enable compliance with applicable securities law, you may disclose to any person the US federal and state income tax treatment and tax structure of the transaction and all materials of any kind (including tax opinions and other tax analyses) that are provided to you relating to such tax treatment and tax structure, without Goldman Sachs imposing any limitation of any kind. Investors should be aware that a determination of the tax consequences to them should take into account their specific circumstances and that the tax law is subject to change in the future or retroactively and investors are strongly urged to consult with their own tax advisor regarding any potential strategy, investment or transaction.
This information discusses general market activity, industry or sector trends, or other broad-based economic, market or political conditions and should not be construed as research or investment advice. This material has been prepared by GSAM and is not financial research nor a product of Goldman Sachs Global Investment Research (GIR). It was not prepared in compliance with applicable provisions of law designed to promote the independence of financial analysis and is not subject to a prohibition on trading following the distribution of financial research. The views and opinions expressed may differ from those of Goldman Sachs Global Investment Research or other departments or divisions of Goldman Sachs and its affiliates. Investors are urged to consult with their financial advisors before buying or selling any securities. This information may not be current and GSAM has no obligation to provide any updates or changes.
Economic and market forecasts presented herein reflect a series of assumptions and judgments as of the date of this presentation and are subject to change without notice. These forecasts do not take into account the specific investment objectives, restrictions, tax and financial situation or other needs of any specific client. Actual data will vary and may not be reflected here. These forecasts are subject to high levels of uncertainty that may affect actual performance. Accordingly, these forecasts should be viewed as merely representative of a broad range of possible outcomes. These forecasts are estimated, based on assumptions, and are subject to significant revision and may change materially as economic and market conditions change. Goldman Sachs has no obligation to provide updates or changes to these forecasts. Case studies and examples are for illustrative purposes only.
Although certain information has been obtained from sources believed to be reliable, we do not guarantee its accuracy, completeness or fairness. We have relied upon and assumed without independent verification, the accuracy and completeness of all information available from public sources.
These examples are for illustrative purposes only and are not actual results. If any assumptions used do not prove to be true, results may vary substantially.
Views and opinions expressed are for informational purposes only and do not constitute a recommendation by GSAM to buy, sell, or hold any security. Views and opinions are current as of the date of this presentation and may be subject to change, they should not be construed as investment advice.
This material is provided for informational purposes only and should not be construed as investment advice or an offer or solicitation to buy or sell securities.
Past performance does not guarantee future results, which may vary. The value of investments and the income derived from investments will fluctuate and can go down as well as up. A loss of principal may occur.
United Kingdom and European Economic Area (EEA): In the United Kingdom, this material is a financial promotion and has been approved by Goldman Sachs Asset Management International, which is authorized and regulated in the United Kingdom by the Financial Conduct Authority.
Asia Pacific: Please note that neither Goldman Sachs Asset Management International nor any other entities involved in the Goldman Sachs Asset Management (GSAM) business maintain any licenses, authorizations, or registrations in Asia
(other than Japan), except that it conducts businesses (subject to applicable local regulations) in and from the following jurisdictions: Hong Kong, Singapore, Malaysia, and India. This material has been issued for use in or from Hong Kong by Goldman Sachs (Asia) L.L.C, in or from Singapore by Goldman Sachs (Singapore) Pte. (Company Number: 198602165W), in or from Malaysia by Goldman Sachs (Malaysia) Sdn Berhad (880767W), and in or from India by Goldman Sachs Asset Management (India) Private Limited (GSAM India).
Australia: This material is distributed in Australia and New Zealand by Goldman Sachs Asset Management Australia Pty Ltd ABN 41 006 099 681, AFSL 228948 (’GSAMA’) and is intended for viewing only by wholesale clients in Australia for the purposes of section 761G of the Corporations Act 2001 (Cth) and to clients who either fall within any or all of the categories of investors set out in section 3(2) or sub-section 5(2CC) of the Securities Act 1978 (NZ) and fall within the definition of a wholesale client for the purposes of the Financial Service Providers (Registration and Dispute Resolution) Act 2008 (FSPA) and the Financial Advisers Act 2008 (FAA) of New Zealand. GSAMA is not a registered financial service provider under the FSPA. GSAMA does not have a place of business in New Zealand. In New Zealand, this document, and any access to it, is intended only for a person who has first satisfied GSAMA that the person falls within the definition of a wholesale client for the purposes of both the FSPA and the FAA. This document is intended for viewing only by the intended recipient. This document may not be reproduced or distributed to any person in whole or in part without the prior written consent of GSAMA. This information discusses general market activity, industry or sector trends, or other broad based economic, market or political conditions and should not be construed as research or investment advice. The material provided herein is for informational purposes only. This presentation does not constitute an offer or solicitation to any person in any jurisdiction in which such offer or solicitation is not authorized or to any person to whom it would be unlawful to make such offer or solicitation.
Canada: This material has been communicated in Canada by Goldman Sachs Asset Management, L.P. (GSAM LP). GSAM LP is registered as a portfolio manager under securities legislation in certain provinces of Canada, as a non-resident commodity trading manager under the commodity futures legislation of Ontario and as a portfolio manager under the derivatives legislation of Quebec. In other provinces, GSAM LP conducts its activities under exemptions from the adviser registration requirements. In certain provinces, GSAM LP is not registered to provide investment advisory or portfolio management services in respect of exchange-traded futures or options contracts and is not offering to provide such investment advisory or portfolio management services in such provinces by delivery of this material.
Japan: This material has been issued or approved in Japan for the use of professional investors defined in Article 2 paragraph (31) of the Financial Instruments and Exchange Law by Goldman Sachs Asset Management Co., Ltd. Goldman Sachs AG.
Switzerland: This document is provided to you by Goldman Sachs Bank AG, Zürich. Any future contractual relationships will be entered into with affiliates of Goldman Sachs Bank AG, which are domiciled outside of Switzerland. We would like to remind you that foreign (Non-Swiss) legal and regulatory systems may not provide the same level of protection in relation to client confidentiality and data protection as offered to you by Swiss law.
Confidentiality
No part of this material may, without GSAM’s prior written consent, be (i) copied, photocopied or duplicated in any form, by any means, or (ii) distributed to any person that is not an employee, officer, director, or authorized agent of the recipient.
Goldman, Sachs & Co., member FINRA.
© 2015 Goldman Sachs. All rights reserved.
Date of first use: 6/22/2015. 165204.OTHER.MED.OTU/164663.MF.MED.OTU
General Disclosures
Market Know-How 3Q 2015: Situational Awareness | 15

Equities
The S&P 500 Index is the Standard & Poor’s 500 Composite Stock Prices Index of 500 stocks, an unmanaged index of common stock prices. The index figures do not reflect any deduction for fees, expenses or taxes. It is not possible to invest directly in an unmanaged index.
The S&P 500 Dividend Aristocrats Index is an equal-weighted index that measures the performance of S&P 500 companies that have increased dividends every year for the last 25 consecutive years.
The Russell 2000 Index is an unmanaged index of common stock prices that measures the performance of the small-cap segment of the US equity universe.
The MSCI AC Asia Pacific ex Japan Index (MXAPJ) is a free float adjusted market capitalization weighted index that is designed to measure the equity market performance of Asia, excluding Japan.
The STOXX Europe 600 Index is derived from the STOXX Europe Total Market Index (TMI) and is a subset of the STOXX Global 1800 Index. With a fixed number of 600 components, the STOXX Europe 600 Index represents large, mid and small capitalization companies across 18 countries of the European region.
The Japanese TOPIX Index is a capitalization-weighted index of the largest companies and corporations that are found in the First Section of the Tokyo Stock Exchange.
The S&P Developed ex US Small Cap Index comprises of stocks representing the lowest 15% of float-adjusted market cap in each developed country.
Fixed Income
The federal funds rate is the interest rate at which depository institutions lend balances at the Federal Reserve to other depository institutions overnight.
The 10-Year Treasury is a US Treasury debt obligation that has a maturity of 10 years.
The German 10-Year Bund is a German Bundesbank debt obligation that has a maturity of 10 years.
The Switzerland 10-Year Bond is a Switzerland government bond that has a maturity of 10 years.
The Japanese 10-Year Bond is a Japanese government bond that has a maturity of 10 years.
The Australian 10-Year Bond is a Australian government bond that has a maturity of 10 years.
The UK 10-Year Bond is a UK government bond that has a maturity of 10 years.
Other
The CBOE S&P 500 BuyWrite Index is a benchmark designed to track the performance of a hypothetical buy-write strategy on the S&P 500 Index.
The HFRI Fund of Funds Composite Index (“HFRI FoF Composite Index”) is an equally weighted hedge fund index including over 650 domestic and off-shore fund of funds. The index is rebalanced monthly with performance updates three times per month.
Index Benchmarks
Indices are unmanaged. The figures for the index reflect the reinvestment of all income or dividends, as applicable, but do not reflect the deduction of any fees or expenses which would reduce returns. Investors cannot invest directly in indices.
The indices referenced herein have been selected because they are well known, easily recognized by investors, and reflect those indices that the Investment Manager believes, in part based on industry practice, provide a suitable benchmark against which to evaluate the investment or broader market described herein.
Glossary
16

A Long-term PartnershipStrategic Advisory Solutions provides a comprehensive
suite of integrated solutions designed to help our clients
grow and enhance their businesses. Our global team
of experienced strategists aims to deliver in-depth
expertise to help clients understand dynamic markets,
design well-diversified strategic portfolios, and
implement industry best practices through programs
tailored to each organization. We partner with our
clients to develop actionable solutions to help them
achieve their goals.
For more information, contact us at [email protected].

GSAMFUNDS.com
As of March 31, 2015. GSAM leverages the resources of Goldman, Sachs & Co. subject to legal, internal, and regulatory restrictions. Assets Under Supervision (AUS) includes assets under management and other client assets for which Goldman Sachs does not have full discretion. SASMARKET3Q15
New York
San Francisco
Los Angeles
Salt Lake City
Boulder
Chicago
Toronto
Miami
Greenwich
Burlington
Boston
São Paulo
London
Madrid
Paris
Amsterdam
Geneva
Zurich
Frankfurt
Milan
Stockholm
Dubai
Mumbai
Bangalore
Hong Kong
Kuala Lumpur
Singapore
Beijing
Shanghai
Seoul
Tokyo
Melbourne
Sydney
Goldman Sachs Asset Management is one of the world’s leading investment managers. With more than 2,000 professionals across 33 offices worldwide, GSAM provides institutional and individual investors with investment and advisory solutions, with strategies spanning asset classes, industries, and geographies. Our investment solutions include fixed income, money markets, public equity, commodities, hedge funds, private equity, and real estate. Our clients access these solutions through our proprietary strategies, strategic partnerships, and our open architecture programs.
Our investment teams represent over 700 investment professionals, capitalizing on the market insights, risk management expertise, and technology of Goldman Sachs. We help our clients navigate today’s dynamic markets and identify the opportunities that shape their portfolios and long-term investment goals. We extend these global capabilities to the world’s leading pension plans, sovereign wealth funds, central banks, insurance companies, financial institutions, endowments, foundations, individuals, and family offices, for whom we invest or advise on more than $1 trillion of assets.