Embed Size (px)
Citation preview
FOR IMMEDIATE RELEASE For more information contact: José Luis Ronsini CFO – Grupo Financiero Galicia S.A. Telephone: (5411) 4343-7528 Pablo Firvida Institutional Relations Manager Tel.: (54-11) 6329-4881 [email protected] www.gfgsa.com
GRUPO FINANCIERO GALICIA S.A. REPORTS FINANCIAL RESULTS FOR THE QUARTER AND THE FISCAL YEAR ENDED DECEMBER 31, 2017
Buenos Aires, Argentina, February 8, 2018 - Grupo Financiero Galicia S.A. (“Grupo Financiero Galicia”; Buenos Aires Stock Exchange: GGAL /NASDAQ: GGAL) today announced its financial results for the quarter and the fiscal year ended on December 31, 2017.
HIGHLIGHTS
Net income for the fiscal year ended on December 31, 2017, amounted to Ps. 8,329 million, 38.4% higher than the Ps.6,018 million profit recorded in fiscal year 2016. Net income per share amounted to Ps.5.84, compared to Ps.4.63 per share for fiscal year 2016.
The result of the fiscal year was mainly attributable to the income derived from its interest in Banco de Galicia y Buenos Aires S.A. (“Banco Galicia” or the “Bank”), for Ps.6,915 million (+35.7%), in Sudamericana Holding S.A., for Ps.415 million (-34.4%), and in Galicia Administradora de Fondos S.A., for Ps.428 million (+128.9%), increased by financial results of Ps.689 million, and partially offset by administrative expenses, for Ps.92 million.
Net income for the quarter ended December 31, 2017, amounted to Ps.2,676 million, 51.0% higher than the Ps.1,772 million profit recorded in the fourth quarter of fiscal year 2016. The profit per share for the quarter amounted to Ps.1.88, compared to Ps.1.36 per share for the same quarter of fiscal year 2016.
The result of the quarter was mainly attributable to the income derived from its interest in Banco Galicia, for Ps.1,754 million (+13.0%), in Sudamericana Holding S.A., for Ps.138 million (+40.8%), and in Galicia Administradora de Fondos S.A., for Ps.132 million (+100.0%), increased by financial results for Ps.700 million, and partially offset by administrative expenses for Ps.16 million and by the income tax for Ps.16.
As of December 31, 2017, Grupo Financiero Galicia and its subsidiaries had a staff of 11,649 employees, a network of 657 branches and other points of contact with clients, managed 4.6 million deposit accounts and 13.5 million credit cards.
CONFERENCE CALL
On Friday, February 9, 2018, at 11:00 A.M. Eastern Standard Time (1:00 P.M. Buenos Aires Time), GFG will host a conference call to review this results. The call-in number is: +1 323-794-2093 - Conference ID: 7506959.
2
GRUPO FINANCIERO GALICIA S.A.
RESULTS FOR THE FISCAL YEAR ENDED DECEMBER 31, 2017
In millions of pesos, except percentages
Table I
FY2017 FY2016 Variation (%) (*) Result by Business
Income from Equity Investments in:
Banco de Galicia y Buenos Aires S.A. 6,915 5,094 35.7
Sudamericana Holding S.A. 415 633 (34.4)
Galicia Administradora de Fondos S.A. 428 187 128.9
Other companies (1) 28 38 (26.3)
Deferred tax adjustment (2) (41) 217 (118.9)
Administrative Expenses (92) (62) 48.4
Financial Results 689 (88) 883.0
Other income and expenses 3 (1) 400.0
Income Tax (16) - -
Net Income 8,329 6,018 38.4
(*) Calculated using figures in millions, with decimals. (1) Includes the results from our interests in Compañía Financiera Argentina S.A. (3%), Galicia Warrants S.A. (87.5%) and Net Investment S.A. (in liquidation) (87.5%), and beginning on May 2017 in Galicia Valores S.A. (1%). (2) Income tax charge determined by Banco Galicia´s subsidiaries in accordance with the deferred tax method.
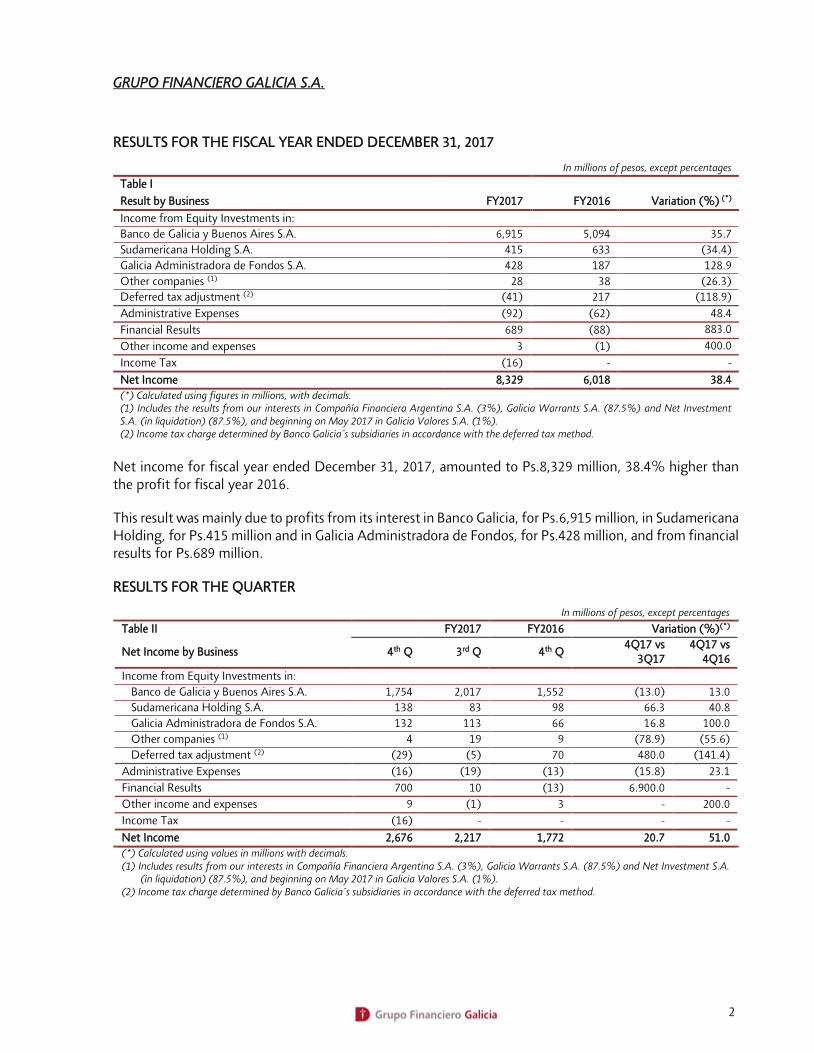
Net income for fiscal year ended December 31, 2017, amounted to Ps.8,329 million, 38.4% higher than the profit for fiscal year 2016.
This result was mainly due to profits from its interest in Banco Galicia, for Ps.6,915 million, in Sudamericana Holding, for Ps.415 million and in Galicia Administradora de Fondos, for Ps.428 million, and from financial results for Ps.689 million.
RESULTS FOR THE QUARTER
In millions of pesos, except percentages
Table II FY2017 FY2016 Variation (%)(*)
Net Income by Business 4th Q 3rd Q 4th Q 4Q17 vs
3Q17 4Q17 vs
4Q16
Income from Equity Investments in:
Banco de Galicia y Buenos Aires S.A. 1,754 2,017 1,552 (13.0) 13.0
Sudamericana Holding S.A. 138 83 98 66.3 40.8
Galicia Administradora de Fondos S.A. 132 113 66 16.8 100.0
Other companies (1) 4 19 9 (78.9) (55.6)
Deferred tax adjustment (2) (29) (5) 70 480.0 (141.4)
Administrative Expenses (16) (19) (13) (15.8) 23.1
Financial Results 700 10 (13) 6.900.0 -
Other income and expenses 9 (1) 3 - 200.0
Income Tax (16) - - - -
Net Income 2,676 2,217 1,772 20.7 51.0
(*) Calculated using values in millions with decimals. (1) Includes results from our interests in Compañía Financiera Argentina S.A. (3%), Galicia Warrants S.A. (87.5%) and Net Investment S.A.
(in liquidation) (87.5%), and beginning on May 2017 in Galicia Valores S.A. (1%). (2) Income tax charge determined by Banco Galicia´s subsidiaries in accordance with the deferred tax method.
3
In pesos, except stated otherwise and percentages
Table III FY2017 FY2016 Twelve Months Ended
Principal Indicators 4th Q 4th Q 12/31/17 12/31/16
Earnings per Share
Average Shares Outstanding (in thousands) 1,426,765 1,300,265 1,426,765 1,300,265
Earnings per Share (1)(2) 1.88 1.36 5.84 4.63
Book Value per Share(1) 27.54 15.65 27.54 15.65
Closing Price
Shares - Buenos Aires Stock Exchange 123.70 42.70
ADS - Nasdaq (in dollars) 65.85 26.92
Price/Book Value 4.49 2.73
Average Daily Volume (amounts in thousands)
Buenos Aires Stock Exchange 644 517 593 495
Nasdaq (3) 4,927 3,059 4,549 3,027
Profitability (%)
Return on Average Assets (4) 4.01 3.59 3.52 3.48
Return on Average Shareholders´ Equity (4) 28.39 36.45 30.91 35.03
(1) 10 ordinary shares = 1 ADS. (2) Earnings for the period divided by the shares outstanding at the end of the period. (3) Expressed in equivalent shares. (4) Annualized.
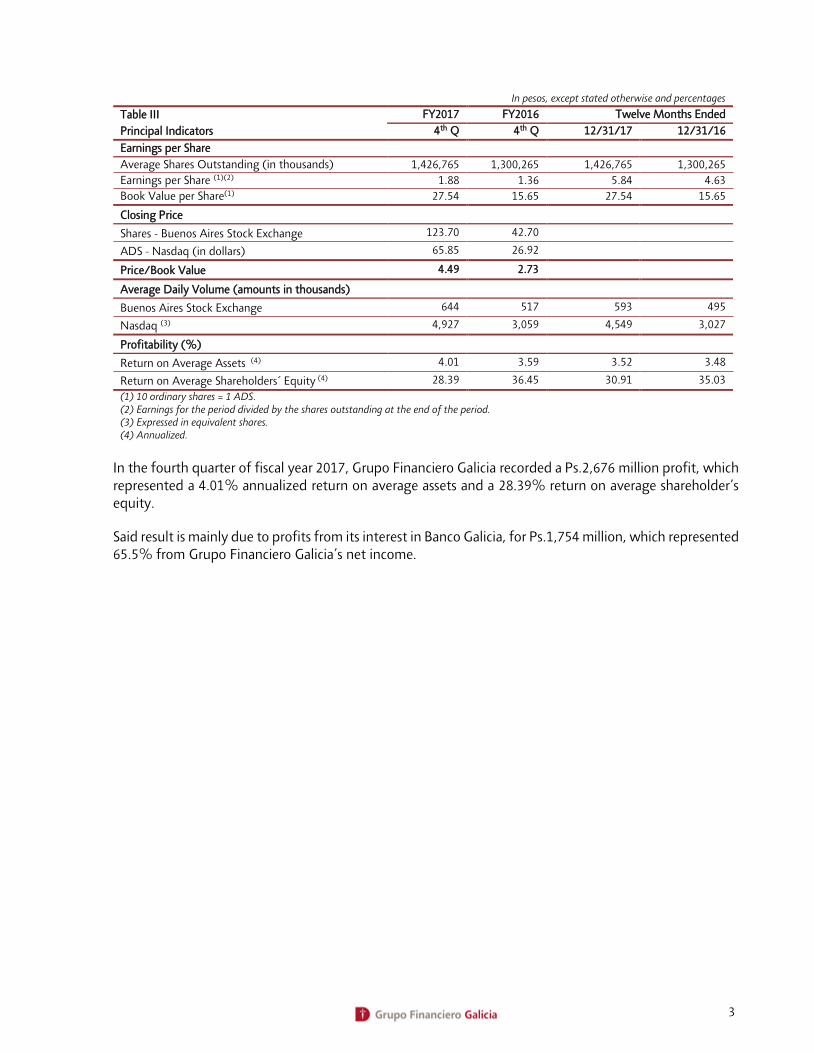
In the fourth quarter of fiscal year 2017, Grupo Financiero Galicia recorded a Ps.2,676 million profit, which represented a 4.01% annualized return on average assets and a 28.39% return on average shareholder’s equity.
Said result is mainly due to profits from its interest in Banco Galicia, for Ps.1,754 million, which represented 65.5% from Grupo Financiero Galicia’s net income.
4
Grupo Financiero Galicia S.A. – Selected Financial Information – Consolidated Data In millions of pesos
FY2017 FY2016
4th Q 3rd Q 2nd Q 1st Q 4th Q
Consolidated Balance Sheet
Cash and due from Banks 56,659 36,152 33,334 50,221 61,166
Government and Corporate Securities 38,771 32,221 29,717 25,590 13,701
Net Loans 197,335 173,744 159,873 146,443 137,452
Other Receivables Resulting from Financial Brokerage 33,359 18,412 17,486 20,773 18,178
Equity Investments in other Companies 29 28 45 54 53
Bank Premises and Equipment, Miscellaneous and Intangible Assets 8,670 7,866 7,485 7,098 6,678
Other Assets 6,190 5,979 5,233 5,849 5,023
Total Assets 341,013 274,402 253,173 256,028 242,251
Deposits 203,451 164,415 158,152 158,652 151,688
Other Liabilities Resulting from Financial Brokerage 81,343 59,226 57,654 62,480 57,794
Subordinated Negotiable Obligations 4,828 4,360 4,261 3,865 4,065
Other Liabilities 10,156 9,440 7,972 7,520 6,889
Minority Interest 1,935 1,766 1,585 1,558 1,462
Total Liabilities 301,713 239,207 229,624 234,075 221,898
Shareholders´ Equity 39,300 35,195 23,549 21,953 20,353
Consolidated Income Statement
Financial Income 13,218 11,289 10,725 9,988 9,502
Financial Expenses (5,652) (4,799) (4,777) (5,117) (4,515)
Gross Brokerage Margin 7,566 6,490 5,948 4,871 4,987
Provisions for Loan Losses (1,468) (1,131) (1,449) (1,157) (1,311)
Income from Services, Net 3,876 3,544 3,594 3,461 3,169
Income from Insurance Activities 606 471 515 525 615
Administrative Expenses (6,439) (5,686) (5,735) (5,131) (5,054)
Minority Interest (169) (181) (95) (181) (133)
Income from Equity Investments 10 42 163 6 2
Net Other Income 142 110 (12) 178 474
Income Tax (1,448) (1,442) (1,094) (971) (977)
Net Income 2,676 2,217 1,835 1,601 1,772
5
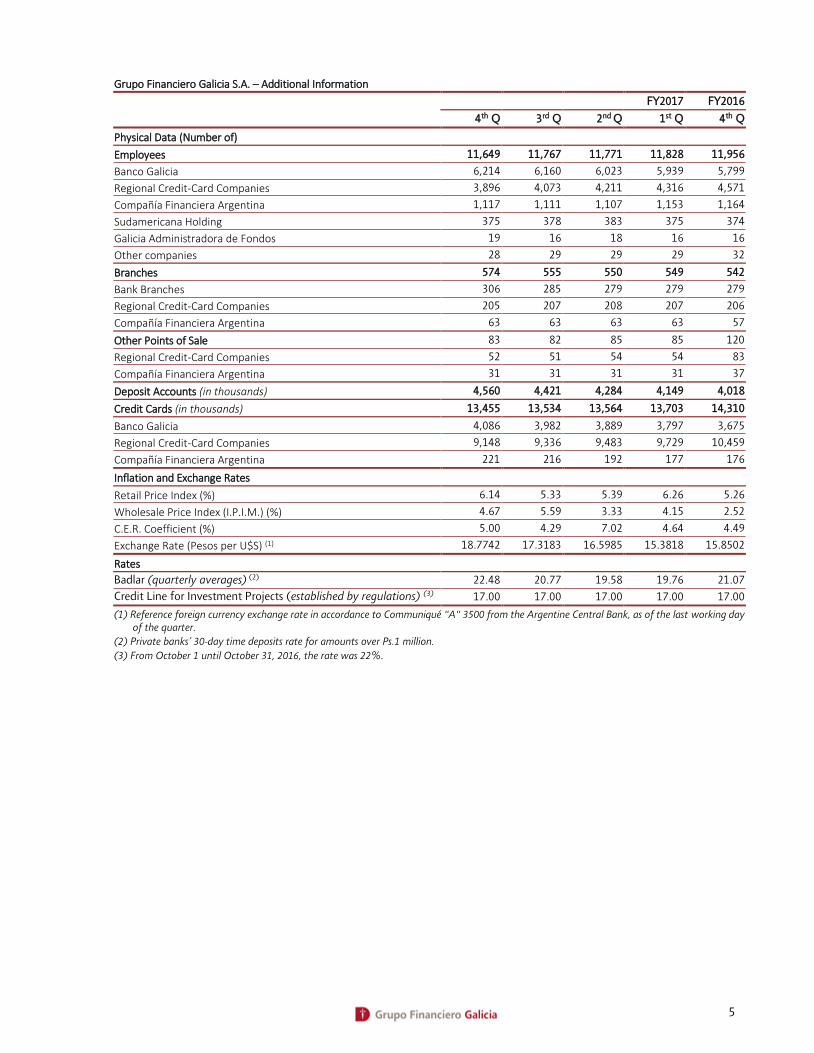
Grupo Financiero Galicia S.A. – Additional Information
FY2017 FY2016
4th Q 3rd Q 2nd Q 1st Q 4th Q
Physical Data (Number of)
Employees 11,649 11,767 11,771 11,828 11,956
Banco Galicia 6,214 6,160 6,023 5,939 5,799
Regional Credit-Card Companies 3,896 4,073 4,211 4,316 4,571
Compañía Financiera Argentina 1,117 1,111 1,107 1,153 1,164
Sudamericana Holding 375 378 383 375 374
Galicia Administradora de Fondos 19 16 18 16 16
Other companies 28 29 29 29 32
Branches 574 555 550 549 542
Bank Branches 306 285 279 279 279
Regional Credit-Card Companies 205 207 208 207 206
Compañía Financiera Argentina 63 63 63 63 57
Other Points of Sale 83 82 85 85 120
Regional Credit-Card Companies 52 51 54 54 83
Compañía Financiera Argentina 31 31 31 31 37
Deposit Accounts (in thousands) 4,560 4,421 4,284 4,149 4,018
Credit Cards (in thousands) 13,455 13,534 13,564 13,703 14,310
Banco Galicia 4,086 3,982 3,889 3,797 3,675
Regional Credit-Card Companies 9,148 9,336 9,483 9,729 10,459
Compañía Financiera Argentina 221 216 192 177 176
Inflation and Exchange Rates
Retail Price Index (%) 6.14 5.33 5.39 6.26 5.26
Wholesale Price Index (I.P.I.M.) (%) 4.67 5.59 3.33 4.15 2.52
C.E.R. Coefficient (%) 5.00 4.29 7.02 4.64 4.49
Exchange Rate (Pesos per U$S) (1) 18.7742 17.3183 16.5985 15.3818 15.8502
Rates
Badlar (quarterly averages) (2) 22.48 20.77 19.58 19.76 21.07
Credit Line for Investment Projects (established by regulations) (3) 17.00 17.00 17.00 17.00 17.00
(1) Reference foreign currency exchange rate in accordance to Communiqué "A" 3500 from the Argentine Central Bank, as of the last working day of the quarter.
(2) Private banks’ 30-day time deposits rate for amounts over Ps.1 million.
(3) From October 1 until October 31, 2016, the rate was 22%.
6
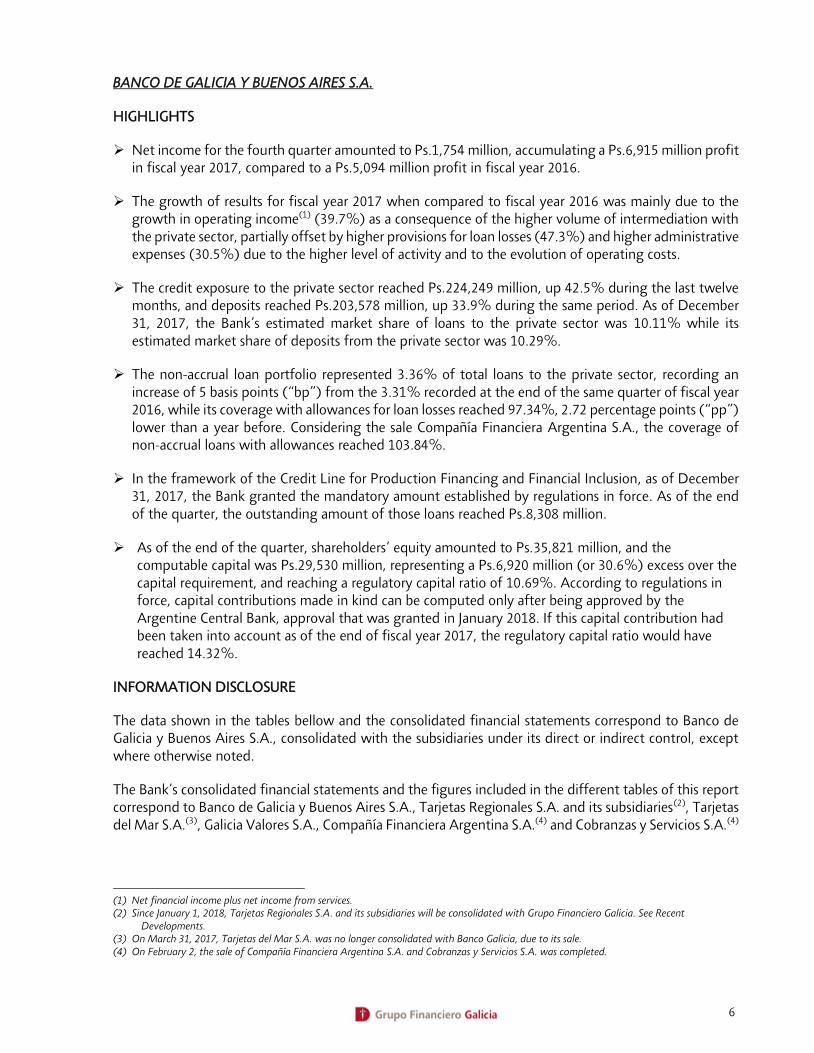
BANCO DE GALICIA Y BUENOS AIRES S.A.
HIGHLIGHTS
Net income for the fourth quarter amounted to Ps.1,754 million, accumulating a Ps.6,915 million profit in fiscal year 2017, compared to a Ps.5,094 million profit in fiscal year 2016.
The growth of results for fiscal year 2017 when compared to fiscal year 2016 was mainly due to the growth in operating income(1) (39.7%) as a consequence of the higher volume of intermediation with the private sector, partially offset by higher provisions for loan losses (47.3%) and higher administrative expenses (30.5%) due to the higher level of activity and to the evolution of operating costs.
The credit exposure to the private sector reached Ps.224,249 million, up 42.5% during the last twelve months, and deposits reached Ps.203,578 million, up 33.9% during the same period. As of December 31, 2017, the Bank’s estimated market share of loans to the private sector was 10.11% while its estimated market share of deposits from the private sector was 10.29%.
The non-accrual loan portfolio represented 3.36% of total loans to the private sector, recording an increase of 5 basis points (“bp”) from the 3.31% recorded at the end of the same quarter of fiscal year 2016, while its coverage with allowances for loan losses reached 97.34%, 2.72 percentage points (“pp”) lower than a year before. Considering the sale Compañía Financiera Argentina S.A., the coverage of non-accrual loans with allowances reached 103.84%.
In the framework of the Credit Line for Production Financing and Financial Inclusion, as of December 31, 2017, the Bank granted the mandatory amount established by regulations in force. As of the end of the quarter, the outstanding amount of those loans reached Ps.8,308 million.
As of the end of the quarter, shareholders’ equity amounted to Ps.35,821 million, and the computable capital was Ps.29,530 million, representing a Ps.6,920 million (or 30.6%) excess over the capital requirement, and reaching a regulatory capital ratio of 10.69%. According to regulations in force, capital contributions made in kind can be computed only after being approved by the Argentine Central Bank, approval that was granted in January 2018. If this capital contribution had been taken into account as of the end of fiscal year 2017, the regulatory capital ratio would have reached 14.32%.
INFORMATION DISCLOSURE
The data shown in the tables bellow and the consolidated financial statements correspond to Banco de Galicia y Buenos Aires S.A., consolidated with the subsidiaries under its direct or indirect control, except where otherwise noted.
The Bank’s consolidated financial statements and the figures included in the different tables of this report correspond to Banco de Galicia y Buenos Aires S.A., Tarjetas Regionales S.A. and its subsidiaries(2), Tarjetas del Mar S.A.(3), Galicia Valores S.A., Compañía Financiera Argentina S.A.(4) and Cobranzas y Servicios S.A.(4)
(1) Net financial income plus net income from services. (2) Since January 1, 2018, Tarjetas Regionales S.A. and its subsidiaries will be consolidated with Grupo Financiero Galicia. See Recent
Developments. (3) On March 31, 2017, Tarjetas del Mar S.A. was no longer consolidated with Banco Galicia, due to its sale. (4) On February 2, the sale of Compañía Financiera Argentina S.A. and Cobranzas y Servicios S.A. was completed.
7
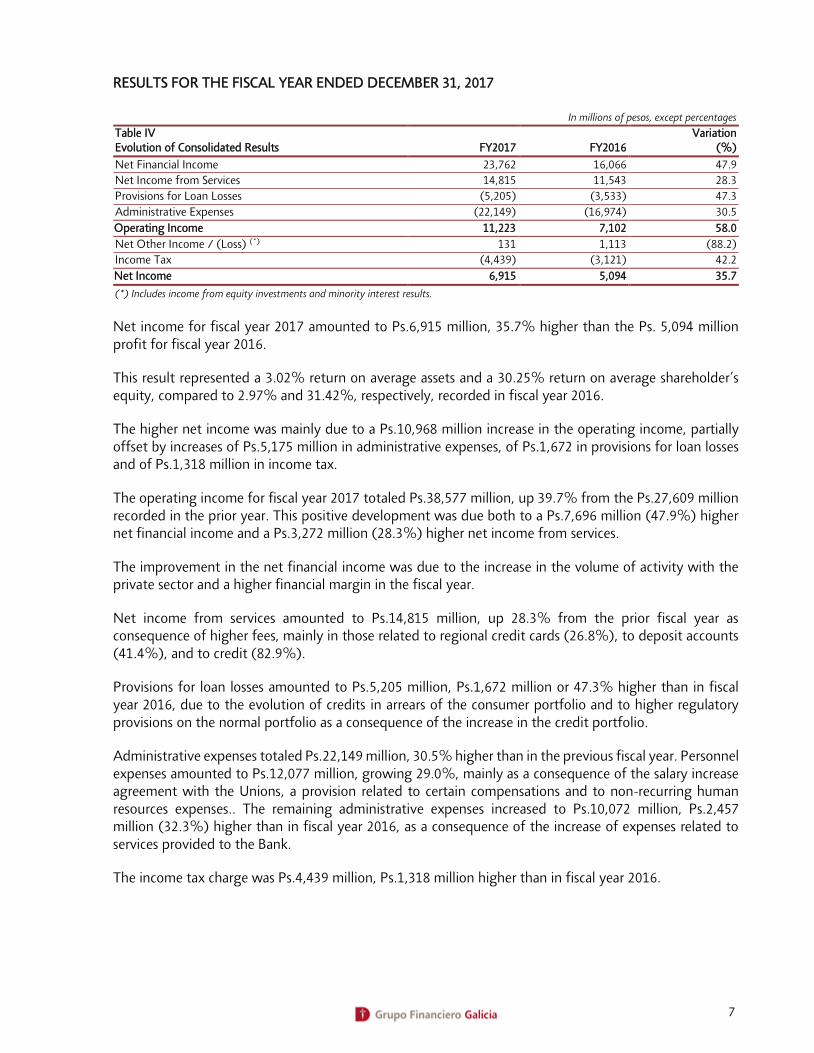
RESULTS FOR THE FISCAL YEAR ENDED DECEMBER 31, 2017
In millions of pesos, except percentages
Table IV Evolution of Consolidated Results FY2017 FY2016
Variation (%)
Net Financial Income 23,762 16,066 47.9
Net Income from Services 14,815 11,543 28.3
Provisions for Loan Losses (5,205) (3,533) 47.3
Administrative Expenses (22,149) (16,974) 30.5
Operating Income 11,223 7,102 58.0
Net Other Income / (Loss) (*) 131 1,113 (88.2)
Income Tax (4,439) (3,121) 42.2
Net Income 6,915 5,094 35.7
(*) Includes income from equity investments and minority interest results.
Net income for fiscal year 2017 amounted to Ps.6,915 million, 35.7% higher than the Ps. 5,094 million profit for fiscal year 2016.
This result represented a 3.02% return on average assets and a 30.25% return on average shareholder’s equity, compared to 2.97% and 31.42%, respectively, recorded in fiscal year 2016.
The higher net income was mainly due to a Ps.10,968 million increase in the operating income, partially offset by increases of Ps.5,175 million in administrative expenses, of Ps.1,672 in provisions for loan losses and of Ps.1,318 million in income tax.
The operating income for fiscal year 2017 totaled Ps.38,577 million, up 39.7% from the Ps.27,609 million recorded in the prior year. This positive development was due both to a Ps.7,696 million (47.9%) higher net financial income and a Ps.3,272 million (28.3%) higher net income from services.
The improvement in the net financial income was due to the increase in the volume of activity with the private sector and a higher financial margin in the fiscal year.
Net income from services amounted to Ps.14,815 million, up 28.3% from the prior fiscal year as consequence of higher fees, mainly in those related to regional credit cards (26.8%), to deposit accounts (41.4%), and to credit (82.9%).
Provisions for loan losses amounted to Ps.5,205 million, Ps.1,672 million or 47.3% higher than in fiscal year 2016, due to the evolution of credits in arrears of the consumer portfolio and to higher regulatory provisions on the normal portfolio as a consequence of the increase in the credit portfolio.
Administrative expenses totaled Ps.22,149 million, 30.5% higher than in the previous fiscal year. Personnel expenses amounted to Ps.12,077 million, growing 29.0%, mainly as a consequence of the salary increase agreement with the Unions, a provision related to certain compensations and to non-recurring human resources expenses.. The remaining administrative expenses increased to Ps.10,072 million, Ps.2,457 million (32.3%) higher than in fiscal year 2016, as a consequence of the increase of expenses related to services provided to the Bank.
The income tax charge was Ps.4,439 million, Ps.1,318 million higher than in fiscal year 2016.
8
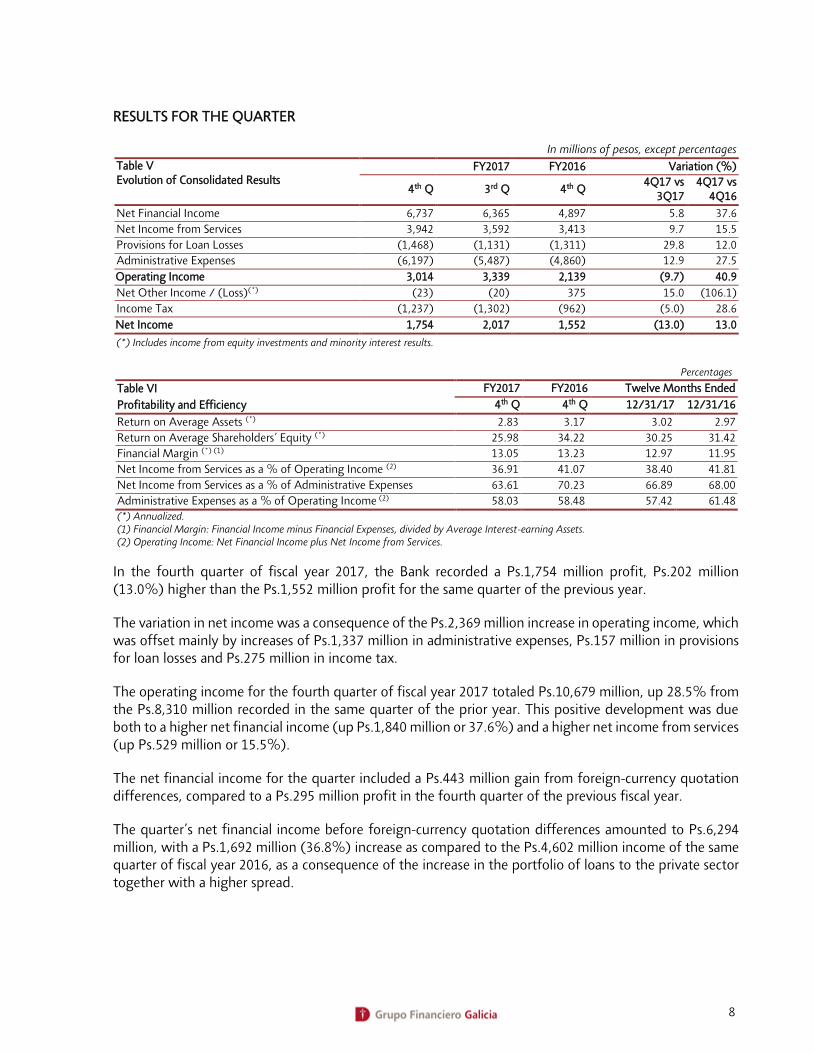
RESULTS FOR THE QUARTER
In millions of pesos, except percentages
Table V Evolution of Consolidated Results
FY2017 FY2016 Variation (%)
4th Q 3rd Q 4th Q 4Q17 vs
3Q17 4Q17 vs
4Q16
Net Financial Income 6,737 6,365 4,897 5.8 37.6
Net Income from Services 3,942 3,592 3,413 9.7 15.5
Provisions for Loan Losses (1,468) (1,131) (1,311) 29.8 12.0
Administrative Expenses (6,197) (5,487) (4,860) 12.9 27.5
Operating Income 3,014 3,339 2,139 (9.7) 40.9
Net Other Income / (Loss)(*) (23) (20) 375 15.0 (106.1)
Income Tax (1,237) (1,302) (962) (5.0) 28.6
Net Income 1,754 2,017 1,552 (13.0) 13.0
(*) Includes income from equity investments and minority interest results.
Percentages
Table VI FY2017 FY2016 Twelve Months Ended
Profitability and Efficiency 4th Q 4th Q 12/31/17 12/31/16
Return on Average Assets (*) 2.83 3.17 3.02 2.97
Return on Average Shareholders’ Equity (*) 25.98 34.22 30.25 31.42
Financial Margin (*) (1) 13.05 13.23 12.97 11.95
Net Income from Services as a % of Operating Income (2) 36.91 41.07 38.40 41.81
Net Income from Services as a % of Administrative Expenses 63.61 70.23 66.89 68.00
Administrative Expenses as a % of Operating Income (2) 58.03 58.48 57.42 61.48
(*) Annualized. (1) Financial Margin: Financial Income minus Financial Expenses, divided by Average Interest-earning Assets. (2) Operating Income: Net Financial Income plus Net Income from Services.
In the fourth quarter of fiscal year 2017, the Bank recorded a Ps.1,754 million profit, Ps.202 million (13.0%) higher than the Ps.1,552 million profit for the same quarter of the previous year.
The variation in net income was a consequence of the Ps.2,369 million increase in operating income, which was offset mainly by increases of Ps.1,337 million in administrative expenses, Ps.157 million in provisions for loan losses and Ps.275 million in income tax.
The operating income for the fourth quarter of fiscal year 2017 totaled Ps.10,679 million, up 28.5% from the Ps.8,310 million recorded in the same quarter of the prior year. This positive development was due both to a higher net financial income (up Ps.1,840 million or 37.6%) and a higher net income from services (up Ps.529 million or 15.5%).
The net financial income for the quarter included a Ps.443 million gain from foreign-currency quotation differences, compared to a Ps.295 million profit in the fourth quarter of the previous fiscal year.
The quarter’s net financial income before foreign-currency quotation differences amounted to Ps.6,294 million, with a Ps.1,692 million (36.8%) increase as compared to the Ps.4,602 million income of the same quarter of fiscal year 2016, as a consequence of the increase in the portfolio of loans to the private sector together with a higher spread.

9
Average balances in millions of pesos. Yields and rates in annualized nominal %
Table VII Average Balances, Yield and Rates(*)
FY2017 FY2016
4th Q 3rd Q 2nd Q 1st Q 4th Q
Av. B. Int. Av. B. Int. Av. B. Int. Av. B. Int. Av. B. Int.
Interest-Earning Assets 206,440 22.35 190,544 21.78 174,010 22.85 162,016 22.86 148,022 24.04
Government Securities 20,329 21.67 20,297 23.08 19,417 22.33 16,386 20.14 18,164 20.52
Loans 181,391 22.32 165,388 21.52 150,387 22.85 139,593 23.08 127,732 24.48
Financial Trusts Securities 146 21.52 260 13.28 368 18.29 452 23.88 532 22.82
Other Interest-Earning Assets 4,574 26.37 4,599 25.87 3,838 25.93 5,585 25.14 1,594 29.35
Interest-Bearing Liabilities 159,611 11.51 150,042 10.70 137,869 10.96 128,575 12.03 109,386 13.58
Current Accounts 3,205 0.01 5,257 0.01 1,756 0.10 1,244 - - -
Saving Accounts 65,494 0.10 61,630 0.08 51,760 0.08 42,086 0.10 34,496 0.09
Time Deposits 61,674 20.12 56,403 19.23 58,521 17.66 59,341 18.38 52,338 20.68
Debt Securities 19,674 22.89 19,617 21.00 19,283 19.38 17,131 16.42 16,761 16.87
Other Interest-Bearing Liabilities 9,564 14.53 7,135 14.46 6,549 15.22 8,773 19.50 5,791 20.35
(*) Does not include foreign-currency quotation differences. Annual nominal interest rates were calculated using a 360-day denominator.
The average interest-earning assets grew Ps.58,418 million (39.5%) as compared to the fourth quarter of the previous fiscal year, primarily as a consequence of the Ps.53,659 million increase in the average portfolio of loans to the private sector (42.0%). Interest-bearing liabilities increased Ps.50,225 million (45.9%) during the same period, primarily due to a Ps.30,998 million increase in the average balances of saving deposits (89.9%), mainly due to the Tax Amnesty Law.
The average yield on interest-earning assets for the fourth quarter of fiscal year 2017 was 22.35%, with a 169 bp decrease compared to the same quarter of the prior year, mainly due to a decrease of 216 bp in the interest rate on loans partially offset by a 115 bp increase in interest rate on government securities. Likewise, the average cost of interest-bearing liabilities was 11.51%, with a 207 bp decrease compared to the fourth quarter of the prior year primarily due to a 56 bp decrease in the average interest rate on time deposits.
In millions of pesos
Table VIII Income from Services, Net
FY2017 FY2016
4th Q 3rd Q 2nd Q 1st Q 4th Q
National Cards 1,410 1,279 1,197 1,370 1,337
Regional Credit Cards 2,188 1,910 1,958 1,808 1,838
CFA 121 115 108 105 103
Deposit Accounts 996 932 919 804 706
Insurance 128 133 141 155 153
Financial Fees 53 51 45 39 37
Credit-Related Fees 174 190 199 121 145
Foreign Trade 140 130 108 106 92
Collections 138 129 123 113 101
Utility-Bills Collection Services 135 120 90 82 75
Mutual Funds 39 33 30 26 22
Other 367 302 276 262 253
Total Income 5,889 5,324 5,194 4,991 4,862
Total Expenditures (1,947) (1,732) (1,521) (1,383) (1,449)
Income from Services, Net 3,942 3,592 3,673 3,608 3,413
10
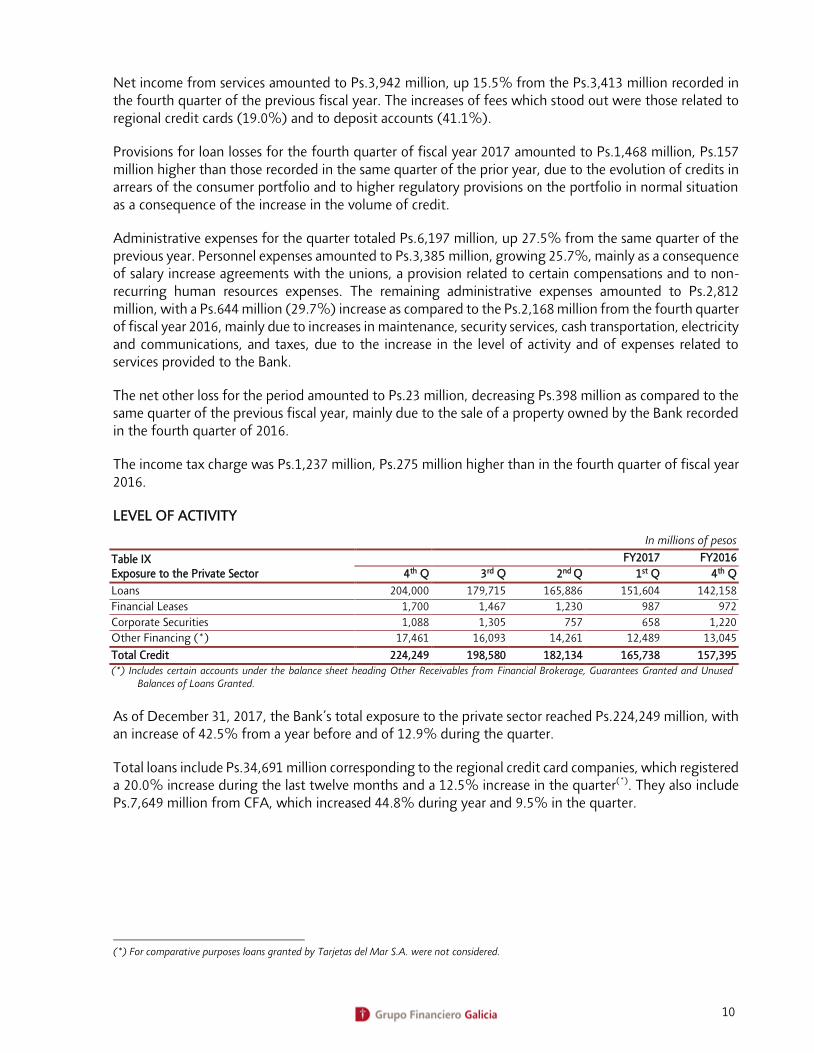
Net income from services amounted to Ps.3,942 million, up 15.5% from the Ps.3,413 million recorded in the fourth quarter of the previous fiscal year. The increases of fees which stood out were those related to regional credit cards (19.0%) and to deposit accounts (41.1%).
Provisions for loan losses for the fourth quarter of fiscal year 2017 amounted to Ps.1,468 million, Ps.157 million higher than those recorded in the same quarter of the prior year, due to the evolution of credits in arrears of the consumer portfolio and to higher regulatory provisions on the portfolio in normal situation as a consequence of the increase in the volume of credit.
Administrative expenses for the quarter totaled Ps.6,197 million, up 27.5% from the same quarter of the previous year. Personnel expenses amounted to Ps.3,385 million, growing 25.7%, mainly as a consequence of salary increase agreements with the unions, a provision related to certain compensations and to non-recurring human resources expenses. The remaining administrative expenses amounted to Ps.2,812 million, with a Ps.644 million (29.7%) increase as compared to the Ps.2,168 million from the fourth quarter of fiscal year 2016, mainly due to increases in maintenance, security services, cash transportation, electricity and communications, and taxes, due to the increase in the level of activity and of expenses related to services provided to the Bank.
The net other loss for the period amounted to Ps.23 million, decreasing Ps.398 million as compared to the same quarter of the previous fiscal year, mainly due to the sale of a property owned by the Bank recorded in the fourth quarter of 2016.
The income tax charge was Ps.1,237 million, Ps.275 million higher than in the fourth quarter of fiscal year 2016.
LEVEL OF ACTIVITY
In millions of pesos
Table IX Exposure to the Private Sector
FY2017 FY2016
4th Q 3rd Q 2nd Q 1st Q 4th Q
Loans 204,000 179,715 165,886 151,604 142,158
Financial Leases 1,700 1,467 1,230 987 972
Corporate Securities 1,088 1,305 757 658 1,220
Other Financing (*) 17,461 16,093 14,261 12,489 13,045
Total Credit 224,249 198,580 182,134 165,738 157,395
(*) Includes certain accounts under the balance sheet heading Other Receivables from Financial Brokerage, Guarantees Granted and Unused Balances of Loans Granted.
As of December 31, 2017, the Bank’s total exposure to the private sector reached Ps.224,249 million, with an increase of 42.5% from a year before and of 12.9% during the quarter.
Total loans include Ps.34,691 million corresponding to the regional credit card companies, which registered a 20.0% increase during the last twelve months and a 12.5% increase in the quarter(*). They also include Ps.7,649 million from CFA, which increased 44.8% during year and 9.5% in the quarter.
(*) For comparative purposes loans granted by Tarjetas del Mar S.A. were not considered.
11
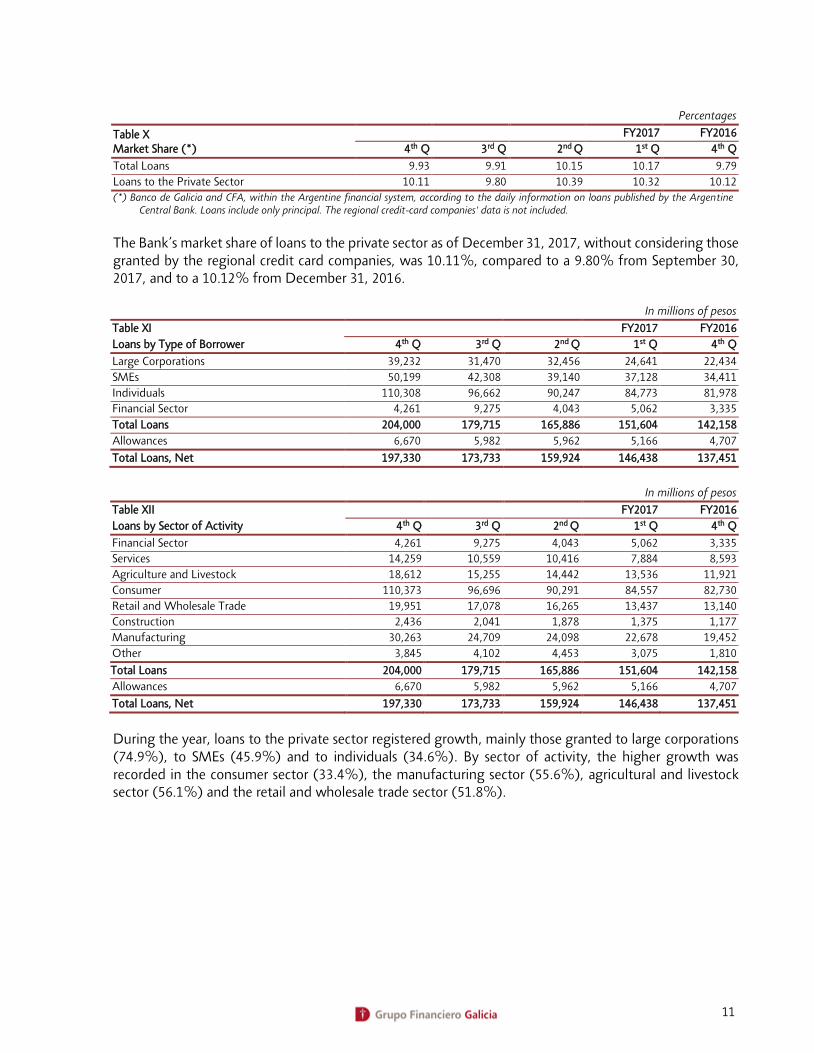
Percentages
Table X Market Share (*)
FY2017 FY2016
4th Q 3rd Q 2nd Q 1st Q 4th Q
Total Loans 9.93 9.91 10.15 10.17 9.79
Loans to the Private Sector 10.11 9.80 10.39 10.32 10.12
(*) Banco de Galicia and CFA, within the Argentine financial system, according to the daily information on loans published by the Argentine Central Bank. Loans include only principal. The regional credit-card companies' data is not included.
The Bank’s market share of loans to the private sector as of December 31, 2017, without considering those granted by the regional credit card companies, was 10.11%, compared to a 9.80% from September 30, 2017, and to a 10.12% from December 31, 2016.
In millions of pesos
Table XI FY2017 FY2016
Loans by Type of Borrower 4th Q 3rd Q 2nd Q 1st Q 4th Q
Large Corporations 39,232 31,470 32,456 24,641 22,434
SMEs 50,199 42,308 39,140 37,128 34,411
Individuals 110,308 96,662 90,247 84,773 81,978
Financial Sector 4,261 9,275 4,043 5,062 3,335
Total Loans 204,000 179,715 165,886 151,604 142,158
Allowances 6,670 5,982 5,962 5,166 4,707
Total Loans, Net 197,330 173,733 159,924 146,438 137,451
In millions of pesos
Table XII FY2017 FY2016
Loans by Sector of Activity 4th Q 3rd Q 2nd Q 1st Q 4th Q
Financial Sector 4,261 9,275 4,043 5,062 3,335
Services 14,259 10,559 10,416 7,884 8,593
Agriculture and Livestock 18,612 15,255 14,442 13,536 11,921
Consumer 110,373 96,696 90,291 84,557 82,730
Retail and Wholesale Trade 19,951 17,078 16,265 13,437 13,140
Construction 2,436 2,041 1,878 1,375 1,177
Manufacturing 30,263 24,709 24,098 22,678 19,452
Other 3,845 4,102 4,453 3,075 1,810
Total Loans 204,000 179,715 165,886 151,604 142,158
Allowances 6,670 5,982 5,962 5,166 4,707
Total Loans, Net 197,330 173,733 159,924 146,438 137,451
During the year, loans to the private sector registered growth, mainly those granted to large corporations (74.9%), to SMEs (45.9%) and to individuals (34.6%). By sector of activity, the higher growth was recorded in the consumer sector (33.4%), the manufacturing sector (55.6%), agricultural and livestock sector (56.1%) and the retail and wholesale trade sector (51.8%).
12
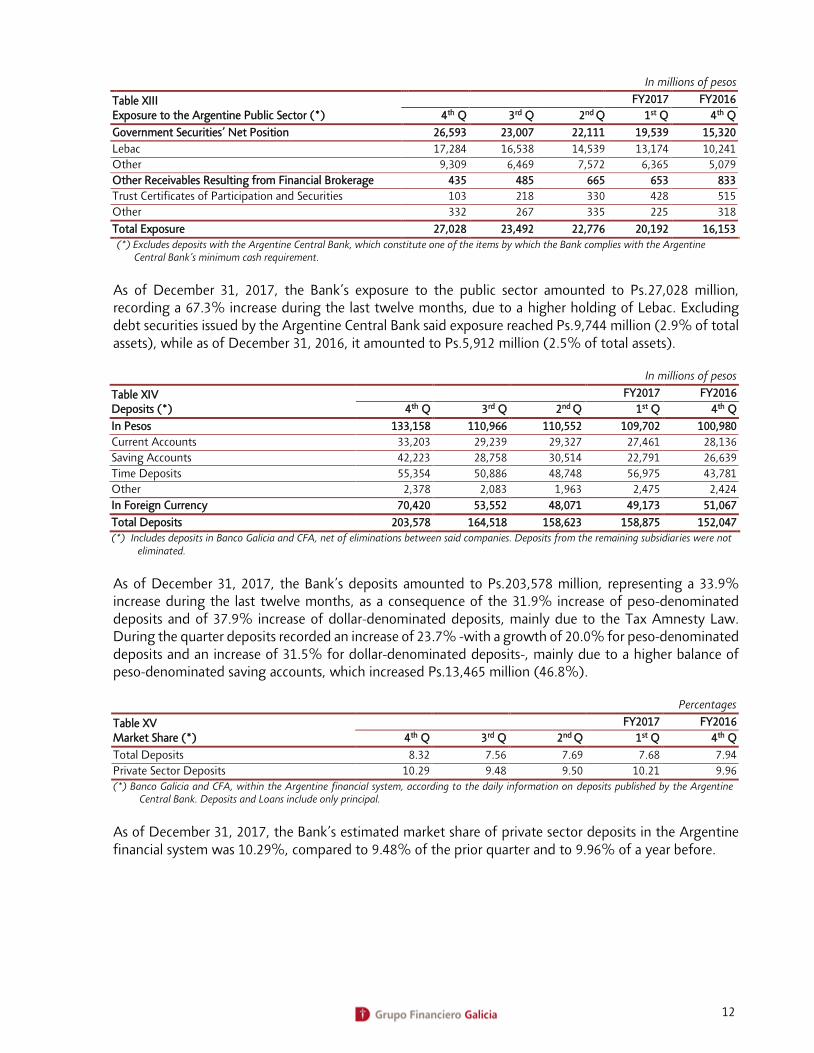
In millions of pesos
Table XIII Exposure to the Argentine Public Sector (*)
FY2017 FY2016
4th Q 3rd Q 2nd Q 1st Q 4th Q
Government Securities’ Net Position 26,593 23,007 22,111 19,539 15,320
Lebac 17,284 16,538 14,539 13,174 10,241
Other 9,309 6,469 7,572 6,365 5,079
Other Receivables Resulting from Financial Brokerage 435 485 665 653 833
Trust Certificates of Participation and Securities 103 218 330 428 515
Other 332 267 335 225 318
Total Exposure 27,028 23,492 22,776 20,192 16,153
(*) Excludes deposits with the Argentine Central Bank, which constitute one of the items by which the Bank complies with the Argentine Central Bank’s minimum cash requirement.
As of December 31, 2017, the Bank’s exposure to the public sector amounted to Ps.27,028 million, recording a 67.3% increase during the last twelve months, due to a higher holding of Lebac. Excluding debt securities issued by the Argentine Central Bank said exposure reached Ps.9,744 million (2.9% of total assets), while as of December 31, 2016, it amounted to Ps.5,912 million (2.5% of total assets).
In millions of pesos
Table XIV Deposits (*)
FY2017 FY2016
4th Q 3rd Q 2nd Q 1st Q 4th Q
In Pesos 133,158 110,966 110,552 109,702 100,980
Current Accounts 33,203 29,239 29,327 27,461 28,136
Saving Accounts 42,223 28,758 30,514 22,791 26,639
Time Deposits 55,354 50,886 48,748 56,975 43,781
Other 2,378 2,083 1,963 2,475 2,424
In Foreign Currency 70,420 53,552 48,071 49,173 51,067
Total Deposits 203,578 164,518 158,623 158,875 152,047
(*) Includes deposits in Banco Galicia and CFA, net of eliminations between said companies. Deposits from the remaining subsidiaries were not eliminated.
As of December 31, 2017, the Bank’s deposits amounted to Ps.203,578 million, representing a 33.9% increase during the last twelve months, as a consequence of the 31.9% increase of peso-denominated deposits and of 37.9% increase of dollar-denominated deposits, mainly due to the Tax Amnesty Law. During the quarter deposits recorded an increase of 23.7% -with a growth of 20.0% for peso-denominated deposits and an increase of 31.5% for dollar-denominated deposits-, mainly due to a higher balance of peso-denominated saving accounts, which increased Ps.13,465 million (46.8%).
Percentages
Table XV Market Share (*)
FY2017 FY2016
4th Q 3rd Q 2nd Q 1st Q 4th Q
Total Deposits 8.32 7.56 7.69 7.68 7.94
Private Sector Deposits 10.29 9.48 9.50 10.21 9.96
(*) Banco Galicia and CFA, within the Argentine financial system, according to the daily information on deposits published by the Argentine Central Bank. Deposits and Loans include only principal.
As of December 31, 2017, the Bank’s estimated market share of private sector deposits in the Argentine financial system was 10.29%, compared to 9.48% of the prior quarter and to 9.96% of a year before.
13
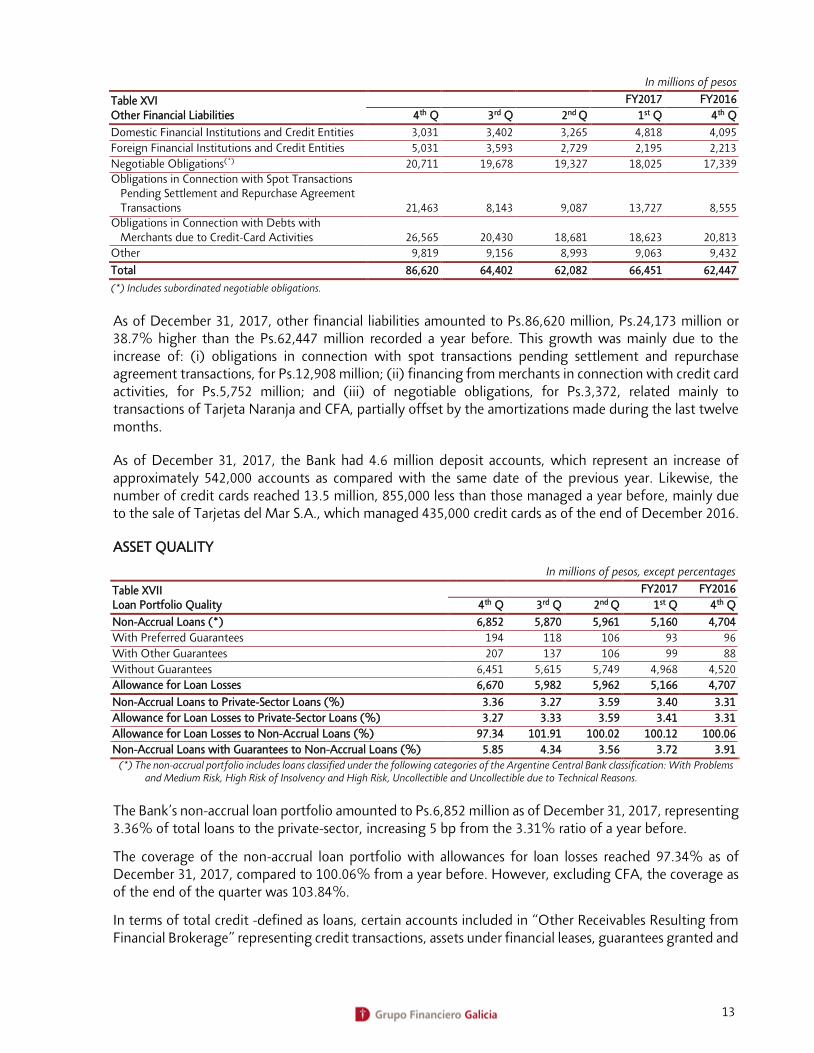
In millions of pesos
Table XVI Other Financial Liabilities
FY2017 FY2016
4th Q 3rd Q 2nd Q 1st Q 4th Q
Domestic Financial Institutions and Credit Entities 3,031 3,402 3,265 4,818 4,095
Foreign Financial Institutions and Credit Entities 5,031 3,593 2,729 2,195 2,213
Negotiable Obligations(*) 20,711 19,678 19,327 18,025 17,339
Obligations in Connection with Spot Transactions Pending Settlement and Repurchase Agreement Transactions 21,463 8,143 9,087 13,727 8,555
Obligations in Connection with Debts with Merchants due to Credit-Card Activities 26,565 20,430 18,681 18,623 20,813
Other 9,819 9,156 8,993 9,063 9,432
Total 86,620 64,402 62,082 66,451 62,447
(*) Includes subordinated negotiable obligations.
As of December 31, 2017, other financial liabilities amounted to Ps.86,620 million, Ps.24,173 million or 38.7% higher than the Ps.62,447 million recorded a year before. This growth was mainly due to the increase of: (i) obligations in connection with spot transactions pending settlement and repurchase agreement transactions, for Ps.12,908 million; (ii) financing from merchants in connection with credit card activities, for Ps.5,752 million; and (iii) of negotiable obligations, for Ps.3,372, related mainly to transactions of Tarjeta Naranja and CFA, partially offset by the amortizations made during the last twelve months.
As of December 31, 2017, the Bank had 4.6 million deposit accounts, which represent an increase of approximately 542,000 accounts as compared with the same date of the previous year. Likewise, the number of credit cards reached 13.5 million, 855,000 less than those managed a year before, mainly due to the sale of Tarjetas del Mar S.A., which managed 435,000 credit cards as of the end of December 2016.
ASSET QUALITY
In millions of pesos, except percentages
Table XVII Loan Portfolio Quality
FY2017 FY2016
4th Q 3rd Q 2nd Q 1st Q 4th Q
Non-Accrual Loans (*) 6,852 5,870 5,961 5,160 4,704
With Preferred Guarantees 194 118 106 93 96
With Other Guarantees 207 137 106 99 88
Without Guarantees 6,451 5,615 5,749 4,968 4,520
Allowance for Loan Losses 6,670 5,982 5,962 5,166 4,707
Non-Accrual Loans to Private-Sector Loans (%) 3.36 3.27 3.59 3.40 3.31
Allowance for Loan Losses to Private-Sector Loans (%) 3.27 3.33 3.59 3.41 3.31
Allowance for Loan Losses to Non-Accrual Loans (%) 97.34 101.91 100.02 100.12 100.06
Non-Accrual Loans with Guarantees to Non-Accrual Loans (%) 5.85 4.34 3.56 3.72 3.91
(*) The non-accrual portfolio includes loans classified under the following categories of the Argentine Central Bank classification: With Problems and Medium Risk, High Risk of Insolvency and High Risk, Uncollectible and Uncollectible due to Technical Reasons.
The Bank’s non-accrual loan portfolio amounted to Ps.6,852 million as of December 31, 2017, representing 3.36% of total loans to the private-sector, increasing 5 bp from the 3.31% ratio of a year before.
The coverage of the non-accrual loan portfolio with allowances for loan losses reached 97.34% as of December 31, 2017, compared to 100.06% from a year before. However, excluding CFA, the coverage as of the end of the quarter was 103.84%.
In terms of total credit -defined as loans, certain accounts included in “Other Receivables Resulting from Financial Brokerage” representing credit transactions, assets under financial leases, guarantees granted and

14
unused balances of loans granted- the Bank’s non-accrual portfolio represented 3.08% of total credit to the private-sector, and its coverage with allowances for loan losses reached 98.05%, compared to 3.01% and 101.16% of a year before, respectively.
On an individual basis Banco Galicia’s non-accrual loan portfolio amounted to Ps.3,390 million as of December 31, 2017, increasing 81.6% during the last twelve months, representing 2.09% of total loans to the private-sector, compared to the 1.74% ratio recorded a year before, recording a 35 bp increase. The coverage with allowances for loan losses reached 106.02%, compared to 117.14% a year before.
In millions of pesos
Table XVIII Consolidated Analysis of Loan Loss Experience
FY2017 FY2016
4th Q 3rd Q 2nd Q 1st Q 4th Q
Allowance for Loan Losses at the Beginning of the Quarter 5,982 5,962 5,166 4,707 4,265
Changes in the Allowance for Loan Losses
Provisions Charged to Income 1,364 1,011 1,354 1,082 1,249
Provisions Reversed - - - - (54)
Charge Offs (676) (991) (558) (623) (753)
Allowance for Loan Losses at Quarter End 6,670 5,982 5,962 5,166 4,707
Charge to the Income Statement
Provisions Charged to Income (1,364) (1,011) (1,354) (1,082) (1,249)
Direct Charge Offs (91) (108) (81) (69) (50)
Bad Debts Recovered 99 131 97 88 143
Provisions Reversed (*) - - - - 54
Net Charge to the Income Statement (1,356) (988) (1,338) (1,063) (1,102)
(*) Recorded under “Net Other Income/(Loss)”.
During the quarter, Ps.676 million were charged off against the allowance for loan losses and direct charges to the income statement for Ps.91 million were made.
In millions of pesos, except ratios
Table XIX Consolidated Regulatory Capital
FY2017 FY2016
4th Q 3rd Q 2nd Q 1st Q 4th Q
Minimum Capital Required (A) 22,610 20,086 17,684 16,441 15,258
Allocated to Credit Risk 17,263 15,222 13,440 12,407 11,511
Allocated to Market Risk 1,126 884 558 624 556
Allocated to Operational Risk 4,221 3,980 3,686 3,410 3,191
Computable Capital (B): 29,530 27,439 25,477 23,454 22,010
Tier I 22,582 21,074 19,384 17,932 16,471
Tier II 6,948 6,365 6,093 5,522 5,539
Excess over Required Capital (B) - (A) 6,920 7,353 7,793 7,013 6,752
Regulatory Ratio (%) 10.69 11.20 11.80 11.68 11.82
As of December 31, 2017, the Bank’s consolidated computable capital was Ps.6,920 million (30.6%) higher than the Ps.22,610 million capital requirement. As of December 31, 2016, this excess amounted to Ps.6,752 million (44.3%).
The minimum capital requirement increased Ps.7,352 million as compared to December 31, 2016, mainly as a result of higher requirements of: (i) Ps.5,752 million due to the growth of the private-sector loan portfolio; and (ii) Ps.1,030 million on operational risk.
Computable capital increased Ps.7,520 million as compared to December 31, 2016, mainly a consequence of a higher Tier I capital, for Ps.6,111 million, mainly due to the higher net income, partially offset by higher deductions, resulting from organization and development expenses. Tier II capital recorded a Ps.1,409 million increase, mainly due to: (i) 100% of the subordinated negotiable obligations issued on
15
July 19, 2016, for U$S 250 million which proceeds were used to cancel in advance the subordinated negotiable obligations due in 2019, of which 24% was considered as computable capital; and (ii) the higher balance of the provision for loan losses on the credit portfolio in normal situation.
According to regulations in force, capital contributions made in kind can be computed only after being approved by the Argentine Central Bank, approval that was granted in January 2018. If this capital contribution had been taken into account as of the end of fiscal year 2017, the regulatory capital ratio would have reached 14.32%.
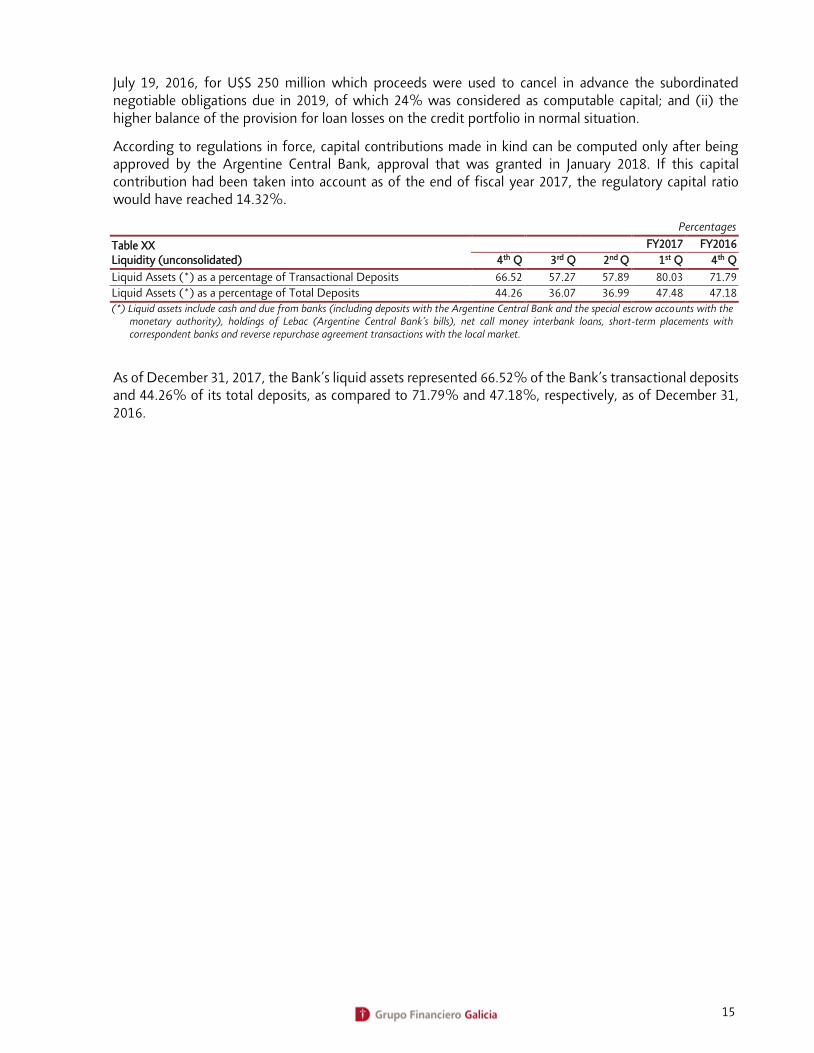
Percentages
Table XX Liquidity (unconsolidated)
FY2017 FY2016
4th Q 3rd Q 2nd Q 1st Q 4th Q
Liquid Assets (*) as a percentage of Transactional Deposits 66.52 57.27 57.89 80.03 71.79
Liquid Assets (*) as a percentage of Total Deposits 44.26 36.07 36.99 47.48 47.18
(*) Liquid assets include cash and due from banks (including deposits with the Argentine Central Bank and the special escrow accounts with the monetary authority), holdings of Lebac (Argentine Central Bank’s bills), net call money interbank loans, short-term placements with correspondent banks and reverse repurchase agreement transactions with the local market.
As of December 31, 2017, the Bank’s liquid assets represented 66.52% of the Bank’s transactional deposits and 44.26% of its total deposits, as compared to 71.79% and 47.18%, respectively, as of December 31, 2016.
16
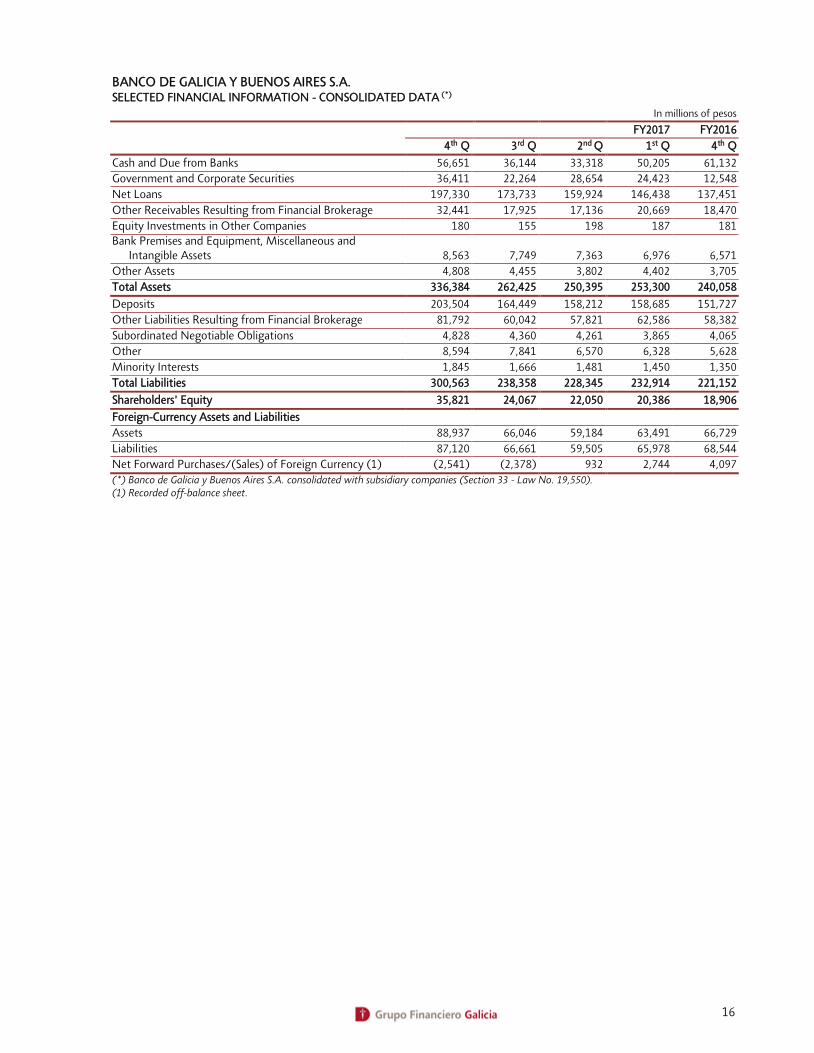
BANCO DE GALICIA Y BUENOS AIRES S.A. SELECTED FINANCIAL INFORMATION - CONSOLIDATED DATA (*)
In millions of pesos
FY2017 FY2016
4th Q 3rd Q 2nd Q 1st Q 4th Q
Cash and Due from Banks 56,651 36,144 33,318 50,205 61,132
Government and Corporate Securities 36,411 22,264 28,654 24,423 12,548
Net Loans 197,330 173,733 159,924 146,438 137,451
Other Receivables Resulting from Financial Brokerage 32,441 17,925 17,136 20,669 18,470
Equity Investments in Other Companies 180 155 198 187 181
Bank Premises and Equipment, Miscellaneous and Intangible Assets 8,563 7,749 7,363 6,976 6,571
Other Assets 4,808 4,455 3,802 4,402 3,705
Total Assets 336,384 262,425 250,395 253,300 240,058
Deposits 203,504 164,449 158,212 158,685 151,727
Other Liabilities Resulting from Financial Brokerage 81,792 60,042 57,821 62,586 58,382
Subordinated Negotiable Obligations 4,828 4,360 4,261 3,865 4,065
Other 8,594 7,841 6,570 6,328 5,628
Minority Interests 1,845 1,666 1,481 1,450 1,350
Total Liabilities 300,563 238,358 228,345 232,914 221,152
Shareholders' Equity 35,821 24,067 22,050 20,386 18,906
Foreign-Currency Assets and Liabilities
Assets 88,937 66,046 59,184 63,491 66,729
Liabilities 87,120 66,661 59,505 65,978 68,544
Net Forward Purchases/(Sales) of Foreign Currency (1) (2,541) (2,378) 932 2,744 4,097
(*) Banco de Galicia y Buenos Aires S.A. consolidated with subsidiary companies (Section 33 - Law No. 19,550). (1) Recorded off-balance sheet.
17
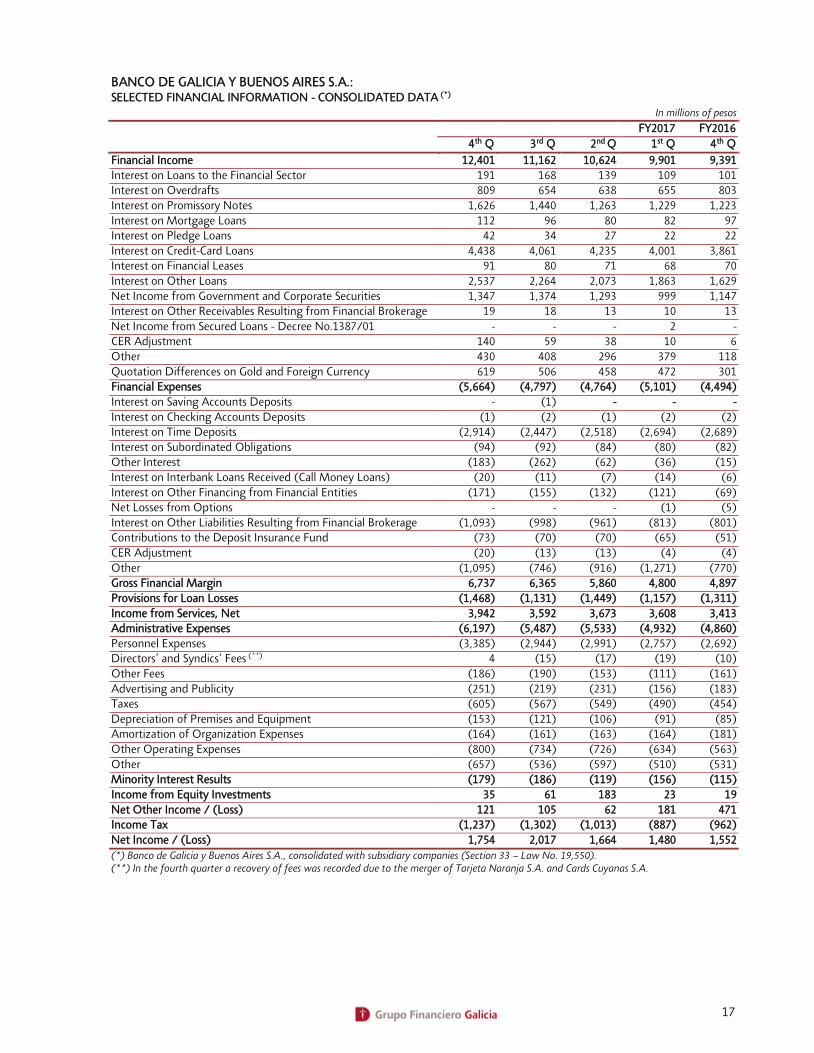
BANCO DE GALICIA Y BUENOS AIRES S.A.: SELECTED FINANCIAL INFORMATION - CONSOLIDATED DATA (*)
In millions of pesos
FY2017 FY2016
4th Q 3rd Q 2nd Q 1st Q 4th Q
Financial Income 12,401 11,162 10,624 9,901 9,391
Interest on Loans to the Financial Sector 191 168 139 109 101
Interest on Overdrafts 809 654 638 655 803
Interest on Promissory Notes 1,626 1,440 1,263 1,229 1,223
Interest on Mortgage Loans 112 96 80 82 97
Interest on Pledge Loans 42 34 27 22 22
Interest on Credit-Card Loans 4,438 4,061 4,235 4,001 3,861
Interest on Financial Leases 91 80 71 68 70
Interest on Other Loans 2,537 2,264 2,073 1,863 1,629
Net Income from Government and Corporate Securities 1,347 1,374 1,293 999 1,147
Interest on Other Receivables Resulting from Financial Brokerage 19 18 13 10 13
Net Income from Secured Loans - Decree No.1387/01 - - - 2 -
CER Adjustment 140 59 38 10 6
Other 430 408 296 379 118
Quotation Differences on Gold and Foreign Currency 619 506 458 472 301
Financial Expenses (5,664) (4,797) (4,764) (5,101) (4,494)
Interest on Saving Accounts Deposits - (1) - - -
Interest on Checking Accounts Deposits (1) (2) (1) (2) (2)
Interest on Time Deposits (2,914) (2,447) (2,518) (2,694) (2,689)
Interest on Subordinated Obligations (94) (92) (84) (80) (82)
Other Interest (183) (262) (62) (36) (15)
Interest on Interbank Loans Received (Call Money Loans) (20) (11) (7) (14) (6)
Interest on Other Financing from Financial Entities (171) (155) (132) (121) (69)
Net Losses from Options - - - (1) (5)
Interest on Other Liabilities Resulting from Financial Brokerage (1,093) (998) (961) (813) (801)
Contributions to the Deposit Insurance Fund (73) (70) (70) (65) (51)
CER Adjustment (20) (13) (13) (4) (4)
Other (1,095) (746) (916) (1,271) (770)
Gross Financial Margin 6,737 6,365 5,860 4,800 4,897
Provisions for Loan Losses (1,468) (1,131) (1,449) (1,157) (1,311)
Income from Services, Net 3,942 3,592 3,673 3,608 3,413
Administrative Expenses (6,197) (5,487) (5,533) (4,932) (4,860)
Personnel Expenses (3,385) (2,944) (2,991) (2,757) (2,692)
Directors’ and Syndics’ Fees (**) 4 (15) (17) (19) (10)
Other Fees (186) (190) (153) (111) (161)
Advertising and Publicity (251) (219) (231) (156) (183)
Taxes (605) (567) (549) (490) (454)
Depreciation of Premises and Equipment (153) (121) (106) (91) (85)
Amortization of Organization Expenses (164) (161) (163) (164) (181)
Other Operating Expenses (800) (734) (726) (634) (563)
Other (657) (536) (597) (510) (531)
Minority Interest Results (179) (186) (119) (156) (115)
Income from Equity Investments 35 61 183 23 19
Net Other Income / (Loss) 121 105 62 181 471
Income Tax (1,237) (1,302) (1,013) (887) (962)
Net Income / (Loss) 1,754 2,017 1,664 1,480 1,552
(*) Banco de Galicia y Buenos Aires S.A., consolidated with subsidiary companies (Section 33 – Law No. 19,550). (**) In the fourth quarter a recovery of fees was recorded due to the merger of Tarjeta Naranja S.A. and Cards Cuyanas S.A.
18
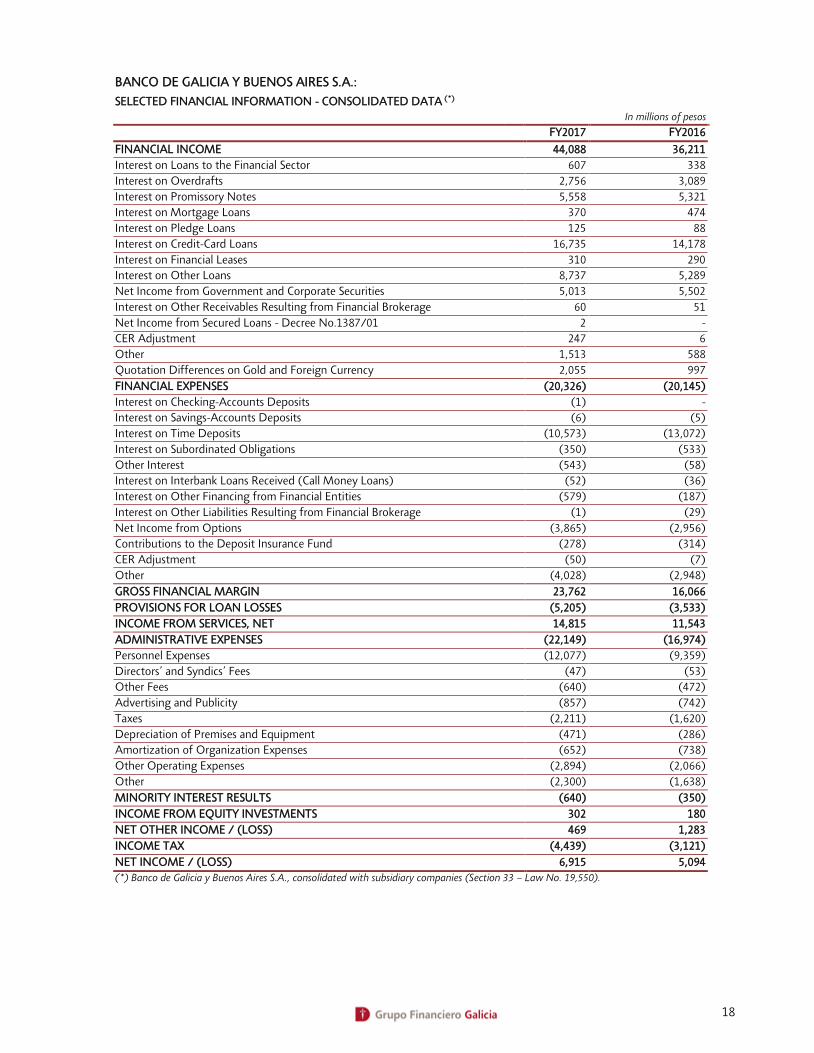
BANCO DE GALICIA Y BUENOS AIRES S.A.:
SELECTED FINANCIAL INFORMATION - CONSOLIDATED DATA (*) In millions of pesos
FY2017 FY2016
FINANCIAL INCOME 44,088 36,211
Interest on Loans to the Financial Sector 607 338
Interest on Overdrafts 2,756 3,089
Interest on Promissory Notes 5,558 5,321
Interest on Mortgage Loans 370 474
Interest on Pledge Loans 125 88
Interest on Credit-Card Loans 16,735 14,178
Interest on Financial Leases 310 290
Interest on Other Loans 8,737 5,289
Net Income from Government and Corporate Securities 5,013 5,502
Interest on Other Receivables Resulting from Financial Brokerage 60 51
Net Income from Secured Loans - Decree No.1387/01 2 -
CER Adjustment 247 6
Other 1,513 588
Quotation Differences on Gold and Foreign Currency 2,055 997
FINANCIAL EXPENSES (20,326) (20,145)
Interest on Checking-Accounts Deposits (1) -
Interest on Savings-Accounts Deposits (6) (5)
Interest on Time Deposits (10,573) (13,072)
Interest on Subordinated Obligations (350) (533)
Other Interest (543) (58)
Interest on Interbank Loans Received (Call Money Loans) (52) (36)
Interest on Other Financing from Financial Entities (579) (187)
Interest on Other Liabilities Resulting from Financial Brokerage (1) (29)
Net Income from Options (3,865) (2,956)
Contributions to the Deposit Insurance Fund (278) (314)
CER Adjustment (50) (7)
Other (4,028) (2,948)
GROSS FINANCIAL MARGIN 23,762 16,066
PROVISIONS FOR LOAN LOSSES (5,205) (3,533)
INCOME FROM SERVICES, NET 14,815 11,543
ADMINISTRATIVE EXPENSES (22,149) (16,974)
Personnel Expenses (12,077) (9,359)
Directors’ and Syndics’ Fees (47) (53)
Other Fees (640) (472)
Advertising and Publicity (857) (742)
Taxes (2,211) (1,620)
Depreciation of Premises and Equipment (471) (286)
Amortization of Organization Expenses (652) (738)
Other Operating Expenses (2,894) (2,066)
Other (2,300) (1,638)
MINORITY INTEREST RESULTS (640) (350)
INCOME FROM EQUITY INVESTMENTS 302 180
NET OTHER INCOME / (LOSS) 469 1,283
INCOME TAX (4,439) (3,121)
NET INCOME / (LOSS) 6,915 5,094
(*) Banco de Galicia y Buenos Aires S.A., consolidated with subsidiary companies (Section 33 – Law No. 19,550).
19
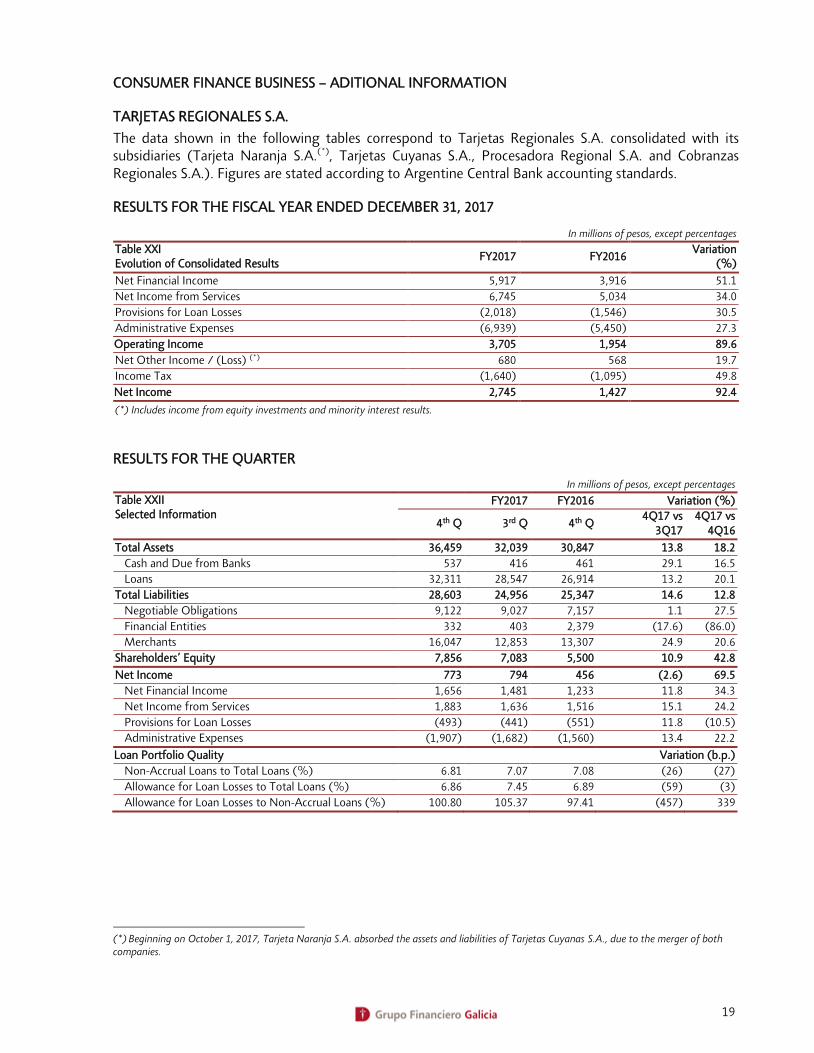
CONSUMER FINANCE BUSINESS – ADITIONAL INFORMATION
TARJETAS REGIONALES S.A.
The data shown in the following tables correspond to Tarjetas Regionales S.A. consolidated with its subsidiaries (Tarjeta Naranja S.A.(*), Tarjetas Cuyanas S.A., Procesadora Regional S.A. and Cobranzas Regionales S.A.). Figures are stated according to Argentine Central Bank accounting standards.
RESULTS FOR THE FISCAL YEAR ENDED DECEMBER 31, 2017
In millions of pesos, except percentages
Table XXI Evolution of Consolidated Results
FY2017 FY2016 Variation
(%)
Net Financial Income 5,917 3,916 51.1
Net Income from Services 6,745 5,034 34.0
Provisions for Loan Losses (2,018) (1,546) 30.5
Administrative Expenses (6,939) (5,450) 27.3
Operating Income 3,705 1,954 89.6
Net Other Income / (Loss) (*) 680 568 19.7
Income Tax (1,640) (1,095) 49.8
Net Income 2,745 1,427 92.4
(*) Includes income from equity investments and minority interest results.
RESULTS FOR THE QUARTER
In millions of pesos, except percentages
Table XXII Selected Information
FY2017 FY2016 Variation (%)
4th Q 3rd Q 4th Q 4Q17 vs
3Q17 4Q17 vs
4Q16
Total Assets 36,459 32,039 30,847 13.8 18.2
Cash and Due from Banks 537 416 461 29.1 16.5
Loans 32,311 28,547 26,914 13.2 20.1
Total Liabilities 28,603 24,956 25,347 14.6 12.8
Negotiable Obligations 9,122 9,027 7,157 1.1 27.5
Financial Entities 332 403 2,379 (17.6) (86.0)
Merchants 16,047 12,853 13,307 24.9 20.6
Shareholders’ Equity 7,856 7,083 5,500 10.9 42.8
Net Income 773 794 456 (2.6) 69.5
Net Financial Income 1,656 1,481 1,233 11.8 34.3
Net Income from Services 1,883 1,636 1,516 15.1 24.2
Provisions for Loan Losses (493) (441) (551) 11.8 (10.5)
Administrative Expenses (1,907) (1,682) (1,560) 13.4 22.2
Loan Portfolio Quality Variation (b.p.)
Non-Accrual Loans to Total Loans (%) 6.81 7.07 7.08 (26) (27)
Allowance for Loan Losses to Total Loans (%) 6.86 7.45 6.89 (59) (3)
Allowance for Loan Losses to Non-Accrual Loans (%) 100.80 105.37 97.41 (457) 339
(*) Beginning on October 1, 2017, Tarjeta Naranja S.A. absorbed the assets and liabilities of Tarjetas Cuyanas S.A., due to the merger of both companies.
20
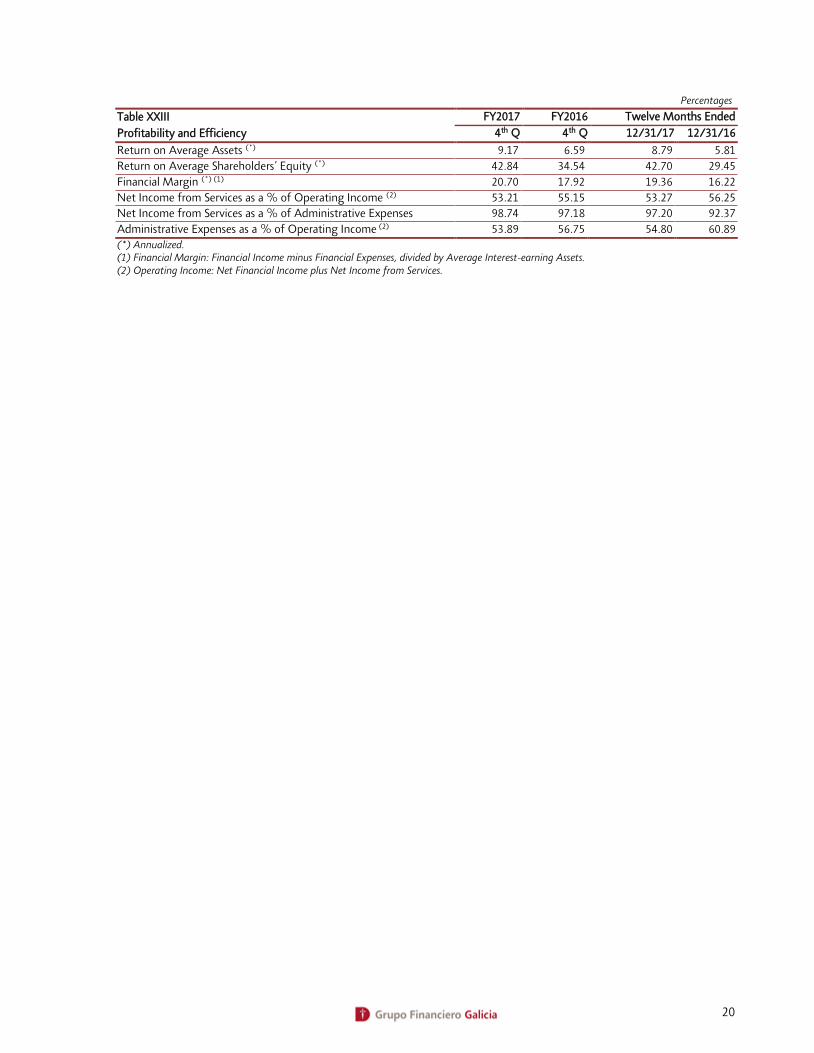
Percentages
Table XXIII FY2017 FY2016 Twelve Months Ended
Profitability and Efficiency 4th Q 4th Q 12/31/17 12/31/16
Return on Average Assets (*) 9.17 6.59 8.79 5.81
Return on Average Shareholders’ Equity (*) 42.84 34.54 42.70 29.45
Financial Margin (*) (1) 20.70 17.92 19.36 16.22
Net Income from Services as a % of Operating Income (2) 53.21 55.15 53.27 56.25
Net Income from Services as a % of Administrative Expenses 98.74 97.18 97.20 92.37
Administrative Expenses as a % of Operating Income (2) 53.89 56.75 54.80 60.89
(*) Annualized. (1) Financial Margin: Financial Income minus Financial Expenses, divided by Average Interest-earning Assets. (2) Operating Income: Net Financial Income plus Net Income from Services.
21
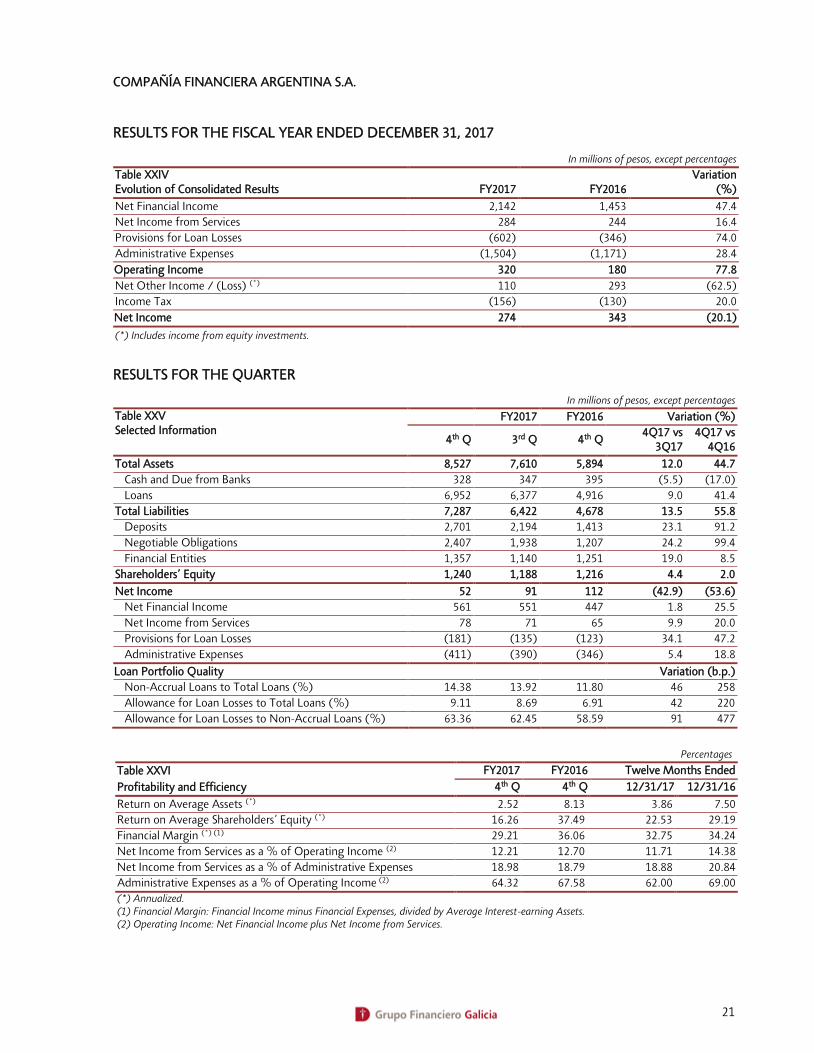
COMPAÑÍA FINANCIERA ARGENTINA S.A.
RESULTS FOR THE FISCAL YEAR ENDED DECEMBER 31, 2017
In millions of pesos, except percentages
Table XXIV Evolution of Consolidated Results FY2017 FY2016
Variation (%)
Net Financial Income 2,142 1,453 47.4
Net Income from Services 284 244 16.4
Provisions for Loan Losses (602) (346) 74.0
Administrative Expenses (1,504) (1,171) 28.4
Operating Income 320 180 77.8
Net Other Income / (Loss) (*) 110 293 (62.5)
Income Tax (156) (130) 20.0
Net Income 274 343 (20.1)
(*) Includes income from equity investments.
RESULTS FOR THE QUARTER
In millions of pesos, except percentages
Table XXV Selected Information
FY2017 FY2016 Variation (%)
4th Q 3rd Q 4th Q 4Q17 vs
3Q17 4Q17 vs
4Q16
Total Assets 8,527 7,610 5,894 12.0 44.7
Cash and Due from Banks 328 347 395 (5.5) (17.0)
Loans 6,952 6,377 4,916 9.0 41.4
Total Liabilities 7,287 6,422 4,678 13.5 55.8
Deposits 2,701 2,194 1,413 23.1 91.2
Negotiable Obligations 2,407 1,938 1,207 24.2 99.4
Financial Entities 1,357 1,140 1,251 19.0 8.5
Shareholders’ Equity 1,240 1,188 1,216 4.4 2.0
Net Income 52 91 112 (42.9) (53.6)
Net Financial Income 561 551 447 1.8 25.5
Net Income from Services 78 71 65 9.9 20.0
Provisions for Loan Losses (181) (135) (123) 34.1 47.2
Administrative Expenses (411) (390) (346) 5.4 18.8
Loan Portfolio Quality Variation (b.p.)
Non-Accrual Loans to Total Loans (%) 14.38 13.92 11.80 46 258
Allowance for Loan Losses to Total Loans (%) 9.11 8.69 6.91 42 220
Allowance for Loan Losses to Non-Accrual Loans (%) 63.36 62.45 58.59 91 477
Percentages
Table XXVI FY2017 FY2016 Twelve Months Ended
Profitability and Efficiency 4th Q 4th Q 12/31/17 12/31/16
Return on Average Assets (*) 2.52 8.13 3.86 7.50
Return on Average Shareholders’ Equity (*) 16.26 37.49 22.53 29.19
Financial Margin (*) (1) 29.21 36.06 32.75 34.24
Net Income from Services as a % of Operating Income (2) 12.21 12.70 11.71 14.38
Net Income from Services as a % of Administrative Expenses 18.98 18.79 18.88 20.84
Administrative Expenses as a % of Operating Income (2) 64.32 67.58 62.00 69.00
(*) Annualized. (1) Financial Margin: Financial Income minus Financial Expenses, divided by Average Interest-earning Assets. (2) Operating Income: Net Financial Income plus Net Income from Services.

22
SUDAMERICANA HOLDING S.A.
INFORMATION DISCLOSURE
The data shown in the tables of this report and the consolidated financial statements correspond to Sudamericana Holding S.A. consolidated with the subsidiaries under its direct or indirect control (Galicia Seguros S.A., Galicia Retiro Compañía de Seguros S.A. and Galicia Broker Asesores de Seguros S.A.).
RESULTS FOR THE TWELVE MONTHS ENDED DECEMBER 31, 2017
In millions of pesos, except percentages
Table XXVII Twelve months ended: Variation (%)
Selected Information 12/31/17 12/31/16
Assets 2,317 2,217 4.5
Premiums Receivable 661 512 29.1
Reinsurance Recoverables 3 3 -
Liabilities 1,329 1,198 10.9
Debt with Insureds 261 214 22.0
Debt with Reinsurers 17 (1) -
Debt with Agents and Brokers 153 147 4.1
Insurance Contract Liabilities 401 303 32.3
Shareholders’ Equity 988 1,019 (3.0)
Net Income 471 710 (33.7)
Earned Premiums 3,202 3,319 (3.5)
Incurred Claims (380) (461) (17.6)
Net Investment Income 326 316 3.0
Commissions and Other (1,175) (786) 49.5
Operating Expenses (1,172) (983) 19.2
Annualized Sales 1,662 1,059 56.9
RESULTS FOR THE QUARTER ENDED DECEMBER 31, 2017
In millions of pesos, except percentages
Table XXVIII Quarters ended: Variation (%)
Selected Information 12/31/17 09/30/17 12/31/16 Quarter Annual
Assets 2.317 2.265 2.217 2.3 4.5
Premiums Receivable 661 580 512 14.0 29.1
Reinsurance Recoverables 3 4 3 (25.0) -
Liabilities 1.329 1.419 1.198 (6.3) 10.9
Debt with Insureds 261 248 214 5.2 22.0
Debt with Reinsurers 17 8 (1) 112.5 -
Debt with Agents and Brokers 153 137 147 11.7 4.1
Insurance Contract Liabilities 401 383 303 4.7 32.3
Shareholders’ Equity 988 846 1.019 16.8 (3.0)
Net Income 157 95 112 66.3 40.8
Earned Premiums 874 791 823 10.5 6.2
Incurred Claims (86) (91) (138) (5.5) (37.7)
Net Investment Income 84 92 72 (8.7) 16.7
Commissions and Other (318) (317) (236) 0.3 34.7
Operating Expenses (317) (291) (276) 8.9 14.9
Annualized Sales 465 452 311 2.9 49.5
23
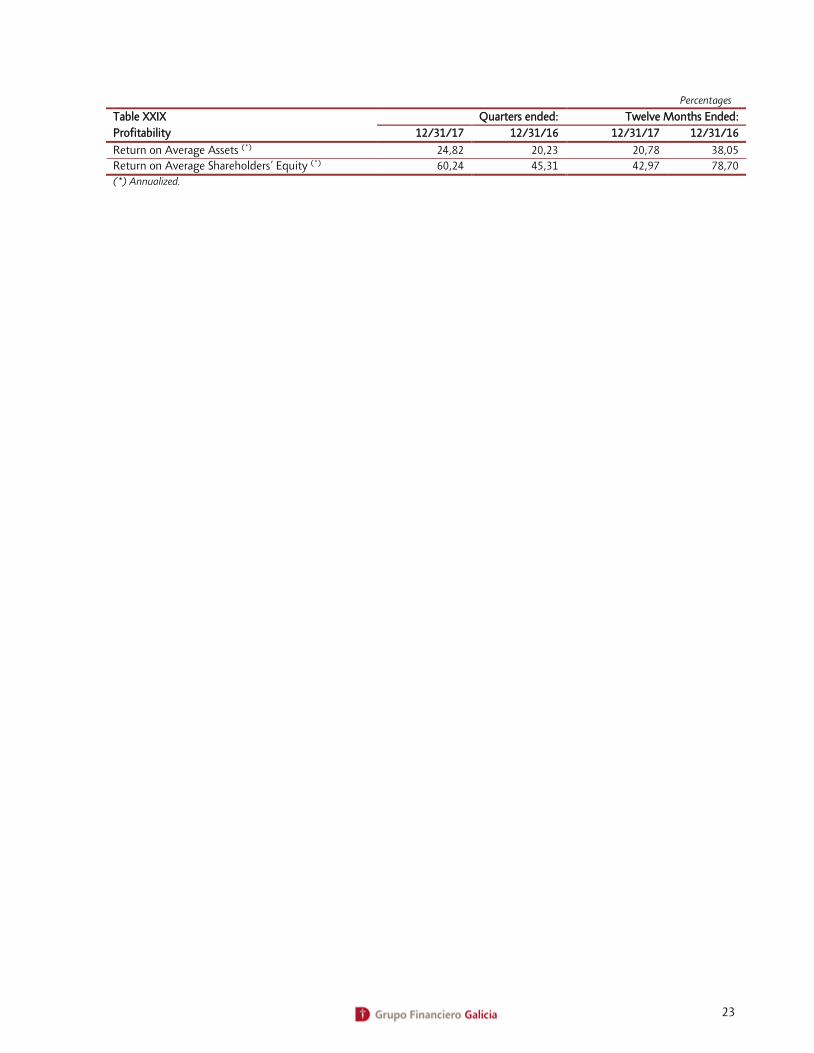
Percentages
Table XXIX Quarters ended: Twelve Months Ended:
Profitability 12/31/17 12/31/16 12/31/17 12/31/16
Return on Average Assets (*) 24,82 20,23 20,78 38,05
Return on Average Shareholders’ Equity (*) 60,24 45,31 42,97 78,70
(*) Annualized.

24
GALICIA ADMINISTRADORA DE FONDOS S.A.
RESULTS FOR THE FISCAL YEAR ENDED DECEMBER 31, 2017
In millions of pesos, except percentages
Table XXX FY2017 FY2016 Variation (%)
Selected Information
Shareholders’ Equity 460 207 122.2
Net Income 450 197 128.4
Fees and Commissions 724 331 118.7
Administrative Expenses (62) (47) 31.9
Commercial Expenses (44) (20) 120.0
RESULTS FOR THE QUARTER
In millions of pesos, except percentages
Table XXXI FY2017 FY2016 Variation (%)
Selected Information 4th Q 3rd Q 4th Q
4Q17 vs 3Q17
4Q17 vs 4Q16
Shareholders’ Equity 460 321 207 43.3 122.2
Net Income 138 119 69 16.0 100.0
Fees and Commissions 219 186 122 17.7 79.5
Administrative Expenses (22) (12) (19) 83.3 15.8
Commercial Expenses (16) (11) (8) 45.5 100.0
In millions of pesos, except percentages
Table XXXII: Assets Under Management as of: Variation
Mutual Funds 4th Q17 4th Q16 Ps. %
Fima Premium 7,540 7,130 410 5.8
Fima Ahorro Pesos 20,918 15,955 4,963 31.1
Fima Ahorro Plus 21,143 10,195 10,948 107.4
Fima Capital Plus 384 562 (178) (31.7)
Fima Renta en Pesos 545 239 306 128.0
Fima Renta Plus 458 247 211 85.4
Fima Abierto Pymes 238 187 51 27.3
Fima Acciones 323 118 205 173.7
Fima PB Acciones 973 305 668 219.0
Fima Mix I 6 152 (146) (96.1)
Fima Renta Dólares I 17,114 2,237 14,877 665.0
Fima Renta Dólares II 5,354 2 5,352 267,600.0
Total Assets Under Management 74,996 37,329 37,667 100.9
25
RECENT DEVELOPMENTS
SPLIT OF TARJETAS REGIONALES
Shareholders at the Extraordinary Shareholders’s Meetings of Grupo Financiero Galicia and Banco Galicia held on December 14, 2017, approved the corporate reorganization process which consists in the split of part of the Bank's equity composed of its 77% interest in Tarjetas Regionales S.A., which will be incorporated to the equity of Grupo Financiero Galicia, effective since January 1, 2018. On January 23, 2018, the definitive split-merger agreement was signed, and its registration in the Public Registry of Commerce is still pending. The aforementioned reorganization implies a capital reduction of Banco Galicia that has no impact on Grupo Financiero Galicia.
ACQUISITION OF A MINORITY INTEREST IN TARJETAS REGIONALES
During August 2017, Grupo Financiero Galicia accepted irrevocable offers made by minority shareholders for the sale of 6% interest in Targetas Regionales S.A., for US$ 49 million. The transfer was made effective on January 5, 2018.
CAPITAL CONTRIBUTION OF GRUPO FINANCIERO GALICIA
On December 27, 2017, Grupo Financiero Galicia in its capacity as sole shareholder and holder of 100% of the capital of Banco Galicia, integrated the capital contribution of Ps.10,000 million through LEBACs. The Argentine Central Bank, through its Resolution No.35 dated January 11, 2018, approved the capital contribution, allowing this contribution to be considered as computable capital.
SALE OF CFA AND COBRANZAS Y SERVICIOS
On February 2, 2018, the sale of Compañía Financiera Argentina S.A. and Cobranzas y Servicios S.A. was completed. The total amount of the transaction reached Ps.1,064 million.
IFRS REGULATIONS
Beginning with the financial statements corresponding to the first quarter of fiscal year 2017, the adjustments corresponding to the application of IFRS are reported as a note to the balance sheet. IFRS will be fully applied since fiscal year 2018. As of December 31, 2017, the adjustment to Banco Galicia's net worth as a result of the application of these standards amounts to Ps.3,144 million, reaching an adjusted net worth of Ps.38,971 million. For Grupo Financiero Galicia, the adjustment amounts to Ps.1,964 million and the adjusted balance to Ps.41,264 million. These figures are subject to changes and may only be considered definitive when preparing the annual financial statements for the year in which IFRS are applied for the first time.
DISTRIBUTION NETWORK
During the quarter, the Bank increased its distribution network with the opening of 19 new branches: 3 in the City of Buenos Aires, 8 in the province of Buenos Aires, 1 in Corrientes, 1 in Neuquén, 2 in Chaco, 2 in Córdoba, 1 in Mendoza and 1 in San Juan.
This report is a summary analysis of Grupo Financiero Galicia’s financial condition and results of operations as of and for the periods indicated. For a correct interpretation, this report must be read in conjunction with Grupo Financiero Galicia’s financial statements, as well as with all other material periodically filed with the National Securities Commission (www.cnv.gob.ar), the Buenos Aires Stock Exchange (www.bolsar.com), the Cordoba Stock Exchange (www.bolsacba.com.ar) and the Nasdaq (www.nasdaq.com). In addition, the Argentine Central Bank (www.bcra.gob.ar) may publish information related to Banco Galicia as of a date subsequent to the last date for which the Bank has published information.
Readers of this report must note that this is a translation made from an original version written and expressed in Spanish. Therefore, any matters of interpretation should be referred to the original version in Spanish.