Embed Size (px)
Citation preview

}
www.banorte.com/ri
Investor Relations Contacts:
Ursula Wilhelm
Mariana Amador
Olga Domínguez
e-mail: [email protected]
Grupo Financiero Banorte 4Q14
Financial Information as of December 31, 2014
“Best Commercial
Bank in Mexico
2013”
“Bank of the
Year Mexico
2014”
“Best Bank in
Mexico 2011”
“Sustainable
Company”
“Best Bank in Mexico and
Latin America 2014”

I. EXECUTIVE SUMMARY
Fourth Quarter 2014 2
INDEX
1. Financial Results as of December 31, 2014:
i) Executive Summary
ii) Management's Discussion & Analysis
iii) GFNorte’s General Information
iv) Financial Statements
v) Accounting Changes and Regulations
vi) Loan Sales to Solida
vii) Notes to the Group’s Financial Statements

I. EXECUTIVE SUMMARY
Fourth Quarter 2014 3
GFNorte reports Net Income of Ps 15.23 billion in 2014 and Ps 3.82 billion in 4Q14
The financial information presented in this Quarterly report has been calculated in pesos and the following tables are in mil lion pesos, thus, they may seem to have some errors but the differences are because of rounding effects.
Income Statement and Balance
Sheet Highlights-GFNorteChange
(Million Pesos) QoQ YoY 2013
Income Statement
Net Interest Income 10,432 10,875 12,441 14% 19% 38,738 44,096 14%
Non Interest Income 2,981 4,506 3,715 (18%) 25% 14,727 16,233 10%
Total Income 13,413 15,381 16,157 5% 20% 53,464 60,329 13%
Non Interest Expense 7,084 6,884 8,590 25% 21% 27,819 29,232 5%
Provisions 1,833 3,253 2,712 (17%) 48% 8,942 11,196 25%
Operating Income 4,496 5,244 4,855 (7%) 8% 16,704 19,901 19%
Taxes 1,075 1,397 1,312 (6%) 22% 3,555 5,668 59%
Subsidiaries & Minority Interest 201 195 277 42% 38% 359 995 177%
Net Income 3,622 4,042 3,819 (6%) 5% 13,508 15,228 13%
Balance Sheet
Asset Under Management 1,829,106 2,048,680 2,039,197 (0%) 11% 1,829,106 2,039,197 11%
Total Assets 1,006,788 1,048,642 1,097,982 5% 9% 1,006,788 1,097,982 9%
Performing Loans (a) 425,038 444,944 471,768 6% 11% 425,038 471,768 11%
Past Due Loans (b) 13,655 14,951 14,293 (4%) 5% 13,655 14,293 5%
Total Loans (a+b) 438,693 459,896 486,061 6% 11% 438,693 486,061 11%
Total Loans Net (d) 424,404 444,345 470,774 6% 11% 424,404 470,774 11%
Acquired Collection Rights ( e) 3,522 3,050 2,984 (2%) (15%) 3,522 2,984 (15%)
Total Credit Portfolio (d+e) 427,925 447,395 473,759 6% 11% 427,925 473,759 11%
Total Liabilities 898,097 928,026 973,311 5% 8% 898,097 973,311 8%
Total Deposits 443,740 463,644 497,922 7% 12% 443,740 497,922 12%
Equity 108,691 120,616 124,672 3% 15% 108,691 124,672 15%
201420134Q13Change
3Q14 4Q14
Change
QoQ YoY 2013
Profitability:
NIM (1) 4.6% 4.6% 5.1% 0.5 pp 0.5 pp 4.4% 4.7% 0.2 pp
NIM after Provisions (2) 3.8% 3.2% 4.0% 0.8 pp 0.2 pp 3.4% 3.5% 0.1 pp
NIM adjusted w/o Insurance & Annuities 4.4% 4.5% 5.0% 0.5 pp 0.6 pp 4.3% 4.5% 0.2 pp
NIM from loan portfolio (3) 8.1% 8.2% 8.7% 0.5 pp 0.6 pp 7.8% 8.2% 0.4 pp
ROE (4) 12.9% 13.8% 12.6% (1.2 pp) (0.3 pp) 14.2% 13.2% (1.0 pp)
ROA (5) 1.5% 1.6% 1.4% (0.1 pp) (0.0 pp) 1.4% 1.5% 0.1 pp
Operation:
Efficiency Ratio (6) 52.8% 44.8% 53.2% 8.4 pp 0.4 pp 52.0% 48.5% (3.6 pp)
Operating Efficiency Ratio (7) 2.8% 2.6% 3.2% 0.6 pp 0.4 pp 2.9% 2.8% (0.1 pp)
Liquidity Ratio (8) 137.4% 134.8% 133.7% (1.1 pp) (3.7 pp) 137.4% 133.7% (3.7 pp)
Asset Quality:
Past Due Loan Ratio 3.1% 3.3% 2.9% (0.3 pp) (0.2 pp) 3.1% 2.9% (0.2 pp)
Coverage Ratio 104.6% 104.0% 107.0% 2.9 pp 2.3 pp 104.6% 107.0% 2.3 pp
Past Due Loan Ratio w/o Banorte USA 3.2% 3.3% 3.0% (0.3 pp) (0.2 pp) 3.2% 3.0% (0.2 pp)
Coverage Ratio w/o Banorte USA 104.4% 103.6% 106.6% 2.9 pp 2.2 pp 104.4% 106.6% 2.2 pp
2013 2014Financial Ratios GFNorte 4Q13 3Q14 4Q14Change
1) NIM= Annualized Net Interest Margin / Average Earnings Assets. 2) NIM= Annualized Net Interest Margin adjusted by Loan Loss Provisions / Average Earnings Assets. 3) NIM = Annualized Net Interest Margin from loan portfolio / Average Performing Loans 4) Annualized earnings as a percentage of the average quarterly equity over the period, minus minority interest of the same period. 5) Annualized earnings as a percentage of the average quarterly assets over the period, minus minority interest of the same period. 6) Non-Interest Expense / Total Income 7) Annualized Non-Interest Expense / Average Total Assets. 8) Liquid Assets / Liquid Liabilities. Where Liquid Assets = Cash and due from Banks + Negotiable Instruments + Securities held for sale, while Liquid Liabilities = Demand Deposits + Loans from banks and other organizations with immediate call option + Short term loans from banks.

I. EXECUTIVE SUMMARY
Fourth Quarter 2014 4
GFNORTE’s Net Income increased 13% during 2014 and decreased (6%) QoQ vs. 3Q14 as a combined result of the
following movements in the Income Statement:
Net Interest Income increased 14% YoY during 2014 and 14% QoQ vs. 3Q14. In all cases, this was due to growth
in the loan portfolio, in core deposits with a better mix and NII expansion in the Insurance and Annuities companies. The average Net Interest Margin (NIM) was 4.7% for 2014 and 5.1% for 4Q14, 24 bp higher vs. 2013 and +50 bp vs. 3Q14. (See pages 10-11).
In 2014 Non-Interest Income grew 10% YoY due to higher service fees and trading revenues and in Other
Operating Income (Expenses), which offset fewer revenues from real estate portfolio recoveries. On a quarterly basis, decreased (18%) vs. 3Q14, due to the decline in trading revenues, Other Operating Income (Expenses) and in real estate portfolio recoveries, these decreases were offset by higher service fees. (See pages 12-14).
Non-Interest Expenses increased 5% YoY vs. 2013 as a result of higher Administrative and Promotional Expenses,
Rents, Depreciations and Amortizations and Professional Fees. Increasing 25% vs. 3Q14 due to higher payments in Personnel Expenses, Administrative and Promotional Expenses, Other Taxes and Non Deductible expenses and Professional Fees. The Efficiency Ratio for 2014 was 48.5%, (3.6 pp) lower YoY, and 53.2% in 4Q14, 8.4 pp higher vs. 3Q14. (See page 15).
Provisions charged to results increased 25% in 2014 and were (14%) lower vs. 3Q14. The annual increase
resulted from higher reserve requirements in Middle Market Companies', the credit exposure to home developers, SMEs, Payroll, Mortgage and Credit Card. The QoQ decrease vs. 3Q14 is mainly due to lower provisions in Middle Market Companies', Payroll, Mortgage and Car loan books, which were partially offset by higher provisions – for home developers, credit card and government portfolios. (See page 11).
Subsidiaries’ Results
The Banking Sector (excluding the results of Afore XXI Banorte) reported profits of Ps 10.53 billion in 2014, (2%) YoY; while contributing Ps 2.61 billion to earnings in 4Q14, (8%) vs. 3Q14. In this sector, Banorte - Ixe Tarjetas
reported profits of Ps 1.81 billion in 2014, 50% higher vs. 2013, quarterly profits totaled Ps 389 million, (26%) lower QoQ. (See page 27-30).
During 2014, Long Term Savings contributed Ps 3.22 billion to the Financial Group’s earnings, +64% vs. 2013 , while contributions to earnings in 4Q14 amounted to Ps 907 million, a 28% QoQ growth vs. 3Q14. (See page 36-38).
The Brokerage Sector reported profits of Ps 931 million in 2014, a 43% increase YoY; and contributed Ps 175 million to earnings in 4Q14, decreasing by (41%) QoQ. (See page 35).
The Sofom and Other Finance Companies Sector recorded profits during 2014 of Ps 573 million a 58 YoY increase. Quarterly profits were Ps 161 million. (See page 39-40).

I. EXECUTIVE SUMMARY
Fourth Quarter 2014 5
Subsidiaries Net Income Change
(Million Pesos) QoQ YoY 2013
Banking Sector 2,953 2,748 2,609 (5%) (12%) 10,686 10,526 (2%)
Banco Mercantil del Norte (1) 2,618 2,221 2,220 (0%) (15%) 9,359 8,721 (7%)
Ixe Banco (2) - - - - - 126 - (100%)
Banorte Ixe Tarjetas 335 528 389 (26%) 16% 1,201 1,805 50%
Broker Dealer 154 297 175 (41%) 13% 649 931 43%
Banorte- Ixe-Broker Dealer 134 267 160 (40%) 20% 562 837 49%
Operadora de Fondos Banorte-Ixe 21 30 15 (50%) (28%) 87 94 8%
Long Term Savings 666 711 907 28% 36% 1,962 3,215 64%
Retirement Funds - Afore XXI Banorte 263 243 321 32% 22% 1,114 1,181 6%
Insurance (4) 338 390 511 31% 51% 725 1,759 143%
Annuities (4) 65 78 74 (4%) 14% 123 276 125%
Other Finance Companies (81) 211 161 (23%) (300%) 362 573 58%
Leasing and Factoring 174 161 209 29% 20% 599 700 17%
Warehousing 3 8 22 188% 734% 43 45 6%
Ixe Automotriz (3) - - - - - 15 - (100%)
Fincasa Hipotecaria (2) - - - - - (28) - (100%)
Sólida Administradora de Portafolios
(former Ixe Soluciones) (257) 42 (70) (267%) (73%) (266) (173) (35%)
Other Companies
Ixe Servicios 1 1 0 (99%) (99%) 1 2 14%
G. F. Banorte (Holding) (72) 74 (33) (144%) (54%) (153) (18) (88%)
Total Net Income 3,622 4,042 3,819 (6%) 5% 13,508 15,228 13%
201420134Q14Change
3Q144Q13
1) GFNorte's 98.22% participation of as of 3Q14. 2) Ixe Banco and Fincasa Hipotecaria merged with Banco Mercantil del Norte, on May 24, 2013. The presented results correspond to prior periods of that date.
3) Ixe Automotriz merged with Arrendadora y Factor Banorte, on May 7 2013. The results presented correspond to prior periods of that date.
4) As of October 4, 2013, Seguros Banorte and Pensiones Banorte consolidate 100% in Grupo Financiero, due to the acquisition of the 49% minority stake from Assicurazioni Generali S.p.A.
Change
QoQ YoY 2013
Earnings per share (1) (Pesos) 1.31 1.46 1.38 (5%) 6% 5.35 5.49 3%
Dividend per Share (Pesos) (3) 0.59 0.20 0.24 24% (59%) 1.14 0.44 (61%)
Dividend Payout (Recurring Net Income) 20.0% 20.0% 20.0% (0%) (0%) 20.0% 20.0% 0%
Book Value per Share (2) (Pesos) 38.45 42.88 44.39 4% 15% 38.45 44.39 15%
Average of Outstanding Shares
(Million Shares)2,773.7 2,773.7 2,770.8 (0%) (0%) 2,526.1 2,773.0 10%
Stock Price (Pesos) 91.36 85.78 81.20 (5%) (11%) 91.36 81.20 (11%)
P/BV (Times) 2.38 2.00 1.83 (9%) (23%) 2.38 1.83 (23%)
Market Capitalization (Million Dollars) 19,367 17,712 15,262 (14%) (21%) 17,639 15,274 (13%)
Market Capitalization (Million Pesos) 253,408 237,931 224,989 (5%) (11%) 230,788 225,167 (2%)
2014Change
Share Data 20134Q144Q13 3Q14
1) As of 3Q13, earnings per share calculations consider the new number of shares resulting from the increase in GFNorte’s equity following the Public Offering, and are not therefore comparable with previous periods.
2) Excluding Minority Interest. 3) The Shaholders' Meeting held on December 20, 2013 approved to modify the First Resolution of the Assembly held on October 14, 2013, in order to make
advanced payments on December 31, 2013 of the dividend that would be disbursed on January 23, 2014 and April 23, 2014 amounting to Ps 0.1963 per share, respectively. The fourth and last disbursement was not paid in advance and was disbursed on July 23, 2014.
0
50
100
150
200
250
300
350
400
450
500
Jan
-06
Mar-
06
May-0
6Jul-0
6O
ct-
06
Dec-0
6F
eb-0
7M
ay-0
7Jul-0
7S
ep-0
7D
ec-0
7F
eb-0
8A
pr-
08
Jun
-08
Se
p-0
8N
ov-0
8Jan
-09
Ap
r-09
Jun
-09
Au
g-0
9N
ov-0
9Jan
-10
Mar-
10
May-1
0S
ep-1
0D
ec-1
0F
eb-1
1A
pr-
11
Jul-1
1S
ep-1
1N
ov-1
1Jan
-12
Ap
r-12
Jun
-12
Au
g-1
2N
ov-1
2Jan
-13
Mar-
13
Jun
-13
Au
g-1
3O
ct-
13
Dec-1
3M
ar-
14
May-1
4Jul-1
4O
ct-
14
Dec-1
4
SHARE PERFORMANCE2006-2014
Banorte
Bolsa

I. EXECUTIVE SUMMARY
Fourth Quarter 2014 6
Mexico D.F., January 22, 2015. Grupo Financiero Banorte (GFNORTE) reported results for December 2014. GFNORTE reported annual profits of Ps 15.23 billion, 13% higher vs. 2013 due to positive operating leverage achieved from the
13% YoY growth in total income and only a 5% increase in operating expenses, effects that offset increases in provisions and taxes. Additionally, the Insurance and Annuities companies, Afore XXI Banorte and the Credit card SOFOM posted favorable business dynamics and profits. Net income totaled Ps 3.82 billion in 4Q14, (6%) lower vs. 3Q14 as a result of
reduced non-interest income, mainly trading revenues and an increase in quarterly operating expenses; effects that were not fully offset by growth in NII, reduced provisions and tax payments.
The Banking Sector's profits for 2014 totaled Ps 10.53 billion, contributing 69% of GFNorte’s earnings.
ROE for 2014 was 13.2%, a (99 bp) decrease vs. 2013 due to the dilution effect from the equity offering of July 2013, to the
capital accumulation mainly in the Bank and an inferior growth in the portfolio than the one forecasted at the beginning of the year. ROA was 1.5%, an increase of 5 bp vs. 2013 due to growth in net income as a result of a better mix and return
on assets.
Deposits and Net Interest Income
In 4Q14 Core Deposits grew 14% YoY or Ps 51.99 billion, from Ps 384.42 billion to Ps 436.41 billion, driven primarily by
efforts to promote Banorte and Ixe deposit products, as well as the significant increase in account balances of some clients since the end of 2013, mainly in Government banking. Annual growths were 18% for Demand deposits and 5% for Retail Time Deposits. During the quarter, Core Deposits increased 6% or Ps 25.52 billion vs. 3Q14 as a result of increases of 8% in demand deposits and 2% in Retail Time Deposits Net Interest Income for 2014 totaled Ps 44.10 billion, 14% higher vs. 2013 due to better loan mix, lower cost of funds, higher loan origination fees and higher NII of the Insurance and Annuities companies. Net Interest Income for 4Q14 totaled Ps 12.44 billion, increasing 14% QoQ, as a result of the reasons already mentioned.
Loans
At the close of 4Q14, Performing Loans reported a YoY growth of 11%, increasing by Ps 46.73 billion to close at Ps
471.77 billion. The Loan portfolio has recovered its pace of growth reaching levels not seen since the end of 2012 due to the gradual economic recovery, maintaining a higher growth rate than GDP. Corporate and middle market company portfolios continued to receive prepayments from customers, (approximately Ps 19 billion in 2014) which were offset by new loan placements in both segments during the last quarter, achieving annual growth. The portfolio registered a 6% QoQ increase as a result of growth in the Government, Commercial (reversing last quarter’s decline), Corporate, Mortgage, Credit card and Payroll portfolios. The Financial Group’s Past Due Loan Ratio was 2.9% at end of 4Q14, (17 bp) vs. 4Q13 and (31 bp) lower vs. 3Q14. The
annual reduction resulted in lower PDL Ratios in the Corporate, Credit card and Payroll segments; while the quarterly decline was the result of lower PDL Ratios in the Commercial, Corporate and Credit card segments. Excluding the PDL of the three troubled home developers companies, the PDL Ratio would be 1.8%, 30 bp higher vs. 2013 and 30 bp lower than the PDL Ratio for 3Q14.
At the end of 4Q14, Past Due Loans totaled Ps 14.29 billion, 5% higher YoY vs. 4Q13 as a result of growth in PDLs for
some Commercial (including SMEs), Mortgage, Payroll, Credit Card and Car loan portfolios, which were not offset by the significant reduction in the Corporate PDL portfolio. The (4%) QoQ decrease was due to a reduction in the Commercial, Corporate and Credit card PDL portfolios. The Group’s coverage ratio was 107.0% at the end of 4Q14, increasing by 2.3 pp YoY and 2.9 pp QoQ.
Efficiency
The Efficiency Ratio for 2014 was 48.5%, (3.6 pp) lower YoY due to positive operating leverage achieved in the period. In 4Q14, the Efficiency Ratio was 53.2%, 8.4 pp higher vs. 3Q14 due to the combination of a faster rate of growth in operating expenses and a reduction in the quarterly non-interest income.
SUMMARY OF RESULTS

I. EXECUTIVE SUMMARY
Fourth Quarter 2014 7
Capitalization
Banco Mercantil del Norte’s Capitalization Ratio was 15.26% at the end of 4Q14, with a Tier 1 ratio of 13.70% and a Core Tier 1 ratio of 12.70%.
Other Subsidiaries
In 2014, Long Term Savings, including Afore XXI Banorte and the Insurance and Annuities companies, contributed Ps
3.22 billion to the Financial Group’s earnings, 64% higher vs. 2013; contribution to earnings in 4Q14 were Ps 907 million, a 28% YoY increase vs. 3Q14. The annual growth was due to better dynamics in the companies that make up this sector, especially Seguros Banorte, as well as the reduction in minority interest resulting from the October 2013 purchase of Generali's 49% stake in the Insurance and Annuities companies, (if GFNorte’s stake in these companies was considered at 100%, annual growth would have been 60% for the Insurance company and 55% for the Annuities company). The quarterly result vs. 3Q14 was due to the good performance of Afore XXI Banorte and Seguros Banorte.
Banorte - Ixe Tarjetas, subsidiary of Banco Mercantil del Norte, reported profits of Ps 1.81 billion, 50% higher YoY, while
profits for 4Q14 totaled Ps 389 million, (26%) lower QoQ. Annual growth came from increased revenues from growth in credit volume (which grew 14% YoY) and higher billing. The quarterly decline was due to a decrease in other operating income (expenses), as a result of 3Q14 cancellations of provisions for expenses, as well as growth in non-interest expenses (mainly expenses related to seasonal promotions and advertisements), these effects offset greater interest income incurred by the 4% growth in the portfolio, as well as more billings.
The Brokerage Sector (Casa de Bolsa Banorte Ixe and Operadora de Fondos Banorte Ixe), reported profits for 2014 of Ps
931 million, a 43% increase vs. 2013, driven by higher net interest income, non-interest income (mainly trading) and lower non-interest expenses, which offset higher tax payments; contributions to earnings for the quarter totaled Ps 175 million, declining by (41%) vs. 3Q14, as a result of the reduction in trading revenues and growth in non-interest expenses, which offset growth in net interest income and net fees.
Sofom and Other Finance Companies, comprised of Arrendadora y Factor Banorte, Almacenadora Banorte and Solida
Administradora de Portfolios, recorded profits for 2014 of Ps 573 million, 58% higher YoY mainly to growth in Arrendadora y Factor Banorte. Quarterly profits of Ps 161 million were posted, (23%) lower vs. 3Q14 due to Solida’s results.

I. EXECUTIVE SUMMARY
Fourth Quarter 2014 8
Shareholders' Assembly
GFNorte held an Ordinary General Shareholders' Meeting on January 21st. The company’s capital that was represented in
the meeting by total subscribed and paid shares was 84.52%. The resolutions approved by the Assembly were:
I. Distribute a cash dividend of Ps. 0.2435 per share, derived from the Retained Earnings of Prior Years. This dividend, to be paid on January 30, corresponds to the second of four payments that will be made for a total amount of Ps. 0.9740 per share, amount approved by the Group’s Board of Directors July 24, 2014, thereby, it will be proposed in subsequent Shareholders’ Assemblies to decree additional dividends for a total amount of Ps. 0.4870 per share, to be covered in two installments of Ps. 0.2435 in April and July 2015, respectively. The total amount of the dividend to be paid represents 20% of the recurring profits of 2013 and the payout ratio was determined according to the dividend policy approved in October 2011, which establishes a payment of 20% of recurring net income in the event that annual profit growth is greater than 20%.
II. Designation of delegate(s) to formalize and execute the resolutions passed by the Assembly.
GFNorte Investor Day
On December 1, GFNorte, held its Investor Day in New York City. The event was led by the Chairman of the Board of Directors and the top management of the Group. During the annual meeting, attended by more than 100 financial experts both Mexican and international, the Group’s organizational changes were presented; moreover, Banorte’s management team presented results of the bank’s Transformation Program, which was launched over a year ago. Management also addressed the Group’s performance expectations for 2015.
While offering his welcoming remarks, Carlos Hank González, Chairman of the Board, stressed that the best for Banorte is at the threshold of a new stage of solid, profitable and sustainable growth, and mentioned to be convinced that the Group will become an international benchmark of good corporate governance.
Marcos Ramirez assured that he will work firmly to make Banorte the best financial institution in Mexico and thus generate value for customers, employees and shareholders; additionally, he was very clear on that he will continue working with the same management team and with the same transformation strategy to achieve the objectives set.
Carlos Hank González, Marcos Ramírez and the management team, stated their vision on the development and the challenges that the Group will face in the upcoming years, they also expressed their commitment and dedication towards creating value for the different stakeholders.
Banorte is recognized as the “Best Bank in Mexico and Latin America 2014” by LatinFinance and as the “Best Bank in Mexico 2014” by The Banker.
Banorte was recognized by LatinFinance, the specialized in banking and capital markets magazine as the “Best Bank in Mexico and Latin America”, and by The Banker through the Financial Times’ publication for the second time in a row and the 7
th since 2005 as the “Best Bank in Mexico”.
Both appointments considered quantitative and qualitative factors such as security, soundness and prudence shown by the institution. They recognized in Banorte its capacity to grow throughout several acquisition and mergers such as the purchase of the remaining Generali's stakes in the Annuities and Insurance companies and its successful mergers with Ixe and Afore BBVA Bancomer, which gave the Group the possibility to increase its market share and meet the financial needs of new customers. They mentioned as well GFNorte’s increasing presence in the equities market.
An additional factor for the assessment was the confidence that investors showed by acquiring the issued shares in the Public Offering, which allowed GFNorte to obtain fresh capital for its expansion in mid-2013, stressing that this capital increase was achieved in a context of greater volatility in international markets and economic growth in Mexico below expectations.
RECENT EVENTS

I. EXECUTIVE SUMMARY
Fourth Quarter 2014 9
Organizational changes
As part of ongoing efforts to focus the organization towards a client-centered business model and continuing with the best international practices, the following appointments and organizational adjustments were made.
On November 20th, an extraordinary meeting of the Board of Directors was held, As part of the agreements, the Board of Directors accepted the resignation of Guillermo Ortiz Martinez as Chairman of this governing body. His resignation is
effective as of December 31st, 2014. The Board approved the substitution of Dr. Ortiz with Carlos Hank Gonzalez as
Chairman of the Board of Directors, effective as of January 1st, 2015. Carlos Hank Gonzalez’s appointment is subject to
ratification by Shareholders' Assembly, for which this governing body will be called.
The Board of Directors, considering the opinion of the Audit and Corporate Practices Committee (CAPS) approved the resignation of Alejandro Valenzuela del Rio as the Financial Group's CEO. Similarly, the Board, hearing the opinion of the CAPS and the Designation’s Committee, appointed Marcos Ramirez to become CEO of the Financial Group, starting
November 20th, 2014. Consistent with the above, Alejandro Valenzuela resigned as member of GFNORTE's Board of Directors.
Marcos Ramirez has 25 years of experience in the financial sector, holding the following positions: Treasurer at Nacional Financiera, various executive positions at Grupo Financiero Santander, and prior to this appointment was Grupo Financiero Banorte's Managing Director of Wholesale Banking. He holds a Bachelor's Degree in Actuarial Science from Universidad Anahuac and is specialized in Finance by Instituto Tecnologico Autonomo de Mexico (ITAM) and is MBA from ESADE in Barcelona, Spain.
Likewise, as of December 1st, 2014, David Suarez Cortazar, Chief Financial Officer, left the organization, Rafael Arana de la Garza, Chief Operating Officer (COO), will continue having oversight over the finance function of the Group and Ursula Wilhelm, Deputy Managing Director of Investor Relations and Financial Intelligence, will maintain responsibility for Investor
Relations.
Armando Rodal has been appointed Managing Director of Wholesale Banking, reporting directly to the Group´s CEO. He
has worked at GFNorte for over 21 years. Armando is a Chemical Engineer from Instituto Tecnologico y de Estudios Superiores de Monterrey, MBA from EGADE and has postgraduate degrees from IPADE and Louisiana State University.

II. MANAGEMENT'S DISCUSSION & ANALYSIS
Fourth Quarter 2014 10
The financial information presented in this Quarterly report has been calculated in pesos, figures resulting from arithmetic operations are rounded.
Net Interest Income
Net Interest Income Change
(Million Pesos) QoQ YoY 2013
Interest Income 16,239 15,813 16,753 6% 3% 65,307 65,303 (0%)
Interest Expense 7,360 6,428 6,597 3% (10%) 31,065 27,494 (11%)
Loan Origination Fees 429 441 1,134 157% 164% 1,564 2,238 43%
Fees Paid 84 100 88 (12%) 4% 377 367 (3%)
GFNORTE´s Net Interest Income excluding
Insurance and Annuities Co. 9,223 9,727 11,202 15% 21% 35,428 39,680 12%
Insurance and Annuities-Interest Income 1,544 1,196 1,757 47% 14% 4,121 5,038 22%
Premium Income (Net) 4,145 4,507 5,301 18% 28% 18,026 18,693 4%
Insurance and Annuities-Interest Expense 3 - - - (100%) 14 - (100%)
Net Increase in Technical Reserves 2,397 2,119 3,406 61% 42% 9,686 9,655 (0%)
Damages, Claims and Other Obligations 2,081 2,436 2,412 (1%) 16% 9,138 9,659 6%
Insurance and Annuitites Net Interest
Income 1,209 1,148 1,239 8% 3% 3,310 4,416 33%
GFNORTE´s Net Interest Income 10,432 10,875 12,441 14% 19% 38,738 44,096 14%
GFNORTE´s Provisions 1,833 3,253 2,712 (17%) 48% 8,942 11,196 25%
Net Interest Income Adjusted for Credit Risk 8,599 7,622 9,729 28% 13% 29,796 32,900 10%
Average Productive Assets 904,220 938,399 969,513 3% 7% 875,366 944,776 8%
Net Interest Margin (1) 4.6% 4.6% 5.1% 0.5 pp 52% 4.4% 4.7% 0.2 pp
NIM after Provisions (2) 3.8% 3.2% 4.0% 0.8 pp 21% 3.4% 3.5% 0.1 pp
20144Q144Q13 3Q14Change
2013
1) NIM = Annualized Net Interest Income / Average Interest Earnings Assets. 2) NIM= Annualized Net Interest Income adjusted by Loan Loss Provisions / Average Interest Earnings Assets.
During 2014, GFNorte’s Net Interest Income grew 14% AoA from Ps 38.74 to Ps 44.1 billion as result of:
a) A 13% increase in net financial revenues and loan origination fees; which increased 11% YoY, mainly because of the growth in the government, corporate and consumer portfolios.
b) Lower funding costs due to growth in core deposits (+14%), mainly Demand Deposits (+18%), which along with other factors, reduced (11%) Interest Expenses. The latter were also reduced by a decrease of 50 bp in the market reference rate during the past 12 months, as well as the August 2013 payment of Ixe’s Perpetual Subordinated Obligations issued at 9.75% in dollars, the cancellation of debt servicing of the USD $800 million syndicated loan pre-paid on July 26, 2013, and the April 21, 2014 prepayment Banorte made for Preferred Non-Convertible Subordinated Obligations in the amount of Ps 2.2 billion with a rate of TIIE + 2.0%.
c) A 43% increase in loan placement fees.
d) A 33% increase in the Net Interest Income of the Insurance and Annuities companies. During 4Q14, GFNorte’s Net Interest Income was Ps 12.44 billion, a 14% increase vs. 3Q14 as a combined effect of
the following:
a) Net financial revenues and loan origination fees increased 11% mainly due to a better loan mix in the portfolio which grew 6% QoQ, driven by the increase in all loans portfolios, mostly government, corporate and commercial portfolios.
b) A lower cost of funding due to growth in core deposits (+6%).
c) A 157% increase in loan placement fees.
d) An 8% increase in the Insurance and Annuities companies’ Net Interest Income.
GRUPO FINANCIERO BANORTE

II. MANAGEMENT'S DISCUSSION & ANALYSIS
Fourth Quarter 2014 11
The average Net Interest Margin (NIM) stood at 4.7% for 2014 and 5.1% in 4Q14, 24 bp higher vs. 2013 and 50 bp vs.
3Q14. These increases resulted from growth in productive assets in higher yielding segments (consumer portfolio excluding mortgage, represent 14.5% of the performing loans for 2014, vs. 13.6% at the end of 2013), in addition, the quarterly and accumulated NIM benefited from a higher valuation impact on the investments of the Annuities company. During 2014, NIM related to lending activity was 8.2%, a YoY increase of 39 bp. Lending NIM for 4Q14 was 8.7%, an
increase of 54 bp vs. 3Q14. The average NIM excluding Insurance and Annuities companies was 4.5% for 2014 and 5.0% in 4Q14, resulting in a
YoY increase of 19 bp and a QoQ increase of 51 bp vs. 3Q14. The average NIM adjusted for Credit Risks was 3.5% in 2014, an increase of 8 bp vs. 2013 driven by the growth in net interest income due to a portfolio mix with higher yielding loans, offset by higher provisions. For 4Q14, the average NIM adjusted for Credit Risks was 4.0%, increasing 77 bp vs. 3Q14 due to a combined effect of the improvement in net
interest income and less provisions.
Provisions
In 2014 provisions charged to results totaled Ps 11.20 billion, +25% vs. 2013 and totaled Ps 2.71 billion in 4Q14,
representing a decrease of (17%) vs. 3Q14. The annual increase resulted from higher reserve requirements in Middle Market Companies', credit exposure to home developers, SMEs, Payroll, Mortgage and Credit Card. The QoQ decrease comes from lower provisions in Middle Market Companies', Payroll, Mortgage and Car loan books, which were partially offset by higher provisions – to home developers, credit card and government portfolios. Loan loss provisions represented 25% of NII in 2014, a 2 pp YoY increase vs. 2013. During the quarter, loan loss provisions represented 22% of Net Interest Income, comparing favorably to the 30% of 3Q14.
Annualized accumulated loan loss provisions for 2014 represented 2.5% of the average loan portfolio, a YoY increase of 0.4 pp vs. 2013. During 4Q14 annualized loan loss provisions accounted for 2.4% of the average loan portfolio,
decreasing (0.6 pp) vs. 3Q14.

II. MANAGEMENT'S DISCUSSION & ANALYSIS
Fourth Quarter 2014 12
Non-Interest Income
Non Interest Income Change
(Million Pesos) QoQ YoY 2013
Services 1,895 2,032 2,415 19% 27% 7,278 8,365 15%
Recovery 145 51 39 (25%) (73%) 811 187 (77%)
Trading 577 1,366 375 (73%) (35%) 3,414 4,420 29%
Other Operating Income (Expense) 364 1,057 887 (16%) 144% 3,223 3,260 1%
Non Interest Income 2,981 4,506 3,715 (18%) 25% 14,727 16,233 10%
2013 20144Q144Q13 3Q14Change
Non Interest Income Change
(Million Pesos) QoQ YoY 2013
Fees Charged on Services 3,167 3,167 3,649 15% 15% 12,006 12,820 7%
Fees for Commercial and Mortgage Loans 3 2 2 4% (40%) 11 9 (21%)
Fund Transfers 155 161 173 7% 11% 533 637 19%
Account Management Fees 375 378 397 5% 6% 1,371 1,499 9%
Fiduciary 95 83 96 15% 1% 362 362 (0%)
Income from Real Estate Portfolios 145 51 39 (25%) (73%) 811 187 (77%)
Electronic Banking Services 1,076 1,126 1,242 10% 15% 3,934 4,486 14%
For Consumer and Credit Card Loans 685 705 744 6% 9% 2,361 2,792 18%
Fees from IPAB - - - - - - - -
Other Fees Charged (1) 632 660 958 45% 52% 2,622 2,847 9%
Fees Paid on Services 1,127 1,083 1,196 10% 6% 3,917 4,268 9%
Fund transfers 11 8 11 29% (7%) 50 45 (10%)
Other Fees Paid 1,116 1,075 1,185 10% 6% 3,867 4,222 9%
Expenses from Real Estate Portfolios - - - - - - - -
Net Fees 2,040 2,083 2,454 18% 20% 8,089 8,553 6%
Trading Income 577 1,366 375 (73%) (35%) 3,414 4,420 29%
Subtotal Other Operating Income
(Expenses) (2) 317 238 334 40% 5% 1,151 1,022 (11%)
Non Operating Income (Expense), net (100) 663 380 (43%) (481%) 1,387 1,578 14%
Other Operating Income (Expense) from
Insurance and Annuities 146 155 173 12% 18% 685 660 (4%)
Other Operating Income (Expenses) 364 1,057 887 (16%) 144% 3,223 3,260 1%
Non Interest Income 2,981 4,506 3,715 (18%) 25% 14,727 16,233 10%
20144Q144Q13 3Q14Change
2013
1. Includes fees from letters of credit, transactions with pension funds, warehousing services, financial advisory services and securities trading by the Brokerage House among others.
2. The majority of these revenues correspond to recoveries of previously charged-off loans.
During 2014, Non-Interest Income totaled Ps 16.23 billion, a 10% YoY increase from 15% growth in Service Fees,
29% in Trading Income and 1% in Other Operating Income (Expenses), which offset the decline of (77%) in income from real estate portfolio recoveries. In 4Q14 Non-Interest Income totaled Ps 3.72 billion, (18%) lower vs. 3Q14. The QoQ reduction resulted from (73%)
decline in Trading Income, (16%) in Other Operating Income (Expenses) and (25%) in real estate portfolio recoveries. These decreases were offset by the 19% growth in Service Fees.
Service Fees During 2014, Service Fees totaled Ps 8.37 billion, 15% higher as a result of better business dynamics. The YoY growth
is the combined effect of:

II. MANAGEMENT'S DISCUSSION & ANALYSIS
Fourth Quarter 2014 13
i) + 14% in fees from electronic banking, ii) + 18% in consumer loan fees, iii) + 9% in other fees, iv) + 9% in account management, v) + 19% in fund transfer revenues, and vi) + 9% in fees paid driven by higher interbank fees and commissions paid to insurance brokers.
Service Fees totaled Ps 2.42 billion in 4Q14, a 19% YoY increase vs. 3Q14 due to better business dynamics similar to
those already described and to higher client’s transactional levels as well as the increase in the active clients’ base.
Trading
Trading revenues in 2014 totaled Ps 4.42 billion, a 29% YoY growth due to valuation gains for Banorte and Casa de
Bolsa Banorte Ixe, and positive results in FX transactions, which offset the results from securities and derivatives transactions of Banorte and the Annuities Company. Trading revenues in 4Q14 totaled Ps 375 million, a (73%) decrease vs. 3Q14. This QoQ decline was mainly due to
negative valuation results of Banorte and Casa de Bolsa Banorte Ixe, as well as reduced trading revenues from Banorte’s securities and derivatives operations.
Other Operating Income and Expenses
Other Operating Income (Expenses) Change
(Million Pesos) QoQ YoY 2013
Subtotal Other Operating Income
(Expenses) 317 238 334 40% 5% 1,151 1,022 (11%)
Loan Recovery 346 226 264 17% (24%) 1,384 956 (31%)
Income from foreclosed assets 2 (16) 55 (438%) 3267% (145) (130) (11%)
Other Operating Income 39 76 102 34% 162% 135 424 214%
Other Operating Income (Expense) (70) (48) (87) 80% 24% (223) (229) 2%
Non Operating Income (Expense), net (100) 663 380 (43%) (481%) 1,387 1,578 14%
Other Products 740 1,458 490 (66%) (34%) 2,988 3,421 14%
Other Recoveries 111 277 429 55% 286% 1,312 1,217 (7%)
Other (Expenses) (950) (1,072) (538) (50%) (43%) (2,912) (3,060) 5%
Other Operating Income (Expense) from
Insurance and Annuities 146 155 173 12% 18% 685 660 (4%)
Other Operating Income (Expenses) 364 1,057 887 (16%) 144% 3,223 3,260 1%
201420134Q143Q144Q13Change
During 2014 Other Operating Income (Expenses) totaled Ps 3.26 billion, 1% higher YoY due to:
i) A 14% increase in Other Products, driven by the cancellation of debtor accounts and other provisions and the
increase in leasing revenues, which offset the negative valuation results of securitizations, and ii) A 214% increase in Other Operating Income due to cancellations of excess preventive estimates constituted in
prior years. The above were offset by:
i) A (33%) decrease in the combined recoveries’ revenues from previously written-off portfolios and sales of
foreclosed assets, ii) A 5% increase in Other Expenses mainly due to more frauds, higher estimates for irrecoverable in certain
subsidiaries and other losses, which offset lower expenses on damages, iii) A (7%) decline in Other Recoveries, as a result of the extraordinary income generated by the recoveries
achieved by the sale of an infrastructure project and another business investment, derived from old debts capitalizations in 1Q13 and 3Q13,
iv) A (4%) decrease in Other Income from the Insurance and Annuities companies, and v) A 2% increase in Other Operating Expenses.

II. MANAGEMENT'S DISCUSSION & ANALYSIS
Fourth Quarter 2014 14
On a quarterly basis, Other Operating Income (Expenses) totaled Ps 887 million, (16%) lower vs. 3Q14, was mainly
due to:
i) A (66%) reduction in Other Products as a result of fewer cancellations of other liabilities accounts, less profits from sales of property, furniture and equipment, reduced leasing income and the negative valuation results of securitizations, and
ii) The 80% increase in Other Operating (Expenses).
The above were offset by:
i) A (50%) decrease in Other Expenses as a result of lower estimates for irrecoverables and the valuation results of
securitizations, which offset higher expenses for frauds and other losses. ii) A 55% increase in acquired portfolio recoveries, iii) A 52% increase in the combined revenues from loan charge-offs and sales of foreclosed assets, iv) A 34% increase in Other Operating Income mainly due to more cancellations of excess preventive estimates, and v) A 12% increase in revenues from Insurance and Annuities’ operations.
Recoveries
Non Interest Income from Recoveries (including real estate portfolio recoveries, write-offs, proprietary loan portfolio and foreclosed assets classified under "Other Operating Income (Expenses) ") totaled Ps 2.23 billion in 2014, a (34%) YoY
decrease vs. 2013, mainly due to the extraordinary income generated by the recoveries achieved by the sale of an infrastructure project and another business investment, derived from old debts capitalizations in 1Q13 and 3Q13 respectively, in addition to the (77%) decrease in real estate portfolio recoveries that included the recognition of lower revenues related to investment projects, mainly with home developers. Recoveries during the quarter amounted to Ps 786 million, 46% higher vs. 3Q14 due to the 55%increases in Other Recoveries and 52% in combined revenues from previously written-off portfolios and sales of foreclosed assets, which
offset the (25%) decrease in real estate portfolio income due to a slower rate of recognition of income related to investment projects with home developers. The amount invested in housing projects at the end of 4Q14 was Ps 6.24 billion.
Non-Interest Expense
Non Interest Expense Change
(Million Pesos) QoQ YoY 2013
Personnel 3,073 2,829 4,054 43% 32% 13,077 12,986 (1%)
Professional Fees 867 762 900 18% 4% 2,767 3,000 8%
Administrative and Promotional 1,328 1,434 1,599 11% 20% 4,874 5,679 17%
Rents, Depreciation & Amortization 794 928 958 3% 21% 3,219 3,648 13%
Taxes other than income tax & non
deductible expenses 457 356 517 45% 13% 1,726 1,653 (4%)
Contributions to IPAB 484 474 487 3% 1% 1,831 1,887 3%
Employee Profit Sharing (PTU) 82 101 74 (26%) (9%) 324 379 17%
Non Interest Expense 7,084 6,884 8,590 25% 21% 27,819 29,232 5%
20142013Change
4Q13 3Q14 4Q14
Non-Interest Expense for 2014 amounted Ps 29.23 billion, a 5% YoY increase (in line with the annual inflation in
Mexico, 4.08%) to sustain business growth and expansion of the operational infrastructure, which was partially offset by a decline in other concepts. Higher expenses came from:
i) +Ps 805 million in Administration and Promotional Expenses (+17%). This growth was driven by the increase in various businesses -related expenses, among others, the expenses of insurance tied to consumer credit and more transactions in ATMs and POS.
ii) +Ps 429 million in Rents, Depreciations and Amortizations (+13%), iii) +Ps 234 million in Professional Fees (+8%). This increase was due to higher payment for professional services,
such as: audit, trust management and recovery services for the consumer portfolio. iv) +Ps 56 million in IPAB contributions (+3%) due to growth in liabilities subject to IPAB fees, and

II. MANAGEMENT'S DISCUSSION & ANALYSIS
Fourth Quarter 2014 15
v) + Ps 55 million in Employee Profit Sharing (+ 17%) Non-Interest Expense in 4Q14 totaled Ps 8.59 billion, a 25% increase vs. 3Q14 due to the combined effect of:
i) A Ps 1.22 billion increase in Personnel Expenses (+43%) mainly due to more provisions for bonuses, incentives
and more expenses on salaries and benefits, ii) A Ps 165 million increase in Administrative and Promotional Expenses (+11%) due to, among other factors,
higher expenses from seasonal promotional campaigns, iii) A Ps 161 million increase in Other Taxes and Non-Deductible Expenses (+45%), iv) A Ps 139 million increase in Professional Fees (+18%) since during the quarter various payments were made for
consulting, technology, audit concepts as well as higher payments for portfolio recovery services, v) A Ps 30 million increase in Rents, Depreciations and Amortizations (+3%), vi) A Ps 13 million increase in IPAB contributions (+3%), and vii) A (Ps 26) million decrease in caused Employee Profit Sharing (-26%).
The Efficiency Ratio during 2014 was 48.5% (3.6 pp) lower YoY due to the positive operating leverage achieved in the period. In 4Q14, the Efficiency Ratio was 53.2%, 8.4 pp higher vs. 3Q14 due to the combination of a higher growth rate
in operating expenses and the reduction in non-interest income for the quarter.
Taxes
Income taxes for 2014 totaled Ps 5.67 billion, +59% YoY and Ps 1.31billion in 4Q14, a (6%) decrease vs. 3Q14. The
YoY growth is explained by: i) new tax regulations effective as of January 1st, 2014, including: the non-deductibility of loan loss reserves and certain employee benefits, ii) a larger profit base for the calculation of taxes, and iii) the use of fiscal credits in 2Q13. The decline vs. 3Q14 was a smaller profit base. The effective tax rate and the Employee Profit Sharing in 4Q14 was 28.1%, 0.1 pp higher compared vs. 3Q14. The effective tax rate and accumulated Employee Profit Sharing in 2014 was 29.8%, 7.0 pp higher compared to the
22.8% for the same period in 2013
Subsidiaries and Minority Interest
During 2014, Subsidiaries and Minority Interest reported Ps 995 million in profits, favorable result vs. the Ps 359
million of 2013, due to: i) the October 2013 purchase of Generali’s 49% stake in the Insurance and Annuities companies, ii) the decrease in Banorte’s minority interest as a result of the payment made to the IFC (completed in December 2013) and iii) to a higher accumulated annual income in the Afore XXI Banorte. On a quarterly basis, Subsidiaries and Minority Interest reported Ps 277 million in profits, 42% higher vs. 3Q14 due
to growth of the Afore XXI Banorte’s quarterly profits.
Net Income GFNorte reported Net Income of Ps 15.23 billion during 2014, 13% higher vs. 2013 due to the positive operating
leverage achieved from a 13% YoY growth in total income, lower growth in Operating Expenses, effects that offset increases in credit costs and tax payments. Additionally, it was achieved by lower minority interest resulting from the acquisition of the IFC's stake in Banorte and Generali’s participation in the Insurance and Annuities companies, which together with Afore XXI Banorte and the Credit Card SOFOM, posted favorable business dynamics. Net income was Ps 3.82 billion for 4Q14, (6%) lower vs. 3Q14, due to the growth in Operating Expenses plus the
decrease in the Non-Interest Income, mainly in trading; effects that were not offset by the increase in NII and the reduction in provisions and tax payments.
Accumulated recurring revenues (NII + net fees excluding portfolio recoveries - Operating Expenses - Provisions) in 2014 totaled Ps 12.03 billion, a 30% YoY increase as a result of higher financial revenues and fees which offset increases in Operating Expenses and Provisions. Recurring revenues totaled Ps 3.55 billion in 4Q14, increasing 28% vs. 3Q14, as a result of the combined effect of growth in Net Interest Income, Service Fees and Operating Expenses as well as the reduction in Provisions.
In 4Q14, ROE was 12.6%, (115 bp) lower vs. 3Q14. ROE for 2014 was 13.2%, decreasing 99 bp vs. the same period of the previous year due to the dilution of the equity offering of last year. Return on Tangible Equity (ROTE) was 16.2% in 4Q14, (40 bp) less vs. 3Q14.

II. MANAGEMENT'S DISCUSSION & ANALYSIS
Fourth Quarter 2014 16
Return on Tangible Equity (ROTE)
4Q13 3Q14 4Q14
Reported ROE 12.9% 13.8% 12.6%
Goodwill &Intangibles Ps 22.37 Ps 23.03 Ps 24.70
Average Tangible Equity Ps 76.85 Ps 90.63 Ps 94.11
ROTE 17.6% 16.6% 16.2%
ROA for 2014 was 1.5%, an increase of 5 bp over the same period of the previous year due to the growth in net income as a result of a better mix and return on assets. ROA for 4Q14 was 1.4%, (13 bp) lower vs. 3Q14. Return on Risk-Weighted Assets was 3.1%, (4 bp) lower vs. 3Q14.
Return on Risk Weighted Assets (RRWA)
4Q13 3Q14 4Q14
Reported ROA 1.5% 1.6% 1.4%
Average Risk Weighted Assets Ps 444.47 Ps 484.92 Ps 497.60
RRWA 3.0% 3.1% 3.1%
The Banking Sector’s (Banco Mercantil del Norte, Banorte - Ixe Tarjetas and Banorte USA) profits for 2014 totaled Ps 10.53 billion, contributing with 69% of GFNorte’s profits. Accumulated ROE for 2014 of this sector was 13.7%, 267 bp lower vs 2013 as a result of the increases in equity and the decrease in the accumulated Net. ROA for the Banking Sector was 1.4% for 2014, declining by 15 bp.

II. MANAGEMENT'S DISCUSSION & ANALYSIS
Fourth Quarter 2014 17
Capitalization
Banco Mercantil del Norte
Capitalization
(Million Pesos) QoQ YoY
Tier 1 Capital 58,585 62,555 65,624 67,840 69,995 3% 19%
Tier 2 Capital 11,034 10,383 7,869 7,951 8,001 1% (27%)
Net Capital 69,619 72,938 73,493 75,791 77,996 3% 12%
Credit Risk Assets 338,045 338,688 344,656 344,453 359,318 4% 6%
Net Capital / Credit Risk Assets 20.6% 21.5% 21.3% 22.0% 21.7% (0.3 pp) 1.1 pp
Total Risk Assets (1) 460,328 481,196 491,431 506,729 511,057 1% 11%
Tier 1 12.73% 13.00% 13.35% 13.39% 13.70% 0.3 pp 1.0 pp
Tier 2 2.40% 2.16% 1.60% 1.57% 1.56% (0.0 pp) (0.8 pp)
Capitalization Ratio 15.12% 15.16% 14.95% 14.96% 15.26% 0.3 pp 0.1 pp
4Q14Change
3Q142Q144Q13 1Q14
1. Includes Market and Operational Risks. Excludes inter-company eliminations.
(*) The capitalization ratio of the reported last period is estimated
Banorte has fully adopted the capitalization requirements established to date by Mexican authorities and international standards, so-called Basel III, which came into effect as of January 2013.
At the end of 4Q14 Banorte's estimated Capitalization Ratio (CR) was 15.26% considering credit, market and
operational risk and 21.71% if only credit risks are considered. The Core Tier 1 ratio was 12.70%, Total Tier 1 ratio was 13.70% and Tier 2 was 1.56%.
The Capitalization Ratio increased 0.31 pp vs. 3Q14, showing the following dynamics:
1. Growth of profits during 4Q14 +0.60 pp
2. Valuation of Financial Instruments, Securitizations and Equity Accounts ACCOUNTSYYYYYY
+0.13 pp
3. Growth in risk assets -0.13 pp
4. Effects of Investment in Subsidiaries and Intangibles -0.29 pp
The Capitalization Ratio Increased 0.14 pp* vs 4Q13, showing the following dynamics:
1. Growth of profits during 4Q14 +2.58 pp
2. Capitalization in March 2014 +0.55 pp
3. Valuation of Financial Instruments, Securitizations and Equity Accounts +0.20 pp
4. Reserves considered as Tier 2 1)
-0.08 pp
5. Prepayment and effectiveness decrease of Subordinate Debt -0.71 pp
6. Effects of Investment in Subsidiaries and Intangibles -0.72 pp
7. Growth in risk assets -1.68 pp
1) Loan loss reserves for Financial Intermediaries and Property Investment Projects. ** pp: Percentage Points

II. MANAGEMENT'S DISCUSSION & ANALYSIS
Fourth Quarter 2014 18
Deposits
Grupo Financiero Banorte
Deposits
(Million Pesos) QoQ YoY
Non Interest Bearing Demand Deposits 123,056 129,603 147,733 14% 20%
Interest Bearing Demand Deposits (1) 132,241 148,060 152,549 3% 15%
Total Demand Deposits (2) 255,297 277,663 300,282 8% 18%
Time Deposits – Retail 129,121 133,222 136,127 2% 5%
Core Deposits 384,419 410,885 436,409 6% 14%
Money Market (3) 59,729 53,382 62,287 17% 4%
Total Bank Deposits 444,147 464,268 498,697 7% 12%
GFNorte’s Total Deposits (4) 443,740 463,644 497,922 7% 12%
Third Party Deposits 150,636 160,116 149,092 (7%) (1%)
Total Assets Under Management 594,783 624,384 647,789 4% 9%
Change3Q14 4Q144Q13
1. Excludes IPAB cash management checking accounts for loan portfolios managed from Banpaís and Bancen. The balances of these accounts to
4Q13, 3Q14 and 4Q14 were Ps 0 million, in all cases. 2. Includes Debit Cards. 3. Includes Bank Bonds (Customers and Financial intermediaries).
4. Includes eliminations among subsidiaries: 4Q13 = (Ps 407) million; 3Q14 = (Ps 623) million; 4Q14 = (Ps 774) million.
Total Deposits
At the end of 4Q14, GFNorte’s Total Deposits amounted to Ps 497.92 billion, a 12% YoY increase of Ps 54.18 billion driven mainly by efforts to promote Banorte - Ixe deposit products, as well as higher account balances of some clients, mainly in Government banking, since the end of 2013; while the QoQ increase of Ps 34.28 billion or 7% was a
result of increases of 6% in core deposits and 17% in Money Market. Total Deposits in the Banking Sector amounted to Ps 498.70 billion, representing a 12% YoY increase or Ps 54.55 billion, which is composed of an 18% increase in Demand Deposits, 5% in Retail Time Deposits and 4% in Money
Market. During the quarter, Total Deposits increased 7% or Ps 34.43 billion.
Demand and Time Deposits
At the end of 4Q14, Demand Deposits totaled Ps 300.28 billion, an increase of Ps 44.99 billion, + 18% YoY driven
by a 20% increase in cost-free Demand Deposits as a result of the 16% increase in the combined average balances of individual and corporate accounts. Interest Bearing Demand Deposits increased 15% YoY as a result of the 22% increase in the combined average balances of individual and corporate accounts. On a quarterly basis, Demand Deposits increased Ps 22.62 billion or 8% vs. 3Q14 driven by a 14% increase in Non-
Interest Bearing Demand Deposits and 3% in Interest Bearing Demand Deposits. Retail Time Deposits totaled Ps 136.13 billion, increasing by Ps 7.01 billion or 5% YoY and Ps 2.91 billion or 2% QoQ
as a result of campaigns to promote promissory notes with different maturities through branches.
Money Market Deposits
Money Market Deposits at end of 4Q14 totaled Ps 62.29 billion, representing increases of a 4% YoY and 17% QoQ
due to higher funding needs to cover assets’ growth needs.

II. MANAGEMENT'S DISCUSSION & ANALYSIS
Fourth Quarter 2014 19
Third Party Deposits
In 4Q14, Third Party Deposits totaled Ps 149.09 billion, (1%) YoY and (7%) QoQ lower. Both changes are driven by
the reduction of third-parties in external custody and third-party investments in private banking.
Asset Under Management
At the end of December 2014, Assets Under Management totaled Ps 647.79 billion, growing by Ps 53.01 billion or
9% YoY, while the QoQ balance increased by Ps 23.41 billion, or 4% QoQ, both increases are explained by higher core deposits.
Loans
Performing Loan Portfolio
(Million Pesos) QoQ YoY
Commercial 113,795 109,617 114,040 4% 0%
Consumer 139,715 153,898 158,139 3% 13%
Corporate 75,690 76,263 80,464 6% 6%
Government 95,637 104,996 118,963 13% 24%
Sub Total 424,837 444,774 471,606 6% 11%
Recovery Bank 201 170 162 (5%) (19%)
Total 425,038 444,944 471,768 6% 11%
4Q143Q144Q13Change
Performing Consumer Loan
Portfolio
(Million Pesos) QoQ YoY
Mortgages 81,833 86,835 89,758 3% 10%
Car Loans 11,412 11,221 11,074 (1%) (3%)
Credit Cards 20,323 22,238 23,209 4% 14%
Payroll 26,147 33,604 34,098 1% 30%
Consumer Loans 139,715 153,898 158,139 3% 13%
3Q144Q13 4Q14Change
(Million Pesos) QoQ YoY
Past Due Loans 13,655 14,951 14,293 (4%) 5%
Loan Loss Reserves 14,289 15,550 15,287 (2%) 7%
Acquired Rights 3,522 3,050 2,984 (2%) (15%)
4Q13 3Q14 4Q14Change
Total Performing Loans
Total Performing Loans increased 11% YoY, growing by Ps 46.77 billion at end of 4Q14 with Ps 471.61 billion,
excluding proprietary loans managed by the Recovery Bank. The Loan portfolio has recovered a growth rate similar to levels not seen since the end of 2012 due to the gradual economic recovery and has grown above the national economy. Corporate and business portfolios (included in the Commercial portfolio) continue to be affected by prepayments from customers (approximately Ps 19 billion in 2014), despite this 4Q14 registered new loan originations in both sectors to achieve annual growth. Total Performing Loans increased 6% QoQ vs. 3Q14, growing by Ps 26.83 billion, mainly due to growth in the
Government, Commercial (reversing last quarter’s decrease) Corporate, Mortgage, Credit Card and Payroll portfolios.

II. MANAGEMENT'S DISCUSSION & ANALYSIS
Fourth Quarter 2014 20
Portfolio growth by segments was:
Individual Loans
Consumer + Mortgage: Increased by Ps 18.43 billion or 13% vs. 4Q13 and Ps 4.24 billion or 3% QoQ vs. 3Q14
closing 4Q14 with a balance of Ps 158.14 billion as a result of favorable annual and quarterly dynamics in all
portfolios with the exception of Car loans. Due to the strategy to increase the Consumer portfolio, mainly Payroll loans and Credit cards, Consumer loans (excluding Mortgages) have increased their proportion within the Performing Loan portfolio from 13.6% to 14.5% in the last 12 months.
Mortgages: Grew by Ps 7.93 billion or 10% YoY, posting a balance of Ps 89.76 billion, driven by favorable
dynamics in products for construction, remodeling and payment of liabilities and the mortgage program with Pemex. During the quarter the portfolio grew by Ps 2.92 billion or 3% QoQ vs. 3Q14, favored by the origination of middle-income housing mortgages, the mortgage program with Pemex, products for construction, remodeling and payment of liabilities and liquidity programs. During 2014 15,563 new mortgages were placed worth Ps 18.80 billion. As of November 2014, Banorte held 16.3% of the market share in balances and 17.8% in new mortgage loan production to November 2014, ranking third and fourth respectively in the system.
Credit Cards: At the end of 4Q14 the portfolio totaled Ps 23.21 billion, a 14% YoY increase of Ps 2.89 billion
and 4% QoQ or Ps 972 million. Both annual and quarterly growths are due to portfolio management strategies, promotional campaigns for Banorte - Ixe products and more cross-selling to clients, increasing billings by 6.1% YoY, while quarterly sales grew 9.8% vs. 3Q14. Profitability of the Credit card portfolio remains good with favorable dynamics, given the growth in the loan portfolio and adequate portfolio risk management. Banorte - Ixe held a 7.7% market share of the system in balances as of November 2014, ranking fourth.
Payroll: At the end of 4Q14, the portfolio increased Ps 7.95 billion or 30% YoY and Ps 494 million or 1%
QoQ totaling Ps 34.10 billion, as a result of growth in the number of Banorte-Ixe payroll account holders, as
well as campaigns to promote the product, multichannel cross-selling strategies and product adjustments to provide more flexibility to clients in order to disburse amortized balances; additionally, in March 2014, Banorte acquired a Payroll loan portfolio from another institution. Payroll loans continue to show vigorous growth with good asset quality with respect to the system’s average. Banorte - Ixe held a 19.2% share of the market in balances as of November 2014, ranking third in the system.
Car Loans: The portfolio decreased by (Ps 338) million or (3%) YoY and (Ps 147) million or (1%) QoQ in 4Q14
totaling Ps 11.07 billion. These decreases were due to fewer new loan placements given the growing
competition from financial firms of car manufacturers in the last months. The profitability of this product remains favorable as a result of adequate portfolio quality (with respect to the system average) and cross-sales of car insurance, one of Seguros Banorte’s most important products. As of November 2014, Banorte-Ixe held a 15.0% market share, ranking fourth in the system, excluding loans granted by finance companies of car manufacturers.
II. Loans to Institutions
Commercial: Increased by Ps 245 million or 0.2% YoY and Ps 4.42 billion or 4% QoQ totaling Ps 114.04
billion. As mentioned above, annual growth for this portfolio was affected by prepayments, as well as by the
decrease of the SME portfolio due to lower origination. However, during 4Q14 new loans increased significantly, including the leasing and factoring portfolio. As of November 2014, the market share in Commercial loans (including Corporate) was 11.9%, ranking fourth place in the system. The SME portfolio balance was Ps 29.85 billion, (Ps 3.89) billion or (11.5%) lower YoY; and (Ps 623) million or
(2%) lower vs. 3Q14. SMEs Portfolio Evolution (billion pesos)
4Q13 3Q14 4Q14
Performing Portfolio Ps 33.74 Ps 30.47 Ps 29.85
% of Performing Commercial Portfolio 29.7% 27.8% 26.2%
% of Total Performing Portfolio 7.9% 6.9% 6.3%
NPL Ratio 5.4% 9.8% 10%

II. MANAGEMENT'S DISCUSSION & ANALYSIS
Fourth Quarter 2014 21
Corporate: At the end of 4Q14 the balance was Ps 80.46 billion, increasing Ps 4.77 billion or 6% YoY and Ps
4.20 billion or 6% QoQ. Annual and quarterly growths were driven by higher origination which offset prepayments received from some clients who used proceeds from capital market transactions to pay off bank liabilities. Banorte’s corporate loan portfolio is diversified by sectors and regions and shows a low concentration risk. Banorte’s 20 main corporate borrowers accounted for 10.8% of the bank's total portfolio, increasing by 0.6 pp vs. 3Q14 and 0.1 pp vs. 4Q13. The bank’s largest corporate loan represents 1.6% of the total portfolio and has an A1 rating, while number 20 represents 0.3%.
Through its subsidiaries Banco Mercantil del Norte, Arrendadora y Factor Banorte and Solida Administradora de Portafolios, GFNorte granted loans, and participated through specialized trust operations in home development projects. Since 2013 some of the largest companies in this sector have experienced financial difficulties; three of the largest companies are undergoing a debt restructuring process and have defaulted on their payments. This situation has led to deterioration in the risk profile of these three borrowers. They are currently involved in restructuring negotiations with GFNorte and other banks. As of December 31, 2014 the loan exposure was Ps 5.54 billion in Urbi Desarrollos Urbanos, S.A.B. de C.V., Corporacion Geo, S.A.B. de C.V. and Desarrolladora Homex, S.A.B. de C.V., 15.6% lower than the
prior quarter, mainly due to the sale of a company belonging to Grupo Homex to another entity. These three companies represented 1.1% of the total loan portfolio vs. the 1.4% of September 2014. Of these loans, Ps 5.42 billion were past due, decreasing by Ps 82 million in 4Q14. The total portfolio has 76% coverage in guarantees,
higher than the 65% reported in the previous quarter due to the sale of a company belonging to Grupo Homex whose loan was unsecured. The reserve coverage of this exposure was 57.6% in 4Q14, 16.8 pp higher vs. 3Q14. Solida had Ps 6.11 billion in investment projects compared to Ps 6.15 billion registered in September
2014.
Government: At the end of 4Q14 the balance was Ps 118.96 billion, growing by Ps 23.33 billion or 24% YoY
and Ps 13.97 billion or 13% QoQ as a result of efforts to continue meeting demand for loans in this segment, including some federal government entities. Banorte’s Government portfolio is diversified by sectors and regions, and shows adequate concentration. Banorte’s 20 largest Government loans account for 22.4% of the Bank’s total portfolio, increasing by 1.8 pp vs. 3Q14 and 2.8 pp vs. 4Q13. The largest Government loan represents 4.5% of the total portfolio and has an A1 rating, while number 20 represents 0.4%. The portfolio’s risk profile is adequate with 28.6% of the loans granted to Federal Government entities and over 95% of loans to States and Municipalities have a fiduciary guarantee (Federal budget transfers and local revenues such as payroll tax), and less than 2% of the loans have short-term maturities. As of November 2014, Banorte holds a 22.9% market share of the total system, ranking second.
Past Due Loans
During 4Q14, Past Due Loans were Ps 14.29 billion, 5% higher vs. 4Q13 as a result of higher delinquencies in
Commercial loans (including SMEs), Mortgages, Payroll loans, Credit Cards and Car loans, which were not offset by the significant reduction in Corporate delinquencies. The (4%) QoQ decrease came from lower delinquencies in Commercial, Corporate and Credit cards. Quaterly evolution of NPL balances were as follows:
Million pesos PDLs
4Q14
Change. Vs.
3Q14
Change. Vs.
4Q13
Credit Cards 1,358 (45) 79
Payroll 789 35 161
Car loans 223 8 36
Mortgage 1,274 72 187
Commercial 5,215 (603) 1,826
Corporate 5,435 (126) (1,649)
Government - - (2)
Total 14,293 (658) 638

II. MANAGEMENT'S DISCUSSION & ANALYSIS
Fourth Quarter 2014 22
In 4Q14, the Past Due Loan Ratio was 2.9%, (17 bp) lower vs. 4Q13 and (31 bp) lower vs. 3Q14. The annual decrease
came from lower delinquencies in the Corporate, Credit card and Payroll segments; while the quarterly decrease was the result of a lower PDL Ratio in the Commercial, Corporate and Credit cards. When excluding the home developers exposure, the PDL Ratio would be 1.8%, 30 bp above the level registered for
4Q13 and (30 bp) lower than in 3Q14.
PDL Ratios by segment showed the following trends during the last 12-months:
4Q13 1Q14 2Q14 3Q14 4Q14
Credit Cards 5.9% 6.2% 6.3% 5.9% 5.5%
Payroll 2.3% 2.0% 2.5% 2.2% 2.3%
Car loans 1.6% 1.3% 1.9% 1.9% 2.0%
Mortgage 1.3% 1.3% 1.3% 1.4% 1.4%
Commercial 2.9% 3.6% 3.9% 5.0% 4.4%
Corporate 8.6% 7.3% 7.3% 6.8% 6.3%
Government 0.0% 0.0% 0.0% 0.0% 0.0%
Total 3.1% 3.0% 3.1% 3.3% 2.9%
The expected loss of Banco Mercantil del Norte, the Financial Group’s main subsidiary, represents 1.9% and the unexpected loss 3.2%, both with respect to the total portfolio at the end of 4Q14. The average expected loss represented
2.0% for the period of October to December 2014. These ratios were 2.1% and 3.3%, respectively for the close of 3Q14 and 4Q13. Banco Mercantil del Norte’s Net Credit Losses (NCL) including discounts was 1.2%, an increase of 20 bp vs. 3Q14
as a result of write-offs realized during the quarter.
Quarterly changes in accounts that affect Non Performing Loans’ balances for the Financial Group were:
Balance as of September '14 14,951
Transfer from Performing Loans to Past
Due Loans 4,131
Portfolio Purchase 206
Renewals (362)
Cash Collections (894)
Discounts (186)
Charge Offs (2,629)
Foreclosures (135)
Transfer from Past Due Loans to
Performing Loans(859)
Loan Portfolio Sale -
Foreign Exchange Adjustments 27
Fair Value Ixe 43
Balance as of December '14 14,293
Past Due Loan Variations
(Million Pesos)

II. MANAGEMENT'S DISCUSSION & ANALYSIS
Fourth Quarter 2014 23
Around 83% of the loan book is rated A Risk, 11% B Risk and 6% as Risk C, D and E combined.
MIDDLE MARKET
COMPANIES
GOVERNMENT
ENTITIES
FINANCIAL
INTERMEDIARIES
A1 375,354 768 487 162 331 108 1,856
A2 58,211 254 229 7 318 38 846
B1 23,457 170 40 6 781 11 1,008
B2 23,162 107 30 11 723 22 893
B3 13,776 263 13 4 326 8 614
C1 6,764 165 26 3 239 39 472
C2 5,326 199 - 1 473 76 749
D 13,749 3,545 - 0 1,472 328 5,345
E 4,133 2,028 - - 1,072 107 3,208
Total 523,932 - - - -
Not Classified (39) - - - -
Exempt 29 - - - -
Total 523,922 7,498 825 195 5,735 737 14,990
Reserves - - - - 15,287
Preventive Reserves - - - - 297
LOANSCATEGORY
Risk Rating of Performing Loans as of 4Q14-GFNorte
(Million Pesos)
LOAN LOSS RESERVES
CONSUMER MORTGAGES TOTAL
COMMERCIAL
Notes: 1.- The ratings of loans and reserves created correspond to the last day of the month referred to in the Balance Sheet as of December 31, 2014. 2.- The loan portfolio is rated according to the rules issued by the Ministry of Finance and Public Credit (SHCP), the methodology established by the CNBV. 3.- The additional loan loss reserves follow the rules applicable to banks and credit institutions.
Based on B6 Credit Portfolio criteria of the CNBV, a Distressed Portfolio is defined as those commercial loans unlikely to be recovered fully, including both principal and interest pursuant to terms and conditions originally agreed. Such determination is made based on actual information and data and on the loan review process. Performing loans and past-due loans are susceptible of being identified as Distressed Portfolios. The D and E risk degrees of the commercial loan rating are as follows:
(Million Pesos) Total
Distressed Portfolio 11,305
Total Loans 523,922
Distressed Portfolio / Total Loans 2.2%

II. MANAGEMENT'S DISCUSSION & ANALYSIS
Fourth Quarter 2014 24
Loan Loss Reserves and Loan Loss Provisions
Loan Loss Reserves
(Million Pesos)
Previous Period Ending Balance 15,550
Provisions charged to results 2,611
Created with profitability margin 0
Reserve Portfolio Sold 0
Other items 0
Charge offs and discounts:
Commercial Loans -1,641
Consumer Loans -890
Mortgage Loans -373
Foreclosed assets 0
-2,905
Cost of debtor support programs -2
Valorization and Others 32
Adjustments 0
Loan Loss Reserves at Period End 15,287
4Q14
Loan Loss Reserves in 4Q14 totaled Ps 15.29 billion, (2%) lower vs. 3Q14. Moreover, 57% of write-offs, charge-offs
and discounts corresponds to the Commercial portfolio, 31% to Consumer and 13% to Mortgages. Similarly, the loan loss coverage ratio was 107.0% (106.6% excluding INB), increasing 2.3 pp YoY and 2.9 pp QoQ.

II. MANAGEMENT'S DISCUSSION & ANALYSIS
Fourth Quarter 2014 25
Banking Sector: Banco Mercantil del Norte, Banorte USA, Banorte- Ixe Tarjetas, Ixe Banco, Fincasa and Afore XXI Banorte (50% ownership).
Income Statement and Balance Sheet
Highlights-Banking SectorChange
(Million Pesos) QoQ YoY 2013
Income Statement
Net Interest Income 9,053 9,567 10,712 12% 18% 34,685 38,589 11%
Non Interest Income 3,262 4,102 3,554 (13%) 9% 13,313 14,969 12%
Total Income 12,315 13,669 14,266 4% 16% 47,998 53,559 12%
Non Interest Expense 6,579 6,376 7,887 24% 20% 25,766 27,037 5%
Provisions 1,800 3,208 2,704 (16%) 50% 8,788 11,107 26%
Operating Income 3,936 4,086 3,675 (10%) (7%) 13,444 15,414 15%
Taxes 919 1,298 1,033 (20%) 12% 2,761 4,720 71%
Subsidiaries & Minority Interest 282 258 342 32% 21% 1,439 1,242 (14%)
Net Income 3,299 3,046 2,984 (2%) (10%) 12,122 11,936 (2%)
Balance Sheet
Total Assets 787,916 867,924 874,908 1% 11% 787,916 874,908 11%
Performing Loans (a) 419,830 436,582 463,784 6% 10% 419,830 463,784 10%
Past Due Loans (b) 13,317 14,643 13,912 (5%) 4% 13,317 13,912 4%
Total Loans (a+b) 433,147 451,226 477,696 6% 10% 433,147 477,696 10%
Total Loans Net (d) 419,382 436,237 462,979 6% 10% 419,382 462,979 10%
Acquired Collection Rights ( e) 1,918 1,545 1,518 (2%) (21%) 1,918 1,518 (21%)
Total Loans (d+e) 421,300 437,782 464,497 6% 10% 421,300 464,497 10%
Total Liabilities 709,990 777,397 780,117 0% 10% 709,990 780,117 10%
Total Deposits 444,147 464,268 498,697 7% 12% 444,147 498,697 12%
Demand Deposits 255,297 277,663 300,282 8% 18% 255,297 300,282 18%
Time Deposits 188,850 186,604 198,414 6% 5% 188,850 198,414 5%
Equity 77,926 90,527 94,791 5% 22% 77,926 94,791 22%
4Q13 3Q14 4Q14Change
2013 2014
Change
QoQ YoY 2013
Profitability:
NIM (1) 4.9% 4.8% 5.3% 0.5 pp 0.4 pp 4.8% 4.9% 0.1 pp
NIM after Provisions (2) 3.9% 3.2% 4.0% 0.8 pp 0.0 pp 3.6% 3.5% (0.1 pp)
ROE (4) 17.3% 13.7% 12.9% (0.8 pp) (4.4 pp) 16.4% 13.7% (2.7 pp)
ROA (5) 1.7% 1.4% 1.4% (0.0 pp) (0.3 pp) 1.6% 1.4% (0.15 pp)
Operation:
Efficiency Ratio (6) 53.4% 46.6% 55.3% 8.6 pp 1.9 pp 53.7% 50.5% (3.2 pp)
Operating Efficiency Ratio (7) 3.3% 2.9% 3.6% 0.7 pp 0.3 pp 3.3% 3.2% (0.1 pp)
Liquidity Ratio (8) 98.8% 116.9% 104.1% (12.8 pp) 5.2 pp 98.8% 104.1% 5.2 pp
Asset Quality:
Past Due Loan Ratio 3.1% 3.2% 2.9% (0.3 pp) (0.2 pp) 3.1% 2.9% (0.2 pp)
Coverage Ratio 103.4% 102.4% 105.8% 3.4 pp 2.4 pp 103.4% 105.8% 2.4 pp
Past Due Loan Ratio w/o Banorte USA 3.1% 3.3% 3.0% (0.3 pp) (0.2 pp) 3.1% 3.0% (0.2 pp)
Coverage Ratio w/o Banorte USA 103.1% 102.0% 105.4% 3.4 pp 2.3 pp 103.1% 105.4% 2.3 pp
Growth (8)
Performing Loans (9) 8.0% 7.1% 10.5% 3.4 pp 2.4 pp 8.0% 10.5% 2.4 pp
Core Deposits 14.5% 12.8% 13.5% 0.7 pp (1.0 pp) 14.5% 13.5% (1.0 pp)
Total Deposits 4.4% 5.3% 12.3% 6.9 pp 7.9 pp 4.4% 12.3% 7.9 pp
Capitalization:
Net Capital/ Credit Risk Assets 20.6% 22.0% 21.7% (0.3 pp) 1.1 pp 20.6% 21.7% 1.1 pp
Total Capitalization Ratio 15.1% 15.0% 15.3% 0.3 pp 0.1 pp 15.1% 15.3% 0.1 pp
Financial Ratios Banking Sector 4Q13 3Q14 4Q14Change
20142013
1) NIM = Annualized Net Interest Margin for the quarter / Average of Performing Assets. 2) NIM = Annualized Net Interest Margin for the quarter adjusted for Credit Risks / Average of Performing Assets. 3) Net Income of the period annualized as a percentage of the quarterly average of Equity (excluding minority interest) for the same period. 4) Net Income of the period annualized as a percentage of the quarterly average of Total Assets (excluding minority interest) for the same period. 5) Non-Interest Expenses / Total Income 6) Annualized Non-Interest Expenses of the quarter / Average of Total Assets 7) Liquid Assets / Liquids Liabilities (Liquid Assets = Availability + Titles for negotiation + Titles available for sale; Liquid Liabilities = Demand deposits + Loans from banks and of other organisms
immediately payable + short term loans from banks and of other organisms.9 8) Growth compared to the same period of the previous year. 9) Does not include Fobaproa / IPAB and proprietary portfolio managed by the Recovery Bank.
BANKING SECTOR

II. MANAGEMENT'S DISCUSSION & ANALYSIS
Fourth Quarter 2014 26
Net Interest Income
Net Interest Income-Banking Sector Change
(Million Pesos) QoQ YoY 2013
Interest Income 13,848 13,867 14,208 2% 3% 55,619 56,356 1%
Interest Expense 5,140 4,641 4,543 (2%) (12%) 22,120 19,638 (11%)
Loan Origination Fees 429 441 1,133 157% 164% 1,564 2,237 43%
Fees Paid 84 99 86 (13%) 2% 377 365 (3%)
Net Interest Income 9,053 9,567 10,712 12% 18% 34,685 38,589 11%
Provisions 1,800 3,208 2,704 (16%) 50% 8,788 11,107 26%
Net Interest Income Adjusted for Credit
Risk 7,253 6,359 8,008 26% 10% 25,897 27,482 6%
Average Productive Assets 737,454 805,068 810,376 1% 10% 722,830 790,173 9%
Net Interest Margin (1) 4.9% 4.8% 5.3% 0.5 pp 0.4 pp 4.8% 4.9% 0.1 pp
NIM after Provisions (2) 3.9% 3.2% 4.0% 0.8 pp 0.0 pp 3.6% 3.5% (0.1 pp)
4Q13 3Q14 4Q14Change
2013 2014
1) NIM = Annualized Net Interest Margin for the quarter / Average of Performing Assets. 2) NIM = Annualized Net Interest Margin for the quarter adjusted for Credit Risks / Average of Performing Assets.
During 2014 Net Interest Income grew 11% YoY going from Ps 34.69 to Ps 38.59 billion, and increased 12% YoY
considering only interest income and net fees related to loan originations as a result of: i) a 10% growth in Performing Loans (highlighted by growth in the Government, Consumer and Corporate portfolios), even with the sale of the Payroll loan portfolio to Solida in 3Q14; (ii) lower cost of funds, as a result of growth in Core Deposits, mainly Demand Deposits, producing an (11%) decrease in Interest Expenses. These latter were also reduced by the 50 bps reduction in the benchmark market rate in the last 12 months, as well as the payment in August 2013 of Ixe’s Perpetual Subordinated dollar Obligations issued at 9.75% and the prepayment of Preferred Subordinated Obligations for Ps 2.2 billion in April 2014, carrying a rate of TIIE + 2.0% and iii) a 43% increase in loan fees.
During 4Q14, Net Interest Income totaled Ps 10.71 billion, a QoQ increase of 12%, which is explained by: i) a 9%
increase in Net Interest Income and loan fees mainly due to the 6% quarterly growth of the total loan portfolio, which was driven by growth in all the loan portfolios, mainly in Government, Commercial and Corporate, ii) a lower funding cost associated with the growth in deposits and iii) the 157% increase in loan fees related to Commercial and housing loans. The average NIM was 4.9% for 2014, +0.1 pp. vs 2013. In 4Q14, NIM was 5.3%, 0.5 pp. higher vs. 3Q14.
Loan Loss Provisions
During 2014 Loan Loss Provisions totaled Ps 11.11 billion, 26% higher vs. 2013, and Ps 2.70 billion in 4Q14, a
(16%) decrease vs. 3Q14. The annual increase is explained mainly by increased provisions for Middle-Market Companies portfolios, as a result of the loan exposures to the troubled home developers, SMEs, Payroll loans, Mortgage and Credit card portfolios as well. The quarterly decrease is mainly due to lower provisions for the Middle-Market Companies, Payroll, Mortgage, Car loan and Government portfolios, which were partially offset by provisions for the home developers exposure and the Credit card portfolio. The average NIM adjusted for Credit Risks was 3.5% at the end of 2014, (0.1 pp.) lower vs. 2013, and 4.0% for 4Q14,
an increase of 0.8 pp. vs. 3Q14.

II. MANAGEMENT'S DISCUSSION & ANALYSIS
Fourth Quarter 2014 27
Non-Interest Income
Non Interest Income Change
(Million Pesos) QoQ YoY 2013
Services 2,042 2,106 2,454 17% 20% 7,580 8,583 13%
Recovery 25 18 21 13% (16%) 88 49 (44%)
Trading 595 1,083 372 (66%) (37%) 3,021 3,859 28%
Other Operating Income (Expense) 600 894 708 (21%) 18% 2,624 2,478 (6%)
Non Interest Income 3,262 4,102 3,554 (13%) 9% 13,313 14,969 12%
20144Q13 3Q14 4Q14Change
2013
Non-Interest Income in 2014, totaled Ps 14.97 billion, a 12% YoY increase driven by growth in Service Fees and Trading revenues, which offset declines in Other Operating Income (Expenses) and real estate portfolio recoveries; Non-Interest Income for 4Q14 was Ps 3.55 billion, representing a QoQ decrease of (13%) vs. 3Q14 due to lower Trading
revenues and Other Operating Income (Expenses) which were not offset by growth in Service Fees.
Non-Interest Expenses
Non Interest Expense Change
(Million Pesos) QoQ YoY 2013
Personnel 2,933 2,695 3,912 45% 33% 12,569 12,441 (1%)
Professional Fees 744 669 770 15% 4% 2,365 2,591 10%
Administrative and Promotional 1,234 1,277 1,388 9% 12% 4,230 4,995 18%
Rents, Depreciation & Amortization 729 859 889 3% 22% 2,992 3,391 13%
Taxes other than income tax & non
deductible expenses 374 303 371 23% (1%) 1,456 1,364 (6%)
Contributions to IPAB 484 474 487 3% 1% 1,831 1,887 3%
Employee Profit Sharing (PTU) 82 99 70 (30%) (15%) 323 369 14%
Non Interest Expense 6,579 6,376 7,887 24% 20% 25,766 27,037 5%
4Q13 3Q14 4Q14Change
2013 2014
Non-Interest Expenses in 2014 totaled Ps 27.04 billion, a 5% YoY increase driven by growth in all areas except Personnel Expenses and Other Taxes and Non-Deductible Expenses. Non-Interest Expenses in 4Q14 totaled Ps 7.89 billion, a 24% QoQ increase as a result of growth in all areas except Statutory Employee Profit Sharing.
The Efficiency Ratio for 2014 was 50.5%, (3.2 pp) lower YoY vs. 2013 due to the positive operating leverage achieved; and 55.3% for 4Q14, an increase of 8.6 pp vs. 3Q14 due to the combination of a faster growth rate in Operating
Expenses and a reduction in the quarterly Non-Interest Income.
Net Income
Net Income for the Banking Sector in 2014 was Ps 11.94 billion, declining by (Ps 187) million or (2%) vs. 2013. It is important to note that Operating Income registered a 15% YoY growth, but was affected by higher tax payments due
to the implementation of the new tax regulations, which resulted in a 71% YoY tax increase. Net Income for the Banking Sector in 4Q14 was Ps 2.98 billion, (Ps 62) million or (2%) lower vs. 3Q14 due to growth
in Non-Interest Expenses, the decrease in trading revenues, which offset the 12% increase of Net Interest Income and the 16% decrease in Provisions. SOFOM Banorte-Ixe Tarjetas continues to report positive performance, posting net profits of Ps 1.81 billion for 2014,
50% higher YoY vs. 2013, contributing 12% of the Financial Group’s profits. ROE for 2014 of this sector was 13.7%, (267 bp) lower vs. 2013 as a result of capital accretion, while the quarterly ROE was 12.9%, (0.8 pp) lower vs. 3Q13. Accumulated ROA for 2014 was 1.4%, decreasing (15 bp); quarterly ROA
was also 1.4%, (4 bp) lower vs. 3Q14.
NPL Ratio
The Banking Sector’s NPL Ratio for 4Q14 was 2.9% (includes INB past due loans), (0.2 pp) lower YoY and (0.3 pp) lower
QoQ.

II. MANAGEMENT'S DISCUSSION & ANALYSIS
Fourth Quarter 2014 28
I. Banorte USA
Income Statement– Banorte USA Change
Figures in MEX GAAP (Million Pesos) QoQ YoY 2013
Income Statement
Net Interest Income 150 160 171 7% 14% 582 651 12%
Non Interest Income 125 122 135 11% 8% 451 497 10%
Total Income 275 282 307 9% 11% 1,033 1,148 11%
Non Interest Expense 198 186 221 18% 11% 755 808 7%
Loan Loss Reserves 11 3 5 81% (57%) 36 21 (42%)
Operating Income 66 93 81 (13%) 23% 242 319 32%
Taxes 23 32 26 (19%) 16% 79 105 32%
Net Income 44 61 55 (9%) 27% 163 214 32%
4Q13 3Q14 4Q14 2014
Change
2013
Under Generally Accepted Accounting Principles for Mexico (MEX GAAP), the Net Income of Banorte USA (owner of 100% of Inter National Bank as well as 100% of remittance companies Uniteller and Motran) was Ps 214 million for 2014, increasing by 32% YoY, mainly due to growth in Net Interest Income and Non-Interest Income as well as lower
Provisions. Net Income for Banorte USA during 2014 represents 1.4% of the Financial Group’s profits. Net Income for 4Q14 was Ps 55 million, (9%) lower vs. 3Q14 due to negative operating leverage in the quarter and higher provisions. II. Inter National Bank (US GAAP)
Income Statement & Balance Sheet
Highlights - InterNational BankChange
Figures in US GAAP (Millon Dollars) QoQ YoY 2013
Income Statement
Net Interest Income 12 13 13 2% 7% 47 51 7%
Non Interest Income 4 4 4 (10%) (1%) 20 17 (15%)
Total Income 16 17 16 (1%) 5% 67 67 1%
Non Interest Expense 12 10 11 11% (6%) 48 44 (8%)
Loan Loss Reserves 0 1 1 153% 236% - 2 2023%
Operating Income 3 6 4 (36%) 15% 18 20 11%
Net Income 2 4 3 (26%) 24% 12 14 12%
Balance Sheet
Investments in Securities 658 509 520 2% (21%) 658 520 (21%)
Performing Loans 777 854 904 6% 16% 777 904 16%
Past Due Loans 7 8 6 (21%) (14%) 7 6 (14%)
Demand Deposits 835 806 858 6% 3% 835 858 3%
Time Deposits 607 592 588 (1%) (3%) 607 588 (3%)
Total Deposits 1,442 1,398 1,446 3% 0% 1,442 1,446 0%
Equity 406 426 432 1% 6% 406 432 6%
3Q14 4Q144Q13 2013Change
2014
BANORTE USA

II. MANAGEMENT'S DISCUSSION & ANALYSIS
Fourth Quarter 2014 29
Financial Ratios INB Change
Figures in US GAAP (Millon Dollars) QoQ YoY 2013
Profitability:
NIM 3.3% 3.4% 3.4% 0.1 0.1 2.9% 3.4% 0.4
ROE 2.2% 3.6% 2.6% (1.0) 0.4 3.0% 3.3% 0.3
ROA 0.5% 0.8% 0.6% (0.2) 0.1 0.6% 0.7% 0.1
Operational:
Efficiency Ratio 76.4% 61.5% 68.7% 7.3 (7.7) 72.5% 66.2% (6.4)
Asset Quality:
Past Due Loan Ratio 0.9% 0.9% 0.7% (0.2) (0.2) 0.9% 0.7% (0.2)
Coverage Ratio 214.2% 201.7% 278.6% 76.9 64.4 214.2% 278.6% 64.4
Capitalization:
Leverage Ratio 12.9% 13.4% 13.9% 0.5 1.0 12.9% 13.9% 1.0
Capitalization Ratio 23.9% 23.7% 22.9% (0.8) (1.0) 23.9% 22.9% (1.0)
Change2013 20143Q14 4Q144Q13
Under Generally Accepted Accounting Principles of the United States (US GAAP), Inter National Bank (INB) posted net profits for US $14 million in 2014, a 12% YoY increase mainly due to higher NII from significant loan growth, and lower Operating Expenses. Net Income for 4Q14 amounted US $3 million, (26%) lower vs. 3Q14 due to negative operating
leverage. INB has an investment portfolio of US $520 million mainly consisting of mortgage-backed securities, which decreased US $137 million or (21%) YoY, and it increased US $12 million or 2% QoQ. The underlying mortgages are rated AAA with an implicit guarantee from the US government. The portfolio posted unrealized valuation losses in 4Q14 of US ($7) million and its weighted average life is 4.6 years. Total Deposits amounted to US $1.45 billion, increasing by US $4 million YoY and US $48 million or 3% QoQ. Performing Loans totaled US $904 million, increasing by US $127 million or 16% YoY and US $50 million, or 6% QoQ. Past Due Loans posted US $6 million, registering reductions of US ($1) million or (14%) YoY and US ($2)
million or (21%) QoQ. Capitalization and Leverage Ratios remain robust. The Capitalization Ratio ended in 4Q14 at 22.9% and the Leverage Ratio was 13.9%. The Past Due Loan ratio was 0.7%, a (0.2 pp) decrease YoY and QoQ; the Coverage
ratio was 278.6%, increasing 64.4 pp YoY and 76.9 pp QoQ. Accumulated 2014 ROE was 3.3%, 0.3 pp higher YoY; ROE for 4Q14 was 2.6%, increasing 0.4 pp YoY and decreasing (1.0 pp) QoQ. Accumulated ROA for 2014 was 0.7%, 0.1 pp higher YoY, and ROA for 4Q14 was 0.6%, decreasing (0.2 pp) QoQ and increasing 0.1 pp YoY. The Efficiency Ratio was 66.2% for 2014, (6.4 pp) lower YoY, for 4Q14 was 68.7%, +7.3 pp QoQ, and (7.7 pp) YoY. NIM for 2014 was 3.4%, increasing 0.4 pp YoY; similarly, NIM in 4Q14 was
3.4%, +0.1 pp QoQ and YoY.

II. MANAGEMENT'S DISCUSSION & ANALYSIS
Fourth Quarter 2014 30
III. UniTeller Financial Services (US GAAP)
Income Statement and Transactions
Highlights UniTeller Financial ServicesChange
Figures in US GAAP (Thousand Dollars) QoQ YoY 2013
Profitability:
Revenues 5,956 7,326 7,393 1% 24% 20,308 27,886 37%
Cost of Sales 3,790 4,697 4,223 (10%) 11% 13,107 17,495 33%
Margin 2,166 2,629 3,170 21% 46% 7,201 10,391 44%
Expenses 1,699 1,825 2,115 16% 24% 6,029 7,271 21%
Income before Taxes 467 804 1,055 31% 126% 1172 3119 166%
Net Income 235 533 505 (5%) 114% 692 1893 173%
Transactions
# of created transactions (thousand) 1,525 2,133 2,176 2% 43% 4,909 8,092 65%
4Q13 3Q14 4Q14Change
2013 2014
UniTeller Financial Services and subsidiaries (UFS) recorded accumulated profits of US $1.89 billion in 2014, comparing favorably to the profits of US $692 thousand for the same period of the previous year, mainly due to more transactions. At the end of 2014 transactions showed a 65% YoY growth, resulting mainly from the expansion of the processing business, including more services to other institutions. IV. Solida USA
In order to reduce Classified Assets and achieve the acceptable levels for the OCC, INB’s regulator in the United States, INB sold assets to Banorte and Solida. These assets are managed by "Solida USA", Banorte’s recovery subsidiary in the United States. Assets under management by Solida USA as of 4Q14 are as follows: Solida Mexico (Foreclosed Assets): US $ 17 million Banorte (Foreclosed Loans and Assets): US $ 72 million INB (Classified Assets and Mortgage Portfolio): US $ 14 million
Total: US $103 million
As a result of the adequate asset management, INB’s Tier 1 Classified Assets Ratio at the close of 4Q14 was 5.8%,
within the acceptable parameters of the regulator in the United States.

II. MANAGEMENT'S DISCUSSION & ANALYSIS
Fourth Quarter 2014 31
Income Statement Highlights - Recovery Banking Change
(M illion Pesos) 2013
Net Interest Income 25 17 (32%)
Loan Loss Provisions 6 (3) (147%)
Non Interest Income 1,944 1,687 (13%)
Non Interest Expense 853 957 12%
Pre-tax Income & Subsidiaries 1,110 750 (32%)
Income Tax and Profit Sharing 315 177 (44%)
Net Income 794 573 (28%)
2013 2014
Assets Under Management
(Million Pesos)
Banking Sector Portfolio- Banorte: 66,076Banorte’s Portfolio and
Repossessed Assets
Net Interest Income and Other Revenues
and Expenses
Loans purchased and managed: 29,865Solida Asset Management
and Banorte
Non Interest Income and Other Revenues
and Expenses (Sólida / Banorte)
Investment Projects: 6,240Solida Asset Management
and BanorteNon Interest Income
Total 102,181
4Q14ACCOUNTING IN THE
BALANCE SHEET
ACCOUNTING IN THE INCOME
STATEMENT
Net Income
Recovery Banking posted profits of Ps 573 million in 2014, (28%) lower than the same period in 2013, driven by
lower Non Interest Income as a result of a significant recovery registered in 1Q13, , additionally, Net Income was affected by a higher level of Non Interest Expenses. Recovery Bank’s Net Income represents 3.8% of the Group’s profits.
Assets Under Management
The Recovery Bank managed total assets of Ps 66.1 billion at the end of the 4Q14, of which 22% corresponds to
Crediactivo, 21% to mortgage loans, 16% to credit cards, 13% to payroll loans, 9% to middle market companies, 9% to foreclosed assets, 6% to car loans, 2% to commercial, 1% to personal loans and 1% to affiliates. Gross revenues generated by the portfolio during 2014 amounted to Ps 935 million, (5%) lower YoY. At the end of 4Q14, of the Ps 29.9 billion in portfolios acquired and managed by the Recovery Bank, 36% are
mortgages, 21% to the portfolio managed on behalf of the Mexican mortgages agency SHF, 21% to middle market companies and commercial loans, 12% to real estate portfolios and 10% to foreclosed assets and payments in kind. These portfolios generated gross revenues in 2014 of Ps 862 million, (34%) lower YoY.
RECOVERY BANKING

II. MANAGEMENT'S DISCUSSION & ANALYSIS
Fourth Quarter 2014 32
Brokerage Sector Change
(Million Pesos) QoQ YoY 2013
Brokerage
Net Income 154 297 175 (41%) 13% 649 931 43%
Shareholder’s Equity 2,569 2,540 2,799 10% 9% 2,569 2,799 9%
Assets Under Custody 647,996 778,344 732,713 (6%) 13% 647,996 732,713 13%
Total Assets 116,576 65,574 102,373 56% (12%) 116,576 102,373 (12%)
ROE 25.0% 42.7% 26.3% (16.5 pp) 1.2 pp 25.1% 34.0% 8.9 pp
Net Capital
Net Capital (1) 2,053 2,132 2,353 10% 15% 2,053 2,353 15%
2013 20144Q13 3Q14 4Q14Change
1) Net capital structure: Tier 1 =Ps 2.35 billion, Tier 2 = Ps 0 million.
Net Income
The Brokerage Sector (Casa de Bolsa Banorte Ixe y Operadora de Fondos Banorte-Ixe) reported profits of Ps 931 million in 2014, 43% higher than in the same period of the previous year. Growth was driven by a higher NII, higher
trading revenues and lower Non Interest Expenses, which offset higher tax payments. The Brokerage Sector’s Net Income for 2014 represented 6% of the Financial Group’s profits. Net Income in 4Q14 totaled Ps 175 million, (41%) lower vs. 3Q14, due to reduced trading revenues and growth in Non
Interest Expenses, items that didn’t offset the increase in NII.
Mutual Funds Operadora de Fondos Banorte Ixe reported profits of Ps 94 million in 2014, an 8% increase vs. the same period of
the previous year due to greater fees resulting from growth in assets under management. Quarterly profits totaled Ps 15 million, (50%) lower QoQ vs. 3Q14. At the end of 4Q14, assets managed by Banorte-Ixe’s mutual funds amounted to Ps 144.2 billion, an annual growth of 29%. Assets held in fixed income funds totaled Ps 125.8 billion, a 28% increase YoY, while equity funds held assets of Ps 18.3 billion, with an annual increase of 39%. At the end of December, Banorte-Ixe had a 7.8% share of the mutual fund market, comprised of 9.1% in fixed income funds and 4.1% in equity funds.
Assets Under Management At the end of 4Q14, AUM totaled Ps 732.7 billion, increasing 13% YoY and decreasing (6%) QoQ.
BROKERAGE

II. MANAGEMENT'S DISCUSSION & ANALYSIS
Fourth Quarter 2014 33
LONG TERM SAVINGS Change
(Million Pesos) QoQ YoY 2013
Afore (1)
Net Income (a) 539 495 655 32% 21% 2,301 2,408 5%
Shareholder’s Equity 24,374 23,928 23,982 0% (2%) 24,374 23,982 (2%)
Total Assets 25,402 25,245 25,282 0% (0%) 25,402 25,282 (0%)
AUM (SIEFORE)* 541,545 589,723 605,816 3% 12% 541,545 605,816 12%
ROE 8.9% 8.4% 10.9% 2.6 pp 2.0 pp 11.5% 10.0% (1.5 pp)
Insurance- Seguros Banorte
Total Operating Income 652 783 960 23% 47% 2,334 3,387 45%
Non Interest Expense 199 190 248 30% 25% 795 845 6%
Operating Income 453 593 711 20% 57% 1,539 2,543 65%
Taxes 113 202 199 (2%) 77% 436 781 79%
Subsidiaries & Minority Interest (3) (0) (2) 659% (38%) (6) (3) (45%)
Net Income 338 390 511 31% 51% 1,097 1,759 60%
Shareholder’s Equity 3,854 4,554 5,094 12% 32% 3,854 5,094 32%
Total Assets 18,470 21,860 24,153 10% 31% 18,470 24,153 31%
Technical Reserves 11,264 12,690 13,629 7% 21% 11,264 13,629 21%
Premiums sold 3,303 2,768 4,583 66% 39% 13,497 17,100 27%
Coverage ratio of technical
reserves1.3 1.3 1.3 0.0 pp 0.0 pp 1.3 1.3 0.0 pp
Capital coverage ratio of
minimum guarantee1.7 1.9 2.0 0.1 pp 0.3 pp 1.7 2.0 0.3 pp
Coverage ratio of minimum
capital39.9 52.0 58.1 6.1 pp 18.2 pp 39.9 58.1 18.2 pp
ROE 36.9% 33.9% 42.6% 8.7 pp 5.7 pp 32.5% 39.2% 6.7 pp
Annuities
Total Operating Income 157 183 185 1% 18% 510 680 33%
Non Interest Expense 66 69 77 13% 18% 261 280 7%
Operating Income 91 114 108 (6%) 18% 250 401 60%
Taxes 28 37 35 (4%) 25% 78 128 65%
Subsidiaries & Minority Interest 3 0 2 659% (36%) 6 3 (46%)
Net Income 65 78 74 (4%) 14% 178 276 55%
Shareholder’s Equity 1,250 1,451 1,375 (5%) 10% 1,250 1,375 10%
Total Assets 52,524 59,212 61,729 4% 18% 52,524 61,729 18%
Technical Reserves 50,943 57,311 59,879 4% 18% 50,943 59,879 18%
Premiums sold 1,736 2,227 2,021 (9%) 16% 8,864 8,048 (9%)
Coverage ratio of technical
reserves1.0 1.0 1.0 (0.0 pp) (0.0 pp) 1.0 1.0 (0.0 pp)
Coverage ratio of minimum
capital8.2 10.2 9.7 (0.1 pp) 0.2 pp 8.2 9.7 1.5 pp
ROE 20.6% 22.0% 21.0% (1.0 pp) 0.4 pp 14.4% 20.4% 6.0 pp
201420134Q13 3Q14 4Q14Change
1. In January 2012 the merger of Afore XXI and Afore Banorte was completed, therefore Afore XXI Banorte was created, which presents its results in
Banco Mercantil del Norte through the equity participation method. As of January 2013, de acquisition of Afore Bancomer was completed, presenting the results since then
a. For informative and comparative purposes of this sector, Afore XXI Banorte's income is included in this section.
LONG TERM SAVINGS

II. MANAGEMENT'S DISCUSSION & ANALYSIS
Fourth Quarter 2014 34
Afore XXI Banorte
Afore XXI Banorte posted net profits of Ps 2.41 billion for 2014, 5% higher vs. the same period of last year due to
higher revenues and valuation gains in its investment portfolios, which offset higher Operating Expenses and taxes. Quarterly profits totaled Ps 655 million, an increase of 32% QoQ, as a result of a positive operating leverage as well as
valuation gains from its investment portfolio. ROE for Afore XXI Banorte at the end of 2014 was 10%, (1.5 pp) lower vs. the same period of the previous year; when excluding goodwill, ROE would be 32.7%. ROE for 4Q14 was 10.9%, + 2.6 pp QoQ. Afore XXI Banorte contributed 8%
of the Financial Group’s profits for 2014. Assets under management as of December 2014 totaled Ps 605.8 billion, an increase of 3% vs. September 2014 and 12% vs. december 2013. According to CONSAR, to November 2014, Afore XXI Banorte had a 25.7% share in managed funds, ranking 1
st in the
market, with 11.33 million accounts (this number does not include 6.0 million accounts managed by Afore XXI with resources deposited in Banco de Mexico), which represent a 24.5% share of the total number of accounts in the system, making it the market leader.
Seguros Banorte
On October 4
th, 2013, the acquisition of Assicurazioni Generali S.p.A.’s 49% minority stake in Seguros Banorte Generali
and Pensiones Banorte Generali was completed, and so as of this date GFNorte owns 100% of these companies' equity. In 2014, Seguros Banorte reported profits of Ps 1.76 billion, 60% higher YoY due to a significant growth in NII, which
offset higher Non-Interest Expenses and taxes. Seguros Banorte’s net income represented 12% of the Financial Group’s profits for 2014. Quarterly earnings totaled Ps 511 million, an increase of 31% QoQ, due to growth in the Net Interest Income, offsetting
growth in Operating Expenses. Written premiums increased 27% YoY totaling Ps 17.10 billion. Technical Reserves totaled Ps 13.63 billion,
increasing 21% YoY and 7% QoQ. ROE for the insurance company was 39.2% at the end of 2014, 6.67 pp higher YoY, while ROE for 4Q14 was 42.6%,
increasing 8.7 pp QoQ.
Regarding the disclosure requested by the General Provisions applicable to Financial Groups' controlling companies, for this reporting period:
i. Risks assumed through the issuance of insurance premiums and bonds, with respect to operations and authorized branches of cancelled operations.
No cancellations were registered during 4Q14 that involved any technical risk.
ii. Transfer of risks through reinsurance and bonding contracts
In the P&C book two important government contracts and one in the tourism sector were ceded to reinsurers, by which 100% of the risk was transferred to prominent foreign reinsurance companies.
iii. Contingencies arising from non-fulfillment by reinsurers and bonding companies.
There were no relevant events in 4Q14.
Pensiones Banorte
During 2014, Pensiones Banorte reported profits of Ps 276 million, increasing by Ps 98 million or 55% vs. 2013 due
to growth in NII, which offset lower trading revenues and higher operating expenses and taxes. Net income for Pensiones Banorte for 2014 represented 2% of the Financial Group’s profits. Quarterly earnings totaled Ps 74 million,
decreasing (4%) vs. 3Q14 due to higher non-interest expenses and reduced NII, which could not be offset by growth in trading revenues.
ROE was 20.4% at the end of 2014, 6.0 pp higher vs. 2013. In 4Q14 ROE was 21.0%, declining by (1.0 pp) QoQ.

II. MANAGEMENT'S DISCUSSION & ANALYSIS
Fourth Quarter 2014 35
Other Finance Companies Change
(Million Pesos) QoQ YoY 2013
Leasing and Factoring
Net Income 174 161 209 29% 20% 599 700 17%
Shareholder’s Equity 3,209 3,702 3,735 1% 16% 3,209 3,735 16%
Loan Portfolio (1) 19,732 20,782 21,237 2% 8% 19,732 21,237 8%
Past Due Loans 210 168 181 8% (14%) 210 181 (14%)
Loan Loss Reserves 312 311 309 (1%) (1%) 312 309 (1%)
Total Assets 20,173 21,094 21,623 3% 7% 20,173 21,623 7%
ROE 22.3% 17.8% 22.5% 4.7 pp 0.1 pp 20.3% 20.0% (0.3 pp)
Warehousing
Net Income 3 8 22 188% 734% 43 45 6%
Shareholder’s Equity 271 295 218 (26%) (20%) 271 218 (20%)
Inventories 477 459 922 101% 93% 477 922 93%
Total Assets 711 687 1,127 64% 58% 711 1,127 58%
ROE 3.9% 10.5% 34.2% 23.8 pp 30.3 pp 15.9% 16.6% 0.7 pp
4Q144Q13Change
2013 20143Q14
1. Includes pure leasing portfolio registered in property, furniture and equipment (net).
Leasing and Factoring
In 2014 Arrendadora y Factor Banorte reported profits amounting to Ps 700 million, increasing 17% YoY mainly
due to the increase in Net Interest Income driven by the growth in the portfolio, lower funding costs, provisions and Operating Expenses. The Leasing and Factoring Company contributed 4.6% of the Financial Group’s profits in 2014. Quarterly earnings totaled Ps 209 million, a 29% increase vs. 3Q14 mainly as a result of a greater Net Interest
Income and reduced provisions derived from the collection to clients in past due loan. ROE for the Leasing and Factoring company was 20.0% at the end of December 2014, (0.3 pp) lower YoY; while the ROE for 4Q14 was 22.5%, higher by 0.1 pp vs. 4Q13 and 4.7 pp vs. 3Q14.
At the end of 4Q14, the Past Due Loan Ratio was 0.9%, remaining the same as in 3Q14 and (0.3 pp) lower vs. 4Q13; on the other hand, the Coverage ratio was 170.5%, 22 pp higher vs. 4Q13 and (15 pp) lower vs. 3Q14. The Capitalization ratio estimated as of December was 15.95% considering total risk-weighted assets of Ps 23.34 billion.
Arrendadora y Factor Banorte continue to be the market leader in terms of portfolio size and assets among the 47 companies in this sector, according to the Asociación Mexicana de Sociedades Financieras de Arrendamiento, Crédito y Factoraje, A.C. - AMSOFAC.
Warehouse
Warehouse posted profits of Ps 45 million in 2014, Ps 2 million more than last year mainly due to growth in Other
Operating Income, which offset the decline in the Net Interest Income. Almacenadora Banorte contributed 0.3% of the Financial Group’s profits in 2014. Quarterly earnings totaled Ps 22 million, Ps 14 million higher vs. 3Q14.
ROE for 2014 was 16.6%, 0.7 pp higher YoY. ROE for 4Q14 was 34.2%, 23.8 pp vs. 3Q14.
In 4Q14 the Capitalization Ratio was 19.7%, considering total certificates at risk in circulation for Ps 3.35 billion.
Almacenadora Banorte ranks third among the 18 warehouses of this sector in terms of generated profits.
OTHER FINANCE COMPANIES

II. MANAGEMENT'S DISCUSSION & ANALYSIS
Fourth Quarter 2014 36
Other Companies Change
(Million Pesos) QoQ YoY 2013
Sólida Administradora de Portafolios
(former Ixe Soluciones)
Net Income (266) 41 (70) (272%) (74%) (22) (178) 705%
Shareholder’s Equity 2,310 4,007 3,946 (2%) 71% 2,310 3,946 71%
Loan Portfolio 494 4,259 3,926 (8%) 695% 494 3,926 695%
Past Due Loans 196 196 213 8% 8% 196 213 8%
Loan Loss Reserves 213 250 260 4% 22% 213 260 22%
Total Assets 14,010 17,409 16,843 (3%) 20% 14,010 16,843 20%
Ixe Servicios
Net Income 0.6 1.1 0.0 (99%) (99%) 1.4 1.5 14%
Shareholder’s Equity 24 25 145 473% 510% 24 145 510%
Total Assets 32 132 147 11% 357% 32 147 357%
ROE 10.7% 17.3% 0.0% (17.2 pp) (10.7 pp) 5.9% 3.2% (2.7 pp)
2013 20144Q13 3Q14 4Q14Change
Solida Administradora de Portafolios
During 2014, Solida Administradora de Portfolios reported a loss of (Ps 178) million, an annual variation of (Ps 156) million, because of lower revenues from fees from investment projects. In 4Q14 Solida Administradora de Portafolios reported a loss of (Ps 70) million, (Ps 111) million less than that registered in 3Q14. This was mainly due to the
increase in expenses related to the acquisition of property (notaries, property taxes, etc.), as well as expenses for transfer of domain and certification of liens, among others which was not offset by growth in NII from the acquisition of Banco Mercantil del Norte’s Performing Payroll loan portfolio in 3Q14.
The Past Due Loan Ratio was 5.4% at the end of 4Q14. The Coverage ratio was 123%, comparing favorably to the 109% of 4Q13 and unfavorably to the 128% of 3Q14. The estimated Capitalization ratio at the end of 4Q14 was 16.2%, 0.4 pp higher vs. 3Q14 and 4.4 pp higher vs. 4Q13 (due to the increase in equity in 3Q14).
OTHER COMPANIES

II. MANAGEMENT'S DISCUSSION & ANALYSIS
Fourth Quarter 2014 37
Rated
Intitutions
STABLE Outlook
BBB Counterparty credit - Long term foreign currency
BBB Counterparty credit - Long term local currency
A-2 Counterparty credit - Short term foreign currency
A-2 Counterparty credit - Short term local currency
BBB Senior Unsecured Notes
BB Subordinated Junior Notes (from the merged Ixe Banco)
STABLE Outlook
bbb+ Viability
BBB+ Long term foreign currency (IDR'S)
F2 Short term foreign currency (IDR'S)
5 Support Rating-GFNorte
NF (Not Floor) Support Rating Floor - GFNorte
STABLE Outlook
bbb+ Viability
BBB+ Long term foreign currency
F2 Short rerm foreign Currency
C Individual - Foreign Currency
2 Support Rating - Banco Mercantil del Norte
BBB- Support Rating Floor - Banco Mercantil del Norte
BB Subordinated Junior Notes (from the merged Ixe Banco)
STABLE Outlook BFSR
C – Bank Financial Strenght
baa1 Baseline Credit Assessment
STABLE Outlook
A2 Long term local currency deposits
A3 Long term foreign currency deposits
P-1 Short term local currency deposits
P-2 Short term foreign currency deposits
A2 Long term foreign currency senior debt
Baa2 Long term local currency subordinated debt
Baa2 (hyb) Long term foreign currency subordinated debt
Baa3 (hyb) Long term local currency junior subordinated debt
Baa3 (hyb) Long term foreing currency junior subordinated debt
STABLE Outlook
A3 Long term local currency issuer
P-2 Short term local currency issuer
(P)A3 Long term local currency senior debt
(P)P-2 Short term local currency senior debt
Standard & Poor’s
International Ratings - GFNorte
Rating Agency
Banco Mercantil del Norte
Rating Category Date
September,2014
Fitch
Banco Mercantil del Norte
March, 2014
Grupo Financiero Banorte
Arrendadora y Factor
Banorte
Dec, 2014Banco Mercantil del Norte
Moody’s
Dec, 2014
RATINGS

II. MANAGEMENT'S DISCUSSION & ANALYSIS
Fourth Quarter 2014 38
Rated
Institutions
STABLE Outlook
mxA-1+ National Scale Counterparty credit - Short term
mxAAA National Scale Counterparty - Long term
STABLE Outlook
mxA-1+ National Scale Counterparty credit - Short term
mxAAA National Scale Counterparty credit - Long term
STABLE Outlook
AAA (mex) National Scale Counterparty - Long term
F1+ (mex) National Scale Counterparty - Short term
F1 + (mex) Depo. Certi. y P.R.L.V. short Term
AA+ (mex) Depo. Certi. y P.R.L.V. long term
STABLE Outlook
F1+ (mex) National Scale - Short term
AAA (mex) National Scale - Long term
F1+ (mex) National Scale Counterparty - Short term
AAA (mex) National Scale Counterparty- Long term
F1+ (mex) National Scale - Unsecured Debt - Short term
AAA (mex) National Scale - Unsecured Debt - Long term
F1+ (mex) National Scale Counterparty - Short term
AAA (mex) National Scale Counterparty - Long term
STABLE Outlook
AAA (mex) Financial Strenght
STABLE Outlook
Aaa.mx National Scale - Long term deposits
MX-1 National Scale - Short term deposits
Aa1.mx Subordinated debt - Long term
Aa2.mx Junior Subordinated debt - Long term
STABLE Outlook
Aaa.mx National Scale - Long term issuer
MX-1 National Scale - Short term issuer
Aaa.mx National Scale - Long term senior debt
MX-1 National Scale - Short term senior debt
STABLE Outlook
HR AAA Long term debt
HR+1 Short term debt
HR AA+ Subordinated Debt Preferential
Fitch
Standard & Poor’s
Dec, 2014
Casa de Bolsa Banorte Ixe
Arrendadora y Factor
Banorte
Dec, 2014
Moody’s
Banco Mercantil del Norte
March, 2014
April, 2014
Almacenadora Banorte
Dec,2014
Arrendadora y Factor
Banorte
HR Ratings Banco Mercantil del Norte
Seguros Banorte Generali
Banco Mercantil del Norte
Domestic Ratings - GFNorte
April, 2014
Category DateRatingRating Agency
Banco Mercantil del Norte
Casa de Bolsa Banorte Ixe

II. MANAGEMENT'S DISCUSSION & ANALYSIS
Fourth Quarter 2014 39
Employees (1) 27,474 27,555 27,898
Branches (2) 1,288 1,267 1,269
INB 20 20 20
ATM’s 7,035 7,167 7,297
POS’s 141,432 155,929 162,352
3Q14 4Q14INFRASTRUCTURE 4Q13
1. Includes Banking Sector and Afore hired and outsourcing personnel 2. 5 banking modules are considered as branches. Does not include Remote Tellers. Does not include 1 branch in the Cayman Islands.
At the end of 4Q14, there were 1,269 branches, two more comparing to 3Q14. The number of branches
decreased by 19 over the past 12 months, a (1%) YoY decrease due to the efficiency program implemented. Total branches include 159 Ixe Banco branches dedicated mainly to the “Preferred” banking segment.
Over the past 12 months 262 Automatic Teller Machines were enabled, a 4% YoY growth, expanding the
network to 7,297 ATM's at the close of 4Q14, including 187 ATMs of the Ixe network.
20,920 Point of Sale Terminals (POS) were enabled during the year, a 15% YoY growth, bringing the number of
installed POS to 162,352 at the end of December, of which 28,413 correspond to the Ixe network.
At the end of 4Q14, there were 5,336 contact points through third party correspondent agreements with 7-Eleven
(1,867), Telecomm-Telegrafos (1,612), Tiendas Extra (1,112), Soriana (634), Grupo Control with the "Del Sol" and "Woolworth" (77) and NetPay (34) brands.
SME Centers. At the end of December 2014 there were 16 operating offices specializing in this segment,
remaining unchanged vs. December 2013.
INFRASTRUCTURE

II. MANAGEMENT'S DISCUSSION & ANALYSIS
Fourth Quarter 2014 40
In compliance with the BOLSA MEXICANA DE VALORES, S.A.B. DE C.V requirement, the information of Brokers that have analyst coverage to: TICKER: GFNORTEO
BOFA - Merill Lynch José Barria Sell 09-dec-14
Intercam Sofía Robles Hold 02-dec-14
Daragh Quinn Hold 20-oct-14
Nau
Nomura
31-oct-14
22-jan-15
22-jan-15
21-jan-15
31-jul-13
03-dec-14
20-nov-14
Interacciones Enrique Mendoza Buy 21-jan-15
Citi
Carlos Gomez
Daniel Abut Buy
Buy
Bradesco Carlos Firetti Buy
Buy
Buy
BuyBurkernroad Lourdes Palma
BX+ Andrés Audiffred Buy
13-oct-14
BBVA Ernesto Gabilondo Buy 13-jan-15
Barclays Cristina Marzea
BTG Pactual Eduardo Rosman
Brasil Plural Eduardo Nishio
Buy
BROKER ANALYST RECOMMENDATION DATE
Morgan Stanley
Buy
Buy
20-nov-14Buy
Vector
Goldman Sachs Carlos Macedo
Deutsche Bank Tito Labarta
Monex
21-jan-15
Actinver
Invex
Itaú BBA Regina Sanchez
GBM Lilian Ochoa
Finamex Rodrigo Ledesma Buy
Hold
HSBC
Scotiabank
08-jan-15
Ana Sepulveda Buy
Hold 14-aug-14
HoldCredit Suisse Marcello Telles
Jorge Kuri Hold 14-jan-15
JP Morgan
Valeria Romo
07-oct-14
19-jan-15
Hold
Philip Finch
Claudia Benavente
Rafael Escobar
Hold
19-jan-15
UBS
Santander
Buy
02-dec-14
Boris Molina
Iñigo Vega Hold
22-jan-15
20-jan-15
19-jan-15
24-oct-14
18-jan-15
Saul Martinez Buy 20-jan-15
Buy 02-dec-14
Hold
Martín Lara
GFNORTE’S ANALYST COVERAGE

III. GFNORTE`S GENERAL INFORMATION
Fourth Quarter 2014 41
GFNorte Ownership of Subsidiaries 4Q14
Banco Mercantil del Norte, S.A. (1) 98.22%
Banorte USA (2) 100.00%
Afore XXI Banorte (2) 50.00%
Arrendadora y Factor Banorte, S.A. de C.V., SOFOM 99.99%
Almacenadora Banorte, S.A. de C.V. 99.99%
Pensiones Banorte, S.A. de C.V. (3) 99.99%
Seguros Banorte, S.A. de C.V. (3) 99.99%
Casa de Bolsa Banorte Ixe , S.A. de C.V. 99.99%
Operadora de Fondos Banorte Ixe, S.A. de C.V. 99.99%
Ixe Servicios, S.A. de C.V. 99.99%
Sólida Administradora de Portafolios, S.A. de C.V. SOFOM 98.83%
1. Considers as of 3Q14 a 98.22%.stake of GFNorte. Since 4Q09 until 1Q13, the stake was 92.72%, reflecting the IFC investment in capital of Banco Mercantil del Norte. In 1Q13 the stake increased to 97.2%, in 2Q13 to 97.50%, in 1Q14 to 97.87% and in 2Q14 to 98.21%%.
2. Subsidiary of Banco Mercantil del Norte. Banorte USA owns 100% of Uniteller and 100% of INB Financial Corp.
3. Considers as of 4Q13 a 99.99% stake of GFNorte, derived from the acquisition of the remaining Generali's participation in
these companies, formerly the stake was of 51.00%
SERIE O
As of December '14
Number of Issued Shares 2,773.73
Number of Shares Outstanding 2,769.34
Shares held in the bank’s Treasury 4.39
Holding Company Capital Structure
Number of Shares (Million)
Amount of outstanding shares since the Public Offering carried out in July, 2013 and authorized by the
Shareholders’ Assembly are: 2,773.73 million.
GRUPO FINANCIERO – GENERAL INFORMATION

III. GFNORTE`S GENERAL INFORMATION
Fourth Quarter 2014 42
The Board of Directors for the fiscal year 2014 which was appointed and approved during the Annual General Shareholders' Meeting held on April 25, 2014.
Grupo Financiero Banorte
Board of Directors
PROPRIETARY MEMBERS
Guillermo Ortiz Martinez (1)
Chairman of the Board Related
Carlos Hank Gonzalez (2)*
Vacant**
Juan Antonio Gonzalez Moreno Patrimonial
David Villareal Montemayor Patrimonial
Miguel Aleman Magnani Independent
Patricia Armendariz Guerra Independent
Herminio Blanco Mendoza Independent
Juan Carlos Braniff Hierro Independent
Alejandro Burillo Azcarraga Independent
Alfredo Elias Ayub Independent
Everardo Elizondo Almaguer Independent
Armando Garza Sada Independent
Hector Reyes Retana y Dahl Independent
Adrian Sada Cueva Independent
ALTERNATE MEMBERS
Jesus O. Garza Martinez Related
Jose Marcos Ramirez Miguel Related
Graciela Gonzalez Moreno* Patrimonial
Juan Antonio Gonzalez Marcos Patrimonial
Jose Maria Garza Treviño Independent
Lorenzo Lazo Margain Independent
Roberto Kelleher Vales Independent
Manuel Aznar Nicolin Independent
Guillermo Mascareñas Milmo Independent
Alejandro Orvañanos Alatorre Independent
Isaac Becker Kabacnik Independent
Alberto Halabe Hamui Independent
Ramon A. Leal Chapa Independent
Vacant Independent
Eduardo Livas Cantu Independent
(1) Guillermo Ortiz Martinez was Chairman and Member of GFNorte’s Board of Directors until December 31, 2014. (2) Carlos Hank Gonzalez is Chairman of the Board of Directors as of January 1, 2015. *Modifications to the Board of Directors approved on the Ordinary General Shareholders’ Meeting held last October 22, 2014. °° Position previously held by Alejandro Valenzuela del Rio, who resigned on November 20, 2014.

III. GFNORTE`S GENERAL INFORMATION
Fourth Quarter 2014 43
Group’s Main Officers 4Q14
NAME CURRENT POSITION
Marcos Ramirez Miguel Chief Executive Officer, Grupo Financiero Banorte
BUSINESS UNITS
Armando Rodal Espinosa Managing Director – Wholesale Banking
Carlos Eduardo Martinez Gonzalez Managing Director – Retail Banking
Fernando Solis Soberon Managing Director – Long Term Savings
STAFF
Rafael Arana de la Garza Chief Operating Officer (COO and CFO)
David Aaron Margolin Schabes Chief Risk Officer
Isaias Velazquez Gonzalez Managing Director - Internal Audit
Sergio Garcia Robles Gil Managing Director – Corporate Affairs
Luis Fernando Orozco Mancera Chief Credit Officer (CCO)

IV. FINANCIAL STATEMENTS
Fourth Quarter 2014 44
Income Statement-Holding
(Million Pesos)
Income Subsidiaries 3,248 3,409 3,310 3,694 3,646 3,780 3,968 3,852 13,661 15,246
Interest Income 16 34 434 (2) 44 22 20 7 481 93
Interest Expense 35 155 35 2 - - - - 228 -
Fees & Tariffs - (0) (0) (0) (0) (0) (0) (0) (0) (0)
Trading Income (29) - - - - - - - (29) -
Other Operating Income (Expense) - - - - 1 0 - - - 1
Non Interest Expense 49 25 27 30 27 28 27 31 132 113
Pre-Tax Income 3,151 3,263 3,681 3,659 3,664 3,774 3,960 3,827 13,753 15,226
Income Tax - - - - - - - - - -
Tax on Assets - - - - - - - - - -
Deferred Income Tax (1) 1 (1) (1) 0 (0) (118) (9) (1) (127)
Taxes (1) 1 (1) (1) 0 (0) (118) (9) (1) (127)
Net Income from Continuos Operations 3,152 3,262 3,682 3,660 3,664 3,774 4,078 3,837 13,754 15,354
Extraordinary Items, net - - - - - - - - - -
Net Income 3,152 3,262 3,682 3,660 3,664 3,774 4,078 3,837 13,754 15,354
2013 20141Q13 2Q13 3Q13 4Q13 1Q14 2Q14 3Q14 4Q14
HOLDING

IV. FINANCIAL STATEMENTS
Fourth Quarter 2014 45
Holding - Balance Sheet
(Million Pesos)
ASSETS
Cash and Due from Banks 311 522 10,816 272 305 279 231
Margin Accounts - - - - - - -
Investment in Securities - - - - - - -
Non-assigned Securities for Settlement - - - - - - -
Debtor Balance in Repo Trans,net - - 11,500 4,900 2,400 2,100 1,300
Securities Lending - - - - - - -
Transactions with Derivatives - 388 - - - - -
Operations w/Derivatives & Securities - 388 11,500 4,900 2,400 2,100 1,300
Valuation adjustments for Asset Coverage - - - - - - -
Performing Loans - - - - - - -
Past Due Loans - - - - - - -
Gross Loan Portfolio - - - - - - -
Preventive Loan Loss Reserves - - - - - - -
Net Loan Portfolio - - - - - - -
Acquired Collection Rights - - - - - - -
Total Credit Portfolio - - - - - - -
Benef.receivab.securization transactions - - - - - - -
Sundry Debtors & Other Accs Rec, Net 12 13 34 46 54 58 62
Inventories - - - - - - -
Foreclosed Assets, Net - - - - - - -
Real Estate, Furniture & Equipment, Net - - - - - - -
Investment in Subsidiaries 84,240 80,310 82,911 88,587 95,903 100,536 104,631
Long-term assets held for sale - - - - - - -
Deferred Taxes, Net 3 2 3 4 4 4 122
Goodwill and Intangibles 10,999 10,980 10,955 10,930 10,909 10,886 10,863
Other Assets Short and Long Term - - - - - - -
Other Assets - - - - - - -
95,255 91,305 93,903 99,567 106,870 111,483 115,677
TOTAL ASSETS 95,566 92,216 116,219 104,739 109,575 113,863 117,209
2Q14 3Q141Q13 2Q13 3Q13 4Q13 1Q14

IV. FINANCIAL STATEMENTS
Fourth Quarter 2014 46
Holding - Balance Sheet
(Million Pesos)
LIABILITIES
Deposits - - - - - - -
Due to Banks & Correspondents 9,901 10,435 - - - - -
Total Collateral sold - - - - - - -
Total Operations w/ Derivatives &
Securities 125 - - - - - -
Margin Accounts Payable - - - - - - -
Other Creditors & Accounts Payable 3,189 0 0 1 0 0 -
Subordinated Non Convertible Debt - - - - - - -
Deferred Taxes, Net - - - - - - -
Deferred Credits - - - - - - -
TOTAL LIABILITIES 13,215 10,435 0 1 0 0 -
EQUITY - - - - - - -
Paid-in Capital 13,098 13,098 14,664 14,664 14,664 14,664 14,664
Provision for future capital increase not
formalized by its governing entity - - - - - - -
Share Subscription Premiums 18,847 18,922 48,556 35,257 35,500 35,797 35,815
Subordinated Convertible Debentures - - - - - - -
Subscribed Capital 31,945 32,019 63,219 49,921 50,163 50,460 50,479
Capital Reserves 3,399 3,399 5,811 5,811 5,811 7,014 7,014
Retained Earnings 45,852 41,554 38,713 37,080 50,846 49,628 49,105
Surplus (Deficit) of Secs Available for Sale 1,881 745 828 674 734 833 541
Results from Valuation of Hedging Secs (2,966) (1,554) (1,677) (1,420) (734) (594) (709)
Results from Conversions (912) (796) (771) (1,083) (909) (916) (737)
Surplus (Deficit) in Capital Restatement - - - - - - -
Adjustments in the Employee´s Pensions - - - - - - -
Accumulated Effect of Deferred Taxes - - - - - - -
Net Income 3,152 6,413 10,095 13,754 3,664 7,438 11,517
Earned Capital 50,406 49,761 52,999 54,817 59,411 63,403 66,730
Minority Interest - - - - - - -
Total Equity 82,351 81,780 116,219 104,737 109,575 113,863 117,209
TOTAL LIABILITIES & EQUITY 95,566 92,216 116,219 104,739 109,575 113,863 117,209
1Q13 2Q13 3Q13 4Q13 1Q14 2Q14 3Q14
Holding - Memorandum Accounts
(Million Pesos)
TOTAL ON BEHALF OF THIRD PARTIES - - - - - - -
Properties in Custody or Administration 3,716 3,716 3,716 3,716 3,716 3,716 3,716
Proprietary Transactions 3,716 3,716 3,716 3,716 3,716 3,716 3,716
TOTAL PROPRIETARY 3,716 3,716 3,716 3,716 3,716 3,716 3,716
3Q141Q13 2Q13 3Q13 4Q13 1Q14 2Q14

IV. FINANCIAL STATEMENTS
Fourth Quarter 2014 47
Income Statement -GFNorte
(Million Pesos)
Interest Income 17,297 16,876 17,472 17,783 17,835 16,985 17,009 18,511 69,428 70,341
Interest Expense 8,091 7,856 7,768 7,363 7,213 7,256 6,428 6,597 31,079 27,494
Charged Fees 328 495 311 429 338 325 441 1,134 1,564 2,238
Fees Paid 83 125 86 84 85 95 100 88 377 367
Net Interest Income from interest &
fees (NII) 9,451 9,390 9,930 10,765 10,875 9,960 10,923 12,960 39,535 44,718
Premium Income (Net) 4,971 4,857 4,053 4,145 4,971 3,914 4,507 5,301 18,026 18,693
Net Increase in Technical Reserves 3,033 2,516 1,740 2,397 3,109 1,021 2,119 3,406 9,686 9,655
Damages, Claims and Other
Obligations 2,235 2,376 2,447 2,081 2,385 2,425 2,436 2,412 9,138 9,659
Net Interest Income (NII) 9,155 9,355 9,796 10,432 10,352 10,428 10,875 12,441 38,738 44,096
Preventive Provisions for Loan Losses 2,073 3,132 1,903 1,833 2,380 2,851 3,253 2,712 8,942 11,196
Net Interest Income Adjusted for Credit
Risk 7,082 6,223 7,892 8,599 7,972 7,577 7,622 9,729 29,796 32,900
Fees for Commercial and Mortgage
Loans 2 2 5 3 3 2 2 2 11 9
Fund Transfers 119 128 131 155 146 158 161 173 533 637
Account Management Fees 313 334 348 375 351 374 378 397 1,371 1,499
Fiduciary 78 100 90 95 82 101 83 96 362 362
Other Fees 752 627 611 632 635 594 660 958 2,622 2,847
Income from Real Estate Portfolios 238 303 126 145 40 57 51 39 811 187
Electronic Banking Services 885 961 1,011 1,076 1,034 1,085 1,126 1,242 3,934 4,486
For Consumer and Credit Card Loans 510 574 592 685 676 667 705 744 2,361 2,792
Fees Charged on Services 2,897 3,029 2,914 3,167 2,967 3,037 3,167 3,649 12,006 12,820
Paid Service Fees - - - - - - - - - -
Fund transfers 15 13 10 11 13 13 8 11 50 45
Other Fees 935 858 958 1,116 972 990 1,075 1,185 3,867 4,222
Amortization of Loan Portfolio - - - - - - - - - -
Fees Paid on Services 951 871 968 1,127 986 1,003 1,083 1,196 3,917 4,268
Foreign Exchange 451 (91) 208 317 343 280 226 236 885 1,085
Securities-Realized Gains 688 1,049 659 330 481 677 823 340 2,726 2,322
Securities-Unrealized Gains 452 (189) (389) (70) 292 606 317 (202) (197) 1,013
Trading Income 1,590 769 478 577 1,116 1,563 1,366 375 3,414 4,420
Loan Recoveries 276 488 274 346 241 225 226 264 1,384 956
Income from foreclosed assets (50) (46) (51) 2 (100) (68) (16) 55 (145) (130)
Other Operating Income 67 3 26 39 129 116 76 102 135 424
Other Operating Expense (58) (39) (57) (70) (77) (16) (48) (87) (223) (229)
Other Products 448 716 1,084 740 761 712 1,458 490 2,988 3,421
Other Recoveries 812 201 188 111 318 193 277 429 1,312 1,217
Other Operating Expense (552) (530) (880) (950) (781) (669) (1,072) (538) (2,912) (3,060)
Other Operating Income (Expense) from
Insurance and Annuities 172 197 170 146 183 150 155 173 685 660
Total Other Operating Income
(Expense) 1,116 990 754 364 673 643 1,057 887 3,223 3,260
Total Non Interest Income 4,653 3,916 3,177 2,981 3,770 4,241 4,506 3,715 14,727 16,233
Total Operating Income 11,734 10,139 11,070 11,580 11,742 11,818 12,128 13,444 44,523 49,133
Non Interest Expense: - - - - - - - - - -
Personnel 4,009 3,080 2,916 3,073 3,074 3,029 2,829 4,054 13,077 12,986
Employee Profit Sharing (PTU) 84 79 79 82 103 101 101 74 324 379
Professional Fees 616 678 605 867 645 693 762 900 2,767 3,000
Administrative and Promotional
Expenses 1,055 1,168 1,323 1,328 1,249 1,397 1,434 1,599 4,874 5,679
Rents, Depreciation & Amortization 787 818 820 794 848 913 928 958 3,219 3,648
Taxes other than income tax & non
deductible expenses 443 431 395 457 467 314 356 517 1,726 1,653
Contributions to IPAB/Fobaproa 440 433 474 484 459 466 474 487 1,831 1,887
Total Non Interest Expense 7,434 6,687 6,613 7,084 6,845 6,913 6,884 8,590 27,819 29,232
- - - - - - - - - -
Operating Income 4,300 3,452 4,457 4,496 4,897 4,906 5,244 4,855 16,704 19,901
- - - - - - - - - -
Subsidiaries' Net Income 351 162 342 275 293 349 248 329 1,130 1,220
- - - - - - - - - -
Pre-Tax Income 4,651 3,614 4,798 4,771 5,190 5,255 5,492 5,184 17,834 21,121
Income Tax 1,303 385 1,209 774 2,108 1,908 2,408 1,617 3,671 8,040
Tax on Assets - - - - - - - - - -
Deferred Income Tax (73) (218) (125) 301 (608) (448) (1,011) (305) (115) (2,372)
Taxes 1,230 167 1,084 1,075 1,500 1,460 1,397 1,312 3,555 5,668
- - - - - - - - - -
Net Income from Continuos Operations 3,421 3,447 3,715 3,696 3,691 3,795 4,095 3,872 14,279 15,453
Extraordinary Items, net - - - - - - - - - -
Minority Interest (281) (227) (189) (74) (63) (56) (54) (52) (771) (225)
- - - - - - - - - -
Net Income 3,140 3,220 3,526 3,622 3,628 3,739 4,042 3,819 13,508 15,228
4Q14 201420133Q141Q13 2Q13 3Q13 4Q13 1Q14 2Q14
GRUPO FINANCIERO BANORTE

IV. FINANCIAL STATEMENTS
Fourth Quarter 2014 48
GFNorte - Balance Sheet
(Million Pesos)
ASSETS
Cash and Due from Banks 59,429 54,906 68,888 61,978 70,120 72,074 70,541 73,838
Margin Accounts 337 105 59 59 74 100 72 45
Negotiable Instruments 191,562 168,398 180,406 232,926 247,302 240,754 234,133 248,976
Securities Available for Sale 78,888 114,380 116,685 85,031 83,281 78,144 92,465 104,937
Securities Held to Maturity 106,972 95,700 94,021 96,730 92,839 88,571 86,860 77,736
Investment in Securities 377,423 378,477 391,112 414,687 423,422 407,470 413,459 431,649
Non-assigned Securities for Settlement - - - - - - - -
Debtor Balance in Repo Trans, net 5,008 62 29 202 378 51 8 871
Securities Lending - - - - - - - -
For trading purposes 20,782 16,139 17,675 14,799 14,050 17,786 15,106 16,510
For hedging purposes 125 420 37 55 76 371 246 86
Operations w/Derivatives & Securities - - - - - - - -
Transactions with Derivatives 20,906 16,559 17,712 14,854 14,126 18,157 15,351 16,597
Operations w/Derivatives & Securities 25,915 16,620 17,741 15,056 14,504 18,208 15,360 17,468
Valuation adjustments for Asset Coverage 170 166 162 158 154 150 147 143
Commercial Loans 183,509 186,320 183,344 184,624 182,202 182,992 182,257 191,189
Financial Intermediaries´ Loans 8,830 5,575 5,268 4,863 3,419 3,825 3,624 3,316
Consumer Loans 48,317 51,843 55,382 57,883 60,153 62,542 67,065 68,383
Mortgage Loans 74,355 77,348 79,421 82,033 83,153 85,040 87,003 89,918
Government Entities´ Loans 89,583 90,695 90,524 95,636 98,625 100,344 104,995 118,962
Loans granted as Federal Agent - - - - - - - -
Performing Loans 404,594 411,782 413,939 425,038 427,553 434,743 444,944 471,768
Commercial PDL´s 6,125 6,206 10,813 10,473 9,989 10,442 11,377 10,649
Financial Intermediaries PDL´s 4 4 27 0 0 1 1 1
Consumer PDL´s 1,643 1,890 1,997 2,093 2,058 2,416 2,371 2,370
Mortgage PDL´s 818 921 1,013 1,087 1,101 1,153 1,202 1,274
Government Entities PDL´s 41 53 15 2 1 1 - -
Past Due Loans 8,631 9,075 13,865 13,655 13,151 14,012 14,951 14,293
Gross Loan Portfolio 413,224 420,857 427,804 438,693 440,704 448,754 459,896 486,061
Preventive Loan Loss Reserves 11,863 14,321 14,651 14,289 13,909 14,642 15,550 15,287
Net Loan Portfolio 401,362 406,536 413,153 424,404 426,794 434,113 444,345 470,774
Acquired Collection Rights 2,979 3,507 3,330 3,522 3,273 3,137 3,050 2,984
Total Credit Portfolio 404,341 410,043 416,483 427,925 430,067 437,249 447,395 473,759
Account Receivables from Insurance and
Annuities 958 1,033 1,151 1,281 1,385 1,713 2,200 1,934
Premium Debtors (Net) 4,640 4,774 3,601 3,047 4,695 5,668 3,535 4,502
Account Receivables from Reinsurance 3,058 3,411 4,037 3,563 3,367 4,856 5,431 5,967
Benef.receivab.securization transactions 795 795 836 738 729 789 691 587
Sundry Debtors & Other Accs Rec, Net 25,265 36,000 32,180 21,703 37,448 28,175 31,268 26,646
Inventories 390 614 568 477 442 657 459 922
Foreclosed Assets, Net 2,704 2,573 2,532 2,781 2,611 2,670 2,546 2,731
Real Estate, Furniture & Equipment, Net 11,568 11,707 11,638 12,033 12,277 12,253 12,320 12,845
Investment in Subsidiaries 13,448 13,568 13,913 14,205 14,510 13,731 13,982 13,916
Long-term assets held for sale - - - - - - - -
Deferred Taxes, Net - 49 168 - 436 885 1,845 2,311
Goodwill and Intangibles 20,380 21,198 21,734 22,366 21,893 22,740 23,030 24,697
Other Assets Short and Long Term 4,623 4,194 4,367 4,729 4,399 4,391 4,361 4,022
Other Assets - - - - - - - -
87,828 99,914 96,726 86,924 104,192 98,529 101,668 101,081
TOTAL ASSETS 955,442 960,232 991,171 1,006,788 1,042,534 1,033,781 1,048,642 1,097,982
4Q141Q144Q133Q132Q13 3Q142Q141Q13

IV. FINANCIAL STATEMENTS
Fourth Quarter 2014 49
GFNorte - Balance Sheet
(Million Pesos)
LIABILITIES
Demand Deposits 204,537 216,882 225,712 254,219 252,652 263,672 276,545 298,852
Time Deposits-Retail 182,128 189,071 184,405 179,146 186,461 179,225 180,569 185,220
Time Deposits-Money Market 23,490 12,752 14,485 4,971 10,745 2,805 1,518 8,444
Special Funds - - - - - - - -
Senior Unsecured Debt 4,743 5,389 5,764 5,405 5,482 5,115 5,011 5,406
Deposits 414,898 424,095 430,366 443,740 455,340 450,817 463,644 497,922
Immediate Redemption Loans 1,460 0 2,562 2,974 0 7,809 0 0
Short Term Loans 37,684 29,330 18,597 19,406 18,942 19,137 18,155 21,082
Long Term Loans 7,134 8,005 7,451 7,679 7,382 7,585 9,077 9,002
Due to Banks & Correspondents 46,278 37,336 28,611 30,060 26,324 34,531 27,232 30,084
Technical Reserves 55,096 58,017 60,556 62,207 65,182 67,970 70,256 73,693
Non-assigned Securities for Settlement - - - - - - - -
Creditor Balance in Repo Trans, Net 277,118 279,734 278,427 304,021 317,580 292,593 296,061 306,602
Secs to be received in Repo Trans, Net - - - - - - - -
Repos (Credit Balance) 65 64 39 8 32 0 7 154
Securities' Loans - - - - - - - -
Transactions with Derivatives - - - - - - - -
Other sold collateral - - - - - - - -
Total Collateral sold 65 64 39 8 32 0 7 154
For trading purposes 19,927 15,427 17,451 14,827 14,140 17,704 15,201 17,271
For hedging purposes 4,371 3,625 3,769 3,500 3,583 3,071 3,041 4,020
Operations w/ Derivatives & Securities - - - - - - - -
Transactions with Derivatives 24,298 19,051 21,220 18,327 17,723 20,775 18,242 21,291
Total Operations w/ Derivatives &
Securities 301,481 298,849 299,686 322,356 335,335 313,368 314,310 328,046
Valuation adjustments for financial liability
coverage - - - - - - - -
Obligations in securitization transactions - 0 0 0 0 0 0 0
Payable Accountsfor Reinsurance 1,315 1,223 785 759 1,054 2,449 796 1,619
Income Tax Payable 1,695 521 852 794 1,917 2,816 4,547 5,380
Profit Sharing Payable 361 419 495 339 130 206 304 373
Provision for future capital increase not
formalized by its governing entity - - - - - - - -
Creditors for settlement of transactions 6,792 15,762 12,422 4,282 9,931 10,678 12,357 3,224
Margin Accounts Payable - - - - - - - -
Other Creditors & Accounts Payable 16,366 14,069 14,333 12,936 13,502 15,510 16,168 15,041
Other Payable Accounts 25,215 30,771 28,102 18,351 25,480 29,210 33,375 24,019
Subordinated Non Convertible Debt 19,258 19,510 18,046 18,001 18,083 15,788 16,021 16,468
Deferred Taxes, Net 770 - - 200 - - - -
Deferred Credits 2,579 2,473 2,509 2,423 2,511 2,412 2,389 1,459
TOTAL LIABILITIES 866,890 872,274 868,661 898,097 929,310 916,544 928,026 973,311
EQUITY - - - - - - - -
Paid-in Capital 13,087 13,086 14,651 14,652 14,647 14,647 14,647 14,632
Provision for future capital increase not
formalized by its governing entity - - - - - - - -
Share Subscription Premiums 18,756 18,793 48,518 35,219 35,349 35,664 35,682 36,201
Subordinated Convertible Debentures - - - - - - - -
Subscribed Capital 31,843 31,879 63,169 49,870 49,995 50,311 50,330 50,833
Capital Reserves 3,399 3,399 5,811 5,811 5,811 7,014 7,014 6,657
Retained Earnings 48,075 43,777 40,936 39,303 52,823 51,605 51,082 50,407
Surplus (Deficit) of Secs Available for Sale 1,824 754 849 667 732 808 554 634
Results from Valuation of Hedging Secs (2,966) (1,554) (1,677) (1,420) (734) (594) (709) (762)
Results from Conversions (912) (796) (771) (1,083) (909) (916) (737) (75)
Surplus (Deficit) in Capital Restatement - - - - - - - -
Adjustments in the Employee´s Pensions - - - - - - - -
Accumulated Effect of Deferred Taxes - - - - - - - -
Net Income 3,140 6,360 9,886 13,508 3,628 7,367 11,409 15,228
Earned Capital 52,559 51,941 55,034 56,787 61,350 65,284 68,611 72,089
Minority Interest 4,151 4,138 4,307 2,034 1,878 1,642 1,675 1,750
Total Equity 88,553 87,957 122,511 108,691 113,224 117,237 120,616 124,672
TOTAL LIABILITIES & EQUITY 955,442 960,232 991,171 1,006,788 1,042,534 1,033,781 1,048,642 1,097,982
4Q144Q13 1Q14 2Q14 3Q141Q13 2Q13 3Q13

IV. FINANCIAL STATEMENTS
Fourth Quarter 2014 50
GFNorte - Memorandum Accounts
(Million Pesos)
On behalf of Third Parties
Customer's Banks 101 205 356 24 264 117 39 52
Dividends Receivable from Customers - - - - - - - -
Interest Receivable from Customers - - - - - - - -
Settlement of Customer Transactions (53) (237) (6) (30) (193) (123) (28) (21)
Customer Premiums - - - - - - - -
Settlement with Clients’ Foreign Currency - - - - - - - -
Margin Accounts in Futures’ Operations - - - - - - - -
Other Current Accounts - - - - - - - -
Customers’ Current Account 48 (32) 350 (7) 71 (7) 12 32
Client Securities Received in Custody 592,696 576,715 567,449 536,300 546,591 592,850 625,248 588,561
Securities and Documents Received in
Guarantee - - - - - - - -
Client Securities Abroad - - - - - - - -
Clients’ Securities 592,696 576,715 567,449 536,300 546,591 592,850 625,248 588,561
Clients’ Repurchase Operations 57,804 73,572 85,849 112,839 77,927 52,824 59,524 98,802
Clients’ Repo Transactions w/ Securities - - - - - - - -
Collateral received in guarantee for
customer accounts 48,913 71,996 84,504 111,486 76,581 51,573 58,283 97,555
Purchase of Futures & Forward Contracts,
national - - - - - - - -
Sale of Futures and Forward Contracts,
national - - - - - - - -
Clients’ Option Purchase Operations - - - - - - - -
Clients’ Option Sales Operations - - - - - - - -
Purchase Operations of derivatives - - - - - - - -
Clients’ Sales Operations of derivatives - - - - - - - -
Trusts under Administration 403 361 340 254 64,280 72,413 75,847 76,857
Transactions On Behalf of Clients 107,119 145,929 170,693 224,579 218,788 176,810 193,655 273,214
Investment bank Trans on Behalf of Third
(Net) 67,162 71,223 93,475 83,171 85,548 99,955 94,013 90,769
TOTAL ON BEHALF OF THIRD PARTIES 767,026 793,835 831,967 844,043 850,998 869,609 912,928 952,576
Endorsement Guarantees Granted - - - - - - - -
Loan Obligations 39,566 35,435 34,588 28,110 28,616 31,840 29,682 43,023
Trusts 346,701 318,844 264,235 194,018 167,885 187,006 205,556 212,425
Mandates 2,140 1,713 10,806 11,043 10,090 8,957 9,031 9,002
Properties in Trusts and Warrant 348,841 320,557 275,042 205,061 177,975 195,963 214,587 221,427
Properties in Custody or Administration 430,381 443,462 477,773 451,582 484,554 489,633 438,328 433,473
Collateral Received 136,279 92,754 87,133 143,033 147,461 154,390 110,293 97,855
Collateral Received or sold or delivered 140,700 123,678 129,104 203,074 171,305 153,445 115,920 142,005
Drafts in Transit - - - - - - - -
Deposits of assets 2,630 2,531 2,045 2,816 2,404 2,083 1,633 3,346
Letters of Credit to the Corporation as
Guarantee - - - - - - - -
Securities to the Corporation for Custody - - - - - - - -
Government Secs of the Corp under
Custody - - - - - - - -
Securities of the Corp given as Guarantee - - - - - - - -
Securities of the Corp Abroad - - - - - - - -
Settlement with FX of the Corp Abroad - - - - - - - -
Debts with the Contingency Fund - - - - - - - -
Contingent Assets & Liabilities 255 255 255 - - 0 0 1
Uncollected Accrued Interest from Past Due
Loans 362 368 391 392 421 454 495 548
Investments of Retirement Savings Funds - - - - - - - -
Integration of the Credit Portfolio - - - - - - - -
Amounts Contracted in Derivatives - - - - - - - -
Other Registration Accounts - - - - - - - -
Proprietary Transactions 1,099,015 1,019,040 1,006,331 1,034,067 1,012,734 1,027,808 910,938 941,678
Repo Securities to be Received - - - - - - - -
(Minus) Repo Creditors - - - - - - - -
Net Repo Transactions - - - - - - - -
Repo Debtors - - - - - - - -
(Minus) Repo Securities to be Delivered - - - - - - - -
Net Repo Transactions - - - - - - - -
TOTAL PROPRIETARY 1,099,015 1,019,040 1,006,331 1,034,067 1,012,734 1,027,808 910,938 941,678
2Q14 3Q14 4Q141Q13 2Q13 3Q13 4Q13 1Q14

IV. FINANCIAL STATEMENTS
Fourth Quarter 2014 51
Net Income 15,228
Items charged to results that do not generate or require use of resources
Depreciation 1,262
Technical Reserves 9,655
Provisions 6,005
Income taxes and deferred 5,668
Minority Interest (995)
21,595
36,823
Change in items related to operations:
Change in Margin Accounts 13
Change in Invesment in Securities (15,802)
Change in repo debtors (669)
Change in derivatives (assets) (1,696)
Changein Loan Portfolio (net) (44,888)
Change in purchased receivables (net) 537
Change in accounts receivable insurance and bonding institutions (net) (653)
Change in debtor premiums (1,455)
Change in Reinsurance (2,404)
Change in benefits to receive from securitizations 151
Change in foreclosed assets (net) 61
Change in other operating assets (net) (5,881)
Change in core deposits 51,799
Change in interbank loans and other entities 10
Change in repo creditors 2,580
Change in collateral pledged sold 145
Change in derivatives (liability) 2,444
Change in Technical Reserves (net) 1,831
Change in Reinsurance (net) (liability) 860
Change in subordinated debt w ith characteristics of liabilities (1,567)
Change in other operating liabilities (5,291)
Change in hedging instruments (the related hedged transaction activities) 488
Income Tax Collection (refunds) 0
Income Tax Payments (3,584)
Net cash generated or used from operations 13,852
Investment Activities:
Charges for disposal of property, furniture and equipment 2,002
Payments for acquisition of property, furniture and equipment (4,006)
Subsidiaries and associated acquisitions charges 409
Subsidiaries and associated acquisitions payment 0
Charges for other investmentes 0
Payments for other investmentes 0
Charges for cash dividends 1,134
Net cash generated or used from investment activities (461)
Financing Activities:
Payments for issued shares 0
Payments of cash dividends (1,218)
Payments associated w ith the repurchase of proprietary shares (549)
Net cash flows from financing activities (1,767)
Net Cash Increase (decrease) 11,624
Effects for changes in cash and equivalents value 236
Cash and cash equivalents at beginning of period 61,978
Cash and cash equivalents at end of period 73,838
GFNORTE - CONSOLIDATED STATEMENT OF CASH FLOW
JANUARY 1, 2014 – DECEMBER 31, 2014
(M illion Pesos)

IV. FINANCIAL STATEMENTS
Fourth Quarter 2014 52
Balance as of December 31, 2013 14,652 35,219 5,811 39,303 667 (1,420) (1,083) 13,508 2,034 108,691
Changes stemming from stockholders’ decisions
Repurchases of payment plan based on stock (20) 438 (357) 1 36 0 0 0 0 98
Capitalization of profits 0 0 0 13,508 0 0 0 (13,508) 0 0
Creation of reserves on behalf of the Annual Ordinary General
Shareholders' Meeting held on April 25, 2014. 0 0 314 (314) 0 0 0 0 0 0
Creation of reserves for stock repurchase 0 0 889 (889) 0 0 0 0 0 0
Dividends declared by the Ordinary General Shareholders'
Meeting held on October 14, 2013 and paid on July 23, 20140 0 0 (544) 0 0 0 0 0 (544)
Dividends declared by the Ordinary General Shareholders'
Meeting held on October 22, 2014 and paid on October 31, 20140 0 0 (674) 0 0 0 0 0 (674)
Total (20) 438 846 11,088 36 0 0 (13,508) 0 (1,120)
Changes stemming from profits
Net Income 0 0 0 0 0 0 0 15,228 0 15,228
Result from valuation of securities available for sale 0 0 0 0 (69) 0 0 0 0 (69)
Effect of subsidiaries, associates and mutual funds 0 544 0 16 0 0 1,008 0 0 1,568
Result from valuation of instruments of cash flow hedges 0 0 0 0 0 658 0 0 0 658
Total 0 544 0 16 (69) 658 1,008 15,228 0 17,385
Recognition of minority interest 0 0 0 0 0 0 0 0 (284) (284)
Balance as of December 31, 2014 14,632 36,201 6,657 50,407 634 (762) (75) 15,228 1,750 124,672
Premium
from sale of
securities
Capital
Reserves
Retained
Earnings
Valuation
Effects of
Securities
Available
for Sale
Results
from val of
instrum
Cash flow
hedges
GFNORTE – CONSOLIDATED STATEMENTS OF CHANGES IN STOCKHOLDERS’ EQUITY
JANUARY 1, 2014 – DECEMBER 31, 2014
Results from
Conversions
Net
Income
Minority
Interest
Total
Stockholders'
Equity
(Million Pesos)
CONTRIBUTED CAPITAL EARNED CAPITAL
Fixed Paid-
in Capital

IV. FINANCIAL STATEMENTS
Fourth Quarter 2014 53
Income Statement -Banking Sector
(Million Pesos)
Interest Income 13,793 13,961 14,018 13,848 14,005 14,276 13,867 14,208 55,619 56,356
Interest Expense 5,933 5,508 5,540 5,140 5,225 5,229 4,641 4,543 22,120 19,638
Charged Fees 319 504 311 429 338 325 441 1,133 1,564 2,237
Fees Paid 83 125 86 84 85 95 99 86 377 365
Net Interest Income (NII) 8,096 8,833 8,704 9,053 9,033 9,277 9,567 10,712 34,685 38,589
Preventive Provisions for Loan Losses 2,026 3,005 1,957 1,800 2,369 2,826 3,208 2,704 8,788 11,107
Net Interest Income Adjusted for Credit
Risk 6,070 5,828 6,746 7,253 6,664 6,451 6,359 8,008 25,897 27,482
Fees for Commercial and Mortgage Loans 2 2 5 3 3 2 2 2 11 9
Fund Transfers 119 128 131 155 146 158 161 173 533 637
Account Management Fees 313 334 348 375 351 374 378 397 1,371 1,499
Fiduciary 74 96 87 93 81 100 83 95 351 360
Other Fees 584 461 437 433 430 398 423 639 1,915 1,890
Income from Real Estate Portfolios 238 (190) 16 25 6 5 18 21 88 49
Electronic Banking Services 885 961 1,011 1,076 1,034 1,085 1,126 1,242 3,934 4,486
For Consumer and Credit Card Loans 510 574 592 685 676 667 705 744 2,361 2,792
Fees Charged on Services 2,725 2,367 2,627 2,846 2,726 2,789 2,896 3,312 10,565 11,723
Paid Service Fees - - - - - - - - - -
Fund transfers 15 13 10 11 13 13 8 11 50 45
Other Fees 666 684 728 768 710 744 764 827 2,847 3,046
Amortization of Loan Portfolio - - - - - - - - - -
Fees Paid on Services 681 697 738 780 724 758 772 837 2,897 3,091
Trading Income - - - - - - - - - - Foreign Exchange 451 (89) 210 322 342 283 229 257 893 1,111
Securities-Realized Gains 464 821 661 343 436 536 664 219 2,289 1,854
Securities-Unrealized Gains 395 (118) (367) (70) 270 536 191 (103) (161) 894
Trading Income 1,310 613 503 595 1,048 1,355 1,083 372 3,021 3,859
Other Operating Income (Expense) - - - - - - - - - -
Loan Recoveries 265 499 274 346 241 225 226 264 1,384 956
Income from foreclosed assets (47) (73) (55) (17) (107) (81) (26) 65 (192) (149)
Other Operating Income 59 3 26 39 89 116 76 102 127 383
Other Operating Expense (51) (35) (48) (45) (65) (3) (36) (33) (180) (138)
Other Products 139 445 284 410 199 363 667 (65) 1,278 1,164
Other Recoveries 811 (39) 158 98 270 76 204 375 1,029 925
Other Operating Expense (230) (274) (87) (231) (221) (225) (218) 0 (821) (663)
Total Other Operating Income (Expense) 947 525 551 600 406 470 894 708 2,624 2,478
Total Non Interest Income 4,300 2,808 2,943 3,262 3,457 3,857 4,102 3,554 13,313 14,969
Total Operating Income 10,370 8,636 9,689 10,515 10,121 10,308 10,461 11,562 39,210 42,451
Non Interest Expense: - - - - - - - - - -
Personnel 3,900 2,924 2,813 2,933 2,950 2,884 2,695 3,912 12,569 12,441
Employee Profit Sharing (PTU) 83 79 78 82 99 101 99 70 323 369
Professional Fees 529 563 530 744 548 605 669 770 2,365 2,591
Administrative and Promotional Expenses 825 1,025 1,145 1,234 1,108 1,222 1,277 1,388 4,230 4,995
Rents, Depreciation & Amortization 731 765 768 729 789 853 859 889 2,992 3,391
Taxes other than income tax & non
deductible expenses 392 360 329 374 420 270 303 371 1,456 1,364
Contributions to IPAB/Fobaproa 440 433 474 484 459 466 474 487 1,831 1,887
Total Non Interest Expense 6,899 6,150 6,137 6,579 6,374 6,401 6,376 7,887 25,766 27,037
- - - - - - - - - -
Operating Income 3,471 2,486 3,552 3,936 3,747 3,907 4,086 3,675 13,444 15,414
- - - - - - - - - - Subsidiaries' Net Income 348 472 337 282 293 349 258 342 1,439 1,242
- - - - - - - - - -
Pre-Tax Income 3,819 2,957 3,889 4,218 4,040 4,255 4,344 4,017 14,883 16,655
Income Tax 1,070 147 1,056 549 1,782 1,625 2,098 1,370 2,822 6,874
Tax on Assets - - - - - - - - - -
Deferred Income Tax (89) (237) (105) 370 (573) (445) (800) (337) (61) (2,154)
Taxes 982 (90) 951 919 1,209 1,180 1,298 1,033 2,761 4,720
- - - - - - - - - -
Net Income from Continuos Operations 2,838 3,048 2,938 3,299 2,831 3,075 3,046 2,984 12,122 11,936
- - - - - - - - - -
Extraordinary Items, net - - - - - - - - - -
- - - - - - - - - -
Minority Interest (0) (0) (0) (0) (0) (0) (0) 0 (0) (0)
- - - - - - - - - -
Net Income 2,838 3,048 2,938 3,299 2,831 3,075 3,046 2,984 12,122 11,936
201420131Q13 2Q13 3Q13 4Q13 1Q14 2Q14 3Q14 4Q14
BANKING SECTOR

IV. FINANCIAL STATEMENTS
Fourth Quarter 2014 54
Banking Sector - Balance Sheet
(Million Pesos)
ASSETS
Cash and Due from Banks 59,583 54,921 68,824 61,967 70,174 71,828 70,371 73,622
Margin Accounts 337 105 59 59 74 100 72 45
Negotiable Instruments 139,529 131,459 134,333 136,344 184,013 194,110 193,774 172,478
Securities Available for Sale 77,562 75,331 74,693 66,715 70,293 67,782 69,116 77,511
Securities Held to Maturity 47,080 40,340 36,135 35,926 30,711 24,676 21,069 10,486
Investment in Securities 264,170 247,130 245,161 238,986 285,017 286,567 283,959 260,475
Non-assigned Securities for Settlement - - - - - - - -
Debtor Balance in Repo Trans,net 5,072 62 29 2 0 51 8 1
Securities Lending - - - - - - - -
For trading purposes 20,782 16,139 17,675 14,799 14,050 17,786 15,106 16,510
For hedging purposes 125 31 37 55 76 371 246 86
Operations w/Derivatives & Securities - - - - - - - -
Transactions with Derivatives 20,906 16,170 17,712 14,854 14,126 18,157 15,351 16,597
Operations w/Derivatives & Securities 25,978 16,232 17,741 14,856 14,127 18,208 15,360 16,598
Valuation adjustments for Asset Coverage 170 166 162 158 154 150 147 143
Commercial Loans 165,639 170,052 167,683 169,150 165,956 165,932 165,798 173,857
Financial Intermediaries´ Loans 16,176 17,329 16,888 17,354 15,174 15,575 17,700 17,703
Consumer Loans 48,259 51,788 55,330 57,833 60,106 62,499 62,960 64,652
Mortgage Loans 74,007 77,323 79,396 82,008 83,130 85,017 86,980 89,918
Government Entities´ Loans 87,583 88,824 88,244 93,484 96,925 98,238 103,144 117,655
Loans granted as Federal Agent - - - - - - - -
Performing Loans 391,664 405,317 407,542 419,830 421,290 427,260 436,582 463,784
Commercial PDL´s 4,776 5,833 10,396 10,082 9,587 10,036 11,017 10,272
Financial Intermediaries PDL´s - 0 24 0 0 1 1 1
Consumer PDL´s 1,649 1,896 2,003 2,098 2,063 2,420 2,375 2,353
Mortgage PDL´s 817 973 1,064 1,137 1,151 1,202 1,250 1,286
Government Entities PDL´s - - - - - - - -
Past Due Loans 7,242 8,701 13,487 13,317 12,801 13,659 14,643 13,912
Gross Loan Portfolio 398,906 414,019 421,028 433,147 434,092 440,919 451,226 477,696
Preventive Loan Loss Reserves 10,656 13,659 14,049 13,765 13,506 14,215 14,989 14,718
Net Loan Portfolio 388,250 400,360 406,979 419,382 420,586 426,703 436,237 462,979
Acquired Collection Rights 2,752 2,039 1,948 1,918 1,702 1,610 1,545 1,518
Total Credit Portfolio 391,002 402,400 408,927 421,300 422,288 428,313 437,782 464,497
Benef.receivab.securization transactions 782 795 836 738 729 789 691 587
Sundry Debtors & Other Accs Rec, Net 23,143 23,032 21,450 11,185 29,371 17,464 18,742 15,662
Inventories - - - - - - - -
Foreclosed Assets, Net 2,340 2,423 2,395 2,266 2,102 2,162 2,036 2,260
Real Estate, Furniture & Equipment, Net 8,829 8,947 9,014 9,498 9,516 9,559 9,720 10,119
Investment in Subsidiaries 13,374 13,156 13,483 13,765 14,062 13,278 13,537 13,592
Long-term assets held for sale - - - - - - - -
Deferred Taxes, Net - 566 722 274 868 1,336 2,085 2,569
Goodwill and Intangibles 7,607 7,802 8,337 9,038 8,472 9,234 9,443 10,998
Other Assets Short and Long Term 4,047 3,518 3,569 3,826 4,013 4,007 3,978 3,742
Other Assets - - - - - - - -
60,123 60,239 59,806 50,589 69,133 57,828 60,233 59,528
TOTAL ASSETS 801,363 781,193 800,679 787,916 860,967 862,996 867,924 874,908
1Q13 2Q13 3Q13 4Q13 1Q14 2Q14 3Q14 4Q14

IV. FINANCIAL STATEMENTS
Fourth Quarter 2014 55
Banking Sector - Balance Sheet
(Million Pesos)
LIABILITIES
Demand Deposits 204,794 217,510 236,198 255,297 253,832 265,051 277,663 300,282
Time Deposits-Retail 182,523 189,206 186,033 179,877 187,015 179,756 181,021 185,461
Time Deposits-Money Market 23,809 13,465 14,485 4,971 10,745 2,805 1,518 8,444
Special Funds - - - - - - - -
Senior Unsecured Debt 3,741 3,985 3,987 4,003 3,951 3,968 4,065 4,510
Deposits 414,867 424,166 440,703 444,147 455,543 451,580 464,268 498,697
Immediate Redemption Loans 1,460 0 2,562 2,974 0 7,809 0 0
Short Term Loans 19,326 9,099 9,138 9,882 8,729 7,732 7,437 10,700
Long Term Loans 3,258 3,451 3,183 3,210 3,049 3,125 4,730 4,073
Due to Banks & Correspondents 24,044 12,550 14,884 16,067 11,778 18,666 12,168 14,774
Non-assigned Securities for Settlement - - - - - - - -
Creditor Balance in Repo Trans, Net 219,502 206,038 203,980 196,041 242,133 241,965 237,896 208,362
Secs to be received in Repo Trans, Net - - - - - - - -
Repos (Credit Balance) 49 36 33 8 32 0 6 154
Securities' Loans - - - - - - - -
Transactions with Derivatives - - - - - - - -
Other sold collateral - - - - - - - -
Total Collateral sold 49 36 33 8 32 0 6 154
For trading purposes 19,927 15,427 17,451 14,827 14,140 17,704 15,201 17,271
For hedging purposes 4,246 3,625 3,769 3,500 3,583 3,071 3,041 4,020
Operations w/ Derivatives & Securities - - - - - - - -
Transactions with Derivatives 24,173 19,051 21,220 18,327 17,723 20,775 18,242 21,291
Total Operations w/ Derivatives & Securities 243,723 225,125 225,233 214,376 259,888 262,740 256,145 229,806
Valuation adjustments for financial liability
coverage - - - - - - - -
Obligations in securitization transactions - 0 0 0 0 0 0 0
Income Tax Payable 1,416 108 397 224 1,518 2,315 3,808 4,459
Profit Sharing Payable 335 409 486 330 120 205 303 373
Provision for future capital increase not
formalized by its governing entity - - - - - - - -
Creditors for settlement of transactions 5,362 12,925 11,937 4,006 17,205 10,073 10,234 3,072
Margin Accounts Payable - - - - - - - -
Other Creditors & Accounts Payable 11,194 11,108 11,494 10,361 10,259 11,799 12,199 11,084
Other Payable Accounts 18,307 24,550 24,314 14,920 29,102 24,392 26,544 18,988
Subordinated Non Convertible Debt 19,258 19,510 18,046 18,001 18,083 15,788 16,021 16,468
Deferred Taxes, Net 372 - - - - - - -
Deferred Credits 2,634 2,523 2,562 2,479 2,373 2,274 2,252 1,384
TOTAL LIABILITIES 723,205 708,425 725,742 709,990 776,768 775,441 777,397 780,117
EQUITY - - - - - - - -
Paid-in Capital 15,067 15,577 15,577 15,577 17,527 20,022 20,074 20,074
Provision for future capital increase not
formalized by its governing entity - - - 1,950 2,499 52 - -
Share Subscription Premiums 13,154 10,389 10,389 10,389 10,389 10,389 10,389 11,099
Subordinated Convertible Debentures - - - - - - - -
Subscribed Capital 28,221 25,966 25,966 27,916 30,415 30,463 30,463 31,173
Capital Reserves 6,703 7,761 7,761 7,761 7,761 8,968 8,968 8,968
Retained Earnings 42,824 35,004 34,285 32,284 44,411 43,183 43,203 43,201
Surplus (Deficit) of Secs Available for Sale 1,656 677 722 517 576 691 540 510
Results from Valuation of Hedging Secs (3,136) (1,688) (1,805) (1,541) (840) (697) (815) (869)
Results from Conversions (958) (848) (824) (1,143) (964) (969) (794) (138)
Surplus (Deficit) in Capital Restatement - - - - - - - -
Results of Non Monetary Fixed Assets - - - - - - - -
Resultos of Non Monetary - Investment Assets - - - - - - - -
Adjustments in the Employee´s Pensions - - - - - - - -
Accumulated Effect of Deferred Taxes - - - - - - - -
Net Income 2,838 5,886 8,824 12,122 2,831 5,906 8,952 11,936
Earned Capital 49,927 46,792 48,962 50,000 53,775 57,082 60,054 63,608
Minority Interest 10 10 10 10 10 10 10 10
Total Equity 78,158 72,768 74,937 77,926 84,200 87,555 90,527 94,791
TOTAL LIABILITIES & EQUITY 801,363 781,193 800,679 787,916 860,967 862,996 867,924 874,908
4Q141Q13 2Q13 4Q13 1Q14 2Q14 3Q143Q13
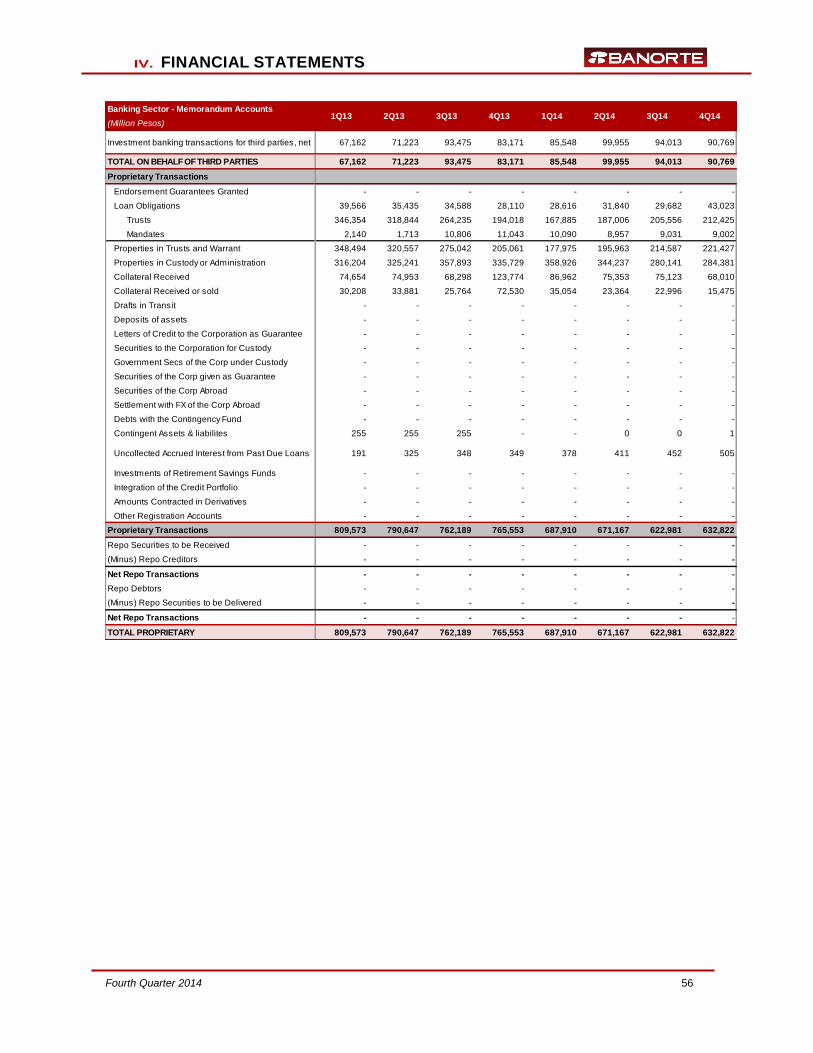
IV. FINANCIAL STATEMENTS
Fourth Quarter 2014 56
Banking Sector - Memorandum Accounts
(Million Pesos)
Investment banking transactions for third parties, net 67,162 71,223 93,475 83,171 85,548 99,955 94,013 90,769
TOTAL ON BEHALF OF THIRD PARTIES 67,162 71,223 93,475 83,171 85,548 99,955 94,013 90,769
Proprietary Transactions
Endorsement Guarantees Granted - - - - - - - -
Loan Obligations 39,566 35,435 34,588 28,110 28,616 31,840 29,682 43,023
Trusts 346,354 318,844 264,235 194,018 167,885 187,006 205,556 212,425
Mandates 2,140 1,713 10,806 11,043 10,090 8,957 9,031 9,002
Properties in Trusts and Warrant 348,494 320,557 275,042 205,061 177,975 195,963 214,587 221,427
Properties in Custody or Administration 316,204 325,241 357,893 335,729 358,926 344,237 280,141 284,381
Collateral Received 74,654 74,953 68,298 123,774 86,962 75,353 75,123 68,010
Collateral Received or sold 30,208 33,881 25,764 72,530 35,054 23,364 22,996 15,475
Drafts in Transit - - - - - - - -
Deposits of assets - - - - - - - -
Letters of Credit to the Corporation as Guarantee - - - - - - - -
Securities to the Corporation for Custody - - - - - - - -
Government Secs of the Corp under Custody - - - - - - - -
Securities of the Corp given as Guarantee - - - - - - - -
Securities of the Corp Abroad - - - - - - - -
Settlement with FX of the Corp Abroad - - - - - - - -
Debts with the Contingency Fund - - - - - - - -
Contingent Assets & liabilites 255 255 255 - - 0 0 1
Uncollected Accrued Interest from Past Due Loans 191 325 348 349 378 411 452 505
Investments of Retirement Savings Funds - - - - - - - -
Integration of the Credit Portfolio - - - - - - - -
Amounts Contracted in Derivatives - - - - - - - -
Other Registration Accounts - - - - - - - -
Proprietary Transactions 809,573 790,647 762,189 765,553 687,910 671,167 622,981 632,822
Repo Securities to be Received - - - - - - - -
(Minus) Repo Creditors - - - - - - - -
Net Repo Transactions - - - - - - - -
Repo Debtors - - - - - - - -
(Minus) Repo Securities to be Delivered - - - - - - - -
Net Repo Transactions - - - - - - - -
TOTAL PROPRIETARY 809,573 790,647 762,189 765,553 687,910 671,167 622,981 632,822
1Q13 2Q13 3Q13 4Q13 1Q14 2Q14 3Q14 4Q14

IV. FINANCIAL STATEMENTS
Fourth Quarter 2014 57
Income Statement-Banorte USA
MEX GAAP (Million Pesos)
Interest Income 178 176 177 176 183 185 183 197 707 747
Interest Expense 42 39 34 32 31 30 32 33 147 127
Charged Fees 4 6 6 6 7 7 8 8 22 31
Fees Paid - - - - - - - - - -
Net Interest Income from interest & fees
(NII) 141 142 149 150 159 162 160 171 582 651
Net Interest Income (NII) 141 142 149 150 159 162 160 171 582 651
Preventive Provisions for Loan Losses 15 2 8 11 11 2 3 5 36 21
Net Interest Income Adjusted for Credit
Risk 126 140 141 139 148 160 157 167 546 631
Fees for Commercial and Mortgage
Loans 2 2 5 3 3 2 2 2 11 9
Fund Transfers 47 56 59 67 71 80 84 88 229 323
Account Management Fees 16 15 17 16 15 15 15 15 64 61
Fiduciary - - - - - - - - - -
Other Fees 4 4 3 5 6 6 7 8 15 27
Income from Real Estate Portfolios - - - - - - - - - -
Electronic Banking Services 5 5 6 5 6 9 9 9 21 32
For Consumer and Credit Card Loans - - - - - - - - - -
Fees Charged on Services 74 82 88 96 101 112 117 123 341 452
Paid Service Fees - - - - - - - - - - Fund transfers 1 1 1 1 0 0 0 0 4 1
Other Fees 26 27 26 29 28 31 30 30 108 119
Amortization of Loan Portfolio - - - - - - - - - -
Fees Paid on Services 27 29 26 30 28 31 31 30 112 120
Trading Income - - - - - - - - - -
Foreign Exchange 13 17 15 16 13 15 15 16 60 59
Securities-Realized Gains 34 11 5 1 17 0 3 0 51 21
Securities-Unrealized Gains - - - - - - - - - -
Trading Income 47 28 20 16 31 15 18 17 111 80
Other Operating Income (Expense) - - - - - - - - - -
Loan Recoveries 11 4 5 12 3 1 2 3 32 8
Income from purchased assets 3 (9) (5) 13 (4) 6 (1) 1 2 2
Other Operating Income - - - - 0 - (0) - - (0)
Other Operating Expense - 0 0 1 1 1 1 1 2 5
Other Products 19 21 21 18 17 17 17 22 79 73
Other Recoveries - - - - - - - - - -
Other Operating Expense (1) (1) (1) (0) (1) (1) (1) (0) (3) (3)
Total Non Interest Income 127 97 102 125 120 119 122 135 451 497
Total Operating Income 252 237 244 264 268 279 279 302 998 1,128
Non Interest Expense: - - - - - - - - - -
Personnel 87 77 82 79 82 90 85 94 325 351
Employee Profit Sharing (PTU) - - - - - - - - - -
Professional Fees 24 23 24 31 25 29 17 24 101 95
Administrative and Promotional Expenses 49 47 52 59 56 65 61 78 207 261
Rents, Depreciation & Amortization 20 19 19 22 20 18 16 18 80 72
Taxes other than income tax & non
deductible expenses 5 4 4 3 4 5 4 3 16 16
Contributions to IPAB/Fobaproa 9 9 4 4 4 3 4 3 26 14
Total Non Interest Expense 193 179 185 198 191 211 186 221 755 808
- - - - - - - - - -
Operating Income 59 58 59 66 77 68 93 81 242 319
- - - - - - - - - -
Subsidiaries' Net Income - - - - - - - - - -
- - - - - - - - - -
Pre-Tax Income 59 58 59 66 77 68 93 81 242 319
Income Tax 19 20 19 23 24 22 32 26 79 105
Tax on Assets - - - - - - - - - -
Deferred Income Tax - - - - - - - - - -
Taxes 19 20 19 23 24 22 32 26 79 105
- - - - - - - - - -
Net Income from Continuos Operations 41 39 40 44 52 46 61 55 163 214
- - - - - - - - - - Extraordinary Items, net - - - - - - - - - -
- - - - - - - - - -
Minority Interest - - - - - - - - - -
- - - - - - - - - -
Net Income 41 39 40 44 52 46 61 55 163 214
20141Q13 2Q13 3Q13 4Q13 1Q14 2Q14 3Q14 4Q14 2013
BANORTE USA

IV. FINANCIAL STATEMENTS
Fourth Quarter 2014 58
Banorte USA-Balance Sheet
(Million Pesos)
ASSETS
Cash and Due from Banks 2,202 2,678 2,094 1,139 2,014 2,248 2,355 2,220
Margin Accounts - - - - - - - -
Negotiable Instruments - - - - - - - -
Securities Available for Sale 11,326 9,929 8,747 8,628 7,474 7,190 6,853 7,692
Securities Held to Maturity - - - - - - - -
Investment in Securities 11,326 9,929 8,747 8,628 7,474 7,190 6,853 7,692
Non-assigned Securities for Settlement - - - - - - - -
Debtor Balance in Repo Trans,net - - - - - - - -
Securities Lending - - - - - - - -
For trading purposes - - - - - - - -
For hedging purposes - - - - - - - -
Operations w/Derivatives & Securities" - - - - - - - -
Transactions with Derivatives - - - - - - - -
Operations w/Derivatives & Securities - - - - - - - -
Valuation adjustments for Asset Coverage - - - - - - - -
Commercial Loans 7,031 7,764 7,697 8,754 9,686 9,608 10,171 11,943
Financial Intermediaries´Loans - - - - - - - -
Consumer Loans 163 172 154 155 142 138 134 149
Mortgage Loans 1,508 1,506 1,482 1,387 1,353 1,321 1,338 1,404
Government Entities´Loans - - - - - - - -
Loans granted as Federal Agent - - - - - - - -
Performing Loans 8,702 9,442 9,333 10,297 11,180 11,067 11,643 13,497
Commercial PDL´s 7 23 4 1 2 1 12 11
Financial Intermediaries PDL´s - - - - - - - -
Consumer PDL´s - 0 0 - - - - -
Mortgage PDL´s 34 33 49 43 17 23 21 33
Government Entities PDL´s - - - - - - - -
Past Due Loans 41 56 53 45 18 24 34 44
Gross Loan Portfolio 8,744 9,498 9,386 10,342 11,198 11,091 11,676 13,541
Preventive Loan Loss Reserves 69 73 77 85 90 87 90 100
Net Loan Portfolio 8,675 9,425 9,308 10,257 11,108 11,004 11,587 13,441
Acquired Collection Rights - - - - - - - -
Acquired Collection Rights, Net - - - - - - - -
Total Credit Portfolio 8,675 9,425 9,308 10,257 11,108 11,004 11,587 13,441
Premium Debtors (Net) - - - - - - - -
Account Receivables from Reinsurance - - - - - - - -
Benef.receivab.securization transactions - - - - - - - -
Sundry Debtors & Other Accs Rec, Net 661 702 716 717 721 722 753 832
Inventories - - - - - - - -
Foreclosed Assets, Net 317 290 246 187 162 118 98 86
Real Estate, Furniture & Equipment, Net 560 582 586 581 575 565 576 625
Investment in Subsidiaries 143 142 144 144 143 141 146 160
Long-term assets held for sale - - - - - - - -
Deferred Taxes, Net 70 155 207 128 104 105 115 120
Goodwill and Intangibles 3,028 3,141 3,173 3,149 3,132 3,114 3,225 3,538
Other Assets Short and Long Term 201 168 202 96 125 121 98 84
Other Assets - - - - - - - -
4,979 5,181 5,275 5,001 4,962 4,886 5,011 5,446
TOTAL ASSETS 27,181 27,213 25,425 25,025 25,558 25,328 25,807 28,799
4Q13 2Q14 3Q14 4Q141Q141Q13 2Q13 3Q13

IV. FINANCIAL STATEMENTS
Fourth Quarter 2014 59
Banorte USA-Balance Sheet
(Million Pesos)
LIABILITIES
Demand Deposits 11,761 11,461 10,697 10,887 11,483 10,979 10,680 12,562
Time Deposits-Retail 9,135 9,251 8,171 7,873 7,549 7,797 7,958 8,666
Time Deposits-Money Market - - - - - - - -
Special Funds - - - - - - - -
Senior Unsecured Debt - - - - - - - -
Deposits 20,896 20,712 18,867 18,760 19,032 18,776 18,638 21,229
Immediate Redemption Loans - - - - - - - -
Short Term Loans 95 112 114 112 114 105 100 111
Long Term Loans - - - - - 6 - -
Due to Banks & Correspondents 95 112 114 112 114 112 100 111
Technical Reserves - - - - - - - -
Non-assigned Securities for Settlement - - - - - - - -
Creditor Balance in Repo Trans, Net 1 2 2 - - - - -
Secs to be received in Repo Trans, Net - - - - - - - -
Repos (Credit Balance) - - - - - - - -
Securities' Loans - - - - - - - -
Transactions with Derivatives - - - - - - - -
Other sold collateral - - - - - - - -
Total Collateral sold - - - - - - - -
For trading purposes - - - - - - - -
For hedging purposes - - - - - - - -
Operations w/ Derivatives & Securities - - - - - - - -
Transactions with Derivatives - - - - - - - -
Total Operations w/ Derivatives & Securities 1 2 2 - - - - -
Valuation adjustments for financial liability
coverage - - - - - - - -
Obligations in securitization transactions - - - - - - - -
Payable Accountsfor Reinsurance - - - - - - - -
Income Tax Payable 43 30 21 28 24 12 59 43
Profit Sharing Payable - - - - - - - -
Provision for future capital increase not
formalized by its governing entity - - - - - - - -
Creditors for settlement of transactions - - - - - - - -
Margin Accounts Payable - - - - - - - -
Other Creditors & Accounts Payable 387 432 431 404 433 430 761 419
Other Payable Accounts 430 462 452 432 457 441 820 461
Subordinated Non Convertible Debt 255 269 272 270 269 267 277 304
Deferred Taxes, Net - - - - - - - -
Deferred Credits 15 19 18 26 30 33 38 51
TOTAL LIABILITIES 21,692 21,575 19,724 19,600 19,901 19,630 19,874 22,156
EQUITY - - - - - - - -
Paid-in Capital 4,668 4,690 4,690 4,690 4,690 4,690 4,690 4,690
Provision for future capital increase not
formalized by its governing entity - - - - - - - -
Share Subscription Premiums - - - - - - - -
Subordinated Convertible Debentures - - - - - - - -
Subscribed Capital 4,668 4,690 4,690 4,690 4,690 4,690 4,690 4,690
Capital Reserves - - - - - - - -
Retained Earnings 601 586 586 586 749 749 749 749
Surplus (Deficit) of Secs Available for Sale 144 (20) (44) (313) (142) (114) (141) (85)
Results from Valuation of Hedging Secs - - - - - - - -
Results from Conversions 34 301 350 299 307 274 476 1,075
Surplus (Deficit) in Capital Restatement - - - - - - - -
Results of Non Monetary Fixed Assets - - - - - - - -
Results of Non Monetary - Investment Assets - - - - - - - -
Adjustments in the Employee´s Pensions - - - - - - - -
Accumulated Effect of Deferred Taxes - - - - - - - -
Net Income 41 80 119 163 52 98 159 214
Earned Capital 821 948 1,011 736 967 1,008 1,243 1,953
Minority Interest - - - - - - - -
Total Equity 5,489 5,637 5,701 5,425 5,657 5,698 5,933 6,643
TOTAL LIABILITIES & EQUITY 27,181 27,213 25,425 25,025 25,558 25,328 25,807 28,799
2Q14 3Q141Q14 4Q143Q13 4Q131Q13 2Q13

IV. FINANCIAL STATEMENTS
Fourth Quarter 2014 60
Banorte USA - Memorandum Accounts
(Million Pesos)
Investment banking transactions for third parties,
net - - - - - - - -
TOTAL ON BEHALF OF THIRD PARTIES - - - - - - - -
Proprietary Transactions
Endorsement Guarantees Granted - - - - - - - -
Loan Obligations 11 5 6 6 12 13 7 8
Trusts - - - - - - - -
Mandates - - - - - - - -
Properties in Trusts and Warrant - - - - - - - -
Properties in Custody or Administration - - - - - - - -
Collateral Received - - - - - - - -
Collateral Received or sold - - - - - - - -
Drafts in Transit - - - - - - - -
Deposits of assets - - - - - - - -
Letters of Credit to the Corporation as
Guarantee - - - - - - - -
Securities to the Corporation for Custody - - - - - - - -
Government Secs of the Corp under Custody - - - - - - - -
Securities of the Corp given as Guarantee - - - - - - - -
Securities of the Corp Abroad - - - - - - - -
Settlement with FX of the Corp Abroad - - - - - - - -
Debts with the Contingency Fund - - - - - - - -
Contingent Assets & liabilites - - - - - - - -
Uncollected Accrued Interest from Past Due
Loans - - - - - - - -
Investments of Retirement Savings Funds - - - - - - - -
Integration of the Credit Portfolio - - - - - - - -
Amounts Contracted in Derivatives - - - - - - - -
Other Registration Accounts - - - - - - - -
Proprietary Transactions 11 5 6 6 12 13 7 8
Repo Securities to be Received - - - - - - - -
(Minus) Repo Creditors - - - - - - - -
Net Repo Transactions - - - - - - - -
Repo Debtors - - - - - - - -
(Minus) Repo Securities to be Delivered - - - - - - - -
Net Repo Transactions - - - - - - - -
TOTAL PROPRIETARY 11 5 6 6 12 13 7 8
2Q14 3Q14 4Q141Q13 2Q13 3Q13 4Q13 1Q14

IV. FINANCIAL STATEMENTS
Fourth Quarter 2014 61
(Million Pesos)
Holding BanorteArrendadora y
FactorAlmacenadora Seguros Pensiones
Casa de Bolsa
Banorte Ixe
Interest Income 93 58,593 2,170 65 501 4,536 9,532
Premium Income (Net) - - - - 11,184 8,048 -
Interest Expense - 20,003 1,303 0 - - 9,000
Net Increase in Technical Reserves - - - - 761 8,894 -
Damages, Claims and Other Obligations - - - - 6,639 3,020 -
Net Interest Income (NII) 93 38,589 867 65 4,286 670 531
Preventive Provisions for Loan Losses - 11,107 53 - - - -
Net Interest Income Adjusted for Credit Risk 93 27,482 814 65 4,286 670 531
Loan Origination Fees - 11,723 54 - - - 1,173
Fees Paid 0 3,091 92 0 1,501 - 71
Trading Income - 3,859 - 1 11 8 559
Other Operating Income (Expenses) 1 2,478 63 28 592 3 (107)
Non Interest Income 1 14,969 25 29 (898) 11 1,554
Total Operating Income 94 42,451 840 94 3,387 680 2,085
Administrative and Promotional Expenses 113 27,037 137 33 845 280 969
Operating Income (20) 15,414 703 61 2,543 401 1,116
Subsidiaries' Net Income 15,246 1,242 - - (0) 3 1
Pre-Tax Income 15,226 16,655 703 61 2,543 404 1,117
Income Tax - 6,874 2 17 778 0 331
Deferred Income Tax (127) (2,154) (0) (1) 3 128 (52)
Net Income from Continuos Operations 15,354 11,936 702 45 1,762 276 837
Extraordinary Items, net - - - - - - -
Minority Interest - (0) (1) (0) (3) - -
Net Income 15,354 11,936 700 45 1,759 276 837
GFNorte - Income Statement as of December '14
(Million Pesos)
Operadora
de Fondos
Banorte Ixe
IXE
Servicios
Sólida
Administrad
ora de
Portafolios
Total Charges Credits Final Balance
Interest Income 3 1 253 75,747 3,232 64 72,579
Premium Income (Net) - - - 19,232 540 - 18,693
Interest Expense - - 516 30,822 - 2,961 27,861
Net Increase in Technical Reserves - - - 9,655 - - 9,655
Damages, Claims and Other Obligations - - - 9,659 - - 9,659
Net Interest Income (NII) 3 1 (263) 44,842 - - 44,096
Preventive Provisions for Loan Losses - - 201 11,361 - 166 11,196
Net Interest Income Adjusted for Credit Risk 3 1 (464) 33,481 - (166) 32,900
Loan Origination Fees 1,114 6 208 14,278 1,458 - 12,820
Fees Paid 942 0 0 5,697 - 1,429 4,268
Trading Income 1 - (26) 4,413 - 7 4,420
Other Operating Income (Expenses) (3) 3 394 3,451 200 9 3,260
Non Interest Income 171 9 576 16,446 1,657 (1,414) 16,233
Total Operating Income 174 10 112 49,927 1,657 (1,579) 49,133
Administrative and Promotional Expenses 44 7 344 29,808 806 1,383 29,232
Operating Income 130 3 (231) 20,119 - - 19,901
Subsidiaries' Net Income 3 - (26) 16,469 15,249 - 1,220
Pre-Tax Income 133 3 (257) 36,588 - - 21,121
Income Tax 37 0 - 8,040 - - 8,040
Deferred Income Tax 1 1 (78) (2,280) 2 94 (2,372)
Net Income from Continuos Operations 94 2 (178) 30,827 - - 15,453
Extraordinary Items, net - - - - - - -
Minority Interest - - - (4) 221 - (225)
Net Income 94 2 (178) 30,823 21,704 5,788 15,228
GFNorte - Income Statement as of December '14
INFORMATION BY SEGMENTS

IV. FINANCIAL STATEMENTS
Fourth Quarter 2014 62
GFNorte - Balance Sheet as of December 31 '14
(Million Pesos)
Cash and Due from Banks 99 73,622 22 9 69 2 1,100
Margin Accounts - 45 - - - - -
Investment in Securities - 260,475 - 37 11,145 60,302 100,125
Negotiable Instruments - 172,478 - 20 4,760 1,207 70,512
Securities Available for Sale - 77,511 - 17 - - 27,781
Securities Held to Maturity - 10,486 - - 6,385 59,095 1,832
Debtor Balance in Repo Trans, net 500 1 - - 870 - -
Securities Lending - - - - - - -
Transactions with Derivatives For trading purposes - 16,510 - - - - -
Transactions with Derivatives For hedging purposes - 86 - - - - -
Gross Loan Portfolio - 464,497 18,806 - - - -
Net Loan Portfolio - 462,979 18,806 - - - -
Performing Loans - 463,784 18,933 - - - -
Commercial Loans - 173,857 17,332 - - - -
Financial Intermediaries´ Loans - 17,703 288 - - - -
Government Entities´ Loans - 117,655 1,307 - - - -
Consumer Loans - 64,652 6 - - - -
Mortgage Loans - 89,918 - - - - -
Past Due Loans - 13,912 181 - - - -
Commercial PDL´s - 10,272 181 - - - -
Financial Intermediaries PDL´s - 1 - - - - -
Government Entities PDL´s - - - - - - -
Consumer PDL´s - 2,353 0 - - - -
Mortgage PDL´s - 1,286 - - - - -
Preventive Loan Loss Reserves - 14,718 309 - - - -
Acquired Collection Rights - 1,518 - - - - -
Account Receivables from Insurance and Annuities - - - - 1,048 886 -
Premium Debtors (Net) - - - - 3,997 505 -
Account Receivables from Reinsurance - - - - 5,967 - -
Benef.receivab.securization transactions - 587 - - - - -
Sundry Debtors & Other Accs Rec, Net 63 15,662 410 76 - - 492
Inventories - - - 922 - - -
Foreclosed Assets, Net - 2,260 8 - - - -
Real Estate, Furniture & Equipment, Net - 10,119 2,123 71 271 3 52
Investment in Subsidiaries 109,558 13,592 - - 1 30 11
Deferred Taxes, Net 131 2,569 24 1 100 - 25
Total other Assets 10,840 14,740 229 11 685 1 248
Goodwill 9,702 4,493 - - - - -
Intangible 1,138 6,505 229 1 617 0 37
Other Assets - 3,742 - 10 68 1 211
TOTAL ASSETS 121,191 874,908 21,623 1,127 24,153 61,729 102,053
SegurosASSETS Holding BanorteArrendadora y
FactorAlmacenadora Pensiones
Casa de Bolsa
Banorte Ixe

IV. FINANCIAL STATEMENTS
Fourth Quarter 2014 63
GFNorte - Balance Sheet as of December 31 '14
(Million Pesos)
Cash and Due from Banks 148 31 163 75,266 237 1,665 73,838
Margin Accounts - - - 45 - - 45
Investment in Securities - - - 432,085 175 611 431,649
Negotiable Instruments - - - 248,976 - - 248,976
Securities Available for Sale - - - 105,310 - 374 104,937
Securities Held to Maturity - - - 77,799 175 237 77,736
Debtor Balance in Repo Trans, net - - - 1,371 - 500 871
Securities Lending - - - - - - -
Transactions with Derivatives For trading purposes - - - 16,510 - - 16,510
Transactions with Derivatives For hedging purposes - - - 86 - - 86
Valuation adjustments for Asset Coverage - - - 143 - - 143
Gross Loan Portfolio - - 5,132 488,434 1,335 16,010 473,759
Net Loan Portfolio - - 3,665 485,449 956 15,632 470,774
Performing Loans - - 3,713 486,431 865 15,528 471,768
Commercial Loans - - - 191,189 759 759 191,189
Financial Intermediaries´ Loans - - - 17,991 - 14,675 3,316
Government Entities´ Loans - - - 118,962 11 11 118,962
Consumer Loans - - 3,713 68,371 68 56 68,383
Mortgage Loans - - - 89,918 27 27 89,918
Past Due Loans - - 213 14,306 91 103 14,293
Commercial PDL´s - - 196 10,649 39 39 10,649
Financial Intermediaries PDL´s - - - 1 - - 1
Government Entities PDL´s - - - - - - -
Consumer PDL´s - - 17 2,370 9 9 2,370
Mortgage PDL´s - - - 1,286 43 56 1,274
Preventive Loan Loss Reserves - - 260 15,287 - - 15,287
Acquired Collection Rights - - 1,466 2,984 379 379 2,984
Account Receivables from Insurance and Annuities - - - 1,934 - - 1,934
Premium Debtors (Net) - - - 4,502 - - 4,502
Account Receivables from Reinsurance - - - 5,967 - - 5,967
Benef.receivab.securization transactions - - - 587 - - 587
Sundry Debtors & Other Accs Rec, Net 131 6 10,074 26,913 64 332 26,646
Inventories - - - 922 - - 922
Foreclosed Assets, Net - - 464 2,731 201 201 2,731
Real Estate, Furniture & Equipment, Net 0 104 5 12,748 212 115 12,845
Investment in Subsidiaries 90 - 320 123,602 767 110,453 13,916
Deferred Taxes, Net - 1 116 2,968 336 992 2,311
Total other Assets 1 5 570 27,330 2,696 1,307 28,719
Goodwill - - - 14,194 2,693 1,117 15,771
Intangible 1 5 570 9,104 - 178 8,926
Other Assets 0 - - 4,032 3 13 4,022
TOTAL ASSETS 371 147 16,843 1,224,146 6,023 132,187 1,097,982
ASSETS Total Charges
Operadora
de Fondos
Banorte Ixe
IXE
Servicios
Sólida
Administrad
ora de
Credits Final Balance

IV. FINANCIAL STATEMENTS
Fourth Quarter 2014 64
GFNorte - Balance Sheet as of December 31 '14
(Million Pesos)
Deposits - 498,697 896 - - - -
Demand Deposits - 300,282 - - - - -
Time Deposits - 193,905 - - - - -
Time Deposits-Retail - 185,461 - - - - -
Time Deposits-Money Market - 8,444 - - - - -
Senior Unsecured Debt - 4,510 896 - - - -
Due to Banks & Correspondents - 14,774 16,263 893 - - -
Immediate Redemption Loans - 0 - - - - -
Short Term Loans - 10,700 11,334 893 - - -
Long Term Loans - 4,073 4,929 - - - -
Technical Reserves - - - - 13,629 59,879 -
Non-assigned Securities for Settlement - - - - - - -
Creditor Balance in Repo Trans, Net - 208,362 - - - - 98,740
Secs to be received in Repo Trans, Net - - - - - - -
Collateral sold or pledged as collateral - 154 - - - - -
Transactions with Derivatives for trading purposes - 17,271 - - - - -
Transactions with Derivatives for hedging purposes - 4,020 - - - - -
Valuation adjustments for financial liability coverage - - - - - - -
Payable Accounts for Reinsurance - - - - 1,619 - -
Other Payable Accounts 1 18,988 597 16 3,692 123 737
Income Tax Payable - 4,459 2 4 777 - 133
Profit Sharing Payable - 373 - - - - -
Provision for future capital increase not formalized by its
governing entity - - - - - - -
Creditors for settlement of transactions - 3,072 - - - - 255
Acreedores Por Colaterales Recibidos En Efectivo - - - - - - -
Other Creditors & Accounts Payable 1 11,084 596 12 2,915 123 348
Subordinated Non Convertible Debt - 16,468 - - - - -
Deferred Taxes, Net - - - - - 353 -
Deferred Credits - 1,384 131 - 119 - -
TOTAL LIABILITIES 1 780,117 17,888 909 19,059 60,355 99,477
EQUITY 0.00 0 0 0 0 0 0
Subscribed Capital 50,983 31,173 526 87 709 325 1,429
Paid-in Capital 14,648 20,074 526 87 709 325 1,354
Share Subscription Premiums 36,334 11,099 - - - - 75
Contributions for future capital increases agreed by the
governing body - - - - - - -
Earned Capital 70,208 63,608 3,204 131 4,356 1,049 1,148
Capital Reserves 6,657 8,968 429 39 540 149 82
Retained Earnings 48,429 43,201 2,075 43 1,983 628 15
Surplus (Deficit) of Secs Available for Sale 605 510 - 4 74 (3) 164
Results from Valuation of Hedging Secs (762) (869) - - - - -
Results from Conversions (75) (138) - - - - 51
Surplus (Deficit) in Capital Restatement - - - - - - -
Results of Non Monetary Assets - - - - - - -
Results of Non Monetary Fixed Assets - - - - - - -
Results of Non Monetary - Investment Assets - - - - - - -
Accumulated Effect of Deferred Taxes - - - - - - -
Net Income 15,354 11,936 700 45 1,759 276 837
Capital Mayoritario 121,191 94,782 3,730 218 5,065 1,375 2,577
Minority Interest - 10 5 0 30 - -
Total Equity 121,191 94,791 3,735 218 5,094 1,375 2,577
TOTAL LIABILITIES & EQUITY 121,191 874,908 21,623 1,127 24,153 61,729 102,053
SegurosLIABILITIES Holding BanorteArrendadora y
FactorAlmacenadora Pensiones
Casa de Bolsa
Banorte Ixe

IV. FINANCIAL STATEMENTS
Fourth Quarter 2014 65
GFNorte - Balance Sheet as of December 31 '14
(Million Pesos)
Deposits - - - 499,593 1,671 - 497,922
Demand Deposits - - - 300,282 1,430 - 298,852
Time Deposits - - - 193,905 241 - 193,664
Time Deposits-Retail - - - 185,461 241 - 185,220
Time Deposits-Money Market - - - 8,444 - - 8,444
Senior Unsecured Debt - - - 5,406 - - 5,406
Due to Banks & Correspondents - - 12,830 44,759 14,683 8 30,084
Immediate Redemption Loans - - - 0 - - 0
Short Term Loans - - 12,830 35,757 14,675 - 21,082
Long Term Loans - - - 9,002 8 8 9,002
Technical Reserves - - - 73,508 - 185 73,693
Non-assigned Securities for Settlement - - - - - - -
Creditor Balance in Repo Trans, Net - - - 307,102 500 - 306,602
Secs to be received in Repo Trans, Net - - - - - - -
Collateral sold or pledged as collateral - - - 154 - - 154
Transactions with Derivatives for trading purposes - - - 17,271 - - 17,271
Transactions with Derivatives for hedging purposes - - - 4,020 - - 4,020
Valuation adjustments for financial liability coverage - - - - - - -
Payable Accounts for Reinsurance - - - 1,619 - - 1,619
Other Payable Accounts 149 1 64 24,368 405 57 24,019
Income Tax Payable 5 - - 5,380 - - 5,380
Profit Sharing Payable - 1 - 373 - - 373
Provision for future capital increase not formalized by its
governing entity - - - - - - -
Creditors for settlement of transactions - - - 3,327 103 - 3,224
Acreedores Por Colaterales Recibidos En Efectivo - - - - - - -
Other Creditors & Accounts Payable 144 1 64 15,287 302 57 15,041
Subordinated Non Convertible Debt - - - 16,468 - - 16,468
Deferred Taxes, Net 0 - - 353 992 639 -
Deferred Credits - - 2 1,637 178 - 1,459
TOTAL LIABILITIES 149 1 12,897 990,851 18,430 889 973,311
EQUITY 0 0 0 0 0 0 0
Subscribed Capital 112 144 2,926 88,415 37,903 322 50,833
Paid-in Capital 112 144 2,926 40,907 26,275 - 14,632
Share Subscription Premiums - - - 47,508 11,628 322 36,201
Contributions for future capital increases agreed by the
governing body - - - - - - -
Earned Capital 109 1 1,020 144,835 75,969 3,222 72,089
Capital Reserves 15 2 117 16,998 10,340 - 6,657
Retained Earnings 1 (3) 1,081 97,454 50,170 3,122 50,407
Surplus (Deficit) of Secs Available for Sale - - - 1,354 720 - 634
Results from Valuation of Hedging Secs - - - (1,631) (869) - (762)
Results from Conversions - - - (162) (87) - (75)
Surplus (Deficit) in Capital Restatement - - - - - - -
Results of Non Monetary Assets - - - - - - -
Results of Non Monetary Fixed Assets - - - - - - -
Results of Non Monetary - Investment Assets - - - - - - -
Accumulated Effect of Deferred Taxes - - - - - - -
Net Income 94 2 (178) 30,823 15,695 100 15,228
Capital Mayoritario 222 145 3,946 233,250 113,872 3,544 122,922
Minority Interest 0 - - 45 29 1,734 1,750
Total Equity 222 145 3,946 233,295 113,902 5,278 124,672
TOTAL LIABILITIES & EQUITY 371 147 16,843 1,224,146 132,331 6,167 1,097,982
Sólida
Administrad
ora de
ChargesLIABILITIES Credits Final Balance
Operadora
de Fondos
Banorte Ixe
IXE
ServiciosTotal

V. ACCOUNTING CHANGES
Fourth Quarter 2014 66
General regulations applied to controlling companies of financial groups subject to supervision by the CNBV.
On January 31, 2011 the CNBV issued general regulations applicable to controlling companies of financial groups, in order to compile into one single legal instrument the dispositions applicable to these entities, as well as the modification of diverse regulatory reports to take into consideration homogeneous accounting approaches applicable to other financial entities such as banking, insurance and bonding sectors. As a consequence of the work carried out jointly by the CNBV and the National Insurance and Bonding Commission in accordance with the Financial Reporting Standards issued by the CINIF and the International Financial Reporting Standards of the International Accounting Standards Board.
Once these dispositions come into effect, the "General Dispositions applicable to financial reporting standards for controlling companies of financial groups subject to supervision by the CNBV" will be cancelled as published in the Diario Oficial de la Federación on April 28, 2005 and its diverse modifications, as well as the "General accounting dispositions applicable to controlling companies of financial groups subject to supervision by the CNBV", published in the Diario Oficial de la Federación on August 14, 2006 and its diverse modifications.
Main changes in accounting criteria for controlling companies.
Criteria A-2 "Applications of special norms" was modified by eliminating the ability to avoid consolidating permanent investments in controlled insurance or bonding institutions, and as of February 1, 2011 such institutions must be consolidated in the financial statements of the controlling companies. Likewise with Criteria D-1, D-2, D-3 and D-4 relating to basic financial statements, there were changes in their presentation in accordance with the changes of the mentioned criteria.
Main changes in accounting criteria for credit institutions.
On January 27, 2011 the National Banking and Securities Commission issued changes to applicable accounting criteria for credit institutions to make them consistent with financial reporting standards established in Mexico and abroad, as well as facilitating the comparison of information provided to authorities, the public and markets in general. These changes were adopted and applied in the financial statements as of January 2011.
Amendment to the rating methodology of the commercial portfolio.
On June 24, 2013, the Commission published a resolution amending the provisions regarding the methodology for rating commercial loans. This resolution modifies the current model of reserves, in order to establish a methodology under which the portfolio is rated and reserved based on expected losses for the next 12 months considering the probability of default, loss severity and exposure to default of each client. The resolution came into force on June 25, 2013 and is applicable optionally as of this date, and must be met no later than December 31, 2013 for loans granted to individuals with business activity, corporations and decentralized bodies, excluding loans to financial institutions, for which the new methodology cannot be applied until January 2014. Pursuant to that resolution, the Institution decided to apply the formerly mentioned methodology with figures as of June 30, 2013, consequently the Institution recognized Ps 3.95 billion, in the heading of retained earnings of prior years, within stockholders' equity, corresponding to the initial cumulative financial effect derived from the application of the new rating methodologies for commercial loans, excluding loans granted to financial institutions which will be adopted until January 2014 according to the regulation. The amount of the allowance for loan losses for commercial loans of the Institution applying the new methodology was Ps. 8.38 billion, and the amount of the reserve for such commercial portfolio considering the methodology used prior to the implementation of this resolution was Ps. 4.99 billion, both with figures as of June 30, 2013. The amount recognized in equity includes Ps. 557 million of reserves corresponding to the portfolio sold by Arrendadora y Factor Banorte.
ACCOUNTING CHANGES AND REGULATIONS

V. ACCOUNTING CHANGES
Fourth Quarter 2014 67
Changes to accounting criteria for Mutual Funds and the individuals providing services.
On March 16, 2012, the National Banking and Securities Commission issued changes in accounting criteria applicable to mutual funds, to make them consistent with financial reporting standards set in Mexico as well as abroad, and to facilitate compatibility of the information given to authorities, public, and markets in general. These changes are similar to changes made for Credit Institutions.
Changes to accounting criteria for other finance companies.
On July 30, 2009 the National Banking and Securities Commission issued changes among others, to accounting criteria applicable other regulated finance companies, SOFOLs and SOFOMs, make them consistent with financial reporting standards set in Mexico as well as abroad, and to facilitate compatibility of the information given to authorities, public, and markets in general. These changes are similar to changes made for Credit Institutions.
NIF B-10 Bulletin “Inflation Effects”.
Comparisons of 2008 results vs. reported figures for previous periods are not fully comparable, as a result of the NIF B10 “Inflation Effects” norm taking effect in January of this year. This norm indicates that the economic environment is non-inflationary when the accumulated inflation rate over the last three years is less than 26%. Under this context, it is not necessary to re-express financial statements as of January, 2008.
Main changes in accounting criteria B-6 “Loan Portfolio”.
On September 24, 2014, the Commission issued a resolution amending terms corresponding to Accounting Criterion "B-6 Loan Portfolio". The objective was to establish an accounting procedure that credit institutions must observe with regards to loans granted under the terms of Article 43 (Section VIII) and under Article 75 (Sections II and III of Article 224) of the Bankruptcy Act. The main changes are:
In the definition of past due loans is specified that in order to exclude those loans from this definition whose
borrowers have declared bankruptcy, the Banks must continue to receive payment on the principal and interest of such loans.
Past Due Loan Portfolio - Comprised of those loans: a) Whose debtors have declared bankruptcy, with the exception of those loans:
i. that continue to make payments under the terms outlined in Section VIII of Article 43 of the Bankruptcy Law, or
ii. granted under the protection of Article 75 in relation to Sections II and III of Article 224 of the aforementioned Law; or
b) Whose principal, interest, or both not have been liquidated under the terms originally pacted, to the effect of that established in paragraphs 53 to 64 of the present criteria.
The definition of payment is added.
Payment – the actual delivery of an item, amount or service due that has been agreed upon. Financial income from capital leasing or financial factoring transactions, or capitalized interests is not considered as payment.
It is specified the statutory basis of the Bankruptcy Act in relation to the procedures that Banks must observe to transfer to past due loans those loans to companies in bankruptcy, provided they are in arrears in the payment of their principal and interest.
Transfer to Past Due Loan
The outstanding amount, in accordance to the conditions established in the loan agreement, will be registered as past due when:
The debtor has declared bankruptcy, in accordance with the Bankruptcy Law.

V. ACCOUNTING CHANGES
Fourth Quarter 2014 68
Without prejudice to the provisions of the present paragraph, those payments received under the terms outlined in Section VIII of Article 43 of the Bankruptcy Law, as well as loans granted protection under Article 75 in relation to Sections II and III of Article 224 of the Act, will be transferred to past due when they have incurred the cases established in numeral 2 of paragraph 53 of Criterion B-6.
Early termination of the mortgage debtor support programs.
On June 30, 2010, the Ministry of Finance and Public Credit (SHCP) on behalf of the Federal Government agreed (the Agreement) to the early termination of mortgage debtor support programs (end point and UDIS trusts) with banks. Consequently, as of January 1, 2011, the Holding Company absorbed the corresponding part of the discount offered in advance to mortgage debtors that participated in the program. Some of the effects recorded in 2010 from the application of the Agreement which became effective as of the date it was entered into are presented below. As of December 31, 2014, the total amount of the Federal Government’s payment obligations with respect to commercial loans amounted to $28 million, which includes $27 million corresponding to the conditioned discount portion derived from loans denominated in local currency and in UDIS, and $1 million related to the discount applied to loans referred to in number 3.1.2 of Circular 1430. As of December 31, 2014, the Federal Government’s obligations under the Agreement were:
Payment date Amount
Fifth amortization June 1, 2015 28
$28
Each amortization will include a monthly financial cost as of the day immediately following the cut-off date and until the end of the month immediately preceding the payment date of each, using, for the month of January 2012, the rate corresponding to the arithmetic average of annual rates of return calculated on the basis of the discount rate of the 91-day Cete issued in December 2011, and for subsequent months 91-day CETES future rates corresponding to the immediately preceding month published by the company Proveedor Integral de Precios, S.A., the working day immediately following the cut-off date, or else that of the closest previous month contained in said publication, taken to the 28-day curve, and dividing the resulting rate by 360, multiplying the result by the number of days that have effectively elapsed during the due period, and applying monthly capitalization. Below is an analysis of the movement in the loan loss estimate for credit risks related to the mortgages covered in the Agreement:
2014
Start balance $19 Holding company support 67 Haircuts, discounts and cancellations 14 Reserve reclassification (9) Contributions to settle trust liabilities 1
End balance $92
During 2014 $8 million were recognized as results in relation to the end point support program. The maximum amount of loans not eligible for the Early Termination program with the potential to receive the discount program’s benefits to be absorbed by the Holding company is $14 million. The amount corresponding to the repurchase of SPECIAL CETES was $97 million; the outstanding balance of SPECIAL CETES that has not been repurchased by the Federal Government as of December 31, 2014 is $885 million with maturities between 2017 and 2027. As a result of the termination of the Trusts, in 2010 the Holding company recognized $330 million in loan loss reserves and $56 million in deferred taxes in its balance sheet.

V. ACCOUNTING CHANGES
Fourth Quarter 2014 69
Special accounting treatment as part of Banco Mercantil del Norte’s support program to help victims of Hurricane "Odile".
Because flooding caused by Hurricane Odile has had a devastatingly negative impact on the region’s economy, the institution has decided to support the economic recovery of the affected regions whose municipalities have been declared disaster areas by the Diario Oficial de la Federacion and by Secretaria Gobernacion, through the implementation of various support programs to loan holders as follows:
Support for mortgages, payroll, Crediactivo (SMEs) and car loans consists of:
Mortgages. Provisions are available to cover up to 3 mortgage payments with a personal loan at the same rate as the mortgage and without any origination fee, for up to the sum of the 3 payments and terms of 36 and 48 months, at the client’s option.
Car loans. Deferral of up to three monthly installments, which will be added to the end of the term extending the original term by an additional 7 months.
Payroll loans. Deferral of up to three monthly payments, which will be added to the end of the term extending the original term by 7 months.
Crediactivo (SMEs). Clients will be able to defer 3 monthly installments through the formalization of an agreement, deferred payments will be added to the end of the term without affecting the original loan term, i.e. the client will have to pay double the installment amount for the last 3 months of the loan.
As a result of the aforementioned, the Comisión Nacional Bancaria y de Valores (National Banking and Securities Commission), issued a special accounting criteria, Document No. P110/2014, applicable to the Institution as of September 19, 2014 for up to 120 days after the event, which authorizes the Institution to consider those performing loans at the date of the incident which qualified for deferment of capital and interest payments in accordance with the Plan, not to be considered as restructured loans as established by Paragraph 56 of Criterion B-6 "Loan Portfolio", and for these same loans to remain classified as performing loans during the term set in this Plan. Therefore, these loans are considered part of the performing loan portfolio for the determination of the estimated loan loss reserves.
Had the authorized special accounting criteria not been applied, the amounts of the portfolio balance sheet that the Institution would have presented in the Balance Sheet on December 31, 2014, would have been:
PERFORMING LOAN PORTFOLIO
Commercial loans
Business or Corporate Activity $191,187
Financial Entities 3,316
Governmental Entities 118,962
Consumer loans 68,328
Mortgages 89,918
TOTAL PERFORMING LOAN PORTFOLIO 471,711
PAST DUE LOAN PORTFOLIO
Commercial loans
Business or Corporate Activity 10,651
Financial Entities 1
Governmental Entities 0
Consumer loans 2,425
Mortgages 1,274
TOTAL PAST DUE LOANS 14,351

V. ACCOUNTING CHANGES
Fourth Quarter 2014 70
LOAN PORTFOLIO 486,062
(Less) ESTIMATED LOAN LOSS PROVISIONS -15,287
LOAN PORTFOLIO, net 470,775
AQUIRED COLLECTION RIGHTS 2,984
TOTAL LOAN PORTFOLIO, net $473,759
End of year results will not be modified as a result of providing of support to borrowers.
Deferred payments to December 31, 2014, are as follows:
Amount Deferred
Commercial loans $ 1
Consumer loans $ 8

VI. LOAN PORTFOLIO SALES TO SOLIDA
According to the new criteria, effective as of January 2008, inflationary accounting no longer applies for re-expressing financial statements.
Fourth Quarter 2014 71
On February, 2003 Banorte sold Ps $1.9 billion (Ps $1.861 billion in past due loans and Ps $64 million in Performing loans) of its own portfolio (including interests) to its subsidiary, Sólida Administradora de Portafolios, S.A. de C.V. for Ps $378 million. The transaction was done based on August 2002 figures, and therefore the final figure that affected the February balance was Ps $1.86 billion, once the collections made since August 2002 are considered. The past due portfolio, as well as Ps $1.577 billion in associated loan reserves, were cancelled.
As instructed by the CNBV in the document 601-II-323110, we show the integration of the loan portfolio sold in 1Q03 by Banorte to its subsidiary Sólida Administradora de Portafolios, S.A. de C.V. The Purpose of this sale was to concentrate the portfolio in this specialized recovery unit as it had been managing the collections of these loans
previously. This was a one-time operation and not a permanent transfer procedure of the Solida's portfolio.
(M illion of Nominal Pesos) aug-02 sep-14 dec-14 aug-02 sep-14 dec-14 aug-02 sep-14 dec-14
Performing Loans
Commercial 5 0 0 5 0 0 10 0 0
Mortgage 54 23 23 0 0 0 54 23 23
Total 59 23 23 5 0 0 64 23 23
Non Performing Loans
Commercial 405 287 251 293 113 111 698 399 362
Consumer 81 72 71 0 0 0 81 72 71
Mortgage 1,112 231 227 0 0 0 1,112 231 227
Total 1,598 589 550 293 113 111 1,891 702 660
TOTAL LOANS 1,657 612 572 298 113 111 1,955 725 683
Loan Loss Reserves (1)
Commercial 326 287 251 246 113 111 572 399 362
Consumer 77 72 71 0 0 0 77 72 71
Mortgage 669 242 238 0 0 0 669 242 238
Total 1,072 601 561 246 113 111 1,318 713 672
TotalLocal Currency Foreign Currency (USD)
(1) Reserve requirements using the same classification method used for the bank.
(* )There was a Reserve deficit of Ps 2 million as of December 2014.
(*) The dollar portfolio and reserves are re-expressed in pesos.
(*) Local Currency includes UDIS valued at the new exchange rate.
(*) Banorte had a 99.99% stake in Sólida until May 2013. After this date, Sólida was merged into Ixe Soluciones and changed its corporate identity to Sólida Administradora de Portafolios, S.A. de C.V. SOFOM, ER, Grupo Financiero Banorte.
In 4Q14 the Loan portfolio showed changes due to: collections of Ps 2.98 million, foreclosed assets of Ps 0.78 million, restructurings of Ps 0.44 million and there were charge offs and discounts of Ps. 30.79 million. In the Loan loss provisions, there were charge offs and discounts of Ps 2.91 million. There were transfers from performing loans to past due loans of Ps 0.20 million and transfers from past due loans to performing loans of Ps 0.23 million.
LOAN PORTFOLIO SALES TO SOLIDA ADMINISTRADORA DE PORTAFOLIOS

VI. LOAN PORTFOLIO SALES TO SOLIDA
According to the new criteria, effective as of January 2008, inflationary accounting no longer applies for re-expressing financial statements.
Fourth Quarter 2014 72
As instructed by the CNBV in the document 601-II-323110 for purposes of determining financial indicators and a general disclosure referred to regulations, we show the integration of the Banorte’s portfolio including the portfolio which was sold to Sólida Administradora de Portafolios, S.A. de C.V.
(Million of Nominal Pesos) sep-14 dec-14 sep-14 dec-14 sep-14 dec-14
Performing Loans
Commercial 270,258 286,398 22,717 28,387 292,975 314,785
Consumer 41,626 42,321 0 0 41,626 42,321
Mortgage 85,665 88,537 0 0 85,665 88,537
Performing Loans 397,549 417,256 22,717 28,387 420,266 445,643
Non Performing Loans
Commercial 10,882 10,428 523 196 11,405 10,624
Consumer 1,111 1,132 0 0 1,111 1,132
Mortgage 1,459 1,480 0 0 1,459 1,480
Non Performing Loans 13,453 13,039 523 196 13,976 13,235
TOTAL LOANS 411,002 430,295 23,240 28,583 434,242 458,878
Loan Loss Reserves 12,216 12,112 657 360 12,873 12,472
Net Loan Portfolio 398,786 418,183 22,583 28,223 421,369 446,406
Loan Loss Reserves 92% 94%
% Past Due Loans 3.22% 2.88%
Local Currency (1)Foreign Currency (USD)
(2)Total
1. Includes UDIS. 2. The dollar portfolio and reserves are re-expressed in pesos.

VII. NOTES TO FINANCIAL STATEMENTS
Fourth Quarter 2014 73
Negotiable Instruments Book Value InterestUnrealized
gain (loss)
Market
Value
Government Securities 200,905 474 (55) 201,324
Unrestricted 6,124 16 19 6,159
CETES (Special) - - - -
CETES 442 5 0 447
BONDES 2,422 2 1 2,424
BPA 475 2 1 477
BREMS - - - -
Bonds 1,727 5 15 1,748
CBIC - - - -
Udibonds 1,005 1 2 1,008
UMS 53 1 0 54
Treasury Bonds - - - -
Treasury Notes - (0) - (0)
Other Government Securities - - - -
Restricted 194,781 458 (74) 195,165
CETES (Special) - - - -
CETES 2,209 - (0) 2,209
BONDES 58,441 65 (39) 58,467
BPA 133,379 393 (35) 133,736
BREMS - - - -
Bonds 612 1 (0) 612
CBIC - - - -
Udibonds 140 0 0 141
UMS - - - -
Treasury Bonds - - - -
Treasury Notes 0 - - 0
Banking Securities 34,905 36 25 34,965
Unrestricted 5,689 1 (1) 5,690
Notes 5,025 0 (0) 5,025
CEDES 51 0 0 51
Stock Certif icates 449 1 (0) 450
Structured Notes - - - -
Other Banking Securities 164 - - 164
Restricted 29,216 34 25 29,275
Notes 5,945 - 1 5,947
CEDES 3,935 4 0 3,940
Stock Certif icates 18,765 29 23 18,817
Structured Notes - - - -
Other Banking Securities 570 1 0 572
Private Securities 12,431 20 236 12,687
Unrestricted 1,346 2 224 1,572
Stock Certif icates 461 1 (5) 457
PEMEX Bonds 3 0 0 3
Commercial Paper - - - -
Corporate Bonds - - - -
Euro Bonds 158 1 6 165
GFNORTE stocks - - - -
BMV stocks 217 - 145 361
Mutual Funds stocks 457 - 81 539
CPOs - - - -
Structured Notes - - - -
Other Private Securities 51 - (3) 48
Restricted 11,085 18 12 11,115
Stock Certif icates 8,394 15 14 8,422
PEMEX Bonds 2,674 3 (2) 2,675
Commercial Paper - - - -
Corporate Bonds - - - -
Euro Bonds - - - -
GFNORTE stocks - - - -
BMV stocks 17 - 0 17
Mutual Funds stocks - - - -
CPOs - - - -
Structured Notes - - - -
Other Private Securities - - - -
Total 248,241 530 205 248,976
(M illion Pesos)
FINANCIAL INSTRUMENTS AND VALUATION EFFECTS 4Q14

VII. NOTES TO FINANCIAL STATEMENTS
Fourth Quarter 2014 74
Securities Held for Sale Book Value InterestUnrealized
gain (loss)
Market
Value
Government Securities 76,472 1,055 446 77,973
Unrestricted 14,698 230 135 15,063
CETES (Special) - - - -
CETES 83 - (0) 83
BONDES 99 0 (0) 99
BPA 130 0 (0) 130
BREMS - - - -
Bonds 252 1 (11) 242
CBIC 31 1 6 37
Udibonds - - - -
UMS 5,664 204 262 6,130
Treasury Bonds - - - -
Treasury Notes 665 5 (20) 650
Other Government Securities 7,775 19 (102) 7,692
Restricted 61,774 826 311 62,910
CETES (Special) - - - -
CETES 98 - (0) 98
BONDES 0 0 - 0
BPA 60,923 824 318 62,064
BREMS - - - -
Bonds 753 2 (6) 748
CBIC - - - -
Udibonds - - - -
UMS - - - -
Treasury Bonds - - - -
Treasury Notes - - - -
Banking Securities 2,133 2 (98) 2,038
Unrestricted 684 0 (102) 583
Notes - - - -
CEDES - - - -
Stock Certif icates - - - -
Structured Notes 684 0 (102) 583
Other Banking Securities - - - -
Restricted 1,449 2 4 1,455
Notes - - - -
CEDES 0 (0) - 0
Stock Certif icates 1,449 2 4 1,455
Structured Notes - - - -
Other Banking Securities - - - -
Private Securities 24,214 347 365 24,926
Unrestricted 21,999 310 320 22,628
Stock Certif icates 3,948 23 (120) 3,851
PEMEX Bonds 8,862 270 275 9,406
Commercial Paper - - - -
Corporate Bonds - - - -
Euro Bonds 1,900 17 43 1,960
GFNORTE stocks - - - -
BMV stocks - - - -
Mutual Funds stocks 7,288 - 122 7,410
CPOs - - - -
Structured Notes - - - -
Other Private Securities - - - -
Restricted 2,215 37 45 2,298
Stock Certif icates 609 2 0 611
PEMEX Bonds 1,441 32 29 1,502
Commercial Paper - - - -
Corporate Bonds - - - -
Euro Bonds 148 4 16 168
GFNORTE stocks - - - -
BMV stocks - - - -
Mutual Funds stocks - - - -
CPOs - - - -
Structured Notes - - - -
Other Private Securities 17 - - 17
Total 102,819 1,405 714 104,937
(M illion Pesos)
FINANCIAL INSTRUMENTS AND VALUATION EFFECTS 4Q14

VII. NOTES TO FINANCIAL STATEMENTS
Fourth Quarter 2014 75
Securities Held to Maturity BOOK VALUE INTEREST xxxxMarket
Value
Government Securities 56,499 86 - 56,585
Unrestricted 53,213 74 - 53,286
CETES (Special) 886 0 - 886
CETES - - - -
BONDES 399 0 - 399
BPA - - - -
BREMS - - - -
Bonds 1,661 4 - 1,665
CBIC 462 2 - 464
Udibonds 49,806 67 - 49,873
UMS - (0) - (0)
Treasury Bonds - - - -
Treasury Notes - - - -
Other Government Securities - - - -
Restricted 3,286 12 - 3,298
CETES (Special) - - - -
CETES - - - -
BONDES 0 - - 0
BPA 3,286 12 - 3,298
BREMS - - - -
Bonds 0 0 - 0
CBIC 0 0 - 0
Udibonds 0 0 - 0
UMS - - - -
Treasury Bonds - - - -
Treasury Notes - - - -
Banking Securities 4,432 1,129 - 5,561
Unrestricted 4,432 1,129 - 5,561
Notes 1,166 - - 1,166
CEDES 1,438 980 - 2,417
Stock Certif icates 1,167 15 - 1,182
Structured Notes 449 135 - 584
Other Banking Securities 211 0 - 211
Restricted (0) - - (0)
Notes - - - -
CEDES - - - -
Stock Certif icates (0) - - (0)
Structured Notes - - - -
Other Banking Securities - - - -
Private Securities 15,106 547 - 15,653
Unrestricted 10,682 532 - 11,214
Stock Certif icates 10,495 528 - 11,024
PEMEX Bonds - - - -
Commercial Paper - - - -
Corporate Bonds - - - -
Euro Bonds 187 4 - 190
GFNORTE stocks - - - -
BMV stocks - - - -
Mutual Funds stocks - - - -
CPOs - - - -
Structured Notes - - - -
Other Private Securities - - - -
Restricted 4,424 15 - 4,439
Stock Certif icates 3,982 14 - 3,995
PEMEX Bonds - - - -
Commercial Paper - - - -
Corporate Bonds - - - -
Euro Bonds - - - -
GFNORTE stocks - - - -
BMV stocks - - - -
Mutual Funds stocks - - - -
CPOs - - - -
Structured Notes - - - -
Other Private Securities 443 1 - 444
Fair Value Adjustment Ixe Banco (63) - - (63)
Total 75,974 1,762 - 77,736
FINANCIAL INSTRUMENTS AND VALUATION EFFECTS 4Q14
(M illion Pesos)

VII. NOTES TO FINANCIAL STATEMENTS
Fourth Quarter 2014 76
R epo C redito rs
MV Repo Debtors
VM Collateral
received sold in
Repo Trans
Debtor Balance Creditor Balance MV Repo Creditors
Goverment securities 35,642 34,772 870 - 259,716
Banking securities 1,729 1,729 0 0 28,637
Private Securities 7,798 7,950 1 154 18,248
Total 45,169 44,451 871 154 306,602
R EP UR C H A SE A GR EEM EN T OP ER A T ION S 4Q14
(M illion Pesos)
R epo D ebto rs
VII. NOTES TO FINANCIAL STATEMENTS
Fourth Quarter 2014 77
Instrument Fair Value
Futures -
TIIE 28 Futures -
Forward -
Fx Forw ard 557
Options -
Rate options 638
Fx options -
Swaps 1
Rate sw ap 14,035
Fx sw ap 1,281
Negotiable Total 16,510
Options -
Rate Options 0
Fx options -
Swaps 0
Rate sw ap 37
Fx sw ap 49
Hedging total 86
Position total 16,597
Instrument Fair Value
Futures -
TIIE 28 Futures -
Forward -
Fx Forw ard 420
Options 0
Rate options 467
Fx options 0
Swaps 2
Rate sw ap 13,932
Fx sw ap 2,452
Negotiable Total 17,271
Swaps 2
Rate sw ap 1,551
Fx sw ap 2,469
Hedging total 4,020
Position total 21,291
Creditor Balance
DERIVATES FINANCIAL INSTRUMENTS
OPERATIONS 4Q14
(M illion Pesos)
Debtor Balance

VII. NOTES TO FINANCIAL STATEMENTS
Fourth Quarter 2014 78
P R OD UC T O SUB YA C EN T E T IP O N OC ION A L
Forwards de Divisa Compras Tipo de Cambio (USD/MXN). 10,116
Forwards de Divisa Ventas Tipo de Cambio (USD/MXN). 6,342
Forwards de Divisa Compras Tipo de Cambio (CAD/MXN). 0
Forwards de Divisa Ventas Tipo de Cambio (CAD/MXN). 0
Forwards de Divisa Compras Tipo de Cambio (EUR/MXN). 0
Forwards de Divisa Ventas Tipo de Cambio (EUR/MXN). 0
Opciones de Divisa Compras Tipo de Cambio (Dólar). 0
Opciones de Divisa Ventas Tipo de Cambio (Dólar). 1
Opciones de Tasa Compras TIIE 81,192
Opciones de Tasa Ventas TIIE 112,440
Opciones de Tasa Compras LIBOR 3,125
Opciones de Tasa Ventas LIBOR 3,192
Swaps de Tasa USD LIBOR LIBOR 246,974
Swaps de Tasa MXN TIIE TIIE 952,651
Swaps de Tasa y Divisa CS USDMXN FIJO/VARIABLE 24,155
Swaps de Tasa y Divisa CS USDCETE CETE 0
Swaps de Tasa y Divisa CS EURMXN FIJO/VARIABLE 8,245
NOTIONAL PRINCIPAL AMOUNT IN DERIVATIVE OPERATIONS 4Q14- Banorte
(Millones de Pesos)

VII. NOTES TO FINANCIAL STATEMENTS
Fourth Quarter 2014 79
4Q13 4Q14 4Q13 4Q14 4Q13 4Q14 4Q13 4Q14
Performing Loans
Commercial Loans 154,336 148,610 - - 30,288 42,579 184,624 191,189
Financial Intermediaries´ Loans 3,650 2,176 - - 1,212 1,140 4,863 3,316
Consumer Loans 57,728 68,234 - - 155 149 57,883 68,383
Mortgage Loans 80,306 88,228 339 286 1,388 1,404 82,033 89,918
Government Entities´ Loans 95,243 118,121 - - 393 841 95,636 118,962
Derechos de cobro Fiduciario - - - - - - - -
Total 391,262 425,369 339 286 33,437 46,113 425,038 471,768
Past Due Loans
Commercial Loans 10,410 10,544 6 6 58 100 10,473 10,649
Financial Intermediaries´ Loans 0 1 - - - - 0 1
Consumer Loans 2,093 2,370 - - - - 2,093 2,370
Mortgage Loans 988 1,207 55 34 43 33 1,087 1,274
Government Entities´ Loans 2 - - - - - 2 -
Total 13,493 14,121 61 39 101 133 13,655 14,293
Total Propietary Loans 404,755 439,490 400 325 33,538 46,246 438,693 486,061
LOAN PORTFOLIO
(Million Pesos)
Local Currency UDIS Foreign Currency Total
PERIOD COST
BALANCE OF LOAN
PORTFOLIO
FINAPE - -
FOPYME - -
Mortgage UDIS 8.5 0.0
Mortgage FOVI - -
8.5 0.0
(Million Pesos)
TOTAL
COST OF BALANCES OF FINAPE, FOPYME, MORTGAGE UDIS AND MORTGAGE FOVI
LOAN PORTFOLIOS AS OF 4Q14- GFNorte
At closing of this quarter the balance in debtors support programs totaled Ps 8 million without a cost for the period.

VII. NOTES TO FINANCIAL STATEMENTS
Fourth Quarter 2014 80
ASSETSINCOME
TAX
PROFIT
SHARINGNET
Excess of preventive reserves accounts over the fiscal limit 2,330 - 2,330
Non deductible provisions and cumulative income 712 - 712
Excess of accounting value over fiscal value on Reposessed Assets 772 - 772
Diminishable profit sharing 112 - 112
Fees received in advance 844 - 844
Effects from valuation of instruments 154 - 154
Tax losses pending amortization 1,815 - 1,815
Provisions for possible loss in loans 1,109 - 1,109
Loss on sale of foreclosed assets and credits 93 - 93
Decline in value of real estate 17 - 17
Interest on Loans 1 - 1
Reserve for employee retirement benefits 3 - 3
Diverse Creditors 135 - 135
Charge-off’s Estimates 32 - 32
Provisions for seniority premiums 11 - 11
Other 196 - 196
Total Assets 8,334 - 8,334
LIABILITIES
Pension Funds Contribution (1,092) - (1,092)
Loan Portfolio Acquisitions (429) - (429)
Projects to be capitalized (1,424) - (1,424)
Effects from valuation of instruments (1,976) - (1,976)
Intangibles’ amortizations (25) - (25)
Increase for securities’ valuation (198) - (198)
Receivable interest from securities (18) - (18)
Current Account Agents (14) - (14)
Savings' Inventory (11) - (11)
Savings' Inventory (757) - (757)
Excess of the accounting value over the tax value of foreclosed
assets and fix assets (42) - (42)
Other (37) - (37)
Total Liabilities (6,023) - (6,023)
Assets (Liabilities) Accumulated Net 2,311 - 2,311
DEFERRED TAXES 4Q14
(Million Pesos)

VII. NOTES TO FINANCIAL STATEMENTS
Fourth Quarter 2014 81
Non Convertible Subordinated Bonds 2006 USD 13-oct-06 200 2,188 2,948 15 years 6.862% 13-oct-21 E/180 days
Senior Notes Due 2010 USD 19-jul-10 300 3,875 4,422 5 years 4.375% 19-jul-15 E/180 days
Non Convertible Subordinated Bonds Q Banorte 08 MXN 11-mar-08 3,000 3,000 3,000 10 years TIIE + 0.60% 27-feb-18 E/28 days
Non Convertible Subordinated Bonds Q Banorte 08-2 MXN 27-jun-08 2,750 2,750 2,750 10 years TIIE + 0.77% 15-jun-18 E/28 days
Non Convertible Subordinated Bonds Q Banorte 08U UDIs 11-mar-08 447 1,749 2,356 20 years 4.950% 15-feb-28 E/182 days
Non Convertible Subordinated Bonds Q Banorte 09 MXN 08-jun-12 3,200 3,200 3,200 10 years TIIE + 1.50% 27-may-22 E/28 days
Non-Preferred Non-Cumulative Subordinated Fixed Rate Notes
due 2020USD 14-oct-10 120 1,484 1,769 10 years 9.25% 14-oct-20 E/180 days
LONG TERM DEBT AS OF DECEMBER '14 - BANCO MERCANTIL
(Million Pesos)
TYPE OF DEBT CURRENCYDATE OF
ISSUE
ORIGINAL
AMOUNT
ORIGINAL
AMOUNT
(VALUED)
INTEREST
PAYMENTRATE MATURITY
CURRENT
AMOUNTTERM
LOANS FROM LOCAL BANKS - -
LOANS FROM FOREIGN BANKS GENERATED IN THE COUNTRY - -
LOANS FROM FOREIGN BANKS GENERATED FROM FOREIGN
COUNTRY 111 111
LOANS FROM DEVELOPMENT BANKS 10,976 6,145 17,120
LOANS FROM PUBLIC FUNDS 9,241 1,259 10,499
CALL MONEY & LOANS FROM BANKS 16,730 - 16,730
LOANS FROM FIDUCIARY FUNDS 237 237
PROVISIONS FOR INTEREST 61 61
37,184 7,576 44,759
ELIMINATIONS (14,675)
Total 30,084
BANK AND OTHER ENTITIES LOANS’ AS OF 4Q14
(M illion Pesos)
LOC A L
C UR R EN C Y
T OT A LF OR EIGN
C UR R EN C Y
DEMAND DEPOSITS
Local Currency and UDIs 0.51%
Foreign Currency 0.02%
TIME DEPOSITS
Local Currency and UDIs 2.44%
Foreign Currency 0.65%
INMEDIATE REDEMPTION LOANS
Local Currency and UDIs 2.91%
Foreign Currency -
OTHERS
Local Currency and UDIs 4.19%
Foreign Currency 1.95%
DUE TO BANKS & CORRESPONDENTS (BANORTE)
CORE DEPOSITS AND DUE TO BANKS & CORRESPONDENTS - INTEREST
RATES 4Q14
CORE DEPOSITS (BANORTE)

VII. NOTES TO FINANCIAL STATEMENTS
Fourth Quarter 2014 82
4Q13 3Q14 4Q14Change
vs. 4Q13
Change
vs. 3Q14
Banxico (Monetary Regulation Deposits) 28,504 30,977 33,449 17% 8%
Banxico (Repos with the System of Payments 37,254 37,609 37,609 1% 0%
Call Money 63,350 65,650 65,650 4% 0%
TOTAL 129,108 134,236 136,708 6% 2%
Million pesos
MAIN CREDIT LINES RECEIVED 4Q14 (BANORTE)
T rading inco me C o nso lidated
Securities - Unrealized gains 1105
Negotiable instruments 223
Derivative instruments - Negotiation 897
Derivative instruments - Hedging -15
Impairment loss or revaluation increase -71
Result from foreign exchange valuation 3
Result from valuation of precious metals 5
Result from purchase/sale of securities and derivatives 2305
Negotiable instruments 1374
Securities held for sale 572
Securities held to maturity 19
Derivative instruments - Negotiation 0
Derivative instruments - Hedging 340
Result from purchase/sale of foreign exchange 1072
Result from purchase/sale of precious metals 6
Transaction costs 0
Intermediation of received collateral -4
Increase derived from trading income adjustments 0
Total 4,420
TRADING INCOME 4Q14
M illio n P eso s

VII. NOTES TO FINANCIAL STATEMENTS
Fourth Quarter 2014 83
Risk Management
AUTHORIZED BODIES
For proper Risk management, the Board of Directors established since 1997 the Risk Policy Committee (CPR) to manage the risk that the Holding company is exposed to as well as to monitor the performance of operations and that it sticks to the objectives, policies and procedures for risk management. In addition, the CPR monitors the overall limits of risk exposure approved by the Board of Directors, in addition to approving specific risk limits for exposure to different types of risk. The CPR is integrated with proprietary members of the Board, the CEO, the Directors of the entities, Risk Management and Audit, this last one participates with voice but no vote. For the adequate performance of its objective, the CPR plays, among others, the following functions: 1. Propose for approval by the Board: • The framework for overall risk management. • The global limits for risk exposure. • The mechanisms for the implementation of corrective actions. • The cases or special circumstances which may exceed the overall limits as much as the specifics. 2. Approve and review at least once a year: • Specific limits for discretionary risks and the risk tolerance levels for non-discretionary. • The methodology and procedures to identify, measure, monitor, limit, control, report and disclose various types of risk to which the holding company is exposed to. • The models, parameters and settings used to carry out the valuation, measurement and control of risks proposed by the unit for comprehensive risk management. 3. Approve: • The methodologies for the identification, valuation, measurement and control of risks of new business, products and services that the holding intends to offer to the market. • The corrective actions proposed by the drive for comprehensive risk management. • Manuals for comprehensive risk management. • The technical evaluation aspects of risk management. 4. Appoint and remove the unit responsible for overall risk management, it is ratified by the Board. 5. Report to the Board at least quarterly, the risk exposure and its possible negative effects and follow-up to the limits and tolerance levels. 6. Report to the Board on corrective actions taken. UNIT FOR INTEGRAL RISK ADMINISTRATION (UAIR)
The UAIR helps identify, measure, monitor, limit, control, report and disclose various types of risk to which the Holding Company is exposed and is in charge of the Risk Management department (DGAR). The DGAR reports to CPR, in compliance with the provisions of the Circular of the Commission called "prudential provisions in the Field of Risk Management applicable to Credit Institutions", as to the independence of business areas. The DGAR routes efforts and has methodologies for:
o Credit Risk Management; o Operational Risk Management; o Market Risk Management; o Liquidity and Capital Risk Management;

VII. NOTES TO FINANCIAL STATEMENTS
Fourth Quarter 2014 84
The main objectives of the DGAR can be summarized as follows: • Provide different business areas clear rules that contribute to its correct understanding to minimize risk and ensure to be within the parameters established and approved by the Board of Directors and the Risk Policy Committee. • Establish mechanisms to monitor the risk taking within the Holding trying to mostly be a timely and supported by advanced systems and processes. • Standardize measurement and risk control. • Protect the Holding´s capital against unexpected losses from market movements, bankruptcies, credit and operational risks. • Develop pricing models for different types of risks. • Establish procedures for portfolio optimization and management of credit portfolio. The Financial Group has divided risk assessment and risk management in the following areas: Credit Risk: revenue volatility due to loan loss provisions for impaired loans, and, expected losses on borrower or counterparty defaults. Market Risk: revenue volatility due to market changes, which affect the valuation of positions for active operations, liabilities or causes of contingent liabilities, such as: interest rates, exchange rates, price indices, etc. Liquidity Risk: potential loss by the impossibility of renewing liabilities or hiring others to the Holding in normal conditions, by early or forced sale of assets at unusual discounts to meet their obligations. Operational Risk: loss resulting from inadequate or failed processes, personnel, internal systems or external events. This definition includes technological risk and legal risk. Technological Risk groups all those potential losses from damage, interruption, disruption or failures resulting from use of or reliance on hardware, software, systems, applications, networks and any other distribution channel information, while the legal risk involves the potential loss by sanctions for noncompliance with laws and administrative or judicial decisions unfavorable issue appealed in relation to the Holding operations performed. Credit Risk
It is a risk that clients, issuers or counterparts do not fulfill their payment obligations therefore, proper management is essential to maintain the loan quality of the portfolio. The objectives of credit risk management at GFNorte are:
Comply with the Risk Profile defined by the Board of Directors.
Improve the quality, diversification and composition of the loan portfolio in order to optimize the risk-
performance (yield) ratio
Provide Executive Management with reliable, timely information to assist decision making regarding funding.
Provide the Business Areas with clear and sufficient tools to support funding placement and follow-up.
Create economic value for shareholders by efficient loan risk management.
Define and keep updated the regulatory framework for the credit risk management.
Comply with the information requirements that the authorities set forth regarding loan risk management.
Perform risk management in accordance with the best practices, implementing models, methodologies,
procedures and systems based on the main advances worldwide.
Measure institution’s vulnerability to extreme conditions and consider those results for decisions making.
Individual Credit Risk GNorte separates the loan portfolio into two large groups: consumer loans and company loans. The individual loan risk for consumer loans is identified, measured and controlled by a parametric system (scoring) that includes origination and behavior models for each of the consumer products: mortgage, car, payroll loans and credit cards.
Individual risk for companies is identified within the portfolio, measured and controlled by means of Objective Markets, the Criteria for Risk Acceptance, Early Alerts and Banorte’s Internal Risk Rating (CIR Banorte).
The Objective Markets, Criteria for Risk Acceptance and the Early Alerts are tools that, together with the Internal Risk Rating are part of GFNorte’s Loan Strategy and support the estimated level of credit risk.

VII. NOTES TO FINANCIAL STATEMENTS
Fourth Quarter 2014 85
The Target Markets are activities selected by region and economic activity – backed by economic research and loan behavior analysis – where Banorte is interested in placing loans.
The Risk Acceptance Criteria are parameters that describe the risk identified by the industry, which makes it possible to estimate the risk involved for the institution when granting a loan to customer on the bases of their economic activity. The types of risk contemplated in the Risk Acceptance Criteria are financial risk, operation risk, market risk, company life cycle, legal, regulatory, loan experience and management quality.
Early Alerts are a set of criteria based on borrower information and indicators and their conditions that were established as a mechanism for the timely prevention and identification of a probable deterioration in the loan portfolio, thereby enabling the institution to take prompt preventive actions to mitigate the credit risk.
Banorte’s CIR is a rating methodology for the borrower which assesses quantitative and qualitative criteria in order to determine the credit quality and it is applied to commercial loans equal to or greater than an amount in Mexican pesos equivalent to four million investment units on the qualification date.
Portfolio Credit Risk
GFNorte has designed a portfolio credit risk method that, besides contemplating international standards in identification, measurement, control and follow-up, has been adapted to work within the context of the Mexican Financial System.
This credit risk methodology makes it possible to know the current value of the portfolio loans of GFNorte, that is, the loan exposure, allowing surveillance of the risk concentration levels per risk qualification, geographical regions, economic activities, currency and type of product in order to know the portfolio’s profile and take action to direct it toward a diversification which will maximize profitability with the lowest risk.
Calculating loan exposure implies generating a cash flow of each one of the loans, of both capital and interest to discount it later. This exposure is sensible to changes in the market, thereby facilitating calculations under different economic scenarios.
The method, in addition to contemplating loan exposure, takes into consideration the probability of non-compliance, the recovery level associated to each client and the classification of the debtor based on the Merton model. The probability of non-compliance is the probability that the debtor will not meet his/her debt obligation with the institution according to the originally agreed terms and conditions. The probability of non-compliance is based on the transition matrixes that GFNorte calculates from the migration of the debtors through different risk qualification levels. The recovery ratio is the percentage of total exposure that is estimated to be recovered if the debtor fails to comply. The classification of the debtor, based on the Merton model, associates the debtor’s future behavior to loan and market factors on which his “credit health” depends, as determined by statistical techniques.
The results are risk measures such as the expected and unexpected loss at a one-year horizon. The expected loss is the credit portfolio's loss distribution average, which is used to measure the following year’s expected loss due to non-compliance or variations in debtors’ credit quality. This unexpected loss is an indicator of the loss that could be expected in extreme scenarios and is measured as the difference between the maximum loss given the distribution of losses, at a specific reliability level that in the case of the Banking Sector is 95%, and the expected loss.
The results obtained are used as a tool for better decision-making in granting loans and in the diversification of the portfolio, according to the Banks’ global strategy. The individual risk identification tools and the portfolio credit risk methodology are periodically checked and updated to allow the application of new techniques that may support or strengthen them.
As of December 31, 2014, Banco Mercantil del Norte's total portfolio was Ps 458.20 billion. The expected loss represents 1.9% and the unexpected loss is 3.2% with respect to the total portfolio. The average expected loss is 2.0% during the period between October-December 2014.
Regarding Casa de Bolsa Banorte-Ixe, the credit exposure of investments is Ps 99.41 billion and the expected loss represents 0.01% of the exposure. The average expected loss is 0.01% between October-December 2014. The total portfolio of Arrendadora and Factor, including pure leasing is Ps 21.24 billion. The expected loss represents 0.9% and the unexpected loss is 3.2% of the total portfolio. The prospective loss average represents 0.9% in the period of October-December 2014.

VII. NOTES TO FINANCIAL STATEMENTS
Fourth Quarter 2014 86
The total portfolio of Solida Administradora de Portafolios was Ps 3.93 billion. The expected loss of the portfolio represents 6.3% and the unexpected loss 9.3% both with respect to the total portfolio. The estimated loss average for the period of October-December 2014 was 6.2%. The total portfolio of Banorte- Ixe Tarjetas is Ps. 23.48 billion. The expected loss represents 10.8% and the unexpected loss 10.7% both with regard to the total portfolio. The estimated loss average represents 11.3% for the period of October-December 2014. Credit Risks of Financial Instruments
To identify, measure, supervise and control loan risks of financial instruments there are defined policies for Origination, Analysis, Authorization and Administration.
Origination policies define the types of financial instruments, as well as the method of evaluating the credit risk of the different types of originators / issuers and counterparts. Credit risk is assigned by means of a rating obtained with an internal methodology, through evaluations of external rating agencies or a combination of both. Maximum parameters of operation are also defined depending on the type of originator / issuer or counterpart, rating and type of operation.
Analysis policies include the type of information and the variables considered to analyze operations with financial instruments when they are presented for authorization to the corresponding committee, including information on the originator or counterpart, financial instrument, destination of the operation inside the group and market information.
The Loan Committee authorizes operation lines with financial instruments in accordance with Authorization policies. The request for authorization is submitted to the business sector and other sectors involved in the operation, with all the relevant information for analysis by the Committee who, if considered appropriate, issues its authorization.
Administration policies for transactions with financial instruments consider procedures of Admission, Instrumentation, Compliance with Regulations, Review, Consumption Monitoring, Administration of Lines and Responsibility by the areas and organisms involved in the operation with financial instruments.
On an individual level, the concentration of loan risk with financial instruments is managed on a continuous basis, establishing and monitoring maximum parameters of operation for each tally or originator depending on the qualification and type of operation. There are defined risk diversification policies for portfolios, for economic groups and internal groups. Additionally, the concentration of tally type or originator, size of financial institutions and the region in which it operates are monitored so that an appropriate diversification is obtained and undesired concentrations are avoided.
Credit risk is measured by means of the rating associated with the issuer, emission or tally, which has assigned a level of risk based on two fundamentals:
1) The probability of nonfulfillment of the originator, emission or counterpart, which is expressed as a percentage between 0% and 100% where the better the rating or lower rate differential vs. the instrument of a government bond equivalent the lower the probability of nonfulfillment and vice versa.
2) The severity of the loss that could be experienced with regard to the total of the operation in the event of nonfulfillment, is expressed as a percentage between 0% and 100% where the better the guarantees or credit structures, the smaller the severity of the loss and vice versa. To mitigating loan risk and to reduce the severity of losses in the event of non-fulfillment, the counterparts have signed ISDA contracts and agreements to net out, in which lines of credit and the use of collateral to mitigate loss in the event of non-fulfillment are implemented.
As of December 31, 2014, exposure to credit risk for Securities Investments of Banco Mercantil del Norte was Ps 243.07 billion, of which 98.7% is rated higher or similar to A-(mex) on a local scale, placing them in investment grade and the 3 main counterparties other than the Federal Government, State Governments and National Financial Institutions represent 8% of the Tier 1 Capital as of September 2014. Additionally, the exposure of investments with the same counterparty other than the Federal Government that represents a higher or similar concentration to 5% of the Net Capital as of September 2014 has similar rating to AAA(mex) and is comprised of (average considered term, amount in billions of pesos and rate): market and bond certificates from Pemex to 7 years and 9 months for Ps 14.66 to 3.5%; Inbursa market certificates for 2 years and 2 months for Ps 7.19 at 3.5%; deposit and market certificates and promissory notes from Banco Santander Mexico for 3 months for Ps 7.77 billion at 3.2%; and market certificates promissory notes from Banobras for 8 months for Ps 6.50 billion at 3.2%.

VII. NOTES TO FINANCIAL STATEMENTS
Fourth Quarter 2014 87
The exposure of Derivatives is Ps (5.40) billion, of which 96.0% has a rating higher or equal to A-(mex) on local level, placing them in investment grade and the 3 main counterparties other than then Federal or State Governments and National Financial Institutions represent 2% of the Tier 1 Capital of September 2014.
The exposure to credit risk for Securities Investments of Casa de Bolsa Banorte-Ixe was Ps 99.41 billion, of which 99.9% is rated higher or similar to A+(mex) on a local scale, placing them in investment grade and the 3 main counterparties other than the Federal Government, State Governments and National Financial Institutions represent 23% of the Capital as of September 2014. Additionally, the exposure of investments with the same counterparty other than the Federal Government that represents a higher or similar concentration to 5% of the Capital as of September 2014 has a higher or similar rating to A+(mex) and are comprised of (average considered term, amount in billion/ million of pesos and rate): market certificates of Pemex to 4 years and 9 months for Ps 2.68 billion at 3.4%;; Scotiabank market certificates for 1 year and 10 months for Ps 1.93 billion at 3.4%; market certificates of Banamex to 1 year and 9 months for Ps 1.82 billion at 3.4%; market certificates of Banco Inbursa to 11 months for Ps 1.78 billion at 3.4%; market certificates of HSBC to 3 years and 11 months for Ps 1.15 billion at 3.6%Banco del Bajío deposit certificates to 1 month for Ps 442 million at 3.6%; Deutsche Bank bonds to 8 years and 5 months for Ps 411 million at 9.9%. In the case of derivatives, there are no operations.
Arrendadora y Factor Banorte does not have investments in securities or derivatives. Exposure to risk of securities of Solida Administradora de Portafolios was Ps 95 million. The 100.0% is distributed in banking instruments. The Institution does not hold positions in derivative instruments. The exposure to credit risk for Securities Investments of Banorte-Ixe Tarjetas is Ps 410 million, of which 100% of the total are in financial instruments. Banorte-Ixe Tarjetas does not hold investments in derivatives. Risk Diversification
In December 2005, the CNBV issued “General Rules Applied to Credit Institutions” in relation to Risk Diversification.
These guidelines state that the institutions must carry out an analysis of their borrowers and/or loans to determine the amount of “Common Risk”; also, the institutions must have the necessary information and documentation to prove that the person or group of persons represent common risk in accordance with the assumptions established in those rules.
In compliance with the risk diversification rules in asset and liability operations, Banco Mercantil del Norte submits the following information (billion pesos):
Tier 1 as of September 30, 2014 67.84
I. Financings whose individual amounts represent more than 10% of basic equity
Loan Operations
Number of financings 2 Total amount of financings 16.61 % in relation to Tier 1 24%
Money Market Operations
Number of financings 0 Total amount of financings 0 % in relation to Tier 1 0%
Overnight Operations
Number of financings 0 Total amount of financings 0 % in relation to Tier 1 0%
II. Maximum amount of financing with the 3 largest debtors and common risk groups: 34.53

VII. NOTES TO FINANCIAL STATEMENTS
Fourth Quarter 2014 88
In compliance with the rules of diversification of risks in active and passive operations, the following information corresponds to Leasing and Factoring (Arrendadora y Factor Banorte) in billion pesos:
Equity as of September 30, 2014 3.70
I. Financings whose individual amounts represent more than 10% of equity
Loan Operations
Number of financings 5 Total amount of financings 3.85 % in relation to equity 104%
Money Market Operations
Number of financings 0 Total amount of financings 0 % in relation to equity 0%
Overnight Operations
Number of financings 0 Total amount of financings 0 % in relation to equity 0%
II. Maximum amount of financing with the 3 largest debtors and common risk groups: 5.12
In accordance with risk diversification regulations for asset and liability operations, is the following information corresponding to Solida Administradora de Portafolios (billion pesos):
Equity as of September 30, 2014 4.01 I. Financings whose individual amounts represent more than 10% of equity (on a group level):
Loan Operations
Number of financings 0
Total amount of financings 0 % in relation to equity 0%
Money Market Operations
Number of financings 0 Total amount of financings 0 % in relation to equity 0%
Overnight Operations
Number of financings 0 Total amount of financings 0 % in relation to equity 0%
II. Maximum amount of financing with the 3 largest debtors and common risk groups: 632

VII. NOTES TO FINANCIAL STATEMENTS
Fourth Quarter 2014 89
In accordance with risk diversification regulations for asset and liability operations, is the following information corresponding to Banorte-Ixe Tarjetas (Billion Pesos):
Equity as of September 30, 2014 4.58
I. Financings whose individual amounts represent more than 10% of basic equity (on a group level):
Loan Operations
Number of financings 0
Total amount of financings 0 % in relation to equity 0%
Money Market Operations
Number of financings 1 Total amount of financings 410 % in relation to equity 9%
Overnight Operations
Number of financings 1 Total amount of financings 56 % in relation to equity 1%
II. Maximum amount of financing with the 3 largest debtors and common risk groups: 4
Market Risk
The exposure to market risk is determined through the calculation of the Value at Risk (“VaR”). The meaning of the VaR under this method is the potential loss which could be generated in the valuation of the portfolios at a given date. This methodology is used both for the calculation of market risk and for the establishment and control of internal limits.
In order to calculate the Value at Risk (VaR), the Institution applies the nonparametric historical simulation method, considering for such purpose a 99% confidence level, using the 500 immediate historical scenarios, multiplying the result by a security factor that fluctuates between 3 and 4 depending on the annual Back Testing results calculated up to the previous quarter, also considering 10 days to break up the risk portfolio in question. These measures make it possible to insure considering unforeseen volatilities in the main risk factors that affect such portfolios.
Such methodology is applied to all financial instrument portfolios within and beyond the balance, including money market and treasury transactions, capital, foreign-exchange and derivatives held for trading and hedging purposes, which are exposed to variations in their value due to changes in the risk factors affecting their market valuation (domestic and foreign interest rates, exchange rates and indexes, among others).
The average VaR for the fourth quarter of 2014 for the portfolio is Ps 5.81 billion.
Million Pesos 4Q13 1Q14 2Q14 3Q14 4Q14
Total VaR* 4,616 5,149 5,389 6,261 5,811
Net Capital ** 69,619 72,938 73,493 75,791 77,996
VaR / Net Capital 6.63% 7.06% 7.33% 8.26% 7.45%
* Quarter Average of Banorte ** Net capital of the Banking Sector is the arithmetic sum of the net capitals of Banorte

VII. NOTES TO FINANCIAL STATEMENTS
Fourth Quarter 2014 90
Moreover, the average Value at Risk per risk factor of the portfolio of instruments described for the Banorte Bank, during the fourth quarter of 2014 is shown below:
Million pesos
Risk Factor VaR
Domestic interest rate 4,957
Foreign interest rate 1,316
IPC 83
Exchange rate 352
Total VaR - Bank 5,811
The VaR for each of the risk factors shown is determined by simulating 500 historical scenarios of the variables that make up each of such factors, maintaining constant the variables that affect the other risk factors mentioned above. Similarly, the consolidated Value at Risk for the Bank considers the correlations of all the risk factors that affect portfolio valuation. That is why the arithmetic sum of the Value at Risk per Risk Factor does not match.
Backtesting Analysis
In order to validate the daily VaR calculation measurement effectiveness, as a measure of market risk, the Backtesting analysis is updated weekly. This analysis makes it possible to compare the results estimated by VaR with the actual results.
Sensitivity Analysis and Extreme Conditions Test
To enrich the analysis and to obtain the desired impact that movements on risk factors may have on positions, sensitivity analyzes and tests under extreme conditions are periodically implemented. These analyzes prevent the Institution from negative situations that could arise in which extraordinary losses result from the valuation of financial instruments in position.
Casa de Bolsa Banorte Ixe
The average VaR of Casa de Bolsa Banorte Ixe 's portfolios for 4Q14 is Ps 224.34 million, which represents 9.53% of the Institution's Net Capital as of December 2014.
CASA DE BOLSA BANORTE - IXE
Average Closing
VaR
0.39 0.00
196.57 243.61
68.63 68.18
TOTAL 224.34 262.64
(41.25) (49.15)
Net Capital as of June 2014 2,353
9.53% 11.16%
Diversifications Effect
Treasury
Shares
4Q14VaR by Portfolio & Risk Factor
Total
Money Market
Million Pesos
VAR / Net Capital

VII. NOTES TO FINANCIAL STATEMENTS
Fourth Quarter 2014 91
Banorte Ixe Tarjetas
The average VaR of Ixe Tarjetas for 4Q14 is Ps 4.73 billion which represents +0.0% of the Institution’s Net Capital as of December 2014. This risk calculation is presented as informative, since the institution invested its resources in repo operations, promissory notes and checkbooks for a day, which are instruments that have no movements in its valuation by not having associated risk factors that presents variations for market conditions.
For their calculation, the Historical Simulation methodology was used with 501 horizon days, and as a policy, calculations were carried out with trust levels of 98% with a horizon time of 10 days, this value is multiplied by a security factor which fluctuates between 3 and 4, accordingly to annual Back Testing results.
Average Closing
0.00 0.00
Net Capital * 3,771
0.00% 0.00%
4Q14
VAR / Net Capital
BANORTE-IXE TARJETAS Total
VaR Balance.
Million Pesos
VaR Balance
*Previous net Capital as of closing December 2014
Liquidity Risk and Balance
In response to the Banking Sector’s need to measure global Liquidity Risk and to have consistent follow-up, the Banks us financial ratios, such as the Liquidity Ratios (Liquid Assets / Liquid Liabilities). Liquid Assets include availabilities, securities to negotiate and securities available for sale. Liquid Liabilities include demand deposits, demand interbank loans and short-term interbank loans. The liquidity ratio for Banorte at closing of 4Q14 is 105.1%, while the average for the quarter is 106.1%.
Million Pesos (at closing of the quarter) 4Q13 1Q14 2Q14 3Q14 4Q14
Liquid Assets 255,285 315,043 324,274 324,059 313,702
Liquid Liabilities 257,596 251,164 269,633 274,488 298,472
Liquidity Ratio 99.1% 125.4% 120.3% 118.1% 105.1%
Million Pesos (average) 4Q13 1Q14 2Q14 3Q14 4Q14
Liquid Assets 249,265 302,080 317,154 311,896 307,622
Liquid Liabilities 237,931 245,161 252,417 268,969 289,999
Liquidity Ratio 104.8% 123.2% 125.6% 116.1% 106.1%
For liquidity risk quantification and follow-up, the Banking Sector uses for the dollar portfolios, the criteria that the Bank of Mexico established for developing the Liquidity Coefficient, which makes it possible to evaluate the differentials between asset and liability flows in different periods of time. This promotes a healthier distribution of terms for these assets.
Moreover, to prevent the risk of concentrating terms and re-appreciation date for each of the Banks in the Banking Sector, a Gap Analysis is made to face the resources with sources of funding, detecting any concentration in advance. These analyses are made separately per currency (domestic, foreign, and udis).
The structural risk of the Balance is evaluated using the analysis of balance simulation, among others, which allows the evaluation of future static or dynamic behavior in the Balance Sheet. It analyzes sensitivity to movements in domestic, foreign and real rates obtaining the impact that they have on the Economic Value and on the Net Interest

VII. NOTES TO FINANCIAL STATEMENTS
Fourth Quarter 2014 92
Income. Likewise, tests are conducted under extreme conditions wherein the result of extreme changes is evaluated on rates, funding and exchange rates.
Projections are periodically compared with real data as a measure of evaluation of the effectiveness of the simulation model. These tests make it possible to evaluate the suppositions and methodology used, and if necessary, adjust them.
With the objective of strengthening follow-up of risk, early detection alarms have been determined, which allow the anticipation of problems and if necessary, put contingency plans into action.
The liquidity ratio vs. Net Capital of Casa de Bolsa Banorte Ixe as of December 31, 2014 is 101.88%.
USE
dic-14
1,099
2,398
2,353
101.88%Liquidity vs. Capital
CASA DE BOLSA BANORTE IXE, S.A. DE C.V.
Liquidity Risk
Million Pesos
Accumulated gap in 1 month (MXP + UDIS)
Liquid Assets
Net Capital
The liquidity ratio vs. Net Capital of Arrendadora y Factor Banorte as of December 31, 2014 is 0.58%.
USE
dic-14
(3,213.19)
(1,077.25)
21.62
3,722.11
Tier 1 Capital 3,722.11
0.58%
0.58%Liquidity vs. Tier 1 Capital
*Balance in Banks
ARRENDADORA Y FACTOR BANORTE
Liquidity Risk
Accumulated gap in 1 month (MXP)
Liquid Assets*
Net Capital
Million Pesos
Accumulated gap in 3 months (MXP)
Liquidity vs. Net Capital

VII. NOTES TO FINANCIAL STATEMENTS
Fourth Quarter 2014 93
The liquidity ratio vs. Net Capital of Solida Administradora de Portafolio as of December 31, 2014 is 4.13%
Sólida Administradora de Portafolios USE
dic-14
(4,031)
(8,702)
163
3,946
3,946
Liquidity vs. Net Capital 4.13%
4.13%
Liquid Assets*
Net Capital
Tier 1 Capital
Liquidity vs. Tier 1 Capital
*Balance in Banks
Liquidity Risk
Million Pesos
Accumulated gap in 1 month (MXP)
Accumulated gap in 3 months (MXP )
The liquidity ratio vs. Net Capital for Banorte- Ixe Tarjetas as of December 31, 2014 is 12.35%
USE
dic-14
2,727
2,787
466
3,771
3,771
Liquidity vs. Net Capital 12.35%
12.35%
Banorte Ixe Tarjetas
Liquidity Risk
Liquidity vs. Tier 1 Capital
*Balance in Banks
Million Pesos
Accumulated gap in 1 month (MXP)
Accumulated gap in 3 months (MXP)
Liquid Assets*
Net Capital
Tier 1 Capital
Operational Risk
GFNorte has a formal Operational Risk department pertaining to the “Deputy Managing Director of Financial and
Operational Risk’, same that reports directly to the Managing Director of Risk Management.
Operational Risk is defined as the potential loss due to failures or deficiencies in the internal controls, errors in operation processing and storing or in data transmitting, as well as to adverse administrative and judicial rulings, fraud or theft (this definition includes Technological and Legal risk).
The objectives of the Operational Risk Management are: a) To allow and support the organization to reach its institutional objectives through the prevention and management of operational risks; b) To insure that the existing operational risks and the required controls are duly identified, assessed and in line with the risk strategy established by the organization; and c) To insure that the operational risks are duly quantified in order to make the proper capital allocation per operational risk.
Pillars of Operational Risk Management

VII. NOTES TO FINANCIAL STATEMENTS
Fourth Quarter 2014 94
I. Policies, Objectives and Guidelines
As part of the institutional regulations, there are documented policies, objectives, guidelines, methodologies and responsible areas in Operating Risk management.
The Operating Risk Directorship maintains close communication and coordination with the Regulatory Comptrollership in order to facilitate effective Internal Control in which the proper procedures and controls are established that will mitigate Operating Risk in the processes, and provide follow up through the Internal Audit Department.
The Regulatory Comptrollership, as part of the Internal Control System, carries out the following activities to mitigate risk: a) Internal control validations; b) Institutional regulations management and control; c) Monitoring of operating processes’ internal control by means of control indicators reports, that are reported by the process comptrollers in the various areas; d) Money Laundering Prevention process management; e) Control and follow up of the regulatory provisions; and f) Analysis and assessment of the operating processes and projects with the participation of the responsible directors of each process in order to insure adequate internal control.
II. Quantitative and Qualitative Measuring Tools
Operating Losses Database
To record operating loss events, has a system that enables the central information supplier areas to directly record such events online, which are classified by Type of Event in accordance with the following categories:
This historical Database provides the statistics of the operating events in which the institution has incurred so as to be able to determine their trends, frequencies, impact and distribution. Moreover, the Database will make it possible in the future to have enough information to calculate the capital requirements per Advances Models.
Types of Events Description
Internal Fraud Losses derived from a type of action intended to defraud, unlawfully take goods or sidestep regulations, laws or company policies (excluding diversity/discrimination events) in which at least one company party is involved.
External Fraud Losses derived from a type of action intended to defraud, unlawfully take goods or sidestep the laws, caused by a third party.
Labor Relations and Safety in the Workplace
Losses caused by acts that are incompatible with the legislation or labor agreements regarding hygiene or safety, the payment of personal damage claims, or cases associated with diversity/discrimination.
Customers, Products & Business Practices
Losses caused by involuntary noncompliance or negligence of a professional obligation to specific customers (including fiduciary and adjustment requirements), or due to the nature or design of a product.
Natural Disasters and Other Events
Losses caused by damage or harm to material assets as a consequence of natural disasters or other events.
Incidences in the Business and Systems Failures
Losses caused by incidences in the business and systems failures
Process Execution, Delivery and Management
Losses caused by errors in operations processing or management, as well as the relations with commercial counterparties and providers.

VII. NOTES TO FINANCIAL STATEMENTS
Fourth Quarter 2014 95
Legal and Fiscal Contingencies Database
For the recording and follow-up of legal, administrative and tax issues that may arise from adverse unappealable ruling, an internal system called “Legal Risk Issues Monitoring System” (SMARL) was developed. This system enables the central data supplying areas to record such events directly and on-line, which are then classified by company, sector and legal issue, among others.
As part of GFNorte’s legal risk management, legal and fiscal contingencies are estimated by the attorneys that process the issues based on an internal methodology. This makes it possible to create the necessary book reserve to face such estimated contingencies.
Risk Management Model
GFNorte has defined objectives, which are achieved through different plans, programs and projects. Compliance with such objectives may be adversely affected due to operating risks, for which reason a methodology must be in place to manage them within the organization. Consequently, operating risk management is now an institutional policy defined and supported by senior management.
To perform Operating Risk Management, each of the operating risks involved in the processes must be identified in order to analyze them. In this regard, the risks identified by the Regulatory Comptrollership are processed in order to eliminate or mitigate them (seeking to reduce their severity or frequency) by defining tolerance levels, as the case may be. At present, work is being done on developing a new Institution Operating Risk Management Model and the technological tools needed to implement it.
III. Required Capital Calculation
In accordance with the Capitalization for Operational Risk Regulations in effect, the institution has adopted the Basic Model, which is calculated and reported periodically to the authorities.
IV. Information and Reporting
The information generated by the Database and the Management Model is processes periodically to report to the Risk Policies Committee and the Board of Directors regarding the main operating events that were detected, the trends, identified risks and their mitigating strategies. Reporting is also done on the status of the main Operating Risk mitigation initiatives implemented by the various areas of the organization.
Technology risk
Technological Risk is defined as all potential losses from damage, interruption, alteration or failures derived from the use of or dependence on hardware, software, systems, applications, networks and any other information distribution channel in the rendering of banking services to the customers. This risk forms an inherent part of Operating Risk, which is why its management is handled collectively throughout the entire organization.
To address the Operating Risk associated with information integrity, and “Integrity Committee” has been created. Its objectives are to align security and information control efforts under a prevention focus, to define new strategies, policies, processes or procedures and to provide solutions to information security issues that affect or may affect the Institutional patrimony.
The functions established by the CNBV or Technology Risk Management are performed by the Institution under institution regulatory and Integrity Committee guidelines.
To address the Operating Risk caused by high impact external events, GFNorte has a Business Continuity Plan (BCP) and Disaster Recovery Plan (DRP) based on a same-time data replication system at an alternate computer site. All the above cover the backup and recovery of the Institution’s critical applications in the event or any relevant operating contingency.

VII. NOTES TO FINANCIAL STATEMENTS
Fourth Quarter 2014 96
Legal risk
Legal Risk is defined as the potential loss from failure to comply with the applicable legal and administrative provisions, the issuance of indisputable unfavorable court rulings and the application of penalties regarding the operations that the institution performs.
The Legal Risk must be measured as an inherent part of Operating Risk in order to understand and estimate its impact. Therefore, those legal issues which result in actual operating losses of the SMARL system are later recorded in the SCERO a database of operational events.
Based on the statistics of the current legal issues and real loss events, the Institution can identify specific legal or operating risks, which are analyzed in order to eliminate or mitigate them in an attempt to reduce or limit their future occurrence or impact.
Internal Control
The companies comprising GF Banorte have an Internal Control System (SCI) that has been structured according to the guidelines set forth by their Board of Directors, which establishes a general internal control framework, as well as the environment in which it must operate in order to provide reasonable security regarding the effectiveness and efficiency objectives of the operations, reliability on financial statements and compliance of regulation and legal framework. The SCI's mission is to help running an adequate internal control in the operations and in data generating and recording. The system is made up of various elements:
A. The Board of Directors with the support of the Advisory Board, Management Committee, Risk Policies Committee (CPR), Audit and Corporate Practices Committee (CAPS) and Human Resources Committee.
B. The CEO and the departments which support him: Unit Risk Management (UAIR), Legal Department and the Comptroller, responsible for ensuring that adequate control levels, operational risks and compliance with regulation are maintained.
C. Internal Audit, External Audit and the Commissary (The Commissary applies only to GFNorte subsidiaries) as additional support structures to check how the Internal Control System functions and provide reasonable assurance regarding the reliability of the generated data. The Internal Audit Department reports to the Audit and Corporate Practices Committee (CAPS) and maintains full independence from the administrative areas.
D. The Executive Group as main responsible persons for SCI assurance according to the functions and responsibilities assigned to them. In addition to promoting the enforcement of the regulations established for the Institution and the strategies set forth by the GFNorte's CEO.
E. Documents that establish the general control criteria that should be followed in the operation and reporting of transactions; in optimizing human, material and technological resources; in the use, security, timeliness and reliability of the information; and in the due compliance with the external and internal regulations. The Code of Conduct that regulates the behavior that each Board member, officer or employee of the Group should assume while performing their activities stress out.
F. Policy and procedure manuals that regulate documentation, recording and liquidation of operations that the Institution carries out and establish the control points that should be observed, assuring the separation of functions, clear assigning of responsibilities, safekeeping of information and prevention of unlawful acts.
During the fourth quarter of 2014, activities related to strengthening control, risk evaluation and management, establishment and monitoring of controls, and assurance of quality information continued to be developed; highlighting the following:
A. The various Corporate Governance Committees have had the required financial, economic, accounting and/or legal information for proper decision-making.
B. The policies and procedure manuals have been updated as per changes in external regulations, new products, and changes in the Institution's processes or improvements to internal controls.Corporate Governance documents related to internal control were reviewed and updated and were subject trough the CAPS to the Board of Directors for authorization. Additionally, there has been continuous follow-up of the improvement actions regarding the observations made by the different members of the SCI
C. The Supervisory Authorities’ requirements have been addressed and the information required by the external regulations has been submitted.

VII. NOTES TO FINANCIAL STATEMENTS
Fourth Quarter 2014 97
D. Through Process and Management Controllers, various business and support processes that make up the operation in GFNorte are monitored, to report periodically on compliance and identifying where areas of opportunity for timely remediation.
E. During the quarter, and according to the work plan developed at the beginning of the year, various activities in terms of accounting internal control were carried out.
F. Requests regarding internal control subjects from diverse internal departments were handled, to the development of new institutional projects, as well as those derived from the Financial Reform.
FINANCIAL SITUATION AND LIQUIDITY
Treasury Policy
GFNorte’s Treasury Department is the central unit in charge of balancing GFNorte's resource needs, monitoring and managing the regulatory levels, eliminating the rate risk of fixed-rate placement operations by using coverage and implementing arbitrage strategies.
The main cash currencies and investment in securities are in Mexican pesos and U.S. dollars.
Internal and External Liquidity Sources
The internal liquidity sources, in local as well as foreign currency, come from the various deposit products that the institution offers its customers: checking accounts and term deposits. Regarding external sources of liquidity, it has diverse mechanisms to access the debt and capital markets. The Institution obtains resources through the issuance of debt securities, loans from other institutions - including the Central Bank and international organisms -, as well as from the issuance of subordinated debt. Also considered is the liquidity that the Institution obtains through its proprietary repos’ securities that qualify for this type of transactions. It also has the alternative of obtaining resources through the issuance of shares representing equity. Currently, the Institution has diverse sources of liquidity. Deposits, including interest bearing and non-interest bearing demand and time deposits, are the bank’s main source of liquidity. Negotiable and short term instruments, such as government securities and deposits in the Central Bank and other banks, are liquid assets that generate interest. Liquid assets also include deposits in foreign banks, which are denominated mainly in US dollars. Detailed information related to liquidity sources is reported in different headings of the GFNorte's Balance Sheet in this report
Dividend Policy
During the April 30, 2003 session, the Board of Directors approved a dividend payment policy in which it will propose to the General Ordinary Stockholders’ Meeting a dividend payment consisting of at least 15% of the Partnership’s net recurring profit, providing that there is no legal impediment and that market conditions and the Partnership’s financial situation allow it.
On October 17, 2011, the Ordinary General Shareholders’ Meeting approved to modify the Dividend Policy, for the purpose of aligning dividend payments to the Financial Groups’ business performance, so as of this year, dividend payments will be as follows:
i. 16% of recurring net income in the event that profit growth is between 0% and 10% during the year.
ii. 18% of recurring net income in the event that profit growth is between 11% and 20% during the year.
iii. 20% of recurring net income in the event that profit growth is greater than 21%.

VII. NOTES TO FINANCIAL STATEMENTS
Fourth Quarter 2014 98
Related Parties Loans
According to Article 73 of the Law of Credit Institutions, loans granted to related parties of credit institutions cannot surpass the established limit of 35% of the basic part of the net capital.
In GFNorte as of December 31 and September 30, 2014, the amount of loans granted to third parties is as follows (million pesos):
Institution granting the loan
Dec-2014 % of the limit Sep-2014 % of the limit
Banorte Ps 3.69 15.5% Ps 3.99 17.4%
Ps 3.69
Ps 3.99
The loans granted are under the 100% limit set forth by the LIC. Banorte. As of December 31, 2014, the total loans granted to related parties, under Article 73 of the Law of Credit Institutions,
was Ps 3.69 billion (including Ps 450 million in ― Credit Letters “CC”, which are registered in memorandum accounts), representing 0.8% of Banorte's total loan portfolio (excluding the balance of CC and Support to Federal Government Housing Debtors). Of the total related loans, Ps 2.39 billion were loans granted to clients linked to members of the Board of Directors; Ps 924 million were granted to clients linked to shareholders and Ps 370 million were linked to companies related to GFNorte. In accordance with Article 73 of the Law of Credit Institutions, the balance of GFNorte‘s loan portfolio for individuals and corporations at closing of December 2014 was 15.5% of the limit set by Banco de Mexico which is equivalent to 35% of the basic part of net capital. Related parties loans have been granted with market conditions and rated in accordance with the policies, procedures and rating systems applicable to the rest of GFNorte‘s loan portfolio based on the general dispositions applicable to credit institutions with regard to rating of loan portfolios issued by CNBV and the internal methodology authorized by CNBV, to rate borrowers in the commercial loan portfolio. 99% of the related party loans are rated in Category "A", and the majority of these loans were classified as commercial loans. As of September 30, 2014, the total loans granted to related parties, under Article 73 of the Law of Credit Institutions,
was Ps 3.99 billion (including Ps 443 million in ― Credit Letters “CC”, which are registered in memorandum accounts), representing 0.9% of Banorte's total loan portfolio (excluding the balance of CC and Support to Federal Government Housing Debtors). Of the total related loans, Ps 2.71 billion were loans granted to clients linked to members of the Board of Directors; Ps 936 million were granted to clients linked to shareholders and Ps 350 million were linked to companies related to GFNorte. In accordance with Article 73 of the Law of Credit Institutions, the balance of GFNorte‘s loan portfolio for individuals and corporations at closing of September 2014 was 17.4% of the limit set by Banco de Mexico which is equivalent to 35% of the basic part of net capital. Related parties loans have been granted with market conditions and rated in accordance with the policies, procedures and rating systems applicable to the rest of GFNorte‘s loan portfolio based on the general dispositions applicable to credit institutions with regard to rating of loan portfolios issued by CNBV and the internal methodology authorized by CNBV, to rate borrowers in the commercial loan portfolio. 99% of the related party loans were rated in Category "A", and the majority of these loans were classified as commercial loans.

VII. NOTES TO FINANCIAL STATEMENTS
Fourth Quarter 2014 99
Loan or tax liabilities
The tax credits listed below are currently in litigation:
Al 31 de diciembre de 2014
BANORTE $32
IMSS fees, various occupations 6
INFONAVIT fees, various occupations 26
AFORE BANORTE $2
Loan # 4429309391 Payroll Tax of the state of Coahuila 2
SEGUROS BANORTE GENERALI, S. A. DE C. V. $15
Fiscal year 2003 (document 900-06-01-2009-9518) 15
CASA DE BOLSA $35
Fiscal year 2007 (document 900 06 05-2010-03968) 35
IXE BANCO $13
Income Tax-Profit Sharing for the 2005 fiscal year – inflation adjustement 13
Million pesos
People in Charge
The undersigned represent under oath that, within the scope of our respective functions, we have drawn up the information relative to Grupo Financiero Banorte contained in this report, which, to the best of our knowledge, reasonably reflects its situation. Furthermore, we express that we are no aware that relevant information has been omitted or falsified in this quarterly report or that it contains information that may lead to errors to investors. Act. Jose Marcos Ramirez Miguel
Chief Executive Officer of Grupo Financiero Banorte, S. A. B. de C. V.
Eng. Rafael Arana de la Garza
Chief Operating Officer & Chief Financial Officer
Lic. Isaias Velazquez Gonzalez
Managing Director of Internal Audit
Lic. Jorge Eduardo Vega Camargo
Deputy Managing Director of Comptrollership
C.P. Mayra Nelly Lopez Lopez
Executive Director of Accounting
Basis for submitting and presenting Financial Statements
Grupo Financiero Banorte (GFNorte). Issues consolidated financial statements with its Subsidiaries in accordance
with the General Provisions Applicable to Financial Information of the Regulating Agencies of Financial Groups Subject to Supervision by the National Banking and Securities Commission (CNBV) published in the Official Gazette of the Federation on January 31, 2011 and modified on July, 18, 2011 and December 1, 2014. As a result of the norm NIF B10 “Inflation Effects” taking effect and according to INIF 9 “Presentation of comparable financial statements as a consequence of NIF B-10 taking effect”, which mentions that the economic environment is non-inflationary when accumulated inflation of the last three years is less than 26%. Under this context, it is not necessary to re-express financial statements as of January 2008.
VII. NOTES TO FINANCIAL STATEMENTS
Fourth Quarter 2014 100
Banking Sector (Banorte). Issues consolidated financial statements with its subsidiaries in conformity with the
General Provisions for Financial Information of Credit Institutions in effect as published on December 2, 2005 and modified on March 3 and 28, September 15, December 6 and 8, 2006, January 12, March 23, April 26, November 5, 2007, March 10, August 22, September 19, October 14, December 4, 2008, April 27, May 28, June 11 , August 12, October 16, November 9, 2009, December 1 and 24, 2009, January 27, February 10, April 9 and 15, May 17, June 28, July 29, August 19, September 9 and 28, October 25, November 26, December 20, 2010, January 24 and 27, March 4, April 21, July 5, August 3 and 12, September 30, October 5 and 27, December 28, 2011, June 19, July 5, October 23, November 28, December 13, 2012, January 31, April 16, May 3, June 3 and 24, July 12, October 2, December 24, 2013, January 7 and 31, March 26, May 12 and 19, July 3 and 31, September 24, October 30, December 8, 2014. As a result of the norm NIF B10 “Inflation Effects” taking effect and according to INIF 9 “Presentation of comparable financial statements as a consequence of NIF B-10 taking effect”, which mentions that the economic environment is non-inflationary when accumulated inflation for the last three years is less than 26%. Under this context, it is not necessary to re-express financial statements as of January 2008. GFNorte and Banorte. The financial information contained in this document has been developed according to the
regulations issued by the CNBV for the regulating agency and the financial entities that make up the Financial Group and to Norms of Financial Information (Normas de Información Financiera NIF), issued by the Mexican Council for the Investigation and Development of Norms of Financial Information, A.C. (CINIF). The regulations of the CNBV and the NIF mentioned above differ given the specialized operations of the Credit Institutions. Moreover, there is a difference in the generally accepted accounting principles of the United States (US GAAP) and the regulations and principles established by the American authorities for this type of financial entities. In order to present the information contained herein in an international format, the classification format and the presentation of certain financial information differ from the format used for the financial information published in Mexico. The information contained in this document is based on the non-audited financial information of each of the entities to which it refers.