Embed Size (px)
Citation preview
Grunmmn Research Department Report RE-311
DETERM[_NATIO N O[ THE COEFFICIENT OF FRICTION
BETWEEN METALS<AND NONMETALS IN ULTRAHIGH VACUUM
by
G. Mohr
and
L. L. Karafiath
Geo-Astrophys ic s Section
December 1967
Final Report
on
Contract No. NAS 8-5415
Project 0284
Prepared for
National Aeronautics and Space Administration
George C. Marshall Space Flight Center
Huntsville, Alabama
Approved by: f"/_;_._. _" _< ._
Charles E. Mack, Jr.
Director of Research
https://ntrs.nasa.gov/search.jsp?R=19680005110 2018-08-22T23:19:36+00:00Z

FOREWORD
The work reported herein was performed in the Geo-Astrophysics
Section of the Research Department with J. D. Halajian (Advanced
Systems) principal investigator, G. Mohr in charge of the experi-
mental work, and L. L. Karafiath participating in the soil mechanics
evaluation of the experiments. The instrumentation was designed
by F. J. Meinhart (CorpOrate Instrumentation and Data Processing
Services). Computer analysis of the data was performed in the
Data Processing Department under the direction of H. Turner.
The ultrahigh vacuum chamber and the friction testing ap-
paratus were manufactured in the machine shop of the Research De-
partment; commercially available components were used where possi-
ble. S. Mole of the Welding Department performed the difficult
task of welding the vacuum chamber and other components of the
system. G. Homfeld assisted in the operation of the vacuum sys-
tem and in the performance of tests.
ii

" ABSTRACT
This report is inpartial fulfillment of the reporting re-
quirements of Contract NAS 8-5415, the "Determination of the
Coefficient of Frictioh Between Metals and Nonmetals in Ultra-
high Vacuum, 'r and is the final report for Modification 3 of that
contract. During the contract period, 20 friction tests at pres-
sures below 2 x 10 -9 torr were performed; in 19 of the vacuum
tests, the pressures were in the i0 -I0 torr range or lower. In
addition to these test_i_in vacuum, supplemental tests under atmo-
spheric conditions were conducted for the purpose of comparison.
The test temperature was the same in all casesj normal room tem-
perature between 20 and 25°C, with a relative humidity con-
trolled at about 35 percent. Friction between basalt and quartz
powders (in two particle size range, 250-500 microns and 38-62
microns) and metal disks (steel 1020 and aluminum 7075) were mea-
sured under these two conditions.
Computer programslbased on the least squares method were used
to obtain best fitting_ifirst and third order curves. The digital-
ized data as well as the best fit curves were then plotted on a
greatly magnified scale. Typical example of plots so prepared are
presented. Illustrations and photographs showing the friction
measuring arrangement, the vacuum system, strain gauge calibration
procedures, outgassing rates of basalt and quartz powders, pres-
sure evolution curves_ and other pertinent documentation are also
included in the appropriate sections of this report.
The observed values of the coefficient of friction followed
the same pattern in aZl of the tests. From an initially high
value, designated _i, -the coefficient of friction declined rapidly
with time until it reached a nearly constant value of kinetic fric-
tion, designated Pc. The initial value _i was only slightly
higher than _c, for the tests performed in air, but in most tests
performed in ultrahigh vacuum, _i was significantly higher than
_c" If for each set of tests, the ratio
_i (vacuum)/_i (air)
is formed3 it is found to be greater than I in all cases except
for steel 1020 sliding on fine quartz powders. For almost all
tests this ratio is much higher than the corresponding ratio
Pc (vacuum)/_c (air) .
iii
Except for two cases, this latter ratio shows the same generaltendency, but in a less pronounced manner. Ratios higher than1.5 are more typical for _i (vacuum)/_i (air); ratios in therange of 1.1-1.2 are typical for _c (vacuum)/_c (air).
These experiments_have proven conclusively that very lowpressures affect the frictional behavior of dissimilar materials.For most combinations of the materials tested, it has been es-tablished that the coefficient of friction between metals andgranular soils increases considerably under the influence ofvery high vacua. The _iations in the measured values of thecoefficients of friction indicate a dependency on surface con-ditions, the forces applied, and the ratio of the metal-soilfriction to the internal friction of the soils.
k
i/"
iv
Section
" ,TABLE OF CONTENTS
I ,
II.
III.
Test Equipment Design
A.
B.
C.
ooeoeooeeoooeeeooeeoooeoooee'eo
Testing Apparatus ..........................
Instrlimentation ............................
Vacuum System ..............................
Testing Procedures ..................................
A. Preparation of Soil Samples ................
B. Preparation of Metal Disks
C.
DQ
.Qeoe.oeooet.o,oe
Vacuum History of Tests ....................
Performance of Test ........................
IV. Evaluation of Records ...............................
A. Processing of Raw Data .....................
B. Computation of the Coefficient of Friction .
Vo Evaluation of_Test Results ..........................
General
Initial Friction!
Kinetic Friction
Miscellaneous Observations
: eeeiloooigeleeomiJeIOOJIeOOJJelIJl°lJiI!
eeeeeeeoooeoeaooeeooooeoooeo°m°
e,oeeeoeo.61eeo_oemeeooeeleoo°°
eoeeeol_eeeoQooeeeooo
VI. Conclusions and Recommendations .....................
i
3
3
4
5
6
6
7
8
12
14
14
16
17
17
18
23
27
28
V
Section
VII. References
Appendices :
A.
B.
0 °e° °O0ooOe ooooe oo0o0o ooO00oOOO000ooOoO oO o
Preparation of Granular _terial ................
Outgassing Rates of Mineral Powders .............
30
51
55
vl
LIST OF ILLUSTRATIONS
FiEure
i
2
3
4
5
6
7
8
9
i0
ii
12
13
14
15
16
17
Friction Measuring Apparatus ........................
Position of Metal Disk Holder and
Mineral Cup Seen through Viewing Port ...............
Vacuum Chamber with External Drive
Arrangement for Rotating Disk .......................
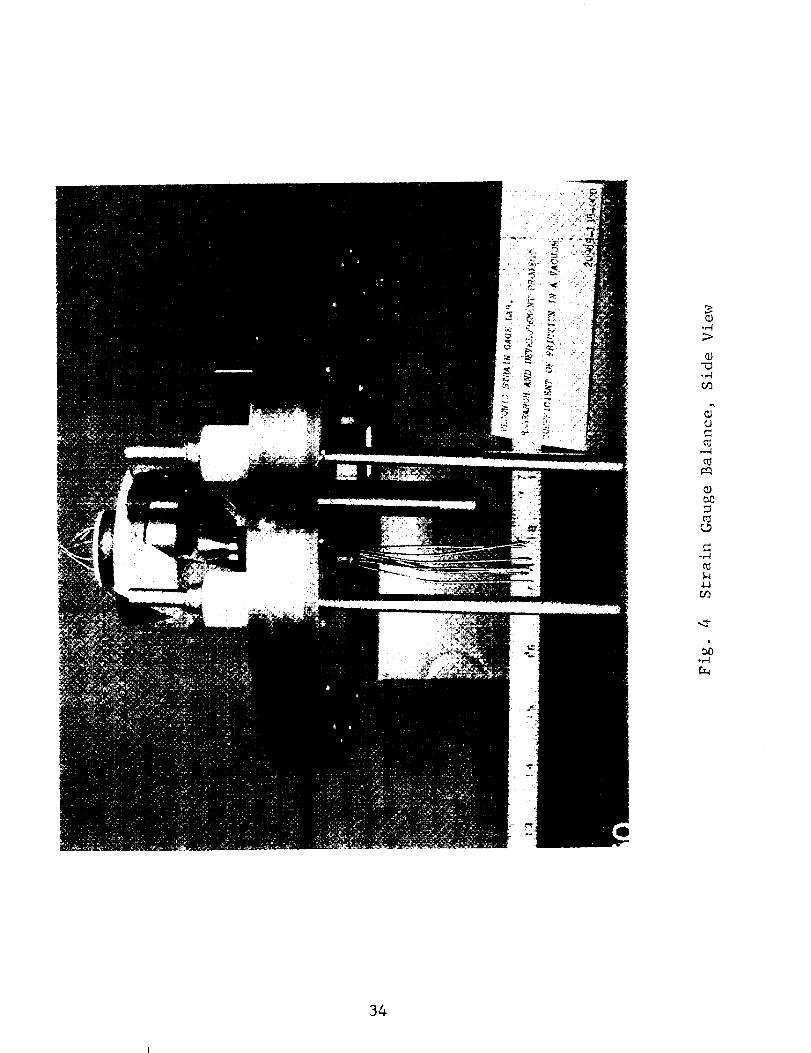
Strain GaugeBalance, Side View .....................
Strain Gaugel Balance, Bottom View ...................
Ultrahigh Vacuum System .............................
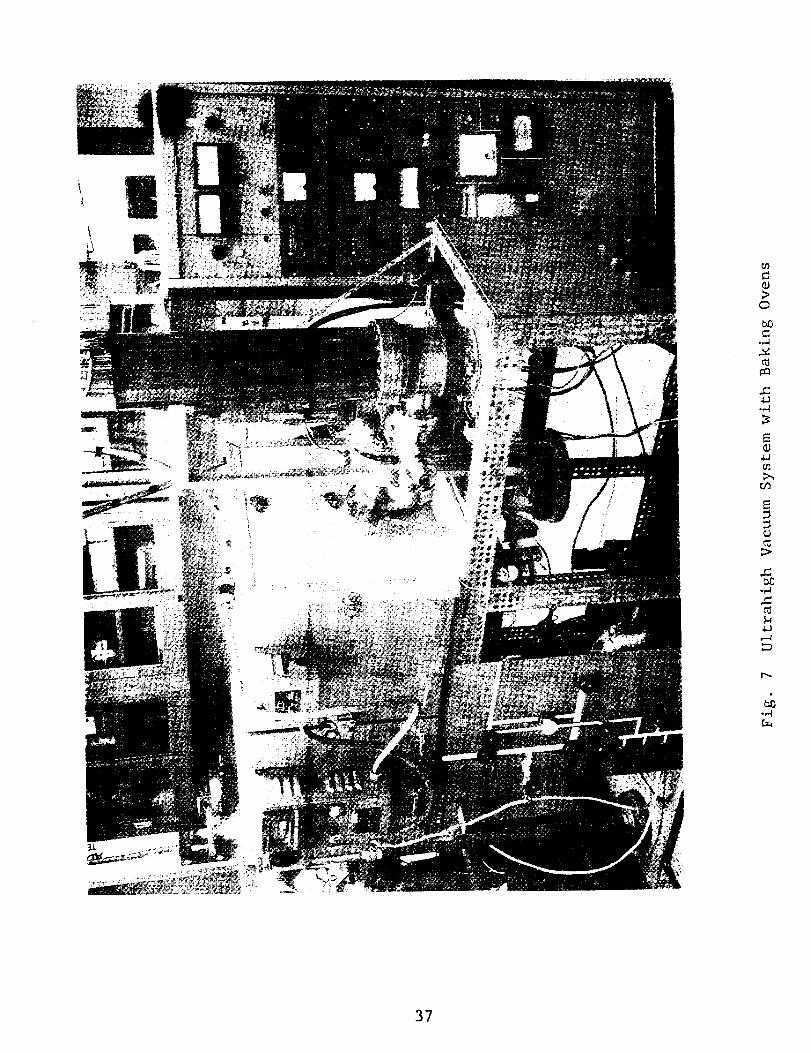
Ultrahigh Vacuum System with Baking Ovens ...........
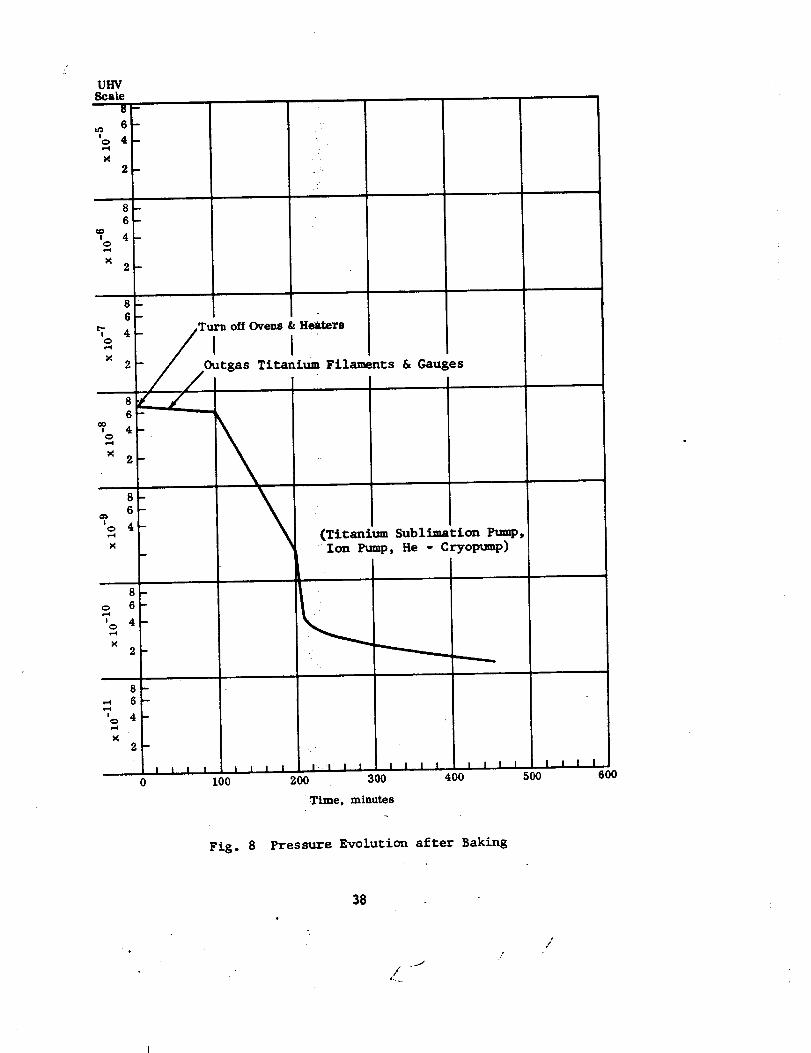
Pressure Evolution after Baking .....................
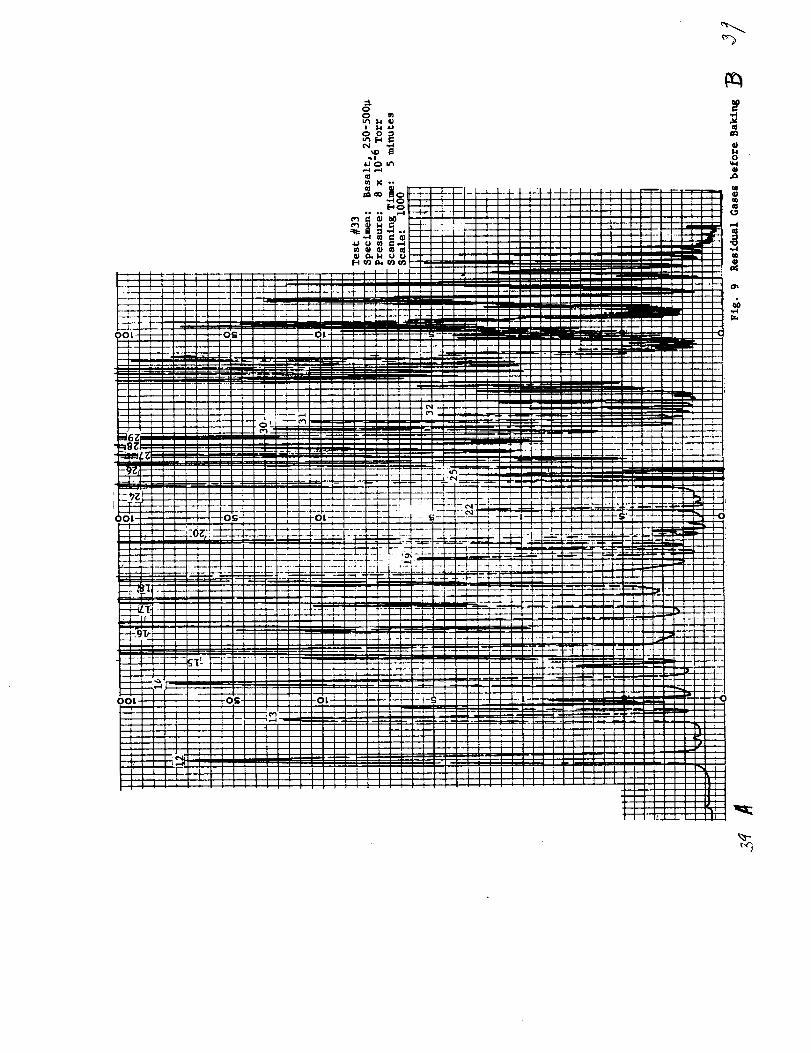
Residual Gases before Baking ........................
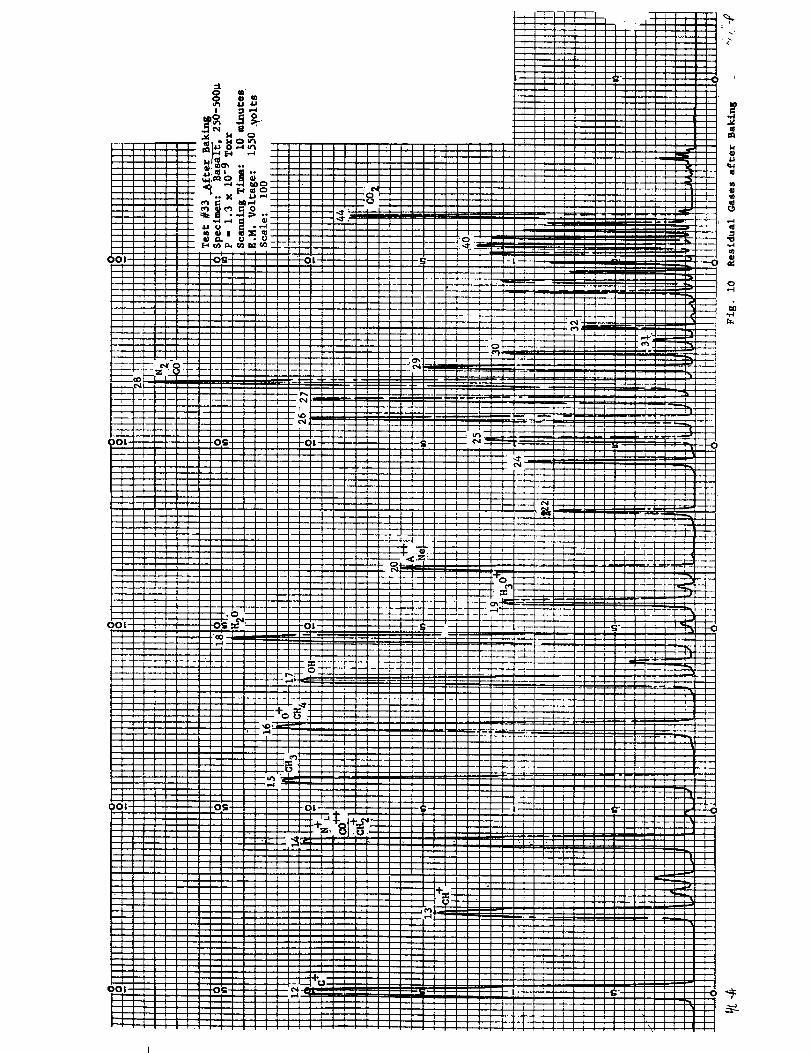
Residual Gases after Baking .........................
Recordings of Pressure Evolution
During Test #35 .....................................
Recordings of Pressure Evolution
During Test #37 .....................................
Adhesion of Mineral Powder on Metal Disk ............
.Appearance of Powder Specimen
after Test (Typical of Vacuum Tests)
Appearance of Powder Specimen
after Test (Typical of Air Tests) ...................
First Order Curve for Test #3 .......................
First Order Curve for Test #7 .......................
32
33
34
35 _
36
37
38
39
40
41
42
43
44
45
46
47
vii
Figure
18
19
20
Recording of Evolution of Friction
During Test #28 .....................................
Recording of Evolution of Friction
During Test #35 .....................................
Recording of Evolution of Friction
During Test #25 .....................................
48
49
50
viii
LIST OF TABLES
Table
i
3
4
5
6
Coefficients of Friction Between Rotating
Metal Disk and Mineral Powder .......................
Coefficients of Friction Between Rotating Disk
and Mineral Powder with Added Variables., oeeeQo.ooooeo
Effect of Type of Metal on the Initial Friction .....
Effect of Type of Soil on the Initial Friction ......
Effect of Particle Size on the Initial Friction .....
Effect of Ultrahigh Vacuum on the
Kinetic Friction ....................................
Outgassing (ROom Temperature) .......................
Outgassing (_ 350°C) ................................
ea_m
I0
ii
19
20
21
24
56
57
ix

I. INTRODUCTION
This report discusses the analytical and experimental in-
vestigations used to determine tbe coefficient of friction be-
tween various metal surfaces and various, granular soil-like
nonmetals in an ultrahigh vacuum environment. These investiga-
tions, which have been conducted at Grumman under the sponsorship
of the Marshall Flight Center, NASA Contract 5415, since 1964, are
aimed at the better Understanding of frictional phenomena in
ultrahigh vacuum. They further serve the purpose of obtaining
quantitative values for the coefficient of friction between metals
and soils needed for the design of lunar landing and roving vehicles.
Specifically, the work includes, according to contract stipu-
lations:
A. A series of measurements made in accordance with
the following conditions.
i. The!vacuum shall be 10 -9 torr or greater.
Vacuum shall be the only variable required
during the tests. Tests shall include 20
separate pumpdowns. The samples shall be at
ambient temperature when the data are taken.
2. The nonmetailic samples will consist of
basalt and quartz with particle sizes of
0.2.5 to 0.50 _. and 0.038 to 0.062 mm.
Each test will be made with a fresh sample.
3. The i_etal sliders will be made of aluminum
7075 and steel AISi 1020; a fresh slider
will be used for each test.
4. The load on the test mechanism shall be kept
constant during a set of tests in air and
ultrahigh vacuum.
= There will be at least two tests on eachJ °
nonmetallic sample size with the same type
metal slider.
B o For each vacuum test, there will be a correspond-
ing air test to allow a determination of the ef-
fect of:vacuum on the coefficient of friction.
i
i
C. Following a series of air/vacuum tests performed
to determine the influence of vacuum alone on
the measurements, other variables such as tempera-
ture or load may be introduced.
The granular materials, basalt and quartz, and the specific
particle sizes had been chosen because of their widespread use in
lunar surface simulation studies. The choice of the materials for
the metal disks was motivated by their importance for engineering
applications in the devdlopment of space vehicles. The specimens
were prepared so that t_ey would be compatible with ultrahigh
vacuum techniques. No effort was made to produce atomically clean
surfaces by electron bo_ardment, ion sputtering or similar
methods. Outgassing ofiithe vacuum system, including the speci-
mensj was always achieved with normal baking temperatures, which
never exceeded 210°C at _ the chamber or 400°C at the pumping _
section of the system. In order to assure the highest possible
vacuumj a new test fixture and instrumentation, made of materials
and components that are compatible with the most stringent re-
quirements of ultrahigh vacuum technology, had to be designed and
constructed for this latest phase of this program. These will be
described in detail in Section II.
During the first 16 tests, exposure of the specimens to very
low pressures was relatively brief (see Section II-C). It was,
therefore, of importance to evaluate the influence of mmch longer
periods of vacuum exposure on the coefficient of friction. Con-
sequently, during two of the tests stipulated under part C of the
contract, as noted above, the specimens were exposed to pressures
below I x 10 -9 torr for a period of ten days. In addition, at
the end of the eighth day, the metal disk was lowered onto the
powder and the load app!ied. The setup then remained in this con-
dition until the coefficient of friction was measured at the end
of the tenth day. In the remaining two tests, the changed varia-
bles were load and speed of rotation, respectively.
2
II. TEST EQUIPMENT DESIGN
A. Testing Apparatus
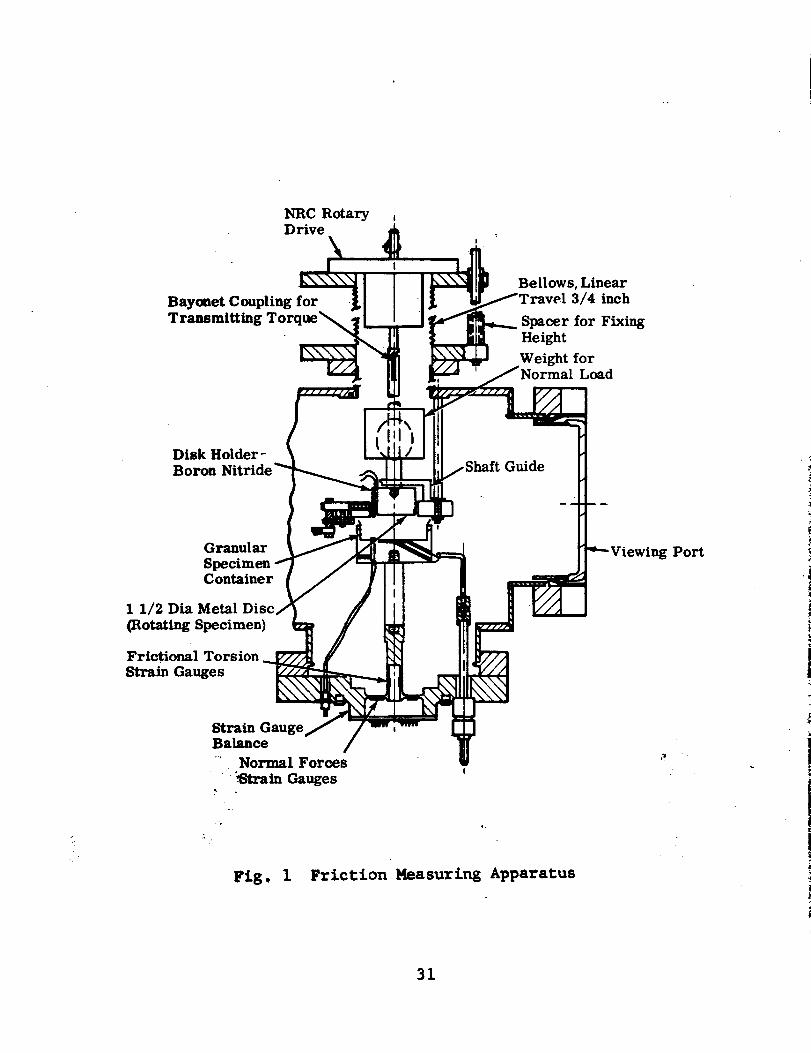
Figure 1 shows the friction measuring apparatus used in the
experiments. It underwent several modifications before repeatable
results became feasible. The original bellows assembly on top of
the vacuum chamber for load application was replaced by a direct
loading assembly to permit weights to be placed and held in
position above the metal disk holder. The whole assembly is free
to move up and down so that the test surfaces can be separated
during outgassing of the system. In this arrangement, the applied
normal load is constant and known, and cannot change during rota-
tion by the contraction or expansion of the bellows. The function
of the bellows has been reduced to that of a positioning device;
The platform supporting the granular specimens container and
the shaft linking it to the strain gauge balance were made of
boron-nitride, an insulator, in order to reduce heat flow toward
the strain gauges. Separate heating elements, connected to an
external high current-low voltage power source, permit selec-
tive outgassing of either the metal disk or the mineral powder,
or both specimens simultaneously. For measurements at room tem-
perature, however, normal outgassing procedures of the whole sys-
tem have been found satisfactory to reach the desired ultimate
pressures, after pretreating the powders as described in
Section Iii.
Spun stainless steel cups were used to contain the granular
specimens. The cups were 2-3/8" in diameter and 3/4" deep; their
upper edge was bent outward to prevent friction between the outer
rim of the disk and the powder. The weights of the granular
specimens were kept constant throughout the tests: 65.6 gr for
coarse and fine basalt and coarse quartz, 53.6 gr for fine
quartz.
The diameter of the metallic disks used in the investigation
was 1-1/2", and their cross-sectional thickness approximately
0.025" They were formed by spinning, and finished by grinding
and polishing to a finish of less than 6 microinches (rms).
Shortly before a test or pump-down, the carefully cleaned disk
was fastened to the disk holder, and a specified quantity of
mineral powder was placed inside the sample container. The
granular specimen container and the disk holder were easily ac-
cessible by removal of the large viewing port in front of the
vacuum chamber (see Fig. 2).
The rotating section of the f_iction measuring unit is driven
by a small, variable speed, dc servo motor (Fig. 3). Mounted on
a support bracket, which in turn is joined to a rigid U-frame by
means of a threaded connection, the motor can be lowered and raised
within a fixed distance. _"During baking of the system, the motor
support bracket is removed from the top of the rotary feedthrough
flange. For transmissiQn of motion into the vacuum chamber, a
flexible coupling connects the motor drive shaft to the input shaft
of a NRC-rotary harmonic feedthrough. This feedthrough is a posi-
tive drive type device that is compatible with u!trahigh vacuum
requirements in all respects.
!"
B. Instrumentation
The strain gauge balance was fabricated from a custom built
forging (see Figs. 4 and 5). A diaphragm section about the center
of the unit is instrumented to measure axial loads; a thin-walled
vertical cylindrical member is instrumented to measure the tor-
sional forces. Normal forces are measured by means of a two-active
arm bridge; torsional forces by means of a four-active arm bridge.
Both measuring circuitsiiuse semiconductor strain gauges. The
range of load calibration was +32 inch-ounces of torsion in incre-
ments of 3 inch-ounces, and a 5 Ib axial load in increments of
1/4 lb.
The sensitivity of the strain gauge circuits can be influenced
in several ways, and these may give rise to slight errors in the
measurements. There is a shift in "zero-output" of the torsion
circuit of approximately _ 0.32 inch-ounces for each pound of
normal force applied. This, however, will not affect the torsion
circuit calibration if the normal force remains constant during a
run. If the total normal force vector acting on the cup varies in
position during a run, it will apply a bending moment to the tor-o,_-
sion member, thus causzng an output error in the torsion circuit
of as mmch as 0.026 inch-ounces of torque for each inch-ounce of
bending moment applied :to the torsion member. This error varies
sinusoidally with the aZimuth angle of the torsion columm. The
normal force circuit i_' also affected by the bending moments ap-
plied to the torsion column, and the output will vary if the
normal force vector varies in position. Each inch-ounce of bend-
ing moment applied can ieause an error of as much as 0.0056 ib in
the normal force circuit output. During tests I through 34, the
output from the strain gauge circuits was fed into a Brush Dual
Gauge Amplifier with a Brush Recorder Mark II. During tests 35-40
a MASSA-COHU Recording Oscillograph and CARRIER amplifiers were
used. For protection of the strain gauges during bake-out of the
system, a water cooling groove was machined directly into the
strain gauge balance ....
4
C. Vacuum System
i. Components
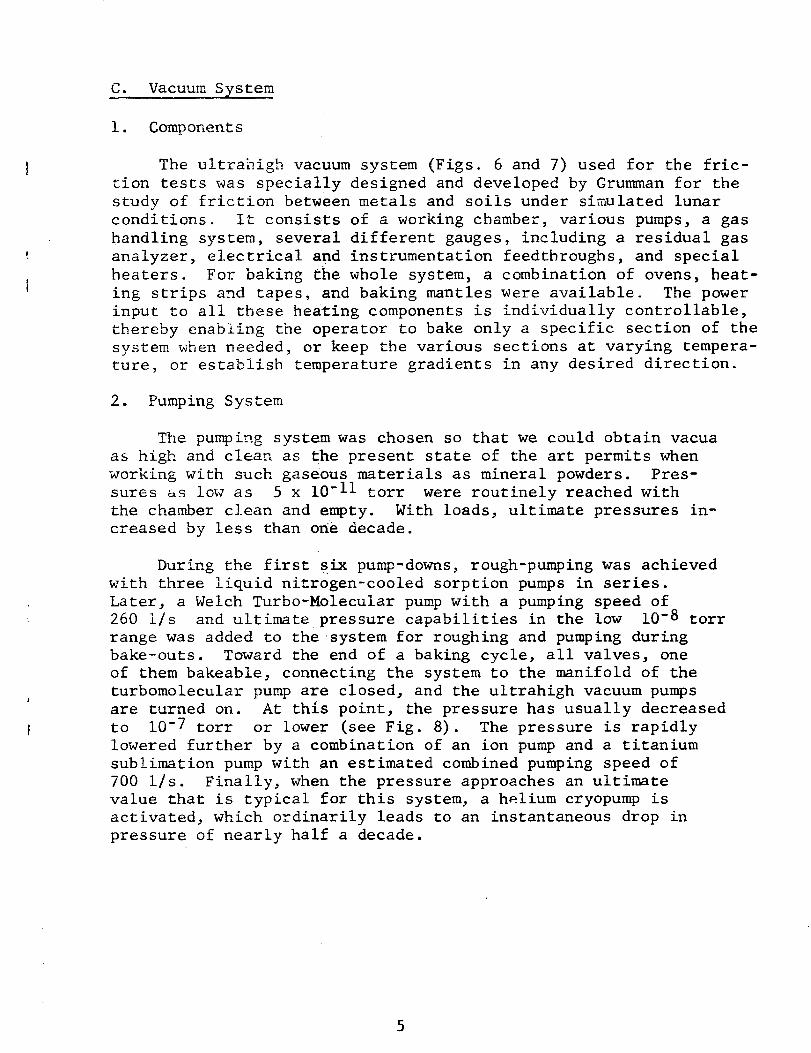
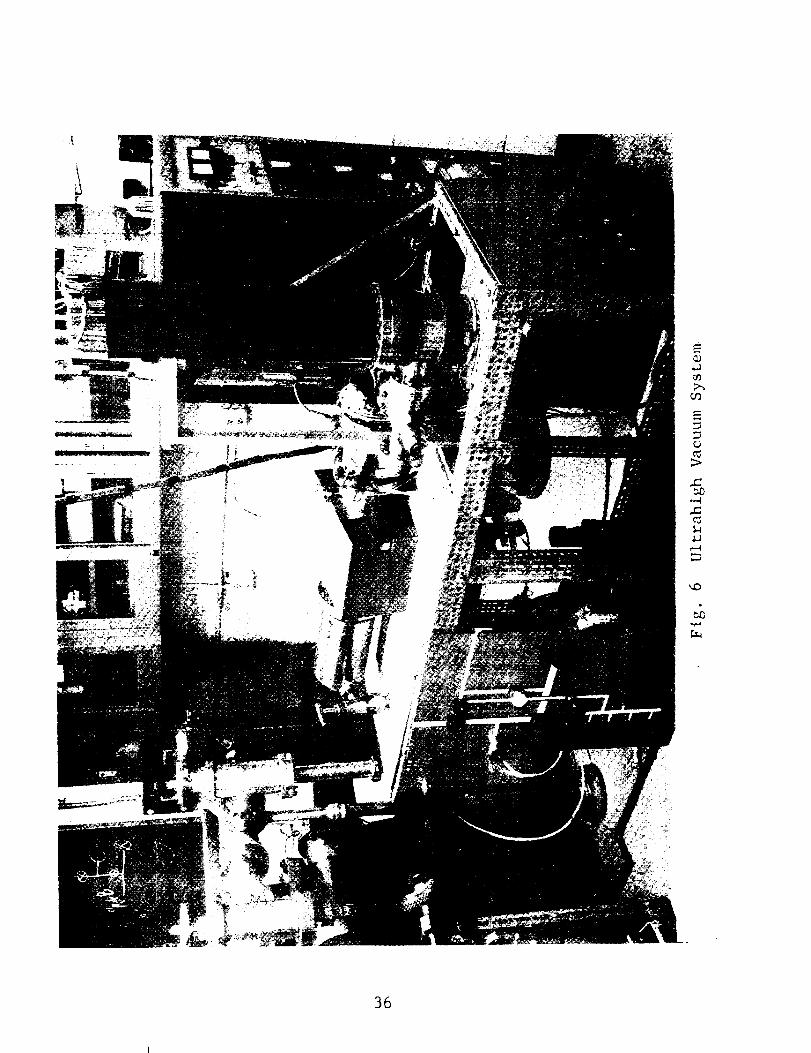
The ultrahigh vacuum system (Figs. 6 and 7) used for the fric-
tion tests was specially designed and developed by Grumman for the
study of friction between metals and soils under simulated lunar
conditions. It consists of a working chamber, various pumps, a gas
handling system, several different gauges, including a residual gas
analyzer, electrical and instrumentation feedthroughs, and special
heaters. For baking the whole system, a combination of ovens, heat-
ing strips and tapes, and baking mantles were available. The power
input to all these heating components is individually controllable,
thereby enabling the operator to bake only a specific section of the
system when needed, or keep the various sections at varying tempera-
ture, or estabiisb temperature gradients in any desired direction.
2. Pumping System
The pumping system was chosen so that we could obtain vacua
as high and clean as the present state of the art permits when
working with such gaseous materials as mineral powders. Pres-
sures as low as 5 x i0 -II torr were routinely reached with
the chamber clean and empty. With loads, ultimate pressures in-
creased by less than one decade.
During the first six pump-downs, rough-pumping was achieved
with three liquid nitrogen-cooled sorption pumps in series.
Later, a Welch Turbo-Molecular pump with a pumping speed of
260 i/s and ultimate pressure capabilities in the low 10 -8 torr
range was added to thesystem for roughing and pumping during
bake-outs. Toward the end of a baking cycle, all valves, one
of them bakeable, connecting the system to the manifold of the
turbomolecular pump are closed, and the ultrahigh vacuum pumps
are turned on. At this point, the pressure has usually decreased
to 10 -7 torr or lower (see Fig. 8). The pressure is rapidly
lowered further by a combination of an ion pump and a titanium
sublimation pump with an estimated combined pumping speed of
700 i/s. Finally, when the pressure approaches an ultimate
value that is typical for this system, a helium cryopump is
activated, which ordinarily leads to an instantaneous drop in
pressure of nearly half a decade.
5
III. TESTING PROCEDURES
A. Preparation of Soil Samples
i. Source of Material
Large quartz crystals from Hot Springs, Arkansas and chunks
of basalt from Somerset County, New Jersey were comminuted and
sifted by the procedure described in detail in Appendix A to
obtain the following grain size ranges:
Material Range of Particle Sizes
Coarse
Fine
250 - 500 microns
38 - 62 microns
2. Storage of Material
The granular material was generally stored in sealed glass
jars; the material selected for testing was placed and stored
in a separate vacuum chamber where it was baked and outgassed.
Although the material was necessarily exposed to air again when
it was placed in the sample container, this procedure reduced
the outgassing time of the friction experiment.
3. Placement of Material in the Sample Container
The same weight of soil was used for one type of material
in all the tests. The container was filled with the loose soil
and carefully evened to the same level in each test with the
help of an Airite vibrator. The following tabulation shows the
weights used for each soil type, the specific gravity, the
moisture content as stored, the dry density, and porosity ofthe soil.
6
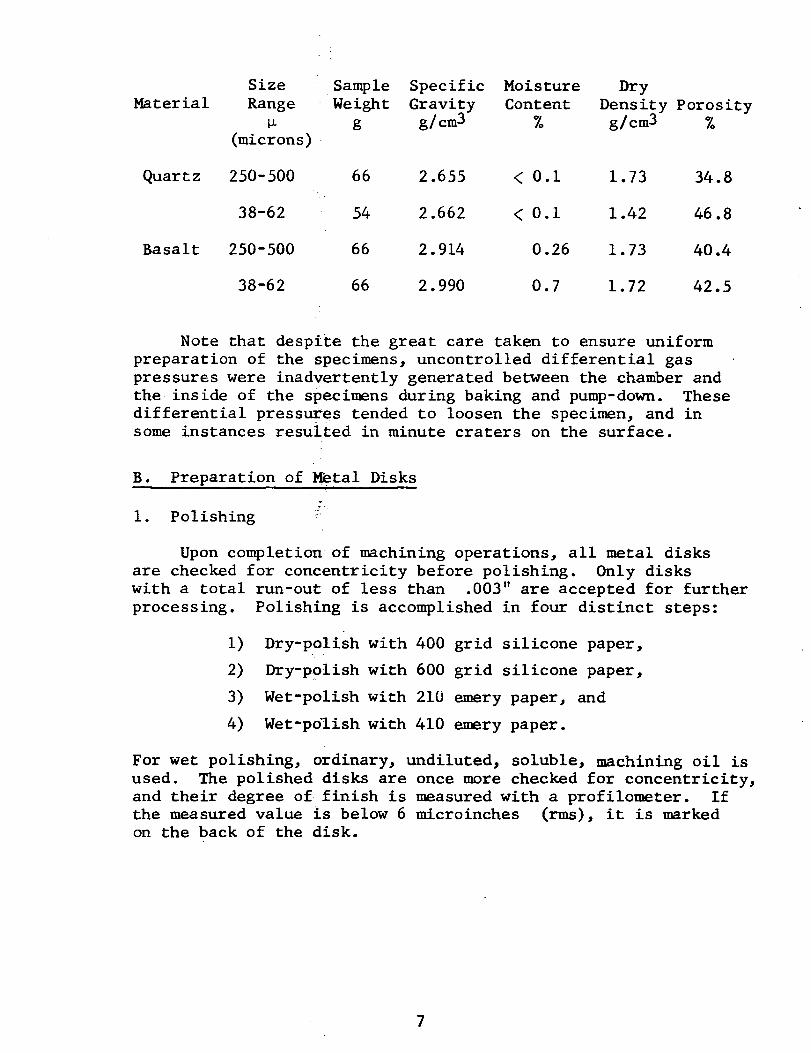
SizeMaterial Range
(microns) •
Quartz 250-500
38-62
Basalt 250-500
38-62
SampleWeigh t
g
Specific Moisture DryGravity Content Density Porosity
g/cm3 % g/cm3 %
66 2.655 < 0.i 1.73 34.8
54 2.662 < 0.i 1.42 46.8
66 2.914 0.26 1.73 40.4
66 2.990 0.7 1.72 42.5
Note that despite the great care taken to ensure uniformpreparation of the specimens, uncontrolled differential gaspressures were inadvertently generated between the chamber andthe inside of the specimens during baking and pump-down. Thesedifferential pressures tended to loosen the specimen, and insome instances resulted in minute craters on the surface.
B. Preparation of l_etal Disks
i. Polishing _
Upon completion of machining operations, all metal disks
are checked for concentricity before polishing. Only disks
with a total run-out of less than .003" are accepted for further
processing. Polishing is accomplished in four distinct steps:
i) Dry-polish with 400 grid silicone paper,
2) Dry-polish with 600 grid silicone paper,
3) Wet-polish with 210 emery paper, and
4) Wet-polish with 410 emery paper.
For wet polishing, ordinary, undiluted, soluble, machining oil is
used. The polished disks are once more checked for concentricity,
and their degree of finish is measured with a profilometer. If
the measured value is below 6 microinches (rms), it is marked
on the back of the disk.
7
2. Cleaning
The accepted specimen is then submitted to a thorough clean-ing procedure:
i) Wash in Alconox solution and rinse with
tap water_
2) Boil in tap water,
3) Rinse
4) Degrease in acetone in ultrasonic cleaner,
5) Dry with nitrogen gas, and
6) Wipe with alcohol.
Disks that are not used inmmdiately are stored in plastic bags
with pellets of drierite or silica-gel. (If a relatively long
period of storage can be anticipated, the clean disks are stored
in a special vacuum desiccator.) In addition, disks made of
1020 steel are sprayed with a rust preventing solution, which is
removed just prior to the test by repeating steps 4 through 6.
After the test, the rust preventing solution is applied again.
It is, therefore, necessary to clean steel disks thoroughly be-
fore examination or measurement of surface conditions.
C. Vacuum History of Tests
I. Outgassing of Powders and Baking of System
The measured outgassing rates for basalt and quartz stored
in glass jars under normal ambient conditions were very high
for these materials (see Appendix B). In order to avoid lengthy
pump-downs and adverse effects of desorbing water vapors on ion
pumps_ the powders used in the vacuum tests were outgassed in a
special desiccator prior to their transfer to the experimental
chamber. It was found that this procedure reduced pump-down
time considerably. Furthermore, the nearly constant gas loads
produced by the processe d specimens made the achievement of a
certain uniformity of the vacuum history of each test easier.
Therefore, differences that still exist are due to factors other
than the outgassing rates of the mineral specimens. Examples
of such factors are exposure time of the whole system to the
atmosphere by contamination of vacuum pumps, small leaks m toname two.
B
-6Normally, the system is roughed down to i0 torr within
90 to 120 minutes, when baking is started. Temperatures are
increased graduallyuntil maxima are reached; these vary from
section to section, and their limitations are set by high tem-
perature sensitive components in the system; e.g., strain gauges
and ion pump magnets.! Increments of temperature increase are
determined by the pressure evolution of the system, which is
never allowed to exceed 5 x 10⁻⁵ torr. During the entire bak-
ing cycle, a temperature gradient ranging from 350 to 400°C
at the cryopump to 180 to 2000C at the ion and titanium
sublimation pump is_maintained. The chamber itself is usually
kept at 200 to 2i00C. Total baking times have been as low
as 24 hours, in some tests as high as 60 hours. When the sys-
tem pressure indicates a falling tendency and reaches the low
10 -7 torr level, the heating system is shut off. From this
point it requires approximately 12 to 20 hours to produce an
ultimate pressure beyond which further decreases cannot be
expected within reasonable periods of time. Although the
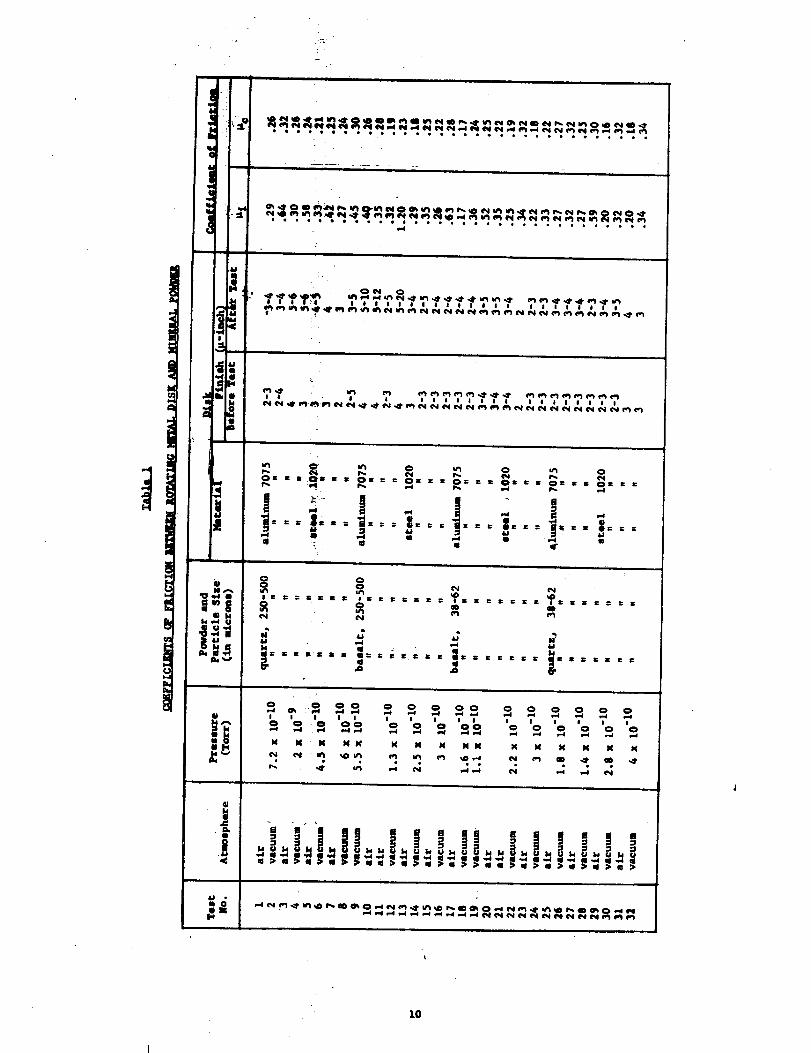
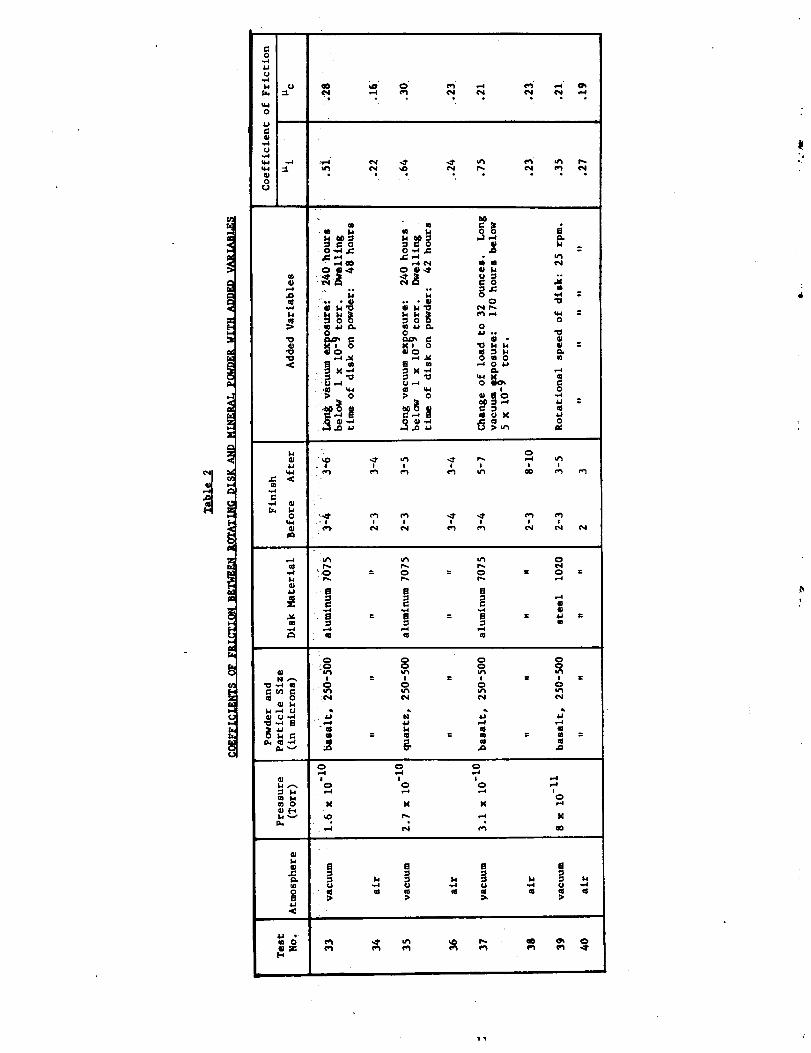
achieved ultimate pressures have varied from test to test (see
Tables i and 2), they are, with one exception, all in the i0 -I0
tort range, or lower.
2. Residual Gases and Pressure Evolution During Tests
Gases entrapped in and evolved from rocks are in addition
to H20 which represents the largest volume, primarily C02,
HCI, CI 2, H2, H2S, CO, CH 4, N 2, and 02 . In basalt specifi-
cally, CO 2 is generally near 50 percent of the total gas other
than H20. Two typical mass scans made with a Veeco Model GA-4
gas analyzer duringone of the tests to determine the composition
of the residual gases in the system are shown in Figs. 9 and i0.
One of the scans was_made before baking, and one after baking of
the system, the mineral specimen being coarse basalt. The differ-
ence in relative pe_k heights of parent gases and their cracking
products before an_after baking are indicative of the effec-
tiveness of the baking procedures.
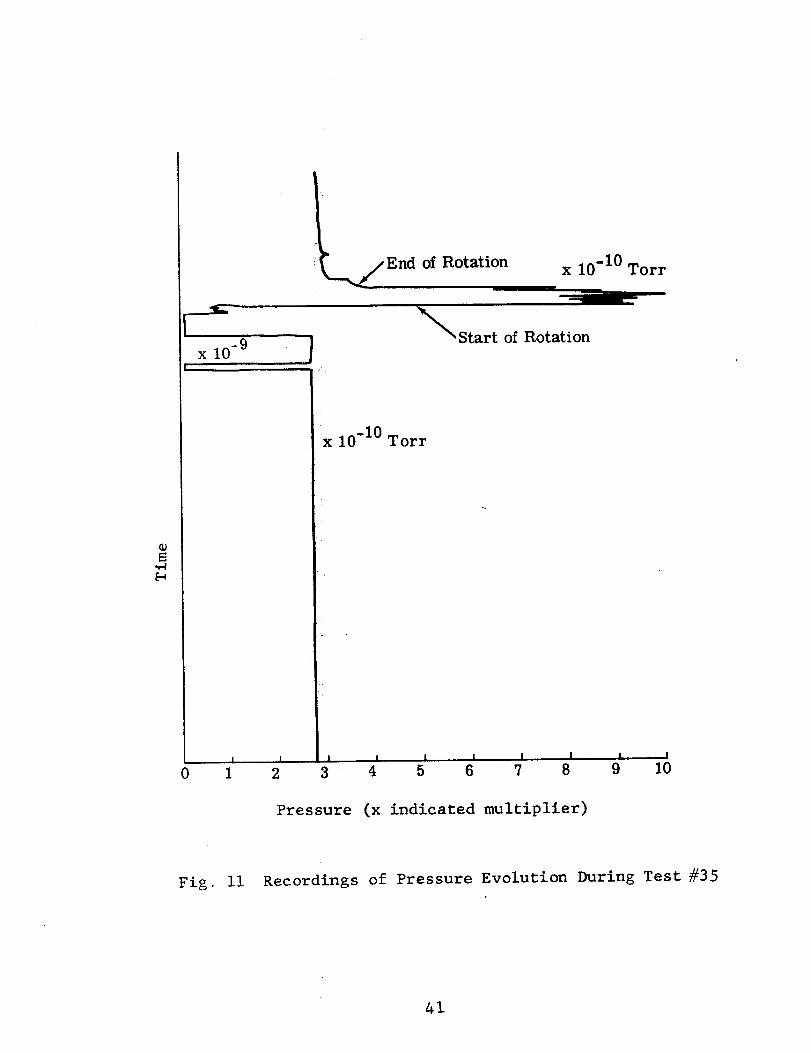
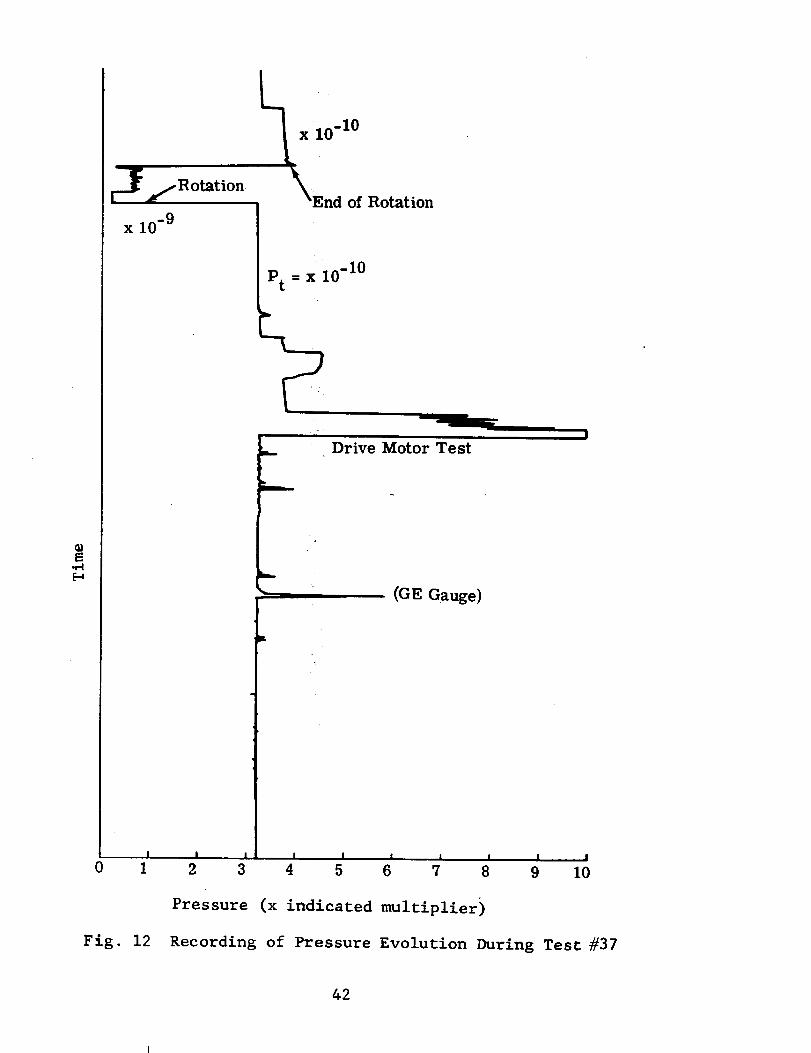
Moving components and sliding surfaces always cause an in-
stantaneous transien£ increase in the pressure of an ultrahigh
vacuum system at the start of motion. As soon as motion ceases,
the pressure decreases almost as rapidly to the original pres-
sure level. Such pressure changes have been recorded during
all of the vacuum tests, and two examples presented in Figs. ii and
12 show the range of pressure variations. If one considers the
type of materials involved, highly gaseous mineral powders and
9
• k
II
I|
10
0
U
0
U
0
"0
0_q
m
U ,.-.I
<
0
m
0-,__,-_
,..4 C_l
0
U,.,_
I!I I
0
0
Q •
0 m 0,--_ 0 _J
0
!
E
0 0
I,i ,.-I U ,._ _
u_r_
oE
.,4
e_
oo
!otr_
m
mm 0
_E"¢
0
I 0
X
0
!
_¢
c_
o!0
_¢
_J u
_,_ ¢_
1.0
u_N
n
0
¢U =
0
0
u_
J_ N
0
o =
¢g
00
=II
gO
_4
ah
a
CJel e_:)
4.1 Q
relatively large metal surfaces in rotational contact, the
magnitude of the pressure transients mmst be considered mini-
mal, thereby indicating4the effectiveness of the baking
procedures and the presence of a clean system.
3. Effect of Pumping on Powder Samples
In spite of the great care that was exercised when open-
ing and closing valves _t the beginning of pump-downs and when
bringing the system bac_ito atmospheric pressures at the end of
a test, the arrangementli_o f the test powders were disturbed.
Sometimes visual inspection through the large viewing port in
front of the chamber re_ealed small crater-like deformations of
the surface of the powder sample. Sometimes particles were
found on the bottom of _t_e chamber as a result of in-rushing or
out-rushing gases. Fluctuations of the pressure during tests
also indicate the existence of pressure gradients within the
powder beds, and these gradients may affect the measured values
of the coefficient of friction. Variations in the appearance
of the powder samples after tests are discussed below.
Performance of Test_ _
General Procedure
Once an acceptable_pressure level has been obtained, the
following procedure is used to measure the coefficient of fric-tion.
i) The calibration of the strain gauge amplifierand recorder is checked.
2) The speed of the rotating disk is checked.
3) The loaded, stationary disk is then lowered
until the disk comes to rest on the powder.
It is left in this position for 5 minutes.
4) Next, rotation of the drive in the clockwise
direction is started, and stopped after oneminute.
5) The direction of rotation is reversed and
maintained ifor one minute.
6) Disk is raised.
7) The calibration of the strain gauge in-
strumentation is rechecked.
12
2. Load and Rotational Speed
In the present,series of tests, the applied load is 2.5 Ibsexcept for test #37{ This value had been chosen to result in a
pressure of 1.4 psi, which is equal to the pressure applied
during previous phases of the program. The rotational speed was
3 rpm in all but one test, which was performed at 25 rpm for
the purpose of investigating the effect of speed of rotation on
the coefficient of friction. The reported coefficients of fric-
tion are based on m_surements made during clockwise rotation.
3. Inspection of Specimens
At the completion of a test, the surface of the disk was ex-
amined, its finish measured again, and the changes noted. After
some of the vacuum tests, strong adhesion of mineral powders on
the contact surface and the rim of the disk were observed (see
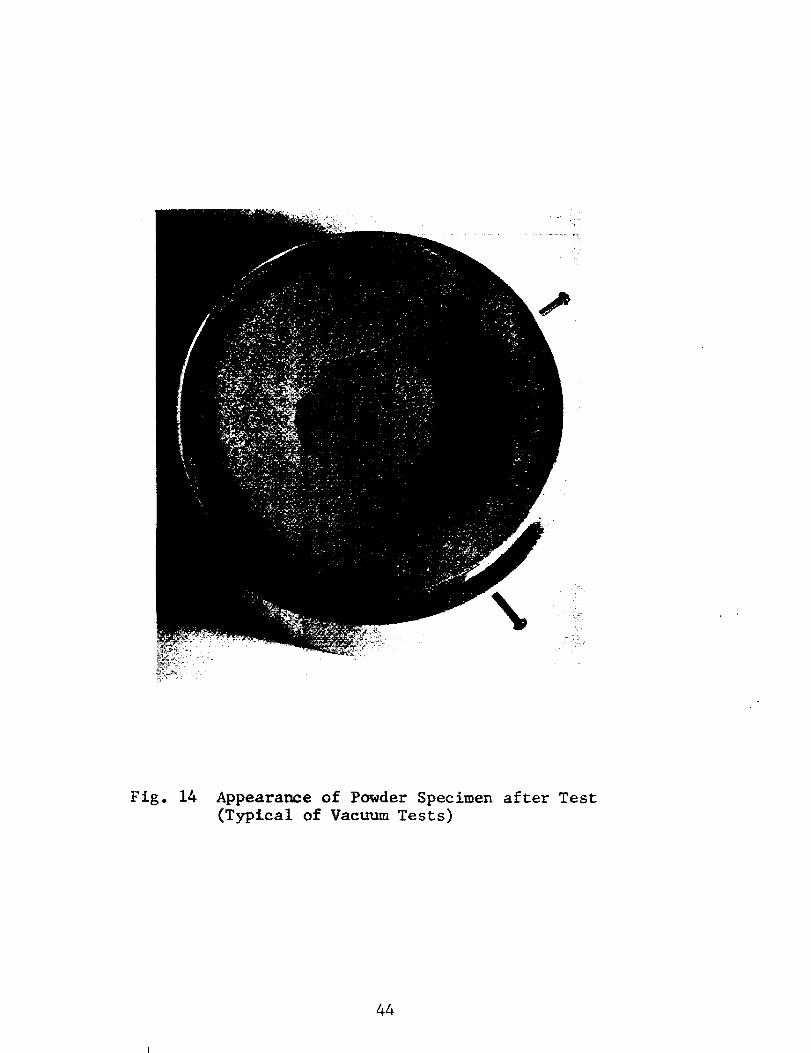
Fig. 13). The shape of the powder bed in the sample cup at the
end of the test showed variations from test to test. Two typical
cases are illustrated in Figs. 14 and 15. No dependence on
particle size or material has been noted. However, the case
illustrated in Fig. 14 is more typical of the condition of the
powder bed after vacuum tests, whereas Fig. 15 shows the normal
appearance after most air tests. When the vacuum test resulted
in the type of powder bed shape shown in Fig. 15, it was sometimes
accompanied by strong adhesion among the powder particles through-out the whole bed.
• 13
IV. EVALUATION OF RECORDS
A. Processing of Raw Data
As indicated in the description of the torque measuring
strain gauge system, it was impractical to compensate completely
for the interaction of the strain gauges at the low level of
strains measured. This iinteraction was due to an unavoidable,
small eccentricity of the load that caused bending in the hollow
shaft in which the gauges were mounted. As a result, the records
of torque measurements included this interaction effect which
amounted to a cyclic error that normally did not exceed +25%
of the measured torque. Also, in some instances the interaction
of high frequency vibrations from nontraceable extraneous sources
were superimposed on the records.
In order to exclude the errors introduced by the interaction
of gauges and extraneous _sources, the raw data were processed
in the following manner. When visual inspection of the records
indicated that the cyclic error was insignificant, the average
•value of the readings during the first revolution, exclusive of
initial values, was determined and accepted in the calculation
of the coefficient of friction. Wher_ the cyclic error was deemed
significant, a cycle was selected, as close to the start of the
test as possible, which clearly showed the variation due to the
interaction of gauges. This cycle included the readings between
two points where the eri_r due to the interaction of gauges was
extreme and of the same sign, i.e., the cycle extended from one
minimum (or maximum) to the next one. The duration of the cycle
corresponded to the period of one revolution of the disk, 20
seconds. Slight deviations from this period occurred because
no elaborate control of the speed of rotation, in excess of a
simple rheostat, was deemed necessary.
The cycle selected by visual inspection was then read at
every 1/5 second interval on a semiautomatic Benson-Lehmer
LARR-V (Large Area Reader-Recorder), whose analog output was
converted into digital counts in the Benson-Lehmer Telepak. The
digital data were automatically punched on IBM data cards that
are compatible for the IBM 360 computer entry. Computer pro-
grams, based on the least squares method and available at Grumman
Data Reduction Center, were used to obtain best fitting first
and third order curves. The digitalized data as well as the
best fit curves were then plotted in a greatly magnified scale
using a CALCOMP plotter. Examples of the CALCOMP plots are
given in Figs. 16 and 17, which show the results of Tests No. 3
and 7.
14
The first order fits served the purpose of establishing thebest fitting straight line variation of the torque during a cycle.The third order fit was intended to follow the actual recordclosely and eliminate the errors from sources other than the in-teraction of the gauges. This would have allowed the separationof the interaction error from the other errors and would estab-lish a correction factor for the interaction error as a functionof time (rotation). However, examination of the third order bestfitting curves showed that this was possible only in a few in-stances because the third order fit was not reflecting the changesin the curvature of the trace at the minima or maxima, which wereselected as the end points of the cycle.
Examination of the records and first degree fits showed thatin the majority of cases there was a slight decrease in the aver-age value of torque represented by the best fitting straight lineduring the cycle, and in some instances there was a slight in-crease. In order to clarify whether these changes in torque canbe attributed to the change in the friction coefficient or otherfactors, and to investigate the potentiality of applying thismethod to the determination of slip-friction relationships,Gru_nan-supported research was initiated. The results of thepreliminary tests and theoretical analyses, to be reported in aGrumman Research Department memorandum, (Ref. i) indicate thatthe changes in torque during continued rotation are most likelythe result of a redistribution of the stresses beneath the ro-tating disk. For this reason it was decided to consider thatvalue of the torque that is representative of the friction whichwas theoretically not affected by any redistribution of thestresses. This value was obtained by extrapolating the bestfitting straight line to the zero time. The coefficient of fric-tion pertaining to this torque and computed on the basis of uni-form stress distribution was designated as _c"
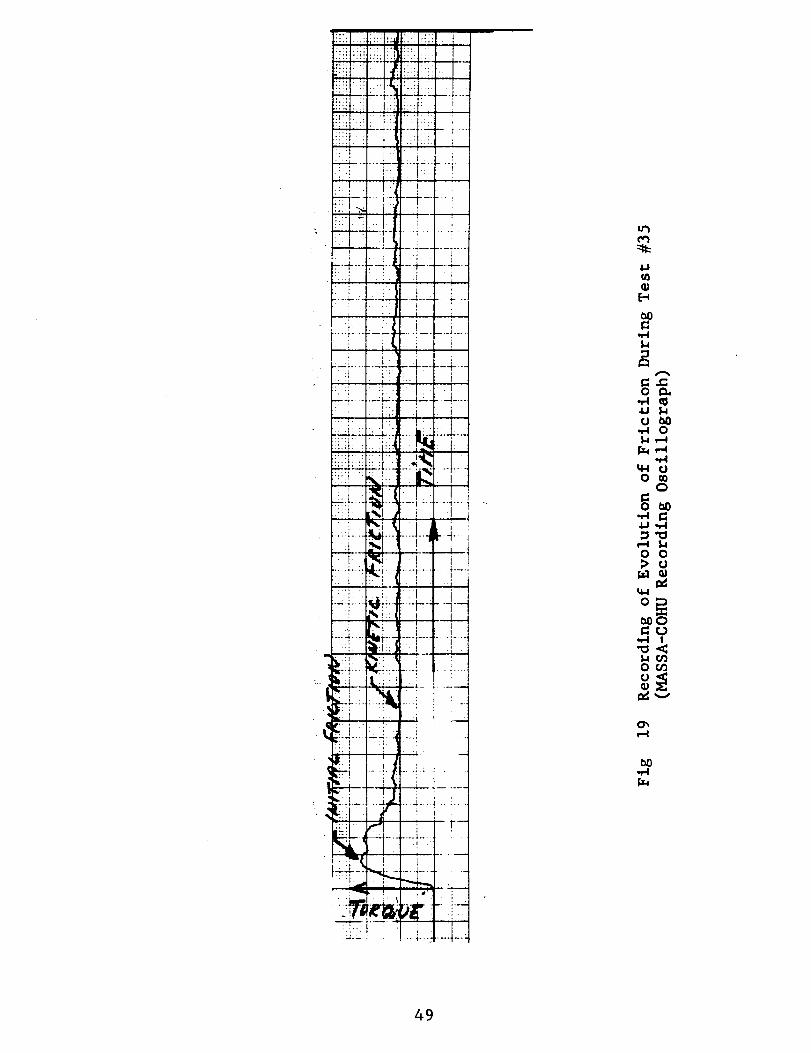
In most of the tests, an initially higher value of friction_i was observed than the value pertaining to continued motion(Figs. 18 and 19). This initial value was only slightly higherthan _c for the tests performed in air, and in most instancessignificantly higher than _c for the tests performed in ultra-high vacuum. In the evaluation of the maximum value of the ini-tial friction, consideration was given to its relative positionto the cyclic interaction error, and adjustments were made wherenecessary.
15
B. Computation of the Coefficient of Friction
As a result of the date processing described in the previous
section, torque values representative of the initial condition
and continued rotation were established. The coefficient of fric-
tion was computed from the above torque values by the formula
3T
where
= coefficienti_f friction,
T = torque in inch-ounces,
W = load in ounces, and
R = radius of disk in inches.
This formula is based on the assumption that the distribution of
normal and shear stresses beneath the disk is uniform.
Investigations in conmection with the Grumman-supported re-
search, referred to earlie= , Showed that departures from the uni-
form pressure distribution_are possible. The magnitude of these
departures, however, is dependent on the actual disk and container
dimensions, the applied load, and the ratio of the metal-soil
friction to the internal friction of the soil. Parallel tests
with annular disks are necessary in each specific case to estab-
lish both the effect of nonuniform stress distribution on the
torque and an adjustment factor that may be applied to the
formula. Preliminary tests made with annular disks of about
1.6 in. O.D. and 0.8 in. I,D. indicate that the effect of de-
partures from the uniform stress distribution on the torque is
probably minor in the case of the 1-1/2 in. diameter disk.
16
V. EVALUATION OF TEST RESULTS
General
The purpose of the testing program was to evaluate the
effect of ultrahigh vacuum on the coefficient of friction be-
tween metals and soils. However, the testing program was
limited to the determination of the rotational sliding resis-
tance under a given normal load. Consequently, for the deter-
mination of the coefficient of friction, it had to be assumed
that the sliding resistance is composed entirely of friction
and adhesion is zero. This assumption is reasonable for dry
granular soils tested under atmospheric conditions, but is not
justified when adhesion between metal and soil develops in
ultrahigh vacuum. Differentiation between friction and ad-
hesion would have required the performance of several tests
for each combination of metal and soil by varying the normal
load only.
In order to make a quantitative comparison between the
frictional resistance in ultrahigh vacuum and air, a coeffi-
cient of friction was computed for every test on the assump-
tion that the sliding resistance is entirely frictional. It
is emphasized, however, that the computation of a friction
coefficient does not denote that the sliding resistance is en-
tirely frictional.
A sample of the.records indicating the frictional resis-
tance at various stages of rotation is that shown in Figs. 18
and 19. The recording shows a sharp peak at the beginning of
rotation; this peak value is termed the "initial friction," and
the coefficient of friction calculated from the peak resistance
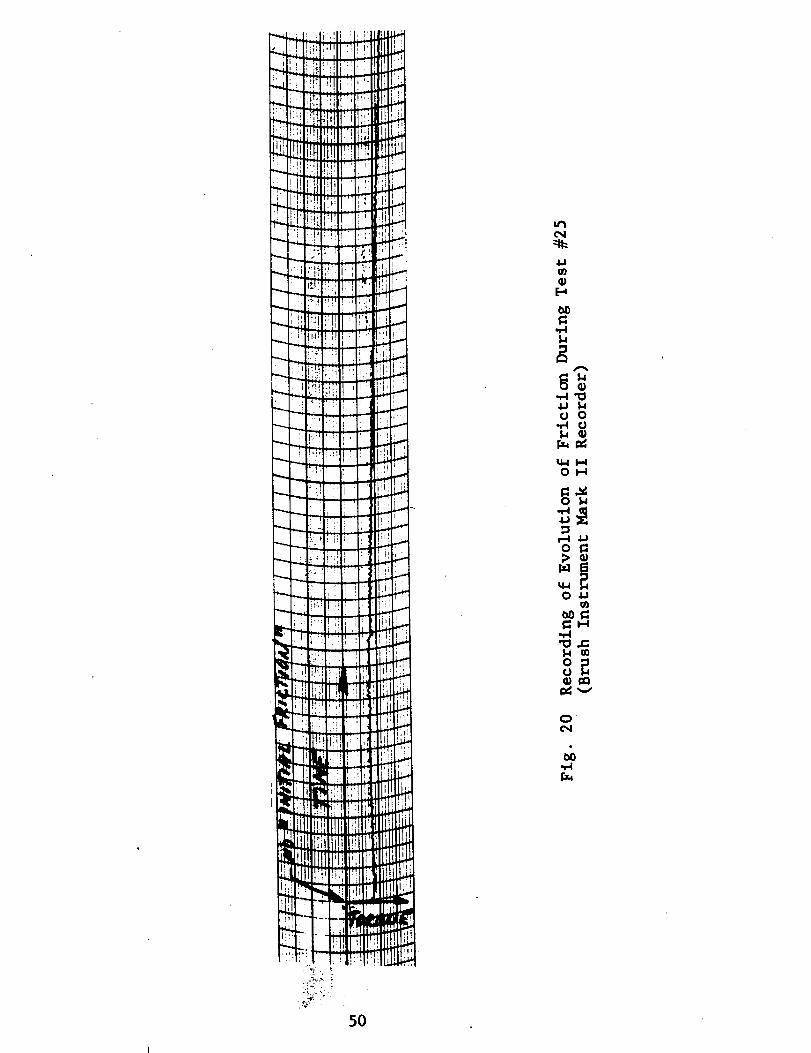
is designated as _i" Sometimes the initial peak is missing
and the development of the friction is gradual as indicated by
the curve of Fig. 20. In either case, after a comparatively
small amount of rotation, the frictional resistance tends to
assume a constant value, although various factors, discussed
later in more detail, may tend to decrease or increase the ob-served frictional resistance as the rotation continues. This
constant frictional resistance is termed kinetic friction, and
the coefficient of friction calculated from the observed fric-
tional resistance is designated as _c" Final results, includ-
ing a detailed description of individual test conditions, are
summarized in Tables i and 2.
17
The effect of high vacuum on the initial and kinetic fric-tion is evaluated in the following paragraphs in detail.
Initial Friction
The testing program Provided for two tests on each of the
eight combinations of two types of metals, two types of materials,
and two particle sizes. The initial friction observed in the
vacuum tests was generally_ch higher than either the initial
friction observed in air on a comparable combination or the
kinetic friction observed 2 vacuum. In some instances, as for
example in the case of steel sliding on fine basalt, the initial
friction showed wide variatl!on in the two similar tests. These
cases were investigated in detail to find the cause of the dis-
crepancy; two of the addit_onal tests (Nos. 33 and 35) were conduc-
ted for the purpose of investigating whether the vacuum exposure
time which varied to some extent in the tests, had any effect on
the initial friction. As _e long exposure tests (Nos. 33 and 35)
indicate, the initial friction did not increase in any significant
degree when the vacuum exposure was prolonged for a period of
over 240 hours. However, a detailed examination of the full
vacuum history of the tests that showed inconsistent results
(Tests No. 22 versus No. 24_and. No. 26 versus No. 28) revealed
that in those tests that showed inconsistently low initial fric-
tion (Nos. 22 and 28) the p_-down was interrupted because of the
malfunctioning of some component and restarted again after the
necessary repairs were completed. One consequence of the repeti-
tion of baking and pumping down might have been that the loosen-
ing of the specimen due to differential gas pressures mentioned
in Section III was more intense than in the other tests, and
thereby resulted in a possibly lower initial friction.
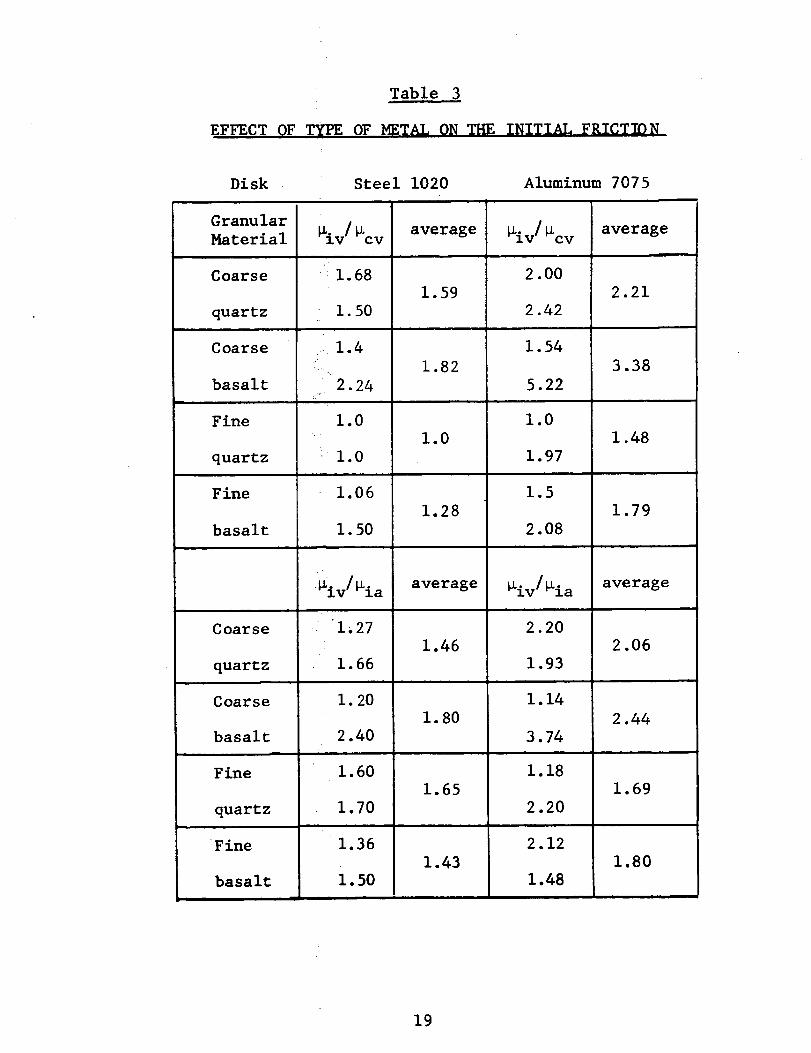
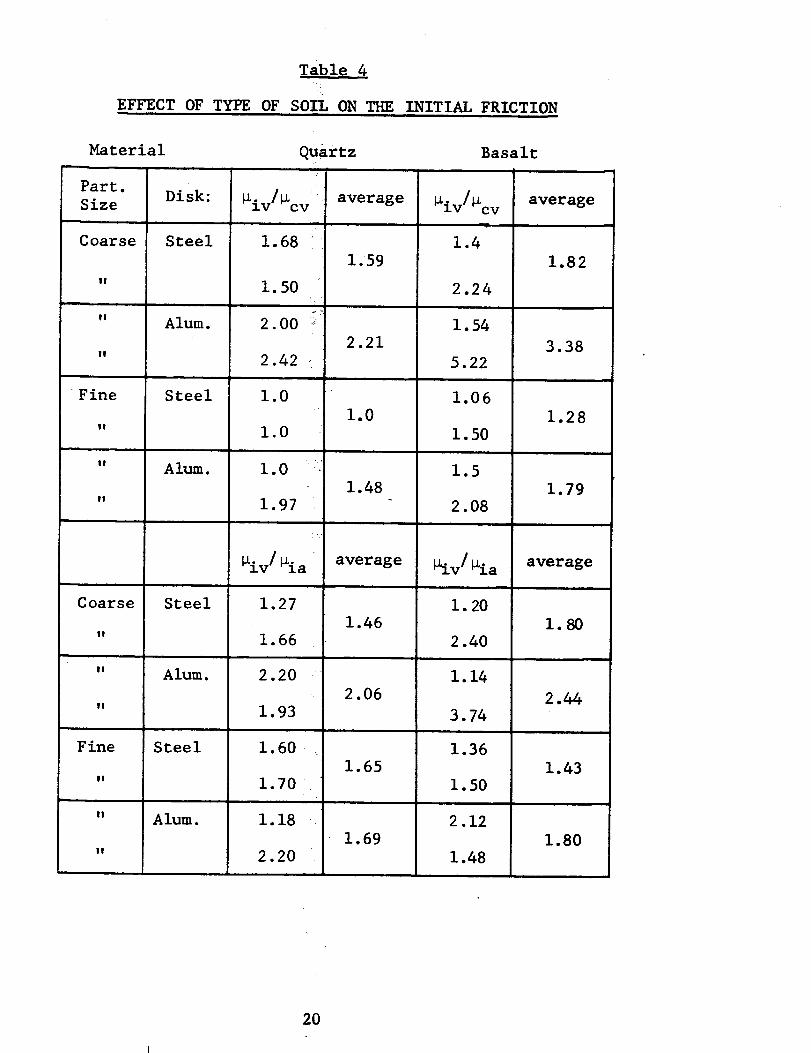
A quantitative maasure of the effect of ul_rahigh vacuum on
the initial friction can be!•Obtained if the initial friction co-
efficient in D-HV (_iv) kS compared to the initial friction co-
efficient in air _ia or to the coefficient of kinetic friction
in vacuum _cv" Unfortunately, the tests results do not lend
themselves readily for a statistical analysis of the effect of
variables, nor for the analysis of the m_gnitude of empirical
errors, because the testing program was limited to two tests for
each combination of the variables. However, tentative conclusions
concerning the effect of a selected variable my be drawn from the
_iv:gia and _iv:_c v ratios, which are tabulated in Tables 3, 4,
and 5 in various combinations for the convenience of evaluation.
18
EFFECT OF TIPE
Table 3
OF METAL ON THE INITIAL FRICTION
Disk
Granular
Material
Coarse
quartz
Coarse
basalt
Fine
quartz
Fine
basalt
Coarse
quartz
Coarse
basaltm
Fine
quartz
Fine
basalt
Steel 1020
_iv / _cv
1.68
i. 50
1.4
2.24/"
1.0
1.0
1.06
i. 50
_iv / _ia
1.27
1.66
i
i. 20
2.40
1.60
1.70
average
1.59
i .82
1.0
1.28
average
i .46
i. 80
1.65
1.43
Aluminum 7075
_iv/_cv
2.00
2.42
i. 54
5.22
1.0
1.97
1.5
2.08
_iv/_ia
2.20
1.93
i. 14
3.74
i. 18
2.20
average
2.21
3.38
1.48
1.79
average
2.06
2.44
1.69
1.80
1.36
i. 50
2.12
1.48
19
EFFECT OF TYPE OF
Table 4
SOIL ON YKE INITIAL FRICTION
Material
Part.
Size
Coarse
II
i
II
I!
Fine
II
I!
II
Coarse
11
F ine
II
11
Disk:
Steel
Alum.
Steel
Alum.
Steel
Alum.
Steel
Alum.
Quartz
_iv/_cv
1.68
i. 50
2.00
2.42
1.0
1.0
1.0
1.97
_iv / Via
1.27
1.66
2.20
1.93
1.60
1.70
i. 18
2.20
Basalt
average
1.59
2.21
1.0
1.48
average
1.46
2.06
1.65
1.69
_iv/_cv average
2.24
1.54
5.22
1.06
i. 50
1.5
2.08
_iv / ILia
I. 20
2.40
i. 14
3.74
1.82
3.38
1.28
1.79
average
1.80
2.44
1.36
i. 50
2.12
1.43
i .80
1.48
2O
EFFECT OF
Particle Size
Material Disk:
i
Quartz
I!
Basalt
I!
Quartz
I!
Basalt
I!
Steel
Alum.
Table 5
PARTICLE SIZE ON THE INITIAL FRICTION
Coarse Fine
:_iv/ _cv
i 1.68
i. 50
2.00
: 2.42
Steel :_ 1.4
2.24
Alum. I. 54
i 5.22
Steel
Alum.
Steel
" iv/#iai
i .27
, 1.66
2.20
1.93
1.20
2.4O
I. 14
3.74
Alum.
average
1.59
2.21
1.82
3.38
average
1.46
2.06
1.80
2.44
_iv/_cv
1.0
1.97
1.06
i. 50
1.5
2.08
_iv /Via
1.60
1.70
I. 18
2.20
1.36
i. 50
2.12
1.48
average
1.0
1.48
1.28
1.79
average
1.65
1.69
1.43
1.80
21
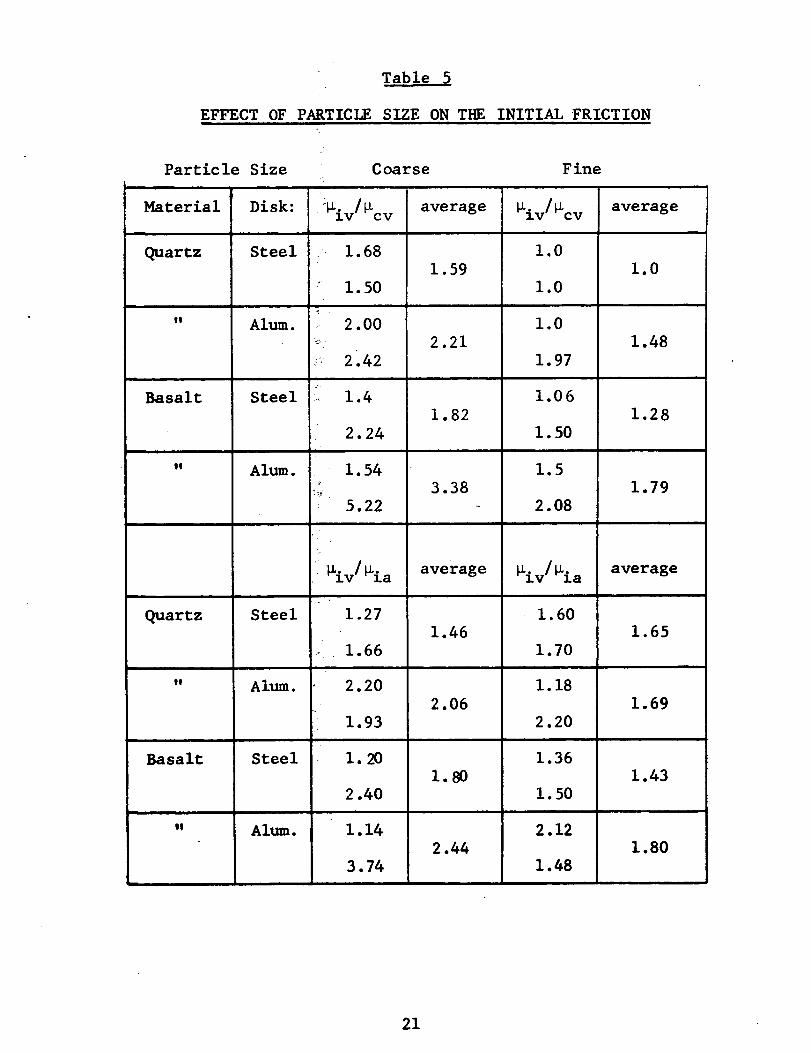
From the tabulationsj the following tentative conclusionscan be drawn.
a) The magnitude of the initial friction in ultrahigh
vacuum relative to that in air is consistently
higher withsteel disks than with aluminum disks.
(The over-ali average ratio is 2.0 in all tests
with aluminum compared to 1.58 with steel.)
b) In ultrahigh vacuum, basalt appears to develop a
somewhat higher ratio of initial friction to kinetic
friction than quartz. The over-all average ratio
of initial to kinetic friction is 2.07 for basalt
compared to 1.58 for quartz.
c) Particle size does not appear to have significant
effect on the initial friction.
This last finding is somewhat contrary to expectation since de-
creasing particle size should result in relatively stronger bonds
between the particle and metal. There are several reasons, how-
ever, why in this type of test the effect of decreasing particle
size does not manifest itself in an increase of the initial fric-
tion. First, the loosening effect of gas bubbles, discussed
earlier, comes into play primarily wfth the finer particles which
form a bed with low gas permeability. Second, the measured ini-
tial friction between metal and soil cannot exceed the value of
soil to soil friction, because in the case of strong adhesion of
the particles to the metal, rotation would take place in the soil
itself. The soil to soil friction of the finer particles may be
appreciably lower than that of the coarser particles. Finally,
the fine particles tend to develop some initial friction in air,
thereby making the difference in initial friction between tests
in air and ultrahigh vacuum smaller.
In the testing program the last four vacuum tests were left
open to permit further investigation of the effect of some of the
variables observed during the first 16 tests. The purpose of
tests Nos. 33 and 35 was to investigate the effect of long vacuum
exposure. As may be seenlfrom the comparison of initial friction
coefficients with the comparable tests (No. 33 versus Nos. I0 and
13, and No. 35 versus Nos. 3 and 5, see table 2), the difference in
initial friction between normal and long vacuum exposure, if any, is
within the experimental error.
Test No. 37 was conducted with a lower normal load. The pur-
pose of this test was to investigate the nature of what is termed
the "initial friction." If the cause of the observed high sliding
resistance is adhesion, it is expected to act with the same value
under lower normal load resulting in a higher computed value of
22
the "initial friction." Test No. 37 was inconclusive in this re-spect, inasmuch as the computed coefficient of initial friction_i was inbetween the values obtained with the comparable testsat higher normal load (0.70 in test No. 37 compared to 0.40 intest No. 9 and 1.2 in test No. 12). Further tests are needed toclarify the nature._of the high initial sliding resistance observedin the tests performed in ultrahigh vacuum.
Test No. 39 was conducted for the purpose of investigatingthe effect of speed on the friction between metals and soils. Ifrotational speed has any effect on the initial friction, it isless than the experimental error.
Kinetic Friction
In general, the effect of ultrahigh vacuum on the kinetic •
friction is less pronounced than that on the initial friction, and
the differences observed between comparable values of kinetic fric-
tion in air and ultrahigh vacuum are often in the range of experi-
mental error. In order to evaluate the effect of ultrahigh vacuum
in such cases, a statistical evaluation of the mean of the ob-
served values with respect to the standard deviation would be
necessary. In view of the small number of tests (two) performed
under comparable conditions for each-combination of the variables,
a statistical evaluation of the experimental error is not prac-
tical. A quantitative measure of the effect of the ultrahigh
vacuum is the ratioof the kinetic friction coefficient in vacuum
over that in air, _cv:_c a. These ratios, tabulated in various
groupings in Table 6, allow a simple comparison of average values,
which can serve as a basis for a tentative evaluation of the ef-
fect of each variable.
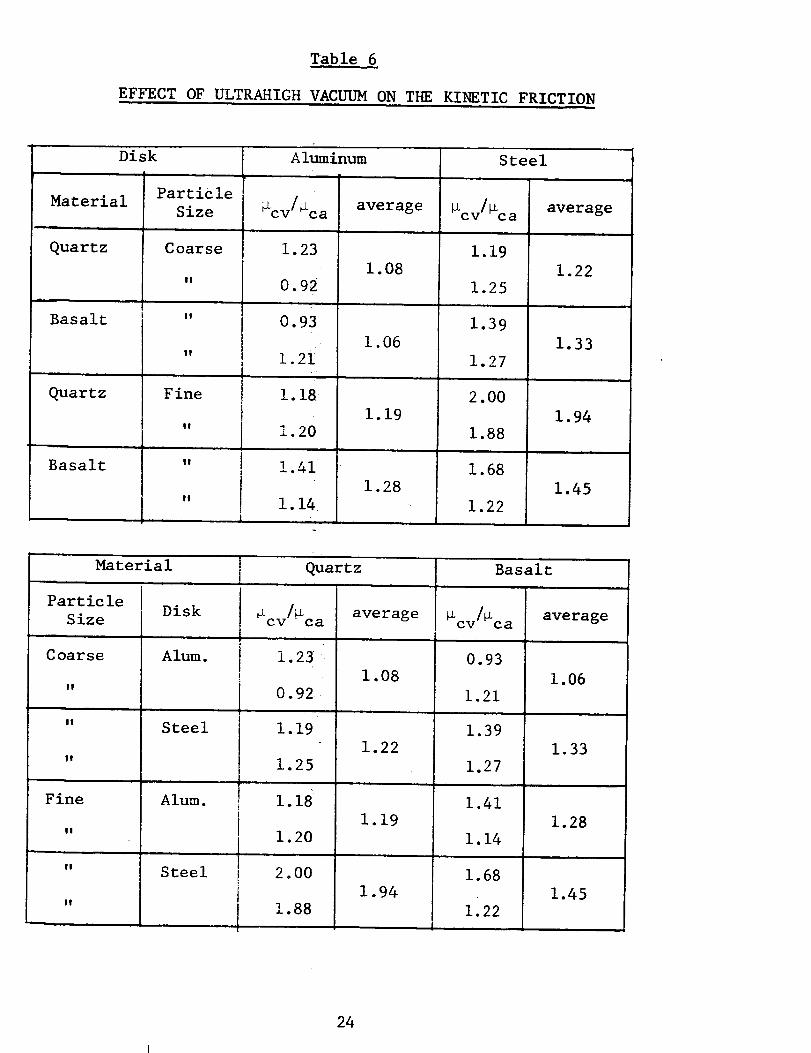
From Table 6, the following tentative conclusions can be
drawn. Generally, there is an increase in the coefficient of
kinetic friction when the materials are exposed to ultrahigh
vacuum. There were, however, a few instances when a lower co-
efficient of kinetic friction was observed in ultrahigh vacuum
than in air. Since the difference between the observed values is
less than the experimental error (_cv = 0.24 versus _ca = 0.26
in test No. 4 and _cv = 0.26 versus _ca = 0.28 in test No. 9),
and the results were not duplicated in the parallel tests, the
observed lower values are not considered to represent a trend
different from that observed in all of the other tests of the
testing program. It is also noted here, that the uncontrolled
loosening of the sample bed during b@king and pump-down might
have contributed to a lower coefficient of friction in these
tests.
23
EFFECT OF ULTRAHIGH
Table 6
VACUUM ON THE KINETIC FRICTION
Disk
Material
Quartz
a
Basalt
Quartz
Basalt
Particle
Size
Coarse
11
I II
11
II
I!
Aluminum
_cv/_Ca
1.23
0.92
0.93
1.21
1.18
1.20
! .41
i. 14
average
1.08
I .06
i. 19
i .28
Steel
_cv/_ca
1.19
1.25
1.39
1.27
2.00
1.88
1.68
1.22
average
1.22
1.33
1.94
1.45
Material
Particle
Size
Coarse
11
I!
!!
Fine
!1
!!
!!
Disk
Alum.
Steel
Alum.
Steel
Quartz
cvl_ca
0.92 •
I. 19
1.25
i. 18
1.20
2.00
1.88
average
i .08
1.22
1.19
1.94
Basalt
_cv/_ca
0.93
1.21
1.39
1.27
1.41
1.14
1.68
1.22
average
i .06
1.33
1.28
1.45
24
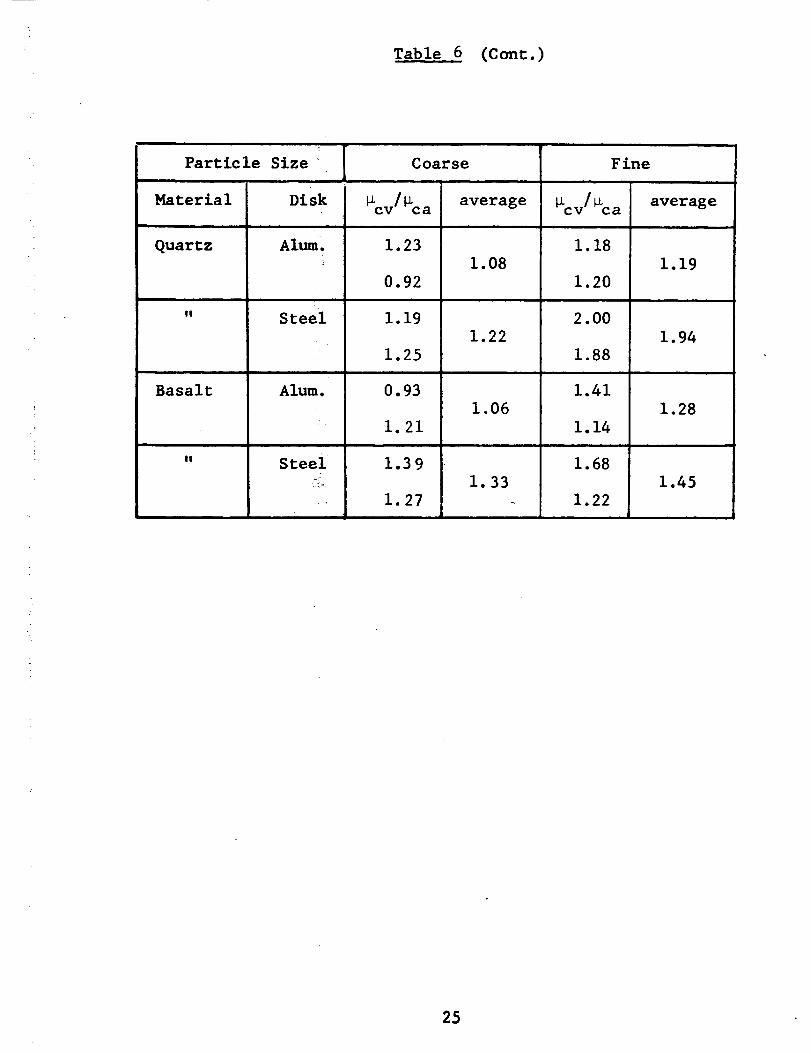
Table 6 (Cont.)
Part ic le
i
Material
Quartz
I!
Basalt
to
Size
Disk
Alum.
Steel
Alum.
Steel
Coarse
vl ca
1.23
0.92
i i
1.19
1.25
0.93
1.21
1.39
1.27
average
1.08
1.22
1.06
1.33
F ine
, , J
_cv/_ca
I. 18
1.20
2.00
i .88
1.41
1.14
1.68
1.22
average
1.19
1.94
1.28
1.45
25
The effect of the individual variables on the kinetic
coefficient of friction in ultrahigh vacuum is evaluated asfollows:
Effect of type of disk. A glance at the first tabulation of
Table 6 indicates that the _cv/_ca ratio is consistently higher
for steel than for aluminum.
Effect of t_pe of granular material. The second tabulation in
Table 6 indicates no consistent trend in favor of either material.
Effect of particle size. The third tabulation in Table 6
indicates that the _cv/_ca values are consistently higher for
the fine material than for the coarse.
From the additional four tests, further information on the
kinetic friction could only be obtained from test No. 39. This
test conducted at a high rotational speed (25 rpm) did not show
any significant effect of the speed of rotation on kinetic fric-tion.
As indicated before, the values of the coefficient of kinetic
friction were determined from the torNue values observed during
the first revolution. This coefficient was found to change during
the test encompassing three revolutions. In some cases, changes
in the calculated coefficient of friction were observed even during
the first revolution. The coefficients of friction indicated in
the tabulation are those evaluated on the basis that the first
degree fits are valid at the beginning of the rotation, but not
after the initial frictionbecomes kinetic. In most cases, the
calculated value of the kinetic friction tended to decrease with
rotation; this is attributed to changes in the pressure distribu-
tion beneath the disk and the resulting change in the torque arm
rather than to a decrease in the friction. In other cases, an in-
crease of the calculated value of the coefficient of friction was
observed. This increase is attributed to an increase of the rough-
ness of the metal disk as rotation progressed. Typical of this
case are test Nos. i0 and 12, each of which demonstrated an increase
in the kinetic friction with continuing rotation; these tests also
showed the greatest increase in the roughness of the metal disk
(from 4 to 5-13 microinches in test No. i0 and from 4 to 5-20
microinches in test No. 12).
26
Miscellaneous Observations
In the tests performed with fine materials, sticking of
fine particles to the metals was observed. Some of the parti-
cles adhered to the metal even after the vacuum was released.
Fig. 13 shows a disk with adhering particles after the release
of vacuum. The observed sticking of the particles supports the
theory of the initial friction being adhesive in nature.
In some of the tests, it was observed that the grains in
the container cup adhered so strongly to each other, even after
the vacuum was released, that appreciable effort with a metal
scoop was required to remove them from the cup. A review of
the histories of the tests where such behavior was observed did
not reveal any cause for the coherence of the granular material
to be higher in these tests than in others.
27
L
Vl. CONCLUSIONS AND RECOMMENDATIONS
The series of frictionexperiments conducted in ultrahigh
vacuum (at pressures below :2 x 10 -9 torr) with various combi-
nations of metals and granular materials show that ultrahigh
vacuum affects the frictional resistance between these dissimi-
lar materials in two ways. "iFirst, at the beginning of sliding
motion, an initial frictional resistance develops that is about
50 to 150% higher than that experienced under normal atmospheric
conditions. Second, the coefficient of kinetic friction is
about 6 to 97% higher, depending upon the particular combina-
tion of metal and granular material, than that observed under
atmospheric conditions. In general, even the higher values of
kinetic friction obtained in ultrahigh vacuum are low compared
to soil-to-soil friction values of materials similar to those
tested and metal on soil friction coefficients commonly en-
countered in foundation construction.
Because of the present program' s limitations, no conclusions
concerning the cohesive oriilfrictional nature of the initial fric-
tional resistance can be drawn at this time. It is recommended
that the nature of the initial frictional resistance be investi-
gated by further experiments in which the vertical load is the
main variable. It is also_-recommended that the rotational dis-
placement necessary to deveioP the initial frictional resistance
be measured. This information is useful for the application of
the data to lunar locomotion studies.
During the testing program, only metals with surface fin-
ishes in the 3-6 microinch range were used. In any application
where a higher coefficient of friction is desired, the obvious
way to achieve this would _be to use metals with rougher surfaces.
Surface roughness is expected to affect the coefficient of fric-
tion in relation to the particle size. Any increase in the co-
efficient of friction is, however, limited by the internal fric-
tion of the granular material. It is recommended that the effect
of surface roughness on t_ coefficient of friction be investiga-
ted in a new testing program.
As reported in Section II, various improvements in the test-
ing technique were made in the course of the development of the
design Of the vacuum equipment, friction measuring apparatus, amd
associated instrumentation. As a result of the experimental ob-
servations, the following recommendations are made to improve
further the testing technique.
28
A method should be devised by which changes in the compact-
ness of the granular sample during outgassing would be prevented.
Annular disks, instead of full disks, should be used to avoid the
effect of changes in pressure distribution during rotation.
The linear measure of the surface roughness as determined
by the profilometer+.for this test series indicates only the maxi-
mum depth of the surface asperities without giving information of
the frequency of oc-curence of such asperities within a certain
area of the disk. Since the frictional properties are affected by
both the depth and _tbe frequency (or density) of the surface as-
perities, it is deslrable to develop a more meaningful method for
the measurement of both of these properties.
In the present system strain gauges are placed outside the
vacuum chamber thereby resulting in a strain gauge balance where,
due to the extremely _low stresses, some interaction of the torque
gauges with latera!!:ioads is unavoidable. It is recon_nended that
the applicability of strain gauges inside the vacuum chamber be
studied with particular attention given to their outgassing char-
acteristics. A strain gauge balance that is less sensitive to
lateral loads shouldbe designed and placed inside the vacuum
chamber.
r ,
29
.
VII. REFERENCES
Karafiath, L. L., Some Aspects of the Determination of theCoefficient of Friction between Metals and Soils and its
Application to Lunar Locomotion Studies, Grumman Research
Department Memorandum RM-379, October 1967.
30
NRC RotaryDrive
Bayonet Coupling forTransmitting
Bellows, Linear:ravel 3/4 inch
Spacer for FixingHeight
Weight for_rma[ Load
Disk Holder-
Boron
Granular
SpecimenContainer
1 1/2 Dia Metal Disc
(Rotating Specimen)
Frictional TorsionStrain Gauges
Guide
Port
Strain GaugeBalance
'_' Normal Forces
'-'Strain Gauges
Fig. I FrlctionMeasurlng Apparatus
31
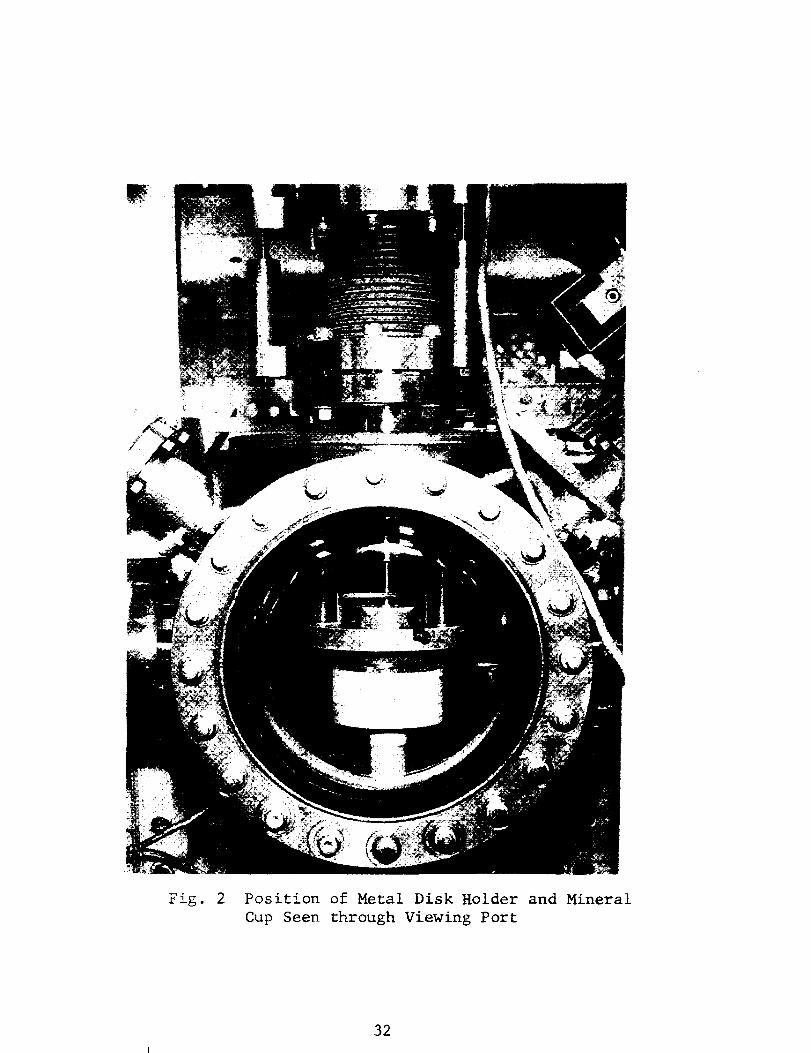
Fig. 2 Position of Metal Disk Holder and Mineral
Cup Seen through Viewing Port
32
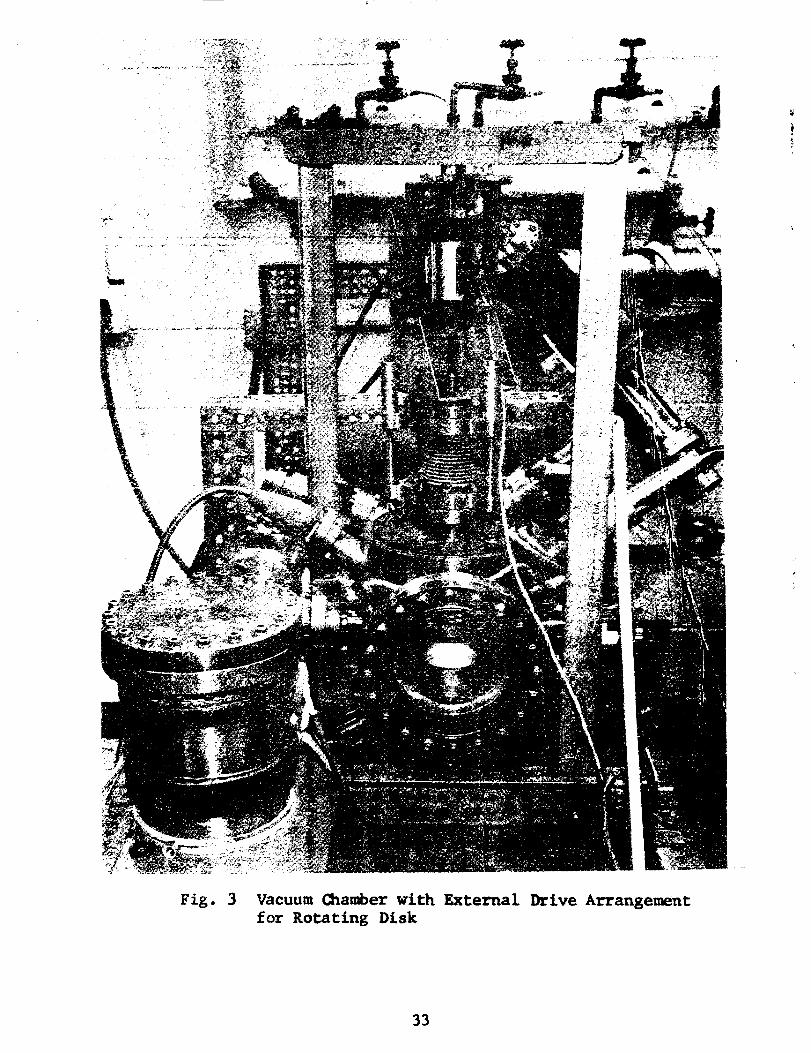
Fig. 3 Vacuum Chamber with External
for Rotating DiskDrive Arrangement
33
o_
g_
_J
C_
o_
34
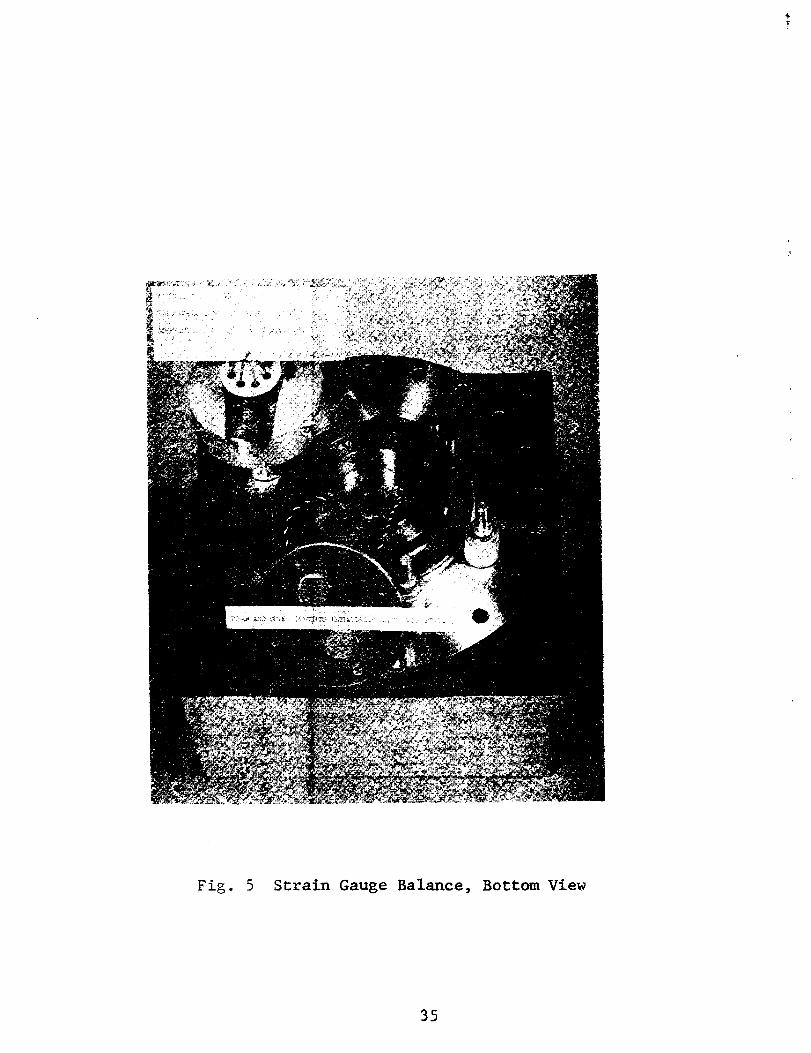
Fig. 5 Strain Gauge Balance, Bottom View
35
q_
ct_
_Jc_
c__4_Jv_
o_
36
|
_J
0
J,J
L_c_
o
._I
37
UHVScale
8
6u_
'o 4..,4
2
86
2
m
m
m
Outgas Ti_aniu m Filaments
8
6
T 4-
f-4
2
8
6-
_o 4 I-r-4
8_
o 6
Ic_ 4,"4
2
8-
I 4 --
2 -
0
& Gauges
•l I
I | I
(Titanium Sublimation Pump,Ion Pump, He - Cryopump)
I" I i t I I 1 I
200 300
Ttme, minutes
I t I I| I I I
i00 400 50O
Fig. 8 Pressure Evolution after Baking
I i I I_00
38
/
/P
"b
oo_,-
__-:__!!-1,-_q,--.
r ! I i00| , _ _
_;!'l -( -
. i ]i
i;i _].
I i ....i T -gq L --
I i i i
- I I
, ;i 1
I[
I
i i i I I_"
_ i 0 r
', i.I__i' I!": ; : _ k
_ q _,j: _ '_
---_ _
I
E
F--9
x 10
I !
0 1 2
___End of Rotationx 10 °10 Torr
_"_Start of Rotation
x 10 °10 Torr
I,3 "
i l I I I I I
4 5 6 7 8 9 10
Pressure (x indicated multiplier)
Fig. Ii Recordings of Pressure Evolution During Test #35
41
_d
x 10 -9
x 10 -10
_kEnd of Rotation
Pt = x I0 -I0
Lma.--
L
. Drive Motor Test
b
(GE Gauge)
I I I I I I I I I I
0 1 2 3 4 5 6 '7 8 9 10
Pressure (x indicated multiplier)
Fig. 12 Recording of Pressure Evolution During Test #37
42
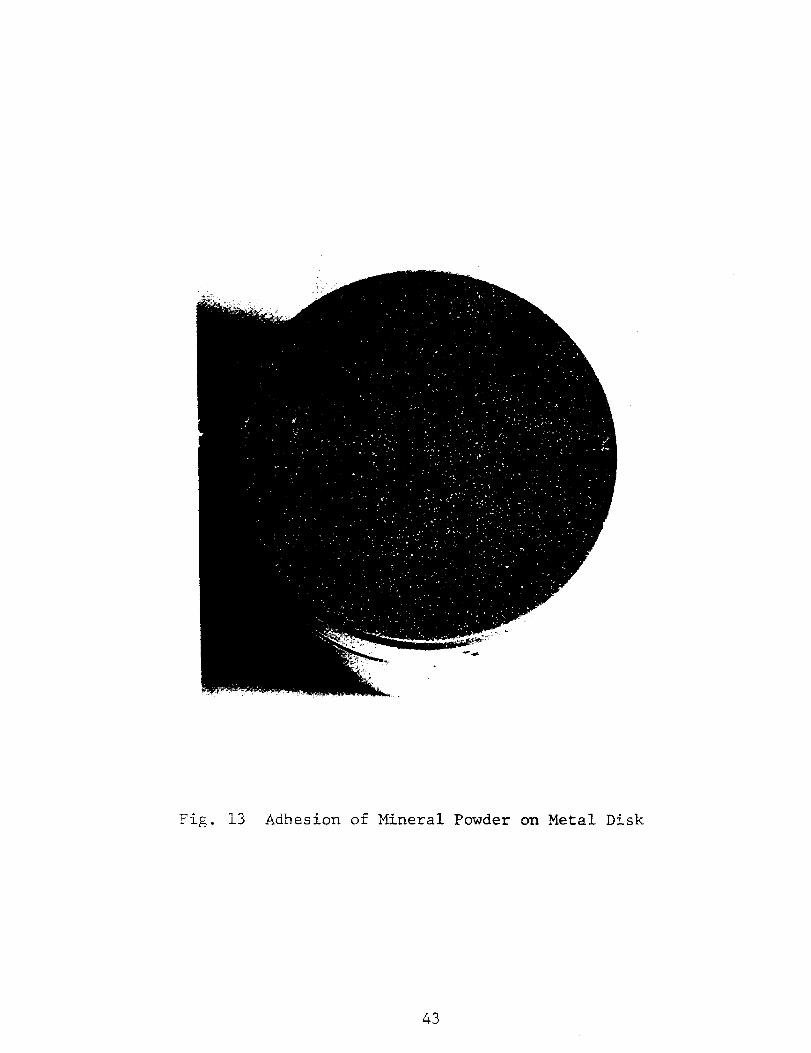
Fig. 13 Adhesion of Mineral Powder on Metal Disk
43
\
Fig. 14 Appearance of Powder Specimen after Test
(Typical of Vacuum Tests)
44
Fig _ _. _ Appearance of Powder Specimen after Test
_,_yplca_ of Air Tests)
45
_6
I
M
K
!o
x
M
I
o
i °Q
o !
oo
o
_JI
o J,_
o_
!
in
¢D
iC_mint
qD
I0E--
X
X
X
X
X
X
X
XX
X
¢r_
X
X
X
X
XX
KX
XX
X
xxX
x x
X
X
XX
XX
X
7,0-"u_ '_uamoR
47
J
48
IP
A
•!..I CJ
:3t_
m
Ov
bO
O_U W
aov-i
.rlr_
["4
O0
0 C_",4
00_•r4 0
LW 00 m
0
0 0
_CJ_ m
O_
_v
49
Iltlilli
.I.I
[-o
t.I
0,,-4
0
0W
0
°_U
0
-i-I
APPENDIX A
PREPARATION OF GRANULAR MATERIAL
In order to obtain the specified range of particle sizes
from the bulk material, various methods of comminuting, sifting,
and washing were tried.
._mr se Materials
The procedure adopted for the preparation of coarse granular
material (250-500 microns) is as follows:
I. Material, as received, is crushed manually
until it passes a No. 8 US-standard sieve.
"i
2. Fine particles, below 105 microns (140 mesh)
are eliminated by sieving the crushed mate-
rial in a motor-driven Ty-Lab tester. The
total weight sieved in one operation is
approximately 300 grams; the sieving-timeis 20minutes. For several of the sieves
containing the finer materials, sieving iscontinued for an additional i0 minutes.
This has proven helpful for removing very
fine particles (below 38 microns) from the
mixture.
3. The t6tal yield of particles produced be-
tween 500 and 250_ is then placed in
a 250'mesh sieve and washed with flowing tap
water, The sieve is gently agitated until
the water flowing through the material and
the screen is clear. (Particles below 250_
are stored for ball milling at a later time.)
4. Particles between 8 mesh and 500_ are
placed in a ball mill, approximately 900 grams
per charge, and milled for 1-1/2 hours. The
grinding medium is I/2-inch diameter tungsten
carbide balls.
51
5. The procedure outlined under steps 2, 3,
and 4 is repeated.
A check test on the size distribution of a coarse basalt
sample prepared by the above method showed the following results.
SIZE DISTRIBUTION OF COARSE BASALT PARTICLES
(250-500 )
Sieve Opening
(microns) U.S. Sieve No_'
Weight between Sieves (grams)
First Run Second Run Third Run
500 35
420 40
350 45
297 50
250 60
210 70
pan
k
29.2 29.9 31.3
29.1 29.0 29.0
21.0 20.6 21.3
25.0 24.7 24.0
4.9 3.6 3.5
1.0 i .2 0.3
TOTAL Ii0.2 109.0 109.3
Fine Materials
The preparation of the/fine material presented problems
inasmuch as comminution by hand-crushing in a stainless steel
mortar into coarse particles ranging from 500 to 1700_ and
ball milling (tungsten carbide balls) for about two hours
yielded very small amounts of the required sizes, as the follow-
ing tabulation of weights shows.
Weight Grain Size % By Weight
g
42 < 38 4
48 38-62 5
126 62-250 13
220 250-500 22
§64 > 500 56
i000 I00
52
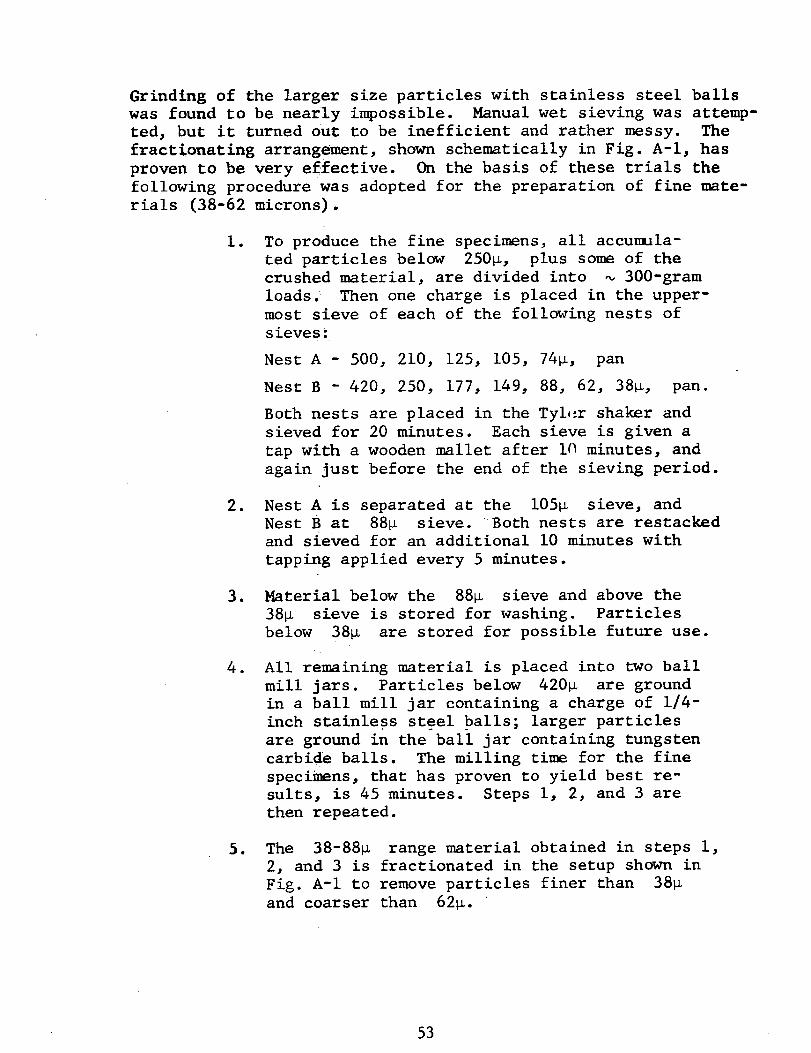
Grinding of the larger size particles with stainless steel balls
was found to be nearly impossible. Manual wet sieving was attemp-
ted, but it turned out to be inefficient and rather messy. The
fractionating arrangement, shown schematically in Fig. A-I, has
proven to be very effective. On the basis of these trials the
following procedure was adopted for the preparation of fine mate-
rials (38-62 microns)•
• To produce the fine specimens, all accumula-
ted particles below 250_, plus some of the
crushed material, are divided into _ 300-gram
loads. Then one charge is placed in the upper-
most sieve of each of the following nests of
sieves.
Nest A- 500, 210, 125, 105, 74_, pan
Nest B- 420, 250, 177, 149, 88, 62, 38_, pan.
Both nests are placed in the Tyl_r shaker and
sieved for 20 minutes• Each sieve is given a
tap with a wooden mallet after i0 minutes, and
again just before the end of the sieving period•
• Nest A is separated at the i05_ sieve, and
Nest B_at 88_ sieve. Both nests are restacked
and sieved for an additional I0 minutes with
tapping applied every 5 minutes•
• Material below the 88_ sieve and above the
38_ sieve is stored for washing• Particles
below 38_ are stored for possible future use.
• All remaining material is placed into two ball
mill jars. Particles below 420_ are ground
in a ball mill jar containing a charge of 1/4-
inch stainless steel balls; larger particles
are ground in the ball jar containing tungsten
carbide balls. The milling time for the fine
specimens, that has proven to yield best re-
suits, is 45 minutes• Steps i, 2, and 3 are
then repeated.
• The 38-88_ range material obtained in steps i,
2, and 3 is fractionated in the setup shown in
Fig. A-I to remove particles finer than 38_
and coarser than 62_.
53
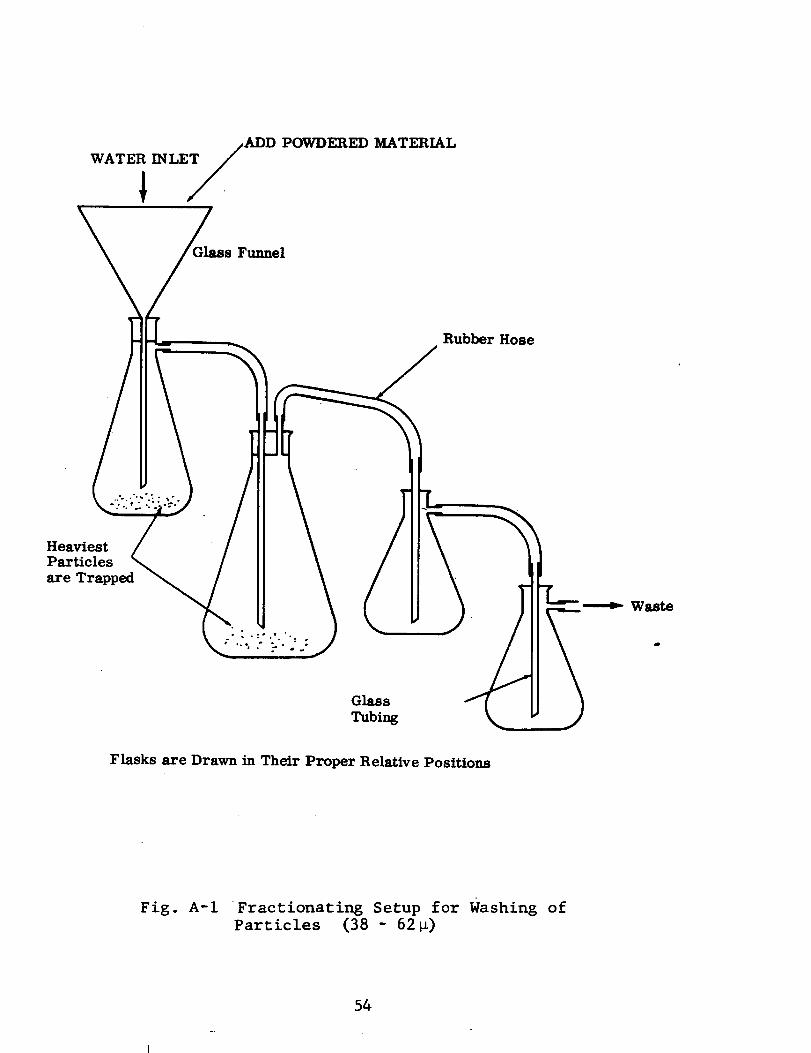
WATER INLEy ADD
POWDERED MATERIAL
Funnel
Rubber Hose
HeaviestParticles
are Trapped
Waste
Glass
Tubing
Flasks are Drawn in Their Proper Relative Positions
Fig. A-I Fractionating Setup for Washing of
Particles (38 - 62_)
54
ApPENDIX B
OUTGASSING RATES OF MINERAL POWDERS
Difficulties in pumping down the vacuum systems, when mineral
specimens taken off the shelf were placed inside the chambers,
made it necessary to measure outgassing rates for basalt and
quartz powders in the particle size ranges specified by the con-
tract. The powders were placed inside a small container and baked
between 5 and 7 hours at approximately 350°C. Due to the very
high outgassing rates during the baking cycle, the ion pumps of
the system had to be valved off; i.e., only the sorption pumps
could be used durin_ baking. Consequently, the pressure was never
lower than 5 x 10- ° torr during this part of the baking. At the
completion of baking, the sample container was air-cooled by
means of two blowers. After approximately 1/2 hour, the container
walls were at room temperature. Then the ion pump valve was
slowly opened, the sorption pump closed as soon as the ion pumps
indicated that they functioned normally, and the pump-down con-
tinued until an equilibrium pressure was reached.
The results of this outgassing is illustrated in Fig. B-I.
First, a pump-down of the empty sample container is performed to
establish curve I. Curves II and III are established by re-
cording the pressure evolution of the samples, beginning with the
opening of the ion pump valve. The outgassing rate of the powders
can now be calculated from the equation
where Api
Api • S
qi w
and, consequently,
St orr- liter _
Ise'c '-'g'ms J ' (B-l)
qi are functions of time,
wqi = gas load due to the outgassing of 55 gms of thespecimen material after i hours of pumping,
Api = increase in pressure due to this gas load intorr, and
S = pumping speed in liters/second.
55
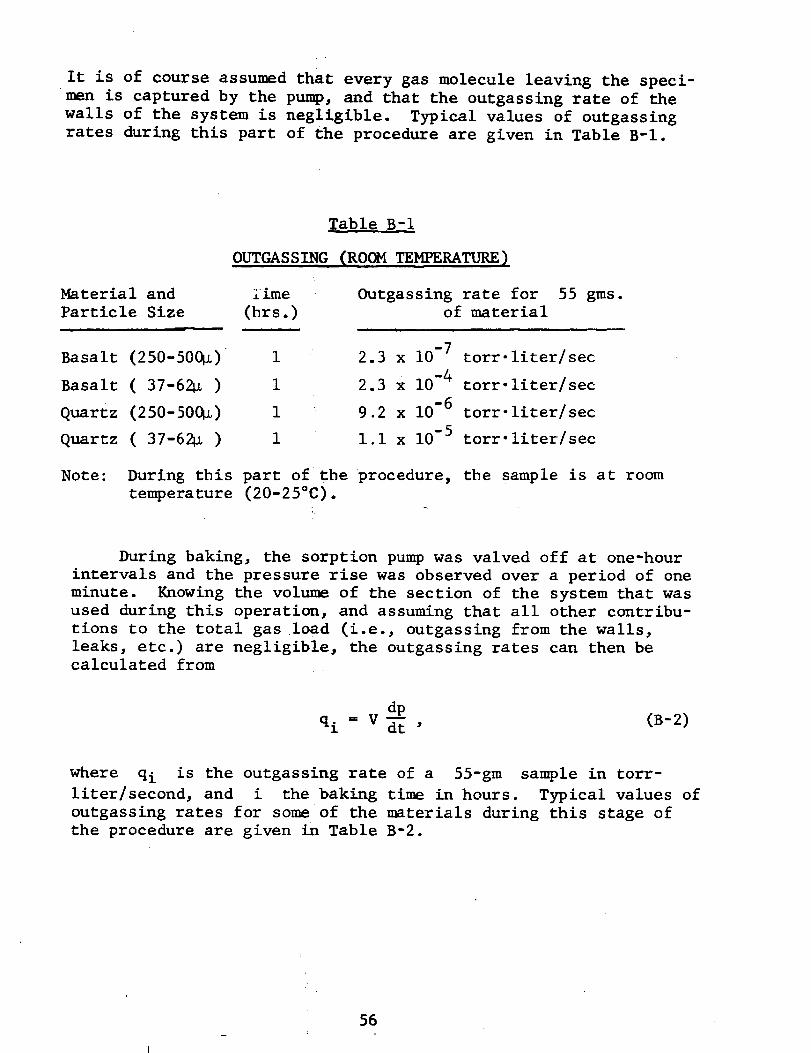
It is of course assumed that every gas molecule leaving the speci-men is captured by the pump, and that the outgassing rate of thewalls of the system is negligible. Typical values of outgassingrates during this part of the procedure are given in Table B-I.
Table B-I
OUTGASSING (ROOM TEMPERATURE )
Material and
Particle Size
-m
Basalt (250-500_) i
Basalt ( 37-62_ ) i
Quartz (250-500_) I
Quartz ( 37-62_ ) I
iime
(hrs.)Outgassing rate for 55 gms.
of material
ii -,, i i
2.3 x 10 -7 torr-liter/sec
2.3 x 10 -4 torr'liter/sec
9.2 x i0 "6 torr-liter/sec
i.I x 10 -5 torr-liter/sec
Note: During this part of the procedure, the sample is at room
temperature (20-25°C).
During baking, the sorption pump was valved off at one-hour
intervals and the pressure rise was observed over a period of one
minute. Knowing the volume of the section of the system that was
used during this operation, and assuming that all other contribu-
tions to the total gas load (i.e., outgassing from the walls,
leaks, etc.) are negligible, the outgassing rates can then be
calculated from
dp
qi = V d--t" (B-2)
where qi is the outgassing rate of a 55-gm sample in torr-
liter/second, and i the baking time in hours. Typical values of
outgassing rates for some of the materials during this stage of
the procedure are given in Table B-2.
56a
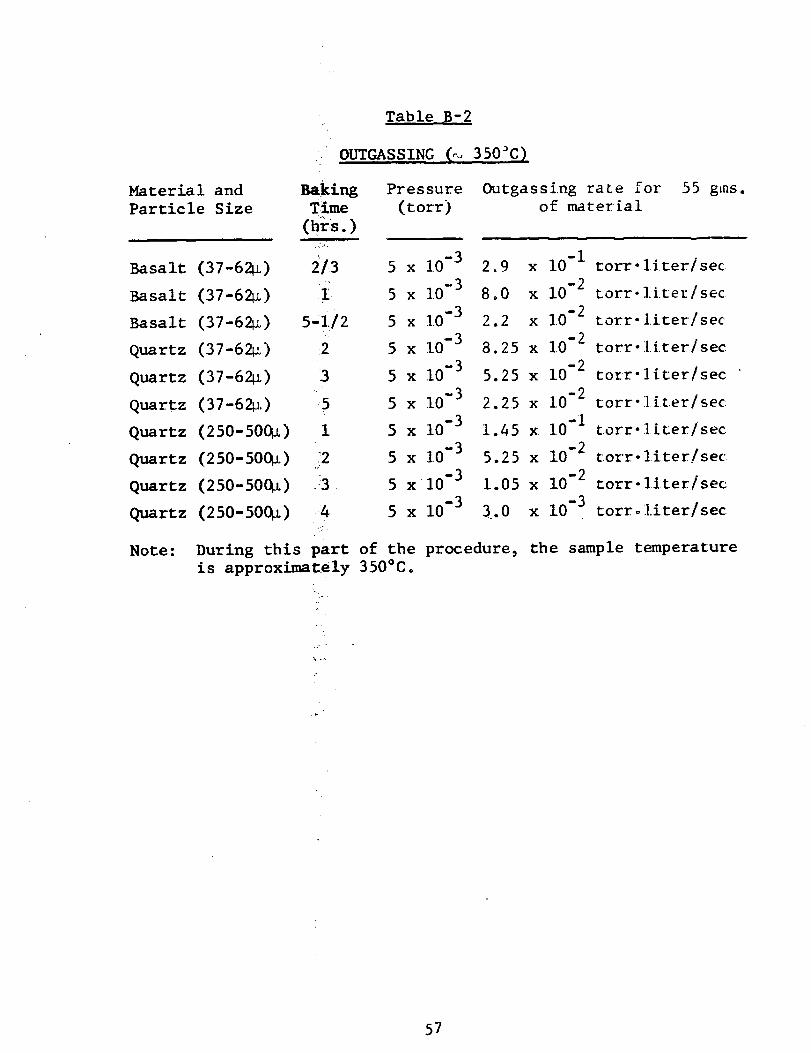
Table B-2
OUTGASSING (_.,.3.50_C)
Material and Baking
Particle Size Time
Basalt (37-62_) 2/3
Basalt (37-62_L) !
Basalt (37-624z) 5"!_/2
Quartz (37-62_) 2
Quartz (37-62_) 3
Quartz (37-62_.) 5
Quartz (250-500_) I
Quartz (250-500_) _2
Quartz (250-500_) 3
Quartz (250-500_) 4.,,'.
Note: During this part
is approximately
Pressure Outgassing rate for 55 gins.
(tort) of material
5 x 10 -3 2,9 x i0 -I torr-liter/sec
5 x 10 -3 8.0 x 10 -2 torr-lite_/sec
5 x 10 -3 2.2 x 10 -2 torr-liter/sec
5 x 10 -3 8.25 x 10 -2 torr-liter/sec
5 x 10 -3 5.25 x 10 -2 torr-]iter/sec
5 x 10 -3 2.25 x 10 -2 torr-]iter/sec:
5 x 10 -3 1.45 x 10 "I torr-liter/sec
5 x 10 -3 5.25 x 10 -2 torr-liter/sec
5 x 10 -3 1.05 x 10 -2 torr-liter/sec
5 x 10 -3 3_.0 x 10 -3 torroliter/sec
of the procedure, the sample temperature
350°C.
57