Embed Size (px)
Citation preview

GRUH Finance LimitedGRUH Finance Limited(A Subsidiary of HDFC Limited)(A Subsidiary of HDFC Limited)
Sept 2017
1

GRUH PROFILEGRUH PROFILE
2 2

• Promoted by HDFC & AKFED on July 21, 1986
• Commenced operations in 1988 from Ahmedabad
• A subsidiary of HDFC - Since June 2000A subsidiary of HDFC Since June 2000
• Regulated by National Housing Bank (NHB) – Wholly
owned subsidiary of Reserve Bank of India (RBI)
• Recognized by NHB for Refinance facility• Recognized by NHB for Refinance facility
3

As on Sept. 30, 2017
• Cumulative Housing Units Financed – 3,87,764
• Cumulative Disbursement of Rs. 25,459 Cr.
• Cumulative Disbursement in Rural Areas(*) – Rs. 11,736 Cr.
• Retail Network of 187 offices across 11 States & one UT• Retail Network of 187 offices across 11 States & one UT
• Consistent track record of Dividend Payout
(*) Rural Areas are locations where populations is less than 50,000
4
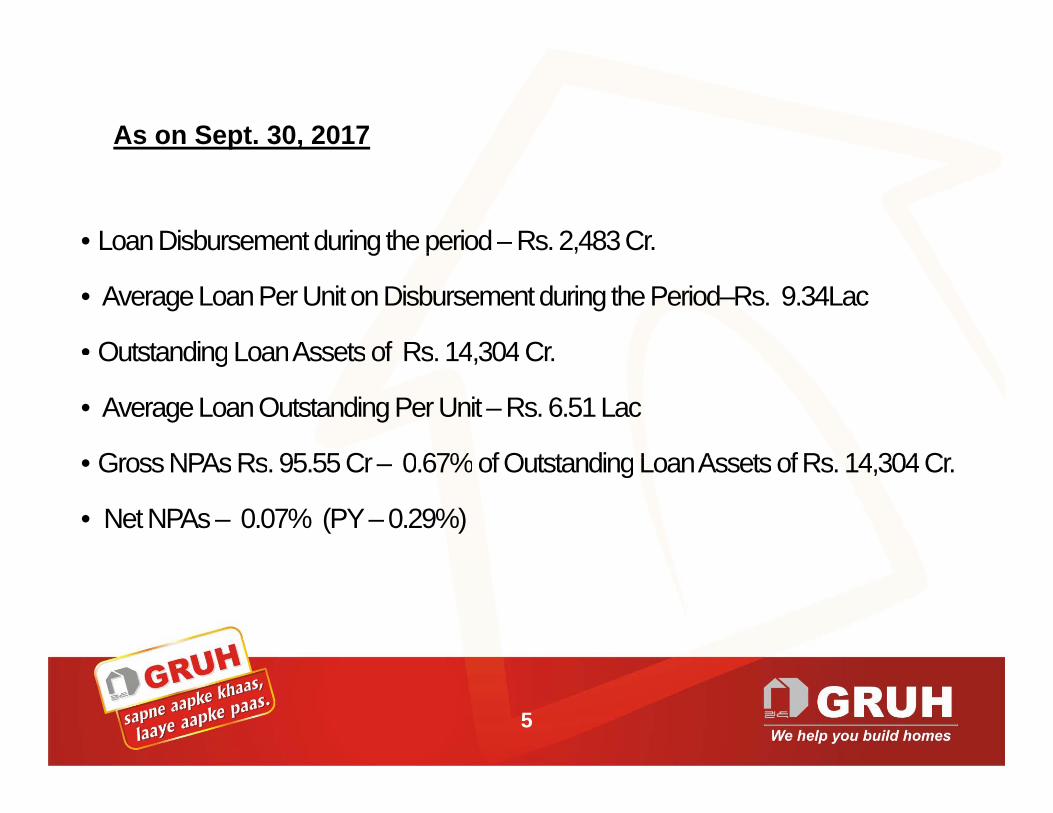
As on Sept. 30, 2017
• LoanDisbursementduring the period – Rs.2,483Cr.g p ,
• AverageLoanPer Unit onDisbursementduring the Period–Rs. 9.34Lac
• OutstandingLoanAssets of Rs 14 304 CrOutstandingLoanAssets of Rs. 14,304 Cr.
• AverageLoanOutstanding Per Unit – Rs. 6.51Lac
GrossNPAs Rs 95 55 Cr 0 67%of OutstandingLoanAssets of Rs 14 304Cr• GrossNPAs Rs. 95.55 Cr– 0.67%of OutstandingLoanAssets of Rs. 14,304Cr.
• Net NPAs – 0.07% (PY– 0.29%)
5

Ratingsg• Public Deposits :
– ‘MAAA’ by ICRA and– ‘FAAA’ by CRISIL
• Non-Convertible Debentures : ‘AAA (Stable)’ by ICRA and CRISILand CRISIL
• Subordinated NCD: ‘AAA (Stable)’ by ICRA and CRISIL• Commercial Paper : ‘A1+’ by ICRA and CRISILCommercial Paper : A1+ by ICRA and CRISIL
“These rating indicates high safety with regard to timely t f i t t d i i l”payment of interest and principal”
6

GRUH PERFORMANCEGRUH PERFORMANCE
7 7

Disbursements(Rs. in Crores)
2500
3000
2,483
2000
1000
1500
960
500
0Sept'12 Sept'13 Sept'14 Sept'15 Sept'16 Sept'17
88

Loan Assets(Rs. in Crores)
14000
16000
14,304
10000
12000
6000
8000
4,672
2000
4000
0Sept'12 Sept'13 Sept'14 Sept'15 Sept'16 Sept'17
99

Profit After Tax(Rs. in Crores)
160 150
100
120
140
160 150
40
60
80
100
54
0
20
40
Sept'12 Sept'13 Sept'14 Sept'15 Sept'16 Sept'17
1010

NIM and NIM to ATA
5.5
5.7
5.9
270
300
330 310
4.7
4.9
5.1
5.3
150
180
210
240
4 39cror
es)
3.9
4.1
4.3
4.5
60
90
120
150
4.14
4.39125
(Rs.
in
3.5
3.7
3.9
0
30
Sept'13 Sept'14 Sept'15 Sept'16 Sept'17
NIM (Rs. In crores) NIM to ATA (%)
1111
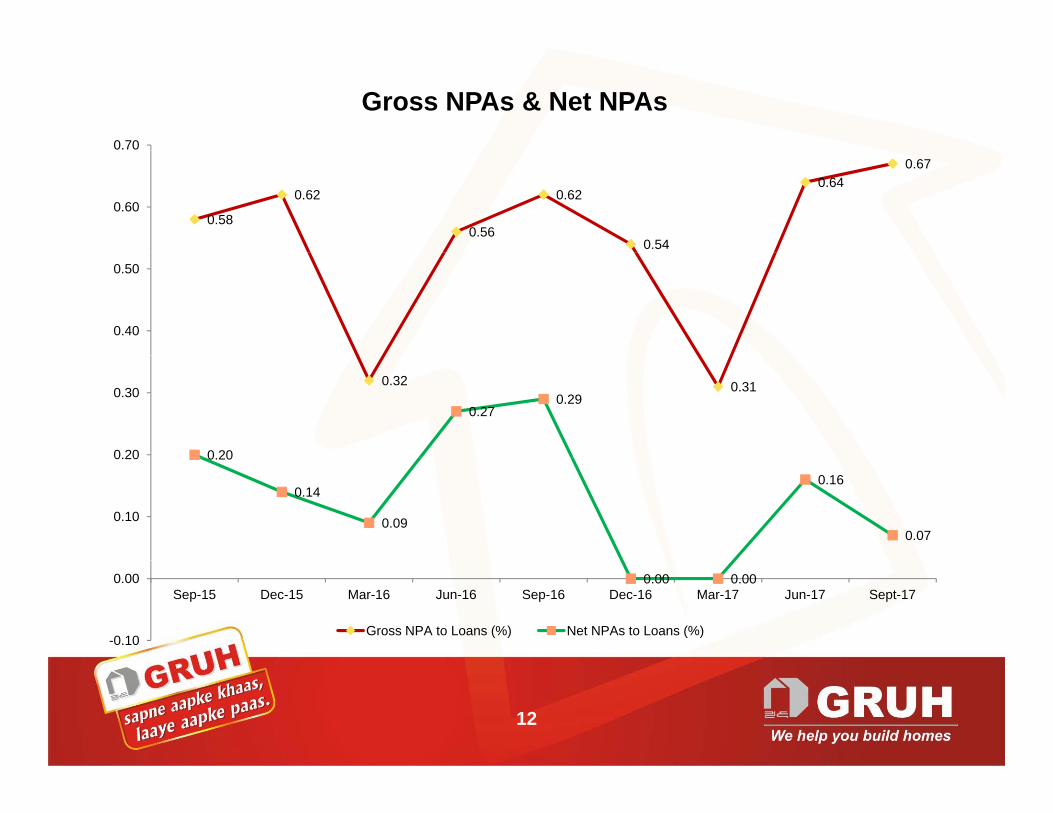
Gross NPAs & Net NPAs0.70
0.58
0.62
0.56
0.62
0.54
0.640.67
0.60
0.40
0.50
0.32 0.31
0 20
0.270.29
0.20
0.30
0.20
0.14
0.09
0.16
0.070.10
0.20
0.00 0.00
-0.10
0.00Sep-15 Dec-15 Mar-16 Jun-16 Sep-16 Dec-16 Mar-17 Jun-17 Sept-17
Gross NPA to Loans (%) Net NPAs to Loans (%)
12

Provisions & Contingencies 70 00
51.4453.90
56.7159.04
63.1364.63 65.56
52.55
61.6060.00
70.00
In C
rore
)
43.21
47.23
51.44
34.97
41.78
40.00
50.00
(Rs.
23.96 23.96 23.9624.61
16 6319.45
22.92
20.00
30.00
13.6515.67
8.54
14.46 16.06 15.6316.63 16.63
10.00
20.00
0.00Sep- 15 Dec- 15 Mar- 16 Jun- 16 Sep- 16 Dec - 16 Mar - 17 Jun- 17 Sept- 17
Provision for NPAs Provision for Standarad Assets Provision for Contingencies
13

NIM & NIE to Average Total Assets
4.38 4.394 00
4.50
5.00
4.03 4.05 4.083.90 3.92
4.11 4.204.38
3.00
3.50
4.00
1.50
2.00
2.50
0.88 0.83 0.790.67 0.78 0.74 0.72 0.72 0.77
0 00
0.50
1.00
0.00Sep- 15 Dec- 15 Mar- 16 Jun- 16 Sep - 16 Dec - 16 Mar - 17 Jun - 17 Sept - 17
Net Interest Margin to Average Total Assets(%) Non-Interest Expenses to Average Total Assets (%)
14

PBT & PAT to Average Total Assets
3.20
3.15
3.51
3.11
3.53
3 13
3.22
3 00
3.50
4.00
2 0
2.36
2.05 2.372 09 2 12
3.06 3.09 3.13
2 00
2.50
3.00
2.112.07 2.05 2.04 2.09 2.12
1.00
1.50
2.00
0.00
0.50
S t 15 D 15 M 16 J 16 S 16 D 16 M 17 J 17 S t 17Sept- 15 Dec- 15 Mar- 16 Jun - 16 Sep - 16 Dec - 16 Mar - 17 Jun- 17 Sept- 17
PAT to Average Total Assets (%) PBT to Average Total Assets (%)
15
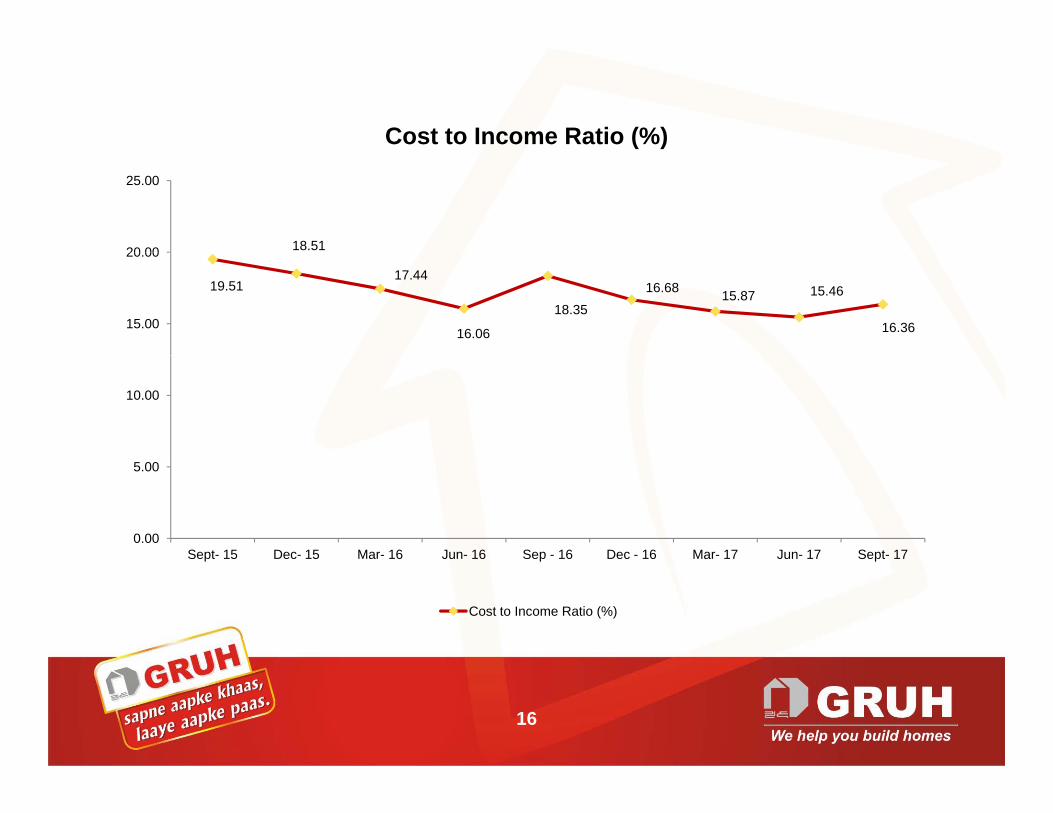
Cost to Income Ratio (%)
18.5120 00
25.00
19.5117.44
16.06
18.3516.68 15.87 15.46
16.3615.00
20.00
10.00
0.00
5.00
Sept- 15 Dec- 15 Mar- 16 Jun- 16 Sep - 16 Dec - 16 Mar- 17 Jun- 17 Sept- 17p p p
Cost to Income Ratio (%)
16

Loan DisbursementsLoan DisbursementsAs at
Sept 30 2017As at
Sept 30 2016Growth
(Rs. in Crores)
Sept 30, 2017 Sept 30, 2016
Amount Amount %
Home Loans * 1908 61 1474 05 29 48Home Loans * 1908.61 1474.05 29.48
Mortgage (LAP) Loans * 277.76 218.96 26.85
NRP Loans * 37 49 30 19 24 18NRP Loans * 37.49 30.19 24.18
Developer Loans 259.07 221.61 16.90
T t l 2482 93 1944 80 27 67Total 2482.93 1944.80 27.67
(*) Individual Loans
17

Outstanding Loans (Rs. in Crores)
As at Sept. 30, 2017 As at Sept. 30, 2016
Amount % Amount %
Suraksha Home Loans 7320.55 51.18 6332.64 52.38
Suvidha Home Loans 4282.61 29.94 3430.49 28.38
S j t R i L 122 18 0 85 57 66 0 48Sajavat Repair Loans 122.18 0.85 57.66 0.48
Total Home Loans * 11727.41 81.99 9820.79 81.23
Mortgage (LAP) Loans * 1593.03 11.14 1385.18 11.46g g ( )
NRP Loans * 412.53 2.88 382.00 3.16
Developer Loans 573.15 4.01 501.16 4.15
Total 14304.25 100.00 12089.13 100.00
(*) Individual LoansLoan Asset Growth of 18%
18

Loan Portfolio-wise NPLAs at Sept. 30, 2017 As at Sept. 30, 2016
Amount % Amount %
H L * 69 27 0 59 49 43 0 50Home Loans * 69.27 0.59 49.43 0.50
Mortgage (LAP) Loans * 19.03 1.19 15.70 1.13
NRP Loans * 7.25 1.77 9.45 2.47
Developer Loans 0.00 0.00 0.00 0.00
Total 95.55 0.67 74.57 0.62
(*) Individual Loans
19 19

Assets Profile
1.05%%
1.43%
1.41% 1.54% 1.09%
0.09% 0.11% 0.17%
98%
99%
100%
1.05%1.12%
96%
97%
97.45% 97.23% 97.31%
93%
94%
95%Fixed Assets Current Assets Investments Loan Assets
91%
92%
93%
90%
Sept 17 Sept 16 Sept 15
20
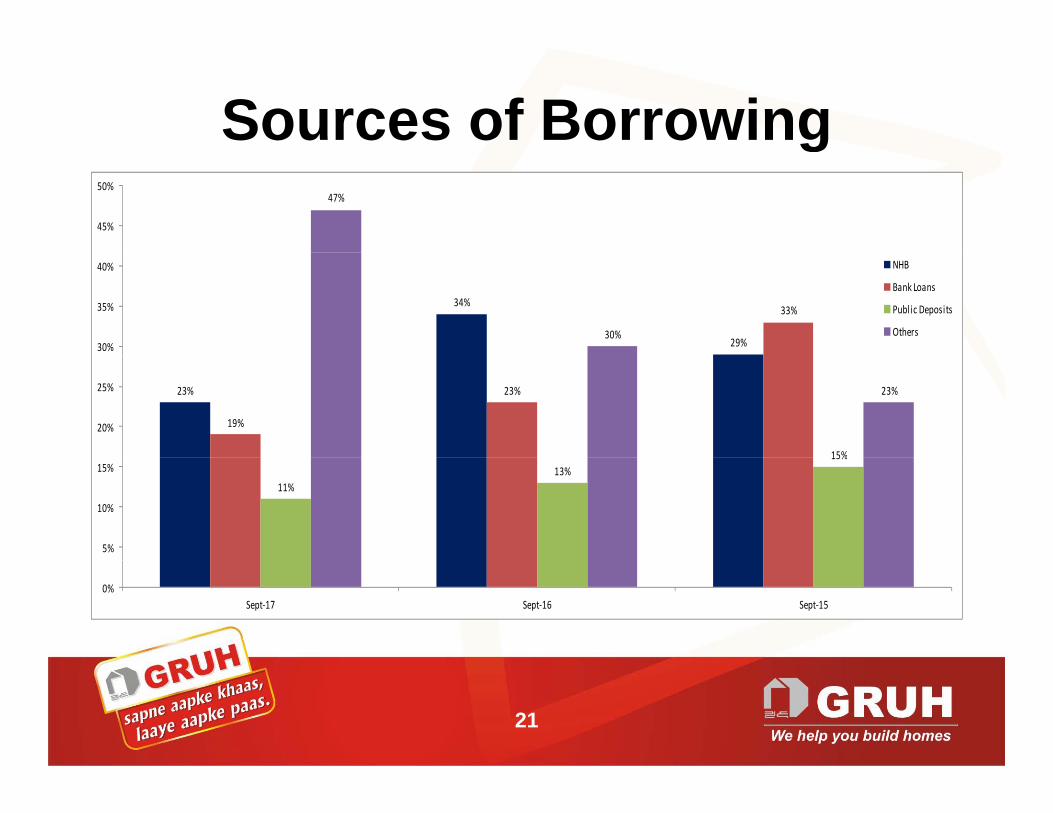
Sources of Borrowingg47%
45%
50%
34%
29%
33%
30%30%
35%
40% NHB
Bank Loans
Public Deposits
Others
23%
19%
23%
15%
23%
20%
25%
11%13%
15%
5%
10%
15%
0%Sept‐17 Sept‐16 Sept‐15
21
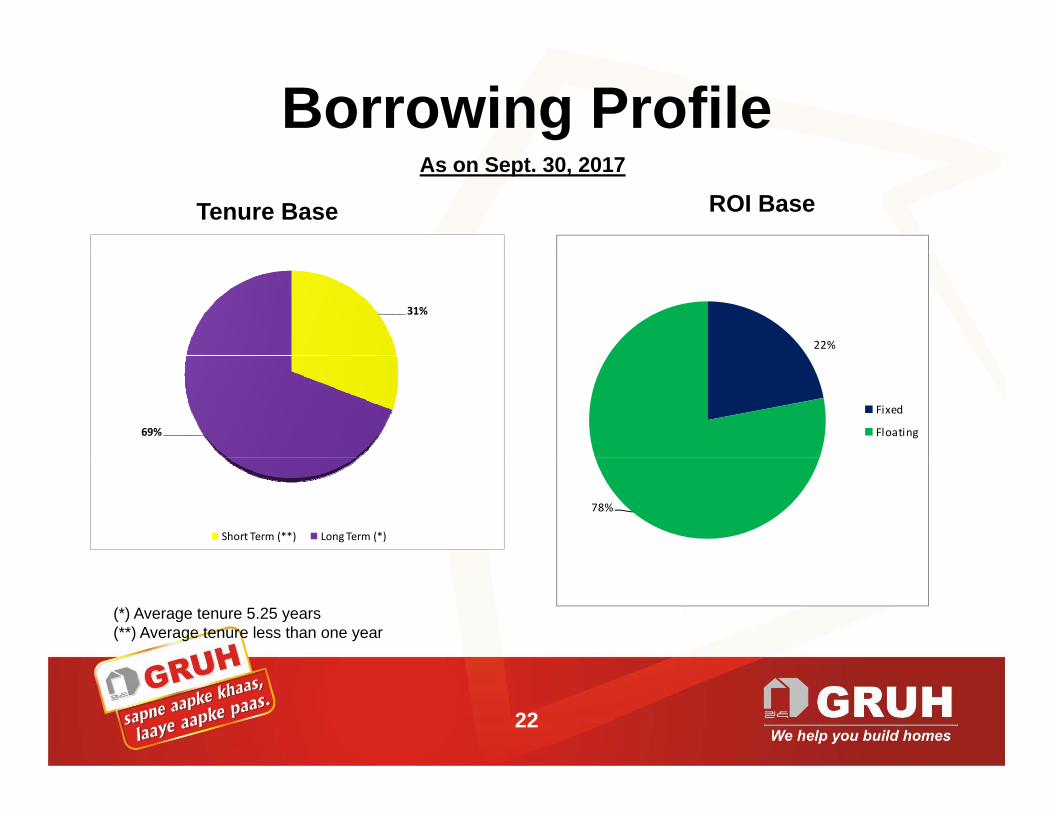
Borrowing Profile As on Sept. 30, 2017
ROI Base Tenure Base
31%
22%
69%
Fixed
Floating
Short Term (**) Long Term (*)
78%
(*) Average tenure 5.25 years(**) Average tenure less than one year
22

Balance SheetAs on Sept. 30, (Rs. in Crores)
2017 2016 Growth (%)
Sources of Funds
Share Capital 73.08 72.78 -
Reserves & Surplus 1086 61 889 56 22Reserves & Surplus 1086.61 889.56 22Borrowings 12965.16 11092.03 17Current Liabilities & Provisions 430.31 313.29 37Deferred Ta Liabilit (Net) 123 84 65 29 90Deferred Tax Liability (Net) 123.84 65.29 90
14679.00 12432.95 18
Application of Funds
Loan Assets 14304.25 12089.13 18Investments 153.60 138.94 11Current Assets 207.20 190.84 9Fixed Assets 13.95 14.04 (1)
14679.00 12432.95 18
23
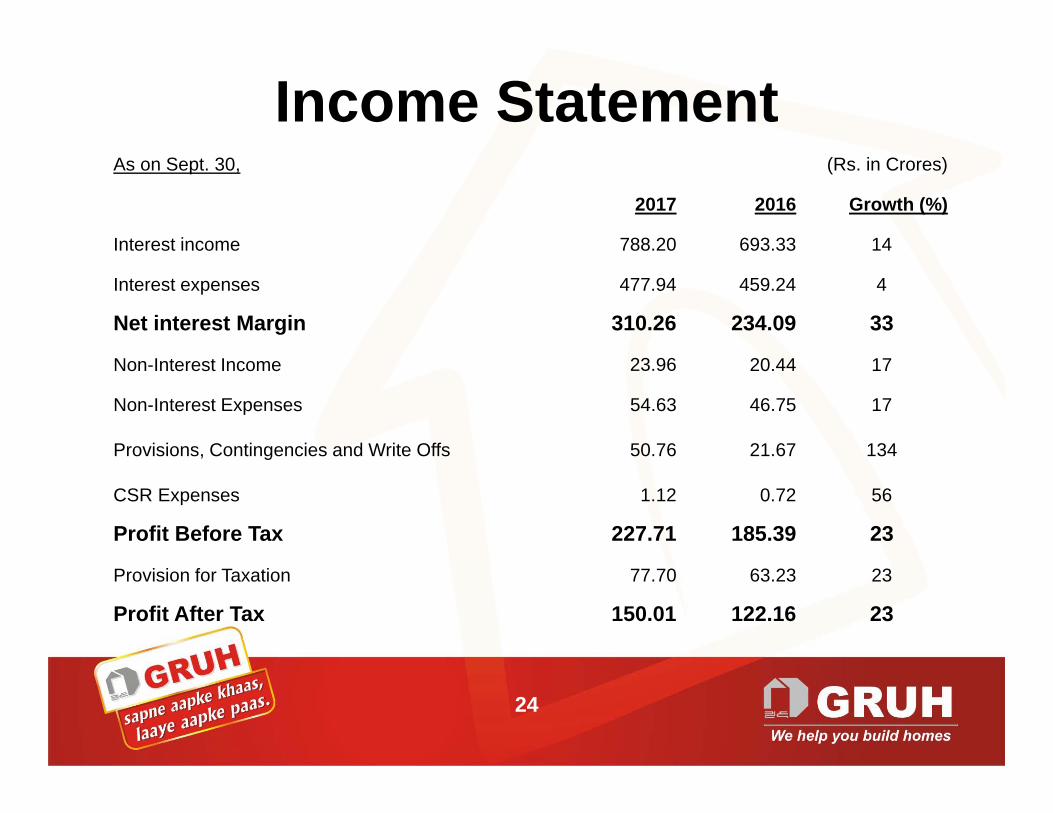
Income StatementAs on Sept. 30, (Rs. in Crores)
2017 2016 Growth (%)
Interest income 788.20 693.33 14
Interest expenses 477.94 459.24 4
Net interest Margin 310.26 234.09 33
Non-Interest Income 23.96 20.44 17
Non-Interest Expenses 54.63 46.75 17
Provisions, Contingencies and Write Offs 50.76 21.67 134, g
CSR Expenses 1.12 0.72 56
Profit Before Tax 227.71 185.39 23
Provision for Taxation 77.70 63.23 23
Profit After Tax 150.01 122.16 23
24

Risk Profile Loan Assets & NPAs
As on Sept. 30, (Rs. in Crores)
2017 2016Loan Assets (Rs.) 14304.25 12089.13
Provision for Standard Assets (Rs.) 65.56 56.71
Gross NPAs (Rs ) 95 55 74 57Gross NPAs (Rs.) 95.55 74.57
Provision for NPAs (Rs.) 23.96 16.06
Provision for Contingencies 61.60 22.92
Net NPAs (Rs.) 10.00 35.59
RatiosGross NPA as % to Loans 0.67 0.62
Net NPA as % to Loans 0.07 0.29
Net NPA to Net worth 0.86 3.70
25
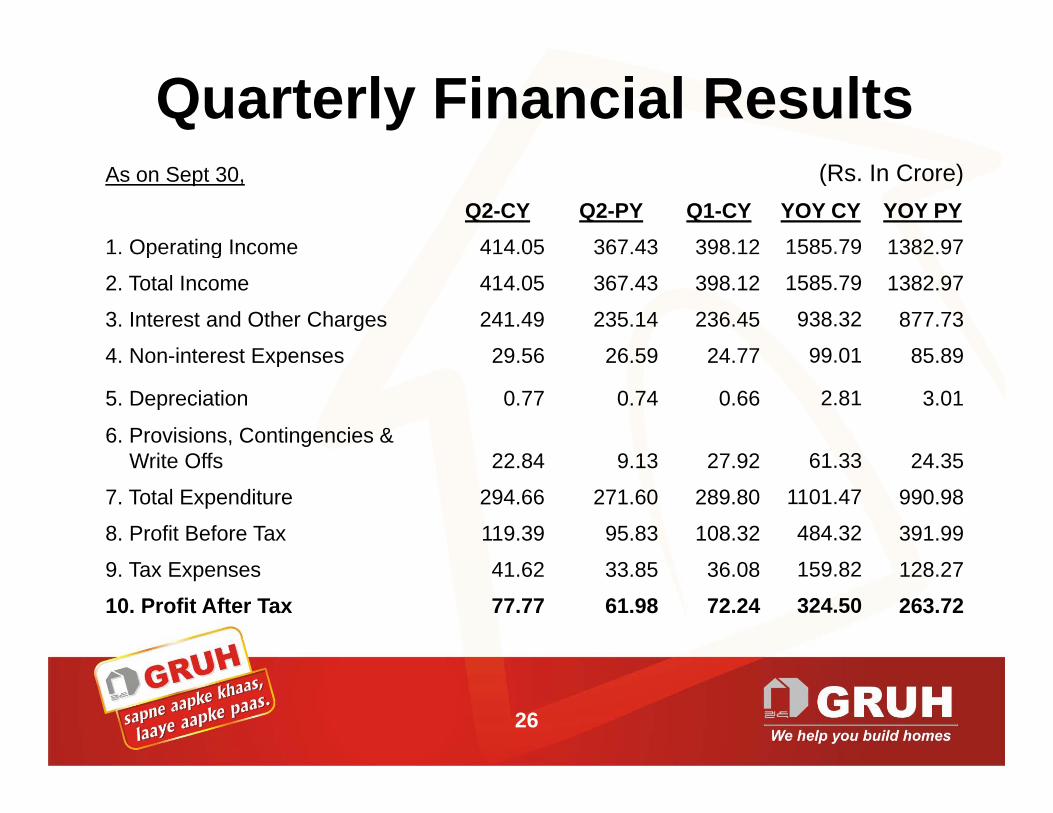
Quarterly Financial ResultsAs on Sept 30, (Rs. In Crore)
Q2-CY Q2-PY Q1-CY YOY CY YOY PY1. Operating Income 414.05 367.43 398.12 1585.79 1382.971. Operating Income 414.05 367.43 398.12 1585.79 1382.97
2. Total Income 414.05 367.43 398.12 1585.79 1382.97
3. Interest and Other Charges 241.49 235.14 236.45 938.32 877.73
4 Non interest Expenses 29 56 26 59 24 77 99 01 85 894. Non-interest Expenses 29.56 26.59 24.77 99.01 85.89
5. Depreciation 0.77 0.74 0.66 2.81 3.01
6. Provisions, Contingencies & Write Offs 22 84 9 13 27 92 61 33 24 35Write Offs 22.84 9.13 27.92 61.33 24.35
7. Total Expenditure 294.66 271.60 289.80 1101.47 990.98
8. Profit Before Tax 119.39 95.83 108.32 484.32 391.99
9. Tax Expenses 41.62 33.85 36.08 159.82 128.27
10. Profit After Tax 77.77 61.98 72.24 324.50 263.72
26

Key Financial RatiosAs on Sept. 30,
2017 2016 2015
Net Interest Margin / ATA (%) 4.39 3.92 4.03
Non Interest Expenses / ATA (%) 0 77 0 78 0 88p ( ) 0.77 0.78 0.88
PBT/ATA (%) 3.22 3.11 3.20
PAT/ATA (%) 2 12 2 05 2 11( ) 2.12 2.05 2.11
Cost to Income Ratio (%) 16.36 18.35 19.51
Return on Equity (%) 26.40 27.18 26.74q y ( ) 26.40 27.18 26.74
ATA = Average Total Assets
27
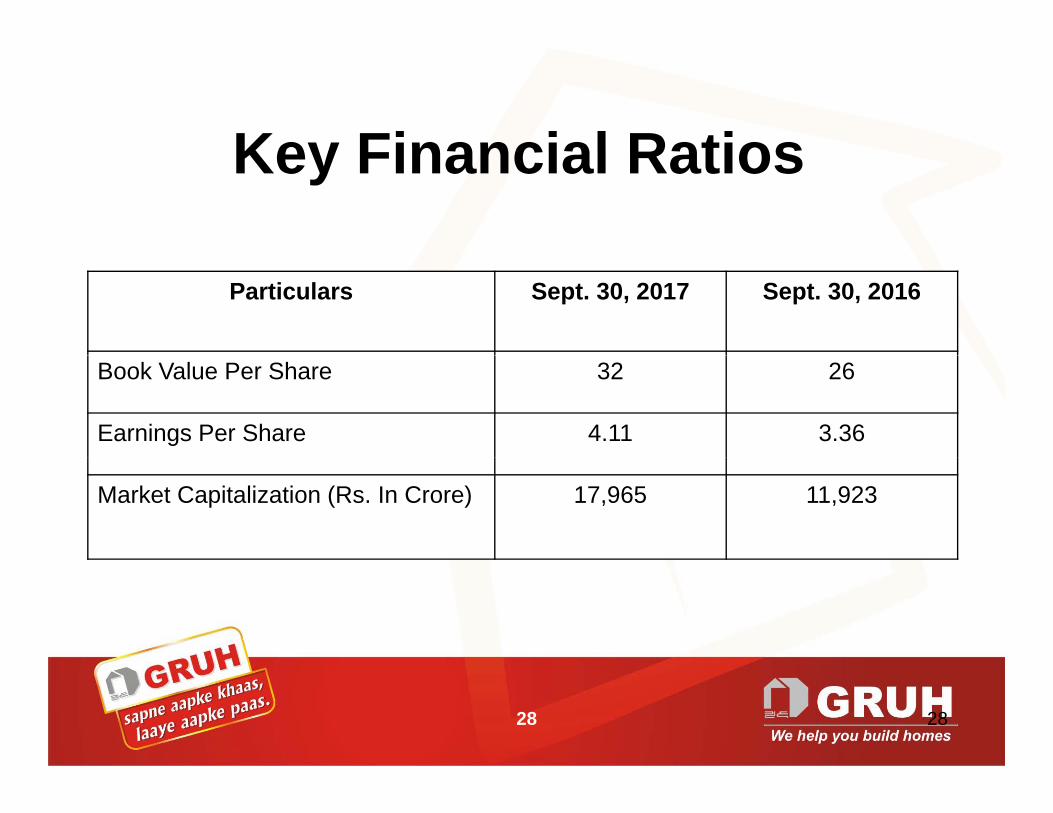
Key Financial RatiosKey Financial Ratios
Particulars Sept. 30, 2017 Sept. 30, 2016
Book Value Per Share 32 26
Earnings Per Share 4.11 3.36
Market Capitalization (Rs. In Crore) 17,965 11,923
28 28

Key Financial RatiosKey Financial Ratios
As on Sept. 30,
2017 2016 2015C it l Ad R ti (%)Capital Adequacy Ratio (%) 17.48 18.26 15.73
Tier – I 16.07 16.65 14.33
Ti IITier –II 1.41 1.61 1.40
29
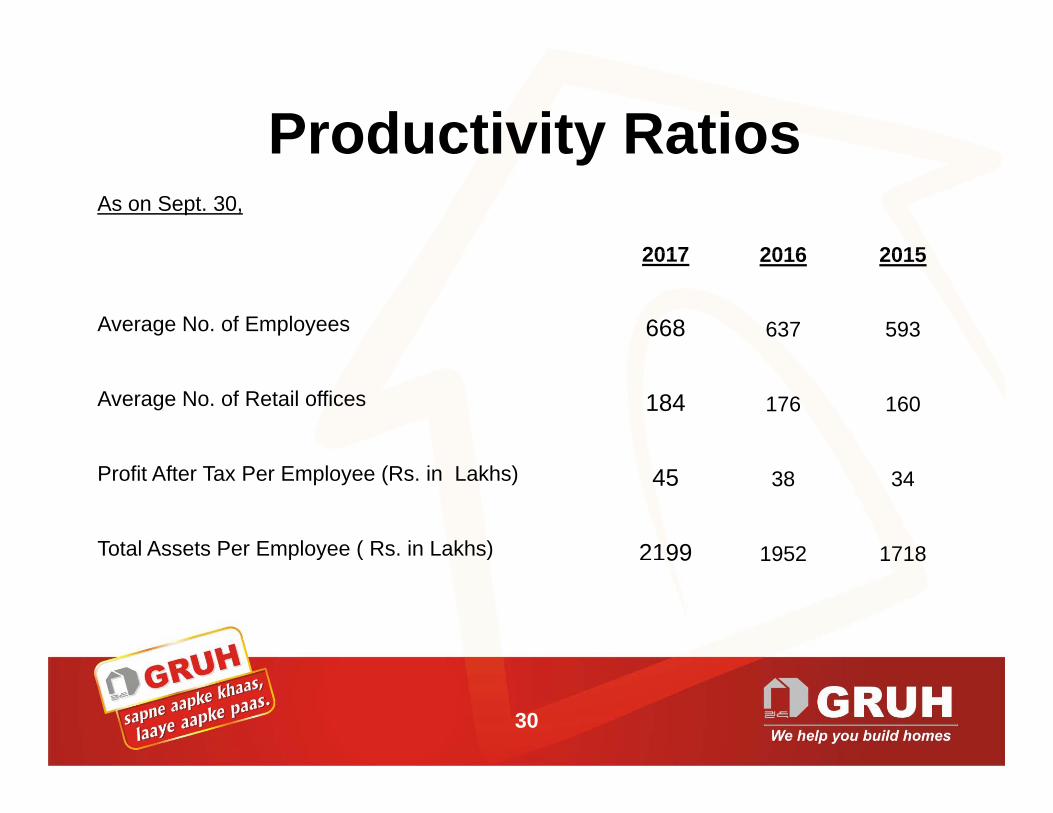
Productivity RatiosProductivity RatiosAs on Sept. 30,
2017 2016 20152017 2016 2015
Average No. of Employees 668 637 593
Average No. of Retail offices 184 176 160
Profit After Tax Per Employee (Rs. in Lakhs) 45 38 34
Total Assets Per Employee ( Rs. in Lakhs) 2199 1952 171899 1952 1718
30
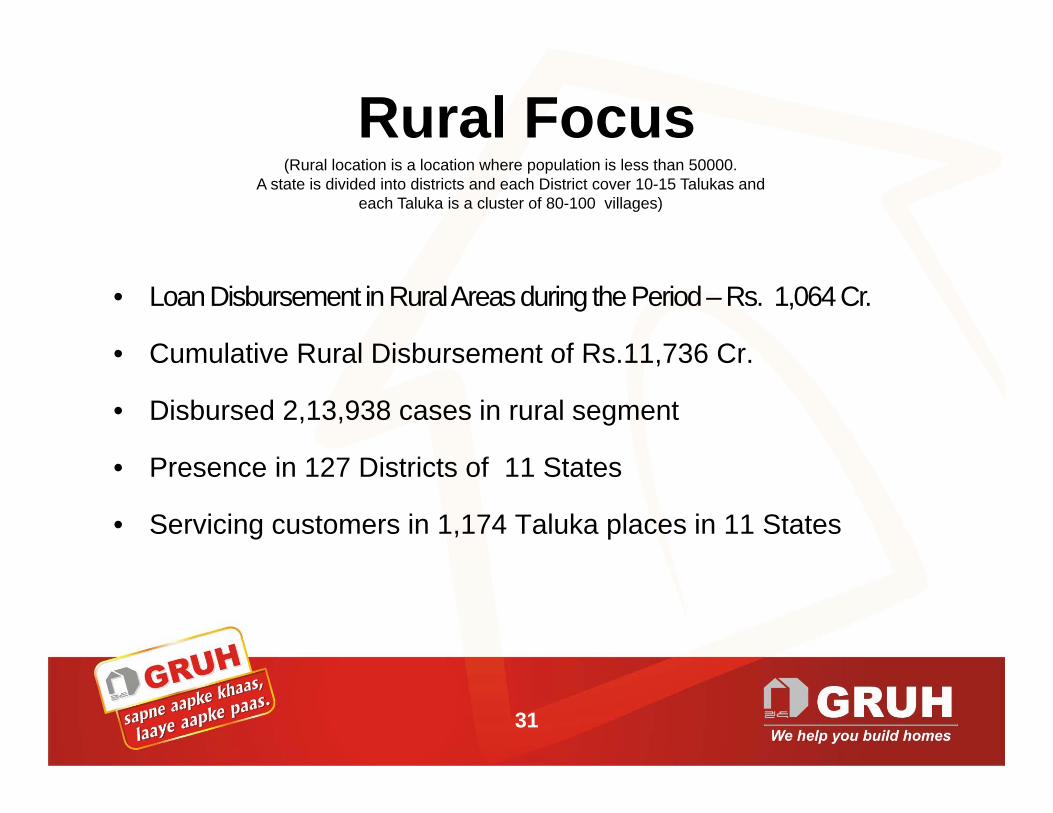
Rural Focus(Rural location is a location where population is less than 50000.
A state is divided into districts and each District cover 10-15 Talukas and each Taluka is a cluster of 80-100 villages)
• Loan Disbursement in Rural Areas during the Period – Rs. 1,064 Cr.
• Cumulative Rural Disbursement of Rs 11 736 Cr• Cumulative Rural Disbursement of Rs.11,736 Cr.
• Disbursed 2,13,938 cases in rural segment
P i 127 Di t i t f 11 St t• Presence in 127 Districts of 11 States
• Servicing customers in 1,174 Taluka places in 11 States
31

Thank You