Embed Size (px)
Citation preview
Findings of the Association for Computational Linguistics: EMNLP 2020, pages 94–108November 16 - 20, 2020. c©2020 Association for Computational Linguistics
94
GRUEN for Evaluating Linguistic Quality of Generated Text
Wanzheng Zhu and Suma BhatUniversity of Illinois at Urbana-Champaign, USA
[email protected], [email protected]
Abstract
Automatic evaluation metrics are indispens-able for evaluating generated text. To date,these metrics have focused almost exclusivelyon the content selection aspect of the systemoutput, ignoring the linguistic quality aspectaltogether. We bridge this gap by proposingGRUEN for evaluating Grammaticality, non-Redundancy, focUs, structure and coherENceof generated text.1 GRUEN utilizes a BERT-based model and a class of syntactic, seman-tic, and contextual features to examine the sys-tem output. Unlike most existing evaluationmetrics which require human references as aninput, GRUEN is reference-less and requiresonly the system output. Besides, it has the ad-vantage of being unsupervised, deterministic,and adaptable to various tasks. Experimentson seven datasets over four language genera-tion tasks show that the proposed metric corre-lates highly with human judgments.2
1 Introduction
Automatic evaluation metrics for Natural LanguageGeneration (NLG) tasks reduce the need for hu-man evaluations, which can be expensive and time-consuming to collect. Fully automatic metrics al-low faster measures of progress when training andtesting models, and therefore, accelerate the devel-opment of NLG systems (Chaganty et al., 2018;Zhang et al., 2020; Clark et al., 2019).
To date, most automatic metrics have focused onmeasuring the content selection between the humanreferences and the model output, leaving linguisticquality to be only indirectly captured (e.g., n-gramand longest common subsequence in ROUGE-Nand ROUGE-L respectively (Lin and Hovy, 2003;
1Following BLEU and ROUGE – blue and red in French,we name our evaluation metric GRUEN – that means greenin German.
2Our metric is available at https://github.com/WanzhengZhu/GRUEN.
Q1: Grammaticality The summary should have no date-lines, system-internal formatting, capitalization errors orobviously ungrammatical sentences (e.g., fragments, miss-ing components) that make the text difficult to read.Q2: Non-redundancy There should be no unnecessaryrepetition in the summary.Q3: Focus The summary should have a focus; sentencesshould only contain information that is related to the rest ofthe summary.Q4: Structure and Coherence The summary should bewell-structured and well-organized. The summary shouldnot just be a heap of related information, but should buildfrom sentence to sentence to a coherent body of informationabout a topic.
Table 1: Dimensions of linguistic quality as proposedin Dang (2006).
Lin, 2004), and alignment in METEOR (Baner-jee and Lavie, 2005)). Even though the need foran explicit measure of linguistic quality has longbeen pointed out in Dang (2006); Conroy and Dang(2008), this aspect has remained under-exploredbarring a few studies that focused on measuringthe linguistic quality of a generated piece of text(Pitler et al., 2010; Kate et al., 2010; Xenouleaset al., 2019).
In this paper, we bridge this gap by proposinga novel metric for evaluating the linguistic qualityof system output. Taking into consideration theguidelines put forth for the Document Understand-ing Conference (DUC) in Table 1, we evaluate: 1)Grammaticality by computing the sentence like-lihood and the grammatical acceptability with aBERT-based language representation model (De-vlin et al., 2019), 2) Non-redundancy by identifyingrepeated components with inter-sentence syntac-tic features, 3) Focus by examining semantic re-latedness between adjacent sentences using WordMover’s Distance (WMD) (Kusner et al., 2015),and 4) Structure and Coherence by measuring theSentence-Order Prediction (SOP) loss with A LiteBERT (Lan et al., 2019).
95
Compared with existing metrics, GRUEN is ad-vantageous in that it is:
• Most correlated with human judgments: Itachieves the highest correlation with humanjudgments when compared with other metricsof linguistic quality, demonstrated using sevendatasets over four NLG tasks.
• Reference-less: Most existing evaluation metrics(e.g., ROUGE, METEOR, MoverScore (Zhaoet al., 2019)) require human references for com-parison. However, it is only logical to assumethat the linguistic quality of a system outputshould be measurable from the output alone. Tothat end, GRUEN is designed to be reference-less, and requires only the system output as itsinput.
• Unsupervised: Available supervised metrics(e.g., SUM-QE (Xenouleas et al., 2019)) notonly require costly human judgments3 as super-vision for each dataset, but also risk poor gener-alization to new datasets. In addition, they arenon-deterministic due to the randomness in thetraining process. In contrast, GRUEN is unsu-pervised, free from training and deterministic.
• General: Almost all existing metrics for evaluat-ing the linguistic quality are task-specific (e.g.,Pitler et al. (2010) and SUM-QE (Xenouleaset al., 2019) are for text summarization), whereasGRUEN is more generally applicable and per-forms well in various NLG task settings as wedemonstrate empirically.
2 Related Work
The growing interest in NLG has given rise to betterautomatic evaluation metrics to measure the outputquality. We first review the widely used metrics forNLG tasks and then discuss available metrics forevaluating linguistic quality.
2.1 NLG Evaluation MetricsN-gram-based metrics: BLEU (Papineni et al.,2002), ROUGE (Lin and Hovy, 2003; Lin, 2004)and METEOR (Banerjee and Lavie, 2005; Lavieand Denkowski, 2009; Denkowski and Lavie, 2014)are three most commonly used metrics to mea-sure the n-gram lexical overlap between the human
3We use “human references” to mean the ground truthoutput for a given task, and “human judgments” as the manuallinguistic quality annotation of a system’s output.
references and the system output in various NLGtasks. To tackle their intrinsic shortcomings (e.g.,inability to capture lexical similarities), many vari-ations have been proposed such as NIST (Dodding-ton, 2002), ROUGE-WE (Ng and Abrecht, 2015),ROUGE-G (ShafieiBavani et al., 2018) and ME-TEOR++ 2.0 (Guo and Hu, 2019).
Embedding-based metrics: These metrics utilizeneural models to learn dense representations ofwords (Mikolov et al., 2013; Pennington et al.,2014) and sentences (Ng and Abrecht, 2015;Pagliardini et al., 2018; Clark et al., 2019). Then,the embedding distances of the human referencesand the system output are measured by cosine sim-ilarity or Word Movers Distance (WMD) (Kusneret al., 2015). Among them, MoverScore (Zhaoet al., 2019), averaging n-gram embeddings withinverse document frequency, shows robust perfor-mance on different NLG tasks.
Supervised metrics: More recently, various su-pervised metrics have been proposed. They aretrained to optimize the correlation with human judg-ments in the training set. BLEND (Ma et al., 2017)uses regression to combine various existing met-rics. RUSE (Shimanaka et al., 2018) leveragespre-trained sentence embedding models. SUM-QE(Xenouleas et al., 2019) encodes the system outputby a BERT encoder and then adopts a linear regres-sion model. However, all these supervised metricsnot only require costly human judgments for eachdataset as input, but also have the risk of poor gen-eralization to new datasets and new domains (Cha-ganty et al., 2018; Zhang et al., 2020). In contrast,unsupervised metrics require no additional humanjudgments for new datasets or tasks, and can begenerally used for various datasets/tasks.
Task-specific metrics: Some metrics are proposedto measure the specific aspects of the tasks. Forinstance, in text simplification, SARI (Xu et al.,2016) measures the simplicity gain in the output.In text summarization, most metrics are designedto evaluate the content selection, such as Pyramid(Nenkova and Passonneau, 2004), SUPERT (Gaoet al., 2020) and Mao et al. (2020). In dialoguesystems, diversity and coherence are assessed in Liet al. (2016a,b) and Dziri et al. (2019). However,these proposed metrics are not generally applicableto the evaluation of other aspects or tasks.
96
2.2 Evaluating Linguistic Quality
Existing metrics have focused mostly on evalu-ating the aspect of content selection in the sys-tem output, while ignoring the aspect of linguisticquality. This suggests the long-standing need forautomatic measures of linguistic quality of NLGoutput, despite requests for further studies in thisimportant direction. For instance, the Text Analy-sis Conference (TAC)4 and the Document Under-standing Conference (DUC)5 (Dang, 2006) havemotivated the need to automatically evaluate thelinguistic quality of summarization since 2006. Asanother example, Conroy and Dang (2008) havehighlighted the downsides of ignoring linguisticquality while focusing on summary content duringsystem evaluation. Additionally, the need for lin-guistic quality evaluation has been underscored inDorr et al. (2011); Graham et al. (2013); Novikovaet al. (2017); Way (2018); Specia and Shah (2018).The uniqueness of our study is that it bridges theneed of an automatic evaluation metric of languagequality to enable a more holistic evaluation of lan-guage generation systems.
Among the few existing metrics of linguisticquality available in prior studies, the early onesPitler et al. (2010); Kate et al. (2010) rely only onshallow syntactic linguistic features, such as part-of-speech tags, n-grams and named entities. Tobetter represent the generated output, the recentSUM-QE model (Xenouleas et al., 2019) encodesthe system output by a BERT encoder and thenadopts a linear regression model to predict the lin-guistic quality. It shows the state-of-the-art resultsand is most relevant to our work. However, SUM-QE is a supervised metric, which not only requirescostly human judgments as input for each dataset,but also has non-deterministic results due to theintrinsic randomness in the training process. Be-sides, SUM-QE has been shown to work well withthe DUC datasets of the summarization task only(Xenouleas et al., 2019), calling into question itseffectiveness for other datasets and tasks. GRUEN,as an unsupervised metric, requires no additionalhuman judgments for new datasets and has beenshown to be effective on seven datasets over fourNLG tasks.
4http://tac.nist.gov/5http://duc.nist.gov/
3 Proposed Metric
In this section, we describe the proposed linguisticquality metric in detail. We define the problem asfollows: given a system output S with n sentences[s1, s2, ..., sn], where si is any one sentence (po-tentially among many), we aim to output a holisticscore, YS , of its linguistic quality. We explicitlyassess system output for the four aspects in Ta-ble 1 – Grammaticality, Non-redundancy, Focus,and Structure and Coherence. We leave Referen-tial Clarity as suggested in Dang (2006) for futurework.Grammaticality: A system output with a highgrammaticality score yg is expected to be readable,fluent and grammatically correct. Most existingworks measure the sentence likelihood (or perplex-ity) with a language model. We, in addition, explic-itly capture whether the sentence is grammatically“acceptable” or not.
We measure yg using two features: sentencelikelihood and grammar acceptance. For a systemoutput S, we first use the Punkt sentence tokenizer(Kiss and Strunk, 2006) to extract its componentsentences s1, s2, ..., sn. Then, for each sentencesi = (wi,1, wi,2, ..., wi,k), a sequence of wordswi,j , we measure its sentence likelihood score liand grammar acceptance score gi by a BERT model(Devlin et al., 2019).6 The choice of BERT is toleverage the contextual features and the maskedlanguage model (MLM), which can best examinethe word choice. However, BERT can not be di-rectly applied to get the likelihood of a sentence,as it is designed to get the probability of a singlemissing word. Inspired by Wang and Cho (2019);Wang et al. (2019), we estimate li by a unigramapproximation of the words in the sentence: li =∑
j log p(wi,j |wi,1..., wi,j−1, wi,j+1, ..., wi,k). Bysuch approximation, li can be estimated by comput-ing the masked probability of each word. To obtainthe grammar acceptance score gi, we fine-tune theBERT model on the Corpus of Linguistic Accept-ability (CoLA) (Warstadt et al., 2018), a datasetwith 10,657 English sentences labeled as grammat-ical or ungrammatical from linguistics publications.Finally, scores from both models (i.e., li and gi)are linearly combined to examine the grammati-cality of the sentence si. The final grammaticalityscore yg is obtained by averaging scores of all n
6We use the “bert-base-cased” model from:http://huggingface.co/transformers/pretrained_models.html.
97
component sentences: yg =∑
i(li + gi)/n.
Non-redundancy: As shown in Dang (2006), non-redundancy refers to having no unnecessary rep-etition, which takes the form of whole sentencesor sentence fragments or noun phrases (e.g., “BillClinton”) when a pronoun (“he”) would sufficeacross sentences. To calculate the non-redundancyscore yr, we capture repeated components by us-ing four inter-sentence syntactic features: 1) stringlength of the longest common substring, 2) wordcount of longest common words, 3) edit distance,and 4) number of common words. We compute thefour features for each pair of component sentencesand there are
(n2
)such pairs in total. For each pair
of sentences (si, sj), we count the number of timesmi,j that these pairs are beyond a non-redundancypenalty threshold. The penalty threshold for eachfeature are: <80% string length of the shorter sen-tence, <80% word count of the shorter sentence,>60% string length of the longer sentence, and<80% word count of the shorter sentence, respec-tively. Finally, we get yr = −0.1 ∗
∑i,j mi,j .
Note that the non-redundancy penalty thresholdand penalty weight are learned empirically from aheld-out validation set. We discuss the effective-ness of each feature in detail in Appendix B.1.
Focus: Discourse focus has been widely studiedand many phenomena show that a focused outputshould have related semantics between adjacentsentences (Walker, 1998; Knott et al., 2001; Pitleret al., 2010). We compute the focus score yf by cal-culating semantic relatedness for each pair of adja-cent sentences (si, si+1). Specifically, we calculatethe Word Mover Similarity wms(si, si+1) (Kusneret al., 2015) for the sentence pair (si, si+1). If thesimilarity score is less than the similarity threshold0.05, we will impose a penalty score -0.1 on thefocus score yf . A focused output should expectyf = 0.
Structure and coherence: A well-structured andcoherent output should contain well-organized sen-tences, where the sentence order is natural and easy-to-follow. We compute the inter-sentence coher-ence score yc by a self-supervised loss that focuseson modeling inter-sentence coherence, namelySentence-Order Prediction (SOP) loss. The SOPloss, proposed by Lan et al. (2019), has beenshown to be more effective than the Next Sen-tence Prediction (NSP) loss in the original BERT(Devlin et al., 2019). We formulate the SOP losscalculation as follows. First, for a system out-
put S, we extract all possible consecutive pairsof segments (i.e., ([s1, ..., si], [si+1, ..., sn]), wherei ∈ [1, 2, ..., n− 1]). Then, we take as positive ex-amples two consecutive segments, and as negativeexamples the same two consecutive segments butwith their order swapped. Finally, the SOP lossis calculated as the average of the logistic loss forall segments,7 and the coherence score yc is theadditive inverse number of the SOP loss.Final score: The final linguistic quality score YSis a linear combination of the above four scores:YS = yg+yr+yf+yc. Note that the final score YSis on a scale of 0 to 1, and all the hyper-parametersare learned to maximize the Spearman’s correlationwith human judgments for the held-out validationset.
4 Empirical Evaluation
In this section, we evaluate the quality of differ-ent metrics on four NLG tasks: 1) abstractive textsummarization, 2) dialogue system, 3) text simplifi-cation and 4) text compression.Evaluating the metrics: We assess the perfor-mance of an evaluation metric by analyzing howwell it correlates with human judgments. We, fol-lowing existing literature, report Spearman’s cor-relation ρ, Kendall’s correlation τ , and Pearson’scorrelation r. In addition, to tackle the correla-tion non-independence issue (two dependent cor-relations sharing one variable) (Graham and Bald-win, 2014), we report William’s significance test(Williams, 1959), which can reveal whether onemetric significantly outperforms the other.Correlation type: Existing automatic metrics tendto correlate poorly with human judgments at theinstance-level, although several metrics have beenfound to have high system-level correlations (Cha-ganty et al., 2018; Novikova et al., 2017; Liu et al.,2016). Instance-level correlation is critical in thesense that error analysis can be done more construc-tively and effectively. In our paper, we primarilyanalyze the instance-level correlations and brieflydiscuss the system-level correlations.Baselines: We compare GRUEN with the follow-ing baselines:
• BLEU-best (Papineni et al., 2002) (best ofBLEU-N. It refers to the version that achievesbest correlations and is different across datasets.)7We select as the model architecture the pre-trained
ALBERT-base model from https://github.com/google-research/ALBERT.
98
• ROUGE-best (Lin, 2004) (best of ROUGE-N,ROUGE-L, ROUGE-W)• METEOR (Lavie and Denkowski, 2009)• Translation Error Rate (TER) (Snover et al.,
2006)• VecSim (Pagliardini et al., 2018)• WMD-best (best of Word Mover Distance (Kus-
ner et al., 2015), Sentence Mover Distance(Clark et al., 2019), Sentence+Word Mover Dis-tance (Clark et al., 2019))• MoverScore (Zhao et al., 2019)• SUM-QE (Xenouleas et al., 2019) (we use the
“BERT-FT-M-1” model trained on the DUC-2006(Dang, 2006) and DUC-2007 (Over et al., 2007)datasets)• SARI (Xu et al., 2016) (compared in the text
simplification task only)
Note that we do not include Pitler et al. (2010)and Kate et al. (2010), since their metrics rely onlyon shallow syntactic linguistic features and shouldprobably have no better results than SUM-QE (Xe-nouleas et al., 2019). Besides, their implementa-tions are not publicly available. For the completeresults of BLEU, ROUGE and WMD, please referto Table 12-15 in Appendix.
4.1 Abstractive Text Summarization
Dataset: We evaluate GRUEN for Text Sum-marization using two benchmark datasets: theCNN/Daily Mail dataset (Hermann et al., 2015;Nallapati et al., 2016) and the TAC-2011 dataset8.
The CNN/Daily Mail dataset contains onlinenews articles paired with multi-sentence summaries(3.75 sentences or 56 tokens on average). We ob-tain the human annotated linguistic quality scoresfrom Chaganty et al. (2018) and use the 2,086 sys-tem outputs from 4 neural models. Each system out-put has human judgments on a scale from 1-3 for:Grammar, Non-redundancy and Overall linguisticquality of the summary using the guideline fromthe DUC summarization challenge (Dang, 2006).In addition, it measures the number of Post-editsto improve the summary quality. For all humanjudgments except Post-edits, higher scores indicatebetter quality.
The TAC-2011 dataset, from the Text AnalysisConference (TAC), contains 4488 data instances(4.43 sentences or 94 tokens on average). It has 88
8http://tac.nist.gov/
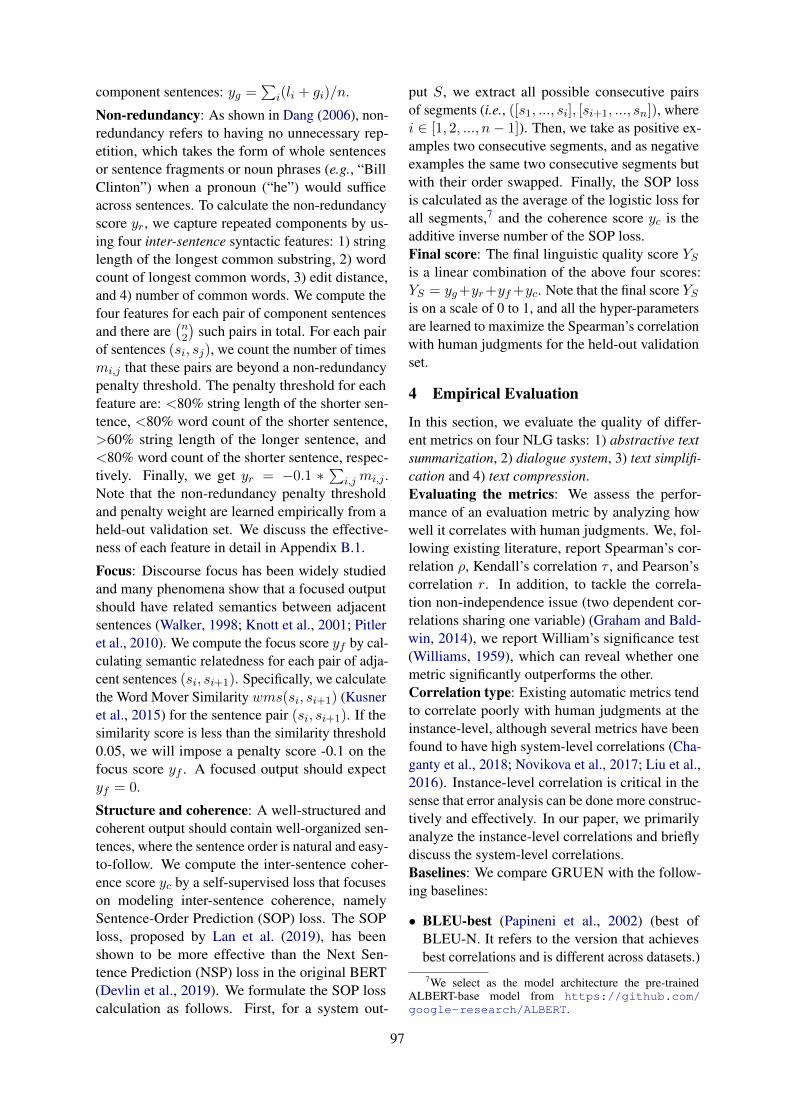
document sets and each document set includes 4 hu-man reference summaries and 51 summarizers. Wereport correlation results on the Readability score,which measures the linguistic quality according tothe guideline in Dang (2006).Results: Instance-level correlation scores are sum-marized in Table 2. As expected, all the baselineapproaches except SUM-QE perform poorly be-cause they do not aim to measure linguistic qualityexplicitly. We note that most of the baselines arehighly unstable (and not robust) across the differ-ent datasets. For instance, BLEU performs rela-tively well on TAC-2011 but poor on CNN/DailyMail, while WMD performs relatively well onCNN/Daily Mail but poor on TAC-2011. GRUENoutperforms SUM-QE on all aspects except theGrammar of CNN/Daily Mail, where they havecomparable performance. We performed a set ofWilliam’s tests for the significance of the differ-ences in performance between GRUEN and SUM-QE for each linguistic score and each correlationtype. We found that the differences were signifi-cant (p < 0.01) in all cases expect the Grammar ofCNN/Daily Mail, as shown in Table 8 in Appendix.
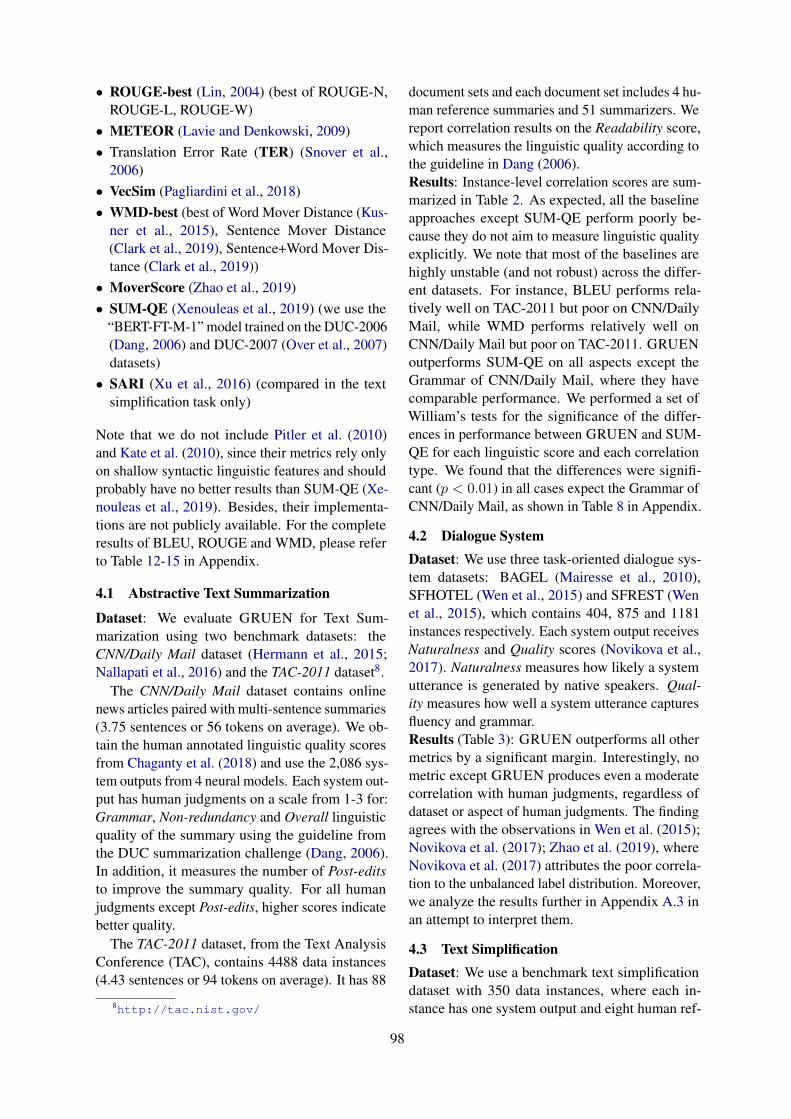
4.2 Dialogue SystemDataset: We use three task-oriented dialogue sys-tem datasets: BAGEL (Mairesse et al., 2010),SFHOTEL (Wen et al., 2015) and SFREST (Wenet al., 2015), which contains 404, 875 and 1181instances respectively. Each system output receivesNaturalness and Quality scores (Novikova et al.,2017). Naturalness measures how likely a systemutterance is generated by native speakers. Qual-ity measures how well a system utterance capturesfluency and grammar.Results (Table 3): GRUEN outperforms all othermetrics by a significant margin. Interestingly, nometric except GRUEN produces even a moderatecorrelation with human judgments, regardless ofdataset or aspect of human judgments. The findingagrees with the observations in Wen et al. (2015);Novikova et al. (2017); Zhao et al. (2019), whereNovikova et al. (2017) attributes the poor correla-tion to the unbalanced label distribution. Moreover,we analyze the results further in Appendix A.3 inan attempt to interpret them.
4.3 Text SimplificationDataset: We use a benchmark text simplificationdataset with 350 data instances, where each in-stance has one system output and eight human ref-
99
CNN/Daily Mail TAC-2011
Overall Grammar Non-redun Post-edits Readability
ρ r ρ r ρ r ρ r ρ r
BLEU-best 0.17 0.18 0.11 0.12 0.17 0.20 -0.21 -0.29 0.26 0.38
ROUGE-best 0.17 0.19 0.11 0.13 0.20 0.23 -0.24 -0.32 0.25 0.36
METEOR 0.17 0.18 0.10 0.12 0.20 0.22 -0.25 -0.28 0.24 0.32
TER -0.04 -0.03 0.03 0.02 -0.07 -0.08 0.08 0.08 0.21 0.34
VecSim 0.16 0.19 0.09 0.12 0.18 0.22 -0.24 -0.34 0.16 0.33
WMD-best 0.26 0.24 0.20 0.21 0.26 0.23 -0.29 -0.26 0.15 0.25
MoverScore 0.24 0.26 0.15 0.17 0.28 0.32 -0.32 -0.40 0.29 0.40
SUM-QE 0.46 0.48 0.41 0.41 0.45 0.44 -0.51 -0.43 0.40 0.41
GRUEN 0.52 0.54 0.43 0.40 0.52 0.58 -0.60 -0.58 0.40 0.45
Table 2: Instance-level Spearman’s ρ and Pearson’s r correlations on the CNN/Daily Mail and TAC-2011 datasets.
BAGEL SFHOTEL SFREST
Naturalness Quality Naturalness Quality Naturalness Quality
ρ r ρ r ρ r ρ r ρ r ρ r
BLEU-best 0.03 0.04 0.02 0.05 0.00 0.07 -0.10 -0.02 0.03 0.03 -0.03 -0.02
ROUGE-best 0.11 0.13 0.10 0.12 -0.02 0.02 -0.12 -0.07 0.02 0.03 -0.06 -0.04
METEOR 0.02 0.03 0.05 0.05 -0.04 0.02 -0.14 -0.07 0.03 0.04 -0.01 0.00
TER 0.11 0.15 0.11 0.15 -0.01 -0.02 -0.05 -0.03 0.01 -0.01 -0.06 -0.08
VecSim 0.03 0.05 0.05 0.07 -0.03 0.04 -0.15 -0.06 0.02 0.02 -0.05 -0.05
WMD-best 0.03 0.05 0.05 0.08 -0.02 0.00 -0.12 -0.07 0.03 0.05 -0.05 0.00
MoverScore 0.07 0.10 0.06 0.10 -0.03 0.02 -0.12 -0.06 0.02 0.02 -0.04 -0.02
SumQE 0.14 0.17 0.13 0.16 0.23 0.30 0.16 0.24 0.09 0.11 0.11 0.13
GRUEN 0.22 0.32 0.19 0.26 0.44 0.48 0.44 0.51 0.24 0.25 0.27 0.27
Table 3: Instance-level Spearman’s ρ and Pearson’s r correlations on the BAGEL, SFHOTEL and SFRESTdatasets.
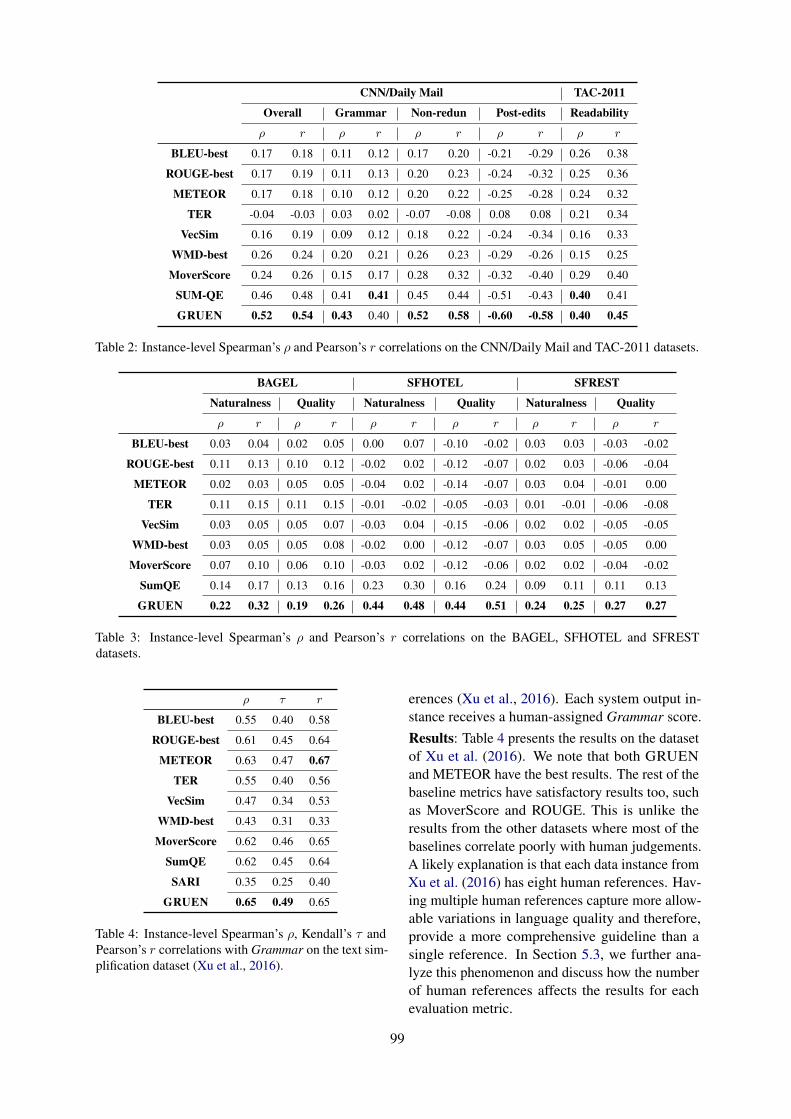
ρ τ r
BLEU-best 0.55 0.40 0.58
ROUGE-best 0.61 0.45 0.64
METEOR 0.63 0.47 0.67
TER 0.55 0.40 0.56
VecSim 0.47 0.34 0.53
WMD-best 0.43 0.31 0.33
MoverScore 0.62 0.46 0.65
SumQE 0.62 0.45 0.64
SARI 0.35 0.25 0.40
GRUEN 0.65 0.49 0.65
Table 4: Instance-level Spearman’s ρ, Kendall’s τ andPearson’s r correlations with Grammar on the text sim-plification dataset (Xu et al., 2016).
erences (Xu et al., 2016). Each system output in-stance receives a human-assigned Grammar score.Results: Table 4 presents the results on the datasetof Xu et al. (2016). We note that both GRUENand METEOR have the best results. The rest of thebaseline metrics have satisfactory results too, suchas MoverScore and ROUGE. This is unlike theresults from the other datasets where most of thebaselines correlate poorly with human judgements.A likely explanation is that each data instance fromXu et al. (2016) has eight human references. Hav-ing multiple human references capture more allow-able variations in language quality and therefore,provide a more comprehensive guideline than asingle reference. In Section 5.3, we further ana-lyze this phenomenon and discuss how the numberof human references affects the results for eachevaluation metric.
100
ρ τ r
BLEU-best 0.21 0.15 0.21
ROUGE-best 0.41 0.29 0.41
METEOR 0.33 0.23 0.32
TER 0.32 0.23 0.33
VecSim 0.22 0.16 0.23
WMD-best 0.23 0.17 0.25
MoverScore 0.34 0.24 0.34
SumQE 0.38 0.23 0.43
GRUEN 0.50 0.37 0.52
Table 5: Instance-level Spearman’s ρ, Kendall’s τ andPearson’s r correlations with Grammar on the text com-pression dataset (Toutanova et al., 2016).
10
30
50
70
Overall Grammar Non-Redun Post-Edits
Spearman
G GU GRU GRUEN
10
30
50
70
Overall Grammar Non-Redun Post-Edits
Pearson
G GU GRU GRUEN
Figure 1: Ablation study on the CNN/Daily MailDataset. For better visualization, we present the abso-lute value of Post-Edits.
4.4 Text Compression
Dataset: We use the text compression dataset col-lected in Toutanova et al. (2016). It has 2955 in-stances generated by four machine learning sys-tems and each system output instance receives ahuman-assigned Grammar score.Results (Table 5): We notice that GRUEN outper-forms all the other metrics by a significant margin.
5 Discussion
The discussion is primarily conducted for the textsummarization task considering that GRUEN canmeasure multiple dimensions in Table 1 of the gen-erated text.
5.1 Ablation study
The results of the ablation analysis (Figure 1)show the effectiveness of G (the Grammaticalitymodule alone), GU (the Grammaticality+focUsmodules), GRU (the Grammaticality+non-Redundancy+focUs modules) on the summariza-tion output using the CNN/Daily Mail dataset. Wemake the following three observations: 1) TheGrammar score is largely accounted for by ourgrammaticality module, and only marginally by the
0
1
ROUG
E-2
0
1
Mov
erSc
ore
0
1
SUM
-QE
1 0 1Human judgement (Overall)
0
1
GRUE
N
0
1
0
1
0
1
0.0 0.2 0.4 0.6 0.8 1.0Human judgement (Post-edits)
0
1
Figure 2: Instance-level distribution of scores for theCNN/Daily Mail dataset. Left shows the Overall scoredistribution on bad (-1), moderate (0) and good (1) out-puts. Right shows the scattered Post-edits score dis-tribution, which is negatively correlated with the out-put quality. The dotted line indicates a regression line,which implies the Pearson’s correlation r.
2 4 6 8Number of references
0.45
0.55
0.65Sp
earm
an's
Corre
latio
n
ROUGE-WMETEORMoverScoreGRUEN
2 4 6 8Number of references
0.30
0.40
0.48
Kend
all's
Cor
rela
tion
ROUGE-WMETEORMoverScoreGRUEN
Figure 3: Spearman’s Correlation and Kendall’s Corre-lation v.s. Number of human references.
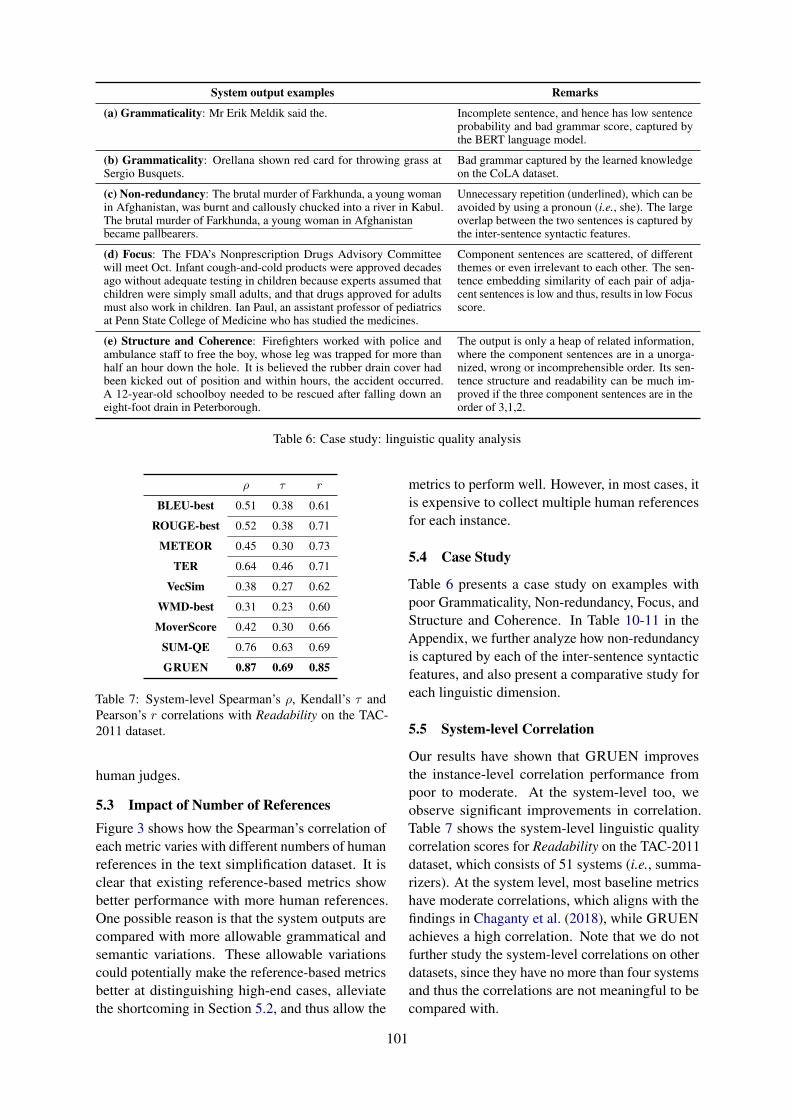
others; 2) The focus and non-redundancy moduleof GRUEN more directly target the Post-edits andNon-redundancy aspects of linguistic quality; 3)The structure and coherence module does not havesignificant improvement over the linguistic qualitydimensions. One possible reason is that structureand coherence is a high-level feature. It is difficultto be captured by not only the models but also thehuman annotators. Please refer to Table 6 for anexample of a system output with poor structureand coherence.
5.2 Alignment with Rating Scale
We compared the scores of ROUGE-2, Mover-Score, SUM-QE and GRUEN with those of humanjudgments on outputs of different quality as shownin Figure 2. These are in-line with the findingsin Chaganty et al. (2018); Novikova et al. (2017);Zhao et al. (2019) that existing automatic metricsare well correlated with human ratings at the lowerend of the rating scale than those in the middle orhigh end. In contrast, we observe that GRUEN isparticularly good at distinguishing high-end cases,i.e., system outputs which are rated as good by the
101
System output examples Remarks
(a) Grammaticality: Mr Erik Meldik said the. Incomplete sentence, and hence has low sentenceprobability and bad grammar score, captured bythe BERT language model.
(b) Grammaticality: Orellana shown red card for throwing grass atSergio Busquets.
Bad grammar captured by the learned knowledgeon the CoLA dataset.
(c) Non-redundancy: The brutal murder of Farkhunda, a young womanin Afghanistan, was burnt and callously chucked into a river in Kabul.The brutal murder of Farkhunda, a young woman in Afghanistanbecame pallbearers.
Unnecessary repetition (underlined), which can beavoided by using a pronoun (i.e., she). The largeoverlap between the two sentences is captured bythe inter-sentence syntactic features.
(d) Focus: The FDA’s Nonprescription Drugs Advisory Committeewill meet Oct. Infant cough-and-cold products were approved decadesago without adequate testing in children because experts assumed thatchildren were simply small adults, and that drugs approved for adultsmust also work in children. Ian Paul, an assistant professor of pediatricsat Penn State College of Medicine who has studied the medicines.
Component sentences are scattered, of differentthemes or even irrelevant to each other. The sen-tence embedding similarity of each pair of adja-cent sentences is low and thus, results in low Focusscore.
(e) Structure and Coherence: Firefighters worked with police andambulance staff to free the boy, whose leg was trapped for more thanhalf an hour down the hole. It is believed the rubber drain cover hadbeen kicked out of position and within hours, the accident occurred.A 12-year-old schoolboy needed to be rescued after falling down aneight-foot drain in Peterborough.
The output is only a heap of related information,where the component sentences are in a unorga-nized, wrong or incomprehensible order. Its sen-tence structure and readability can be much im-proved if the three component sentences are in theorder of 3,1,2.
Table 6: Case study: linguistic quality analysis
ρ τ r
BLEU-best 0.51 0.38 0.61
ROUGE-best 0.52 0.38 0.71
METEOR 0.45 0.30 0.73
TER 0.64 0.46 0.71
VecSim 0.38 0.27 0.62
WMD-best 0.31 0.23 0.60
MoverScore 0.42 0.30 0.66
SUM-QE 0.76 0.63 0.69
GRUEN 0.87 0.69 0.85
Table 7: System-level Spearman’s ρ, Kendall’s τ andPearson’s r correlations with Readability on the TAC-2011 dataset.
human judges.
5.3 Impact of Number of ReferencesFigure 3 shows how the Spearman’s correlation ofeach metric varies with different numbers of humanreferences in the text simplification dataset. It isclear that existing reference-based metrics showbetter performance with more human references.One possible reason is that the system outputs arecompared with more allowable grammatical andsemantic variations. These allowable variationscould potentially make the reference-based metricsbetter at distinguishing high-end cases, alleviatethe shortcoming in Section 5.2, and thus allow the
metrics to perform well. However, in most cases, itis expensive to collect multiple human referencesfor each instance.
5.4 Case Study
Table 6 presents a case study on examples withpoor Grammaticality, Non-redundancy, Focus, andStructure and Coherence. In Table 10-11 in theAppendix, we further analyze how non-redundancyis captured by each of the inter-sentence syntacticfeatures, and also present a comparative study foreach linguistic dimension.
5.5 System-level Correlation
Our results have shown that GRUEN improvesthe instance-level correlation performance frompoor to moderate. At the system-level too, weobserve significant improvements in correlation.Table 7 shows the system-level linguistic qualitycorrelation scores for Readability on the TAC-2011dataset, which consists of 51 systems (i.e., summa-rizers). At the system level, most baseline metricshave moderate correlations, which aligns with thefindings in Chaganty et al. (2018), while GRUENachieves a high correlation. Note that we do notfurther study the system-level correlations on otherdatasets, since they have no more than four systemsand thus the correlations are not meaningful to becompared with.
102
5.6 Limitations and Future Work
GRUEN evaluates non-redundancy by looking forlexical overlap across sentences. However, theystill remain unexamined for semantically relevantcomponents that are in different surface forms. Be-sides, it does not handle intra-sentence redundancy,such as “In 2012, Spain won the European Champi-onships for a second time in 2012.”. Another chal-lenging problem is to evaluate the referential clarityas proposed in Dang (2006), which is particularlyimportant for long sentences and multi-sentenceoutputs. Future work should aim for a more com-prehensive evaluation of redundancy and tackle thereferential clarity challenge.
6 Conclusion
We proposed GRUEN to evaluate Grammaticality,non-Redundancy, focUs, structure and coherENceof generated text. Without requiring human ref-erences, GRUEN achieves the new state-of-the-art results on seven datasets over four NLG tasks.Besides, as an unsupervised metric, GRUEN isdeterministic, free from obtaining costly humanjudgments, and adaptable to various NLG tasks.
ReferencesSatanjeev Banerjee and Alon Lavie. 2005. Meteor:
An automatic metric for mt evaluation with im-proved correlation with human judgments. In TheACL Workshop on Intrinsic and Extrinsic EvaluationMeasures for Machine Translation and/or Summa-rization.
Arun Chaganty, Stephen Mussmann, and Percy Liang.2018. The price of debiasing automatic metrics innatural language evalaution. In Association for Com-putational Linguistics (ACL).
Elizabeth Clark, Asli Celikyilmaz, and Noah A Smith.2019. Sentence movers similarity: Automatic eval-uation for multi-sentence texts. In Association forComputational Linguistics (ACL).
John M Conroy and Hoa Trang Dang. 2008. Mind thegap: Dangers of divorcing evaluations of summarycontent from linguistic quality. In Association forComputational Linguistics (ACL).
Hoa Trang Dang. 2006. Overview of duc 2006. InDocument Understanding Conference (DUC).
Michael Denkowski and Alon Lavie. 2014. Meteor uni-versal: Language specific translation evaluation forany target language. In Workshop on Statistical Ma-chine Translation.
Jacob Devlin, Ming-Wei Chang, Kenton Lee, andKristina Toutanova. 2019. Bert: Pre-training of deepbidirectional transformers for language understand-ing. In North American Association for Computa-tional Linguistics (NAACL).
George Doddington. 2002. Automatic evaluationof machine translation quality using n-gram co-occurrence statistics. In International Conferenceon Human Language Technology Research.
Bonnie Dorr, Joseph Olive, John McCary, and CaitlinChristianson. 2011. Machine translation evaluationand optimization. In Handbook of Natural Lan-guage Processing and Machine Translation, pages745–843. Springer.
Nouha Dziri, Ehsan Kamalloo, Kory W Mathewson,and Osmar Zaiane. 2019. Evaluating coherence indialogue systems using entailment. arXiv preprintarXiv:1904.03371.
Yang Gao, Wei Zhao, and Steffen Eger. 2020. Su-pert: Towards new frontiers in unsupervised evalu-ation metrics for multi-document summarization. InAssociation for Computational Linguistics (ACL).
Yvette Graham and Timothy Baldwin. 2014. Testingfor significance of increased correlation with humanjudgment. In Empirical Methods in Natural Lan-guage Processing (EMNLP).
Yvette Graham, Timothy Baldwin, Alistair Moffat, andJustin Zobel. 2013. Continuous measurement scalesin human evaluation of machine translation. In TheSeventh Linguistic Annotation Workshop and Inter-operability with Discourse.
Yinuo Guo and Junfeng Hu. 2019. Meteor++ 2.0:Adopt syntactic level paraphrase knowledge into ma-chine translation evaluation. In The Fourth Confer-ence on Machine Translation.
Karl Moritz Hermann, Tomas Kocisky, Edward Grefen-stette, Lasse Espeholt, Will Kay, Mustafa Suleyman,and Phil Blunsom. 2015. Teaching machines to readand comprehend. In Neural Information ProcessingSystems (NIPS).
Rohit J Kate, Xiaoqiang Luo, Siddharth Patwardhan,Martin Franz, Radu Florian, Raymond J Mooney,Salim Roukos, and Chris Welty. 2010. Learning topredict readability using diverse linguistic features.In International Conference on Computational Lin-guistics (COLING).
Tibor Kiss and Jan Strunk. 2006. Unsupervised mul-tilingual sentence boundary detection. Computa-tional Linguistics, 32(4):485–525.
Alistair Knott, Jon Oberlander, Mick ODonnell, andChris Mellish. 2001. Beyond elaboration: The inter-action of relations and focus in coherent text. TextRepresentation: Linguistic and Psycholinguistic As-pects, pages 181–196.
103
Matt Kusner, Yu Sun, Nicholas Kolkin, and KilianWeinberger. 2015. From word embeddings to docu-ment distances. In International Conference on Ma-chine Learning (ICML).
Zhenzhong Lan, Mingda Chen, Sebastian Goodman,Kevin Gimpel, Piyush Sharma, and Radu Soricut.2019. Albert: A lite bert for self-supervised learn-ing of language representations. arXiv preprintarXiv:1909.11942.
Alon Lavie and Michael J Denkowski. 2009. Themeteor metric for automatic evaluation of machinetranslation. Machine Translation, 23(2-3):105–115.
Jiwei Li, Michel Galley, Chris Brockett, Jianfeng Gao,and Bill Dolan. 2016a. A diversity-promoting ob-jective function for neural conversation models. InNorth American Association for Computational Lin-guistics (NAACL).
Jiwei Li, Will Monroe, Alan Ritter, Dan Jurafsky,Michel Galley, and Jianfeng Gao. 2016b. Deep re-inforcement learning for dialogue generation. InEmpirical Methods in Natural Language Processing(EMNLP).
Chin-Yew Lin. 2004. Rouge: A package for automaticevaluation of summaries. In Text SummarizationBranches Out.
Chin-Yew Lin and Eduard Hovy. 2003. Auto-matic evaluation of summaries using n-gram co-occurrence statistics. In North American Associa-tion for Computational Linguistics (NAACL).
Chia-Wei Liu, Ryan Lowe, Iulian Serban, Mike Nose-worthy, Laurent Charlin, and Joelle Pineau. 2016.How not to evaluate your dialogue system: An em-pirical study of unsupervised evaluation metrics fordialogue response generation. In Empirical Meth-ods in Natural Language Processing (EMNLP).
Qingsong Ma, Yvette Graham, Shugen Wang, and QunLiu. 2017. Blend: a novel combined mt metricbased on direct assessmentcasict-dcu submission towmt17 metrics task. In The Second Conference onMachine Translation.
Francois Mairesse, Milica Gasic, Filip Jurcıcek, SimonKeizer, Blaise Thomson, Kai Yu, and Steve Young.2010. Phrase-based statistical language generationusing graphical models and active learning. In Asso-ciation for Computational Linguistics (ACL).
Yuning Mao, Liyuan Liu, Qi Zhu, Xiang Ren, and Ji-awei Han. 2020. Facet-aware evaluation for extrac-tive summarization. In Association for Computa-tional Linguistics (ACL).
Tomas Mikolov, Ilya Sutskever, Kai Chen, Greg S Cor-rado, and Jeff Dean. 2013. Distributed representa-tions of words and phrases and their composition-ality. In Neural Information Processing Systems(NIPS).
Ramesh Nallapati, Bowen Zhou, Cicero dos Santos,Ca glar Gulcehre, and Bing Xiang. 2016. Abstrac-tive text summarization using sequence-to-sequencernns and beyond. Computational Natural LanguageLearning (CoNLL).
Ani Nenkova and Rebecca Passonneau. 2004. Evaluat-ing content selection in summarization: The pyra-mid method. In North American Association forComputational Linguistics (NAACL).
Jun-Ping Ng and Viktoria Abrecht. 2015. Better sum-marization evaluation with word embeddings forrouge. In Empirical Methods in Natural LanguageProcessing (EMNLP).
Jekaterina Novikova, Ondrej Dusek, Amanda CercasCurry, and Verena Rieser. 2017. Why we need newevaluation metrics for nlg. In Empirical Methods inNatural Language Processing (EMNLP).
Paul Over, Hoa Dang, and Donna Harman. 2007. Ducin context. Information Processing & Management,43(6):1506–1520.
Matteo Pagliardini, Prakhar Gupta, and Martin Jaggi.2018. Unsupervised learning of sentence embed-dings using compositional n-gram features. In NorthAmerican Association for Computational Linguistics(NAACL).
Kishore Papineni, Salim Roukos, Todd Ward, and Wei-Jing Zhu. 2002. Bleu: a method for automatic eval-uation of machine translation. In Association forComputational Linguistics (ACL).
Jeffrey Pennington, Richard Socher, and Christopher DManning. 2014. Glove: Global vectors for word rep-resentation. In Empirical Methods in Natural Lan-guage Processing (EMNLP).
Emily Pitler, Annie Louis, and Ani Nenkova. 2010.Automatic evaluation of linguistic quality in multi-document summarization. In Association for Com-putational Linguistics (ACL).
Elaheh ShafieiBavani, Mohammad Ebrahimi, Ray-mond Wong, and Fang Chen. 2018. A graph-theoretic summary evaluation for rouge. In Em-pirical Methods in Natural Language Processing(EMNLP).
Hiroki Shimanaka, Tomoyuki Kajiwara, and MamoruKomachi. 2018. Ruse: Regressor using sentenceembeddings for automatic machine translation eval-uation. In The Third Conference on Machine Trans-lation: Shared Task Papers.
Matthew Snover, Bonnie Dorr, Richard Schwartz, Lin-nea Micciulla, and John Makhoul. 2006. A studyof translation edit rate with targeted human annota-tion. In Association for Machine Translation in theAmericas.
104
Lucia Specia and Kashif Shah. 2018. Machine transla-tion quality estimation: Applications and future per-spectives. In Translation Quality Assessment, pages201–235. Springer.
Kristina Toutanova, Chris Brockett, Ke M Tran, andSaleema Amershi. 2016. A dataset and evaluationmetrics for abstractive compression of sentences andshort paragraphs. In Empirical Methods in NaturalLanguage Processing (EMNLP).
Joshi Prince Walker. 1998. Centering theory in dis-course. Oxford University Press.
Alex Wang and Kyunghyun Cho. 2019. Bert has amouth, and it must speak: Bert as a markov randomfield language model. In The Workshop on Meth-ods for Optimizing and Evaluating Neural LanguageGeneration.
Chenguang Wang, Mu Li, and Alexander J Smola.2019. Language models with transformers. arXivpreprint arXiv:1904.09408.
Alex Warstadt, Amanpreet Singh, and Samuel R Bow-man. 2018. Neural network acceptability judgments.arXiv preprint arXiv:1805.12471.
Andy Way. 2018. Quality expectations of machinetranslation. In Translation Quality Assessment,pages 159–178. Springer.
Tsung-Hsien Wen, Milica Gasic, Nikola Mrksic, Pei-Hao Su, David Vandyke, and Steve Young. 2015. Se-mantically conditioned lstm-based natural languagegeneration for spoken dialogue systems. In Em-pirical Methods in Natural Language Processing(EMNLP).
Evan James Williams. 1959. Regression Analysis, vol-ume 14. Wiley.
Stratos Xenouleas, Prodromos Malakasiotis, MariannaApidianaki, and Ion Androutsopoulos. 2019. Sum-qe: a bert-based summary quality estimation model.In Empirical Methods in Natural Language Process-ing and International Joint Conference on NaturalLanguage Processing (EMNLP-IJCNLP).
Wei Xu, Courtney Napoles, Ellie Pavlick, QuanzeChen, and Chris Callison-Burch. 2016. Optimizingstatistical machine translation for text simplification.Transactions of the Association for ComputationalLinguistics (TACL), 4:401–415.
Tianyi Zhang, Varsha Kishore, Felix Wu, Kilian QWeinberger, and Yoav Artzi. 2020. Bertscore: Eval-uating text generation with bert. In InternationalConference on Learning Representations (ICLR).
Wei Zhao, Maxime Peyrard, Fei Liu, Yang Gao, Chris-tian M Meyer, and Steffen Eger. 2019. Moverscore:Text generation evaluating with contextualized em-beddings and earth mover distance. In EmpiricalMethods in Natural Language Processing and Inter-national Joint Conference on Natural Language Pro-cessing (EMNLP-IJCNLP).
ρ τ r
CNN/
Overall *** *** ***
Daily Mail
Grammar * — —
Non-Redun *** *** ***
Post-edits *** *** ***
TAC-2011 Readability * ** **
BAGEL Naturalness 0.01 0.07 **
Quality 0.06 0.17 *
SFHOTEL Naturalness *** *** ***
Quality *** *** ***
SFREST Naturalness *** *** ***
Quality *** *** ***
Xu et al. (2016) Grammar 0.33 0.46 —
Toutanova et al.(2016)
Grammar *** *** ***
Table 8: William Significance Test on GRUEN againstthe best baselines for each correlation type and eachdataset. *, **, *** indicate the significance level of<0.01, <0.001 and <0.0001 respectively. — indicatesGRUEN does not outperform the best baseline.
A Quantitative Analysis
A.1 William’s Significance Test
In Table 8, we perform William’s significance testson GRUEN against the best baselines for eachlinguistic score and each correlation measurement(e.g., SUM-QE for ρ on the Overall score of theCNN/Daily Mail dataset, METEOR for r on theGrammar score of the dataset in Xu et al. (2016)).We found that the differences are significant (p <0.0001) in 24 out of 39 cases.
A.2 Performance on Reliable Instances
In the human annotation process, each instancereceives a score that is the aggregate of multiplepeople’s ratings. Given the subjective nature of thetask of annotating for linguistic quality, there aresome instances where annotators disagree. To ana-lyze how we perform on reliably coded instances,we show in Table 9 the correlation scores on theinstances where all annotators agreed perfectly onthe Overall score for the CNN/Daily Mail dataset(N = 1323). We observe that GRUEN consis-tently outperforms the baselines on the reliabledata instances. Importantly, GRUEN and SUM-QE are better correlated with human judgementson the reliable data instances than on all the datainstances.
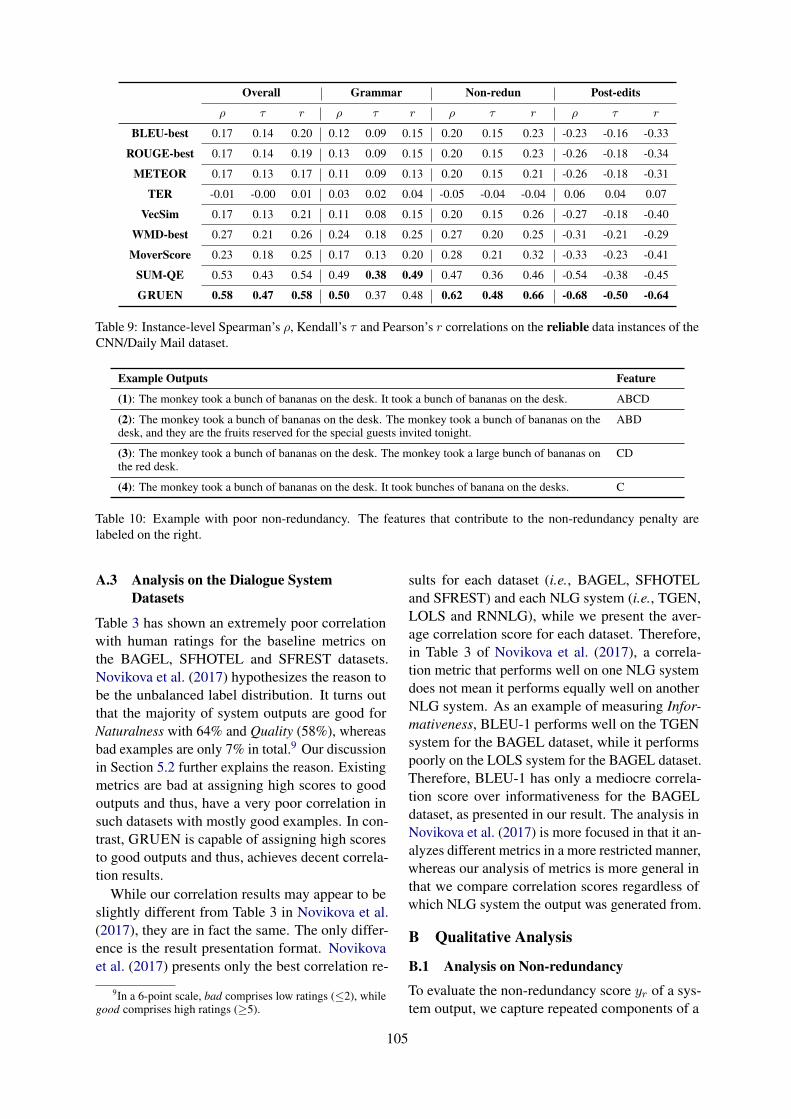
105
Overall Grammar Non-redun Post-edits
ρ τ r ρ τ r ρ τ r ρ τ r
BLEU-best 0.17 0.14 0.20 0.12 0.09 0.15 0.20 0.15 0.23 -0.23 -0.16 -0.33
ROUGE-best 0.17 0.14 0.19 0.13 0.09 0.15 0.20 0.15 0.23 -0.26 -0.18 -0.34
METEOR 0.17 0.13 0.17 0.11 0.09 0.13 0.20 0.15 0.21 -0.26 -0.18 -0.31
TER -0.01 -0.00 0.01 0.03 0.02 0.04 -0.05 -0.04 -0.04 0.06 0.04 0.07
VecSim 0.17 0.13 0.21 0.11 0.08 0.15 0.20 0.15 0.26 -0.27 -0.18 -0.40
WMD-best 0.27 0.21 0.26 0.24 0.18 0.25 0.27 0.20 0.25 -0.31 -0.21 -0.29
MoverScore 0.23 0.18 0.25 0.17 0.13 0.20 0.28 0.21 0.32 -0.33 -0.23 -0.41
SUM-QE 0.53 0.43 0.54 0.49 0.38 0.49 0.47 0.36 0.46 -0.54 -0.38 -0.45
GRUEN 0.58 0.47 0.58 0.50 0.37 0.48 0.62 0.48 0.66 -0.68 -0.50 -0.64
Table 9: Instance-level Spearman’s ρ, Kendall’s τ and Pearson’s r correlations on the reliable data instances of theCNN/Daily Mail dataset.
Example Outputs Feature
(1): The monkey took a bunch of bananas on the desk. It took a bunch of bananas on the desk. ABCD
(2): The monkey took a bunch of bananas on the desk. The monkey took a bunch of bananas on thedesk, and they are the fruits reserved for the special guests invited tonight.
ABD
(3): The monkey took a bunch of bananas on the desk. The monkey took a large bunch of bananas onthe red desk.
CD
(4): The monkey took a bunch of bananas on the desk. It took bunches of banana on the desks. C
Table 10: Example with poor non-redundancy. The features that contribute to the non-redundancy penalty arelabeled on the right.
A.3 Analysis on the Dialogue SystemDatasets
Table 3 has shown an extremely poor correlationwith human ratings for the baseline metrics onthe BAGEL, SFHOTEL and SFREST datasets.Novikova et al. (2017) hypothesizes the reason tobe the unbalanced label distribution. It turns outthat the majority of system outputs are good forNaturalness with 64% and Quality (58%), whereasbad examples are only 7% in total.9 Our discussionin Section 5.2 further explains the reason. Existingmetrics are bad at assigning high scores to goodoutputs and thus, have a very poor correlation insuch datasets with mostly good examples. In con-trast, GRUEN is capable of assigning high scoresto good outputs and thus, achieves decent correla-tion results.
While our correlation results may appear to beslightly different from Table 3 in Novikova et al.(2017), they are in fact the same. The only differ-ence is the result presentation format. Novikovaet al. (2017) presents only the best correlation re-
9In a 6-point scale, bad comprises low ratings (≤2), whilegood comprises high ratings (≥5).
sults for each dataset (i.e., BAGEL, SFHOTELand SFREST) and each NLG system (i.e., TGEN,LOLS and RNNLG), while we present the aver-age correlation score for each dataset. Therefore,in Table 3 of Novikova et al. (2017), a correla-tion metric that performs well on one NLG systemdoes not mean it performs equally well on anotherNLG system. As an example of measuring Infor-mativeness, BLEU-1 performs well on the TGENsystem for the BAGEL dataset, while it performspoorly on the LOLS system for the BAGEL dataset.Therefore, BLEU-1 has only a mediocre correla-tion score over informativeness for the BAGELdataset, as presented in our result. The analysis inNovikova et al. (2017) is more focused in that it an-alyzes different metrics in a more restricted manner,whereas our analysis of metrics is more general inthat we compare correlation scores regardless ofwhich NLG system the output was generated from.
B Qualitative Analysis
B.1 Analysis on Non-redundancy
To evaluate the non-redundancy score yr of a sys-tem output, we capture repeated components of a
106
Example Outputs Module Scores
(a) Grammaticality: Orellana shown red card for throwing grass at Sergio Busquets. yg = 0.2
(b) Grammaticality: Orellana was shown a red card for throwing grass at Sergio Busquets. yg = 0.7
(c) Non-redundancy: The brutal murder of Farkhunda, a young woman in Afghanistan, whose bodywas burnt and callously chucked into a river in Kabul. The brutal murder of Farkhunda, a youngwoman in Afghanistan became pallbearers, hoisting the victim’s coffin on their shoulders draped withheadscarves.
yr = −0.4
(d) Non-redundancy: The brutal murder of Farkhunda, a young woman in Afghanistan, whose bodywas burnt and callously chucked into a river in Kabul. She became pallbearers, hoisting the victim’scoffin on their shoulders draped with headscarves.
yr = 0.0
(e) Focus: The FDA’s Nonprescription Drugs Advisory Committee will meet Oct. Infant cough-and-cold products were approved decades ago without adequate testing in children because experts assumedthat children were simply small adults, and that drugs approved for adults must also work in children.Ian M. Paul, an assistant professor of pediatrics at Penn State College of Medicine who has studied themedicines.
yf = −0.1
(f) Focus: On March 1, 2007, the Food/Drug Administration (FDA) started a broad safety review ofchildren’s cough/cold remedies. They are particularly concerned about use of these drugs by infants.By September 28th, the 356-page FDA review urged an outright ban on all such medicines for childrenunder six. Dr. Charles Ganley, a top FDA official said “We have no data on these agents of what’s asafe and effective dose in Children.” The review also stated that between 1969 and 2006, 123 childrendied from taking decongestants and antihistamines. On October 11th, all such infant products werepulled from the markets.
yf = 0.0
(g) Coherence and Structure: Firefighters worked with police and ambulance staff to free the boy,whose leg was trapped for more than half an hour down the hole. It is believed the rubber drain coverhad been kicked out of position and within hours, the accident occurred. A 12-year-old schoolboyneeded to be rescued after falling down an eight-foot drain in Peterborough.
yc = −0.1
(h) Coherence and Structure: A 12-year-old schoolboy needed to be rescued after falling down aneight-foot drain in Peterborough. Firefighters worked with police and ambulance staff to free the boy,whose leg was trapped for more than half an hour down the hole. It is believed the rubber drain coverhad been kicked out of position and within hours, the accident occurred.
yc = 0.0
(i) Overall: The monkey took a bottle of a water bottle in a bid to cool it down with bottle in hand.The monkey is the bottle to its hands before attempting to quench its thirst. It is the the bottle of thebottle in its mouth and a bottle. It’s the bottle. A bottle in the water bottle.
YS = 0.0
(j) Overall: The footage was captured on a warm day in Bali, Indonesia. Tour guide cools monkeydown by spraying it with water. Monkey then picks up bottle and casually unscrews the lid. Primatehas drink and remarkably spills very little liquid.
YS = 0.8
Table 11: A comparative study on good and bad example outputs for each linguistic aspect.
107
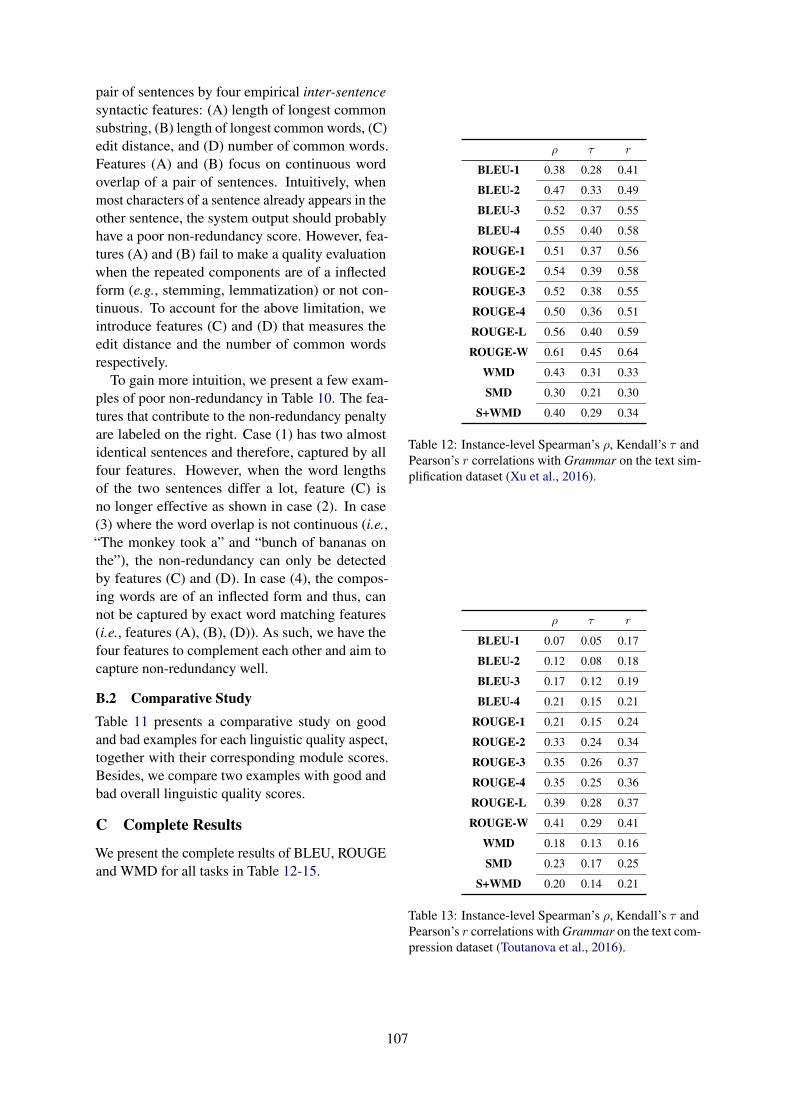
pair of sentences by four empirical inter-sentencesyntactic features: (A) length of longest commonsubstring, (B) length of longest common words, (C)edit distance, and (D) number of common words.Features (A) and (B) focus on continuous wordoverlap of a pair of sentences. Intuitively, whenmost characters of a sentence already appears in theother sentence, the system output should probablyhave a poor non-redundancy score. However, fea-tures (A) and (B) fail to make a quality evaluationwhen the repeated components are of a inflectedform (e.g., stemming, lemmatization) or not con-tinuous. To account for the above limitation, weintroduce features (C) and (D) that measures theedit distance and the number of common wordsrespectively.
To gain more intuition, we present a few exam-ples of poor non-redundancy in Table 10. The fea-tures that contribute to the non-redundancy penaltyare labeled on the right. Case (1) has two almostidentical sentences and therefore, captured by allfour features. However, when the word lengthsof the two sentences differ a lot, feature (C) isno longer effective as shown in case (2). In case(3) where the word overlap is not continuous (i.e.,“The monkey took a” and “bunch of bananas onthe”), the non-redundancy can only be detectedby features (C) and (D). In case (4), the compos-ing words are of an inflected form and thus, cannot be captured by exact word matching features(i.e., features (A), (B), (D)). As such, we have thefour features to complement each other and aim tocapture non-redundancy well.
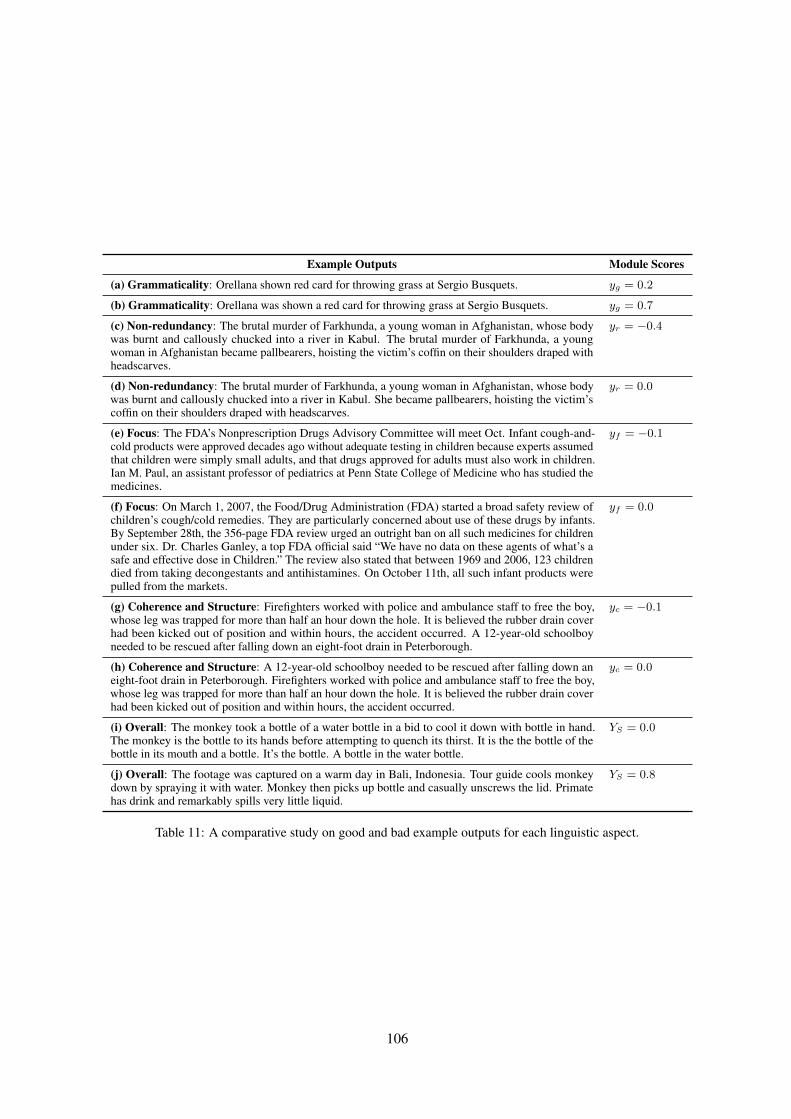
B.2 Comparative StudyTable 11 presents a comparative study on goodand bad examples for each linguistic quality aspect,together with their corresponding module scores.Besides, we compare two examples with good andbad overall linguistic quality scores.
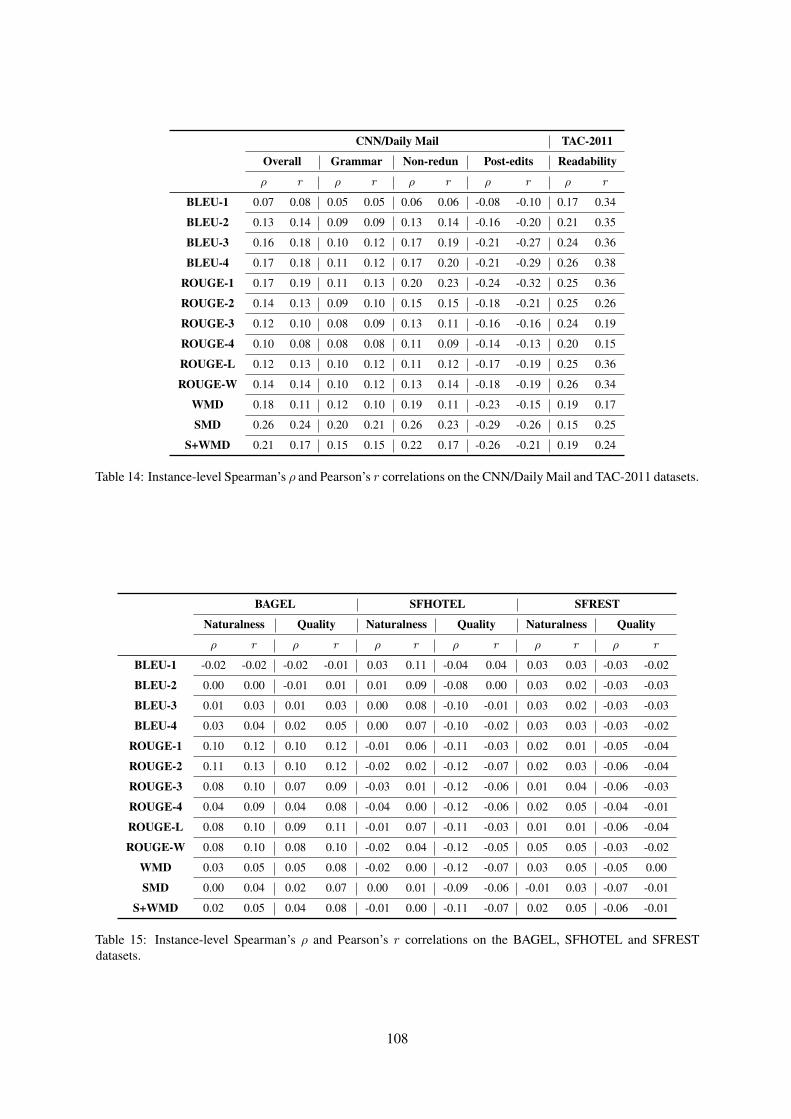
C Complete Results
We present the complete results of BLEU, ROUGEand WMD for all tasks in Table 12-15.
ρ τ r
BLEU-1 0.38 0.28 0.41
BLEU-2 0.47 0.33 0.49
BLEU-3 0.52 0.37 0.55
BLEU-4 0.55 0.40 0.58
ROUGE-1 0.51 0.37 0.56
ROUGE-2 0.54 0.39 0.58
ROUGE-3 0.52 0.38 0.55
ROUGE-4 0.50 0.36 0.51
ROUGE-L 0.56 0.40 0.59
ROUGE-W 0.61 0.45 0.64
WMD 0.43 0.31 0.33
SMD 0.30 0.21 0.30
S+WMD 0.40 0.29 0.34
Table 12: Instance-level Spearman’s ρ, Kendall’s τ andPearson’s r correlations with Grammar on the text sim-plification dataset (Xu et al., 2016).
ρ τ r
BLEU-1 0.07 0.05 0.17
BLEU-2 0.12 0.08 0.18
BLEU-3 0.17 0.12 0.19
BLEU-4 0.21 0.15 0.21
ROUGE-1 0.21 0.15 0.24
ROUGE-2 0.33 0.24 0.34
ROUGE-3 0.35 0.26 0.37
ROUGE-4 0.35 0.25 0.36
ROUGE-L 0.39 0.28 0.37
ROUGE-W 0.41 0.29 0.41
WMD 0.18 0.13 0.16
SMD 0.23 0.17 0.25
S+WMD 0.20 0.14 0.21
Table 13: Instance-level Spearman’s ρ, Kendall’s τ andPearson’s r correlations with Grammar on the text com-pression dataset (Toutanova et al., 2016).
108
CNN/Daily Mail TAC-2011
Overall Grammar Non-redun Post-edits Readability
ρ r ρ r ρ r ρ r ρ r
BLEU-1 0.07 0.08 0.05 0.05 0.06 0.06 -0.08 -0.10 0.17 0.34
BLEU-2 0.13 0.14 0.09 0.09 0.13 0.14 -0.16 -0.20 0.21 0.35
BLEU-3 0.16 0.18 0.10 0.12 0.17 0.19 -0.21 -0.27 0.24 0.36
BLEU-4 0.17 0.18 0.11 0.12 0.17 0.20 -0.21 -0.29 0.26 0.38
ROUGE-1 0.17 0.19 0.11 0.13 0.20 0.23 -0.24 -0.32 0.25 0.36
ROUGE-2 0.14 0.13 0.09 0.10 0.15 0.15 -0.18 -0.21 0.25 0.26
ROUGE-3 0.12 0.10 0.08 0.09 0.13 0.11 -0.16 -0.16 0.24 0.19
ROUGE-4 0.10 0.08 0.08 0.08 0.11 0.09 -0.14 -0.13 0.20 0.15
ROUGE-L 0.12 0.13 0.10 0.12 0.11 0.12 -0.17 -0.19 0.25 0.36
ROUGE-W 0.14 0.14 0.10 0.12 0.13 0.14 -0.18 -0.19 0.26 0.34
WMD 0.18 0.11 0.12 0.10 0.19 0.11 -0.23 -0.15 0.19 0.17
SMD 0.26 0.24 0.20 0.21 0.26 0.23 -0.29 -0.26 0.15 0.25
S+WMD 0.21 0.17 0.15 0.15 0.22 0.17 -0.26 -0.21 0.19 0.24
Table 14: Instance-level Spearman’s ρ and Pearson’s r correlations on the CNN/Daily Mail and TAC-2011 datasets.
BAGEL SFHOTEL SFREST
Naturalness Quality Naturalness Quality Naturalness Quality
ρ r ρ r ρ r ρ r ρ r ρ r
BLEU-1 -0.02 -0.02 -0.02 -0.01 0.03 0.11 -0.04 0.04 0.03 0.03 -0.03 -0.02
BLEU-2 0.00 0.00 -0.01 0.01 0.01 0.09 -0.08 0.00 0.03 0.02 -0.03 -0.03
BLEU-3 0.01 0.03 0.01 0.03 0.00 0.08 -0.10 -0.01 0.03 0.02 -0.03 -0.03
BLEU-4 0.03 0.04 0.02 0.05 0.00 0.07 -0.10 -0.02 0.03 0.03 -0.03 -0.02
ROUGE-1 0.10 0.12 0.10 0.12 -0.01 0.06 -0.11 -0.03 0.02 0.01 -0.05 -0.04
ROUGE-2 0.11 0.13 0.10 0.12 -0.02 0.02 -0.12 -0.07 0.02 0.03 -0.06 -0.04
ROUGE-3 0.08 0.10 0.07 0.09 -0.03 0.01 -0.12 -0.06 0.01 0.04 -0.06 -0.03
ROUGE-4 0.04 0.09 0.04 0.08 -0.04 0.00 -0.12 -0.06 0.02 0.05 -0.04 -0.01
ROUGE-L 0.08 0.10 0.09 0.11 -0.01 0.07 -0.11 -0.03 0.01 0.01 -0.06 -0.04
ROUGE-W 0.08 0.10 0.08 0.10 -0.02 0.04 -0.12 -0.05 0.05 0.05 -0.03 -0.02
WMD 0.03 0.05 0.05 0.08 -0.02 0.00 -0.12 -0.07 0.03 0.05 -0.05 0.00
SMD 0.00 0.04 0.02 0.07 0.00 0.01 -0.09 -0.06 -0.01 0.03 -0.07 -0.01
S+WMD 0.02 0.05 0.04 0.08 -0.01 0.00 -0.11 -0.07 0.02 0.05 -0.06 -0.01
Table 15: Instance-level Spearman’s ρ and Pearson’s r correlations on the BAGEL, SFHOTEL and SFRESTdatasets.


![Opening a [Gruen] Wristwatch Case and Removing the … · Opening a [Gruen] Wristwatch Case and Removing the Movement isafely-ish] By Mike Barnett This is a tutorial on how to open](https://img.pdfslide.us/doc/110x75/5adba54a7f8b9afc0f8e1eca/opening-a-gruen-wristwatch-case-and-removing-the-a-gruen-wristwatch-case.jpg)

![Opening a [Gruen] Wristwatch Case and Removing the ... · Opening a [Gruen] Wristwatch Case and Removing the Movement [safely-ish] By Mike Barnett This is a tutorial on how to open](https://img.pdfslide.us/doc/110x75/5fad20331c61264f2c223d05/opening-a-gruen-wristwatch-case-and-removing-the-opening-a-gruen-wristwatch.jpg)