Embed Size (px)
Citation preview
ORIGINAL ARTICLE
Impact Factor : 0.1870 ISSN No :2231-5063
Monthly Multidisciplinary Research Journal
GoldenResearch
Thoughts
Chief EditorDr.Tukaram Narayan Shinde
PublisherMrs.Laxmi Ashok Yakkaldevi
Associate EditorDr.Rajani Dalvi
HonoraryMr.Ashok Yakkaldevi
Vol 2 Issue 11 May 2013

Mohammad HailatDept. of Mathmatical Sciences, University of South Carolina Aiken, Aiken SC 29801
Abdullah SabbaghEngineering Studies, Sydney
Catalina NeculaiUniversity of Coventry, UK
Ecaterina PatrascuSpiru Haret University, Bucharest
Loredana BoscaSpiru Haret University, Romania
Fabricio Moraes de AlmeidaFederal University of Rondonia, Brazil
George - Calin SERITANPostdoctoral Researcher
Hasan BaktirEnglish Language and Literature Department, Kayseri
Ghayoor Abbas ChotanaDepartment of Chemistry, Lahore University of Management Sciences [ PK ]Anna Maria ConstantinoviciAL. I. Cuza University, Romania
Horia PatrascuSpiru Haret University, Bucharest, Romania
Ilie Pintea,Spiru Haret University, Romania
Xiaohua YangPhD, USANawab Ali KhanCollege of Business Administration
Flávio de São Pedro FilhoFederal University of Rondonia, Brazil
Kamani PereraRegional Centre For Strategic Studies, Sri Lanka
Janaki SinnasamyLibrarian, University of Malaya [ Malaysia ]
Romona MihailaSpiru Haret University, Romania
Delia SerbescuSpiru Haret University, Bucharest, Romania
Anurag MisraDBS College, Kanpur
Titus Pop
Pratap Vyamktrao NaikwadeASP College Devrukh,Ratnagiri,MS India
R. R. PatilHead Geology Department Solapur University, Solapur
Rama BhosalePrin. and Jt. Director Higher Education, Panvel
Salve R. N.Department of Sociology, Shivaji University, Kolhapur
Govind P. ShindeBharati Vidyapeeth School of Distance Education Center, Navi Mumbai
Chakane Sanjay DnyaneshwarArts, Science & Commerce College, Indapur, Pune
Awadhesh Kumar ShirotriyaSecretary, Play India Play (Trust),Meerut
Iresh SwamiEx - VC. Solapur University, Solapur
N.S. DhaygudeEx. Prin. Dayanand College, Solapur
Narendra KaduJt. Director Higher Education, Pune
K. M. BhandarkarPraful Patel College of Education, Gondia
Sonal SinghVikram University, Ujjain
G. P. PatankarS. D. M. Degree College, Honavar, Karnataka
Maj. S. Bakhtiar ChoudharyDirector,Hyderabad AP India.
S.Parvathi DeviPh.D.-University of Allahabad
Sonal Singh
Rajendra ShendgeDirector, B.C.U.D. Solapur University, Solapur
R. R. YalikarDirector Managment Institute, Solapur
Umesh RajderkarHead Humanities & Social Science YCMOU, Nashik
S. R. PandyaHead Education Dept. Mumbai University, Mumbai
Alka Darshan ShrivastavaShaskiya Snatkottar Mahavidyalaya, Dhar
Rahul Shriram SudkeDevi Ahilya Vishwavidyalaya, Indore
S.KANNANPh.D , Annamalai University,TN
Satish Kumar Kalhotra
Editorial Board
International Advisory Board
IMPACT FACTOR : 0.2105
Welcome to ISRJISSN No.2230-7850
Indian Streams Research Journal is a multidisciplinary research journal, published monthly in English, Hindi & Marathi Language. All research papers submitted to the journal will be double - blind peer reviewed referred by members of the editorial Board readers will include investigator in universities, research institutes government and industry with research interest in the general subjects.
RNI MAHMUL/2011/38595
Address:-Ashok Yakkaldevi 258/34, Raviwar Peth, Solapur - 413 005 Maharashtra, IndiaCell : 9595 359 435, Ph No: 02172372010 Email: [email protected] Website: www.isrj.net

Title : Source:Golden Research Thoughts [2231-5063]
yr:2013 vol:2 iss:11
GEOGRAPHICAL ANALYSIS OF EMPLOYMENT, PER CAPITA INCOME AND LEVELS OF DEVELOPMENT AMONG URBAN BEGGAR POPULATION IN ALIGARH DISTRICT JABIR HASAN KHAN , MENKA AND SHAMSHAD
KEY WORDS:
Employment, Per Capita Income, Development, Urban Beggars, Aligarh.
INTRODUCTION
Begging being a serious problem confronts in many urban areas across the globe. The situation becomes worse when it confronts urban areas of less developed nations. Despite the pronounced manifestation of this problem in developing countries, people still regard begging as a normal phenomenon (Adedibu 1989; Ogunkan and Fawole 2009; Tambawal 2010 cited by Namwata et al. 2012; Adedibu and Jelili 2011). Begging is a social ill whose implications for city economy and environment call for concern of urban planners. The negative impacts of begging on social and physical environments are obvious in the tendency of beggars to delay and obstruct free flow human and vehicular traffic, and their high propensity to generate dirty materials either as waste or as parts of their belongings (Jelili 2006 cited by Namwata et al. 2010). The presence of beggars is perceived to be indicative of larger social ills or issues and can cause others to avoid beggar-inhabited areas (Clapper 2012). Begging is commonly defined as the act of stopping people on the street to ask for assistance, for example in the form of food or money (Bose and Hwang 2002; Collins and Blomley 2003).
Begging has been a traditional profession in India as charity is considered one of the noblest of human virtues according to Hindu tradition (Dhruvasan 1963). Beggars in India are the victims of an unbalanced socio-economic system. They are amongst the most vulnerable people in our society and show
Abstract:
The present study deals with the variations in the employment, income, socio-economic status of urban beggars, and the relationship between their employment & per capita income (dependent variables) with selected variables of socio-economic development in Aligarh district of Uttar Pradesh. The study is based on primary source of data, collected through the field survey in the Aligarh district carried out during 2009. All the towns were selected for the survey. The 6 per cent wards from each town have been selected in which 25 per cent beggars' households from each ward were randomly surveyed for the study. Altogether, 396 households were selected for the present study. The analysis of the present research work reveals that the medium level of employment is witnessed in the whole central part, while, eastern and western parts experienced the low level of employment in the study area. Whereas, the high level of per capita income of urban beggars is witnessed in the south-eastern part, while, low level of income is experienced in the central part of Aligarh district. Moreover, the majority of blocks (fifty per cent) of the district witnessed low level of development among urban beggars.
GEOGRAPHICAL ANALYSIS OF EMPLOYMENT, PER CAPITA INCOME AND LEVELS OF DEVELOPMENT AMONG URBAN
BEGGAR POPULATION IN ALIGARH DISTRICT
JABIR HASAN KHAN , MENKA AND SHAMSHAD
Associate Professor , Department of Geography Aligarh Muslim University Aligarh.Department of Geography , Aligarh Muslim University Aligarh.
Research Scholar , Department of Geography Aligarh Muslim University Aligarh
Available online at www.aygrt.isrj.net
ORIGINAL ARTICLE
Volume 2, Issue. 11, May. 2013Golden Research Thoughts
ISSN:-2231-5063
GRT

the low soci0-economic conditions of that group and this is the human degradation to the lowest extent for them, and a menace to the healthy society. Most of them are the product of economic deprivation, destitution and neglect (Cama, 1945). Fitzpatrick and Kennedy (2000) defined begging as “asking passer-by for money in a public space”. Michael Adler defined beggars as “people who beg, that is, who ask for money for themselves without offering anything in return” (Adler, Bromley, and Rosie 2000). Mukharjee (1945) pointed out that “Beggary is a symptom of social disorganisation”. The major factors making for its prevalence are to be found in the breakdown of the socio-economic structure of the country.
The development is an outcome of the efforts made for the eradication of poverty and unemployment and regional inequalities (Seer, 1989). According to Verma (1993), development of a region can be identified with an increase in the employment opportunities, availability of infrastructural facilities, amenities and services, proper distribution of resources, increase in production, and investment in consumption and so on. Thus, the development refers to an improvement of all the sectors of economic, social and cultural pursuits.
OBJECTIVES OF THE STUDY
The present study has been undertaken with the following specific objectives:
i.to examine the regional variations of employment of urban beggars in the district,ii.to analyse the spatial variations of per capita income of urban beggars in the Aligarh district,iii.to inspect the geographical disparities in the level of development in the study area,iv.to see the relationship of employment and per capita income of the urban beggars (dependent variables) with the selected variables of socio-economic development.
STUDY AREA
Aligarh district, a medium sized district, is spreading over an area of 3700.4 square kilometers in the Western part of Uttar Pradesh. It occupies the north-western part of the Uttar Pradesh which is fertile region of Ganga and Yamuna, known as Doab. In the world map, the geographical location of this district is in North-Eastern Hemisphere and lying between the parallels of 27o29' and 28o11' north latitudes and meridians of 77o29' and 78o38' east longitudes. Its boundary touches the boundaries of five other districts (Bulandshahr, Badaun, Mathura, Hathras and Etah) of the Uttar Pradesh and one state (Haryana) of India. At present, the district is divided into five Tahsils namely, Koil, Khair, Gabhana, Atrauli and Iglas for the purpose of land record keeping, land revenue collection, judicial administration, etc. These tahsils are further sub-divided into 12 development blocks namely: Atrauli, Gangiri, Bijauli, Jawan, Chandus, Khair, Tappal, Dhanipur, Lodha, Akrabad, Iglas and Gonda.
According to 2001 Census, the district accommodates a residential population of 29, 92, 286 of which 29 per cent was classified as urban and 71 per cent as rural. The general density of population in the district was 820 persons per sq. km. However, it was 607 persons per sq. km. in the rural sector and 5,949 persons per sq. km. in the urban sector. The general sex ratio that is the number of females per thousand males was 862 in the district, whereas, the figures for the rural and urban areas were 856 and 876 respectively. The literacy rate in the district is 58.5 per cent and the male literacy rate is 71.7 per cent and females are 43.0 per cent literate while, the percentage of literacy in rural and urban population was 56.5 and 63.2 respectively.
According to the Census of India there were 7,50,307 beggars and vagrants in India in 1981, which declined to 5,42,875 in 1991, though it further increased to 6,27,688 in 2001. Out of the total beggars, about two third beggars were in rural areas while one-third in urban areas. The matter of begging is not the ignorable issue of the society, but in fact, the begging has become one of the most problematic social issues of India. It is, therefore, necessary that empirical studies have to be undertaken aimed at collecting relevant data on the subject.
DATABASE AND METHODOLOGY
The study is based on primary source of data that has been collected the through field survey in the Aligarh district, carried out during 2009. All the 13 towns were selected for the survey. The two blocks (Chandaus and Bijauli) of the district do not have any town or urban unit (means there is no urban population) that is why; they were excluded for this analysis. The 6 per cent wards from each town have been selected in which 25 per cent beggars' households from each ward were randomly surveyed for the study. Altogether, 396 households were selected for the present study.
2
GEOGRAPHICAL ANALYSIS OF EMPLOYMENT, PER CAPITA INCOME AND LEVELS..........
Golden Research Thoughts • Volume 2 Issue 11 • May 2013
In the present analysis, a set of seventeen indicators of development have been taken into account to determine the levels of socio-economic status of the urban beggars at one hand and employment rate and per capita income on the other hand in the twelve blocks of the district. These indicators fall into five categories like population characteristics, literacy, employment, income and household infrastructural facilities. In the first step, the raw data for each variable which determines the areal variations of employment rate and per capita income, and levels of their socio-economic status have been computed into standard score. It is generally known as Z value or Z-score. The score quantify the departure of individual observations, expressed in a comparable form. This means it becomes a linear transformation of the original data (Smith, 1973: 85). It may be expressed as:
Where: Z = Standardised value of the variable i in block j,ij
X = Actual value of variable i in block j,ij
X = Mean value of variable i in all blocks,i
ó = Standard deviation of variable i in all blocks.i
In the second step, the Z-scores of all variables have been added block wise and the average has taken out for these variables which may be called as composite score (CS) for each block and may be algebraically expressed as:
Where: CS stands composite score,
∑Z indicates Z-scores of all variables i in district j,ij
N refers to the number of variables.
The positive values relating to the districts' Z-score explain high level, while, negative values indicate the low employment rate and per capita income of urban beggars, and their levels of development in the study area. The correlation co-efficient is worked out among dependent variables (employment rate and per capita income) and independent variables (selected variables of development) and student t-test technique is applied to find out the determinants which are significant at 1 per cent and 5 per cent levels.
The correlation co-efficient has been computed on the basis of the Karl Pearson's correlation co-efficient (r) method which is as follows:
Where: r is the co-efficient of correlation, X, y are the two given variables, n is the number of observation.
To find out the computed 't' value, student t-test technique is used which is given below:
Where: t is the calculated value of 't' in the test of significance, r is the computed value of co-efficient of correlation,
3Golden Research Thoughts • Volume 2 Issue 11 • May 2013
i
iij
ij
XXZ
s
-=
N
ZCS
ijå=
n
yy
n
xx
nyxxyr
22
22 )()(
/
S-S
S-S
SS-S=
21
)2(
r
nrt
-
-=
GEOGRAPHICAL ANALYSIS OF EMPLOYMENT, PER CAPITA INCOME AND LEVELS..........

n is the number of observation.
Besides, advanced statistical techniques, GIS-Arc view programme (Version 3.2a) has been applied to show the spatial variations of employment rate and per capita income of the urban beggars and their levels of development among the blocks of the Aligarh district through maps.
Employment and Per Capita Income
Table 1 envisages the block wise z-score of employment of urban beggar population in Aligarh. There are wide regional variations of employment rate in the district which ranges from the lowest - 0.83 score in Gonda block to the highest 1.86 score in Akrabad block, which may be grouped into three grades namely, above 0.39 score (high), 0.39 to - 0.39 score (medium) and below -0.39 score (low). The only Akrabad block observed high level (above 0.39 score) of employment and lies in the south-eastern part of the district. The medium level (0.39 to -0.39 score) of employment is experienced in the six blocks of the district and five of them namely, Lodha, Dhanipur, Iglas, Jawan and Atrauli constitute an identifiable region in the central part of the district but Tappal block in the north-western part of the district does not form any region. Three blocks of the district witnessed the low (below -0.39 score) level of employment rate, in which, two blocks (Khair and Gonda) make a region in the south-western part and one block (Gangiri) is located in the eastern part of the district. Regional analysis of data depicts that the majority of the central blocks of the district witnessed the medium level of employment among urban beggars, while, western and eastern parts experienced the low level of employment of urban beggar population in the study area.
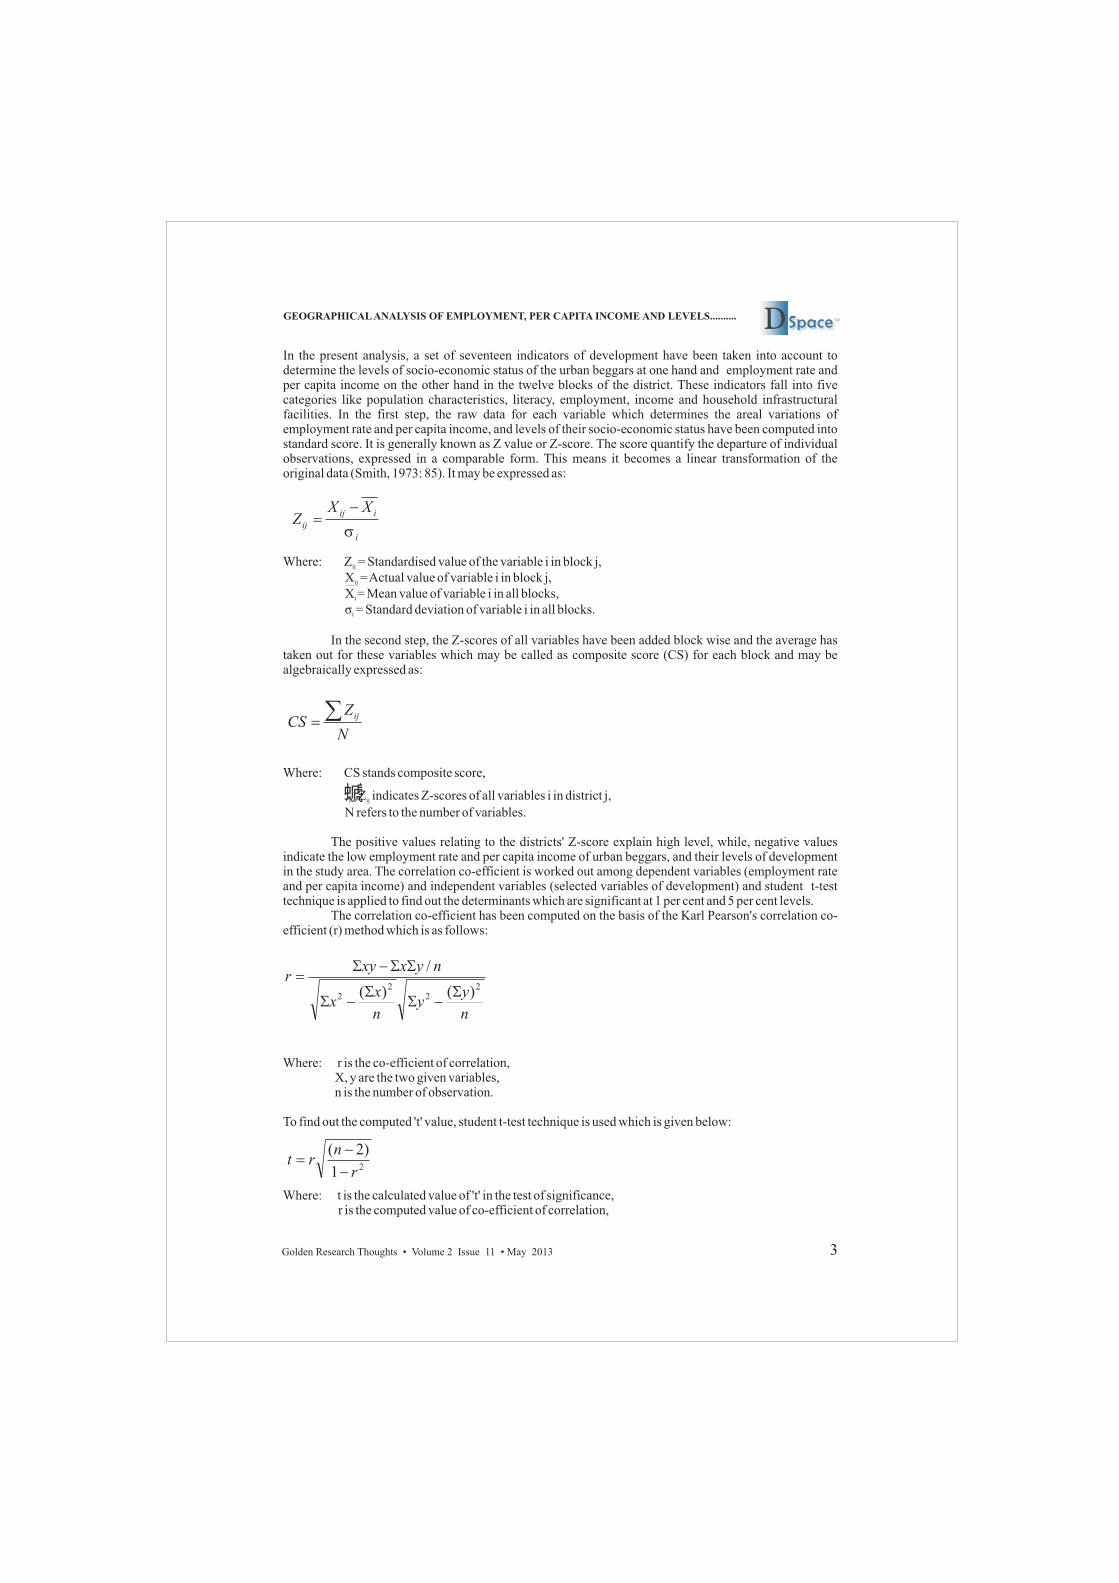
Table 1 also shows the regional variations of per capita income of urban beggars in the district and it varies from lowest -1.07 score in Gonda block to the highest 2.38 score in Dhanipur block that may be categorised into three grades as high (above 0.50 score), medium (0.50 to - 0.50 score) and low (below -0.50 score) as given in Table 2. The pattern of per capita income of urban beggars in the district is shown by the Figure 3. The Table 2 depicts that the two blocks of the district have high level (above 0.50 score) of per capita income and they form a small region in the south-eastern part of the district comprising the blocks of Dhanipur and Akrabad. Six blocks of the district recorded the medium level (0.50 to -0.50 score) of urban per capita income they are Tappal, Khair, Iglas, Jawan, Atrauli and Gangiri, and five out of them, form two distinct regions. First region lying in the north-western part of the district includes the blocks Tappal and Khair while second region is being situated in north-eastern part of the district composes the blocks of Jawan, Atrauli and Gangiri, but Iglas block does not make any region in the district. The blocks of Lodha and Gonda having the low level (below -0.50 score) of per capita income constitute a distinguished region in the central and south-western parts of the district. Thus, an analysis of the Figure 3 exhibits that the high level of per capita income of urban beggars is witnessed in the south-eastern part, while, low level of income is experienced in the central part of the study area. The other peripheral blocks of the district observed the medium level of per capita income.
Level of Development
The level of socio-economic development is the aggregate output of the attainment of the various selected indicators of socio-economic development. It can be measured in an area with the help of several indicators but beggars are the persons who are considered as poorest of the poor and do not have so much infrastructural facilities available within their households that is why, some selected indicators has been chosen to measure their level of development.
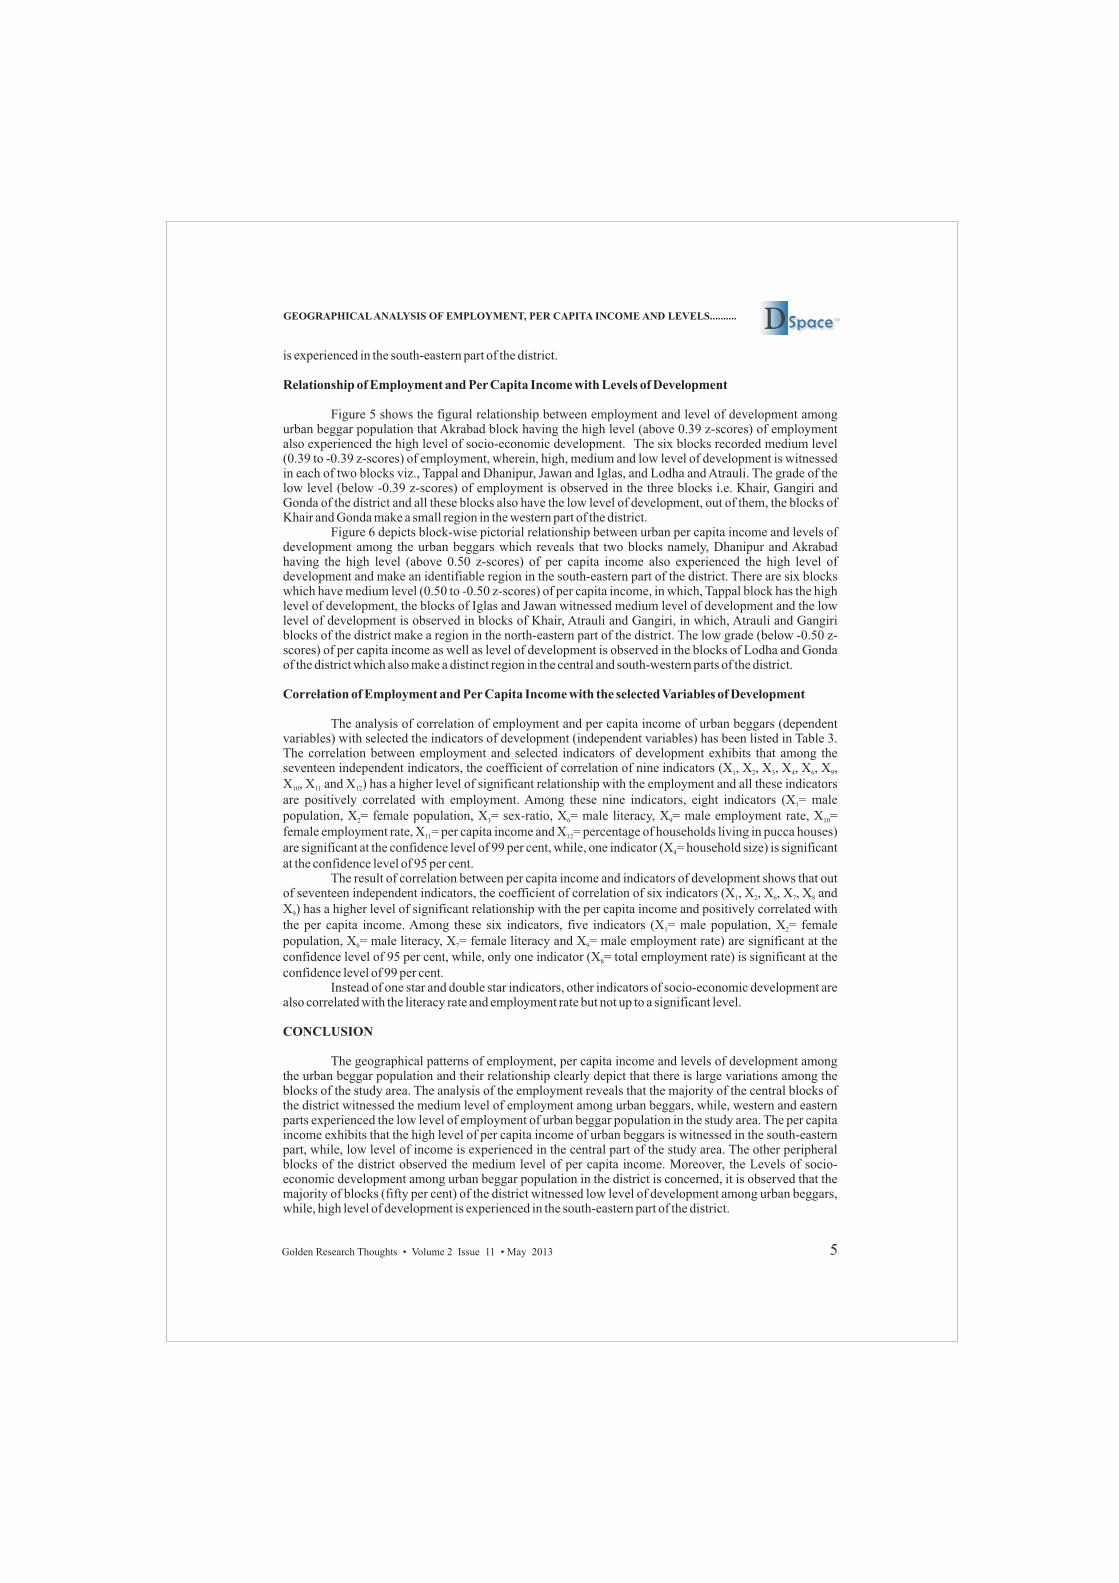
Table 1 reveals the block-wise development among urban beggar population in Aligarh district. The range of socio-economic development varies from -0.41 score in Gonda block to 0.59 score in Dhanipur block. This range of variations may be arranged into three grades as high (above 0.17 score), medium (0.17 to - 0.17 score) and low (below -0.17 score). Table 2 shows that three blocks i.e. Dhanipur, Akrabad and Tappal of the district have the high level (above 0.17 score) of development, in which, Dhanipur and Akrabad blocks make a recognizable region in the south-eastern part of the district. The two blocks namely Jawan and Iglas witnessed medium level (0.17 to -0.17 score) of development and fail to share the boundary of adjacent blocks of same level to make any region in the district. The remaining five blocks of the district accounted the low (below -0.17 score) level of development among the urban beggar population these blocks are Khair, Lodha, Gonda, Atrauli and Gangiri which form two different regions. First region by comprising the blocks of Khair, Lodha and Gonda lies in the central and western parts, whereas, second region by including the blocks of Atrauli and Gangiri locates in the north-eastern part of the study unit. The geographical analysis of the Figure 4 discloses that the majority of blocks (fifty per cent) of the district witnessed low level of development among urban beggars, while, high level of development
4Golden Research Thoughts • Volume 2 Issue 11 • May 2013
GEOGRAPHICAL ANALYSIS OF EMPLOYMENT, PER CAPITA INCOME AND LEVELS..........
is experienced in the south-eastern part of the district.
Relationship of Employment and Per Capita Income with Levels of Development
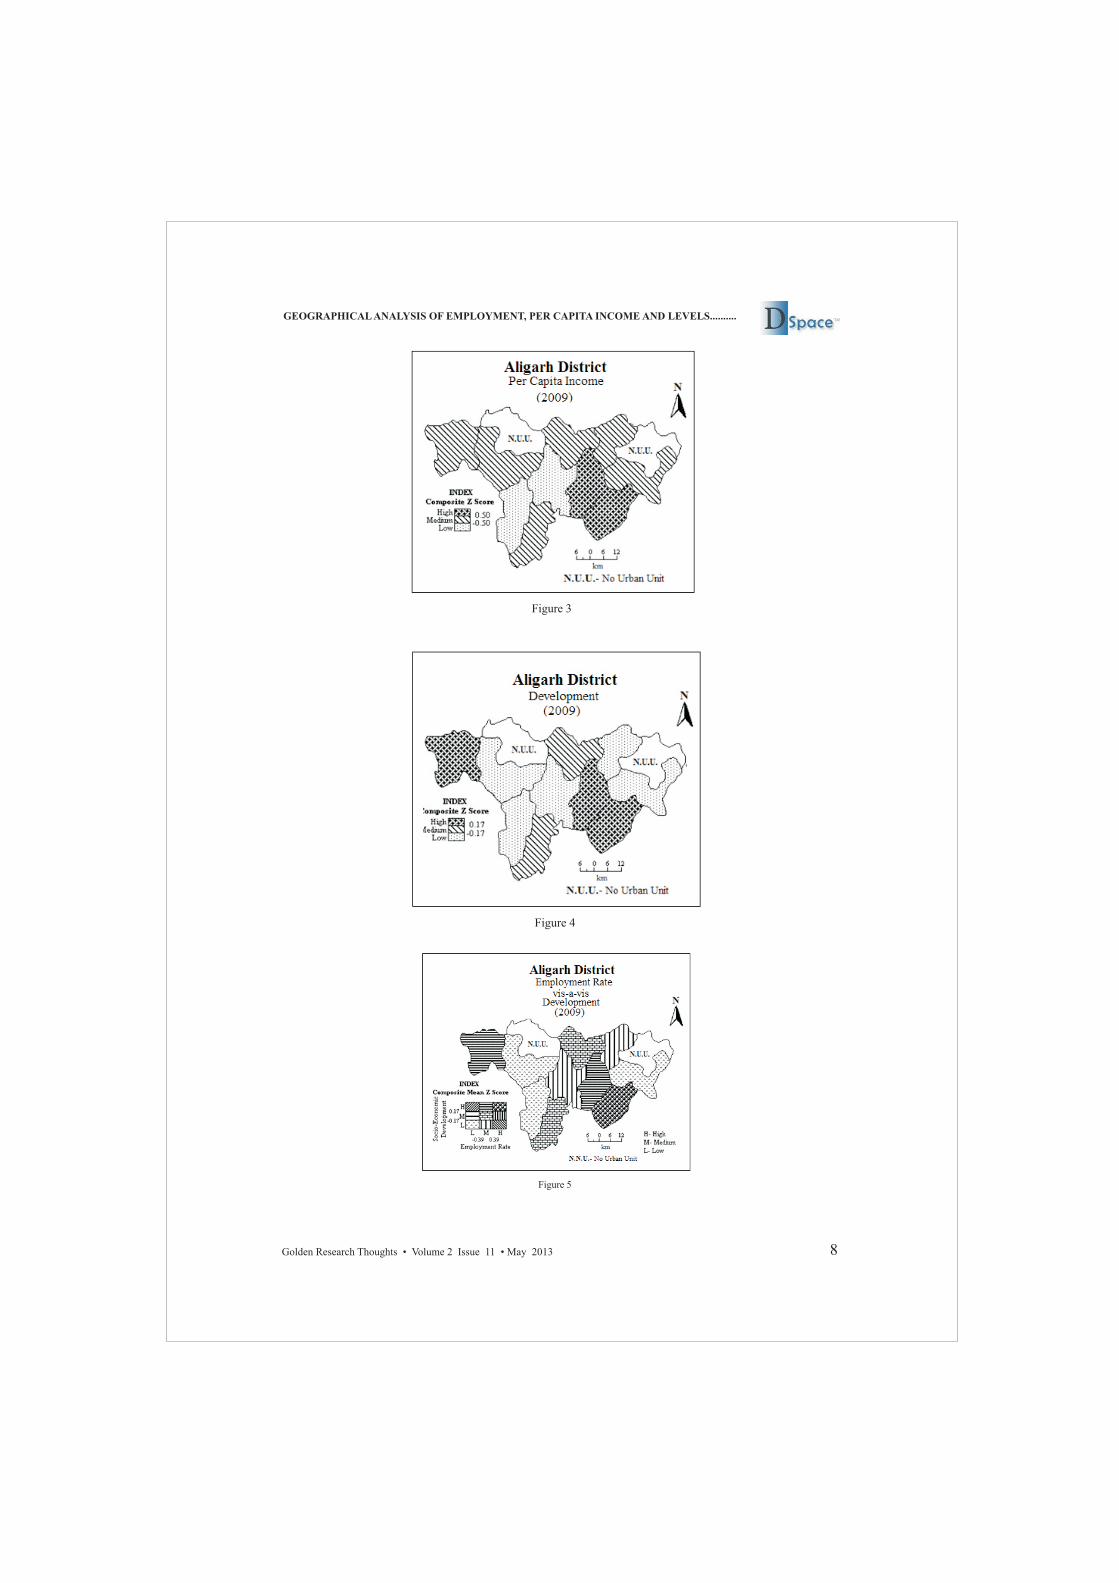
Figure 5 shows the figural relationship between employment and level of development among urban beggar population that Akrabad block having the high level (above 0.39 z-scores) of employment also experienced the high level of socio-economic development. The six blocks recorded medium level (0.39 to -0.39 z-scores) of employment, wherein, high, medium and low level of development is witnessed in each of two blocks viz., Tappal and Dhanipur, Jawan and Iglas, and Lodha and Atrauli. The grade of the low level (below -0.39 z-scores) of employment is observed in the three blocks i.e. Khair, Gangiri and Gonda of the district and all these blocks also have the low level of development, out of them, the blocks of Khair and Gonda make a small region in the western part of the district.
Figure 6 depicts block-wise pictorial relationship between urban per capita income and levels of development among the urban beggars which reveals that two blocks namely, Dhanipur and Akrabad having the high level (above 0.50 z-scores) of per capita income also experienced the high level of development and make an identifiable region in the south-eastern part of the district. There are six blocks which have medium level (0.50 to -0.50 z-scores) of per capita income, in which, Tappal block has the high level of development, the blocks of Iglas and Jawan witnessed medium level of development and the low level of development is observed in blocks of Khair, Atrauli and Gangiri, in which, Atrauli and Gangiri blocks of the district make a region in the north-eastern part of the district. The low grade (below -0.50 z-scores) of per capita income as well as level of development is observed in the blocks of Lodha and Gonda of the district which also make a distinct region in the central and south-western parts of the district.
Correlation of Employment and Per Capita Income with the selected Variables of Development
The analysis of correlation of employment and per capita income of urban beggars (dependent variables) with selected the indicators of development (independent variables) has been listed in Table 3. The correlation between employment and selected indicators of development exhibits that among the seventeen independent indicators, the coefficient of correlation of nine indicators (X , X , X , X , X , X , 1 2 3 4 6 9
X , X and X ) has a higher level of significant relationship with the employment and all these indicators 10 11 12
are positively correlated with employment. Among these nine indicators, eight indicators (X = male 1
population, X = female population, X = sex-ratio, X = male literacy, X = male employment rate, X = 2 3 6 9 10
female employment rate, X = per capita income and X = percentage of households living in pucca houses) 11 12
are significant at the confidence level of 99 per cent, while, one indicator (X = household size) is significant 4
at the confidence level of 95 per cent.The result of correlation between per capita income and indicators of development shows that out
of seventeen independent indicators, the coefficient of correlation of six indicators (X , X , X , X , X and 1 2 6 7 8
X ) has a higher level of significant relationship with the per capita income and positively correlated with 9
the per capita income. Among these six indicators, five indicators (X = male population, X = female 1 2
population, X = male literacy, X = female literacy and X = male employment rate) are significant at the 6 7 9
confidence level of 95 per cent, while, only one indicator (X = total employment rate) is significant at the 8
confidence level of 99 per cent.Instead of one star and double star indicators, other indicators of socio-economic development are
also correlated with the literacy rate and employment rate but not up to a significant level.
CONCLUSION
The geographical patterns of employment, per capita income and levels of development among the urban beggar population and their relationship clearly depict that there is large variations among the blocks of the study area. The analysis of the employment reveals that the majority of the central blocks of the district witnessed the medium level of employment among urban beggars, while, western and eastern parts experienced the low level of employment of urban beggar population in the study area. The per capita income exhibits that the high level of per capita income of urban beggars is witnessed in the south-eastern part, while, low level of income is experienced in the central part of the study area. The other peripheral blocks of the district observed the medium level of per capita income. Moreover, the Levels of socio-economic development among urban beggar population in the district is concerned, it is observed that the majority of blocks (fifty per cent) of the district witnessed low level of development among urban beggars, while, high level of development is experienced in the south-eastern part of the district.
5Golden Research Thoughts • Volume 2 Issue 11 • May 2013
GEOGRAPHICAL ANALYSIS OF EMPLOYMENT, PER CAPITA INCOME AND LEVELS..........

The association between employment and levels of development among the urban beggars depicts that out of ten blocks, the five blocks experienced the perfect positive relationship between employment and level of development in the district. On the other hand, the relationship between per capita income and levels of development shows that about sixty percent blocks of the district of Aligarh are perfectly positive correlated with each other and forty per cent blocks of the district moderately related with each other in this regard. The analysis of t-test indicates that male population, female population, sex-ratio, male literacy rate, male employment rate, female employment rate, per capita income, percentage of households living in pucca houses and household size are the major positive determinants bringing the regional variations in employment opportunities among the urban beggars in the study area. While the per capita income of urban beggars is mainly alimented by male population, female population, male literacy, female literacy, male employment rate and total employment rate in the district.
REFERENCES:
Adedibu, A.A. (1989) “Begging and Poverty in Third World Cities: A Case Study of Ilorin, Nigeria”, Ilorin J. Bus. Soc. Sci. (IJBSS), Vol.1: 25-40. Adedibu, A.A. and Jelili, M.O. (2011) “Package for Controlling Street Begging and Rehabilitating Beggars and the Physically Challenged in Nigeria: Paper for Policy Consideration”, Global Journal of Human Social Science (USA), Vol. 11(1): 17–24.Adler, M., Bromley, C., & Rosie, M. (2000) “Begging as a Challenge to the Welfare State”, In R. Jowell, J. Curtice, A. Park, K. Thomson, L. Jarvis, C. Bromley & N. Stratford (Eds.), British Attitudes: the 17th Report. Focusing on diversity (pp. 209-237), London: Sage.Bose, R. and Hwang, S.W. (2002) “Income and Spending Patterns among Panhandlers”, Canadian Medical Association Journal, Vol. 167(5): 477–479. Cama, K.H. (1945) “Types of Beggars”, In J. M. Kumarappa (Ed.), Our Beggar Problem: How to Tackle it (pp. 1-17), Bombay: Padma Publications Ltd.Census of India (2001) Primary Census Abstract, Series-1, Total Population: Table A-5, Registrar General and Census Commissioner, Govt. of India, New Delhi.Clapper, T.M. (2012) “About Beggars”, eHow Contributor. p.1. Retrieved from .Collins, D. and Blomley, N. (2003) “Private Needs and Public Space: Politics, Poverty, and Anti-Panhandling By-Laws in Canadian Cities”, In Law Commission of Canada (Ed.), New Perspectives on the Public–Private Divide, Vancouver: UBC Press, p.1.Dhruvasan, A.R. (1963) “Is This A Part of Religion”, Social Welfare, Vol.10 (9): 10-12.Fitzpatrick, S. & Kennedy, C. (2000) “Getting by Begging, Rough Sleeping and the Issue in Glasgow and Edinburgh”, Bristol: The Policy Press. pp.2.Mukharjee, R. (1945) “Causes of Beggary”, In J. M. Kumarappa (Ed.), Our Beggar Problem: How to Tackle it (pp. 19-26), Bombay: Padma Publications Ltd.Namwata, B.M.L., Mgabo, M.R. and Dimoso, P. (2010) “Demographic Dimensions and Their Implications on the Incidence of Street Begging in Urban Areas of Central Tanzania: The Case of Dodoma and Singida Municipalities”, Global Journal of Human Social Science, Vol. 11(4): 53–60.Namwata, B.M.L., Mgabo, M.R. and Dimoso, P. (2012, June) “Categories of Street Beggars and Factors Influencing Street Begging in Central Tanzania”, African Study Monographs, Vol. 33(2): 133-143. Ogunkan, D.V. & Fawole, O.A. (2009) “Incidence and Socio-Economic Dimensions of Begging in Nigerian Cities: The Case of Ogbomoso”, International NGO Journal, Vol.4(12): 498–503.Seer, D. (1969) “The Meaning of Development”, New Delhi: Eleventh World Conference of Society for International Development, p.3.Smith, D.M. (1973) “The Geography of Social Well Being in the United State: An Introduction to Territorial Social Indicators”, New York: McGraw-Hill, p. 85.Verma, S.S. (1993) “Typology of Development and Planning for Integrated Development: A Study of Rohilkhand Plain (UP)”, In R.S. Tripathi and R.P. Tiwari (Eds.), Regional Disparities and Development in India, New Delhi: Ashish Publishing House, pp. 231-243.Vikas Bhawan Office, Aligarh.
http://www.ehow.com/about_4610585_beggars.html
6Golden Research Thoughts • Volume 2 Issue 11 • May 2013
GEOGRAPHICAL ANALYSIS OF EMPLOYMENT, PER CAPITA INCOME AND LEVELS..........

MAPS
Aligarh District: Administrative Divisions, 2001
7Golden Research Thoughts • Volume 2 Issue 11 • May 2013
Source: Census of India & Vikas Bhawan, Aligarh, 2008.
Figure 1
Figure 2
GEOGRAPHICAL ANALYSIS OF EMPLOYMENT, PER CAPITA INCOME AND LEVELS..........
8Golden Research Thoughts • Volume 2 Issue 11 • May 2013
Figure 3
Figure 4
Figure 5
GEOGRAPHICAL ANALYSIS OF EMPLOYMENT, PER CAPITA INCOME AND LEVELS..........

9Golden Research Thoughts • Volume 2 Issue 11 • May 2013
Figure 6
APPENDIX ONE Table 1: Block-Wise Distribution of Z-score of Employment, Per Capita Income and Levels of Development among Urban Beggar Population in Aligarh District, 2009
Name of the Block Employment
Rate Per Capita
Income Development
Employment Rate vis-à-vis
Development
Per Capita Income vis-à-vis
Development
Lodha 0.21 -0.95 -0.21 ER2 D3 PCI3 D3
Dhanipur -0.16 2.38 0.59 ER2 D1 PCI1 D1
Akrabad 1.86 0.96 0.51 ER1 D1 PCI1 D1
Gonda -0.83 -1.07 -0.41 ER3 D3 PCI3 D3
Iglas 0.12 -0.2 -0.03 ER2 D2 PCI2 D2
Khair -0.81 -0.29 -0.2 ER3 D3 PCI2 D3
Tappal 0.35 -0.24 0.2 ER2 D1 PCI2 D1
Chandaus - - - - -
Jawan 0.14 0 0.03 ER2 D2 PCI2 D2
Atrauli -0.24 -0.24 -0.22 ER2 D3 PCI2 D3
Bijauli - - - - -
Gangiri -0.64 -0.35 -0.26 ER3 D3 PCI2 D3
Source: Calculation is based on Sample Survey by Researcher.
Note: ER1= High Level of Employment Rate, ER2= Medium Level of Employment Rate, ER3= Low Level of Employment Rate,
PCI1= High Level of Per Capita Income, PCI2= Medium Level of Per Capita Income, PCI3= Low Level of Per Capita Income,
D1= High Level of Development, D2= Medium Level of Development and D3= Low Level of Development
GEOGRAPHICAL ANALYSIS OF EMPLOYMENT, PER CAPITA INCOME AND LEVELS..........

10Golden Research Thoughts • Volume 2 Issue 11 • May 2013
APPENDIX TWO
Table 2: Levels of Employment, Per Capita Income and Levels of Development among Urban Beggars in Aligarh District, 2009
Category Z-Score No. of Blocks Name of the Blocks
Employment Rate
High Above 0.39 01 Akrabad
Medium 0.39 to -0.39 06 Lodha, Dhanipur, Jawan, Atrauli, Iglas and Tappal,
Low Below -0.39 03 Gonda, Khair and Gangiri
Per Capita Income
High Above 0.50 02 Dhanipur and Akrabad
Medium 0.50 to -0.50 06 Jawan, Atrauli, Gangiri, Iglas, Khair and Tappal,
Low Below -0.50 02 Lodha and Gonda
Development
High Above 0.17 03 Dhanipur, Akrabad and Tappal
Medium 0.17 to -0.17 02 Jawan and Iglas
Low Below -0.17 05 Lodha, Khair, Gonda, Atrauli and Gangiri
Source: Based on Table 1.
GEOGRAPHICAL ANALYSIS OF EMPLOYMENT, PER CAPITA INCOME AND LEVELS..........

ORIGINAL ARTICLE
Publish Research ArticleInternational Level Multidisciplinary Research Journal
For All Subjects
Dear Sir/Mam, We invite unpublished research paper.Summary of Research Project,Theses,Books and Books Review of publication,you will be pleased to know that our journals are
Associated and Indexed,India
¬
¬OPEN J-GATE International Scientific Journal Consortium Scientific
Associated and Indexed,USA
?
?Index Copernicus?Publication Index?Academic Journal Database?Contemporary Research Index?Academic Paper Databse?Digital Journals Database?Current Index to Scholarly Journals?Elite Scientific Journal Archive?Directory Of Academic Resources?Scholar Journal Index?Recent Science Index?Scientific Resources Database
EBSCO
Golden Research Thoughts 258/34 Raviwar Peth Solapur-413005,Maharashtra
[email protected]/[email protected]
Website : www.isrj.net