Embed Size (px)
Citation preview
The BC Organic MarketGrowth, Trends & Opportunities, 2013April 2013
by Shauna MacKinnon © Canada Organic Trade Association
Research supported by:
2 © Canada Organic Trade Association, 2013
ACKNOWLEDGEMENTS
PrOjecT STeerinG cOmmiTTee memberS
Matthew Holmes, Canada Organic Trade Association
Rob Horricks, Blush Lane Organics
Garth Owen, Organic Grocer
Billy Potash, Nature’s First Fruit
Gunta Vitins, Vitins Consulting
Ian Walker, Left Coast Naturals
FundinG SuPPOrT
Funding for this project has been provided by the Organic Sector Development Program (OSDP), a $900,000 fund for the development of the BC organic sector. Funding for the OSDP comes from Agriculture and Agri-Food Canada’s Canadian Agricultural Adaptation Program (CAAP), which is delivered by the Investment Agriculture Foundation in British Columbia.
The Canada Organic Trade Association wishes to thank our other funding partners: Loblaw Companies, Taste of Nature, UNFI Canada and Whole Foods Market.

3The BC Organic Market: Growth, Trends & Opportunities, 2013
TAbLE Of CONTENTSExECuTivE SuMMary ................................... 5
SECTiON i
BC OrganiC ShOppErS: ThE WhO, WhaT, WhErE & hOW MuCh ....... 9
1. Attitudes and influence ............................... 9
2. demographics ........................................... 11
Urban, educated, older .................................... 12
Health and wellness market segments ............... 14
3. dollars and cents: bc Organic Grocery Spending ....................................................... 16
Regional comparisons ....................................... 17
Consumers predict more organic spending ........ 17
SECTiON ii
MainSTrEaM & graSSrOOTS: grOWTh in ThE BC OrganiC MarKET ......... 18
4. bc Organic market Overview ...................... 18
The big picture for BC organic sales .................. 19
Changes in the last six years .............................. 20
5. Growth in mainstream retail ....................... 21
6. Organic Price Premiums ............................. 23
Competition amongst brands nationally ............ 23
Private label ...................................................... 24
Organic price premiums .................................... 24
Country of origin .............................................. 25
Organic claims and logos .................................. 26
7. natural Health & Foodservice ...................... 27
Growth in the face of competition .................... 27
Incubators for the new, small and local ............. 27
Coffee: The organic star in foodservice ............. 28
Mainstream foodservice enters organic ............. 28
8. Growth of direct marketing ......................... 29
The role of organic at BC farmers’ markets ........ 30
Community Supported Agriculture .................... 31
SECTiON iii
OppOrTuniTiES and rECOMMEndaTiOnS ... 33
9. Opportunities for Sector development ......... 33
Broaden and deepen the consumer market ....... 33
Strengthening local organic food systems ......... 33
Embracing the incubator role ............................ 34
A focus on foodservice ...................................... 34
Support for scaling up ....................................... 34
A viable organic meat and poultry sector .......... 34
10. recommendations for Future research .... 35
references .................................................... 36
4 © Canada Organic Trade Association, 2013
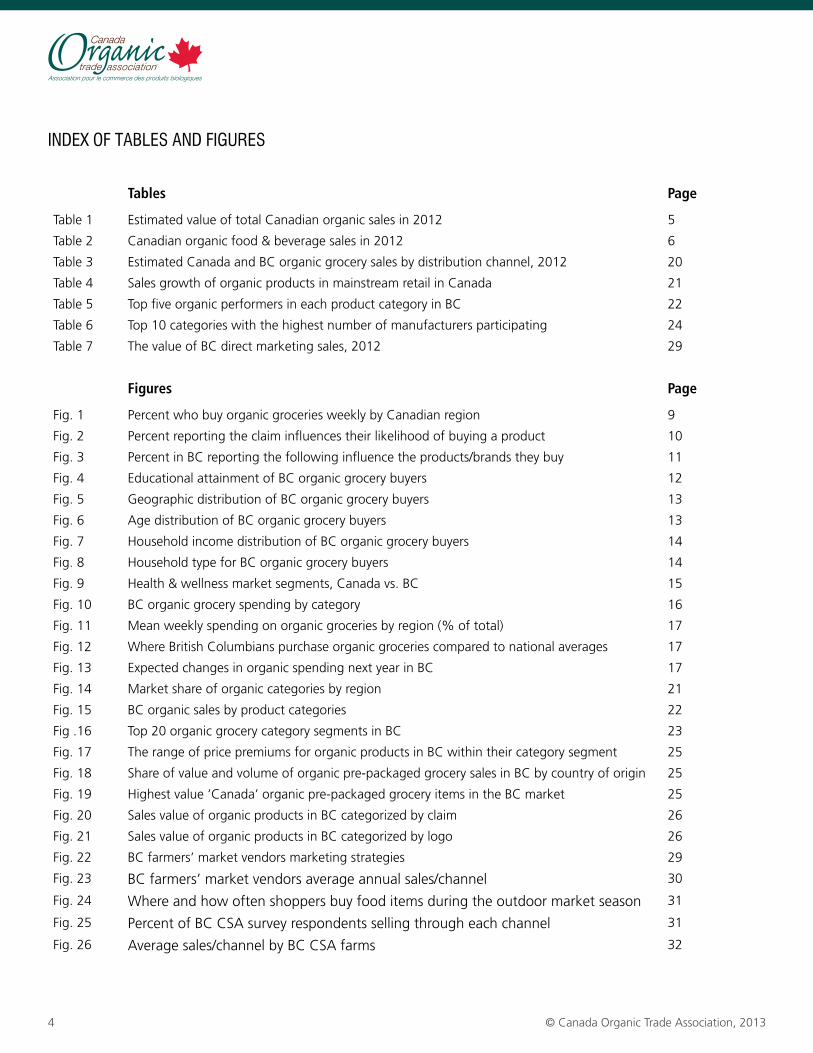
index OF TAbleS And FiGureS
Tables Page
Table 1 Estimated value of total Canadian organic sales in 2012 5
Table 2 Canadian organic food & beverage sales in 2012 6
Table 3 Estimated Canada and BC organic grocery sales by distribution channel, 2012 20
Table 4 Sales growth of organic products in mainstream retail in Canada 21
Table 5 Top five organic performers in each product category in BC 22
Table 6 Top 10 categories with the highest number of manufacturers participating 24
Table 7 The value of BC direct marketing sales, 2012 29
Figures Page
Fig. 1 Percent who buy organic groceries weekly by Canadian region 9
Fig. 2 Percent reporting the claim influences their likelihood of buying a product 10
Fig. 3 Percent in BC reporting the following influence the products/brands they buy 11
Fig. 4 Educational attainment of BC organic grocery buyers 12
Fig. 5 Geographic distribution of BC organic grocery buyers 13
Fig. 6 Age distribution of BC organic grocery buyers 13
Fig. 7 Household income distribution of BC organic grocery buyers 14
Fig. 8 Household type for BC organic grocery buyers 14
Fig. 9 Health & wellness market segments, Canada vs. BC 15
Fig. 10 BC organic grocery spending by category 16
Fig. 11 Mean weekly spending on organic groceries by region (% of total) 17
Fig. 12 Where British Columbians purchase organic groceries compared to national averages 17
Fig. 13 Expected changes in organic spending next year in BC 17
Fig. 14 Market share of organic categories by region 21
Fig. 15 BC organic sales by product categories 22
Fig .16 Top 20 organic grocery category segments in BC 23
Fig. 17 The range of price premiums for organic products in BC within their category segment 25
Fig. 18 Share of value and volume of organic pre-packaged grocery sales in BC by country of origin 25
Fig. 19 Highest value ‘Canada’ organic pre-packaged grocery items in the BC market 25
Fig. 20 Sales value of organic products in BC categorized by claim 26
Fig. 21 Sales value of organic products in BC categorized by logo 26
Fig. 22 BC farmers’ market vendors marketing strategies 29
Fig. 23 BC farmers’ market vendors average annual sales/channel 30
Fig. 24 Where and how often shoppers buy food items during the outdoor market season 31
Fig. 25 Percent of BC CSA survey respondents selling through each channel 31
Fig. 26 Average sales/channel by BC CSA farms 32
5 © Canada Organic Trade Association, 2013
ExECuTivE SuMMAryThe organic market in Canada has grown exponentially over a very short period, to the point that it is now the fourth largest in the world. One need only walk through the aisles of a major national grocery store or a small convenience store to see the increasing prevalence of organic products. From the traditional natural health food store to the coffee urns on Parliament Hill, organic products have become established as a visible and viable option in today’s market. What hasn’t been known until now is exactly how much growth, what kind of market share, or who exactly the consumer is. Two previous studies were conducted before the introduction of Canada’s Organic Products Regulations in 2009, and were based primarily on mainstream grocery sales tracked and aggregated by the Nielsen Company. They described a mushrooming organic marketplace—but one that existed before the global recession, and before the introduction of strict national standards, import restrictions and mandatory regulatory requirements on organic claims that tightened what made it to market. This study is the first to provide a perspective on the new, regulated organic market in Canada—with a particular focus on its engine, British Columbia—and the consumers who are driving its growth.
The “BC checkmark” program, which is now in its twentieth year, has fostered a unique awareness in BC of how certified organic food and farming differs from conventional production, along with a widely recognized visual cue for consumers. Outside of BC and Quebec, provincial regulatory programs do not yet exist. In the rest of the country, the launch of the Canada Organic Regime in 2009 was the first domestic organic initiative, introducing a recognizable logo and the label consistency that BC has enjoyed for years. This “head start” in BC is evident in many of the findings contained in this study. And the results of this research do more than describe a robust provincial market that is growing at retail while also supporting
local farmers: as a “bellwether” province, BC’s organic success offers a clear vision of growth for all of Canada’s organic market through the next decade and beyond.
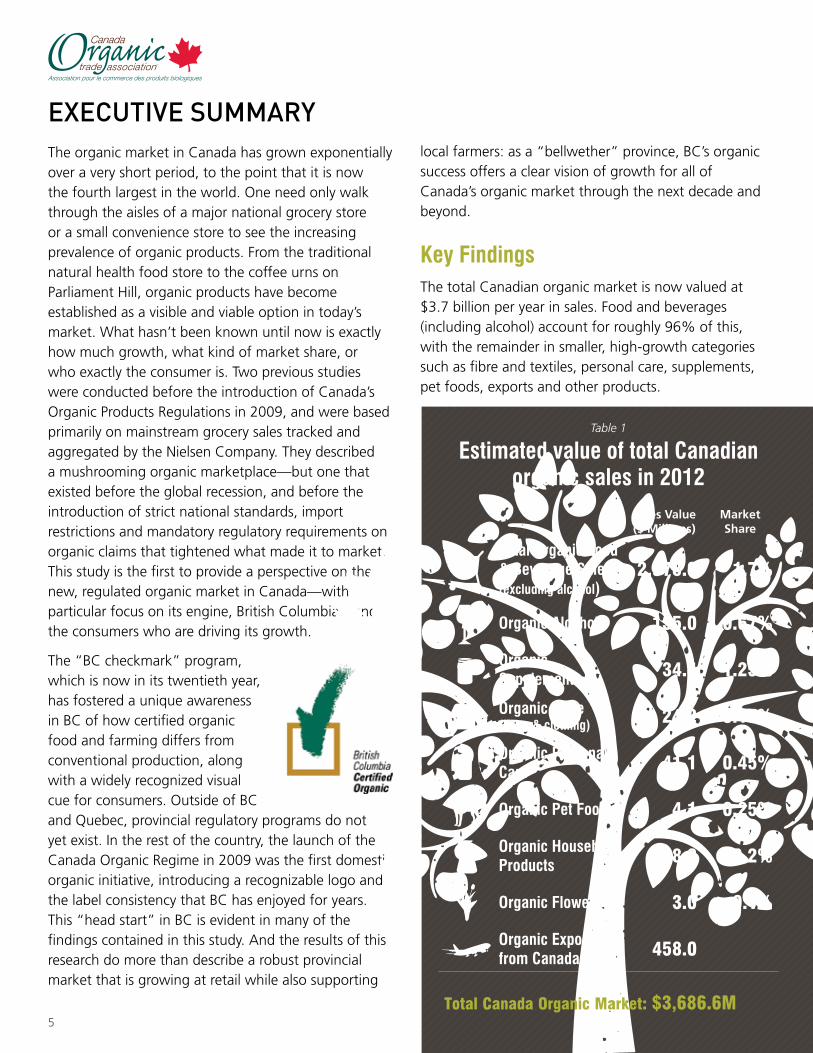
Key FindingsThe total Canadian organic market is now valued at $3.7 billion per year in sales. Food and beverages (including alcohol) account for roughly 96% of this, with the remainder in smaller, high-growth categories such as fibre and textiles, personal care, supplements, pet foods, exports and other products.
Table 1
Estimated value of total Canadian organic sales in 2012
Sales Value ($ Millions)
MarketShare
Total Organic Food & Beverage Sales (excluding alcohol)
2,978.6 1.7%
Organic alcohol 135.0 0.67%
Organic Supplements 34.4 1.25%
Organic Fibre (linen & clothing) 24.2 0.15%
Organic personal Care 41.1 0.45%
Organic pet Food 4.1 0.25%
Organic household products 8.2 0.2%
Organic Flowers 3.0 0.1%
Organic Exports from Canada 458.0
Total Canada Organic Market: $3,686.6M
6The BC Organic Market: Growth, Trends & Opportunities, 2013
BC is home to approximately 500 certified organic producers on 61,000 acres, as well as 110 organic processors and handlers (about 13% of all Canadian organic operators). And while it represents 13% of the Canadian population, BC accounts for 22% of organic food and beverage sales (over $662 million in 2012). The market has grown by an average of 11% since the recession, far outpacing the tepid growth in the rest of the food sector.
The market success of organic products in BC has been influenced by the long history of the provincial organic certification program, the established presence of natural health food stores, as well as more recent growth in both farmers’ markets and mainstream grocery offerings.
The level of influence of claims such as “made in Canada”, “local”, “organic”, and “non-GMO” are higher in BC than nationally, while the influence of “natural” or “all natural” claims is lower. This suggests there is a more perceptive and informed audience for organic products in BC. The level of influence of
products labelled “Canada Organic” is nearly double the influence of the “USDA Organic” seal.
Total BC organic market share for pre-packaged grocery items is almost double what it is for the rest of Canada —2.9% in BC vs. 1.6% nationally. Organic pre-packaged salads have 39% market share in their category segment, while organic roast and ground coffee represents 15% of all coffee sold in the province through mainstream retail channels.
Over 40% of all organic sales at mainstream retail are fresh fruit and vegetables. When asked about their buying intentions over the next year, 98% of BC respondents indicated they planned to maintain or increase their purchases of organic fruit and vegetables.
Sixty-six percent of British Columbians buy organic groceries on a weekly basis, making BC the province with the most weekly organic grocery purchasers per capita in the country. Additionally, the research shows that BC consumers of organic spend $19 more per week on average than conventional shoppers; however, a comparison of price premiums by category segments found that organic products are on average the same price as their conventional counterparts or are capturing slightly more value.
Households with children under two are the highest buyers of organic groceries by household type (75%), while those with children aged 2-17 still buy at a higher frequency (70%) than households without children (65%).
There is a clear linkage between organic consumption and university-educated, urban, and older working-age consumers: between 73-79% of consumers falling into these demographics buy organic products weekly. Households earning over $100,000 annually have strong correlations to these same demographics, and are also high purchasers of organic.
In BC, ethnicity also appears to have a strong linkage to organic purchasing: 74% of consumers self-identifying as non-Caucasian buy organics weekly, compared to 64% for Caucasian respondents.
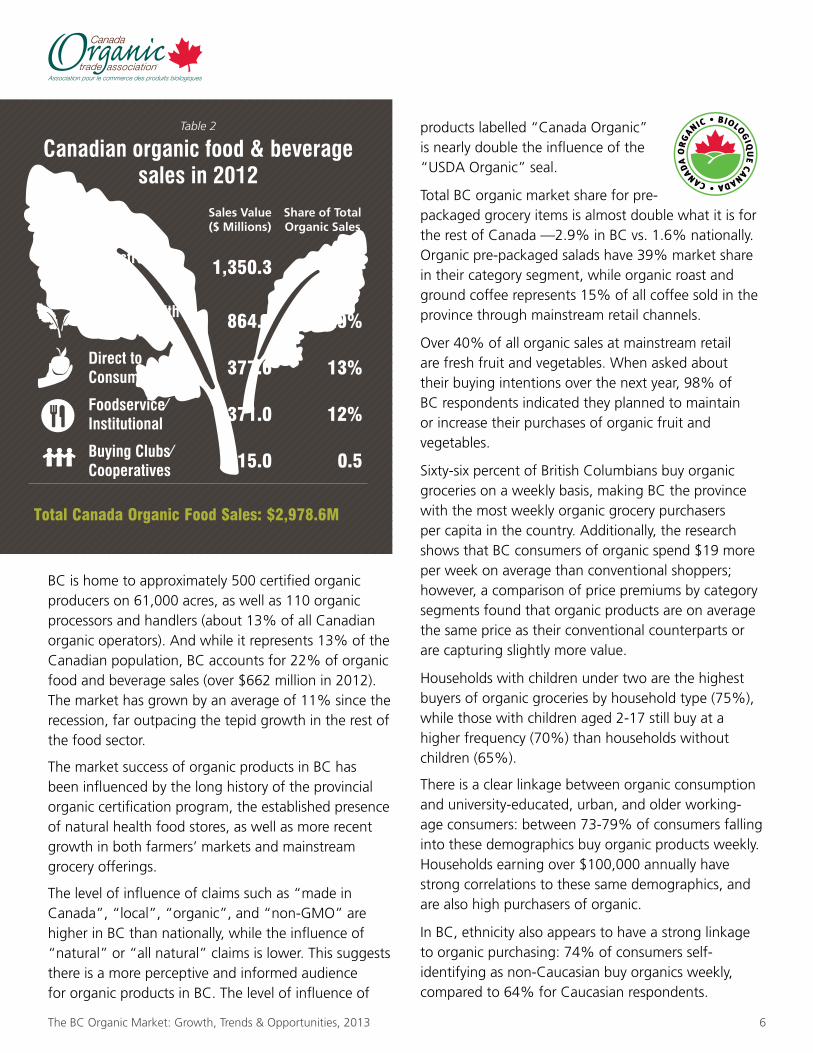
Table 2
Canadian organic food & beverage sales in 2012
Sales Value ($ Millions)
Share of Total Organic Sales
Mainstream retail 1,350.3 45%
natural health & Online retail 864.7 29%
direct to Consumer 377.6 13%
Foodservice/institutional 371.0 12%
Buying Clubs/Cooperatives 15.0 0.5
Total Canada Organic Food Sales: $2,978.6M
7 © Canada Organic Trade Association, 2013
An amazing five-fold increase was observed in farmer-direct sales between 2006 and 2012, particularly through farmers’ markets. What is most exciting about this trend is that growth in farmer-direct sales represents growth in sales that support the BC farm community, whereas sales growth in other channels is most often a mix of domestic and imported organic products.
Over half of Vancouver farmers’ markets, and 40% of all BC farmers’ market sales were attributed to certified organic vendors in 2012, worth $45.5 million. COTA has calculated an additional $800,000 of certified organic fruit, vegetables and other food products were sold through 20 Community Supported Agriculture (CSA) programs in 2012.
Conclusions & Key ConsiderationsIt is clear that the organic market in Canada is here to stay, with great potential for continued growth. While some organic market segments are still only beginning to establish market share and value chain, others have become dominant players in their categories. Canadian consumers continue to be drawn to the attributes that organic products offer, and the next step will be to better understand organic consumers and to better communicate the benefits of organic to them. The following conclusions and recommendations can be made from this analysis:
• Assistancefordomesticorganicproducersandmanufacturerstoscaleupandmeetthevolumedemandsoflargebuyerswillhelpdisplaceimportsoverthelongterm;
• Atthesametimethatitisattemptingtobroadenanddifferentiateitsofferings,thefoodservicechannelisaimingtomeetcustomerexpectationsforsustainableandlocalproducts.AtargetedfocusonidentifyingandsupplyingtheCanadianorganicproductswhicharebestsuitedtoenterthefoodservicesupplychaincoulddrasticallyscaleuptheorganicmarket;
• BChasseentremendousgrowthindirectmarketingtoconsumers.Programsthatsupportlocalorganicfoods
(includingfarmersmarketsandCommunitySupportedAgriculture)wouldprovideawaytosupportnewentrantstotheorganicsectorandcreateanincreaseinopportunitiesforexistingorganicproducers;
• Anopportunityexiststoformalizetheincubatorroleplayedbynaturalhealthorspecialtyretailers,withspecificprogramstosupportlocal,organicgrowersandfoodproducers/manufacturers;
• Thereisaclearmarketopportunityfororganicmeatandpoultry,however,thissectorarguablyfacesthegreatestchallengesofallorganicproducts:anationalorganicmeatandpoultrystrategyiswarranted;
• Themajorityoforganicbuyersarestillinthelowestweeklyspendingbracketof$1-25.Thishighlightstheneedtodeepentheorganicmarketbyencouragingconsumerstocommitmoreoftheirgroceryspendingtoorganicproducts;and
• Theresearchfindingssuggestthatoneofthebestwaystoachievethisbroadeninganddeepeningoftheorganicmarket,inBCaswellasnationally,istomorestronglypromotethebrandandvalueof“CanadaOrganic”certification.
As the first market research study to be conducted since the Canada Organic Regime was introduced in 2009, and the most comprehensive organic market research effort to date, this study also provides an important benchmark for future research. The scope and depth of the analysis highlights a number of areas where data collection can be improved to facilitate better tracking of the organic market and consumers in the future:
• Morein-depthconsumerresearchtobetterunderstandthebarriersandstrongestmotivatorsforbuyingorganicaswellasgreatersegmentationoforganicbuyinggroups;
• Thedevelopmentofastandardizedindustrysurveytobecompletedannuallybycompaniesinvolvedintheorganicvaluechaintocollectsales,growthanddistributionchannelinformation;
• Trackingoforganicsalesinthenaturalhealthretailsectorbyamarketresearchfirm;
8The BC Organic Market: Growth, Trends & Opportunities, 2013
• Maintenanceandexpansionoforganicquestions(e.g.marketingchannel)intheCensusofAgricultureconductedbyStatisticsCanada;
• Anannual,nationallycoordinatedcollectionofproductiondataandproducersales;
• Supportforlongitudinalresearcheffortstomeasuremarketgrowth,sectordevelopmentandconsumertrendsattwo-tothree-yearintervalstoprovidecriticaltrendlineinformation;
• Morerigorouscollectionofdataontheorganicnon-foodsector,whichinmanyinstancesisgrowingatafasterpace;and
• TheexpansionofHarmonizedSystem(HS)codestobetterquantifytherangeoforganicproductsimportedintoCanada,andtheintroductionofHScodesforexportedproducts.
Methodology & Limitations of the dataThis research brings together new Canadian consumer research on organic purchasing behaviour as well as sales data collected from a variety of sources to provide the most accurate picture possible of the value of the organic market across distribution channels.
Vision Critical conducted the consumer research in August 2012 with over 1,500 Canadians, aged 25 and over, balanced by region, age and gender. As new parents and the millennial generation are clearly an important demographic for the organic sector, future studies should include data on households in the 18-24 year-old bracket as well.
The Nielsen Company provided detailed data on the mainstream retail market. Sales and volume data for organic fresh and pre-packaged grocery products, including organic label and country of origin information, was collected for the 52-week period ending October 20, 2012, covering grocery banners, drug stores and mass merchandisers across Canada.
The sales value and market share of organic food and beverage products in some distribution channels remain poorly tracked, particularly in the natural health
retail, foodservice and direct marketing segments. To fill this data gap, information was gathered from market research, university studies, farmer surveys and private company sales information. Estimates of market share and total sales by segment were informed by insights from leaders in the sector.
Although significantly smaller, the Canadian organic market shares many similarities with the US organic market. For the purposes of this study, US market share values in organic non-food categories were used as a guide for informing Canadian market share values (OTA 2012). In general, organic non-food products in Canada were estimated to have about half of the market share as is seen in the US, and based on the comparative values seen in the food and non-alcoholic beverage market. These values were then adjusted against information from private companies, associations and other sources involved directly in the non-food categories assessed.
9 © Canada Organic Trade Association, 2013
SECTiON ibC OrGANiC ShOppErS: ThE WhO, WhAT, WhErE & hOW MuCh
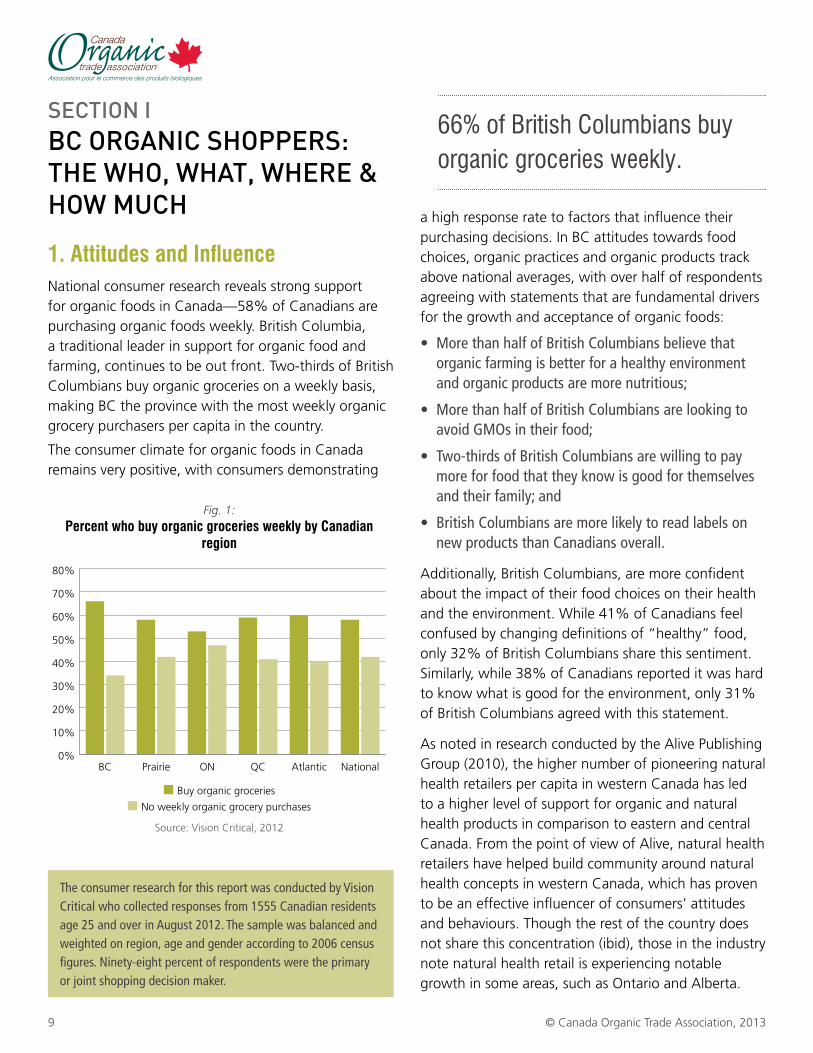
1. attitudes and influenceNational consumer research reveals strong support for organic foods in Canada—58% of Canadians are purchasing organic foods weekly. British Columbia, a traditional leader in support for organic food and farming, continues to be out front. Two-thirds of British Columbians buy organic groceries on a weekly basis, making BC the province with the most weekly organic grocery purchasers per capita in the country.
The consumer climate for organic foods in Canada remains very positive, with consumers demonstrating
a high response rate to factors that influence their purchasing decisions. In BC attitudes towards food choices, organic practices and organic products track above national averages, with over half of respondents agreeing with statements that are fundamental drivers for the growth and acceptance of organic foods:
• MorethanhalfofBritishColumbiansbelievethatorganicfarmingisbetterforahealthyenvironmentandorganicproductsaremorenutritious;
• MorethanhalfofBritishColumbiansarelookingtoavoidGMOsintheirfood;
• Two-thirdsofBritishColumbiansarewillingtopaymoreforfoodthattheyknowisgoodforthemselvesandtheirfamily;and
• BritishColumbiansaremorelikelytoreadlabelsonnewproductsthanCanadiansoverall.
Additionally, British Columbians, are more confident about the impact of their food choices on their health and the environment. While 41% of Canadians feel confused by changing definitions of “healthy” food, only 32% of British Columbians share this sentiment. Similarly, while 38% of Canadians reported it was hard to know what is good for the environment, only 31% of British Columbians agreed with this statement.
As noted in research conducted by the Alive Publishing Group (2010), the higher number of pioneering natural health retailers per capita in western Canada has led to a higher level of support for organic and natural health products in comparison to eastern and central Canada. From the point of view of Alive, natural health retailers have helped build community around natural health concepts in western Canada, which has proven to be an effective influencer of consumers’ attitudes and behaviours. Though the rest of the country does not share this concentration (ibid), those in the industry note natural health retail is experiencing notable growth in some areas, such as Ontario and Alberta.
TheconsumerresearchforthisreportwasconductedbyVisionCriticalwhocollectedresponsesfrom1555Canadianresidentsage25andoverinAugust2012.Thesamplewasbalancedandweightedonregion,ageandgenderaccordingto2006censusfigures.Ninety-eightpercentofrespondentsweretheprimaryorjointshoppingdecisionmaker.
0%
10%
20%
30%
40%
50%
60%
70%
80%
NationalAtlanticQCONPrairieBC
Fig. 1:Percent who buy organic groceries weekly by Canadian
region
■ Buy organic groceries
■ No weekly organic grocery purchases
Source: Vision Critical, 2012
66% of british columbians buy organic groceries weekly.
10The BC Organic Market: Growth, Trends & Opportunities, 2013
The well-established provincial organic certification program in BC, which is now in its twentieth year, plays a role in this as well. The widely recognized “BC checkmark” program has fostered awareness in BC of how certified organic food and farming differs from conventional production. The Certified Organic Associations of BC (COABC) also offer the benefits of support and community-building amongst organic growers, further helping to build the sector. Outside of BC and Quebec, provincial regulatory programs do not exist. In the rest of the country, the launch of the Canada Organic Regime in 2009 was the first domestic organic initiative. Organic food, at a national scale, is still a relatively young concept when compared to the long-established and regulated markets in the US, Europe and Japan. However, the Canadian market has also shown considerable growth during this time, and is now considered the world’s fourth-largest organic market (IFOAM/FiBL 2013).
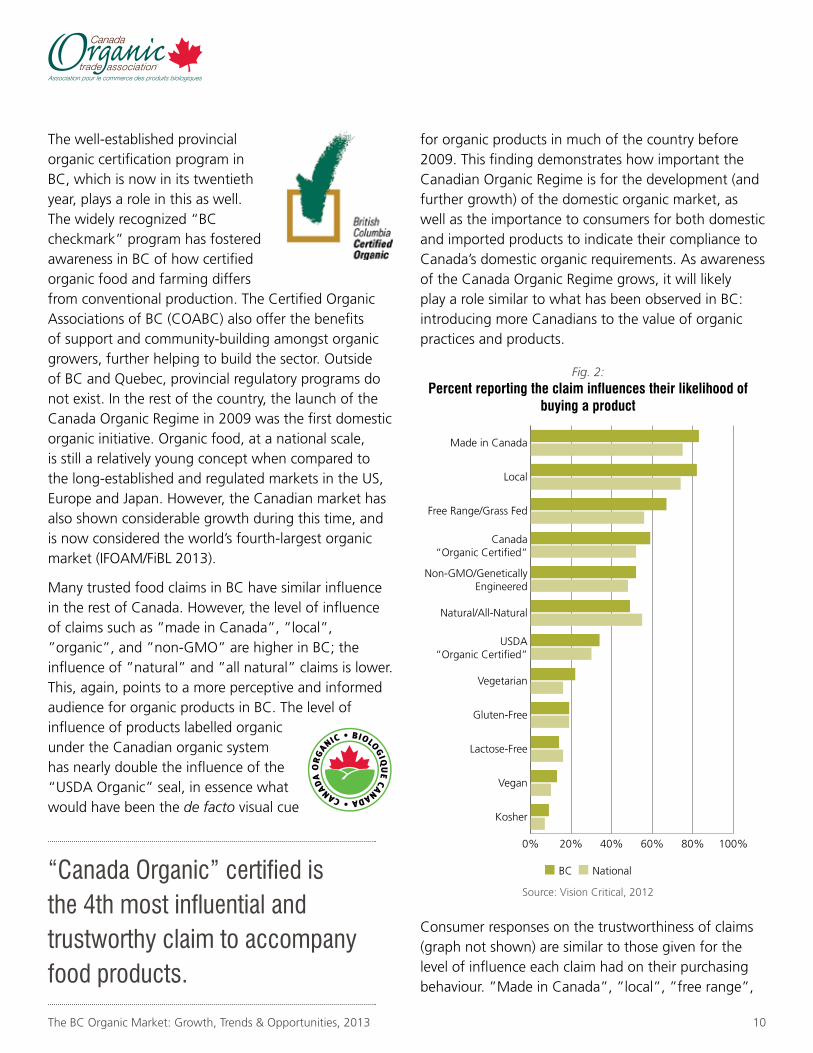
Many trusted food claims in BC have similar influence in the rest of Canada. However, the level of influence of claims such as ”made in Canada”, ”local”, ”organic”, and ”non-GMO” are higher in BC; the influence of ”natural” and ”all natural” claims is lower. This, again, points to a more perceptive and informed audience for organic products in BC. The level of influence of products labelled organic under the Canadian organic system has nearly double the influence of the “USDA Organic” seal, in essence what would have been the de facto visual cue
for organic products in much of the country before 2009. This finding demonstrates how important the Canadian Organic Regime is for the development (and further growth) of the domestic organic market, as well as the importance to consumers for both domestic and imported products to indicate their compliance to Canada’s domestic organic requirements. As awareness of the Canada Organic Regime grows, it will likely play a role similar to what has been observed in BC: introducing more Canadians to the value of organic practices and products.
Consumer responses on the trustworthiness of claims (graph not shown) are similar to those given for the level of influence each claim had on their purchasing behaviour. ”Made in Canada”, ”local”, ”free range”,
Fig. 2:Percent reporting the claim influences their likelihood of
buying a product
■ BC ■ National
Source: Vision Critical, 2012
0% 20% 40% 60% 80% 100%
Kosher
Vegan
Lactose-Free
Gluten-Free
Vegetarian
USDA“Organic Certified”
Natural/All-Natural
Non-GMO/GeneticallyEngineered
Canada“Organic Certified”
Free Range/Grass Fed
Local
Made in Canada
“canada Organic” certified is the 4th most influential and trustworthy claim to accompany food products.
11 © Canada Organic Trade Association, 2013
and ”Canada Organic” certified took the top four slots as the most trusted claims. British Columbians have a slightly lower level of trust in ”Made in Canada” claims than the national average (87% vs. 89%) and a slightly higher level of trust in ”Canada Organic” certified (81% vs. 78%) as well as ”non-GMO” (67% vs. 62%). “Natural” claims have the lowest level of trust in BC, with only 51% of British Columbians reporting that they trust this claim in comparison to 58% of Canadians overall.
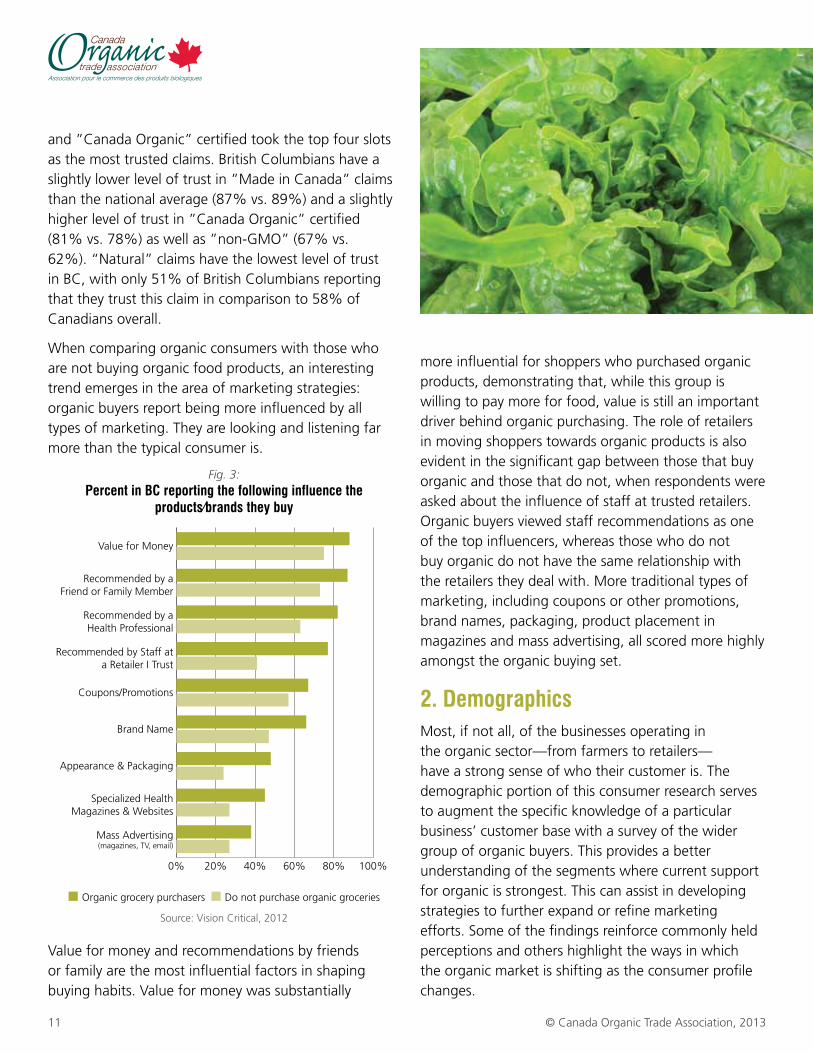
When comparing organic consumers with those who are not buying organic food products, an interesting trend emerges in the area of marketing strategies: organic buyers report being more influenced by all types of marketing. They are looking and listening far more than the typical consumer is.
Value for money and recommendations by friends or family are the most influential factors in shaping buying habits. Value for money was substantially
more influential for shoppers who purchased organic products, demonstrating that, while this group is willing to pay more for food, value is still an important driver behind organic purchasing. The role of retailers in moving shoppers towards organic products is also evident in the significant gap between those that buy organic and those that do not, when respondents were asked about the influence of staff at trusted retailers. Organic buyers viewed staff recommendations as one of the top influencers, whereas those who do not buy organic do not have the same relationship with the retailers they deal with. More traditional types of marketing, including coupons or other promotions, brand names, packaging, product placement in magazines and mass advertising, all scored more highly amongst the organic buying set.
2. demographicsMost, if not all, of the businesses operating in the organic sector—from farmers to retailers—have a strong sense of who their customer is. The demographic portion of this consumer research serves to augment the specific knowledge of a particular business’ customer base with a survey of the wider group of organic buyers. This provides a better understanding of the segments where current support for organic is strongest. This can assist in developing strategies to further expand or refine marketing efforts. Some of the findings reinforce commonly held perceptions and others highlight the ways in which the organic market is shifting as the consumer profile changes.
Fig. 3: Percent in BC reporting the following influence the
products/brands they buy
■ Organic grocery purchasers ■ Do not purchase organic groceries
Source: Vision Critical, 2012
0% 20% 40% 60% 80% 100%
Mass Advertising(magazines, TV, email)
Specialized HealthMagazines & Websites
Appearance & Packaging
Brand Name
Coupons/Promotions
Recommended by Staff ata Retailer I Trust
Recommended by aHealth Professional
Recommended by aFriend or Family Member
Value for Money
12The BC Organic Market: Growth, Trends & Opportunities, 2013
urbAn, educATed, Older
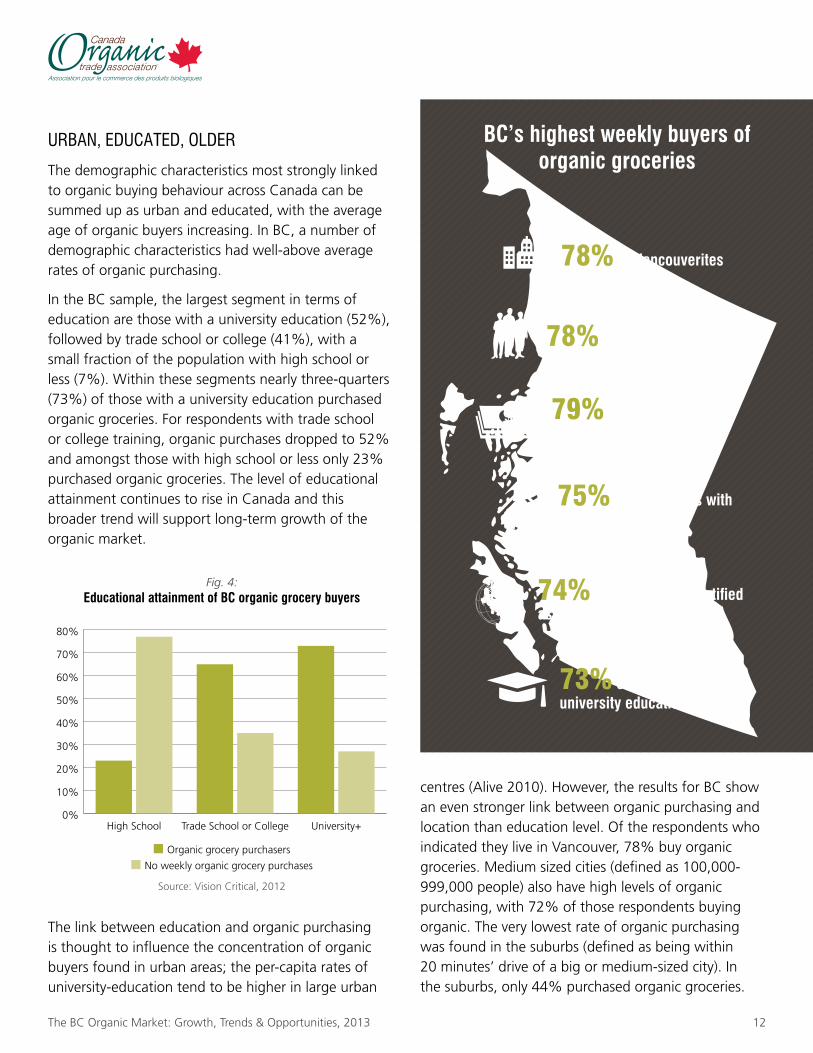
The demographic characteristics most strongly linked to organic buying behaviour across Canada can be summed up as urban and educated, with the average age of organic buyers increasing. In BC, a number of demographic characteristics had well-above average rates of organic purchasing.
In the BC sample, the largest segment in terms of education are those with a university education (52%), followed by trade school or college (41%), with a small fraction of the population with high school or less (7%). Within these segments nearly three-quarters (73%) of those with a university education purchased organic groceries. For respondents with trade school or college training, organic purchases dropped to 52% and amongst those with high school or less only 23% purchased organic groceries. The level of educational attainment continues to rise in Canada and this broader trend will support long-term growth of the organic market.
The link between education and organic purchasing is thought to influence the concentration of organic buyers found in urban areas; the per-capita rates of university-education tend to be higher in large urban
centres (Alive 2010). However, the results for BC show an even stronger link between organic purchasing and location than education level. Of the respondents who indicated they live in Vancouver, 78% buy organic groceries. Medium sized cities (defined as 100,000-999,000 people) also have high levels of organic purchasing, with 72% of those respondents buying organic. The very lowest rate of organic purchasing was found in the suburbs (defined as being within 20 minutes’ drive of a big or medium-sized city). In the suburbs, only 44% purchased organic groceries.
BC’s highest weekly buyers of organic groceries
74% of people self-identified as non-caucasian ethnicity
78% of vancouverites
73% of people with university education
78% of 55-64 year olds
75% of households with children under two
0%
10%
20%
30%
40%
50%
60%
70%
80%
University+Trade School or CollegeHigh School
Fig. 4:Educational attainment of BC organic grocery buyers
■ Organic grocery purchasers
■ No weekly organic grocery purchases
Source: Vision Critical, 2012
79% of households with $100,000+ income
13 © Canada Organic Trade Association, 2013
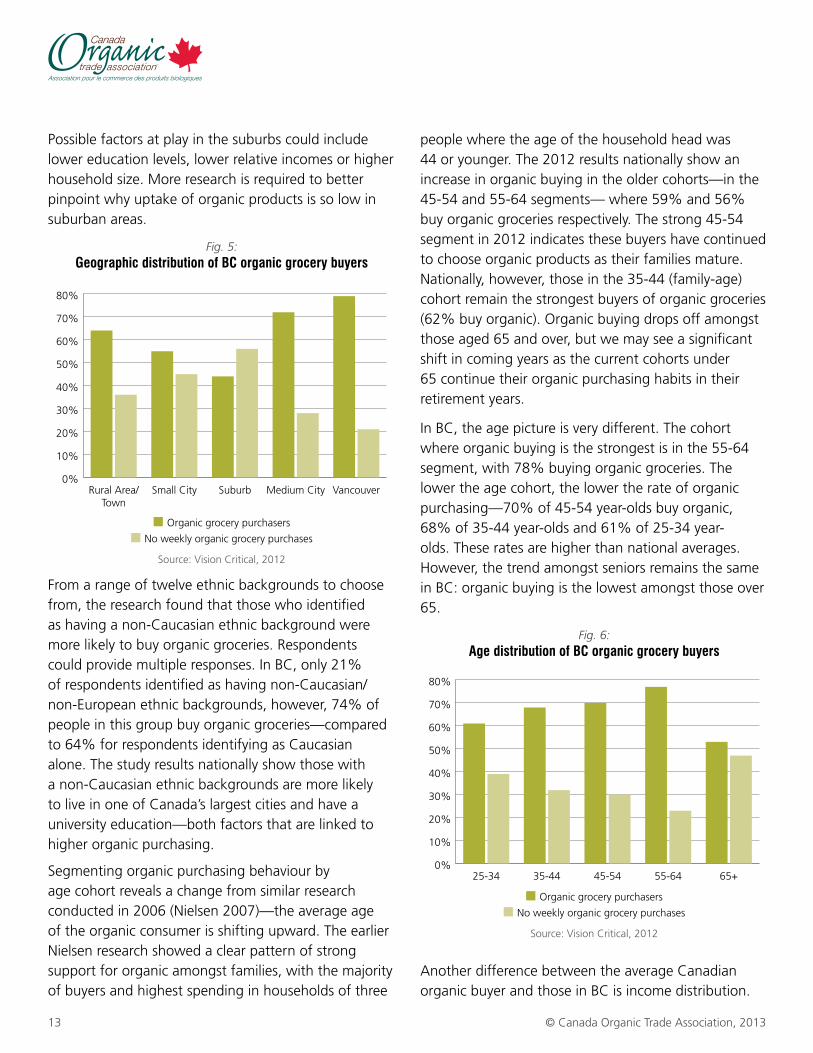
Possible factors at play in the suburbs could include lower education levels, lower relative incomes or higher household size. More research is required to better pinpoint why uptake of organic products is so low in suburban areas.
From a range of twelve ethnic backgrounds to choose from, the research found that those who identified as having a non-Caucasian ethnic background were more likely to buy organic groceries. Respondents could provide multiple responses. In BC, only 21% of respondents identified as having non-Caucasian/non-European ethnic backgrounds, however, 74% of people in this group buy organic groceries—compared to 64% for respondents identifying as Caucasian alone. The study results nationally show those with a non-Caucasian ethnic backgrounds are more likely to live in one of Canada’s largest cities and have a university education—both factors that are linked to higher organic purchasing.
Segmenting organic purchasing behaviour by age cohort reveals a change from similar research conducted in 2006 (Nielsen 2007)—the average age of the organic consumer is shifting upward. The earlier Nielsen research showed a clear pattern of strong support for organic amongst families, with the majority of buyers and highest spending in households of three
people where the age of the household head was 44 or younger. The 2012 results nationally show an increase in organic buying in the older cohorts—in the 45-54 and 55-64 segments— where 59% and 56% buy organic groceries respectively. The strong 45-54 segment in 2012 indicates these buyers have continued to choose organic products as their families mature. Nationally, however, those in the 35-44 (family-age) cohort remain the strongest buyers of organic groceries (62% buy organic). Organic buying drops off amongst those aged 65 and over, but we may see a significant shift in coming years as the current cohorts under 65 continue their organic purchasing habits in their retirement years.
In BC, the age picture is very different. The cohort where organic buying is the strongest is in the 55-64 segment, with 78% buying organic groceries. The lower the age cohort, the lower the rate of organic purchasing—70% of 45-54 year-olds buy organic, 68% of 35-44 year-olds and 61% of 25-34 year-olds. These rates are higher than national averages. However, the trend amongst seniors remains the same in BC: organic buying is the lowest amongst those over 65.
Another difference between the average Canadian organic buyer and those in BC is income distribution.
0%
10%
20%
30%
40%
50%
60%
70%
80%
VancouverMedium CitySuburbSmall CityRural Area/Town
Fig. 5:Geographic distribution of BC organic grocery buyers
■ Organic grocery purchasers
■ No weekly organic grocery purchases
Source: Vision Critical, 2012
0%
10%
20%
30%
40%
50%
60%
70%
80%
65+55-6445-5435-4425-34
Fig. 6:Age distribution of BC organic grocery buyers
■ Organic grocery purchasers
■ No weekly organic grocery purchases
Source: Vision Critical, 2012

14The BC Organic Market: Growth, Trends & Opportunities, 2013
National consumer research in 2006 (Nielsen 2007) found a direct correlation between income and organic purchasing, with those with household incomes of $70,000 or higher showing the highest numbers of organic buyers and the highest spending. In 2012, the income distribution for Canadian organic buyers very closely follows the pattern for average income with only a slightly higher number of organic buyers reporting the highest household income category of $100,000 or above. In BC, those with household incomes between $50,000-$100,000 were least likely to buy organic groceries (58%). In the $100,000 or above household income category 79% buy organic groceries, and in the lowest income category (below $50,000) 64% buy organic. This data suggests a broadening of the consumer base has occurred in which all socio-economic classes are buying organic regularly.
Nationally and in BC, household type remains a factor influencing organic purchasing behaviour. In BC, households with children under two are the highest buyers of organic groceries by household type (75%), while those with children aged 2-17 still buy at a higher frequency (70%) than households without children (65%). Overall, households with children remain a small segment of the organic market (80%
of organic buyers have no children at home); this is consistent with wider population trends in Canada.
A slight difference between genders is also found in the data. Amongst the survey respondents in BC, the gender split was exactly 50/50; in the female group, 71% purchased organic groceries; in the male group 60% purchased organic groceries.
HeAlTH And wellneSS mArkeT SeGmenTS
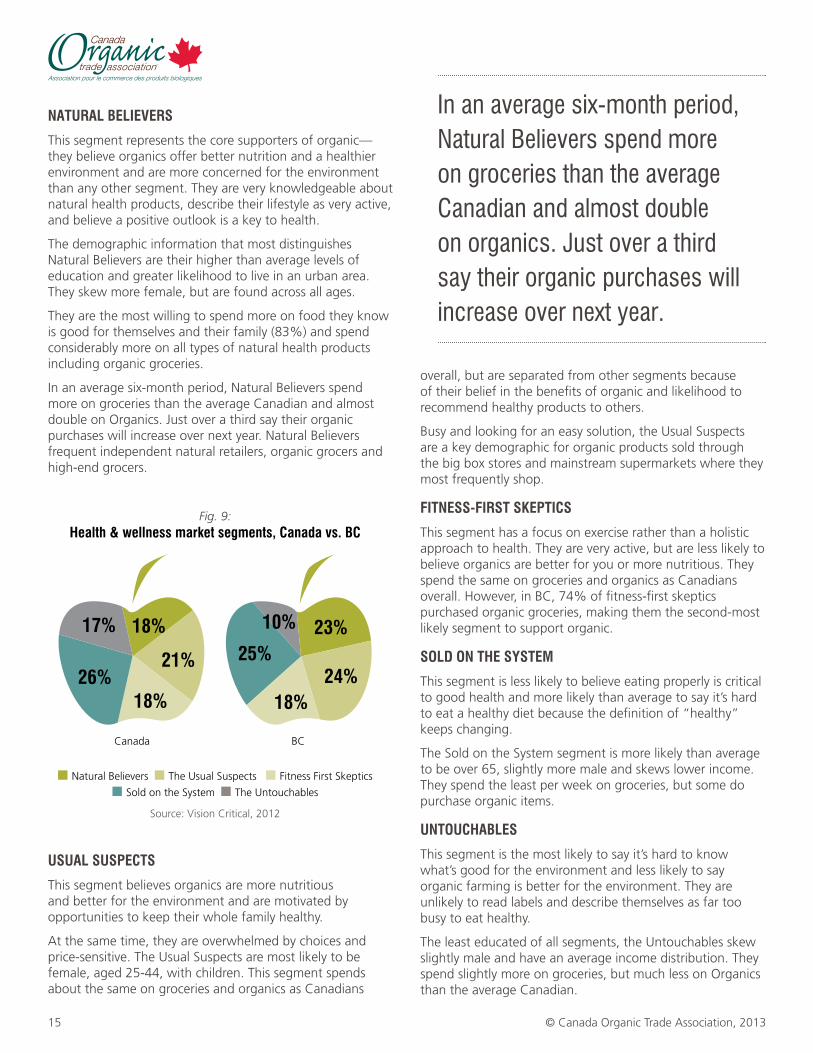
Consumer research for the health and wellness market in Canada has developed five segments that describe the values, attitudes and purchasing behaviour of Canadians. The Canadian population as a whole divides almost equally into these segments—“Natural Believers”, ”Fitness-First Skeptics”, ”Usual Suspects”, ”Sold on the System” and ”Untouchables”. Each segment, described in more detail below, has differing attitudes and purchasing habits. The two stand-out supporters of organics nationally are the ”Natural Believers” and the ”Usual Suspects”. British Columbia has a higher proportion of both of these organic-friendly segments and less ”Untouchables”. In addition, the segment described as ”Fitness-First Skeptics”, who are only average buyers of organics nationally, are above average buyers of organic in BC.
Fig. 7:Household income distribution of BC organic
grocery buyers
■ Under $50K ■ $50K - $100K ■ $100K+
Source: Vision Critical, 2012
0% 20% 40% 60% 80% 100%
No OrganicGrocery Purchases
Organic GroceryPurchases
BC Average
Fig. 8:Household type for BC organic grocery buyers
■ Organic grocery purchasers
■ No weekly organic grocery purchases
Source: Vision Critical, 2012
0%
10%
20%
30%
40%
50%
60%
70%
80%
No Childrenin Household
Households withChildren
2-17 Years
Households withChildren Under
2 Years
15 © Canada Organic Trade Association, 2013
naTuraL BELiEvErS
This segment represents the core supporters of organic—they believe organics offer better nutrition and a healthier environment and are more concerned for the environment than any other segment. They are very knowledgeable about natural health products, describe their lifestyle as very active, and believe a positive outlook is a key to health.
The demographic information that most distinguishes Natural Believers are their higher than average levels of education and greater likelihood to live in an urban area. They skew more female, but are found across all ages.
They are the most willing to spend more on food they know is good for themselves and their family (83%) and spend considerably more on all types of natural health products including organic groceries.
In an average six-month period, Natural Believers spend more on groceries than the average Canadian and almost double on Organics. Just over a third say their organic purchases will increase over next year. Natural Believers frequent independent natural retailers, organic grocers and high-end grocers.
uSuaL SuSpECTS
This segment believes organics are more nutritious and better for the environment and are motivated by opportunities to keep their whole family healthy.
At the same time, they are overwhelmed by choices and price-sensitive. The Usual Suspects are most likely to be female, aged 25-44, with children. This segment spends about the same on groceries and organics as Canadians
overall, but are separated from other segments because of their belief in the benefits of organic and likelihood to recommend healthy products to others.
Busy and looking for an easy solution, the Usual Suspects are a key demographic for organic products sold through the big box stores and mainstream supermarkets where they most frequently shop.
FiTnESS-FirST SKEpTiCS
This segment has a focus on exercise rather than a holistic approach to health. They are very active, but are less likely to believe organics are better for you or more nutritious. They spend the same on groceries and organics as Canadians overall. However, in BC, 74% of fitness-first skeptics purchased organic groceries, making them the second-most likely segment to support organic.
SOLd On ThE SySTEM
This segment is less likely to believe eating properly is critical to good health and more likely than average to say it’s hard to eat a healthy diet because the definition of “healthy” keeps changing.
The Sold on the System segment is more likely than average to be over 65, slightly more male and skews lower income. They spend the least per week on groceries, but some do purchase organic items.
unTOuChaBLES
This segment is the most likely to say it’s hard to know what’s good for the environment and less likely to say organic farming is better for the environment. They are unlikely to read labels and describe themselves as far too busy to eat healthy.
The least educated of all segments, the Untouchables skew slightly male and have an average income distribution. They spend slightly more on groceries, but much less on Organics than the average Canadian.
Fig. 9:Health & wellness market segments, Canada vs. BC
■ Natural Believers ■ The Usual Suspects ■ Fitness First Skeptics
■ Sold on the System ■ The Untouchables
Source: Vision Critical, 2012
Canada BC
26%
18%
18%
21%
17%25%
23%
18%24%
10%
in an average six-month period, natural believers spend more on groceries than the average canadian and almost double on organics. just over a third say their organic purchases will increase over next year.
16The BC Organic Market: Growth, Trends & Opportunities, 2013
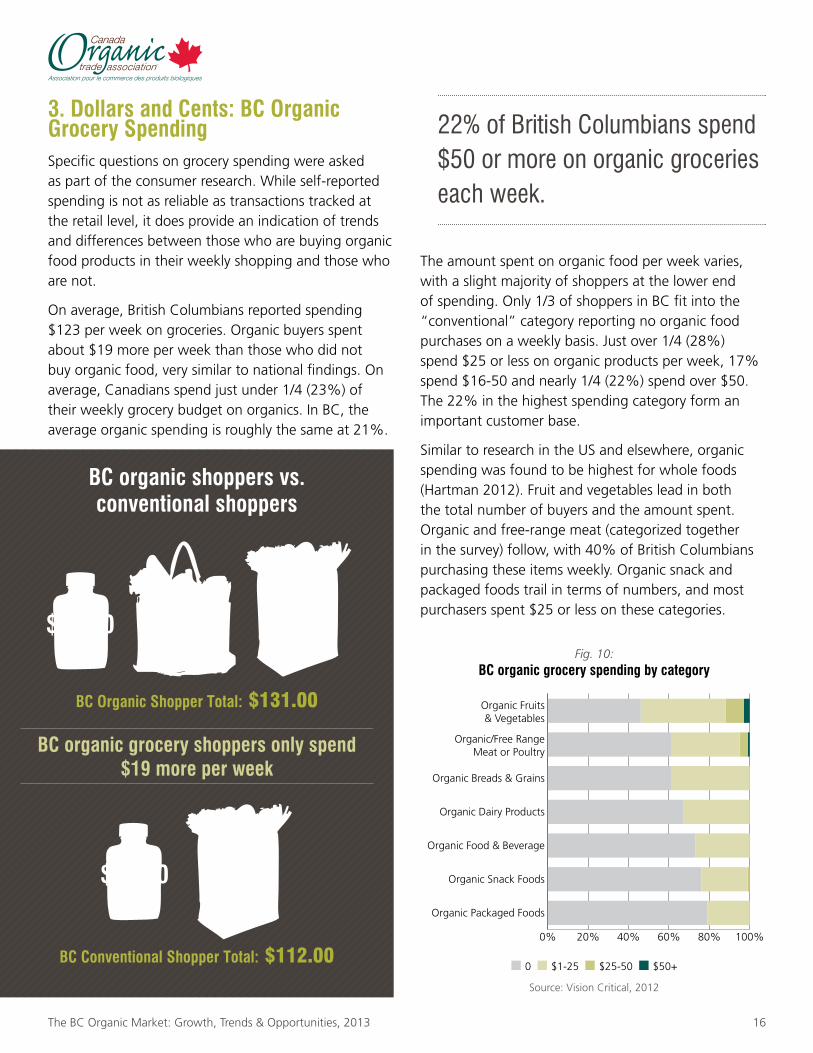
3. dollars and Cents: BC Organic grocery SpendingSpecific questions on grocery spending were asked as part of the consumer research. While self-reported spending is not as reliable as transactions tracked at the retail level, it does provide an indication of trends and differences between those who are buying organic food products in their weekly shopping and those who are not.
On average, British Columbians reported spending $123 per week on groceries. Organic buyers spent about $19 more per week than those who did not buy organic food, very similar to national findings. On average, Canadians spend just under 1/4 (23%) of their weekly grocery budget on organics. In BC, the average organic spending is roughly the same at 21%.
The amount spent on organic food per week varies, with a slight majority of shoppers at the lower end of spending. Only 1/3 of shoppers in BC fit into the “conventional” category reporting no organic food purchases on a weekly basis. Just over 1/4 (28%) spend $25 or less on organic products per week, 17% spend $16-50 and nearly 1/4 (22%) spend over $50. The 22% in the highest spending category form an important customer base.
Similar to research in the US and elsewhere, organic spending was found to be highest for whole foods (Hartman 2012). Fruit and vegetables lead in both the total number of buyers and the amount spent. Organic and free-range meat (categorized together in the survey) follow, with 40% of British Columbians purchasing these items weekly. Organic snack and packaged foods trail in terms of numbers, and most purchasers spent $25 or less on these categories.
BC Organic Shopper Total: $131.00
BC organic grocery shoppers only spend $19 more per week
$50.30Organic
$12.30Functional
$68.50Conventional
BC organic shoppers vs.conventional shoppers
$19.10Functional
$92.90Conventional
BC Conventional Shopper Total: $112.00
Fig. 10:BC organic grocery spending by category
■ 0 ■ $1-25 ■ $25-50 ■ $50+
Source: Vision Critical, 2012
0% 20% 40% 60% 80% 100%
Organic Packaged Foods
Organic Snack Foods
Organic Food & Beverage
Organic Dairy Products
Organic Breads & Grains
Organic/Free RangeMeat or Poultry
Organic Fruits& Vegetables
22% of british columbians spend $50 or more on organic groceries each week.

17 © Canada Organic Trade Association, 2013
reGiOnAl cOmPAriSOnS
There are significant differences in how much of the weekly grocery budget Canadians spend on organic products. Quebec reported the highest weekly spending, with 30% of the average grocery budget going to organics; BC follows close behind at 26%.
Canadians purchase organic groceries through a range of distribution channels, with many individuals seeking organic in more than one location. The locations where British Columbians buy organic groceries are similar to national averages. Purchases through mainstream grocers and mass retailers are slightly less frequent in BC, with slightly higher purchases through natural health retailers and other channels, including on-line and cooperatives.
cOnSumerS PredicT mOre OrGAnic SPendinG
Across Canada, consumers expect to spend more on organic food next year. When asked about expected changes in spending on specific grocery categories, respondents indicated substantially more growth potential for organic whole foods than regular or functional foods and beverages. Ninety-eight percent of British Columbians expect to increase or maintain their spending on organic fruit and vegetables and organic dairy next year.
BC consumers again demonstrated a stronger commitment to organic: with more BC consumers expecting an increase in spending on organic groceries in all categories compared to Canadians overall. Twenty-nine percent of British Columbians expected to spend more on organic fruits and vegetables in the next year and 25% expected to spend more on organic/free-range meat or poultry; five percentage points more than the Canadian average in both categories. The expected increase in organic snack food purchases was higher in BC: 16% versus 9% nationally.
Fig. 11:Mean weekly spending on organic groceries by region
(% of total)
Source: Vision Critical, 2012
0% 5% 10% 15% 20% 25% 30%
Atlantic
QC
ON
Prairies
BC
Fig. 12:Where British Columbians purchase organic groceries
compared to national averages
■ Conventional grocers ■ Direct from farmer
■ Natural health retailers ■ Mass retailers
■ Other ■ Pharmacy/Drug Stores
Source: Vision Critical, 2012
0%
10%
20%
30%
40%
50%
60%
70%
80%
NationalBC
Fig. 13:Expected changes in organic spending next year
in BC
■ Decrease ■ Stay the same ■ Increase
Source: Vision Critical, 2012
0% 20% 40% 60% 80% 100%
Organic Packaged Foods
Functional Foods& Beverages
Other Organic Food& Beverages
Regular Foods &Beverages
Organic Snack Foods
Organic Breads & Grains
Organic Dairy Products
Organic/Free RangeMeat or Poultry
Organic Fruits & Vegetables
18The BC Organic Market: Growth, Trends & Opportunities, 2013
SECTiON iiMAiNSTrEAM & GrASSrOOTS: GrOWTh iN ThE bC OrGANiC MArKET
4. BC Organic Market OverviewGrowth in the organic market is evident—new farmers’ markets, bigger organic sections in mainstream supermarkets and menu descriptions that tell the stories of organic farmers. Hard numbers on the size, growth rate and changes in distribution of this young industry have, however, been lacking. To fill this data gap, the Canada Organic Trade Association has assembled sales information from market research, university studies, and company information including sales values, market share and insight from leading businesses in the organic sector. Earlier research conducted in 2006 (Macey 2007) serves as a benchmark for growth and change in the sector both nationally and in BC. This study offers a broader scope and more in-depth analysis than previous research, and provides the first market study since the Canada Organic Regime was officially introduced in 2009.
To estimate the total sales of certified organic food as accurately as possible, COTA used the following categories to differentiate the primary distribution channels:
MainSTrEaM rETaiL
This category includes grocery banners (e.g. Save on Foods, Safeway, Thrifty’s, Marketplace IGA) mass merchandisers (e.g. Walmart, Zellers) and drug stores (e.g. Shopper’s Drug Mart, Pharmasave). Sales information for these companies was obtained from the Nielsen Company, which focuses on market research. The data included detailed value and volume information for pre-packaged organic foods including dairy, eggs, bagged and boxed salad greens, bread, prepared foods and organic products found in the frozen and refrigerated sections. In addition, sales information for the fresh organic fruit, vegetable and meat categories was provided. To supplement the data
obtained through stores where Nielsen has access to sales and volume data a “Retail Channel Adjustment” figure was provided to account for sales moving through mainstream retailers such as Costco that are not included in the Nielsen data set.
Sales of organic foods have continued to grow in mainstream retail, with the rates of growth seen for organic items far outpacing those of other foods, where growth has remained relatively flat.
naTuraL hEaLTh rETaiL
The natural health sector is comprised of both chain and single stores that in comparison to mainstream retail focus primarily on selling health foods, organic foods, local produce and natural health products such as supplements and alternative medicines. In 2012, COTA broadened the natural health category to include on-line retailers and box delivery programs (e.g. SPUD.ca) that have evolved into offering year-round fresh produce and grocery items to their customers, making them more similar to a natural health store than farmer-direct subscription programs.
The value and volume of organic sales through natural health stores is not tracked by a market research agency in Canada, making detailed information difficult to obtain. Estimates for this channel were developed using information generously provided to COTA directly from distributors, producers, and a number of natural health retailers. Understanding the market share split between mainstream retail, where we had accurate data, and natural health stores was a key strategy for estimating natural health sales.
19 © Canada Organic Trade Association, 2013
For BC, it is estimated that total organic grocery sales at the retail level are split 60/40 between mainstream and natural health retailers.
A 2010 survey of Canadian natural health retailers found that the majority of stores reported 10-20% annual growth, with increased sales expected to continue (Alive 2010). Organic foods form a central part of the natural health business as food purchases bring customers into the stores on a regular basis. Our estimates show a growth in organic food sales that reflect this overall growth trend even as the mainstream retail sector continues to expand its organic offerings.
FarMEr-dirECT
In recent years the public has become increasingly interested in purchasing food locally and having a more direct connection to the farmers and artisans that grow and make their food. Farmers’ markets, on-farm sales through farm stands and Community Supported Agriculture (CSA) programs are the primary ways that farmers are selling directly to their end customers.
The estimates for farmer-direct sales in BC are largely based on research conducted in collaboration with Dr. David Connell at the University of Northern British Columbia and the BC Association of Farmers’ Markets, sales information provided by the Vancouver Farmers’ Markets as well as primary research conducted by COTA. Nationally, a number of associations and organizations provided sales information based on their own research and tracking efforts.
In BC, we found five-fold growth in farmer-direct sales between 2006 and 2012, particularly through farmers’ markets. What is most exciting about this trend is that growth in farmer-direct sales represents growth in sales that support the BC farm community, whereas sales growth in other channels is most often a mix of domestic and imported organic products.
FOOdSErviCE
The foodservice category includes chain and independent restaurants, cafes, hotels and institutions that operate cafeterias such as schools, hospitals and
workplaces. It is perhaps the segment of the organic food marketplace of which the least is known.
Sales of organic food through large foodservice providers and restaurant chains are beginning to increase. Independent restaurants and select foodservice sites have been leading the sustainability trend with greater adoption of organic, local and other progressive buying practices. Large foodservice providers and coffee chains are now selling organic coffee. Restaurants are requesting that their distributors carry organic products and direct buying from farmers has increased. By far the most substantial sales category for organic foods in foodservice is coffee, particularly in BC.
Organic food sales through foodservice are not well tracked in Canada. COTA compiled data from distributors, farmer surveys, Fair Trade Canada and the Organic Trade Association to develop an estimate of total foodservice sales.
COOpS and Buying CLuBS
Food co-ops, grocery stores that are owned and operated by their members, and buying clubs, who place large orders directly with a distributor and then split the orders between members, played a foundational role in the early part of the organic movement. By 2006, they were estimated to contribute only 0.05% of total organic food sales in Canada. Through distributor information and conversations with a number of buying clubs COTA found that coops and buying clubs had a similarly small share of total sales in 2012.
THe biG PicTure FOr bc OrGAnic SAleS
Growth is the major trend in organic food sales in Canada and BC. What is remarkable is that even as organics “go mainstream”, sales in natural health, direct marketing and foodservice channels also continue to grow. The broader market trend of increasing consumer demand for local food appears to be boosting certified organic sales as consumers and businesses seek out more direct and transparent relationships with farmers and food producers.
20The BC Organic Market: Growth, Trends & Opportunities, 2013
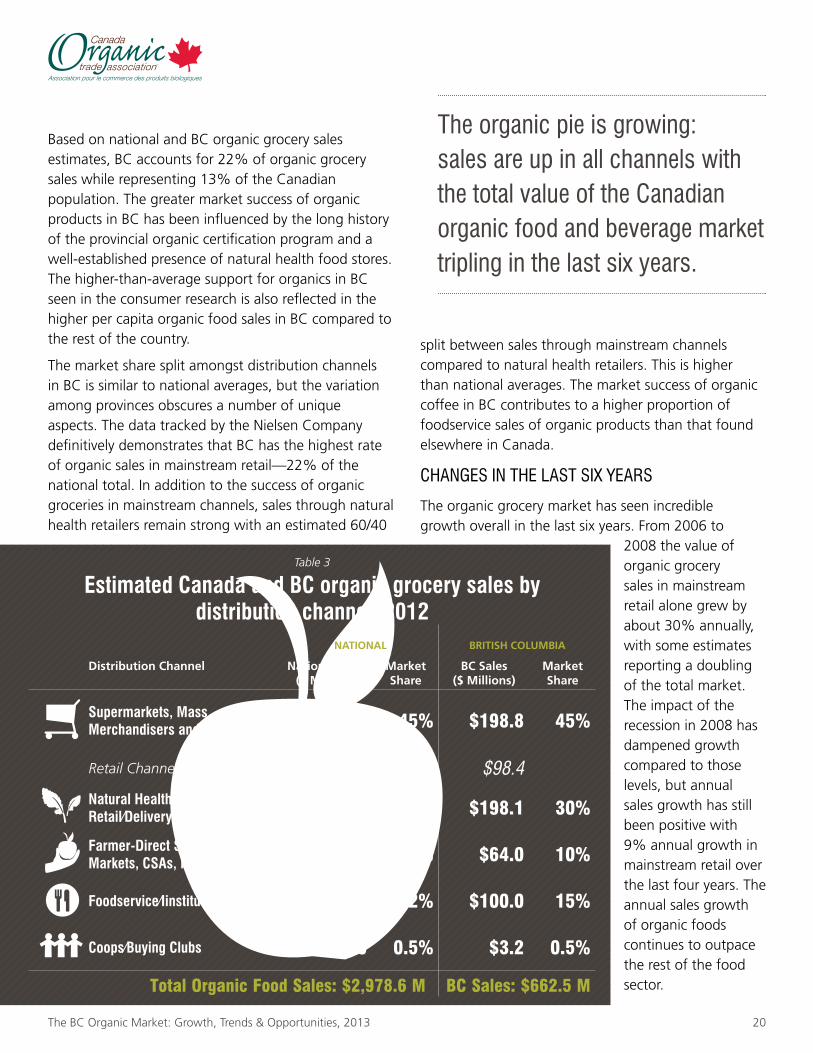
Based on national and BC organic grocery sales estimates, BC accounts for 22% of organic grocery sales while representing 13% of the Canadian population. The greater market success of organic products in BC has been influenced by the long history of the provincial organic certification program and a well-established presence of natural health food stores. The higher-than-average support for organics in BC seen in the consumer research is also reflected in the higher per capita organic food sales in BC compared to the rest of the country.
The market share split amongst distribution channels in BC is similar to national averages, but the variation among provinces obscures a number of unique aspects. The data tracked by the Nielsen Company definitively demonstrates that BC has the highest rate of organic sales in mainstream retail—22% of the national total. In addition to the success of organic groceries in mainstream channels, sales through natural health retailers remain strong with an estimated 60/40
split between sales through mainstream channels compared to natural health retailers. This is higher than national averages. The market success of organic coffee in BC contributes to a higher proportion of foodservice sales of organic products than that found elsewhere in Canada.
cHAnGeS in THe lAST Six yeArS
The organic grocery market has seen incredible growth overall in the last six years. From 2006 to
2008 the value of organic grocery sales in mainstream retail alone grew by about 30% annually, with some estimates reporting a doubling of the total market. The impact of the recession in 2008 has dampened growth compared to those levels, but annual sales growth has still been positive with 9% annual growth in mainstream retail over the last four years. The annual sales growth of organic foods continues to outpace the rest of the food sector.
Table 3
Estimated Canada and BC organic grocery sales by distribution channel, 2012
NATIONAL BRITISH COLUMBIA
Distribution Channel National Sales ($ Millions)
Market Share
BC Sales ($ Millions)
Market Share
Supermarkets, Mass Merchandisers and drug Stores $919.7 45% $198.8 45%
Retail Channel Adjustment $430.6 $98.4
natural health Stores & Online retail/delivery Services $864.7 29% $198.1 30%
Farmer-direct Sales: Farmers’ Markets, CSas, Farm-Stands $377.6 13% $64.0 10%
Foodservice/iinstitutional $371.0 12% $100.0 15%
Coops/Buying Clubs $15.0 0.5% $3.2 0.5%
Total Organic Food Sales: $2,978.6 M BC Sales: $662.5 M
The organic pie is growing: sales are up in all channels with the total value of the canadian organic food and beverage market tripling in the last six years.
21 © Canada Organic Trade Association, 2013
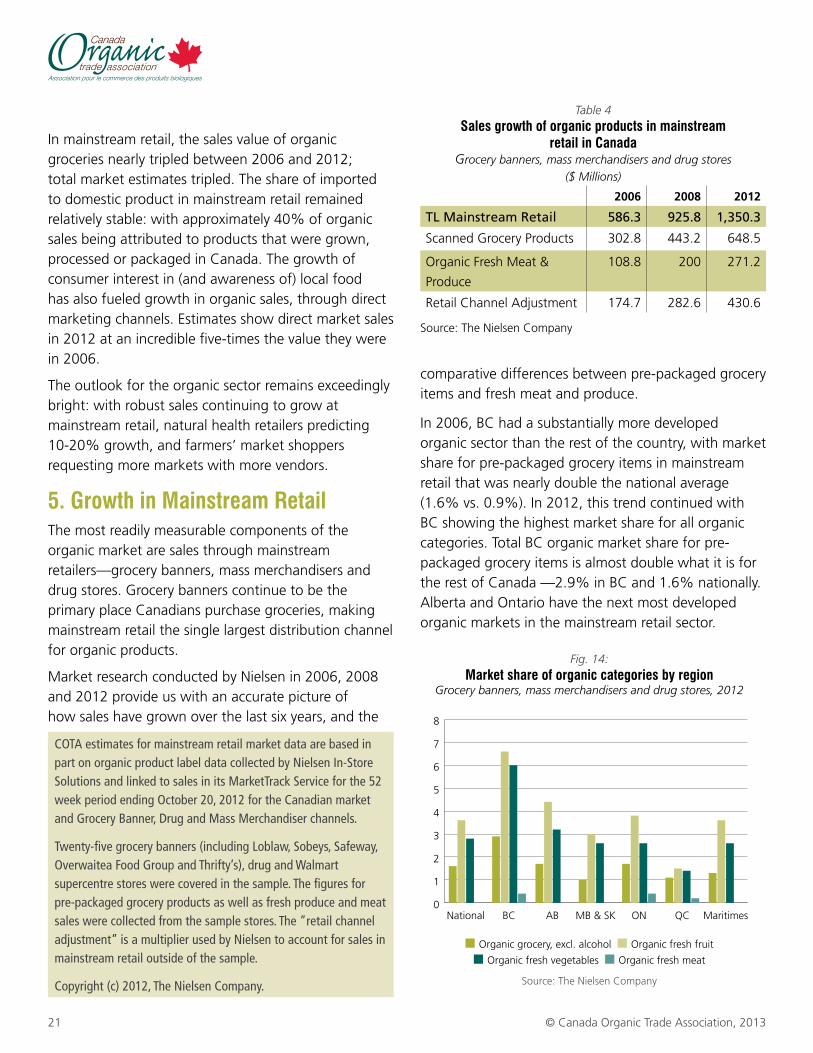
In mainstream retail, the sales value of organic groceries nearly tripled between 2006 and 2012; total market estimates tripled. The share of imported to domestic product in mainstream retail remained relatively stable: with approximately 40% of organic sales being attributed to products that were grown, processed or packaged in Canada. The growth of consumer interest in (and awareness of) local food has also fueled growth in organic sales, through direct marketing channels. Estimates show direct market sales in 2012 at an incredible five-times the value they were in 2006.
The outlook for the organic sector remains exceedingly bright: with robust sales continuing to grow at mainstream retail, natural health retailers predicting 10-20% growth, and farmers’ market shoppers requesting more markets with more vendors.
5. growth in Mainstream retailThe most readily measurable components of the organic market are sales through mainstream retailers—grocery banners, mass merchandisers and drug stores. Grocery banners continue to be the primary place Canadians purchase groceries, making mainstream retail the single largest distribution channel for organic products.
Market research conducted by Nielsen in 2006, 2008 and 2012 provide us with an accurate picture of how sales have grown over the last six years, and the
comparative differences between pre-packaged grocery items and fresh meat and produce.
In 2006, BC had a substantially more developed organic sector than the rest of the country, with market share for pre-packaged grocery items in mainstream retail that was nearly double the national average (1.6% vs. 0.9%). In 2012, this trend continued with BC showing the highest market share for all organic categories. Total BC organic market share for pre-packaged grocery items is almost double what it is for the rest of Canada —2.9% in BC and 1.6% nationally. Alberta and Ontario have the next most developed organic markets in the mainstream retail sector.
COTAestimatesformainstreamretailmarketdataarebasedinpartonorganicproductlabeldatacollectedbyNielsenIn-StoreSolutionsandlinkedtosalesinitsMarketTrackServiceforthe52weekperiodendingOctober20,2012fortheCanadianmarketandGroceryBanner,DrugandMassMerchandiserchannels.
Twenty-fivegrocerybanners(includingLoblaw,Sobeys,Safeway,OverwaiteaFoodGroupandThrifty’s),drugandWalmartsupercentrestoreswerecoveredinthesample.Thefiguresforpre-packagedgroceryproductsaswellasfreshproduceandmeatsaleswerecollectedfromthesamplestores.The”retailchanneladjustment”isamultiplierusedbyNielsentoaccountforsalesinmainstreamretailoutsideofthesample.
Copyright(c)2012,TheNielsenCompany.
Table 4Sales growth of organic products in mainstream
retail in CanadaGrocery banners, mass merchandisers and drug stores
($ Millions)
2006 2008 2012
TL Mainstream Retail 586.3 925.8 1,350.3
Scanned Grocery Products 302.8 443.2 648.5
Organic Fresh Meat &
Produce
108.8 200 271.2
Retail Channel Adjustment 174.7 282.6 430.6
Source: The Nielsen Company
0
1
2
3
4
5
6
7
8
MaritimesQCONMB & SKABBCNational
Fig. 14:Market share of organic categories by region
Grocery banners, mass merchandisers and drug stores, 2012
■ Organic grocery, excl. alcohol ■ Organic fresh fruit
■ Organic fresh vegetables ■ Organic fresh meat
Source: The Nielsen Company

22The BC Organic Market: Growth, Trends & Opportunities, 2013
The data gathered by Nielsen through product scans and sales of fresh produce and meats was categorized into product categories to show the comparative sales between categories. Fruit and vegetables are the clear leaders in organic sales, capturing over 40% of total organic sales in mainstream retail. Fresh produce out-performs dried or frozen products with 94% of category sales. However, the detailed scan data reveals that organic offerings in the frozen fruit and vegetable categories are limited. Beverages are the second largest product category where roast and ground coffee accounts for approximately half of all sales. BC leads organic coffee purchasing nationally: one-third of organic coffee was sold in BC, while representing only 13% of the population. Tea, juices and drinks are also strong performers in this category.
Bread, grains and baking aids closely follow beverages in organic sales, with ready-to-eat cereals and bread leading sales. Crackers were one of the few categories where a significant portion—73% of BC sales—fall under the “made with organic ingredients” product category. Dairy and eggs, not surprisingly, are big sellers in mainstream retail, with BC yogurt sales outperforming national averages.
In the packaged and prepared category, soup is the strongest performer, accounting for roughly one-third of total sales. Products catering to babies and toddlers are another stand-out: combined, baby food ($1.76 M), toddler and infant snacks ($ 0.78 M) and infant cereal ($0.39 M) account for 20% of category sales.
Bulk sales information, which is not included in the Nielsen market research, was included in this study for the first time thanks to information provided to COTA directly from private businesses. Nuts account for about one-third of bulk sales with fruit, grains, snacks and seeds following in sales. The condiment category
Table 5Top five organic performers in each product category in BC
Grocery banners, mass merchandisers and drug stores, 2012
Fruit & vegetables
$83.42mBeverages
$30.29 mBread, grains & Baking aids
$25.4 m1. Fresh Fruit
$31.14 M2. Fresh Vegetables
$27.21 M3. Pre-Packaged Salads
$19.65 M4. Frozen Fruit
$0.87 M5. Dried Beans
$0.81 M
1. Coffee (Roast & Ground) $15.41 M
2. Soya Drinks $6.86 M
3. Juices/Drinks (Shelf-Stable) $3.31 M
4. Tea $1.51 M5. Juices/Drinks
(Refrigerated) $1.47 M
1. RTE Cereals $7.83 M
2. Bread (Commercial) $ 6.94 M
3. Crackers $2.00 M
4. Pasta (Dry) $1.67 M5. Hot Cereals
$1.53 M
dairy & Eggs
17.06 mpackaged & prepared Foods
$14.78 m
Condiments
$ 7.89 m
1. Yogurt Products $11.79 M
2. Milk $9.77 M3. Eggs $3.99 M4. Butter & Dairy
Spreads $0.97 M5. Cheese (Exact
Weight) $0.60 M
1. Soup $5.09 M2. Baby Food $1.76 M3. Tofu Products
$1.41 M4. Peanut Butter
$1.12 M5. Pasta Sauce (C & B)
$0.81 M
1. Cooking Oils $2.02 M
2. Spices $ 0.94 M3. Pure Maple Syrup
$0.93 M4. Honey $0.63 M5. Mexican Salsa, Dips
& Garnishes $0.61 MSnack Foods
$ 4.82 mMeat, poultry & Seafood
$ 2.99 m*1. Nutritious Portable
Foods $2.03 M2. Snack Foods
$1.25 M 3. Chocolate $0.94 M4. Snacking Fruits, Nuts
& Seeds $0.32 M
1. Fresh Meat & Poultry $2.45 M
2. Frozen Seafood $0.54 M
Source: The Nielsen Company
Fig. 15:BC organic sales by product categories
Grocery banners, mass merchandisers and drug stores, 2012
■ Fruit & vegetables ■ Beverages
■ Bread, grains & baking aids ■ Dairy & eggs
■ Packaged/prepared foods ■ Bulk ■ Condiments
■ Snack foods ■ Meat, poultry & fish
Source: The Nielsen Company
43%
16%13%
9%8%
4%
4%
1%2%
*Does not include certified organic seafood in the fresh case.
23 © Canada Organic Trade Association, 2013
is diverse with a small number of top performers—cooking oils, spices and maple syrup represent half of total sales.
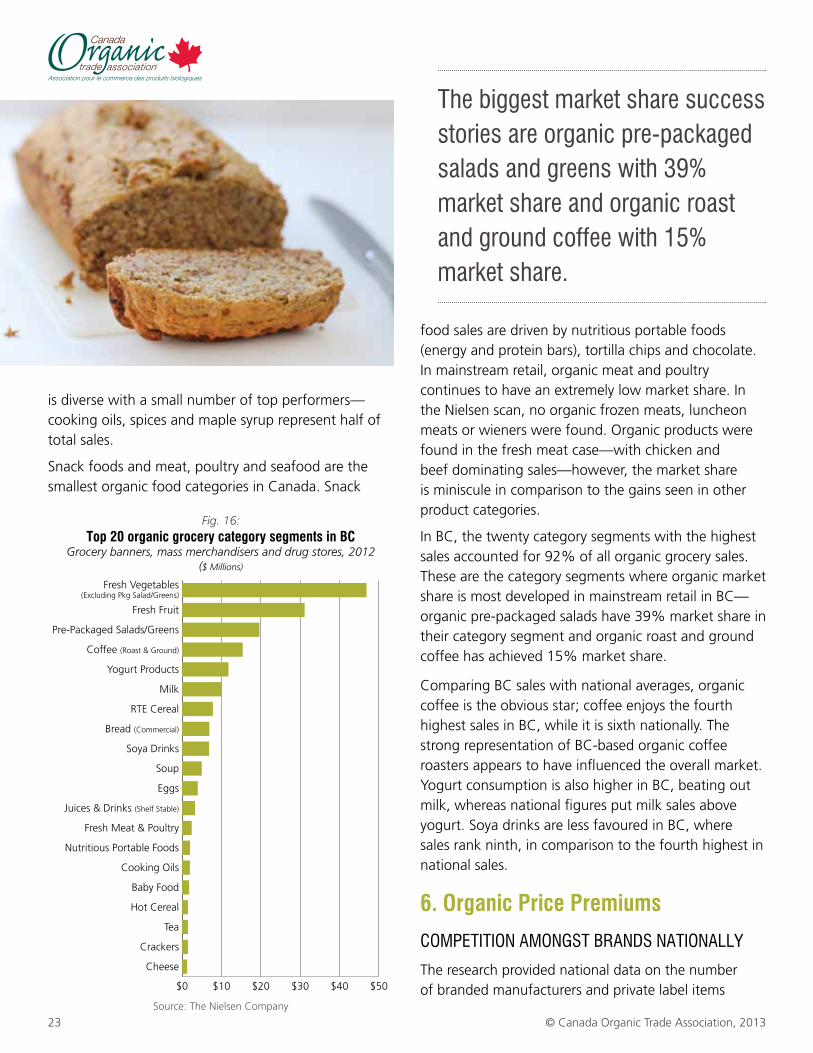
Snack foods and meat, poultry and seafood are the smallest organic food categories in Canada. Snack
food sales are driven by nutritious portable foods (energy and protein bars), tortilla chips and chocolate. In mainstream retail, organic meat and poultry continues to have an extremely low market share. In the Nielsen scan, no organic frozen meats, luncheon meats or wieners were found. Organic products were found in the fresh meat case—with chicken and beef dominating sales—however, the market share is miniscule in comparison to the gains seen in other product categories.
In BC, the twenty category segments with the highest sales accounted for 92% of all organic grocery sales. These are the category segments where organic market share is most developed in mainstream retail in BC—organic pre-packaged salads have 39% market share in their category segment and organic roast and ground coffee has achieved 15% market share.
Comparing BC sales with national averages, organic coffee is the obvious star; coffee enjoys the fourth highest sales in BC, while it is sixth nationally. The strong representation of BC-based organic coffee roasters appears to have influenced the overall market. Yogurt consumption is also higher in BC, beating out milk, whereas national figures put milk sales above yogurt. Soya drinks are less favoured in BC, where sales rank ninth, in comparison to the fourth highest in national sales.
6. Organic price premiums
cOmPeTiTiOn AmOnGST brAndS nATiOnAlly
The research provided national data on the number of branded manufacturers and private label items
Fig. 16:Top 20 organic grocery category segments in BC
Grocery banners, mass merchandisers and drug stores, 2012($ Millions)
Source: The Nielsen Company
$0 $10 $20 $30 $40 $50
Cheese
Crackers
Tea
Hot Cereal
Baby Food
Cooking Oils
Nutritious Portable Foods
Fresh Meat & Poultry
Juices & Drinks (Shelf Stable)
Eggs
Soup
Soya Drinks
Bread (Commercial)
RTE Cereal
Milk
Yogurt Products
Coffee (Roast & Ground)
Pre-Packaged Salads/Greens
Fresh Fruit
Fresh Vegetables(Excluding Pkg Salad/Greens)
The biggest market share success stories are organic pre-packaged salads and greens with 39% market share and organic roast and ground coffee with 15% market share.
24The BC Organic Market: Growth, Trends & Opportunities, 2013
participating in each organic grocery category segment. A degree of competition amongst brands was found in most segments. Not surprisingly, the segments with the most competition tended to be those with the highest sales values. However, the market share of organic products was not always highest in the category segments that have the most brand competition. In other words, there is still room for the introduction of new organic products even in the segments with the highest rates of competition.
PrivATe lAbelThe top organic sellers under private label in national and regional grocery chains show a strong trend towards offering convenient, yet healthy food. Pre-packaged salads are the largest organic private label seller—70% of organic pre-packaged salads in mainstream retail are sold under private label brands. Eggs are the second strongest performer in terms of sales, and private label brands have captured 56% of the organic egg market in mainstream retail. Frozen fruit and vegetables, peanut butter, single-serve apple and fruit sauces, and infant and toddler snacks round out the category segments where private label brands play the largest role. Canada’s mainstream retailers are clearly targeting their products to families with children who value health and convenience. Twenty-one percent of mainstream retail organic sales were attributed to private label products in 2012, the same share as found in 2008. However, the total number of
private label grocery products has decreased from 96 to 73, suggesting retailers have better focused their efforts.
OrGAnic Price PremiumS
A rough estimate of current price premiums for organic products was attained by comparing the share of dollar sales organic products captured in each category segment against their share by volume. The comparison is based on the total value of the category segment, which incorporates the value of premium conventional brands. It does not provide a comparison of lowest-cost organic items to lowest-cost conventional items.
A large spread in price premiums was found, with the majority of category segments showing organic products to have a 1:1 to 1.4:1 dollar share to unit share ratio. In other words, on average, the majority of organic products are the same price as their conventional counterparts (1:1) or are capturing slightly more value (1.4:1). At the lower end of the range, eighteen category segments were found where the ratio indicated that the average organic price was lower than the average conventional price. A number of these are also category segments where private label plays a substantial role in total organic sales.
In the fresh categories in BC, organic meat and poultry have the highest ratio (1.8:1) followed by organic vegetables (1.6:1), and organic fruit (1.3:1). Most of the organic dairy categories enjoy a price premium over non-organic, as do juices and drinks, including vegetable juices. The product with the highest price premium was yogurt (4.6:1), given that yogurt is also the second-highest seller in the grocery category, this suggests that consumers remain willing to pay a premium for organic in some categories.
Source: The Nielsen Company
Table 6Top 10 categories with the highest number of manufacturers
participating
Tea 29 Cooking Oils 17
Coffee(Roast & Ground)
26 RTE Cereals 15
Juice & Drinks (Shelf Stable)
26 Flour 15
Pasta (Dry) 20 Bread (Commercial) 15
Hot Cereals 17 Dried BeansRice
13;13
canada’s mainstream grocers are targeting families with their organic private label offerings.

25 © Canada Organic Trade Association, 2013
cOunTry OF OriGin
Of over 3,000 organic grocery items captured in the market research scan, in the BC market 39% by volume identified themselves as being grown, packaged or processed in Canada. These Canadian products captured slightly more value than imported products, accounting for 44% of market value. Thirty-five percent of organic products by value were identified as US imports, the largest by far of
any importing country. The BC market has a slightly larger proportion of US imports than the national average, primarily because a much lower presence of US products in Quebec lowers the national average—US imports only represent 20% of organic sales in Quebec. In BC, the origin of 15% of products was unspecified or unknown.
Amongst organic pre-packaged products identified as grown, processed or packaged in Canada, the top 12 category segments, shown below, account for
0%
10%
20%
30%
40%
50%
EuropeOtherUnknownUSACanada
Fig. 18:Share of value and volume of organic pre-packaged grocery
sales in BC by country of originGrocery banners, mass merchandisers and drug stores, 2012
■ Value ■ Volume
Source: The Nielsen Company
Fig. 19:Highest value ‘Canada’ Organic pre-packaged grocery items in
the BC marketGrocery banners, mass merchandisers and drug stores, 2012
($ Millions)
■ Value ■ Volume
Source: The Nielsen Company
$0 $2 $4 $6 $8 $10 $12
Pure Maple Syrups
Soup
Butter & Dairy Spreads
Baby Food
Juices & Drinks(Refrigerated)
RTE Cereals
Soya Drinks
Eggs
Bread(Commercial)
Milk
Yogurt Products
Coffee(Roast & Ground)
Source: The Nielsen Company
Fig. 17The range of price premiums for organic products in BC
within their category segment
$ Share: unit Share ratio Category Segment Examples
2-4.6 (20 items) Yogurt, Juice & Drinks (Shelf Stable), Chocolate, Vegetable Juices
1.5-1.9 (29 items) Milk, Eggs, Bread, Cottage Cheese, Sour Cream, Butter
1-1.4 (72 items) Pre-Packaged Salads, Coffee, RTE Cereals, Soya Drinks, Crackers, Pasta
0.3-0.9 (18 items) Rice & Non-Dairy Alts, Baby Food, Rice, Honey, Peanut Butter, Fruit & Apple Sauce
Price premiums for organic foods remain, but category segment averages show the relative pricing between conventional and organic products is approaching 1:1 for many products.
26The BC Organic Market: Growth, Trends & Opportunities, 2013
80% of total sales. Roasted in Canada coffee, dairy, eggs, and bread are the strongest performers. RTE cereals, baby food, and soup demonstrate the ability of manufactures that produce their products in Canada and/or source Canadian ingredients to compete in the prepared organic foods category. Detailed information on the country of origin of fresh organic products was not available through the Nielsen market scan.
OrGAnic clAimS And lOGOS
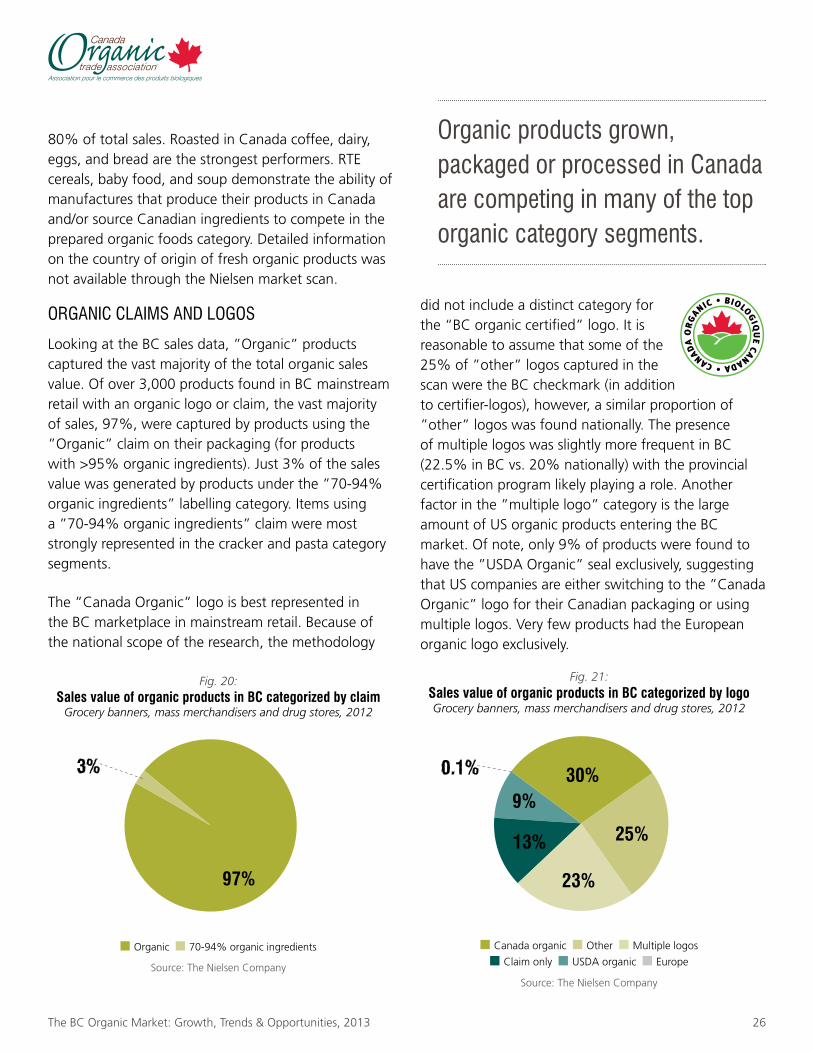
Looking at the BC sales data, ”Organic” products captured the vast majority of the total organic sales value. Of over 3,000 products found in BC mainstream retail with an organic logo or claim, the vast majority of sales, 97%, were captured by products using the ”Organic” claim on their packaging (for products with >95% organic ingredients). Just 3% of the sales value was generated by products under the ”70-94% organic ingredients” labelling category. Items using a ”70-94% organic ingredients” claim were most strongly represented in the cracker and pasta category segments.
The ”Canada Organic” logo is best represented in the BC marketplace in mainstream retail. Because of the national scope of the research, the methodology
did not include a distinct category for the “BC organic certified” logo. It is reasonable to assume that some of the 25% of ”other” logos captured in the scan were the BC checkmark (in addition to certifier-logos), however, a similar proportion of ”other” logos was found nationally. The presence of multiple logos was slightly more frequent in BC (22.5% in BC vs. 20% nationally) with the provincial certification program likely playing a role. Another factor in the ”multiple logo” category is the large amount of US organic products entering the BC market. Of note, only 9% of products were found to have the ”USDA Organic” seal exclusively, suggesting that US companies are either switching to the ”Canada Organic” logo for their Canadian packaging or using multiple logos. Very few products had the European organic logo exclusively.
Fig. 20: Sales value of organic products in BC categorized by claim
Grocery banners, mass merchandisers and drug stores, 2012
■ Organic ■ 70-94% organic ingredients
Source: The Nielsen Company
97%
3%
Fig. 21:Sales value of organic products in BC categorized by logoGrocery banners, mass merchandisers and drug stores, 2012
■ Canada organic ■ Other ■ Multiple logos
■ Claim only ■ USDA organic ■ Europe
Source: The Nielsen Company
30%
25%
23%
13%
9%
0.1%
Organic products grown, packaged or processed in canada are competing in many of the top organic category segments.
27The BC Organic Market: Growth, Trends & Opportunities, 2013
7. natural health & Foodservice
GrOwTH in THe FAce OF cOmPeTiTiOn
The competition for consumer grocery dollars in Canada is fierce. The grocery sector is one of the most competitive segments of Canadian retail and one might expect that with the growing share of organic products found in mainstream grocery outlets, Canada’s natural health retailers would be suffering as a result. While total sales volumes in the natural health sector are poorly tracked, the research, data and insights shared with COTA by key players all point to continued growth in the value and volume of organic food sales through natural health retailers in 2012.
Alive Publishing Group (2010) estimates that there are over 3,000 natural health retail outlets in Canada, many of which are single stores. Taken together these stores continue to represent a substantial portion of the organic food market, even as higher volume players move into organic. What is perhaps the most promising part of the natural health scene is the optimism for growth. In a recent survey of natural health retailers, 71% expected sales to increase, with anticipated growth ranging from 10-20%. Only 5% of retailers in the sector expected a decrease (Alive 2010). This fits with the experiences reported by distributors in western and central Canada who service these retailers—sales growth has steadily remained in the double-digit range since the 2008 recession.
One of the largest players in the Canadian natural health sector is Whole Foods Market. As a publicly traded company, Whole Foods Market releases an annual report that includes sales values as well as an estimate of the share of certified organic products sold. The scale of Whole Foods Market—they are the 20th largest food retailer in North America—translates into substantial sales volumes of organic products (Supermarket News 2012). In 2012, 30% of the company’s $11.7 billion net sales are estimated to be from the sale of certified organic products (Whole Foods Market 2012). Based on figures from their annual report, 30% of Whole Foods Market’s Canadian sales alone would add over $50 million to the value of
the Canadian organic marketplace. Currently, Whole Foods operates four stores in BC and four in Ontario with a number of new stores under development.
incubATOrS FOr THe new, SmAll And lOcAl
Sales volumes are not necessarily the most important role that natural health retailers play in supporting the organic sector. Typically smaller and more nimble, natural health retailers are in a position to buy direct from farmers, carry value-added products that have not yet scaled up to meet the volume demands of larger players, and differentiate themselves from mainstream competitors by offering more local products. In many instances, natural health retailers are also able to offer a more direct relationship with their customers that the consumer research shows is so important to organic shoppers. The ability to purchase from small to medium farmers and value-added producers serves an essential incubator role that is needed to help new businesses develop and smaller operators maintain market presence.
Chefs and restaurants are playing a similar incubator role for smaller-scale and new organic producers. Conversations and research with farmers, distributors and chefs indicate that farmer-direct sales to restaurants have been an area of growth over the last six years. Again, interest in local food and the desire to know the story behind food production has been a major driver behind this new marketing opportunity. While it is not without its challenges, the producer-restaurant relationship provides a new avenue to increase the viability and profile of organic farming and production practices.

28The BC Organic Market: Growth, Trends & Opportunities, 2013
cOFFee: THe OrGAnic STAr in FOOdService
One of the largest success stories in the organic sector is the growth in organic coffee. In BC, in particular, a vibrant industry of independent organic coffee roasters has taken root and enjoyed significant market success. Organic coffee sales in foodservice are not well documented, but the growing availability of certified organic coffee is evident from single-site cafés to convenience stores and university campuses.
Import data shows $121 million of certified organic, unroasted, caffeinated beans being brought into the country in 2012 in addition to $29 million of roasted organic coffee. Thirty-five percent of Canada’s unroasted organic coffee was imported into BC, more than doubling the share imported in 2009. In 2012, BC imported $41.8 million of certified organic, unroasted, caffeinated coffee (up slightly from 2011) and $6.6 M of certified organic, roasted, caffeinated coffee. Organic coffee imports in Ontario, Quebec and Alberta decreased in 2012 while Nova Scotia and New Brunswick imported substantially more, though the total value in these provinces remains relatively low.
Comparing import figures to the total $68.4 million in sales of roasted and ground coffee estimated by Nielsen for all mainstream retail, the importance of foodservice as a distribution channel for organic coffee is apparent. The dominance of foodservice sales in the tea and coffee market was noted by Agriculture & Agri-Food Canada in a 2010 review of the conventional coffee market (AAFC 2010).
Market trends for fair trade certified coffee provide additional insight into the organic coffee market. Estimates of how much organic and fair trade coffee certifications overlap in North America ranges from 50-85% (Giovannucci 2009; DeCarlo 2007). Fairtrade Canada reported 71% of fair trade sales were from coffee, for a total of $22 million in 2011. This is a small portion of the market in comparison to organic sales, however, the growth in fair trade coffee in foodservice is telling: 130% between 2010 and 2011 (FTC 2011). Based on the organic coffee import figures and sales
tracked in retail, an estimated $113.9 million in organic coffee sales in foodservice was calculated for Canada, with $39.9 million of this attributed to BC foodservice sales.
mAinSTreAm FOOdService enTerS OrGAnic
Based on distributor numbers, roughly 5% of organic food products are sold through foodservice channels. In addition, farmer-direct sales to restaurants increases the total value of organic foodservice sales. While the trend for local and organic procurement is seen most often in single location and small chain restaurants, larger players with high volume needs are also starting to provide organic options to their customers in response to consumer demand.
Again, the value of organic sales through foodservice channels is not tracked at this time, but the sales volume of the largest players demonstrates the buying power of the collective foodservice industry. Sysco, the largest foodservice distributor in North America in 2012, reported sales in Canada of $4.25 billion. While Sysco offers non-food items the bulk of their sales, over 95%, are from food and beverage products (Sysco 2012). Fresh produce sales in Canada alone are worth $383 million. Sysco has already increased their organic offerings by partnering with Earthbound Farms to develop organic Sysco Brand spring mix salad greens and baby spinach. However, Sysco customers are increasingly asking for local, sustainable produce and heirloom vegetable varieties are among the latest additions to Sysco’s offerings (Produce News 2012). These trends in combination offer an opportunity to build greater value in the Canadian organic market through foodservice distributors. Just a 1% shift in Sysco’s total Canadian food and beverage sales to organic would be equivalent to a $40 million increase in annual sales.
An estimated $40 m of organic coffee was sold in bc foodservice in 2012.

29 © Canada Organic Trade Association, 2013
8. growth of direct MarketingDirect marketing channels are an important sales strategy for many BC organic growers. Organic growers also provide a critical share of the food products available through localized distribution channels. The direct marketing channels with the highest amount of sales and used by the largest group of growers are farmers’ markets and farm-gate sales. Other important channels include direct sales from farmer to restaurant or retailer and Community Supported Agriculture (CSA) programs.
To develop an accurate estimate for organic sales through direct marketing channels, information was drawn from a province-wide survey of farmers’ markets and their vendors conducted by Dr. Connell at the University of Northern British Columbia and the BC Association of Farmers’ Markets, Vancouver Farmers’ Market sales data and primary research on Community Supported Agriculture (CSA) programs by COTA. From these sources, it is estimated $64 million in certified organic food sales was generated in BC through direct marketing channels in 2012.
Within direct marketing (direct-to-consumer) sales, farmers’ markets have the highest share of total sales. The Connell and BCAFM research as well as Vancouver Farmers’ Market sales data suggests over 40% of all BC farmers’ market sales are from certified organic operators. Using the 40% figure as a conservative estimate, this equates to $45.5 million in certified organic sales in 2012.
The province-wide farmers’ market vendor surveys also provided information on certified organic on-farm sales. Sixty-five percent of the certified organic vendors sold through an on-farm stand, generating sales worth 60% of the value earned through farmers’ markets. Based on these responses, certified organic sales through BC farm-stands are estimated at $17.7 million, likely an underestimate as some farmers selling on-farm would not attend farmers’ markets. COTA distributed a survey to BC farmers operating CSAs and, based on these responses, concluded that $800,000 of certified organic fruits, vegetables and other food products were sold through BC CSAs in 2012.
The Connell/BCAFM vendor surveys provide a producer-level perspective of direct-marketing sales values and how sales through different distribution channels are used in combination.
Of the 152 vendors surveyed, 63% were certified ”Organic”, 20% identified as ”natural” or ”organic but not certified”, and 12% as ”conventional”. The UNBC research team surveyed farms to ensure that vendors across product categories and regions were represented. They estimate that the survey sample represents approximately 5% of BC farmers’ market vendors.
Table 7The value of certified organic sales in BC direct marketing
sales, 2012
direct-to-Consumer Sales Estimated value ($ Millions)
Farmers’ Market $45.5
Farm Gate(On-Farm Stand)
$17.7
Community Supported Agriculture
$0.8
TOTaL $64.0 Million
Fig. 22: BC farmers’ market vendors marketing strategies
Number of farms reporting use of each channel
0 20 40 60 80 100
Live Animals
CSA
Wholesale
Retail
Restaurant
Farm Gate
Farmers’ Market
■ Certified organic ■ Natural ■ Conventional
Source: Connell/BCAFM
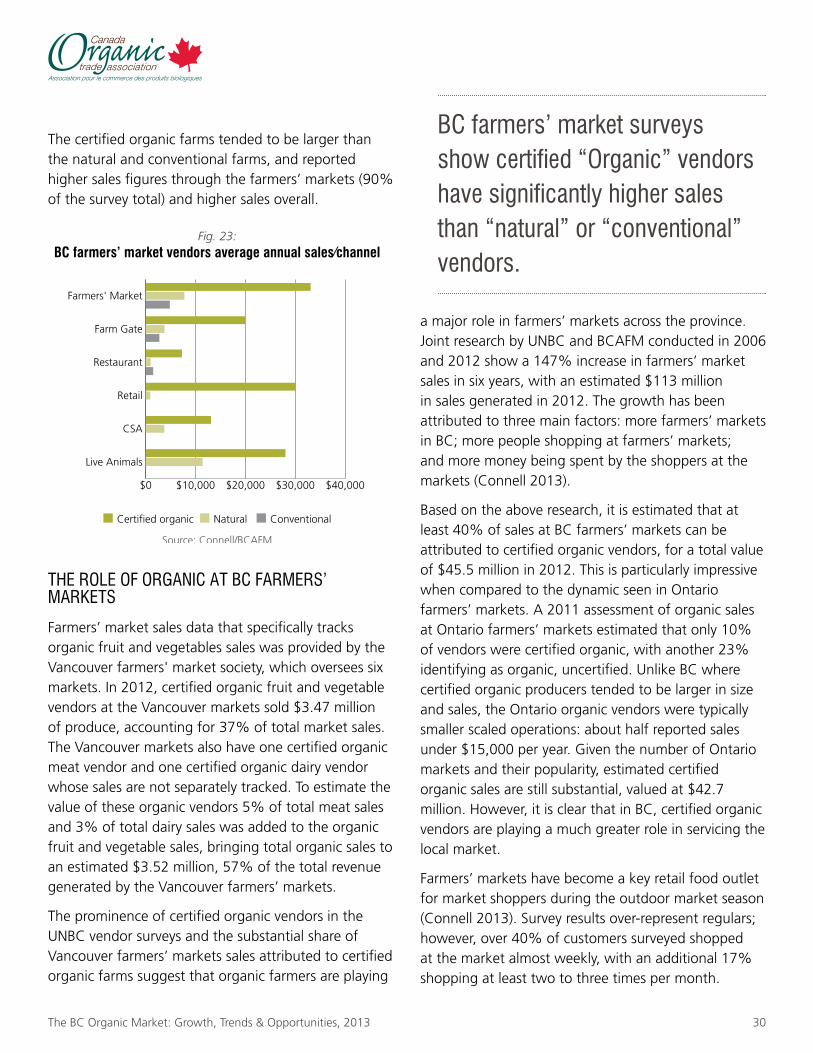
30The BC Organic Market: Growth, Trends & Opportunities, 2013
The certified organic farms tended to be larger than the natural and conventional farms, and reported higher sales figures through the farmers’ markets (90% of the survey total) and higher sales overall.
THe rOle OF OrGAnic AT bc FArmerS’ mArkeTS
Farmers’ market sales data that specifically tracks organic fruit and vegetables sales was provided by the Vancouver farmers' market society, which oversees six markets. In 2012, certified organic fruit and vegetable vendors at the Vancouver markets sold $3.47 million of produce, accounting for 37% of total market sales. The Vancouver markets also have one certified organic meat vendor and one certified organic dairy vendor whose sales are not separately tracked. To estimate the value of these organic vendors 5% of total meat sales and 3% of total dairy sales was added to the organic fruit and vegetable sales, bringing total organic sales to an estimated $3.52 million, 57% of the total revenue generated by the Vancouver farmers’ markets.
The prominence of certified organic vendors in the UNBC vendor surveys and the substantial share of Vancouver farmers’ markets sales attributed to certified organic farms suggest that organic farmers are playing
a major role in farmers’ markets across the province. Joint research by UNBC and BCAFM conducted in 2006 and 2012 show a 147% increase in farmers’ market sales in six years, with an estimated $113 million in sales generated in 2012. The growth has been attributed to three main factors: more farmers’ markets in BC; more people shopping at farmers’ markets; and more money being spent by the shoppers at the markets (Connell 2013).
Based on the above research, it is estimated that at least 40% of sales at BC farmers’ markets can be attributed to certified organic vendors, for a total value of $45.5 million in 2012. This is particularly impressive when compared to the dynamic seen in Ontario farmers’ markets. A 2011 assessment of organic sales at Ontario farmers’ markets estimated that only 10% of vendors were certified organic, with another 23% identifying as organic, uncertified. Unlike BC where certified organic producers tended to be larger in size and sales, the Ontario organic vendors were typically smaller scaled operations: about half reported sales under $15,000 per year. Given the number of Ontario markets and their popularity, estimated certified organic sales are still substantial, valued at $42.7 million. However, it is clear that in BC, certified organic vendors are playing a much greater role in servicing the local market.
Farmers’ markets have become a key retail food outlet for market shoppers during the outdoor market season (Connell 2013). Survey results over-represent regulars; however, over 40% of customers surveyed shopped at the market almost weekly, with an additional 17% shopping at least two to three times per month.
Fig. 23: BC farmers’ market vendors average annual sales/channel
■ Certified organic ■ Natural ■ Conventional
Source: Connell/BCAFM
$0 $10,000 $20,000 $30,000 $40,000
Live Animals
CSA
Retail
Restaurant
Farm Gate
Farmers' Market
bc farmers’ market surveys show certified “Organic” vendors have significantly higher sales than “natural” or “conventional” vendors.
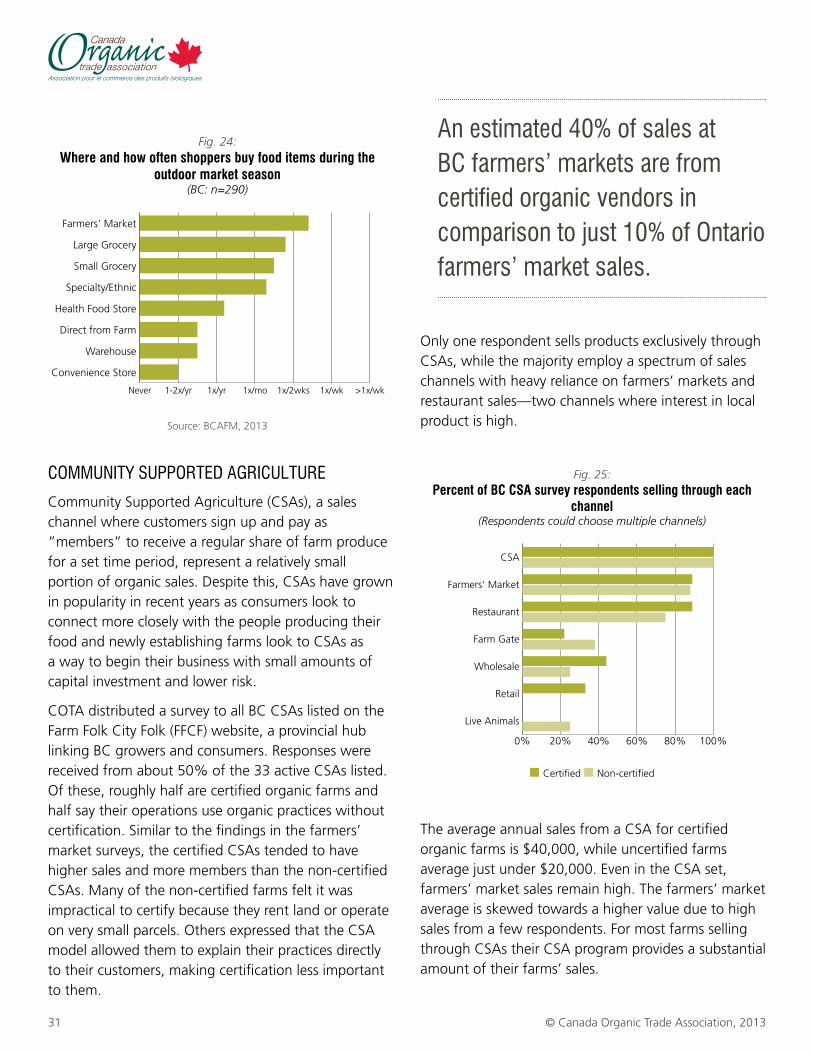
31 © Canada Organic Trade Association, 2013
cOmmuniTy SuPPOrTed AGriculTure
Community Supported Agriculture (CSAs), a sales channel where customers sign up and pay as ”members” to receive a regular share of farm produce for a set time period, represent a relatively small portion of organic sales. Despite this, CSAs have grown in popularity in recent years as consumers look to connect more closely with the people producing their food and newly establishing farms look to CSAs as a way to begin their business with small amounts of capital investment and lower risk.
COTA distributed a survey to all BC CSAs listed on the Farm Folk City Folk (FFCF) website, a provincial hub linking BC growers and consumers. Responses were received from about 50% of the 33 active CSAs listed. Of these, roughly half are certified organic farms and half say their operations use organic practices without certification. Similar to the findings in the farmers’ market surveys, the certified CSAs tended to have higher sales and more members than the non-certified CSAs. Many of the non-certified farms felt it was impractical to certify because they rent land or operate on very small parcels. Others expressed that the CSA model allowed them to explain their practices directly to their customers, making certification less important to them.
Only one respondent sells products exclusively through CSAs, while the majority employ a spectrum of sales channels with heavy reliance on farmers’ markets and restaurant sales—two channels where interest in local product is high.
The average annual sales from a CSA for certified organic farms is $40,000, while uncertified farms average just under $20,000. Even in the CSA set, farmers’ market sales remain high. The farmers’ market average is skewed towards a higher value due to high sales from a few respondents. For most farms selling through CSAs their CSA program provides a substantial amount of their farms’ sales.
Fig. 24:Where and how often shoppers buy food items during the
outdoor market season (BC: n=290)
Source: BCAFM, 2013
Never 1-2x/yr 1x/yr 1x/mo 1x/2wks 1x/wk >1x/wk
Convenience Store
Warehouse
Direct from Farm
Health Food Store
Specialty/Ethnic
Small Grocery
Large Grocery
Farmers' Market
Fig. 25: Percent of BC CSA survey respondents selling through each
channel(Respondents could choose multiple channels)
■ Certified ■ Non-certified
0% 20% 40% 60% 80% 100%
Live Animals
Retail
Wholesale
Farm Gate
Restaurant
Farmers' Market
CSA
An estimated 40% of sales at bc farmers’ markets are from certified organic vendors in comparison to just 10% of Ontario farmers’ market sales.
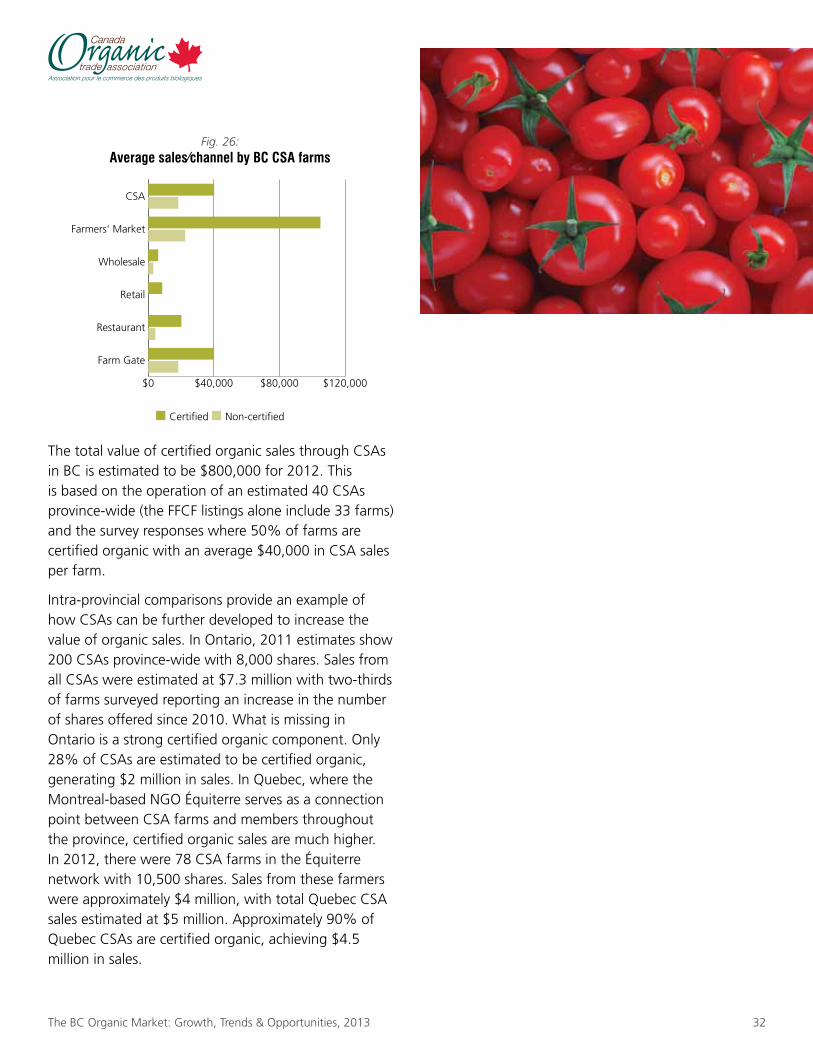
32The BC Organic Market: Growth, Trends & Opportunities, 2013
The total value of certified organic sales through CSAs in BC is estimated to be $800,000 for 2012. This is based on the operation of an estimated 40 CSAs province-wide (the FFCF listings alone include 33 farms) and the survey responses where 50% of farms are certified organic with an average $40,000 in CSA sales per farm.
Intra-provincial comparisons provide an example of how CSAs can be further developed to increase the value of organic sales. In Ontario, 2011 estimates show 200 CSAs province-wide with 8,000 shares. Sales from all CSAs were estimated at $7.3 million with two-thirds of farms surveyed reporting an increase in the number of shares offered since 2010. What is missing in Ontario is a strong certified organic component. Only 28% of CSAs are estimated to be certified organic, generating $2 million in sales. In Quebec, where the Montreal-based NGO Équiterre serves as a connection point between CSA farms and members throughout the province, certified organic sales are much higher. In 2012, there were 78 CSA farms in the Équiterre network with 10,500 shares. Sales from these farmers were approximately $4 million, with total Quebec CSA sales estimated at $5 million. Approximately 90% of Quebec CSAs are certified organic, achieving $4.5 million in sales.
Fig. 26: Average sales/channel by BC CSA farms
■ Certified ■ Non-certified
$0 $40,000 $80,000 $120,000
Farm Gate
Restaurant
Retail
Wholesale
Farmers' Market
CSA
33 © Canada Organic Trade Association, 2013
SECTiON iiiOppOrTuNiTiES AND rECOMMENDATiONS
9. Opportunities for Sector developmentThe organic market in Canada has experienced impressive growth in the last decade, with certified organic products now widely available in almost all agricultural product categories and in most retail environments. Today, with $3.7 billion in annual sales in Canada and broad-scale consumer interest, opportunities for businesses throughout the organic value chain have never been greater. Organic has reached new heights in Canada, creating a solid foundation for the next phases of growth and development.
brOAden And deePen THe cOnSumer mArkeT
The consumer research commissioned as part of this study shows that the vast majority of Canadians are seeking out healthy foods and are willing to pay more for food that they know is good for themselves and their families. With over half of all Canadians buying organic groceries on a weekly basis, there remains significant room to broaden the organic consumer base. Notably, the majority of organic buyers are still in the lowest weekly spending bracket ($1-25). This highlights the need to deepen the organic market by encouraging consumers to commit more of their grocery spending to organic products.
The research findings suggest that one of the best ways to achieve this broadening and deepening of the organic market, in BC as well as nationally, is to more strongly promote the brand and value of “Canada Organic” certification. Consumer responses already show that “Canada Organic” certification has much greater influence on the likelihood of purchasing a product than “USDA Organic” certification. The strong trust in “local” claims also reaffirms the importance of maintaining and building on the “BC checkmark” as a strong visual identifier for consumers. However, the
organic sector needs a strong, coordinated campaign that goes beyond just a logo: a national campaign with provincial tie-ins needs to back up the logo and claim and build awareness and engagement in the community. The “brand-promise” that the logo guarantees will strengthen the organic claim’s influence and further encourage consumers to choose organic foods over other products.
STrenGTHeninG lOcAl OrGAnic FOOd SySTemS
The impressive growth in sales of certified organic products through direct marketing channels in BC between 2006 and 2012 highlights how efforts to develop local food systems share common ground with organic agriculture promotion. The growing demand for local food is happening across distribution channels—from farmers’ markets to foodservice to mainstream retail. Despite some early concerns that “local” may compete with “organic”, it is clear from the market research that “local” and “organic” can be mutually supportive concepts. This is especially the case as consumers move along the continuum of asking for more information on where a product is grown, to a more comprehensive understanding of how it has been grown. Demand for local, sustainable food fits well with the practices and positioning of organic producers. Further initiatives to support and expand local food systems will continue to create a corresponding increase in opportunities for organic producers. In particular, Community Supported Agriculture (CSA) is an attractive model for newly establishing farmers. Building on this existing dynamic,
34The BC Organic Market: Growth, Trends & Opportunities, 2013
a program that supports CSAs would also provide a way to support new entrants to the organic sector—expanding both production and market opportunities.
embrAcinG THe incubATOr rOle
A notable benefit of the relationship between organic food producers and natural health or specialty retailers and restaurants is the incubator role they are able to play. With lower volume needs and a higher likelihood to have a direct relationship with consumers, these retailers and restaurants are well-positioned to profile new and artisanal products and bring them to a broader audience. These are often trendsetters in the food system that play a crucial role in shaping public tastes and preferences. An opportunity exists to formalize the incubator role with specific programs to support direct relationships between local, organic growers or food producers and these ‘incubators’, both in foodservice and retail.
A FOcuS On FOOdService
As noted in the research, a 1% shift to organic on the part of national foodservice providers would have a massive impact on the domestic organic market. At the same time that it is attempting to broaden and differentiate its offerings, the foodservice channel is aiming to meet customer expectations for sustainable and local products. Certain products are clearly leaders in the organic market in BC, and in foodservice as well: while the average market share of organic products
ranges from 1.7 to 4%, coffee and fresh greens are in the double-digits. A targeted focus on identifying and supplying Canadian organic products that are best suited to enter the foodservice supply chain could drastically scale up the local organic market.
SuPPOrT FOr ScAlinG uP
The continued gains in market share for organic products in mainstream retail and foodservice are exciting to see. However, BC organic producers continue to face substantial competition from organic imports, primarily from the US. Assistance for domestic organic producers and manufacturers to scale up and meet the volume demands of large buyers will help the competitiveness of BC organic producers over the long term, build stronger Canadian demand for organic products (“Made in Canada” remains the most influential claim governing purchasing behaviour) as well as provide the “multiplier effect” of job and sales growth opportunities.
A viAble OrGAnic meAT And POulTry SecTOr
Organic meat and poultry remains the most poorly developed category segment for organic products, yet consumer interest in free-range and organic meat production is among the highest of all organic segments and is continuing to rise. There is a clear market opportunity for organic meat and poultry; however, this sector arguably faces the greatest challenges of all organic products. In the meat category there is strong competition from products with poorly-defined “natural” claims and high organic grain prices make feed costs difficult to manage. To continue to grow the market share of organic products overall, a strategy to expand the production and market opportunities for organic meat and poultry is required at both the provincial and national level.
35 © Canada Organic Trade Association, 2013
10. recommendations for Future researchAs the first market research study to be conducted since the Canada Organic Regime was introduced in 2009, and the most comprehensive organic market research effort to date, this study provides an important benchmark for future research. The scope and depth of the analysis highlights a number of areas where data collection can be improved to facilitate better tracking of the organic market and consumers in the future:
• Morein-depthconsumerresearchtobetterunderstandthebarriersandstrongestmotivatorsforbuyingorganic,aswellasgreatersegmentationoforganicbuyinggroups;
• Thedevelopmentofastandardizedindustrysurveytobecompletedannuallybycompaniesinvolvedintheorganicvaluechaintocollectsales,growthanddistributionchannelinformation;
• Trackingoforganicsalesinthenaturalhealthretailsectorbyamarketresearchfirm;
• Maintenanceandexpansionoforganicquestions(e.g.marketingchannel)intheCensusofAgricultureconductedbyStatisticsCanada;
• Anannual,nationallycoordinatedcollectionofproductiondataandproducersales;
• Supportforlongitudinalresearcheffortstomeasuremarketgrowth,sectordevelopmentandconsumertrendsattwo-tothree-yearintervalstoprovidecriticaltrendlineinformation;
• Morerigorouscollectionofdataontheorganicnon-foodsector,whichinmanyinstancesisgrowingatafasterpace;and
• TheexpansionofHarmonizedSystem(HS)codestobetterquantifytherangeoforganicproductsimportedintoCanada,andtheintroductionofHScodesforexportedproducts.
36The BC Organic Market: Growth, Trends & Opportunities, 2013
referencesAgriculture and Agri-Food Canada (2010) The
Canadian Coffee Industry. http://www4.agr.gc.ca/AAFC-AAC/display-afficher.do?id=1172237152079
Alive Publishing Group (2010) Navigating Natural Health in Canada.
Connell, D. (2013) Economic and Social Benefits Assessment, Provincial Report: British Columbia, Canada. A collaborative project of British Columbia Association of Farmers’ Markets and School of Environmental Planning, University of Northern British Columbia.
DeCarlo, J. (2007) Fair Trade: A Beginner’s Guide. Oxford, England: Oneworld.
Fairtrade Canada (2011) 2011 Year In Review. http://fairtrade.ca/sites/default/files/2011%20Year%20In%20Review%20-%20PUBLIC.pdf
Giovannucci, D.P. (2009) The North American Organic Coffee Industry Report.
International Federation of Organic Agriculture Movements and Research Institute of Organic Agriculture (FiBL) (2013) The World of Organic Agriculture 2013.
Macey, A. (2007) Retail Sales of Certified Organic Food Products, in Canada, in 2006. Commission and published by the Organic Agriculture Centre of Canada: Truoro, Nova Scotia.
The Nielsen Company (2007) Certified Organic Insights Report: Pure & Simple Insight to Consumer Food Choices.
Organic Trade Association (2012). 2012 Organic Industry Survey.
Supermarket News (2012) Top 75 Retailers & Wholesalers 2012. http://supermarketnews.com/top-75-retailers-wholesalers-2012
Sysco (2012) 2012 Annual Report. http://www.sysco.com/investor/OnlineAnnual2012/
The Produce News (2012). Sysco Canada discusses foodservice produce trends. http://www.producenews.com/index.php/list-all-categories2/7556-sysco-canada-discusses-foodservice-produce-trends
Whole Foods Market (2012) Annual Stakeholders’ Report 2012. http://www.wholefoodsmarket.com/sites/default/files/media/Global/Company%20Info/PDFs/2012-WFM_Annual_Report.pdf
AbOuT cOTA
The Canada Organic Trade Association is the membership-based trade association for the organic sector in Canada, representing growers, shippers, processors, certifiers, farmers’ associations, distributors, importers, exporters, consultants, retailers and others in the organic value chain. COTA’s mission is to promote and protect the growth of organic trade to benefit the environment, farmers, the public and the economy.
cOnTAcT
Matthew Holmes, Executive DirectorCanada Organic Trade Association
[email protected] P (613) 482-1717 F (613) 236-0743
www.ota-canada.ca