Embed Size (px)
Citation preview

Only for Discussion
Not to be Quoted
Baseline Study
August 2015
Growth of Population and Management
BANGLADESH DELTA PLAN 2100
FORMULATION PROJECT
General Economics Division
Planning Commission
Government of Bangladesh

1

2
Title Growth of Population and Management
Subject Baseline Study
Author BanDuDeltAS
Date August 2015
Version Final


Executive Summary
Bangladesh is the 8th largest country in the world by population (157.85 million) and the 94th largest country
in the world by total area (147,570 km2)1. It has one of the highest population densities in the world and is
currently in a critical transitional phase in its economic development. All economic development is
predicated on population demographics and economic development is ultimately about improving the lives
of the general population. All aspects of planning, therefore, from adopting policies to foster economic
growth to building climate change resilient infrastructure to raising education standards to implementing
effective water resource management strategies for agricultural sector growth etc. all depends on the size,
structure, composition and characteristics of the population.
According to the standard population-development model the changes in population occur during the
transition phase between two stable equilibrium states. The first stable equilibrium state is characterized by
high birth and death rates (thus low growth rates). With economic development and increased access to
healthcare services and medical technology death rates tend to fall sharply; however as birth rates follow
cultural and other socioeconomic factors they tend to lag behind the declines in death rates. In very general
terms this causes the population explosion. As birth rates decline, the population starts to stabilize again
and this state is characterized by a higher total population with low birth and death rates (thus low growth
rates). This period of transition, if properly managed and exploited can yield a population dividend that has
far reaching consequences to future prosperity. Bangladesh is currently entering (if it has not already
entered) this critical window of opportunity, thus planning for these probable futures is of vital importance. 2
This study explores the historical trends of the population demographics and attempts to assess the
probable future states of population. The major highlights of the study are as follows:
Population & Population Growth: Bangladesh’s population grew from a little over 50 million in 1961 to over
157 million in 2015. The current annual population growth rate is 1.2% (i.e. approximately 1.88 million
annually). It is projected (according to the Medium Variant, see chapter 6) that by 2025 the population will
be around 178 million and by 2050 it will be around 202 million. Further projections, given certain binding
assumptions, indicate that by 2075 population will drop to 199 million and by 2100 population will fall to
182 million. The changes in total population are just one aspect of the projected changes. A far more
important component is the expected change in the age structure of the population. One of the underlying
assumptions assumes that Total Fertility Rate 3 will continue to fall; however the population momentum
effect will continue to push the population up. This means that in the coming decades the 15-59 age cohort
will account for the majority of the total population.
Implications: On one hand these changes mean that Bangladesh can expect a very large total available
workforce but this also indicates the need for major investment in the education sector in the near future.
The path to sustainable development is through ensuring that this future workforce is highly skilled and
internationally competitive.
1 (World Bank WDI, 2015) 2 (United Nations (UN): Demographic Compponents of Future Population Growth) 3 the average number of children that would be born to a woman over her lifetime if: she were to experience the exact current age-specific fertility
rates (ASFRs) through her lifetime and were to survive from birth through the end of her reproductive life

ii
There are also has significant implications for other policies; for example it will become increasingly
important to ensure that job creation matches this age demographic transition and thus it may be feasible
to promote high employment generating sectors in the medium run switching over to high value sectors
later on as population stabilizes. In the next few decades Bangladesh will also see a significant aging
population. Social security initiatives and similar safety net measures and programs will need to be
implemented to care for this segment of the population. There will also be a significant change in the
cultural and socio-economic makeup of the society. Addressing income and wealth inequalities will become
a major deciding factor in the form these cultural changes take.
In the short to medium run more active manpower export policies may be a viable strategy to reduce
population pressure.
iii
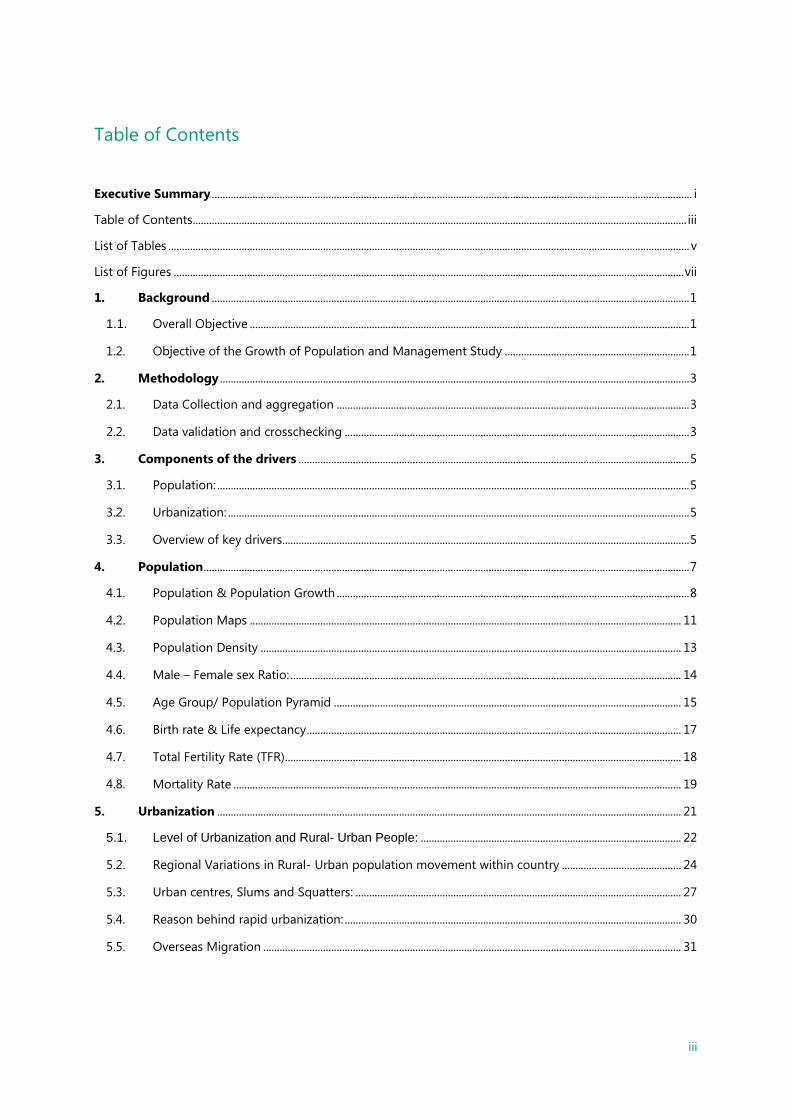
Table of Contents
Executive Summary ................................................................................................................................................................................. i
Table of Contents...................................................................................................................................................................................... iii
List of Tables ................................................................................................................................................................................................ v
List of Figures ............................................................................................................................................................................................ vii
1. Background ................................................................................................................................................................................ 1
1.1. Overall Objective .................................................................................................................................................................. 1
1.2. Objective of the Growth of Population and Management Study .................................................................... 1
2. Methodology ............................................................................................................................................................................. 3
2.1. Data Collection and aggregation .................................................................................................................................. 3
2.2. Data validation and crosschecking ............................................................................................................................... 3
3. Components of the drivers ................................................................................................................................................ 5
3.1. Population: .............................................................................................................................................................................. 5
3.2. Urbanization: .......................................................................................................................................................................... 5
3.3. Overview of key drivers...................................................................................................................................................... 5
4. Population ................................................................................................................................................................................... 7
4.1. Population & Population Growth .................................................................................................................................. 8
4.2. Population Maps ............................................................................................................................................................... 11
4.3. Population Density ........................................................................................................................................................... 13
4.4. Male – Female sex Ratio: ................................................................................................................................................ 14
4.5. Age Group/ Population Pyramid ................................................................................................................................ 15
4.6. Birth rate & Life expectancy .......................................................................................................................................... 17
4.7. Total Fertility Rate (TFR) .................................................................................................................................................. 18
4.8. Mortality Rate ..................................................................................................................................................................... 19
5. Urbanization ........................................................................................................................................................................... 21
5.1. Level of Urbanization and Rural- Urban People: ................................................................................................ 22
5.2. Regional Variations in Rural- Urban population movement within country ............................................ 24
5.3. Urban centres, Slums and Squatters: ........................................................................................................................ 27
5.4. Reason behind rapid urbanization: ............................................................................................................................ 30
5.5. Overseas Migration .......................................................................................................................................................... 31
iv
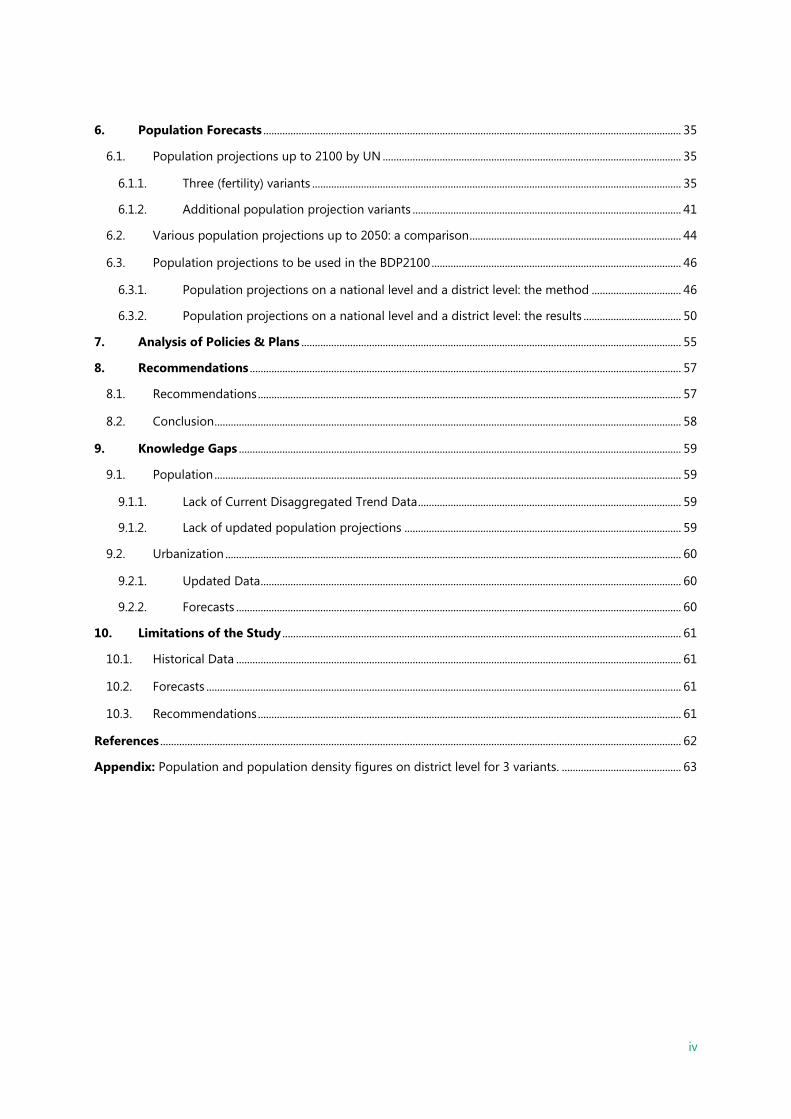
6. Population Forecasts .......................................................................................................................................................... 35
6.1. Population projections up to 2100 by UN .............................................................................................................. 35
6.1.1. Three (fertility) variants ........................................................................................................................................ 35
6.1.2. Additional population projection variants ................................................................................................... 41
6.2. Various population projections up to 2050: a comparison.............................................................................. 44
6.3. Population projections to be used in the BDP2100 ............................................................................................ 46
6.3.1. Population projections on a national level and a district level: the method ................................. 46
6.3.2. Population projections on a national level and a district level: the results .................................... 50
7. Analysis of Policies & Plans ............................................................................................................................................ 55
8. Recommendations ............................................................................................................................................................... 57
8.1. Recommendations ............................................................................................................................................................ 57
8.2. Conclusion ............................................................................................................................................................................ 58
9. Knowledge Gaps ................................................................................................................................................................... 59
9.1. Population ............................................................................................................................................................................ 59
9.1.1. Lack of Current Disaggregated Trend Data ................................................................................................. 59
9.1.2. Lack of updated population projections ...................................................................................................... 59
9.2. Urbanization ........................................................................................................................................................................ 60
9.2.1. Updated Data ........................................................................................................................................................... 60
9.2.2. Forecasts .................................................................................................................................................................... 60
10. Limitations of the Study ................................................................................................................................................... 61
10.1. Historical Data .................................................................................................................................................................... 61
10.2. Forecasts ............................................................................................................................................................................... 61
10.3. Recommendations ............................................................................................................................................................ 61
References ................................................................................................................................................................................................ 62
Appendix: Population and population density figures on district level for 3 variants. ............................................ 63
v
List of Tables
Table 1: Enumerated Population: (Source: BBS: Population & Housing Census 2011 Volumes I to IV (full)) ...... 10
Table 2: Male/Female Population (Source BBS: Population & Housing Census Volumes I to IV (full)).................. 14
Table 3: Facts regarding Urbanization: (Source BBS: Statistical Year Book 1991-2013) .............................................. 24
Table 4: Number of Urban Centres by Census Year and Size Classes (Source Population & Housing Census
Volumes 2011 I to IV (full)) .................................................................................................................................................................. 27
Table 5: Number of slum and cluster between 1997 and 2005 census; by Division (Source: Centre for Urban
Studies 2013) ............................................................................................................................................................................................. 28
Table 6: Number of Slums in Dhaka City 1974- 2005 (Source: BBSCensus of Slum Areas and Floating
Population 1997-2005) ......................................................................................................................................................................... 28
Table 7: Number of slum Households and their % between 1986 and 2005 census ................................................. 29
Table 8: % of male and female In Distribution of population between 1986 and 1997 census ............................. 30
Table 9: Flow of Male and Female migrants from 2004- 2009: (Source BMET & UN) ................................................. 32
Table 10: Intra-country Migration .................................................................................................................................................... 33
Table 11: WB Population projections for Bangladesh, 2001-2051, according to LF and AFT scenario
(summary) .................................................................................................................................................................................................. 44
Table 12: UNFPA Population projections for Bangladesh for three scenarios in the period 2011-2061 (in
millions): a summary .............................................................................................................................................................................. 45
Table 13: Projections Population Bangladesh on division and national level (Medium Variant) selected years
........................................................................................................................................................................................................................ 51
Table 14: Projections Population Bangladesh on division and national level (High Variant) selected years .... 52
Table 15: Projections Population Bangladesh on division and national level (Low Variant) selected years ..... 53

vi
vii
List of Figures
Figure 1: Historical Trend of Population: (Source: BBS Statistical Yearbook 1991-2013) .............................................. 8
Figure 2: Population Growth: (World Bank WDI, 2015)............................................................................................................. 9
Figure 3: Population Growth Rate by Division: (Source: BBS Statistical Yearbook 1991-2013) ................................ 10
Figure 4: Total Population 1991 (Source BBS: Population & Housing Census Volumes I to IV (full)) ..................... 11
Figure 5: Total Population 2001 (Source BBS: Population & Housing Census Volumes I to IV (full)) ..................... 12
Figure 6: Total Population 2011: (Source BBS: Population & Housing Census Volumes I to IV (full)) .................... 12
Figure 8: Population density (1970- 2012) (World Bank WDI, 2015)) ............................................................................... 13
Figure 7: Share of total population: (Source BBS: Population & Housing Census Volumes I to IV (full) ............... 13
Figure 9: Trends in age division from 1981 2011: (BBS: Statistical Year Book 1991-2013) ....................................... 16
Figure 10: Male Female population distribution with age division (Source: BBS: Statistical Year Book 1991-
2013) ............................................................................................................................................................................................................ 16
Figure 11: Crude Birth Rate from 1978- 2011 (Source: World Bank WDI) ........................................................................ 17
Figure 12: Life expectancy trend 1960- 2012: (Source: World Bank WDI ......................................................................... 17
Figure 13: Total Fertility rate at national level Source BBS: Statistical Year Book 1991-2013 ................................... 18
Figure 14: TFR by residence level 1997- 2011: (Source BBS: Statistical Year Book 1991-2013) ............................... 18
Figure 15: Crude death rate (1981-2011) (Source BBS: Statistical Year Book 1991-2013) ......................................... 20
Figure 16: Childhood Mortality rates (1979-2011) (Source BBS: Statistical Year Book 1991-2013) & BDHS
2005-2007 .................................................................................................................................................................................................. 20
Figure 17: Total Rural and Urban Population Trend ................................................................................................................. 23
Figure 18: Level of Urbanization 1981- 2011 .............................................................................................................................. 23
Figure 19: Change in rural – urban population in Eastern & Western divisions (Source BBS: Statistical Year
Book 1991-2013) ..................................................................................................................................................................................... 25
Figure 20: Map of Urban Centres (Source Center for Urban Studies-2013) ..................................................................... 27
Figure 21: Overseas employment 1976- 2014 ............................................................................................................................ 31
Figure 22: Total population in Bangladesh up to 2100 for three projection variants ................................................ 36
Figure 23: Total Population by variant ........................................................................................................................................... 36
Figure 24: Total population in Bangladesh by age groups and sex (absolute numbers: in millions) for
medium variant ........................................................................................................................................................................................ 37
Figure 25: Population growth (in % annually) for the past as well as the future up to 2050 .................................. 39
Figure 26: Urban and Rural Population Projections Medium Variant up to 2050 ........................................................ 40
Figure 27: Urban and Rural Population projections added up (medium variant up to 2050) ................................. 41
Figure 28: Additional population projection variants for Bangladesh up to 2100, based on the standard
(medium variant) ..................................................................................................................................................................................... 43


1
1. Background
Bangladesh sits in southern Asia, on the delta of two largest rivers on the Indian subcontinent—the Ganges
and Jamuna (Brahmaputra). It borders with India in the west, north, and east, Myanmar in the southeast, and
with the Bay of Bengal in the south. The country's area is 144,000 square kilometers (55,598 square miles),
and it is divided into 7 administrative divisions (Dhaka, Chittagong, Khulna, Barisal, Rajshai, Rangpur and
Sylhet). Bangladesh is approximately the size of the state of Iowa in the US, yet as of 2014, the population
stands at approximately 157 million4.
Since the 1960s the size of population within the country has almost doubled and changing 209 percent
during the last 50 years.5 Population in Bangladesh averaged 99.09 Million from 1960 until 2013, reaching
an all time high of 154.70 Million in 2013 and a record low of 50.10 Million in 19606. In 2000 the birth rate
stood at 25.44 per 1,000 (slightly higher than the world average), adding around 190,000 people every
month. Meanwhile the death rate stood at 8.73 per 1,000. The estimated population growth rate is 1.59
percent, and if the current trend remains unchanged, the population could double within the next 45 years.
Addressing the future challenges specifically with growing pressure of population and its management,
Bangladesh will require a strategic plan with a long term horizon of 100 years, while short term results are
needed to solve urgent problems, and to gain widespread socio-political support for Bangladesh Delta Plan
2100. Thus, in our approach, we emphasize on the population factors which play a critical role in this
planning exercise and overall resource allocation of the country to manage.
This report focuses on population aspects in Bangladesh, presenting a set of key areas within population.
The rationale behind inclusion of urbanization is due to the critical role it plays in terms of intra and inter
migration aspects. The management aspects of population to a greater aspect has been dealt with within
the spatial planning baseline study. While attempts have been made to provide the most updated and
validated information and data with regards to each driver, it is important to note that this report is not
based on primary data collection, as a result of which, it may present some level inconsistencies, but we
have addressed these in our approach.
This document, while exhaustive in terms of information and analysis, should be treated as a living
document and updated.
1.1. Overall Objective
The overall objective of the project on the formulation of BDP 2100 is to realize a sustainable and commonly
agreed strategy with all relevant stakeholders for an optimum level of water safety and food security, as well
as sustained economic growth of Bangladesh and a framework for its implementation.
1.2. Objective of the Growth of Population and Management Study
4 (World Bank WDI, 2015) 5 (Bangladesh Bureau of Statistics, 1991-2015), (World Bank WDI, 2015) 6 Bangladesh Bureau of Statistics

2
The broader objective of this baseline is to provide an overview of the population and the related aspects
with regards to management, which we define as urbanization to some extent. These drivers were analyzed
on the basis of their relevance, impact levels, among others. The objectives of the thematic baseline study
within the context of socio-economic analysis therefore include:
Identification, evaluation and assessment of the population elements and factors
Identification of key plans
To establish a strong basis for all thematic areas in the BDP 2100 given the relevance of population
in all themes and broader objectives of BDP2100

3
2. Methodology
As discussed in the previous chapter, this study aims to provide an overview of historical trends in case of
population and urbanization. The analysis of these historical trends will show the broad evolution of
Bangladesh since Independence and the patterns of growth and development that provide the context for
any plan for the future. The methodology of this study consists of three major phases.
2.1. Data Collection and aggregation
As primary data collection is far beyond the scope of this study, the data collection, research and analysis
efforts focused on desk research and secondary data collection from publically available, official and/or
government approved sources. An important consideration that needs to be taken into account is the issue
of comparability. That is to say, whatever data is collected, from whatever source, it is of the primary
importance that the basic terms and definitions used across the drivers are common. For example, it must
be assured that the period of historical trends are the same, viz. from 1970 to present. Though in some
cases, such as using data from the Population Censuses, the data was available decade wise, the year to year
trend will be the basic format that is to be followed.
2.2. Data validation and crosschecking
Though the main sources of data were official and government databases/reports, validation and
crosschecking is the hallmark of all sound research. Thus data on the same variables will be collected from
different sources; in cases of conflict official BBS/Government data will be considered to be preferable
However the veracity and accuracy of all secondary research depends entirely on the soundness of the
primary research that was undertaken, it is, again, beyond the scope of this report to assess the quality of
the primary research.
In this study, the historical trend analysis focuses on outlining the general trends and indicating major
events and policy decisions that have a degree of explanatory power in the context of the specific variables.
Changes in the general trends outlined and as much relevant linkages and patterns will be referenced as
possible. The goal is to provide an overview and establish a sensible narrative that tries to explain the trends
observed.

4
5
3. Components of the drivers
3.1. Population:
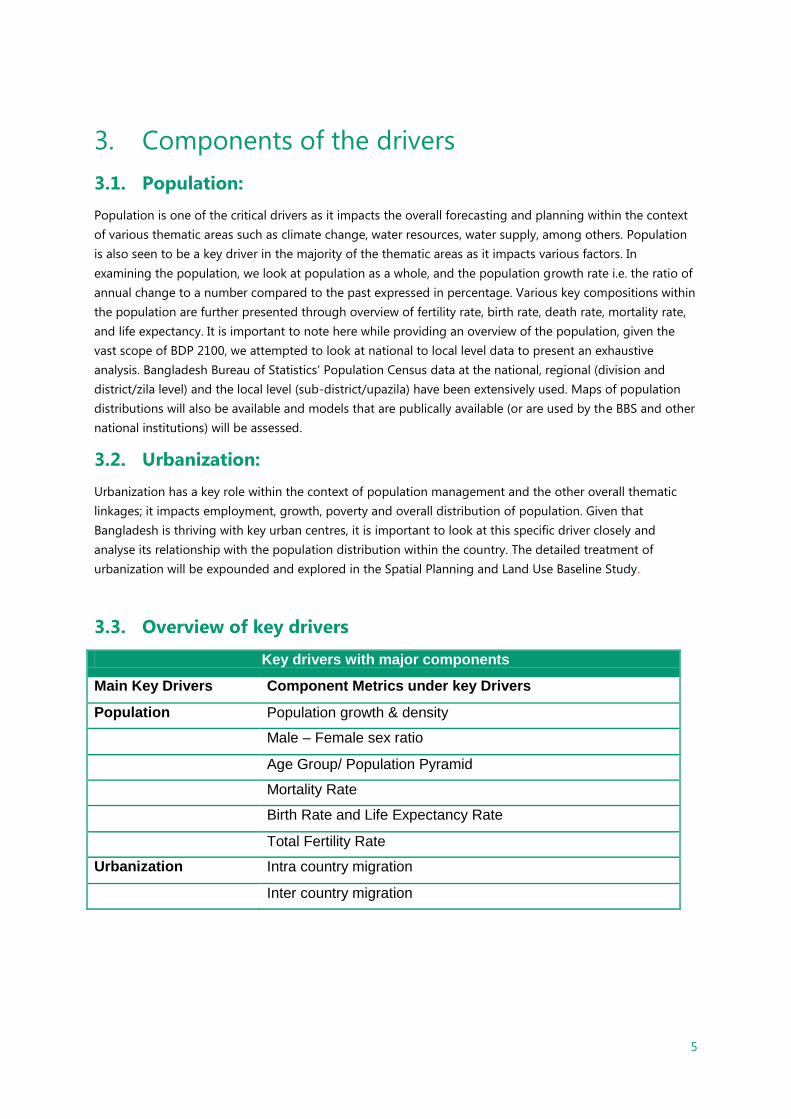
Population is one of the critical drivers as it impacts the overall forecasting and planning within the context
of various thematic areas such as climate change, water resources, water supply, among others. Population
is also seen to be a key driver in the majority of the thematic areas as it impacts various factors. In
examining the population, we look at population as a whole, and the population growth rate i.e. the ratio of
annual change to a number compared to the past expressed in percentage. Various key compositions within
the population are further presented through overview of fertility rate, birth rate, death rate, mortality rate,
and life expectancy. It is important to note here while providing an overview of the population, given the
vast scope of BDP 2100, we attempted to look at national to local level data to present an exhaustive
analysis. Bangladesh Bureau of Statistics’ Population Census data at the national, regional (division and
district/zila level) and the local level (sub-district/upazila) have been extensively used. Maps of population
distributions will also be available and models that are publically available (or are used by the BBS and other
national institutions) will be assessed.
3.2. Urbanization:
Urbanization has a key role within the context of population management and the other overall thematic
linkages; it impacts employment, growth, poverty and overall distribution of population. Given that
Bangladesh is thriving with key urban centres, it is important to look at this specific driver closely and
analyse its relationship with the population distribution within the country. The detailed treatment of
urbanization will be expounded and explored in the Spatial Planning and Land Use Baseline Study.
3.3. Overview of key drivers
Key drivers with major components
Main Key Drivers Component Metrics under key Drivers
Population Population growth & density
Male – Female sex ratio
Age Group/ Population Pyramid
Mortality Rate
Birth Rate and Life Expectancy Rate
Total Fertility Rate
Urbanization Intra country migration
Inter country migration

6

7
4. Population
Bangladesh, the 8th most populated country in the world7, has encountered a massive population boom in
the past few decades, going from approximately 50 million in 1960 to approximately 157 million in 2015.
The country is now experiencing a demographic transition and the continuous decline of the total fertility
rate should lead to a lower population increase and a change in the demographic composition in the
coming decades. Major demographic characteristics have been provided below:
7 (World Bank WDI, 2015)
Population –157
Million(BBS, 2015)
Population Growth – 1.37
(BBS, 2011)
Population Density –
1,015/km (BBS 2011)
Sex Ratio – 100.3 & Life Expectancy
68 years (BBS, 2011)
Infant Mortality rate- 50.13 (BBS,
2011)
Total Fertility Rate – 2.1 (BBS,
2011)
Birth Rate & Death Rate –17.88 & 4.79 (BBS, 2011)
8
Historical Trend of major metrics
4.1. Population & Population Growth
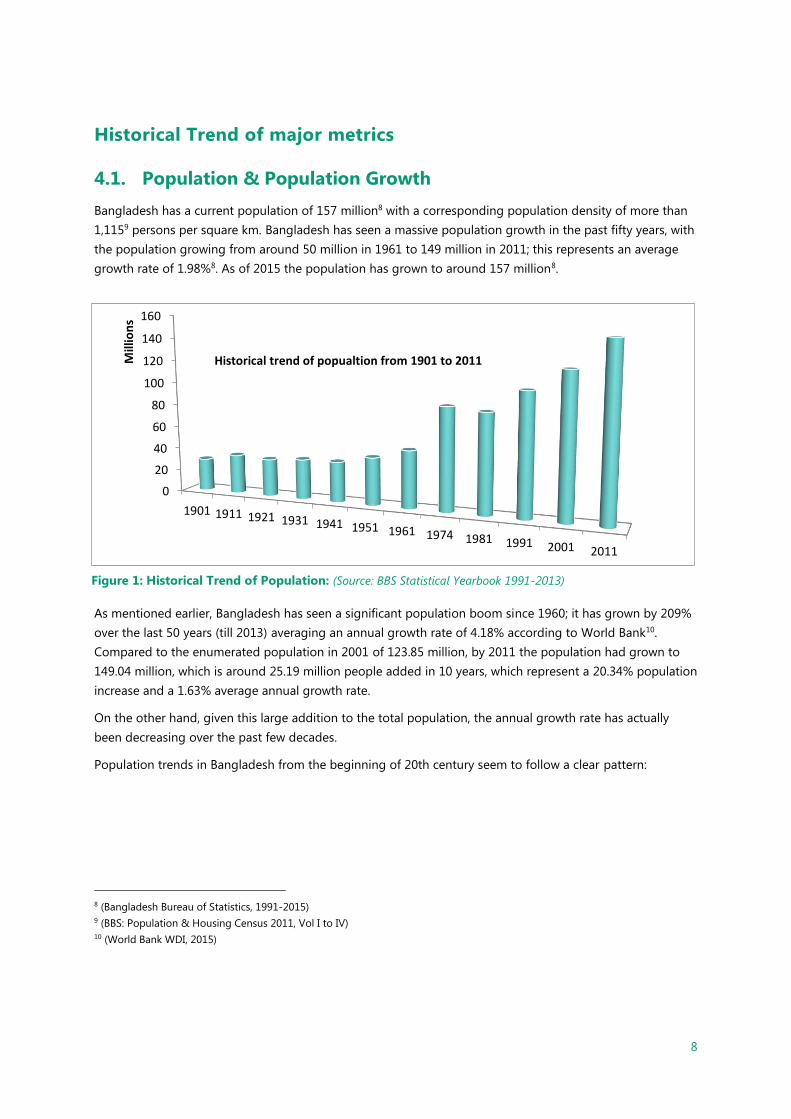
Bangladesh has a current population of 157 million8 with a corresponding population density of more than
1,1159 persons per square km. Bangladesh has seen a massive population growth in the past fifty years, with
the population growing from around 50 million in 1961 to 149 million in 2011; this represents an average
growth rate of 1.98%8. As of 2015 the population has grown to around 157 million8.
As mentioned earlier, Bangladesh has seen a significant population boom since 1960; it has grown by 209%
over the last 50 years (till 2013) averaging an annual growth rate of 4.18% according to World Bank10.
Compared to the enumerated population in 2001 of 123.85 million, by 2011 the population had grown to
149.04 million, which is around 25.19 million people added in 10 years, which represent a 20.34% population
increase and a 1.63% average annual growth rate.
On the other hand, given this large addition to the total population, the annual growth rate has actually
been decreasing over the past few decades.
Population trends in Bangladesh from the beginning of 20th century seem to follow a clear pattern:
8 (Bangladesh Bureau of Statistics, 1991-2015) 9 (BBS: Population & Housing Census 2011, Vol I to IV) 10 (World Bank WDI, 2015)
0
20
40
60
80
100
120
140
160
1901 1911 1921 1931 1941 1951 1961 1974 1981 1991 2001 2011
Mill
ion
s
Historical trend of popualtion from 1901 to 2011
Figure 1: Historical Trend of Population: (Source: BBS Statistical Yearbook 1991-2013)
9
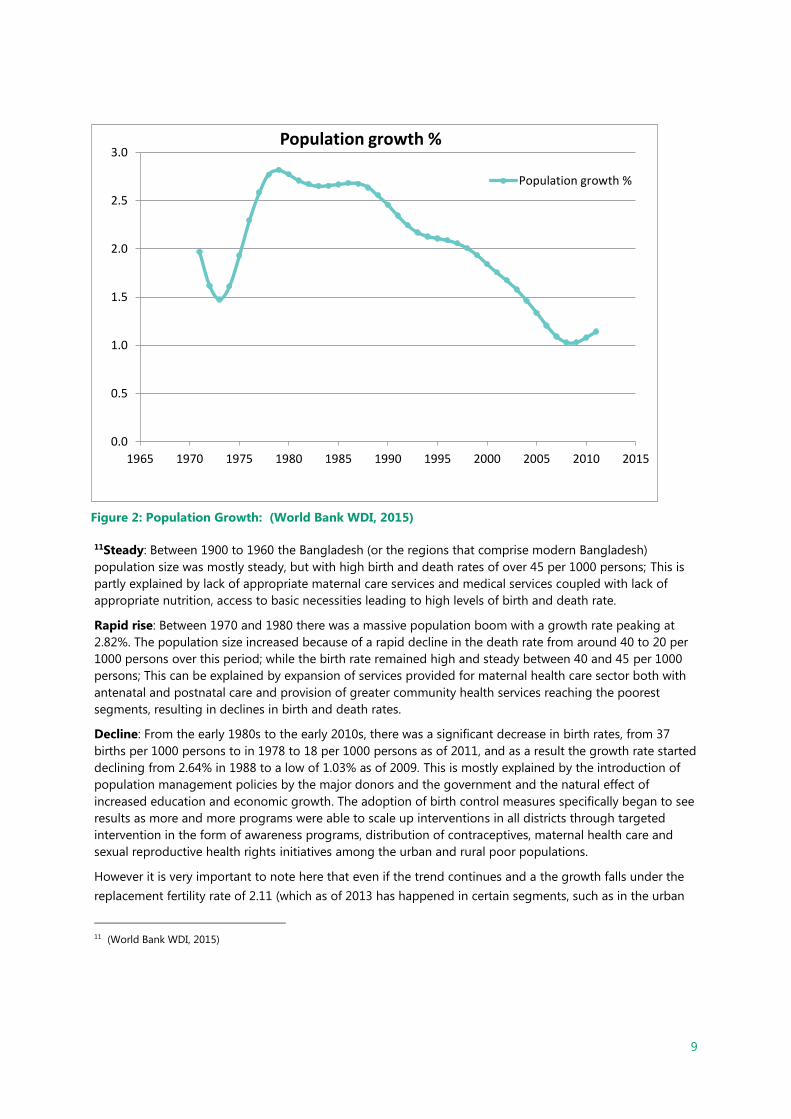
11Steady: Between 1900 to 1960 the Bangladesh (or the regions that comprise modern Bangladesh)
population size was mostly steady, but with high birth and death rates of over 45 per 1000 persons; This is
partly explained by lack of appropriate maternal care services and medical services coupled with lack of
appropriate nutrition, access to basic necessities leading to high levels of birth and death rate.
Rapid rise: Between 1970 and 1980 there was a massive population boom with a growth rate peaking at
2.82%. The population size increased because of a rapid decline in the death rate from around 40 to 20 per
1000 persons over this period; while the birth rate remained high and steady between 40 and 45 per 1000
persons; This can be explained by expansion of services provided for maternal health care sector both with
antenatal and postnatal care and provision of greater community health services reaching the poorest
segments, resulting in declines in birth and death rates.
Decline: From the early 1980s to the early 2010s, there was a significant decrease in birth rates, from 37
births per 1000 persons to in 1978 to 18 per 1000 persons as of 2011, and as a result the growth rate started
declining from 2.64% in 1988 to a low of 1.03% as of 2009. This is mostly explained by the introduction of
population management policies by the major donors and the government and the natural effect of
increased education and economic growth. The adoption of birth control measures specifically began to see
results as more and more programs were able to scale up interventions in all districts through targeted
intervention in the form of awareness programs, distribution of contraceptives, maternal health care and
sexual reproductive health rights initiatives among the urban and rural poor populations.
However it is very important to note here that even if the trend continues and a the growth falls under the
replacement fertility rate of 2.11 (which as of 2013 has happened in certain segments, such as in the urban
11 (World Bank WDI, 2015)
0.0
0.5
1.0
1.5
2.0
2.5
3.0
1965 1970 1975 1980 1985 1990 1995 2000 2005 2010 2015
Population growth %
Population growth %
Figure 2: Population Growth: (World Bank WDI, 2015)
10
population including the urban poor segment) the population will not stabilize for several decades because
of the backlog effect or population momentum created by the "bulge" in younger age groups moving
towards parenthood12.
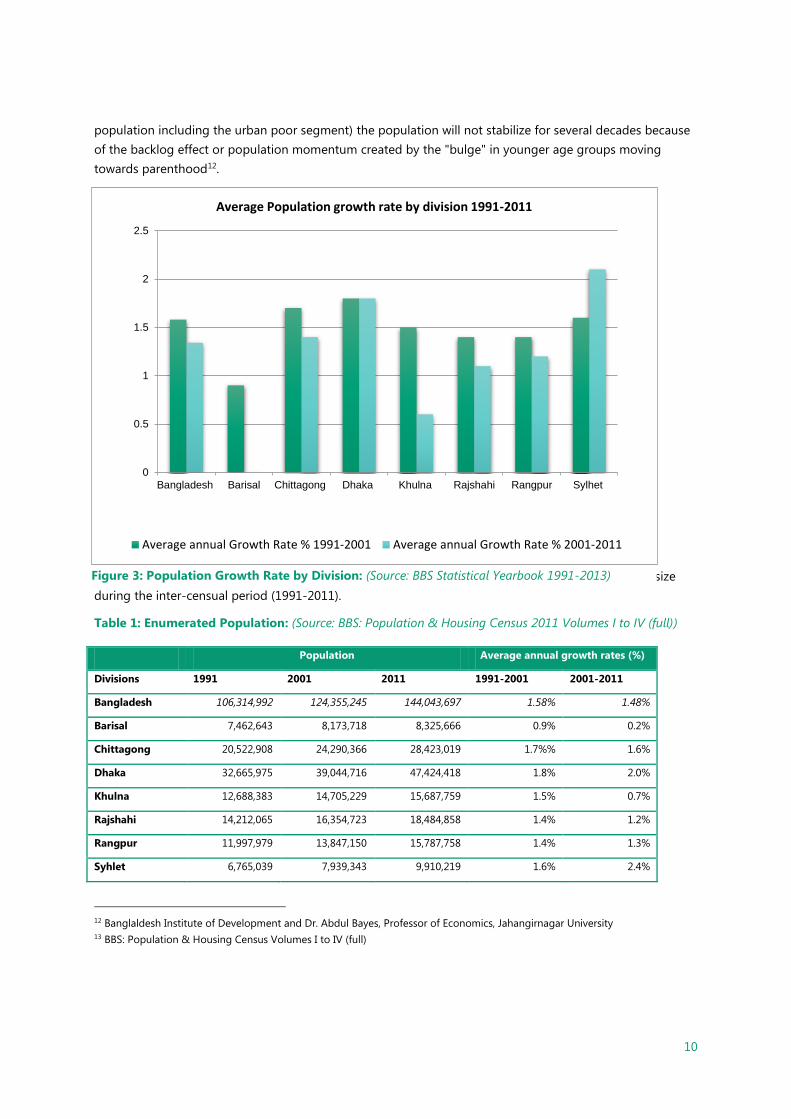
13Based on the division level data, a large distinction is observed regarding the change in population size
during the inter-censual period (1991-2011).
Table 1: Enumerated Population: (Source: BBS: Population & Housing Census 2011 Volumes I to IV (full))
Population Average annual growth rates (%)
Divisions 1991 2001 2011 1991-2001 2001-2011
Bangladesh 106,314,992 124,355,245 144,043,697 1.58% 1.48%
Barisal 7,462,643 8,173,718 8,325,666 0.9% 0.2%
Chittagong 20,522,908 24,290,366 28,423,019 1.7%% 1.6%
Dhaka 32,665,975 39,044,716 47,424,418 1.8% 2.0%
Khulna 12,688,383 14,705,229 15,687,759 1.5% 0.7%
Rajshahi 14,212,065 16,354,723 18,484,858 1.4% 1.2%
Rangpur 11,997,979 13,847,150 15,787,758 1.4% 1.3%
Syhlet 6,765,039 7,939,343 9,910,219 1.6% 2.4%
12 Banglaldesh Institute of Development and Dr. Abdul Bayes, Professor of Economics, Jahangirnagar University 13 BBS: Population & Housing Census Volumes I to IV (full)
0
0.5
1
1.5
2
2.5
Bangladesh Barisal Chittagong Dhaka Khulna Rajshahi Rangpur Sylhet
Average Population growth rate by division 1991-2011
Average annual Growth Rate % 1991-2001 Average annual Growth Rate % 2001-2011
Figure 3: Population Growth Rate by Division: (Source: BBS Statistical Yearbook 1991-2013)

11
After Sylhet, Dhaka and Chittagong divisions have the highest growth rate. Khulna (0.6%) has shown the
least growth rate after Barisal (less than 0.1%) where Rajshahi & Rangpur has similar rate of growth.
This is explained by the fast growing urban centres and the trend of more and more segments moving into
these cities as result of increased demand and supply for jobs. In districts such as Barisal, extreme poverty
and lack of access to proper health facilities due to poor infrastructure plays a critical role. It is important to
note however that that increased aid and development efforts being targeted in Barisal through market
development approaches and projects is likely to change the scene in the coming years.
4.2. Population Maps
The following three maps show the change in the population up the Zila levels generated using data from
the BBS Population Census from 1991, 2001 and 2011. These maps clearly show which zilas in Bangladesh
experienced the highest population growth between 1991 to 2011.
Figure 4: Total Population 1991 (Source BBS: Population & Housing Census Volumes I to IV (full))

12
Figure 5: Total Population 2001 (Source BBS: Population & Housing Census Volumes I to IV (full))
Figure 6: Total Population 2011: (Source BBS: Population & Housing Census Volumes I to IV (full))
13
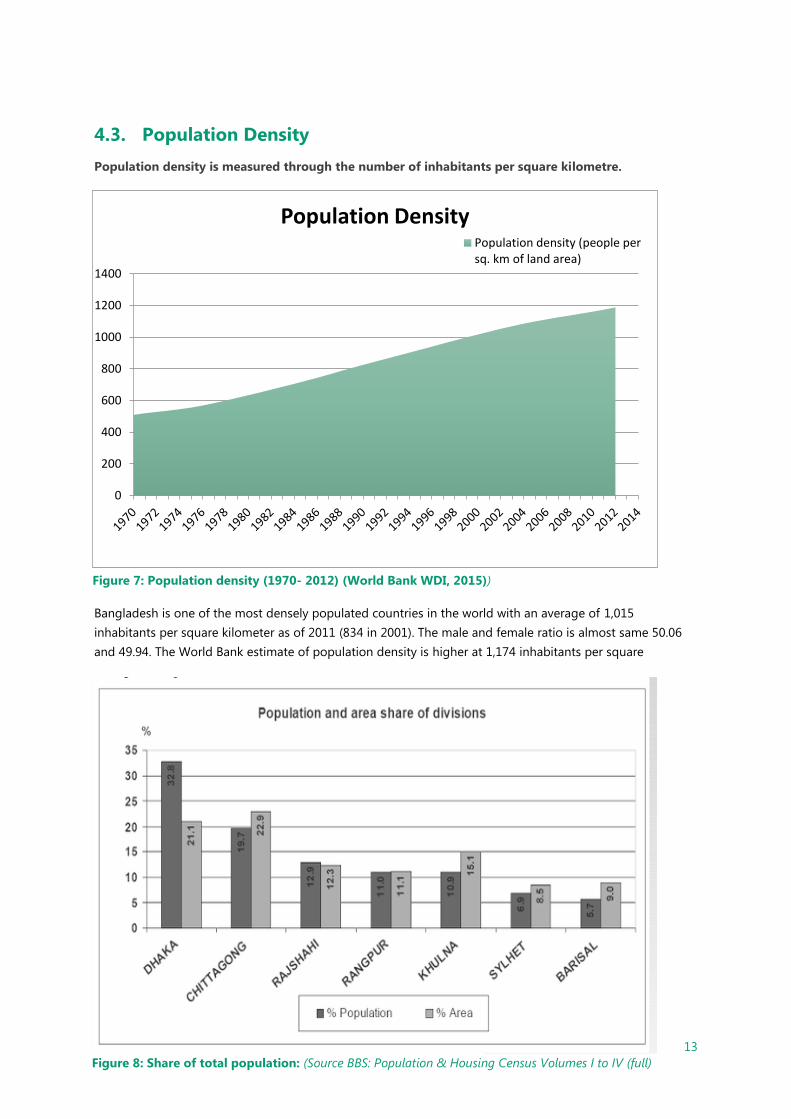
4.3. Population Density
Population density is measured through the number of inhabitants per square kilometre.
Bangladesh is one of the most densely populated countries in the world with an average of 1,015
inhabitants per square kilometer as of 2011 (834 in 2001). The male and female ratio is almost same 50.06
and 49.94. The World Bank estimate of population density is higher at 1,174 inhabitants per square
0
200
400
600
800
1000
1200
1400
Population DensityPopulation density (people persq. km of land area)
Figure 7: Population density (1970- 2012) (World Bank WDI, 2015))
Figure 8: Share of total population: (Source BBS: Population & Housing Census Volumes I to IV (full)
14
kilometer in 2011 (1,035 in 2001)14
Between divisions and districts significant disparities has been observed. At the division level, the density
figures range from 1,502 inhabitants per square kilometre in Dhaka division to 613 in the Barisal division.
At the district level, the highest density is found in Dhaka (8,111 inhabitants / km2) and Narayanganj (4,139)
districts, and the lowest in Bandarban district (86) (based on population density map 2011, 2001 & 1991).
After Dhaka, Chittagong division accommodates 19.7% of the population on 22.9% of the country area.
The explanation for the sharp increase of population density is due to the fact that population growth
soared whereas the available land is fixed. The density disparities between divisions and districts are due to
increased job opportunities and demand for jobs as a result of urbanization leading to movement into
urban centres. Rapid industrialization during the 1990s and continued growth explains much of the rise in
this density in the major urban centres such as Dhaka and Chittagong.
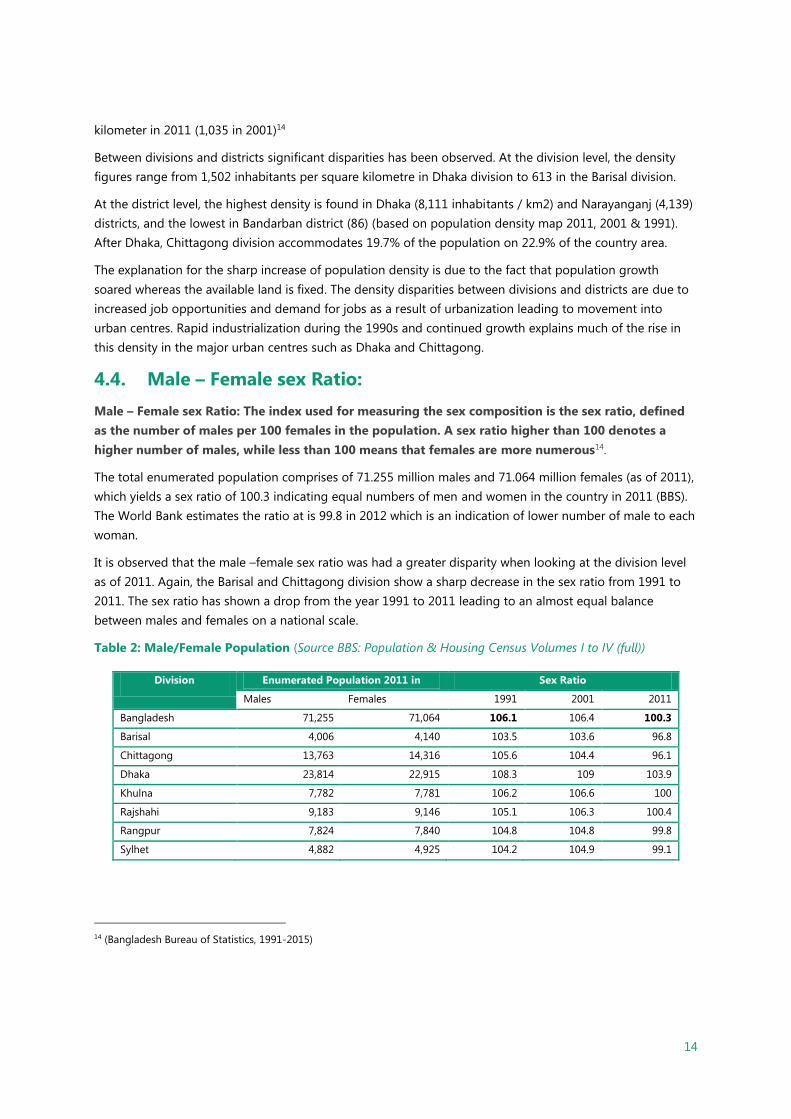
4.4. Male – Female sex Ratio:
Male – Female sex Ratio: The index used for measuring the sex composition is the sex ratio, defined
as the number of males per 100 females in the population. A sex ratio higher than 100 denotes a
higher number of males, while less than 100 means that females are more numerous14.
The total enumerated population comprises of 71.255 million males and 71.064 million females (as of 2011),
which yields a sex ratio of 100.3 indicating equal numbers of men and women in the country in 2011 (BBS).
The World Bank estimates the ratio at is 99.8 in 2012 which is an indication of lower number of male to each
woman.
It is observed that the male –female sex ratio was had a greater disparity when looking at the division level
as of 2011. Again, the Barisal and Chittagong division show a sharp decrease in the sex ratio from 1991 to
2011. The sex ratio has shown a drop from the year 1991 to 2011 leading to an almost equal balance
between males and females on a national scale.
Table 2: Male/Female Population (Source BBS: Population & Housing Census Volumes I to IV (full))
Division Enumerated Population 2011 in
thousands
Sex Ratio
Males Females 1991 2001 2011
Bangladesh 71,255 71,064 106.1 106.4 100.3
Barisal 4,006 4,140 103.5 103.6 96.8
Chittagong 13,763 14,316 105.6 104.4 96.1
Dhaka 23,814 22,915 108.3 109 103.9
Khulna 7,782 7,781 106.2 106.6 100
Rajshahi 9,183 9,146 105.1 106.3 100.4
Rangpur 7,824 7,840 104.8 104.8 99.8
Sylhet 4,882 4,925 104.2 104.9 99.1
14 (Bangladesh Bureau of Statistics, 1991-2015)

15
According to the BBS Population Census 2011, Bangladesh has experienced an interesting change in the sex
composition of its population, in the last decade. A six point decrease of the sex ratio from 2001 to 2011
represents a difference of 4 million people (fewer male and/or more female). An explanation for such a
phenomenon may be found in a conjunction of several factors listed below, whose respective influence
cannot be measured yet. Possible reasons for the drastic sex ratio fall that we observe over the last decade
are:
a significant increase of external emigration, mainly concerning males;
an improved census coverage of the female population;
the already documented important decrease of maternal mortality;
possibly also the female child mortality decreasing faster than the male ;
differences in life expectancy levels and gains, both in favour of females;15
4.5. Age Group/ Population Pyramid
Age Group/ Population Pyramid: The age structure or composition of a population is the distribution
by age of the population.
Population momentum: The phenomenon of a large number of young people at reproductive age
engendering a further increase in total population numbers is called population momentum.
The demographic structure of Bangladesh’s population suggests that its population will continue to grow
for decades to come due to the population momentum (as more than 33 percent of the total population is
under the age of 15) inherent in the young age structure, even if replacement level fertility is achieved by
the year 2015. The standard demographic transition model that tries to explain how the population
structure of a country changes over time posits that all countries at one point in their development pass
through a state in which the population is stable with high birth and death rates (i.e. a low population
growth rate) through stages with changing birth and death rates to an end state where the population is
again stable with low birth and death rates (i.e. a low population growth rate again). The rapid population
growth occurs during the transition phases between one stable state to the other. The demographic
transition model thus indicates that the main challenge facing Bangladesh is how to ensure this change in
stable population levels while ensuring that the average standard of living is held steady if not improved.
Furthermore, population projections show that the structure of the population, i.e. the total size of the age
cohort that comprises the population will drastically change. The coming decades will not only see the
growth of an aging population but also a very large population that will comprise the available working
population. Ensuring that there are policies and initiatives in place that answer to education and job creation
needs of this age cohort is vital to future growth and prosperity.
That being said, the rest of this chapter focuses on the historical trends of population demographics
15 (BBS: Population & Housing Census 2011, Vol I to IV)

16
0%
5%
10%
15%
20%
Total Male Female Total Male Female Total Male Female Total Male Female
1981 1991 2001 2011
Male - Female distribution with Age Division 1981- 2011
0-4
5-9
10-14
15-24
25-24
35-44
45-59
60+
The under age (<15) population has declined from 46.7% in 1981 to 33.41% in 2011 due to a reduction in
fertility
The proportion of population in the economically active age group (15-59) has marked an increase from
47.7% in 1981 to 57.03% in 2011 with a gradual increase. This can create a virtual cycle of growth, known
as demographic dividend.
There is a slight increase in the proportion of older population (>60) from 5.63% in 1981 to 7.40% in 2011.
Thus Age-dependency ratio of the population has increased also which implies that there has been an
increase in the life expectancy at birth 2011 (68 years).
0%
10%
20%
30%
40%
50%
60%
1981 1991 1995 1996 2001 2011
Population Composition by age cohort
0-1515-5960+
Figure 9: Trends in age division from 1981 2011: (BBS: Statistical Year Book 1991-2013)
Figure 10: Male Female population distribution with age division (Source: BBS: Statistical Year Book 1991-
2013)

17
4.6. Birth rate & Life expectancy
Crude birth rate indicates the number of live births occurring during the year, per 1,000 populations
estimated at midyear.
The value for Birth rate,
crude (per 1,000 people)
in Bangladesh was 17.88
as of 2011. As the graph
below shows, over the
past 30 years this
indicator reached a
maximum value of 37 in
1978 and a minimum
value of 17.88 in 2011.
The value for Life expectancy at
birth, total (years) in Bangladesh
was 68.94 as of 2011. As the graph
below shows, over the past 51 years
this indicator reached a maximum
value of 68.94 in 2011 and a
minimum value of 38.97 in 197216.
Life expectancy trend has been
increasing because of increased
access to healthcare services and
medical technology.
From the late 1970s the expansion
of health and family planning services
has drastically increased.
From the late 1980s large government initiatives have expanded the role of urban health care and access to
efficient drugs has increased in the general population.
Continuing this trend, from the early 1990s community health services insurance schemes were started,
initiative has taken to eradicate several treatable diseases and has good successes in reducing morbidity,
TFR, mortality, birth rate. From the late 1990s to present a greater emphasis on primary health care and
greater coverage to the poor has reduced the birth rate, and led to increased life expectancy. Access to
16 Bangladesh Bureau of Statistics and World Bank
0
10
20
30
40Birth rate, crude (per 1,000 people)
Figure 11: Crude Birth Rate from 1978- 2011 (Source: World Bank WDI)
Figure 12: Life expectancy trend 1960- 2012: (Source: World
Bank WDI
18
better family planning methods, higher rates of female education, women getting married at a later age has
all resulted in the lower birth rate in Bangladesh.
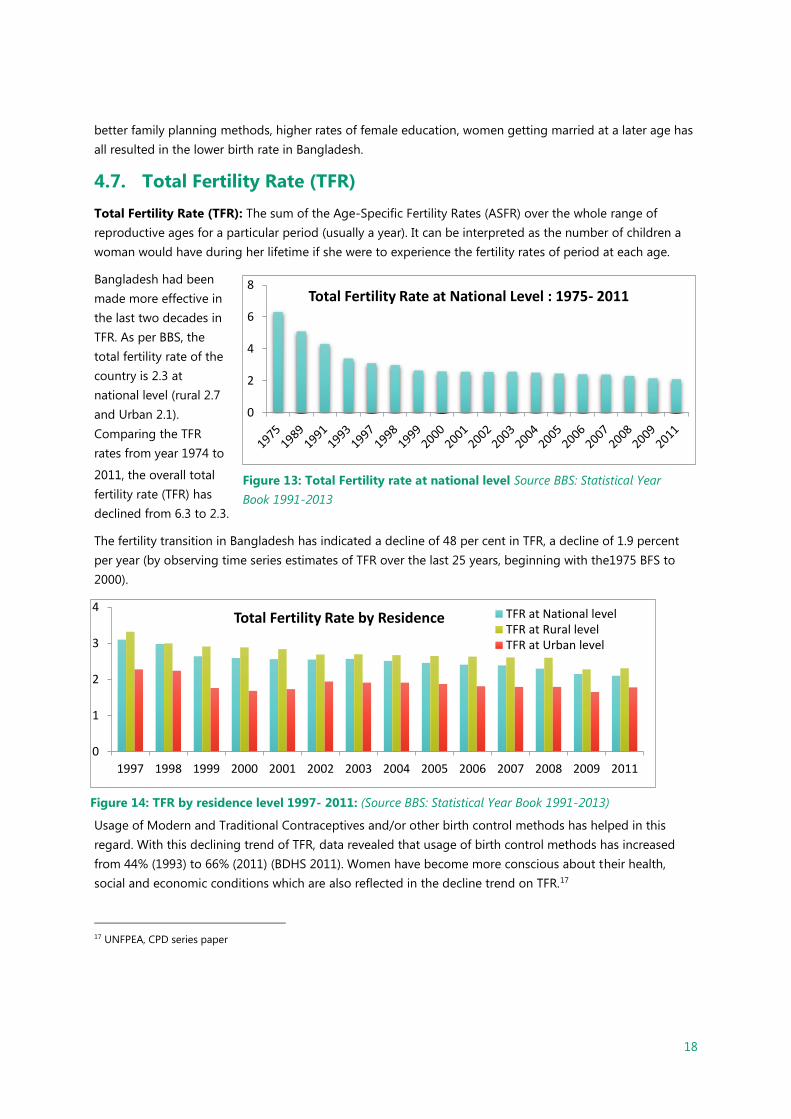
4.7. Total Fertility Rate (TFR)
Total Fertility Rate (TFR): The sum of the Age-Specific Fertility Rates (ASFR) over the whole range of
reproductive ages for a particular period (usually a year). It can be interpreted as the number of children a
woman would have during her lifetime if she were to experience the fertility rates of period at each age.
Bangladesh had been
made more effective in
the last two decades in
TFR. As per BBS, the
total fertility rate of the
country is 2.3 at
national level (rural 2.7
and Urban 2.1).
Comparing the TFR
rates from year 1974 to
2011, the overall total
fertility rate (TFR) has
declined from 6.3 to 2.3.
The fertility transition in Bangladesh has indicated a decline of 48 per cent in TFR, a decline of 1.9 percent
per year (by observing time series estimates of TFR over the last 25 years, beginning with the1975 BFS to
2000).
Usage of Modern and Traditional Contraceptives and/or other birth control methods has helped in this
regard. With this declining trend of TFR, data revealed that usage of birth control methods has increased
from 44% (1993) to 66% (2011) (BDHS 2011). Women have become more conscious about their health,
social and economic conditions which are also reflected in the decline trend on TFR.17
17 UNFPEA, CPD series paper
0
2
4
6
8Total Fertility Rate at National Level : 1975- 2011
0
1
2
3
4
1997 1998 1999 2000 2001 2002 2003 2004 2005 2006 2007 2008 2009 2011
Total Fertility Rate by Residence TFR at National levelTFR at Rural levelTFR at Urban level
Figure 13: Total Fertility rate at national level Source BBS: Statistical Year
Book 1991-2013
Figure 14: TFR by residence level 1997- 2011: (Source BBS: Statistical Year Book 1991-2013)

19
The yearly trend shows that the TFR has decreased in Rural Areas from 3.32 (1991) to 2.28 (2009) but then
rose to 2.7 (2011). In the same manner in the Urban Areas the TFR decreased to 1.65 (2009) from 2.28 (1997)
but then it increased to 2.1 (2011).18
Although the overall TFR has declined, it should be noted that there are regional disparities here. For
example, in the Khulna Division in the southwest, the TFR estimated at two children per woman and has
therefore already reached the replacement level of 2.2. In the Khulna Division in the southwest, for example,
the TFR is estimated at two children per woman and has, therefore, already reached the designated
replacement level of 2.2. In the Sylhet Division in the northeast, on the other hand, the TFR reached levels of
up to 3.7 children per woman in 2006. Given these regional disparities and the exceptionally high
population density, further reductions in regional and national fertility rates are still high on the agenda of
policy makers.
The number of Bangladeshi women who use contraception has stagnated in recent years. Since 2000, only
54 to 56 percent of currently married women use a method of contraception. Added to this, almost 60
percent of contraceptive users discontinue using their chosen method within the first 12 months of use.
Why the fertility increased between 2001 and 2011 even though there has been significant success of family
planning is a matter for further investigation. The contraceptive prevalence rates in these regions where
family planning has been very successful either remained same (Rajshahi) or increased only slightly (Khulna).
Similarly, prevalence of modern methods remained same in these regions, during 1996 -99. (UNFPA)
In 2011, fertility was lowest in the Khulna division (1.9 births per woman), followed by Rajshahi and Rangpur
at 2.1 births per woman, and highest in Sylhet (3.1 births per woman) and Chittagong (2.8 births per
women). Current health, population, and nutrition sector development programs (HPNSDP) aims to reduce
fertility to 2.0 births per woman by 2016, in Bangladesh. Khulna has reached that level already, and Rajshahi
and Rangpur are very close.19
4.8. Mortality Rate
Mortality Rate20: is a measure of the number of deaths (in general, or due to a specific cause) in a
population, scaled to the size of that population, per unit of time. Indicators those are used for this study
are:
Crude Death Rate (CDR): The crude death rate (CDR) is the number of deaths per 1000 midyear population
in a given year. Crude death rate indicates the number of deaths occurring during the year, per 1,000
populations estimated at midyear. Subtracting the crude death rate from the crude birth rate provides the
rate of natural increase, which is equal to the rate of population change in the absence of migration.
Under 5 Mortality Rate: Under-five mortality rate is defined as the number of deaths among children in
age 1-4 per 1000 mid-year population in the same age group.
Child mortality: The probability of a child dying between the first and fifth birthday;
18 BDHS 2011, 2007, 2005 19 BDHS 2011 20 Definitions are based on Bangladesh Bureau of Statistics
20
0
2
4
6
8
10
12
14
19
82
19
84
19
86
19
88
19
90
19
92
19
94
19
96
19
98
20
00
20
02
20
04
20
06
20
08
20
11
Crude Death Rate
0
50
100
150
200 Childhood Mortality Infant MortalityRate
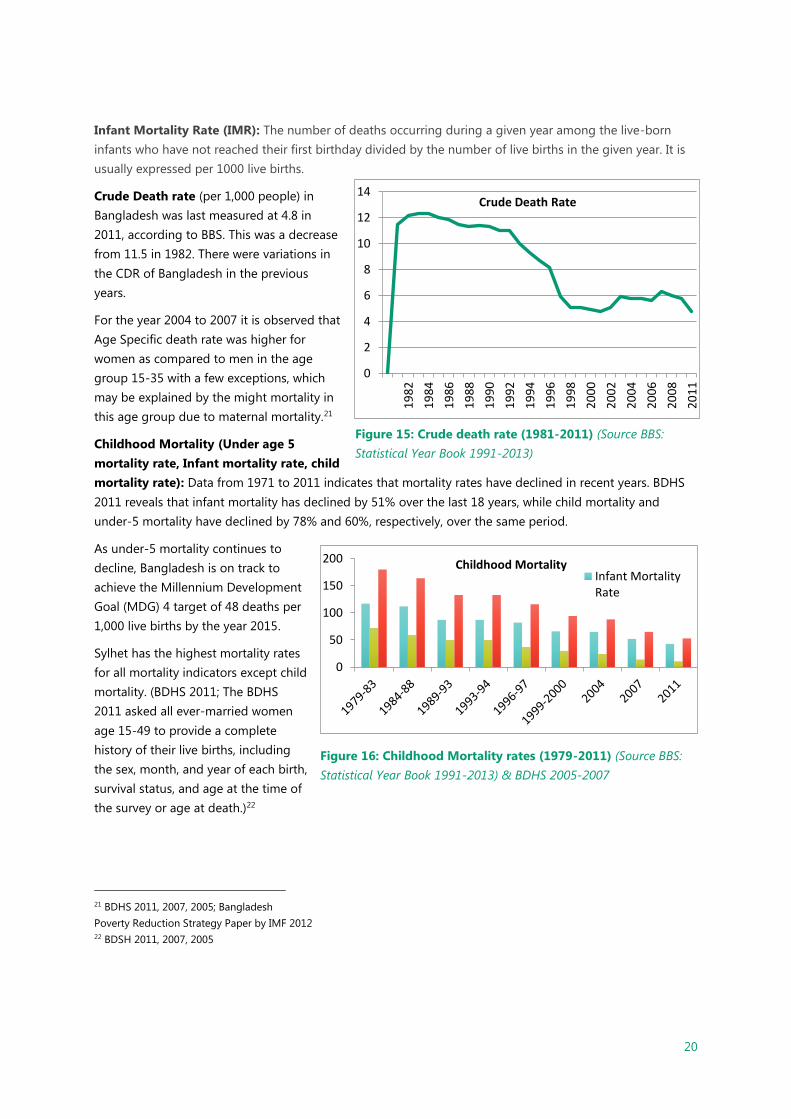
Infant Mortality Rate (IMR): The number of deaths occurring during a given year among the live-born
infants who have not reached their first birthday divided by the number of live births in the given year. It is
usually expressed per 1000 live births.
Crude Death rate (per 1,000 people) in
Bangladesh was last measured at 4.8 in
2011, according to BBS. This was a decrease
from 11.5 in 1982. There were variations in
the CDR of Bangladesh in the previous
years.
For the year 2004 to 2007 it is observed that
Age Specific death rate was higher for
women as compared to men in the age
group 15-35 with a few exceptions, which
may be explained by the might mortality in
this age group due to maternal mortality.21
Childhood Mortality (Under age 5
mortality rate, Infant mortality rate, child
mortality rate): Data from 1971 to 2011 indicates that mortality rates have declined in recent years. BDHS
2011 reveals that infant mortality has declined by 51% over the last 18 years, while child mortality and
under-5 mortality have declined by 78% and 60%, respectively, over the same period.
As under-5 mortality continues to
decline, Bangladesh is on track to
achieve the Millennium Development
Goal (MDG) 4 target of 48 deaths per
1,000 live births by the year 2015.
Sylhet has the highest mortality rates
for all mortality indicators except child
mortality. (BDHS 2011; The BDHS
2011 asked all ever-married women
age 15-49 to provide a complete
history of their live births, including
the sex, month, and year of each birth,
survival status, and age at the time of
the survey or age at death.)22
21 BDHS 2011, 2007, 2005; Bangladesh
Poverty Reduction Strategy Paper by IMF 2012 22 BDSH 2011, 2007, 2005
Figure 15: Crude death rate (1981-2011) (Source BBS:
Statistical Year Book 1991-2013)
Figure 16: Childhood Mortality rates (1979-2011) (Source BBS:
Statistical Year Book 1991-2013) & BDHS 2005-2007
21
5. Urbanization
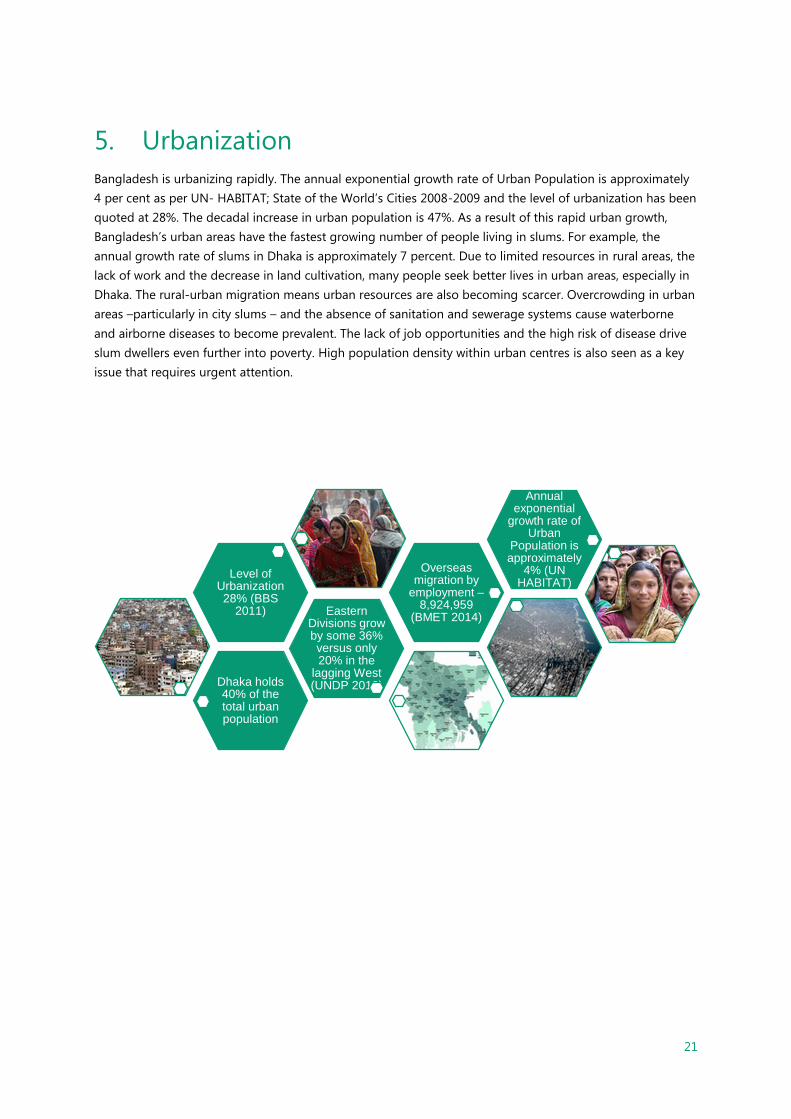
Bangladesh is urbanizing rapidly. The annual exponential growth rate of Urban Population is approximately
4 per cent as per UN- HABITAT; State of the World’s Cities 2008-2009 and the level of urbanization has been
quoted at 28%. The decadal increase in urban population is 47%. As a result of this rapid urban growth,
Bangladesh’s urban areas have the fastest growing number of people living in slums. For example, the
annual growth rate of slums in Dhaka is approximately 7 percent. Due to limited resources in rural areas, the
lack of work and the decrease in land cultivation, many people seek better lives in urban areas, especially in
Dhaka. The rural-urban migration means urban resources are also becoming scarcer. Overcrowding in urban
areas –particularly in city slums – and the absence of sanitation and sewerage systems cause waterborne
and airborne diseases to become prevalent. The lack of job opportunities and the high risk of disease drive
slum dwellers even further into poverty. High population density within urban centres is also seen as a key
issue that requires urgent attention.
Dhaka holds 40% of the total urban population
Eastern Divisions grow by some 36% versus only 20% in the
lagging West (UNDP 2010)
Level of Urbanization 28% (BBS
2011)
Overseas migration by
employment –8,924,959
(BMET 2014)
Annual exponential
growth rate of Urban
Population is approximately
4% (UN HABITAT)

22
Historical Trend of major variables
It is important to note that the urban areas in Bangladesh follow a contextual definition and based on this
the corresponding data is collected and collated by the national entities. In accordance to BBS (2011), urban
area corresponds with area developed around a central place having “such amenities as metalled roads,
improved communication, electricity, gas, water supply, sewerage, sanitation and also having comparatively
higher density of population with majority population in non-agricultural occupations”. According to the
census, the urban areas are classified into three categories:
City Corporation: It includes city corporation area as declared by the Ministry of Local Government;
Paurashava/Municipality Area (PSA): It includes paurashavas incorporated and administered by local
government under Paurashava Ordinance, 1977;
Other Urban Area (OUA): It includes those upazila headquarters which are not paurashavas.
Nevertheless, the only exception is the 17 unions adjacent to Dhaka City Corporation under Dhaka
Metropolitan Area. These unions are treated as other urban areas on the basis of their urban
characteristics.
The share of urban population in Bangladesh varies to some extent based on the old and new definition of
urbanisation.
5.1. Level of Urbanization and Rural- Urban People:
The Urban population base has expanded rapidly from 7.6% to nearly 25% between 1970 and 2005 which
makes Bangladesh a ‘rapidly urbanizing country’. The most significant urban population growth in
Bangladesh occurred during the 1961-74 inter-census period; over 6 million people were living in urban
areas constituting roughly 8.0% of the total population. Thus the percentage increase of the urban
population during these 13 years was striking. That accelerated growth is to a great extent the result of the
very recent influx from rural villages. The growth rate of the urban population was 5.4% during the 1981-
1991. By 2001 the total urban population stood at 28.6 million.
After 1971, there was an explosive growth of big cities. The number of cities with a population greater than
100,000 increased from 4 in 1961 to 6 by 1974, to 13 by 1981 and then to 23 by 1991. The total number of
urban centres increased from 78 in 1961 to 492 in 1991, an increase of over 647% during a span of 30 years.
The growth of urban centres by size/class indicates that there is a strong association between city size and
city growth rates, i.e. the large and medium sized cities are increasing more rapidly simply because of the
graduation of cities occurring in that class. Cities with a population between 25,000 and 49,999 increased
from 15 in 1961 to 45 in 1981, an increase of 300%. During the same period cities with a population of 5,000
to 9,999 increased from 21 in 1961 to 129 in 1981 and those with a population less than 5,000 increased
from 10 to 168. In summary, the urban population of Bangladesh grew at very high rate from 1961-1974
(8.8%) and reached its peak during the period 1974-1981 (10.97%). However about 30% of the total increase
during 1974-1981 can be explained by the change in definition of urban areas in 1981.
In 1974 people living in urban areas accounted for only 8.8% of the population where in 2011 this urban
population was 28% of total population.

23
(Source BBS: Statistical Year Book 1991-2013 & World Bank WDI)
The push factors driving people from rural to urban areas are the socio-economic, demo-graphic and
cultural issues, which includes unemployment, poverty, floods, droughts, river erosion, political instability,
social discrimination, disputes, etc. The pull factors attracting people to urban areas include the
concentration of resources, employment opportunities, better living and educational facilities, etc. in the
urban areas. For example, according to World Bank assessment, approximately 80% of the garments
industry in Bangladesh, accounting for the overwhelming majority of the country’s exports, is located in
Dhaka city. It is also interesting to analyse the general movements in the form of Intra country
movement (Rural to Urban, Rural to Rural, Urban to Rural, Urban to Urban) and Inter country movement
(overseas).
0102030405060708090
100
% % % % %
1974 1981 1991 2001 2011
Rural and Urban Population Urban
Rural
0
5
10
15
20
25
30
18
91
19
01
19
11
19
21
19
31
19
41
19
51
19
61
19
74
19
81
19
91
20
01
20
11
Level of Urbanization (% of Population)
Figure 18: Level of Urbanization 1981- 2011 Figure 17: Total Rural and Urban Population Trend
24
Table 3: Facts regarding Urbanization: (Source BBS: Statistical Year Book 1991-2013)
Facts regarding Urbanization23
Census
year
Total
national
population
(million)
Growth rate
of national
population
(%)
Total urban
population
(million)
Level of
Urbanization
(%)
Decadal
increase in
urban
population
(%)
Annual
exponential
growth rate of
urban population
(%)
1951 44.17 0.5 1.82 4.33 18.38 1.69
1961 55.22 2.26 2.64 5.19 45.11 3.72
1974 76.37 2.48 6.27 8.87 137.57 6.66
1981 89.91 2.32 13.23 15.18 110.68 10.66
1991 111.45 2.17 20.87 19.63 57.79 4.56
2001 123.1 1.47 28.61 23.1 37.05 3.15
2011 150.4 1.37 42.11 28.4 47.19 4.12
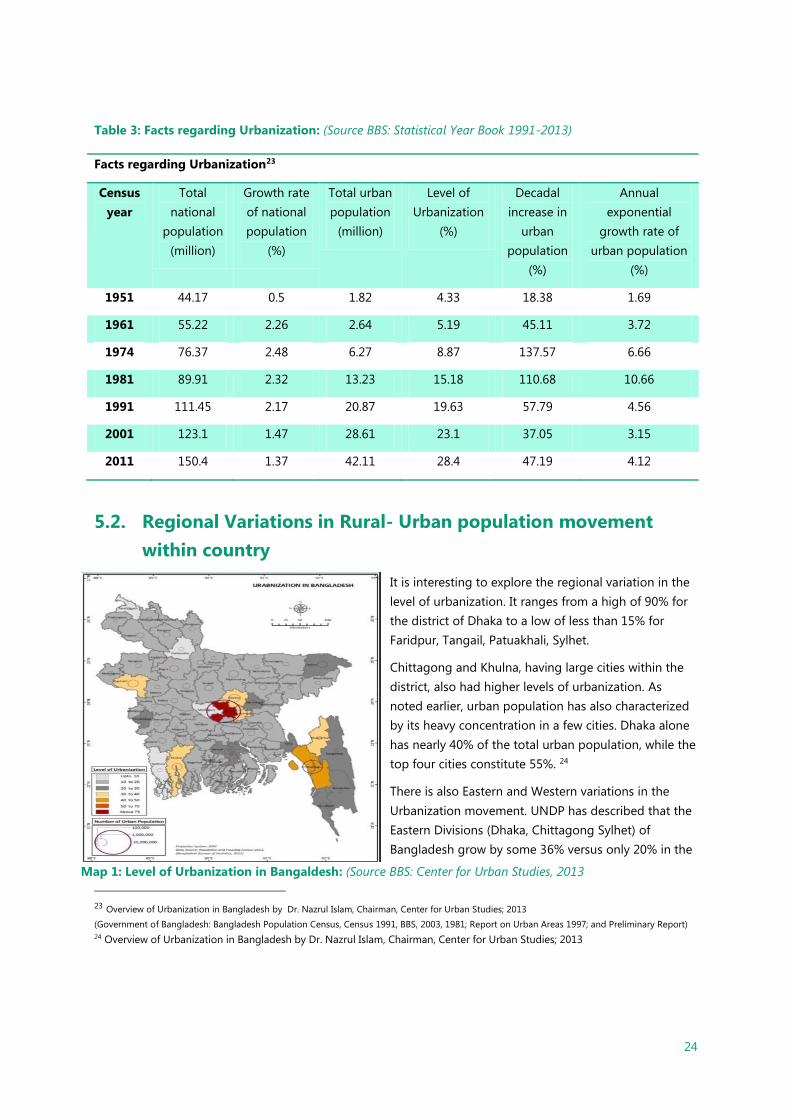
5.2. Regional Variations in Rural- Urban population movement
within country
It is interesting to explore the regional variation in the
level of urbanization. It ranges from a high of 90% for
the district of Dhaka to a low of less than 15% for
Faridpur, Tangail, Patuakhali, Sylhet.
Chittagong and Khulna, having large cities within the
district, also had higher levels of urbanization. As
noted earlier, urban population has also characterized
by its heavy concentration in a few cities. Dhaka alone
has nearly 40% of the total urban population, while the
top four cities constitute 55%. 24
There is also Eastern and Western variations in the
Urbanization movement. UNDP has described that the
Eastern Divisions (Dhaka, Chittagong Sylhet) of
Bangladesh grow by some 36% versus only 20% in the
23 Overview of Urbanization in Bangladesh by Dr. Nazrul Islam, Chairman, Center for Urban Studies; 2013
(Government of Bangladesh: Bangladesh Population Census, Census 1991, BBS, 2003, 1981; Report on Urban Areas 1997; and Preliminary Report) 24 Overview of Urbanization in Bangladesh by Dr. Nazrul Islam, Chairman, Center for Urban Studies; 2013
Map 1: Level of Urbanization in Bangaldesh: (Source BBS: Center for Urban Studies, 2013
25
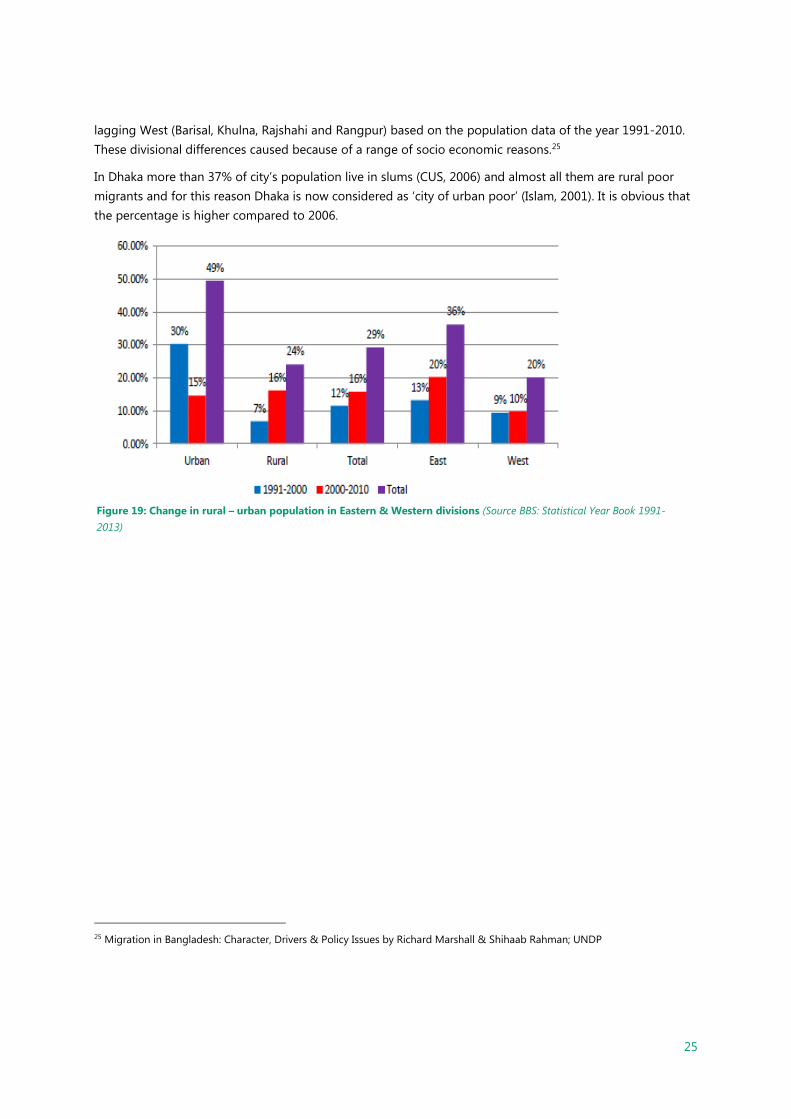
lagging West (Barisal, Khulna, Rajshahi and Rangpur) based on the population data of the year 1991-2010.
These divisional differences caused because of a range of socio economic reasons.25
In Dhaka more than 37% of city’s population live in slums (CUS, 2006) and almost all them are rural poor
migrants and for this reason Dhaka is now considered as ‘city of urban poor’ (Islam, 2001). It is obvious that
the percentage is higher compared to 2006.
25 Migration in Bangladesh: Character, Drivers & Policy Issues by Richard Marshall & Shihaab Rahman; UNDP
Figure 19: Change in rural – urban population in Eastern & Western divisions (Source BBS: Statistical Year Book 1991-
2013)

26
Percentage of changes in Urban- Rural Population in District level from 1991- 2001 & 2001- 2011 based on BBS data base
-750,000 -250,000 250,000 750,000 1,250,000
KhulnaNaraynganjChittagong
PabnaManikganj
RangpurLalmonirhat
BagerhatRangamatiBandarbanJhalokathi
BholaRajshahiMagura
MeherpurGaibandha
BargunaGopalganj
PirojpurShariatpur
RajbariMadaripur
KustiaJoypurhat
PanchagarhSatkhira
NarailPatuakhali
ChuadangaNatore
LakhsmipurSunamganj
ThakurgaonFaridpur
KhagrachoriKurigram
JhenaidahChapai Nababganj
SherpurNaogaonHabiganj
NilphamariJamalpur
NetrokonaMaulvibazar
DinajpurMunshiganjNarshingdi
TangailGazipur
BrahmanbariaJessore
SirajganjChandpur
FeniBarishal
KishorganjMymensing
NoakhaliCox's Bazaar
BograComilla
Sylhet
Changes in Urban &Rural Population in District level 2001- 2011
Urban
Rural
-500,000 0 500,0001,000,0001,500,0002,000,000
MunshiganjBagerhat
RangamatiPanchagarhJhalokathi
NarailBarguna
ThakurgaonBandarbanLakhsmipur
MeherpurNatore
SherpurMaulvibazar
RajbariSatkhira
LalmonirhatPirojpur
Chapai NababganjBhola
PatuakhaliGopalganj
NilphamariKustia
JoypurhatBarishal
KurigramNaogaon
JhenaidahShariatpurNetrokona
BrahmanbariaSirajganj
GaibandhaMagura
ChuadangaKhagrachori
MadaripurManikganjKishorganj
Cox's BazaarHabiganjDinajpur
FeniSylhet
FaridpurRangpur
BograNarshingdiSunamganj
PabnaNoakhali
JessoreChandpurJamalpur
MymensingComillaTangailKhulna
RajshahiGazipur
NaraynganjChittagong
Dhaka
Changes in Urban -Rural Population in District level 1991-2001
Urban
Rural
27
5.3. Urban centres, Slums and Squatters:
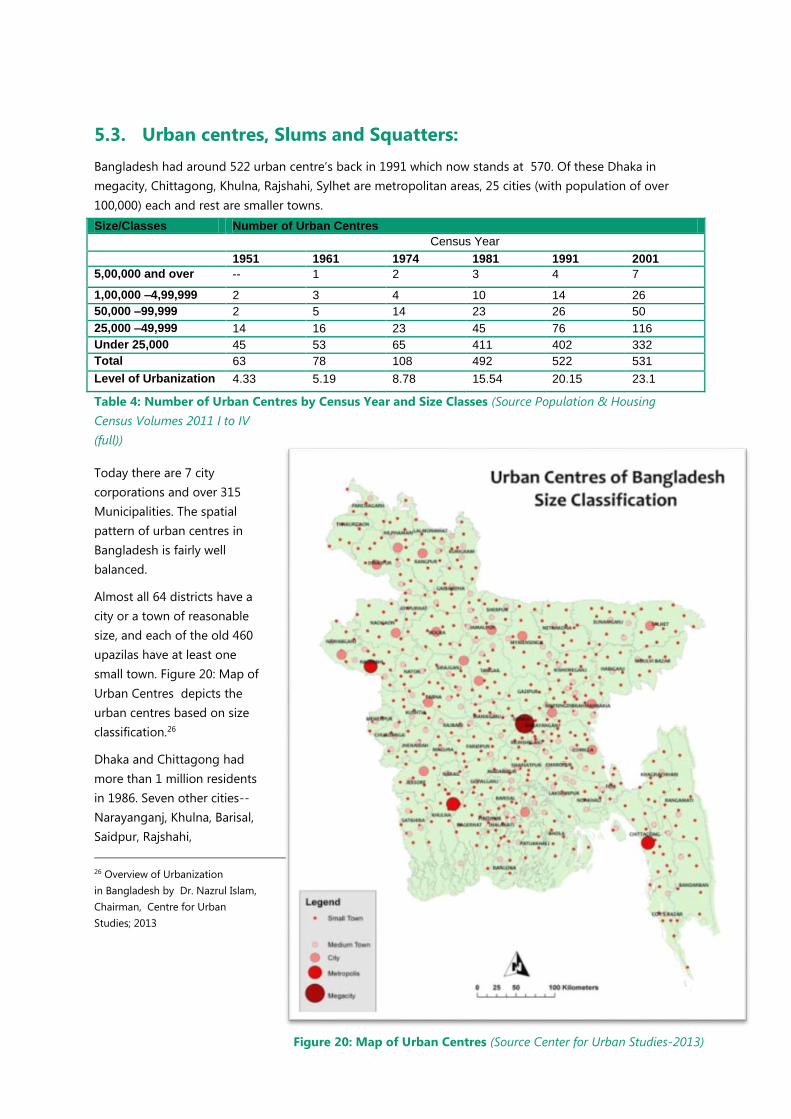
Bangladesh had around 522 urban centre’s back in 1991 which now stands at 570. Of these Dhaka in
megacity, Chittagong, Khulna, Rajshahi, Sylhet are metropolitan areas, 25 cities (with population of over
100,000) each and rest are smaller towns.
Table 4: Number of Urban Centres by Census Year and Size Classes (Source Population & Housing
Census Volumes 2011 I to IV
(full))
Today there are 7 city
corporations and over 315
Municipalities. The spatial
pattern of urban centres in
Bangladesh is fairly well
balanced.
Almost all 64 districts have a
city or a town of reasonable
size, and each of the old 460
upazilas have at least one
small town. Figure 20: Map of
Urban Centres depicts the
urban centres based on size
classification.26
Dhaka and Chittagong had
more than 1 million residents
in 1986. Seven other cities--
Narayanganj, Khulna, Barisal,
Saidpur, Rajshahi,
26 Overview of Urbanization
in Bangladesh by Dr. Nazrul Islam,
Chairman, Centre for Urban
Studies; 2013
Size/Classes Number of Urban Centres
Census Year
1951 1961 1974 1981 1991 2001
5,00,000 and over -- 1 2 3 4 7
1,00,000 –4,99,999 2 3 4 10 14 26
50,000 –99,999 2 5 14 23 26 50
25,000 –49,999 14 16 23 45 76 116
Under 25,000 45 53 65 411 402 332
Total 63 78 108 492 522 531
Level of Urbanization 4.33 5.19 8.78 15.54 20.15 23.1
Figure 20: Map of Urban Centres (Source Center for Urban Studies-2013)
28
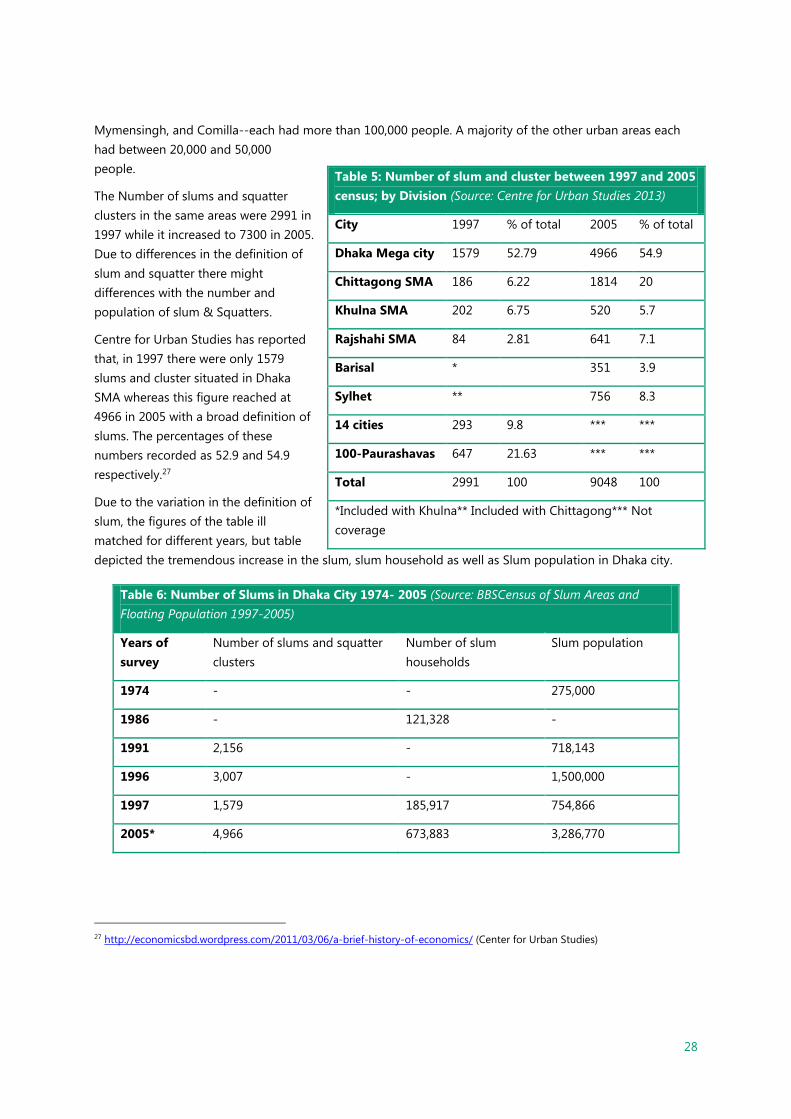
Mymensingh, and Comilla--each had more than 100,000 people. A majority of the other urban areas each
had between 20,000 and 50,000
people.
The Number of slums and squatter
clusters in the same areas were 2991 in
1997 while it increased to 7300 in 2005.
Due to differences in the definition of
slum and squatter there might
differences with the number and
population of slum & Squatters.
Centre for Urban Studies has reported
that, in 1997 there were only 1579
slums and cluster situated in Dhaka
SMA whereas this figure reached at
4966 in 2005 with a broad definition of
slums. The percentages of these
numbers recorded as 52.9 and 54.9
respectively.27
Due to the variation in the definition of
slum, the figures of the table ill
matched for different years, but table
depicted the tremendous increase in the slum, slum household as well as Slum population in Dhaka city.
27 http://economicsbd.wordpress.com/2011/03/06/a-brief-history-of-economics/ (Center for Urban Studies)
Table 5: Number of slum and cluster between 1997 and 2005
census; by Division (Source: Centre for Urban Studies 2013)
City 1997 % of total 2005 % of total
Dhaka Mega city 1579 52.79 4966 54.9
Chittagong SMA 186 6.22 1814 20
Khulna SMA 202 6.75 520 5.7
Rajshahi SMA 84 2.81 641 7.1
Barisal * 351 3.9
Sylhet ** 756 8.3
14 cities 293 9.8 *** ***
100-Paurashavas 647 21.63 *** ***
Total 2991 100 9048 100
*Included with Khulna** Included with Chittagong*** Not
coverage
Table 6: Number of Slums in Dhaka City 1974- 2005 (Source: BBSCensus of Slum Areas and
Floating Population 1997-2005)
Years of
survey
Number of slums and squatter
clusters
Number of slum
households
Slum population
1974 - - 275,000
1986 - 121,328 -
1991 2,156 - 718,143
1996 3,007 - 1,500,000
1997 1,579 185,917 754,866
2005* 4,966 673,883 3,286,770

29
In 1986, the number of slum households was 176745 in the three divisional Cities including Paurashavas.
Later on in 2005 this number has increased and reported at 334431 in the six divisional Cities including
Paurashavas and some urbanized areas, called SMA. Dhaka still occupied the first position in terms of living
slum household, which was 68.65 and 64.6% in 1997 and 2005 respectively. Chittagong SMA secured the
second position followed by Khulna SMA, Rajshahi SMA and Sylhet containing 25.5%, 3.6%, 2.6%, 1.9% and
1.7% respectively.28
Table 7: Number of slum Households and their % between 1986 and 2005 census
City 1986 % of
total
1997 % of
total
2005 % of total
Dhaka Mega city 121,328 68.65 185,917 55.59 673,883 64.6
Chittagong SMA 30,854 17.45 45,143 13.5 266,182 25.5
Khulna SMA 24,563 13.9 28,184 8.43 37,826 3.6
Rajshahi SMA - - 6,998 2.09 27,665 2.6
Barisal *** *** * * 19,460 1.9
Sylhet *** *** ** ** 18,313 1.7
14 cities - - 24448 7.31 *** ***
100-Paurashavas - - 43741 13.08 *** ***
Total 176,745 100 334,431 100 1,043,329 100
*Included with Khulna** Included with Chittagong*** Not coverage
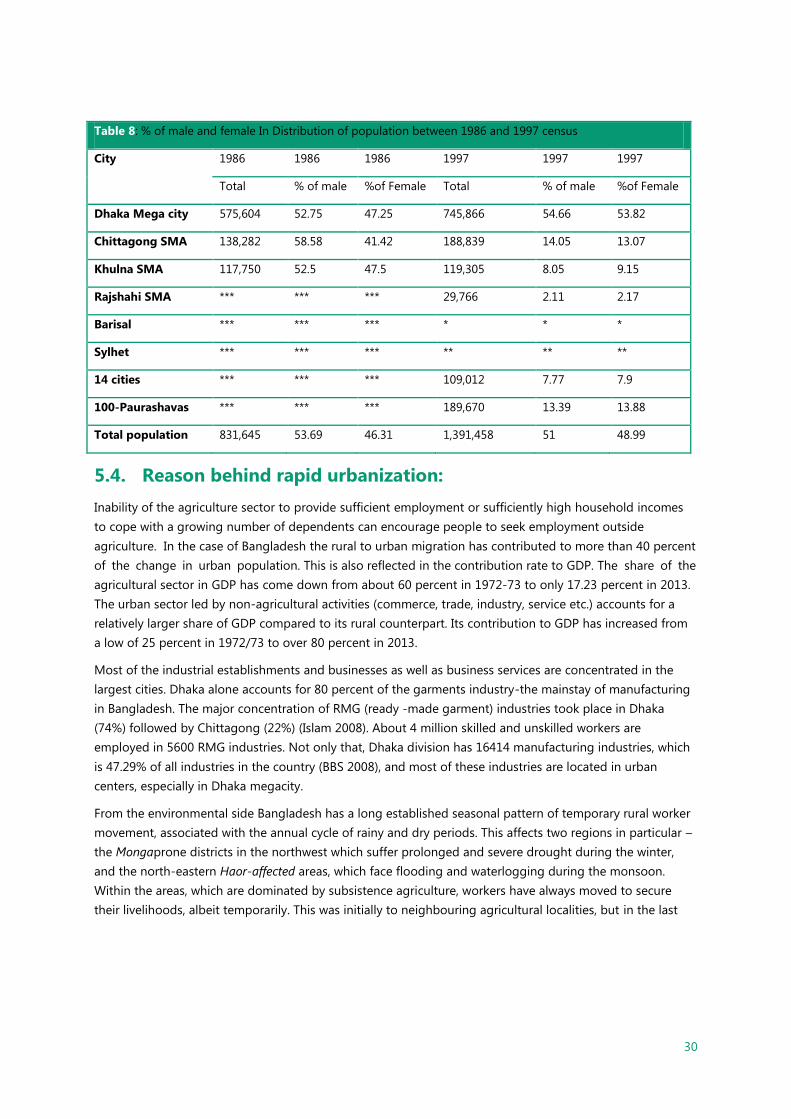
In the year 1986, it has been observed that the total population in slum was 831645 with 53.69 % and
46.31% of male and female respectively in three divisional cities with adjacent Paurashavas.while in 1997.
This figure reached at 1391458 with 51% and 48.99 % of male and female respectively in six divisional cities
with adjacent Paurashavas and urban areas.29.
28 http://economicsbd.wordpress.com/2011/03/06/a-brief-history-of-economics/ (Center for Urban Studies) 29 http://economicsbd.wordpress.com/2011/03/06/a-brief-history-of-economics/ (Center for Urban Studies)
30
Table 8: % of male and female In Distribution of population between 1986 and 1997 census
City 1986 1986 1986 1997 1997 1997
Total % of male %of Female Total % of male %of Female
Dhaka Mega city 575,604 52.75 47.25 745,866 54.66 53.82
Chittagong SMA 138,282 58.58 41.42 188,839 14.05 13.07
Khulna SMA 117,750 52.5 47.5 119,305 8.05 9.15
Rajshahi SMA *** *** *** 29,766 2.11 2.17
Barisal *** *** *** * * *
Sylhet *** *** *** ** ** **
14 cities *** *** *** 109,012 7.77 7.9
100-Paurashavas *** *** *** 189,670 13.39 13.88
Total population 831,645 53.69 46.31 1,391,458 51 48.99
5.4. Reason behind rapid urbanization:
Inability of the agriculture sector to provide sufficient employment or sufficiently high household incomes
to cope with a growing number of dependents can encourage people to seek employment outside
agriculture. In the case of Bangladesh the rural to urban migration has contributed to more than 40 percent
of the change in urban population. This is also reflected in the contribution rate to GDP. The share of the
agricultural sector in GDP has come down from about 60 percent in 1972-73 to only 17.23 percent in 2013.
The urban sector led by non-agricultural activities (commerce, trade, industry, service etc.) accounts for a
relatively larger share of GDP compared to its rural counterpart. Its contribution to GDP has increased from
a low of 25 percent in 1972/73 to over 80 percent in 2013.
Most of the industrial establishments and businesses as well as business services are concentrated in the
largest cities. Dhaka alone accounts for 80 percent of the garments industry-the mainstay of manufacturing
in Bangladesh. The major concentration of RMG (ready -made garment) industries took place in Dhaka
(74%) followed by Chittagong (22%) (Islam 2008). About 4 million skilled and unskilled workers are
employed in 5600 RMG industries. Not only that, Dhaka division has 16414 manufacturing industries, which
is 47.29% of all industries in the country (BBS 2008), and most of these industries are located in urban
centers, especially in Dhaka megacity.
From the environmental side Bangladesh has a long established seasonal pattern of temporary rural worker
movement, associated with the annual cycle of rainy and dry periods. This affects two regions in particular –
the Mongaprone districts in the northwest which suffer prolonged and severe drought during the winter,
and the north-eastern Haor-affected areas, which face flooding and waterlogging during the monsoon.
Within the areas, which are dominated by subsistence agriculture, workers have always moved to secure
their livelihoods, albeit temporarily. This was initially to neighbouring agricultural localities, but in the last

31
twenty years this cycle has expanded to include working within the core urban centres. Some evidence has
shown that these movements have become more permanent in nature.30
5.5. Overseas Migration
A number of populations are moving to overseas for different purposes like settlement, education, and
employment each year. This number is quite difficult to obtain. There are five channels of recruitment from
Bangladesh for overseas employment. As per 2007 data individual initiative constitutes 68%, Recruiting
agents deal with 32% of recruitment (including BMET, BOESEL). BOESL recruits less than 1%.
For overseas employment as per BMET it has seen that in 1976 only 6,087 people went to overseas for
employment reason where in 2008 it was 837,055 and in 2014 (up to date) it is 207,95731. The previous
graph is showing the trend of movement and it has unstable rise & fall. Political situation of Bangladesh,
international relationship with the foreign governments, political situation of the foreign countries, global
economy, man power demand of the foreign countries etc. is the main reason for this rise and fall. No figure
is available on the returned migrants which may be estimated as 10%-15%.32
Between 1991 to 2000 female migrants constituted less than 1% of the total flow, after the relaxation of
restriction during the years of 2005 or 2006, 6% of the total labor flow from Bangladesh was women. In
2009 and 2010 share of women were, 4.7% and 7% of the total flow respectively. In 2011 the flow of female
migrants increased by 10.37 per cent over that of 201033.
30http://www.bd.undp.org/content/dam/bangladesh/docs/Publications/Pub2013/Internal%20Migration%20in%20Bangladesh%20UNDP%20Final.pdf 31 Migration Scenerio: Nature, Pattern and Trend by Dr. Md. Nurul Islam 32 Bureau of Manpower, Employment and Training 33 Siddiqui, Tasneem (2013); Remittance backed Financial Products in Bangladesh (Working paper series no. 37, Dhaka: RMMRU
Figure 21: Overseas employment 1976- 2014

32
There is district wise variation to this overseas employment. The BMET 2008 data describes the following
features of the origin of migrants34:
Dhaka and Chittagong Divisions comprising only 30 of the country’s 64 districts account for the lion’s
share—78.20%-- of the migrants; the remaining 4 Divisions consisting of 34 districts chip in with only
21.20%
The poorest parts of the country have very small representation in the migration; the manga (seasonal
famine) affected districts on the northwest fringe of the country are among the worst performers with
insignificant migrant population.
At the district level, Comilla stands out as the leading supplier of male manpower for employment abroad,
along with 5 other traditional suppliers.35
34 BMET and Study on the International Demand for Semi–skilled and Skilled Bangladeshi Workers by MAXWELL STAMP Ltd. 35 BMET and Study on the International Demand for Semi–skilled and Skilled Bangladeshi Workers by MAXWELL STAMP Ltd.
Table 9: Flow of Male and Female migrants from 2004- 2009: (Source BMET & UN)

33
BMET and United Nation’s 2010 data reveals that around 6% Bangladeshi migrant has stayed in overseas as
Immigrant. But
they have
provided the data
only based on the
list of countries
with Bangladeshi
migrant
population of over
5,000. So this
number might be
a bit higher.36
36 Country Paper Migration
Table 10: Intra-country Migration

34

35
6. Population Forecasts
6.1. Population projections up to 2100 by UN
6.1.1. Three (fertility) variants
Since 1951s the United Nations (UN) had been publishing country level population estimates and
projections. These population projections have been prepared by the Population Division of the Department
of Economic and Social Affairs of the United Nations Secretariat.
In 2013 the “2012 Revision” of the World Population Prospects37 was published, containing among others
three fertility variants (medium, high and low) up to 2100, each sharing the assumptions made with
respect to mortality and international migration. Starting year for the projections is 2010.
For Bangladesh the assumptions about the three fertility variants are as follows:
Medium variant: the total fertility rate (TFR) declining to 2.20 in the period 2010-2015, and further
declining to 1.69 (lowest level) in the period 2040-2055 and slightly increasing in the next 45 years
1.82.
High variant: the TFR is projected to reach a fertility level that is 0.5 children above the total fertility
rate in the medium variant.
Low variant: the TFR is projected to reach a fertility level that is 0.5 children below the total fertility
rate in the medium variant.
Figure 22 shows total fertility rate for the medium variant for Bangladesh compared to Asia and to Southern
Asia. The figure indicates that total fertility rate for Bangladesh is projected to be declining significantly
faster than in Asia and Southern Asia, already reaching the replacement value of about 2.1 just after 2015,
while in Southern Asia this will be the case only after 2040. At the end of the 21st century total fertility rate is
converging in all three regions mentioned to about 1.8.
37 World Population Prospects The 2012 Revision: Volume I: Comprehensive Tables, UN, New York 2013.

36
Figure 22: Total population in Bangladesh up to 2100 for three projection variants
Source: UN, World Population Prospects, the 2012 Revision: Volume II: Demographic Profiles
Figure 23: Total Population by variant
Source: UN, World Population Prospects, the 2012 Revision: Volume II: Demographic Profiles
In the medium variant total population in Bangladesh is projected to grow (from 151.1 million in 2010) to
201.9 million in 2050, reaching its maximum level of 203.7 million in 2060. In the next period 2060 -2100
total population is decreasing very slowly to 182.2 million in 2100.

37
In the high variant comparable figures for total population are 235.6 million in 2050, 251.7 million in 2060
and increasing to even above the 300 million level (306.8 million) in 2100.
In the low variant total population is increasing slowly to 175.0 million in 2035 (reaching its maximum level),
and thereafter slightly declining to 171.9 million in 2050. In the period 2050-2100 total population is further
decreasing significantly to about 100.3 million in 2100.
The above picture in the very long run (2050-2100) is deviating substantially over time (compare in
particular the high and low variant) and its uncertainty is (no doubt) increasing. However, for the medium
and long run (up to 2050) the estimates are more robust given the fact that most people who will live in
2050 are already born.
In later sections we will come back to the above variants in more detail, when dealing about the national
population projections and the way these projections are regionalized on a district (and division) level.
Below, just some issues will be dealt with briefly for the medium variant (up to 2050 and/or 2100).
Age groups and sex pyramids (up to 2100)
Due to the on-going demographic transition the population age structure is also changing substantially. In
Figure 24 population pyramids for the medium variant are shown for the current situation (2010), 2050 and
2100.
Figure 24: Total population in Bangladesh by age groups and sex (absolute numbers: in millions) for
medium variant
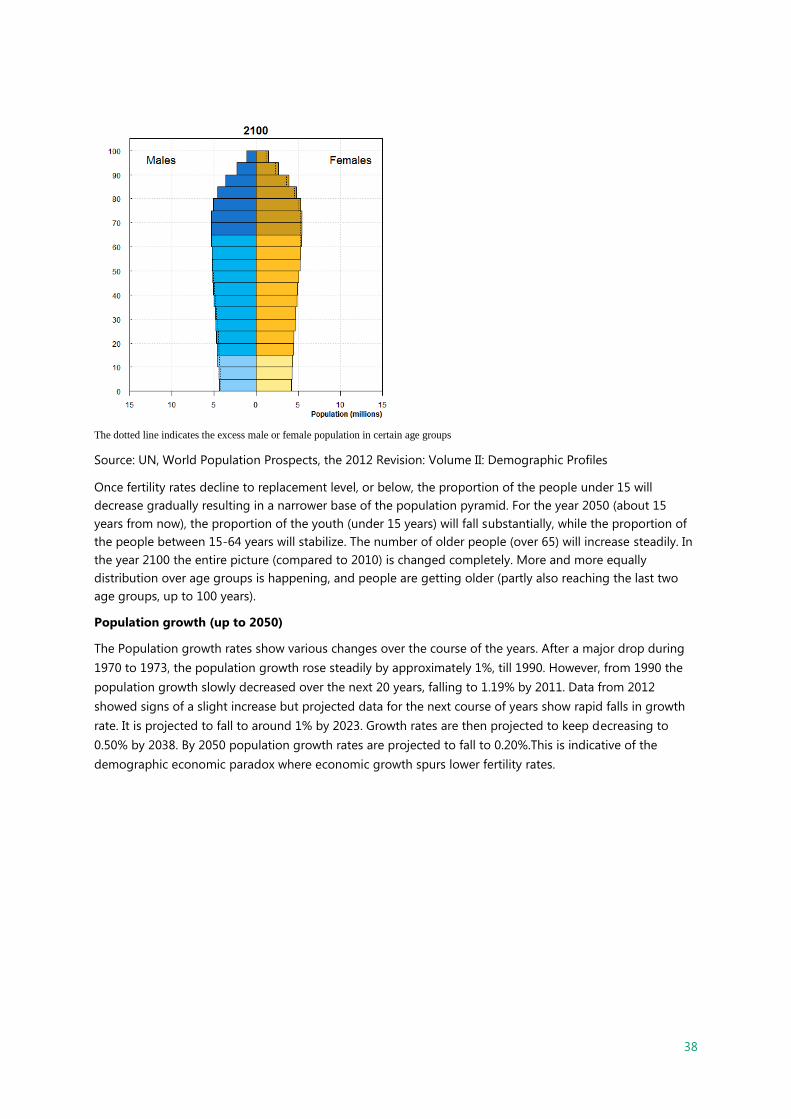
38
The dotted line indicates the excess male or female population in certain age groups
Source: UN, World Population Prospects, the 2012 Revision: Volume II: Demographic Profiles
Once fertility rates decline to replacement level, or below, the proportion of the people under 15 will
decrease gradually resulting in a narrower base of the population pyramid. For the year 2050 (about 15
years from now), the proportion of the youth (under 15 years) will fall substantially, while the proportion of
the people between 15-64 years will stabilize. The number of older people (over 65) will increase steadily. In
the year 2100 the entire picture (compared to 2010) is changed completely. More and more equally
distribution over age groups is happening, and people are getting older (partly also reaching the last two
age groups, up to 100 years).
Population growth (up to 2050)
The Population growth rates show various changes over the course of the years. After a major drop during
1970 to 1973, the population growth rose steadily by approximately 1%, till 1990. However, from 1990 the
population growth slowly decreased over the next 20 years, falling to 1.19% by 2011. Data from 2012
showed signs of a slight increase but projected data for the next course of years show rapid falls in growth
rate. It is projected to fall to around 1% by 2023. Growth rates are then projected to keep decreasing to
0.50% by 2038. By 2050 population growth rates are projected to fall to 0.20%.This is indicative of the
demographic economic paradox where economic growth spurs lower fertility rates.

39
Source: UN, World Population Prospects, the 2012 Revision: Volume II: Demographic Profiles
Figure 25: Population growth (in % annually) for the past as well as the future up to 2050
0.00
0.50
1.00
1.50
2.00
2.50
3.00
1970 1980 1990 2000 2010 2020 2030 2040 2050
Population growth (annual %)

40
Urban and Rural population
In the Figure below the development of urban and rural population up to 2050 is showed.
Figure 26: Urban and Rural Population Projections Medium Variant up to 2050
Source: UN, World Population Prospects, the 2012 Revision: Volume II: Demographic Profiles
The data indicate that rural population has been steadily decreasing over the years whereas the urban
population is seen to have a steady increase. It is projected that by 2040 both Urban and Rural populations
will be equal. By 2050 it is projected that urban populations will stand at around 112 million and rural
populations at around 90 million (total around 202 million). This has significant implications for land use and
water resource management
0
10
20
30
40
50
60
70
80
90
100
1970 1980 1990 2000 2010 2020 2030 2040 2050
Urban and Rural Population Projections
Rural population (% of total population) Urban population (% of total)
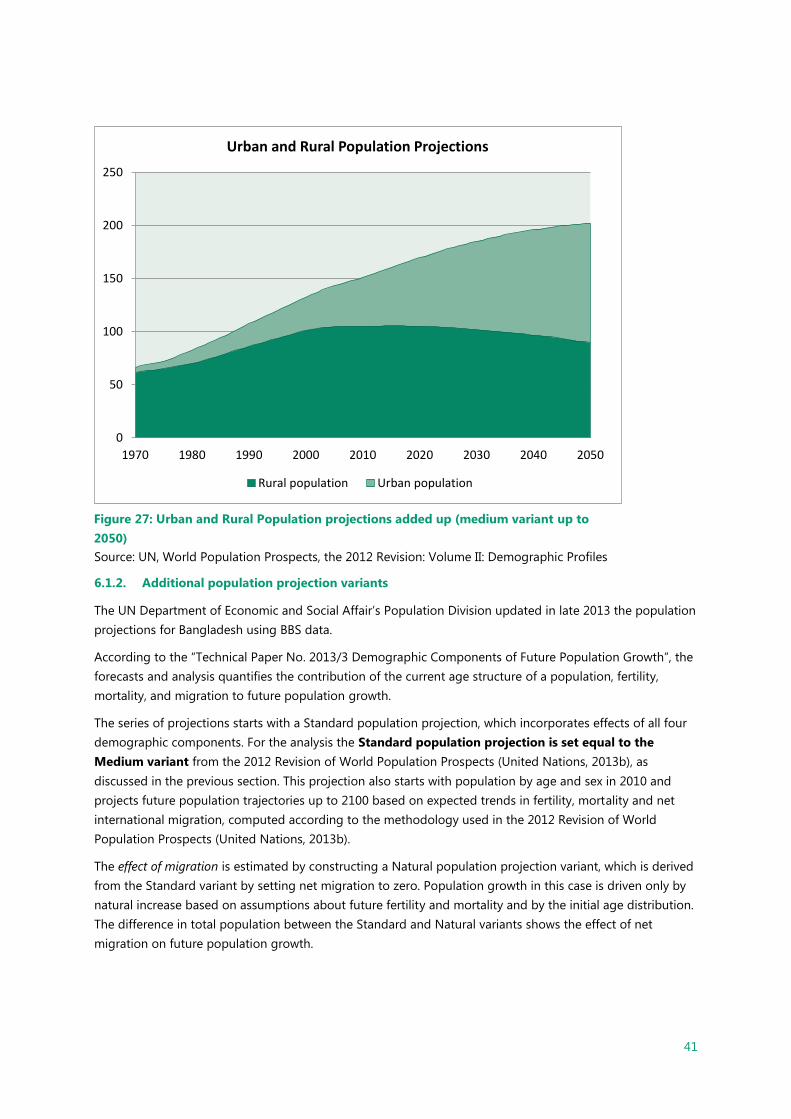
41
Source: UN, World Population Prospects, the 2012 Revision: Volume II: Demographic Profiles
6.1.2. Additional population projection variants
The UN Department of Economic and Social Affair’s Population Division updated in late 2013 the population
projections for Bangladesh using BBS data.
According to the “Technical Paper No. 2013/3 Demographic Components of Future Population Growth”, the
forecasts and analysis quantifies the contribution of the current age structure of a population, fertility,
mortality, and migration to future population growth.
The series of projections starts with a Standard population projection, which incorporates effects of all four
demographic components. For the analysis the Standard population projection is set equal to the
Medium variant from the 2012 Revision of World Population Prospects (United Nations, 2013b), as
discussed in the previous section. This projection also starts with population by age and sex in 2010 and
projects future population trajectories up to 2100 based on expected trends in fertility, mortality and net
international migration, computed according to the methodology used in the 2012 Revision of World
Population Prospects (United Nations, 2013b).
The effect of migration is estimated by constructing a Natural population projection variant, which is derived
from the Standard variant by setting net migration to zero. Population growth in this case is driven only by
natural increase based on assumptions about future fertility and mortality and by the initial age distribution.
The difference in total population between the Standard and Natural variants shows the effect of net
migration on future population growth.
0
50
100
150
200
250
1970 1980 1990 2000 2010 2020 2030 2040 2050
Urban and Rural Population Projections
Rural population Urban population
Figure 27: Urban and Rural Population projections added up (medium variant up to
2050)

42
The effect of fertility is estimated by a Replacement projection variant, which is derived from the Natural
variant by setting total fertility at the replacement level for each five-year projection periods. The difference
between the Natural and Replacement projection variants shows the effect of total fertility, above or below
replacement level, on the overall population growth. Note that the Replacement projection variant is
different from the instant-replacement variant published in the 2012 Revision of World Population Prospects
(United Nations, 2013b), because the latter includes the effect of migration while the former does not.
The last projection variant, Momentum, is constructed by using as of 2010 constant mortality rates, constant
fertility at the replacement level and by setting net migration at zero. Computing the difference in total
population between the Replacement and Momentum variants shows the effect of anticipated mortality
decline on future population size. It is important to note that trends in mortality between birth and the
reproductive ages are taken into account by the changes that occur in the replacement levels of fertility. The
difference between the Replacement and Momentum projections therefore measures only adult mortality
above the average age at childbearing.
Lastly, the difference between the starting total population in 2010 and the Momentum variant is
attributable to the initial age structure of a population. If fertility declines immediately to the replacement
level as in the Momentum a few decades before it eventually tapers off and reaches the ultimate stationary
level.
The different variants can thus be summed up as:
Standard Variant (=medium variant in section 6.1.1): This projection starts with population by age and sex in
2010 and projects future population trajectories up to 2100 based on expected trends in fertility, mortality
and net international migration, computed according to the methodology used in the 2012 Revision of
World Population Prospects (United Nations, 2013b).
Natural Variant: derived from standard variant setting net migration to zero
Replacement Variant: derived from the Natural variant by setting total fertility at the replacement level for
each five-year projection periods.
Momentum Variant: is constructed by using as of 2010 constant mortality rates, constant fertility at the
replacement level and by setting net migration at zero.
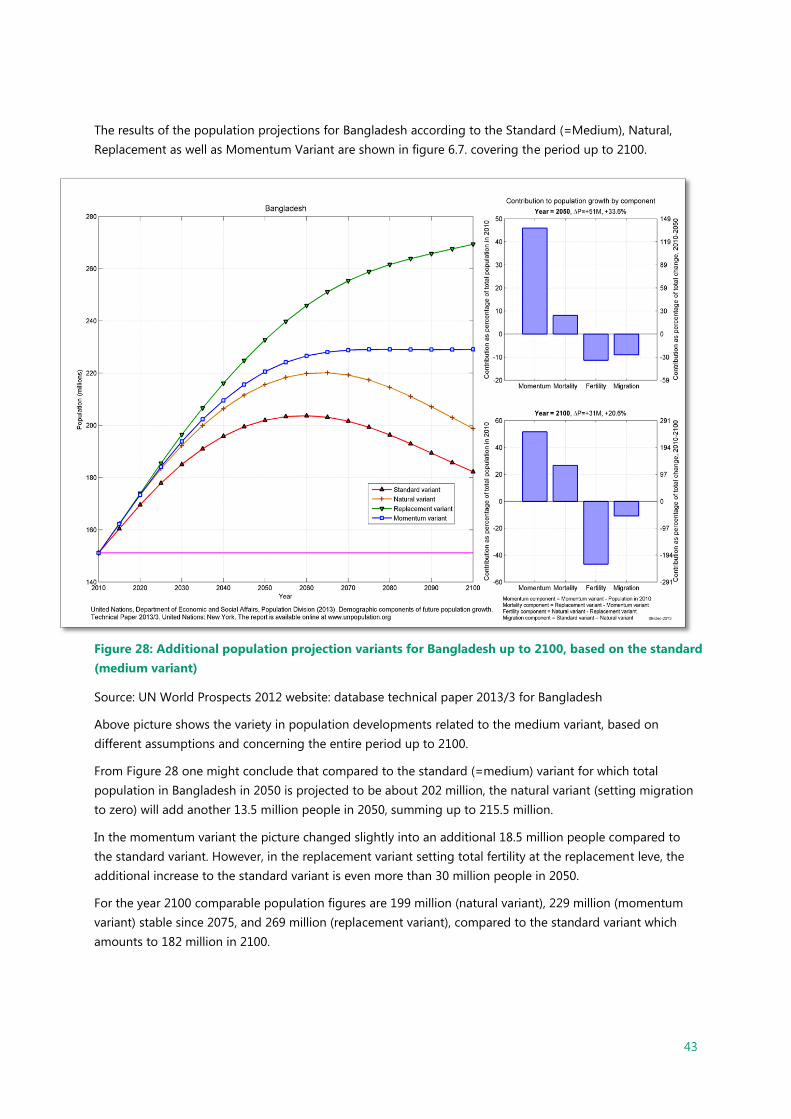
43
The results of the population projections for Bangladesh according to the Standard (=Medium), Natural,
Replacement as well as Momentum Variant are shown in figure 6.7. covering the period up to 2100.
Source: UN World Prospects 2012 website: database technical paper 2013/3 for Bangladesh
Above picture shows the variety in population developments related to the medium variant, based on
different assumptions and concerning the entire period up to 2100.
From Figure 28 one might conclude that compared to the standard (=medium) variant for which total
population in Bangladesh in 2050 is projected to be about 202 million, the natural variant (setting migration
to zero) will add another 13.5 million people in 2050, summing up to 215.5 million.
In the momentum variant the picture changed slightly into an additional 18.5 million people compared to
the standard variant. However, in the replacement variant setting total fertility at the replacement leve, the
additional increase to the standard variant is even more than 30 million people in 2050.
For the year 2100 comparable population figures are 199 million (natural variant), 229 million (momentum
variant) stable since 2075, and 269 million (replacement variant), compared to the standard variant which
amounts to 182 million in 2100.
Figure 28: Additional population projection variants for Bangladesh up to 2100, based on the standard
(medium variant)
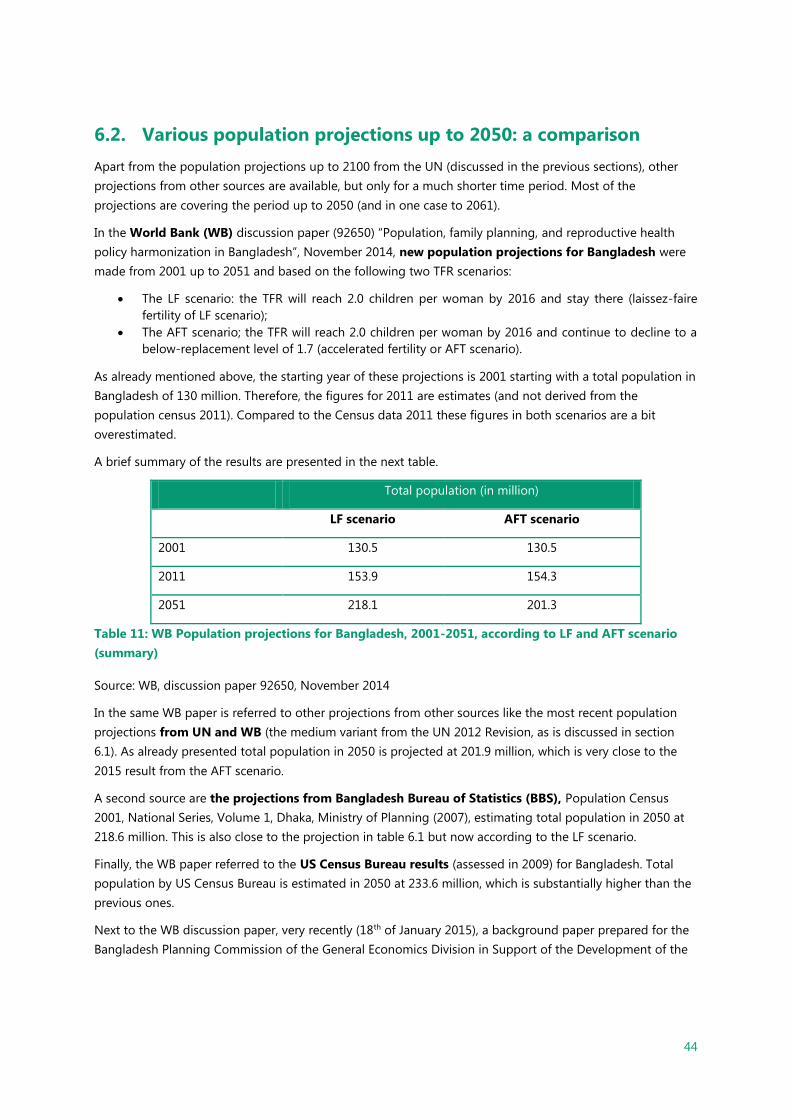
44
6.2. Various population projections up to 2050: a comparison
Apart from the population projections up to 2100 from the UN (discussed in the previous sections), other
projections from other sources are available, but only for a much shorter time period. Most of the
projections are covering the period up to 2050 (and in one case to 2061).
In the World Bank (WB) discussion paper (92650) “Population, family planning, and reproductive health
policy harmonization in Bangladesh”, November 2014, new population projections for Bangladesh were
made from 2001 up to 2051 and based on the following two TFR scenarios:
The LF scenario: the TFR will reach 2.0 children per woman by 2016 and stay there (laissez-faire
fertility of LF scenario);
The AFT scenario; the TFR will reach 2.0 children per woman by 2016 and continue to decline to a
below-replacement level of 1.7 (accelerated fertility or AFT scenario).
As already mentioned above, the starting year of these projections is 2001 starting with a total population in
Bangladesh of 130 million. Therefore, the figures for 2011 are estimates (and not derived from the
population census 2011). Compared to the Census data 2011 these figures in both scenarios are a bit
overestimated.
A brief summary of the results are presented in the next table.
Total population (in million)
LF scenario AFT scenario
2001 130.5 130.5
2011 153.9 154.3
2051 218.1 201.3
Table 11: WB Population projections for Bangladesh, 2001-2051, according to LF and AFT scenario
(summary)
Source: WB, discussion paper 92650, November 2014
In the same WB paper is referred to other projections from other sources like the most recent population
projections from UN and WB (the medium variant from the UN 2012 Revision, as is discussed in section
6.1). As already presented total population in 2050 is projected at 201.9 million, which is very close to the
2015 result from the AFT scenario.
A second source are the projections from Bangladesh Bureau of Statistics (BBS), Population Census
2001, National Series, Volume 1, Dhaka, Ministry of Planning (2007), estimating total population in 2050 at
218.6 million. This is also close to the projection in table 6.1 but now according to the LF scenario.
Finally, the WB paper referred to the US Census Bureau results (assessed in 2009) for Bangladesh. Total
population by US Census Bureau is estimated in 2050 at 233.6 million, which is substantially higher than the
previous ones.
Next to the WB discussion paper, very recently (18th of January 2015), a background paper prepared for the
Bangladesh Planning Commission of the General Economics Division in Support of the Development of the

45
7th FYP 2016-2020 has been published. This paper, which is called “The Impact of the Demographic
Transition on Socioeconomic Development in Bangladesh: Future prospects and Implications for Public
Policy”, UNFPA, January 2015, presented new population projections for Bangladesh specifically for the
abovementioned report, due to absence of up-to-date “official” population projections based on the 2011
census.
The population projections by UNFPA are covering the period 2011-2061. The base year of the
projections was the age-sex distribution derived from the 2011 census after adjusting for the census
undercount and smoothing the age distribution to remove the effects of “age-heaping”.
For this report, three projections were prepared, a medium, high and low variant (comparable to the UN
variants discussed in section 6.1.1):
The Medium Scenario assumes that the Total Fertility Rate (TFR) drops to 2.1 (replacement level) in
the 2011-2016 period, to below replacement (1.9) by 2016-2021 period and remains at 1.9 through
to 2061.
The High Scenario assumes that the TFR would remain constant at its present level (2.3) for the
entire projection period.
The Low Scenario assumes that the TFR declines to below replacement (2.0) during the 2011-16
period, and to 1.6 by the 2016-2021 period where it remains until the end of the projection period.
According to this report, it has also been assumed that the distribution of fertility by age of the mother will
change through time. It stated that “Bangladesh has a distinctive pattern of early marriage and childbearing.
Declining fertility in recent decades has occurred in older age groups with the result that the proportion of
births in younger age groups has been increasing. In these projections it is assumed that the age
distribution of fertility will shift again to the older ages in the longer run given the possible increase in the
age of marriage and first birth.
The projected population for Bangladesh for three scenarios in the period 2011-2061 are presented in table
6.2. It only concerns a summary based on a selection of years. In the UNFPA report the projections are
dealing with three age groups (0-14; 15-59; 60+) and covering each 5 year period from 2011 onwards.
Population in millions
Year Medium scenario High scenario Low Scenario
2011 149.8 149.8 149.8
2051 218.4 245.6 201.3
2061 225.7 265.1 201.1
Table 12: UNFPA Population projections for Bangladesh for three scenarios in the period 2011-2061
(in millions): a summary
Source: UNFPA Background paper as input for 7th FYP2016-2020
Although the results of these three scenarios are also referring to the year 2061, we start our comparison
with the year 2051. The population of Bangladesh in the UNFPA medium scenario is projected at about 218
million, which is (as also stated in the UNFPA report) very close to the WB LF scenario (see table 6.1).
Moreover, it is very close to the “old” BBS forecast for 2050 (which was 218.6 million).

46
The UNFPA low scenario projected the population in Bangladesh at a level of 201 million in 2051. This is also
very close to the other WB AFT scenario (201.3 million; see table 6.1). When comparing the UNFPA figure
with the UN projections (discussed in section 6.1) the UNFPA figure of 201 million in 2051 is very close to
the UN projected 201.9 million in 2050: however, the figure in the UN projection is presenting the medium
variant and NOT the low variant. Concerning the TFR which is currently (2011) 2.3 in Bangladesh, the UN
medium variant is more optimistic than the UNFPA about its decline. The TFR assumptions in the medium
variant of the UN are close, but a bit more conservative than those used by UNFPA in their low scenario.
However, in the UN low scenario the UNFPA assumptions concerning the development of TFR are surpassed
leading to significant lower projections and a significantly declining population just from 2040 onwards. The
UN figure for 2050 is 172 million and for 2060 is 163 million.
Looking at the UNFPA high scenario, we might conclude that the population figure for 2051 projected at
245.6 million is significantly higher than the UN high variant for 2050, which is projected at 235.6 million.
Comparable projections for the year 2061 (or 2060 respectively) are 265 million (UNFPA) and 252 million
(UN). In the UN high scenario the 265 million level is assumed to be reached 10 years later in the year 2070.
Conclusion
As discussed above various population projections for Bangladesh are available up to 2050, each with their
own assumptions concerning TFR and other variables like mortality etc. The results are of course deviating
from each other, because not all assumptions for various variables are the same, the starting year differs,
model(s) used are not the same, etc. etc. Also differences between medium and high respectively low
scenarios deviate for instance +- 20 up to +-30 million (in a particular year). Moreover, future policy
directions are unknown and their effects somewhat unpredictable. But the rough picture is clear: has total
population in Bangladesh in 2050 increased to even 245 million people, or stabilized at for instance 200
million, or after 25 years from today (2015) in which it increased to 175 million on the return back to 172
million?
For the purpose of scenario building exercises and the final development of the socio economic and climate
change scenarios for Bangladesh for the Delta Plan 2100 (BDP2100), in which we are looking at drivers with
high uncertainty and high impact, and also scenarios which does not include policy choices or preferences
that can be influenced by e.g. water planners or decision makers, the above picture for the total population
of Bangladesh is sufficient. Please, be aware that for the period 2050-2100 the uncertainty is even much
higher.
Therefore, as a starting point for the discussion in the scenario exercises we suggest to make use of the UN
projections (as dealt with in section 6.1.1 as well as in the next section). These projections include the
bandwidth as discussed for the period up to 2050 and include also projections for the period after 2050 up
to 2100 (the horizon of the BDP2100).
6.3. Population projections to be used in the BDP2100
6.3.1. Population projections on a national level and a district level: the method
As already discussed in section 6.1 UN (and WB) made population projections for Bangladesh at a national
scale up to 2100 for three main variants (medium, high and low). However, within the BDP2100 project, a
need exists to get more insight in the population projections on a regional scale: that is at the division level
or even at the district level. A recent discussion with officials from BBS revealed that BBS is making

47
population projections at the district level using Census data 2011. At the same time the BBS official argued
that these population projections will not be ready before March/June 2015, which might be still optimistic!
It has been agreed that until more official projections are available, the BDP2100 team can reference the
UN/WB2012 population projection(s). Once the official new BBS reports come out, updating might be
possible.
Because the UN projections are only available at a national level and designing and running a new
population forecasting model at the national level as well as the division/district level is not included in the
scope, timing and budget of the BDP2100 project, we have suggested the following:
One of the methods that can be used for regionalizing national forecasts is the so-called “Shift &
Share Method38”39. Main components are the difference in regional growth rate (read: district
growth rate) against the national growth rate of population in a certain period/year and the
difference in developments in growth rates between periods (district against national level).
Although this method has some disadvantages, and is in principle not suitable for very long periods
(>30 years of more) we believe that for our purpose of designing scenarios for BDP2100 as well as
the way it will be used on a regional level in the Delta Ateliers, this method serves the purpose.
However, because this method is pure mechanical, for long periods like in the BDP2100, possible
corrections in some cases have to be made. This is open for discussion.
The main condition of using this method is that the forecasted population on district level is adding
up to the national figure (for every period or year which is chosen).
Apart from national population forecasts per period or year, we do need (of course) historical
population data on national level and on a district level. Moreover, the historical data (on a
national, which are the sum of the regional data) have to be in line with the national forecasts. In
other words: the latest historical data available (f.i. 2011 or 2010) on national level (and thus on a
district level) have to be the starting point values for the national forecasts! (see also Box 1 in which
an example in Turkey is presented, based on shift & share).
38 A Practitioners’s Guide to State and Local Population Projections, Stanley K Smith, Jeff Tayman, David A Swanson, December
2013, Springer, USA/Dordrecht 39 In Marmara Basin Socio-Economic Assessment, Turkey, ECORYS Nederland BV, 2006

48
Box 1: Population forecast 2010-2030 Marmara Basin Provinces, Turkey *)
To estimate the impact of population on total pollution load in Marmara Basin in the next 25 years,
the population forecast is essential. Based on a shift and share method population forecasts for 8
provinces linked to the Marmara Basin have been developed for every 5-years period from 2000 up
to 2030 according to three different population growth scenarios: medium , high and low growth.
Below we show the medium population forecast method and final results.
The following steps have been taken for the medium population growth scenario:
1. For this medium growth scenario population growth rates from the United Nations’ population projections for
Turkey (UN, 2002) have been used as a basis for forecasting the population from 2010 onwards. The UN provides
growth rates for urban, rural and total population for each 5-years period up to 2025 (unfortunately, only on a
national level). Based on extrapolation also population growth rates have been estimated for the period 2026-
2030.
2. Next, for urban as well as for rural areas deviations in growth rates between Turkey and each of the provinces
within Marmara Basin have been calculated and analyzed for the period 2000-2010 (for two 5-years periods).
Besides, for each 5-years period from 2010 up to 2030 the development of these deviations has been
extrapolated (for each province separately). This is done in a conservative way by using the change from period
2000-2005 to 2006-2010 as a constant factor in time.
3. Finally, the projected deviations in growth rates between Turkey and each of the provinces within Marmara Basin
are combined with the projected national growth rates for Turkey in the period 2010-2030 (from step 1). This
exercise results in specific population growth rates for each of the provinces in Marmara Basin, distinguished for
urban and rural settlements. Based on these growth rates the population per province is forecasted (totaling
urban and rural settlements ) for the period 2010-2030
The population results per province are shown in the table below.
Population Scenario –: Medium Growth (Marmara Basin Provinces, Turkey) 2005 -2030
Provinces 2005 2010 2015 2020 2025 2030
Istanbul 11,169,050 12,583,832 13,968,436 15,264,007 16,498,891 17,625,790
Bursa 2,117,838 2,359,554 2,596,347 2,819,887 3,038,125 3,244,531
Kocaeli 1,283,203 1,415,434 1,543,382 1,663,538 1,782,390 1,898,293
Balıkesir 839,643 852,395 855,725 849,565 838,901 823,716
Kütahya 309,938 313,652 314,858 313,546 311,558 308,894
Tekirdag 219,681 245,541 270,987 294,893 317,812 338,783
Çanakkale 359,656 360,198 357,687 352,804 348,149 344,006
Yalova 183,551 198,418 212,692 226,046 239,491 252,897
Total 16,482,560 18,329,024 20,120,113 21,784,285 23,375,317 24,836,911
*) Marmara Basin Socio-Economic Assessment , Turkey, 2006, ECORYS Nederland BV.
This study is part of the Environmental Master Plan & Investment Strategy for the Marmara Sea
Basin, prepared by a consortium consisting of Grontmij NL (lead), WL/Delft Hydraulics and ECORYS
Nederland BV, 2008, Turkey/The Netherlands

49
Taking into account the issues mentioned above (using the shift & share method) some inconsistencies in
data have to be solved. Therefore, the following steps are taken (to compile the data sets needed):
1. Estimating the starting values at the district level (summing up to the national level) by up-scaling the
2011 census data (at district level) with a 96% coverage to 100% coverage (for each of the districts in
the same way, using the factor 100/96!);
2. Calculating back the 2011 census data on a district level to the year 2010 (which will be used as starting
year in the projections, based on the UN figures), taking into account (per district) the average annual
growth rate in the last 10 years (derived from the two censuses 2001 and 2011);
3. Calculating the historical growth rates (per 10 years period, from 1991 – 2001 and from 2001 -2011) on
district level (and summing up to the national level) using the original census data for 1991, 2001 and
2011 and taken the average of both periods (per district) as the regional growth rate for future periods;
unfortunately more historical data on district level (64) for earlier years (f.i. census 1981) were not
available (in 1981 only 22 districts were existing);
4. Calculating the national population growth rates (per 10 years period) from WB/UN, following the three
variants (medium, low and high) up to 2100. The reason is that the starting value of the UN/WB
projections deviates a bit from the last population census data 2011. Based on a discussion with officials
from BBS, the latter will be taken (see a).
Based on the above mentioned data sets, and starting with the population figures for 2010 per district, the
following (mechanical) procedure has been followed (based on shift and share) for each of the three variants
distinguished by the UN to make population projections on a district level and a national level:
1. Applying the average 10 years population growth rate per district from the past (average 1991-2011) at
the projection period 2010-2020;
2. Adding up the absolute population figures for 2020 to the national level;
3. Calculating the national 2020 population projection based on the 10 years growth rate derived from the
UN projections;
4. Calculating the correction factor (scaling factor) based on the results found under 2 and 3, in order to fit
the sum of the projections on a district level with the national projection;
5. Applying the correction factor found under “4” on all districts, leading to the new data set for the next
period 2020-2030.
6. Repeating the above steps from 1 to 5 for each 10 years period up to the last period 2090-2100.
This has been done for all three variants: medium, high and low.
In the above procedure ONE assumption in particular has been introduced and ONLY with respect to the
growth rate of population in Dhaka Zila for the next 90 years. The main reason is that in the past 20 years
(1991-2011) the growth rate of Dhaka Zila is about 44 % in a 10-years period (average of two 10-years
periods). Continuation of this 44% growth rate in each of the 10-years periods up to 2100 is only leading to
absurd not realistic figures (in terms of total population and population density). Therefore, we have
assumed that the growth rate of 44% is only VALID in the first 10-years period (2010-2020), but thereafter
THE RATE will decrease with 10% points per 10-years period. So, in the next period (2020-2030) the growth
rate will be 44%*0.9=39.6%; in the period thereafter (2030-2040) it will be 39.6%*0.9=35.6%. and so on. Of
course: the 10% decrease in growth rate is a first best guess (open for discussion). But, it shows more
realistic figures (looking at the absolute figures and population density in the Dhaka Zila in particular). This
of course is influencing all other Zila's.
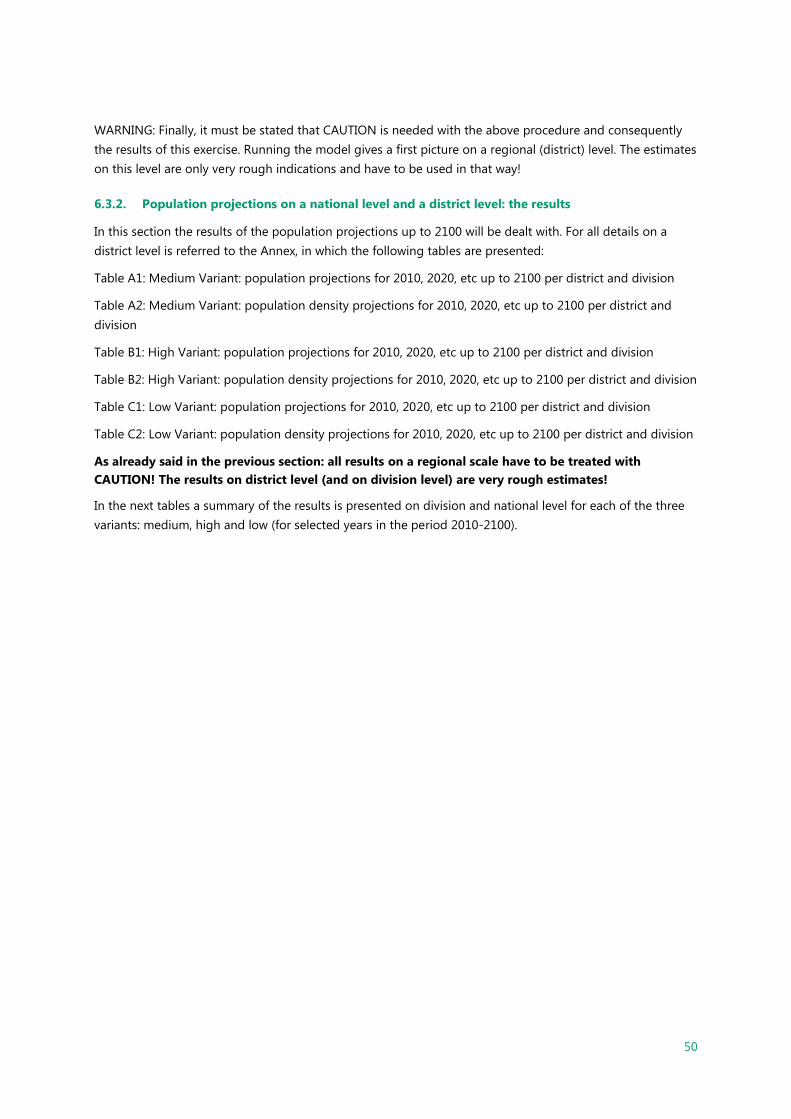
50
WARNING: Finally, it must be stated that CAUTION is needed with the above procedure and consequently
the results of this exercise. Running the model gives a first picture on a regional (district) level. The estimates
on this level are only very rough indications and have to be used in that way!
6.3.2. Population projections on a national level and a district level: the results
In this section the results of the population projections up to 2100 will be dealt with. For all details on a
district level is referred to the Annex, in which the following tables are presented:
Table A1: Medium Variant: population projections for 2010, 2020, etc up to 2100 per district and division
Table A2: Medium Variant: population density projections for 2010, 2020, etc up to 2100 per district and
division
Table B1: High Variant: population projections for 2010, 2020, etc up to 2100 per district and division
Table B2: High Variant: population density projections for 2010, 2020, etc up to 2100 per district and division
Table C1: Low Variant: population projections for 2010, 2020, etc up to 2100 per district and division
Table C2: Low Variant: population density projections for 2010, 2020, etc up to 2100 per district and division
As already said in the previous section: all results on a regional scale have to be treated with
CAUTION! The results on district level (and on division level) are very rough estimates!
In the next tables a summary of the results is presented on division and national level for each of the three
variants: medium, high and low (for selected years in the period 2010-2100).
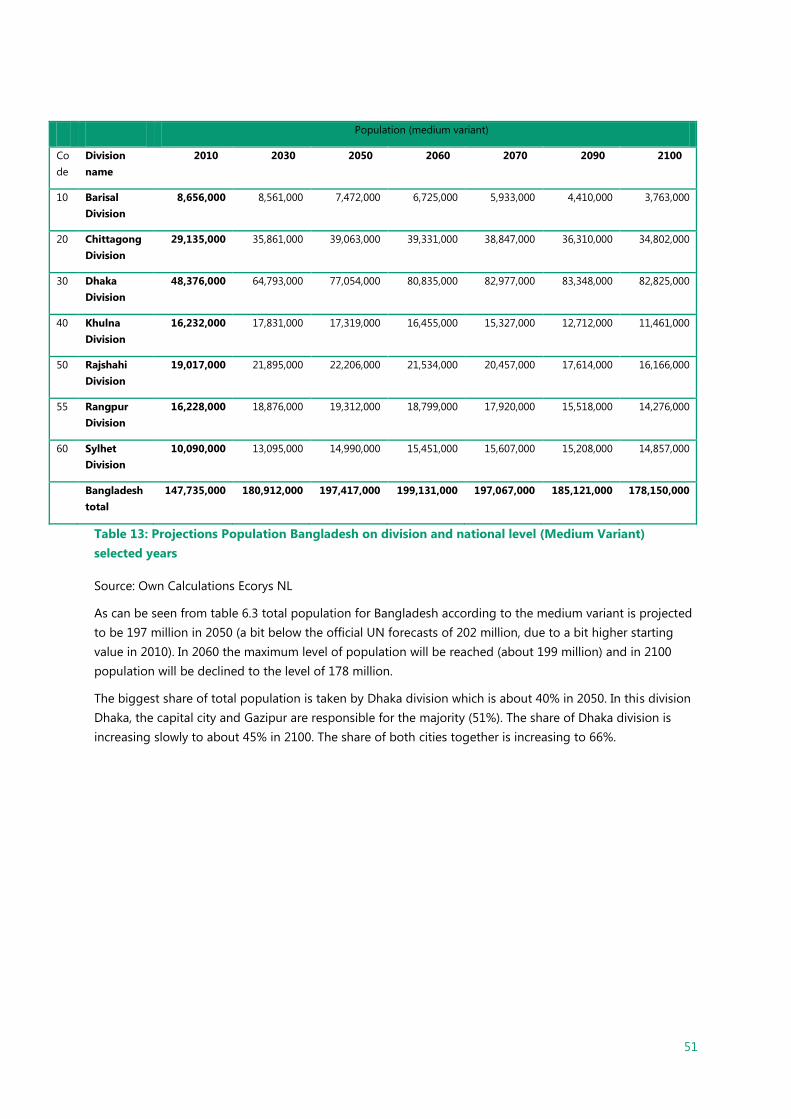
51
Population (medium variant)
Co
de
Division
name
2010 2030 2050 2060 2070 2090 2100
10 Barisal
Division
8,656,000 8,561,000 7,472,000 6,725,000 5,933,000 4,410,000 3,763,000
20 Chittagong
Division
29,135,000 35,861,000 39,063,000 39,331,000 38,847,000 36,310,000 34,802,000
30 Dhaka
Division
48,376,000 64,793,000 77,054,000 80,835,000 82,977,000 83,348,000 82,825,000
40 Khulna
Division
16,232,000 17,831,000 17,319,000 16,455,000 15,327,000 12,712,000 11,461,000
50 Rajshahi
Division
19,017,000 21,895,000 22,206,000 21,534,000 20,457,000 17,614,000 16,166,000
55 Rangpur
Division
16,228,000 18,876,000 19,312,000 18,799,000 17,920,000 15,518,000 14,276,000
60 Sylhet
Division
10,090,000 13,095,000 14,990,000 15,451,000 15,607,000 15,208,000 14,857,000
Bangladesh
total
147,735,000 180,912,000 197,417,000 199,131,000 197,067,000 185,121,000 178,150,000
Table 13: Projections Population Bangladesh on division and national level (Medium Variant)
selected years
Source: Own Calculations Ecorys NL
As can be seen from table 6.3 total population for Bangladesh according to the medium variant is projected
to be 197 million in 2050 (a bit below the official UN forecasts of 202 million, due to a bit higher starting
value in 2010). In 2060 the maximum level of population will be reached (about 199 million) and in 2100
population will be declined to the level of 178 million.
The biggest share of total population is taken by Dhaka division which is about 40% in 2050. In this division
Dhaka, the capital city and Gazipur are responsible for the majority (51%). The share of Dhaka division is
increasing slowly to about 45% in 2100. The share of both cities together is increasing to 66%.
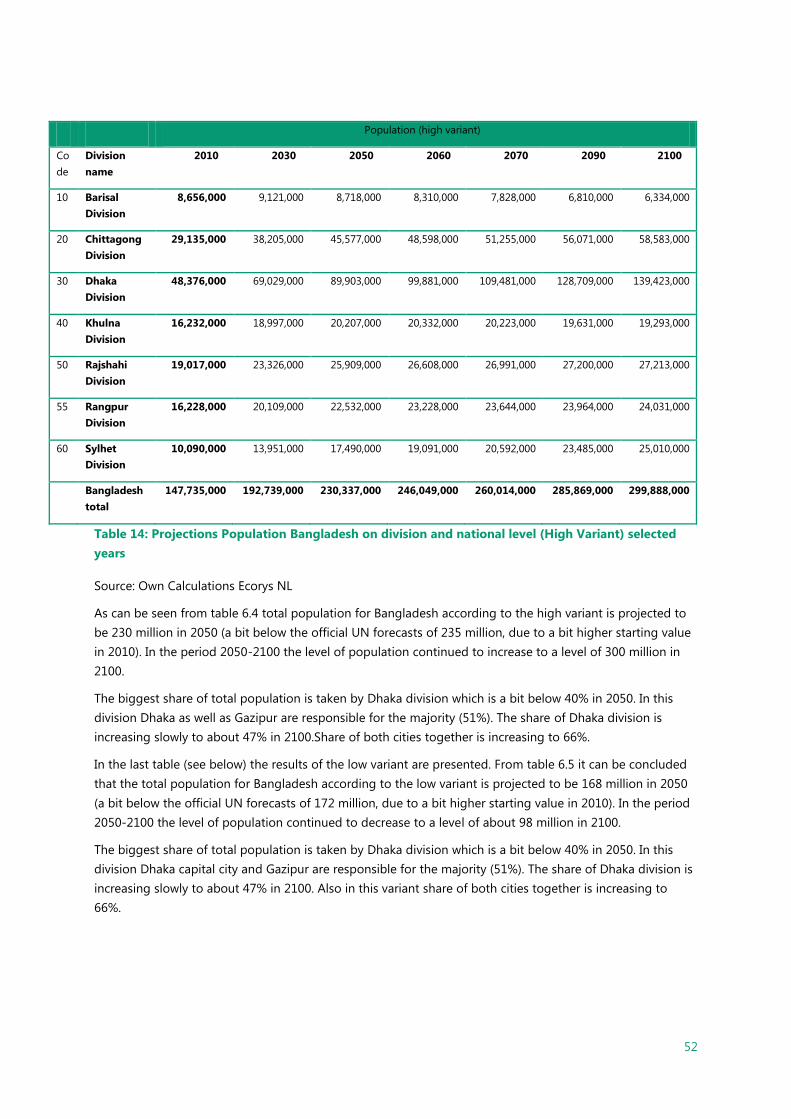
52
Population (high variant)
Co
de
Division
name
2010 2030 2050 2060 2070 2090 2100
10 Barisal
Division
8,656,000 9,121,000 8,718,000 8,310,000 7,828,000 6,810,000 6,334,000
20 Chittagong
Division
29,135,000 38,205,000 45,577,000 48,598,000 51,255,000 56,071,000 58,583,000
30 Dhaka
Division
48,376,000 69,029,000 89,903,000 99,881,000 109,481,000 128,709,000 139,423,000
40 Khulna
Division
16,232,000 18,997,000 20,207,000 20,332,000 20,223,000 19,631,000 19,293,000
50 Rajshahi
Division
19,017,000 23,326,000 25,909,000 26,608,000 26,991,000 27,200,000 27,213,000
55 Rangpur
Division
16,228,000 20,109,000 22,532,000 23,228,000 23,644,000 23,964,000 24,031,000
60 Sylhet
Division
10,090,000 13,951,000 17,490,000 19,091,000 20,592,000 23,485,000 25,010,000
Bangladesh
total
147,735,000 192,739,000 230,337,000 246,049,000 260,014,000 285,869,000 299,888,000
Table 14: Projections Population Bangladesh on division and national level (High Variant) selected
years
Source: Own Calculations Ecorys NL
As can be seen from table 6.4 total population for Bangladesh according to the high variant is projected to
be 230 million in 2050 (a bit below the official UN forecasts of 235 million, due to a bit higher starting value
in 2010). In the period 2050-2100 the level of population continued to increase to a level of 300 million in
2100.
The biggest share of total population is taken by Dhaka division which is a bit below 40% in 2050. In this
division Dhaka as well as Gazipur are responsible for the majority (51%). The share of Dhaka division is
increasing slowly to about 47% in 2100.Share of both cities together is increasing to 66%.
In the last table (see below) the results of the low variant are presented. From table 6.5 it can be concluded
that the total population for Bangladesh according to the low variant is projected to be 168 million in 2050
(a bit below the official UN forecasts of 172 million, due to a bit higher starting value in 2010). In the period
2050-2100 the level of population continued to decrease to a level of about 98 million in 2100.
The biggest share of total population is taken by Dhaka division which is a bit below 40% in 2050. In this
division Dhaka capital city and Gazipur are responsible for the majority (51%). The share of Dhaka division is
increasing slowly to about 47% in 2100. Also in this variant share of both cities together is increasing to
66%.

53
Population (low variant)
Co
de
Division
name
2010 2030 2050 2060 2070 2090 2100
10 Barisal
Division
8,656,000 8,005,000 6,361,000 5,394,000 4,432,000 2,726,000 2,071,000
20 Chittagong
Division
29,135,000 33,531,000 33,256,000 31,543,000 29,019,000 22,449,000 19,154,000
30 Dhaka
Division
48,376,000 60,584,000 65,600,000 64,829,000 61,986,000 51,530,000 45,586,000
40 Khulna
Division
16,232,000 16,673,000 14,745,000 13,197,000 11,450,000 7,859,000 6,308,000
50 Rajshahi
Division
19,017,000 20,472,000 18,905,000 17,270,000 15,282,000 10,890,000 8,898,000
55 Rangpur
Division
16,228,000 17,649,000 16,441,000 15,076,000 13,387,000 9,594,000 7,857,000
60 Sylhet
Division
10,090,000 12,244,000 12,762,000 12,391,000 11,659,000 9,402,000 8,177,000
Bangladesh
total
147,735,000 169,159,000 168,071,000 159,700,000 147,214,000 114,451,000 98,052,000
Table 15: Projections Population Bangladesh on division and national level (Low Variant) selected
years
Source: Own Calculations Ecorys NL

54
55
7. Analysis of Policies & Plans
Within the context of population and demography it is interesting to look at the policies and plans within
this context. In this sense, the most critical policies and plans include the following:
The objectives of the National Population Policy are to improve the status of family planning, maternal and
child health including reproductive health services and to improve the living standard of the people of
Bangladesh through making a desirable balance between population and development in the context of
Millennium Development Goals (MDGs) and Interim Poverty Reduction Strategy Paper (IPRSP)/Five year
planning.
The policy emphasizes on improved quality of care and increased utilization of services that will be needed
for reducing fertility, maternal mortality and morbidity, infant and child mortality. Besides, ensuring the
availability of family planning materials is one of the cornerstones of the population policy. Some strategies
proposed in this area are:
(a) Provision for Maternal, child and reproductive health services through a comprehensive client centred
approach. These services should be provided along with health services at Upazila and Union levels, through
a one-stop service and home delivery system. Both system should be complementary to one another;
(b) Ensure full coverage of safe delivery through skilled birth attendants;
(c) Special attention to young, low parity and newly married couples and those with unmet need for RH
information and services. Freedom and right to choose contraceptive methods according to individual
needs and preferences will be emphasized. In addition, supply of contraceptives should be ensured through
home visitation and poor community should get supply of contraceptives free of cost;
(d) Priority should be given in the provisions of social services to the couples with one child for their
adopting small family norm;
(e) Establishment of Union level Health and Family Welfare Centres, wherever needed and appointment of a
doctor in these centres will be pursued in a phased manner to increase availability and access to quality
care;
(f) Uninterrupted supply of required medicines, equipment for all the service centres and strengthening of
the contraceptive security system so that supplies are available wherever and whenever they are needed;
(g) Ensure access to essential information and services especially amongst high risk behaviour groups for
prevention of STIs, RTIs and HIV/AIDS infection;
(h) Ensure supply of Vitamin A and other micronutrients and prevention of malnutrition among children and
pregnant women; and
(i) Support and ensure full coverage of child immunization.
The policy further focuses on addressing the overall planning and management of population however,
there is no linkage to appropriate forecasting and how the management aspects will take into consideration
of long term planning processes. The Challenges of urbanization while addressed to some extent, does not
include specific actions to address the growing density in specific urban centres and formal organization of
slums and squatters.

56
Appropriate financial assessments to address the visions of the policy, as in case of numerous plans and
policies are not addressed.
Urbanization Policy: To be covered in the Spatial Planning and Land use Baseline Study.
57
8. Recommendations
The changing nature of the structure of Bangladesh’s population has major implications for the types of
policies that need to be enacted in the near future to ensure that the demographic dividend is fully realized.
The demographic dividend itself is based on the assumption that in the near future, given the changing
nature of age structure of the population, there will be a significantly large percentage of the population in
the 15-51 age group that are geographically mobile, educated and in general have no dependents (young
or old) and thus can be the engine for a significant boost in economic growth. However in order to enable
the ideal conditions for this large and productive labour force it is vital that there is an increased focus on
education, health care and social protection schemes that increase the productivity and reduce the extent of
the burden of dependents of this growing workforce. The population projections do strongly indicate that it
will be vital to heavily invest in human resource development in the immediate future.
The General Economic Division’s Report “The Impact of the Demographic Transition on Socioeconomic
Development in Bangladesh: Future prospects and Implications for Public Policy” which makes up part of
the series of Background Studies that were conducted for the 7th Five Year Plan goes into comprehensive
depth on the implications of the trends of population growth and urbanization. The results presented in this
report mirror very closely the findings in the above mentioned report and thus the recommendations will be
very similar. As the main objective of this particular baseline study is to provide an overview of the current
and potential trends and the no-regret strategies are to be explicated in the final Bangladesh Delta Plan
2100 document, this section will be brief and very general.
8.1. Recommendations
Reducing the fertility level to the replacement level and further below is vital and should be a top
prority. Even given the low projection, the population growth has dire implications for population
density, labour force absorption, urban population growth, climate change refuguess etc.
Policies that focus on lowering morbidity and mortality levels among the poor should be
considered a priority
A major drive needs to be initnated that places extreme importance on educational investment
Developing a comprhenisve urban development strategy is vital.
Develop skill development programmes for international labour migration programs with the aim
of ensuring continued remittances

58
8.2. Conclusion
In the near term policies that focus on human resource development, targeting in a tiered strategic manner
the expected growth is the best way forward. As absolute population size will continue to increase it is
extremely important to be able to absorb the growing labour force into the active economy. Otherwise, if
business as usual practices are followed, then the wealth gap and income inequality will increase and that
will put severe pressure on social harmony and cohesion.
A lot of the development can be left up to the private sector market forces but there needs to be farsighted
government policies that break the poverty trap and reduce income and wealth inequality. The core of any
policy recommendation would thus be: invest heavily in human resource development and create a
business enabling environment coupled with effective and comprehensive urban development
strategies that harmonize all these disparate /elements into a cohesive whole.
59
9. Knowledge Gaps
9.1. Population
Population can be considered a driver of primary importance; it has significant policy implications when
assessing the kinds of measures that need to be taken in various sectors in the context of water resource
management and investment planning. Population data, ranging from current population figures to future
prospects is thus a vital component in effective planning and decision making. However there exists
significant knowledge gaps in the current publically available datasets and sources.
9.1.1. Lack of Current Disaggregated Trend Data
The main issue with population data is that the most accurate assessment requires a full national wide
population census. These censuses are currently conducted every decade (the currently available digital
versions are 1981, 1991, 2001 and 2011 i.e. 4 data points) and are very expensive. These censuses are the
main source of disaggregated data (in terms of sub-national disaggregation). The census data are available
at the village/ward level disaggregation. However accurate annual growth trends (that would allow a better
understanding of the demographic changes) are difficult to obtain using only five data points. All annual
trend data are therefore estimates and given the fact that the initial reports are difficult to identify (reports
sometimes cite each other) the underlying assumptions that are used are also difficult to assess. Thus the
following knowledge gaps have been identified:
Lack of disaggregated trend data for various metrics: i.e. upazila level trend data that is nationally
sanctioned/ accepted by the government are not available or date back at least a decade.
TFR, mortality, CBR and CDR data for different demographic components (e.g. urban slum, rural
etc.) are not available within comparable dates; e.g. TFR for urban slums are available as of 2009
but CBR and CDR data are available as of 2005 whereas TFR for rural is available as of 2012. This
makes it difficult to assess trends.
9.1.2. Lack of updated population projections
Population forecasts are of the utmost importance in drafting an acceptable planning document, adjusting
policy measures or assessing investment plans. However the last updated population forecast that is
available from BBS is from 2006. BBS is planning to generate a national population forecast using the
Population Census 2011. However no concrete date for the completion of this report is officially available.
There are UN and World Bank forecasts of Bangladesh’s population to 2100 but those are only at the
national level and not disaggregated to sub-national geographical locations. These forecasts can only be
used if there is an official sanction; the Statistics Act 2013 limits the use of non-BBS source data in
Government Documents. Thus the following knowledge gaps have been identified
Sub-national i.e. regional forecasts (at least up to the 64 district level) are not available from BBS.
Updated data and robust estimations of various population metrics (e.g. TFR, CBR, CDR, Net
Migration, etc) need to be standardized and available for comparable year ranges.

60
9.2. Urbanization
Changes in the level of urbanization will have significant policy implications. This baseline study mostly
looks at the population aspect of Urbanization and therefore the knowledge gaps are Most of the
knowledge gaps for the Urbanization driver are identified in the spatial planning baseline. Some of the basic
ones are closely linked with the Population Driver Knowledge Gaps. It is vital to bear in mind that future
forecasting is vital for proper planning and infrastructure investment plans.
9.2.1. Updated Data
Updated population figures for major cities are often dated.
Trends of various metrics are missing as annual data is missing.
Definitions of metrics change as do administrative boundaries; making available historical data no
longer relevant
9.2.2. Forecasts
There are very few forecasts (updated) available for urban centre growth and expansion.
Demographic metrics (such as IMR, MMR, TFR) are difficult to assess or have significant gaps.
61
10. Limitations of the Study
10.1. Historical Data
The accuracy of available historical data depends completely on the quality of the primary data collection.
All levels of accuracy depend on quality and methodology of the primary data collection.
10.2. Forecasts
The uncertainty levels associated with the forecasts largely depends on the accuracy of the primary data that
it is based on and the validity of the assumptions that underpin the methodology used. It is often difficult to
generate accurate forecasts given that assumptions are subject to interpretation and the selection of the
same depends on the needs of the forecaster. As already said in the previous section: all results of the
forecasts used in this study (in particular on a regional level) have to be treated with CAUTION! The results
on district level (and on division level) are very rough estimates based on the best available data.
10.3. Recommendations
The recommendations outlined in this study are at best very general indications of the direction that policy
and implementation programs should take. This is because a great deal of further study and assessment of
the feasibility and impact of the issues are needed before actionable, target based policies can be drafted.
The recommendations are thus a starting point for thinking about strategies to tackle the challenges that
are expected and thus should form general guidelines for future debate and investigations.
62
References
Please note that all papers and reports referenced in this study are based on primary data obtained from the
following reports:
Bangladesh Bureau of Statistics:
1. Population Census, 1991, National Series Vol. I, Analytical Report
2. Population Census 1991, National Series, Vol. III, Urban Area Report
3. Population Census 1991, National Series, Vol-IV, Socio-Economic and Demographic Report
4. Census of Slum Areas and Floating Population 1997, Volume 1
5. Preliminary Report, Population Census 2001
6. Population Census 2001, National Report (Provisional) July 2003
7. Population Census, 2001, Zila Series
8. Population Census, 2001, Community
9. Population Census 2001, National Series, Vol-II Union Statistics
10. Population Census 2001, National Series, Vol-I Analytical Report
11. Population & Housing Census Volumes 2011 I to IV (full)
12. Statistical Year Book 1991-2013
13. Household Income and Expenditure Survey 2000
14. Household Income and Expenditure Survey 2005
15. Household Income and Expenditure Survey 2010
16. Labour Force Survey 1999-2000
17. Labour Force Survey 2009
United Nations (UN), 2013, World Population Prospects, the 2012 Revision: Volume I: Comprehensive Tables,
UN.
United Nations (UN), 2013, World Population Prospects, the 2012 Revision: Volume II: Demographic Profiles,
UN.
United Nations (UN), 2013, Technical Paper No. 2013/3 Demographic Components of Future Population
Growth, UN.
World Bank (WB), November 2014, Discussion paper (92650), Population, family planning, and reproductive
health policy harmonization in Bangladesh, World Bank.
UNFPA, January 2015, The Impact of the Demographic Transition on Socioeconomic Development in
Bangladesh: Future prospects and Implications for Public Policy”, UNFPA.
World Bank: World Development Indicators Database
A Practitioners’s Guide to State and Local Population Projections, Stanley K Smith, Jeff Tayman, David A
Swanson, December 2013, Springer, USA/Dordrecht
Marmara Basin Socio-Economic Assessment, Turkey, ECORYS Nederland BV, 2006; study is part of:
Environmental Master Plan & Investment Strategy for the Marmara Sea Basin, prepared by a consortium
consisting of Grontmij NL (lead), WL/Delft Hydraulics and ECORYS Nederland BV, 2008, Turkey/The
Netherlands

63
Appendix: Population and population density figures on district level for 3 variants.
Table A1 Population forecasts Medium Variant (rounded off to the nearest 1000 people) 2010 (base year) up to 2100
Code DISTRICT NAME Population (medium variant)
ZILA 2010 2020 2030 2040 2050 2060 2070 2080 2090 2100
Barisal Division
4 Barguna Zila 925,000 948,000 940,000 901,000 839,000 762,000 678,000 592,000 511,000 438,000
6 Barisal Zila 2,424,000 2,375,000 2,253,000 2,066,000 1,840,000 1,599,000 1,361,000 1,137,000 938,000 769,000
9 Bhola Zila 1,843,000 1,930,000 1,958,000 1,919,000 1,827,000 1,698,000 1,544,000 1,379,000 1,217,000 1,067,000
42 Jhalokhati Zila 712,000 688,000 644,000 583,000 512,000 439,000 369,000 304,000 247,000 200,000
78 Patuakhali Zila 1,592,000 1,669,000 1,694,000 1,662,000 1,584,000 1,473,000 1,341,000 1,199,000 1,058,000 929,000
79 Pirojpur Zila 1,159,000 1,133,000 1,072,000 980,000 870,000 754,000 640,000 533,000 439,000 359,000
Chittagong Division
3 Bandarban Zila 394,000 488,000 585,000 679,000 764,000 840,000 904,000 955,000 997,000 1,034,000
12 Brahmanbaria Zila 2,908,000 3,198,000 3,405,000 3,503,000 3,502,000 3,416,000 3,262,000 3,058,000 2,832,000 2,607,000
13 Chandpur Zila 2,501,000 2,603,000 2,624,000 2,556,000 2,419,000 2,234,000 2,020,000 1,793,000 1,572,000 1,370,000
15 Chittagong Zila 7,821,000 8,954,000 9,928,000 10,637,000 11,071,000 11,245,000 11,182,000 10,917,000 10,527,000 10,092,000
19 Comilla Zila 5,522,000 6,093,000 6,512,000 6,724,000 6,745,000 6,604,000 6,329,000 5,955,000 5,535,000 5,114,000
22 Cox's Bazar Zila 2,324,000 2,818,000 3,310,000 3,756,000 4,141,000 4,455,000 4,692,000 4,853,000 4,956,000 5,033,000
30 Feni Zila 1,475,000 1,612,000 1,706,000 1,745,000 1,734,000 1,682,000 1,596,000 1,488,000 1,369,000 1,253,000
46 Khagrachhari Zila 629,000 805,000 996,000 1,191,000 1,384,000 1,570,000 1,743,000 1,900,000 2,045,000 2,189,000
51 Lakshmipur Zila 1,774,000 1,944,000 2,064,000 2,116,000 2,108,000 2,050,000 1,951,000 1,823,000 1,683,000 1,544,000
75 Noakhali Zila 3,176,000 3,590,000 3,931,000 4,158,000 4,273,000 4,285,000 4,207,000 4,055,000 3,860,000 3,654,000
84 Rangamati Zila 611,000 711,000 801,000 872,000 922,000 951,000 961,000 954,000 934,000 910,000
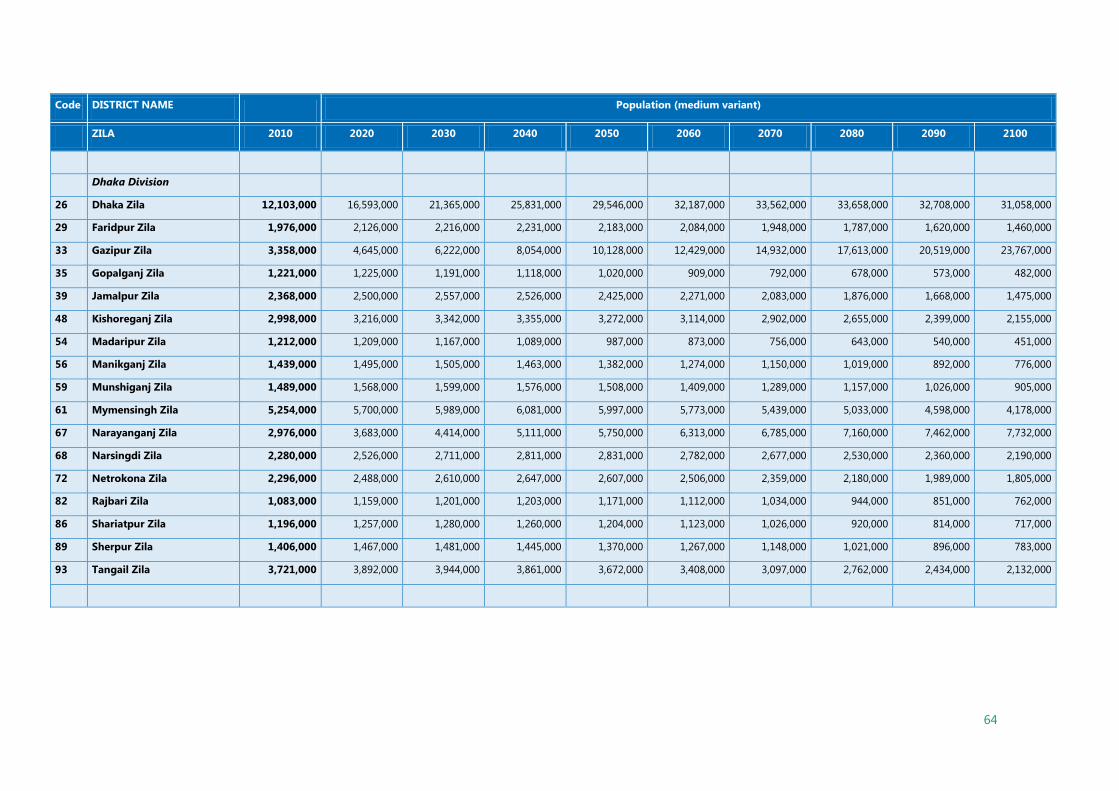
64
Code DISTRICT NAME Population (medium variant)
ZILA 2010 2020 2030 2040 2050 2060 2070 2080 2090 2100
Dhaka Division
26 Dhaka Zila 12,103,000 16,593,000 21,365,000 25,831,000 29,546,000 32,187,000 33,562,000 33,658,000 32,708,000 31,058,000
29 Faridpur Zila 1,976,000 2,126,000 2,216,000 2,231,000 2,183,000 2,084,000 1,948,000 1,787,000 1,620,000 1,460,000
33 Gazipur Zila 3,358,000 4,645,000 6,222,000 8,054,000 10,128,000 12,429,000 14,932,000 17,613,000 20,519,000 23,767,000
35 Gopalganj Zila 1,221,000 1,225,000 1,191,000 1,118,000 1,020,000 909,000 792,000 678,000 573,000 482,000
39 Jamalpur Zila 2,368,000 2,500,000 2,557,000 2,526,000 2,425,000 2,271,000 2,083,000 1,876,000 1,668,000 1,475,000
48 Kishoreganj Zila 2,998,000 3,216,000 3,342,000 3,355,000 3,272,000 3,114,000 2,902,000 2,655,000 2,399,000 2,155,000
54 Madaripur Zila 1,212,000 1,209,000 1,167,000 1,089,000 987,000 873,000 756,000 643,000 540,000 451,000
56 Manikganj Zila 1,439,000 1,495,000 1,505,000 1,463,000 1,382,000 1,274,000 1,150,000 1,019,000 892,000 776,000
59 Munshiganj Zila 1,489,000 1,568,000 1,599,000 1,576,000 1,508,000 1,409,000 1,289,000 1,157,000 1,026,000 905,000
61 Mymensingh Zila 5,254,000 5,700,000 5,989,000 6,081,000 5,997,000 5,773,000 5,439,000 5,033,000 4,598,000 4,178,000
67 Narayanganj Zila 2,976,000 3,683,000 4,414,000 5,111,000 5,750,000 6,313,000 6,785,000 7,160,000 7,462,000 7,732,000
68 Narsingdi Zila 2,280,000 2,526,000 2,711,000 2,811,000 2,831,000 2,782,000 2,677,000 2,530,000 2,360,000 2,190,000
72 Netrokona Zila 2,296,000 2,488,000 2,610,000 2,647,000 2,607,000 2,506,000 2,359,000 2,180,000 1,989,000 1,805,000
82 Rajbari Zila 1,083,000 1,159,000 1,201,000 1,203,000 1,171,000 1,112,000 1,034,000 944,000 851,000 762,000
86 Shariatpur Zila 1,196,000 1,257,000 1,280,000 1,260,000 1,204,000 1,123,000 1,026,000 920,000 814,000 717,000
89 Sherpur Zila 1,406,000 1,467,000 1,481,000 1,445,000 1,370,000 1,267,000 1,148,000 1,021,000 896,000 783,000
93 Tangail Zila 3,721,000 3,892,000 3,944,000 3,861,000 3,672,000 3,408,000 3,097,000 2,762,000 2,434,000 2,132,000

65
Code DISTRICT NAME Population (medium variant)
ZILA 2010 2020 2030 2040 2050 2060 2070 2080 2090 2100
Khulna Division
1 Bagerhat Zila 1,545,000 1,498,000 1,406,000 1,276,000 1,125,000 967,000 815,000 673,000 550,000 446,000
18 Chuadanga Zila 1,163,000 1,313,000 1,435,000 1,517,000 1,557,000 1,560,000 1,529,000 1,473,000 1,400,000 1,324,000
41 Jessore Zila 2,847,000 3,114,000 3,298,000 3,375,000 3,355,000 3,255,000 3,092,000 2,883,000 2,656,000 2,432,000
44 Jhenaidah Zila 1,824,000 1,986,000 2,095,000 2,135,000 2,114,000 2,042,000 1,932,000 1,794,000 1,645,000 1,500,000
47 Khulna Zila 2,421,000 2,482,000 2,465,000 2,365,000 2,204,000 2,004,000 1,785,000 1,560,000 1,347,000 1,157,000
50 Kushtia Zila 2,005,000 2,179,000 2,294,000 2,333,000 2,305,000 2,223,000 2,098,000 1,945,000 1,780,000 1,620,000
55 Magura Zila 946,000 1,017,000 1,060,000 1,066,000 1,042,000 994,000 928,000 851,000 771,000 694,000
57 Meherpur Zila 676,000 745,000 795,000 819,000 821,000 803,000 768,000 722,000 670,000 618,000
65 Narail Zila 749,000 750,000 728,000 682,000 621,000 552,000 480,000 410,000 346,000 290,000
87 Satkhira Zila 2,056,000 2,188,000 2,256,000 2,248,000 2,175,000 2,055,000 1,900,000 1,725,000 1,546,000 1,379,000
Rajshahi Division
10 Bogra Zila 3,499,000 3,771,000 3,936,000 3,969,000 3,888,000 3,717,000 3,479,000 3,197,000 2,902,000 2,619,000
38 Joypurhat Zila 945,000 986,000 996,000 972,000 922,000 854,000 774,000 689,000 605,000 529,000
64 Naogaon Zila 2,686,000 2,821,000 2,870,000 2,821,000 2,694,000 2,510,000 2,290,000 2,051,000 1,815,000 1,596,000
69 Natore Zila 1,757,000 1,860,000 1,908,000 1,890,000 1,819,000 1,709,000 1,571,000 1,419,000 1,265,000 1,121,000
70 Chapai Nawabganj Zila 1,691,000 1,915,000 2,099,000 2,224,000 2,289,000 2,300,000 2,261,000 2,183,000 2,082,000 1,974,000
76 Pabna Zila 2,589,000 2,834,000 3,004,000 3,076,000 3,061,000 2,972,000 2,825,000 2,637,000 2,431,000 2,228,000
81 Rajshahi Zila 2,669,000 2,988,000 3,240,000 3,395,000 3,455,000 3,432,000 3,337,000 3,187,000 3,005,000 2,817,000
88 Sirajganj Zila 3,181,000 3,553,000 3,843,000 4,016,000 4,077,000 4,040,000 3,919,000 3,732,000 3,510,000 3,283,000
Rangpur Division
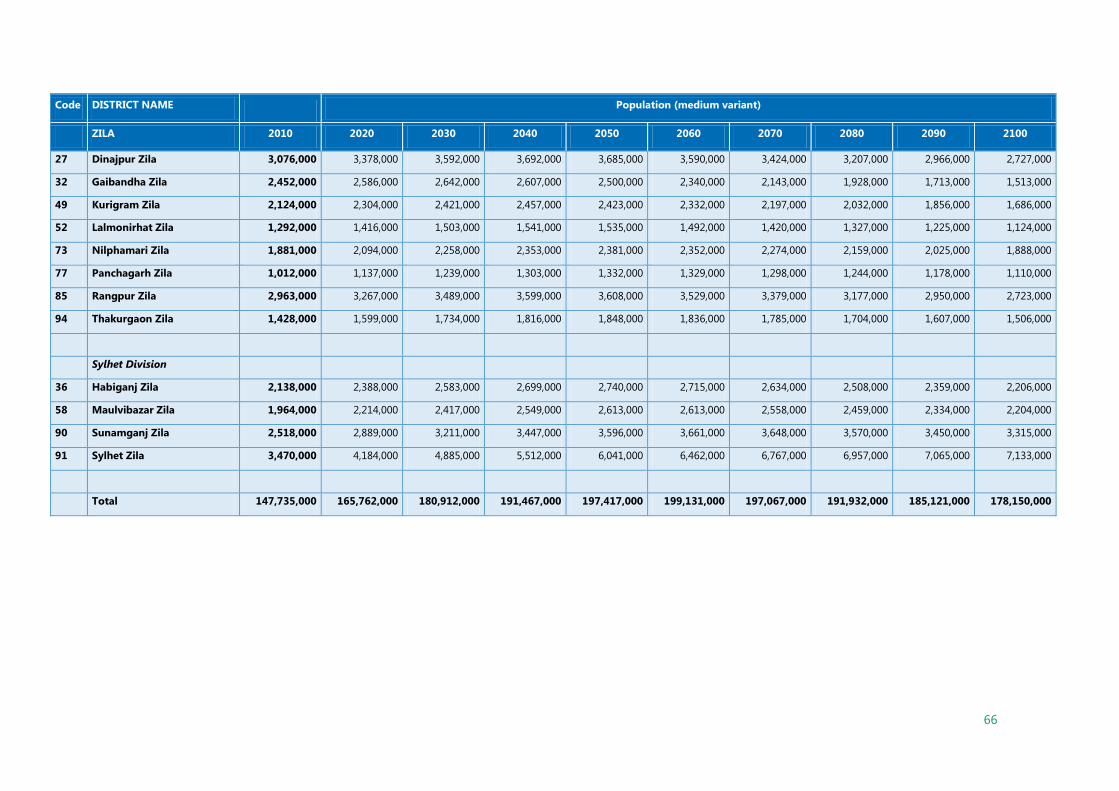
66
Code DISTRICT NAME Population (medium variant)
ZILA 2010 2020 2030 2040 2050 2060 2070 2080 2090 2100
27 Dinajpur Zila 3,076,000 3,378,000 3,592,000 3,692,000 3,685,000 3,590,000 3,424,000 3,207,000 2,966,000 2,727,000
32 Gaibandha Zila 2,452,000 2,586,000 2,642,000 2,607,000 2,500,000 2,340,000 2,143,000 1,928,000 1,713,000 1,513,000
49 Kurigram Zila 2,124,000 2,304,000 2,421,000 2,457,000 2,423,000 2,332,000 2,197,000 2,032,000 1,856,000 1,686,000
52 Lalmonirhat Zila 1,292,000 1,416,000 1,503,000 1,541,000 1,535,000 1,492,000 1,420,000 1,327,000 1,225,000 1,124,000
73 Nilphamari Zila 1,881,000 2,094,000 2,258,000 2,353,000 2,381,000 2,352,000 2,274,000 2,159,000 2,025,000 1,888,000
77 Panchagarh Zila 1,012,000 1,137,000 1,239,000 1,303,000 1,332,000 1,329,000 1,298,000 1,244,000 1,178,000 1,110,000
85 Rangpur Zila 2,963,000 3,267,000 3,489,000 3,599,000 3,608,000 3,529,000 3,379,000 3,177,000 2,950,000 2,723,000
94 Thakurgaon Zila 1,428,000 1,599,000 1,734,000 1,816,000 1,848,000 1,836,000 1,785,000 1,704,000 1,607,000 1,506,000
Sylhet Division
36 Habiganj Zila 2,138,000 2,388,000 2,583,000 2,699,000 2,740,000 2,715,000 2,634,000 2,508,000 2,359,000 2,206,000
58 Maulvibazar Zila 1,964,000 2,214,000 2,417,000 2,549,000 2,613,000 2,613,000 2,558,000 2,459,000 2,334,000 2,204,000
90 Sunamganj Zila 2,518,000 2,889,000 3,211,000 3,447,000 3,596,000 3,661,000 3,648,000 3,570,000 3,450,000 3,315,000
91 Sylhet Zila 3,470,000 4,184,000 4,885,000 5,512,000 6,041,000 6,462,000 6,767,000 6,957,000 7,065,000 7,133,000
Total 147,735,000 165,762,000 180,912,000 191,467,000 197,417,000 199,131,000 197,067,000 191,932,000 185,121,000 178,150,000
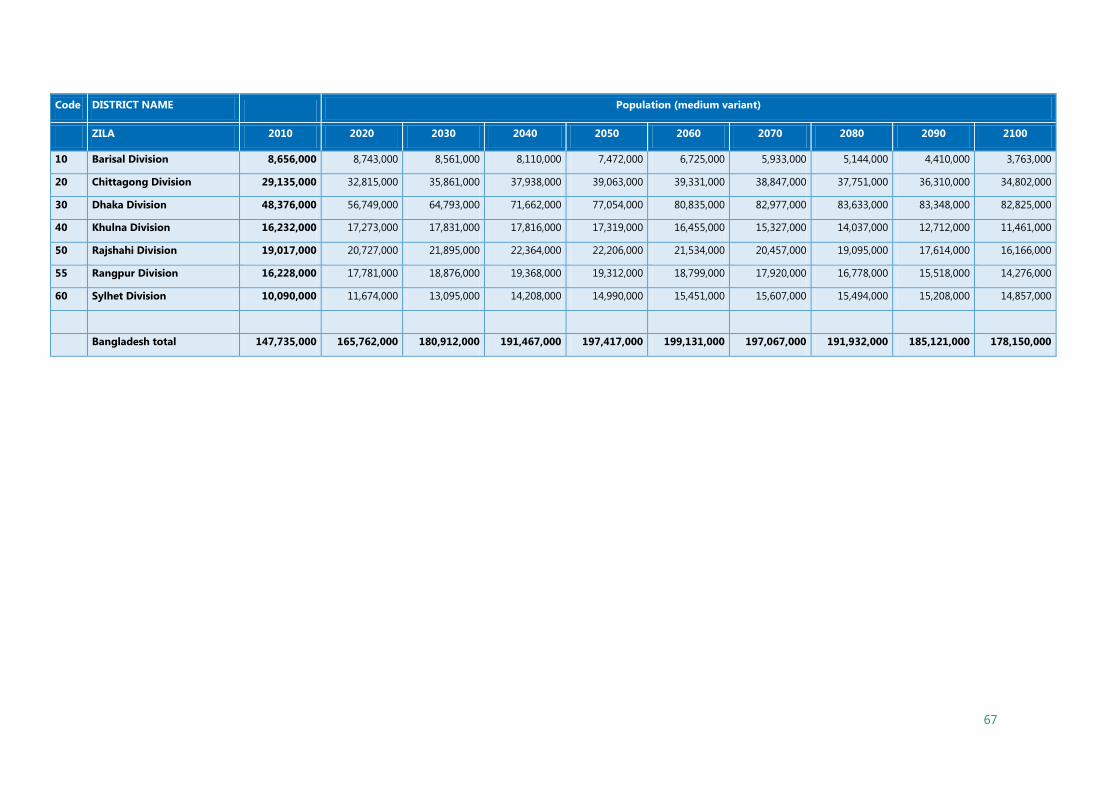
67
Code DISTRICT NAME Population (medium variant)
ZILA 2010 2020 2030 2040 2050 2060 2070 2080 2090 2100
10 Barisal Division 8,656,000 8,743,000 8,561,000 8,110,000 7,472,000 6,725,000 5,933,000 5,144,000 4,410,000 3,763,000
20 Chittagong Division 29,135,000 32,815,000 35,861,000 37,938,000 39,063,000 39,331,000 38,847,000 37,751,000 36,310,000 34,802,000
30 Dhaka Division 48,376,000 56,749,000 64,793,000 71,662,000 77,054,000 80,835,000 82,977,000 83,633,000 83,348,000 82,825,000
40 Khulna Division 16,232,000 17,273,000 17,831,000 17,816,000 17,319,000 16,455,000 15,327,000 14,037,000 12,712,000 11,461,000
50 Rajshahi Division 19,017,000 20,727,000 21,895,000 22,364,000 22,206,000 21,534,000 20,457,000 19,095,000 17,614,000 16,166,000
55 Rangpur Division 16,228,000 17,781,000 18,876,000 19,368,000 19,312,000 18,799,000 17,920,000 16,778,000 15,518,000 14,276,000
60 Sylhet Division 10,090,000 11,674,000 13,095,000 14,208,000 14,990,000 15,451,000 15,607,000 15,494,000 15,208,000 14,857,000
Bangladesh total 147,735,000 165,762,000 180,912,000 191,467,000 197,417,000 199,131,000 197,067,000 191,932,000 185,121,000 178,150,000
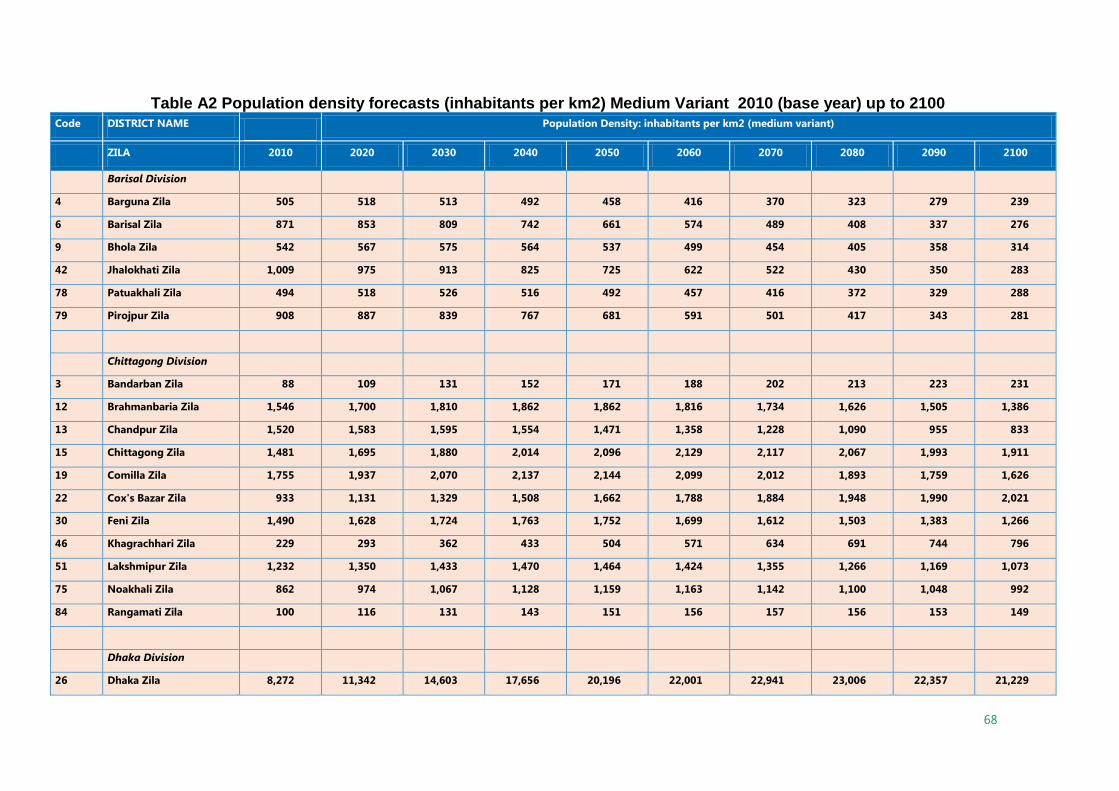
68
Table A2 Population density forecasts (inhabitants per km2) Medium Variant 2010 (base year) up to 2100 Code DISTRICT NAME Population Density: inhabitants per km2 (medium variant)
ZILA 2010 2020 2030 2040 2050 2060 2070 2080 2090 2100
Barisal Division
4 Barguna Zila 505 518 513 492 458 416 370 323 279 239
6 Barisal Zila 871 853 809 742 661 574 489 408 337 276
9 Bhola Zila 542 567 575 564 537 499 454 405 358 314
42 Jhalokhati Zila 1,009 975 913 825 725 622 522 430 350 283
78 Patuakhali Zila 494 518 526 516 492 457 416 372 329 288
79 Pirojpur Zila 908 887 839 767 681 591 501 417 343 281
Chittagong Division
3 Bandarban Zila 88 109 131 152 171 188 202 213 223 231
12 Brahmanbaria Zila 1,546 1,700 1,810 1,862 1,862 1,816 1,734 1,626 1,505 1,386
13 Chandpur Zila 1,520 1,583 1,595 1,554 1,471 1,358 1,228 1,090 955 833
15 Chittagong Zila 1,481 1,695 1,880 2,014 2,096 2,129 2,117 2,067 1,993 1,911
19 Comilla Zila 1,755 1,937 2,070 2,137 2,144 2,099 2,012 1,893 1,759 1,626
22 Cox's Bazar Zila 933 1,131 1,329 1,508 1,662 1,788 1,884 1,948 1,990 2,021
30 Feni Zila 1,490 1,628 1,724 1,763 1,752 1,699 1,612 1,503 1,383 1,266
46 Khagrachhari Zila 229 293 362 433 504 571 634 691 744 796
51 Lakshmipur Zila 1,232 1,350 1,433 1,470 1,464 1,424 1,355 1,266 1,169 1,073
75 Noakhali Zila 862 974 1,067 1,128 1,159 1,163 1,142 1,100 1,048 992
84 Rangamati Zila 100 116 131 143 151 156 157 156 153 149
Dhaka Division
26 Dhaka Zila 8,272 11,342 14,603 17,656 20,196 22,001 22,941 23,006 22,357 21,229
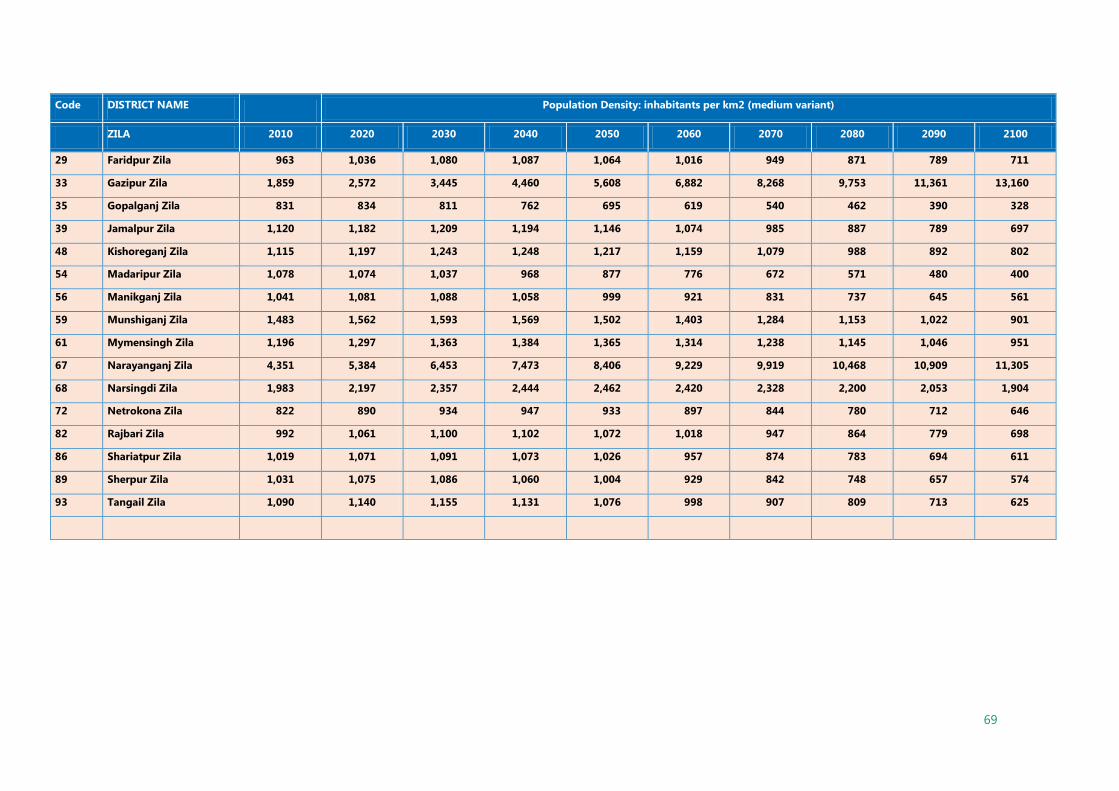
69
Code DISTRICT NAME Population Density: inhabitants per km2 (medium variant)
ZILA 2010 2020 2030 2040 2050 2060 2070 2080 2090 2100
29 Faridpur Zila 963 1,036 1,080 1,087 1,064 1,016 949 871 789 711
33 Gazipur Zila 1,859 2,572 3,445 4,460 5,608 6,882 8,268 9,753 11,361 13,160
35 Gopalganj Zila 831 834 811 762 695 619 540 462 390 328
39 Jamalpur Zila 1,120 1,182 1,209 1,194 1,146 1,074 985 887 789 697
48 Kishoreganj Zila 1,115 1,197 1,243 1,248 1,217 1,159 1,079 988 892 802
54 Madaripur Zila 1,078 1,074 1,037 968 877 776 672 571 480 400
56 Manikganj Zila 1,041 1,081 1,088 1,058 999 921 831 737 645 561
59 Munshiganj Zila 1,483 1,562 1,593 1,569 1,502 1,403 1,284 1,153 1,022 901
61 Mymensingh Zila 1,196 1,297 1,363 1,384 1,365 1,314 1,238 1,145 1,046 951
67 Narayanganj Zila 4,351 5,384 6,453 7,473 8,406 9,229 9,919 10,468 10,909 11,305
68 Narsingdi Zila 1,983 2,197 2,357 2,444 2,462 2,420 2,328 2,200 2,053 1,904
72 Netrokona Zila 822 890 934 947 933 897 844 780 712 646
82 Rajbari Zila 992 1,061 1,100 1,102 1,072 1,018 947 864 779 698
86 Shariatpur Zila 1,019 1,071 1,091 1,073 1,026 957 874 783 694 611
89 Sherpur Zila 1,031 1,075 1,086 1,060 1,004 929 842 748 657 574
93 Tangail Zila 1,090 1,140 1,155 1,131 1,076 998 907 809 713 625

70
Code DISTRICT NAME Population Density: inhabitants per km2 (medium variant)
ZILA 2010 2020 2030 2040 2050 2060 2070 2080 2090 2100
Khulna Division
1 Bagerhat Zila 390 378 355 322 284 244 206 170 139 113
18 Chuadanga Zila 990 1,118 1,223 1,292 1,326 1,328 1,303 1,254 1,193 1,128
41 Jessore Zila 1,093 1,195 1,265 1,295 1,287 1,249 1,186 1,106 1,019 933
44 Jhenaidah Zila 929 1,011 1,067 1,087 1,076 1,040 984 913 838 764
47 Khulna Zila 551 565 561 538 502 456 406 355 307 263
50 Kushtia Zila 1,247 1,355 1,427 1,451 1,434 1,382 1,305 1,210 1,107 1,008
55 Magura Zila 911 979 1,020 1,026 1,003 957 894 819 742 668
57 Meherpur Zila 900 991 1,058 1,091 1,093 1,069 1,023 961 892 823
65 Narail Zila 775 776 753 706 642 571 497 424 358 300
87 Satkhira Zila 539 573 591 589 570 538 498 452 405 361
Rajshahi Division
10 Bogra Zila 1,208 1,301 1,358 1,370 1,342 1,283 1,201 1,103 1,001 904
38 Joypurhat Zila 933 974 984 961 911 844 765 680 598 522
64 Naogaon Zila 782 821 835 821 784 731 667 597 528 465
69 Natore Zila 925 979 1,004 995 957 899 827 747 666 590
70 Chapai Nawabganj Zila 994 1,125 1,234 1,307 1,345 1,351 1,329 1,283 1,223 1,160
76 Pabna Zila 1,090 1,193 1,264 1,295 1,288 1,251 1,189 1,110 1,023 938
81 Rajshahi Zila 1,101 1,232 1,336 1,400 1,425 1,415 1,376 1,314 1,239 1,162
88 Sirajganj Zila 1,324 1,479 1,600 1,672 1,697 1,682 1,631 1,554 1,461 1,367
Rangpur Division
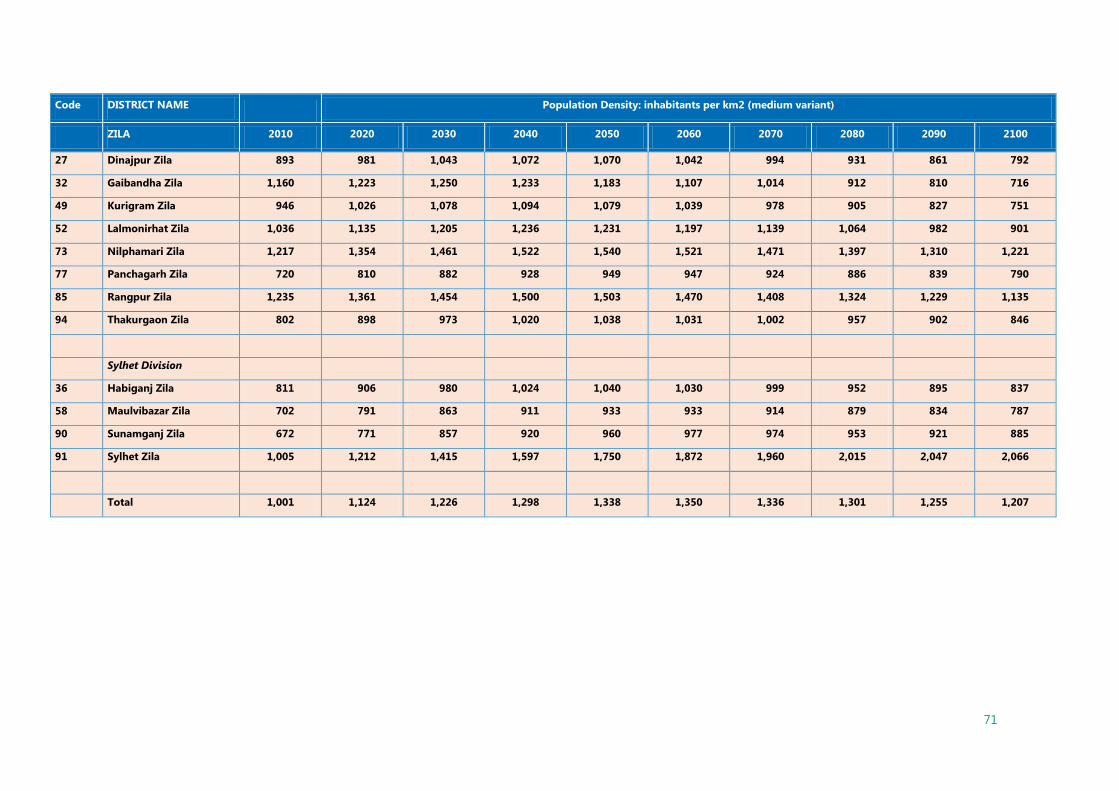
71
Code DISTRICT NAME Population Density: inhabitants per km2 (medium variant)
ZILA 2010 2020 2030 2040 2050 2060 2070 2080 2090 2100
27 Dinajpur Zila 893 981 1,043 1,072 1,070 1,042 994 931 861 792
32 Gaibandha Zila 1,160 1,223 1,250 1,233 1,183 1,107 1,014 912 810 716
49 Kurigram Zila 946 1,026 1,078 1,094 1,079 1,039 978 905 827 751
52 Lalmonirhat Zila 1,036 1,135 1,205 1,236 1,231 1,197 1,139 1,064 982 901
73 Nilphamari Zila 1,217 1,354 1,461 1,522 1,540 1,521 1,471 1,397 1,310 1,221
77 Panchagarh Zila 720 810 882 928 949 947 924 886 839 790
85 Rangpur Zila 1,235 1,361 1,454 1,500 1,503 1,470 1,408 1,324 1,229 1,135
94 Thakurgaon Zila 802 898 973 1,020 1,038 1,031 1,002 957 902 846
Sylhet Division
36 Habiganj Zila 811 906 980 1,024 1,040 1,030 999 952 895 837
58 Maulvibazar Zila 702 791 863 911 933 933 914 879 834 787
90 Sunamganj Zila 672 771 857 920 960 977 974 953 921 885
91 Sylhet Zila 1,005 1,212 1,415 1,597 1,750 1,872 1,960 2,015 2,047 2,066
Total 1,001 1,124 1,226 1,298 1,338 1,350 1,336 1,301 1,255 1,207

72
Code DISTRICT NAME Population Density: inhabitants per km2 (medium variant)
ZILA 2010 2020 2030 2040 2050 2060 2070 2080 2090 2100
10 Barisal Division 655 661 647 613 565 509 449 389 333 285
20 Chittagong Division 859 968 1,058 1,119 1,152 1,160 1,146 1,113 1,071 1,026
30 Dhaka Division 1,552 1,820 2,078 2,299 2,472 2,593 2,661 2,683 2,673 2,657
40 Khulna Division 728 775 800 800 777 738 688 630 570 514
50 Rajshahi Division 1,048 1,142 1,206 1,232 1,223 1,186 1,127 1,052 970 891
55 Rangpur Division 1,003 1,099 1,166 1,197 1,193 1,162 1,107 1,037 959 882
60 Sylhet Division 799 924 1,036 1,124 1,186 1,223 1,235 1,226 1,204 1,176
Bangladesh total 1,001 1,123 1,226 1,298 1,338 1,349 1,335 1,301 1,254 1,207

73
Table B1 Population forecasts High Variant (rounded off to the nearest 1000 people) 2010 (base year) up to 2100
Code DISTRICT NAME
Population (high variant)
ZILA 2010 2020 2030 2040 2050 2060 2070 2080 2090 2100
Barisal Division
4 Barguna Zila 925,000 973,000 1,001,000 1,000,000 979,000 942,000 895,000 842,000 789,000 738,000
6 Barisal Zila 2,424,000 2,440,000 2,401,000 2,293,000 2,147,000 1,976,000 1,795,000 1,616,000 1,448,000 1,295,000
9 Bhola Zila 1,843,000 1,983,000 2,086,000 2,130,000 2,132,000 2,098,000 2,038,000 1,961,000 1,879,000 1,796,000
42 Jhalokhati Zila 712,000 707,000 686,000 647,000 597,000 543,000 486,000 432,000 382,000 337,000
78 Patuakhali Zila 1,592,000 1,714,000 1,805,000 1,844,000 1,848,000 1,820,000 1,769,000 1,705,000 1,635,000 1,564,000
79 Pirojpur Zila 1,159,000 1,163,000 1,142,000 1,087,000 1,015,000 932,000 844,000 758,000 677,000 604,000
Chittagong Division
3 Bandarban Zila 394,000 501,000 624,000 753,000 892,000 1,038,000 1,193,000 1,358,000 1,539,000 1,741,000
12 Brahmanbaria Zila 2,908,000 3,284,000 3,627,000 3,888,000 4,085,000 4,220,000 4,303,000 4,348,000 4,373,000 4,389,000
13 Chandpur Zila 2,501,000 2,674,000 2,796,000 2,837,000 2,822,000 2,760,000 2,665,000 2,549,000 2,427,000 2,306,000
15 Chittagong Zila 7,821,000 9,197,000 10,577,000 11,804,000 12,917,000 13,895,000 14,753,000 15,523,000 16,256,000 16,989,000
19 Comilla Zila 5,522,000 6,258,000 6,937,000 7,462,000 7,870,000 8,159,000 8,350,000 8,468,000 8,547,000 8,609,000
22 Cox's Bazar Zila 2,324,000 2,894,000 3,526,000 4,168,000 4,831,000 5,505,000 6,191,000 6,900,000 7,654,000 8,472,000
30 Feni Zila 1,475,000 1,656,000 1,818,000 1,937,000 2,023,000 2,078,000 2,106,000 2,115,000 2,115,000 2,110,000
46 Khagrachhari Zila 629,000 826,000 1,061,000 1,322,000 1,615,000 1,940,000 2,300,000 2,701,000 3,158,000 3,685,000
51 Lakshmipur Zila 1,774,000 1,997,000 2,199,000 2,349,000 2,460,000 2,533,000 2,574,000 2,593,000 2,599,000 2,600,000
75 Noakhali Zila 3,176,000 3,688,000 4,188,000 4,614,000 4,985,000 5,294,000 5,550,000 5,766,000 5,961,000 6,151,000
84 Rangamati Zila 611,000 730,000 853,000 967,000 1,075,000 1,176,000 1,268,000 1,356,000 1,443,000 1,532,000
Dhaka Division
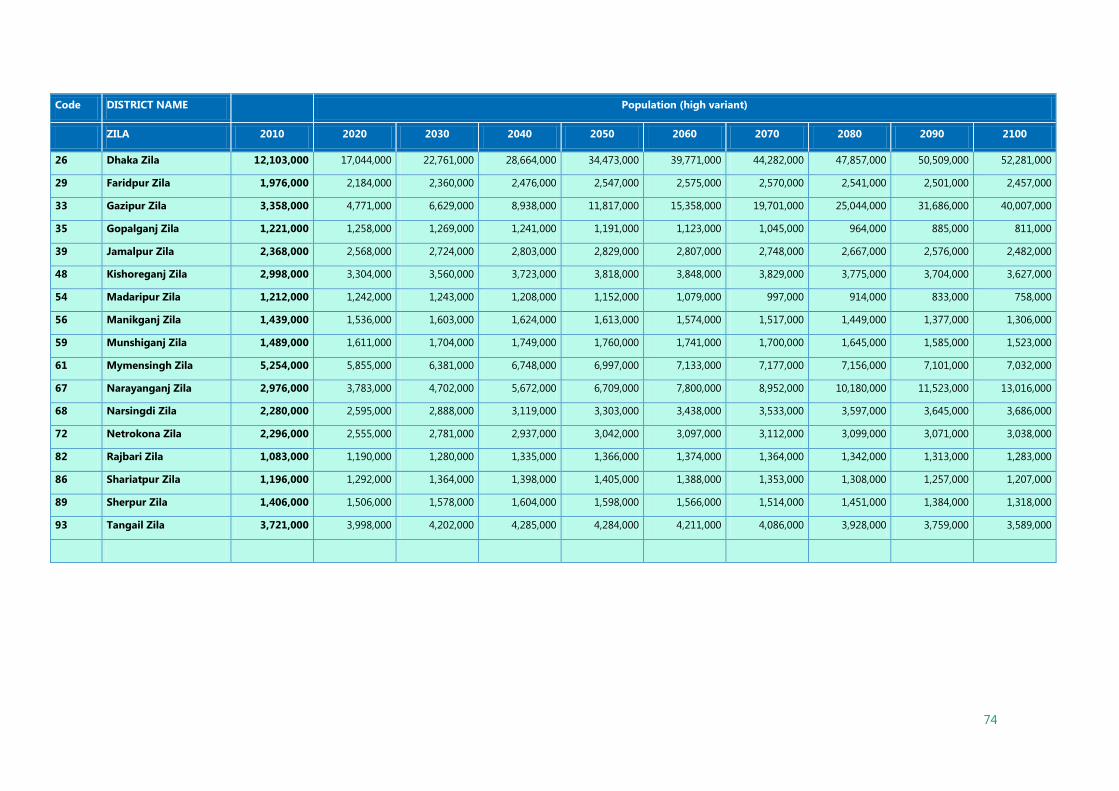
74
Code DISTRICT NAME
Population (high variant)
ZILA 2010 2020 2030 2040 2050 2060 2070 2080 2090 2100
26 Dhaka Zila 12,103,000 17,044,000 22,761,000 28,664,000 34,473,000 39,771,000 44,282,000 47,857,000 50,509,000 52,281,000
29 Faridpur Zila 1,976,000 2,184,000 2,360,000 2,476,000 2,547,000 2,575,000 2,570,000 2,541,000 2,501,000 2,457,000
33 Gazipur Zila 3,358,000 4,771,000 6,629,000 8,938,000 11,817,000 15,358,000 19,701,000 25,044,000 31,686,000 40,007,000
35 Gopalganj Zila 1,221,000 1,258,000 1,269,000 1,241,000 1,191,000 1,123,000 1,045,000 964,000 885,000 811,000
39 Jamalpur Zila 2,368,000 2,568,000 2,724,000 2,803,000 2,829,000 2,807,000 2,748,000 2,667,000 2,576,000 2,482,000
48 Kishoreganj Zila 2,998,000 3,304,000 3,560,000 3,723,000 3,818,000 3,848,000 3,829,000 3,775,000 3,704,000 3,627,000
54 Madaripur Zila 1,212,000 1,242,000 1,243,000 1,208,000 1,152,000 1,079,000 997,000 914,000 833,000 758,000
56 Manikganj Zila 1,439,000 1,536,000 1,603,000 1,624,000 1,613,000 1,574,000 1,517,000 1,449,000 1,377,000 1,306,000
59 Munshiganj Zila 1,489,000 1,611,000 1,704,000 1,749,000 1,760,000 1,741,000 1,700,000 1,645,000 1,585,000 1,523,000
61 Mymensingh Zila 5,254,000 5,855,000 6,381,000 6,748,000 6,997,000 7,133,000 7,177,000 7,156,000 7,101,000 7,032,000
67 Narayanganj Zila 2,976,000 3,783,000 4,702,000 5,672,000 6,709,000 7,800,000 8,952,000 10,180,000 11,523,000 13,016,000
68 Narsingdi Zila 2,280,000 2,595,000 2,888,000 3,119,000 3,303,000 3,438,000 3,533,000 3,597,000 3,645,000 3,686,000
72 Netrokona Zila 2,296,000 2,555,000 2,781,000 2,937,000 3,042,000 3,097,000 3,112,000 3,099,000 3,071,000 3,038,000
82 Rajbari Zila 1,083,000 1,190,000 1,280,000 1,335,000 1,366,000 1,374,000 1,364,000 1,342,000 1,313,000 1,283,000
86 Shariatpur Zila 1,196,000 1,292,000 1,364,000 1,398,000 1,405,000 1,388,000 1,353,000 1,308,000 1,257,000 1,207,000
89 Sherpur Zila 1,406,000 1,506,000 1,578,000 1,604,000 1,598,000 1,566,000 1,514,000 1,451,000 1,384,000 1,318,000
93 Tangail Zila 3,721,000 3,998,000 4,202,000 4,285,000 4,284,000 4,211,000 4,086,000 3,928,000 3,759,000 3,589,000

75
Code DISTRICT NAME
Population (high variant)
ZILA 2010 2020 2030 2040 2050 2060 2070 2080 2090 2100
Khulna Division
1 Bagerhat Zila 1,545,000 1,539,000 1,498,000 1,416,000 1,312,000 1,195,000 1,075,000 958,000 849,000 752,000
18 Chuadanga Zila 1,163,000 1,348,000 1,529,000 1,683,000 1,816,000 1,927,000 2,018,000 2,094,000 2,163,000 2,229,000
41 Jessore Zila 2,847,000 3,198,000 3,513,000 3,745,000 3,915,000 4,022,000 4,079,000 4,100,000 4,101,000 4,094,000
44 Jhenaidah Zila 1,824,000 2,040,000 2,232,000 2,369,000 2,466,000 2,523,000 2,549,000 2,551,000 2,541,000 2,526,000
47 Khulna Zila 2,421,000 2,550,000 2,626,000 2,624,000 2,571,000 2,477,000 2,355,000 2,219,000 2,080,000 1,947,000
50 Kushtia Zila 2,005,000 2,238,000 2,444,000 2,589,000 2,690,000 2,747,000 2,769,000 2,766,000 2,749,000 2,728,000
55 Magura Zila 946,000 1,045,000 1,129,000 1,183,000 1,216,000 1,228,000 1,225,000 1,211,000 1,191,000 1,169,000
57 Meherpur Zila 676,000 765,000 847,000 909,000 958,000 992,000 1,014,000 1,026,000 1,035,000 1,041,000
65 Narail Zila 749,000 771,000 776,000 757,000 725,000 682,000 634,000 583,000 534,000 488,000
87 Satkhira Zila 2,056,000 2,248,000 2,404,000 2,494,000 2,538,000 2,539,000 2,507,000 2,452,000 2,388,000 2,321,000
Rajshahi Division
10 Bogra Zila 3,499,000 3,873,000 4,193,000 4,404,000 4,537,000 4,593,000 4,591,000 4,546,000 4,481,000 4,408,000
38 Joypurhat Zila 945,000 1,012,000 1,061,000 1,079,000 1,076,000 1,055,000 1,021,000 979,000 934,000 890,000
64 Naogaon Zila 2,686,000 2,898,000 3,057,000 3,130,000 3,143,000 3,102,000 3,021,000 2,917,000 2,802,000 2,687,000
69 Natore Zila 1,757,000 1,911,000 2,032,000 2,097,000 2,122,000 2,111,000 2,073,000 2,017,000 1,953,000 1,888,000
70 Chapai Nawabganj Zila 1,691,000 1,967,000 2,237,000 2,468,000 2,671,000 2,842,000 2,984,000 3,104,000 3,215,000 3,323,000
76 Pabna Zila 2,589,000 2,911,000 3,200,000 3,414,000 3,571,000 3,673,000 3,728,000 3,749,000 3,754,000 3,750,000
81 Rajshahi Zila 2,669,000 3,069,000 3,452,000 3,767,000 4,031,000 4,241,000 4,404,000 4,531,000 4,640,000 4,742,000
88 Sirajganj Zila 3,181,000 3,649,000 4,094,000 4,457,000 4,757,000 4,992,000 5,170,000 5,306,000 5,421,000 5,526,000
Rangpur Division

76
Code DISTRICT NAME
Population (high variant)
ZILA 2010 2020 2030 2040 2050 2060 2070 2080 2090 2100
27 Dinajpur Zila 3,076,000 3,469,000 3,827,000 4,097,000 4,300,000 4,436,000 4,518,000 4,559,000 4,579,000 4,590,000
32 Gaibandha Zila 2,452,000 2,656,000 2,814,000 2,894,000 2,917,000 2,891,000 2,828,000 2,741,000 2,645,000 2,546,000
49 Kurigram Zila 2,124,000 2,367,000 2,579,000 2,727,000 2,827,000 2,881,000 2,898,000 2,889,000 2,866,000 2,838,000
52 Lalmonirhat Zila 1,292,000 1,454,000 1,601,000 1,710,000 1,791,000 1,844,000 1,874,000 1,887,000 1,891,000 1,892,000
73 Nilphamari Zila 1,881,000 2,151,000 2,406,000 2,611,000 2,778,000 2,906,000 3,001,000 3,070,000 3,126,000 3,177,000
77 Panchagarh Zila 1,012,000 1,168,000 1,319,000 1,446,000 1,554,000 1,642,000 1,712,000 1,769,000 1,820,000 1,868,000
85 Rangpur Zila 2,963,000 3,356,000 3,717,000 3,994,000 4,209,000 4,360,000 4,458,000 4,517,000 4,555,000 4,585,000
94 Thakurgaon Zila 1,428,000 1,642,000 1,847,000 2,015,000 2,156,000 2,268,000 2,355,000 2,423,000 2,481,000 2,535,000
Sylhet Division
36 Habiganj Zila 2,138,000 2,453,000 2,752,000 2,995,000 3,197,000 3,355,000 3,475,000 3,566,000 3,643,000 3,714,000
58 Maulvibazar Zila 1,964,000 2,274,000 2,575,000 2,829,000 3,048,000 3,228,000 3,375,000 3,496,000 3,605,000 3,709,000
90 Sunamganj Zila 2,518,000 2,968,000 3,420,000 3,826,000 4,196,000 4,523,000 4,813,000 5,076,000 5,327,000 5,580,000
91 Sylhet Zila 3,470,000 4,297,000 5,204,000 6,116,000 7,049,000 7,985,000 8,928,000 9,893,000 10,910,000 12,007,000
Total 147,735,000 170,263,000 192,739,000 212,471,000 230,337,000 246,049,000 260,014,000 272,903,000 285,869,000 299,888,000
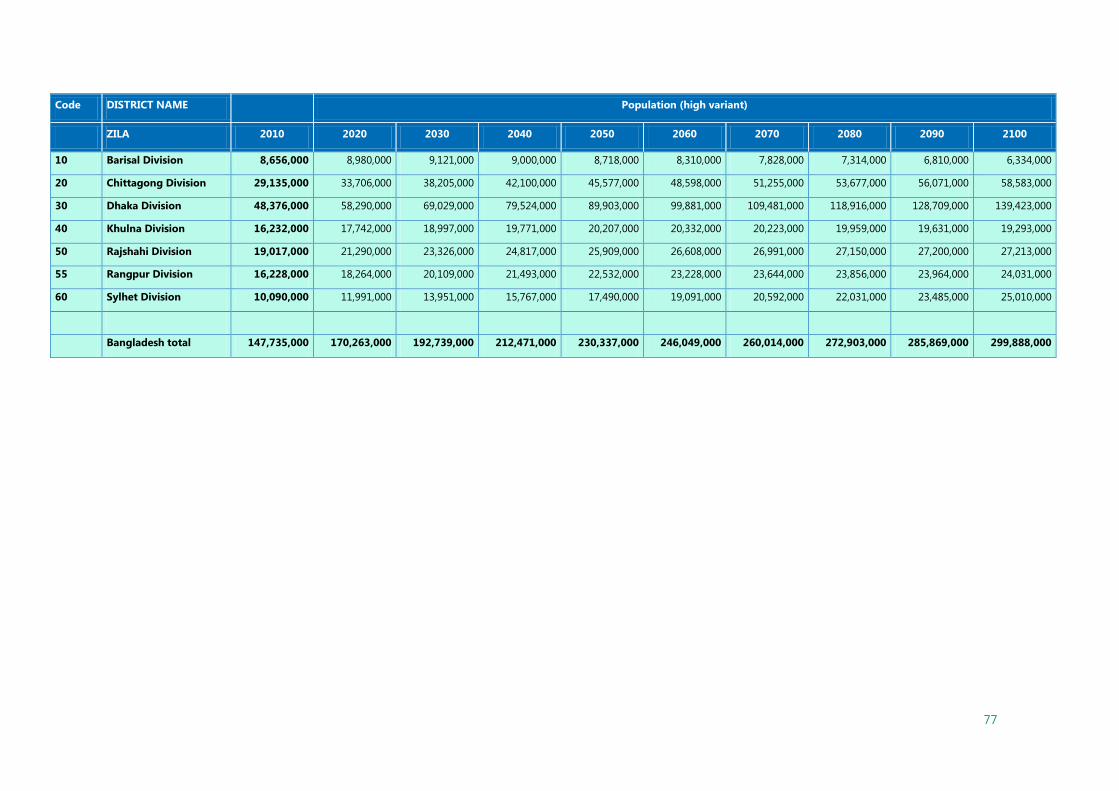
77
Code DISTRICT NAME
Population (high variant)
ZILA 2010 2020 2030 2040 2050 2060 2070 2080 2090 2100
10 Barisal Division 8,656,000 8,980,000 9,121,000 9,000,000 8,718,000 8,310,000 7,828,000 7,314,000 6,810,000 6,334,000
20 Chittagong Division 29,135,000 33,706,000 38,205,000 42,100,000 45,577,000 48,598,000 51,255,000 53,677,000 56,071,000 58,583,000
30 Dhaka Division 48,376,000 58,290,000 69,029,000 79,524,000 89,903,000 99,881,000 109,481,000 118,916,000 128,709,000 139,423,000
40 Khulna Division 16,232,000 17,742,000 18,997,000 19,771,000 20,207,000 20,332,000 20,223,000 19,959,000 19,631,000 19,293,000
50 Rajshahi Division 19,017,000 21,290,000 23,326,000 24,817,000 25,909,000 26,608,000 26,991,000 27,150,000 27,200,000 27,213,000
55 Rangpur Division 16,228,000 18,264,000 20,109,000 21,493,000 22,532,000 23,228,000 23,644,000 23,856,000 23,964,000 24,031,000
60 Sylhet Division 10,090,000 11,991,000 13,951,000 15,767,000 17,490,000 19,091,000 20,592,000 22,031,000 23,485,000 25,010,000
Bangladesh total 147,735,000 170,263,000 192,739,000 212,471,000 230,337,000 246,049,000 260,014,000 272,903,000 285,869,000 299,888,000
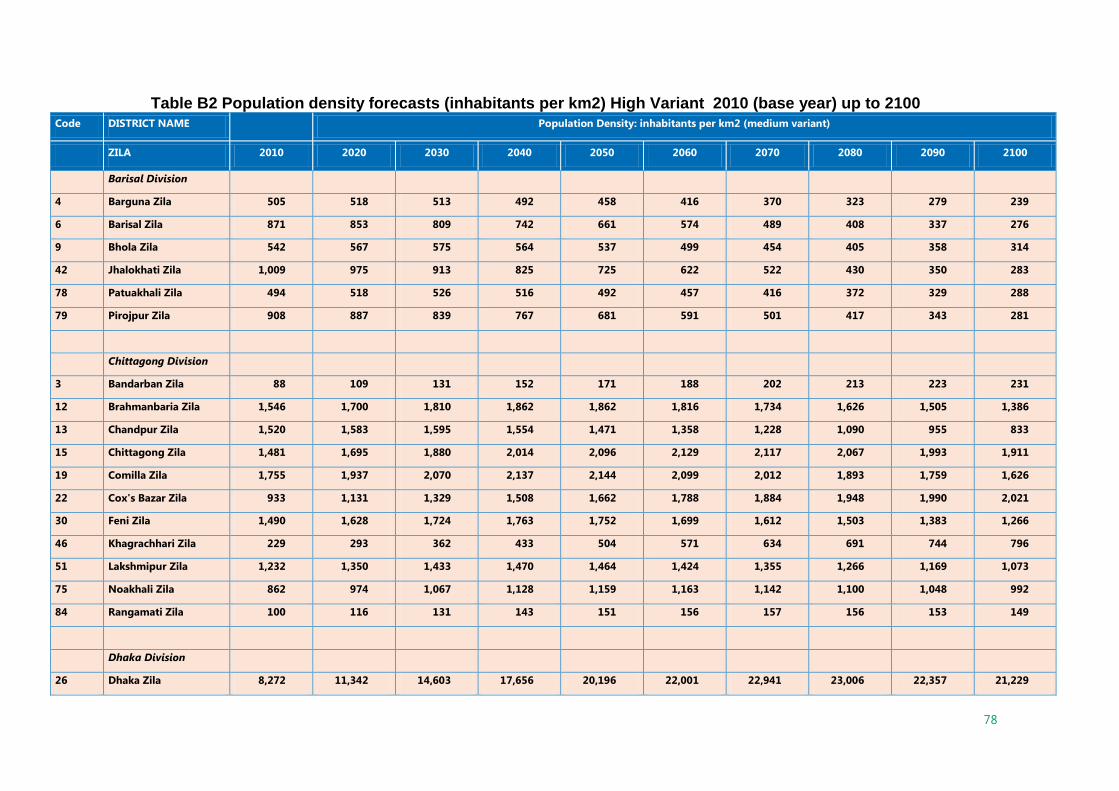
78
Table B2 Population density forecasts (inhabitants per km2) High Variant 2010 (base year) up to 2100 Code DISTRICT NAME
Population Density: inhabitants per km2 (medium variant)
ZILA 2010 2020 2030 2040 2050 2060 2070 2080 2090 2100
Barisal Division
4 Barguna Zila 505 518 513 492 458 416 370 323 279 239
6 Barisal Zila 871 853 809 742 661 574 489 408 337 276
9 Bhola Zila 542 567 575 564 537 499 454 405 358 314
42 Jhalokhati Zila 1,009 975 913 825 725 622 522 430 350 283
78 Patuakhali Zila 494 518 526 516 492 457 416 372 329 288
79 Pirojpur Zila 908 887 839 767 681 591 501 417 343 281
Chittagong Division
3 Bandarban Zila 88 109 131 152 171 188 202 213 223 231
12 Brahmanbaria Zila 1,546 1,700 1,810 1,862 1,862 1,816 1,734 1,626 1,505 1,386
13 Chandpur Zila 1,520 1,583 1,595 1,554 1,471 1,358 1,228 1,090 955 833
15 Chittagong Zila 1,481 1,695 1,880 2,014 2,096 2,129 2,117 2,067 1,993 1,911
19 Comilla Zila 1,755 1,937 2,070 2,137 2,144 2,099 2,012 1,893 1,759 1,626
22 Cox's Bazar Zila 933 1,131 1,329 1,508 1,662 1,788 1,884 1,948 1,990 2,021
30 Feni Zila 1,490 1,628 1,724 1,763 1,752 1,699 1,612 1,503 1,383 1,266
46 Khagrachhari Zila 229 293 362 433 504 571 634 691 744 796
51 Lakshmipur Zila 1,232 1,350 1,433 1,470 1,464 1,424 1,355 1,266 1,169 1,073
75 Noakhali Zila 862 974 1,067 1,128 1,159 1,163 1,142 1,100 1,048 992
84 Rangamati Zila 100 116 131 143 151 156 157 156 153 149
Dhaka Division
26 Dhaka Zila 8,272 11,342 14,603 17,656 20,196 22,001 22,941 23,006 22,357 21,229
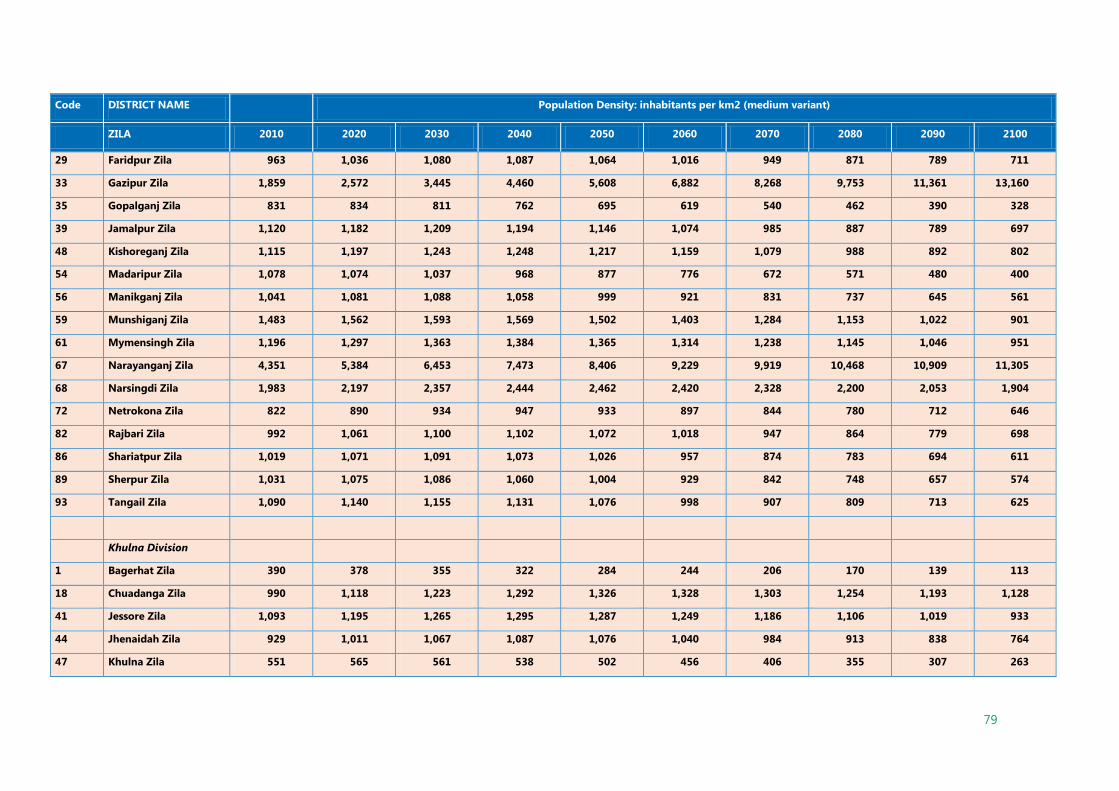
79
Code DISTRICT NAME
Population Density: inhabitants per km2 (medium variant)
ZILA 2010 2020 2030 2040 2050 2060 2070 2080 2090 2100
29 Faridpur Zila 963 1,036 1,080 1,087 1,064 1,016 949 871 789 711
33 Gazipur Zila 1,859 2,572 3,445 4,460 5,608 6,882 8,268 9,753 11,361 13,160
35 Gopalganj Zila 831 834 811 762 695 619 540 462 390 328
39 Jamalpur Zila 1,120 1,182 1,209 1,194 1,146 1,074 985 887 789 697
48 Kishoreganj Zila 1,115 1,197 1,243 1,248 1,217 1,159 1,079 988 892 802
54 Madaripur Zila 1,078 1,074 1,037 968 877 776 672 571 480 400
56 Manikganj Zila 1,041 1,081 1,088 1,058 999 921 831 737 645 561
59 Munshiganj Zila 1,483 1,562 1,593 1,569 1,502 1,403 1,284 1,153 1,022 901
61 Mymensingh Zila 1,196 1,297 1,363 1,384 1,365 1,314 1,238 1,145 1,046 951
67 Narayanganj Zila 4,351 5,384 6,453 7,473 8,406 9,229 9,919 10,468 10,909 11,305
68 Narsingdi Zila 1,983 2,197 2,357 2,444 2,462 2,420 2,328 2,200 2,053 1,904
72 Netrokona Zila 822 890 934 947 933 897 844 780 712 646
82 Rajbari Zila 992 1,061 1,100 1,102 1,072 1,018 947 864 779 698
86 Shariatpur Zila 1,019 1,071 1,091 1,073 1,026 957 874 783 694 611
89 Sherpur Zila 1,031 1,075 1,086 1,060 1,004 929 842 748 657 574
93 Tangail Zila 1,090 1,140 1,155 1,131 1,076 998 907 809 713 625
Khulna Division
1 Bagerhat Zila 390 378 355 322 284 244 206 170 139 113
18 Chuadanga Zila 990 1,118 1,223 1,292 1,326 1,328 1,303 1,254 1,193 1,128
41 Jessore Zila 1,093 1,195 1,265 1,295 1,287 1,249 1,186 1,106 1,019 933
44 Jhenaidah Zila 929 1,011 1,067 1,087 1,076 1,040 984 913 838 764
47 Khulna Zila 551 565 561 538 502 456 406 355 307 263
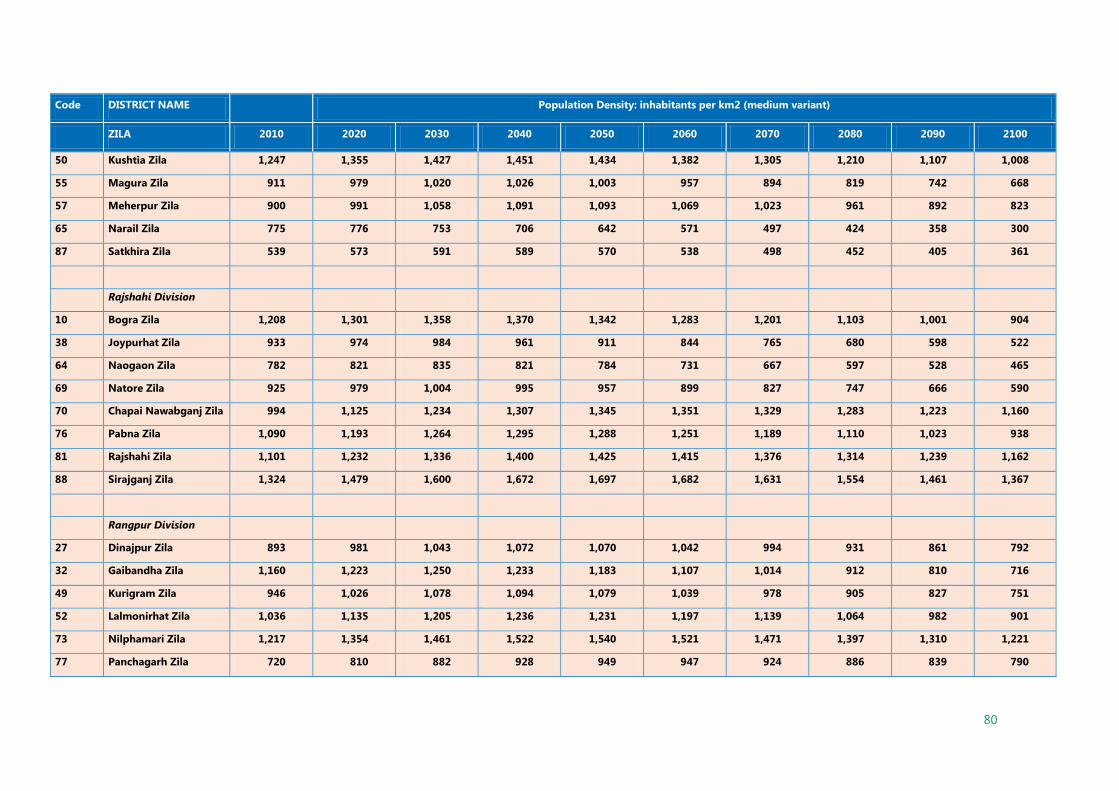
80
Code DISTRICT NAME
Population Density: inhabitants per km2 (medium variant)
ZILA 2010 2020 2030 2040 2050 2060 2070 2080 2090 2100
50 Kushtia Zila 1,247 1,355 1,427 1,451 1,434 1,382 1,305 1,210 1,107 1,008
55 Magura Zila 911 979 1,020 1,026 1,003 957 894 819 742 668
57 Meherpur Zila 900 991 1,058 1,091 1,093 1,069 1,023 961 892 823
65 Narail Zila 775 776 753 706 642 571 497 424 358 300
87 Satkhira Zila 539 573 591 589 570 538 498 452 405 361
Rajshahi Division
10 Bogra Zila 1,208 1,301 1,358 1,370 1,342 1,283 1,201 1,103 1,001 904
38 Joypurhat Zila 933 974 984 961 911 844 765 680 598 522
64 Naogaon Zila 782 821 835 821 784 731 667 597 528 465
69 Natore Zila 925 979 1,004 995 957 899 827 747 666 590
70 Chapai Nawabganj Zila 994 1,125 1,234 1,307 1,345 1,351 1,329 1,283 1,223 1,160
76 Pabna Zila 1,090 1,193 1,264 1,295 1,288 1,251 1,189 1,110 1,023 938
81 Rajshahi Zila 1,101 1,232 1,336 1,400 1,425 1,415 1,376 1,314 1,239 1,162
88 Sirajganj Zila 1,324 1,479 1,600 1,672 1,697 1,682 1,631 1,554 1,461 1,367
Rangpur Division
27 Dinajpur Zila 893 981 1,043 1,072 1,070 1,042 994 931 861 792
32 Gaibandha Zila 1,160 1,223 1,250 1,233 1,183 1,107 1,014 912 810 716
49 Kurigram Zila 946 1,026 1,078 1,094 1,079 1,039 978 905 827 751
52 Lalmonirhat Zila 1,036 1,135 1,205 1,236 1,231 1,197 1,139 1,064 982 901
73 Nilphamari Zila 1,217 1,354 1,461 1,522 1,540 1,521 1,471 1,397 1,310 1,221
77 Panchagarh Zila 720 810 882 928 949 947 924 886 839 790

81
Code DISTRICT NAME
Population Density: inhabitants per km2 (medium variant)
ZILA 2010 2020 2030 2040 2050 2060 2070 2080 2090 2100
85 Rangpur Zila 1,235 1,361 1,454 1,500 1,503 1,470 1,408 1,324 1,229 1,135
94 Thakurgaon Zila 802 898 973 1,020 1,038 1,031 1,002 957 902 846
Sylhet Division
36 Habiganj Zila 811 906 980 1,024 1,040 1,030 999 952 895 837
58 Maulvibazar Zila 702 791 863 911 933 933 914 879 834 787
90 Sunamganj Zila 672 771 857 920 960 977 974 953 921 885
91 Sylhet Zila 1,005 1,212 1,415 1,597 1,750 1,872 1,960 2,015 2,047 2,066
Total 1,001 1,124 1,226 1,298 1,338 1,350 1,336 1,301 1,255 1,207
10 Barisal Division 655 661 647 613 565 509 449 389 333 285
20 Chittagong Division 859 968 1,058 1,119 1,152 1,160 1,146 1,113 1,071 1,026
30 Dhaka Division 1,552 1,820 2,078 2,299 2,472 2,593 2,661 2,683 2,673 2,657
40 Khulna Division 728 775 800 800 777 738 688 630 570 514
50 Rajshahi Division 1,048 1,142 1,206 1,232 1,223 1,186 1,127 1,052 970 891
55 Rangpur Division 1,003 1,099 1,166 1,197 1,193 1,162 1,107 1,037 959 882
60 Sylhet Division 799 924 1,036 1,124 1,186 1,223 1,235 1,226 1,204 1,176
Bangladesh total 1,001 1,123 1,226 1,298 1,338 1,349 1,335 1,301 1,254 1,207
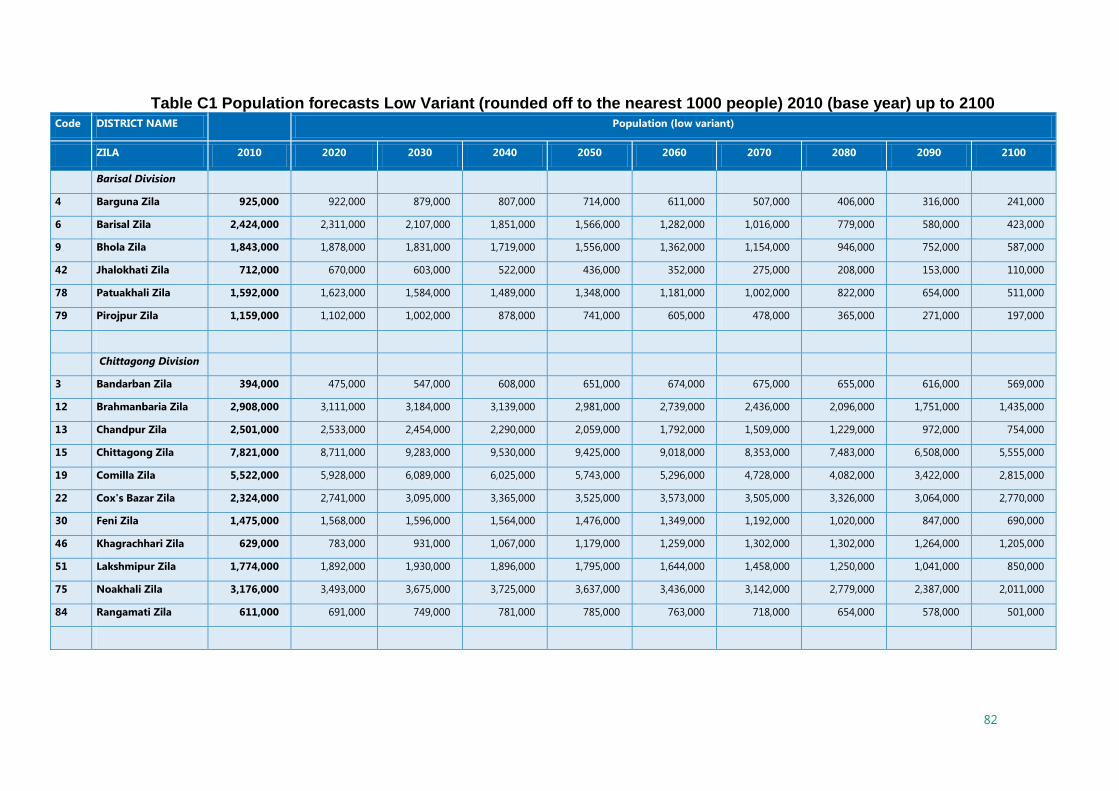
82
Table C1 Population forecasts Low Variant (rounded off to the nearest 1000 people) 2010 (base year) up to 2100 Code DISTRICT NAME
Population (low variant)
ZILA 2010 2020 2030 2040 2050 2060 2070 2080 2090 2100
Barisal Division
4 Barguna Zila 925,000 922,000 879,000 807,000 714,000 611,000 507,000 406,000 316,000 241,000
6 Barisal Zila 2,424,000 2,311,000 2,107,000 1,851,000 1,566,000 1,282,000 1,016,000 779,000 580,000 423,000
9 Bhola Zila 1,843,000 1,878,000 1,831,000 1,719,000 1,556,000 1,362,000 1,154,000 946,000 752,000 587,000
42 Jhalokhati Zila 712,000 670,000 603,000 522,000 436,000 352,000 275,000 208,000 153,000 110,000
78 Patuakhali Zila 1,592,000 1,623,000 1,584,000 1,489,000 1,348,000 1,181,000 1,002,000 822,000 654,000 511,000
79 Pirojpur Zila 1,159,000 1,102,000 1,002,000 878,000 741,000 605,000 478,000 365,000 271,000 197,000
Chittagong Division
3 Bandarban Zila 394,000 475,000 547,000 608,000 651,000 674,000 675,000 655,000 616,000 569,000
12 Brahmanbaria Zila 2,908,000 3,111,000 3,184,000 3,139,000 2,981,000 2,739,000 2,436,000 2,096,000 1,751,000 1,435,000
13 Chandpur Zila 2,501,000 2,533,000 2,454,000 2,290,000 2,059,000 1,792,000 1,509,000 1,229,000 972,000 754,000
15 Chittagong Zila 7,821,000 8,711,000 9,283,000 9,530,000 9,425,000 9,018,000 8,353,000 7,483,000 6,508,000 5,555,000
19 Comilla Zila 5,522,000 5,928,000 6,089,000 6,025,000 5,743,000 5,296,000 4,728,000 4,082,000 3,422,000 2,815,000
22 Cox's Bazar Zila 2,324,000 2,741,000 3,095,000 3,365,000 3,525,000 3,573,000 3,505,000 3,326,000 3,064,000 2,770,000
30 Feni Zila 1,475,000 1,568,000 1,596,000 1,564,000 1,476,000 1,349,000 1,192,000 1,020,000 847,000 690,000
46 Khagrachhari Zila 629,000 783,000 931,000 1,067,000 1,179,000 1,259,000 1,302,000 1,302,000 1,264,000 1,205,000
51 Lakshmipur Zila 1,774,000 1,892,000 1,930,000 1,896,000 1,795,000 1,644,000 1,458,000 1,250,000 1,041,000 850,000
75 Noakhali Zila 3,176,000 3,493,000 3,675,000 3,725,000 3,637,000 3,436,000 3,142,000 2,779,000 2,387,000 2,011,000
84 Rangamati Zila 611,000 691,000 749,000 781,000 785,000 763,000 718,000 654,000 578,000 501,000

83
Code DISTRICT NAME
Population (low variant)
ZILA 2010 2020 2030 2040 2050 2060 2070 2080 2090 2100
Dhaka Division
26 Dhaka Zila 12,103,000 16,143,000 19,977,000 23,143,000 25,154,000 25,813,000 25,072,000 23,069,000 20,222,000 17,094,000
29 Faridpur Zila 1,976,000 2,068,000 2,072,000 1,999,000 1,858,000 1,671,000 1,455,000 1,225,000 1,001,000 803,000
33 Gazipur Zila 3,358,000 4,519,000 5,818,000 7,216,000 8,623,000 9,968,000 11,154,000 12,072,000 12,686,000 13,081,000
35 Gopalganj Zila 1,221,000 1,192,000 1,113,000 1,002,000 869,000 729,000 592,000 465,000 354,000 265,000
39 Jamalpur Zila 2,368,000 2,432,000 2,391,000 2,263,000 2,064,000 1,822,000 1,556,000 1,286,000 1,031,000 812,000
48 Kishoreganj Zila 2,998,000 3,129,000 3,125,000 3,006,000 2,786,000 2,498,000 2,168,000 1,820,000 1,483,000 1,186,000
54 Madaripur Zila 1,212,000 1,176,000 1,091,000 976,000 840,000 700,000 565,000 440,000 334,000 248,000
56 Manikganj Zila 1,439,000 1,455,000 1,407,000 1,311,000 1,177,000 1,022,000 859,000 698,000 551,000 427,000
59 Munshiganj Zila 1,489,000 1,525,000 1,495,000 1,412,000 1,284,000 1,130,000 963,000 793,000 634,000 498,000
61 Mymensingh Zila 5,254,000 5,545,000 5,600,000 5,448,000 5,106,000 4,630,000 4,063,000 3,449,000 2,843,000 2,299,000
67 Narayanganj Zila 2,976,000 3,583,000 4,127,000 4,579,000 4,895,000 5,063,000 5,068,000 4,907,000 4,613,000 4,256,000
68 Narsingdi Zila 2,280,000 2,458,000 2,535,000 2,518,000 2,410,000 2,231,000 2,000,000 1,734,000 1,459,000 1,205,000
72 Netrokona Zila 2,296,000 2,420,000 2,441,000 2,372,000 2,220,000 2,010,000 1,762,000 1,494,000 1,230,000 993,000
82 Rajbari Zila 1,083,000 1,127,000 1,123,000 1,078,000 997,000 892,000 772,000 647,000 526,000 420,000
86 Shariatpur Zila 1,196,000 1,223,000 1,197,000 1,129,000 1,025,000 901,000 766,000 630,000 503,000 395,000
89 Sherpur Zila 1,406,000 1,427,000 1,385,000 1,295,000 1,166,000 1,016,000 857,000 700,000 554,000 431,000
93 Tangail Zila 3,721,000 3,787,000 3,688,000 3,459,000 3,126,000 2,733,000 2,313,000 1,893,000 1,505,000 1,174,000
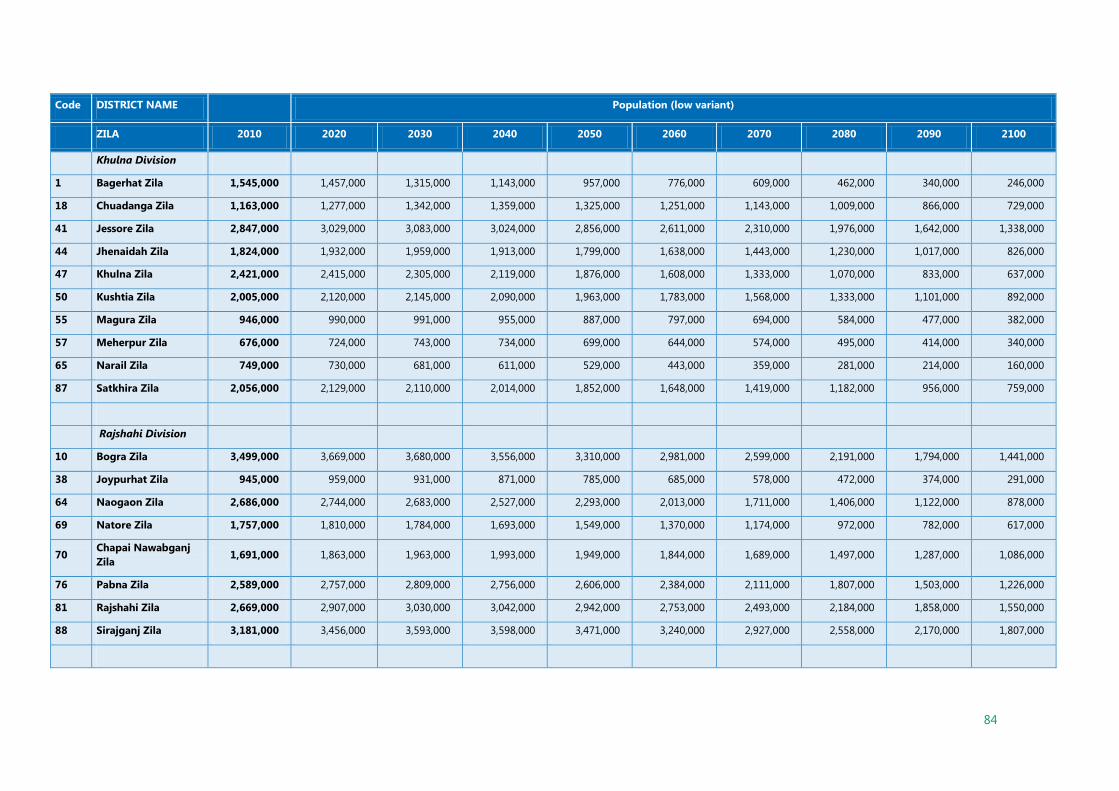
84
Code DISTRICT NAME
Population (low variant)
ZILA 2010 2020 2030 2040 2050 2060 2070 2080 2090 2100
Khulna Division
1 Bagerhat Zila 1,545,000 1,457,000 1,315,000 1,143,000 957,000 776,000 609,000 462,000 340,000 246,000
18 Chuadanga Zila 1,163,000 1,277,000 1,342,000 1,359,000 1,325,000 1,251,000 1,143,000 1,009,000 866,000 729,000
41 Jessore Zila 2,847,000 3,029,000 3,083,000 3,024,000 2,856,000 2,611,000 2,310,000 1,976,000 1,642,000 1,338,000
44 Jhenaidah Zila 1,824,000 1,932,000 1,959,000 1,913,000 1,799,000 1,638,000 1,443,000 1,230,000 1,017,000 826,000
47 Khulna Zila 2,421,000 2,415,000 2,305,000 2,119,000 1,876,000 1,608,000 1,333,000 1,070,000 833,000 637,000
50 Kushtia Zila 2,005,000 2,120,000 2,145,000 2,090,000 1,963,000 1,783,000 1,568,000 1,333,000 1,101,000 892,000
55 Magura Zila 946,000 990,000 991,000 955,000 887,000 797,000 694,000 584,000 477,000 382,000
57 Meherpur Zila 676,000 724,000 743,000 734,000 699,000 644,000 574,000 495,000 414,000 340,000
65 Narail Zila 749,000 730,000 681,000 611,000 529,000 443,000 359,000 281,000 214,000 160,000
87 Satkhira Zila 2,056,000 2,129,000 2,110,000 2,014,000 1,852,000 1,648,000 1,419,000 1,182,000 956,000 759,000
Rajshahi Division
10 Bogra Zila 3,499,000 3,669,000 3,680,000 3,556,000 3,310,000 2,981,000 2,599,000 2,191,000 1,794,000 1,441,000
38 Joypurhat Zila 945,000 959,000 931,000 871,000 785,000 685,000 578,000 472,000 374,000 291,000
64 Naogaon Zila 2,686,000 2,744,000 2,683,000 2,527,000 2,293,000 2,013,000 1,711,000 1,406,000 1,122,000 878,000
69 Natore Zila 1,757,000 1,810,000 1,784,000 1,693,000 1,549,000 1,370,000 1,174,000 972,000 782,000 617,000
70 Chapai Nawabganj
Zila 1,691,000 1,863,000 1,963,000 1,993,000 1,949,000 1,844,000 1,689,000 1,497,000 1,287,000 1,086,000
76 Pabna Zila 2,589,000 2,757,000 2,809,000 2,756,000 2,606,000 2,384,000 2,111,000 1,807,000 1,503,000 1,226,000
81 Rajshahi Zila 2,669,000 2,907,000 3,030,000 3,042,000 2,942,000 2,753,000 2,493,000 2,184,000 1,858,000 1,550,000
88 Sirajganj Zila 3,181,000 3,456,000 3,593,000 3,598,000 3,471,000 3,240,000 2,927,000 2,558,000 2,170,000 1,807,000
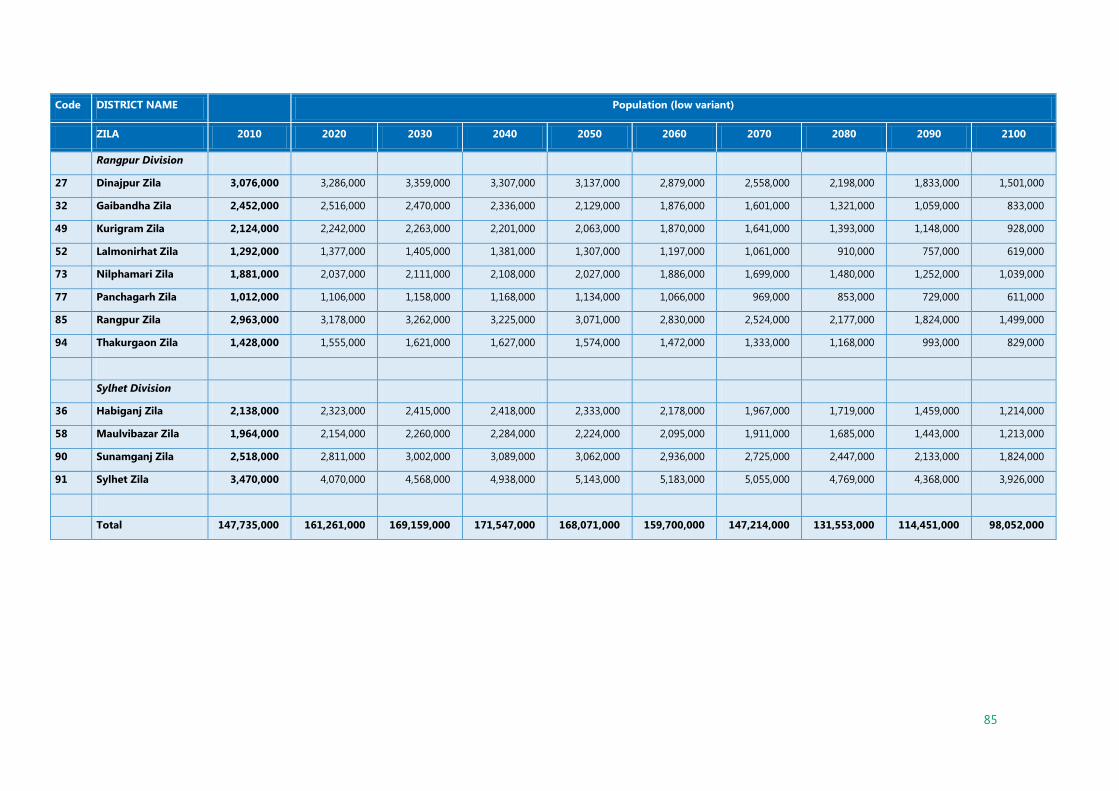
85
Code DISTRICT NAME
Population (low variant)
ZILA 2010 2020 2030 2040 2050 2060 2070 2080 2090 2100
Rangpur Division
27 Dinajpur Zila 3,076,000 3,286,000 3,359,000 3,307,000 3,137,000 2,879,000 2,558,000 2,198,000 1,833,000 1,501,000
32 Gaibandha Zila 2,452,000 2,516,000 2,470,000 2,336,000 2,129,000 1,876,000 1,601,000 1,321,000 1,059,000 833,000
49 Kurigram Zila 2,124,000 2,242,000 2,263,000 2,201,000 2,063,000 1,870,000 1,641,000 1,393,000 1,148,000 928,000
52 Lalmonirhat Zila 1,292,000 1,377,000 1,405,000 1,381,000 1,307,000 1,197,000 1,061,000 910,000 757,000 619,000
73 Nilphamari Zila 1,881,000 2,037,000 2,111,000 2,108,000 2,027,000 1,886,000 1,699,000 1,480,000 1,252,000 1,039,000
77 Panchagarh Zila 1,012,000 1,106,000 1,158,000 1,168,000 1,134,000 1,066,000 969,000 853,000 729,000 611,000
85 Rangpur Zila 2,963,000 3,178,000 3,262,000 3,225,000 3,071,000 2,830,000 2,524,000 2,177,000 1,824,000 1,499,000
94 Thakurgaon Zila 1,428,000 1,555,000 1,621,000 1,627,000 1,574,000 1,472,000 1,333,000 1,168,000 993,000 829,000
Sylhet Division
36 Habiganj Zila 2,138,000 2,323,000 2,415,000 2,418,000 2,333,000 2,178,000 1,967,000 1,719,000 1,459,000 1,214,000
58 Maulvibazar Zila 1,964,000 2,154,000 2,260,000 2,284,000 2,224,000 2,095,000 1,911,000 1,685,000 1,443,000 1,213,000
90 Sunamganj Zila 2,518,000 2,811,000 3,002,000 3,089,000 3,062,000 2,936,000 2,725,000 2,447,000 2,133,000 1,824,000
91 Sylhet Zila 3,470,000 4,070,000 4,568,000 4,938,000 5,143,000 5,183,000 5,055,000 4,769,000 4,368,000 3,926,000
Total 147,735,000 161,261,000 169,159,000 171,547,000 168,071,000 159,700,000 147,214,000 131,553,000 114,451,000 98,052,000

86
Code DISTRICT NAME
Population (low variant)
ZILA 2010 2020 2030 2040 2050 2060 2070 2080 2090 2100
10 Barisal Division 8,656,000 8,505,000 8,005,000 7,267,000 6,361,000 5,394,000 4,432,000 3,526,000 2,726,000 2,071,000
20 Chittagong Division 29,135,000 31,924,000 33,531,000 33,991,000 33,256,000 31,543,000 29,019,000 25,875,000 22,449,000 19,154,000
30 Dhaka Division 48,376,000 55,208,000 60,584,000 64,207,000 65,600,000 64,829,000 61,986,000 57,323,000 51,530,000 45,586,000
40 Khulna Division 16,232,000 16,804,000 16,673,000 15,963,000 14,745,000 13,197,000 11,450,000 9,621,000 7,859,000 6,308,000
50 Rajshahi Division 19,017,000 20,164,000 20,472,000 20,037,000 18,905,000 17,270,000 15,282,000 13,088,000 10,890,000 8,898,000
55 Rangpur Division 16,228,000 17,298,000 17,649,000 17,353,000 16,441,000 15,076,000 13,387,000 11,500,000 9,594,000 7,857,000
60 Sylhet Division 10,090,000 11,357,000 12,244,000 12,730,000 12,762,000 12,391,000 11,659,000 10,620,000 9,402,000 8,177,000
Bangladesh total 147,735,000 161,261,000 169,159,000 171,547,000 168,071,000 159,700,000 147,214,000 131,553,000 114,451,000 98,052,000
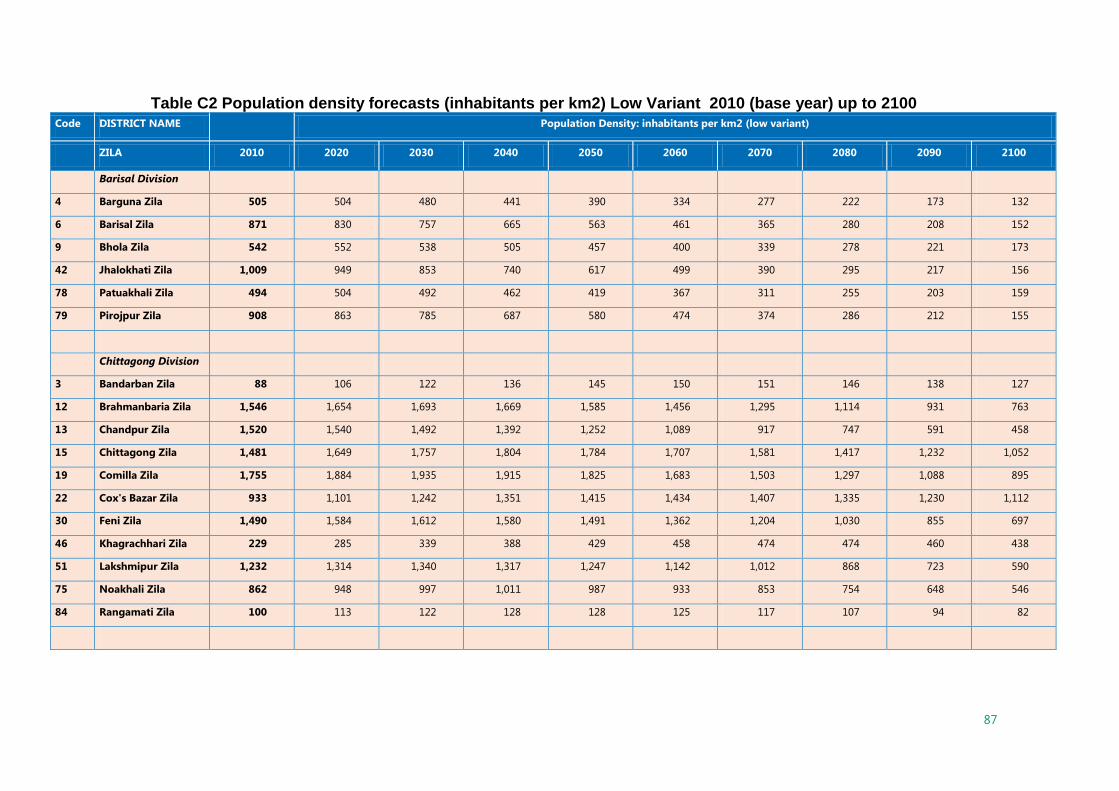
87
Table C2 Population density forecasts (inhabitants per km2) Low Variant 2010 (base year) up to 2100 Code DISTRICT NAME
Population Density: inhabitants per km2 (low variant)
ZILA 2010 2020 2030 2040 2050 2060 2070 2080 2090 2100
Barisal Division
4 Barguna Zila 505 504 480 441 390 334 277 222 173 132
6 Barisal Zila 871 830 757 665 563 461 365 280 208 152
9 Bhola Zila 542 552 538 505 457 400 339 278 221 173
42 Jhalokhati Zila 1,009 949 853 740 617 499 390 295 217 156
78 Patuakhali Zila 494 504 492 462 419 367 311 255 203 159
79 Pirojpur Zila 908 863 785 687 580 474 374 286 212 155
Chittagong Division
3 Bandarban Zila 88 106 122 136 145 150 151 146 138 127
12 Brahmanbaria Zila 1,546 1,654 1,693 1,669 1,585 1,456 1,295 1,114 931 763
13 Chandpur Zila 1,520 1,540 1,492 1,392 1,252 1,089 917 747 591 458
15 Chittagong Zila 1,481 1,649 1,757 1,804 1,784 1,707 1,581 1,417 1,232 1,052
19 Comilla Zila 1,755 1,884 1,935 1,915 1,825 1,683 1,503 1,297 1,088 895
22 Cox's Bazar Zila 933 1,101 1,242 1,351 1,415 1,434 1,407 1,335 1,230 1,112
30 Feni Zila 1,490 1,584 1,612 1,580 1,491 1,362 1,204 1,030 855 697
46 Khagrachhari Zila 229 285 339 388 429 458 474 474 460 438
51 Lakshmipur Zila 1,232 1,314 1,340 1,317 1,247 1,142 1,012 868 723 590
75 Noakhali Zila 862 948 997 1,011 987 933 853 754 648 546
84 Rangamati Zila 100 113 122 128 128 125 117 107 94 82

88
Code DISTRICT NAME
Population Density: inhabitants per km2 (low variant)
ZILA 2010 2020 2030 2040 2050 2060 2070 2080 2090 2100
Dhaka Division
26 Dhaka Zila 8,272 11,034 13,655 15,819 17,194 17,644 17,137 15,769 13,822 11,684
29 Faridpur Zila 963 1,008 1,010 974 906 814 709 597 488 392
33 Gazipur Zila 1,859 2,502 3,222 3,996 4,774 5,519 6,176 6,685 7,024 7,243
35 Gopalganj Zila 831 812 758 683 592 496 403 317 241 181
39 Jamalpur Zila 1,120 1,150 1,130 1,070 976 861 736 608 488 384
48 Kishoreganj Zila 1,115 1,164 1,162 1,118 1,036 929 806 677 552 441
54 Madaripur Zila 1,078 1,045 970 867 747 622 502 392 297 220
56 Manikganj Zila 1,041 1,052 1,017 948 851 739 621 505 399 309
59 Munshiganj Zila 1,483 1,519 1,489 1,406 1,279 1,126 959 790 632 496
61 Mymensingh Zila 1,196 1,262 1,274 1,240 1,162 1,054 925 785 647 523
67 Narayanganj Zila 4,351 5,238 6,033 6,695 7,157 7,402 7,410 7,175 6,745 6,222
68 Narsingdi Zila 1,983 2,137 2,204 2,190 2,096 1,940 1,739 1,508 1,269 1,048
72 Netrokona Zila 822 866 874 849 794 719 631 535 440 356
82 Rajbari Zila 992 1,032 1,029 987 913 817 707 592 482 384
86 Shariatpur Zila 1,019 1,042 1,020 961 873 767 653 537 429 336
89 Sherpur Zila 1,031 1,046 1,015 949 855 745 629 513 406 316
93 Tangail Zila 1,090 1,109 1,080 1,013 916 801 678 555 441 344

89
Code DISTRICT NAME
Population Density: inhabitants per km2 (low variant)
ZILA 2010 2020 2030 2040 2050 2060 2070 2080 2090 2100
Khulna Division
1 Bagerhat Zila 390 368 332 289 242 196 154 117 86 62
18 Chuadanga Zila 990 1,088 1,143 1,158 1,129 1,065 973 860 737 621
41 Jessore Zila 1,093 1,162 1,183 1,160 1,096 1,002 886 758 630 514
44 Jhenaidah Zila 929 984 997 974 916 834 735 626 518 420
47 Khulna Zila 551 550 524 482 427 366 303 243 190 145
50 Kushtia Zila 1,247 1,318 1,334 1,300 1,221 1,109 975 829 685 555
55 Magura Zila 911 953 954 919 854 767 668 562 459 368
57 Meherpur Zila 900 964 989 978 931 857 764 659 552 453
65 Narail Zila 775 755 704 632 547 458 371 291 221 165
87 Satkhira Zila 539 558 553 528 485 432 372 310 250 199
Rajshahi Division
10 Bogra Zila 1,208 1,266 1,270 1,227 1,142 1,029 897 756 619 497
38 Joypurhat Zila 933 947 920 861 776 677 571 466 370 288
64 Naogaon Zila 782 799 781 736 668 586 498 409 327 256
69 Natore Zila 925 953 939 891 815 721 618 512 412 325
70 Chapai Nawabganj
Zila 994 1,094 1,153 1,171 1,145 1,084 993 879 756 638
76 Pabna Zila 1,090 1,160 1,182 1,160 1,097 1,003 888 761 632 516
81 Rajshahi Zila 1,101 1,199 1,249 1,254 1,213 1,135 1,028 901 766 639
88 Sirajganj Zila 1,324 1,439 1,496 1,498 1,445 1,349 1,219 1,065 904 752
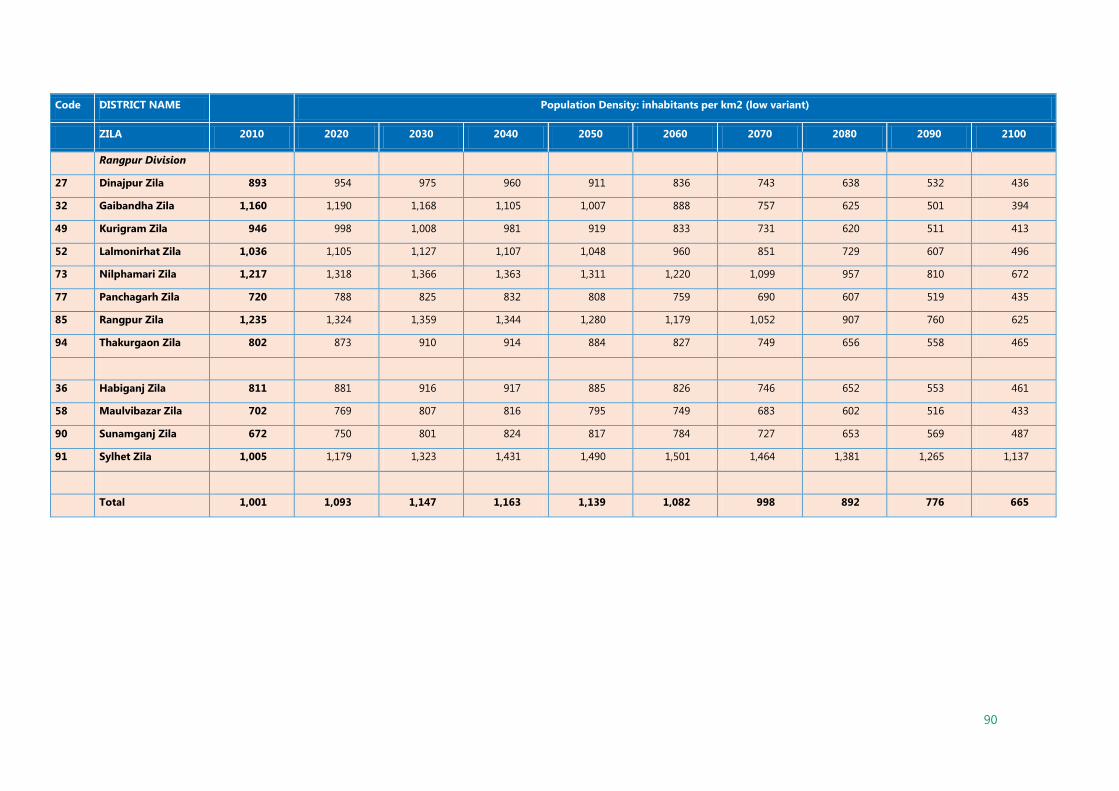
90
Code DISTRICT NAME
Population Density: inhabitants per km2 (low variant)
ZILA 2010 2020 2030 2040 2050 2060 2070 2080 2090 2100
Rangpur Division
27 Dinajpur Zila 893 954 975 960 911 836 743 638 532 436
32 Gaibandha Zila 1,160 1,190 1,168 1,105 1,007 888 757 625 501 394
49 Kurigram Zila 946 998 1,008 981 919 833 731 620 511 413
52 Lalmonirhat Zila 1,036 1,105 1,127 1,107 1,048 960 851 729 607 496
73 Nilphamari Zila 1,217 1,318 1,366 1,363 1,311 1,220 1,099 957 810 672
77 Panchagarh Zila 720 788 825 832 808 759 690 607 519 435
85 Rangpur Zila 1,235 1,324 1,359 1,344 1,280 1,179 1,052 907 760 625
94 Thakurgaon Zila 802 873 910 914 884 827 749 656 558 465
36 Habiganj Zila 811 881 916 917 885 826 746 652 553 461
58 Maulvibazar Zila 702 769 807 816 795 749 683 602 516 433
90 Sunamganj Zila 672 750 801 824 817 784 727 653 569 487
91 Sylhet Zila 1,005 1,179 1,323 1,431 1,490 1,501 1,464 1,381 1,265 1,137
Total 1,001 1,093 1,147 1,163 1,139 1,082 998 892 776 665
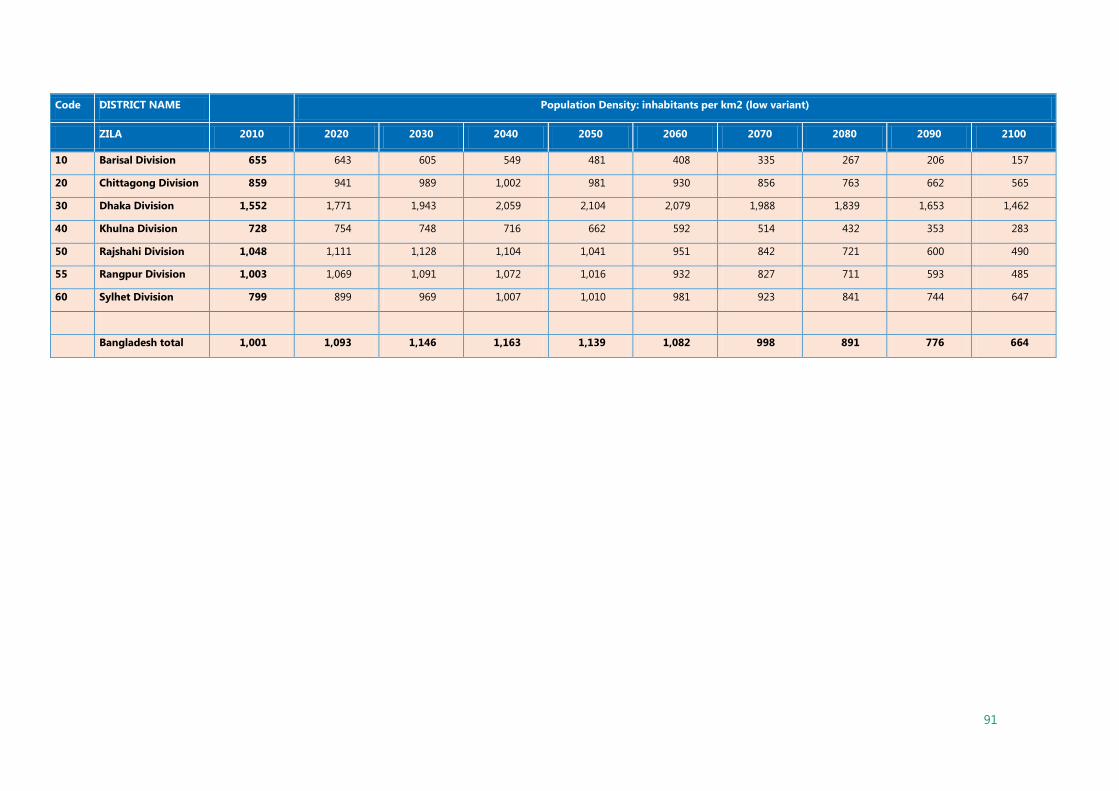
91
Code DISTRICT NAME
Population Density: inhabitants per km2 (low variant)
ZILA 2010 2020 2030 2040 2050 2060 2070 2080 2090 2100
10 Barisal Division 655 643 605 549 481 408 335 267 206 157
20 Chittagong Division 859 941 989 1,002 981 930 856 763 662 565
30 Dhaka Division 1,552 1,771 1,943 2,059 2,104 2,079 1,988 1,839 1,653 1,462
40 Khulna Division 728 754 748 716 662 592 514 432 353 283
50 Rajshahi Division 1,048 1,111 1,128 1,104 1,041 951 842 721 600 490
55 Rangpur Division 1,003 1,069 1,091 1,072 1,016 932 827 711 593 485
60 Sylhet Division 799 899 969 1,007 1,010 981 923 841 744 647
Bangladesh total 1,001 1,093 1,146 1,163 1,139 1,082 998 891 776 664