Embed Size (px)
Citation preview
Knowledge and Management of Aquatic Ecosystems (2008) 389, 05 © ONEMA, 2009 http://www.kmae-journal.orgDOI: 10.1051/kmae/2008011
Growth of black bullhead Ameiurus melas (Rafinesque, 1820) in Corbara Reservoir (Umbria – Italy)
G. Pedicillo(1), A. Bicchi(1), V. Angeli(1), A. Carosi(2), P. Viali(2), M. Lorenzoni(1)
Received April 9, 2008 / Reçu le 9 avril 2008 Revised December 4, 2008 / Révisé le 4 décembre 2008 Accepted December 16, 2008 / Accepté le 16 décembre 2008
ABSTRACT
The age and growth of the invasive black bullhead Ameiurus melas(Rafinesque, 1820) were studied in the Corbara Reservoir, an artificial lake located on the River Tiber in central Italy. The results of the research revea-led that the population was made up of eight cohorts, the oldest speci-mens being spawned in 1999. The sex ratio appears to be balanced, although females predominate in the younger cohorts, while the percenta-ge of males increases among older specimens. The differences between sexes in the slope of the length-weight relationship were not statistically significant; the slope for the whole sample (b = 3.055) was significantly greater than 3, indicating an allometric growth pattern of the black bull-head. There were no significant differences in mean back-calculated lengths at age between the sexes. Analysis of Lee’s phenomenon revealed the existence of differential mortality among younger individuals (1 and 2 years old) that favours larger individuals. The Von Bertalanffy growth func-tion was TLt = 35.69 {1 – exp[–0.18 (t + 0.27)]}. The specimens caught dis-played mean relative weight (Wr) values distinctly below 100 at all ages, while no significant difference emerged between the sexes with regard to condition.
RÉSUMÉ
Croissance du poisson-chat Ameiurus melas (Rafinesque, 1820) dans le Lac Corbara (Ombrie – Italie)
L’âge et la croissance du poisson-chat invasif Ameiurus melas (Rafinesque, 1820) ont été étudiés dans le Lac Corbara, un lac artificiel situé le long du cours du fleuve Tevere, en Italie centrale. Les résultats de la recherche ont révélé que la population était composée de huit classes d’âges, les spécimens les plus âgés provenant de la fraie de 1999. Le sex-ratio semble être équilibré, bien que les femelles prédomi-nent dans les classes d'âges plus jeunes, tandis que le pourcentage de mâles augmente parmi les spécimens plus âgés. Les différences entre les sexes en ma-tière de pente du rapport longueur-poids n’étaient pas significatives ; la pente de tout l’échantillon (b = 3.055) était significativement supérieure à 3, indiquant que le poisson-chat a un modèle de croissance allométrique. Aucune différence signifi-cative n’a été constatée entre les longueurs rétromesurées moyennes des différents sexes au même âge. L’analyse du phénomène de Lee a révélé l’existence d’une
(1) Dipartimento di Biologia Cellulare e Ambientale, Università di Perugia, Via Elce di Sotto, 06123 Perugia, Italy, [email protected](2) Provincia di Terni, Servizio Programmazione Ittico-Faunistica, Via Plinio il Giovane 21, 05100 Terni, Italy
Key-words:age, growth, length-weight relationship, Lee’s phenomenon, relative weight
Mots-clés :âge, croissance, rapport longueur-poids, phénomène de Lee, poids relatif
G. Pedicillo et al.: Knowl. Managt. Aquatic Ecosyst. (2008) 389, 05
différence de mortalité chez les jeunes individus (âgés de 1 et 2 ans) en faveur des individus les plus grands. La fonction de croissance de Von Bertalanffy est de TLt = 35.69 {1 – exp[–0.18 (t + 0.27)]}. Les spécimens capturés présentaient des valeurs de poids moyen relatif (Wr) nettement inférieures à 100 à tous les âges, tandis qu’aucune différence n’est apparue entre les sexes en ce qui concerne la condition.
INTRODUCTION
One of the most important and least studied factors in the deterioration of aquatic ecosystems is reported to be the introduction of exotic species (Lodge et al., 2000; Mack et al., 2000). In the last century, non-indigenous fish species were introduced into European freshwater systems, both intentionally and by accident (Copp et al., 2005). When exotic species are introduced, biodiversity generally declines, especially if the new arrival displaces one or more indigenous species. The result is that a few species able to adapt to a broad range of habitats will proliferate, often at the expense of indigenous or less adaptable ones (Rooney et al., 2007). Non-indigenous populations may affect indigenous communities through competition for limited food resources, predation, the introduction of parasites and diseases, and genetic deterioration via hybridisation or through structural changes in the habitat (Crivelli, 1995).
Native to North America, the black bullhead Ameiurus melas (Rafinesque, 1820) has been recorded in Europe since the nineteenth century (Kottelat and Freyhof, 2007). Although the identity of wild European populations is uncertain, the black bullhead is the most widespread of the ictalurid species introduced into Europe (Wheeler, 1978), and has recently been recorded in Spain (Elvira, 1984) and Portugal (Gante and Santos, 2002). In Italy, the black bullhead first appeared in 1904 (Tortonese, 1970), and has now spread throughout most of the country. While A. melas is widespread in the River Tiber, one of its most abundant populations is to be found in Corbara Reservoir (Lorenzoni et al., 2006).
A possible reason for the diffusion of the black bullhead is its ability to tolerate a wide range of environmental conditions (Smith, 1949; Stuber, 1982). Black bullhead populations often reach high biomass levels (Brown et al., 1999). For this reason, it is often considered undesirable and a potential threat to autochthonous fish species, on account of both competition for resources and predation upon small fishes. French legislation classifies it as a “species liable to cause biological disequilibrium” (Cucherousset et al., 2006).
Despite the widespread distribution of the species, little information is currently available on the ecology of the black bullhead in Italy and its impact on indigenous fish communities. Any management strategy that aims to contain invasive species and to safeguard biodiversity can only be successful if it is based on thorough knowledge of the diffusion, ecology and biology of the species introduced and of the impact that they have on native communities (Byers et al., 2002). Quantification of age and growth is a vital component in understanding the ecology and life history of any fish species; this is especially important for an introduced species like the black bullhead. Knowledge of the individual growth rates and age structure of an introduced population is required in order to determine the success and degree of establishment as well as to predict the fish’s impact on native fauna. Growth rate information can also be used to compare dynamics among water bodies, years and fish size; to describe trends over time; to examine total mortality rates and to determine the general status of a population (Kwak et al., 2006).
The objectives of our research were to quantify the growth rates, age structure, condition and sex ratio of the black bullhead population in Corbara Reservoir, and to compare our findings with those from rivers and reservoirs in native and introduced ranges in order to elucidate trends among populations.
05p2
G. Pedicillo et al.: Knowl. Managt. Aquatic Ecosyst. (2008) 389, 05
MATERIALS AND METHODS
> STUDY SITE AND SAMPLING PROCEDURES
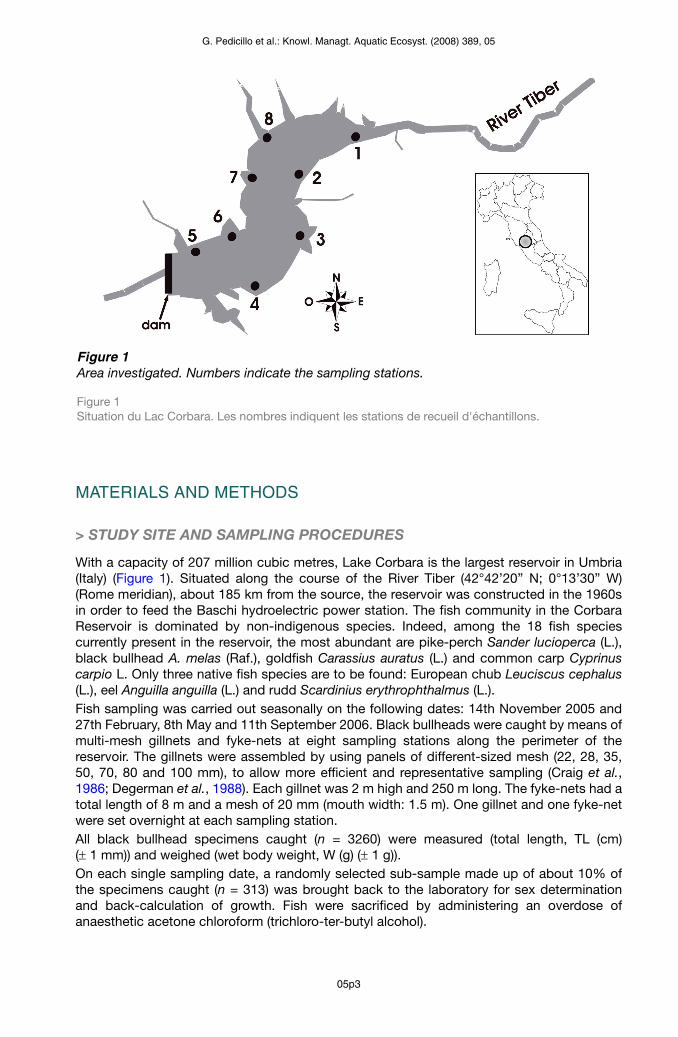
With a capacity of 207 million cubic metres, Lake Corbara is the largest reservoir in Umbria (Italy) (Figure 1). Situated along the course of the River Tiber (42°42’20” N; 0°13’30” W) (Rome meridian), about 185 km from the source, the reservoir was constructed in the 1960s in order to feed the Baschi hydroelectric power station. The fish community in the Corbara Reservoir is dominated by non-indigenous species. Indeed, among the 18 fish species currently present in the reservoir, the most abundant are pike-perch Sander lucioperca (L.), black bullhead A. melas (Raf.), goldfish Carassius auratus (L.) and common carp Cyprinus carpio L. Only three native fish species are to be found: European chub Leuciscus cephalus(L.), eel Anguilla anguilla (L.) and rudd Scardinius erythrophthalmus (L.).Fish sampling was carried out seasonally on the following dates: 14th November 2005 and 27th February, 8th May and 11th September 2006. Black bullheads were caught by means of multi-mesh gillnets and fyke-nets at eight sampling stations along the perimeter of the reservoir. The gillnets were assembled by using panels of different-sized mesh (22, 28, 35, 50, 70, 80 and 100 mm), to allow more efficient and representative sampling (Craig et al., 1986; Degerman et al., 1988). Each gillnet was 2 m high and 250 m long. The fyke-nets had a total length of 8 m and a mesh of 20 mm (mouth width: 1.5 m). One gillnet and one fyke-net were set overnight at each sampling station. All black bullhead specimens caught (n = 3260) were measured (total length, TL (cm) (± 1 mm)) and weighed (wet body weight, W (g) (± 1 g)). On each single sampling date, a randomly selected sub-sample made up of about 10% of the specimens caught (n = 313) was brought back to the laboratory for sex determination and back-calculation of growth. Fish were sacrificed by administering an overdose of anaesthetic acetone chloroform (trichloro-ter-butyl alcohol).
Figure 1Area investigated. Numbers indicate the sampling stations.
Figure 1 Situation du Lac Corbara. Les nombres indiquent les stations de recueil d'échantillons.
05p3
G. Pedicillo et al.: Knowl. Managt. Aquatic Ecosyst. (2008) 389, 05
> LABORATORY ANALYSIS
Age and sex
Bhattacharya’s method (Bhattacharya, 1967) was used to split the age-classes from the length-frequency data of all black bullheads caught (n = 3260), by means of the program FiSAT II (version 1.2.2) (Gayanilo et al., 2006). This was followed by the application of modal class progression analysis, which yields an index that must be greater than 2 to provide meaningful separations. Specimens were assigned to a given age-class on the basis of the number of winters that they had lived through before being caught. The date conventionally used as a cut-off between one age-class and the next was 31st December (Devries and Frie, 1996). As sampling was carried out in two different calendar years, the same specimen could be assigned to two different age-classes, depending on the period in which it was caught. For this reason, in the analyses of population structure, the cohorts were identified according to the year of spawning of the individual specimens, rather than the age-class. Sex was determined by means of macroscopic examination of the gonads (Bagenal, 1978). To analyse the sex ratio, the percentages of males and females in each cohort were compared by means of Fisher’s exact test.
Back-calculation of total lengths
The right pectoral spine of 82 black bullheads was removed for back-calculated growth analysis. Specimens included in the study were selected at 1-cm length intervals, in order to encompass the whole length range of the sub-sample brought back to the laboratory. The spines removed were cleaned of dry tissue and sectioned. Sections approximately 0.5 mm thick were cut through the dorsal and anterior processes. This location minimises the influence of the central lumen (Buckmeier, 2002). Photographs were taken of all pectoral spines for image analyses, which were carried out by means of ImageJ software (1.26 version). This software served to accurately measure pectoral spine radius at the time of capture (from the focus to the edge) and the different radii of age-rings (from the focus to the corresponding ring-mark identified as an annulus).The previous growth of black bullhead was determined by back-calculation from the sections of pectoral spine measurements. Back-calculation is based on the assumption that the growth of the fish is proportional to the growth of its bony structures. The relationship between the chosen structure and the body length of the fish can be described by means of various linear or non-linear equations (Francis, 1990; Secor and Dean, 1992). Length at age was back-cal-culated by means of various models: the direct-proportional method of Dahl-Lea (DPM) (Dahl, 1907; Lea, 1910), the Fraser-Lee method (Devries and Frie, 1996), the linear body propor-tional hypothesis (LBPH), and the non-linear body proportional hypothesis (NLBPH); detailed descriptions of the formulae and rationale of these methods can be found in Smedstad and Holm (1996). On comparing the various methods by means of the ANOVA test, no significant differences emerged in the back-calculated lengths at the different ages; the relationships between TL and radius of the pectoral spine were substantially homogeneous in terms of the variance justified by the different models. For this reason, in subsequent analyses and figures, the widely used Fraser-Lee method was preferred (Ricker, 1992); the relationship between the TL of specimens at the time of capture (TLc) and total radius of the pectoral spine (Rs) was described by means of the equation: TLc = a + b Rs. The past TL at the time of check for-mation was back-calculated by means of the formula (Devries and Frie, 1996): TLt – a = Rt / Rs (TLc – a), where TLt is total length (in cm) relative to age t and Rt is the radius (in cm) of the annulus t; the parameter a was defined as the intercept of linear regression between TLcand Rs. The Fraser-Lee method of back-calculation is used when the intercept of the relation-ship between fish length and hard-part radius is not at the origin (Devries and Frie, 1996).
05p4
G. Pedicillo et al.: Knowl. Managt. Aquatic Ecosyst. (2008) 389, 05
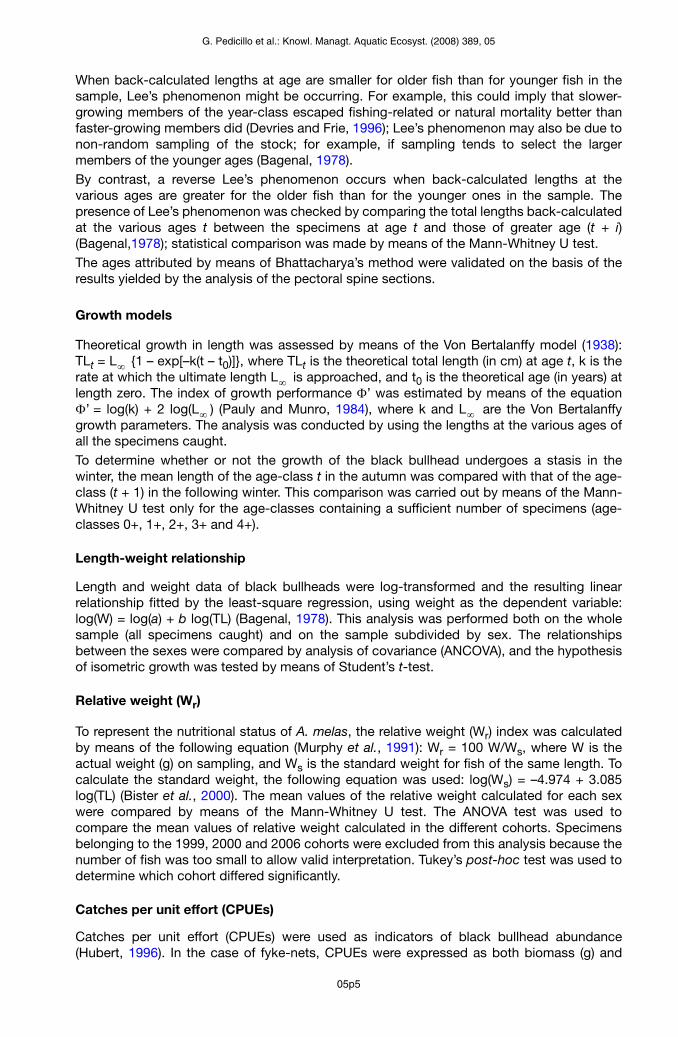
When back-calculated lengths at age are smaller for older fish than for younger fish in the sample, Lee’s phenomenon might be occurring. For example, this could imply that slower-growing members of the year-class escaped fishing-related or natural mortality better than faster-growing members did (Devries and Frie, 1996); Lee’s phenomenon may also be due to non-random sampling of the stock; for example, if sampling tends to select the larger members of the younger ages (Bagenal, 1978).By contrast, a reverse Lee’s phenomenon occurs when back-calculated lengths at the various ages are greater for the older fish than for the younger ones in the sample. The presence of Lee’s phenomenon was checked by comparing the total lengths back-calculated at the various ages t between the specimens at age t and those of greater age (t + i) (Bagenal,1978); statistical comparison was made by means of the Mann-Whitney U test.The ages attributed by means of Bhattacharya’s method were validated on the basis of the results yielded by the analysis of the pectoral spine sections.
Growth models
Theoretical growth in length was assessed by means of the Von Bertalanffy model (1938): TLt = L {1 – exp[–k(t – t0)]}, where TLt is the theoretical total length (in cm) at age t, k is the rate at which the ultimate length L is approached, and t0 is the theoretical age (in years) at length zero. The index of growth performance ’ was estimated by means of the equation
’ = log(k) + 2 log(L ) (Pauly and Munro, 1984), where k and L are the Von Bertalanffy growth parameters. The analysis was conducted by using the lengths at the various ages of all the specimens caught.To determine whether or not the growth of the black bullhead undergoes a stasis in the winter, the mean length of the age-class t in the autumn was compared with that of the age-class (t + 1) in the following winter. This comparison was carried out by means of the Mann-Whitney U test only for the age-classes containing a sufficient number of specimens (age-classes 0+, 1+, 2+, 3+ and 4+).
Length-weight relationship
Length and weight data of black bullheads were log-transformed and the resulting linear relationship fitted by the least-square regression, using weight as the dependent variable: log(W) = log(a) + b log(TL) (Bagenal, 1978). This analysis was performed both on the whole sample (all specimens caught) and on the sample subdivided by sex. The relationships between the sexes were compared by analysis of covariance (ANCOVA), and the hypothesis of isometric growth was tested by means of Student’s t-test.
Relative weight (Wr)
To represent the nutritional status of A. melas, the relative weight (Wr) index was calculated by means of the following equation (Murphy et al., 1991): Wr = 100 W/Ws, where W is the actual weight (g) on sampling, and Ws is the standard weight for fish of the same length. To calculate the standard weight, the following equation was used: log(Ws) = –4.974 + 3.085 log(TL) (Bister et al., 2000). The mean values of the relative weight calculated for each sex were compared by means of the Mann-Whitney U test. The ANOVA test was used to compare the mean values of relative weight calculated in the different cohorts. Specimens belonging to the 1999, 2000 and 2006 cohorts were excluded from this analysis because the number of fish was too small to allow valid interpretation. Tukey’s post-hoc test was used to determine which cohort differed significantly.
Catches per unit effort (CPUEs)
Catches per unit effort (CPUEs) were used as indicators of black bullhead abundance (Hubert, 1996). In the case of fyke-nets, CPUEs were expressed as both biomass (g) and
∞∞
ΦΦ ∞ ∞
05p5
G. Pedicillo et al.: Knowl. Managt. Aquatic Ecosyst. (2008) 389, 05
the number of individuals (ind.) caught per night; for gillnets, fishing effort was calculated on the area of nets, and CPUEs were expressed as ind·m–2 and g·m–2 per night. In order to analyse the trend in black bullhead stocks over time, the CPUEs calculated were compared with those recorded during a similar study conducted in Corbara Reservoir in 2000, which used the same sampling pattern (the same stations, equipment and seasonal periods). The data from the two studies were therefore directly comparable. The basic principle underlying the use of CPUE data is that changes in CPUE accurately reflect changes in the abundance of fish in the stock (King, 1995). Comparison between the mean CPUEs in each of the two sampling years was carried out by means of the Mann-Whitney U test.
RESULTS
> SEX, AGE AND LENGTH DISTRIBUTIONS
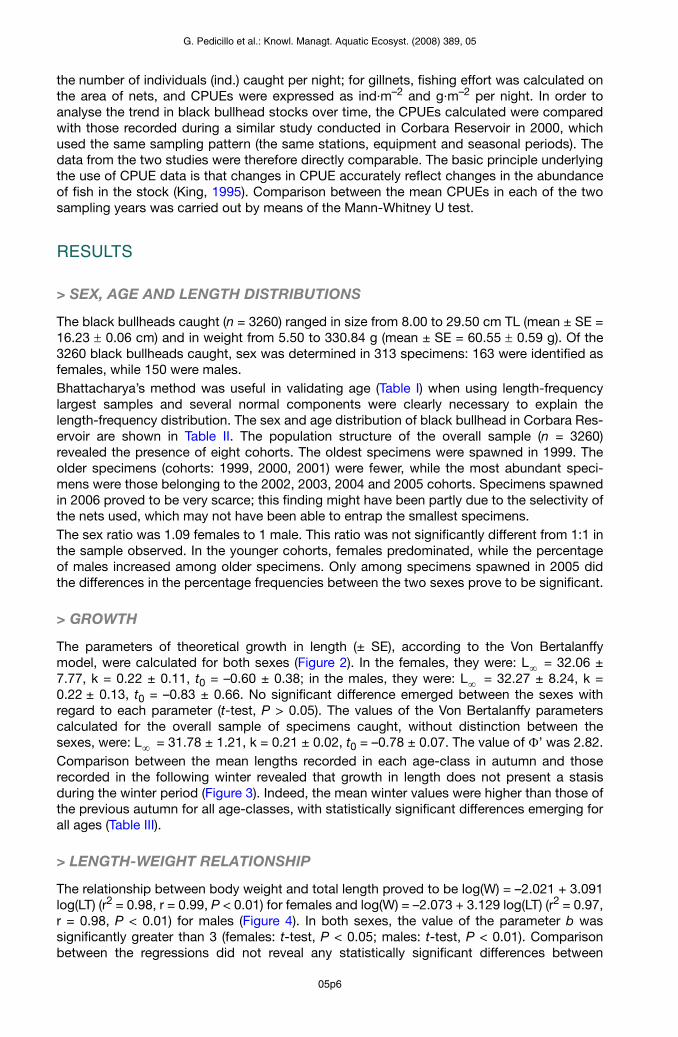
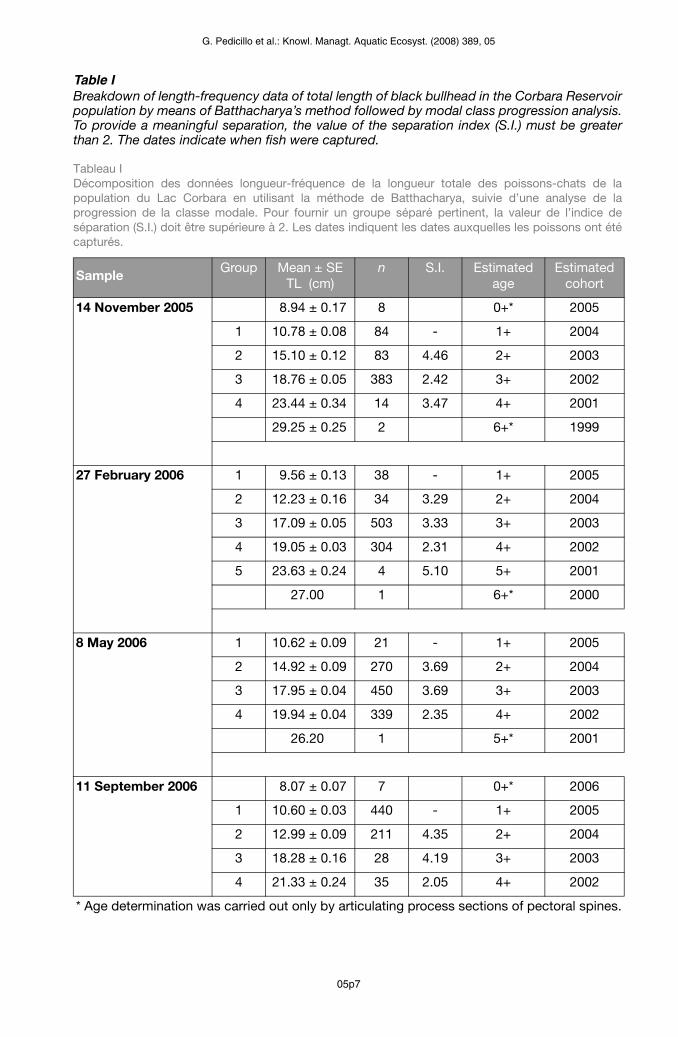
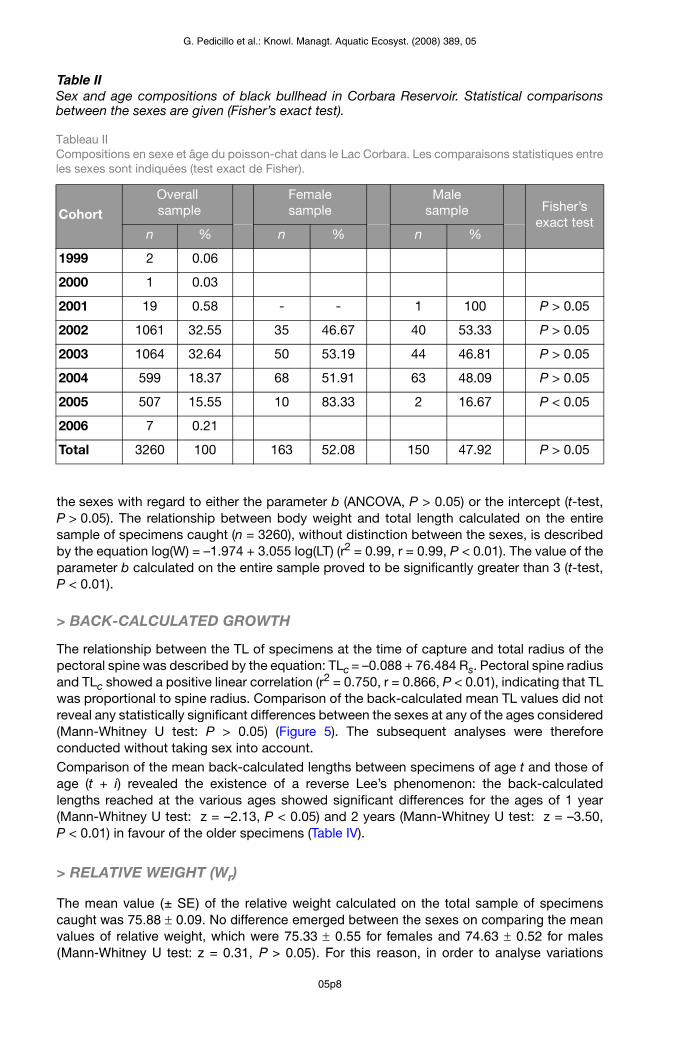
The black bullheads caught (n = 3260) ranged in size from 8.00 to 29.50 cm TL (mean ± SE = 16.23 ± 0.06 cm) and in weight from 5.50 to 330.84 g (mean ± SE = 60.55 ± 0.59 g). Of the 3260 black bullheads caught, sex was determined in 313 specimens: 163 were identified as females, while 150 were males.Bhattacharya’s method was useful in validating age (Table I) when using length-frequency largest samples and several normal components were clearly necessary to explain the length-frequency distribution. The sex and age distribution of black bullhead in Corbara Res-ervoir are shown in Table II. The population structure of the overall sample (n = 3260) revealed the presence of eight cohorts. The oldest specimens were spawned in 1999. The older specimens (cohorts: 1999, 2000, 2001) were fewer, while the most abundant speci-mens were those belonging to the 2002, 2003, 2004 and 2005 cohorts. Specimens spawned in 2006 proved to be very scarce; this finding might have been partly due to the selectivity of the nets used, which may not have been able to entrap the smallest specimens.The sex ratio was 1.09 females to 1 male. This ratio was not significantly different from 1:1 in the sample observed. In the younger cohorts, females predominated, while the percentage of males increased among older specimens. Only among specimens spawned in 2005 did the differences in the percentage frequencies between the two sexes prove to be significant.
> GROWTH
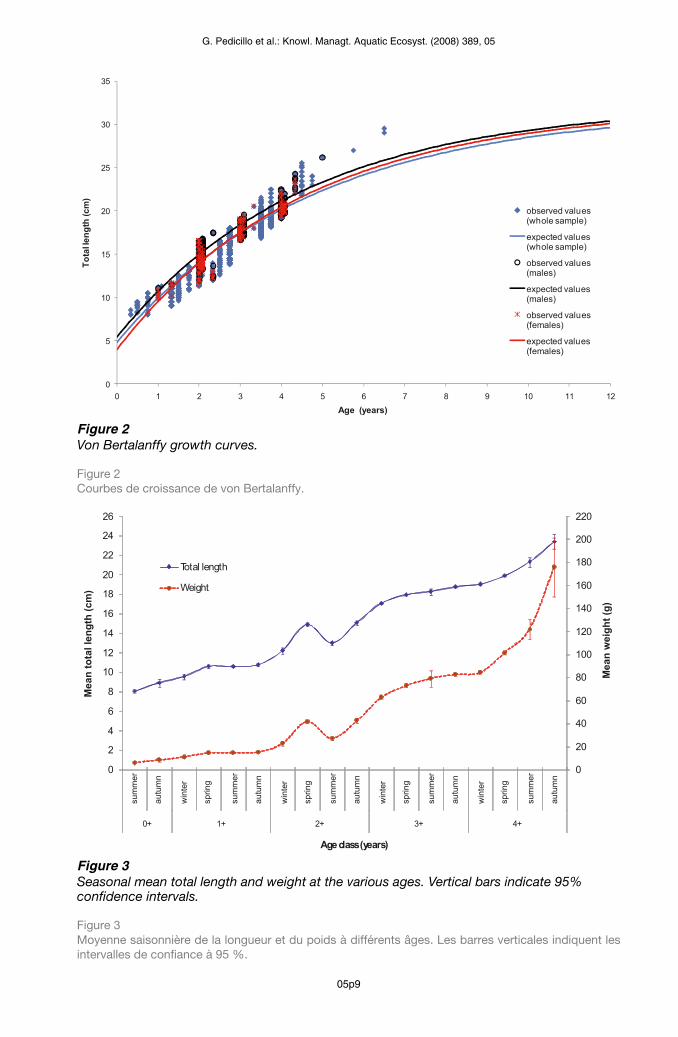
The parameters of theoretical growth in length (± SE), according to the Von Bertalanffy model, were calculated for both sexes (Figure 2). In the females, they were: L = 32.06 ± 7.77, k = 0.22 ± 0.11, t0 = –0.60 ± 0.38; in the males, they were: L = 32.27 ± 8.24, k = 0.22 ± 0.13, t0 = –0.83 ± 0.66. No significant difference emerged between the sexes with regard to each parameter (t-test, P > 0.05). The values of the Von Bertalanffy parameters calculated for the overall sample of specimens caught, without distinction between the sexes, were: L = 31.78 ± 1.21, k = 0.21 ± 0.02, t0 = –0.78 ± 0.07. The value of ’ was 2.82.Comparison between the mean lengths recorded in each age-class in autumn and those recorded in the following winter revealed that growth in length does not present a stasis during the winter period (Figure 3). Indeed, the mean winter values were higher than those of the previous autumn for all age-classes, with statistically significant differences emerging for all ages (Table III).
> LENGTH-WEIGHT RELATIONSHIP
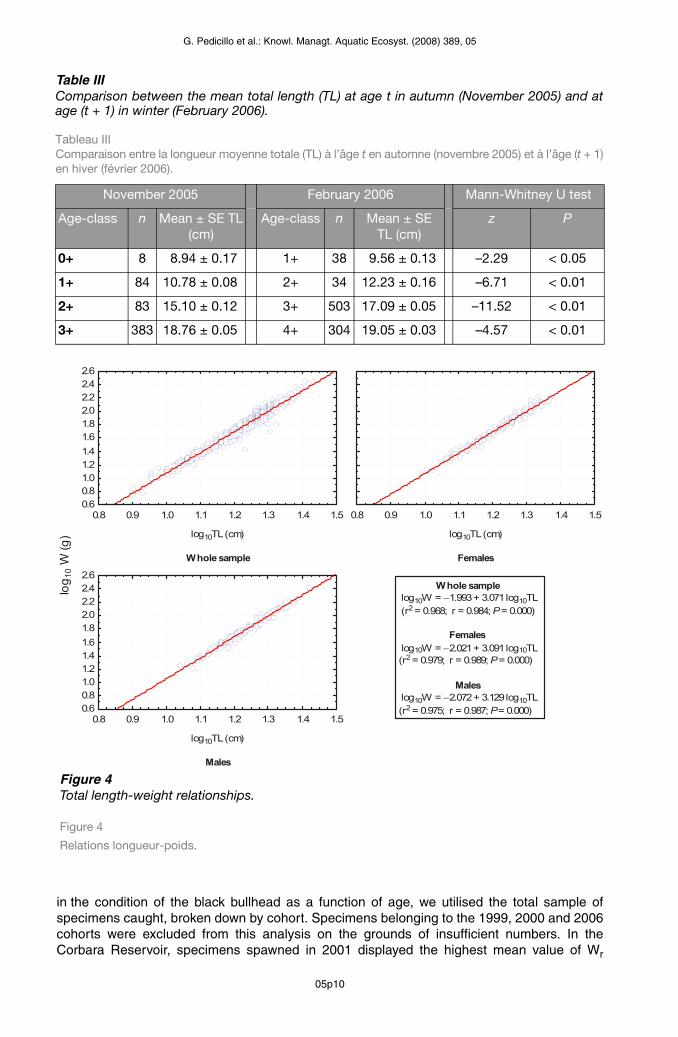
The relationship between body weight and total length proved to be log(W) = –2.021 + 3.091 log(LT) (r2 = 0.98, r = 0.99, P < 0.01) for females and log(W) = –2.073 + 3.129 log(LT) (r2 = 0.97, r = 0.98, P < 0.01) for males (Figure 4). In both sexes, the value of the parameter b was significantly greater than 3 (females: t-test, P < 0.05; males: t-test, P < 0.01). Comparison between the regressions did not reveal any statistically significant differences between
∞∞
∞ Φ
05p6
G. Pedicillo et al.: Knowl. Managt. Aquatic Ecosyst. (2008) 389, 05
Table IBreakdown of length-frequency data of total length of black bullhead in the Corbara Reservoir population by means of Batthacharya’s method followed by modal class progression analysis. To provide a meaningful separation, the value of the separation index (S.I.) must be greater than 2. The dates indicate when fish were captured.
Tableau I Décomposition des données longueur-fréquence de la longueur totale des poissons-chats de la population du Lac Corbara en utilisant la méthode de Batthacharya, suivie d’une analyse de la progression de la classe modale. Pour fournir un groupe séparé pertinent, la valeur de l’indice de séparation (S.I.) doit être supérieure à 2. Les dates indiquent les dates auxquelles les poissons ont été capturés.
SampleGroup Mean ± SE
TL (cm)n S.I. Estimated
ageEstimated
cohort
14 November 2005 8.94 ± 0.17 8 0+* 2005
1 10.78 ± 0.08 84 - 1+ 2004
2 15.10 ± 0.12 83 4.46 2+ 2003
3 18.76 ± 0.05 383 2.42 3+ 2002
4 23.44 ± 0.34 14 3.47 4+ 2001
29.25 ± 0.25 2 6+* 1999
27 February 2006 1 9.56 ± 0.13 38 - 1+ 2005
2 12.23 ± 0.16 34 3.29 2+ 2004
3 17.09 ± 0.05 503 3.33 3+ 2003
4 19.05 ± 0.03 304 2.31 4+ 2002
5 23.63 ± 0.24 4 5.10 5+ 2001
27.00 1 6+* 2000
8 May 2006 1 10.62 ± 0.09 21 - 1+ 2005
2 14.92 ± 0.09 270 3.69 2+ 2004
3 17.95 ± 0.04 450 3.69 3+ 2003
4 19.94 ± 0.04 339 2.35 4+ 2002
26.20 1 5+* 2001
11 September 2006 8.07 ± 0.07 7 0+* 2006
1 10.60 ± 0.03 440 - 1+ 2005
2 12.99 ± 0.09 211 4.35 2+ 2004
3 18.28 ± 0.16 28 4.19 3+ 2003
4 21.33 ± 0.24 35 2.05 4+ 2002
* Age determination was carried out only by articulating process sections of pectoral spines.
05p7
G. Pedicillo et al.: Knowl. Managt. Aquatic Ecosyst. (2008) 389, 05
the sexes with regard to either the parameter b (ANCOVA, P > 0.05) or the intercept (t-test, P > 0.05). The relationship between body weight and total length calculated on the entire sample of specimens caught (n = 3260), without distinction between the sexes, is described by the equation log(W) = –1.974 + 3.055 log(LT) (r2 = 0.99, r = 0.99, P < 0.01). The value of the parameter b calculated on the entire sample proved to be significantly greater than 3 (t-test, P < 0.01).
> BACK-CALCULATED GROWTH
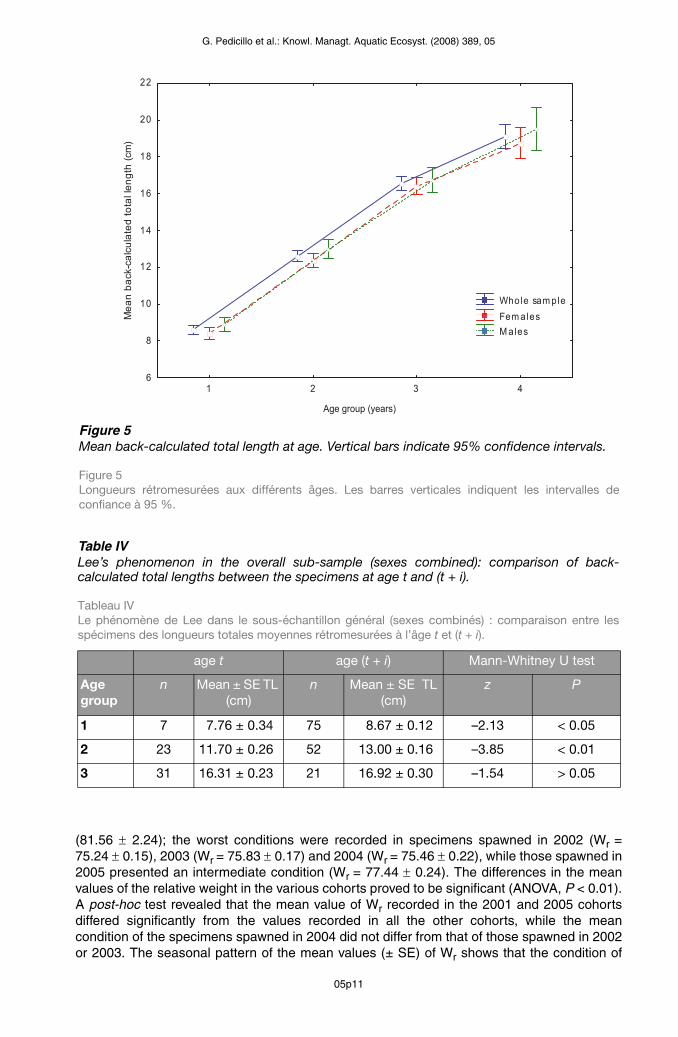
The relationship between the TL of specimens at the time of capture and total radius of the pectoral spine was described by the equation: TLc = –0.088 + 76.484 Rs. Pectoral spine radius and TLc showed a positive linear correlation (r2 = 0.750, r = 0.866, P < 0.01), indicating that TL was proportional to spine radius. Comparison of the back-calculated mean TL values did not reveal any statistically significant differences between the sexes at any of the ages considered (Mann-Whitney U test: P > 0.05) (Figure 5). The subsequent analyses were therefore conducted without taking sex into account. Comparison of the mean back-calculated lengths between specimens of age t and those of age (t + i) revealed the existence of a reverse Lee’s phenomenon: the back-calculated lengths reached at the various ages showed significant differences for the ages of 1 year (Mann-Whitney U test: z = –2.13, P < 0.05) and 2 years (Mann-Whitney U test: z = –3.50, P < 0.01) in favour of the older specimens (Table IV).
> RELATIVE WEIGHT (Wr)
The mean value (± SE) of the relative weight calculated on the total sample of specimens caught was 75.88 ± 0.09. No difference emerged between the sexes on comparing the mean values of relative weight, which were 75.33 ± 0.55 for females and 74.63 ± 0.52 for males (Mann-Whitney U test: z = 0.31, P > 0.05). For this reason, in order to analyse variations
Table IISex and age compositions of black bullhead in Corbara Reservoir. Statistical comparisons between the sexes are given (Fisher’s exact test).
Tableau II Compositions en sexe et âge du poisson-chat dans le Lac Corbara. Les comparaisons statistiques entre les sexes sont indiquées (test exact de Fisher).
Cohort
Overall sample
Femalesample
Malesample Fisher’s
exact testn % n % n %
1999 2 0.06
2000 1 0.03
2001 19 0.58 - - 1 100 P > 0.05
2002 1061 32.55 35 46.67 40 53.33 P > 0.05
2003 1064 32.64 50 53.19 44 46.81 P > 0.05
2004 599 18.37 68 51.91 63 48.09 P > 0.05
2005 507 15.55 10 83.33 2 16.67 P < 0.05
2006 7 0.21
Total 3260 100 163 52.08 150 47.92 P > 0.05
05p8
G. Pedicillo et al.: Knowl. Managt. Aquatic Ecosyst. (2008) 389, 05
0
5
10
15
20
25
30
35
0 1 2 3 4 5 6 7 8 9 10 11 12
Tota
l len
gth
(cm
)
Age (years)
observed values (whole sample)
expected values (whole sample)
observed values (males)
expected values (males)
observed values (females)
expected values (females)
0
20
40
60
80
100
120
140
160
180
200
220
0
2
4
6
8
10
12
14
16
18
20
22
24
26
sum
mer
autu
mn
win
ter
sprin
g
sum
mer
autu
mn
win
ter
sprin
g
sum
mer
autu
mn
win
ter
sprin
g
sum
mer
autu
mn
sum
mer
autu
mn
win
ter
sprin
g
+4+3+2+1+0
Mea
n w
eigh
t (g)
Mea
n to
tal l
engt
h (c
m)
Age class (years)
Total length
Weight
Figure 2Von Bertalanffy growth curves.
Figure 2 Courbes de croissance de von Bertalanffy.
Figure 3Seasonal mean total length and weight at the various ages. Vertical bars indicate 95% confidence intervals.
Figure 3 Moyenne saisonnière de la longueur et du poids à différents âges. Les barres verticales indiquent les intervalles de confiance à 95 %.
05p9
G. Pedicillo et al.: Knowl. Managt. Aquatic Ecosyst. (2008) 389, 05
in the condition of the black bullhead as a function of age, we utilised the total sample of specimens caught, broken down by cohort. Specimens belonging to the 1999, 2000 and 2006 cohorts were excluded from this analysis on the grounds of insufficient numbers. In the Corbara Reservoir, specimens spawned in 2001 displayed the highest mean value of Wr
Table IIIComparison between the mean total length (TL) at age t in autumn (November 2005) and at age (t + 1) in winter (February 2006).
Tableau III Comparaison entre la longueur moyenne totale (TL) à l’âge t en automne (novembre 2005) et à l’âge (t + 1)en hiver (février 2006).
November 2005 February 2006 Mann-Whitney U test
Age-class n Mean ± SE TL(cm)
Age-class n Mean ± SETL (cm)
z P
0+ 8 8.94 ± 0.17 1+ 38 9.56 ± 0.13 –2.29 < 0.05
1+ 84 10.78 ± 0.08 2+ 34 12.23 ± 0.16 –6.71 < 0.01
2+ 83 15.10 ± 0.12 3+ 503 17.09 ± 0.05 –11.52 < 0.01
3+ 383 18.76 ± 0.05 4+ 304 19.05 ± 0.03 –4.57 < 0.01
log 1
0 W
(g)
Whole sample
0.8 0.9 1.0 1.1 1.2 1.3 1.4 1.5
log10TL (cm)
0.60.81.01.21.41.61.82.02.22.42.6
Females
0.8 0.9 1.0 1.1 1.2 1.3 1.4 1.5
log10TL (cm)
Males
0.8 0.9 1.0 1.1 1.2 1.3 1.4 1.5
log10TL (cm)
0.60.81.01.21.41.61.82.02.22.42.6
Whole sample log10W = −1.993 + 3.071 log10TL (r2 = 0.968; r = 0.984; P = 0.000)
Females log10W = −2.021 + 3.091 log10TL(r2 = 0.979; r = 0.989; P = 0.000)
Males log10W = −2.072 + 3.129 log10TL (r2 = 0.975; r = 0.987; P = 0.000)
Figure 4Total length-weight relationships.
Figure 4
Relations longueur-poids.
05p10
G. Pedicillo et al.: Knowl. Managt. Aquatic Ecosyst. (2008) 389, 05
(81.56 ± 2.24); the worst conditions were recorded in specimens spawned in 2002 (Wr = 75.24 ± 0.15), 2003 (Wr = 75.83 ± 0.17) and 2004 (Wr = 75.46 ± 0.22), while those spawned in 2005 presented an intermediate condition (Wr = 77.44 ± 0.24). The differences in the mean values of the relative weight in the various cohorts proved to be significant (ANOVA, P < 0.01). A post-hoc test revealed that the mean value of Wr recorded in the 2001 and 2005 cohorts differed significantly from the values recorded in all the other cohorts, while the mean condition of the specimens spawned in 2004 did not differ from that of those spawned in 2002 or 2003. The seasonal pattern of the mean values (± SE) of Wr shows that the condition of
4321
Age group (years)
6
8
10
12
14
16
18
20
22
Mea
n ba
ck-c
alcu
late
d to
tal l
engt
h (c
m)
Whole sam ple Fem ales M ales
Figure 5Mean back-calculated total length at age. Vertical bars indicate 95% confidence intervals.
Figure 5 Longueurs rétromesurées aux différents âges. Les barres verticales indiquent les intervalles de confiance à 95 %.
Table IVLee’s phenomenon in the overall sub-sample (sexes combined): comparison of back-calculated total lengths between the specimens at age t and (t + i).
Tableau IV Le phénomène de Lee dans le sous-échantillon général (sexes combinés) : comparaison entre les spécimens des longueurs totales moyennes rétromesurées à l’âge t et (t + i).
age t age (t + i) Mann-Whitney U test
Age group
n Mean ± SE TL (cm)
n Mean ± SE TL (cm)
z P
1 7 7.76 ± 0.34 75 8.67 ± 0.12 –2.13 < 0.05
2 23 11.70 ± 0.26 52 13.00 ± 0.16 –3.85 < 0.01
3 31 16.31 ± 0.23 21 16.92 ± 0.30 –1.54 > 0.05
05p11
G. Pedicillo et al.: Knowl. Managt. Aquatic Ecosyst. (2008) 389, 05
the specimens examined worsened during the colder seasons (spring: 76.21 ± 0.19; summer: 76.47 ± 0.21; autumn: 75.36 ± 0.10; winter: 75.32 ± 0.17), the differences being statistically significant (ANOVA, P < 0.01).
> CATCHES PER UNIT EFFORT (CPUEs)
In Corbara Reservoir, no data on CPUEs are available for the years prior to 2000. In 2000 the mean CPUEs were clearly lower than in 2006, both for gillnets (2000: 0.0002 ± 0.0001 ind·m–2, 0.04 ± 2.77 g·m–2; 2006: 0.27 ± 0.06 ind·m–2, 14.26 ± 2.77 g·m–2) and for fyke-nets (2000: 0.59 ± 0.33 ind, 31.35 ± 39.51 g; 2006: 45.84 ± 7.85 ind, 2416.31 ± 450.60 g). Statistical comparison between the mean CPUEs by means of the Mann-Whitney U test revealed significant differences with regard to both gillnets (number of individuals: z = 8.20, P < 0.01; biomass: z = 8.15, P < 0.01) and fyke-nets (number of individuals: z = 6.39, P < 0.01; biomass: z = 6.23, P < 0.01).
DISCUSSION
Among-population comparisons of growth in fish are a common and useful means of assessing the adaptation of a species to different environmental conditions (Živcov et al., 1999). The potential of an animal species to colonise new ecosystems, or to re-colonise those previously occupied, is influenced by its ability to modify its allocation of energy resources to somatic and gonadal growth in response to different environments (Copp et al., 2004). The fact that the populations introduced into Europe display lower adult growth rates and lower ultimate lengths (L ) than native North American populations may be the result of the greater reproductive effort needed to colonise new ecosystems (Copp et al., 2004).The slope b values of the length-weight relationship (Figure 4) showed that weight increases allometrically with length (Ricker, 1975); growth in length takes second place to growth in the other spatial dimensions, so that weight increases more than proportionately with length. A. melas in Corbara Reservoir display a higher regression coefficient than other European and North American populations (n = 11), for which the mean value of b is 2.99, ranging from a minimum of 2.89 to a maximum of 3.41 (Froese and Pauly, 2006). With regard to comparison with other populations in northern Italy, Ceccuzzi (2004) reported b values of 2.61 for females and 2.80 for males in a population of black bullhead in Lake Varese, while in Lake Ghirla b is reported to be 3.02 (Graia, 2001). In five waterways in the Province of Padua, b varies from 2.68 to 3.17, with a mean value of 2.85 (Turin et al., 1995). The oldest specimens caught in Corbara Reservoir were more than 6 years old (Table I); this finding is in line with reports in the literature. Indeed, the mean lifespan of the species in Italy is 4–5 years, though a few specimens may live as long as 8–9 years (Gandolfi et al., 1991). According to Taylor (1962), the Von Bertalanffy equation provides a good description of the growth pattern if the maximum observed length is approximately 95% of the asymptotic length; in Corbara Reservoir the maximum theoretical length that can be reached by specimens of the population examined is 31.78 cm (Figure 2), while the maximum length of the specimens caught was 29.50 cm; this would suggest a good description of the growth pattern for the overall population without taking sex into account (93%).Very few published data on the growth rates of black bullhead in other Italian waterways are available for comparison with those recorded in Corbara Reservoir. Our study shows that black bullhead in Corbara Reservoir reach a mean length of 8.53 cm during their first year of life, 10.56 cm in the second year, 14.11 cm in the third, 17.87 in the fourth and 19.69 in the fifth. The growth of A. melas in Corbara Reservoir is lower than has been reported in the literature with regard to acclimatised populations in Italy; according to Gandolfi et al. (1991), the black bullhead reaches a length of 18–25 cm by the age of three years. In Lake Varese, specimens reach a length of 17 cm within the first year, 22 cm within the second, 26 cm in the third and 30 cm in the fourth (Ceccuzzi, 2004). The values reported by Turin et al. (1995)
∞
05p12
G. Pedicillo et al.: Knowl. Managt. Aquatic Ecosyst. (2008) 389, 05
are lower: 11.2 cm in the first year, 13.9 in the second, 15.8 in the third, 17.7 in the fourth and 24.5 in the sixth. Moreover, black bullhead growth in Corbara Reservoir is markedly lower than that recorded in the original North American populations (Carlander, 1950; Houser and Collins, 1962; Shelley, 1981; Morris, 1985; Hanchin et al., 2002a; Froese and Pauly, 2006).Our analysis revealed that growth in length is not constant throughout the year; rather, it takes place mainly in autumn and spring, without suffering any stasis in the winter period (Figure 3). This might not, however, be due to a real increase in length; it might be the result of differential mortality, to the detriment of smaller individuals. Indeed, winter is a particularly critical period for many fish species (Lorenzoni et al., 2002); temperatures fall and food sup-plies dwindle, which may increase mortality among smaller or more malnourished specimens as a result of tougher intra- and interspecific competition (Bujise and Houthuijzen, 1992; Ludsin and Devries, 1997). Our analysis of relative weight revealed that winter is the season in which the black bullhead in Corbara Reservoir display their worst condition. The finding of a reverse Lee’s phenomenon in the younger age-classes (1- and 2-year-olds) (Table IV) sug-gests that predation or intra- and interspecific competition takes place among younger indi-viduals and that this favours the larger specimens (Bagenal, 1978). The relative weight of the Corbara specimens is distinctly below 100. When Wr values are well below 100 for an individual or size-group, problems may exist with regard to food supply or feeding conditions (Anderson and Neumann, 1996). That the food supply is inadequate for the black bullhead population in Corbara Reservoir seems clear if the mean Wr values calculated in the different cohorts are compared with those reported by Morris (1985) with regard to some South Dakota populations. It seems likely that this situation is the consequence of intense intraspecific competition, due to the recent numerical expansion of the population, as is evidenced by the increase in CPUEs in recent years. Indeed, the current CPUE values calculated in the Corbara Reservoir are high and, according to what has been reported by Brown et al. (1999), typical of high-density populations. Our analysis also revealed a possible relationship between the relative abundance of the var-ious cohorts and the pattern of relative weight. Indeed, the lack of young of the year may be partly explained by the size-selectivity of the gillnets used. However, we also used fyke-nets (20-mm mesh). These capture gears have proved to be particularly efficient in capturing ben-thonic species (Krueger et al., 1998), such as the black bullhead; moreover, Hanchin et al.(2002b) claim that fyke-nets (19-mm mesh) appear to more effectively capture smaller black bullheads. The age structure showed that the number of newly-spawned specimens in the population underwent a marked increase in 2002 and 2003, and declined in subsequent years (Table II). With regard to the relative weight, by contrast, it emerged that those speci-mens spawned in 2002, 2003 and 2004 were most heavily penalised. Several studies have found that black bullhead growth is highly correlated with relative abundance and size-struc-ture (Moen, 1959; Houser and Collins, 1962; Hanchin et al., 2002a). Black bullhead growth has generally been correlated with the population characteristics of some potential competitors (Brown et al., 1999). Competition for food resources would most likely occur between black bullhead and common carp (Rose and Moen, 1951; Hanchin et al., 2002a). In Corbara Reservoir, common carp and goldfish are the most abundant species, accounting for 41.40% and 30.78%, respectively, of the total biomass (unpublisheddata); moreover, the abundance of these two species showed an increase from 2000 to 2006 (goldfish: CPUE 2000 = 0.0086 ind·m–2, CPUE 2006 = 0.023 ind·m–2; common carp: CPUE 2000 = 0.0028 ind·m–2, CPUE 2006 = 0.01 ind·m–2), which proved significant on the Mann-Whitney U test (goldfish: z = 2.71, P < 0.01; common carp: z = 4.36, P < 0.01). However, this issue deserves further study.The information yielded by this research increases our knowledge of the biological characteristics of A. melas and provides a frame of reference for further analyses, with a view to monitoring trends in the black bullhead population of Corbara Reservoir. It seems particularly important to investigate the internal dynamics of the population and the intra- and interspecific interactions that characterise this population.
05p13
G. Pedicillo et al.: Knowl. Managt. Aquatic Ecosyst. (2008) 389, 05
REFERENCES
Anderson R.O. and Neumann R.M., 1996. Length, Weight, and Associated Structural Indices. In: Murphy B.R. and Willis D.W. (eds.), Fisheries Techniques, American Fisheries Society, Bethesda, 447–482.
Bagenal T.B., 1978. Fish production in fresh waters, Editor Blackwell, London, 365 p.Bhattacharya C.G., 1967. A simple method of resolution of a distribution into Gaussian components.
Biometrics, 23, 115–135.Bister T.J., Willis D.W., Brown M.L., Jordan S.M., Neumann R.M., Quist M.C. and Guy C.S., 2000.
Proposed standard weight (Ws) equations and standard length categories for 18 warmwater nongame and riverine fish species. N. Am. J. Fish. Manag., 20, 570–574.
Brown M.L., Willis D.W. and Blackwell B.G., 1999. Physiochemical and biological influences on black bullhead populations in eastern South Dakota glacial lakes. J. Freshwater Ecol., 14, 47–60.
Buckmeier D., 2002. Validity of otholiths and pectoral spines for estimating ages of channel catfish. N. Am. J. Fish. Manag., 22, 934–942.
Buijse A. and Houthuijzen R.P., 1992. Piscivory, growth and size selective mortality of age 0 pikeperch (Stizostedion lucioperca). Can. J. Fish. Aquat. Sci., 49, 894–902.
Byers J.E., Reichard S., Randall J.M., Parker I.M., Smith C.S., Lonsdale W.M., Atkinson I.A.E., Seastedt T.R., Williamson M., Chornesky E. and Hayes D., 2002. Directing research to reduce the impacts of non-indigenous species. Conserv. Biol., 16, 3, 630–640.
Carlander K.D., 1950. Handbook of freshwater fishery biology, Wm. C. Brown Co., 281 p.Ceccuzzi P., 2004. Biologia riproduttiva ed ecologia delle popolazioni di pesce gatto (Ictalurus melas)
nel lago di Varese, Tesi Sperimentale in Scienze Biologiche Università degli studi dell’Insubria di Varese, Italy.
Copp G.H., Fox M.G., Przybylski M. and Godinho F.N., 2004. Life-time growth patterns of pumpkinseed Lepomis gibbosus introduced to Europe, relative to native North American populations. Folia Zool., 53, 3, 237–254.
Copp G.H., Bianco P.G., Bogutskaya N.G., Eros T., Falka I., Ferreira M.T., Fox M.G., Freyhof J., Gozlan R.E., Grabowska J., Kovac V., Moreno-Amich R., Naseka A.M., Penaz M., Povz M., Przybylski M., Robillard M., Russell I.C., Stakenas S., Šumer S., Vila-Gispert A. and Wiesner C., 2005. To be, or not to be, a non-native freshwater fish? J. Appl. Ichthyol., 21, 4, 242–262.
Craig J.F., Sharma A. and Smiley K., 1986. The variability in catches from multi-mesh gillnets fished in three Canadian Lakes. J. Fish. Biol., 28, 671–678.
Crivelli A.J., 1995. Are fish introductions a threat to endemic freshwater fishes in the northern Mediterranean region? Biol. Conserv., 72, 311–319.
Cucherousset J., Paillisson J.M. and Carpentier A., 2006. Is mass removal an efficient measure to regulate the North American catfish Ameiurus melas outside of its native range? J. Freshwater Ecol., 21, 699–704.
Dahl K., 1907. The scales of herring as a means of determining age, growth and migration. Report on Norwegian Fisheries and Marine Investigations, 2, 1–39.
Degerman E., Nyberg P. and Appelberg M., 1988. Estimating the number of species and relative abundance of fish in oligotrophic Swedish lakes using multi-mesh gillnets. Nordic J. Freshwater Res., 64, 91–100.
Devries D.R. and Frie R.V., 1996. Determination of age and growth. In: Murphy B.R. and Willis D.W. (eds.), Fisheries Techniques, American Fisheries Society, Bethesda, 483–512.
Elvira B., 1984. First record of the North American catfish Ictalurus melas (Rafinesque, 1820) (Pisces, Ictaluridae) in Spanish waters. Cybium, 8, 96–98.
Francis R.I.C.C., 1990. Back-calculation of fish length: a critical review. J. Fish Biol., 36, 883–902.Froese R. and Pauly D., Editors, 2006. FishBase, World Wide Web electronic publication,
www.fishbase.org, version (12/2006). Gandolfi G., Zerunian S., Torricelli P. and Marconato A., 1991. I pesci delle acque interne italiane, Istituto
Poligrafico e Zecca dello Stato, Roma, 616 p.Gante H.F. and Santos C.D., 2002. First records of North American catfish Ictalurus melas (Rafinesque,
1820) in Portugal. J. Fish Biol., 61, 1643–1646.Gayanilo F.C. Jr., Sparre P. and Pauly D., 2006. FAO-ICLARM stock assessment tools (FiSAT). User’s
guide, FAO Computerized Information Series (Fisheries), No. 8, Rome, FAO, 169 p.Graia S.R.l., 2001. Carta delle Vocazioni Ittiche della Provincia di Varese, Provincia di Varese, 263 p.Hanchin P.A, Willis D.W. and Hubers J.M., 2002a. Black bullhead growth in South Dakota waters:
limnological and community influences. J. Freshwater Ecol., 17, 65–75.Hanchin P.A, Willis D.W. and Sauver T.R., 2002b. Comparison of concurrent trap-net and gill-net
samples for black bullheads. J. Freshwater Ecol., 17, 2, 233–237.Houser A. and Collins C., 1962. Growth of black bullhead catfish in Oklahoma. Oklahoma Fishery
Research Laboratory, 78, 1–18.
05p14

G. Pedicillo et al.: Knowl. Managt. Aquatic Ecosyst. (2008) 389, 05
Hubert W.A., 1996. Passive capture techniques. In: Murphy B.R. and Willis D.W. (eds.), Fisheries Techniques, American Fisheries Society, Bethesda, 157–182.
King M., 1995. Fisheries Biology, Assessment and Management. Fishing News Books, Blackwell Science, Oxford, 341 p.
Kottelat M. and Freyhof J., 2007. Handbook of European freshwater fishes; Kottelat, Cornol, Switzerland and Freyhof, Berlin, 646 p.
Krueger K.L., Hubert W.A. and Price R.M., 1998. Tandem-set fyke nets for sampling benthic fishes in lakes. N. Am. J. Fish. Manag., 18, 154–160.
Kwak T., Pine W.E. and Waters D.S., 2006. Age, growth and mortality of introduced flathead catfish in Atlantic rivers and a review of other populations. N. Am. J. Fish. Manag., 26, 73–87.
Lea E., 1910. On the methods used in the herring investigations. Publications de Circonstance, Conseil Permanent International pour L’Exploration de Mer, 53, 7–25.
Lodge D.M., Christopher A., Taylor C.A., Holdich D.M. and Skurdal J., 2000. Non-indigenous crayfish threaten North American freshwater biodiversity: lesson from Europe. Fisheries, 25, 8, 7–20.
Lorenzoni M., Corboli M., Dörr A.J.M., Mearelli M. and Giovinazzo G., 2002. The growth of pike (Esox lucius Linnaeus, 1798) in lake Trasimeno (Umbria, Italy). Fish. Res., 59, 239–246.
Lorenzoni M., Ghetti L. and Mearelli M., 2006. Native and exotic fish species in the Tiber River watershed (Umbria – Italy) and their relationship to the longitudinal gradient. Bull. Fr. Pêche Piscic., 382, 19–44.
Ludsin S.A. and Devries D.R., 1997. First-year recruitment of largemouth bass: the interdependency of early life stages. Ecol. Appl., 7, 3, 1024–1038.
Mack R.N., Simberlof C.D., Lonsdale W.M, Evans H., Clout M. and Bazzaz F., 2000. Biotic Invasion: Causes, Epidemiology, Global Consequences and Control. Issues in Ecology, 5, 1–19.
Moen T.E., 1959. Notes on the growth of bullheads. Iowa state Conservation Commission Quarterly Biological Report, 11, 29–31.
Morris C.E., 1985. Evaluation of structure and growth of bluegills and black bullheads stocked with largemouth bass in South Dakota farm ponds, Thesis in Wildlife and Fisheries Sciences, South Dakota University, USA.
Murphy B.R., Willis D.W. and Springer T.A., 1991. The relative weight index in fisheries management: status and needs. Fisheries, 16, 2, 30–38.
Pauly D. and Munro J.L., 1984. Once more on comparison of growth in fish and invertebrates. ICLARM. Fishbyte, 1, 2, 21–22.
Ricker W.E., 1975. Computation and interpretation of biological statistics of fish population. Bulletin of the Fisheries Research Board of Canada, 191, 1–382.
Ricker W.E., 1992. Back-calculation of fish lengths based on proportionality between scale and length increments. Can. J. Fish. Aquat. Sci., 49, 1018–1026.
Rooney T.P., Olden J.D., Leach M.K. and Rogers D.A., 2007. Biotic homogenization and conservation prioritization. Biol. Conserv., 134, 3, 447–450.
Rose E.T. and Moen T., 1951. Results of increased fish harvest in Lost Island Lake. Trans. Am. Fish. Soc., 80, 1, 50–55.
Secor D.H. and Dean J.M., 1992. A comparison of otolith-based back-calculation methods to determine individual growth histories of larval striped bass, Morone saxatilis. Can. J. Fish. Aquat. Sci., 49, 1439–1454.
Shelley J.J., 1981. Initial growth and survival of Bluegills and Bullhead stocked with largemouth bass in South Dakota ponds, Thesis in Wildlife and Fisheries Sciences, South Dakota University, USA.
Smedstad O.M. and Holm J.C., 1996. Validation of back-calculation formulae for cod otoliths. J. Fish Biol., 49, 973–985.
Smith L.L., 1949. Cooperative fishery survey of upper Mississippi River. Trans. Am. Fish. Soc., 76, 279–282.
Stuber R.J., 1982. Habitat suitability index models: black bullhead, United States Department of Interior FWS/OBS-82/10.14.
Taylor C.C., 1962. Growth equation with metabolic parameters. Journal du Conseil International pour l'Exploration de la Mer, 27, 270–286.
Tortonese E., 1970. Osteichthyes (Pesci Ossei) I, Fauna Ittica 10, 565 p.Turin P., Zanetti M., Loro R. and Bilò M.F., 1995. Carta Ittica della provincia di Padova, Provincia di
Padova – Assessorato alla Pesca, 399 p.Von Bertalanffy L., 1938. A quantitative theory of organic growth. Hum. Biol., 10, 181–243. Wheeler A., 1978. Ictalurus melas (Rafinesque, 1820) and I. nebulosus (Lesueur, 1819): North American
catfishes in Europe. J. Fish Biol., 12, 435–439.Živkov M.T., Trichkovata T.A. and Raikova-Petrova G.N., 1999. Biological reasons for the unsuitability of
growth parameters and indices for comparing fish growth. Envir. Biol. Fish., 54, 67–76.
05p15