Embed Size (px)
Citation preview


Wollondilly Shire Council, Growth Management Strategy 2011 page 2
contentsMayor’s MessageCouncil’s Vision
Chapter 1 Overview 1.1 Introduction 1.2 Why do we need a GMS 1.3 Timeframe of the GMS 1.4 Aims of the GMS 1.5 What does the GMS contain 1.6 Key Policy Directions 1.7 Council’s overall position on growth
Chapter 2 Our Context 2.1 Population Growth 2.2 Community views on the issue of growth 2.3 Growth / Infrastructure / Opportunities 2.4 Funding and provision of infrastructure 2.4.1 Development Contributions and Planning Agreements 2.4.2 Rate revenue 2.4.3 Sewerage Infrastructure 2.5 Accommodating employment growth 2.6 Mining in Wollondilly 2.7 Wollondilly’s local strategic planning context 2.7.1 “Rural Living” defi ned 2.7.2 Integrated Planning and Reporting (IPR) 2.7.3 Community Strategic Plan 2.7.4 Vision 2025 2.7.5 Wollondilly LEP 2011 2.8 State Government context 2.8.1 Metropolitan Strategy 2005 and draft South West Subregional Strategy 2.8.2 “Sydney Towards 2036” 2.9 Macarthur South 2.9.1 NSW Government’s position on Macarthur South 2.9.2 Council’s position on Macarthur South
Chapter 3 How this GMS was prepared 3.1 GMS methodology key elements 3.2 Who prepared this GMS? 3.3 Councillor consultation programme 3.2 Department of Planning support for GMS
Chapter 4 Drivers of Change 4.0 Introduction 4.1 Driver of Change – A growing population 4.1.1 Age structure 4.1.2 Household type and sizes 4.1.3 Summary of population trends 4.2 Driver of Change – Dwelling stock 4.3 Driver of Change – Migration 4.4 Driver of Change – Behaviours and choices 4.4.1 Income and consumption 4.4.2 Labour force 4.4.3 Modes of travel 4.5 Driver of Change – Development potential and property market economics 4.6 Driver of Change – Commercial and industrial developments 4.7 Driver of Change – Agricultural lands 4.8 Driver of Change – Conservation and Environmental Management 4.9 Conclusion
45
6668899
11
1212121314141515161617171819192020
2121222223
2626292930
3131323234363638414143464848494949

Wollondilly Shire Council, Growth Management Strategy 2011 page 3
Chapter 5 Housing 5.1 Housing “targets” - what are they all about? 5.2 Th e housing land supply debate 5.3 Determining the distribution of housing numbers 5.4 Determining the mix of housing types 5.5 Residential development types 5.5.1 Rural-residential 5.5.2 Urban development on town edge 5.5.3 Medium density housing 5.5.4 Self-contained master planned estates 5.6 Assessment Criteria
Chapter 6 Employment 6.1 Understanding the role of the GMS in relation to employment 6.2 Wollondilly’s employment context 6.3 Council’s Economic Development Strategy (EDS) 6.4 Metropolitan Strategy and the draft SW Subregional Strategy 6.5 Industrial employment lands supply estimates and distribution 6.5.1 MACROC analysis 6.5.2 Th e Metropolitan Strategy Review “Sydney Towards 2036” 6.5.3 Regional Development Australia’s response 6.5.4 Wollondilly Council’s role and responsibilities in contributing to industrial land supply 6.6 Commercial / business employment land supply 6.7 Types of employment lands 6.7.1 Commercial / business lands 6.7.2 Light Industry / general industry 6.7.3 Logistics / warehousing / intermodal facilities 6.8 Role of the F5 Freeway corridor 6.9 Other employment land types which may be proposed 6.9.1 Heavy industry 6.9.2 Business parks 6.9.3 Agri-business parks 6.9.4 Bulky goods retailing 6.9.5 Initiatives and Strategies to promote agriculture
Chapter 7 Implementation 7.1 A quick guide to using and interpreting this document 7.2 What the Structure Plans show 7.2.1 Residential mapping 7.2.2 Employment land mapping 7.3 Assessment Criteria 7.4 Local Environmental Plans 7.5 Planning Proposals and the “Gateway” plan-making process 7.5.1 Lodging a Planning Proposal 7.5.2 Fees for lodging a Planning Proposal 7.5.3 Need for precinct-wide approach 7.5.4 Initial community consultation 7.5.5 Initial determination by Council 7.5.6 Th e “gateway” determination 7.5.7 Consultation with government agencies 7.5.8 Environmental studies 7.5.9 Director-General’s approval before community consultation 7.5.10 Formal community consultation 7.5.11 Council’s fi nal determination 7.5.12 Legal drafting of the LEP 7.5.13 Making of a local plan 7.6 Rezoning applications currently with Council 7.7 Part 3A of the EPA Act, 1979 7.7.1 Council’s role in Part 3A matters 7.8 Future review of this GMS 7.9 Other ways in which this GMS will be usedAppendix 1 Assessment criteriaAppendix 2 Structure Plans
5050515255555659606263
64646566676768686869
707070727373747474757576
77777777798080818182828282838383838484848485858686868796

Wollondilly Shire Council, Growth Management Strategy 2011 page 4
IntroductionTh e Wollondilly Shire is a beautiful and unique place dearly valued by those who live here, those who work here, and those who visit. Th is Growth Management Strategy is all about the challenge of having growth without compromising all the things we love about the Shire.
We are constantly being presented with proposals for all sorts of growth and these raise challenging issues and questions about our future. What kind of growth do we want, how much and where? And what kind of legacy do we want to leave for future generations?
Council and the community need to have an agreed strategy regarding future growth. How we grow and develop into the future will aff ect the fundamental nature of our Shire more than any other issue. In the past the Council has not had a coherent long-term strategy about its future growth and this has made it diffi cult to manage the development aspirations of a wide variety of landowners. Which of these proposals should go forward and which should not? By having a Growth Management Strategy we will be better equipped to answer those kinds of questions.
Th e Councillors of Wollondilly have been active participants in the preparation of this Growth Management Strategy. A number of workshop meetings have been held between Councillors and staff over an 18 month period in order to reach a common understanding on the aims, directions and content of the draft Growth Management Strategy.
Th e preparation of the Growth Management Strategy has also been supported by the NSW Department of Planning in recognition of the diffi culty Wollondilly Council faces in managing growth pressures and the competing demands and aspirations of developers, landholders and the general community. Th e Department of Planning has provided funding assistance for the preparation of this document and has also indicated support for its overall directions.
Th is Growth Management Strategy makes some tough decisions about our future and not all landowners will be happy with its directions. A sustainable approach to growth management can not be focused on individual property development interests. Rather, we have to look at the bigger picture and focus on the principles and directions that will ensure the long-term well being of the Shire and its community.
Michael Banasik Les McMahonMayor General Manager
L M M h
g y
Michael Banasik

Wollondilly Shire Council, Growth Management Strategy 2011 page 5
VisionCouncils vision refl ects the Community’s desire to maintain Wollondilly Shire’s rural character together with the sense of belonging to caring communities that have been at its core for generations.
Our MissionTo create opportunities in partnership with the Community and to enhance the quality of life and the environment, by managing growth and providing sustainable services and facilities.
Our ValuesCouncil believes its values are important for all its operations and desires that staff work with Council to achieve an organisation that:
As a custodian Values the past, plans for the future, protects the environment and is responsive to our Community.
As a decision maker and a service providerEnsures equity, openness, integrity, dilligence, empathy and accountability.
As a corporationStrives for excellence, responsibility, effi ciency, quality improvement and ethical behavour.
As an employerSupport the commitment, ambition, innovation and teamwork of staff .
ex periencerural living

Wollondilly Shire Council, Growth Management Strategy 2011 page 6
Chapter 1 -
OverviewETh is chapter explains why this Growth Management Strategy is needed and what it is trying to achieve. It includes a summary of the Key Policy Directions which govern the GMS and also a statement about Council’s overall position on growth matters.
1.1 IntroductionWollondilly is continually having to mange pressure for growth against the context of a broad community desire to keep the Shire rural. Th is is a challenging balancing act and an inevitable consequence of being a rural area on the fringe of a major metropolis. Because we’re so close to the edge of Sydney we will always be attractive as both a development location and a lifestyle location.
Council rec ognises that we need growth but it has to be the right kind of growth in the right locations. Wollondilly’s population of around 43,000 will continue to grow over the next twenty fi ve years. Th e increase could take us to a population of over 60,000 some time in the early to mid 2030s which would require over 7,500 extra houses and many more jobs.
Th e Council is constantly being asked to look at various development proposals across the Shire, for houses and jobs. So decisions need to be made about which proposals make strategic sense and which don’t. Currently there are interests and development aspirations being expressed by a wide variety of landowners, not just the development industry. Some have been submitted as formal proposals but others have not reached that stage. What is clear is that the sum total of these proposals is signifi cantly in excess of what the Shire actually needs to accommodate its future growth. Which of these proposals should go forward and which should not? Th is Growth Management Strategy has been prepared to help answer those kinds of questions.
1.2 Why do we need a GMS?Th e range of diff erent proposals for growth involves both residential and employment lands proposals. Th ese proposals vary in terms of their location, development type and scale. Th ey also vary in terms of whether the

Wollondilly Shire Council, Growth Management Strategy 2011 page 7
proponent is a large landholder / developer or just a local property owner with development aspirations.It is fair to say there is no defi nitive framework guiding all of these growth proposals. Th e State Government’s directions on the matter are largely contained in the Metropolitan Strategy and the draft South West Subregional Strategy, but these are big picture documents open to diff erent interpretations and, appropriately, they require local Council’s to set local directions for their implementation.
Council’s previous local strategic document, Vision 2025 has its own limitations as a guide for growth. Its principles and “Vision Statements” are sound but some of its representations of growth options for each of our towns are highly conceptual and very open to interpretation. It also fails to adequately deal with employment land issues, the range of potential types of residential development (as discussed in this GMS), infrastructure capabilities and the overall timing and quantity of development. Th e great value however of Vision 2025 is that it captured the key themes and community aspirations regarding our future.
Th e absence of sound strategic policies guiding growth matters potentially creates an ad hoc approach to growth and development, particularly when high pressure lobbying and advocacy prevail over a loose planning framework.
Council recently exhibited and then fi nalised its LEP 2011. In response there were understandable community expectations that it would be a planning document which would deal with the Shire’s long term growth options. However, the need to prepare this new LEP in accordance with a State Government standard LEP Template and within a relatively short time frame meant that the LEP was not able to be the process for resolving questions of long-term growth.
Th e Growth Management Strategy project was therefore commenced in recognition of the need to have a plan for future growth. Having such a plan also enables us to plan for future service and infrastructure provision. Th is is extremely important to a Council needing to prioritise limited resources.
Th ere is a tendency to reduce the growth debate down to very simplistic terms, for it to become merely a question of “can I get my land rezoned?” Th ere is much more to the issue as it encompasses a broad range of questions that aff ect all in our community, including:
• What are the pros and cons of growth?• What types of growth are best for us and our vision of rural living?• Where and when should growth occur?• Who should be the benefi ciaries of growth?• How will infrastructure needs be met and paid for?• How will social needs be met and paid for?• What types of housing do we need to house the kind of community we want?• What forms of growth do we have a say on and what is beyond our control? • What do we see as our long term future?• What is the legacy we would like to leave for future generations?
gement Strategy 2011 page 7
2025 has its own limitations as a some of its representations of growth optio
interpretation. It also fails to adequately deal witresidential development (as discussed in this GMS), in
and quantity of development. Th e great value however of Vision 20community aspirations regarding our future.
ategic policies guiding growth matters potentially creates an ad hoc approach particularly when high pressure lobbying and advocacy prevail over a loose planning
bited and then fi nalised its LEP 2011. In response there were understandable community ould be a planning document which would deal with the Shire’s long term growth options prepare this new LEP in accordance with a State Government standard LEP Template andort time frame meant that the LEP was not able to be the process for resolving questio
ment Strategy project was therefore commenced in recognition of the need to have a planHaving such a plan also enables us to plan for future service and infrastructure provision.
mportant to a
cy to reduce get my land
ect all in our
re the pros ypes of growtand when shou
hould be the benill infrastructure nll social needs be mpes of housing do wems of growth do we h
e see as our long term fegacy we would like to le

Wollondilly Shire Council, Growth Management Strategy 2011 page 8
So our directions on the question of growth are therefore fundamental to the future of the Shire in all respects:
• our environment• our economy• our assets and infrastructure• our community• the operations of Council• our identity / character
Preparing a Growth Management Strategy is therefore highly consistent with the aims of the new Integrated Planning and Reporting framework for local government and the themes in our Community Strategic Plan (see sections 2.6.2 and 2.6.3 below). Th e GMS is also listed as a necessary “key supporting plan” in the Community Strategic Plan.
1.3 Timeframe of the GMSTh e GMS looks at our Shire’s growth requirements for the next 20 – 25 years, and so it incorporates demographic forecasts and strategies which extend to the mid 2030s. It is recognised that periodic review of the GMS will be required to ensure its policy directions remain relevant and appropriate, to monitor growth outcomes, and to account for other unforseen changes. At the time of compiling this GMS the State Government had commenced a review of Sydney’s Metropolitan Strategy looking at a 2036 horizon. It therefore makes sense for Council’s GMS to consider this timeframe also.
Having a 20-25 year timeframe in strategic planning terms should not however be confused with the idea that we are “locking-in” our policy directions for that length of time. Th is GMS will need periodic review and so its policy directions and details may need updating as time progresses.
1.4 Aims of the GMSTh e Growth Management Strategy is a policy document with associated mapping which contains key directions and principles to guide proposals and Council decisions on growth. Although the primary purpose of the GMS is to be a tool to sift through and assess planning proposals that come to Council, it has a range of other aims.
• To outline clear policy directions on growth issues.• To provide Council and the community with a strategic framework against which to consider planning proposals. • To achieve a long-term sound and sustainable approach to how this Shire develops and changes into the future.• To inform Council decisions and priorities regarding service delivery and infrastructure provision.• To provide direction and leadership to the community on growth matters.• To assist in advocating for better infrastructure and services.• To provide our strategy/response for how we see the State Government’s Metropolitan and subregional planning strategies being implemented at the local level.

Wollondilly Shire Council, Growth Management Strategy 2011 page 9gement Strategy 2011 page 9
1.5 What does the GMS contain?Th e GMS includes:
• Overarching policy directions and principles for growth management.• An outline of the State, Regional and local planning policy context • A summary of key demographic trends and forecasts.• An overview of housing number targets and their general distribution.• Discussion of diff erent types of housing and diff erent types of employment lands.• Identifi cation of the key issues associated with the main types of residential and employment proposals facing Wollondilly.• Assessment criteria to assist in making decisions on planning proposals.• Broad-scale mapping and structure plans to identify possible growth locations.• Explanations on how to use the GMS and the processes for implementation.
1.6 Key Policy DirectionsTh roughout this document, there are references to Key Policy Directions. Th ese are listed below and collectively they form the overarching growth strategy for Wollondilly and the basis for the development of this GMS.
General Policies
P1 All land use proposals need to be consistent with the Key Policy Directions and Assessment Criteria contained in this GMS in order to be supported by Council.
P2 All land use proposals need to be compatible with the concept and vision of “Rural Living” (defi ned in Chapter 2)
P3 All Council decisions on land use proposals shall consider the outcomes of community engagement.
P4 Th e personal fi nancial circumstances of landowners are not relevant planning considerations for Council in making decisions on land use proposals.
P5 Council is committed to the principle of appropriate growth for each of our towns and villages. Each of our settlements has diff ering characteristics and diff ering capacities to accommodate diff erent levels and types of growth (due to locational attributes, infrastructure limitations, geophysical constraints, market forces etc.).
Housing Policies
P6 Council will plan for adequate housing to accommodate the Shire’s natural growth forecast. P7 A high growth or accelerated growth scenario is not being pursued. Th e extra dwellings needed for the Shire’s growth therefore are not intended to accommodate the urban expansion of the Sydney Metropolitan Area*. (*It is acknowledged that Wollondilly will continue to accommodate migration from Sydney, however this is distinct from actually accommodating the spread of the Sydney urban footprint)
P8 Council will support the delivery of a mix of housing types to assist housing diversity and aff ordability so that Wollondilly can better accommodate the housing needs of its diff erent community members and household types.
P9 Dwelling densities, where possible and environmentally acceptable, should be higher in proximity to centres and lower on the edges of towns (on the “rural fringe”).

Wollondilly Shire Council, Growth Management Strategy 2011 page 10
P10 Council will focus on the majority of new housing being located within or immediately adjacent to its existing towns and villages.
Macarthur South Policies
P11 Council does not support major urban release within the Macarthur South area at this stage.
P12 Council considers that in order to achieve sound long-term orderly planning for the eventual development of Macarthur South an overall master plan is required.
P13 Council will not support further signifi cant new housing releases in Macarthur South beyond those which have already been approved. Small scale residential development in and adjacent to the existing towns and villages within Macarthur South will be considered on its merits.
P14 Council will consider proposals for employment land developments in Macarthur South provided they:• Are environmentally acceptable• Can provide signifi cant local and/or subregional employment benefi ts • Do not potentially compromise the future orderly master planning of the Macarthur South area• Provide for the timely delivery of necessary infrastructure.• Are especially suited to the particular attributes of the Macarthur South area AND can be demonstrated as being unsuitable or unable to be located in alternative loations cloer to established urban areas• Do not depend on the approval of any substantial new housing development proposal in order to proceed (Employment land proposals which necesitate some limited ancillary or incidental housing may be considered on their merits)
Employment Policies
P15 Council will plan for new employment lands and other employment generating initiatives in order to deliver positive local and regional employment outcomes.
P16 Council will plan for diff erent types of employment lands to be in diff erent locations in recognition of the need to create employment opportunities in diff erent sectors of the economy in appropriate locations.
Integrating Growth with Infrastructure
P17 Council will not support residential and employment lands growth unless increased infrastructure and servicing demands can be clearly demonstrated as being able to be delivered in a timely manner without imposing unsustainable burdens on Council or the Shire’s existing and future community.
P18 Council will encourage sustainable growth which supports our existing towns and villages, and makes the provision of services and infrastructure more effi cient and viable – this means a greater emphasis on concentrating on new housing in and around our existing population centres.
P19 Dispersed population growth will be discouraged in favour of growth in, or adjacent to, existing population centres.
P20 Th e focus for population growth will be in two key growth centres, being the Picton/Th irlmere/Tahmoor Area (PTT) area and the Bargo Area. Appropriate smaller growth opportunities are identifi ed for other towns.

Wollondilly Shire Council, Growth Management Strategy 2011 page 11Management Strategy 2011 page 1
Rural and Resource lands
P21 Council acknowledges and will seek to protect the special economic, environmental and cultural values of Shire’s lands which comprise waterways, drinking water catchments, biodiversity, mineral resources, agricultural lands, aboriginal heritage and European rural landscapes.
P22 Council does not support incremental growth involving increased dwelling entitlements and/or rural lands fragmentation in dispersed rural areas. Council is however committed to maintaining, where possible and practicable, existing dwelling and subdivision entitlements in rural areas.
1.7 Council’s overall position on growthTh e depth and range of opinion on the issue of growth has been given serious consideration by Council in the preparation of this GMS. In weighing up these views Council fi rmly believes that growth is required and that with sound planning, it can be achieved in a way which does not lead to detrimental outcomes for the Shire. In other words we can have a balanced approach where we grow and at the same time retain our rural living vision.
Council has also considered the question of “how much growth?” Th rough demographic forecasting we know that the population can be expected to grow at rates of between 1.6% and 2.2% per year. Th is will mean our population will most likely increase to over 60,000 by some time between 2031 and 2036. Th is would eff ectively represent a healthy continuation of the rates of growth we have seen over the last fi fteen years, in other words it could be considered as a kind of “natural growth trajectory”.
If Council and the community were to take a no-growth or minimal-growth stance these rates of population increase could in theory be stifl ed by having very limited land released for new housing. Th is is however highly unsustainable for our communities and our economy and is unrealistic given our context adjacent to the Sydney metropolis. It is therefore clearly not a legitimate option available to us.
Alternatively if Council wanted growth rates over and above our natural trajectory, we could in theory accelerate our growth by releasing larger quantities of land for housing supply. However, as explained further in this document, this is also an unrealistic concept at this point in time. To embark on such a growth programme would require us to be identifi ed by State Government as an area to accommodate the large scale urban expansion of Sydney and would require signifi cant infrastructure investment. Th e Macarthur South area (discussed in more detail further on) has been potentially earmarked for that kind of urban growth for many years but the offi cial position of the NSW Government at this stage is that it is not expected to be needed for housing supply in the short to medium term.
In addition to the fact that Wollondilly Shire is eff ectively not yet needed to accommodate Sydney’s growth, attempting to accelerate our Shire’s population growth also raises the signifi cant issue of how that would fundamentally transform the nature of our Shire. Although Council believes that we can accommodate natural growth levels without compromising the vision of rural living, any scenario which involves Wollondilly accommodating Sydney’s urban expansion would be unlikely to maintain that vision, at least for signifi cant parts of the Shire.
So this GMS takes a balanced and realist ic app roach of planning to accommodate Wollondilly’s natural res idential growth forec ast
and to provide new employ ment lands and uses that do not compromise environmental amenity and rural living.

Wollondilly Shire Council, Growth Management Strategy 2011 page 12
Th is chapter provides an overview of the context in which this GMS has been prepared and in which it has to operate.
2.1 Population growth Wollondilly’s population of around 43,000 in will continue to grow over the next twenty fi ve years due to the Shire’s location, features and external infl uences. Th e increase could be about 19,000 (46%) to total 60,000 or more by 2036, which would require over 7,500 extra dwellings, and many more jobs.
Whatever the actual population growth, there will need to be more land available for residential, commercial, industrial, infrastructure and community purposes. Th is requires planning so that essential and aff ordable infrastructure, facilities and services are available when needed by residents.
More detailed discussion of the key demographic trends and forecasts for Wollondilly are contained in Chapter 4.
2.2 Community views on the issue of growthTh ere are varied and passionate views regarding the issue of growth. Many in our community would say that growth is largely inevitable and that if we don’t grow our lifestyles and communities will not be sustainable. But there are also strong views about keeping the Shire as it is. Th e debate can touch on deep sentiments related to viewpoints on development, environment, economics, politics, wealth, lifestyle, sustainability and more. Another important factor which infl uences viewpoint is your “stake” in it (i.e. whether you stand to gain directly from development or whether you’re likely to be aff ected by its impacts). Understandably therefore, the strongest pressure for growth comes from landowners and developers who are legitimately seeking to realise fi nancial gains.
Although the arguments for and against growth are diverse and complex, both ends of the spectrum can be briefl y summarised as follows:
Chapter 2 -
Our Context

Wollondilly Shire Council, Growth Management Strategy 2011 page 13Management Strategy 2011 page 1
Th e case for growth
With its relatively low population base and widely dispersed population Wollondilly Shire has diffi culty supporting and attracting some of the opportunities available in more highly and densely populated areas. Th e case for growth is essentially that we need a “critical mass” of population to be more economically, socially and environmentally sustainable. Th e larger population would:
• Support local economic / jobs growth.• Increase our economic self-suffi ciency by reducing escape expenditure.• Support “hard” infrastructure improvements (e.g. better rail services, road improvements).• Support an increase in “soft” infrastructure (health, education, community services etc).• Lower the unit cost of infrastructure and service provision.• Broaden local lifestyle opportunities (shopping, recreation, cultural, social networks, youth opportunities etc).• Decrease the proportion of our population having to drive out of the Shire for life’s needs (work, shopping, lifestyle, social, leisure etc).• Decrease the proportion of our population (often young people) who are left with no choice but to live outside the Shire to meet those needs.
Th e case against growth
Concerns about growth often arise in the context of objections to particular development proposals and tend to centre on the idea that Wollondilly should stay as it is. Th ose who don’t see the benefi ts of growth may be those who have chosen to live or to stay in Wollondilly knowing and accepting its limitations. In other words they’ve made a “trade-off ”, accepting some costs in return for the lifestyle and setting they want. Growth therefore represents a more urban lifestyle, one which they have avoided (or actually left) by choice. For them any signifi cant growth will:
• Lead to the loss of our rural character• Adversely aff ect the character and feel of our towns and villages.• Represent the beginning of urbanisation.• Represent more people, more traffi c etc.• Have adverse impacts on the Shire’s natural environment• Fundamentally transform the Shire’s communities.• Have a direct impact on their sense of lifestyle and sense of place by causing change to an area they know and cherish.
2.3 Growth / Infrastructure / Opportunities Th ere is an ongoing paradox in being a Shire with comparatively limited infrastructure and services. On the one hand, those limitations make the Shire a less desirable location for accommodating population growth, while on the other hand those same limitations make the need for growth more imperative as the growth is (in some cases) needed to stimulate better infrastructure, services and opportunities. Th is “catch 22” situation can apply to sewerage, education, local jobs, health services and public transport for example. Th e concept of needing to have a “critical mass” of population to better support a full range of infrastructure and services, as mentioned above, is relevant here.
But the argument of needing critical population mass has its limitations. Although a growing population can directly drive and sustain local business development, it doesn’t necessarily drive public infrastructure roll-outs. In fact the urban development of Western Sydney has been typically characterised by minimal or lagging infrastructure and services and this has caused signifi cant social, economic and environmental costs.

Wollondilly Shire Council, Growth Management Strategy 2011 page 14
2.4 Funding and provision of infrastructure Residential and employment land growth needs to be matched with appropriate infrastructure in order to function eff ectively, provide good planning outcomes, and be sustainable in the long run. Th e term “infrastructure” is often narrowly interpreted as meaning “hard” physical infrastructure – roads, bridges, community buildings, parks, sewerage, water, public transport etc. But it also includes soft infrastructure i.e. the services and programmes that support growth (particularly the case for residential growth as incoming populations have social needs that need to be met).
Th e following Key Policy Directions are relevant to this issue:
P17 Council will not support residential and employment lands growth unless increased infrastructure and servicing demands can be clearly demonstrated as being able to be delivered in a timely manner without imposing unsustainable burdens on Council or the Shire’s existing and future community.
P18 Council will encourage sustainable growth which supports our existing towns and villages, and makes the provision of services and infrastructure more effi cient and viable – this means a greater emphasis on concentrating new housing in and around our existing population centres.
P19 Dispersed population growth will be discouraged in favour of growth in, or adjacent to, existing population centres.
Note that P17 above incorporates the concept of intergenerational equity – this is particularly relevant to the issue of infrastructure provision as development with minimal or lagging infrastructure and services can create an inequitable and unsustainable burden on future residents.
In addition to these Key Policy Directions, the Assessment Criteria contained in Appendix 1 reinforce infrastructure provision and funding as an essential consideration in determining whether growth proposals should go forward.
2.4.1 Development Contributions and Planning AgreementsTh e EPA Act, 1979 enables local councils as well the State Government to require developers to contribute to the provision of essential infrastructure. At the local level this is either done through development contributions (commonly referred to as “section 94 contributions”) or by developers providing the works directly e.g. providing parks and road works through developer agreements (or a combination of the two).
State Developer Agreements are negotiated between developers and State agencies in order to ensure contributions towards key state level infrastructure.
At the time of writing this GMS the ability of Councils to fund infrastructure though development contributions is being severely constrained by an overall cap on the amount that can be levied and by limits on the types of infrastructure that can be levied for. Th is potentially places a signifi cant limit on Council’s ability to ensure that new development is matched by appropriate levels of infrastructure funding and provision. So our capacity to ensure that new development satisfi es Key Policy Direction P17 above is challenged.
Wollondilly Shire Council, Growth Management Strategy 2011 page 14
upport residentiicing demands can be clearly dem
hout imposing unsustainable burdens on C
Council will encourage sustainable growth which supthe provision of services and infrastructure more effi cienon concentrating new housing in and around our existing
Dispersed population growth will be discouraged in favour of gpopu
Note that P17 above incorporates the concept of intergenerational equitssue of infrastructure provision as development with minimal or lagging in
an inequitable and unsustainable burden on future reside
ment Criteria contaation in determini
anning Ao require devethrough develong the works dire two)
es in order to ensur
ough development cvied and by limits on
t on Council’s ability to nnew development is matched by appropriate levels of infrastructure funding and provision. So our capensure that new development satisfi es Key Policy Direction P17 above is challenged.

Wollondilly Shire Council, Growth Management Strategy 2011 page 15
2.4.2 Rate revenueTh is raises the question of whether growth is in fact cost-eff ective for the community as a whole. If the infrastructure requirements generated by new growth have to be met by raising rate revenue, it can be argued that is placing an unfair burden on existing residents by requiring them to subsidise the infrastructure needs of incoming development.
Local Council’ are already stret ched to their limits in terms of providing and maintaining infr astructure. Th ere are oft en
simplist ic arguments put forward that Council should app rove more growth and development and in so doing this will translate
to greater rate revenue. While rate revenue has risen over time with population growth, this increase is clearly no windfall gain for Councils as growing populations require Council services and new infrastructure. Th e costs of these increased services and infrastructure demands exceed the minimal rate increases that have been allowed under the NSW rate-pegging system.
2.4.3 Sewerage InfrastructureIn Wollondilly Shire, sewerage is the “hard” infrastructure shortcoming that features most prominently with regard to the issue of future growth. Parts of Wollondilly are either not yet connected to reticulated sewerage or have limited sewerage capacity to enable future growth. Council and the community are continually lobbying for this situation to be remedied. At the time of writing this GMS, Sydney Water under their Priority Sewerage Programme are well-progressed with a project to deliver reticulated sewerage to Appin and have commenced planning for sewerage solutions for Bargo. Solutions to increase the limited capacity in the Picton Tahmoor Th irlmere area are also being explored.
Th is GMS’s long-term plans for accommodating growth are reliant on some key assumptions regarding sewerage. (Note however that the upgrade of sewerage services is not Council’s responsibility as it is determined by Sydney Water’s Infrastructure programme):
• Appin connected to sewer by 2012• Bargo sewerage scheme to have commenced construction by 2015• Th e Picton, Tahmoor, Th irlmere area will have future capacity to accommodate growth through a combination of: • existing Picton Sewerage Treatment Plant capacity • potential future upgrade of the Picton Sewerage Treatment Plant capacity • use of private package treatment plant systems • Th e provision of sewerage infrastructure to the other remaining unsewered towns in the Shire (Buxton, Yanderra, Menangle, Wilton and Douglas Park) is expected to occur between 2013- 2017
Other parts of the Shire without access to sewer connections may also rely on the use of private package treatment plant systems.

Wollondilly Shire Council, Growth Management Strategy 2011 page 16
2.5 Accommodating employment growth Th ere is no dispute on the issue that our Shire needs more local employment opportunities, given that over 60% of our workforce has to leave the Shire to access work. However as explained more in Chapters 4 and 6 the key to this issue is as much to do with regional employment opportunities as it is to do with employment within the local government area boundaries. Having greater employment opportunities both regionally and locally would clearly assist our environmental, economic and social sustainability.
Despite the recognised need, the reality of developing new business and industry can involve signifi cant resident opposition due to localised environmental impacts. Th is is not to criticise those residents who defend their amenity, as we all, to some extent, do the same when our neighbourhood is being impacted upon. It does however mean that Council is presented with the challenge of how to promote economic development without compromising environmental amenity and the vision of rural living.
Wollondilly needs to make available more lands for employment uses if our population is to grow. As discussed in Chapter 6 the GMS can play a signifi cant role in employment growth by identifying lands for diff erent types of employment such as commercial town centre growth, and industrial growth.
2.6 Mining in WollondillyWollondilly shire contains signifi cant coal resources. Managing the extraction of these valuable resources, while at the same time allowing surface development, needs a balanced approach. Nevertheless the existing of coal resources throughout the shire and the ongoing long term extraction of this resource needs to be recognised as a signifi cant constraint to when, where and how urban development should occur.
Because of mine subsidence impacts and the need for surface development associated with the running of a mine (vent shafts, mine entry points etc) it will always be preferable for mining to occur prior to urban development on the surface. Where it can not occur in that preferred sequence the issue can in some cases be managed through appropriate planning and design controls in conjunction with advice from the Mine Subsidence Board. Th is will ultimately be a matter for detailed investigation on a case by case basis as planning proposals and draft LEPs are developed.
Th e signifi cant issue of the relative timing of mining and surface development calls for an ongoing coordinated and consultative approach involving:
• Council• Department of Planning• Department of Industry and Investment• Mine Subsidence Board • Mining Industry• Development Industry

Wollondilly Shire Council, Growth Management Strategy 2011 page 17
2.7 Wollondilly’s local strategic planning context2.7.1 “Rural living” defi nedFor many years the Shire has identifi ed rural living as its “Vision”. But this term has never been well defi ned, and as a result it has tended to be given a fairly narrow meaning. Typically the words are taken to refer to those aspects of the Shire that involve actually living (i.e. residing) on or amongst rural land. Th is is a narrow focus which ignores that there are broader aspects comprising life in a rural area – such as the towns and villages, the community and how we interact, the working agriculture, and how we value our overall environment. Our experience of rural Wollondilly is in other words made up of all sorts of aspects and not all are directly related to actually living on rural land or on a farm.
In the absence of this broader understanding, rural living is often put forward as a justifi cation in debates about property and development rights and outcomes, e.g. to argue for more large rural-residential properties or as an argument for opposing change in order to keep things “rural”.
By understanding the characteristics of rural living, development proposals can be assessed to ensure they do not compromise the concept. Nine characteristics of rural living (as they relate to Wollondilly) have been developed:
1. Rural setting and characterTh e rural setting is obvious, with farmland and natural areas located between separate towns and villages connected by rural-type roads.
2. Viable agricultureAgriculture and associated industries continue to be a productive, sustainable and visible part of our economy, our community and our landscape.
3. LifestyleResidents experience and value living within a rural setting irrespective of where and how they live – i.e. whether or not they live in a town, a village, on a rural-residential holding or on a farm for example.
4. Community SpiritCommunity spirit and involvement thrive in the towns and villages with separate but interrelated identities.
5. Environment and heritageTh e Shire’s natural and man-made settings have environmental and cultural heritage signifi cance for our communities – these elements include its waterways and catchments, natural areas, aboriginal heritage, agricultural landscapes, rural heritage, and its towns and villages.
6. Towns and villagesSeparate towns and villages (and particularly their centres) are focal points which provide opportunities – working, shopping, business, leisure, civic events, community facilities, education, and social interactions.
7. Buildings and developmentNew development aims to be sympathetic to the existing form and traditional character of our built environment which is an integral part of our townscapes, rural landscapes and cultural heritage.
8. Roads and Transport

Wollondilly Shire Council, Growth Management Strategy 2011 page 18
Residents understand the factors which contribute to the Shire’s overall high car-dependence but nevertheless seek opportunities to reduce car reliance and to use alternative modes of transport.
9. Infrastructure and services Residents understand that despite the benefi ts of rural living, it can also mean having to deal with lower levels of services and infrastructure.
Th is defi nition of the key characteristics of Rural Living is critical to this GMS and its implementation. Key Policy Direction P2 states as follows:
P2 All proposals for residential or employment growth need to be compatible with the concept and vision of “Rural Living” (defi ned in Chapter 2)
2.7.2 Integrated Planning and Reporting (IPR) FrameworkTh ere has been an ever-increasing focus on the fi nancial pressures facing local government particularly in terms of limited resources, burgeoning infrastructure maintenance and renewal costs, increasing legislative complexity, rising community expectations and (now) climate change adaptation.
It is in this environment that the NSW State Government has introduced new Integrated Planning and Reporting (IPR) arrangements for Councils, to place a stronger and more coordinated focus on sustainability.
In summary, under these new arrangements Council is required to have:
• A 10yr Community Strategic Plan• A 4yr Resourcing Strategy incorporating:• A Long-term Financial Plan• An Asset Management Strategy and Plan• A Workforce Management Plan• An Annual Operational Plan
It is clear to see how the combination of these plans will provide a very solid strategic foundation for sustainable planning and budgeting.
As part of the introduction of the IPR requirements, a range of amendments have been made to the Local Government Act, 1993 but particular attention is drawn to the amendment of Section 8 which has added the following to Council’s Charter:
“A Council has the following Charter…:
• To bear in mind that it is the custodian and trustee of public assets and to eff ectively plan for, account for and manage the assets for which it is responsible
• To engage in long-term strategic planning on behalf of the local community
• To exercise its functions in a manner that is consistent with and promotes social justice principles of equity, access, participation and rights.”
Clearly the preparation of a Growth Management Strategy strongly supports these aspects of a Council’s Charter and the aims of the new IPR arrangements as the concept of needing to engage in long-term strategic planning is fundamental to this GMS.

Wollondilly Shire Council, Growth Management Strategy 2011 page 19
Th e NSW Department of Local Government has advised NSW Councils to select from a range of timeframe options for meeting the new IPR requirements. Wollondilly Council has resolved on an implementation date of 30 June 2011.
A substantial amount of transition work is required between now and then. Fortunately, Wollondilly is some way down the path of implementation as we have already developed a Community Strategic Plan (CSP), although this document is currently being updated with further community engagement.
Th e CSP aspect of the IPR framework is an opportunity to capture community aspirations on a range of issues including the broad concept of growth and what sort of place we want Wollondilly to be in the future.
2.7.3 Community Strategic PlanIn July 2008 Council adopted the Community Strategic Plan 2030 (CSP). One of its purposes is to provide a focus when developing Council’s other plans, such as this Growth Management Strategy. Th e CSP is based on Council’s long held vision of “rural living” for the Shire and develops goals, outcomes and strategies for each of fi ve focus areas of Community, Economy, Environment, Infrastructure and Governance.
As discussed in the previous section, at the time of compiling this GMS Council had commenced a review of the CSP document in order to bring it up to date with the latest Department of Local Government guidelines and requirements for Integrated Planning and Reporting.
2.7.4 Vision 2025In 2004 Council released Vision 2025. In many ways this was an attempt to establish a growth strategy for the Shire. (Previous Growth Strategies that applied to some of the towns and villages across the Shire were in fact rescinded when Council adopted Vision 2025). Unfortunately, the Vision 2025 document has limitations in its ability to operate as a meaningful growth management strategy. (It has never received any offi cial recognition in that regard from the Department of Planning).
Its limitations are based on many factors:
• Doesn’t adequately address diff erent residential housing types• Doesn’t adequately address dispersed rural residential growth• Doesn’t adequately address employment lands issues• Doesn’t directly relate identifi ed growth areas to demographic projections• Includes many “idealistic” or “visionary” statements and ideas that were not tested and reviewed for their strategic voracity. • Identifi es areas which have questionable merit as growth locations• Includes graphical mapping representations that are open to diff erent interpretations• Its mapping is also not clearly explained. Th is has led to the simplistic interpretation that if something is shown on the map, it’s therefore strategically supported and makes good planning sense. • Doesn’t contain any clear assessment criteria to use when assessing proposals so it has limited use as a tool to assist in decision making on planning proposals.
Despite these limitations as a growth management document, Vision 2025 was useful in capturing some key themes and issues regarding the Shire’s future. Th e content of that document had signifi cant input from an extensive community engagement process which was, in the truest sense, a “visioning” process. Th is explains the outcome and fi nal contents of the document.
With the development of the new Community Strategic Plan and this GMS, Vision 2025 is to be superseded, however its key themes and directions are being carried through into the CSP and the GMS. Its specifi c content
, Growth Management Strategy 2011 page 19y
ommunity Strategic Plan 2030 (CSother plans, such as this Growth Managem
“rural living” for the Shire and develops goals, outnity, Economy, Environment, Infrastructure and Gover
n the previous section, at the time of compiling this GMS Council had cument in order to bring it up to date with the latest Department of Local G
rements for Integrated Planning and Reporting.
4 Vision 2025004 Council released Vision 2025. In many ways this was an attempt to establish a growth strate. (Previous Growth Strategies that applied to some of the towns and villages across the Shire weinded when Council adopted Vision 2025). Unfortunately, the Vision 2025 document has limitatioty to operate as a meaningful growth management strategy. (It has never received any offi cial recogniregard from th
imitations ar
Doesn’tDoesn’DoesnDoesn
• Includes many “idealistic” or “visionary” statements and ideas that were not tested and reviewed fotheir
• Identifi• ncludes• s mapping is also not clearly explained. Th is has led to the simplistic interpretation that if something
is shown on• oesn’t contain any clear assessment criteria to use when assessing proposals so it has limited use as a
tool to assist in
espite these limitations as a growth management document, Vision 2025 was useful in capturing some kemes and issues regarding the Shire’s future. Th e content of that document had signifi cant input from ansive community engagement process which was, in the truest sense, a “visioning” process. Th is explains th
me and fi nal contents of th
development of the new Community Strategic Plan and this GMS, Vision 2025 is to be supersededey themes and directions are being carried through into the CSP and the GMS. Its specifi c co

Wollondilly Shire Council, Growth Management Strategy 2011 page 20
regarding future development scenarios for each of our towns and villages (as shown on its maps) has been reviewed to ensure that elements that are consistent with the overarching principles and directions of this GMS are captured and carried forward.
2.7.5 Wollondilly LEP 2011Wollondilly’s new Local Environmental Plan 2011 was gazetted in February 2011.
Th is new plan was prepared in response to State government legislation requiring all NSW councils to prepare a new comprehensive LEP in line with a new standardised LEP Template (the “Standard Instrument”). Th e process has largely been a transfer of Council’s current LEP across to the new system.
A deliberate decision was made when the process was commenced that the new LEP was not going to attempt to be the mechanism for deal with all issues regarding future growth. Council at that point in time had many unresolved issues regarding future growth and to try and use the LEP process as a way of resolving such issues would have proved almost impossible given the time constraints set by the State Government for the preparation of the new plan. Th e new LEP does however deliver some signifi cant growth opportunity outcomes:
• Increased employment lands (business zones) in an around many of our town centres*• Introduction of a medium density housing zone in the central area of many of our towns* (*Note that these growth opportunities are shown on the maps attached to this GMS) Th e agreed strategic approach between Councillors and staff has been to prioritise the delivery of a new LEP in accordance with the Standard Template, closely followed by a Growth Management Strategy. Th is has enabled the new LEP to progress without getting excessively bogged down in issues and debates on growth as these kinds of matters have been understood to be issues better left for the GMS. (Inevitably the exhibition of the draft LEP resulted in a signifi cant number of submissions requesting rezoning to permit various forms of growth).
What this means in eff ect is that future rezonings to enable growth, whether they be for employment lands or housing, will need to be prepared as amendments to LEP 2011. Th is implementation aspect is discussed more fully in Chapter 7 Implementation.
2.8 State Government Context
2.8.1 Metropolitan Strategy 2005 and draft SW Subregional StrategyWollondilly Shire is included as part of the Greater Metropolitan Area of Sydney and is therefore included in the State Government’s Metropolitan Strategy for Sydney, “City of Cities” released in December 2005. Wollondilly, Camden, Campbelltown and Liverpool local government areas collectively form the South West Subregion of Sydney and are covered by the Department of Planning’s Draft SW Subregional Strategy. Th e 2005 Metropolitan Strategy is currently under review (with the recent release of the “Sydney Towards 2036” discussion paper).
A signifi cant part of the South West Subregion is the South West Growth Centre (SWGC), which includes some areas of Camden, Campbelltown and Liverpool, but not Wollondilly. Th e Growth Centres SEPP (State Environmental Planning Policy) provides the legislative framework for the delivery of the Growth Centres and specifi c structure plans guide the overall planning outcomes, precinct staging and infrastructure rollout.
Th e Metro Strategy and the Draft SW Subregional Strategy contain the State Government’s overarching planning
•
Wollondilly Shire Council, Growth Management Strategy 20
2.8 State Gove
2.8.1 Metropolitan Strateg
t of the Grean Strateg
d Liverpohe Departder review
on is the Soiverpool, but
e legislative framanning outcome
mep
Th e Metro Strategy and the Draft SW Subregional Strategy

Wollondilly Shire Council, Growth Management Strategy 2011 page 21
policy directions for Wollondilly. Sydney’s 2005 Metro Strategy predicted that Sydney’s population will grow by 1.1 million to 5.3 million between 2004 and 2031. Th is would require 640,000 new homes and 500,000 more jobs. Of the extra 640,000 new homes, 430,000 would be in existing areas and one 210,000 in greenfi eld areas.
For the South West Subregion, this meant a target of 155,000 new homes over and above 2004 numbers), comprising:
• 40,000 in existing areas,• 100,000 in the South West Growth Centre and• 15,000 in other greenfi eld areas Th e DoP’s draft South West Subregional Strategy December 2007 recognises that Wollondilly Shire has three quarters of the land mass of the SW Subregion. But over half the Shire’s area is designated as national park or water catchment lands, which constrains future development potential. Th e draft Strategy sets targets to 2031 for the Shire of 5,200 extra dwellings, of which 4,000 (three quarters), would be from Greenfi eld sites, plus 2,000 jobs. In contrast Campbelltown is expected to provide 20% from Greenfi eld sites and 80% from existing areas. Th e DoP target of 5,200 extra dwellings for Wollondilly represents less than 1% of the Sydney Metropolitan Area target of 640,000.
(It should be noted that Wollondillly has continually stated that the dwelling target in the 2005 Metro Strategy and associated SW Subregional Strategy are insuffi cient to accommodate our growth forecasts and that Wollondilly needs a target of 7,000 – 7,500 dwellings).
Key features of the draft Subregional Strategy are:
• Wollondilly does not play any signifi cant role in accommodating Sydney’s growth, so includes no major centres for growth etc, • Th e draft Strategy however acknowledges the need for the Shire’s sixteen rural towns and villages to grow, and also acknowledges the potential of Maldon and Menangle for employment lands. • Th e draft Strategy includes this statement on Macarthur South in the Economy & Employment section: “Interim development at Macarthur South should not limit options for urban development and infrastructure in the future and have regard to the principles in the State Plan of providing jobs close to residential areas and with good public transport access”.• Wollondilly is recognised and valued for its resource lands environmental lands, rural lands etc. • Th e draft Strategy concentrates on the role of the SW Growth Centre to deliver the majority of required Greenfi eld housing numbers etc
2.8.2 “Sydney Towards 2036”Th is document, in conjunction with the recently released Metropolitan Transport Plan, has been released as part of the consultative process feeding into a review of the Metropolitan Strategy. It is understood that the new revised Metro Strategy will be released later in 2010 and that the subregional strategies (which are still in draft form) will then be able to be fi nalised.
tro Strategy predicted that Sydney’s population will grow 2031. Th is would require 640,000 new homes and 500,000
30,000 would be in existing areas and one 210,000 in greenfi eld
get of 155,00
d
er 2007 rehalf the Shment potentia
(three quarters), would be from Greenfi eld sites,vide 20% from Greenfi eld sites and 80% from
ndilly represents less than 1% of the Sydney
lling target in the 2005 Metro Strategy ate our growth forecasts and th

Wollondilly Shire Council, Growth Management Strategy 2011 page 22
2.9 Macarthur South
2.9.1 NSW Government’s position on Macarthur South As Wollondilly Shire is on the southern fringe of the Sydney Metropolis, it is coming under increasing pressure from landowners to develop greenfi eld land for residential purposes, particularly in the Macarthur South area (which is shown in one of the maps in Appendix 2). Th is area has been recognised as a potential urban expansion area for Sydney’s future growth for over three decades. Th e area extends east from Razorback to the Shire’s eastern water catchment lands. It includes the villages of Maldon, Douglas Park, Menangle, Wilton and Appin in Wollondilly Shire, and Mt Gilead in Campbelltown Council’s area.
In 1991 the Department of Planning produced the comprehensive Macarthur South Regional Environmental Study, with the aim of establishing “guidelines for future development.” It provides some useful background information but was not progressed and it has been superseded by subsequent NSW Government planning documents and changes in Government policies.
Th e latest blueprint for Sydney, the NSW Government’s Metropolitan Strategy continues to recognize this area for the inevitable urban expansion of the Sydney Metropolitan Area (SMA) but it identifi es the Macarthur South area as having urban development capability beyond the next 25 years.
Macarthur South is highly relevant to any high growth / accelerated growth scenario for Wollondilly. Th e number of lots developed in the Shire could be much greater than that which is needed to accommodate our natural growth rates if the NSW Government allows signifi cant residential release in the Macarthur South area, such as those for which major developers are currently understood to be lobbying.
In 2009, the Minister for Planning issued an offi cial statement declaring the NSW Government’s position on Macarthur South, which reinforced the position adopted by the Metro Strategy and draft Subregional Strategy.
In keeping with the media release by the Minister, Council received a letter from the Director-General of the Department of Planning which stated:
“Aft er considering a wide range of factors the Government has dec ided to cease and defer any further inves tigation of the Macarthur South area as a land release area. Th ose factors include the infr astructure cost of servicing the area, the ec onomic values of coal and agricultural res ources in Macarthur South, access to employ ment and curr ent and proposed supp ly of land for housing already in the South Wes t”

Wollondilly Shire Council, Growth Management Strategy 2011 page 23
However the letter does also included the following statement:
“Consideration of land release proposals for other relatively smaller areas within Macarthur South may be given if they meet the Government’s requirements, particularly regarding infrastructure provision”
Th e implications of these announcements have been discussed with Senior Department of Planning representatives (Director-General and Regional Director) with particularly regard to the above statement concerning small area land release. Th e Department of Planning has indicated that the development aspirations of the major development companies with landholdings in Macarthur South go beyond the scale of what could be supported as limited small scale release. Th e Director-General however pointed out that whether or not a proposal would be considered acceptable is not just a question of scale, but more importantly a question of infrastructure servicing and impacts on resource lands (coal, agriculture etc).
Th e senior DoP staff have advised that in the context of the 2009 Ministerial announcements on Macarthur South, it would be diffi cult to consider major residential proposals in Macarthur South as “state signifi cant” as that would be contrary to their position that Macarthur South is not at this point in time a State priority for the delivery of Sydney’s housing needs..
When it comes to “land release proposals for other relatively smaller areas”, DoP is saying that these will need to be fi rstly considered and supported by Council. Th is is signifi cantly and appropriately deferring the issue back to local government, at least at the beginning of the process. So it’s placing Council in the driving seat when it comes to the initial question of whether or not to go forward with some limited “small scale” releases in the Macarthur South area. Th e implications of this responsibility are discussed further in the following section.
Th e current Metropolitan Strategy Review is not expected to lead to a change in the Department of Planning’s position on Macarthur South.
2.9.2 Council’s position on Macarthur SouthDecisions regarding when and how Macarthur South goes forward as a major release area for the expansion of Metropolitan Sydney are ultimately matters which will be determined by State Government. If the NSW Government was to announce that Macarthur South was to proceed on a major scale then it would need to commence broad scale planning to produce an overall master plan and an implementation strategy, not dissimilar to that which has occurred for the Growth Centres. Th is would be necessary to ensure an orderly approach to staging and infrastructure provision. While Wollondilly Council has only limited infl uence over such long term metropolitan planning directions, we would nevertheless demand to be a key participant in any such planning process if it were to commence.
Wollondilly Council does however have a key role in the short term in deciding whether or not to support smaller scale incremental land releases in the Macarthur South area. At the time of writing this GMS Wollondilly Council has been presented with a range of signifi cant Macarthur South development concepts put forward by key landholders / development companies. Th ese proposals include both housing developments and employment lands developments. Statements both verbally and in writing from the Department of Planning suggest that these kinds of proposals are matters for Council to consider (in the fi rst instance at least).
, Growth Management Strategy 2011 page 23y
the context of the 2009 der major residential proposals in Ma
position that Macarthur South is not at this poneeds..
to “land release proposals for other relatively smaller areas”, DoP is saysidered and supported by Council. Th is is signifi cantly and appropriately d
vernment, at least at the beginning of the process. So it’s placing Council in tto the initial question of whether or not to go forward with some limited “small scur South area. Th e implications of this responsibility are discussed further in the follo
urrent Metropolitan Strategy Review is not expected to lead to a change in the Department ion on Macarthur So
9.2 Counciisions regarding when and how Macarthur South goes forward as a major release area for the expa
Metropolitan Sydney are ultimately matters which will be determined by State Government. If the Nernment was to announce that Macarthur South was to proceed on a major scale then it would n
commence broad scale planning to produce an overall master plan and an implementation strategy, similar to that which has occurred for the Growth Centres. Th is would be necessary to ensure an order
pproach to staging and infrastructure provision. While Wollondilly Council has only limited infl uence overuch long term metropolitan planning directions, we would nevertheless demand to be a key participant in anuch planning
Wollondilly Council does however have a key role in the short term in deciding whether or not to supporsmaller scale incremental land releases in the Macarthur South area. At the time of writing this GMWollondilly Council has been presented with a range of signifi cant Macarthur South development concepts puforward by key landholders / development companies. Th ese proposals include both housing developments andemployment lands developments. Statements both verbally and in writing from the Department of Planningsuggest that these kinds of proposals are matters for Council to consider (in the fi rst instance at least).

Wollondilly Shire Council, Growth Management Strategy 2011 page 24
Th e draft South West Subregional Strategy acknowledges that there may be some potential for limited land releases in the Macarthur South area but it requires that development of any signifi cant “Greenfi eld” sites outside the South West Growth Centre area need to meet a range of threshold sustainability criteria for new land releases. Th ese criteria address:
• Infrastructure provision• Access• Housing diversity• Employment lands• Avoidance of risk• Natural resources• Environmental protection• Quality & equity of services.
In 2007 the Department of Planning commissioned APP Corporation to research and prepare the Macarthur South Strategic Review Report. Th e report was issued in September 2007 and it provides a very useful summary of relevant issues in the Macarthur South area. It addresses land supply and demand, infrastructure and environmental assessments, government services planning, metropolitan and local planning frameworks and considered four possible development scenarios. On the issue of incremental developments in Macarthur South, the report included the following statement:
“Incremental development may demonstrate that it is ‘self suffi cient’, but over time the risk is that the aggregation of these developments will result in inadequate social and transport infrastructure requiring remedial action by government”.
Also the report recognised the need for detailed planning in the Macarthur South area before signifi cant development should be permitted. It reinforced that the limited resources of government agencies need to be focussed on achieving land releases in the designated Growth Centres, and that this could be jeopardised if they are diverted to planning in other areas such as Macarthur South.
Council has a dwelling target in the Draft Subregional Strategy of 5,200 new dwellings by 2031. With the agreement of DoP this target is to expected be raised to around 7,500 in the yet to be released fi nal version of the Subregional Strategy. Th is new target fi gure will better refl ect the forecast population growth rates for Wollondilly and the strategy of planning to accommodate our natural growth forecast as discussed above.
Two signifi cant housing developments (Bingara Gorge at Wilton and North Appin) are collectively providing approximately 1500 new homes towards this target. Council believes it can sustainably and sensibly plan for the vast majority of the remainder of the 25 year housing target to be located in those parts of the shire not within Macarthur South. It makes sense for Wollondilly’s residential growth to be primarily focused in and around our existing main population centres. Small scale residential growth would still be able to occur in the Macarthur South area in and around existing centres, but the overall numbers would be expected to be in the hundreds. Any such proposals would need to be considered on a case by case basis in accordance with this GMS.
Allowing substantial incremental release of land for housing developments in the Macarthur South area would divert our growth target towards Macarthur South and away from our other towns and villages – in other words we’d be accepting that our growth is going to be concentrated in Macarthur South rather than the rest of the Shire.
Th e only way that further housing developments in Macarthur South would not have this diversion eff ect is if those housing releases were delivering housing over and above our 7,500 target. Th is would however be making the profoundly signifi cant policy decision that Wollondilly’s growth needs to be well above “natural” growth trends. i.e. that we will deliberately embark on a policy of high / accelerated growth and that this “extra” growth will occur in Macarthur South. Such a direction would be unlikely to be supported by a community who largely value the Shire for its non-urbanised rural character.

Wollondilly Shire Council, Growth Management Strategy 2011 page 25
Council’s Vision 2025 document and its more recent Community Strategic Plan were both the outcomes of extensive community consultation and they clearly refl ect community aspirations for keeping the Shire rural. Th ere is certainly no evidence that our community wishes to see the development of major new urban centres in Macarthur South nor is there any evidence of broad community support for dramatically accelerating our growth. Both of these concepts would need to be subject to extensive community debate and support before they could legitimately become part of our strategic vision for future growth.
Th e commencement of substantial housing release in Macarthur South would be most likely to manifest itself, in the fi rst instance at least, as a concentration of development around the intersection of Picton Road and the F5. Indeed, part of the argument being put forward for further housing developments relates to the concept that the Wilton area needs a greater amount of development than that which has been approved to date in order to enable the creation of a new population centre and associated town centre in that location.
When, and if, Macarthur South is needed to accommodate Sydney’s housing growth, it may be that the Wilton interchange is an appropriate location in which to commence master planning for signifi cant urban release. But this is clearly a matter for future consideration. At the time of compiling this GMS a review of the Metropolitan Strategy had been announced and is underway. Further reviews at 5 year intervals are expected. So there will be ongoing opportunities to consider Sydney’s greenfi eld housing supply needs and the success of the Growth Centres in meeting these needs. Th ese future reviews would also be expected to consider the broader question of how to sustainably accommodate housing growth at a metropolitan and state level. Arising out of these future reviews may or may not be the decision that substantial urban release in Macarthur South is warranted. Certainly at this point in time the agreed view between Council and the Department of Planning is that Macarthur South is not currently needed for housing supply and is recognised to have signifi cant infrastructure and natural resource constraints.
Th e Key Policy Directions regarding Macarthur South are as follows:
Macarthur South Policies
P11 Council does not support major urban release within the Macarthur South area at this stage.
P12 Council considers that in order to achieve sound long-term orderly planning for the eventual development of Macarthur South an overall master plan is required.
P13 Council will not support further signifi cant new housing releases in Macarthur South beyond those which have already been approved. Small scale residential development in and adjacent to the existing towns and villages within Macarthur South will be considered on its merits.
P14 Council will consider proposals for employment land developments in Macarthur South provided they: • Are environmentally acceptable • Can provide signifi cant local and/or subregional employment benefi ts • Do not potentially compromise the future orderly planning of the Macarthur South area • Provide for the timely delivery of necessary infrastructure. • Are especially suited to the particular attributes of the Macarthur South area AND can be demonstrated as being unsuitable or unable to be located in alternative loations cloer to established urban areas • Do not depend on the approval of any substantial new housing development proposal in order to proceed (Employment land proposals which necesitate some limited ancillary or incidental housing may be considered on their merits)

Wollondilly Shire Council, Growth Management Strategy 2011 page 26
3.1 GMS methodology – key elementsTh e methodology for the preparation of the GMS has involved the following:
General methodology
A. Identifi cation and review of the various factors that make up the current context in which this GMS is being prepared. Th is has included the State Government planning policy setting, Council’s own strategic documents and directions, and our understanding of community views and aspirations regarding growth and change. Th e project also required an understanding of the specifi c development and lifestyle pressures facing Wollondilly given its location and context adjacent to the Sydney Metropolis.
B. Exploring the vision of “Rural Living” with an aim to defi ne this concept for the fi rst time and in so doing understand that it has a meaning beyond the narrow interpretation of actually living on rural or semi-rural land.
C. Understanding our context and what rural living really means enabled the GMS project to establish clear overarching policy positions on the key issues associated with residential and employment lands growth. Th ese Key Policy Directions underpin the GMS and were based on extensive analysis, research, discussion and consultation with key staff and Councillors.
Housing methodology
D. Undertaking demographic analysis to understand key trends and likely population growth forecasts. (Th is analysis was also used to inform the key policy directions mentioned above).
E. Translating demographic forecasts into housing requirements. In broad terms this means the GMS needs to plan for the delivery of at least 7,500 new dwellings over the next 20-25 years in order to house approximately 20,000 more residents.
F. Reviewing the Shire’s current housing supply situation. Th is included an audit of housing approvals granted but not yet acted upon, existing residentially zoned land with development potential, and the capacity of certain locations to accommodate ongoing infi ll development. Th is was important to understand the degree to which a proportion of our required housing numbers are either already “in the pipeline” or are able to be met within our existing urban areas.
Chapter 3 -
How this GMS was prepared

Wollondilly Shire Council, Growth Management Strategy 2011 page 27owth Management Strategy 2011 pa
G. Reviewing previous and current concepts relating to growth in Wollondilly. Th ese included superseded and current growth management documents and studies, previous Council resolutions, concepts which have been presented to Council, current draft LEPs in process, outstanding rezoning applications etc. Th is also included considering a large number of submissions that were received in relation to the exhibition of draft LEP 2010 raising questions regarding growth issues. In other words, we looked at “what we’ve got on the books” and this analysis gave an overview of the range and scale of development pressures confronting Council and some of the key planning and political issues associated with those proposals.
H. Incorporating an approach to dwelling numbers to provide fl exibility for market variations and other constraints and changes. In order to factor in a contingency for unknown or uncontrollable development constraints and to allow market fl exibility, the GMS project has established broad targets for over 10,000 houses over the next 20 to 25 years. In other words the GMS housing numbers include a +2,500 contingency above the 7,500 anticipated to be actually needed to accommodate healthy population growth. A fl exible approach to the mapping complements this need for fl exibility on housing numbers (see M below).
I. Analysing the diff erent forms of residential growth facing the Shire. Th e GMS acknowledges that residential growth can occur in many diff erent forms (from medium density housing through to rural residential estates for example) and that each of these development types has its own attributes and location requirements. In other words each of the diff erent residential types needs a particular set of circumstances for it to be an appropriate and sustainable form of growth.
J. Compiling Assessment Criteria for diff erent residential development types. Th ese criteria therefore operate as a check list to ensure that each type of residential development meets its identifi ed requirements.
K. Preliminary fi eld work and desktop analysis to identify lands which may have the potential to provide growth opportunities while meeting: • GMS Assessment Criteria • GMS Key Policy Directions (Note: Some of these lands have been brought to the GMS project’s attention as a result of a formal rezoning proposal, a submission to Council, a previous adopted strategy, or as a result of Council resolutions).
L. Preparation of Structure Plans which have considered and/or included: • Th e outcomes of the investigations described above • Th e shire wide LEP 2011 and its key outcomes regarding residential growth (this mainly refers to the lands that have been zoned for R3 medium density housing) • Other current draft LEPs for residential development which have been resolved to be prepared by Council and which are currently in progress. • Land already rezoned for residential growth but yet to be fully developed
M. Incorporating appropriate levels of fl exibility into the identifi cation and mapping of development locations. Th e Structure Plans attached to this GMS are therefore not defi nitive. Th ey refl ect a desired strategy which is consistent with the Key Policy Directions of the GMS. Th ere are three key elements to this fl exibility: • Firstly, other than those lands which are identifi ed by a specifi c draft LEP in progress or where there is some form of defi nitive physical boundary, the Structure Plans show potential growth locations generally using a conceptual graphical representation which does not specifi cally defi ne the extent of the area. Th is is because the actual extent of developable land and the capacity and appropriate scale of development in any of those proposed locations is a matter which can only be determined with more detailed analysis through the rezoning process.

Wollondilly Shire Council, Growth Management Strategy 2011 page 28
• Secondly, there may be lands in the Shire which are not mapped or identifi ed in this GMS which may have the potential to meet the Key Policy Directions and Assessment Criteria. Council may consider proposals on such lands if applicants submit “Planning Proposals” which demonstrate that they can satisfy those matters. (see Chapter 7 – Implementation for more information on “Planning Proposals”) • Th irdly, and as noted above, there needs to be appropriate fl exibility in terms of the way the lands identifi ed translate to housing numbers over time. A complex interaction of factors (environmental constraints, development costs, market conditions, infrastructure provision, government policy etc) has a large bearing on the sequence and take-up rates of land release and development. Th is needs to be recognised in any interpretation of the Structure Plans.
(How the Structure Plans are meant to be used and interpreted is explained in greater detail in Chapter 7 – Implementation).
Employment lands methodology
N. Reviewing a range of relevant local, regional and metropolitan studies and information sources relating to employment issues, prospects and forecasts. Th is included Council’s own Economic Development Strategy, MACROC’s Employment Prospects for South West Sydney and industrial land supply audits done for Wollondilly LGA and the SW Subregion.
O. Reviewing key demographic facts and forecasts regarding employment characteristics and needs in the Shire and the subregion.
P. Identifying that the Shire needs to attract a range of diff erent jobs and subsequently a range of diff erent employment land opportunities. Th e GMS acknowledges the need for additional employment but, unlike the approach taken to housing, the GMS does not set numeric targets on indicators such as job creation or hectares of industrially zoned land for example. Nevertheless, the GMS considers the draft Subregional Strategy target of 2000 new jobs in Wollondilly by 2031 as an insuffi cient number.
Q. Understanding the relationship of job types to diff erent development forms (e.g. retail and commercial centre growth, agricultural developments, tourism development, industrial estates, large scale regional industry etc) and that each of these development types has its own attributes and location requirements.
R. Compiling, where possible and appropriate, Assessment Criteria for diff erent employment land types to refl ect that analysis. Th ese criteria therefore operate as a check list to ensure that each type of residential development meets its identifi ed requirements.
S. Preliminary fi eld work and desktop analysis to identify lands which may have the potential to provide employment growth opportunities while meeting: • GMS Assessment Criteria • GMS Key Policy Directions(Note: Some of these lands have been brought to the GMS project’s attention as a result of a formal rezoning proposal, a submission to Council, a previous adopted strategy, or as a result of Council resolutions).
T. Preparation of Structure Plans which have considered and/or included: • Th e outcomes of the investigations described above • Th e shire wide LEP 2011 and its key outcomes regarding employment growth (this mainly refers to the lands that have been zoned for business purposes) • Other current draft LEPs for employment land development which have been resolved to be prepared by Council and which are currently in progress. • Land already rezoned for employment uses but yet to be fully developed.

Wollondilly Shire Council, Growth Management Strategy 2011 page 29
U. Incorporating appropriate levels of fl exibility into the identifi cation and mapping of employment locations. Th e Structure Plans attached to this GMS are therefore not prescriptive. Th ey refl ect a desired strategy which is consistent with the Key Policy Directions of the GMS. Th ere are three key elements to this fl exibility: • Firstly, other than those lands which are identifi ed by a specifi c draft LEP in progress or where there is some form of defi nitive physical boundary, the Structure Plans show potential employment growth locations generally using a conceptual graphical representation which does not specifi cally defi ne the extent of the area. Th is is because the actual extent of developable land and the capacity and appropriate scale of development in any of those proposed locations is a matter which can only be determined with more detailed analysis through the rezoning process. • Secondly, there may be lands in the Shire which are not mapped or identifi ed in this GMS which may have the potential to meet the Key Policy Directions and Assessment Criteria. Council will consider employment proposals on such lands if applicants submit “Planning Proposals” which demonstrate that they can satisfy those matters. (see Chapter 7 – Implementation for more information on “Planning Proposals”). • Th irdly, there needs to be appropriate fl exibility in terms of the way the lands identifi ed translate to employment numbers over time. A complex interaction of factors (environmental constraints, development costs, market conditions, infrastructure provision, government policy etc) has a large bearing on the sequence and take-up rates employment land development. Also, the actual job yield achieved on any given area of employment land can vary signifi cantly depending on the type of industry that goes there. Th is needs to be recognised in any interpretation of the Structure Plans.
3.2 Who prepared this GMS?Th is GMS was prepared by the Strategic Plan team of Wollondilly Council with consultant assistance provided by Rigall and Associates.
Th e preparation of the document also involved input and assistance from other sections of Council and those contributions are greatly acknowledged.
Specialist demographic analysis and forecasting was provided by demographic consultants ID (Informed Decisions).
3.3 Councillor consultation programmeTh e Councillors of Wollondilly have been active participants in the preparation of this GMS. A number of workshop meetings have been held between Councillors and staff over an 18 month period in order to reach a common understanding on the aims, directions and content of the draft GMS. Councillors have had particular input into:
• Th e Key Policy Directions • Th e defi nition of Rural Living• Council’s overall position on accommodating natural growth• Council’s position on Macarthur South
o the identifi cation and mapping of employment his GMS are therefore not prescriptive. Th ey refl ect a
the Key Policy Directions of the GMS. Th ere are three
s which are identifi ed by a specifi c draft LEP in progress or whereve physical boundary, the Structure Plans show potential
enerally using a conceptual graphical representation e the extent
ity and appch can onl
hire whichhe Key Poosals on sucan satisfy those matters. (see Chapter 7 –
Planning Prolity in terms of
A complex interaction of factors (environmental ns, infrastructure provision, government policy
up rates employment land development. of employment land can vary signifi cantly
needs to be recognised in any

Wollondilly Shire Council, Growth Management Strategy 2011 page 30
3.4 Department of Planning support for GMSTh e preparation of the GMS has been supported by the NSW Department of Planning in recognition of the diffi culty Wollondilly Council faces in managing growth pressures and the competing demands and aspirations of developers, landholders and the general community.
Th e Department of Planning have provided funding assistance for the preparation of this document and have also reviewed and endorsed its overall directions. Given that the rezoning of land involves the agreement of State Government at various points in the process, this collaborative approach is particularly important in ensuring the GMS’s legitimacy as a useable planning policy document.
Th e fi nal stages of preparing this GMS have also coincided with the review of the Sydney Metropolitan Strategy and the associated release of the discussion paper “Sydney Towards 2036”. Th is GMS has therefore been prepared in the knowledge that it needs to inform that review process.
Recent briefi ngs undertaken by the Department of Planning have reinforced their desire to see local councils prepare and adopt Growth Management Strategies which support the key principles of:
• Sustainable growth in appropriate locations; and • Integrating land use and infrastructure
Th is GMS is strongly founded on those principles.

Wollondilly Shire Council, Growth Management Strategy 2011 page 31
4.0 IntroductionBefore planning for future changes we need to identify what we would like to preserve and protect from adverse change.
As stated before, the key themes and community aspirations identifi ed in the Wollondilly Vision 2025 captured the valued elements of the Shire and its community. Combined with Council’s “Assets to Opportunities” guidelines these documents are a reliable record of the things that should be retained and protected. Th ey are summarised as:
• A wealth of native fl ora and fauna• Healthy waterways• Rural character and environmental heritage• Sustainable farms• Well designed towns and villages• Invigorated main streets• Green space and recreational networks• Integrated transport• An integrated community
Prot ect ing thes e valued aspect s of our Shire relies on us understanding the multiple factors that lead to change. Th at way we are bett er able to manage thes e factors in order to foster the changes we want and minimise or avoid the changes we don’t want. For those factors that are bey ond our control having an understanding at least helps us to plan to accommodate those changes .Th e following is a general discussion of these factors called “drivers of change”.
Chapter 4 -
Drivers of Change

Wollondilly Shire Council, Growth Management Strategy 2011 page 32
4.1 Driver of Change - A growing populationBy 2036 the total population of the Shire could increase to as much as 66,900 (Source: ABS Local Area Population Projections, 2006-2036).
Th is increase will be created from:
• Natural increase (births and deaths amongst the existing resident population); and• Net migration (the diff erence between outmigration and immigration).
Natural increase is predicted to be sustained at a level of between 400 additional people per annum in 2010 and 480 per annum in 2036. Net immigration is expected to contribute between 350 people per annum in 2010 and 400 people per annum in 2036.
“Natural Growth” is a term used throughout this GMS. It means the sustained increase in the Shire’s population that has occurred relatively consistently for the past 25 years. It is a total population growth rate of between 1.6 and 2.2% per annum. It does not include signifi cant net immigration caused by major State Government policy decisions on metropolitan growth locations (such as that proposed for the Growth Centres, Regional centres and major centres identifi ed in the Metropolitan Strategy).
Planning for population growth needs to consider the characteristics of that future population such as:
• Age structure, fertility rates and death rates.• Household types and household sizes.• Numbers of dependent and working residents;• Propensity to move (in and out migration) and the origin and destination for migration.
Planning for the population now and into the future needs to consider:
• Existing and future dwelling stocks.• Future employment needs.• Other non-residential land uses.
4.1.1 Age StructureTh e major diff erences between the age structure of Wollondilly Shire and the Sydney Statistical Division are:
• A larger percentage of 5 to 11 year olds (11.7% compared to 9.1%); • A larger percentage of 12 to 17 year olds (10.1% compared to 7.9%); • A smaller percentage of 25 to 34 year olds (12.2% compared to 15.3%), and; • A smaller percentage of 70 to 84 year olds (5.0% compared to 7.3%).
Figure 1 below shows these diff erences and Figure 2 shows age structure change between 2001 and 2006.
dilly Shire Council, Growth Management Strategy 20
ng and future dwellinture employment needs.
Other non-residential land uses.
4.1.1 Age StructureTh e major diff erences between the age structure of
• lds (11.7• ds (10.1• ds (12.2%• s (5.0% c
Figure 1 below shows these diff erences and Figure 2 shows a

Wollondilly Shire Council, Growth Management Strategy 2011 page 33
Figure 1 – Age structure of Wollondilly population compared to the Sydney Statistical Division (2006 ABS Census).
Figure 2 – Change in Age structure of Wollondilly population (2001 to 2006 ABS Census)
Wollondilly’s current population features a larger than average number of adults and dependent children compared to the Sydney average and people aged 18 to 34 and over 65 years are under-represented.

Wollondilly Shire Council, Growth Management Strategy 2011 page 34
4.1.2 Household types and sizesWollondilly Shire has a larger proportion of couple families with children but a smaller proportion of one-parent families, group households and single person households in comparison to the Sydney Statistical Division.Th e largest recent changes in family types in Wollondilly Shire between 2001 and 2006 were increases in the number of households containing adult(s) and dependent children. At the same time the number of single person households and unrelated (group) households declined.
Family households accounted for 80.3% of total households in Wollondilly Shire while lone person households comprised 15.1%, (68.6% and 21.8% respectively for the Sydney Statistical Division).Figures 3 to 6 inclusive summarise the features of household types, family types and household size in Wollondilly compared to the Sydney average and changes in these features over recent times.
Figure 3: Types of households and families in Wollondilly compared to Sydney Statistical Division (ABS Census 2006).
Figure 3 demonstrates the higher representation of ‘parent(s) with dependent children’ families and households in Wollondilly.

Wollondilly Shire Council, Growth Management Strategy 2011 page 35
Figure 4: Changes in household and family types in Wollondilly (ABS Census 2001 and 2006)
Figure 4 shows continued increase in the number of family households. Th is is to be expected given the predominance of these age groups (under 17 years and 35 to 55 years) in the general population. It is important to note a signifi cant increase in the number of single person households.
Figure 5: Household size in Wollondilly compared to Sydney Statistical Division (ABS Census 2006).
Figure 5 shows that Wollondilly dwellings typically contain a larger number of people than the houses in the Sydney Statistical Division. Th is is partly a refl ection of the available dwelling stock which is predominantly large, detached dwellings (see ‘Dwelling Stock’ below).

Wollondilly Shire Council, Growth Management Strategy 2011 page 36
Figure 6: Changes in Household size in Wollondilly (ABS Census 2001 and 2006).
Figure 6 indicates that there has been a larger relative increase in the number of households containing one and two people.
4.1.3 Summary of population trendsIn summary, based on the data available to date, the following population trends can be expected for the Shire’s future:
• Ageing population• Smaller household and family sizes• Continued outmigration of persons aged 18 to 34 years
Th e Growth Management Strategy identifi es opportunities for Council to plan for these changes with the intention of minimising the negative consequences and maximizing positive opportunities for the future population. In particular, a greater number of smaller dwellings in locations with good access to daily conveniences needs to be available for fi rst time households, smaller households and ageing households.
4.2 Driver of Change - Dwelling StockTh e size of households and the available dwelling stock are interrelated, arising from various factors including, but not limited to:
• Th e socio-economic motivations aff ecting household size.• Th e complex range of matters that motivate housing choice when people select a dwelling.• Deep rooted social and economic values attached to housing and home-ownership.

Wollondilly Shire Council, Growth Management Strategy 2011 page 37
• Fashion and taste in housing including the concept of what a home should be and what it should include.• Th e market forces which lead to the construction of diff erent types of dwellings. • Th e role of the housing industry (partly its role in responding to trends but also its role in setting trends).• Th e role and infl uence of government planning policies aff ecting housing design, supply, location, cost etc.• Our personal economic circumstances infl uencing where and how we live.• Economic factors beyond our control such as the costs and opportunities to create land and housing and the demand for diff erent types of housing that may not be currently met by the existing dwelling stock.
More research is needed specifi c to housing in Wollondilly to fully understand how these factors interact here to produce the dwelling stock currently available and likely to be available in the future. More information will be sought for future revisions and refi nements of this GMS.
We do know the following information about the dwelling stock in Wollondilly at present:
• Th e dwelling stock is dominated by single detached dwellings. Almost 90% of households reside in a single, detached dwelling, these numbers being made up of dwellings in both rural areas and within towns and villages.• Th e remainder of households are mostly living in medium density dwellings (villas, townhouses, dual occupancies, seniors living etc)• Th e number of households in higher density forms of housing (residential fl at buildings) is statistically insignifi cant.
Figure 7: Dwelling stock in Wollondilly Shire compared to the Sydney Statistical District (ABS Census, 2006)y Statistical District (ABS Census, 2006)

Wollondilly Shire Council, Growth Management Strategy 2011 page 38
Figure 8: Changes in Dwelling stock in Wollondilly Shire (ABS Census, 2001 and 2006)
Th e changes in dwelling stock shown in Figure 8 do not refl ect the scale of changes in household size (i.e. decreasing household size) nor do they refl ect the existing and likely future changes in population characteristics and the demands for housing (such as increased demand for smaller, adaptable dwellings).
4.3 Driver of Change - MigrationTh e movement of residents into and out of Wollondilly Shire infl uences the population almost as much as natural increase. Net migration results in an increase of an average of 350 to 400 people per annum compared to an average increase of 400 to 480 through natural increase.
Figures 9 and 10 below show that the majority of people moving in to the Shire come from adjoining local government areas. At the same time the majority of people moving out of the Shire move to areas that are signifi cant distances.

Wollondilly Shire Council, Growth Management Strategy 2011 page 39
Figure 9: Major net migration moves for Wollondilly Shire (ABS Census 1996 to 2001)
Figure 10: Major net migration moves for Wollondilly Shire (ABS Census 2001 to 2006)
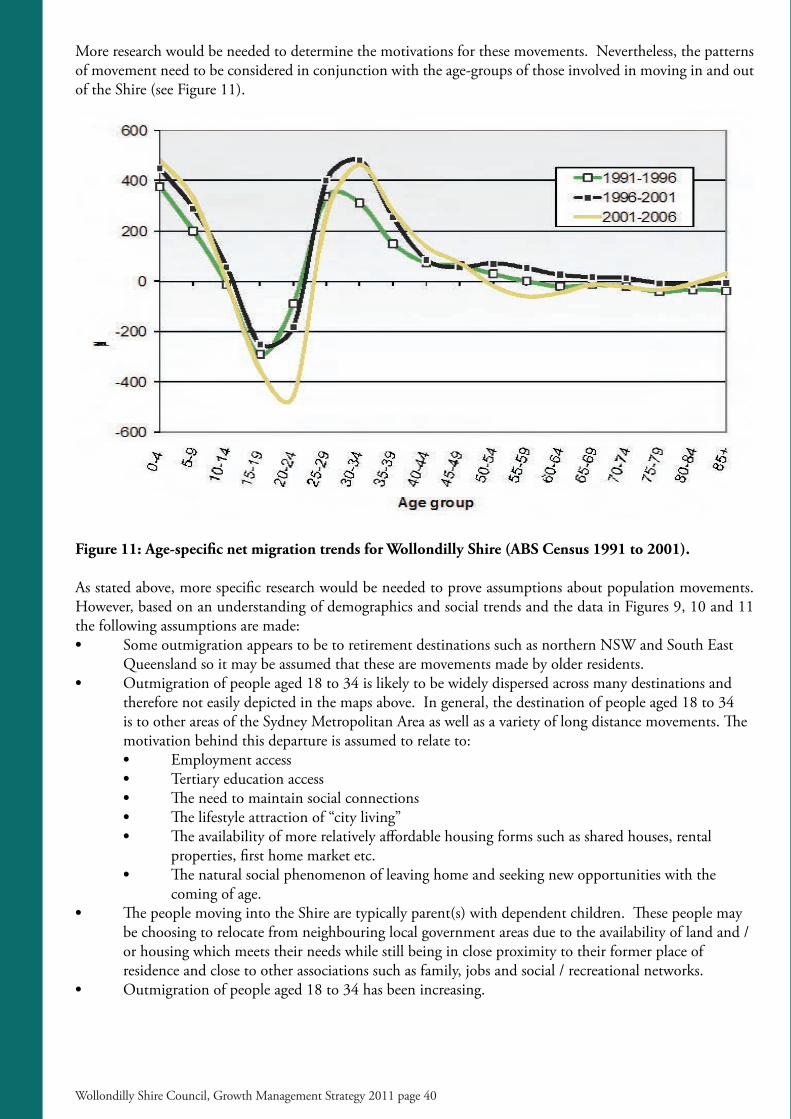
Wollondilly Shire Council, Growth Management Strategy 2011 page 40
More research would be needed to determine the motivations for these movements. Nevertheless, the patterns of movement need to be considered in conjunction with the age-groups of those involved in moving in and out of the Shire (see Figure 11).
Figure 11: Age-specifi c net migration trends for Wollondilly Shire (ABS Census 1991 to 2001).
As stated above, more specifi c research would be needed to prove assumptions about population movements. However, based on an understanding of demographics and social trends and the data in Figures 9, 10 and 11 the following assumptions are made:• Some outmigration appears to be to retirement destinations such as northern NSW and South East Queensland so it may be assumed that these are movements made by older residents.• Outmigration of people aged 18 to 34 is likely to be widely dispersed across many destinations and therefore not easily depicted in the maps above. In general, the destination of people aged 18 to 34 is to other areas of the Sydney Metropolitan Area as well as a variety of long distance movements. Th e motivation behind this departure is assumed to relate to: • Employment access • Tertiary education access • Th e need to maintain social connections • Th e lifestyle attraction of “city living” • Th e availability of more relatively aff ordable housing forms such as shared houses, rental properties, fi rst home market etc. • Th e natural social phenomenon of leaving home and seeking new opportunities with the coming of age.• Th e people moving into the Shire are typically parent(s) with dependent children. Th ese people may be choosing to relocate from neighbouring local government areas due to the availability of land and / or housing which meets their needs while still being in close proximity to their former place of residence and close to other associations such as family, jobs and social / recreational networks.• Outmigration of people aged 18 to 34 has been increasing.

Wollondilly Shire Council, Growth Management Strategy 2011 page 41
4.4 Driver of Change - Behaviours and Choices (work, lifestyle, recreation)Th e behaviours of the population now and into the future must also be considered in planning for future changes in the Shire. Th ese factors are diverse and changing and can not be generalised for the Shire’s population or even for the diff erent household types.
What is most important is that the Growth Management Strategy (and indeed all Council’s strategies and decisions) aim to improve the sustainability of those behaviours and choices. More specifi cally, Council should seek to provide an environment where the residents and visitors to Wollondilly have the opportunities to behave and make choices which consistently reduce their impacts on the environment.
It is important to understand that “sustainable” behaviour and choices can not be confi ned to geographic boundaries. Th e aim is therefore not so much about making “Wollondilly Shire” self-sustaining, but rather more about the need to identify and use opportunities provided on a regional (and sometimes larger) scale and understand how choices and behaviours can consistently work towards a more sustainable quality of life for our current and future generations.
Some understanding of signifi cant behaviours and choices can be determined from data related to income and consumption, employment and education.
4.4.1 Income and ConsumptionWollondilly Shire has a high rate of workforce participation in comparison to the Sydney Metropolitan average. Of the working-age population of Wollondilly 95.7 % of the potentially available workforce is employed (compared to 94.7 % for the Sydney average).
High workforce participation and larger-than-average numbers of people per household translate to slightly higher-than-average household incomes in Wollondilly compared to Sydney. As can be seen in Figure 12 below, the 2006 Census showed there was a smaller proportion of high income households (those earning $1,700 per week or more) as well as a smaller proportion of low income households (those earning less than $500 per week).

Wollondilly Shire Council, Growth Management Strategy 2011 page 42
Figure 12: Weekly household income for Wollondilly compared to Sydney Statistical Division (ABS Census 2006).
Table 1 below shows that Wollondilly has a rate of home ownership the same as the Sydney average but a signifi cantly higher proportion of the overall population have mortgages compared to the Sydney average.
Table 1: - Housing Tenure Wollondilly Shire / 2006 CensusEnumerated data Number Percent (%) Sydney Statistical Division %Owned 4,116 30.8 30.1Purchasing 6,443 48.1 31.1Renting 2,035 15.2 29.7Total dwellings (OPDs) 13,382 100.0 100.0
Th e amount that Wollondilly households spend on housing is signifi cantly higher than average as shown in Figure 13. Also, rental payments are typically lower than the Sydney average.

Wollondilly Shire Council, Growth Management Strategy 2011 page 43
Figure 13: Weekly spending on housing per household for Wollondilly compared to Sydney Statistical Division (ABS Census 2006).
Th is means that a large proportion of households in Wollondilly are potentially vulnerable to mortgage stress (defi ned as households that spend more than 30% of their weekly income on housing). Th e lack of rental accommodation and lack of housing diversity also creates a situation where households have limited choices locally when seeking to down-size their housing or change their housing tenure. Th is can translate into a loss of social cohesion as decisions to change housing type often requiring outmigration.
4.4.2 Labour forceTh e type of jobs held by the resident workforce is also relevant to understanding behaviours and choices for the existing and likely future population. Th e major diff erences between the jobs held by the population of Wollondilly Shire and the Sydney Statistical Division are:• A larger percentage of persons employed in manufacturing (13.9% compared to 9.7%); • A larger percentage of persons employed in construction (11.2% compared to 7.1%); • A much smaller percentage of persons employed in professional, scientifi c and technical services (4.7% compared to 8.9%), and; • A smaller percentage of persons employed in fi nancial and insurance Services (2.4% compared to 6.4%).

Wollondilly Shire Council, Growth Management Strategy 2011 page 44
Figure 14: Employment sectors for the Wollondilly labour force compared to the Sydney Statistical District (ABS Census 2006).
Figure 14 shows that there are a large number of workers in Wollondilly Shire who are required to be mobile as part of their every day occupation. Th ese workers include:
• construction (11.2%) and• transport etc (6.5%).
Th ere is some existing research which concludes that urban-rural fringe locations are particularly sought after as living locations for tradespeople, construction workers and transport workers. Th e reasons include that the properties in urban-rural fringe locations are larger than average and can accommodate the parking and storage of vehicles, equipment and goods related to these occupations and because these workers typically travel to a variety of locations daily and have no need to live close to a particular area and no reliance on public transport networks.
In the 2006 Census there were 8,961 jobs recorded within Wollondilly and 19,416 people participating in the labour force. Shire residents held 63.9% of the 8,961 “local” jobs. Of the remaining jobs, the majority were held by residents of adjoining local government areas.
Table 2 shows the main work destinations of the Wollondilly labour force.
Table 2: - Employment location of Wollondily’s residents / 2006 CensusNumber Percent (%)
Within Wollondilly Shire 5,728 29.5Outside Wollondilly Shire 11,674 60.1Live within Wollondilly Shire, work location unknown 2,014 10.4Empolyed residents of Wollondilly Shire 13,382 100.0
Source: Australian Bureau of Statistics, Journey to work, unpublished data, 2006.

Wollondilly Shire Council, Growth Management Strategy 2011 page 45
Table 2 shows approximately 60% of the labour force travel outside the Shire for their work. It is reasonable to assume that the 10.4% who are recorded as “work location unknown” are those employed in construction and transport who have variable workplace destinations, so the 60% working outside the Shire fi gure is likely to be slightly higher when this group is taken into account.
Th e fi gure of over 60% leaving the Shire is not unusual for an urban-rural fringe location. Th e labour forces of adjoining LGA’s show similar characteristics.
Table 3 shows that, of those 60% who regularly travel outside the Shire, almost all travel to an adjoining local government area.
Table 3: Top 10 Local Government Areas of employment for residents in Wollondilly Shire Council, 2006
Rank Local Government Area Number Percent (%)1 Wollondilly (A) 5,728 29.52 Campbelltown (C) 2,403 12.43 Camden (A) 2,170 11.24 Liverpool (C) 1,107 5.75 Penrith (C) 799 4.16 Sydney (C) 648 3.37 Wingecarribee (A) 556 2.98 Fairfi eld (C) 476 2.59 Bankstown (C) 448 2.310 Blacktown (C) 425 2.2
Other areas 4,656 24.0Total employed residents in Wollondilly Shire
19,416 100.0
Source: Australian Bureau of Statistics, Journey to work, unpublished data, 2006.
So, while the number of people working outside the Shire is high, it is not unusual. Th is is the outcome of a range of factors including:
• Th e size of the labour force exceeding the number of local jobs available.• A large proportion of the resident workforce having already established themselves in jobs outside the Shire before choosing to become Shire residents.• Th e widely dispersed geographic area over which the Shire extends making it in fact more convenient for some people to travel to an adjoining LGA to work rather than travelling within their own LGA (such as Warragamba and Silverdale residents working in Penrith and Liverpool and Appin residents working in Campbelltown).• Th e type of jobs available locally not necessarily matching the profi le of the professions, skills and trades of the labour force.
What is particularly important is the distances and times dedicated to work journeys, not the specifi c issue of whether you have to cross an LGA boundary to get to work. Th e Wollondilly labour force spend signifi cantly more time travelling greater distances to and from work than workers from any other nearby LGA. Th is potentially has signifi cant implications for the amount of time available for social and recreational activities and can be a barrier to integrating with the local community and developing affi liations with the local area. Th is is detrimental to the maintenance of social cohesion in the local community and therefore contrary to the characteristics identifi ed as part of “rural living”.
bs availableady established themselves in jobs ou
Shire extends making it in fact more convenork rather than travelling within their own LGAng in Penrith and Liverpool and Appin residents
tching the profi le of the professions, skills and
dedicated to work journeys, not the specifi c issue of rk. Th e Wollondilly labour force spend signifi cantly k than workers from any other nearby LGA. Th isf time available for social and recreational activities
unity and developing affi liations with the local area.n the local community and therefore contrary to the

Wollondilly Shire Council, Growth Management Strategy 2011 page 46
A high level of work distance travel also means high reliance on private vehicle usage (as discussed in the next section) which has broad environmental sustainability impacts as well as potential unfair cost burdens for our workers as they suff er high fuel costs.
4.4.3 Modes of travelAnother measure of behaviour and choice is the modes of travel used by residents. Unfortunately data is only available for the modes of travel for work and not for other activities so this data is not a true indication of the choices and behaviours made about movements for other activities (such as school-related trips, shopping trips, recreation trips etc.). Anecdotally however, we know that those other trips follow similar modal preferences and patterns.
Th e major diff erences between the method of travel to work of Wollondilly Shire workers compared to the Sydney Statistical Division are:
• A larger percentage of car-as-driver commuters (66.0% compared to 53.7%) • A smaller percentage of train commuters (3.8% compared to 12.3%) • A smaller percentage of bus commuters (0.4% compared to 5.4%).
Th e largest changes in the method of travel to work by resident population in Wollondilly Shire between 2001 and 2006 were fo:
• Car-as-driver (+1,802 persons) • Did not go to work (+223 persons) • Car-as passenger (+90 persons)
Figure 15: Mode of travel to work for the Wollondilly labour force compared to the Sydney Statistical District (ABS Census 2006).

Wollondilly Shire Council, Growth Management Strategy 2011 page 47
Figure 16: Changes in the modes of travel to work for the Wollondilly labour force (ABS Census 2001 and 2006).
In all cases private vehicles dominate the travel of the local workforce. Wollondilly Council hosted a Transport Forum during which issues of public transport and alternatives to private car use were discussed. Strategies have been identifi ed from the Forum for future eff orts. Th is Growth Management Strategy overlaps with some of the strategies developed from the Forum and is also in line with the principles of sustainable living and development such as integrating a variety of land uses with a variety of transport options.
Anecdotal evidence on travel behaviour was reinforced from the Forum regarding the large portion of resident school-aged children who attend schools outside Wollondilly. Although further research is needed into this issue it is likely that the trip to work may also be combined with trips to school with approximately 70% of high-school aged children attending schools outside Wollondilly Shire. Th e convenience and versatility of the private car used for a combined work and school trip is diffi cult to substitute for public transport or other alternatives.
To summarise, modes of travel behaviour Wollondilly are dominated by private cars. While this is not a sustainable behaviour it will be a diffi cult matter to overcome due to:
• Th e widely dispersed population and low residential densities.• Th e close proximity of larger urban centres such as Campbelltown, Liverpool and Penrith.• Th e lack of public transport which is not compatible with the variable destinations of home and work.• Th e lack of local schooling opportunities especially for high school students.
Th e Metropolitan Strategy promotes development in the Growth Centres and increasing the number of residents within 30 minutes by public transport of a City, Major or Specialised Centre. Th e development of the South West Growth Centre is expected to provide more opportunities for work and education for Wollondilly residents. Although this will mean that more workers and school students will travel outside the Shire daily, the actual distance of the trip may not be as far as is currently experienced by many.
itute for public
minated by private cars. While thidue to:
densities.Campbelltown, Liverpool and Penrith.e with the variable destinations of home and workfor high
he Growth Centres and increasing the number ofMajor or Specialised Centre. Th e development of thepportunities for work and education for Wollondilly school students will travel outside the Shire daily, theexperience

Wollondilly Shire Council, Growth Management Strategy 2011 page 48
While there are very few places in Wollondilly that are within 30 minutes by public transport to Liverpool, Penrith and Campbelltown, the Growth Management Strategy aims to increase housing in areas of high accessibility to shops, schools, services, community facilities and public transport in order to improve opportunities for reducing trips by private cars.
Th e Growth Management Strategy also aims to increase opportunities to create employment in the local area to potentially reduce the travel distance to work for local residents.
4.5 Driver of Change – Development Potential and Property Market EconomicsTh e factors infl uencing decisions made to act on the development potential of a site and to buy and sell properties are too complex for analysis in this document. Council provides a variety of sources of raw data and relies on the specialised support services of a statistics and data management company to maintain and update complex models of supply and demand for land and housing. Th is company provides Council with data on predictions for the supply and demand models for housing and Council then uses this information to keep informed of trends in supply and demand. Th e process is iterative and constantly reviewed. It is suffi cient to note at this time that the modelling conducted to date supports the new dwelling targets identifi ed in the Growth Management Strategy.
More detailed research is intended to be undertaken to examine the relative role of diff erent housing forms in meeting these targets. Based on data and research to date it is evident that there is a need to increase the supply of medium density / infi ll dwellings and to continue to provide new urban land on the edge of existing urban areas. Planned estates may provide the opportunity to integrate a variety of sustainable urban design features. Rural residential developments are least likely to provide opportunities for sustainable housing choices and behaviours in the future.
4.6 Driver of Change – Commercial and Industrial DevelopmentsTh e factors which motivate decisions to use land for commercial and industrial purposes are also complex. Th ey also vary depending on the nature of individual businesses and sectors. Th e Growth Management Strategy aims to identify matters for consideration in creating new land and new opportunities for commercial and industrial land uses within the Shire as well as opportunities to reinforce and develop existing commercial and industrial areas.
More information is being compiled on the regional dynamics of commercial and industrial lands and how this is to infl uence Wollondilly. As stated previously, the Metropolitan Strategy focuses on the Growth Centres, Cities and Major Regional Centres – none of which are located within Wollondilly. However, the Growth Management Strategy aims to take a proactive approach to guide future changes in the most appropriate locations.
More detailed research is required on which specifi c industry and commercial development types are needed in Wollondilly and within the region generally to achieve growth in employment opportunities both locally and regionally.

Wollondilly Shire Council, Growth Management Strategy 2011 page 49
4.7 Driver of Change – Agricultural LandsTh e Growth Management Strategy recognises, and is committed to, protecting existing primary producers and to protecting the agricultural potential of land holdings. Th e importance of retaining and attracting viable agriculture within the Sydney Basin is receiving increasing recognition with government authorities, the media and the general community. Retaining local producers and the employment opportunities generated from agricultural enterprises and benefi ts from consumption of local produce are essential to achieving a sustainable future.
4.8 Driver of Change – Conservation and Environmental ManagementAs stated in the Introduction to this Chapter, it is essential to determine what we need to protect from change and what we must inevitably accommodate for before we consider how to plan for changes. Land for conservation and protection has been initially identifi ed in Council’s Local Environmental Plan and Biodiversity Strategy. More specifi c locations must be progressively identifi ed in detailed studies undertaken when and where land use changes are proposed.
Concepts, values and policy approaches regarding the environment, conservation and the notion of “sustainability” continue to evolve, so this area is likely to be a dynamic driver of change for the future. For example, the emergence of bio-banking and future public policy responses to climate change may therefore have signifi cant implications for Wollondilly.
4.9 ConclusionIn response to the overall drivers of change outlined in this Chapter the GMS aims to:
• Promote a diversity of dwelling stock particularly increasing the supply of smaller dwellings located with good access to daily conveniences including public transport.• Promote and encourage a range of commercial and industrial development in appropriate locations• Facilitate access to more employment opportunities within the region.• Create environments with more opportunities for sustainable behaviours and choices (at both the local and regional scales).• Provide opportunities to substitute trips by private cars by integrating land uses in combination with the provision combined with a variety of transport options.

Wollondilly Shire Council, Growth Management Strategy 2011 page 50
As outlined previously the GMS needs to plan for the delivery of at least 7,500 new dwellings over the next 20-25 years in order to house approximately 20,000 more residents. Th is housing needs to be provided in a diverse number of forms so that there are appropriate and aff ordable housing options for all sections of our community. Diff erent forms of housing are explained in this chapter, along with their pros and cons. Th e chapter also deals with the concept of housing numbers or “targets” and how those numbers are to be achieved and broadly distributed.
5.1 Housing “targets” – what are they all about?Th e Department of Planning has recently commenced the fi rst 5 year review of the 2005 Metropolitan Strategy. Th e timeframe for the new version to be released later in 2010 is now appropriately extended out to 2036. Importantly the discussion paper, Sydney Towards 2036, which was released to kick off the review, notes that the population projections for Sydney and NSW have increased since the 2005 Metropolitan Strategy was released. Some of the key elements of the new forecast are:
• Sydney’s population by 2031 expected to be 5.7 million. (Th e previous forecast contained in the 2005 Metro Strategy was 5.3 million by 2031)• Sydney’s population by 2036 expected to be 6 million.• 70% of population growth will be driven by natural increase and 30% by migration.• By 2036 1 in 6 people will be aged 65 or over, compared to 1 in 8 now.
Th e housing targets contained in the 2005 Metro Strategy and the associated subregional strategies, (and those which will arise out of the current review of those documents) are all about setting goals for the delivery of housing to meet anticipated population growth forecasts. Th e targets vary between diff erent subregions and between diff erent local government areas to refl ect the fact that diff erent parts of the greater Sydney metropolitan area have diff ering capacities and roles when it comes to accommodating growth. A range of planning principles such as infrastructure delivery, environmental constraints, centres policy, resource conservation, the integration of land use and transport networks etc. have therefore infl uenced these targets.
Chapter 5 -
Housing

Wollondilly Shire Council, Growth Management Strategy 2011 page 51, Growth Management Strategy 2011 page 51y
Wollondilly’s minimal role in accommodating growth is appropriate given:
• our location and the need to contain Sydney’s urban footprint• our forecast population growth• our valuable resource lands• our environmental constraints • our limited infrastructure• our community’s desire to keep the shire rural
Th e draft Southwest Subregional Strategy (SWSRS) therefore set a 2031 housing target of 5200 new dwellings for Wollondilly. Th is means 5200 additional dwellings above and beyond the number that existed as at 2004. (Th e 2005 Metropolitan Strategy and associated draft Subregional Strategies used 2004 as their base year). Wollondilly Council has consistently argued that this is an inadequate number for the anticipated population growth. A fi nal version of the SWSRS is yet to be adopted but it is expected that the revised document will incorporate a housing target to better refl ect our population growth forecast.
Th e concept of “targets” can be confused to mean a “cap” or “limit” on the number of houses. Th e Department of Planning has confi rmed that this is not the intention of the targets as they are goals for housing delivery. Wollondilly Council is not prevented from providing housing in excess of these targets and, as noted throughout this document, the GMS project aims to deliver at least 7,500 new houses over the next 20 to 25 years to accommodate healthy population growth. Furthermore the GMS recognises the need for a contingency above the 7,500 in order to factor in unknown or uncontrollable development constraints and to allow market fl exibility. Hence the inclusion in this Chapter of broad housing target fi gures which exceed 10,000.
Nevertheless, the idea that “targets” are not “caps” should not be misinterpreted to mean that Wollondilly can provide housing vastly in excess of its target as this would fundamentally fail to refl ect our context (see dot points above). In addition to the fact that Wollondilly Shire is eff ectively not yet needed to accommodate Sydney’s growth, attempting to accelerate our Shire’s population growth by releasing large tracts of land for new housing also raises profound issues of how that would transform the nature of our Shire and the vision of rural living.
It should be noted that in many local government areas, particularly those with strong community opposition to increased urban densities, the notion of housing “targets” is seen in a very diff erent context compared to Wollondilly – i.e the targets are seen as undesirably high.
5.2 Th e housing land supply debateTh e issue of whether Sydney has enough land identifi ed for meeting housing supply needs into the future is a matter of constant debate. Th e development industry continues to argue that there isn’t suffi cient supply and that this places upward pressure on housing prices. However the Department of Planning’s Metropolitan Development Programme has indicated that Sydney’s housing needs are adequately catered for over the next 10 years at least. Th ese opposing views are not being explored in this GMS as it is well beyond the scope of this project.
Th e NSW State Government has recently announced a Comprehensive Housing Supply Strategy to accelerate housing supply and to place downward pressure on prices. It remains to be seen as to what comes out of this approach, however it may have an eff ect on this GMS and Council’s required policy position on residential growth, particularly if the Comprehensive Housing Supply Strategy sets new directions regarding Macarthur South.

Wollondilly Shire Council, Growth Management Strategy 2011 page 52
5.3 Determining the distribution of housing numbersTh e long term strategy for the distribution of new dwellings in Wollondilly Shire is based on the following ten Key Policy Directions (see Chapter 1 for the full list of Key Policy Directions).
P5 Council is committed to the principle of appropriate growth for each of our towns and villages. Each of our settlements has diff ering characteristics and diff ering capacities to accommodate diff erent levels and types of growth (due to locational attributes, infrastructure limitations, geophysical constraints, market forces etc.).
P9 Dwelling densities, where possible and environmentally acceptable, should be higher in proximity to centres and lower on the edges of towns (on the “rural fringe”).
P10 Council will focus on the majority of new housing being located within or immediately adjacent to its existing towns and villages.
P11 Council does not support major urban release within the Macarthur South area at this stage.
P12 Council considers that in order to achieve sound long-term orderly planning for the eventual development of Macarthur South an overall master plan is required.
P13 Council will not support further signifi cant new housing releases in Macarthur South beyond those which have already been approved. Small scale residential development in and adjacent to the existing towns and villages within Macarthur South will be considered on its merits.
P17 Council will not support residential and employment lands growth unless increased infrastructure and servicing demands can be clearly demonstrated as being able to be delivered in a timely manner without imposing unsustainable burdens on Council or the Shire’s existing and future community.
P18 Council will encourage sustainable growth which supports our existing towns and villages, and makes the provision of services and infrastructure more effi cient and viable – this means a greater emphasis on concentrating new housing in and around our existing population centres.
P19 Dispersed population growth will be discouraged in favour of growth in, or adjacent to, existing population centres.
P22 Council does not support incremental growth involving increased dwelling entitlements and/or rural lands fragmentation in dispersed rural areas. Council is however committed to maintaining, where possible and practicable, existing dwelling and subdivision entitlements in rural areas.
Th e Table on the following page shows in very broad terms the proposed strategic distribution of new dwelling numbers across the Wollondilly Shire over the next 20-25 years. Th e fi gures are long term targets and whether they are achieved will ultimately depend on a wide range of factors (most notably infrastructure provision, environmental constraints, market forces, population growth rates, State government planning policy). Th is table needs to be read in conjunction with the explanatory notes on page 54.
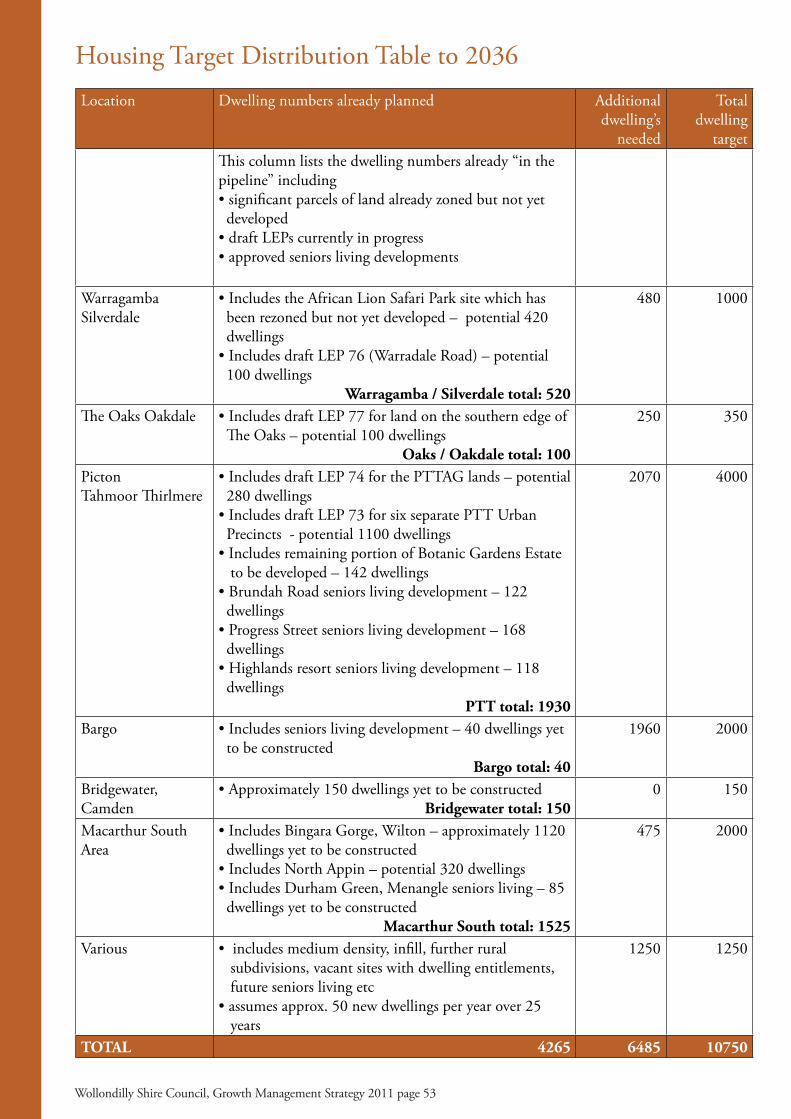
Wollondilly Shire Council, Growth Management Strategy 2011 page 53
Housing Target Distribution Table to 2036Location Dwelling numbers already planned Additional
dwelling’s needed
Total dwelling
targetTh is column lists the dwelling numbers already “in the pipeline” including• signifi cant parcels of land already zoned but not yet developed • draft LEPs currently in progress• approved seniors living developments
Warragamba Silverdale
• Includes the African Lion Safari Park site which has been rezoned but not yet developed – potential 420 dwellings• Includes draft LEP 76 (Warradale Road) – potential 100 dwellings
Warragamba / Silverdale total: 520
480 1000
Th e Oaks Oakdale • Includes draft LEP 77 for land on the southern edge of Th e Oaks – potential 100 dwellings
Oaks / Oakdale total: 100
250 350
Picton Tahmoor Th irlmere
• Includes draft LEP 74 for the PTTAG lands – potential 280 dwellings• Includes draft LEP 73 for six separate PTT Urban Precincts - potential 1100 dwellings• Includes remaining portion of Botanic Gardens Estate to be developed – 142 dwellings• Brundah Road seniors living development – 122 dwellings• Progress Street seniors living development – 168 dwellings• Highlands resort seniors living development – 118 dwellings
PTT total: 1930
2070 4000
Bargo • Includes seniors living development – 40 dwellings yet to be constructed
Bargo total: 40
1960 2000
Bridgewater, Camden
• Approximately 150 dwellings yet to be constructedBridgewater total: 150
0 150
Macarthur South Area
• Includes Bingara Gorge, Wilton – approximately 1120 dwellings yet to be constructed• Includes North Appin – potential 320 dwellings• Includes Durham Green, Menangle seniors living – 85 dwellings yet to be constructed
Macarthur South total: 1525
475 2000
Various • includes medium density, infi ll, further rural subdivisions, vacant sites with dwelling entitlements, future seniors living etc• assumes approx. 50 new dwellings per year over 25 years
1250 1250
TOTAL 4265 6485 10750

Wollondilly Shire Council, Growth Management Strategy 2011 page 54
Some of the signifi cant points relevant to understanding this table are:
• Th e table is based on establishing broad dwelling targets to 2036.
• Th e targets are not prescriptive limits so will need to be interpreted and applied with appropriate levels of fl exibility over time in conjunction with the monitoring of dwelling numbers. Any such fl exibility variation will however need to be based on the Key Policy Directions of this GMS.
• Th e total target number 10,750 is well in excess of the actual forecast requirement of approximately 7,500 new dwellings. Th is excess is an appropriate contingency for a range of unknown factors – in other words the assumption is that not all of these targets will necessarily be achieved.
• Th e number of dwellings already “planned” 4265 is signifi cant and is in fact close to the housing target 5200 applied to Wollondilly Shire under the draft SWSRS.
• Of the proposed 2000 Macarthur South dwellings approximately 1525 are already planned for delivery at Bingara Gorge Estate, Wilton and at the North Appin (Walker Corporation) development land. Th is means further residential land releases in the Macarthur South area will be only for small scale developments on town edges (primarily Appin but also some smaller potential at Wilton, Douglas Park and Menangle).
• Th e focus for population growth will be in two key centres, being the Picton / Th irlmere / Tahmoor Area and the Bargo area with long term targets of 4000 and 2000 new dwellings respectively. Th ese two locations are acknowledged as having attributes which make them capable and suitable for future growth (Note that this assumes key infrastructure provision and upgrades, particularly regarding sewerage and road networks)
• Th e Warragamba / Silverdale area is targeted for further growth, but with a lesser capacity than PTT and Bargo, with a long term target of 1000 new dwellings.
• Oaks / Oakdale have some limited capacity for growth so have a smaller overall target of 350 new dwellings.
• Th e row shown as “Various” refers to a wide variety of housing forms that currently contribute to growth across the Shire. Th ese housing types are expected to continue and in most cases will not require the rezoning of land. (A broad assumption of 50 such dwellings per year is included hence the total assumption of 1250). Th ey include such things as:
• Future seniors living housing developments – assumption is that Wollondilly will continue to be an attractive location for this housing sector, particular with the forecast of an ageing population. • Medium density housing – villas, town houses, multi-unit housing, shop-top housing etc - assumption is that market interest in these housing forms will improve in the future. • Urban infi ll development (i.e. land that has, or will have with the advent of reticulated sewer, subdivision potential or dual occupancy / secondary dwelling potential) – assumption is that these housing forms will continue at a steady rate. • Rural subdivisions – being rural lots which have unrealised subdivision potential – assumption is that these lots will decrease over time. • Vacant lots – being vacant urban and rural lots with dwelling entitlements – assumption is that these lots will also decrease over time.
• Any growth proposals put forward for Wollondilly’s other smaller towns and villages not specifi cally referred to in this table will be considered on their merits against the Key Policy Directions and the Assessment Criteria contained in the GMS
Wollondilly Shire Council, Growth
tate, Wilton aurther residential land releases
ments on town edges (primarily Appin bark and Menangle
Th e focus for population growth will be in two key centres, beiArea and the Bargo area with long term targets of 4000 and 2000Th ese two locations are acknowledged as having attributes which m
for future growth (Note that this assumes key infrastructure provision regarding sewerage and road networks)
The Warragamba / Silverdale area is targeted for further growth, but with a and Bargo, with a long term target of 1000 new dwelling
• Oaks / Oakdale have some limited capacity for growth so have a smaller overall t dw
ms that currently growth across the Shire. Th ese housing types are expected to continue and in most carequire the rezoning of land. (A broad assumption of 50 such dwellings per year is inc
that Wollondil continue to be an attractive location for this housing sector, particular with t
ing, shop-top ho etc - assumption is that market interest in these housing forms will improve in th
advent of reticula
sewer, subdivision potential or dual occupancy / secondary dwelling poten assumption is that these housing forms will continue at a steady ra
vision po
ntitlements –
• Any growth proposals put forward for Wollondilly’s other smaller towns and villages not specifi cally referred to in this table will be considered on their merits against the Key Policy Directions and the Assessme

Wollondilly Shire Council, Growth Management Strategy 2011 page 55
5.4 Determining the mix of housing typesCouncil is committed to encouraging and facilitating housing diversity to help sustain our communities. Th e previous chapter provides an insight into some of the key demographic trends facing our Shire and the consequent need to provide housing diversity to meet the needs of emerging household types.
Th ere are two Key Policy Directions relating to this issue:
P8 Council will support the delivery of a mix of housing types to assist housing diversity and aff ordability so that Wollondilly can better accommodate the housing needs of its diff erent community members and household types.
P9 Dwelling densities, where possible and environmentally acceptable, should be higher in proximity to centres and lower on the edges of towns (on the “rural fringe”). Th is GMS does not attempt to set prescriptive controls or targets for each diff erent housing type discussed below. Th e proportion and mix of housing types in any given development location is a matter which is best left for the rezoning stage and DA stage. Th e appropriate mix of dwelling types will be signifi cantly infl uenced by the realities of the housing market and the principle that certain residential types have their pros and cons in certain circumstances (as discussed below). Also the Assessment Criteria which are included in Appendix 1 will inform decisions on which types of residential development should occur in which locations.
As residential development progresses, the mix of housing being achieved within any particular development, and also cumulatively across the Shire, will need monitoring and review. Any such monitoring and review may in turn have an infl uence on the acceptable mix of dwelling types in any given development.
5.5 Residential development types Th e GMS acknowledges that residential growth can occur in many diff erent forms (from medium density housing through to rural residential estates for example) and that each of these development types has its own attributes and locational requirements. Most of the diff erent types of residential growth have potential in the Shire in the right circumstances so the challenge is to get the right mix in the right locations. Th e concept that each residential type is acceptable in the right circumstances is refl ected in the use of Assessment Criteria for each residential type (see Appendix 1).
Th e main residential growth types are discussed below. Note that these residential forms do not necessarily occur in isolation from each other. Residential proposals will therefore often contain a mix of these diff erent types, and in many cases the inclusion of a suitable mix of housing types will assist in achieving the overall Key Policy Directions of this GMS. Also proposals do not always neatly fi t into these categories. For example, the “self-contained estates” referred to below may share many of the characteristics associated with the other housing types. Th e point of this discussion is therefore to outline in general terms some of the key issues associated with diff erent residential development concepts.

Wollondilly Shire Council, Growth Management Strategy 2011 page 56
5.5.1 Rural-residentialTh is form of housing typically occurs on land parcels ranging in size from over 1 acre to 2 hectares (over 4,000 to 20,000 sqm) but can involve larger land parcels, particularly in highly environmentally constrained locations where lot sizes need to be bigger to achieve environmental outcomes.
Rural-residential lots earn their title from essentially being residential properties with a rural feel and setting. In general these land parcels are not used for productive commercial agriculture. Th ose who choose to reside on these lots are generally attracted to the rural lifestyle and may engage in some hobby farming such as the keeping of horses.
A small proportion of land parcels at the larger end of this range are used for productive agriculture (most typically horticulture) depending on their location and ultimately the intentions of the landowner.
Th ere is always debate over what size lot constitutes rural-residential - i.e. is a 1 acre (4000 sqm) lot a rural-residential size lot or not? Th e recent Standard Template LEP system introduced by the State Government takes the view that areas made up of these types of large lots (up to and including 4000 sqm) should be zoned R5 Large Lot Residential – in other words they are really being considered as a form of low density residential development rather than as a “rural” zone. Th e draft LEP 2010 adopted by Council at its May 2010 meeting has taken this approach.
Rural-residential style development presents Council with a signifi cant challenge. It is a form of development which has delivered signifi cant population growth and gentrifi cation benefi ts, particularly over the last 15-20 years, and it characterises much of the Shire. Th e continuation of that type of growth is therefore seen as logical by many, so it is the type of residential development most commonly and passionately pushed by the “mum and dad” developers, generally the owners of small rural holdings. Often their desire to subdivide land is understandably borne out of long-held expectations that they will one day be able to subdivide in order to provide some fi nancial security for themselves and their family.
Due to the complex and varied provisions contained in Wollondilly’s planning controls (which have been changed over time) rural-residential development has occurred in Wollondilly in a range of situations and forms including:
• concessional allotments excised off larger rural holdings• large scale community title “estates”• small scale community title developments• torrens title rural-residential estates• miscellaneous subdivision of rural land holdings as a result of the introduction of new subdivisions entitlements (largely during the early to mid 1990s)
Smaller scale rural-residential subdivisions have in the past given reasonably high fi nancial return for minimum eff ort and investment outlay. Depending on the characteristics of the land, the up-front infrastructure and servicing requirements have been relatively low per lot. Allotments are also typically sold at a higher market value than urban residential lots.
Council is put in a diffi cult position with the high level of interest in rural-residential proposals, as it is a form of housing development which comes at a broader cost (as outlined below) and is being resisted by State Government.
Th e proponents of rural-residential style development see its benefi ts as follows:
m over 1 acre to 2 hectares (over 4,000environmentally constrained locations
properties with a rural feel and setting.griculture. Th ose who choose to residege in some hobby farming such as the
sed for productive agriculture (mostions of the landowner.
4000 sqm) lot a r

Wollondilly Shire Council, Growth Management Strategy 2011 page 57owth Management Strategy 2011 page 57y
• It presents a rural look and feel which is preferable to many and therefore more desirable to market and promote compared to urban size lots and “suburbia”. • Its aesthetic role is therefore particularly well-suited to the edges of towns where a transition between urban lots and broad agricultural lands is warranted.• Th e lots are sold at a higher market value and are typically purchased by those who are aiming to construct high value rural-style housing which further contributes to the aesthetic appeal.• It provides opportunities for people to enjoy the many benefi ts and joys of living in a rural setting.• Th e large lot sizes enable on-site effl uent disposal so generally no need for reticulated sewerage. • Th e large lots potentially provide opportunities for locating dwellings and confi guring lots so as to retain environmental features and qualities e.g. vegetation.• It provides a low density outer ring around the edge of town acting as a future inhibitor to suburban sprawl. Th is is a compelling point as it is widely acknowledged that once these lots are created and developed, these up-market lifestyle blocks become diffi cult to acquire, consolidate and re-subdivide. (Th is is in fact one of the reasons for State Government opposition to rural-residential development – i.e. that it fragments and obstructs possible future urban lands). • It represents a continuation of a development form which characterises parts of the Shire and which has benefi ted the Shire.• Th ere are therefore perceived issues of equity based on the “they’ve done it so why can’t I do it?” concept. Th is point is a very strong and recurrent theme among the advocates of rural-residential.• It enables us to build our population and attract wealth which will support the Shire’s economy.• It gives small rural landowners (rather then just the big development companies) the opportunity to develop their land and therefore can give economic opportunity to some of our Shire’s residents.
Th e arguments against rural-residential include the following:
• It is increasingly viewed as an ineffi cient form of residential development as its density is extremely low so its longer-term urban infrastructure demands (on Council and service providers – not on the developer) can be very high per lot. Th at is, the longer-term infrastructure demands per lot are ineffi cient to sustain in comparison to urban residential development. For example the cost of providing and maintaining new roads in rural residential subdivisions is high per lot compared to roads in urban areas.• It is a very car-dependent form of housing so has sustainability/greenhouse implications. Car dependency is often a factor of low density and/or remote location combined with high car-use / car-ownership lifestyles.• It doesn’t concentrate population growth in established centres so doesn’t assist in building a higher density population mass to fund/support new infrastructure such as better public transport.• It uses up signifi cant amounts of valuable resource lands, particularly agricultural lands. Even land currently not being used for agricultural production may be a valuable future resource as changes in agriculture, technology, climate, markets, transport/fuel costs, and the concept of “food security” are inevitable.• It can, if poorly planned and located, have adverse impacts on our rural and natural landscapes, and our natural environment (vegetation clearing, impacts on water quality etc).• It can lead to the loss of separation between our towns, in that the rural wedge ends up as a low density rural-residential transition. • It can make future urban development more costly and problematic (as noted above).• It takes land out of agricultural production as most rural-residential properties do not involve any meaningful agriculture.• It can contribute to land use confl ict problems as rural life stylers end up adjacent to farmers, which can in turn have adverse impacts on rural production and farming viability.• It infl ates land values by placing speculative land pressure on farmland, further threatening the economic viability of farming. • It inevitably produces an up-market housing product, which is unaff ordable to many sectors of our community. As a form of housing therefore it does very little for social sustainability as it generally doesn’t assist in housing our ageing community, our fi rst home buyers, our young people and our low income earners.Th ere is clear evidence to demonstrate that Wollondilly Shire has an ample supply of rural-residential properties.
Wollondilly Shire Council, Growth Management Strategy 2011 page 58
Th ere is however no compelling demographic evidence to say we need to increase the supply rural-residential housing stock to house our community. Th ese types of properties are also renowned as having a high ownership turnover rate, with the average period of ownership being around fi ve years. Th is turnover rate contributes to ensuring there will always be a reasonable supply of rural-residential properties on the market available to those seeking that type of housing.
As noted above the rural-residential housing supply has largely been delivered through planning policies and provisions introduced over the last 15 to 20 years. Council has throughout that period had a planning policy framework which encouraged these housing forms under the broad banner of “rural living”.
Council is still committed to the vision of rural living however, as explained in Chapter 2, the concept goes beyond the idea of merely living on rural-residential properties. Importantly, this GMS is therefore setting a new direction for Council regarding the way in which housing is to be provided and located. In other words, we are shifting the emphasis away from rural-residential and towards more consolidated housing forms in and around our existing settlements. Th is approach does not prevent rural-residential housing forms from continuing to be provided. It is reasonable to assume that that there will always be a market for that type of housing and if appropriately located rural-residential properties deliver signifi cant positive outcomes.
Th e following Key Policy Directions are relevant to the issue of rural-residential development:
P9 Dwelling densities, where possible and environmentally acceptable, should be higher in proximity to centres and lower on the edges of towns (on the “rural fringe”).
P10 Council will focus on the majority of new housing being located within or immediately adjacent to its existing towns and villages.
P18 Council will encourage sustainable growth which supports our existing towns and villages, and makes the provision of services and infrastructure more effi cient and viable – this means a greater emphasis on concentrating new housing in and around our existing population centres.
P19 Dispersed population growth will be discouraged in favour of growth in, or adjacent to, existing population centres.
P22 Council does not support incremental growth involving increased dwelling entitlements and/or rural lands fragmentation in dispersed rural areas. Council is however committed to maintaining, where possible and practicable, existing dwelling and subdivision entitlements in rural areas.
What this means in practice is that Council would be more likely to favourably consider rezonings to permit rural-residential development where those lots form part (typically the outer edge areas) of a broader development adjacent to an existing town or village. In such a scenario the overall average density of the development would be higher than those rural-residential parts. Th e larger lots also have the benefi t of being suitable to accommodate any environmentally signifi cant features such as watercourses and native vegetation.

Wollondilly Shire Council, Growth Management Strategy 2011 page 59
5.5.2 Urban development on Town EdgeTh is is essentially where a town grows outward into the surrounding rural land with new land release and subdivision, but maintains a typically urban lot confi guration, structure and overall density. Th is is the traditional form of growth for rural towns and villages including those in Wollondilly. Examples of lands earmarked for a continuation of this type of growth are North Appin, the African Lion Safari Park site in Warragamba and the Picton/Tahmoor/Th irlmere Urban precincts currently being progressed through a Local Environmental Study. Th e advantages of this type of growth are that:
• It provides a logical extension to a town/village in terms of land use patterns and infrastructure extensions.• It focuses growth in and around existing centres where there is ready availability of services and infrastructure.• Th e longer-term infrastructure demands per lot are relatively effi cient in comparison to rural- residential development.• Th e development can easily benefi t from having accessibility to existing centres through minor extensions of the road and shared pathway networks.• It adds to a concentrated critical population mass which assists in supporting new and existing services and facilities.• It has less impact on environmental, rural and resource lands in comparison to dispersed rural- residential development.• Depending on the scale of the area, it can be designed to include new infrastructure of benefi t to the broader community such as open space and shared pathway networks.• It creates residential release areas which can be designed to cater for some diversity in housing types. It therefore has capacity to accommodate a variety of households and cater for a broader cross section of the community than rural-residential. • More likely therefore to provide housing accessible to fi rst home-buyers.• Its location and housing types support a higher likelihood of investment properties / rental accommodation.
On the downside this type of growth can have the following issues:
• Often it can have a very “suburban” look with large houses on small lots very close together. Th e overall eff ect can be one of modern suburbia tacked onto the edge of a traditional country town. Th is can be very visually incongruous and can detract signifi cantly from the aesthetic appeal of traditional rural settings and townscapes. Th is is particularly the case in situations where the release area is in a prominent position on the entry to a town with the back of urban lots forming an unsightly row of solid metal fences and outbuildings. Essentially the resolution of this issue comes down to design and density controls in order to integrate the development within its setting and create a visual transition – e.g. larger lots / rural-residential on the edge; lot layouts so that streets rather than back fences form the town edge.• Related to the above point is the issue that these areas often become a battle on the issue of density, with the developer’s desire to maximize lot yield and the case for urban consolidation working in opposition to the general community desire to keep the density lower and the appearance more “rural” particularly on the edges.• Depending on its design and the way it is potentially targeted to certain sectors of the housing market, it can unfortunately deliver an expensive, uniform housing product and a lack of diversity, so it doesn’t always cater for the housing needs of the community.• It is often fraught with political issues regarding debates around which lands are suitable and who therefore should be the benefi ciaries of substantial up-zoning.
page 59
t home-buyers.hood of investment properties /
the following issues:
look with large houses on small lots very close together. Th n suburbia tacked onto the edge of a traditional country town. ous and can detract signifi cantly from the aesthetic appeal of
nscapes. Th is is particularly the case in situations where the releasen the entry to a town with the back of urban lots forming an es and outbuildings. Essentially the resolution of this issue comesols in order to integrate the development within its setting and
rger lots / rural-residential on the edge; lot layouts so that streets e town ede issue that these areas often become a battle on the issue of density,
maximize lmmunity
es.he way it is potentially targeted to certain sectors of the housing eliver an expensive, uniform housing product and a lack of diversity, soousing needs of
issues regardingaries of substantial

Wollondilly Shire Council, Growth Management Strategy 2011 page 60
Th e following Key Policy Directions are particularly relevant to the issue of urban on town edge development. Th ese policies eff ectively support this type of development (in addition to medium density development as discussed below) as a focus for future housing growth.
P5 Council is committed to the principle of appropriate growth for each of our towns and villages. Each of our settlements has diff ering characteristics and diff ering capacities to accommodate diff erent levels and types of growth (due to location attributes, infrastructure limitations, geophysical constraints, market forces etc.).
P8 Council will support the delivery of a mix of housing types to assist housing diversity and aff ordability so that Wollondilly can better accommodate the housing needs of its diff erent community members and household types.
P9 Dwelling densities, where possible and environmentally acceptable, should be higher in proximity to centres and lower on the edges of towns (on the “rural fringe”).
P10 Council will focus on the majority of new housing being located within or immediately adjacent to its existing towns and villages.
P18 Council will encourage sustainable growth which supports our existing towns and villages, and makes the provision of services and infrastructure more effi cient and viable – this means a greater emphasis on concentrating new housing in and around our existing population centres.
P19 Dispersed population growth will be discouraged in favour of growth in, or adjacent to, existing population centres.
P22 Council does not support incremental growth involving increased dwelling entitlements and/or rural lands fragmentation in dispersed rural areas. Council is however committed to maintaining, where possible and practicable, existing dwelling and subdivision entitlements in rural areas.
5.5.3 Medium Density HousingTh is includes a range of higher density housing forms including residential fl ats, town houses, shop top housing, villas and senior living housing. It also includes secondary dwellings (granny fl ats) and dual occupancies. Th e advantages of this form of housing growth (if sensibly located) are:
• It delivers social sustainability outcomes for the Shire by providing a wide range of more aff ordable housing types to cater for diff erent household types and the needs of diff erent social groups. • It delivers more rental property options.• It is the most effi cient form of housing growth to achieve consolidated population densities in and around existing centres, thereby supporting improvements to services and infrastructure and minimising costs of upgrades and maintenance of infrastructure per dwelling.• It helps to directly support town centre economies by encouraging opportunities for local spending.• It can bring life and vibrancy to town centres by boosting population and mixing land uses.• It improves the safety of town centres with casual surveillance and activity outside typical business hours.• It creates “walkable” environments so encourages less car dependent communities.• It doesn’t use up valuable rural and resource lands and has little impact on scenic/landscape values on the perimeter of towns and villages.• It is less fraught with the politics of “land release”.

Wollondilly Shire Council, Growth Management Strategy 2011 page 61
Medium density housing however suff ers from an image problem and there are certainly many examples of where it has been poorly executed with substandard design, low amenity and a lack of design integration with the surrounding environment. So these forms of housing present their own set of issues:
• It needs particularly careful attention to design standards to ensure quality outcomes regarding residential amenity (for occupants as well as neighbours) and aesthetic design..• It can have a negative eff ect on traditional rural town character, heritage qualities, streetscape appearance etc if poorly located and designed.• It is often associated with concepts of overcrowding, increased local traffi c etc.• It is also often associated with strong negative community perceptions regarding “low cost” and “ghetto” stereotypes, particularly when the proposal involves public housing.• In the case of seniors living housing, State Government policy enables this type of housing to be located in rural town edge areas creating issues of access to services.
Wollondilly LEP 2011 has rezoned substantial areas in and around town centres to R3 Medium Density (see Structure Plans in Appendix 2). Although this planning framework enables medium density housing, it is acknowledged that there is currently a lack of market interest and investment return on these housing forms locally. Nevertheless proposals for these types of housing are on the increase so it is reasonable to assume that there will be an increased uptake of this type of housing into the future, particularly with population growth, changes in household types over time, and the general aging of our population.
Th e following Key Policy Directions are particularly relevant to the issue of medium density housing. Th ese policies eff ectively support this type of development (in addition to urban on town edge development as discussed above) as a focus for future housing growth.
P8 Council will support the delivery of a mix of housing types to assist housing diversity and aff ordability so that Wollondilly can better accommodate the housing needs of its diff erent community members and household types.
P9 Dwelling densities, where possible and environmentally acceptable, should be higher in proximity to centres and lower on the edges of towns (on the “rural fringe”).
P10 Council will focus on the majority of new housing being located within or immediately adjacent to its existing towns and villages.
P18 Council will encourage sustainable growth which supports our existing towns and villages, and makes the provision of services and infrastructure more effi cient and viable – this means a greater emphasis on concentrating new housing in and around our existing population centres.
P19 Dispersed population growth will be discouraged in favour of growth in, or adjacent to, existing population centres.
owth Management Strategy 2011 page 61y
eating issues of access to
ned substantial areas in and around town cex 2). Although this planning framework enables
is currently a lack of market interest and investment reeless proposals for these types of housing are on the increase so it is
an increased uptake of this type of housing into the future, particularly whousehold types over time, and the general aging of our population
owing Key Policy Directions are particularly relevant to the issue of medium densits eff ectively support this type of development (in addition to urban on town edge
ssed above) as a focus f
uncil will support the delivery of a mix of housing types to assist housing diversity and aff ordabthat Wollondilly can better accommodate the housing needs of its diff erent community members andhousehold typ
Dwelling densities, where possible and environmentally acceptable, should be higher in proximity to ceand lower
10 Council will focus on the majority of new housing being located within or immediately adjacent to its existing
P Council will encourage sustainable growth which supports our existing towns and villages, and makes the provision of services and infrastructure more effi cient and viable – this means a greater emphasis on conce
1 Dispersed population growth will be discouraged in favour of growth in, or adjacent to, existing populationcentres.
Wollondilly Shire Council, Growth Management Strategy 2011 page 62
5.5.4. Self-contained master planned estates Th ese are the developments which are eff ectively separate from existing centres and which propose to provide their own key infrastructure and facilities. Bingara Gorge at Wilton is an example in Wollondilly. Another example outside our LGA is Tulimbar Village to the west of Albion Park (Shellharbour Council). Th ese developments, when large enough, are eff ectively new towns. On the plus side these developments are:
• Highly coordinated under one developer so they avoid multiple land ownership issues during the rezoning and development phase.• Able to deliver key infrastructure funded (initially at least) by the developer. • Normally subject to an overall master plan which aims to ensures good design, sensible overall structure, open space facilities, environmental protection, shared pathway networks etc.• Usually have high “green” credentials – water sensitive urban design, energy effi cient housing etc.• Able to deliver signifi cant amounts of new housing / new lots on to the market in a relatively short time period due to the highly coordinated single land developer.• Capable of providing some degree of housing diversity and lot sizes given the proposals are master planned on a “clean slate”.• Likely to attract middle to high income earners so can bring wealth, new skills, new enterprise and a professional workforce to the Shire, so in other words the positives of “gentrifi cation”. • Able to assist in retaining the character and scale of our existing traditional centres by placing housing growth elsewhere (this of course has its own fl ip-side of negatives as noted below).
Th ese self-contained master planned estates however present a range of issues:
• Th ey concentrate new growth and infrastructure investment away from established centres and therefore can potentially impact on the ability of those centres to compete for growth and investment. Some would argue that they may actually contribute to the stagnation of those centres by focusing “attractive new” growth elsewhere.• Although often very “green” in their design, as noted above, they can be highly car-dependent due to their location and demographics (high car ownership rates and high car-use lifestyles).• In the case of Wollondilly, they further scatter our population so they exacerbate the issue of small population mass distributed across numerous centres. So they don’t assist in building higher density population mass to fund/support new infrastructure such as better public transport.• Th ey invariably deliver a relatively expensive housing product so there are no clear social sustainability benefi ts.• Th ey can be perceived as exclusive “gated communities”. • Th ey attempt to create a new community from scratch rather than building on the existing social capital of established towns and villages. Th e depth of genuine community cohesion in these new estates could be questioned.• Potentially these estates are the “spot fi res” of future urban sprawl.• Th ey reinforce community perceptions about big developers getting their way while the smaller landowners are unable to develop their land.• Th ey can rely on costly community title arrangements to provide ongoing funding for high quality infrastructure maintenance. Th e ultimate outcome of this for the new residents and Council, and therefore the fi nancial sustainability of these types of estates, remains to be seen.
Th e following Key Policy Directions are particularly relevant to the issue of self-contained master planned estates. Th ese policies would suggest that any such estates should be located adjacent to established centres so as to eff ectively function as an urban on town edge development.

Wollondilly Shire Council, Growth Management Strategy 2011 page 63
P10 Council will focus on the majority of new housing being located within or immediately adjacent to its existing towns and villages.
P18 Council will encourage sustainable growth which supports our existing towns and villages, and makes the provision of services and infrastructure more effi cient and viable – this means a greater emphasis on concentrating new housing in and around our existing population centres.
P19 Dispersed population growth will be discouraged in favour of growth in, or adjacent to, existing population centres.
5.6 Assessment CriteriaAppendix 1 contains Assessment Criteria which are designed to be use to assist in determining whether or not proposals have merit and should receive support. Th e Assessment Criteria relating to residential development types support the concepts, issues and policies discussed above in this chapter.
Further explanation of how to use the Assessment Criteria is contained in Chapter 7 Implementation and in Appendix 1 itself.

Wollondilly Shire Council, Growth Management Strategy 2011 page 64
To improve job opportunities for residents, local economic development is a priority. A stronger local economy would not only assist local residents by increasing opportunities for good jobs, it would also bring social and environmental benefi ts.
6.1 Understanding the role of the GMS in relation to employmentIt is important to note that land use planning (specifi cally the rezoning of land to enable employment uses) is just one of many approaches in Council’s Economic Development Strategy that need to be pursued concurrently in order to promote economic development and jobs growth. So while the release of employment lands through the rezoning process is important, it should not be seen as the sole solution for jobs growth. (Refer to Section 6.3 below and Council’s Economic Development Strategy for more detail on the full range of strategies being pursued by Council to promote economic development).
A common misconception or oversight is that employment lands means “industrial” land only. Th e concept of “employment lands” needs to be understood to also include other zones which provide employment opportunities such as business and commercial zones – these can often achieve a higher job yield per given area than industrial land. Institutional uses also need to be considered, such as health / medical facilities and tertiary education.
Th ere are also employment sectors which do not necessarily rely on specifi c industrial or business zoned land to operate / develop. In Wollondilly’s case this would include such things as mining, agriculture, sport/recreation, some tourism uses, home-based businesses, some institutional uses etc. Th ese uses are still controlled to diff ering extents through zoning and other land use controls, but in most cases have no direct correlation to industrial or business zoned land. Th is is signifi cant for Wollondilly as our Economic Development Strategy strongly acknowledges and supports future growth in agriculture, tourism, home based business and institutional uses.
Chapter 6 -
Employment Lands

Wollondilly Shire Council, Growth Management Strategy 2011 page 65
Th is GMS assists in an overall strategic approach to the promotion of employment by:
• Outlining the increase in zoned employment lands being achieved through LEP 2011 (these lands shown on the Structure Plans in Appendix 2).• Recognising that there is a need to plan for new industrial lands within Wollondilly and the Southwest Subregion (Th e GMS does not however attempt to quantify issues of employment land supply and demand as this is beyond the scope of this project). • Discussing some key employment land types that need to be planned for including their characteristics and general comments on where such uses are best located. • Establishing Key Policy Directions and Assessment Criteria to assist in assessing the merits of employment land rezoning proposals.• Nominating some potential locations for diff erent employment growth types (these are shown on the Structure Plans)• Having a “centres-based” approach to residential development, i.e. promoting the majority of residential growth in and around existing population centres so as to support the economic well-being of those centres.
6.2 Wollondilly’s employment contextAs outlined in more detail in Chapter 4, some of the key features of Wollondilly’s population regarding work and employment are as listed below.
• Th e main work categories in which Wollondilly’s workers are employed are: – Manufacturing – Construction – Transport (truck drivers) – Retailing – Health Care and Social Assistance – Education and Training
• Wollondilly has less knowledge based workers – specifi cally managers and professionals – compared to the Sydney average
• In the 2006 Census there were 8,961 jobs recorded within Wollondilly and 19,416 people participating in the labour force. Shire residents held 63.9% of the 8,961 “local” jobs. Of the remaining jobs, the majority were held by residents of adjoining local government areas
• Th e main categories of jobs found in Wollondilly, regardless of whether they are taken by local residents or not are:
– Manufacturing – Mining – Retail – Construction
• Unemployment levels in Wollondilly are relatively low at around 3.3%, but this needs to be understood against the continuing trend of young people leaving the Shire to look for work elsewhere. In other words, the out-migration of this age group assists in keeping this fi gure low.

Wollondilly Shire Council, Growth Management Strategy 2011 page 66
• Over 60% of the labour force travels outside the Shire for their work, although this fi gure is not unusual for an urban-rural fringe location. Th e labour forces of adjoining Local Government Area’s show similar characteristics.• Of the 60% plus who regularly travel outside the Shire, almost all travel to an adjoining local government area. Th is is very signifi cant as it underscores the idea that employment growth within the subregion is as signifi cant to the well-being of Wollondilly’s residents as is local employment growth. It also means that while it is desirable to reduce this fi gure, its importance as an indicator of our employment well-being should not be overstated and become a holy grail. Th e Shire’s attributes as a tree-change location will continue to attract new residents who move here and willingly chose to commute out of the Shire to work. For this reason we may be unlikely to see any signifi cant reduction in the travel to work fi gures.• So, while the number of people working outside the Shire is high, it is not unusual. Th is is the outcome of a range of factors including: – Th e size of the labour force exceeding the number of local jobs available. – A large proportion of the resident workforce having already established themselves in jobs outside the Shire before choosing to become Shire residents. – Th e widely dispersed geographic area over which the Shire extends making it in fact more convenient for some people to travel to an adjoining LGA to work rather than travelling within their own LGA (such as Warragamba and Silverdale residents working in Penrith and Liverpool, or Appin residents working in Campbelltown). – Th e type of jobs available locally not necessarily matching the profi le of the professions, skills and trades of the resident labour force.
• Th e Wollondilly labour force spends more time travelling greater distances to and from work than workers from any other nearby Local Government Area. • Use of private vehicles is the dominant form of travel to work.
6.3 Council’s Economic Development Strategy (EDS)Council has an adopted Economic Development Strategy which sets a range of actions to support and enhance our local economy and in so doing provide greater opportunities for our residents. Th e Strategy outlines six strategic directions, each with a range of possible actions. Th e six strategic directions are:
• Planning for economic growth and change• Strengthening business competitiveness• Consolidation activity centres• Investing in people and infrastructure• Marketing Wollondilly• Building a sustainable economy
Th e EDS analyses key industry strengths and argues there are a number of opportunities to increase investment and jobs in primary industries, manufacturing, logistics, retail, tourism, recreation and community services.
Under the fi rst strategic direction of “Planning for economic growth and change” the EDS recommends that Council identify and rezone up to 250 hectares of new employment lands. Th is target is discussed further in Section 6.5 below.
Council in 2008 established an Economic Development Advisory Group to assist Council in its implementation of the EDS.
hire for their work, although this fi gure is not labour forces of adjoining Local Government
de the Shire, almost all travel to an adjoining local t underscores the idea that employment growth within
g of Wollondilly’s residents as is local employment to reduce tated andnew resid
n we may
hire is high, it is not unusual. Th is is the
er of local jng already established themselves in jobs
residents.Shire extends making it in fact more LGA to work rather than travelling
dale residents working in Penrith and
e profi le of the professions

Wollondilly Shire Council, Growth Management Strategy 2011 page 67
6.4 Metropolitan Strategy and the draft SW Subregional Strategy
Strengthening economic activity and employment growth in Western Sydney is one of the greatest challenges of the 2005 Metropolitan Strategy and its associated draft SW Subregional Strategy.
Th e draft SW Subregional Strategy set an employment target of 89,000 new jobs for the subregion to 2031. Th ese targets were distributed as follows:
• Liverpool 35,000• Campbelltown 26,000• Camden 26,000• Wollondilly 2,000
Th e Councils in the subregion have consistently expressed the view that this level of employment growth would be insuffi cient to meet the employment needs of the anticipated population growth for the subregion. As a result, over time the relatively low number of jobs per capita in the subregion would worsen. Th e latest subregion population fi gures for 2006 to 2036 contained in “Sydney Towards 2036” forecasts a 113% increase. So in order to maintain or improve the number of jobs available per capita in the subregion employment growth would also need to be 113% or greater.
In this context Wollondilly has continued to express the view that the 2,000 new jobs employment target is extremely low and does not refl ect Wollondilly’s aspirations for local economic development and local jobs growth. Council is therefore treating this target as a minimum and continues to work towards pursuing a range of actions outlined in our EDS.
6.5 Industrial employment lands supply estimates and distributionDepending on which document or study you refer to, there are varying estimates of the supply and demand for industrial lands in the Southwest Subregion. Th e main reason for this variation would appear to be diff ering approaches to the defi nition of “employment lands” and diff ering approaches to whether the land is considered “available” or “developable”.
iy Towards 2036
le per capita in the subregio
xpress the view that the 2,000 new jobs employdilly’s aspirations for local economic development an
arget as a minimum and continues to work towards pursui
mployment lands supply distrib
udy you refer to, there are varying estimates of the supply and demand forubregion. Th e main reason for this variation would appear to be diff eringployment lands” and diff ering approaches to whether the land is considered

Wollondilly Shire Council, Growth Management Strategy 2011 page 68
6.5.1 MACROC analysisOne study prepared for MACROC in 2006 estimated that the total supply of industrial land in the Subregion was 2,346 hectares with 20% (470 hectares) being vacant, predominantly in Smeaton Grange and Moorebank. Th e Subregion is estimated to have a take-up rate of around 50 hectares per annum and MACROC’s Economic Development Plan forecasts that this take-up rate could increase towards 80 ha per annum. Since the 2006 survey was prepared for MACROC a further 114 hectares have been released in Camden in the Oran Park/Turner Road precinct (part of the SW Growth Centre). So in 2010 it is probably fair to assume that the supply of available industrial land remains at around 400 hectares (if one also assumes that the amount of absorption in the period 2007-2010 was fully off set by new releases).
If the annual take-up rate runs at 50 hectares or more into the future, it is conceivable that the entire supply could be exhausted at some point between 5 and 10 years from now. So there appears to be no question that more industrial lands need to be released across the region to maintain a good supply stream. Th ere are further planned industrial land releases in the South West Growth Centre (Lowes Creek, Bringelly and Leppington) which will assist in providing supply, however Wollondilly also needs to contribute to this supply.
Th e provision of industrial land across the Subregion is uneven with 76% of all industrial sites located within the Campbelltown and Liverpool Local Government Areas. By comparison, Camden had 13% and Wollondilly had 11% of industrial lands in 2006.
6.5.2 Th e Metropolitan Strategy Review “Sydney Towards 2036” According to the Department of Planning’s recent discussion paper “Sydney Towards 2036” about 25% of all jobs are located in employment lands, these lands being defi ned as “traditional industrial areas, business and technology parks and land for urban services as well as warehousing and logistics”. (Note that this defi nition of employment lands does not include business zones in and around town centres). Th e discussion paper states that almost 70% of Sydney’s employment lands are located in Western Sydney. New employment lands noted in the discussion paper either recently released or soon to be released are:
• 800 ha in the vicinity of the M7 / M4 interchange (State Environmental Planning Policy – Western Sydney Employment Area - 2009)• 88 ha at Riverstone West• 88 ha at Hoxton Park Aerodrome • 114 ha in the Oran Park/Turner Road precinct as part of the SW Growth Centre• 140 ha at Yarrunga/Prestons• 300 ha at Marsden Park
6.5.3 Regional Development Australia’s responseRegional Development Australia, in their recent submission in response to “Sydney Towards 2036” have made the following statements which present a broad calculation of the overall need for new employment lands in Western Sydney between 2011 and 2036. Th eir statements are based on an estimate of 10,000 ha of employment lands being available in 2011
“It is assumed that there will be no additional net growth in the supply of employment lands in the older established areas of Sydney after 2011. In 2011, GWS (Greater Western Sydney) will have a population of 2 million. If 46% are in the workforce (920,000) and 25% are located in employment lands (230,000) and available new employment lands totals 10,000 ha (70% of Sydney’s 14,790 ha) then the average employment rate per worker would need to be 23 per gross hectare.
In 2036, with GWS reaching a population of 3 million people and assuming 46% of the population are in the workforce (1,380,000) and 25% are located in employment lands (345,000) then at say 20 persons per hectare there will be a need for 17,250 ha if there is to be a balance between the GWS workforce and their jobs in employment lands”
ed that the total supply of industrial land in the Subregionacant, predominantly in Smeaton Grange and Moorebank. around 50 hectares per annum and MACROC’s Economic
uld increase towards 80 ha per annum. Since the 2006tares have been released in Camden in the Oran Park/So in 201es (if one
he future, it is conceivable that the entire supply m now. So there appears to be no question that
aintain a good supply stream. Th ere are furthentre (Lowes Creek, Bringelly and Leppington)
eds to contribu
76% of all industrial sites located withinson, Camden had 13% and Wollondilly
ey Towards 2

Wollondilly Shire Council, Growth Management Strategy 2011 page 69
6.5.4 Wollondilly Council’s role and responsibilities in contributing to industrial land supplyWith regard to Wollondilly’s limited industrial land supply it needs to be recognised that much of this vacant industrial land is ineff ective in any real sense of being truly on the market. Th is is because of issues and constraints which make the “vacant” land unsuitable and/or unavailable:
• Environmental constraints• Unsuitable location• Infrastructure limitations• Land parcels inadequate• Land-owners not interested in selling vacant land
Th e anecdotal evidence in Wollondilly’s case is that fi rms who have considered relocating to Wollondilly have been unable to fi nd available industrial land to suit their needs and have therefore chosen to locate elsewhere.
Currently Council is proceeding with a draft local environmental plan to create additional industrially zoned land in the Maldon area. Th is draft LEP will contribute to Wollondilly’s supply but substantially more industrial land needs to be achieved.
As has been stated elsewhere in this document the GMS project has not attempted to specify quantitative targets regarding hectares of industrially zoned land required in the future. Th is is beyond the scope of the GMS and is therefore a matter for future analysis, dependent on:
• Metropolitan and Subregional approaches to industrial land supply release being pursued by the Department of Planning. Th ese issues are expected to be given revised direction through the upcoming revision of the Metropolitan Strategy and the fi nalisation of the SW Subregional Strategy• Subregional planning collaboration being commenced by the MACROC Councils to develop agreed strategies on the location and type of new employment lands needed throughout the Macarthur Area.• Further investigation of the correlation between diff erent types of employment land and their: – likely overall job yield per hectare – likely local/regional job yield split
It should be noted that Wollondilly’s Economic Development Strategy (EDS) recommended that up to 250 hectares of land should be rezoned for industrial purposes, however this target fi gure was based on some very broad assumptions and will need review in future, in line with the matters listed above.
Nevertheless, from the various studies and documents that exist on the issue of industrial land supply in Western Sydney and the Southwest Subregion, there is clearly a universally held view that the supply needs to be increased into the future. Wollondilly Council therefore has to consider its responsibilities regarding the supply of new industrial lands both at a local level and also at a subregional level. Proposals for new employment lands need to be viewed not only in terms of the benefi ts for Wollondilly residents but also in the regional context to support containment and employment opportunities for Macarthur residents.
What this means is that there may be employment land proposals put forward which have a limited degree for local employment generation but which demonstrate greater potential employment benefi ts when examined at a subregional level. Th is subregional responsibility is an issue which will need to be considered in the context of the proposed strategic employment lands collaboration being commenced by the MACROC Councils. Having a subregional perspective on the issue of employment also refl ects the reality of Wollondilly’s workforce characteristics as outlined in section 6.1 above.

Wollondilly Shire Council, Growth Management Strategy 2011 page 70
6.6 Commercial / business employment land supplyAs part of Council’s background studies for the preparation of draft LEP 2010 a “Towns and Villages Centres Study” was undertaken by Council. One of the outcomes of this project was a Commercial Centres Study undertaken by Hill PDA. Th is led to a series of recommended expansions to some of the Shire’s main commercial town centres. Accordingly draft LEP 2010 includes expanded and new business zone areas, as are shown on the Structure Plans in Appendix 2. Th ese enlarged business zone areas will assist in enabling new businesses to develop and grow in our major town centres (see Section 6.7.1 below).
Further review of the take-up rates of this business zoned land will be needed in the future so as to monitor the need for additional expansion. Note that the Structure Plans nominate some possible new locations for commercial expansion in Tahmoor, Picton and Bargo.
6.7 Types of employment landsTh e GMS acknowledges that employment growth can occur in many diff erent forms. Th ree broad categories of employment land are discussed in this GMS in some detail as they are the most likely forms of employment land expected to be presented to Council through the submission of planning proposals. Growth in any of these broad categories of employment land will generally require the rezoning of land to an appropriate zone.
• Commercial / business • Light industry / general industry • Freight / logistics / warehousing
As discussed previously there are many forms of employment growth which do not necessarily rely on specifi c industrial or business zoned land to operate and develop. In Wollondilly’s case this would include such things as mining, agriculture, sport/recreation, some tourism uses, home-based businesses, some institutional uses etc. Although some of these proposals may require the rezoning of land, in many cases the proposal would only require a Development Application. In such cases the merits of the proposal would be assessed in accordance with the EPA Act, 1979. Th ese forms of employment growth are nevertheless very signifi cant for Wollondilly as our Economic Development Strategy strongly acknowledges and supports future growth in primary industries, agriculture, tourism, home based business and institutional uses.
Each of the three development types has its own attributes and preferable location requirements refl ected in the Assessment Criteria (see Appendix 1).
Note that each of the diff erent employment land types do not necessarily occur in isolation from each other. Employment land proposals may therefore contain a mix of these diff erent types, and will not therefore be able to be neatly categorised. Also Council may be presented with employment land proposals not considered in detail under this GMS.
Th e following sections outline some of the key characteristics and issues associated with the three broad employment land types.
6.7.1 Commercial / business lands As discussed above this is the land in and around town centres which is usually zoned for business purposes (in Wollondilly’s case likely to be zones B1, B2 or B4). Such land can support a wide range of high employment yield uses – retailing, professional offi ces, fi nancial institutions, government offi ces, restaurants and take-away food, health care and personal services etc.

Wollondilly Shire Council, Growth Management Strategy 2011 page 71
Business growth in these areas has a strong correlation to population growth as the businesses are primarily focussed on providing goods and services in response to the growing local market. Th is is why this GMS and its overall focus on centres-based growth will assist in supporting business development and employment growth in these zones.
Town centre business zones also tend to provide a diversity of jobs, and in so doing they cater for the employment needs of a cross section of our community – diff erent age groups, diff erent skill levels, diff erent workforce participation abilities.
Wollondilly’s fragmented and dispersed town and village network however makes it diffi cult to compete with larger nearby centres and reduce escape expenditure. As a result many residents travel out of the Shire for their retail shopping needs. Anecdotally, it is understood that a proportion of this escape expenditure is linked to people who work out of the Shire – in other words they do their shopping elsewhere because they can combine it with their work travel patterns. Council’s EDS makes the following important observation:
“Reducing escape expenditure is an important strategy to stimulate local retailing. Th e way to do this is to improve the accessibility and convenience of existing centres, broadening the scope of centre activities through improving hospitality and recreational opportunities, as well as amenities including streetscapes, child care facilities and entertainment. Th e challenge for Wollondilly is that it needs to consolidate retail activities in selective centres.”
As noted above Council has delivered expanded business zones through its recent Draft LEP 2010. Council will further review the take-up rates of this business zoned land in the future so as to monitor the need for additional expansion. Note that the Structure Plans attached to this GMS nominate some possible new locations for commercial expansion in Tahmoor, Picton and Bargo.
Th e Wollondilly Commercial Centres Study (Hill PDA) recommended that a hierarchy of towns and villages throughout the Shire be adopted and reinforced with future decisions relating to land use and future investment. A hierarchy of towns and villages assists in creating and reinforcing a particular character and function for each commercial area and balancing the scale of towns and villages with surrounding land use patterns and infrastructure. Specifi cally the Study identifi ed the following hierarchy (in order of decreasing scale and diversity of services and facilities):
• Town Centres – Picton and Tahmoor• Village Centres – Appin, Bargo, Th e Oaks, Th irlmere, Warragamba• Neighbourhood Centres – Buxton, Douglas Park, Menangle, Oakdale, Belimbla Park (Th e Dome) and Silverdale.
Decisions relating to future changes in commercial and business lands need to respect and reinforce this hierarchy.
Th e Wollondilly Commercial Centres Study (Hill PDA) also recommended the total retail fl oor area throughout the Shire will need to double between 2010 and 2030. Th is can be achieved through:
• Development of vacant commercial land and land which is zoned for, but not used, commercially (largely controlled by the land owner).• More effi cient and more intense use of existing commercial land (can be encouraged by market demands, potential rental returns and development potential permitted under planning controls).• Rezoning to create new commercial land.
Planning for new commercial and business zoned land must aim for a balance between spatial containment and maintaining new opportunities for growth and diversity.

Wollondilly Shire Council, Growth Management Strategy 2011 page 72
Spatial containment is needed to:
• Maximise accessibility (making it convenient for customers to visit many places in one trip).• Maintain and improve vibrancy and activity (by reducing the likelihood of long term vacancies and clustering a variety of businesses close to each other).• Encourage the most effi cient use of existing space (including multi-storey “shop top” developments).
Increased land area is needed to:
• Provide opportunities for new and expanding businesses.• Maintain a level of competition between businesses for effi ciency and consumer choice and price competitiveness;• Provide variety and diversity of services, products, facilities and jobs.
Th e balance between containment and growth of commercial and business lands must be constantly monitored and reviewed.
6.7.2 Light Industry / general industry Wollondilly has an acknowledged limited supply of light and general industrial zoned areas. Th ese lands (in Wollondilly’s case likely to be zones IN1 and IN2) provide business opportunities for enterprises such as:
• Manufacturing and processing • Trades outlets• Automotive service business• Small scale warehousing and logistics• Transport depots• Hardware, garden supplies, nurseries• Some bulky goods retailing
Although these lands can accommodate large businesses with a regional employment reach, in the case of Wollondilly many of the businesses are smaller operations which directly service the local community and which employ local residents. Th ere is therefore a strong correlation to population growth as the businesses grow in response to the growing local market. It is also important to consider that many of the Shire’s residents have the appropriate skills base which should help to grow this sector.
Although these lands are typically located on the edge of town they could be located separate to centres. However there are likely to be market feasibility issues if not located carefully, at least for those business types that have a strong economic correlation and dependency on the local population. More importantly perhaps, industrial lands which are located separate to urban centres are usually better placed to accommodate larger more noxious industrial activities which have greater potential for environmental impacts – such as noise, truck movements, visual and landscape impacts, 24 hour operation requirements etc. So it makes more sense to accommodate smaller scale local service industries adjacent or near to towns and to have larger scale heavier industry in locations which can accommodate the impacts.
Note that the Structure Plans attached to this GMS nominate some possible new locations for new or expanded industrial land in Appin, Picton, Bargo and Wilton around the F5 / Picton Road Interchange.
ge 72
irectly serviceon to population growth
to consider that many of the Shis sector.
ge of town they could be located separate to cenot located carefully, at least for those business typn the local population. More importantly perhaps,are usually better placed to accommodate larger morefor environmental impacts – such as noise, truck mov
n requirements etc. So it makes more sense to accommr near to towns and to have larger scale heavier indus
GMS nominate some possible new locations for new or expandeWilton ar

Wollondilly Shire Council, Growth Management Strategy 2011 page 73
6.7.3 Logistics / warehousing / intermodal facilities Increasing trade dependence, greater specialisation of fi rms and technological advances in distribution, storage and purchasing have led to higher demand for freight, logistics and intermodal activities. Th ese kinds of uses will continue to be attracted to large land holdings which are close to Sydney markets and which have high accessibility to major road networks and rail networks.
Parts of Wollondilly Shire have attributes particularly well suited to these kinds of uses, and already Council has seen interest in establishing these kinds of activities at Maldon and near Menangle. Th e F5 freeway corridor running through Wollondilly’s Macarthur South area is a potential location for these types of land uses, particularly given that co-located within this general corridor is the Main Southern Railway Line. Th is forms part of the broader Melbourne-Sydney Transport corridor which is the most signifi cant inter-city transport corridor in Australia. Th is corridor also has direct links to Wollongong / Port Kembla via Picton Road and also intersects with the proposed Maldon-Dombarton rail link.
It is widely known that warehousing and logistics yield relatively low job densities when compared to mixed uses e.g. manufacturing and offi ces. Th is view needs to be balanced however with the recognition that there are potentially signifi cant business multiplier eff ects arising from these activities. Having an overall effi cient and competitive logistics and freight distribution system has potentially very broad economic (as well as environmental) benefi ts for Sydney and NSW.
A signifi cant challenge for Wollondilly is that these benefi ts may not be signifi cant at the local level and will seem outweighed by local impacts, whether perceived or real. Th e most obvious impacts are those associated with increased traffi c and the adverse eff ects on landscape and rural character (given the substantial scale at which these uses operate and the bulky and stark nature of the buildings and infrastructure required).
Dealing with proposals for logistics, warehousing and intermodal facilities will therefore call on Wollondilly to be able to take a subregional (or even a metropolitan) perspective. Th is follows on from the the points made in Section 6.5.4 above regarding the need for subregional collaboration. Th is will in turn depend on there being a cohesive overarching strategy for freight and logistics so as to guide future land use decisions.
Th e NSW Government has announced that it will be releasing a Freight Strategy in mid 2010. At the time of writing this GMS, no such strategy had been released. It remains to be seen whether this Freight Strategy assists in delivering the coordinated vision advocated above.
6.8 Role of the F5 Freeway corridorIn general terms this GMS nominates the F5 freeway corridor in the Macarthur South area as a potential location for future employment lands. As noted in the section above this land is likely to be attractive to large scale logistics / warehousing / intermodal uses but also has signifi cant potential to accommodate light industrial / general industrial uses. Th e following Key Policy Direction is relevant to this corridor:
P14 Council will consider proposals for employment land developments in Macarthur South provided they:• Are environmentally acceptable• Can provide signifi cant local and/or subregional employment benefi ts • Do not potentially compromise the future orderly master planning of the Macarthur South area• Provide for the timely delivery of necessary infrastructure.• Are especially suited to the particular attributes of the Macarthur South area AND can be demonstrated as
being unsuitable or unable to be located in alternative loations cloer to established urban areas• Do not depend on the approval of any substantial new housing development proposal in order to proceed
(Employment land proposals which necesitate some limited ancillary or incidental housing may be considered on their merits)

Wollondilly Shire Council, Growth Management Strategy 2011 page 74
It needs to be understood that the lands along the corridor have diff erent capacities to accommodate employment uses given varying levels of constraints. Some sections of the corridor for example have signifi cant watercourses, vegetation and topographic issues while other sections pose challenges regarding the maintenance of landscape character and residential amenity.
Although the entire corridor is nominally shown on the Structure Plans attached to this GMS, the Wilton Interchange location has been highlighted as a potentially suitable location for future employment lands. Th e prospect of the Maldon-Dombarton Rail link completion in the future also adds to this potential.
Th ere may also be potential for other employment generating uses along this corridor such as institutional developments (particularly associated with health and tertiary education). Th e Wilton interchange location may have potential in this regard.
6.9 Other employment land types which may be proposed
6.9.1 Heavy industryWollondilly currently has two signifi cant large scale “heavy” industrial activities located at Maldon, being the Blue Circle Cement Works and the recently constructed Allied Mills Flour Mill. (Th e latter of these two uses is not “heavy” industry in the traditional sense of the word as its emissions are minimal, however it is best considered as “heavy” industry by virtue of its scale and its 24 hour operation regime). Th e lands occupied by these uses are zoned IN3 Heavy Industry under LEP 2011.
Wollondilly Council does not see Maldon as a location for further heavy industrial development. Th e location does not have the infrastructure or environmental capacity to accommodate further industrial activities at that scale. Th e draft LEP currently being progressed for expanded industrial land in the Maldon precinct therefore aims to enable light industrial activities (manufacturing, processing etc).
Wollondilly’s Economic Development Strategy and its Community Strategic Plan do not promote any vision for further heavy industrial activity in Wollondilly, nor does the previous Vision 2025 document.
Future heavy industrial uses may be proposed in other parts of Wollondilly in the future, but due to their scale and value, are more likely to dealt with under Part 3A of the EPA Act, 1979 rather than as planning proposals seeking the rezoning of land. (See section 7.7 below)
6.9.2 Business parks Business parks have the potential to generate a signifi cant number of jobs and therefore would be a desirable form of development in Wollondilly, particularly along the F5 freeway corridor. However, the market feasibility of a business park in Wollondilly is questionable at this point in time or in the near future. Th eir success relies on:
• Direct access to a large pool of professional workers.• Good access by road and public transport.• High quality buildings and offi ce accommodation in an overall high quality urban design / landscape setting.

Wollondilly Shire Council, Growth Management Strategy 2011 page 75
• High quality amenities within the business park – cafes, gyms, schools, retail stores etc• High class executive living in close proximity • Plentiful car parking• Presence of a prominent anchor tenant that creates a catalyst for head offi ces to locate to the precinct• Proximity to a commercial centre which is served by public transport and has a wider range of business services. • Competitive rents.
Some of the above attributes may able to be achieved in Wollondilly but the likelihood of this occurring would be much greater in the context of future large scale coordinated urban release within the Macarthur South area. Under that scenario a master planned approach to the location of housing, business parks, industrial lands, commercial centres and key supporting infrastructure could be achieved.
6.9.3 Agri-business parksAgri-business parks are similar in concept to an industrial area in that they are usually located away from or outside residential areas and are normally provided with good transportation access, including road and rail. Agri-business parks would allow for intensive agricultural enterprises to operate in closed environments, and can be mixed with other agricultural enterprises or light industrial uses. By providing economies of agglomeration individual businesses benefi t through shared infrastructure, support services such as waste management, processing and marketing. Agri-business parks do not require good agricultural land given the use of intensive large scale green house systems and so could occur in industrial zones.
Australia does not currently have any agri-business parks, however there is a proposal for one in Devonport, Tasmania known as “Produce from Heaven”. Th is proposal - the fi rst of its kind in Australia - will combine producers and the private sector and provide shared offi ce facilities, commercial test kitchens and packing facilities. Th ere are many international examples of agri-business parks including in the Netherlands, Singapore and China.
Th e F5 freeway corridor may have future potential for these kinds of uses, particularly as Sydney grows and looks more seriously towards sustainable and effi cient food production and general food security issues. Ongoing climate change, new policy approaches to food production and transportation, and rising energy costs may make these kinds of uses viable in the future.
6.9.4 Bulky goods retailing A small amount of bulky goods retailing currently occurs out of the industrial zoned area in South Picton (Henry Street / Bridge Street Precinct). Because this retailing remains fairly limited in scale there is currently no evidence of it displacing industrial activities, dominating the industrial zone or competing with nearby town centres. Th ese issues however could arise if such retailing expanded signifi cantly.
Stand-alone bulky goods retailing centres have become part of the retail landscape in urban areas. It is unlikely that such proposals would be viable or suitable in the Wollondilly Shire as they would need to be closer to the markets of Campbelltown, Camden and the South West Growth Sector.

Wollondilly Shire Council, Growth Management Strategy 2011 page 76
6.9.5 Initiatives and Strategies to promote agriculture Wollondilly Council is committed to maintaining and further developing agricultural industry and through its Rural Industry Liaison Committee will be pursuing the following initiatives:
• Developing a specifi c Agricultural Industry Development Strategy, the aim of which will be to attract and develop rural industry.
• Working with key stakeholder groups to attract and develop rural industry.
• Investigating the potential for agri-business parks (as discussed above).
• Investigating the potential for agricultural industry “clusters”.
• Promotion of best-practice modern sustainable farming techniques and agricultural uses of rural land.
• Continuing to ensure that Wollondilly’s planning instruments and development control plans support and encourage the retention and development of rural industries and agri-tourism.
• Continuing to promote local food production as a positive step towards planning for climate change and food security to support a growing population in the Sydney Basin.

Wollondilly Shire Council, Growth Management Strategy 2011 page 77
Chapter 7 -
ImplementationTh e aim of this chapter is:To outline how to use and interpret this document.To explain how the concepts and directions for growth are to be implemented and to explain the NSW planning system as it relates to the rezoning of land.
7.1 A quick guide to using and interpreting this documentTh e key features of this document to be understood are:
Th e Key Policy Directions (See section 1.6)Th e Housing Target Distribution Table (See Section 5.3)Th e Structure Plans (See Section 7.2 and Appendix 2)Th e Assessment Criteria (See section 7.3 and Appendix 1)
7.2 What the Structure Plans showTh e Structure Plans attached to this GMS in Appendix 2 show a range of locations where residential and employment growth can be expected to occur or where it has the potential to occur.
7.2.1 Residential mappingTh e Structure Plans show a range of residential growth locations:
Low density residential areas (developed)Th ese areas correspond to those parts of the R2 Low Density Residential and the R5 Large Lot Residential zones in Wollondilly’s LEP 2011 that have already substantially been developed for low density housing. Nevertheless these area need to be shown as they do have capacity to accommodate additional dwellings through infi ll, subdivisions, dual occupancies, secondary dwellings and seniors living developments. Some of these housing forms are dependent on the advent of reticulated sewerage.

Wollondilly Shire Council, Growth Management Strategy 2011 page 78
Low density residential areas (undeveloped) Th ese areas correspond to signifi cant areas within the R2 Low Density Residential zone in Wollondilly’s LEP 2011 that are yet to be developed. Th ese areas are essentially large land holdings which are already zoned to permit residential development but which are still not fully developed.
Medium density residential areas Th ese areas correspond to the R3 Medium Density Residential zone in Wollondilly’s LEP 2011. Th is zone permits multi-dwelling housing (villas, townhouses etc), seniors living developments and residential fl at buildings. Currently low density housing predominates in these areas. Th e take-up rates for new medium density housing in these areas is diffi cult to forecast and will depend largely on there being future improvements in the market for medium density housing. So these areas are expected to see a gradual transition to a greater number of medium density developments. It should be noted that the extent of these areas is greater than the extent of land identifi ed under Development Control Plan 50 for medium density housing.
Draft residential rezoningsTh ese areas correspond to those parts of the Shire where Council has formally resolved to prepare a draft LEP for residential rezoning. Th e specifi c housing outcome for those lands is not yet fi nalised but will emerge as the rezoning progresses.
Potential residential growth areasTh ese areas have been identifi ed through previous endorsed strategies or through more recent preliminary fi eld work and desktop analysis. Th ey have potential to provide growth opportunities while meeting:
– GMS Assessment Criteria (See Appendix 1) – GMS Key Policy Directions (See Section 1.6)
Note 1: Th ese lands are not yet zoned so as to permit substantial residential development so will require a “Planning Proposal” to be submitted to Council for consideration. (See Section 7.5 for information on “Planning Proposals”).
Note 2: Th e inclusion of these lands in the GMS does not in any way commit Council to supporting a planning proposal on those lands as that can only be determined following more detailed analysis through the rezoning assessment process.
Note 3: Th ese lands in some cases are mapped with a defi nitive boundary (which may be based on a logical physical limit (e.g. a main road) or the fi ndings of an endorsed strategy). However in most cases these areas are shown using a conceptual graphical representation which does not specifi cally defi ne the extent of the area. Th is is because the actual extent of developable land and the capacity and appropriate scale of development in any of those proposed locations is a matter which can only be determined with more detailed analysis through the rezoning assessment process.
Land not specifi cally identifi edTh ere may be lands in the Shire which are not specifi cally mapped or identifi ed in this GMS which may have the potential to meet the Key Policy Directions and Assessment Criteria for residential development. Council may consider proposals on such lands if applicants submit “Planning Proposals” which demonstrate that they can satisfy those matters. (See Section 7.5 for more information on “Planning Proposals”).
Other forms of residential growth not captured on the Structure PlansAcross the Shire there will continue to be residential growth occurring through such things as the ongoing (albeit diminishing) take-up of historical subdivision and dwelling entitlements and through approvals not yet commenced or not yet completed.

Wollondilly Shire Council, Growth Management Strategy 2011 page 79
7.2.2 Employment land mappingTh e Structure Plans attached to this GMS in Appendix 2 show a range of locations where employment growth can be expected to occur or where it has the potential to occur.
Business zone areasTh ese areas correspond to the B1 Neighbourhood Centre, B2 Local Centre and B4 Mixed Use zones in Wollondilly’s LEP 2011. Th ese locations are the commercial centres of our settlements and have capacity to provide a range of employment in the retail, hospitality, professional services, government and commercial sectors. As our population grows we can expect further business development and jobs growth in these areas. It should be noted that the extent of these areas is greater than the extent of business zoned land under Local Environmental Plan 1991.
Industrial zone areas Th ese areas correspond to the IN2 Light Industrial and IN3 Heavy Industrial zones in Wollondilly’s LEP 2011. Th ese areas are essentially existing industrially zoned areas – most are either fully developed or close to full development but they do provide some limited opportunities for further employment growth.
Draft industrial rezoningsTh ese areas correspond to those parts of the Shire where Council has formally resolved to prepare a draft LEP for industrial rezoning. Th e specifi c industrial land use outcome for those lands is not yet fi nalised but will emerge as the rezoning progresses.
Potential employment areasTh ese areas have been identifi ed through previous endorsed strategies or through more recent preliminary fi eld work and desktop analysis. Th ey have potential to provide growth opportunities while meeting:
– GMS Assessment Criteria (See Appendix 1) – GMS Key Policy Directions (See Section 1.6)
Note 1: Th ese lands are not yet zoned so as to permit employment land development so will require a “Planning Proposal” to be submitted to Council for consideration. (See Section 7.5 for information on “Planning Proposals”).
Note 2: Th e inclusion of these lands in the GMS does not in any way commit Council to supporting a planning proposal on those lands as that can only be determined following more detailed analysis through the rezoning assessment process.
Note 3: Th ese lands in some cases are mapped with a defi nitive boundary (which may be based on a logical defi nitive physical limit (e.g. a main road) or the fi ndings of an endorsed strategy). However in most cases these areas are shown using a conceptual graphical representation which does not specifi cally defi ne the extent of the area. Th is is because the actual extent of developable land and the capacity and appropriate scale of development in any of those proposed locations is a matter which can only be determined with more detailed analysis through the rezoning assessment process.
Land not specifi cally identifi edTh ere may be lands in the Shire which are not specifi cally mapped or identifi ed in this GMS which may have the potential to meet the Key Policy Directions and Assessment Criteria for employment development. Council will consider proposals on such lands if applicants submit “Planning Proposals” which demonstrate that they can satisfy those matters. (see Section 7.5 below for more information on “Planning Proposals”).
Wollondilly Shire Council, Growth Management Strategy 2011 page 80
Other forms of employment growth not captured on the Structure PlansTh ere are employment sectors which do not necessarily rely on specifi c industrial/business land to operate / develop. In Wollondilly’s case this would include such things as mining, agriculture, sport/recreation, some tourism uses, home-based businesses etc. Th ese uses are still controlled to diff ering extents through zoning and other land use controls, but their lack of direct correlation to industrial / business land means they can not be specifi cally included in the Structure Plans.
7.3 Assessment CriteriaAppendix 1 to this GMS contains a set of Assessment Criteria for a range of diff erent development types, both residential and employment proposals. Th ese criteria operate as check lists to ensure that each type of development meets its identifi ed requirements.
Th ere are a range of issues and legislation that apply universally to all proposals irrespective of the nature of the proposal or where it is located.
Th ere is then a set of criteria more specifi c to diff erent types of development.
Applicants proposing to lodge a planning proposal must address all the relevant matters contained in these Assessment Criteria and must be able to show that their proposal satisfi es all matters.
7.4 Local Environmental PlansUnder the Environmental Planning and Assessment Act, 1979 land is zoned under Local Environmental Plans (LEPs). Th ese LEPs are legal instruments that impose standards to control development. Th ey are a means to implement strategies and generally comprise a written document and accompanying maps. LEPs cover matters such as:
• the zoning of land• the specifi c land uses which can or can’t be carried out within each zone• reservation of land for public purposes such as parks and roads• protection of trees and environmentally sensitive areas• subdivision controls and minimum lot sizes• controls on building heights• controls on listed heritage items and conservation areas • a range of other specifi c controls on development
In Febraury 2011 Wollondilly Local Environmental Plan 2011 was gazetted.
Structure Ppecifi c industrial/business land to operate /mining, agriculture, sport/recreation, someed to diff erial / bus
of diff erent development types,ts to ensure that each type of
ctive of the nature of

Wollondilly Shire Council, Growth Management Strategy 2011 page 81
Th is new plan was prepared in response to State government legislation requiring all NSW councils to prepare a new principal LEP in line with a new standardised LEP Template (the “Standard Instrument”). Th e process has largely been a transfer of Council’s 1991 LEP across to the new system.
Future growth proposals that necessitate rezoning, whether they are for employment lands or housing, will need to be prepared as amending LEPs (which in eff ect become amendments to the principal LEP 2011). Applications for such amendments were previously known as “rezoning applications” but are now known as “planning proposals” as discussed below.
7.5 Planning Proposals and the “Gateway” Plan-making ProcessIn July 2009, the NSW Government changed the way that local environmental plans (LEPs) are developed and approved. Th is system is known as the “gateway” plan-making process. Th e State Government’s aim is that this new system will streamline the planning process with regard to the rezoning of land.
Th e information presented in this section has been taken from the Department of Planning’s 2009 publication A Guide to Preparing Local Environmental Plans.
7.5.1 Lodging a Planning ProposalTo begin the process of amending the Local Environmental Plan it is necessary to prepare a planning proposal which is an application submitted to Council who in most cases will be the “relevant planning authority” (RPA). Th e RPA is the authority having responsibility for carrying out the rezoning process. Th e planning proposal can be prepared by the RPA or by a proponent for the proposed LEP. In either event the RPA is ultimately responsible for the planning proposal and must be satisfi ed with it such that it is prepared to forward it to the Minister for the “Gateway Determination”.
Note also that the Minister for Planning can nominate others to be the RPA under some circumstances, particularly if the plan is of State or regional environmental signifi cance. In such cases the Minister can nominate:
• Th e Director General of the Department of Planning; or a• Joint Regional Planning Panel.
A planning proposal must contain a range of information as specifi ed in Section 55 of the EPA Act, 1979. Th is information must include:
• A statement of objectives and intended outcomes of the proposal• An explanation of the provisions of the proposed LEP.• A justifi cation of the objectives and outcomes, including how this is to be implemented. (In Wollondilly’s case this will need to include a justifi cation of how the proposal is consistent with this GMS – this comes under the EPA Act’s reference to the planning proposal needing to be consistent with the relevant “strategic planning framework”).• Maps containing appropriate detail are to submitted, including land use zones, heritage areas, fl ood prone areas and other such details• Details of the community consultation that will be undertaken.
For more detailed information on the requirements for lodging a Planning Proposal, and on the new local plan making process overall, visit the Department of Planning website www.planning.nsw.gov.au and click on local plan making.

Wollondilly Shire Council, Growth Management Strategy 2011 page 82
7.5.2 Fees for lodging a Planning ProposalCouncil’s adopted Fees and Charges Schedule for 2010/2011 specifi es an application fee of $16,480 for a major planning proposal and $10,918 for a minor planning proposal. Note that this fee is just the initial application fee to cover Council’s costs in undertaking initial community consultation, assessing the application and preparing a report to Council. Th e fee does not include a range of more signifi cant costs that may arise as a result of specialist environmental studies being required as the planning proposal goes forward. Th ese are discussed below in section 7.5.8.
7.5.3 Need for precinct-wide approachIt is important to ensure that planning occurs at an appropriately broad scale and avoids ad-hoc incremental decision-making focused on small parcels of land. For this reason planning proposals should ideally be based on large precincts. Often this will necessitate the coordination and inclusion of a number of allotments and landowners. Th is approach is not only more likely to achieve more effi cient and cost eff ective planning processes, but assists in the provision and coordination of infrastructure and the management of environmental issues and impacts. Potential proponents of planning proposals are advised to discuss options for precinct planning with the Strategic Planning Section of Council prior to formulating their proposals.
7.5.4 Initial Community ConsultationAfter a planning proposal is received by Council, adjoining and nearby neighbours will be notifi ed for a 28 day period. Any submissions received will be considered in the assessment of the proposal. Th is consultation stage is not a legislative requirement under the new local plan making system as that system involves only one community consultation stage further into the process (see section 7.5.10 below).
Council, however, has had a policy of initial community notifi cation for a number of years in relation to rezoning applications and intends to continue this approach. Th e view of the community can provide valuable up-front input on whether or not a planning proposal has merit.
7.5.5 Initial Determination by CouncilPlanning proposals will be assessed against the matters contained in this GMS and a range of matters required to be considered under the EPA Act, 1979 and as determined by guidelines issued by the Department of Planning. A report will then be presented to Council making a recommendation regarding whether or not the planning proposal should be supported. It is important to understand that this is only an initial decision to commence the process and to forward the planning proposal to the Minister for the “Gateway Determination”.
According to the Department of Planning’s information on the new local plan making system, when a planning proposal has been assessed and endorsed by Council it eff ectively becomes Council’s planning proposal.
Wollondilly Shire Council, Growth Management Strategy 2011 page 83
7.5.6 Th e “Gateway” DeterminationTh e planning proposal is then forwarded to the Minister for Planning for review under the gateway process. Th e purpose of the gateway determination is to ensure there is suffi cient justifi cation early in the process to proceed with a planning proposal and to determine the ongoing information and assessment requirements. Th is allows a planning proposal to be reviewed at an early stage by key government agencies in order to make a decision as to whether to proceed further. It enables planning proposals that are not credible to be stopped early in the process before resources are committed to fruitless studies and investigations, and before State and Commonwealth agencies are asked to commit their own resources to carrying out assessments.
After reviewing a proposal, the Minister for Planning will determine:
• Whether the proposal should proceed, with or without variation, or whether it should be re- submitted (including for further studies or other information, or for the revision of the planning proposal).• Th e level of community consultation required.• Any necessary input from State and Commonwealth authorities.• Any studies required to be undertaken.• Th e necessity for a public hearing by the Planning Assessment Commission or other body.• Th e appropriate timeframes for the various stages of the proposal.
7.5.7 Consultation with Government AgenciesTh e gateway determination will identify any consultation required with government agencies and the RPA is responsible for undertaking that consultation. Following the consultation the RPA may need to amend the planning proposal to satisfy any concerns from agencies. If this occurs the RPA may need to seek a revised gateway determination and further community consultation may be required.
7.5.8 Environmental Studies Planning proposals for the rezoning of land will in many cases require a range of specialist studies to justify the proposal and to provide assessment on a range of critical environmental issues. Th is is particularly the case with major proposals for new employment lands or housing areas. In some cases applicants will choose to prepare these specialist studies up-front as part of the justifi cation, but often the studies will be undertaken as the proposal progresses past the gateway determination. Th ese studies may cover such matters as:
• Traffi c assessment• Aboriginal and European heritage assessment• Flora and fauna assessment• Water quality and sewerage issues• Community infrastructure
7.5.9 Director-General’s Approval before Community ConsultationTh e Director-General of Planning must approve the form of planning proposals, as revised to comply with the gateway determination, before they are placed on exhibition
mmunit

Wollondilly Shire Council, Growth Management Strategy 2011 page 84
7.5.10 Formal Community Consultation Before a local environmental plan is made, the relevant planning authority must meet the community consultation requirements set out in the gateway decision. Th e guidelines underpinning the new process stipulate at least 28 days exhibition for a major plan and 14 days for “low impact proposals”. Low impact proposals are those proposals which:
• Are consistent with the surrounding land use and zoning pattern.• Are consistent with the relevant strategic planning framework.• Present no issues regarding infrastructure servicing.• Are not a principal LEP.• Do not reclassify land public land.
During exhibition:
• Any person can make a submission concerning the proposed plan• A public hearing can be arranged, and a report prepared and made public.
7.5.11 Council’s fi nal determinationTh e consultation period will not be deemed to have been completed until the relevant planning authority has considered all submissions and reports from any public hearings. In eff ect this means that Council as the RPA will need to formally consider the planning proposal after the completion of the exhibition. As a result of the submissions Council may either:
• Endorse the planning proposal in its current form • Vary the planning proposal which may require further gateway determination • Request that the Minister discontinue the planning proposal
7.5.12 Legal Drafting of the LEPIf Council endorses the planning proposal the next step is to send it to the Department of Planning for the drafting of the legal planning instrument. Th is drafting is undertaken by Parliamentary Counsel upon receipt of instructions by the Department.
7.5.13 Making of a Local PlanFollowing these processes, the Minister for Planning can decide to make a local environmental plan come into force. Th e Minister may:
• Make the plan in full put forward by the relevant planning authority• Vary the plan• Decide not to proceed with the plan• Defer certain matters in the proposed plan Once a decision is made to make an LEP, the decision is given eff ect by publishing the LEP (including maps) on the NSW Legislation website.
local environment
g authority
eff ect by publishing the LEP (including m

Wollondilly Shire Council, Growth Management Strategy 2011 page 85
7.6 Rezoning applications currently with CouncilWhen the GMS project was commenced Council resolved to put a number of current rezoning proposals on hold pending the fi nalisation of the GMS. While work on the GMS has progressed Council has also received further applications, either as “rezoning proposals” under the old system or as “planning proposals” under the new system.
Upon fi nalisation of the GMS, Council will need to undertake an assessment of these applications. Th ose that were submitted as a rezoning application will need to be resubmitted in a revised format as “planning proposals” to comply with the new local plan making system outlined above.
Th e process for dealing with all planning proposals will be as outlined above and in accordance with the relevant legislative requirements and guidelines issued by the Department of Planning.
7.7 Part 3A of the EPA Act, 1979A particular development may be declared a major project to be assessed under Part 3A of the Environmental Planning and Assessment Act, 1979. Th e Minister for Planning’s approval is required for these projects and they are ordinarily assessed by the Department of Planning.
Major projects are identifi ed either in:
• State Environmental Planning Policy (Major Development) 2005 (Major Development SEPP),or• an order by the Minister for Planning published in the NSW Government Gazette
Schedule 1 of the Major Development SEPP describes the types (also known as classes) of development that may be declared a Part 3A project and sets thresholds (such as a total capital investment value or the number of operational employees) before a proposal may be considered a major project.Schedules 2 and 3 of the Major Development SEPP list the types of developments that are considered projects under Part 3A of the EP&A Act because of where they are located.
Section 75B(1) of the EPA Act allows the Minister to declare, by way of an order published in the NSW Government Gazette, that the carrying out of a particular development is a Part 3A project. Th e Minister has to be satisfi ed that the development is of State or regional environmental planning signifi cance before making such an order.
Any development that is declared to be a major project under Part 3A of the Act may also be declared a critical infrastructure project if, in the opinion of the Minister, the development is essential for the State for economic, environmental or social reasons. Th e same assessment process applies to critical infrastructure projects as for other major projects.
For further information on Part 3A matters visit the Department of Planning website www.planning.nsw.gov.au

Wollondilly Shire Council, Growth Management Strategy 2011 page 86
7.7.1 Council’s role in Part 3A mattersCouncil has a very limited role in Part 3A as we neither assess nor determine the application. Council’s input is usually confi ned to being given the opportunity to comment on the proposal as a key stakeholder. If a Part 3A matter necessitates the rezoning of land Council may be instructed by the Minister to prepare a planning proposal.
Th e signifi cance of Part 3A to this GMS is that there may be certain major proposals that go forward with limited reference to this GMS and with limited opportunity for local Council and local community input.
7.8 Future Review of this GMSAlthough the GMS has a long-term horizon to 2036, it is clearly not intended to be an unchanging document over that period. Th ere will need to be periodic reviews of its direction and content, particularly regarding likely changes in overall context which will need to be monitored and considered. Th ere are a range of matters which are dynamic and may trigger the need for review, such as:
• Population growth rates• Economic circumstances• State Government planning policy• Local planning policy • Climate change issues• Housing market issues• Dwelling / lot production rates• Employment land demands and take-up rates• Infrastructure provision issues
7.9 Other ways in which this GMS will be usedTh e primary purpose of the GMS is to be a tool to sift through and assess planning proposals that come to Council. However, having a long-term strategic view on how the Shire is to grow will be useful to Council on a range of other matters.
• Th e GMS will assist Council in planning its own strategies and setting priorities regarding service delivery and infrastructure provision. Th is is critical to the new Integrated Planning and Reporting Framework.• By outlining clear policy directions on growth issues we will be able to use the GMS to assist in advocating and lobbying for State government infrastructure upgrades and service delivery improvements. • Th e GMS will be available as a resource to assist other agencies and service providers in their future planning.• Th e GMS provides some overarching guidance on how to achieve a long-term sound and sustainable approach to future development.• Th e GMS will assist in the preparation of future development contributions plans.• Th e GMS can assist in promoting economic development as it provides useful forecast information and assumptions for business and enterprises. • Th e GMS will be available as a resource for students, community groups, and members of the public generally.

Wollondilly Shire Council, Growth Management Strategy 2011 page 87
App endix 1
Assesment criteriaTh is Growth Management Strategy (GMS) provides the framework for the future development of land to achieve sustainable and socially responsible housing and employment. Th is appendix provides Assessment criteria which aim to achieve the Key Policy Directions of the GMS.
Th e Assessment Criteria will apply to any planning proposal which seeks to develop land for residential and employment uses as outlined in the GMS. All planning proposals will need to address and be consistent with these criteria.
Proponents of planning proposals are required to follow the ‘Gateway’ planning process as legislated in the EP&A Act 1979 and details of this can be found at the Department of Planning web site.
Part 1: Generic Assessment Criteria
Th e assessment criteria in Part 1 are to be met by all planning proposals.
State and Regional Strategies and Policies
Document / Policy / Concept Criteria
NSW State Plan, Metropolitan StrategySub-Regional Strategy
Meets objectives, sustainability criteria and directions within these documents
State Planning Policies Consistent with relevant State Environmental Planning Policies (SEPPs)
Ministerial Directions Consistent with relevant Ministerial Directions (s.117 Directions)
LEP Framework Zones and objectives in accordance with the Standard Planning Instrument LEP 2011
Local Strategies and Policies
Document / Policy / Concept Criteria
Key Policy Directions in the GMS
Planning proposals must demonstrate that they are consistent with all relevant Key Policy Directions of the GMS
Precinct Planning
Planning proposals should be based on precincts containing a number of allotments which when considered as a whole will achieve the effi cient and cost eff ective provision of infrastructure while creating minimal environmental impacts. Potential proponents of planning proposals are advised to discuss options for precinct planning with the Strategic Planning Section of Council prior to formulating their proposals.
Wollondilly Community Strategic Plan
Wollondilly Community Strategic Plan 2030 – Growing Your Future details a range of criteria considered important for ensuring future growth and development in the Shire. Th is plan relates directly to the particular social, environmental and economic characteristics of the Shire and aims to ensure development is undertaken in a sustainable manner. Planning Proposals should meet the relevant objectives outlined in this plan.

Wollondilly Shire Council, Growth Management Strategy 2011 page 88
Project Objectives and Justifi cation
Overall ObjectiveTh e planning proposal needs to include statements explaining:
- what is planned to be achieved by the Proposal; and- why a Planning Proposal is the mechanism necessary to achieve the objectives
Strategic ContextIs the Proposal the result of a strategic study or report endorsed by the Department of Planning and / or Wollondilly Council?
If so, identify the study / strategy and explain how the Planning Proposal is in accordance with that study / strategy.
Net Community Benefi t?Demonstrate the potential for net community benefi t (see Department of Planning Guidelines for a Net Community Benefi t Test in the Draft Centres Policy)
Summary of Likely ImpactsWhat are the likely impacts to:
- the environment;- the community (both the existing community and the potential new community members resulting from
the proposal);- the economy
How are these impacts proposed to be avoided, mitigated managed and / or rehabilitated?
Infrastructure and ServicesIdentify the type, capacity and quality / reliability of infrastructure and services:
(i) currently available(ii) scheduled to be available (must be confi rmed in writing from service providers)(iii) needed to be available to support the proposal when operational.
Supply and Demand AnalysisA proposal shall be accompanied by an analysis of land supply and demand at both local and regional scales. Th e analysis must be prepared by a suitably qualifi ed and experienced analyst and shall include independently verifi able references and sources of data used to prepare the report. Th e report shall include short and long term market analysis, rental availability, vacancy rates, turn over rates, duration of sale periods and population changes.
Site suitability / attributesA proposal shall demonstrate using independently verifi able evidence that the site selected is the best available site to accommodate the proposed use in a local and regional context. Reasons may include, but not be limited to; consolidated site area, access advantages, utilities and other infrastructure available, fewer constraints, potential for linkages and integration with other land uses to a mutually benefi cial outcome

Wollondilly Shire Council, Growth Management Strategy 2011 page 89
Preserving Rural Land and Character
Character and SettingA proposal must demonstrate how it will contribute to maintaining rural character, including how it will be consistent with the defi nition of Rural Living contained in this GMS
Visual attributesA proposal must create or maintain visual catchment boundaries which defi ne the rural-urban interface.
A proposal must maintain rural landscape character.
A proposal must ensure future development is located and able to be designed so as to not impact on visually sensitive ridgelines or areas of topographical or visual signifi cance or signifi cant view corridors.
A proposal must ensure that it will have a minimal impact on riverine scenic quality.
Rural and Resource LandsWhere relevant proposals should include an assessment of the potential viability of agricultural use of the land in accordance with recognised guidelines (such as Department of Agriculture Site Suitability Assessments).
Th is assessment needs to demonstrate that the site can not reasonably be considered suitable as a viable agricultural holding (neither presently nor in the future)
Proposals need to demonstrate that the future use of the land as proposed will not eliminate or restrict opportunities for continued or new agricultural uses on adjoining and nearby land
Environmental Sustainability
Protection and conservationProposals should demonstrate how future development shall allow for the protection of threatened species, populations or ecological communities and their habitats.
Proposals should not require the removal of signifi cant tracts of remnant vegetation and should enable the retention and conservation of environmentally signifi cant land and riparian lands.
Th e protection, rehabilitation and management of environmentally signifi cant lands and riparian lands should not negatively impact on the ownership, care, control and management responsibilities of Council in the short or long term.
Water Quality and QuantityProposals should provide buff er zones to protect watercourses and provide riparian lands setbacks.
Proposals should ensure that any future development in the drinking water catchment can meet the neutral or benefi cial eff ect on water quality (NorBE) test, consistent with the Drinking Water Catchments State Environmental Planning Policy.
Proposals must give consideration to Sydney Catchment Authority’s Strategic Land and Water Capability Assessments (SLWCA) to avoid risk to water quality.
Proposals must demonstrate future development will protect groundwater resources and groundwater dependent ecosystems.
Proposals should include statements outlining:- Demand for water to the site- commitments to collect water on site- commitments to reuse water on site- Production of wastewater and its treatment and disposal methods.
Proposals must note lead to proliferation of basic Landholder Rights along the frontage of waterways or over any vulnerable aquifers.

Wollondilly Shire Council, Growth Management Strategy 2011 page 90
Flood HazardProposals must demonstrate that the land to be developed is located outside of an area potentially aff ected by fl ooding in the event of a 1% AEP event or is on land where fl ood hazard can be managed and mitigated to acceptable standards.
Geotechnical/Resources/SubsidenceLand to be developed must not be located in an area of low or medium risk of slope instability.
Planning proposals should not sterilise access to coal resources or access to existing infrastructure associated with approved mining uses and this must be verifi ed in writing from the appropriate government authority.
Planning proposals should indicate whether the land is located outside of a Mine Subsidence area or whether coal resources have been extracted and the impacts of subsidence completed.
Buff ers and Spatial SeparationAdequate buff ers shall be provided within the site to achieve separation between the proposed uses and any adjacent incompatible development as required.
Proposals should provide buff er zones to protect watercourses and provide riparian lands setbacks as required.
Bushfi re HazardWhere the site is identifi ed as Bushfi re Prone land in Council’s records the planning proposal should be able to provide appropriate protection and evacuation measures, including Asset Protection Zones and perimeter roads to avoid risk to human life.
All bush fi re hazard reduction measures and Asset Protection Zones shall be contained within the site.
Asset Protection Zones and other measures for bushfi re hazard management must be located outside areas identifi ed as environmentally sensitive land including habitat and riparian areas to mitigate impact on ecological functioning.
Heritage Proposals must demonstrate no detrimental impacts to any item or place of Aboriginal or archaeological signifi cance or on any heritage item or heritage conservation area.
Resource SustainabilityProposals should demonstrate commitment to maximising opportunities for energy effi ciency, water recycling and reuse and waste minimisation
Infrastructure
Effi cient Use and Provision of Infrastructure Proposals for urban land uses (industrial, commercial, residential) shall demonstrate a commitment to the minimum provisions (where appropriate) of:- electricity- reticulated water- reticulated sewer- telephone services- optic fi bre- public roads integrated with the existing public road network- kerb and gutter and stormwater management infrastructure- footpaths suitable for pedestrian use- shared pathways compatible with an adopted Council strategy- street lighting to Australian Standards- public open space in accordance with best practice design guidelines and adopted strategies- bus stops- street trees- contributions towards community services and facilities as may be required by an adopted strategy and works
schedules
rate a commitment to the mini
s and ad
quired by an

Wollondilly Shire Council, Growth Management Strategy 2011 page 91
Transport, Roads and AccessProposals must demonstrate (where possible) a commitment to improving access and movement opportunities to and through the site by means other than private cars.
Proposals must demonstrate a commitment to ensuring the local road network is capable of catering for future development in terms of road capacity, traffi c management and safety.
Proposals shall allow for the acquisition, dedication and/or construction of future local or regional road links as identifi ed in state or local environmental planning instruments.
Proposals should minimise new vehicle access points directly to a major regional or arterial road.
Open SpaceProposals should identify opportunities within the site for creating a variety of types of public open space and / or improving the quality of public open space in the locality.
Provision and design standards for public open space shall be demonstrated to be consistent with best practice guidelines and adopted strategies and plans.
Proposals should include provision of access connections to existing or planned shared pathways.
Part 2: Employment and Commercial Lands
Th e assessment criteria in Part 2 are to be met by all planning proposals for commercial and employment lands as applicable.
Regional and Local Dynamics
Proposals shall be accompanied by an analysis of the dynamics of employment and commercial lands at both local and regional scales. Th e analysis must address the existing dynamics and proposed dynamics (predicted as a result of the proposal and any other proposals that have been applied for or approved but not yet constructed) and must demonstrate that the proposal has the potential to result in an improvement to the function and interrelationships of land uses and associated activities.
Proposals must maintain the Shire’s hierarchy of towns and villages.
Proposals should include information shall be submitted which demonstrates that the proposal has the potential to enhance the viability and vibrancy of existing towns and villages as well as reinforcing and contributing to the existing and desired future character of towns and villages.
Location and Area
Th e planning proposal must be compatible with existing zoned employment and commercial land and result (where possible) in clustering and creating consolidated areas of employment and commercial lands. Th e planning proposal must demonstrate how the new site will be integrated with adjacent lands and provide opportunity for eff ective links to existing employment and commercial lands and other land uses (particularly town and village centres and public open spaces) and make effi cient use of existing and / or new infrastructure, services and facilities.
Th e site shall be of suffi cient area to accommodate a range of land uses and lot sizes, the provision of public roads, pathways and public open space and other features including buff ers / setbacks.

Wollondilly Shire Council, Growth Management Strategy 2011 page 92
Employment Considerations
Th e proposal should demonstrate a net long term positive contribution to local and/or regional employment opportunities.
Th e proposal should result in diversifi cation and expansion of Wollondilly’s economy through the provision of a broader range of industries and businesses. Information regarding the likely potential new uses in comparison to the existing range of uses in the local area should be submitted with the proposal.
Transport, Roads and Access
Road access to the site shall minimise the need for business-related traffi c to travel through residential areas.
Slope / Topography
Th e land to be rezoned shall generally have a slope of less than 1 in 10 to be considered suitable for industrial development.
Amenity and Air Quality
Th e planning proposal should allow for the appropriate siting of industrial and commercial development having regard to maintaining or improving air quality levels when considering local wind and climatic condition and the cumulative impacts of clustering industrial and commercial land uses.
Adequate separation shall be provided between future commercial and industrial uses and adjacent land uses to protect amenity
Additional Criteria for Specifi c Land Uses
Business / commercialShould be located in towns and villages in practical walking distance to residential areas.
Proposals should not aff ect the shire’s existing hierarchy of towns and villages.
Proposals should be Integrated with the existing structure and layout of existing towns and villages.
Proposals should reinforce and contribute to the existing and the desired future character and identity of the town or village in which the site is located.
Proposals should demonstrate a commitment to achieving high quality urban design principles and positive changes to adjoining and nearby public spaces and amenities.
Proposals should improve the function and safety of movement networks for customers, staff , deliveries and service vehicles using a variety of modes of transport and movement.
Light Service Industry
Should be located near existing towns and villages.
Should preferable adjoin or be near existing light service industry centres.
Potential for clustering of compatible industries and businesses.
Proposals should ensure good accessibility for customers and suppliers by a variety of means of transport.
omers, staff , deliveries and ser
y a var

Wollondilly Shire Council, Growth Management Strategy 2011 page 93
Heavy Industry
To be considered on a case by case basis.
Preferably located near other heavy industries if compatible.
Potential for attracting and clustering of compatible / linked industries and businesses.
Proposals should ensure good accessibility for customers and suppliers by a variety of means of transport.
Transport Logistics
Should be located along the freeway / Hume Highway and/or Southern Railway corridor
Tourism – Motels, Hotels and Serviced Apartments
Should be located within practical walking distance of town or village centres
Part 3: Residential lands
Th e assessment criteria in Part 3 are to be met by all planning proposals for residential lands as applicable.
Location / Area / Type
Planning proposals should be consistent with land identifi ed under the relevant LEP or the GMS for rural-residential, medium density development or town edge development.
Th e planning proposal shall demonstrate how the new site will be integrated with adjacent lands and provide opportunity for eff ective links to other land uses (particularly town and village centres and public open spaces) and make effi cient use of existing and / or new infrastructure , services and facilities
Th e site shall be of suffi cient area to accommodate a range of lot sizes, the provision of public roads, pathways and public open space and other features including buff ers / setbacks.
Social Integration
Gated communities are not acceptable in Wollondilly Shire.
Th e proposal shall commit to achieving a variety of housing forms to increase the potential for a mix of household types and diversity amongst residents.
Emphasis shall be placed on providing high quality public spaces within the site (such as streets, pathways, footpaths and open space) to provide attractive places for people to use and opportunities for informal social interaction.

Wollondilly Shire Council, Growth Management Strategy 2011 page 94
Additional Criteria for Specifi c Land Uses
Rural ResidentialTh e site shall be contiguous to the town edge.
Th e furthest parts of the site should be located within approx. 2 km of the nearest existing town or village centre.
Th e proposal should create and maintain a distinct town edge setting and an eff ective interface between urban and rural land.
Th e proposal should include a total water cycle management plan including concept details of on-site sewage management and stormwater management integrated with the natural catchment.
Th e proposal must preserve the separation between urban areas.
Th e proposal must preserve rural character (“look and feel”).
Rural residential lots are expected to be mixed with “urban on town edge” developments to broaden housing mix and aff ordability and achieve overall effi cient residential densities.
Th e subdivision should not lead to proliferation of Basic Landholder Rights along the frontage of waterways or over any vulnerable aquifers.
Th e proposal shall be serviced by reticulated town water or it should demonstrate that it has an adequate and self suffi cient water supply without having to pump it from streams.
Urban on Town EdgeTh e site shall be contiguous to existing urban land.
Th e site should be located within practical walking distance of existing town, village or neighbourhood centre.
Th e proposal needs to demonstrate that residential use of the land is the most suitable use of the land within the context of land uses in the area.
Th e proposal should achieve physical and visual integration with the existing edge of town Proposals should includes a mix of residential lot sizes and cater for a mix of housing types to assist diversity and aff ordability.
Proposals should complement existing residential areas in terms of subdivision layout and housing design, density and character.
Proposals should achieve an average density of 11 to 16 dwellings per hectare.
Proposals should provide a visually attractive transition between urban and rural areas.
Proposals must be capable of being serviced by reticulated water and sewerage schemes such as Sydney Water infrastructure or package treatment plant systems.
Proposals should enable or include connection to existing shared pathway networks.
Proposal should incorporate community land and proposals for development of facilities and services if demand on existing social and community services provisions is likely to be increased.
d housing design,
d rural areas.
rage sche
y netw
ment od.

Wollondilly Shire Council, Growth Management Strategy 2011 page 95
Infi ll, Medium Density, Multi Dwelling DevelopmentsTh e land should be of suffi cient area to accommodate a range of residential forms integrated with adjoining urban lands.
Development of land should complement existing medium density areas.
Th e site should be within the footprint of existing towns & village residential areas
Th e site should be within practical walking distance of existing neighbourhood/village/town centres.
Th e site should be located close to transport links including shared pathways, bus and train.
Sites should be serviced by reticulated water and sewerage schemes.
Development of the site should not impede commercial development in the neighbourhood.
Self-contained Master Planned EstatesNOTE: Applies to proposals to develop large masterplanned residential subdivisions. Proposals must be located immediately adjacent to existing towns & villages so all of the criteria applying under the heading Urban on Town Edge category above also apply.
Proposals should provide an overall master plan displaying – good design, sensible overall structure, open space facilities, environmental protection, shared pathway networks, etc.
Proposals should be supported by evidence that a new estate will not be detrimental to the viability and hierarchy of existing towns and villages
Public access must be provided throughout roads, pathways and public open spaces of the estate area (gated communities are not acceptable).

Wollondilly Shire Council, Growth Management Strategy 2011 page 96
App endix 2
Structure Plans
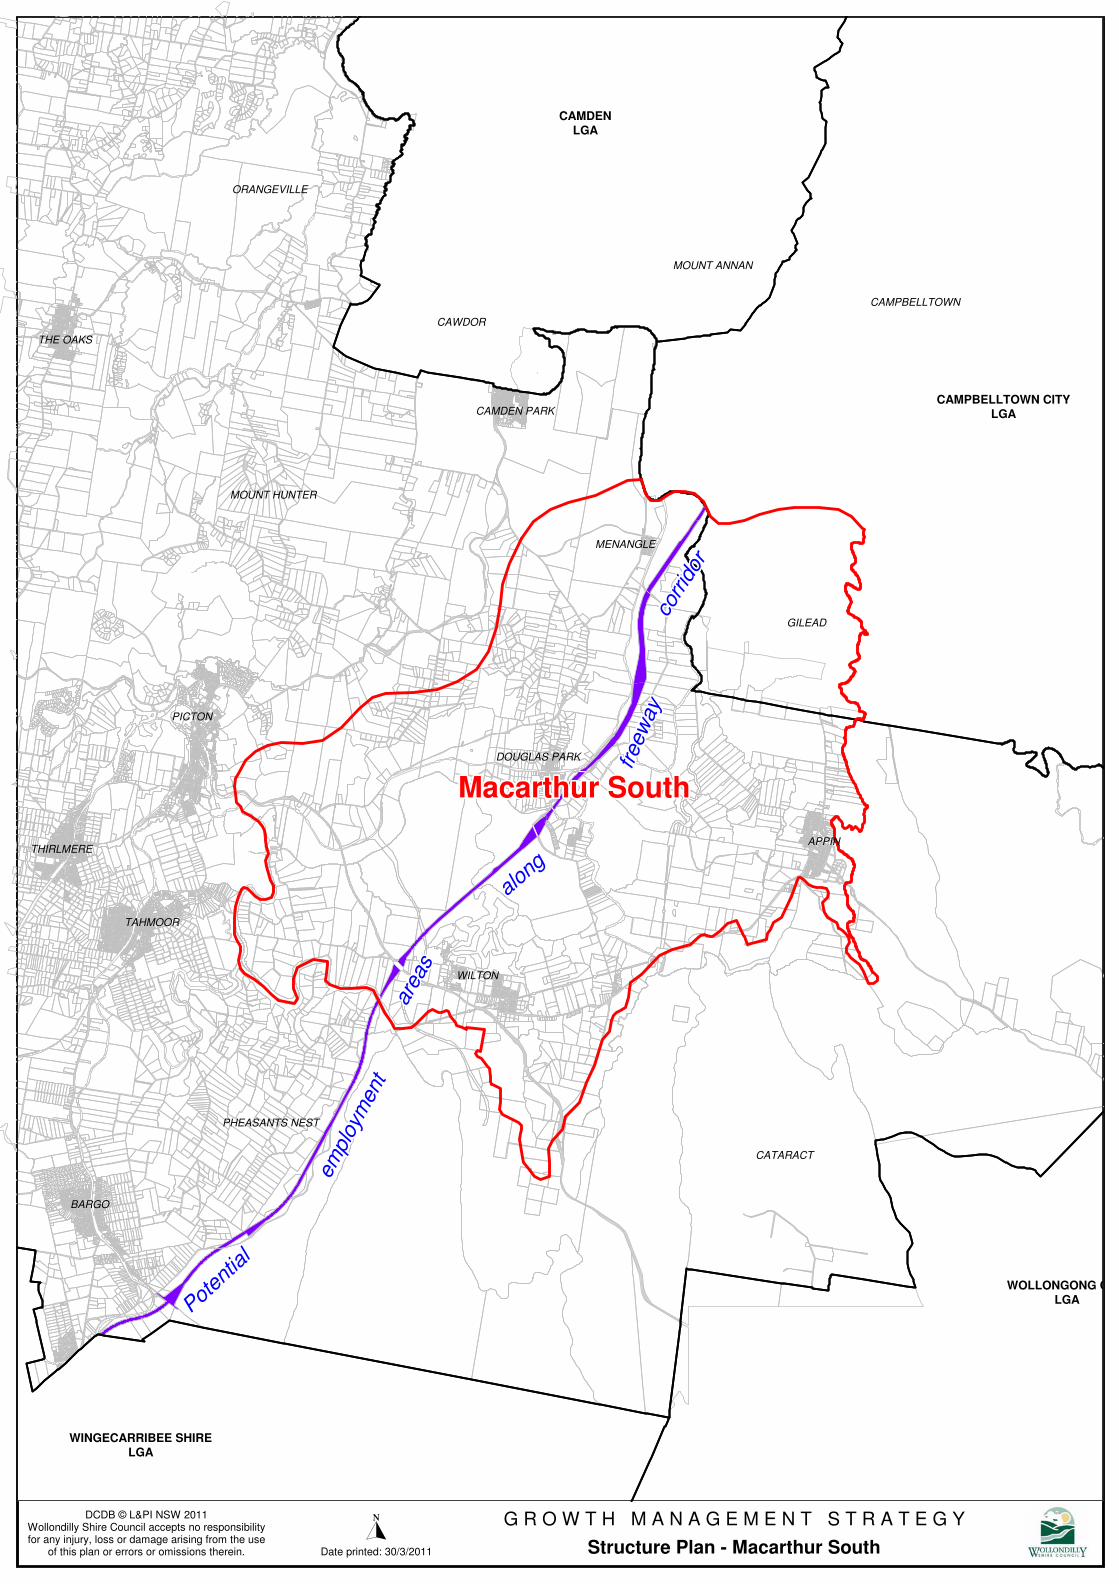
Poten
tial
Poten
tial
Poten
tial
Poten
tial
Poten
tial
Poten
tial
Poten
tial
Poten
tial
Poten
tial
Poten
tial
Poten
tial
Poten
tial
Poten
tial
Poten
tial
Poten
tial
Poten
tial
Poten
tial
Poten
tial
Poten
tial
Poten
tial
Poten
tial
Poten
tial
Poten
tial
Poten
tial
Poten
tial
Poten
tial
Poten
tial
Poten
tial
Poten
tial
Poten
tial
Poten
tial
Poten
tial
Poten
tial
Poten
tial
Poten
tial
Poten
tial
Poten
tial
Poten
tial
Poten
tial
Poten
tial
Poten
tial
Poten
tial
Poten
tial
Poten
tial
Poten
tial
Poten
tial
Poten
tial
Poten
tial
Poten
tial
Poten
tial
Poten
tial
Poten
tial
Poten
tial
Poten
tial
Poten
tial
Poten
tial
Poten
tial
Poten
tial
Poten
tial
Poten
tial
Poten
tial
Poten
tial
Poten
tial
Poten
tial
Poten
tial
are
as
are
as
are
as
are
as
are
as
are
as
are
as
are
as
are
as
are
as
are
as
are
as
are
as
are
as
are
as
are
as
are
as
are
as
are
as
are
as
are
as
are
as
are
as
are
as
are
as
are
as
are
as
are
as
are
as
are
as
are
as
are
as
are
as
are
as
are
as
are
as
are
as
are
as
are
as
are
as
are
as
are
as
are
as
are
as
are
as
are
as
are
as
are
as
are
as
are
as
are
as
are
as
are
as
are
as
are
as
are
as
are
as
are
as
are
as
are
as
are
as
are
as
are
as
are
as
are
as
em
plo
yment
em
plo
yment
em
plo
yment
em
plo
yment
em
plo
yment
em
plo
yment
em
plo
yment
em
plo
yment
em
plo
yment
em
plo
yment
em
plo
yment
em
plo
yment
em
plo
yment
em
plo
yment
em
plo
yment
em
plo
yment
em
plo
yment
em
plo
yment
em
plo
yment
em
plo
yment
em
plo
yment
em
plo
yment
em
plo
yment
em
plo
yment
em
plo
yment
em
plo
yment
em
plo
yment
em
plo
yment
em
plo
yment
em
plo
yment
em
plo
yment
em
plo
yment
em
plo
yment
em
plo
yment
em
plo
yment
em
plo
yment
em
plo
yment
em
plo
yment
em
plo
yment
em
plo
yment
em
plo
yment
em
plo
yment
em
plo
yment
em
plo
yment
em
plo
yment
em
plo
yment
em
plo
yment
em
plo
yment
em
plo
yment
em
plo
yment
em
plo
yment
em
plo
yment
em
plo
yment
em
plo
yment
em
plo
yment
em
plo
yment
em
plo
yment
em
plo
yment
em
plo
yment
em
plo
yment
em
plo
yment
em
plo
yment
em
plo
yment
em
plo
yment
em
plo
yment
along
along
along
along
along
along
along
along
along
along
along
along
along
along
along
along
along
along
along
along
along
along
along
along
along
along
along
along
along
along
along
along
along
along
along
along
along
along
along
along
along
along
along
along
along
along
along
along
along
along
along
along
along
along
along
along
along
along
along
along
along
along
along
along
along
Macarthur SouthMacarthur SouthMacarthur SouthMacarthur SouthMacarthur SouthMacarthur SouthMacarthur SouthMacarthur SouthMacarthur SouthMacarthur SouthMacarthur SouthMacarthur SouthMacarthur SouthMacarthur SouthMacarthur SouthMacarthur SouthMacarthur SouthMacarthur SouthMacarthur SouthMacarthur SouthMacarthur SouthMacarthur SouthMacarthur SouthMacarthur SouthMacarthur SouthMacarthur SouthMacarthur SouthMacarthur SouthMacarthur SouthMacarthur SouthMacarthur SouthMacarthur SouthMacarthur SouthMacarthur SouthMacarthur SouthMacarthur SouthMacarthur SouthMacarthur SouthMacarthur SouthMacarthur SouthMacarthur SouthMacarthur SouthMacarthur SouthMacarthur SouthMacarthur SouthMacarthur SouthMacarthur SouthMacarthur SouthMacarthur SouthMacarthur South
freew
ay
freew
ay
freew
ay
freew
ay
freew
ay
freew
ay
freew
ay
freew
ay
freew
ay
freew
ay
freew
ay
freew
ay
freew
ay
freew
ay
freew
ay
freew
ay
freew
ay
freew
ay
freew
ay
freew
ay
freew
ay
freew
ay
freew
ay
freew
ay
freew
ay
freew
ay
freew
ay
freew
ay
freew
ay
freew
ay
freew
ay
freew
ay
freew
ay
freew
ay
freew
ay
freew
ay
freew
ay
freew
ay
freew
ay
freew
ay
freew
ay
freew
ay
freew
ay
freew
ay
freew
ay
freew
ay
freew
ay
freew
ay
freew
ay
freew
ay
freew
ay
freew
ay
freew
ay
freew
ay
freew
ay
freew
ay
freew
ay
freew
ay
freew
ay
freew
ay
freew
ay
freew
ay
freew
ay
freew
ay
freew
ay
corr
idor
corr
idor
corr
idor
corr
idor
corr
idor
corr
idor
corr
idor
corr
idor
corr
idor
corr
idor
corr
idor
corr
idor
corr
idor
corr
idor
corr
idor
corr
idor
corr
idor
corr
idor
corr
idor
corr
idor
corr
idor
corr
idor
corr
idor
corr
idor
corr
idor
corr
idor
corr
idor
corr
idor
corr
idor
corr
idor
corr
idor
corr
idor
corr
idor
corr
idor
corr
idor
corr
idor
corr
idor
corr
idor
corr
idor
corr
idor
corr
idor
corr
idor
corr
idor
corr
idor
corr
idor
corr
idor
corr
idor
corr
idor
corr
idor
corr
idor
corr
idor
corr
idor
corr
idor
corr
idor
corr
idor
corr
idor
corr
idor
corr
idor
corr
idor
corr
idor
corr
idor
corr
idor
corr
idor
corr
idor
corr
idor
CAMPBELLTOWN CITY
LGA
WOLLONGONG CITY
LGA
CAMDEN
LGA
WINGECARRIBEE SHIRE
LGA
MENANGLE
DOUGLAS PARK
WILTON
GILEAD
APPIN
PHEASANTS NEST
BARGO
MOUNT ANNAN
CAMPBELLTOWN
CAWDOR
CAMDEN PARK
CATARACT
TAHMOOR
THIRLMERE
PICTON
MOUNT HUNTER
THE OAKS
ORANGEVILLE
Date printed: 30/3/2011
DCDB © L&PI NSW 2011Wollondilly Shire Council accepts no responsibilityfor any injury, loss or damage arising from the use
of this plan or errors or omissions therein. Structure Plan - Macarthur South
G R O W T H M A N A G E M E N T S T R A T E G Y
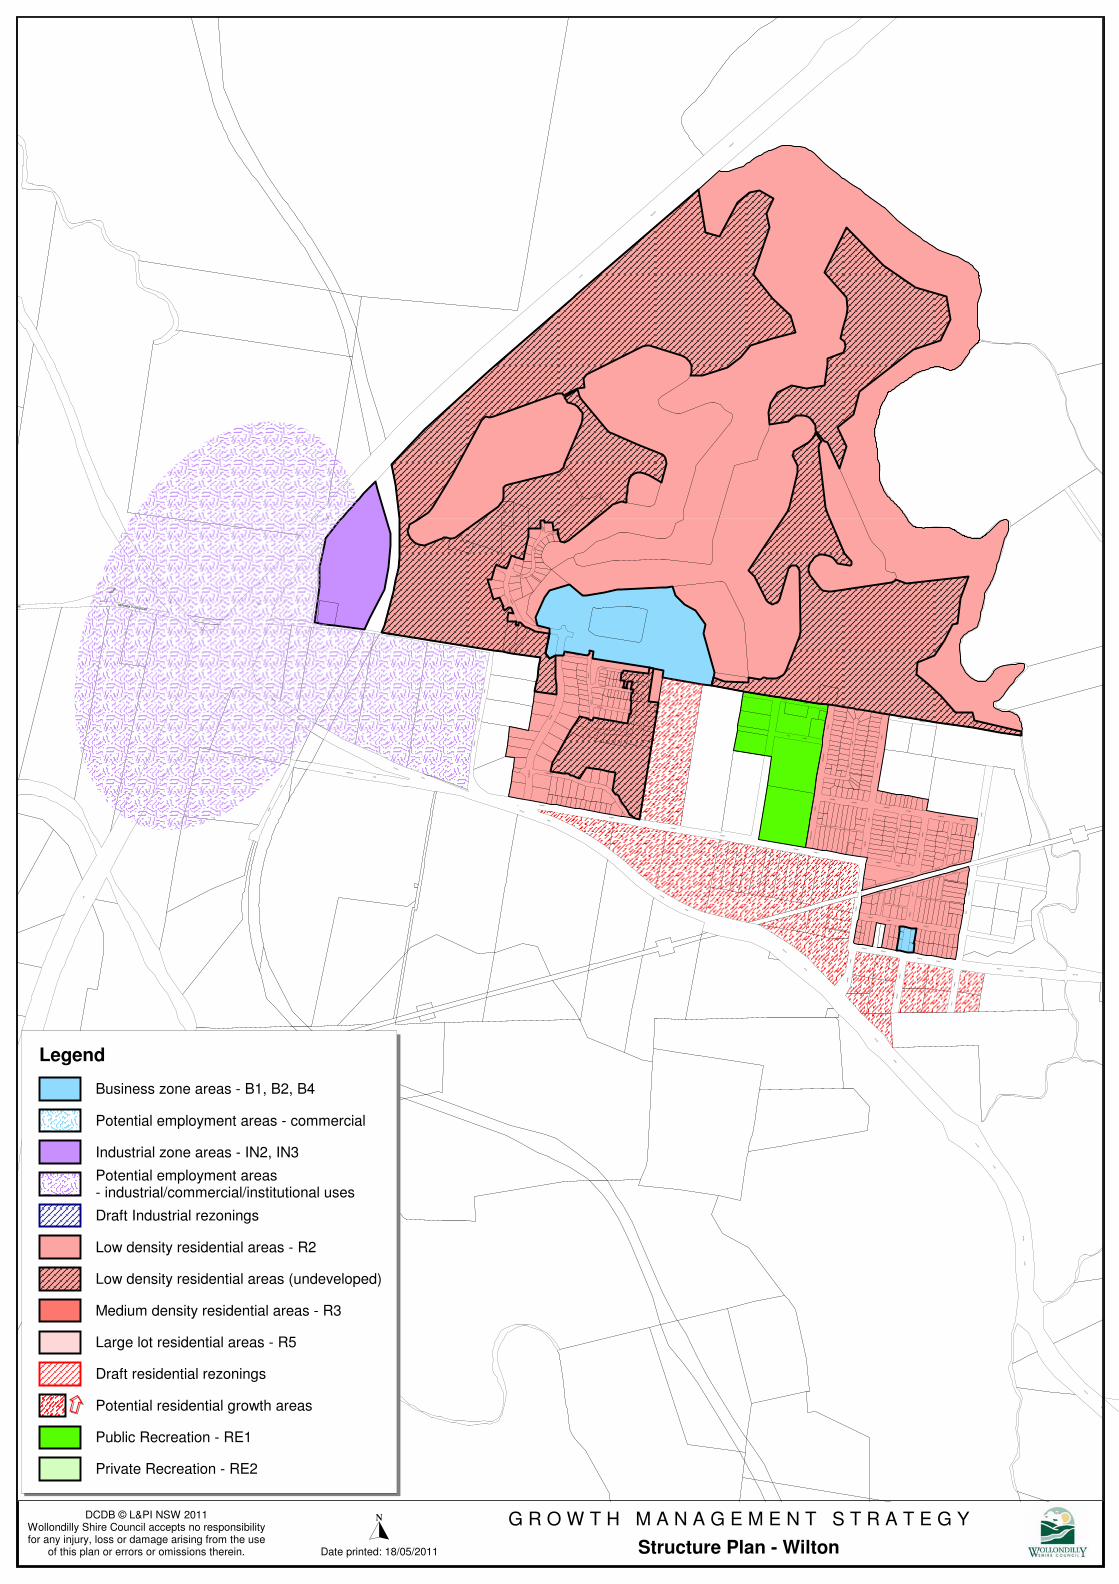
STREET
ROAD
BERWICK PARK ROAD
STREET
STREET
STREET
ST
RE
ET
COOPER BE
AT
TY
PE
EL
ST
RE
ET
MIR
I AM
ST
RE
ET
PE
EL
STREET
STREET
ST
RE
ET
ST
RE
ET
PE
EL
STREET
ST
RE
ET
CA
MD
EN
CA
MD
EN
ARGYLE
STREET
FITZROY
FITZROY
STREET
ARGYLE
STREET
WILTON
STREET
WILTON
WONSON
STREET
ST
RE
ET
SARAZEN CRES
JEFFREY
WHITE STREET
DRIVE
FA
IRW
AY
KIRKWOOD
CH
AS
E
KIR
KW
OO
D
CH
AS
E
PA
RA
DE
OXENBRIDGE
PE
MB
RO
KE
AV
EN
UE
CH
I SO
LM
DONELEY
HORDERN
ST
RE
ET
HU
ME
PARK
HW
Y
LAN
E
PICTON
RD
SO
UTH
RO
AD
PIC
TON
ROAD
EM
MA
JANDERRA
LANE
HORNBY
ROAD
PICTON
ROAD
PICTON
CO
ND
ELL
PA
RK
RO
AD
STREET
SO
UTH
CONDELL
PARK
FR
EEW
AY
WES
TER
N
FREE
WAY
WES
TERN
ROAD
HORNBY
ROAD
PICTON
STREET
RO
AD
GORDON
ST
RE
ET
BR
OU
GH
TO
N
KING
TYS
ON
STREET
STREET
SW
AIN
E
RO
AD
PICTON
HORNBY
STREET
ST
RE
ET
AL
MO
ND
ST
RE
ET
AL
MO
ND
AL
MO
ND
ST
RE
ET
CAMPSIE
BR
OU
GH
TO
N
ST
RE
ET
STREET
CAMPSIE
STREET
GORDON
ST
RE
ET
AL
MO
ND
CA
MD
EN
STREET
WONSON
WILTON
ST
RE
ET
HORNBY
CAMPSIE
STREET
STREET
DR
IVE
STREET
ARGLE
PIC
TON
RO
AD
RO
AD
PIC
TON
RO
AD
PIC
TO
N
RO
AD
PICTO
N
Date printed: 18/05/2011
DCDB © L&PI NSW 2011Wollondilly Shire Council accepts no responsibilityfor any injury, loss or damage arising from the use
of this plan or errors or omissions therein. Structure Plan - Wilton
G R O W T H M A N A G E M E N T S T R A T E G Y
Legend
Low density residential areas - R2
Large lot residential areas - R5
Draft residential rezonings
Potential residential growth areas
Low density residential areas (undeveloped)
Medium density residential areas - R3
00
Industrial zone areas - IN2, IN3
Draft Industrial rezonings
Potential employment areas- industrial/commercial/institutional uses
Business zone areas - B1, B2, B4
Public Recreation - RE1
Private Recreation - RE2
Potential employment areas - commercial

McB
RIE
N P
L
ST
RE
ET
HARDWICKE
HA
RD
WIC
KE
ROAD
BURRAGORANG
GLENDIVER
RO
AD
RO
AD
BR
OW
NS
ROAD
ROAD
BURRAG
ORANG
RO
AD
BURRAG
ORAN
G
JOORILANDROAD
MO
N
MO
NT
PE
LIE
R
DR
IVE
STREET
BURRAGORANGSTREET
WIL
LIA
M
ST
RE
ET
McINTOSH
RO
AD
MO
NTP
ELIE
R
DR
IVE
STREET
McINTOSH
BA
DG
ALLY
BLACKBUTT PL
GLENBROOK PLACE
MO
NT
PE
LIE
R
CA
SU
AR
INA
CR
ES
CE
NT
EDWARD
DE
VIT
T
CLOSE
DR
IVE
WIL
LIA
MS
TR
EE
T
VA
ND
ER
VIL
LE
S
TR
EE
T N
OR
TH
TIMOTHYLACEY
RUSSELL
ST
RE
ET
ST
RE
ET
WIL
LIA
M
STREET
RUSSELL
CHASELING PLACE
MARY
ME
RL
IN
JO
HN
ST
RE
ET
ST
RE
ET
ME
RL
INS
TR
EE
T
BURRAGORANG
VA
ND
ER
VIL
LE
S
TR
EE
T S
OU
TH
JO
HN
STREET
STREET
MARYSTREET
STREET
HA
RD
WIC
KEM
AR
SH
PLA
CE
CR
ES
CE
NT
DE
VIT
T
CRESCENT
DEVITT
EDWARDSTREET
ST
RE
ET
SIL
VE
RD
ALE
JO
HN
STREET
LANE
MA
PL
E
AV
E
DANELLA ST
MERLIN
RID
EO
UT
L
AN
E
SIL
VE
RD
ALE
ST
RE
ET
STREET
GLENDIVER
ME
RL
IN
ST
RE
ET
CEDAR
ME
RL
IN
PLACE
GLENDIVERROAD
ROAD
ROAD
STREET
DLEP 77DLEP 77DLEP 77DLEP 77DLEP 77DLEP 77DLEP 77DLEP 77DLEP 77DLEP 77DLEP 77DLEP 77DLEP 77DLEP 77DLEP 77DLEP 77DLEP 77DLEP 77DLEP 77DLEP 77DLEP 77DLEP 77DLEP 77DLEP 77DLEP 77DLEP 77DLEP 77DLEP 77DLEP 77DLEP 77DLEP 77DLEP 77DLEP 77DLEP 77DLEP 77DLEP 77DLEP 77DLEP 77DLEP 77DLEP 77DLEP 77DLEP 77DLEP 77DLEP 77DLEP 77DLEP 77DLEP 77DLEP 77DLEP 77
leve
l
leve
l
leve
l
leve
l
leve
l
leve
l
leve
lle
vel
leve
l
leve
l
leve
l
leve
l
leve
l
leve
lle
vel
leve
l
leve
l
leve
l
leve
l
leve
l
leve
lle
vel
leve
l
leve
l
leve
l
leve
l
leve
lle
vel
leve
l
leve
l
leve
l
leve
l
leve
l
leve
lle
vel
leve
l
leve
l
leve
l
leve
l
leve
l
leve
lle
vel
leve
l
leve
l
leve
l
leve
l
leve
l
leve
lle
vel
flood
flood
flood
flood
flood
flood
flood
flood
flood
flood
flood
flood
flood
flood
flood
flood
flood
flood
flood
flood
flood
flood
flood
flood
flood
flood
flood
flood
flood
flood
flood
flood
flood
flood
flood
flood
flood
flood
flood
flood
flood
flood
flood
flood
flood
flood
flood
flood
flood
1:1
00 y
r1:1
00 y
r1:1
00 y
r1:1
00 y
r1:1
00 y
r1:1
00 y
r1:1
00 y
r1:1
00 y
r1:1
00 y
r1:1
00 y
r1:1
00 y
r1:1
00 y
r1:1
00 y
r1:1
00 y
r1:1
00 y
r1:1
00 y
r1:1
00 y
r1:1
00 y
r1:1
00 y
r1:1
00 y
r1:1
00 y
r1:1
00 y
r1:1
00 y
r1:1
00 y
r1:1
00 y
r1:1
00 y
r1:1
00 y
r1:1
00 y
r1:1
00 y
r1:1
00 y
r1:1
00 y
r1:1
00 y
r1:1
00 y
r1:1
00 y
r1:1
00 y
r1:1
00 y
r1:1
00 y
r1:1
00 y
r1:1
00 y
r1:1
00 y
r1:1
00 y
r1:1
00 y
r1:1
00 y
r1:1
00 y
r1:1
00 y
r1:1
00 y
r1:1
00 y
r1:1
00 y
r1:1
00 y
r
1:10
0 yr
1:10
0 yr
1:10
0 yr
1:10
0 yr
1:10
0 yr
1:10
0 yr
1:10
0 yr
1:10
0 yr
1:10
0 yr
1:10
0 yr
1:10
0 yr
1:10
0 yr
1:10
0 yr
1:10
0 yr
1:10
0 yr
1:10
0 yr
1:10
0 yr
1:10
0 yr
1:10
0 yr
1:10
0 yr
1:10
0 yr
1:10
0 yr
1:10
0 yr
1:10
0 yr
1:10
0 yr
1:10
0 yr
1:10
0 yr
1:10
0 yr
1:10
0 yr
1:10
0 yr
1:10
0 yr
1:10
0 yr
1:10
0 yr
1:10
0 yr
1:10
0 yr
1:10
0 yr
1:10
0 yr
1:10
0 yr
1:10
0 yr
1:10
0 yr
1:10
0 yr
1:10
0 yr
1:10
0 yr
1:10
0 yr
1:10
0 yr
1:10
0 yr
1:10
0 yr
1:10
0 yr
1:10
0 yr
leve
lle
vel
leve
lle
vel
leve
lle
vel
leve
lle
vel
leve
lle
vel
leve
lle
vel
leve
lle
vel
leve
lle
vel
leve
lle
vel
leve
lle
vel
leve
lle
vel
leve
lle
vel
leve
lle
vel
leve
lle
vel
leve
lle
vel
leve
lle
vel
leve
lle
vel
leve
lle
vel
leve
lle
vel
leve
lle
vel
leve
lle
vel
leve
lle
vel
leve
lle
vel
leve
lle
vel
leve
l
flood
flood
flood
flood
flood
flood
flood
flood
flood
flood
flood
flood
flood
flood
flood
flood
flood
flood
flood
flood
flood
flood
flood
flood
flood
flood
flood
flood
flood
flood
flood
flood
flood
flood
flood
flood
flood
flood
flood
flood
flood
flood
flood
flood
flood
flood
flood
flood
flood
Date printed: 30/3/2011
DCDB © L&PI NSW 2011Wollondilly Shire Council accepts no responsibilityfor any injury, loss or damage arising from the use
of this plan or errors or omissions therein. Structure Plan - The Oaks
G R O W T H M A N A G E M E N T S T R A T E G Y
000000
0000
00
00
00 00 00 00
00
00
00
Legend
Low density residential areas - R2
Large lot residential areas - R5
Draft residential rezonings
Potential residential growth areas
Low density residential areas (undeveloped)
Medium density residential areas - R3
00
Industrial zone areas - IN2, IN3
Draft Industrial rezonings
Potential employment areas - industrial
Business zone areas - B1, B2, B4
Public Recreation - RE1
Private Recreation - RE2
Potential employment areas - commercial

THIRLMERE
ST
ON
EQ
UA
RR
Y
CR
AW
FO
RD
LA
.
STOKES
ROAD
KIA
H R
IDG
E R
D
VA
LER
IE
ST
SHORT STREET
HO
US
E
TH
OM
PS
ON
PL
TAHMOOR
CO
UR
T
PENNY LANE
WAY
WAY
THIRLMERE
OA
KS
RO
AD
STR
EE
T
STREET
STR
EE
T
STA
TIO
N
PA
RA
DE
WE
ST
AUSTINS
LANE
NATTAI
PA
RA
DE
STREET
LAKES
WEST
ST
RE
ET
RYA
N
STA
TION
BURNS
ROAD
CE
DA
R
CLOSED ROAD
CLOSE
CLO
SE
KIM
STR
EE
T
CAM
PB
ELL
OAKS
STREET
STREET
MASON
CLOSE
STREET
RYA
N
SHELLEYS
LANE
ROAD
CREEK
CED
AR
ROAD
BURNS
STREET
BA
RBO
UR
RO
AD
AN
TIL
L
STR
EE
T
STA
TION
STA
TION
STR
EE
T
STR
EE
T
STREE T
STREET
BOUNDARY
ROAD
RO
AD
RO
AD
CA
RLTO
N
NORTH
NORTH
STREET
CA
RLTO
N
RO
AD
VIC
TO
RI A
STR
EE
T
MASON
OAKS
STREET
ST
REE
T
STREET
RO
AD
BOUNDARY
ROAD
DRIVE
PING
GEORGE
AV
EN
UE
TH
IRLM
ER
E
KEVIN PL
TURNER
SOUTH
WE
STB
OU
RN
E
STREET
WA
Y
STREET
BELL
JARVIS
STREE T
WR
EN
LEONARD
TH
IRLM
ER
E
WA
Y
TH
IRLM
ER
E
DAVIS
ALBERT
AVENUE
AV
EN
UE
WE
STB
OU
RN
E
PLACE
STREET
STREET
NORTH
STR
EE
T
KA
NG
AR
OO
KA
NG
AR
OO
RO
AD
BR
ON
ZEW
ING
RO
AD
THIRLMERE
WAY
STR
EE
T
DEN
MEA
D
ST
RE
ET
STR
EE
T
DEN
MEA
D
RITA
ST
RE
ET
STREET
WAY
TH
IRLM
ER
E
WA
Y
WAY
MILTON
CHURCH SQUARE
RO
AD
STREET
STREET
CHURCH SQUARE
WE
STB
OU
RN
E
TH
IRLM
ER
E
WA
Y
TH
IRLM
ER
E
DA
RLE
Y
BRIDGE
TH
IRLM
ER
E
WINDEYER
BETTY
ST
EP
HE
N
WA
Y
AVENUE
STREET DA
RLE
Y
PLACE
ST
RE
ET
TU
RN
ER
ST
RE
ET
TU
RN
ER
BRUNDAH
ROAD
DEN
NIS
STREE
T
ST
RE
ET
DE
NM
EA
D
BRIDGE
STREET
ST
RE
ET
WAY
THIR
LMERE
STREET
TH
IRLM
ER
E
WAY
OWEN
STREET
ST
RE
ET
BREELLEN CL
BRONZEWING
STREET
RO
AD
MI L
NE
ST
RE
ET
THIRLMERE
WAY
THIRLMERE
MAC
QU
AR
I E
WAY
MI L
NE
ST
RE
ET
STREET
BR
UN
DA
H
RO
AD
IBBOTSON
GLE
NAN
NE
ST
UA
RT
BR
UN
DA
H
FR
AS
ER
BRONZEWING
SHORT
PLACE
LINDSELL
STREET
MARKET
ST
RE
ET
MI L
NE
ST
RE
ET
ST
RE
ET
STR
EE
T
HUNTER
STREET
STREET
STREET
FR
AS
ER
ST
REE
T
CONNOR
PL
AC
E
LE
IHA
PATTERSON
STREET
PLACE
CHAPMAN
STREET
HAR
PER
CLO
SE
REM
EM
BR
AN
CE
DR
IVEW
AY
STREET
GE
OR
GE
GE
OR
GE
THIRLMERE
STREE
T
PI T
T
ST
REE
T
MAH
ON
GA
THIRLMERE
WAY
ROAD
PA RK
HILTO N
HILTO
N
PARK
RO
AD
STR
EE
T
LE
WIS
LA
NE
STREET
STR
EE
T
PI T
T
ROAD
RIVER
BARGO
ROAD
RIVER
ROAD
BARGO
NO
ONAM
ENA
RD
ROAD
REM
EM
BR
AN
CE
ROAD
RIVER
BA
RG
O
DR
IVEW
AY
BARGO
RIV
ER
ROAD
HAWKINS
RO
CK
FO
RD
RO
AD
ROAD
EDINBURGH
ST
RA
TF
OR
D
RO
AD
HODGSO N
RO
CK
FO
RD
RO
AD
ST
RA
TF
OR
D
GROVE
KA
SC
H
CL
BY
RO
N
PLA
CE
WA
RA
TA
H
STREET
NATTAI
STO
KE
S
RO
AD
BYRON
DUDLEY PL
STREET
RO
AD
BY
RO
N
ROAD
REM
EMBRAN
CE
DRIV
EW
AY
PL
PLA
CE
STR
EET
MIL
NE
MIL
LE
R P
L
HU
EN
ROBYN
STREET
KING
BRIDGE
MARKET
STR
EET
PITT
BRONZEWING
CASTL E
REAG
H
REM
EMBRAN
CE
DRIV
EW
AY
ST
RA
TF
OR
D
RO
AD
MONICA PL
EL
PH
IN
ST
RE
ET
AM
BL
EC
OT
E
PLACE
ST
CA
STL
ER
EA
GH
STR
EE
T
CA
ST
LER
EAG
H
KING
STREET
YO
RK
STREET
LARKIN
CR
AW
FO
RD
EMM
ETT
ST
REE
T
STR
EE
T
YO
RK
RO
CK
FO
RD
RALFE
STREET
RO
CK
FO
RD
RO
AD
RO
AD
KR
ISTA
GE
OR
GE
ST
RE
ET
TA
HM
OO
R
RO
AD
PROG RE SS
STREET
AB
ELI A
AB
ELIA
ST
BRADBURY
STREET
ST PL
TANYA
PL
PANDORA
STREET
PR
OG
RE
SS
STR
EE
TLI N
TIN
A
STRUAN
STR
EE
T
STRUAN
STREET
MYRTLE
CR
EEK
AV
EN
UE
YO
RK
GREENACRE
CRO
SS
GR
EE
NA
CR
E
DR
IVE
DRIVE
PL
MY
RT
LE
CR
EE
K
AVEN
UE
CHIVERS
MOORLAND
ROAD
VICTA PL
ST
BARGO
GO
OD
LE
TT
AN
TIL
L
STR
EE
T
BA
RBO
UR
ROAD
BU
RN
S
CREEK
CEDAR
AV
EN
UE
ROAD
NIX
ON
STREET
BAROO
MA
DIG
AN
GR
OV
E
WIL
SO
N G
R
PLAC
E
LEONARD
STREE T
BR
ON
ZE
WIN
G
AUDREY
MA
RIO
N
ST
RE
ET
CA
SH
ST
STREET
ST
GORDON
ALBERT
STREET
STREE T
KATHLEEN
PL
BELL
STREET
BELL
STREET
JARVIS
PLACE
ST
RE
ET
RIC
HAR
DSO
N
RICHARDSON
BURNS
ROAD
NIX
ON
INN
ES
STR
EE
T
INN
ES
AL
MA
ST
PL
STREET
RITA
MA
RIO
N
RIT
A
ST
RE
ET
ST
RE
ET
ST
RE
ET
MA
RIO
N
ST
RE
ET
RIT
A
BRUNDAH
ROAD
RO
AD
TICKLE
TICKLE
DRIVE
WI N
PA
RA
FR
AS
ER
ST
RE
ET
PARK
STREET
PIMELIA
STREET
DRIVE
CLO
SE
BRUNDAH
ROAD
ST
REE
T
ST
REE
T
YO
RK
ST
REE
T
GE
OR
GE
CA
ST
LE
RE
AG
H
ST
RE
ET
PARK
STREET
PL
AC
E
PLA
CE
MYRTLE
BRIDGE
STREET
BRIDGE
STREET
STREET
BRIDGE
STREET
PLAC
E
REM
EM
BR
ANC
E
DRIVEWAYR
EM
EM
BR
AN
CE
DR
IVE
WAY
STR
EE
T
AR
GY
LE
WOOD
BOLLARD PL
AR
GY
LE
ST
RE
ET
STR
EE
T
RU
MK
ER
AR
GY
LE
REMEMBRANCE
DRIVEWAY
LA
NE
ST
ILT
ON
RO
AD
RIV
ER
RO
AD
PLACE
MYRTLE
STREET
DR
IVE
WA
Y
LA
NE
STIL
TO
N
L AN
E
ST
ILT
ON
HEN
RY
STR
EE
T
WONGA
ROAD
WO
NG
A
ST
REE
T
STREET
ANTILL
ST
REE
T
ST
RE
ET
WIL
D
STREET
WAY
CO
UR
T LA
ND
LINT
INA
RE
MEM
BR
AN
CE
DR
IVE
WAY
RE
ET
ST
REE
T
YO
RK
STR
EE
T
MIT
CH
ELL
CL
AV
EN
UE
ST
PR
OG
RE
SS
THIRLMERE
WAY
TH
IRLM
ER
E
WAY
STREET
HILL
WAY
THIRLMERE
ROAD
GROVE
DR
JANICE
OXLEY TA
HM
OO
R TAHMOOR
ROAD
MOORLAND
ROAD
ST
REE
T
REDBANK
BRIDGE
PLACE
BR
IDG
E
SUFFOLKAV
ENUE
PARK
RIVER
ROAD
RIV
ER
LA
NE
ST
ILT
ON
REM
EM
BR
AN
CE
STR
EE
T
RIV
ER
ROAD
R IVER
ROAD
MYRTLE
CR
EEK
AV ENUE
STREET
CR
ES
CE
NT
TA
RR
AN
T
WIL
D
STREET
HAD
DO
N
PL
AC
E
CO
AC
HW
OO
D
CR
ES
CE
NT
CO
AC
HW
OO
D
AR
GY
LE
STREET
HILL
CR
EE
K
TA
HM
OO
R
RIV
ER
MYR
TLE
AV
EN
UE
RO
AD
TA
HM
OO
R
RO
AD
ANTILL
CLO
S E
HILL
KO
OR
AN
A
REMEMBRANCE
RO
AD
KOORANA
DLEP 74DLEP 74DLEP 74DLEP 74DLEP 74DLEP 74DLEP 74DLEP 74DLEP 74DLEP 74DLEP 74DLEP 74DLEP 74DLEP 74DLEP 74DLEP 74DLEP 74DLEP 74DLEP 74DLEP 74DLEP 74DLEP 74DLEP 74DLEP 74DLEP 74DLEP 74DLEP 74DLEP 74DLEP 74DLEP 74DLEP 74DLEP 74DLEP 74DLEP 74DLEP 74DLEP 74DLEP 74DLEP 74DLEP 74DLEP 74DLEP 74DLEP 74DLEP 74DLEP 74DLEP 74DLEP 74DLEP 74DLEP 74DLEP 74DLEPDLEPDLEPDLEPDLEPDLEPDLEPDLEPDLEPDLEPDLEPDLEPDLEPDLEPDLEPDLEPDLEPDLEPDLEPDLEPDLEPDLEPDLEPDLEPDLEPDLEPDLEPDLEPDLEPDLEPDLEPDLEPDLEPDLEPDLEPDLEPDLEPDLEPDLEPDLEPDLEPDLEPDLEPDLEPDLEPDLEPDLEPDLEPDLEP
73737373737373737373737373737373737373737373737373737373737373737373737373737373737373737373737373
DLEPDLEPDLEPDLEPDLEPDLEPDLEPDLEPDLEPDLEPDLEPDLEPDLEPDLEPDLEPDLEPDLEPDLEPDLEPDLEPDLEPDLEPDLEPDLEPDLEPDLEPDLEPDLEPDLEPDLEPDLEPDLEPDLEPDLEPDLEPDLEPDLEPDLEPDLEPDLEPDLEPDLEPDLEPDLEPDLEPDLEPDLEPDLEPDLEP
73737373737373737373737373737373737373737373737373737373737373737373737373737373737373737373737373
DLEPDLEPDLEPDLEPDLEPDLEPDLEPDLEPDLEPDLEPDLEPDLEPDLEPDLEPDLEPDLEPDLEPDLEPDLEPDLEPDLEPDLEPDLEPDLEPDLEPDLEPDLEPDLEPDLEPDLEPDLEPDLEPDLEPDLEPDLEPDLEPDLEPDLEPDLEPDLEPDLEPDLEPDLEPDLEPDLEPDLEPDLEPDLEPDLEP
73737373737373737373737373737373737373737373737373737373737373737373737373737373737373737373737373
DLEPDLEPDLEPDLEPDLEPDLEPDLEPDLEPDLEPDLEPDLEPDLEPDLEPDLEPDLEPDLEPDLEPDLEPDLEPDLEPDLEPDLEPDLEPDLEPDLEPDLEPDLEPDLEPDLEPDLEPDLEPDLEPDLEPDLEPDLEPDLEPDLEPDLEPDLEPDLEPDLEPDLEPDLEPDLEPDLEPDLEPDLEPDLEPDLEP
73737373737373737373737373737373737373737373737373737373737373737373737373737373737373737373737373
PTTFuture UrbanInvestigation
Area
PTTFuture UrbanInvestigation
Area
DLEPDLEPDLEPDLEPDLEPDLEPDLEPDLEPDLEPDLEPDLEPDLEPDLEPDLEPDLEPDLEPDLEPDLEPDLEPDLEPDLEPDLEPDLEPDLEPDLEPDLEPDLEPDLEPDLEPDLEPDLEPDLEPDLEPDLEPDLEPDLEPDLEPDLEPDLEPDLEPDLEPDLEPDLEPDLEPDLEPDLEPDLEPDLEPDLEP
73737373737373737373737373737373737373737373737373737373737373737373737373737373737373737373737373
Date printed: 30/3/2011
DCDB © L&PI NSW 2011Wollondilly Shire Council accepts no responsibilityfor any injury, loss or damage arising from the use
of this plan or errors or omissions therein. Structure Plan - Tahmoor & Thirlmere
G R O W T H M A N A G E M E N T S T R A T E G Y
0000
00
0000 00 00 00
0000 00 00
0000
This land notincluded dueto vegetationconstraints
Legend
Low density residential areas - R2
Large lot residential areas - R5
Draft residential rezonings
Potential residential growth areas
Low density residential areas (undeveloped)
Medium density residential areas - R3
00
Industrial zone areas - IN2, IN3
Draft Industrial rezonings
Potential employment areas - industrial
Business zone areas - B1, B2, B4
Public Recreation - RE1
Private Recreation - RE2
Potential employment areas - commercial00
00
0000

KIPARA
CRESCENT
(UN
FO
RM
ED
RO
AD
)
TW
EN
TY F
IRS
T
LAN
E
LANE
FIRST
TW
EN
TY
DONOHOE WY
SCOTC
HEYS
PL
GREEN HILLS DRIVE
ST HELIERS ROAD
ST HELIERS ROAD
ST
HE
LIE
RS
RO
AD
EIG
HTE
EN
TH
STR
EE
T
ELEVENTH
TW
ELFT
H
TH
IRTEEN
TH
TW
ELF
TH
STR
EE
T
TENTH STREET
TH
IRD
WE
IR
SIXTH
RO
AD
ST
REE
T
ST
RE
ET
NIN
TH
STREET
ST
REE
T
WE
IRR
OA
D
ST
RE
ET
NIN
TH
RO
AD
SEVENTH
WE
IRR
OA
DW
EIR
ELTONSROAD
PIP
ER
S
LA
NE
BARRINGTON
TA
YLO
RS
NO
RM
AN
MA
NN
A
MA
RG
AR
ET
T
ER
RA
CE
ROAD
SILVERDALE
ROAD
SIL
VE
RD
ALE
RO
AD
RO
AD
ROAD
ST
RE
ET
McKAY
SIL
VER
DALE
MA
RS
H
WA
LK
ER
CL
GIB
SO
N
RO
AD
STREET
ELD
RE
D
COVENY STREET
GI B
SO
N
LEWIS
GIBSON
ST
RE
ET
ST
RE
ET
STREET
MA
RS
HR
OA
D
TAYLORS
TAYLORS
BARROW PL
DU
NB
AR
DR
IVE
WARRADALE
ROAD
AARON PL
TU
RU
NE
N
SIL
VER
DA
LE
RO
ADR
OA
DR
OA
D
RIDGEHAVEN
SIL
VER
DA
LE
BILLETT
McA
ULIF
FE
ROAD
PLA
CE
McKAY SA
LE
S
MO
OR
EH
EA
D
AVE
GRAHAM
PL
ST
RE
ET
AVE
DRIVE
DRIVE
DE
LAN
EY
AV
EN
UE
HILLS
GR
EE
N
GREEN
HIL
LS
DRIVE
FO
XW
OO
DC
LO
SE
WA
Y
DR
IVE
McK
AY
ROAD
TAYLORSROAD
WAY
RO
AD
DA
LE
SR
OA
D
SILVEN
PARK
GOLDEN WAY
GR
EE
NH
AV
EN
DA
LES
RIDGEHAVEN
ROAD
STREET
DR
IVE
WA
TE
RH
OU
SE
RO
AD
TA
YLO
RS
RO
AD
CLOSE
LACHLAN
RIT
CH
IE
WA
TE
RH
OU
SE
KAREN PLACE
DR
IVE
RO
AD
TA
YLO
RS
RO
AD
TA
YLO
RS
RO
AD
RID
GEH
AV
EN
TAYLORSROAD
RO
AD
NO
RM
AN
MANNAWAY
RO
AD
PLAC
E
SPICER
LAN
GM
EA
D
RO
AD
RID
GE
HA
VE
N
RO
AD
ROAD
RO
AD
ST
WA
RR
AD
ALE
AVENUE
RO
AD
FAR
NS
WO
RTH
NI N
ETEE
NTH
RE
ET
MAUNDER PL
STR
EET
EN
TH
TE
NIN
ETE
EN
TH
WE
IR
NI
FO
UR
EN
TH
RO
AD
TWENTIETH ST
FO
UR
TE
EN
TH
ST
RE
ET
ST
RE
ET
STR
EE
T
TE
STREE
T
FIFTEE NTH ST
EIG
HTE
EN
TH
WE
I R
STREET
STREET
NE
STR
EET
WEIR
RO
AD
FOURTH
AVENUE
PRODUCTION
PR
OD
UC
TI O
N
WAR
RAD
ALE
RO
AD
AV
EN
UE
AVENUE
FARNSWORTH
SECO
ND
THIR
D
STREE T
FARNSWORTH
ST
REE
T
RO
AD
TH
IRT
EE
NT
HS
TR
EE
T
STREET
ST
REE
T
FIR
ST
SE
CO
ND
TH
IRD
SE
CO
ND
STR
EE
T
ST
RE
ET
SE
CO
ND
FIFTH
STREET
ST
RE
ET
TH
IRD
ST
RE
ET
ST
REE
T
STREET
TH
IRD
ST
RE
ET
SE
CO
ND
FARNSWORTH
AVENUE
AVENUE
ST
RE
ET
FIR
ST
EC
ON
O
GOVERNMENT
WARREN
ECONO
SIL
VER
DALE
RO
AD
SIL
VE
RD
ALE
RO
AD
PLACE
PL
AC
E
PL
ROAD
NA
RE
LLE
P
LA
CE
DRIVE
WATERHOUSE
SIL
VER
DALE
RO
AD
DA
LES
RO
AD
AV
EN
UE
SILVER
DALE
SIL
VE
RD
ALE
FA
RN
SW
OR
TH
FARNSWORTH
RO
AD
RO
AD
AV
EN
UE
AVENUE
FA
RN
SW
OR
TH
DLEP 76DLEP 76DLEP 76DLEP 76DLEP 76DLEP 76DLEP 76DLEP 76DLEP 76DLEP 76DLEP 76DLEP 76DLEP 76DLEP 76DLEP 76DLEP 76DLEP 76DLEP 76DLEP 76DLEP 76DLEP 76DLEP 76DLEP 76DLEP 76DLEP 76DLEP 76DLEP 76DLEP 76DLEP 76DLEP 76DLEP 76DLEP 76DLEP 76DLEP 76DLEP 76DLEP 76DLEP 76DLEP 76DLEP 76DLEP 76DLEP 76DLEP 76DLEP 76DLEP 76DLEP 76DLEP 76DLEP 76DLEP 76DLEP 76
Date printed: 30/3/2011
DCDB © L&PI NSW 2011Wollondilly Shire Council accepts no responsibilityfor any injury, loss or damage arising from the use
of this plan or errors or omissions therein. Structure Plan - Silverdale & Warragamba
G R O W T H M A N A G E M E N T S T R A T E G Y
00000000
Commercial expansionneeds to be linked
to residential growth
Legend
Low density residential areas - R2
Large lot residential areas - R5
Draft residential rezonings
Potential residential growth areas
Low density residential areas (undeveloped)
Medium density residential areas - R3
00
Industrial zone areas - IN2, IN3
Draft Industrial rezonings
Potential employment areas - industrial
Business zone areas - B1, B2, B4
Public Recreation - RE1
Private Recreation - RE2
Potential employment areas - commercial
00
0000

FA
IRLE
YS
AB
BO
TS
FO
RD
RO
AD
RO
AD
HEREFORD
WAY
FR
IES
IAN
WA
Y
AYRSHIREGARDENS
ATTUNGA CL
ST
WARRINGTON
DA
VIS
ON
RO
AD
CARRAMAR CL
ST
ON
EQ
UA
RR
Y
RO
AD
BOOYO
NG CL
RAIL
WA
Y
CR
ES
CR
EEK
CR
EE
K
MANOLIS LN
ST
AR
GA
RD
CR
ES
CE
NT
ST
AR
GA
RD
CR
ES
CE
NT
OBSERVATORY
ST
HEATHCOTE ST
SHORT STREET
WAY
LA
NE
WAY
THIRLMERE
DU
NLO
PP
L
RO
AD
MA
LDO
N
BR
IDG
EM
ALD
ON
BR
IDG
E
RO
AD
BARKERS
LODG
E
RD
ROAD
ABBOTSFORD
RO
AD
ST
RE
ET
ST
RE
ET
RU
MK
ER
ST
AR
VIEWSTREET
ST
RE
ET
RE
GR
EM
E
BARKERS
REGREME
RO
AD
BOTT
LEBRUSH
HO
LLIE
R
MAGNOLIA
DRIVE
MIDDLETON
LOV
E P
L
RO
AD
STREET
AR
GY
LE
ARGYLE
STREE
T
MENANG
LE
STREET
ST
RE
ET
ST
RE
ET
ELIZ
AB
ETH
DOWNING
ST
STREET
MARGARET
WEST
STREET
MENANGLE
STATION
ST
RE
ET
ST
RE
ET
STREET
PRINCE
VI C
TO
RI A
ST
CA
MP
BE
LL
ST
RE
ET
CA
MP
BE
LL
ME
NA
NG
LE
ME
NA
NG
LE
STREE
T
CO
ULL
PIC
TO
N
AV
EN
UE
ST
RE
ET
BR
IALY P
L
JARVISFIELD
AR
GY
LE
STR
EE
T
ROAD
JA
N
STREET
COLDE
NHAM
KY
EE
MA
RO
AD
YA
LL
AM
BI S
T
PLA
CE
ROAD
LOD
GE
BAR
KE
RS
ROAD
LODGEBARKERS
MON
DS
LANEA
BB
OT
SF
OR
D
RO
AD
EQUESTRIAN
DR
IVE
ST
RE
ET
LOD
GE
LUM
SD
AIN
E
CRAKA
NTH
OR
P L
ANE
BA
RK
ER
S
CO
ULL
PIC
TO
N
AV
EN
UE
AR
GY
LE
PO
PLA
R P
LA
CE
RIB
BO
NG
UM
P
L
CLIFFE
STREET
DA
VIE
S
PLA
CE
L OD
GE
RO
AD
BAXTER LANE
EMM
ETT
MEN
ANG
LE
ST
RE
ET
MARGARET
CO
LD
EN
ST
RE
ET
CLOSE
GIL
MO
RE
AV
EN
UE
STREET
AR
GY
LE
STR
EE
TST
WEETA
MALLAM
ROAD
RAM
SA
Y
STREET
ST
RE
ET
CL
REMEMBRANCE
PL
JACIN
TA
OLD
RAC
ECOUR
SE
CL
PL
RO
AD
DRIVEW
AY
REMEM
BRANCE
MYRTLE
BRIDGE
STREE
T
BRIDGE
STREET
STREET
BRIDGE
STREET
CR
ESC
EN
T
AR
GY
LE
WOOD
BOLLARD PL
AR
GY
LE
ST
RE
ET
STR
EE
T
RU
MK
ER
CONNELLAN
AR
GY
LE
MYRTLE
STREET
DR
IVE
WA
Y
ST
ILTO
N
LA
NE
ST
ILTO
N
HE
NR
Y
ST
RE
ET
WONGA
ROAD
RO
AD
WO
NG
A
STR
EE
T
STREET
ANTILL
ST
RE
ET
STREET
COWPERSTREET
PLACE
DU
NLO
P
ST
RE
ET S
TR
EE
T
WIL
D
ST
REE
T
STREET
THIRLMERE
WAY
TH
IRLM
ER
E WAY
ST
RE
ET
RU
MK
ER
STREET
HILL
WAY
THIRLMERE
ST
RE
ET
REDBANK
BRIDGE
PLACE
BR
IDG
E
LAN
E
ST
ILTO
N
RE
ME
MB
RA
NC
E
STR
EE
T
CR
ES
CE
NT
TA
RR
AN
T
WIL
D
STREET
HA
DD
ON
PL
AC
E
CO
AC
HW
OO
D
CR
ES
CE
NT
CO
AC
HW
OO
D
AR
GY
LE
STREET
HILL
ANTILL
CLOSE
MA
IDST
ON
E
WHERRITT
CLOSE
WEBSTER
STREET
PRINCE
ST
COWPER
STREET
HILL
PICTON
MATTHEWS LANE
ME
NA
NG
LE
ST
RE
ET
MA
TT
HE
WS
LA
NE
RO
AD
PIC
TO
N
ROAD
ST
RE
ET
HE
AT
HC
OT
E
ST
RE
ET
WIL
D
STONE
QUA
RRY P
L
AR
GY
LE
LUM
SD
AIN
E
ST
RE
ET
STR
EE
T
WHITFIELDPL
ST
STREET
AR
GY
LE
ST
RE
ET
FAIR
LEYS
WIL
TO
N
PICTON
ROAD
GO
VER
NO
RS
SO
NJ A
ROAD
RO
AD
CO
LDE
NH
AM
PL
DRIVEWAY
LAN
E
NA
TAS
HA
LA
NE
(Pri v
ate
Accesswa
y)
REMEMBRANCE
GO
VER
NO
RS
DLEPDLEPDLEPDLEPDLEPDLEPDLEPDLEPDLEPDLEPDLEPDLEPDLEPDLEPDLEPDLEPDLEPDLEPDLEPDLEPDLEPDLEPDLEPDLEPDLEPDLEPDLEPDLEPDLEPDLEPDLEPDLEPDLEPDLEPDLEPDLEPDLEPDLEPDLEPDLEPDLEPDLEPDLEPDLEPDLEPDLEPDLEPDLEPDLEP
73737373737373737373737373737373737373737373737373737373737373737373737373737373737373737373737373
DLEPDLEPDLEPDLEPDLEPDLEPDLEPDLEPDLEPDLEPDLEPDLEPDLEPDLEPDLEPDLEPDLEPDLEPDLEPDLEPDLEPDLEPDLEPDLEPDLEPDLEPDLEPDLEPDLEPDLEPDLEPDLEPDLEPDLEPDLEPDLEPDLEPDLEPDLEPDLEPDLEPDLEPDLEPDLEPDLEPDLEPDLEPDLEPDLEP
74747474747474747474747474747474747474747474747474747474747474747474747474747474747474747474747474
Potential touristaccommodation location
Date printed: 30/3/2011
DCDB © L&PI NSW 2011Wollondilly Shire Council accepts no responsibilityfor any injury, loss or damage arising from the use
of this plan or errors or omissions therein. Structure Plan - Picton
G R O W T H M A N A G E M E N T S T R A T E G Y
00 0000
00
0000
000000
Legend
Low density residential areas - R2
Large lot residential areas - R5
Draft residential rezonings
Potential residential growth areas
Low density residential areas (undeveloped)
Medium density residential areas - R3
00
Industrial zone areas - IN2, IN3
Draft Industrial rezonings
Potential employment areas - industrial
Business zone areas - B1, B2, B4
Public Recreation - RE1
Private Recreation - RE2
Potential employment areas - commercial
00

LO
DG
ER
OA
D
BURRAGORANG
AV
EN
UE
AC
AC
IA
ROAD
BA
NK
SIA
RO
AD
LO
DG
E
BA
RK
ER
S
PLACE
SH
AY
NE
CT
PL
MA
RIA
KERRY PLACE
AV
EN
UE
BLA
TT
MA
N
MOORE
BURRAGORANG
TA
MA
RA
C
L
WILLIS
AV
EN
UE
BLA
TT
MA
N
PLACE
ST
RE
ET
ROAD
ROAD
JAN
ET
TE
PLACE
DE
AN
C
LO
SE
GA
RB
UT
T
EG
AN
SR
OA
D
EG
AN
S
RO
AD
LANE
RUSSELL
BR
IDLE
AV
EN
UE
BLUE WRENPL
BURRAGORANG
ROAD
OLD
Date printed: 30/3/2011
DCDB © L&PI NSW 2011Wollondilly Shire Council accepts no responsibilityfor any injury, loss or damage arising from the use
of this plan or errors or omissions therein. Structure Plan - Oakdale
G R O W T H M A N A G E M E N T S T R A T E G Y
0000
00
00
00 0000
00 000000
0000
Legend
Low density residential areas - R2
Large lot residential areas - R5
Draft residential rezonings
Potential residential growth areas
Low density residential areas (undeveloped)
Medium density residential areas - R3
00
Industrial zone areas - IN2, IN3
Draft Industrial rezonings
Potential employment areas - industrial
Business zone areas - B1, B2, B4
Public Recreation - RE1
Private Recreation - RE2
Potential employment areas - commercial
0000

ROAD
WOODBRIDGE
MOR
ETON
SOUTH
ME
NA
NG
LE
RO
AD
AVENUE
HAIN
ES
PLA
CE
MO
RE
TO
N
PA
RK
RO
AD
ME
NAN
GLE
RO
AD
SU
LM
AN
P
L
RO
AD
MO
RE
TO
N
ME
NA
NG
LE
PA
RK
CL
OS
E
RIVERSFORD
RO
AD
ME
NA
NG
LE
ST JAMESR
OA
D
FWY
WESTERN
ST
EV
EN
S R
OA
D
STATION
PA
RK
STREET
flood
flood
flood
flood
flood
flood
floodflood
flood
flood
flood
flood
flood
floodflood
flood
flood
flood
flood
flood
floodflood
flood
flood
flood
flood
floodflood
flood
flood
flood
flood
flood
floodflood
flood
flood
flood
flood
flood
floodflood
flood
flood
flood
flood
flood
flood
flood
1:1
00 yr
1:1
00 yr
1:1
00 yr
1:1
00 yr
1:1
00 yr
1:1
00 yr
1:1
00 yr
1:1
00 yr
1:1
00 yr
1:1
00 yr
1:1
00 yr
1:1
00 yr
1:1
00 yr
1:1
00 yr
1:1
00 yr
1:1
00 yr
1:1
00 yr
1:1
00 yr
1:1
00 yr
1:1
00 yr
1:1
00 yr
1:1
00 yr
1:1
00 yr
1:1
00 yr
1:1
00 yr
1:1
00 yr
1:1
00 yr
1:1
00 yr
1:1
00 yr
1:1
00 yr
1:1
00 yr
1:1
00 yr
1:1
00 yr
1:1
00 yr
1:1
00 yr
1:1
00 yr
1:1
00 yr
1:1
00 yr
1:1
00 yr
1:1
00 yr
1:1
00 yr
1:1
00 yr
1:1
00 yr
1:1
00 yr
1:1
00 yr
1:1
00 yr
1:1
00 yr
1:1
00 yr
1:1
00 yr
leve
l
leve
l
leve
l
leve
l
leve
l
leve
l
leve
lle
vel
leve
l
leve
l
leve
l
leve
l
leve
l
leve
lle
vel
leve
l
leve
l
leve
l
leve
l
leve
l
leve
lle
vel
leve
l
leve
l
leve
l
leve
l
leve
lle
vel
leve
l
leve
l
leve
l
leve
l
leve
l
leve
lle
vel
leve
l
leve
l
leve
l
leve
l
leve
l
leve
lle
vel
leve
l
leve
l
leve
l
leve
l
leve
l
leve
lle
vel
Date printed: 30/3/2011
DCDB © L&PI NSW 2011Wollondilly Shire Council accepts no responsibilityfor any injury, loss or damage arising from the use
of this plan or errors or omissions therein. Structure Plan - Menangle
G R O W T H M A N A G E M E N T S T R A T E G Y
SPECIAL HERITAGE CURTILAGE INVESTIGATION AREASPECIAL HERITAGE CURTILAGE INVESTIGATION AREASPECIAL HERITAGE CURTILAGE INVESTIGATION AREASPECIAL HERITAGE CURTILAGE INVESTIGATION AREASPECIAL HERITAGE CURTILAGE INVESTIGATION AREASPECIAL HERITAGE CURTILAGE INVESTIGATION AREASPECIAL HERITAGE CURTILAGE INVESTIGATION AREASPECIAL HERITAGE CURTILAGE INVESTIGATION AREASPECIAL HERITAGE CURTILAGE INVESTIGATION AREASPECIAL HERITAGE CURTILAGE INVESTIGATION AREASPECIAL HERITAGE CURTILAGE INVESTIGATION AREASPECIAL HERITAGE CURTILAGE INVESTIGATION AREASPECIAL HERITAGE CURTILAGE INVESTIGATION AREASPECIAL HERITAGE CURTILAGE INVESTIGATION AREASPECIAL HERITAGE CURTILAGE INVESTIGATION AREASPECIAL HERITAGE CURTILAGE INVESTIGATION AREASPECIAL HERITAGE CURTILAGE INVESTIGATION AREASPECIAL HERITAGE CURTILAGE INVESTIGATION AREASPECIAL HERITAGE CURTILAGE INVESTIGATION AREASPECIAL HERITAGE CURTILAGE INVESTIGATION AREASPECIAL HERITAGE CURTILAGE INVESTIGATION AREASPECIAL HERITAGE CURTILAGE INVESTIGATION AREASPECIAL HERITAGE CURTILAGE INVESTIGATION AREASPECIAL HERITAGE CURTILAGE INVESTIGATION AREASPECIAL HERITAGE CURTILAGE INVESTIGATION AREASPECIAL HERITAGE CURTILAGE INVESTIGATION AREASPECIAL HERITAGE CURTILAGE INVESTIGATION AREASPECIAL HERITAGE CURTILAGE INVESTIGATION AREASPECIAL HERITAGE CURTILAGE INVESTIGATION AREASPECIAL HERITAGE CURTILAGE INVESTIGATION AREASPECIAL HERITAGE CURTILAGE INVESTIGATION AREASPECIAL HERITAGE CURTILAGE INVESTIGATION AREASPECIAL HERITAGE CURTILAGE INVESTIGATION AREASPECIAL HERITAGE CURTILAGE INVESTIGATION AREASPECIAL HERITAGE CURTILAGE INVESTIGATION AREASPECIAL HERITAGE CURTILAGE INVESTIGATION AREASPECIAL HERITAGE CURTILAGE INVESTIGATION AREASPECIAL HERITAGE CURTILAGE INVESTIGATION AREASPECIAL HERITAGE CURTILAGE INVESTIGATION AREASPECIAL HERITAGE CURTILAGE INVESTIGATION AREASPECIAL HERITAGE CURTILAGE INVESTIGATION AREASPECIAL HERITAGE CURTILAGE INVESTIGATION AREASPECIAL HERITAGE CURTILAGE INVESTIGATION AREASPECIAL HERITAGE CURTILAGE INVESTIGATION AREASPECIAL HERITAGE CURTILAGE INVESTIGATION AREASPECIAL HERITAGE CURTILAGE INVESTIGATION AREASPECIAL HERITAGE CURTILAGE INVESTIGATION AREASPECIAL HERITAGE CURTILAGE INVESTIGATION AREASPECIAL HERITAGE CURTILAGE INVESTIGATION AREA
SP
EC
IAL
HE
RIT
AG
E C
UR
TIL
AG
ES
PE
CIA
L H
ER
ITA
GE
CU
RT
ILA
GE
SP
EC
IAL
HE
RIT
AG
E C
UR
TIL
AG
ES
PE
CIA
L H
ER
ITA
GE
CU
RT
ILA
GE
SP
EC
IAL
HE
RIT
AG
E C
UR
TIL
AG
ES
PE
CIA
L H
ER
ITA
GE
CU
RT
ILA
GE
SP
EC
IAL
HE
RIT
AG
E C
UR
TIL
AG
ES
PE
CIA
L H
ER
ITA
GE
CU
RT
ILA
GE
SP
EC
IAL
HE
RIT
AG
E C
UR
TIL
AG
ES
PE
CIA
L H
ER
ITA
GE
CU
RT
ILA
GE
SP
EC
IAL
HE
RIT
AG
E C
UR
TIL
AG
ES
PE
CIA
L H
ER
ITA
GE
CU
RT
ILA
GE
SP
EC
IAL
HE
RIT
AG
E C
UR
TIL
AG
ES
PE
CIA
L H
ER
ITA
GE
CU
RT
ILA
GE
SP
EC
IAL
HE
RIT
AG
E C
UR
TIL
AG
ES
PE
CIA
L H
ER
ITA
GE
CU
RT
ILA
GE
SP
EC
IAL
HE
RIT
AG
E C
UR
TIL
AG
ES
PE
CIA
L H
ER
ITA
GE
CU
RT
ILA
GE
SP
EC
IAL
HE
RIT
AG
E C
UR
TIL
AG
ES
PE
CIA
L H
ER
ITA
GE
CU
RT
ILA
GE
SP
EC
IAL
HE
RIT
AG
E C
UR
TIL
AG
ES
PE
CIA
L H
ER
ITA
GE
CU
RT
ILA
GE
SP
EC
IAL
HE
RIT
AG
E C
UR
TIL
AG
ES
PE
CIA
L H
ER
ITA
GE
CU
RT
ILA
GE
SP
EC
IAL
HE
RIT
AG
E C
UR
TIL
AG
ES
PE
CIA
L H
ER
ITA
GE
CU
RT
ILA
GE
SP
EC
IAL
HE
RIT
AG
E C
UR
TIL
AG
ES
PE
CIA
L H
ER
ITA
GE
CU
RT
ILA
GE
SP
EC
IAL
HE
RIT
AG
E C
UR
TIL
AG
ES
PE
CIA
L H
ER
ITA
GE
CU
RT
ILA
GE
SP
EC
IAL
HE
RIT
AG
E C
UR
TIL
AG
ES
PE
CIA
L H
ER
ITA
GE
CU
RT
ILA
GE
SP
EC
IAL
HE
RIT
AG
E C
UR
TIL
AG
ES
PE
CIA
L H
ER
ITA
GE
CU
RT
ILA
GE
SP
EC
IAL
HE
RIT
AG
E C
UR
TIL
AG
ES
PE
CIA
L H
ER
ITA
GE
CU
RT
ILA
GE
SP
EC
IAL
HE
RIT
AG
E C
UR
TIL
AG
ES
PE
CIA
L H
ER
ITA
GE
CU
RT
ILA
GE
SP
EC
IAL
HE
RIT
AG
E C
UR
TIL
AG
ES
PE
CIA
L H
ER
ITA
GE
CU
RT
ILA
GE
SP
EC
IAL
HE
RIT
AG
E C
UR
TIL
AG
ES
PE
CIA
L H
ER
ITA
GE
CU
RT
ILA
GE
SP
EC
IAL
HE
RIT
AG
E C
UR
TIL
AG
ES
PE
CIA
L H
ER
ITA
GE
CU
RT
ILA
GE
SP
EC
IAL
HE
RIT
AG
E C
UR
TIL
AG
ES
PE
CIA
L H
ER
ITA
GE
CU
RT
ILA
GE
SP
EC
IAL
HE
RIT
AG
E C
UR
TIL
AG
ES
PE
CIA
L H
ER
ITA
GE
CU
RT
ILA
GE
SP
EC
IAL
HE
RIT
AG
E C
UR
TIL
AG
E
INV
ES
TIG
AT
ION
AR
EA
INV
ES
TIG
AT
ION
AR
EA
INV
ES
TIG
AT
ION
AR
EA
INV
ES
TIG
AT
ION
AR
EA
INV
ES
TIG
AT
ION
AR
EA
INV
ES
TIG
AT
ION
AR
EA
INV
ES
TIG
AT
ION
AR
EA
INV
ES
TIG
AT
ION
AR
EA
INV
ES
TIG
AT
ION
AR
EA
INV
ES
TIG
AT
ION
AR
EA
INV
ES
TIG
AT
ION
AR
EA
INV
ES
TIG
AT
ION
AR
EA
INV
ES
TIG
AT
ION
AR
EA
INV
ES
TIG
AT
ION
AR
EA
INV
ES
TIG
AT
ION
AR
EA
INV
ES
TIG
AT
ION
AR
EA
INV
ES
TIG
AT
ION
AR
EA
INV
ES
TIG
AT
ION
AR
EA
INV
ES
TIG
AT
ION
AR
EA
INV
ES
TIG
AT
ION
AR
EA
INV
ES
TIG
AT
ION
AR
EA
INV
ES
TIG
AT
ION
AR
EA
INV
ES
TIG
AT
ION
AR
EA
INV
ES
TIG
AT
ION
AR
EA
INV
ES
TIG
AT
ION
AR
EA
INV
ES
TIG
AT
ION
AR
EA
INV
ES
TIG
AT
ION
AR
EA
INV
ES
TIG
AT
ION
AR
EA
INV
ES
TIG
AT
ION
AR
EA
INV
ES
TIG
AT
ION
AR
EA
INV
ES
TIG
AT
ION
AR
EA
INV
ES
TIG
AT
ION
AR
EA
INV
ES
TIG
AT
ION
AR
EA
INV
ES
TIG
AT
ION
AR
EA
INV
ES
TIG
AT
ION
AR
EA
INV
ES
TIG
AT
ION
AR
EA
INV
ES
TIG
AT
ION
AR
EA
INV
ES
TIG
AT
ION
AR
EA
INV
ES
TIG
AT
ION
AR
EA
INV
ES
TIG
AT
ION
AR
EA
INV
ES
TIG
AT
ION
AR
EA
INV
ES
TIG
AT
ION
AR
EA
INV
ES
TIG
AT
ION
AR
EA
INV
ES
TIG
AT
ION
AR
EA
INV
ES
TIG
AT
ION
AR
EA
INV
ES
TIG
AT
ION
AR
EA
INV
ES
TIG
AT
ION
AR
EA
INV
ES
TIG
AT
ION
AR
EA
INV
ES
TIG
AT
ION
AR
EA
SPEC
IAL H
ER
ITA
GE C
UR
TIL
AG
E IN
VESTIG
ATIO
N A
REA
SPEC
IAL H
ER
ITA
GE C
UR
TIL
AG
E IN
VESTIG
ATIO
N A
REA
SPEC
IAL H
ER
ITA
GE C
UR
TIL
AG
E IN
VESTIG
ATIO
N A
REA
SPEC
IAL H
ER
ITA
GE C
UR
TIL
AG
E IN
VESTIG
ATIO
N A
REA
SPEC
IAL H
ER
ITA
GE C
UR
TIL
AG
E IN
VESTIG
ATIO
N A
REA
SPEC
IAL H
ER
ITA
GE C
UR
TIL
AG
E IN
VESTIG
ATIO
N A
REA
SPEC
IAL H
ER
ITA
GE C
UR
TIL
AG
E IN
VESTIG
ATIO
N A
REA
SPEC
IAL H
ER
ITA
GE C
UR
TIL
AG
E IN
VESTIG
ATIO
N A
REA
SPEC
IAL H
ER
ITA
GE C
UR
TIL
AG
E IN
VESTIG
ATIO
N A
REA
SPEC
IAL H
ER
ITA
GE C
UR
TIL
AG
E IN
VESTIG
ATIO
N A
REA
SPEC
IAL H
ER
ITA
GE C
UR
TIL
AG
E IN
VESTIG
ATIO
N A
REA
SPEC
IAL H
ER
ITA
GE C
UR
TIL
AG
E IN
VESTIG
ATIO
N A
REA
SPEC
IAL H
ER
ITA
GE C
UR
TIL
AG
E IN
VESTIG
ATIO
N A
REA
SPEC
IAL H
ER
ITA
GE C
UR
TIL
AG
E IN
VESTIG
ATIO
N A
REA
SPEC
IAL H
ER
ITA
GE C
UR
TIL
AG
E IN
VESTIG
ATIO
N A
REA
SPEC
IAL H
ER
ITA
GE C
UR
TIL
AG
E IN
VESTIG
ATIO
N A
REA
SPEC
IAL H
ER
ITA
GE C
UR
TIL
AG
E IN
VESTIG
ATIO
N A
REA
SPEC
IAL H
ER
ITA
GE C
UR
TIL
AG
E IN
VESTIG
ATIO
N A
REA
SPEC
IAL H
ER
ITA
GE C
UR
TIL
AG
E IN
VESTIG
ATIO
N A
REA
SPEC
IAL H
ER
ITA
GE C
UR
TIL
AG
E IN
VESTIG
ATIO
N A
REA
SPEC
IAL H
ER
ITA
GE C
UR
TIL
AG
E IN
VESTIG
ATIO
N A
REA
SPEC
IAL H
ER
ITA
GE C
UR
TIL
AG
E IN
VESTIG
ATIO
N A
REA
SPEC
IAL H
ER
ITA
GE C
UR
TIL
AG
E IN
VESTIG
ATIO
N A
REA
SPEC
IAL H
ER
ITA
GE C
UR
TIL
AG
E IN
VESTIG
ATIO
N A
REA
SPEC
IAL H
ER
ITA
GE C
UR
TIL
AG
E IN
VESTIG
ATIO
N A
REA
SPEC
IAL H
ER
ITA
GE C
UR
TIL
AG
E IN
VESTIG
ATIO
N A
REA
SPEC
IAL H
ER
ITA
GE C
UR
TIL
AG
E IN
VESTIG
ATIO
N A
REA
SPEC
IAL H
ER
ITA
GE C
UR
TIL
AG
E IN
VESTIG
ATIO
N A
REA
SPEC
IAL H
ER
ITA
GE C
UR
TIL
AG
E IN
VESTIG
ATIO
N A
REA
SPEC
IAL H
ER
ITA
GE C
UR
TIL
AG
E IN
VESTIG
ATIO
N A
REA
SPEC
IAL H
ER
ITA
GE C
UR
TIL
AG
E IN
VESTIG
ATIO
N A
REA
SPEC
IAL H
ER
ITA
GE C
UR
TIL
AG
E IN
VESTIG
ATIO
N A
REA
SPEC
IAL H
ER
ITA
GE C
UR
TIL
AG
E IN
VESTIG
ATIO
N A
REA
SPEC
IAL H
ER
ITA
GE C
UR
TIL
AG
E IN
VESTIG
ATIO
N A
REA
SPEC
IAL H
ER
ITA
GE C
UR
TIL
AG
E IN
VESTIG
ATIO
N A
REA
SPEC
IAL H
ER
ITA
GE C
UR
TIL
AG
E IN
VESTIG
ATIO
N A
REA
SPEC
IAL H
ER
ITA
GE C
UR
TIL
AG
E IN
VESTIG
ATIO
N A
REA
SPEC
IAL H
ER
ITA
GE C
UR
TIL
AG
E IN
VESTIG
ATIO
N A
REA
SPEC
IAL H
ER
ITA
GE C
UR
TIL
AG
E IN
VESTIG
ATIO
N A
REA
SPEC
IAL H
ER
ITA
GE C
UR
TIL
AG
E IN
VESTIG
ATIO
N A
REA
SPEC
IAL H
ER
ITA
GE C
UR
TIL
AG
E IN
VESTIG
ATIO
N A
REA
SPEC
IAL H
ER
ITA
GE C
UR
TIL
AG
E IN
VESTIG
ATIO
N A
REA
SPEC
IAL H
ER
ITA
GE C
UR
TIL
AG
E IN
VESTIG
ATIO
N A
REA
SPEC
IAL H
ER
ITA
GE C
UR
TIL
AG
E IN
VESTIG
ATIO
N A
REA
SPEC
IAL H
ER
ITA
GE C
UR
TIL
AG
E IN
VESTIG
ATIO
N A
REA
SPEC
IAL H
ER
ITA
GE C
UR
TIL
AG
E IN
VESTIG
ATIO
N A
REA
SPEC
IAL H
ER
ITA
GE C
UR
TIL
AG
E IN
VESTIG
ATIO
N A
REA
SPEC
IAL H
ER
ITA
GE C
UR
TIL
AG
E IN
VESTIG
ATIO
N A
REA
SPEC
IAL H
ER
ITA
GE C
UR
TIL
AG
E IN
VESTIG
ATIO
N A
REA
SPECIAL H
ERITAGE CURTIL
AGE INVESTIG
ATION A
REA
SPECIAL H
ERITAGE CURTIL
AGE INVESTIG
ATION A
REA
SPECIAL H
ERITAGE CURTIL
AGE INVESTIG
ATION A
REA
SPECIAL H
ERITAGE CURTIL
AGE INVESTIG
ATION A
REA
SPECIAL H
ERITAGE CURTIL
AGE INVESTIG
ATION A
REA
SPECIAL H
ERITAGE CURTIL
AGE INVESTIG
ATION A
REA
SPECIAL H
ERITAGE CURTIL
AGE INVESTIG
ATION A
REA
SPECIAL H
ERITAGE CURTIL
AGE INVESTIG
ATION A
REA
SPECIAL H
ERITAGE CURTIL
AGE INVESTIG
ATION A
REA
SPECIAL H
ERITAGE CURTIL
AGE INVESTIG
ATION A
REA
SPECIAL H
ERITAGE CURTIL
AGE INVESTIG
ATION A
REA
SPECIAL H
ERITAGE CURTIL
AGE INVESTIG
ATION A
REA
SPECIAL H
ERITAGE CURTIL
AGE INVESTIG
ATION A
REA
SPECIAL H
ERITAGE CURTIL
AGE INVESTIG
ATION A
REA
SPECIAL H
ERITAGE CURTIL
AGE INVESTIG
ATION A
REA
SPECIAL H
ERITAGE CURTIL
AGE INVESTIG
ATION A
REA
SPECIAL H
ERITAGE CURTIL
AGE INVESTIG
ATION A
REA
SPECIAL H
ERITAGE CURTIL
AGE INVESTIG
ATION A
REA
SPECIAL H
ERITAGE CURTIL
AGE INVESTIG
ATION A
REA
SPECIAL H
ERITAGE CURTIL
AGE INVESTIG
ATION A
REA
SPECIAL H
ERITAGE CURTIL
AGE INVESTIG
ATION A
REA
SPECIAL H
ERITAGE CURTIL
AGE INVESTIG
ATION A
REA
SPECIAL H
ERITAGE CURTIL
AGE INVESTIG
ATION A
REA
SPECIAL H
ERITAGE CURTIL
AGE INVESTIG
ATION A
REA
SPECIAL H
ERITAGE CURTIL
AGE INVESTIG
ATION A
REA
SPECIAL H
ERITAGE CURTIL
AGE INVESTIG
ATION A
REA
SPECIAL H
ERITAGE CURTIL
AGE INVESTIG
ATION A
REA
SPECIAL H
ERITAGE CURTIL
AGE INVESTIG
ATION A
REA
SPECIAL H
ERITAGE CURTIL
AGE INVESTIG
ATION A
REA
SPECIAL H
ERITAGE CURTIL
AGE INVESTIG
ATION A
REA
SPECIAL H
ERITAGE CURTIL
AGE INVESTIG
ATION A
REA
SPECIAL H
ERITAGE CURTIL
AGE INVESTIG
ATION A
REA
SPECIAL H
ERITAGE CURTIL
AGE INVESTIG
ATION A
REA
SPECIAL H
ERITAGE CURTIL
AGE INVESTIG
ATION A
REA
SPECIAL H
ERITAGE CURTIL
AGE INVESTIG
ATION A
REA
SPECIAL H
ERITAGE CURTIL
AGE INVESTIG
ATION A
REA
SPECIAL H
ERITAGE CURTIL
AGE INVESTIG
ATION A
REA
SPECIAL H
ERITAGE CURTIL
AGE INVESTIG
ATION A
REA
SPECIAL H
ERITAGE CURTIL
AGE INVESTIG
ATION A
REA
SPECIAL H
ERITAGE CURTIL
AGE INVESTIG
ATION A
REA
SPECIAL H
ERITAGE CURTIL
AGE INVESTIG
ATION A
REA
SPECIAL H
ERITAGE CURTIL
AGE INVESTIG
ATION A
REA
SPECIAL H
ERITAGE CURTIL
AGE INVESTIG
ATION A
REA
SPECIAL H
ERITAGE CURTIL
AGE INVESTIG
ATION A
REA
SPECIAL H
ERITAGE CURTIL
AGE INVESTIG
ATION A
REA
SPECIAL H
ERITAGE CURTIL
AGE INVESTIG
ATION A
REA
SPECIAL H
ERITAGE CURTIL
AGE INVESTIG
ATION A
REA
SPECIAL H
ERITAGE CURTIL
AGE INVESTIG
ATION A
REA
SPECIAL H
ERITAGE CURTIL
AGE INVESTIG
ATION A
REA
SPECIAL HERITAGE CURTILAGE INVESTIGATION AREASPECIAL HERITAGE CURTILAGE INVESTIGATION AREASPECIAL HERITAGE CURTILAGE INVESTIGATION AREASPECIAL HERITAGE CURTILAGE INVESTIGATION AREASPECIAL HERITAGE CURTILAGE INVESTIGATION AREASPECIAL HERITAGE CURTILAGE INVESTIGATION AREASPECIAL HERITAGE CURTILAGE INVESTIGATION AREASPECIAL HERITAGE CURTILAGE INVESTIGATION AREASPECIAL HERITAGE CURTILAGE INVESTIGATION AREASPECIAL HERITAGE CURTILAGE INVESTIGATION AREASPECIAL HERITAGE CURTILAGE INVESTIGATION AREASPECIAL HERITAGE CURTILAGE INVESTIGATION AREASPECIAL HERITAGE CURTILAGE INVESTIGATION AREASPECIAL HERITAGE CURTILAGE INVESTIGATION AREASPECIAL HERITAGE CURTILAGE INVESTIGATION AREASPECIAL HERITAGE CURTILAGE INVESTIGATION AREASPECIAL HERITAGE CURTILAGE INVESTIGATION AREASPECIAL HERITAGE CURTILAGE INVESTIGATION AREASPECIAL HERITAGE CURTILAGE INVESTIGATION AREASPECIAL HERITAGE CURTILAGE INVESTIGATION AREASPECIAL HERITAGE CURTILAGE INVESTIGATION AREASPECIAL HERITAGE CURTILAGE INVESTIGATION AREASPECIAL HERITAGE CURTILAGE INVESTIGATION AREASPECIAL HERITAGE CURTILAGE INVESTIGATION AREASPECIAL HERITAGE CURTILAGE INVESTIGATION AREASPECIAL HERITAGE CURTILAGE INVESTIGATION AREASPECIAL HERITAGE CURTILAGE INVESTIGATION AREASPECIAL HERITAGE CURTILAGE INVESTIGATION AREASPECIAL HERITAGE CURTILAGE INVESTIGATION AREASPECIAL HERITAGE CURTILAGE INVESTIGATION AREASPECIAL HERITAGE CURTILAGE INVESTIGATION AREASPECIAL HERITAGE CURTILAGE INVESTIGATION AREASPECIAL HERITAGE CURTILAGE INVESTIGATION AREASPECIAL HERITAGE CURTILAGE INVESTIGATION AREASPECIAL HERITAGE CURTILAGE INVESTIGATION AREASPECIAL HERITAGE CURTILAGE INVESTIGATION AREASPECIAL HERITAGE CURTILAGE INVESTIGATION AREASPECIAL HERITAGE CURTILAGE INVESTIGATION AREASPECIAL HERITAGE CURTILAGE INVESTIGATION AREASPECIAL HERITAGE CURTILAGE INVESTIGATION AREASPECIAL HERITAGE CURTILAGE INVESTIGATION AREASPECIAL HERITAGE CURTILAGE INVESTIGATION AREASPECIAL HERITAGE CURTILAGE INVESTIGATION AREASPECIAL HERITAGE CURTILAGE INVESTIGATION AREASPECIAL HERITAGE CURTILAGE INVESTIGATION AREASPECIAL HERITAGE CURTILAGE INVESTIGATION AREASPECIAL HERITAGE CURTILAGE INVESTIGATION AREASPECIAL HERITAGE CURTILAGE INVESTIGATION AREASPECIAL HERITAGE CURTILAGE INVESTIGATION AREA
SPECIAL HERITAGE CURTILAGE INVESTIGATION AREA
SPECIAL HERITAGE CURTILAGE INVESTIGATION AREA
SPECIAL HERITAGE CURTILAGE INVESTIGATION AREA
SPECIAL HERITAGE CURTILAGE INVESTIGATION AREA
SPECIAL HERITAGE CURTILAGE INVESTIGATION AREA
SPECIAL HERITAGE CURTILAGE INVESTIGATION AREA
SPECIAL HERITAGE CURTILAGE INVESTIGATION AREA
SPECIAL HERITAGE CURTILAGE INVESTIGATION AREA
SPECIAL HERITAGE CURTILAGE INVESTIGATION AREA
SPECIAL HERITAGE CURTILAGE INVESTIGATION AREA
SPECIAL HERITAGE CURTILAGE INVESTIGATION AREA
SPECIAL HERITAGE CURTILAGE INVESTIGATION AREA
SPECIAL HERITAGE CURTILAGE INVESTIGATION AREA
SPECIAL HERITAGE CURTILAGE INVESTIGATION AREA
SPECIAL HERITAGE CURTILAGE INVESTIGATION AREA
SPECIAL HERITAGE CURTILAGE INVESTIGATION AREA
SPECIAL HERITAGE CURTILAGE INVESTIGATION AREA
SPECIAL HERITAGE CURTILAGE INVESTIGATION AREA
SPECIAL HERITAGE CURTILAGE INVESTIGATION AREA
SPECIAL HERITAGE CURTILAGE INVESTIGATION AREA
SPECIAL HERITAGE CURTILAGE INVESTIGATION AREA
SPECIAL HERITAGE CURTILAGE INVESTIGATION AREA
SPECIAL HERITAGE CURTILAGE INVESTIGATION AREA
SPECIAL HERITAGE CURTILAGE INVESTIGATION AREA
SPECIAL HERITAGE CURTILAGE INVESTIGATION AREA
SPECIAL HERITAGE CURTILAGE INVESTIGATION AREA
SPECIAL HERITAGE CURTILAGE INVESTIGATION AREA
SPECIAL HERITAGE CURTILAGE INVESTIGATION AREA
SPECIAL HERITAGE CURTILAGE INVESTIGATION AREA
SPECIAL HERITAGE CURTILAGE INVESTIGATION AREA
SPECIAL HERITAGE CURTILAGE INVESTIGATION AREA
SPECIAL HERITAGE CURTILAGE INVESTIGATION AREA
SPECIAL HERITAGE CURTILAGE INVESTIGATION AREA
SPECIAL HERITAGE CURTILAGE INVESTIGATION AREA
SPECIAL HERITAGE CURTILAGE INVESTIGATION AREA
SPECIAL HERITAGE CURTILAGE INVESTIGATION AREA
SPECIAL HERITAGE CURTILAGE INVESTIGATION AREA
SPECIAL HERITAGE CURTILAGE INVESTIGATION AREA
SPECIAL HERITAGE CURTILAGE INVESTIGATION AREA
SPECIAL HERITAGE CURTILAGE INVESTIGATION AREA
SPECIAL HERITAGE CURTILAGE INVESTIGATION AREA
SPECIAL HERITAGE CURTILAGE INVESTIGATION AREA
SPECIAL HERITAGE CURTILAGE INVESTIGATION AREA
SPECIAL HERITAGE CURTILAGE INVESTIGATION AREA
SPECIAL HERITAGE CURTILAGE INVESTIGATION AREA
SPECIAL HERITAGE CURTILAGE INVESTIGATION AREA
SPECIAL HERITAGE CURTILAGE INVESTIGATION AREA
SPECIAL HERITAGE CURTILAGE INVESTIGATION AREA
SPECIAL HERITAGE CURTILAGE INVESTIGATION AREA
SP
EC
IAL H
ER
ITA
GE
CU
RTIL
AG
E IN
VE
STIG
ATIO
N A
RE
A
SP
EC
IAL H
ER
ITA
GE
CU
RTIL
AG
E IN
VE
STIG
ATIO
N A
RE
A
SP
EC
IAL H
ER
ITA
GE
CU
RTIL
AG
E IN
VE
STIG
ATIO
N A
RE
A
SP
EC
IAL H
ER
ITA
GE
CU
RTIL
AG
E IN
VE
STIG
ATIO
N A
RE
A
SP
EC
IAL H
ER
ITA
GE
CU
RTIL
AG
E IN
VE
STIG
ATIO
N A
RE
A
SP
EC
IAL H
ER
ITA
GE
CU
RTIL
AG
E IN
VE
STIG
ATIO
N A
RE
A
SP
EC
IAL H
ER
ITA
GE
CU
RTIL
AG
E IN
VE
STIG
ATIO
N A
RE
A
SP
EC
IAL H
ER
ITA
GE
CU
RTIL
AG
E IN
VE
STIG
ATIO
N A
RE
A
SP
EC
IAL H
ER
ITA
GE
CU
RTIL
AG
E IN
VE
STIG
ATIO
N A
RE
A
SP
EC
IAL H
ER
ITA
GE
CU
RTIL
AG
E IN
VE
STIG
ATIO
N A
RE
A
SP
EC
IAL H
ER
ITA
GE
CU
RTIL
AG
E IN
VE
STIG
ATIO
N A
RE
A
SP
EC
IAL H
ER
ITA
GE
CU
RTIL
AG
E IN
VE
STIG
ATIO
N A
RE
A
SP
EC
IAL H
ER
ITA
GE
CU
RTIL
AG
E IN
VE
STIG
ATIO
N A
RE
A
SP
EC
IAL H
ER
ITA
GE
CU
RTIL
AG
E IN
VE
STIG
ATIO
N A
RE
A
SP
EC
IAL H
ER
ITA
GE
CU
RTIL
AG
E IN
VE
STIG
ATIO
N A
RE
A
SP
EC
IAL H
ER
ITA
GE
CU
RTIL
AG
E IN
VE
STIG
ATIO
N A
RE
A
SP
EC
IAL H
ER
ITA
GE
CU
RTIL
AG
E IN
VE
STIG
ATIO
N A
RE
A
SP
EC
IAL H
ER
ITA
GE
CU
RTIL
AG
E IN
VE
STIG
ATIO
N A
RE
A
SP
EC
IAL H
ER
ITA
GE
CU
RTIL
AG
E IN
VE
STIG
ATIO
N A
RE
A
SP
EC
IAL H
ER
ITA
GE
CU
RTIL
AG
E IN
VE
STIG
ATIO
N A
RE
A
SP
EC
IAL H
ER
ITA
GE
CU
RTIL
AG
E IN
VE
STIG
ATIO
N A
RE
A
SP
EC
IAL H
ER
ITA
GE
CU
RTIL
AG
E IN
VE
STIG
ATIO
N A
RE
A
SP
EC
IAL H
ER
ITA
GE
CU
RTIL
AG
E IN
VE
STIG
ATIO
N A
RE
A
SP
EC
IAL H
ER
ITA
GE
CU
RTIL
AG
E IN
VE
STIG
ATIO
N A
RE
A
SP
EC
IAL H
ER
ITA
GE
CU
RTIL
AG
E IN
VE
STIG
ATIO
N A
RE
A
SP
EC
IAL H
ER
ITA
GE
CU
RTIL
AG
E IN
VE
STIG
ATIO
N A
RE
A
SP
EC
IAL H
ER
ITA
GE
CU
RTIL
AG
E IN
VE
STIG
ATIO
N A
RE
A
SP
EC
IAL H
ER
ITA
GE
CU
RTIL
AG
E IN
VE
STIG
ATIO
N A
RE
A
SP
EC
IAL H
ER
ITA
GE
CU
RTIL
AG
E IN
VE
STIG
ATIO
N A
RE
A
SP
EC
IAL H
ER
ITA
GE
CU
RTIL
AG
E IN
VE
STIG
ATIO
N A
RE
A
SP
EC
IAL H
ER
ITA
GE
CU
RTIL
AG
E IN
VE
STIG
ATIO
N A
RE
A
SP
EC
IAL H
ER
ITA
GE
CU
RTIL
AG
E IN
VE
STIG
ATIO
N A
RE
A
SP
EC
IAL H
ER
ITA
GE
CU
RTIL
AG
E IN
VE
STIG
ATIO
N A
RE
A
SP
EC
IAL H
ER
ITA
GE
CU
RTIL
AG
E IN
VE
STIG
ATIO
N A
RE
A
SP
EC
IAL H
ER
ITA
GE
CU
RTIL
AG
E IN
VE
STIG
ATIO
N A
RE
A
SP
EC
IAL H
ER
ITA
GE
CU
RTIL
AG
E IN
VE
STIG
ATIO
N A
RE
A
SP
EC
IAL H
ER
ITA
GE
CU
RTIL
AG
E IN
VE
STIG
ATIO
N A
RE
A
SP
EC
IAL H
ER
ITA
GE
CU
RTIL
AG
E IN
VE
STIG
ATIO
N A
RE
A
SP
EC
IAL H
ER
ITA
GE
CU
RTIL
AG
E IN
VE
STIG
ATIO
N A
RE
A
SP
EC
IAL H
ER
ITA
GE
CU
RTIL
AG
E IN
VE
STIG
ATIO
N A
RE
A
SP
EC
IAL H
ER
ITA
GE
CU
RTIL
AG
E IN
VE
STIG
ATIO
N A
RE
A
SP
EC
IAL H
ER
ITA
GE
CU
RTIL
AG
E IN
VE
STIG
ATIO
N A
RE
A
SP
EC
IAL H
ER
ITA
GE
CU
RTIL
AG
E IN
VE
STIG
ATIO
N A
RE
A
SP
EC
IAL H
ER
ITA
GE
CU
RTIL
AG
E IN
VE
STIG
ATIO
N A
RE
A
SP
EC
IAL H
ER
ITA
GE
CU
RTIL
AG
E IN
VE
STIG
ATIO
N A
RE
A
SP
EC
IAL H
ER
ITA
GE
CU
RTIL
AG
E IN
VE
STIG
ATIO
N A
RE
A
SP
EC
IAL H
ER
ITA
GE
CU
RTIL
AG
E IN
VE
STIG
ATIO
N A
RE
A
SP
EC
IAL H
ER
ITA
GE
CU
RTIL
AG
E IN
VE
STIG
ATIO
N A
RE
A
SP
EC
IAL H
ER
ITA
GE
CU
RTIL
AG
E IN
VE
STIG
ATIO
N A
RE
A
SPEC
IAL H
ERIT
AG
E C
UR
TILA
GE IN
VESTIG
ATIO
N A
REA
SPEC
IAL H
ERIT
AG
E C
UR
TILA
GE IN
VESTIG
ATIO
N A
REA
SPEC
IAL H
ERIT
AG
E C
UR
TILA
GE IN
VESTIG
ATIO
N A
REA
SPEC
IAL H
ERIT
AG
E C
UR
TILA
GE IN
VESTIG
ATIO
N A
REA
SPEC
IAL H
ERIT
AG
E C
UR
TILA
GE IN
VESTIG
ATIO
N A
REA
SPEC
IAL H
ERIT
AG
E C
UR
TILA
GE IN
VESTIG
ATIO
N A
REA
SPEC
IAL H
ERIT
AG
E C
UR
TILA
GE IN
VESTIG
ATIO
N A
REA
SPEC
IAL H
ERIT
AG
E C
UR
TILA
GE IN
VESTIG
ATIO
N A
REA
SPEC
IAL H
ERIT
AG
E C
UR
TILA
GE IN
VESTIG
ATIO
N A
REA
SPEC
IAL H
ERIT
AG
E C
UR
TILA
GE IN
VESTIG
ATIO
N A
REA
SPEC
IAL H
ERIT
AG
E C
UR
TILA
GE IN
VESTIG
ATIO
N A
REA
SPEC
IAL H
ERIT
AG
E C
UR
TILA
GE IN
VESTIG
ATIO
N A
REA
SPEC
IAL H
ERIT
AG
E C
UR
TILA
GE IN
VESTIG
ATIO
N A
REA
SPEC
IAL H
ERIT
AG
E C
UR
TILA
GE IN
VESTIG
ATIO
N A
REA
SPEC
IAL H
ERIT
AG
E C
UR
TILA
GE IN
VESTIG
ATIO
N A
REA
SPEC
IAL H
ERIT
AG
E C
UR
TILA
GE IN
VESTIG
ATIO
N A
REA
SPEC
IAL H
ERIT
AG
E C
UR
TILA
GE IN
VESTIG
ATIO
N A
REA
SPEC
IAL H
ERIT
AG
E C
UR
TILA
GE IN
VESTIG
ATIO
N A
REA
SPEC
IAL H
ERIT
AG
E C
UR
TILA
GE IN
VESTIG
ATIO
N A
REA
SPEC
IAL H
ERIT
AG
E C
UR
TILA
GE IN
VESTIG
ATIO
N A
REA
SPEC
IAL H
ERIT
AG
E C
UR
TILA
GE IN
VESTIG
ATIO
N A
REA
SPEC
IAL H
ERIT
AG
E C
UR
TILA
GE IN
VESTIG
ATIO
N A
REA
SPEC
IAL H
ERIT
AG
E C
UR
TILA
GE IN
VESTIG
ATIO
N A
REA
SPEC
IAL H
ERIT
AG
E C
UR
TILA
GE IN
VESTIG
ATIO
N A
REA
SPEC
IAL H
ERIT
AG
E C
UR
TILA
GE IN
VESTIG
ATIO
N A
REA
SPEC
IAL H
ERIT
AG
E C
UR
TILA
GE IN
VESTIG
ATIO
N A
REA
SPEC
IAL H
ERIT
AG
E C
UR
TILA
GE IN
VESTIG
ATIO
N A
REA
SPEC
IAL H
ERIT
AG
E C
UR
TILA
GE IN
VESTIG
ATIO
N A
REA
SPEC
IAL H
ERIT
AG
E C
UR
TILA
GE IN
VESTIG
ATIO
N A
REA
SPEC
IAL H
ERIT
AG
E C
UR
TILA
GE IN
VESTIG
ATIO
N A
REA
SPEC
IAL H
ERIT
AG
E C
UR
TILA
GE IN
VESTIG
ATIO
N A
REA
SPEC
IAL H
ERIT
AG
E C
UR
TILA
GE IN
VESTIG
ATIO
N A
REA
SPEC
IAL H
ERIT
AG
E C
UR
TILA
GE IN
VESTIG
ATIO
N A
REA
SPEC
IAL H
ERIT
AG
E C
UR
TILA
GE IN
VESTIG
ATIO
N A
REA
SPEC
IAL H
ERIT
AG
E C
UR
TILA
GE IN
VESTIG
ATIO
N A
REA
SPEC
IAL H
ERIT
AG
E C
UR
TILA
GE IN
VESTIG
ATIO
N A
REA
SPEC
IAL H
ERIT
AG
E C
UR
TILA
GE IN
VESTIG
ATIO
N A
REA
SPEC
IAL H
ERIT
AG
E C
UR
TILA
GE IN
VESTIG
ATIO
N A
REA
SPEC
IAL H
ERIT
AG
E C
UR
TILA
GE IN
VESTIG
ATIO
N A
REA
SPEC
IAL H
ERIT
AG
E C
UR
TILA
GE IN
VESTIG
ATIO
N A
REA
SPEC
IAL H
ERIT
AG
E C
UR
TILA
GE IN
VESTIG
ATIO
N A
REA
SPEC
IAL H
ERIT
AG
E C
UR
TILA
GE IN
VESTIG
ATIO
N A
REA
SPEC
IAL H
ERIT
AG
E C
UR
TILA
GE IN
VESTIG
ATIO
N A
REA
SPEC
IAL H
ERIT
AG
E C
UR
TILA
GE IN
VESTIG
ATIO
N A
REA
SPEC
IAL H
ERIT
AG
E C
UR
TILA
GE IN
VESTIG
ATIO
N A
REA
SPEC
IAL H
ERIT
AG
E C
UR
TILA
GE IN
VESTIG
ATIO
N A
REA
SPEC
IAL H
ERIT
AG
E C
UR
TILA
GE IN
VESTIG
ATIO
N A
REA
SPEC
IAL H
ERIT
AG
E C
UR
TILA
GE IN
VESTIG
ATIO
N A
REA
SPEC
IAL H
ERIT
AG
E C
UR
TILA
GE IN
VESTIG
ATIO
N A
REA
SP
EC
IAL
HE
RIT
AG
E C
UR
TIL
AG
E IN
VE
ST
IGA
TIO
N A
RE
A
SP
EC
IAL
HE
RIT
AG
E C
UR
TIL
AG
E IN
VE
ST
IGA
TIO
N A
RE
A
SP
EC
IAL
HE
RIT
AG
E C
UR
TIL
AG
E IN
VE
ST
IGA
TIO
N A
RE
A
SP
EC
IAL
HE
RIT
AG
E C
UR
TIL
AG
E IN
VE
ST
IGA
TIO
N A
RE
A
SP
EC
IAL
HE
RIT
AG
E C
UR
TIL
AG
E IN
VE
ST
IGA
TIO
N A
RE
A
SP
EC
IAL
HE
RIT
AG
E C
UR
TIL
AG
E IN
VE
ST
IGA
TIO
N A
RE
A
SP
EC
IAL
HE
RIT
AG
E C
UR
TIL
AG
E IN
VE
ST
IGA
TIO
N A
RE
A
SP
EC
IAL
HE
RIT
AG
E C
UR
TIL
AG
E IN
VE
ST
IGA
TIO
N A
RE
A
SP
EC
IAL
HE
RIT
AG
E C
UR
TIL
AG
E IN
VE
ST
IGA
TIO
N A
RE
A
SP
EC
IAL
HE
RIT
AG
E C
UR
TIL
AG
E IN
VE
ST
IGA
TIO
N A
RE
A
SP
EC
IAL
HE
RIT
AG
E C
UR
TIL
AG
E IN
VE
ST
IGA
TIO
N A
RE
A
SP
EC
IAL
HE
RIT
AG
E C
UR
TIL
AG
E IN
VE
ST
IGA
TIO
N A
RE
A
SP
EC
IAL
HE
RIT
AG
E C
UR
TIL
AG
E IN
VE
ST
IGA
TIO
N A
RE
A
SP
EC
IAL
HE
RIT
AG
E C
UR
TIL
AG
E IN
VE
ST
IGA
TIO
N A
RE
A
SP
EC
IAL
HE
RIT
AG
E C
UR
TIL
AG
E IN
VE
ST
IGA
TIO
N A
RE
A
SP
EC
IAL
HE
RIT
AG
E C
UR
TIL
AG
E IN
VE
ST
IGA
TIO
N A
RE
A
SP
EC
IAL
HE
RIT
AG
E C
UR
TIL
AG
E IN
VE
ST
IGA
TIO
N A
RE
A
SP
EC
IAL
HE
RIT
AG
E C
UR
TIL
AG
E IN
VE
ST
IGA
TIO
N A
RE
A
SP
EC
IAL
HE
RIT
AG
E C
UR
TIL
AG
E IN
VE
ST
IGA
TIO
N A
RE
A
SP
EC
IAL
HE
RIT
AG
E C
UR
TIL
AG
E IN
VE
ST
IGA
TIO
N A
RE
A
SP
EC
IAL
HE
RIT
AG
E C
UR
TIL
AG
E IN
VE
ST
IGA
TIO
N A
RE
A
SP
EC
IAL
HE
RIT
AG
E C
UR
TIL
AG
E IN
VE
ST
IGA
TIO
N A
RE
A
SP
EC
IAL
HE
RIT
AG
E C
UR
TIL
AG
E IN
VE
ST
IGA
TIO
N A
RE
A
SP
EC
IAL
HE
RIT
AG
E C
UR
TIL
AG
E IN
VE
ST
IGA
TIO
N A
RE
A
SP
EC
IAL
HE
RIT
AG
E C
UR
TIL
AG
E IN
VE
ST
IGA
TIO
N A
RE
A
SP
EC
IAL
HE
RIT
AG
E C
UR
TIL
AG
E IN
VE
ST
IGA
TIO
N A
RE
A
SP
EC
IAL
HE
RIT
AG
E C
UR
TIL
AG
E IN
VE
ST
IGA
TIO
N A
RE
A
SP
EC
IAL
HE
RIT
AG
E C
UR
TIL
AG
E IN
VE
ST
IGA
TIO
N A
RE
A
SP
EC
IAL
HE
RIT
AG
E C
UR
TIL
AG
E IN
VE
ST
IGA
TIO
N A
RE
A
SP
EC
IAL
HE
RIT
AG
E C
UR
TIL
AG
E IN
VE
ST
IGA
TIO
N A
RE
A
SP
EC
IAL
HE
RIT
AG
E C
UR
TIL
AG
E IN
VE
ST
IGA
TIO
N A
RE
A
SP
EC
IAL
HE
RIT
AG
E C
UR
TIL
AG
E IN
VE
ST
IGA
TIO
N A
RE
A
SP
EC
IAL
HE
RIT
AG
E C
UR
TIL
AG
E IN
VE
ST
IGA
TIO
N A
RE
A
SP
EC
IAL
HE
RIT
AG
E C
UR
TIL
AG
E IN
VE
ST
IGA
TIO
N A
RE
A
SP
EC
IAL
HE
RIT
AG
E C
UR
TIL
AG
E IN
VE
ST
IGA
TIO
N A
RE
A
SP
EC
IAL
HE
RIT
AG
E C
UR
TIL
AG
E IN
VE
ST
IGA
TIO
N A
RE
A
SP
EC
IAL
HE
RIT
AG
E C
UR
TIL
AG
E IN
VE
ST
IGA
TIO
N A
RE
A
SP
EC
IAL
HE
RIT
AG
E C
UR
TIL
AG
E IN
VE
ST
IGA
TIO
N A
RE
A
SP
EC
IAL
HE
RIT
AG
E C
UR
TIL
AG
E IN
VE
ST
IGA
TIO
N A
RE
A
SP
EC
IAL
HE
RIT
AG
E C
UR
TIL
AG
E IN
VE
ST
IGA
TIO
N A
RE
A
SP
EC
IAL
HE
RIT
AG
E C
UR
TIL
AG
E IN
VE
ST
IGA
TIO
N A
RE
A
SP
EC
IAL
HE
RIT
AG
E C
UR
TIL
AG
E IN
VE
ST
IGA
TIO
N A
RE
A
SP
EC
IAL
HE
RIT
AG
E C
UR
TIL
AG
E IN
VE
ST
IGA
TIO
N A
RE
A
SP
EC
IAL
HE
RIT
AG
E C
UR
TIL
AG
E IN
VE
ST
IGA
TIO
N A
RE
A
SP
EC
IAL
HE
RIT
AG
E C
UR
TIL
AG
E IN
VE
ST
IGA
TIO
N A
RE
A
SP
EC
IAL
HE
RIT
AG
E C
UR
TIL
AG
E IN
VE
ST
IGA
TIO
N A
RE
A
SP
EC
IAL
HE
RIT
AG
E C
UR
TIL
AG
E IN
VE
ST
IGA
TIO
N A
RE
A
SP
EC
IAL
HE
RIT
AG
E C
UR
TIL
AG
E IN
VE
ST
IGA
TIO
N A
RE
A
SP
EC
IAL
HE
RIT
AG
E C
UR
TIL
AG
E IN
VE
ST
IGA
TIO
N A
RE
A
0000
0000
Legend
Low density residential areas - R2
Large lot residential areas - R5
Draft residential rezonings
Potential residential growth areas
Low density residential areas (undeveloped)
Medium density residential areas - R3
00
Industrial zone areas - IN2, IN3
Draft Industrial rezonings
Potential employment areas - industrial
Business zone areas - B1, B2, B4
Public Recreation - RE1
Private Recreation - RE2
Potential employment areas - commercial

RidgelineRidgelineRidgelineRidgelineRidgelineRidgelineRidgelineRidgelineRidgelineRidgelineRidgelineRidgelineRidgelineRidgelineRidgelineRidgelineRidgelineRidgelineRidgelineRidgelineRidgelineRidgelineRidgelineRidgelineRidgelineRidgelineRidgelineRidgelineRidgelineRidgelineRidgelineRidgelineRidgelineRidgelineRidgelineRidgelineRidgelineRidgelineRidgelineRidgelineRidgelineRidgelineRidgelineRidgelineRidgelineRidgelineRidgelineRidgelineRidgelineRidgelineRidgelineRidgelineRidgelineRidgelineRidgelineRidgelineRidgelineRidgelineRidgelineRidgelineRidgelineRidgelineRidgelineRidgelineRidgeline
SHEIL
WIL
TO
N P
AR
K R
OA
D
MAR
CU
S
STREET
STOCKADE
ROAD
RO
AD
MA
LDO
N
BR
IDG
EM
ALD
ON
BR
IDG
E
RO
AD
PICTON ROAD
MENANGLE
ROAD
RA
NG
E
ROAD
WIL
TO
N
PA
RK
WIL
TO
N P
AR
K R
OA
D
MARCUS
STREET
RO
AD
PIC
TO
N
RO
AD
ME
NAN
GLE
PICTON
ROAD
MENANGLE
PICTON
ROAD
PICTO
N
RO
AD
LAN
E
GO
VE
RN
OR
S
DO
NALD
S
DLEP 75DLEP 75DLEP 75DLEP 75DLEP 75DLEP 75DLEP 75DLEP 75DLEP 75DLEP 75DLEP 75DLEP 75DLEP 75DLEP 75DLEP 75DLEP 75DLEP 75DLEP 75DLEP 75DLEP 75DLEP 75DLEP 75DLEP 75DLEP 75DLEP 75DLEP 75DLEP 75DLEP 75DLEP 75DLEP 75DLEP 75DLEP 75DLEP 75DLEP 75DLEP 75DLEP 75DLEP 75DLEP 75DLEP 75DLEP 75DLEP 75DLEP 75DLEP 75DLEP 75DLEP 75DLEP 75DLEP 75DLEP 75DLEP 75
DLEP 75DLEP 75DLEP 75DLEP 75DLEP 75DLEP 75DLEP 75DLEP 75DLEP 75DLEP 75DLEP 75DLEP 75DLEP 75DLEP 75DLEP 75DLEP 75DLEP 75DLEP 75DLEP 75DLEP 75DLEP 75DLEP 75DLEP 75DLEP 75DLEP 75DLEP 75DLEP 75DLEP 75DLEP 75DLEP 75DLEP 75DLEP 75DLEP 75DLEP 75DLEP 75DLEP 75DLEP 75DLEP 75DLEP 75DLEP 75DLEP 75DLEP 75DLEP 75DLEP 75DLEP 75DLEP 75DLEP 75DLEP 75DLEP 75DLEP 75
DLEPDLEPDLEPDLEPDLEPDLEPDLEPDLEPDLEPDLEPDLEPDLEPDLEPDLEPDLEPDLEPDLEPDLEPDLEPDLEPDLEPDLEPDLEPDLEPDLEPDLEPDLEPDLEPDLEPDLEPDLEPDLEPDLEPDLEPDLEPDLEPDLEPDLEPDLEPDLEPDLEPDLEPDLEPDLEPDLEPDLEPDLEPDLEPDLEP75757575757575757575757575757575757575757575757575757575757575757575757575757575757575757575757575
Date printed: 30/3/2011
DCDB © L&PI NSW 2011Wollondilly Shire Council accepts no responsibilityfor any injury, loss or damage arising from the use
of this plan or errors or omissions therein. Structure Plan - Maldon
G R O W T H M A N A G E M E N T S T R A T E G Y
Legend
Low density residential areas - R2
Large lot residential areas - R5
Draft residential rezonings
Potential residential growth areas
Low density residential areas (undeveloped)
Medium density residential areas - R3
00
Industrial zone areas - IN2, IN3
Draft Industrial rezonings
Potential employment areas - industrial
Business zone areas - B1, B2, B4
Public Recreation - RE1
Private Recreation - RE2
Potential employment areas - commercial

PR
ICES
RO
AD
PRICES
ROAD
McW
ILLIA
M
DRIVE
HOPSON
RO
AD
CA
MD
EN
RO
AD
DU
GG
AN
ST
RE
ET
STREET
DRIVE
STATION
DU
RH
AM
CA
MD
EN
STREET
PARK
ST
RE
ET
NEPEAN
RO
AD
NEPEANSTREET
DU
RH
AM
STREET
CA
MD
EN
DOUGLAS
JENKINS
RO
AD
ST
RE
ET
JENKINS
JENKINSSTREET
STATIONC
AM
DE
N
RAILWAY
CA
MD
EN
STATION
STREET
STREET
SO
UTH
FR
EEW
AY
WESTE
RN
DOUGLAS
PARK
DRIVE
RO
AD
DOUGLAS
PA
RK
DRIV
E
STREET
MO
RETON
PARK
DRIVE
ST
RE
ET
MO
RE
TO
NM
OR
ET
ON
ST
PA
RK
PARADE
STREET
STREET RO
AD
Date printed: 30/3/2011
DCDB © L&PI NSW 2011Wollondilly Shire Council accepts no responsibilityfor any injury, loss or damage arising from the use
of this plan or errors or omissions therein. Structure Plan - Douglas Park
G R O W T H M A N A G E M E N T S T R A T E G Y
00
00
00
0000
Legend
Low density residential areas - R2
Large lot residential areas - R5
Draft residential rezonings
Potential residential growth areas
Low density residential areas (undeveloped)
Medium density residential areas - R3
00
Industrial zone areas - IN2, IN3
Draft Industrial rezonings
Potential employment areas - industrial
Business zone areas - B1, B2, B4
Public Recreation - RE1
Private Recreation - RE2
Potential employment areas - commercial

YARRAN
ROAD
ROAD
TY
LE
RS R
D
PL
JAC
K
DAVIS
HU
DS
ON
PL
AC
E
PAPERBARK PL
OLD
ARGYLERD
DAM
AVON
ROAD
WARROBYN ROAD
WARROBYN ROAD
SC
OT
HO
RN
E P
L
CLAREMONT FLO
RE
NC
E
WELLERS
HOGANS
DRIVE
AV
EN
UE
RA
ILS
I DE
LAURA
NOONGAH
CA
MB
ALA
N
STREET
BE
ST
RE
ET
RA
DN
OR
RA
ILS
IDE
DR
IVE
WA
Y
ROAD
RA
ILSID
E
AV
EN
UE
RA
ILS
IDE
AV
EN
UE
SO
UTH
ER
N
GR
EA
T
RA
I LS
I DE
AV
EN
UE
SO
UT
HE
RN
GR
EA
T
GR
EA
T
RO
AD
HA
WT
HO
RN
E
SO
UTH
ER
N
RO
AD
SO
UT
HE
RN
R
OA
D
HA
WT
HO
RN
ER
OA
D
HA
WT
HO
RN
ER
OA
D
IRONBARK
ROAD
POINT
ROAD
RA
ILS
IDE
ROAD
GR
EA
T
SOUTH
ERN
HAW
THO
RNE
RO
AD
RO
AD
RO
AD
BARGO
AV
EN
UE
AV
EN
UE
STREET
ROAD
ST
RE
ET
DYMOND
GO
VE
RN
ME
NT
RO
AD
GO
VE
RN
ME
NT
RO
AD
GO
VE
RN
ME
NT
RO
AD
BARGO
ROAD
ROAD
ROAD
DA
ISY
ST
RE
ET
KADER
KADER
GW
YN
N H
UG
HE
S
STREET
LAN
E
ST
RE
ET
GW
YN
N H
UG
HE
S
ST
RE
ET
TYLERS
ROAD
YA
ND
ER
RA
CARLISLE
RO
AD
YA
ND
ER
RA
RO
AD
STREET
MORTI
MER
HAR
LEY
STREET
STREET
RO
AD
YA
ND
ER
RA
STREET
RO
AD
CH
AN
DO
S
RO
AD
CH
AN
DO
S
CARLISLE
RO
AD
RO
AD
CH
AN
DO
S
DRIV
EWAY
STREE
T
CH
AN
DO
S
ST
RE
ET
STR
EE
T
STREET
KA
DE
R
BINGARRAPL
ICO
RR
PL
RO
AD
SIL
ICA
SIL
ICA
TYLERS
TYLERS
ROADROAD
RO
AD
RO
AD
CH
AN
DO
S
STREET
PANORAMA
RA
DN
OR
MIMOSA ST
RO
AD
NOONGAH
STREET
RA
DN
OR
RO
AD
SIL
ICA
RO
AD
RE
ME
MB
RA
NC
E
DRIVEW
AY
OLD
HUM
E
HIGH
WAY
NOORAL
TY
LE
RS
KA
DE
R
STREET
RO
AD
BAYAN
MARSHALLAVENUE
PLACE
REMEM
BRANCE
DRIVEW
AY
DAM
AVO
N
RO
AD
RO
AD
HAW
THO
RNE
RO
AD
JOHNSTONROAD
REMEMBRANCE
DRIVEW
AY
DRIVEWAYREMEMBRANCE SOUTH
WESTERN
HAWTHORNE
DA
M
RE
ME
MB
RA
NC
E
DR
IVEW
AY
AV
ON
RO
AD
AVON
ROAD
DAM
RESERVOIR
ROAD
BARGO
JOHNSTON
ARINA
RE
ME
MB
RA
NC
E
DR
IVE
WA
Y
FREEWAY
LUPTON
ROAD
LU
PT
ON
RO
AD
ROAD
DAM
AVON
ROAD
RESERVOIR
ROAD
ROAD
ROAD
RESER
VOIR
ROAD
ARIN
A
RO
AD
ASHBY
WA
Y
LLO
YD
S
THORNCROFT
EL
VY
HOGANS
NO
RM
A
ELV
Y
WELLERS
CLOSE
CL
OS
E
CLOSE
ROAD
ST
RE
ET
DR
IVE
HAMBRIDGE
PHILLIPA
EL
VY
JU
ST
INE
ST
RE
ET
CLO
SE
PLACE
WELLERS
CLA
RE
MO
NT
HO
GA
NS
ROAD
DR
IVE
DRIVE
DRIVE
CLOSE
STREET
CA
MB
ALA
N
BIARA
STR
EE
T
WIN
DS
OR
ROAD
HA
MB
RID
GE
ROAD
PL
AC
E
CLO
SE
STREET
CHARLIES
RE
ME
MB
RA
NC
E
GR
EA
T
RO
AD
RO
AD
GR
EA
T
WA
TT
LE
DYMOND
RA
DN
OR
HAMBRIDGE
IRONBARK
STREET
ROAD
SO
UT
HE
RN
ANTHONY
RO
AD
Date printed: 18/05/2011
DCDB © L&PI NSW 2011Wollondilly Shire Council accepts no responsibilityfor any injury, loss or damage arising from the use
of this plan or errors or omissions therein. Structure Plan - Bargo
G R O W T H M A N A G E M E N T S T R A T E G Y
00 00
00
00
00
00
00
00
Legend
Low density residential areas - R2
Large lot residential areas - R5
Draft residential rezonings
Potential residential growth areas
Low density residential areas (undeveloped)
Medium density residential areas - R3
00
Industrial zone areas - IN2, IN3
Draft Industrial rezonings
Potential employment areas - industrial
Business zone areas - B1, B2, B4
Public Recreation - RE1
Private Recreation - RE2
Potential employment areas - commercial
00 0000

ST
MACQUARIEDALE
PL
MIRCA
TECHNOLOGY
BROOKS
POINTROAD
DRIVE
WILTON
ROAD
ROAD
KERR
STREET
KINGSTREET
THOMAS ST
MACQUARIEDALE
MACQUARIEDALE
LEWIS
ROAD
BROOKSPOINT
WILTON
PARADE
SPORTSGROUND
WINTON
PERCIVALAVENUE
AVENUE
D'ARCY
HUME
PLKERR
STREET
ROAD
ROAD
ROAD
PL
CATARACT
ST
JAMES
TOGGERAI
WILTON
DAM
(CLOSED ROAD)
ROAD
DENISON PL
ANDERSON
KERR
STREET
RIXON
CL
ELIZABETH
CLOSE
KING
SARAH
ROAD
APPIN
PL
WEST
MACNAMARA
STREET
KENNEDY
STREET
PLACE
NEAL
GLEBE
CLOSE
PLACE
ROAD
STREET
RIXON
ROAD
ROAD
APPIN
APPIN
MARKET
STREET
CRES
STREET
STREET
(CLOSED ROAD)
OU
KENNEDY
STREET
WINTON
BR
GROVE
KENNEDY
ROAD H
TON
G
PITT
CHURCH
(CLOSED ROAD)
KING
STREET
STREET
BURKE
MARKETR
OAD
APPIN
STREET
STREET
TOGGERAI
BURKE
BULLI - A
PPIN
STREET
ILLAWARRA
CHURCH
STREET
STREET
STREET
STREET
STREET
ILLAWARRA
STREET
GEORGE
STREET
GEORGE
ROAD
BULLI - APPIN
ROAD
SHERRIFF
ROAD
ROAD
APPIN
Date printed: 30/3/2011
DCDB © L&PI NSW 2011Wollondilly Shire Council accepts no responsibilityfor any injury, loss or damage arising from the use
of this plan or errors or omissions therein. Structure Plan - Appin
G R O W T H M A N A G E M E N T S T R A T E G Y
Legend
Low density residential areas - R2
Large lot residential areas - R5
Draft residential rezonings
Potential residential growth areas
Low density residential areas (undeveloped)
Medium density residential areas - R3
Industrial zone areas - IN2, IN3
Draft Industrial rezonings
Potential employment areas - industrial
Business zone areas - B1, B2, B4
Public Recreation - RE1
Private Recreation - RE2
Potential employment areas - commercial