Embed Size (px)
Citation preview

q/E^o6s
NASA Technical Memorandum 103788
Growth Kinetics of Physical Vapor TransportProcesses: Crystal Growth of the optoelec-tronic Material Mercurous Chloride
N.B. SinghWestinghouse Science and Technology CenterPittsburgh, Pennsylvania
and
W.M.B. DuvalLewis Research CenterCleveland, Ohio
March 1991
NASA
https://ntrs.nasa.gov/search.jsp?R=19910010007 2018-06-20T06:44:46+00:00Z

CONTENTS
1. EXECUTIVE SUMMARY ............................................... 1
2. TECHNICAL BACKGROUND ............................................ 2
2.1 THE MERCUROUS HALIDES ....................................... 2
2.2 PHYSICAL VAPOR TRANSPORT PROCESS ............................ 3
2.3 IMPORTANCE OF CONVECTION IN CRYSTAL GROWTH OF
MERCUROUS CHLORIDE .......................................... 3
3. EXPERIMENTAL METHOD ............................................. 5
3.1 MATERIALS AND PURIFICATION .................................. 5
3.2 FURNACE AND CALIBRATION ..................................... 5
3.3 GROWTH RATE MEASUREMENTS .................................... 7
3.4 CRYSTAL CHARACTERIZATION .................................... 7
3.4.1 X-ray Characterization ................................ 7
3.4.2 Scattering Measurements ............................... 9
3.4.3 Birefringence Interferometry .......................... 9
4. RESULTS AND DISCUSSION .......................................... 12
4.1 IMPURITIES AND CHARACTERIZATION ............................. 12
4.2 TEMPERATURE DISTRIBUTION .................................... 12
4.3 GROWTH RATES AND TRANSPORT BEHAVIOR ......................... 12
4.4 QUALITY OF CRYSTALS GROWN AT DIFFERENT Ra ................... 22
5. SUMMARY ........................................................ 25
6. PUBLICATIONS FROM PHASE I OF THE PROGRAM ........................ 26
7. FUTURE PLANS .................................................... 27
8. REFERENCES ...................................................... 28
ACKNOWLEDGMENTS ................................................. 29

1. EXECUTIVE SUMMARY
The results reported here were carried out in order to derive a
quantitative understanding of the physical vapor transport (PVT) process
for the purpose of identifying the magnitude of convective effects on
the crystal growth process. The effects of convection on crystal
quality were studied by varying the aspect ratio and those thermal con-
ditions which ultimately affect thermal convection during PVT. An
important outcome of the present study was the observation that the
convection growth rate increased up to a certain value and then dropped
to a constant value for high aspect ratios. This indicated that a very
complex transport had occurred which could not be explained by linear
stability theory. Better quality crystals grown at a low Rayleigh number
confirmed that improved properties are possible in convectionless
environments.
i
2. TECHNICAL BACKGROUND
2.1 THE MERCUROUS HALIDES
The mercurous halides have recently become important because of
their application in acousto-optic and opto-electronic devices. The
properties that make this class of materials important are: (a) the
spectral transmission range, (b) the photo-elastic coefficient, (c) the
acousto-optic figure of merit, (d) acoustic velocity, and (e) acoustic
attenuation. These halides belong to the tetragonal (D4h) crystal class
and are positively uniaxial with large birefringence. The refractive
indices for Hg 2C1 2 are 2.621 and 1.962; for H9 2Br2 , 2.975 and 2.121.
The transmission ranges are 0.36 to 20 um for H9 2C1 21 0.4 to 30 µm for
H92Br 2i and 0.5 to 40 µm for H9 2I 2 . This wide optical transmission
range is very unusual and potentially very useful for wideband spectro-
scopic devices.
During the last several years we have been involved 1-4 in the
purification, crystal growth, and characterization of mercurous halides.
The need for high optical-quality crystals came from military defense
applications of the devices for which mercurous halides appear to have
great potential. Mercurous iodide is the least developed and requires a
great number of refinements. We have grown reasonably good-quality
mercurous chloride and mercurous bromide, but scattering levels due to
inhomogeneity in the refractive index are still a big problem. These
halides have the slowest shear acoustic velocity in the [110] direction
of any known acousto-optic material. The magnitudes of acoustic veloci-
ty are 254 m/s for H9 2I2 , 273 m/s for Hg 2Br2 , and 347 m/s for H9 2C1 2 . By
comparison, this value for commercially available Te0 2 is 616 m/s. If
we define the quality of the material (figure of merit) as suggested by
Chang,' these halides have very large values. Also, mercurous halides
cover a large transmission range, i.e., 0.36 to 40 am. The acoustic
attenuation for Hg2C1 2 and Hg2Br 2 is 376 and 431.5 dB cm-7 GHz-2 . These
properties are all well suitable for fabrication of Bragg cells which
can offer high resolution, high diffraction efficiency, and high dynamic
2

range. From this perspective we propose to study the factors which
ultimately affect the homogeneity of the crystals during growth.
2.2 PHYSICAL VAPOR TRANSPORT PROCESS
Mercurous halides decompose s-7 to mercury and mercuric halide
(H92X2 -4 Hg + HgX2) at the melting point. The existence of the two
liquid fields and compositional stratification largely preclude the
solidification of large H9 2X2 crystals by conventional melt growth tech-
niques. However, mercurous halides exhibit reasonably high vapor pres-
sure at low temperature, and crystal growth by vapor transport could be
accomplished at rates well within practical range. The purification
process of the source material and the furnace design are very difficult
tasks. Since mercurous halides are not soluble in most of the usual
solvents, including alcohols, acetone, acids, and water, purification by
a recrystallization method is very difficult. Purification by direc-
tional freezing or zone-refining methods is also not applicable because
of decomposition into mercury and mercuric salt. A sublimation method
has therefore been used for purifying these halides.
Our previous studies 2 have shown that mercurous chloride has a
very high magnitude of anisotropy with respect to growth rates. The
growth velocity in the [110] direction is approximately half that in the
[001] direction. This suggests that comparison of growth velocities in
different thermal environments or geometries should be done for a par-
ticular crystal orientation. The results reported here are for the
growth of mercurous chloride in the [110] orientation.
2.3 IMPORTANCE OF CONVECTION IN CRYSTAL GROWTH OF MERCUROUS CHLORIDE
The main objective is to clearly identify the growth conditions
under which crystals with uniform refractive index can be grown. The
influence of convection is very complex; it produces a variety of spa-
tial and temporal transport rate patterns which cause undesirable micro-
and macrosegration. In the case of high-purity source material, the
major concern is thermal convection, which can promote stirring in
fluids and contribute significantly to compositional differences in the
growing crystal through transient behavior. Some fluids develop
3

periodic temperature fluctuations at relatively low temperature gradi-
ents, leading to the production of undesirable growth rate fluctuations
and changes in boundary layer thickness. The situation becomes even
more complex in the presence of impurities, and double diffusive convec-
tion (thermo-solutal convection) controls the fluid flow. The magnitude
of convection can be expressed in terms of a Rayleigh number.
For the geometry used in our system, one can define the Rayleigh
number, Ra asa:
a 4 C p • d 2 ATRa=
k• •L(1)
where g is the gravitational constant, P is the volume expansion coeffi-
cient, AT is the temperature difference between hot and cold zones, a is
the radius of the ampoule, Cp is the heat capacity, d is the density, k
is the thermal conductivity, t is the viscosity, and L is the transport
length. Very extensive theoretical studies have been done on this pro-
blem, but experiments are very limited for materials of low Prandtl
number (Pr = r • Cp/k). From the equation it is clear that thermal
convection conditions (Ra) can be changed by varying g, AT, and/or a/L.
Also, equation 1 shows that Ra is strongly dependent on geometry (a4 /L)
in comparision to AT.
4

3. EXPERIMENTAL METHOD
3.1 MATERIALS AND PURIFICATION
Since the objective of the present program was to study the
convection effect in pure mercurous chloride, attempts were made to
prepare high-purity mercurous chloride. This minimizes the solutal
convective effects.
As-supplied source materials were listed as 99%+ purity. For
the purification of source material we designed a multichamber Pyrex
sublimation column shown in Figure 1. This apparatus was cleaned by
rinsing with acetone, chromic acid, and sulphuric acid followed by a
mixture of nitric acid, hydrofluoric acid, and water. The final rinsing
was carried out using DI water repeatedly. The source material was
loaded in one column of the glass apparatus and evacuated. During evac-
uation, the side tube was placed in liquid nitrogen to solidify
undesired volatile impurities. Occasional heating was also provided to
the mercurous chloride charge to drive out moisture. After achieving a
good vacuum (in the range of 10 -e torr), the column was sealed. The
column containing as-supplied material was placed in a temperature grad-
ient furnace to sublime the material. The temperature of the furnace
was maintained at approximately 350°C. After transporting most of the
as-supplied material into the second column, the first column was sealed
and separated. A large amount of dark-colored residue was left in the
first column. In a similar fashion, material was transported from the
second to third column and so on. After five to six sublimations, the
mercurous chloride became water clear and quite suitable for the present
purpose. Purity was checked by spark source mass spectrometry.
3.2 FURNACE AND CALIBRATION
Experiments were carried out in a two-zone transparent furnace.
The zones were separated by a transparent annular evacuated glass dewar.
This insulated section produced a hump in the temperature profile. Each
5

EE
Nr—iUNbiD
{-I0
w
m
tiaacd
a0
bLO
U
w
a
a^ti
.Hw
EVLOti
cr OJ o L
FO— Z ~E a
o E^a

furnace was controlled independently by separate controllers. The tem-
perature distribution was measured in two ways: (a) using a bare
chromel-alumel thermocouple, and (b) using a platinum probe in a dummy
growth tube filled with mercurous chloride and quartz pieces.
For crystal growth runs a platinum probe was always used. The
probe was built in a specially designed ampoule, which had a thermometer
well in the center of the ampoule. A calibrated platinum probe was
placed in the thermometer well (capillary tube), which permitted meas-
urements along the growth axis of the crystal. Since for each set of
measurements more than 20 minutes was provided, it was assumed that the
thermometer well did not produce any distortion in the temperature field
of the crystal.
3.3 GROWTH RATE MEASUREMENTS
All growth rate measurements were carried out for the [110]
orientation. We designed the growth tube similar to that shown in
Figure 2 for this purpose. A pre-oriented seed was used to seed the
crystal in the [110] direction. The source material was sealed in the
tapered cylindrical quartz ampoule. For the growth rate measurements,
mercurous chloride crystal was grown to a length of 2 cm by pulling the
tube, and then pulling was stopped to achieve the equilibrium interface
position (stage 1). A time of 12 to 24 hours was allowed to achieve the
equilibrium. After recording the equilibrium position, the ampoule was
rapidly raised by approximately 3 - 5 mm (stage 2).
The crystal then grew down the tube to establish the new equi-
librium position (stage 3). During this period, the crystal length was
measured as a function of time. From these measurements growth velocity
could be deduced.
3.4 CRYSTAL CHARACTERIZATION
3.4.1 X-ray Characterization
X-ray Laue patterns were taken to ensure that growth rates were
measured in the [110] direction. This enabled us to identify the facets
on the surface of the crystals during growth.

0LOM
00co
0LnN
U0
N
CIOLa-
Q^
rn
0
ti
30tibD
ti0wa^
30ti
OON
aiN
do
w
00
O d co N w OT T (y
V
r_
y.r
O
a
8

3.4.2 Scattering Measurements
A He-Ne laser beam expanded through a spatial filter (5 mm) was
used in order to obtain an average of crystal scattering. The beam was
passed through the crystal and the emerging beam was focussed onto the
slit of a beam scanner. The scanner has a 25 ym slit with an optical
fibre attached behind the slit. The slit/fiber assembly was in turn
joined to a motorized linear drive. The fiber transmitted light through
the slit onto a photomultiplier, the output of which was fed to a loga-
rithmic do amplifier. The output of the amplifier was displayed on an
X-Y recorder, the x-input being driven with a signal proportional to the
linear displacement of the slit. The system is shown in Figure 3.
3.4.3 Birefringence Interferometry
To evaluate crystal homogeneity by birefringence interferometry,
a polarized beam from a 1 mW He-Ne laser operating at 1.5 ym was
focussed through a pinhole to obtain a good-quality Gaussian mode, and
was then expanded and collimated to fill a 5 cm aperture. The mercurous
chloride crystal to be inspected was placed in this beam. The polariza-
tion of the probe beam was adjusted to be incident on the crystal at 45
degrees to the projection of the optical axis on the plane perpendicular
to the direction of the beam. This was accomplished either by rotating
the laser to the proper position or by use of a polarizer in front of
the crystal. As a result of this choice of polarization, the incoming
beam split into two beams as it traversed the birefringent crystal. One
of these beams saw the ordinary refractive index, n o , and travelled with
speed, c/no, in the crystal, while the other beam saw an extraordinary
refractive index, ne, and travelled with the velocity c/n e . Since ne
and no are normally different in mercurous chloride crystal, two beams
propogated at different speeds and arrived at the other end with a dif-
ferent phase relationship. The change in the phase could be detected by
recombining the two beams using a polarizer. If the two beams passed
through the crystal, the output beam from the polarizer would be uniform
in intensity.
To the extent that one or both beams are distorted by the crys-
tal, a fringe pattern similar in appearance to the pattern from a stand-
ard interferrometer would be present in the output beam. Details of the
schematics are shown in Figure 4.
9

Uv;
3m
a
bZ
U
NOw
e
m
ti
w
LQ).Q
EL\ OV
Q 0) Ej_U
L •^o c vIcao L) Q.2(n O
a)+., Q
cn EL (aU to
m
10

a)
cn^cna^ cn
^— iU
a^L
L
a^UQNbD
0
EnU)
tibo
w
o z o
^L,WNa%_ca
7CL
c
J
o coL
/ cu
U
NC a
L^z cn
cn0 ca
T— 2 J
11

4. RESULTS AND DISCUSSION
4.1 IMPURITIES AND CHARACTERIZATION
During the purification of source material, a large amount of
residue was left behind. X-ray analysis was done to match the lines
with standard patterns in the Joint Committee on Powder Standards data-
base. The match was to the compound Hg 6C1 2 04 . Diffraction data
indicated that this material is orthorhombic, having lattice parameters
of a = 11.598 A, b = 11.717 X, and c = 6.090 X. In order to avoidsolutal effects and impurity parameter constants, we prepared the
material in batches. The purification of mercurous chloride by this
method produced source material which contained metallic impurities well
below 15 ppm. These results were obtained by spark source mass
spectrometry.
4.2 TEMPERATURE DISTRIBUTION
There was very little if any difference in the temperature pro-
file measured by thermocouple and platinum probe. In the case of the
platinum probe, the growing crystal and vapor was acting as a medium,
while in the case of the bare thermocouple hot air was acting as the
medium.
Two sets of observations were made. In the first case the tem-
perature distribution was kept constant and the aspect ratio of the
growth tube was changed. The temperature profile is shown in Figure 5.
In the second case experiments were carried out to examine the effects
of source temperature for the identical aspect ratio.
4.3 GROWTH RATES AND TRANSPORT BEHAVIOR
In the present study experiments were conducted by the PVT pro-
cess in the region where the Knudsen number was smaller than unity;
hence, collisions between vapor molecules dominated. The transport was
congruent and constituent molecules of Hg 2C1 2 transported intact during
crystal growth. The present studies and the experiments of Barta et
12

20
16
12
E 8U
O 4
0N
O -4D_
v -8
CO
i -127
LL -16
••
••
-20
260 280 300 320 340 360
Temperature (°C)
Figure 5. Temperature distribution for growth rate measurements atdifferent aspect ratio.
al.' showed that in the presence of moisture, Hg 2C1 2 oxidizes and tends
to decompose into Hg and HgCl 2 . High-purity mercurous chloride did not
decompose and the correct stoichiometry was maintained during transport.
Signs of mercury and mercuric chloride were not observed during vapor
transport.
Growth rate data for different aspect ratios are shown in
Figure 6 in the form of crystal length versus time for the closed tube
system. All data were taken in the [110] orientation by using the
proper seeding technique and in the region where crystals were well away
from the conical seeding section of the growth tube. Measurements close
to the seed end were avoided to reduce the capillary effects on
relaxation time. The experimental data corresponded to equation 2:
Lt = Le - A exp(-t/T)
(2)
where Lt is length at time t, Le is the equilibrium length, T, i.e.,
(1/G • 7), is relaxation time, G is the temperature gradient, 7 is the
kinetic coeficient, and A is a constant. Similar studies were carried
out at a constant aspect ratio and identical thermal conditions for
13

.6
.5
.4
E
.3
2
1
C.r- 158 S26-8
Curve No. aft
1 0.02222 0.0353
_ 3 0.06674 0.0910
5 0.10426 Q 0830
45
6
3 2 1
0
o
e0 40 80 120 160 200
Time ( h)
Figure 6. Length of growing crystals as a function of time at differentaspect ratio.
crystals where one and two effusion holes were used to permit the elimi-
nation or reduction of any impurity. The data are shown in Figure 7.
The values of T and 7 given in Table 1 showed that the kinetic coeffi-
cient was mildly affected by the presence of effusion holes, and relaxa-
tion time was similarly affected by the effusion holes. Consequently,
there is no definite trend of change, again suggesting that perhaps
interfacial attachment kinetics dominate during the growth of Hg2C12.
The velocity profile across the circular duct is derived by
substituting the general expression to the shear stress into Newton's
Table 1
Kinetic Coefficient and Relaxation Time
Growth Condition 7 T G
(cm/K-p h) (h) (K/cm)
Closed Tube 0.011 64 1.4One Hole 0.013 51 1.5Two Holes 0.011 65 1.4
14

Length (cm)0.5 r-
2 Holes
No HoleOne Hole
0.2
0.1
0 20 40 60 80 100 120 140
Time (Hr.)
Figure 7. Length of growing crystals as a function of time for no hole,one hole, and two holes at a/L = 0.01.
law of viscosity and integrating by applying the no-slip condition at
the wall. The average velocity is defined as:
• 2P a (3)v = 8 L
where P = Ps - Pc, Ps and Pc are the vapor pressures at the source and
crystal interfaces, ^ is the viscosity, L the distance between inter-
faces, and a is the radius of the growth tube. Volumetric flow rate Q
can be derived by the following integration:
0.4
0.3
hence,
8PQ_ 8- r^
a2L
f 2 r r dr (4)0
Q = AP x a4(5)8 r^ L
15

a result which is known as the Hagen-Poiseuille equation. In spite of
the fact that equation 5 is only applicable to incompressible fluids,
one can derive le,ii the number of moles, N, flowing each second through
the cross-section area, which is given as:
4
N - 8 7r R (Ps 2 - Pc2 ) (Ts + Tc) (6)
and flux is then:2
N/ra2 = 8 rf a• L R (Ps2 - Pc2 ) (Ts + Tc) (7)
where R is the universal gas constant. Rosenberger et al. 9-11 have
derived that growth velocity can be given as:
V = 9.6 a2 • M (Ps 2 - Pc2)
(8)^ • L • p • (Ts + Tc)
where M is the molecular weight and p is the density of the solid; Ta
and T. represent the temperatures of source and growth interface as
given in Figure 5. When we used the experimental parameters to predict
the growth velocity by using equation 8, the experimental growth rate
was observed to be orders of magnitude lower than the predicted growth
rate. A few researchers have attributed the low transport rates to some
other mass transport governed by the impurity redistribution. It is
believed that impurities rejected during crystal growth tend to form a
boundary layer at the growth interface, and the growth flux tends to
accumulate the entrained impurities which are not accepted by the
growing interface. This effect has been reduced by allowing the
impurities accumulating at the interface to effuse out of the ampoule.
In order to test the applicability of this technique to the calomel
system, one hole was made in one ampoule and two holes in the other. As
shown in Figure 7, no change was observed in the growth rate which could
satisfy equation 8. Furthermore, in the case of one effusion hole and
two effusion holes, the identical growth velocity was observed. In the
case one hole, 37% of the material escaped from the growth tube, and in
the case of two holes, 66% of the material was lost. This confirms that
differences between observed and predicted growth velocities are not
accounted for as the result of an impurity layer boundary forming on the
growing interface in the system. In spite of the fact that (Ts - Tc)
was small, the H9 2C1 2 heated above the temperature of the top end of the
16

ampoule; in this situation one must expect the influence of convective
flow on net flow. For the purpose of estimating the concentration
distribution, a one-dimensional diffusion treatment with PVT was used.
In an effort similar to that of Rosenberger et al., we selected: (a) the
source interface as the reference, (b) steady-state growth conditions,
(c) a fixed distance from source to growth interface and ignored the
effect of temperature on vapor density between source and growth
interface. The molar concentration of Hg 2C1 2 at distance x from source
is given as:
C (x) = C - [C - C (0) ] exp (Pe X/L) (9)
where C(0) and C are the concentration of H92C1 2 vapor at the source and
total molar concentration. P,, is the Peclet number defined as:
P e -
D L(10)AB
where V is the mole average velocity and D kB is the binary diffusion
coefficient. Since we used H9 2C121 which had less than 15 ppm impurity,
equation 10 can be written as:
Pe - V D11
L (11)
where D11 is self diffusivity. The dependence of concentration on
peclet number is shown in Figure 8. The Peclet number predicted by
equation 11 is very small (Pe = between 0 and 1) for our system, and a
relatively uniform distribution of impurities (if any) is expected. At
the large Peclet number (not in this case), the increased Hg 2C1 2 flux
would largely over-ride any back diffusion of impurities. Impurities
accumulate at the interface from the diffusion boundary layer, which can
limit access to the interface for source material undergoing non-
molecular transport.
In addition to density changes in the vapor phase induced by
temperature changes, and the associated changes in the vapor pressure
over the source and crystallization surfaces, further complexity is
created because sometimes both effects compete with one another. The
overall motion can be explained in terms of the Rayleigh number. For
the geometry used in our system, the Rayleigh number is defined in
17

OLOT
O GO (D Ct N
T O O O O
O
T
00
O Jx
a^
cco
NtD 00LOQ.
Cm
LLL
OCO
CQ^
GN
O
O
OO
O
E-I
e
UOa
G'O
rlO
i^
GUGOUwOa^UGNbGab
a^
F
00
ON
hA.,iw
7O C CU O O
O O ^OC U "-'
18

V x 10 3 (cm/hr)10
Low Aspect RatioHigh Aspect Ratio
8
6
4
20 0.02 0.04 0.06 0.08 0.10 0.12
(a/L)
Figure 9. Growth velocity as a function of aspect ratio.
Section 2. Figure 9 shows the experimental growth velocity data for PVT
in a cylindrical ampoule for which the aspect ratio varied by an order
of magnitude. There was a direct relationship between a 2/L and the flux
for both condensing and transporting flux. This occured only up to a
certain value of aspect ratio and hence the Rayleigh number. Figure 10
shows the variation of growth velocity in terms of Rayleigh number. It
is clear that growth velocity increases with aspect ratio (hence Ra as
expected), and then suddenly drops to a value which appears to be con-
stant. This clearly indicates that one cannot scale the system on the
basis of measurements in the low aspect ratio region, and in addition
suggests that some change in fluid flow behavior is occuring in the
growth system. We believe this again confirms that convection increases
growth velocity up to certain value; after that, convection destablizes
flow in the system. As shown in Figure 10, linear stability theory will
not explain the experimental observations.
Since the early 1970s, various fluid dynamists have developed
theoretical stability curves for fluid behavior for high aspect ratio
19

T
^U_O
O
Lf..
OV
O O O
Q
bZ
Nr-I
Cd04
CHO
C.O.H
U
w
m
U)
UO
r-IN
Oti00
ti
w
T
OT
N
OT
L
V̂.s
M MOT O
Tx
OT
OM
20
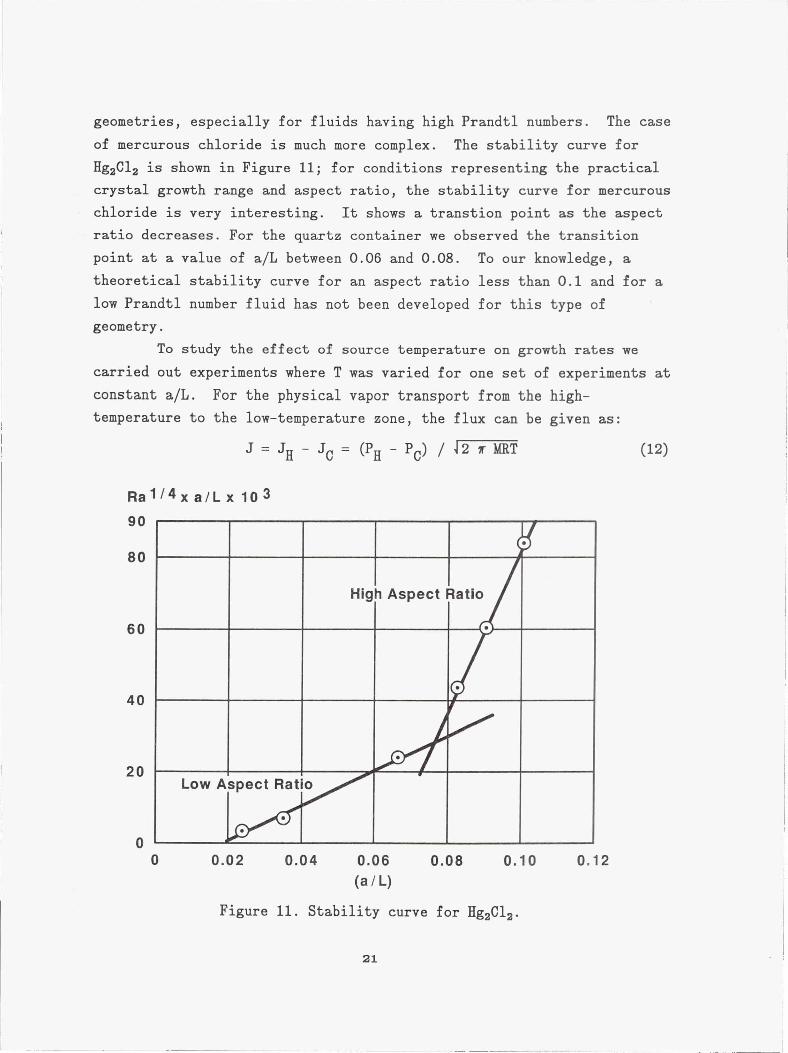
geometries, especially for fluids having high Prandtl numbers. The case
of mercurous chloride is much more complex. The stability curve for
Hg2C1 2 is shown in Figure 11; for conditions representing the practical
crystal growth range and aspect ratio, the stability curve for mercurous
chloride is very interesting. It shows a transtion point as the aspect
ratio decreases. For the quartz container we observed the transition
point at a value of a/L between 0.06 and 0.08. To our knowledge, a
theoretical stability curve for an aspect ratio less than 0.1 and for a
low Prandtl number fluid has not been developed for this type of
geometry.
To study the effect of source temperature on growth rates we
carried out experiments where T was varied for one set of experiments at
constant a/L. For the physical vapor transport from the high-
temperature to the low-temperature zone, the flux can be given as:
J=JH - J
C = (PH -
P C ) / 27rMRT (12)
Ra t/4 xa/Lx 103
90
80
High Aspect Ratio
60
40
20Low Aspect Ratio
00 0.02 0.04 0.06 0.08 0.10 0.12
(a/L)
Figure 11. Stability curve for Hg2C12.
21

where JR and JC are the flux from the hot and cold temperature zone, and
PH and PC are the vapor pressure at the hot and cold zone. This
equation is applicable for PVT growth in which a certain sink action of
the growing surface is assumed. Figure 12 shows the Arrhenius plot of
the experimental and theoretical curves. The experimental line
corresponds to calculated values corrected by the sticking coefficient
of approximate values of 0.01. Since all the growth rate measurements
were made in the (110) direction and at the identical aspect ratio, the
change in growth rate was attributed to thermal conditions only.
10
1
Based OnH-K Equation
10"1
Growth Velocity(cm / h)
10-2
•
10 -3 L1.4 1.5 1.6 1.7
1 /T x 10 3 (K-1)
Figure 12. Arrhenius plot for H92Cl2.
4.4 QUALITY OF CRYSTALS GROWN AT DIFFERENT Ra
The mercurous chloride crystals grown in different thermal
conditions were evaluated by measuring the bulk scattering and
inhomogeneity of refractive index by birefringence interferometry
(Figures 13 and 14). It was clearly observed that crystals grown at
higher AT showed higher scattering and irregular fringes. Since the
22

Curve 756522 -A
0
—10
m
—20
JU)Z
coUN
—30
Legend:
1. Without Crystal2. 8° K/cm3. 11° K/cm4. 17 0 K/cm
1 42 dB234
—40
—10 0 10Frequency (MHz)
Figure 13. Scattering for crystals grown at different Ra.
23

(a)
( b)
( C)
Figure 14. Birefringence interferograms for crystals grown at differentRa: (a), (b), and (c) correspond to 8°K/cm, 11°K/cm, and17°K/cm, respectively.
24
crystals were grown from the identical source material and cooling con-
ditions were identical, the difference in homogeneity is attributed to
stresses developed in the crystals due to the difference in AT and hence
Ra.
5. SUMMARY
• The condensing flux at the solid-vapor interface was orders of magni-
tude lower than the flux calculated by transport theory.
• An increase of 20% in the growth rate was observed in the system with
effusion holes in comparison to the closed system. This showed that
the difference in growth velocities is not due to impurity boundary
layers.
• Theories based on the Hagen-Poiseuille equation could not explain the
fluid dynamic phenomena.
• A condensation coefficient is required to explain the growth velocity
data of mercurous chloride.
• Growth velocity was observed to be orientation dependent for a low
growth rate (low T) region.
• Crystals grown at low Ra showed better quality.
25

6. PUBLICATIONS FROM PHASEOF THE PROGRAM
Following are the results of Phase I of the program.
1. "Evaluation of Transport Conditions During PVT Growth: Mercurous
Chloride System," Physico Chemical Hydrodynamics 11 (1989), 41.
2. "Effect of Temperature Gradient on the Optical Quality of Mercurous
Chloride Crystals," J. Crystal Growth 96 (1989), 916.
3. "On the Quality of Mercurous Chloride Crystals," Materials Letters 7
(1989), 397.
4. "Evaluation of Growth Conditions During PVT of Opto-Electronic
Crystals," AIAA Journal of Thermo-Physics and Heat Transfer
(Communicated).
For more-detailed information, all of the above-mentioned papers
are included as appendices at the end of this report. In addition to
the papers cited above, results were presented at the following seminars
and conferences.
1. "Growth of Large Crystals of Mercurous Chloride Crystals," Special
Symposium on Space Processing, BHU Varanasi, Jan. 13, 1988.
2. "Congruent Vapor Transport in 1-g Conditions," Symposium on Materials
Processing in Space, ASM, Materials Science Division, World Materials
Congress, Chicago, IL, Sept. 27, 1988.
3. "Physical Vapor Transport Growth of Mercurous Chloride Crystals,"
CCDS Meeting at Gruman Aerospace Corporation, July 1988.
4. "On the Transport Behavior of Mercurous Chloride," CCDS Meeting,
Marshall Space Flight Center, Huntsville, AL, Feb. 13, 1989.
5. "Growth and Characterization of 1-g Grown Mercurous Chloride
Crystals," International Symposium on Mercurous Halides, Prague, Nov.
1989.
6. "Evaluation of Growth Conditions of the PVT Process During the 1-g
Growth of Mercurous Chloride Crystals," ICCG-8, Sendai, Japan, 1989.
26
7. FUTURE PLANS
Given the means, objective for future study are:
1. Study the growth rates and kinetics of the PVT process by varying the
g-vector.
2. Identify the magnitude of convective effects due to variation of the
g-vector.
3. Correlate growth rates with inclination of the g-vector and the
quality of grown crystals, keeping the aspect ratio and thermal
environments identical.
4. Identify the critical range of convection/diffusion dominating the
growth process by studying the growth rate at different thermal
environments and different g-vectors.
5. Identify the effects of microgravity with respect to mercurous halide
crystal growth and design a microgravity experiment.
A very important outcome of these studies will be to determine
the role of microgravity using the PVT process in growing large crystals
with improved optical properties in comparision to those grown in 1-g
conditions.
27

8. REFERENCES
1. N. B. Singh, M. Gottlieb and A. Goutzoulis, J. Crystal Growth 82
(1987), 274.
2. N. B. Singh, R. H. Hopkins, R. Mazelsky and M. Gottlieb, J. Crystal
Growth 85 (1987), 240.
3. M. Gottlieb, N. B. Singh and A. Goutzoulis, Appl. Opt. 26 (1987),
4681.
4. N. B. Singh, R. H. Hopkins, R. Mazelsky and J. J. Conroy, J. Crystal
Growth 75 (1986), 173.
5. I. C. Chang, IEEE Trans. Sonics & Ultrasonics SU-23 (1976), 7.
6. N. B. Singh, R. H. Hopkins, R. Mazelsky and M. Gottlieb, J. Crystal
Growth 85 (1987), 240.
7. S. J. Yosim and S. W. Mayer, Am. Chem. Soc. 64 (1960), 909.
8. C. Barta, Krist. and Tech. 5 (1970), 541.
9. F. Rosenberger, Physico-Chemical Hydrodynamics 1 (1980), 3.
10. J. R. Carruthers, Preparation and Properties of Solid State
Materials, Ed. by Wilcox (Marcel Dekker Inc., New York, NY), Vol. 4
(1979), 50.
11. J. R. Abernathey, D. W. Greenwell and F. Rosenberger, J. Crystal
Growth 47 (1979), 145.
12. G. S. Charlson and R. L. Sani, J. Heat Mass Trans. 14 (1971), 2157.
28

ACKNOWLEDGMENTS
The author is grateful to NASA, Microgravity Science and
Application Division, Code EN, for providing the financial assistance of
Contract NAS3-25274 through NASA Lewis Research Center.
29

NASANational Aeronautics and Report Documentation PageSpace Administration
1. Report No. 2. Government Accession No. 3. Recipient's Catalog No.
NASA TM — 103788
4. Title and Subtitle S. Report Date
Growth Kinetics of Physical Vapor Transport Processes: Crystal Growth of March 1991the Optoelectronic Material Mercurous Chloride
6. Performing Organization Code
7. Author(s) 8. Performing Organization Report No.
N.B. Singh and W.M.B. Duval E - 6065
10. Work Unit No.
674-21-059. Performing Organization Name and Address
11. Contract or Grant No.National Aeronautics and Space AdministrationLewis Research CenterCleveland, Ohio 44135 - 3191
13. Type of Report and Period Covered
Technical Memorandum12. Sponsoring Agency Name and Address
National Aeronautics and Space Administration14. Sponsoring Agency CodeWashington, D.C. 20546 - 0001
15. Supplementary Notes
N.B. Singh, Westinghouse Science and Technology Center, 1310 Beulah Road, Pittsburgh, Pennsylvania 15235(work funded under NASA Contract NAS3 -25274). W.M.B. Duval, NASA Lewis Research Center. Responsibleperson, W.M.B. Duval, (216) 433-5023.
16. Abstract
The results reported here were carried out in order to derive a quantitative understanding of the physical vapor trans-port (PVT) process for the purpose of identifying the magnitude of convective effects on the crystal growth process.The effects of convection on crystal quality were studied by varying the aspect ratio and those thermal conditionswhich ultimately affect thermal convection during PVT. An important outcome of the present study was the observa-tion that the convection growth rate increased up to a certain value and then dropped to a constant value for high aspectratios. This indicated that a very complex transport had occurred which could not be explained by linear stabilitytheory. Better quality crystals grown at a low Rayleigh number confirmed that improved properties are possible inconvectionless environments.
17. Key Words (Suggested by Author(s)) 18. Distribution Statement
Physcial vapor transport Unclassified - UnlimitedCrystal growth Subject Category 29Mercurous chlorideOptoelectronic material
19. Security Classif. (of the report) 20. Security Classif. (of this page) 21. No. of pages 22. Price'
Unclassified Unclassified 30 A03
NASA FORM 1626 OCT 86*For sale by the National Technical Information Service, Springfield, Virginia 22161