Embed Size (px)
Citation preview
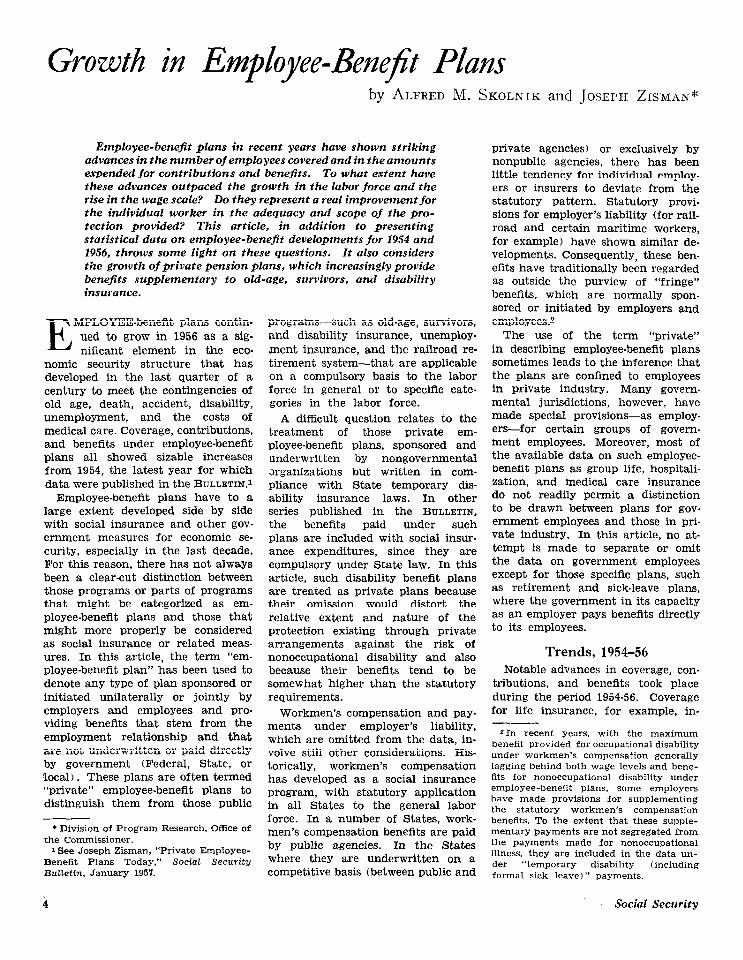
Growth in Employee-Benefit Plans by ALFRED M. SKOLNIK and JOSEPH ZISMAN*
Employee-benefit plans in recent years have shown striking advances in the number of employees covered and in the amounts expended for contributions and benefits. To what extent have these advances outpaced the growth in the Labor force and the rise in the wage scale? Do they represent a real improvement for the individual worker in the adequacy and scope of the pro- tection provided? This article, in addition to presenting statistical data on employee-benefit developments for 1954 and 1956, throws some light on these questions. It also considers the growth of private pension plans, which increasingly provide benefits supplementary to old-age, survivors, and disability insurance.
E MPLOYEE-benefit plans contin- ued to grow in 1956 as a sig- nificant element in the eco-
nomic security structure that has developed in the last quarter of a century to meet the contingencies of old age, death, accident, disability, unemployment, and the costs of medical care. Coverage, contributions, and benefits under employee-benefit plans all showed sizable increases from 1954, the latest year for which data were published in the BULLETIN.~
Employee-benefit plans have to a large extent developed side by side with social insurance and other gov- ernment measures for economic se- curity, especially in the last decade. For this reason, there has not always been a clear-cut distinction between those programs or parts of Programs that might be categorized as em- ployee-benefit plans and those that might more properly be considered as social insurance or related meas- ures. In this article, the term “em- ployee-benefit plan” has been used to denote any type of plan sponsored or initiated unilaterally or jointly by employers and employees and pro- viding benefits that stem from the employment relationship and that are not underwritten or paid directly by government (Federal, State, or local). These plans are often termed “private” employee-benefit plans to distinguish them from those public
* Division of Program Research, Office of the Commissioner.
1 See Joseph Zisman, “Private Employee- Benefit Plans Today,” Social Security Bulletin, January 1957.
4
programs-such as old-age, survivors, and disability insurance, unemploy- ment insurance, and the railroad re- tirement system-that are applicable on a compulsory basis to the labor force in general or to specific cate- gories in the labor force.
A difficult question relates to the treatment of those private em- ployee-benefit plans, sponsored and underwritten by nongovernmental srganizations but written in com- pliance with State temporary dis- ability insurance laws. In other series published in the BULLETIN, the benefits paid under such plans are included with social insur- ance expenditures, since they are compulsory under State law. In this article, such disability benefit plans are treated as private plans because their omission would distort the relative extent and nature of the protection existing through private arrangements against the risk of nonoccupational disability and also because their benefits tend to be somewhat higher than the statutory requirements.
Workmen’s compensation and pay- ments under employer’s liability, which are omitted from the data, in- volve still other considerations. His- torically, workmen’s compensation has developed as a social insurance program, with statutory application in all States to the general labor force. In a number of States, work. men’s compensation benefits are paid by public agencies. In the States where they are underwritten on a competitive basis (between public and
private agencies) or exclusively by nonpublic agencies, there has been little tendency for individual employ- ers or insurers to deviate from the statutory pattern. Statutory provi- sions for employer’s liability (for rail- road and certain maritime workers, for example) have shown similar de- velopments. Consequently, these ben- efits have traditionally been regarded as outside the purview of “fringe” benefits, which are normally spon- sored or initiated by employers and employees?
The use of the term “private” in describing employee-benefit plans sometimes leads to the inference that the plans are confined to employees in private industry. Many govern- mental jurisdictions, however, have made special provisions-as employ- ers-for certain groups of govern- ment employees. Moreover, most of the available data on such employee- benefit plans as group life, hospitali- zation, and medical care insurance do not readily permit a distinction to be drawn between plans for gov- ernment employees and those in pri- vate industry. In this article, no at- tempt is made to separate or omit the data on government employees except for those specific plans, such as retirement and sick-leave plans, where the government in its capacity as an employer pays benefits directly to its employees.
Trends, 1954-56 Notable advances in coverage, con-
tributions, and benefits took place during the period 1954-56. Coverage for life insurance, for example, in- --
21n recent years, with the maximum benefit provided for occupational disability under workmen’s compensation generally lagging behind both wage levels and bene- fits for nonoccupational disability under employee-benefit plans, some employers have made provisions for supplementing the statutory workmen’s compensation benefits. To the extent that these supple- mentary payments are not segregated from the payments made for nonoccupational illness, they are included in the data un- der “temporary disability (including formal sick leave) ” payments,
Social Security

creased by 22 percent, contributions by 34 percent, and benefits by 36 percent. Tables 1, 2, and 3 show the trends for various types of employee benefits.
Coverage At the end of 1956, hospitalization
and life insurance were still the most common types of employee protec- tion, covering some 35.5 million em- ployees (table 1) . Surgical expense insurance was a close second, with 33.1 million covered employees. In addition, hospital expense insurance covered 53.5 million dependents, and surgical expense insurance 49.0 million.
The greatest increase from 1954 to 1956 in the number of employee participants was reported for life in- surance and for plans affording med- ical expense benefits. Both types of plan increased their employee cover- age by more than 5.5 million. An increase of 5.3 million was recorded in plans providing surgical benefits and one of 4.4 million in hospitaliza- tion plans.
For every type of employee benefit, growth in coverage kept ahead of the ‘growth in the labor force. In the case of temporary disability and retirement benefits, the difference was slight, but for surgical and med- ical benefits and life insurance the rate of growth was considerably in excess of that for the labor force. Fifty-nine percent of the wage and salary labor force, for example, was covered for surgical expense at the end of 1956, compared with 53 per- cent in 1954; 40 percent had medical expense protection in 1956, compared with 32 percent in 1954.
ment insurance programs, the flrst plans called for contributions to be- gin in June 1955 and benefits in June 1956. Expanding into the glass, rubber, metal, steel, and maritime industries, supplemental unemploy- ment benefit plans covered an esti- mated 2 million workers or 4 per- cent of the private labor force by the end of 1956.
Contributions
The a-year period saw the intro- duction on a large scale of one new major type of employee-benefit plan -supplemental unemployment bene- fits-resulting from union-industry negotiations in the automobile indus- try. Designed to supplement the un- employment benefits provided workers through the Federal-State unemploy-
Employer and employee contribu- tions to employee-benefit plans to- taled an estimated $8.7 billion in 1956, an increase of 27 percent from the 1954 estimate of $6.8 billion (table 2) . Of the $1.9 billion increase, private retirement plans were re- sponsible for the greatest share ($0.7 billion), with hospitalization ($0.4 billion) and life insurance ($0.25 billion) ranking second and third. Percentagewise, the greatest gain- other than that in major medical ex-
Except for the new and rapidly expanding field of major medical ex- pense insurance, which showed an increase in employee coverage from less than a million in 1954 to 3.6 million in 1956, the greatest percent- age gain occurred in medical expense coverage-33 percent. Other types of employee protection showed smaller rates of increase, ranging from about 10 percent in temporary disability in- surance plans to 24 percent in group accidental death and dismemberment insurance. Even larger percentage gains were recorded in the number of dependents covered, with the great- est growth reported in the relatively new fields of major medical expense and dependents’ life insurance.
Table 1 .-Estimated number and percentage of wage and salary worki>= their dependents covered under employee benefit plans, 1 by type of benefit, December 31, 1954 and 1956
I Numbers (in millions) I
Type of benefit IL-
1954 1956
Covered em- lloyees as per- cent of wage and salary
labor force 2
Total Em- De- ploy- pend- ees ents
__-
Total Em- Ploy- ees
De-
%ttm 1954 1956
Life insurance and death benefits a--.- 30.9 Accidental death and dismember-
29.8 1.1
14.0 ___._.. 31.1 44.2 27.8 36.4 17.0 21.1
.8 1.1
37.7 35.5 2.2 62.8
rnenta~~~~~-~-~~~~_.~-~~-.---~~~~. 14.0 Hospitalization 5 __________. ._________ 75.3 Surgicala _____. --- ..____._._. ._._____ 66.2 Medicals........-.......-.---.-.---.- 38.1 Major medical expense 5 ____._. -.--__. 1.9
17.3 89.0 82.1 54.G
8.3
17.3 _ _ _ _. _. 35.5 53.5 33.1 49.0 22.6 32.0
3.6 4.7
56.7
26.6 59.1 52.9 32.3
1.5
30.6 62.8 58.6 40.0
6.4
Supplemental unemployment bene- fitse.-...-.-------...-- _ _________ -_-_-__,
Temporary disability (including for- malsickleove)s- .___ _... -._.-__. 22.9
Retirements...-.-..--.-.-.-.--------- 13.1
2.0 2.0
22.9 .._____ 13.1 ____ -__
25.2 25.2 _ _ _ _ _ _. 15.2 15.2 _-___..
’ 50.3 ’ 28.8
‘4.1
7 51.5 ‘31.1
-
Perhaps of more significance than the growth in numerical coverage is the ‘growth in the proportion of the wage and salary labor force covered by employee-benefit plans. For those types of benefits for which data for government employees are included, table 1 relates coverage to the entire wage and salary labor force. For retirement, temporary disability, and supplemental unemployment benefits, which exclude data for government employees, coverage is related to the wage and salary labor force in pri- vate industry.
1 Plans whose benefits flow fromithe employment reletionship and are not underwritten or p&id directly by government (Federal, St&e, or locrrl). Excludes workmen’s compensation rewired bv statute and employer’s liability.
2 Average number of full-time and part-time em- ployees-52.6 million in 1954 and 56.6 million in 1956 (Snwey 01 Current Busineaa, July 1957, table 26).
3 Qroup and wholesale life insurance coverage (Life Insurance Association of America, (froup Insurance and cfroup Annuity Coverage, 1954 and 1956) and self-insured death benefit plan coverage (based on data for various trade-union, mutual benefit association, plans).
and company-administered
4 Data from the Life Insurance Association of America (see footnote 3).
5 Data from Extent of Voluntary Health Insurance Coverage in the United States (Health Insurance Council, 1954 and 1956) and from the Life Associa- tion of America (see footnote 3). In estimating number of employees covered under plans other than group insurance and union and company plans, 75 percent of all subscribers assumed to be employees. Data for hospitalization, surgical, and
medical coverage include employees and their dependents covered by group major medical ex- pe%e insurance under both- supplementary and comprehensive plans. Comprehensive major medi- cal plans, which include both basic hospital-surgical- medical benefits and major medical expense pro- tection in the same insurance contract, covered 22,000 employees and 29,009 dependents in 1954; 551,000 employees and 862,000 dependents in 1956.
0 Based on trade-union and industry reports. Excludes dismissal wage and separation allowances.
7 Computed as percent of private wage and salary labor force (45.5 million in 1954 and 48.9 million in 1956). (u.8 Data from the Health Insurance Council (see footnote 5). Includes private plans written in com- pliance with State temporary disability insurance laws in California, New Jersey, and New York.
9 Estimated by the Division of the Actuary, Social Security Administration. Represents pay-as-you- go and deferred profit-sharing plans, plans of non- profit organizations, and railroad plans supple- menting the Federal railroad retirement program; excludes annuitants.
Bulletin, March 1958 5
pense insurance-was in premiums for accidental death and dismemberment and life insurance (48 percent and 34 percent, respectively).
Table 2 also shows the magnitude of the contributions in relation to the total wage and salary bill of the Nation. The same procedure is fol- lowed as in table 1; contributions are related either to all wages and salaries or to wages and salaries in private industry only, depending on whether the type of benefit includes or excludes government employees.
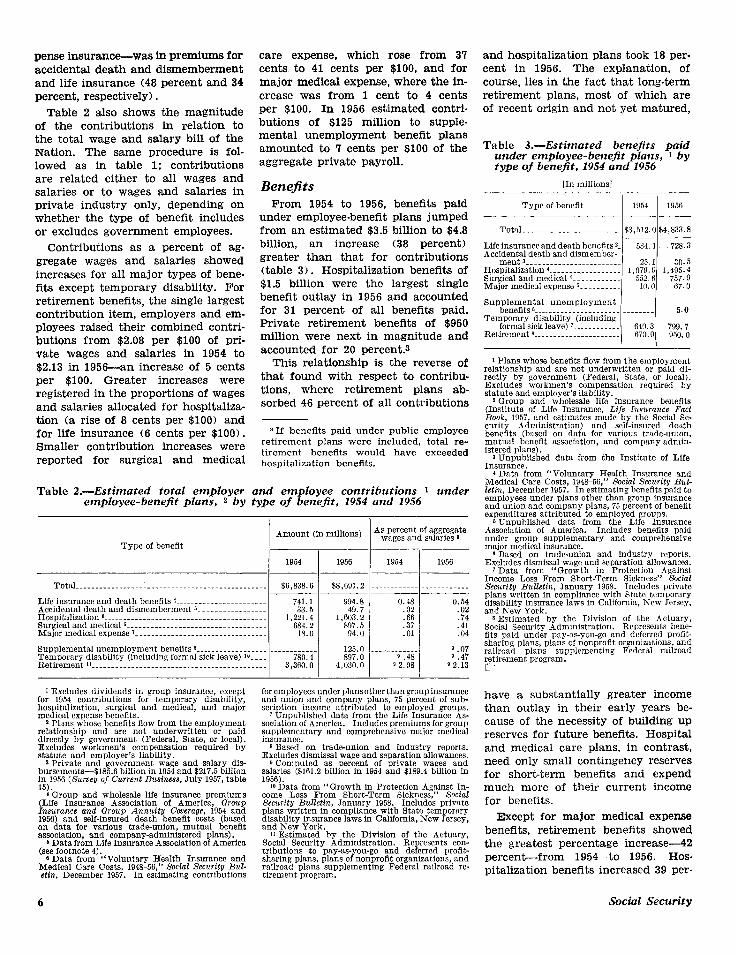
care expense, which rose from 3’7 cents to 41 cents per $100, and for major medical expense, where the in- crease was from 1 cent to 4 cents per $100. In 1956 estimated contri- butions of $125 million to supple- mental unemployment benefit plans amounted to 7 cents per $100 of the aggregate private payroll.
Benejits From 1954 to 1956, benefits paid
Contributions as a percent of ag- gregate wages and salaries showed increases for all major types of bene- ilts except temporary disability. For retirement benefits, the single largest contribution item, employers and em- ployees raised their combined contri- butions from $2.08 per $100 of pri- vate wages and salaries in 1954 to $2.13 in 1956-an increase of 5 cents per $100. Greater increases were registered in the proportions of wages and salaries allocated for hospitaliza- tion (a rise of 8 cents per $100) and for life insurance (6 cents per $100). Smaller contribution increases were reported for surgical and medical
under employee-benefit plans jumped from an estimated $3.5 billion to $4.8 billion, an increase (38 percent) greater than that for contributions (table 3). Hospitalization benefits of $1.5 billion were the largest single benefit outlay in 1956 and accounted for 31 percent of all benefits paid. Private retirement benefits of $950 million were next in magnitude and accounted for 20 percent.3
This relationship is the reverse of that found with respect to contribu- tions, where retirement plans ab- sorbed 46 percent of all contributions
8 If benefits paid under public employee retirement plans were included, total re- tirement benefits would have exceeded hospitalization benefits.
Table 2.-Estimated to_tal fmplcy$r and employee contributions 1 under employee-oeneflt plans, a oy type of benefit, 1954 and 1956
and hospitalization plans took 18 per- cent in 1956. The explanation, of course, lies in the fact that long-term retirement plans, most of which are of recent origin and not yet matured,
Table 3.-Estimated benefits paid under employee-benefit plans, 1 by type of benefit, 1954 and 1956
[In millions]
Type.of benefit I I
1954 1956 __-
Total ___.._._.___.__......-.- -/$3,512.01$4,833.8
Life insurance and death benefits 2. 534.1 728.3 Accidental death and dismember-
ment3.---..---....--.--....-~ 25.1 30.5 Hospitalizationr._-..- ._.___ -..-.. 1,079.g 1,;49;:; Surgical and medical a.-.- 552.6 Major medical expense 5- _ -_. 10.0 67.0
Supplemental unemployment benefits e... .__._________...... ~- . . .._. 5.0
Temporary disability (including formal sick leave) 7 ________.._ _ 640.3 799.7
Retirement a..- _____._. -- ______ -_. 673.0 950.0
Type of benefit Amount (in millions) As percent of aggregate
wages and salaries 8 ~--
1954 1956 1954 1956 ___~
Totitl.._______________.__-.-....--.---.------------.- $6.838.6 $8,691.2 ._..._...... ._..._._.___ ____~___ Life insurance and death benefits 4 ________ -_----___- 741.1 994.8 0.48 0.54 Accidental death and dismemberment ~.~~~~----~~~---~- 33.5 49.7 .a2 .02 Hospitalization 6 . . . ..__________________________ ________. 1,221.4 1,603.Z .66 .74 Surgical and medical 6. ______________.________ _________. 684.2 897.5 .37 .41 Major medical expense 7 _......._........_..____________ 18.0 94.0 .Ol .a4 Supplemental rmemployment benefits * ._..____ -_------__ ..__ --.-.-.- 125.0 .- _____. -.-. 9 .a7 Temporary disability (including forms1 sick leave) 10. .__ 780.4 897.0 9.48 9 .47 Retirement II--...-......---.--......--.-----.....-..-... 3,360.O 4,030.o Q2.08 9 2.13
8 Estimated by the Division of the Sctuary, Social Security Administration. Represents bene- fits paid under pay-x-you-go and deferred profit- sharing plans, plans of nonprofit organizations, and railroad plans supplementing Federal railroad @irement program. L1
1 Excludes dividends in group insurance, except for 1954 contributions for temporary disability, hospitalization, surgical and medical, and major medical expense benefits.
2 Plans whose benefits flow from the employment relationship and are not underwritten or paid directly by government (Federal! State, or local). Excludes workmen’s compensatmn required by statute and employer’s liability.
8 Private and government wage and salary dis- bursements-$185.6 billion in 1954 and $217.5 billion in 1956 (Swoey of Cwrent Business, July 1957, table 15).
1 Qroup and wholesale life insurance premiums (Life Insurance Association of America. arouz) insurance and ar0up Annuity Coverage, i954 a& 1956) and self-insured death benefit costs (based on data for various trade-union, mutual benefit association, and company-admimstered plans).
5 Data from Life Insurance Association of America
for employees under plans other than group insurance and union and company plans, 75 percent of sub- scription income attributed to employed groups.
7 Unpublished data from the Life Insurance As- sociation of America. Includes Dremiums for WOUD
have a substantially greater income than outlay in their early years be- cause of the necessity of building UP reserves for future benefits. Hospital and medical care plans, in contrast, need only small contingency reserves for short-term benefits and expend much more of their current income for benefits.
Except for major medical expense benefits, retirement benefits showed the greatest percentage increase-42 percent-from 1954 to 1956. Hos- pitalization benefits increased 39 per-
supplementary and comprehensive major medical insurance.
8 Based on trade-union and industry reports. Excludes dismissal wage and separation allowances.
9 Computed BS percent of private wages and salaries ($161.2 billion in 1954 and $189.4 billion in 1956).
10 Data from “Qrowth in Protection Against In- come Loss From Short-Term Sickness,” Social Security Bulletin, January 1958. Includes private plans written in compliance with State temporary disability insurance laws in California, New Jersey, and New York.
11 Estimated by the Division of the Actuary, Social Security Administration. Represents con- tributions to pay-ss-you-go and deferred profit- sharing plans, plans of nonprofit organizations, and railroad plans supplementing Federal railroad re- tirement program.
(see footnote 4). 6 Data from “Voluntary Health Insurance and
Medical Care Costs, 1948-56,” Social Security Bul- &in, December 1957. In estimating contributions
6 Social Security
cent, and surgical and medical care benefits 37 percent during this period. Benefits for temporary disability showed the least expansion-about 25 percent.
In 1956, benefits under major med- ical expense insurance, sometimes called “catastrophe” insurance, were almost seven times what they had been in 1954, although they accounted for only a little more than 1 percent of all benefits paid under employee- benefit plans in 1956. As one of the latest types of employee benefits to be introduced, major medical ex- pense insurance is expected to con- tinue to make rapid strides in the coming years.
Measuring Real Growth Questions are often raised concern-
ing the extent to which rising con- tributions and benefits paid under employee-benefit plans represent real gains for individual employees, in terms of the scope and adequacy of the protection furnished. In other words, what portions of the increase in aggregate expenditures for em- ployee benefits are explained by (1) growth in the number of employees covered by plans, (2) inclusion of larger proportions of dependents, (3) increased cost of providing the same amount of benefits, and (4) liberali- zation of benefits that increases the real value or quantity of the protec- tion?
Hospitalization benefits, for ex- ample, which increased in the aggre- gate 38.5 percent from 1954 to 1956, showed only a 19.0-percent increase when measured in terms of beneflts per participant. This percentage in- crease is less impressive when the rise in the cost of hospital care dur- ing the 2 years is considered. The consumer price index of the Bureau of Labor Statistics shows a rise of 10.5 percent in hospital room rates from 1954 to 1956. If this increase is indicative of hospitalization prices in general, then only 8.5 percent out of the 38.5-percent increase in aggre- gate benefit payments for hospitaliza- tion can be said to relate to addi- tional services received by insured persons. The pattern of utilization of hospital services, however, is con- stantly changing. It is therefore dif- ficult to determine what part of the 8.5-percent increase signifies a lib-
eralization of the benefit provisions.4 A similar analysis with respect to surgical and medical benefits (includ- ing these benefits under major med- ical) showed that, of the increase of about 42 percent in aggregate pay. merits, at least 32 percent is due to growth in numbers covered and to price changes.
Health BeneJits and Services The measurement of real growth
in the area of hospitalization bene- fits is complicated by the fact that about half the employee coverage is derived from service benefit plans that, by their nature, tend to follow rises in hospital costs without too much lag. For the cash indemnity benefits available to the other half of the employees covered, however, there tends to be an appreciably greater gap between payments and rising costs. This same type of differ. ence in the relationship of payments and rising costs exists between plans covering full surgical costs and cash indemnity plans with fixed schedules for surgical fees.
In terms of real growth in protec- tion, however, the longer hospital stays permitted are significant under either service or indemnity plans. An examination of the plan provisions as described in the Blue Cross Guide reveals that from 1954 to 1956 the maximum duration of hospitalization provided has tended to increase from 30 days to 70, 90, and even 120 days. A recent National Industrial Confer- ence Board report shows that, in early 1956, 83 out of 143 employee- benefit plans studied were providing at least 70 days of hospitalization and that 31 were providing 120 or more days.5 According to a Bureau of Labor Statistics study of 180 union- negotiated plans paying cash hospital benefits throughout the country, the maximum duration was 70 or more days for 46 percent of the workers
4 For a general discussion of the inter- relationship of per capita medical expendi- tures, price changes, and patterns of spending for medical care, see “Voluntary Health Insurance and Medical Care Costs, 1948-56,” Social Secusity Bulletin, Decem- ber 1957.
6 Harland Fox, Trends in Company Group Insurance Programs (National In- dustrial Conference Board, Studies in Personnel Policy No. 159). 1957.
covered in late 1955.6 In contrast, a study by the New York State Depart- ment of Labor showed that only 36 percent of the workers under cash indemnity plans in that State had 70 or more days of coverage in June 1954.’
Rates charged by hospitals for room and board rose almost universal- ly from 1954 to 1956. The average rate for a two-bed room (typically provided in service benefit plans) in large hospitals in 1954 was $14.47; by 1956 the rate was $15.29.
Changes reported in employee-ben- efit plan provisions negotiated by employers and trade unions during 1954-56 * included numerous in- stances where the daily allowance for hospital room and board was raised from $10 to $12 or from $12 to $15. According to data gathered by the Life Insurance Association of America, the average daily allowance provided for employees by group hos- pital plans in force that were under- written by commercial insurance car- riers was $10.26 for 1956, compared with $9.17 for 1954.9 The Bureau of Labor Statistics study of union- negotiated plans shows the average maximum daily benefits provided un- der cash-benefit hospital plans in late 1955 as $11.12 for employees and $10.31 for dependents.
The increase in allowances for hos- pital “extras,” either fully paid by the plan or coinsured by the em- ployee, parallels increases in the daily allowance for room and board and like them reflects the fact that hospital charges have gone up. The National Industrial Conference Board reported that ‘78 of the 123 plans paying cash benefits provided $150 or more in allowances for extras such
6U. S. Department of Labor, Bureau of Labor Statistics, Analysis of Health and
Insurance Plans Under Collective Bargain-
ing, Late I955 (Bulletin No. 1221), 1957. TNew York State Department of Labor,
Health and Welfare Benejits in New York
State (Division of Research and Statistics Publication No. B-83), December 1955, page 53.
8 IJ. S. Department of Labor. Bureau of Labor Statistics, Current Wage Develop-
ments, monthly issues; and “Significant Pay Settlements,” published monthly in Management Record (National Industrial Conference Board).
0 Life Insurance Association of America, Group Insurance and Group Annuity
COveTage, 1954 and 1956.
Bulletin, March 1958 7
as drugs and serums, various diagnos- tic procedures, and the use of special equipment. Of the 78 Plans, 26 pro- vided allowances ranging from $100 to $315, plus 75 percent of the next $500-$4,580 of expenses.
The amounts allowed in employee- benefit plans for surgical and medi- cal benefits have also tended to rise. According to the 1955-56 studies of both the National Industrial Confer- ence Board and the Bureau of Labor Statistics, half the plans provided maximum surgical allowances of $250 or more. Data for group insurance companies show that the average maximum surgical benefit for em- ployees rose from $219 in 1954 to $234 in 1956. Reports of negotiated changes show frequent increases in the fee schedule from $200 and $250 to $250, $300, and higher for the most costly procedures. The extent to which these increases in fee sched- ules have occurred in recognition of already existing increases in physi- cians’ and surgeons’ charges and the extent to which they produce actual improvements in the workers’ pro- tection vary from place to place. Even apart from the rapid spread of major medical insurance, there has been an increase in the frequency of provisions for reimbursements of physicians’ fees for visits to his office or for his calls to the patient’s home in addition to fees for physicians’ visits at the hospital. At the same time the extension of hospitalization, surgical, and other medical benefits to retired employees and their de- pendents has continued.
It is apparent that many of the developments outlined above, such as increased allowances for hospitaliza- tion and surgical expenses, were mo- tivated by the need to keep existing benefits abreast of the increased cost of medical care. On the other hand, increases in the maximum duration of hospitalization benefits, the addi- tion of provisions for physicians’ serv- ices at the home or office and for
ability, death, or retirement, it is less easy to distinguish between that portion of the aggregate increase in benefits devoted to keeping up with wage levels and that portion repre- senting real gains in the scope of the protection provided.
In the case of temporary nonoccu- pational disability, some insight into this problem may be obtained by using the procedures developed by the Division of Program Research in its annual series on income-loss pro- tection against sickness.10 Relating the amounts paid under employee- benefit plans to the income lost by covered wage and salary workers gives a rough measurement of the extent to which benefits actually im- proved. Use of this method shows that cash sickness benefits paid un- der private plans (including formal sick-leave plans) replaced 27.6 per- cent of the gross income loss of work- ers covered by such plans in 1954 and 28.6 percent in 1956.
National Industrial Conference Board studies of company disability plans11 in mid-1953 and the first quarter of 1956 show general in- creases in the size of benefits. The 1956 analysis of company plans pro- viding employee benefits that were graduated on the basis of employee earnings indicates that the weekly disability benefit in the median com- pany was equal to half pay for work- ers earning up to $80 a week. In 1953, only weekly earnings of less than $75 were compensable at half pay. Week- ly benefits payable under flat-sum programs increased from an average of $30 in 1953 to $34 in 1956. Ac- cording to the Life Insurance Asso- ciation of America, the average week- ly benefit for all group disability in- surance policies in force in 1956 was $33.27-10.4 percent higher than the 1954 average of $30.13. Since gross average weekly earnings of produc- tion workers in manufacturing indus- tries rose by 11.3 percent during the
2 years, it is evident that increases in benefit amounts were mainly de- signed to take care of advancing wage rates.
Other features of group disability insurance plans, according to avail- able data, showed no appreciable changes from 1954 to 1956. The tend- ency to extend the duration of bene- fits or to liberalize waiting periods received no special impetus in this period. The amendment to the New York temporary disability insurance law that extended the duration from 13 weeks to 20 weeks went into effect on July 1, 1956, and apparently is not fully reflected in current studies of disability plans.
Supplementation of workmen’s compensation generally up to the level of the benefit paid for nonoccu- pational disability has been increas- ingly provided for in collective bar- gaining agreements. The Bureau of Labor Statistics study shows that in late 1955 about one-fifth of the plans analyzed contained provisions of this nature. The effect on aggregate ben- efit payments, however, has been slight, since only about 5 percent of all illnesses are work-connected and benefits paid in such instances rep- resent only the difference between the statutory workmen’s compensation payment and the nonoccupational disability payment.
There is also evidence of a grow. ing tendency to use formal sick-leave plans as a means of supplementing accident and sickness benefits under a group insurance plan. National Industrial Conference Board studies show that in early 1954 about 25 per- cent of the firms surveyed provided both sick leave and group insurance benefits for salaried employees, com- pared with 32 percent in early 1956.12 Firms with dual benefits for hourly employees increased from 9 percent to 18 percent. The Community Wage Studies of the Bureau of Labor Sta- tisticsls also show the increased scope
meeting the cost of catastrophic ill- 12 Harland FOX, Company-Paid Sick
nesses, and the extension of benefits, 10 See “Growth in Protection Against In- Leave and Supplements to Workmen’s
to some degree, to retired employees come Loss From Short-Term Sickness,” Compensation and Trends in Company
and their dependents are distinct im- Social Security Bulletin, January 1958. Group Insurance Programs (National In-
11 Lois E. Forde, “Group Disability Insur- dustrial Conference Board, Studies in provements in existing programs. ante Plans: A Study of Current Group In- Personnel Policy, No. 146, 1954, and No.
surance Program Points UP the Trend to 159. 1957).
l’emporary Disability Benefits Greater Coverage and Larger Benefits,” *U. S. Department of Labor, Bureau of Management Record (National Industrial Labor Statistics, Wages and Related Bene-
For those types of benefits designed Conference Board), March 1954; and Fox, fits, 1953-54 and 1955-56 (Bulletins No. 1157 to replace income lost because of dis- op. cit. and No. 1188).
8 Social Security
of coverage provided by sick-leave plans, primarily for office workers.
Life Insurance For group life insurance, it is most
meaningful to measure changes in real protection in terms of the face value of the group insurance policies. As reported by the Life Insurance Association of America, these amounts increased in the aggregate by 35.6 percent from 1954 to 1956 for all employee policies in force. The average amount of insurance per employee certificate, however, rose only 12.5 percent, from $3,120 to $3,510. This increase has more than kept pace with the 9.Spercent rise in average annual earnings during the 2 years.
Although both the National Indus- trial Conference Board and the Bu- reau of Labor Statistics studies show that about 7 out of 10 plans paying flat benefits provided less than $3,000 of insurance per employee covered, the plans with benefit amounts grad- uated in accordance with the em- ployee’s wages were more liberal, and they included the larger plans. For employees earning $4,000 a year, ap- proximately four-fifths of the plans provided insurance protection equiv- alent to at least a year’s salary. One- fourth of the plans in the BLS study and one-third of those studied by the National Industrial Conference Board provided insurance equal to at least 1% year’s salary. Approxi- mately 15 percent in both studies provided insurance protection equal- ing at least 2 years’ wages. Reports of negotiated changes in employee benefits show frequent increases ranging from $500 to $2,000. The trend toward covering retired em- ployees is continuing.
Financing Revisions in the benefit structure
were not the only changes made in employee-benefit plans during 1955 and 1956. Even when there were no benefit improvements or when the benefits merely kept pace with the increased costs of medical care or with the rise in wage levels, many employees gained some advantage as employers increasingly assumed a greater share of the benefit costs. In 1954, it was estimated, employers as-
sumed 47 percent of the costs of health and welfare benefits texclud- ing retirement benefits) .I4 Though the change since 1954 is difficult to measure from existing data, reports of negotiated changes show that in- creases in the share of the cost borne by employers may take one or more of the following forms: (1) assum- ing all or a greater share of the costs of increased benefits; (2) as- suming some or all of the cost of benefits for dependents; (3) assuming a greater share of t,he costs of exist- ing benefits; (41 converting a con- tributory plan (or parts of such a plan) to a noncontributory plan; and (5) assuming all or a greater share of the cost of benefits for retired employees.
According to the National Indus- trial Conference Board, 41 percent of the group accident and sickness plans studied in early 1956 were noncon- tributory, compared with about 38 percent in early 1954.15 For basic hospital-surgical-medical benefits for employees, noncontributory arrange- ments prevailed in 39 percent of the plans reviewed in 1956 and in about 36 percent in 1954. Only about 10 percent of the plans were financed entirely by employee contributions in 1956 and about 17 percent in 1954.
Despite the trend toward increas- ing financial participation by the em- ployer, the BLS study shows that, in late 1955, 46 Percent of the 300 union- negotiated health and welfare plans examined, which included 55 percent of covered employees, were financed jointly by the employers and employ. ees as far as employee benefits were concerned.16 With respect to de- pendents’ coverage, 39 percent of the plans were contributory and 18 per-
1.4 U. S. Senate, Committee on Labor and Public Welfare, Welfare and Pension Plans Investigation: Final Report . Submitted by Its Subcommittee on Welfare and Pen- sion Funds (S. Rept. 1734, 84th Cong., 2d sess., 1956).
15 Harland Fox, “Company Group Insur- ance-Who Pays the Bill,” Management
Record (National Industrial Conference Board), November 1954, and “Financing Group Insurance Programs,” Management Record, April 1957.
1.6 Plans were classified as jointly financed if the employee contributed toward the cost of one or more of the benefits of the group specified or if the employer con- tributed only a part of the cost of the benefits.
cent were financed entirely by em- ployees. The contributory Plans in- cluded 47 percent of the employees whose dependents were covered, and the plans financed entirely by the em- ployees, 12 percent.
Trends in Retirement Plans, 1930-56
Because provisions for retirement in- volve long-range considerations, the data on private retirement plans do not readily permit a statistical evalu- ation of growth over a short period of time. To get a better perspective of developments in the field of pri- vate pension plans, a historical an- alysis is presented in the following paragraphs. An analysis going back to the 1930’s has pertinence because of the relationship that has devel- oped between private retirement plans and the Federal program of old-age, survivors, and disability in- surance initiated in 1935.
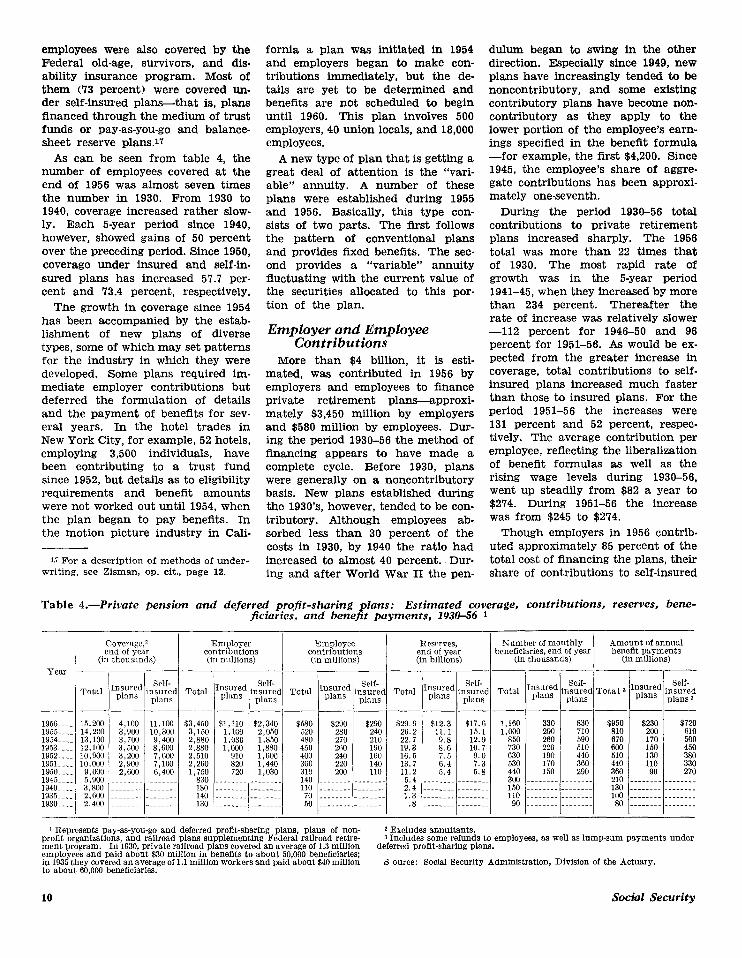
The past quarter of a century has witnessed a remarkable growth in the coverage and resources of private retirement plans. Since 1930, accord. ing to the estimates developed by the Division of the Actuary, coverage under private pension and deferred profit-sharing plans has increased from 2.4 million to 15.2 million, con- tributions from $180 million to $4,030 million, the number of beneficiaries from 90,000 to 1,160,000, and benefits from $80 million to $950 million (table 4). Reserves accumulated un- der the plans rose from $0.8 billion to $29.9 billion. This growth, al- though attributable in part to Fed- eral tax policy, has been accelerated by the Government’s wage stabiliza- tion programs during World War II and the Korean conflict. The spec- tacular rise in coverage and resources since 1950 can also be traced to the widespread adoption of private pen- sion pla,ns in mass-production indus- tries, following the decisions of the courts and the National Labor Rela- tions Board that pension and welfare plans are proper subjects for collec- tive bargaining.
Coverage At the end of 1956, private retire-
ment plans covered an estimated 15.2 million employees, or more than 31 percent of the private wage and sal- ary labor force. Practically all these
Bulletin, March 1958 9
employees were also covered by the Federal old-age, survivors, and dis- ability insurance program. Most of them (‘73 percent) were covered un- der self-insured plans-that is, plans
As can be seen from table 4, the number of employees covered at the
financed through the medium of trust
end of 1956 was almost seven times the number in 1930. From 1930 to
funds or pay-as-you-go and balance-
1940, coverage increased rather slow- ly. Each 5-year period since 1940,
sheet reserve plans.17
however, showed gains of 50 percent over the preceding period. Since 1950, coverage under insured and self-in- sured plans has increased 57.7 per- cent and 73.4 percent, respectively.
Tne growth in coverage since 1954 has been accompanied by the estab- lishment of new plans of diverse types, some of which may set patterns for the industry in which they were developed. Some plans required im- mediate employer contributions but deferred the formulation of details and the payment of benefits for sev- eral years. In the hotel trades in New York City, for example, 52 hotels, employing 3,500 individuals, have been contributing to a trust fund since 1952, but details as to eligibility requirements and benefit amounts were not worked out until 1954, when the plan began to pay benefits. In t.he motion picture industry in Cali-
I.7 For a description of methods of under- writing, see Zisman, op. cit., page 12.
fornia a plan was initiated in 1954 and employers began to make con- tributions immediately, but the de- tails are yet to be determined and
A new type of plan that is getting a
benefits are not scheduled to begin
great deal of attention is the “vari- able” annuity. A number of these
until 1960. This plan involves 500
plans were established during 1955 and 1956. Basically, this type con-
employers, 40 union locals, and 18,000
sists of two parts. The first follows the pattern of conventional plans
employees.
and provides fixed benefits. The sec- ond provides a “variable” annuity fluctuating with the current value of the securities allocated to this por- tion of the plan.
Employer and Employee Contributions
More than $4 billion, it is esti- mated, was contributed in 1956 by employers and employees to finance private retirement plans-approxi- mately $3,450 million by employers and $580 million by employees. Dur- ing the period 1930-56 the method of financing appears to have made a complete cycle. Before 1930, plans were generally on a noncontributory basis. New plans established during the 1930’s, however, tended to be con- tributory. Although employees ab- sorbed less than 30 percent of the costs in 1930, by 1940 the ratio had increased to almost 40 percent. Dur- ing and after World War II the pen-
dulum began to swing in the other direction. Especially since 1949, new plans have increasingly tended to be noncontributory, and some existing contributory plans have become non. contributory as they apply to the lower portion of the employee’s earn- ings speciiied in the benefit formula -for example, the first $4,200. Since 1945, the employee’s share of aggre. gate contributions has been approxi- mately one-seventh.
During the period 1930-56 total contributions to private retirement plans increased sharply. The 1956 total was more than 22 times that of 1930. The most rapid rate of growth was in the B-year period 1941-45, when they increased by more than 234 percent. Thereafter the rate of increase was relatively slower -112 percent for 1946-50 and 96 percent for 1951-56. As would be ex- pected from the greater increase in coverage, total contributions to self- insured plans increased much faster than those to insured plans. For the period 1951-56 the increases were 131 percent and 52 percent, respec- tively. The average contribution per employee, reflecting the liberalization of benefit formulas as well as the rising wage levels during 1930-56, went up steadily from $82 a year to $274. During 1951-56 the increase was from $245 to $274.
Though empIoyers in 1956 contrib. uted approximately 85 percent of the total cost of financing the plans, their share of contributions to self-insured
Table 4 .-Private pension and deferred profit-sharing plans: Estimated coverage, contributions, reserves, bene- ficiaries, and benefit payments, 193046 1
-
1956L.. 1955.-.. 1954L.. 1953.--. 195x--. 1951.... 195OL.. 1945L.. 1940..-. 1935L.. 1930.--.
15,200 4,100 11,100 14,200 3,900 10,300 13,100 3,7cml 9,400 12,100 3,500 8,Goo 10,900 3,200 7,600 10,000 2,900 7,100 9,000 2,600 6,400 5,9ch!l .--._-.. .-_-_.-- 3,800 .-.-.._. .-...-_. 2.600 ._--.._. .-_..._. 2,400 ..- . .._ ..- . . .._.
Employcr contributions (in millions)
Employee contributions (in millions) 1
Reserves, end of year (in billions)
/ I
Xumher of monthly Amount of annual heneflciaries, end of year benefit payments
(in thousands) (in millions) I I I I
$29.9 26.2 22.7 19.3 16.5 13.7 11.2 5.4 2.4 1.3 .8
$12.3 “2: Y
1,160 11.1 1,wo 9.8 12.9 850 8.6 10.7 730 7.5 9.0 630 6.4 7.3 530 5.4 5.8 440
_. 3M) .._____. _...__.- --------I-------~ 150 . . .._-__._.-_._. 110
90
330 830 290 710 260 590 220 510 190 440 170 360 150 290
,_.-.-.--1..- . .._..
% 670 600 510 440 360 210 130 100 80
$:2X& “2 170 500 150 450 130 380 110 330 90 270 _ _ _ _ , _ _. _. _ _
. _. _ _ _ , _ _ _ _ _ _ _ _
._-__--. ________
1 Represents pay-as-you-go and deferred profit-sharing plans, plans of non- * Excludes annuitants. profit organizations, and railroad plans supplementing Federal railroad retire- 3 Includes some refunds to employees, as well as lump-sum payments under ment program. In 1930, private railroad plans covered an average of 1.3 million employees and paid about $30 million in benefits to about 50,000 beneficiaries;
deferred profit-sharing plans.
in 1935 they covered an average of 1.1 million workers and paid about $40 million 5 ource: Social Security Administration, Division of the Actuary. to about 60,000 beneficiaries.
10 Social Security
plans tends to be relatively larger than that for insured plans; a larger portion of the latter are on a con- tributory basis. For the period 1950-56, employers’ contributions amounted to approximately 90 per- cent of the total for self-insured plans and about 79 percent for insured plans. These proportions seem to re- flect the influence of collective bar- gaining for noncontributory pension plans in the mass-production indus- tries, which followed the 1949 agree- ments with the major employers in the automobile and basic steel indus- tries.
Reports of negotiated changes dur- ing 1955 and 1956 show frequent in- creases in employer contributions to jointly administered multi-employer pension funds. The increases from 3 percent to 4 percent in various plans involving the International Ladies’ Garment Workers Union are illustra- tive.
Increased employer contributions, other than those resulting from ac- tuarial factors, may result from a reduction in employee contribution or a change from a contributory (em- ployer-employee joint financing) plan to a noncontributory plan. In 1955, for example, the agreement between a major electrical equipment manu- facturer and the International Union of Electrical, Radio, and Machine Workers reduced employee contribu- tions from 2 percent on the first $3,600 of annual earnings and 5 per- cent on the excess to 1 percent on the first $4,200 and 4 percent on the remainder. In 1958 the contribution on the first $4,200 will be eliminated, and the contribution on the remain- der reduced to 3 percent.
Reserves The growth in retirement plan re-
serves has been even greater than that in the other factors examined so far. Estimated at $800 million in 1930, at the end of 1956 they amounted to $29.9 billion, or more than 3’7 times the 1930 total. Re- serves trebled in the period 1931-40. During the next decade they in- creased by almost 367 percent and since 1950 by close to 167 percent. Although the yearly rate of increase has dropped from approximately 22 percent in 1951 to 14 percent in 1956, the yearly increase in absolute dollars
has risen from $2.5 billion to $3.7 billion. The reserves constitute 8 large and growing source of invest- ment funds.
Approximately 41 percent of the reserves was accumulated under in- sured plans in 1956; in 1950 the pro- portion was more than 48 percent. This drop, and the corresponding rise in the proportion of reserves accumu- lated by the self-insured plans, is attributable to the fact that many self-insured plans are relatively new. As they grow older their assets in- crease in significance. It will be noted, for example, that assets under insured plans increased by only 128 percent from 1950 to 1956 but that those of self-insured plans increased by 203 percent.
Since insured plans tend to be more fully funded, the average reserve per employee is much larger under in- sured plans than under self-insured plans. In 1956 the average amount per employee covered in insured plans was $3,075, and under self- insured plans it was $1,645. The relative difference, however, has nar- rowed noticeably since 1950, when the average reserves were $2,160 and $951, respectively. For the two types of plans combined the average re- serves increased from $1,333 to $2,034 during the period.
Beneficiaries and BeneJits The number of monthly beneficiar-
ies under private retirement plans has grown steadily-from 90,000 in 1930 to 1,160,OOO in 1956. Not all the cur- rent beneficiaries are recipients of benefits under the Federal old-age, survivors, and disability insurance program. A sizable number-an esti- mated 180,000-worked in noncovered employment or retired before they had met the age or work require- ments to qualify for benefits under the Federal program.
Benefit payments under private re- tirement plans grew from $80 million in 1930 to $950 million in 1956. These benefits include the following lump- sum payments under self-insured plans: (1) refunds of employee con- tributions to individuals withdraw- ing from the plans before retirement and before accumulating vested de- ferred rights; (2) return of employee contributions to the survivors of workers who died before they had
received in retirement benefits a total amount equal to their contributions: and (3) lump-sum payments made under certain conditions to beneficiar- ies under deferred profit-sharing plans. Because the source of data from which the estimates have been developed does not make it possible to distinguish between these lump- sum benefits and monthly retirement benefits, average annual retirement benefits cannot be derived.
Since 1950, both the number of beneficiaries and the amount of bene- fits have increased at the same pace; the 1956 totals were about two and one-half times what they were in the earlier year. There was thus little increase in benefit outlays per bene- ficiary. This finding is not surpris- ing, because the total amount paid under private retirement plans is weighted with benefits that reflect earnings levels and benefit formulas of earlier decades. Improvements and expansion of benefits under private pension plans in any year are for the most part not fully felt until many years have elapsed. Moreover, a growing proportion of the benefi- ciaries retiring (72 percent in 1956 and 66 percent in 1950) were covered by self-insured plans. These plans, many of which were established in the last decade as the result of nego- tiations in the mass-production in- dustries, currently tend to pay pen- sions of lower amounts than do the older plans.
Some private pension plans have had their ups and downs in recent years, as a result of changing eco- nomic conditions. The retirement plan negotiated by the United Mine Workers of America for the anthra- cite coal industry, for example, re- duced its monthly benefits early in 1954 from $100 to $50 because of the declining tonnage in coal mined. In the fall of 1954 the pension plan established in 1950 in the full-fash- ioned hosiery industry as a result of an arbitration award was liquidated because of competitive and economic conditions. In the spring of 1955 the United Hatters, Cap and Milli- nery Workers International Union agreed with the Eastern Women’s Headwear Manufacturers Association to forego a proposed addition of 1 percent to the a-percent employer contribution to the industry pension
Bulletin. March 1958 11
plan and to permit the money to be used instead to promote the sale of women’s hats, with the hope that the pension plan would benefit from any improvement in business.
The relative importance of pen- sions for workers is illustrated by two agreements. The first, made be- tween the United Automobile Work- ers and the American Motors Cor- poration in the fall of 1955, deferred supplementary unemployment bene- fits for 1 year to protect the pensions of 3,000 employees displaced as a re- sult of the company’s merger with the Hudson Motor Car Company. The second, negotiated by the Textile Workers Union and the American Viscose Company in mid-1956, in- creased retirement benefits and pro- vided for the company’s assumption of the full cost of the pension plan effective June 1, 1956, and for the deferment of a wage increase to July 1, 1957.
On the whole, however, the 1954- 56 period was marked by numerous instances of improvements in existing plans. The improvements took the following forms: adjustment of bene- fit formulas to amendments in the Social Security Act, liberalization of benefit formulas and eligibility re- quirements, changes in disability ben- eflts, and increased vesting provisions.
Integration with old-age, survivors, and disability insurance. - When plans were first negotiated in the mass-production industries, they fre- quently provided for offsetting the full amount (one-half the full amount in the rubber industry) of the old- age benefit under the Social Security Act from the amount derived from the plan’s benefit formula. As a re- sult, when benefits paid under the Act were liberalized, the amount of benefit payable by the plan was re- duced.
In mid-1954 the United Steel Work- ers signed a series of agreements with manufacturers in the basic steel in- dustry, which provided that future increases in the Federal benefits would go to the retired workers and, for that purpose, froze the amount to be offset from the plan’s monthly benefit at $85-the maximum old-age benefit then payable under the Act. In addition, it ohanged the minimum
Liberalization of benefit formulas. -The benefit formulas have been liberalized in various ways. In the mass-production industries the mini- mum benefit-a flat monthly benefit for each year of service-has been increased. In the automobile indus- try the maximum on the number (30) of years of service that could be cred- ited was eliminated in mid-1955, and the monthly benefit for normal re- tirement was raised from $1.75 for each year of service to $2.25. In other industries the benefit expressed as a percentage of average wages dur- ing the entire period of service, for each year of service, was changed to a percentage of the average wage during the last 10 years (or 5 years) of service. In still others the per- centage factor was increased.
Changes in disability benefits.- Disability benefits were changed in many instances by reducing the elig- ibility requirements, increasing the benefits, or both.
Increased vesting.-Vesting provi- sions, which transfer to the employee upon separation before retirement the right to the accrued pension re- sulting from his employer’s contribu- tions, have received much attention in the negotiations in the mass-pro- duction industries. Such provisions are common in insured plans but have not been adopted until recently in the noninsured plans that pre- dominate in these industries. The Bankers Trust Company, in its 1956 analysis of 61 private retirement plans, observed that in 1952 few of the plans in the mass-production in- dustries had vesting provisions 18 but that 27 percent had vesting provisions at the end of 1955. Outstanding ex- amples of plans in which vesting pro- visions were added are those adopted in 1955 in the automobile and rubber industries, which provide for vesting at age 40 and after 10 years of serv- ice, and those in the steel industry, where similar provisions (vesting at age 40 and after 15 years of service) went into effect as of November 1, 1957. For steel workers, however, vesting is restricted to those laid off for 2 years or more or whose services are terminated as a result of a per- manent shutdown.
In the automobile industry the age requirement (50) for eligibility has
monthly benefit from $100 (including the Federal old-age benefit) for em ployees with at least 25 years of serv- ice to $55 (excluding the Federal ben- efit) for employees with 30 or more years of service. In 1956 the mini- mum monthly benefit was changed, effective November 1, 1957, to $2.40 for each year of service (up to 30) before that date and to $2.50 for each year thereafter . This pattern was also adopted in the aluminum and canning industries. In other plans- the rubber industry plan, for example -alternative formulas providing a flat benefit for each year of service are used if the result is a benefit greater than that derived from the offset formula. In some plans, the offset formula has been replaced by one paying a flat amount for each year of service.
A recently negotiated plan in the trucking industry provides for normal retirement at age 60, with a monthly benefit of $90. When the worker reaches age 65 and becomes eligible for a benefit under old-age, survivors, and disability insurance his monthly benefit under the plan drops to $22.50.
been removed as a result of negotia- tions in the spring of 1955. The serv- ice requirement of 15 years, however, was retained. In addition, the month- ly benefit was increased from $3.00 to $4.50 for each year of creditable service. The deduction of “statutory benefits” is still in force. Moreover, as in the case of old-age benefits, the period of creditable service is no longer limited to 30 years. In the steel industry the minimum monthly benefit was raised in 1954 from $50 to $75 and again, effective November 1, 1957, to $90 (including the dis- ability benefit under the Social Se- curity Act, up to $85), and the age requirement was reduced in 1956 from 50 to 40. The trend, as seen from the Bureau of Labor Statistics and National Industrial Conference Board reports on negotiated changes, ap- pears to be toward eliminating the age requirement.
‘8 Bankers Trust Company. A Study of Industrial Retirement Plans (1956 edition).
12 Social Security