Embed Size (px)
Citation preview

Growth Equity Portfolio
Morningstar Separate Accounts ID# F00000XISY
Riskalyze ID# VCMGROE
Minimum Investment: $250,000
Summary Prospectus
June 30, 2017
Before you invest, you should review the Portfolio’s Prospectus, which contains more information about the portfolio and its risks. You can obtain additional information about the portfolio by contacting Victoria Capital Management, Inc. at 843.342.3044.
The Securities and Exchange Commission (SEC) has not approved nor disapproved this portfolio or passed upon the adequacy of this prospectus. Any representation to the contrary is a criminal offense
Page 1
211 King Street Suite 106 Charleston, SC 29401 843-342-3044 www.vcm.us.com
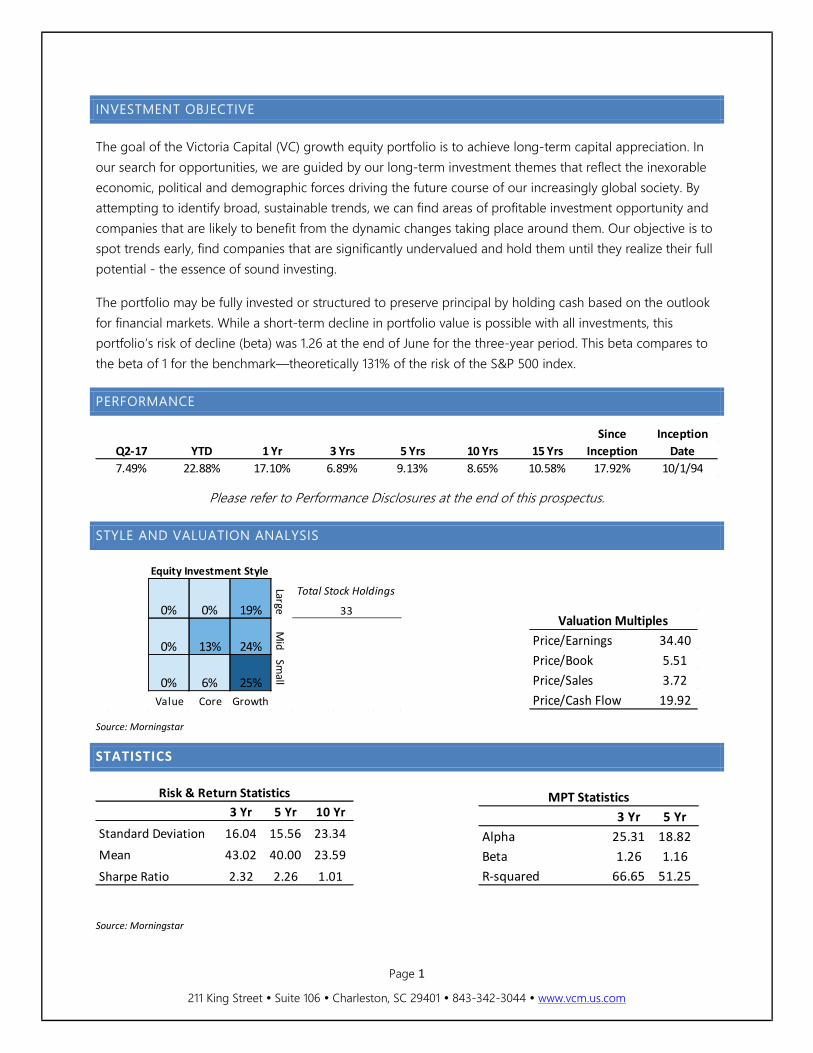
INVESTMENT OBJECTIVE
The goal of the Victoria Capital (VC) growth equity portfolio is to achieve long-term capital appreciation. In our search for opportunities, we are guided by our long-term investment themes that reflect the inexorable economic, political and demographic forces driving the future course of our increasingly global society. By attempting to identify broad, sustainable trends, we can find areas of profitable investment opportunity and companies that are likely to benefit from the dynamic changes taking place around them. Our objective is to spot trends early, find companies that are significantly undervalued and hold them until they realize their full potential - the essence of sound investing.
The portfolio may be fully invested or structured to preserve principal by holding cash based on the outlook for financial markets. While a short-term decline in portfolio value is possible with all investments, this portfolio’s risk of decline (beta) was 1.26 at the end of June for the three-year period. This beta compares to the beta of 1 for the benchmark—theoretically 131% of the risk of the S&P 500 index.
PERFORMANCE
Please refer to Performance Disclosures at the end of this prospectus.
STYLE AND VALUATION ANALYSIS
Source: Morningstar
STATISTICS
Source: Morningstar
Since InceptionQ2-17 YTD 1 Yr 3 Yrs 5 Yrs 10 Yrs 15 Yrs Inception Date7.49% 22.88% 17.10% 6.89% 9.13% 8.65% 10.58% 17.92% 10/1/94
Value Core Growth
Equity Investment Style
0% 0% 19%
0% 13% 24%
0% 6% 25%
LargeM
idSm
all
Total Stock Holdings
33
Price/Earnings 34.40Price/Book 5.51Price/Sales 3.72Price/Cash Flow 19.92
Valuation Multiples
3 Yr 5 Yr 10 Yr
Standard Deviation 16.04 15.56 23.34
Mean 43.02 40.00 23.59
Sharpe Ratio 2.32 2.26 1.01
Risk & Return Statistics
3 Yr 5 YrAlpha 25.31 18.82Beta 1.26 1.16R-squared 66.65 51.25
MPT Statistics

Page 2
211 King Street Suite 106 Charleston, SC 29401 843-342-3044 www.vcm.us.com
THEME ANALYSIS
GROWTH OF $100,000
This Growth Equity Composite chart represents an investment of a $100,000 made on October 1, 1994 that would have grown to $4,249,806 at the end of June 2017.
Please refer to Performance Disclosures at the end of this prospectus.
$4,249,806
$804,271
$100,000
$600,000
$1,100,000
$1,600,000
$2,100,000
$2,600,000
$3,100,000
$3,600,000
$4,100,000
$4,600,000VCM Growth Equity S&P 500
Exhibit reflects what the cumulative value of the VCM Growth Equity Composite since October 1, 1994 compared to the S&P 500 index. An initial investment of $100,000 would have risen to $4,249,806 after fees versus $804,271 for the S&P 500 index before fees for the period ended June 30, 2017. The Composite contains accounts that do not pay fees.

Page 3
211 King Street Suite 106 Charleston, SC 29401 843-342-3044 www.vcm.us.com
PORTFOLIO TURNOVER
The Portfolio incurs transaction costs when it buys and sells securities (or “turns over” the portfolio). A higher portfolio turnover rate may indicate higher transaction costs and may incur tax liabilities when the portfolio is held in a taxable account. During the most recent fiscal year, the estimated Portfolio turnover rate was 38% of the average value of the portfolio.
PRINCIPAL RISKS
An investment in the Portfolio could lose money over short or even long periods. The Portfolio’s value and total return can fluctuate within a wide range. The Portfolio is subject to the following risks, which could affect performance:
• Stock market risk, which is the chance that stock prices overall will decline. Stock markets tend to move in cycles, with periods of rising prices and periods of falling prices. In addition, the Portfolio’s target index may, at times, become focused in stocks of a specific market sector that would subject the Portfolio to proportionately higher exposure to the risks of that sector.
• Inflationary Risk, also known as purchasing power risk, is the chance that the value of an asset or income will be eroded as inflation shrinks the value of a country's currency. Put another way, it is the risk that future inflation will cause the purchasing power of cash flow from an investment to decline. The best way to fight this type of risk is through appreciable investments, such as stocks or convertible bonds, which have a growth component that stays ahead of inflation over the long term.
• Business Risk is the measure of risk associated with a security. It is also known as unsystematic risk and refers to the risk associated with a specific issuer of a security. Generally, all businesses in the same industry have similar types of business risk. But used more specifically, business risk refers to the possibility that the issuer of a stock or a bond may go bankrupt or be unable to pay the interest or principal in the case of bonds.
• Liquidity Risk refers to the possibility that an investor may not be able to buy or sell an investment as and when desired or in sufficient quantities because opportunities are limited. A good example of liquidity risk is selling real estate. In most cases, it will be difficult to sell a property at any given moment should the need arise, unlike government securities or blue chip stocks.
• Social/Political / Legislative Risk is associated with the possibility of nationalization, unfavorable government action or social changes resulting in a loss of value is called social or political risk. Because the U.S. Congress has the power to change laws affecting securities, any ruling that results in adverse consequences is also known as legislative risk.
Page 4
211 King Street Suite 106 Charleston, SC 29401 843-342-3044 www.vcm.us.com
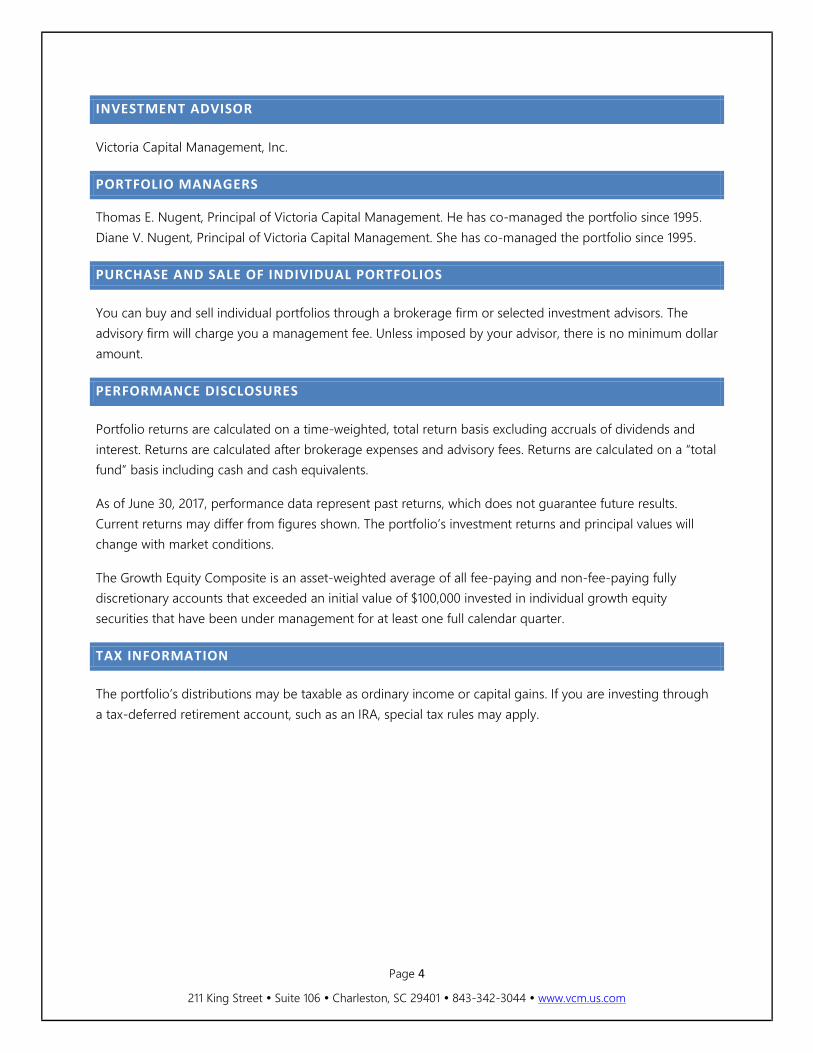
INVESTMENT ADVISOR
Victoria Capital Management, Inc.
PORTFOLIO MANAGERS
Thomas E. Nugent, Principal of Victoria Capital Management. He has co-managed the portfolio since 1995. Diane V. Nugent, Principal of Victoria Capital Management. She has co-managed the portfolio since 1995.
PURCHASE AND SALE OF INDIVIDUAL PORTFOLIOS
You can buy and sell individual portfolios through a brokerage firm or selected investment advisors. The advisory firm will charge you a management fee. Unless imposed by your advisor, there is no minimum dollar amount.
PERFORMANCE DISCLOSURES
Portfolio returns are calculated on a time-weighted, total return basis excluding accruals of dividends and interest. Returns are calculated after brokerage expenses and advisory fees. Returns are calculated on a “total fund” basis including cash and cash equivalents.
As of June 30, 2017, performance data represent past returns, which does not guarantee future results. Current returns may differ from figures shown. The portfolio’s investment returns and principal values will change with market conditions.
The Growth Equity Composite is an asset-weighted average of all fee-paying and non-fee-paying fully discretionary accounts that exceeded an initial value of $100,000 invested in individual growth equity securities that have been under management for at least one full calendar quarter.
TAX INFORMATION
The portfolio’s distributions may be taxable as ordinary income or capital gains. If you are investing through a tax-deferred retirement account, such as an IRA, special tax rules may apply.