Embed Size (px)
Citation preview
8/3/2019 Growth Eng
http://slidepdf.com/reader/full/growth-eng 1/3
5. Growth of Area, Production and Productivity of
RiceDuring the past four decades, rice production grew in a pheno
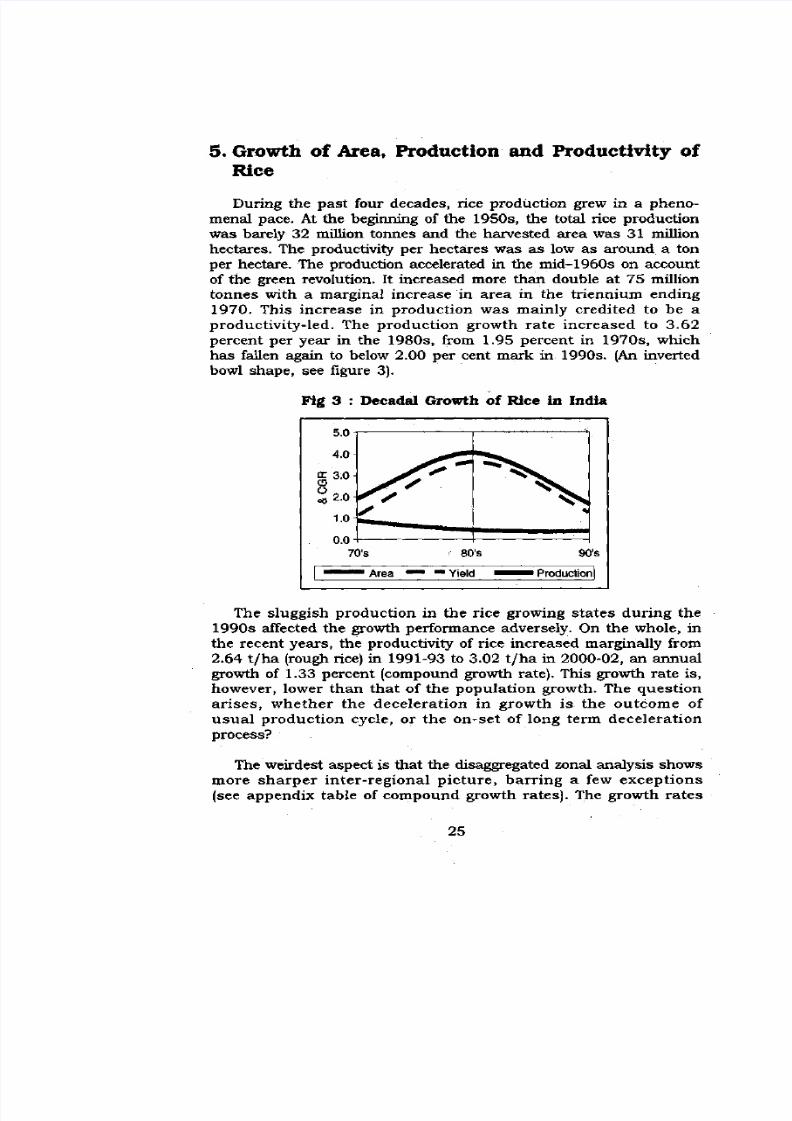
menal pace. At the beginning of the 1950s, the total rice productionwas barely 32 miUion tonnes and the harvested area was 31 millionhectares. The productivity per hectares was as low as around a tonper hectare. The production accelerated in the mid-1960s on accountof the green revolution. It increased more than double at 75 milliontonnes with a marginal increase in area in the triennium ending1970. This increase in production was mainly credited to be aproductivity-led. The production growth rate increased to 3.62percent per year in the 1980s, from 1.95 percent in 1970s, whichhas fallen again to below 2.00 per cent mark in 1990s. (An invertedbowl shape, see figure 3).
Fig 3 : Decadal Growth of Rice in India
70's 80's 90's
Area Yield Production
The sluggish production in the rice growing states during the1990s affected the growth performance adversely. On the whole, inthe recent years, the productivity of rice increased marginally from2.64 t/ha (rough rice) in 1991-93 to 3.02 t/ha in 2000-02, an annualgrowth of 1.33 percent (compound growth rate). This growth rate is,however, lower than that of the population growth. The questionarises, whether the deceleration in growth is the outcome of usual production cycle, or the on-set of long term decelerationprocess?
The weirdest aspect is that the disaggregated zonal analysis showsmore sharper in ter-regional p icture , barr ing a few except ions(see appendix table of compound growth rates). The growth rates
25
8/3/2019 Growth Eng
http://slidepdf.com/reader/full/growth-eng 2/3
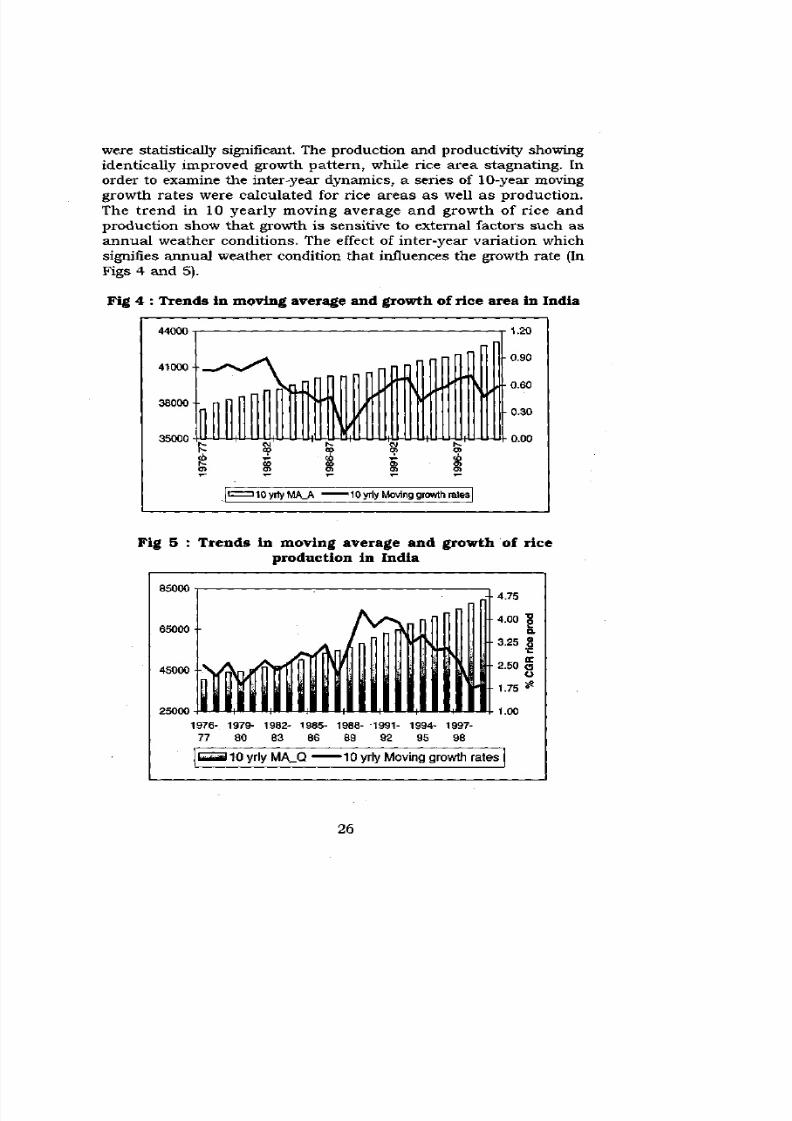
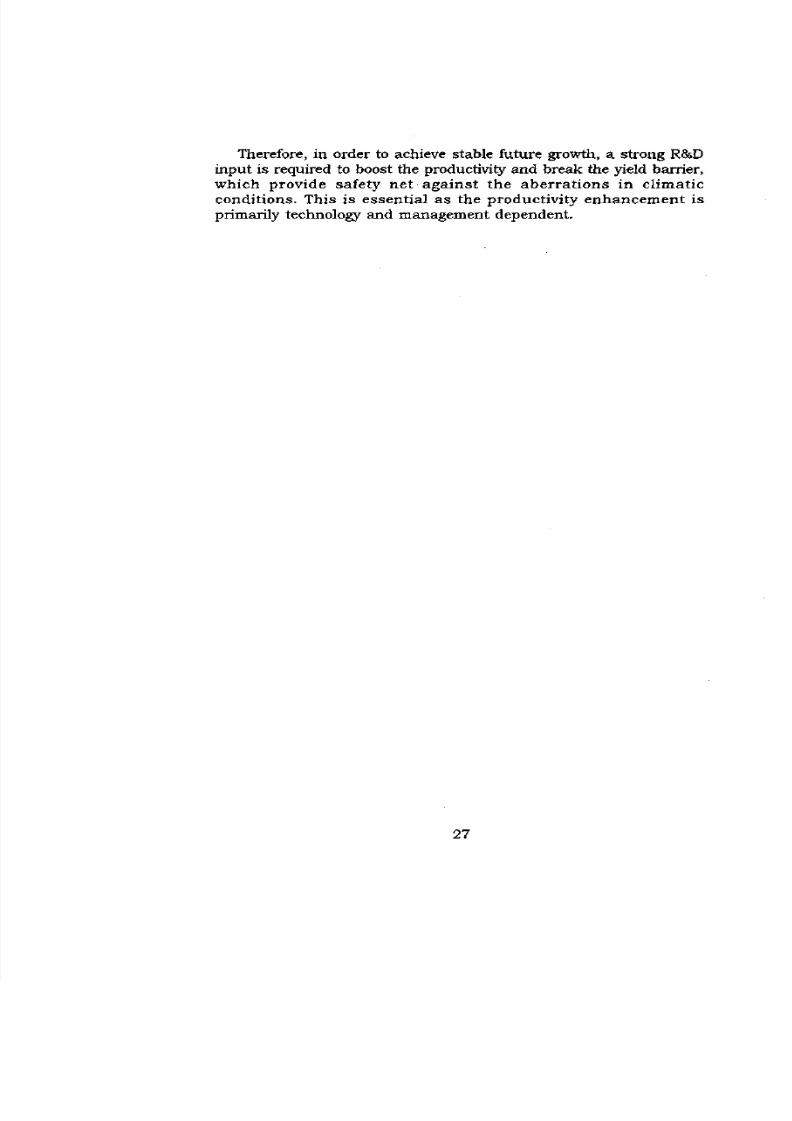
were statistically significant. The production and productivity showingidentically improved growth pattern, while rice area stagnating. Inorder to examine the inter-year dynamics, a series of 10-year movinggrowth rates were calculated for rice areas as well as production.The trend in 10 yearly moving average and growth of rice andproduction show that growth is sensitive to external factors such asannual weather conditions. The effect of inter-year variation whichsignifies annual weather condition that influences the growth rate (InFigs 4 and 5).
Fig 4 : Trends in moving average and growth of rice area in India
44000
41000
38000 -- n
35000
310yrlyMA_A •10 yrly Moving growth rates
1.20
Fig 5 : Trend s in movin g average and growth of riceproduction in India
85000
65000
45000 -
-- 4.75
25000 !• • • [ • • • [ • • • [ • • • [ • • • [ • • • [ • • • [ • • •! 1.00
1976- 1979- 1982- 1985- 1988- 1991- 1994- 1997-
77 80 83 86 89 92 95 98
10yrlyMA_Q "10 yrly Moving growth rates
26
8/3/2019 Growth Eng
http://slidepdf.com/reader/full/growth-eng 3/3
Therefore, in order to achieve stable future growth, a strong R85D
input is required to boost the productivity and break the yield barrier,which provide safety net against the aberrations in cl imaticconditions. This is essential as the productivity enhancement isprimarily technology and management dependent.
27


![Economy Notefile.truefriend.com/Storage/eng/research/Economy_120911.pdf · 3 1. Korean economy [Economy I] Real GDP growth Imports & exports growth -6-4-2 0 2 4 6 8 10 07 08 09 10](https://img.pdfslide.us/doc/110x75/6020396030b5670856560326/economy-3-1-korean-economy-economy-i-real-gdp-growth-imports-exports-growth.jpg)