Embed Size (px)
Citation preview
KE
LAN
I VA
LLEY
PLA
NT
AT
ION
S P
LC | A
NN
UA
L RE
PO
RT
2017/18
GrowthBeyond Measure
Kelani Valley Plantations PLC Annual Report 2017/18

KE
LAN
I VA
LLEY
PLA
NT
AT
ION
S P
LC | A
NN
UA
L RE
PO
RT
2017/18
GrowthBeyond Measure
Kelani Valley Plantations PLC Annual Report 2017/18

In being one with nature, the essential resource from which we create our products, we extend our dedication to sustainability by incorporating tea waste, which would otherwise be discarded, in the creation of the cover.
Like a branch offshoots to create more foliage, shade and fruit in the grand scheme of growth, we too are currently in the process of putting out tender shoots that will grow into fruitful ventures. Some of these shoots have already borne the results that we have sought and others are ensuring that are our brand has entered the foray amongst other competitors.
As we embark on a new year that will see us take new journeys along with the challenges and opportunities they present, we are enthused about the quality, efficiency and innovation we will bring to every venture that we undertake. Celebrating growth beyond measure, we eagerly set forth to establish our quality and result-oriented outlook in everything that we do.
02
KELANI VALLEY PLANTATIONS PLC
Annual Report 2017/18
ContentsThis Annual report has been structured as depicted below into eight sections, namely Corporate Overview, Highlights for 2017/18, Strategy
and Focus, Business Reviews, Capital Management Reports, Governance and Risk, Financial Reports followed by Annexures.
Corporate OverviewReport Profile 03
Revenue Distribution Local & Global 04
Our Land 06
Our Spread 07
Corporate Profile 08
Milestones 10
Board of Directors 12
Corporate Management Profile 16
Highlights for 2017/18 Financial Highlights 22
Non Financial Highlights 24
Awards and Accolades 26
Chairman’s Message 28
Managing Director’s Message 32
Strategy and Focus Stakeholder Engagement 38
Materiality Assessment 42
Creating Value for our Stakeholders 50
Business Reviews Sector Reviews 55
Capital Management Reports Financial Capital 66
Statement of Value Addition and Distribution
- 2017/18 82
Manufactured Capital 83
Intellectual Capital 88
Human Capital 90
Social and Relationship Capital 103
Natural Capital 110
Governance and Risk GRI Index Table 123
Corporate Governance 130
Risk Management 170
Annual Report of the Board of Directors
on the Affairs of the Company 183
Directors’ Statement on Internal Controls 188
Financial Reports Financial Calender 189
Statement of Directors’ Responsibilities 190
Audit Committee Report 191
Related Party Transactions Review
Committee Report 193
Managing Director’s and Chief Financial
Officer’s Responsibility Statement 194
Independent Auditors’ Report 195
Statement of Profit or Loss 198
Statement of Comprehensive Income 199
Statement of Financial Position 200
Statement of Changes in Equity 202
Statement of Cash Flows 204
Notes to the Financial Statements 206
Annexures Ten Year Summary 272
Investor Information 274
Environmental Calculations 276
Glossary 277
Notice of Meeting 282
Form of Proxy 283
Notes 285
Corporate Information 288
03
KELANI VALLEY PLANTATIONS PLC
Annual Report 2017/18
Co
rpo
rate
O
verv
iew
actual results or developments to differ
materially from those expressed or implied
by these forward-looking statements. As
such, the Company does not undertake
to review or revise such forward-looking
statements.
INQUIRIES AND FEEDBACKWe will be pleased to answer any
questions and provide any clarification
on this report. Your contact point at
KVPL would be; [email protected].
REPORTING STANDARDS/ GUIDELINES/ FRAMEWORKS
Sri Lanka Accounting Standards
issued by The Institute of Chartered
Accountants of Sri Lanka;
Companies Act No. 07 of 2007;
Sri Lanka Accounting and Auditing
Standards Act No. 15 of 1995;
Listing Rules of the Colombo Stock
Exchange;
Code of Best Practice on
Corporate Governance 2017
issued by the Institute of Chartered
Accountants of Sri Lanka
Code of Best Practices on Related
Party Transactions issued by
the Securities and Exchange
Commission of Sri Lanka.
International Integrated Reporting
Council’s (IIRC) “Six Capitals”
Integrated Reporting <IR>
Framework
GRI Reporting Standards
UN Sustainability Development
Goals (SDG’s)
United Nations Global Compact
Principles
Report Profile
This is Kelani Valley Plantations PLC’s
(KVPL) 05th Integrated Annual Report and
has been prepared in order to provide all
stakeholders with a balanced assessment
of the Company’s ability to create and
sustain value in the short-, medium- and
long-term.
SCOPE AND BOUNDARYThis Integrated Annual Report provides an
accurate and balanced review of KVPL’s
economic, social and environmental
performance within the context of its
strategy and risks and opportunities and
long term prospects.
The report covers the operations of KVPL
and its subsidiaries for the period 1 April
2017 to 31 March 2018 and where relevant
is supported by comparable data relating
to the previous year.
The information on Social Responsibility
has been obtained from data maintained
on “A Home For Every Plantation Worker”
Programme.
This Report covers its companies and
Subsidiaries.
There has been no significant change to
the scope and boundary of the report
compared to the previous year. Further, this
report does not contain any restatements
of information provided in previous reports.
MATERIALITYThe principle of materiality has been
applied to determine the content of this
report. Material matters are defined as
those aspects that have the potential to
crucially affect the Company’s ability to
create and sustain value over the short-,
medium- and long-term. These aspects are
assessed within the context of the KVPL’s
strategies; environmental influences and
the key risks and opportunities that affect
the Company’s ability to create sustainable
value.
ASSURANCEThe content included in this Integrated
Report has been approved by the
respective business heads and reviewed by
the audit committee prior to submission to
the Board of Directors for approval.
In addition, Messrs. Ernst & Young
Colombo have issued an independent
report on Financial Statements and Messrs.
Climate SI have provided an independent
assurance statement on the Company’s
Total Carbon Foot Print.
BOARD RESPONSIBILITY STATEMENTThe Board believes that the Integrated
Annual Report has been prepared
in accordance with best practices,
appropriately addresses material aspects of
KVPL’s business and is a fair representation
of the integrated performance of the
Company. The Board unanimously
approved the 2017/18 Integrated Annual
Report on 09 May 2018, for release to
shareholders.
09 May 2018
Managing Director – On behalf of Board of
Directors
FORWARD-LOOKING STATEMENTSThis report may contain certain forward-
looking statements with respect to KVPL’s
financial position, results, operations
and businesses. These statements and
forecasts involve risk and uncertainty
as they relate to events and depend on
circumstances that occur in the future.
There are various factors that could cause
GRI 102-10,50,51,52,53,54
04
KELANI VALLEY PLANTATIONS PLC
Annual Report 2017/18
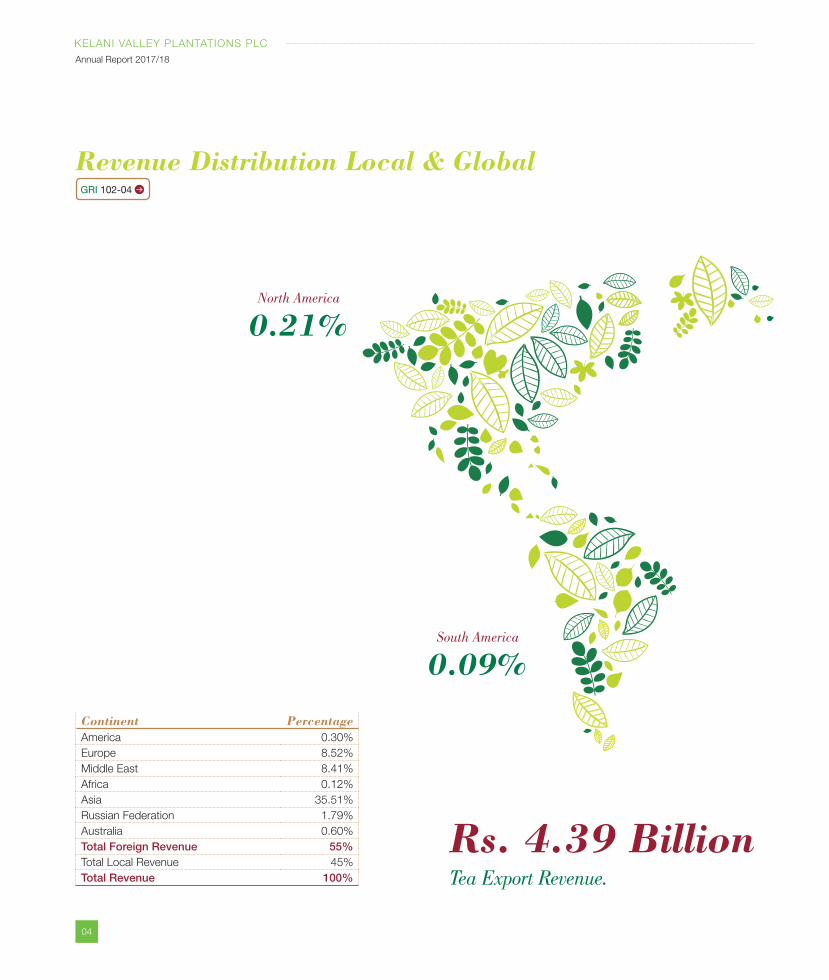
Revenue Distribution Local & GlobalGRI 102-04
North America
0.21%
Tea Export Revenue.
Rs. 4.39 Billion
South America
0.09%
Continent PercentageAmerica 0.30%
Europe 8.52%
Middle East 8.41%
Africa 0.12%
Asia 35.51%
Russian Federation 1.79%
Australia 0.60%
Total Foreign Revenue 55%Total Local Revenue 45%
Total Revenue 100%
05
KELANI VALLEY PLANTATIONS PLC
Annual Report 2017/18
Co
rpo
rate
O
verv
iew
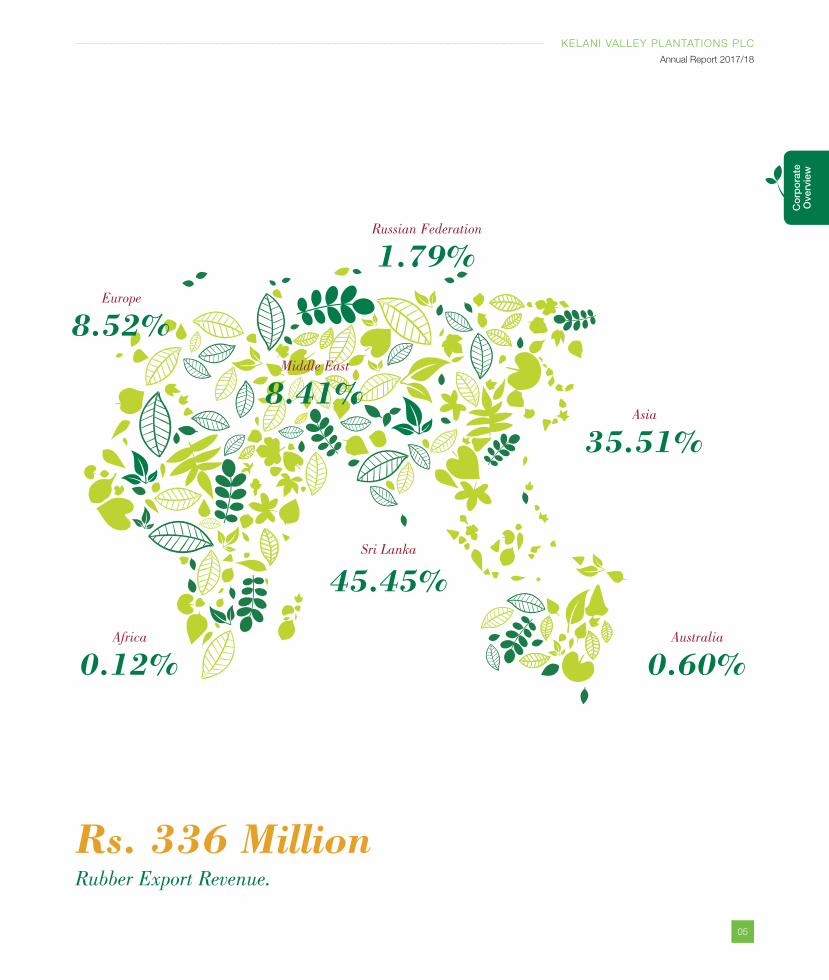
Europe
Russian Federation
Asia
Australia
Sri Lanka
Africa
Middle East
8.52%
1.79%
35.51%
0.60%
45.45%
0.12%
8.41%
Rubber Export Revenue.
Rs. 336 Million
06
KELANI VALLEY PLANTATIONS PLC
Annual Report 2017/18
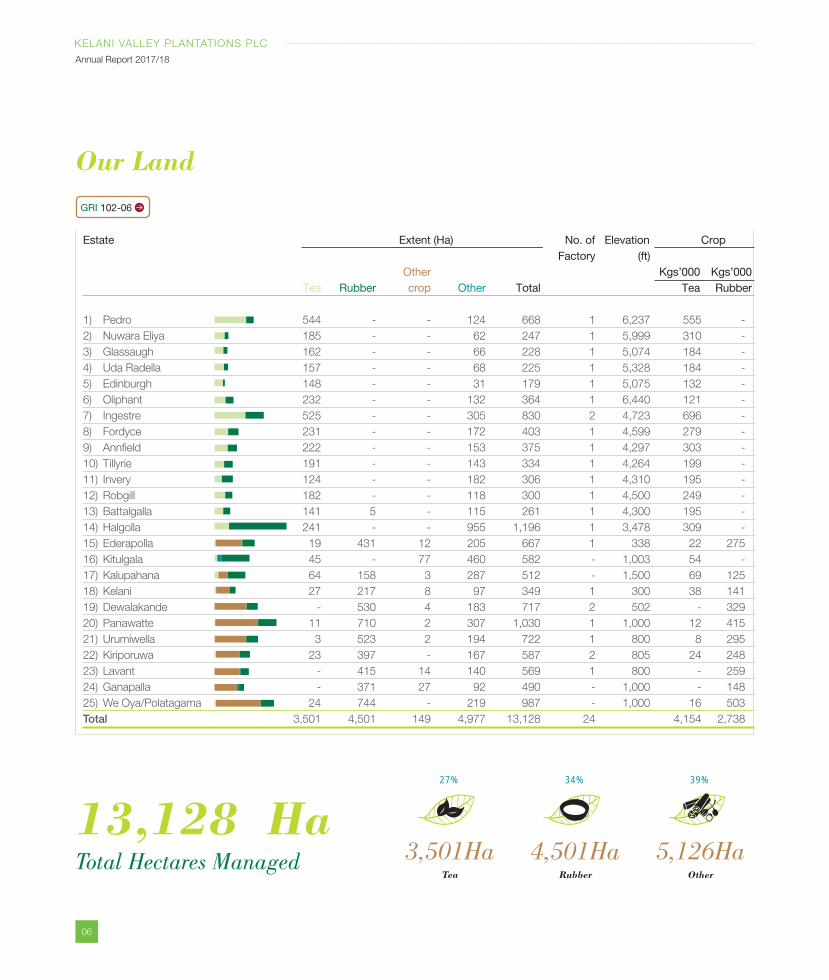
Our Land
Total Hectares Managed
13,128 HaTea Rubber Other
3,501Ha 4,501Ha 5,126Ha
27% 34% 39%
GRI 102-06
Estate Extent (Ha) No. of Elevation Crop Factory (ft) Other Kgs’000 Kgs’000 Tea Rubber crop Other Total Tea Rubber
1) Pedro 544 - - 124 668 1 6,237 555 -
2) Nuwara Eliya 185 - - 62 247 1 5,999 310 -
3) Glassaugh 162 - - 66 228 1 5,074 184 -
4) Uda Radella 157 - - 68 225 1 5,328 184 -
5) Edinburgh 148 - - 31 179 1 5,075 132 -
6) Oliphant 232 - - 132 364 1 6,440 121 -
7) Ingestre 525 - - 305 830 2 4,723 696 -
8) Fordyce 231 - - 172 403 1 4,599 279 -
9) Annfield 222 - - 153 375 1 4,297 303 -
10) Tillyrie 191 - - 143 334 1 4,264 199 -
11) Invery 124 - - 182 306 1 4,310 195 -
12) Robgill 182 - - 118 300 1 4,500 249 -
13) Battalgalla 141 5 - 115 261 1 4,300 195 -
14) Halgolla 241 - - 955 1,196 1 3,478 309 -
15) Ederapolla 19 431 12 205 667 1 338 22 275
16) Kitulgala 45 - 77 460 582 - 1,003 54 -
17) Kalupahana 64 158 3 287 512 - 1,500 69 125
18) Kelani 27 217 8 97 349 1 300 38 141
19) Dewalakande - 530 4 183 717 2 502 - 329
20) Panawatte 11 710 2 307 1,030 1 1,000 12 415
21) Urumiwella 3 523 2 194 722 1 800 8 295
22) Kiriporuwa 23 397 - 167 587 2 805 24 248
23) Lavant - 415 14 140 569 1 800 - 259
24) Ganapalla - 371 27 92 490 - 1,000 - 148
25) We Oya/Polatagama 24 744 - 219 987 - 1,000 16 503
Total 3,501 4,501 149 4,977 13,128 24 4,154 2,738
07
KELANI VALLEY PLANTATIONS PLC
Annual Report 2017/18
Co
rpo
rate
O
verv
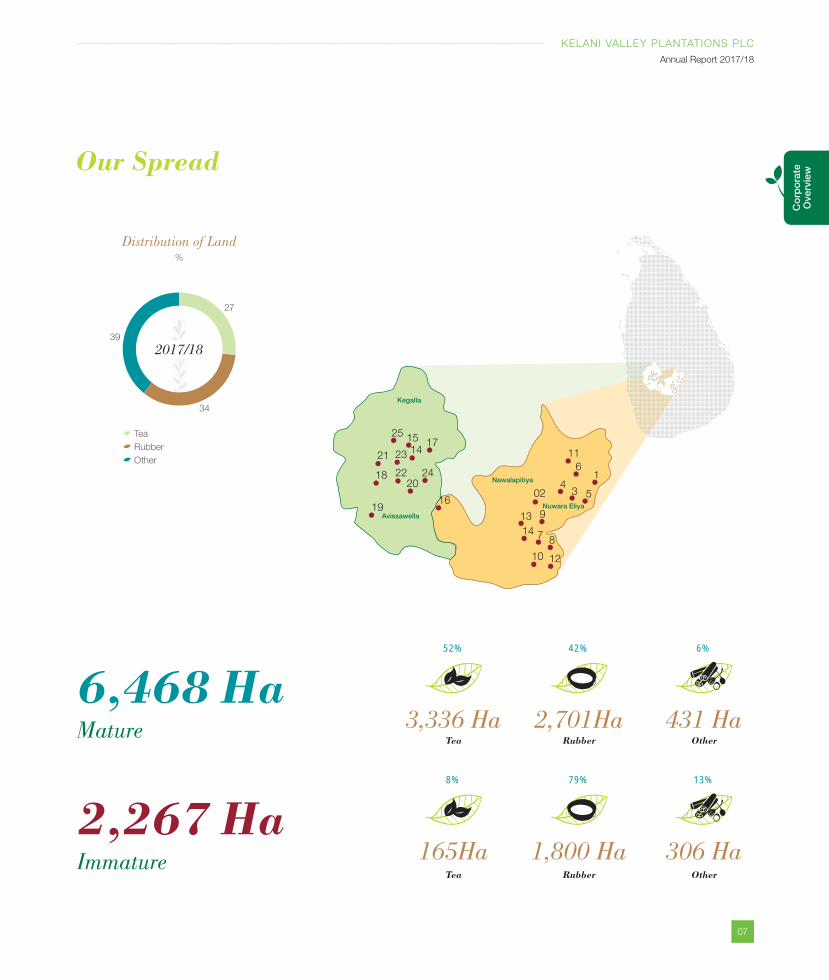
iewOur Spread
Tea
Rubber
Other
Distribution of Land%
27
39
34
2017/18
Immature
Mature
2,267 Ha
6,468 Ha
Tea
Tea
Rubber
Rubber
Other
Other
165Ha
3,336 Ha
1,800 Ha
2,701Ha
306 Ha
431 Ha
8%
52%
79%
42%
13%
6%
22
19
24
17
2018
2114
2515
16
1210
8714
913
024
3 5
16
1123
Kegalla
Avissawella
Nawalapitiya
Nuwara Eliya
22
19
24
17
2018
2114
2515
16
1210
8714
913
24
3 5
16
1123
08
KELANI VALLEY PLANTATIONS PLC
Annual Report 2017/18
Corporate Profile
Established in 1992, Kelani Valley
Plantations PLC (KVPL) was listed on
the main board of the Colombo Stock
exchange in 1996.
Celebrating its 25th year in 2017, KVPL
today is among the leading manufacturers
of Tea and Rubber. The Company owns
and manages 25 estates covering over
13,000 hectares of Tea and Rubber
plantations. More recently the Company
has invested heavily to increase its footprint
through the cultivation of cinnamon on a
commercial scale, a strategy that has met
with considerable success.
KVPL owns and operates 11 ISO 22000;
2005 Certified factories, which manufacture
the highest-quality Pure Ceylon Tea for the
global market. In addition, the Company’s
Glassaugh factory produces green Tea also
for the export market, while KVPL’s Nuwara
Eliya factory specialises in the production
of instant Tea for the local market and
Hayleys Global Beverages (Pvt) Ltd. The
state of the art Tea extract plant in Hatton
caters to the international market. KVPL’s
two Tea centres – the Pedro Estate Ethical
Tea Boutique in Nuwara Eliya as well as the
newly-launched “Tea Train” at Edinburgh
Estate in Nanuoya, add considerable brand
value to KVPL’s credentials as a leading Tea
manufacturer in the country.
Reinforcing the commitment to be a world-
class Tea manufacturer, KVPL has adopted
the internationally-accepted best practices
including Global Gap framework, RA/UTZ
standards and ETP guidelines, in addition
to the UNGC mandate for sustainable
development, in order to drive excellence
across all aspects of the business.
KVPL is also one of the leading RA–FSC
Certified Rubber producers in Sri
Lanka. The Company’s two factories
in Yatiyantota and Dehiowita produce
sole crepe, centrifuge latex and crepe
Rubber used mainly as raw material in the
manufacture of Rubber gloves and for the
pharmaceutical and shoe industries.
In addition to its core business in the
manufacture of Tea and Rubber, the
Company has been steadily diversifying
into other complementary business
models, including marketing of value-
added and specialty Teas via Mabroc
Teas (Pvt) Ltd., acquired in 2010, and in
hydro power by way of Kalupahana Power
Company (Pvt) Ltd., established in 2003 .
The most recent addition to KVPL’s
portfolio of businesses is Kelani Valley
Resorts (Pvt) Ltd. (KVR), which was
formed in 2016 to mark KVPL’s entry
into the leisure sector in Sri Lanka. The
Oliphant Estate Bungalow in Nuwara
Eliya was renovated into a luxury
boutique hotel and brought under KVR.
The Oliphant Boutique Bungalow is
situated 7,600 feet above sea level and
located in the picturesque Nuwara Eliya
region, in Shanthipura, a village that sits
at the highest elevation in the island.
Surrounded by the lush Tea plantations of
the Oliphant estate, the bungalow offers
visitors a unique value proposition by
way of a truly colonial experience amidst
breathtaking vistas of lush greenery.
GRI 102-02,15
“Kelani Valley Plantations- products of excellence”
Vision
Read this Report Online
www.kvpl.com
09
KELANI VALLEY PLANTATIONS PLC
Annual Report 2017/18
Co
rpo
rate
O
verv
iew
ValuesMission
Our Customers: We provide consistently good quality
products and excellent service at competitive
prices, whilst ensuring continuity of supplies.
We are conscious of customer requirements
and ever-changing market trends and orient
our production to suit specific needs.
Our Employees: We care for our employees and create a
favourable environment for their participation
in managing our affairs, thereby increasing
productivity. We develop and create
individuals who feel contended and secure
in their jobs. We recognise merit.
Our Suppliers: We establish mutually-beneficial
relationships with our suppliers based on
trust, quality and reliability. We treat them
as we wish to be treated ourselves.
Our Owners: We enhance the reputation of the
company by conforming to high levels of
conduct. We generate adequate return
and ensure security of their investments by
maintaining high-viability, long-term stability.
We strive to do our best for our stakeholders in the following ways:
Our Competitors: We view our competitors as a source of
inspiration for our own advancement.
We are conscious of their strengths and
weaknesses and compete for market
superiority without resorting to unethical
practices while maintaining close
cooperation on common issues.
Our Country and the World: We conduct our business in a socially-
responsible and ethical manner. We are
aware of the changing environment and
contribute towards enhancing the quality
of life for a better Sri Lanka and a better
world.
To optimize plantation productivity and ensure highest quality by harnessing and developing employees whilst improving the quality of life of the community and securing an acceptable return on investment.
10
KELANI VALLEY PLANTATIONS PLC
Annual Report 2017/18
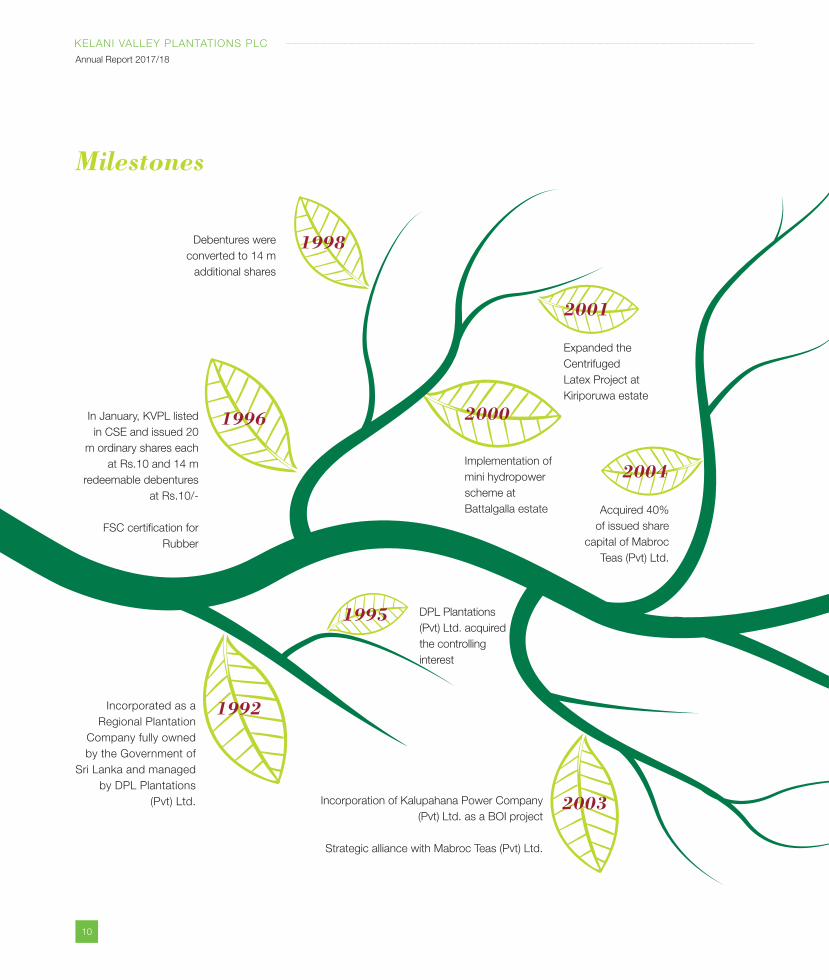
1996
1995
1998
2000
2001
2004
2003
1992Incorporated as a
Regional Plantation
Company fully owned
by the Government of
Sri Lanka and managed
by DPL Plantations
(Pvt) Ltd. Incorporation of Kalupahana Power Company
(Pvt) Ltd. as a BOI project
Strategic alliance with Mabroc Teas (Pvt) Ltd.
DPL Plantations
(Pvt) Ltd. acquired
the controlling
interest
Implementation of
mini hydropower
scheme at
Battalgalla estate
Expanded the
Centrifuged
Latex Project at
Kiriporuwa estate
Acquired 40%
of issued share
capital of Mabroc
Teas (Pvt) Ltd.
In January, KVPL listed
in CSE and issued 20
m ordinary shares each
at Rs.10 and 14 m
redeemable debentures
at Rs.10/-
FSC certification for
Rubber
Debentures were
converted to 14 m
additional shares
Milestones
11
KELANI VALLEY PLANTATIONS PLC
Annual Report 2017/18
Co
rpo
rate
O
verv
iew
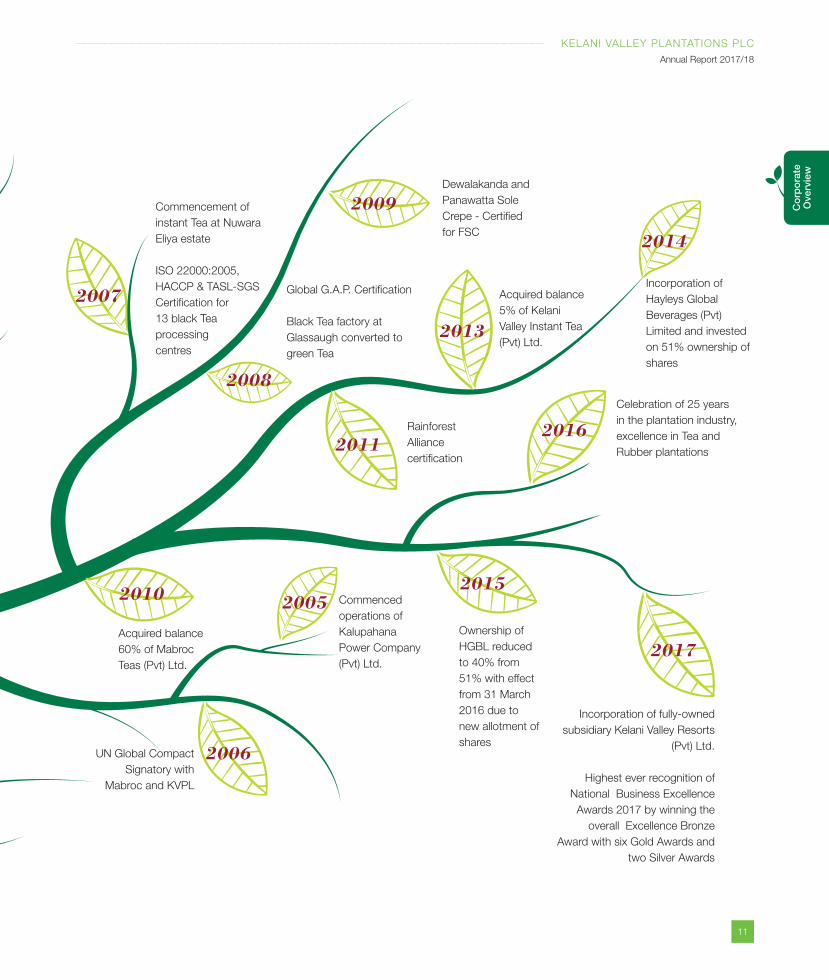
2007
2008
2009
2013
2011
20052010 2015
2006
2016
2014
2017Acquired balance
60% of Mabroc
Teas (Pvt) Ltd.
Ownership of
HGBL reduced
to 40% from
51% with effect
from 31 March
2016 due to
new allotment of
shares
Incorporation of fully-owned
subsidiary Kelani Valley Resorts
(Pvt) Ltd.
Highest ever recognition of
National Business Excellence
Awards 2017 by winning the
overall Excellence Bronze
Award with six Gold Awards and
two Silver Awards
Commencement of
instant Tea at Nuwara
Eliya estate
ISO 22000:2005,
HACCP & TASL-SGS
Certification for
13 black Tea
processing
centres
Rainforest
Alliance
certification
Acquired balance
5% of Kelani
Valley Instant Tea
(Pvt) Ltd.
Incorporation of
Hayleys Global
Beverages (Pvt)
Limited and invested
on 51% ownership of
shares
Celebration of 25 years
in the plantation industry,
excellence in Tea and
Rubber plantations
Dewalakanda and
Panawatta Sole
Crepe - Certified
for FSC
Commenced
operations of
Kalupahana
Power Company
(Pvt) Ltd.
Global G.A.P. Certification
Black Tea factory at
Glassaugh converted to
green Tea
UN Global Compact
Signatory with
Mabroc and KVPL
12
KELANI VALLEY PLANTATIONS PLC
Annual Report 2017/18
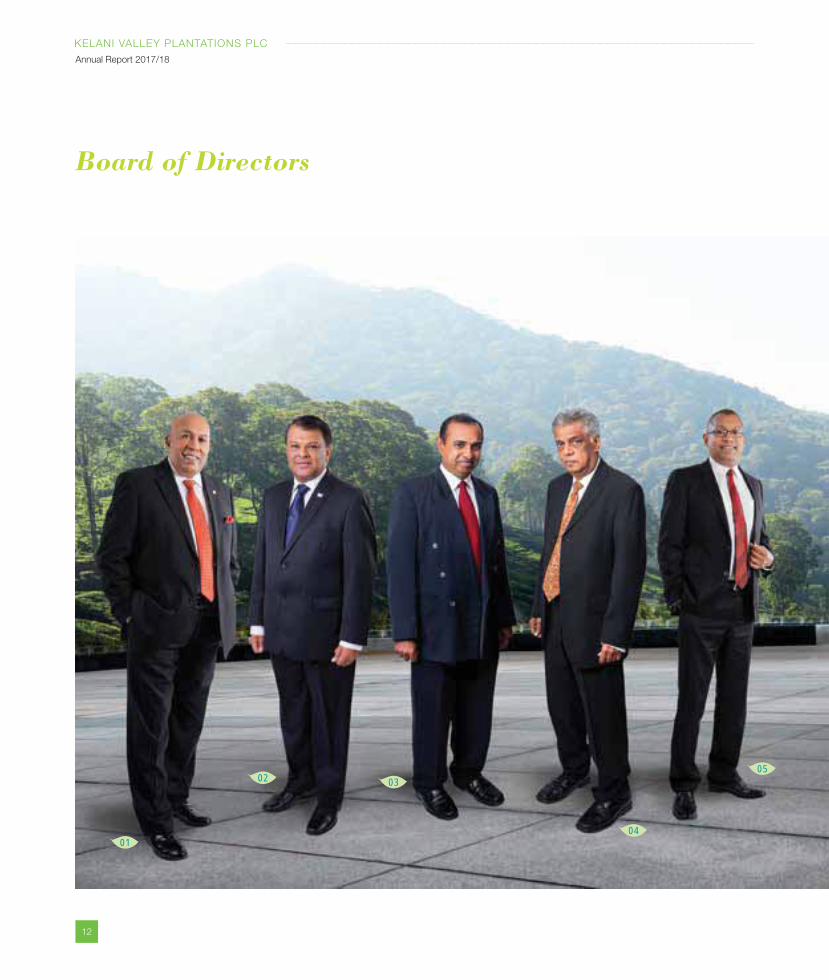
Board of Directors
01
02 03
04
05
13
KELANI VALLEY PLANTATIONS PLC
Annual Report 2017/18
Co
rpo
rate
O
verv
iew
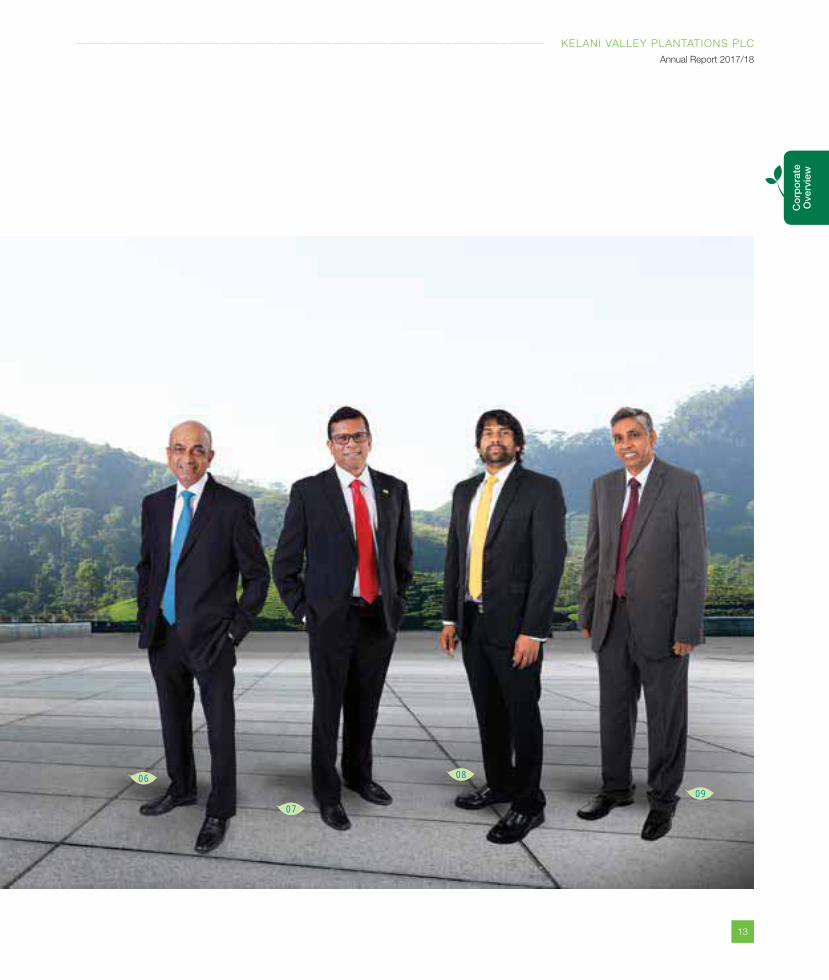
06
07
08
09
14
KELANI VALLEY PLANTATIONS PLC
Annual Report 2017/18
Board of Directors Contd.
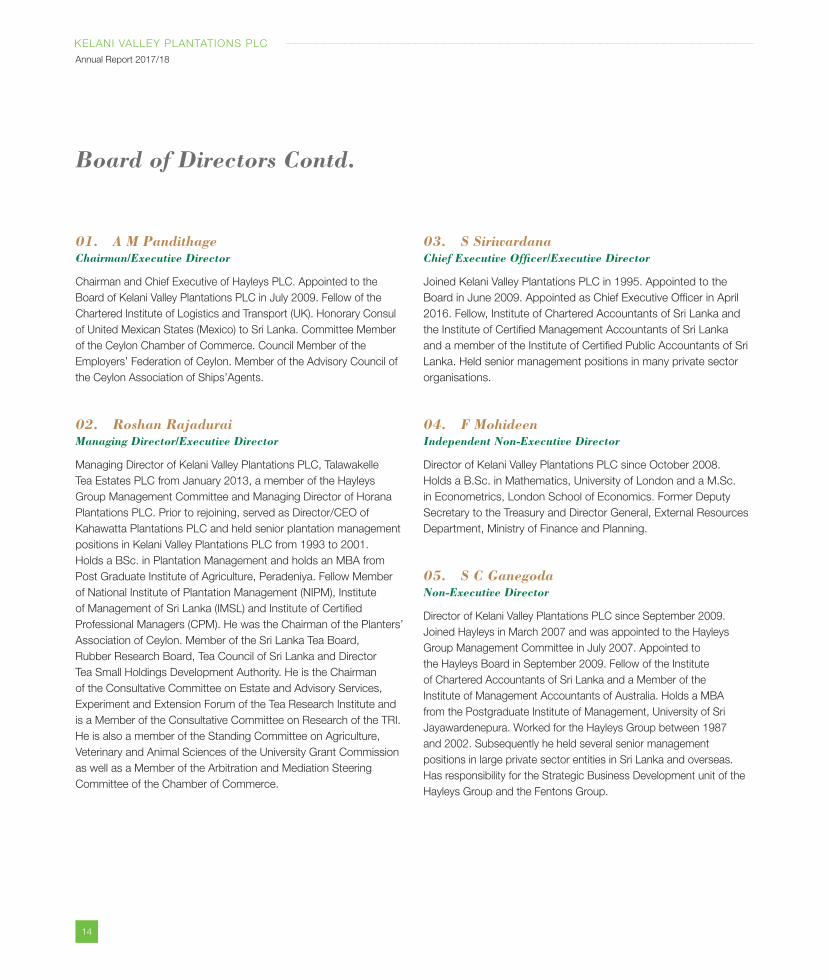
01. A M PandithageChairman/Executive Director
Chairman and Chief Executive of Hayleys PLC. Appointed to the
Board of Kelani Valley Plantations PLC in July 2009. Fellow of the
Chartered Institute of Logistics and Transport (UK). Honorary Consul
of United Mexican States (Mexico) to Sri Lanka. Committee Member
of the Ceylon Chamber of Commerce. Council Member of the
Employers’ Federation of Ceylon. Member of the Advisory Council of
the Ceylon Association of Ships’Agents.
02. Roshan RajaduraiManaging Director/Executive Director
Managing Director of Kelani Valley Plantations PLC, Talawakelle
Tea Estates PLC from January 2013, a member of the Hayleys
Group Management Committee and Managing Director of Horana
Plantations PLC. Prior to rejoining, served as Director/CEO of
Kahawatta Plantations PLC and held senior plantation management
positions in Kelani Valley Plantations PLC from 1993 to 2001.
Holds a BSc. in Plantation Management and holds an MBA from
Post Graduate Institute of Agriculture, Peradeniya. Fellow Member
of National Institute of Plantation Management (NIPM), Institute
of Management of Sri Lanka (IMSL) and Institute of Certified
Professional Managers (CPM). He was the Chairman of the Planters’
Association of Ceylon. Member of the Sri Lanka Tea Board,
Rubber Research Board, Tea Council of Sri Lanka and Director
Tea Small Holdings Development Authority. He is the Chairman
of the Consultative Committee on Estate and Advisory Services,
Experiment and Extension Forum of the Tea Research Institute and
is a Member of the Consultative Committee on Research of the TRI.
He is also a member of the Standing Committee on Agriculture,
Veterinary and Animal Sciences of the University Grant Commission
as well as a Member of the Arbitration and Mediation Steering
Committee of the Chamber of Commerce.
03. S SiriwardanaChief Executive Officer/Executive Director
Joined Kelani Valley Plantations PLC in 1995. Appointed to the
Board in June 2009. Appointed as Chief Executive Officer in April
2016. Fellow, Institute of Chartered Accountants of Sri Lanka and
the Institute of Certified Management Accountants of Sri Lanka
and a member of the Institute of Certified Public Accountants of Sri
Lanka. Held senior management positions in many private sector
organisations.
04. F MohideenIndependent Non-Executive Director
Director of Kelani Valley Plantations PLC since October 2008.
Holds a B.Sc. in Mathematics, University of London and a M.Sc.
in Econometrics, London School of Economics. Former Deputy
Secretary to the Treasury and Director General, External Resources
Department, Ministry of Finance and Planning.
05. S C GanegodaNon-Executive Director
Director of Kelani Valley Plantations PLC since September 2009.
Joined Hayleys in March 2007 and was appointed to the Hayleys
Group Management Committee in July 2007. Appointed to
the Hayleys Board in September 2009. Fellow of the Institute
of Chartered Accountants of Sri Lanka and a Member of the
Institute of Management Accountants of Australia. Holds a MBA
from the Postgraduate Institute of Management, University of Sri
Jayawardenepura. Worked for the Hayleys Group between 1987
and 2002. Subsequently he held several senior management
positions in large private sector entities in Sri Lanka and overseas.
Has responsibility for the Strategic Business Development unit of the
Hayleys Group and the Fentons Group.
15
KELANI VALLEY PLANTATIONS PLC
Annual Report 2017/18
Co
rpo
rate
O
verv
iew
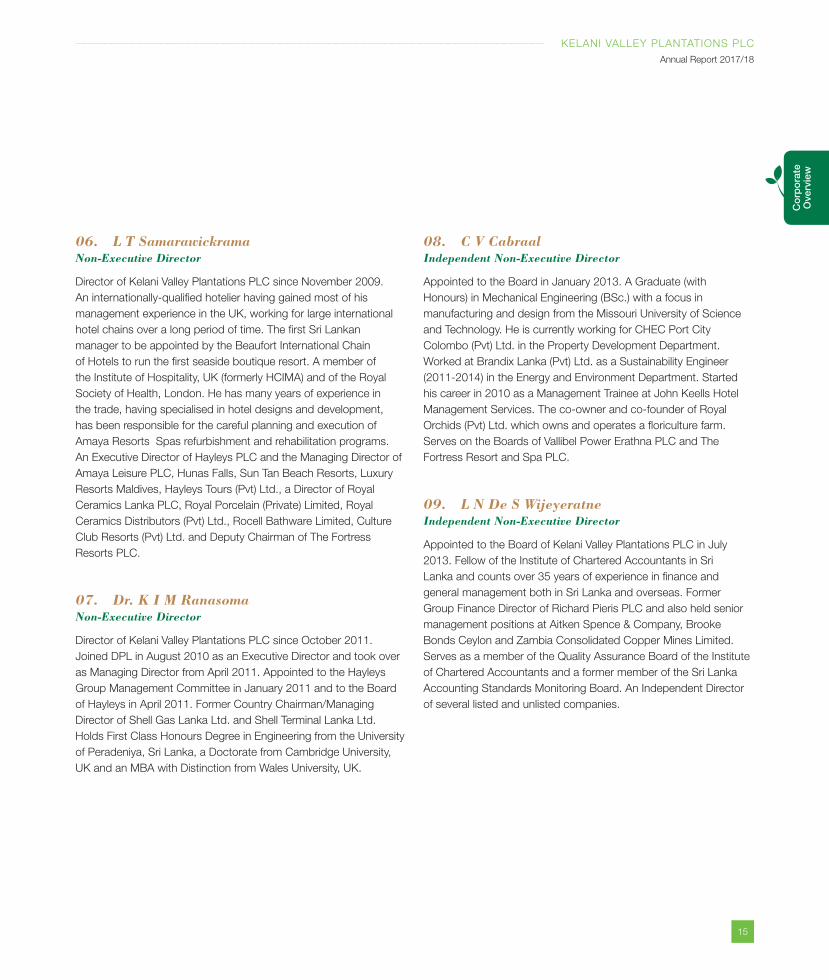
06. L T SamarawickramaNon-Executive Director
Director of Kelani Valley Plantations PLC since November 2009.
An internationally-qualified hotelier having gained most of his
management experience in the UK, working for large international
hotel chains over a long period of time. The first Sri Lankan
manager to be appointed by the Beaufort International Chain
of Hotels to run the first seaside boutique resort. A member of
the Institute of Hospitality, UK (formerly HCIMA) and of the Royal
Society of Health, London. He has many years of experience in
the trade, having specialised in hotel designs and development,
has been responsible for the careful planning and execution of
Amaya Resorts Spas refurbishment and rehabilitation programs.
An Executive Director of Hayleys PLC and the Managing Director of
Amaya Leisure PLC, Hunas Falls, Sun Tan Beach Resorts, Luxury
Resorts Maldives, Hayleys Tours (Pvt) Ltd., a Director of Royal
Ceramics Lanka PLC, Royal Porcelain (Private) Limited, Royal
Ceramics Distributors (Pvt) Ltd., Rocell Bathware Limited, Culture
Club Resorts (Pvt) Ltd. and Deputy Chairman of The Fortress
Resorts PLC.
07. Dr. K I M RanasomaNon-Executive Director
Director of Kelani Valley Plantations PLC since October 2011.
Joined DPL in August 2010 as an Executive Director and took over
as Managing Director from April 2011. Appointed to the Hayleys
Group Management Committee in January 2011 and to the Board
of Hayleys in April 2011. Former Country Chairman/Managing
Director of Shell Gas Lanka Ltd. and Shell Terminal Lanka Ltd.
Holds First Class Honours Degree in Engineering from the University
of Peradeniya, Sri Lanka, a Doctorate from Cambridge University,
UK and an MBA with Distinction from Wales University, UK.
08. C V CabraalIndependent Non-Executive Director
Appointed to the Board in January 2013. A Graduate (with
Honours) in Mechanical Engineering (BSc.) with a focus in
manufacturing and design from the Missouri University of Science
and Technology. He is currently working for CHEC Port City
Colombo (Pvt) Ltd. in the Property Development Department.
Worked at Brandix Lanka (Pvt) Ltd. as a Sustainability Engineer
(2011-2014) in the Energy and Environment Department. Started
his career in 2010 as a Management Trainee at John Keells Hotel
Management Services. The co-owner and co-founder of Royal
Orchids (Pvt) Ltd. which owns and operates a floriculture farm.
Serves on the Boards of Vallibel Power Erathna PLC and The
Fortress Resort and Spa PLC.
09. L N De S WijeyeratneIndependent Non-Executive Director
Appointed to the Board of Kelani Valley Plantations PLC in July
2013. Fellow of the Institute of Chartered Accountants in Sri
Lanka and counts over 35 years of experience in finance and
general management both in Sri Lanka and overseas. Former
Group Finance Director of Richard Pieris PLC and also held senior
management positions at Aitken Spence & Company, Brooke
Bonds Ceylon and Zambia Consolidated Copper Mines Limited.
Serves as a member of the Quality Assurance Board of the Institute
of Chartered Accountants and a former member of the Sri Lanka
Accounting Standards Monitoring Board. An Independent Director
of several listed and unlisted companies.
16
KELANI VALLEY PLANTATIONS PLC
Annual Report 2017/18
BOARD OF DIRECTORS
Kelani Valley Plantations PLCTea and Rubber plantations
Incorporated in 1992 in Sri Lanka
Stated capital – Rs. 340 m
Directors:A M Pandithage - Chairman
Roshan Rajadurai - Managing Director
S Siriwardana - Chief Executive Officer
F Mohideen
S C Ganegoda
L T Samarawickrama
Dr. K I M Ranasoma
C V Cabraal
L N De S Wijeyeratne
DPL Plantations (Pvt) Ltd.Plantation Management, Managing Agent
Incorporated in 1992 in Sri Lanka
Stated capital – Rs. 350 m
Directors:A M Pandithage - Chairman
Roshan Rajadurai
S Siriwardana
S C Ganegoda
Dr. K I M Ranasoma
Corporate Management Profile
Kalupahana Power Company (Pvt) Ltd.Generates hydro power
Incorporated in 2003 in Sri Lanka
Stated capital – Rs. 30 m, Group interest
– 60%
Directors:S Siriwardana
Dr. K I M Ranasoma
Roshan Rajadurai
M F M Ismail
L G Perera
Kelani Valley Instant Tea (Pvt) Ltd.Manufactures instant Tea
Incorporated in 2007 in Sri Lanka
Stated Capital - Rs. 30 m, Group Interest
100%
Directors:A M Pandithage
N R Ranatunga
Dr. K I M Ranasoma
Roshan Rajadurai
Mabroc Teas (Pvt) Ltd.Exports bulk and retail packed Tea
Incorporated in 1988 in Sri Lanka
Stated capital – Rs. 90 m, Group interest
– 100%
Directors:A M Pandithage - Chairman
J A G Anandarajah
N R Ranatunga - Managing Director
R M Hanwella
Roshan Rajadurai
Dr. K I M Ranasoma
M R Zaheed (Resigned w.e.f. 31-03-2018)
R S Samarasinghe (Appointed w.e.f.
01-04-2017)
S C Ganegoda (Appointed w.e.f. 01-04-
2018)
Kelani Valley Resorts (Pvt) Ltd.Operates Boutique Bungalow
Incorporated in 2017 in Sri Lanka
Stated capital – Rs.10, Group interest –
100%
DirectorsA M Pandithage
Roshan Rajadurai
S Siriwardana
L T Samarawickrama
17
KELANI VALLEY PLANTATIONS PLC
Annual Report 2017/18
Co
rpo
rate
O
verv
iew
MANAGEMENT TEAM
Kelani Valley Plantations PLC
Board Directors:A M Pandithage - Chairman
Roshan Rajadurai - Managing Director
S Siriwardana - Chief Executive Officer
Operational Directors:Y U S Premathilake - Plantations (Rubber)
A Weerakoon - Plantations (Tea)
J A Rodrigo - Corporate Affairs
General Managers:N A A K Nissanka - Finance
K C de J Seneviratne - Regional
Administration
R D G Fernando - Rubber Marketing and
Administration
Regional General Managers:B C Gunasekera - Panawatte/(Rubber
Group I)
S F Fernando - Dewalakanda/(Rubber
Group II)
Deputy General Managers:D I Gallearachchi - Robgill
A P Senanayake - Pedro
A T Gamage - Human Resources and
Corporate Sustainability
C B Dharmakirthy - Halgolla
Group Managers:D E P K Welikala - Kelani
U K Tennakoon - Edinburgh
R C V V Ramanathan - Ingestre
Senior Managers:R L Obeysekara - Kiriporuwa
W P S B Abeywardena - Ederapola
Managers:N D Amaratunga - Marketing
W L P S Wijesinghe - Information
Technology
C D Ikiriwatte - Business Development
K A R Alles - Corporate Affairs
S Ram - Human Development
B Balamurali - Sustainability and resource
Development
Estate Managers:
Up Country (Nuwara Eliya and Hatton Group)Y A Hettiarachchi - Oliphant
A M C B Attanayake - Invery
W W Wijekoon - Uda Radella
L G Keragala - Tillyrie
M K D Priyantha - Annfield
A A Harridge * - Battalgalla
D M K C B Dhanapala * - N'Eliya
A R C Gnanasekeram * - Fordyce
H A N B Madushan ** - Glassaugh
Low Country (Tea and Rubber Group)D W M M R B Madawala - Urumiwela
R M R Y B Ratnayake - We Oya
P K A H Thilakaratna - Lavant
R M Vithanawasam - Kalupahana
G U Premarathne * - Kitulgala
W A K Chandana * - Centrifuged Factory
R M U S Jayasundara ** - Ganapalla
* Acting Estate Manager
** Deputy Manager in charge
Mabroc Teas (Pvt) Ltd.
Directors:N R Ranatunga - Managing Director
R M Hanwella - Operations
R S Samarasinghe
General Managers:S C Hikkaduwage - Finance
U A De Silva Kulasiri - Marketing Local
Sales
T M L J Peris - Marketing
Managers:K L D C Niroshini - Finance
H M S Wijerathne - Information Technology
E F W Samaraweera - Factory
G A M S Perera - Shipping
V A W Wakista - Tea
S L T Puvimannasinghe - Creative
18
KELANI VALLEY PLANTATIONS PLC
Annual Report 2017/18
Corporate Management Profile Contd.
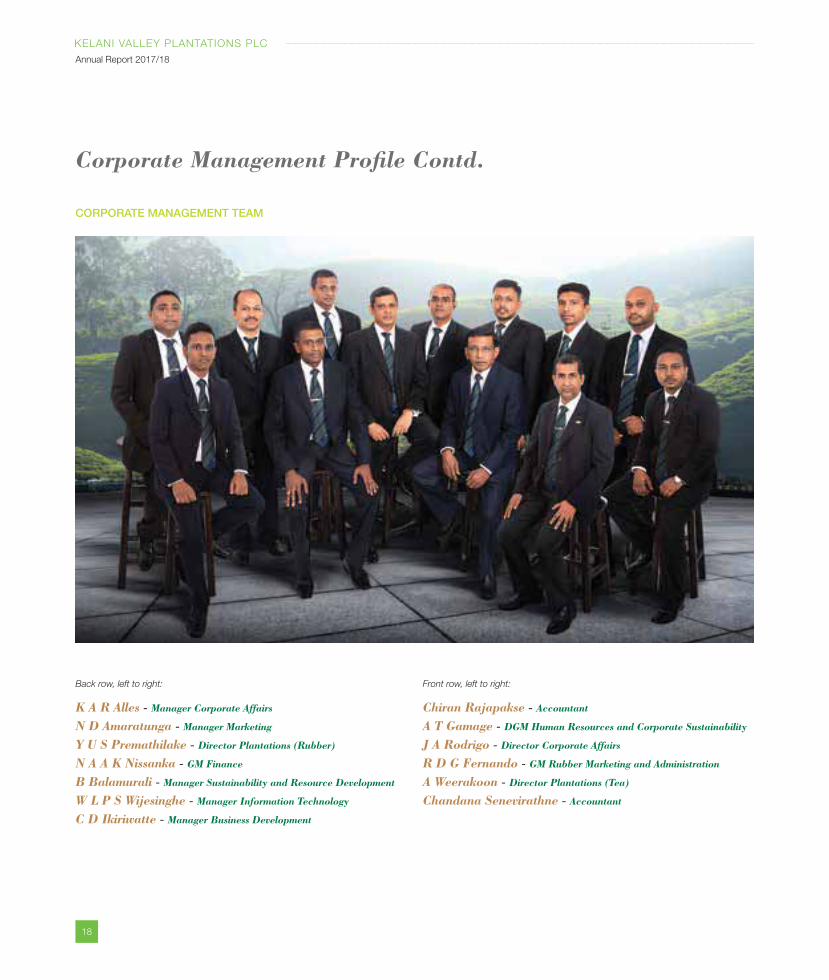
CORPORATE MANAGEMENT TEAM
Back row, left to right:
K A R Alles - Manager Corporate Affairs
N D Amaratunga - Manager Marketing
Y U S Premathilake - Director Plantations (Rubber)
N A A K Nissanka - GM Finance
B Balamurali - Manager Sustainability and Resource Development
W L P S Wijesinghe - Manager Information Technology
C D Ikiriwatte - Manager Business Development
Front row, left to right:
Chiran Rajapakse - Accountant
A T Gamage - DGM Human Resources and Corporate Sustainability
J A Rodrigo - Director Corporate Affairs
R D G Fernando - GM Rubber Marketing and Administration
A Weerakoon - Director Plantations (Tea)
Chandana Senevirathne - Accountant
19
KELANI VALLEY PLANTATIONS PLC
Annual Report 2017/18
Co
rpo
rate
O
verv
iew
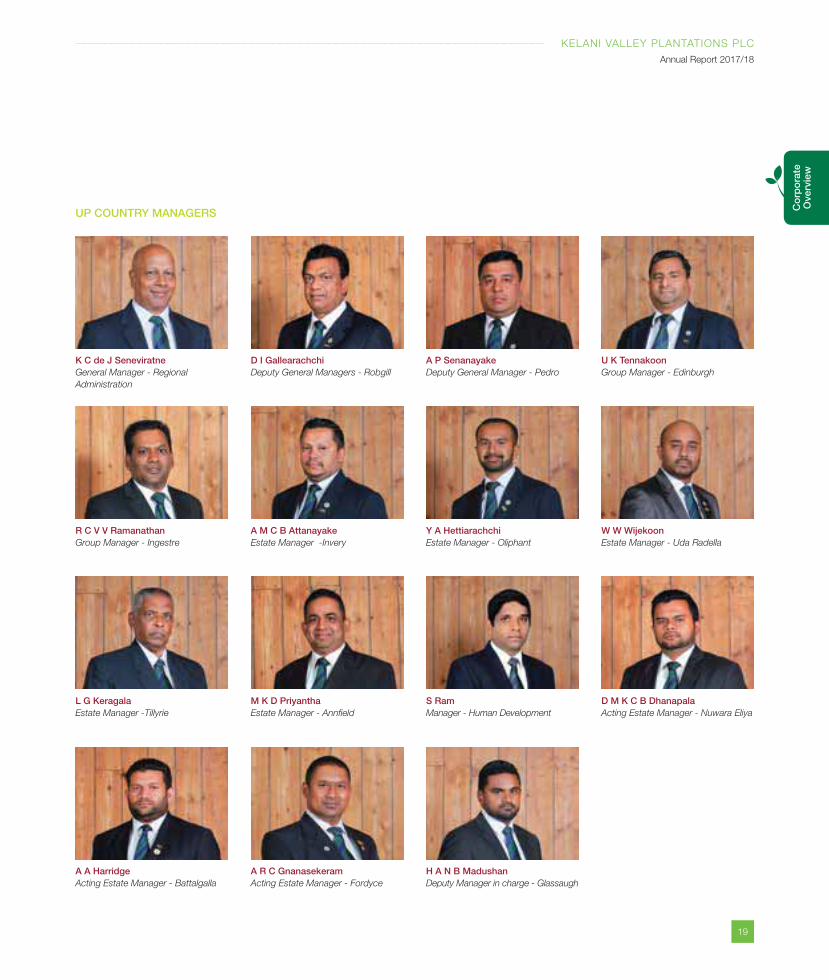
A A HarridgeActing Estate Manager - Battalgalla
K C de J SeneviratneGeneral Manager - Regional
Administration
U K TennakoonGroup Manager - Edinburgh
A M C B AttanayakeEstate Manager -Invery
D I Gallearachchi Deputy General Managers - Robgill
L G KeragalaEstate Manager -Tillyrie
W W WijekoonEstate Manager - Uda Radella
A P SenanayakeDeputy General Manager - Pedro
D M K C B DhanapalaActing Estate Manager - Nuwara Eliya
M K D PriyanthaEstate Manager - Annfield
Y A HettiarachchiEstate Manager - Oliphant
A R C GnanasekeramActing Estate Manager - Fordyce
H A N B MadushanDeputy Manager in charge - Glassaugh
S RamManager - Human Development
R C V V RamanathanGroup Manager - Ingestre
UP COUNTRY MANAGERS
20
KELANI VALLEY PLANTATIONS PLC
Annual Report 2017/18
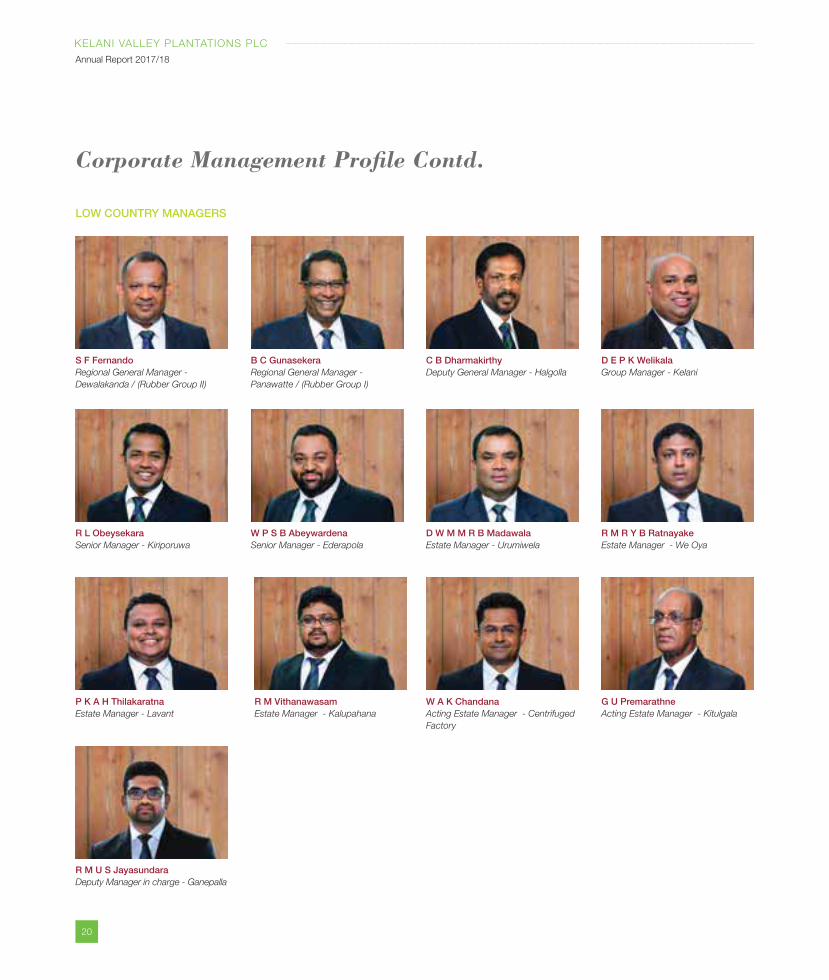
B C Gunasekera Regional General Manager -
Panawatte / (Rubber Group I)
P K A H ThilakaratnaEstate Manager - Lavant
R M Vithanawasam Estate Manager - Kalupahana
D E P K WelikalaGroup Manager - Kelani
R L ObeysekaraSenior Manager - Kiriporuwa
S F Fernando Regional General Manager -
Dewalakanda / (Rubber Group II)
D W M M R B Madawala Estate Manager - Urumiwela
R M R Y B RatnayakeEstate Manager - We Oya
W A K Chandana Acting Estate Manager - Centrifuged
Factory
G U Premarathne Acting Estate Manager - Kitulgala
R M U S Jayasundara Deputy Manager in charge - Ganepalla
W P S B Abeywardena Senior Manager - Ederapola
C B Dharmakirthy Deputy General Manager - Halgolla
LOW COUNTRY MANAGERS
Corporate Management Profile Contd.
21
KELANI VALLEY PLANTATIONS PLC
Annual Report 2017/18
Hig
hlig
hts
for
2017
/18
Our tea plantations have truly redefined the quality and taste of the perfect cup
here and all over the globe.
- ALAN LAKEIN -
futureinto the present
Planning isbringing the
something about itnow
22
KELANI VALLEY PLANTATIONS PLC
Annual Report 2017/18
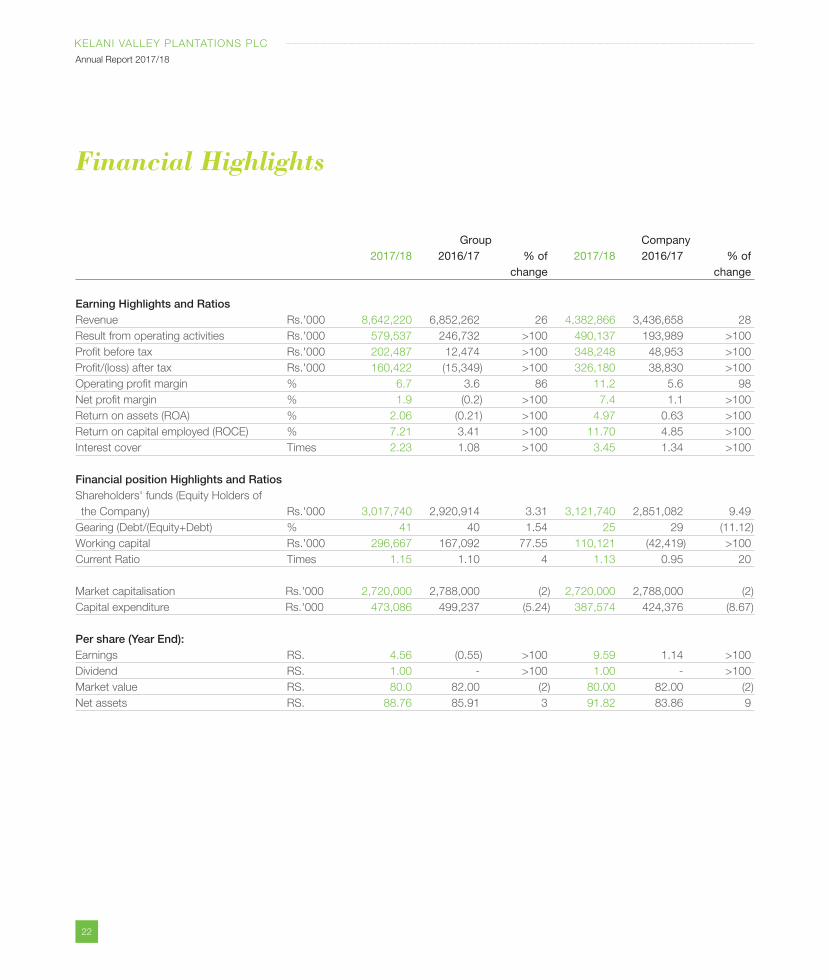
Financial Highlights
Group Company 2017/18 2016/17 % of 2017/18 2016/17 % of change change
Earning Highlights and RatiosRevenue Rs.'000 8,642,220 6,852,262 26 4,382,866 3,436,658 28
Result from operating activities Rs.'000 579,537 246,732 >100 490,137 193,989 >100
Profit before tax Rs.'000 202,487 12,474 >100 348,248 48,953 >100
Profit/(loss) after tax Rs.'000 160,422 (15,349) >100 326,180 38,830 >100
Operating profit margin % 6.7 3.6 86 11.2 5.6 98
Net profit margin % 1.9 (0.2) >100 7.4 1.1 >100
Return on assets (ROA) % 2.06 (0.21) >100 4.97 0.63 >100
Return on capital employed (ROCE) % 7.21 3.41 >100 11.70 4.85 >100
Interest cover Times 2.23 1.08 >100 3.45 1.34 >100
Financial position Highlights and RatiosShareholders' funds (Equity Holders of
the Company) Rs.'000 3,017,740 2,920,914 3.31 3,121,740 2,851,082 9.49
Gearing (Debt/(Equity+Debt) % 41 40 1.54 25 29 (11.12)
Working capital Rs.'000 296,667 167,092 77.55 110,121 (42,419) >100
Current Ratio Times 1.15 1.10 4 1.13 0.95 20
Market capitalisation Rs.'000 2,720,000 2,788,000 (2) 2,720,000 2,788,000 (2)
Capital expenditure Rs.'000 473,086 499,237 (5.24) 387,574 424,376 (8.67)
Per share (Year End):Earnings RS. 4.56 (0.55) >100 9.59 1.14 >100
Dividend RS. 1.00 - >100 1.00 - >100
Market value RS. 80.0 82.00 (2) 80.00 82.00 (2)
Net assets RS. 88.76 85.91 3 91.82 83.86 9
23
KELANI VALLEY PLANTATIONS PLC
Annual Report 2017/18
Hig
hlig
hts
for
2017
/18
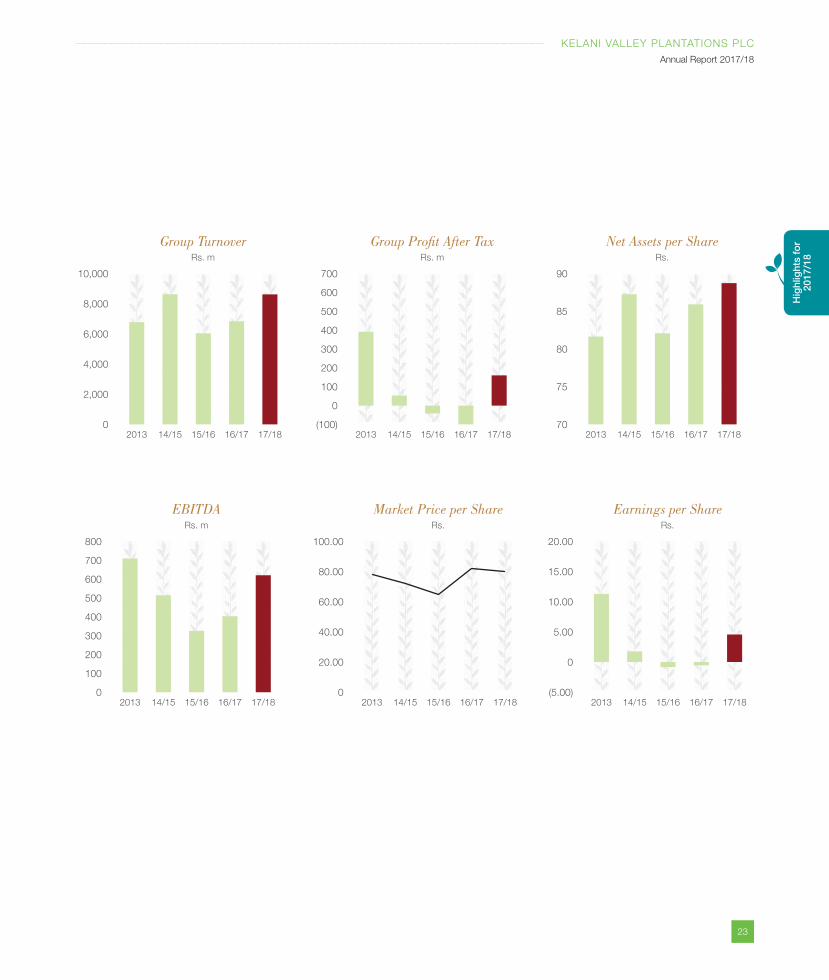
Group TurnoverRs. m
4,000
10,000
8,000
6,000
0
2,000
2013 14/15 15/16 16/17 17/18
EBITDARs. m
400
300
800
700
600
500
0
200
100
2013 14/15 15/16 16/17 17/18
Earnings per ShareRs.
15.00
10.00
20.00
(5.00)
5.00
0
2013 14/15 15/16 16/17 17/18
Net Assets per ShareRs.
80
90
85
70
75
2013 14/15 15/16 16/17 17/18
Group Profit After TaxRs. m
300
400
200
100
700
500
600
(100)
0
2013 14/15 15/16 16/17 17/18
Market Price per ShareRs.
40.00
100.00
80.00
60.00
0
20.00
2013 14/15 15/16 16/17 17/18
24
KELANI VALLEY PLANTATIONS PLC
Annual Report 2017/18
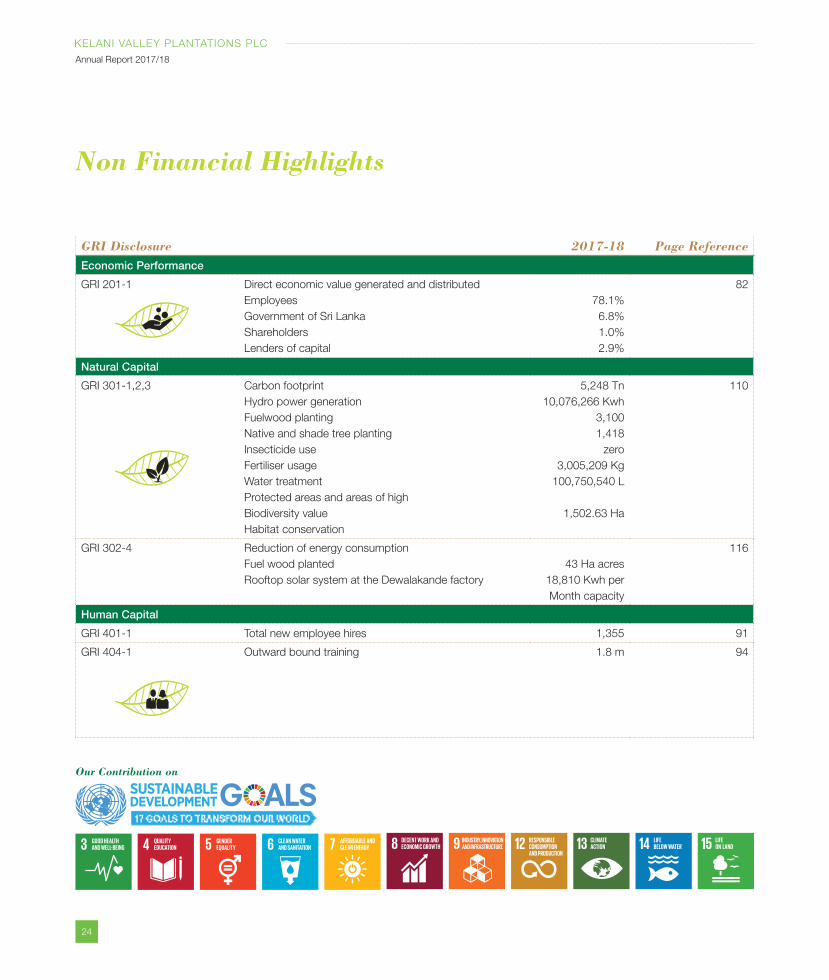
GRI Disclosure 2017-18 Page Reference Economic Performance
GRI 201-1 Direct economic value generated and distributed
Employees
Government of Sri Lanka
Shareholders
Lenders of capital
78.1%
6.8%
1.0%
2.9%
82
Natural Capital
GRI 301-1,2,3 Carbon footprint
Hydro power generation
Fuelwood planting
Native and shade tree planting
Insecticide use
Fertiliser usage
Water treatment
Protected areas and areas of high
Biodiversity value
Habitat conservation
5,248 Tn
10,076,266 Kwh
3,100
1,418
zero
3,005,209 Kg
100,750,540 L
1,502.63 Ha
110
GRI 302-4 Reduction of energy consumption
Fuel wood planted
Rooftop solar system at the Dewalakande factory
43 Ha acres
18,810 Kwh per
Month capacity
116
Human Capital
GRI 401-1 Total new employee hires 1,355 91
GRI 404-1 Outward bound training 1.8 m 94
Non Financial Highlights
Our Contribution on
25
KELANI VALLEY PLANTATIONS PLC
Annual Report 2017/18
Hig
hlig
hts
for
2017
/18
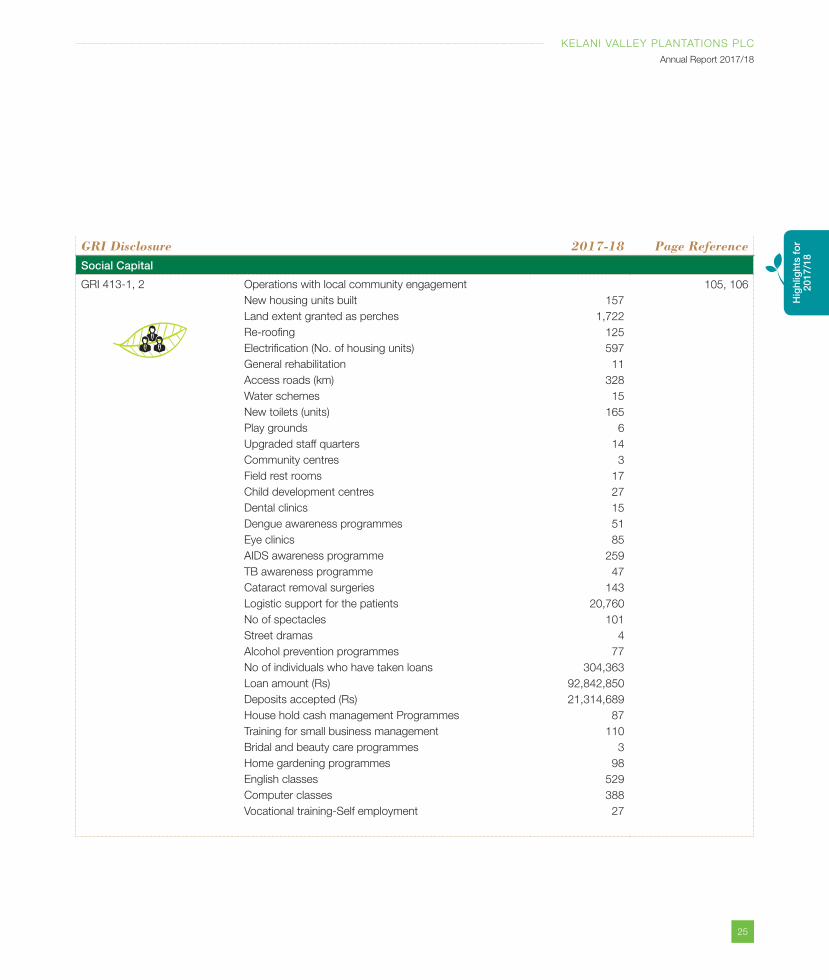
GRI Disclosure 2017-18 Page Reference Social Capital
GRI 413-1, 2 Operations with local community engagement
New housing units built
Land extent granted as perches
Re-roofing
Electrification (No. of housing units)
General rehabilitation
Access roads (km)
Water schemes
New toilets (units)
Play grounds
Upgraded staff quarters
Community centres
Field rest rooms
Child development centres
Dental clinics
Dengue awareness programmes
Eye clinics
AIDS awareness programme
TB awareness programme
Cataract removal surgeries
Logistic support for the patients
No of spectacles
Street dramas
Alcohol prevention programmes
No of individuals who have taken loans
Loan amount (Rs)
Deposits accepted (Rs)
House hold cash management Programmes
Training for small business management
Bridal and beauty care programmes
Home gardening programmes
English classes
Computer classes
Vocational training-Self employment
157
1,722
125
597
11
328
15
165
6
14
3
17
27
15
51
85
259
47
143
20,760
101
4
77
304,363
92,842,850
21,314,689
87
110
3
98
529
388
27
105, 106
26
KELANI VALLEY PLANTATIONS PLC
Annual Report 2017/18
Awards and Accolades
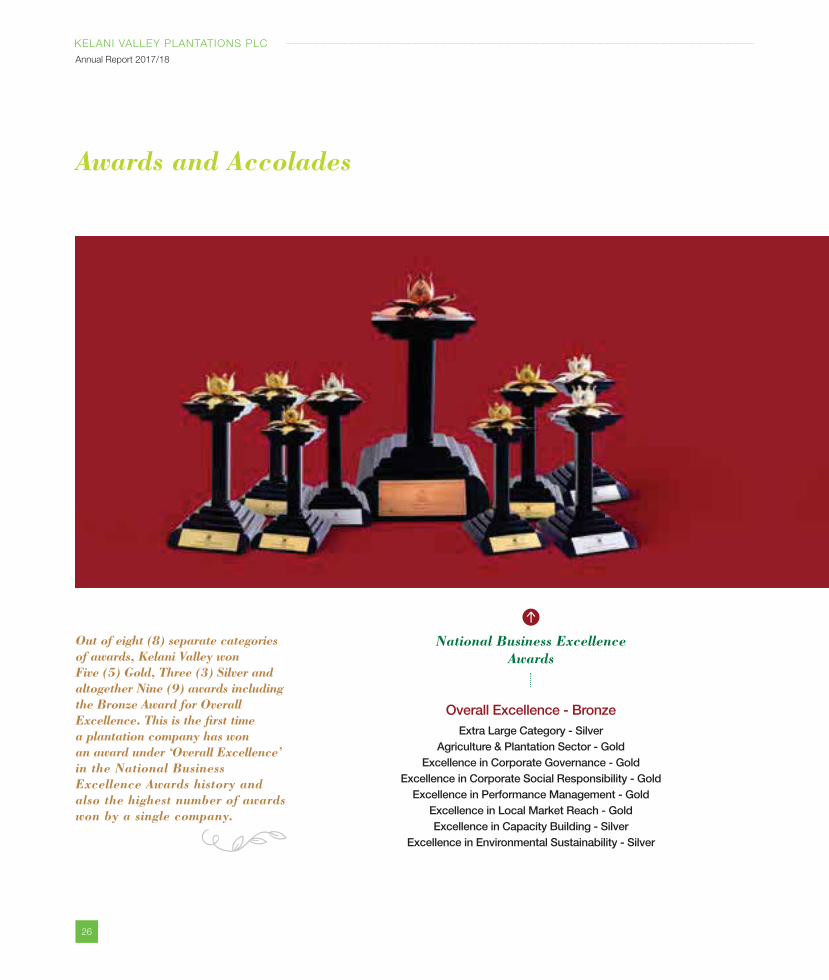
Overall Excellence - BronzeExtra Large Category - Silver
Agriculture & Plantation Sector - GoldExcellence in Corporate Governance - Gold
Excellence in Corporate Social Responsibility - GoldExcellence in Performance Management - Gold
Excellence in Local Market Reach - GoldExcellence in Capacity Building - Silver
Excellence in Environmental Sustainability - Silver
National Business Excellence Awards
Out of eight (8) separate categories of awards, Kelani Valley won Five (5) Gold, Three (3) Silver and altogether Nine (9) awards including the Bronze Award for Overall Excellence. This is the first time a plantation company has won an award under ‘Overall Excellence’ in the National Business Excellence Awards history and also the highest number of awards won by a single company.
27
KELANI VALLEY PLANTATIONS PLC
Annual Report 2017/18
Hig
hlig
hts
for
2017
/18
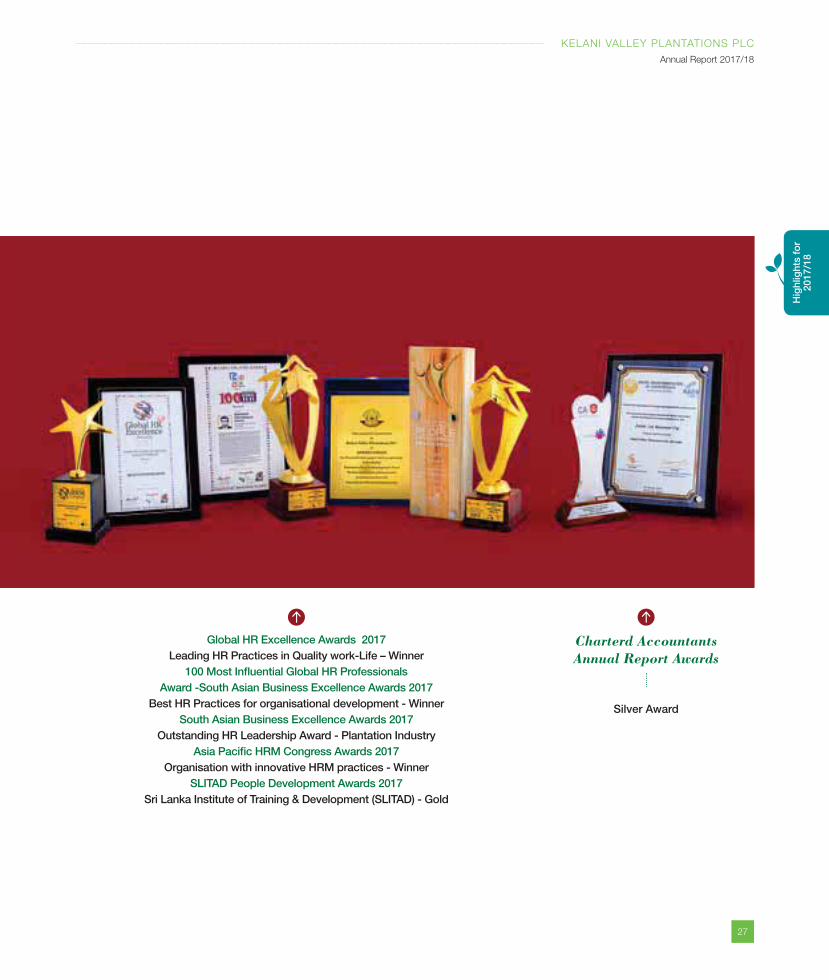
Silver Award
Global HR Excellence Awards 2017 Leading HR Practices in Quality work-Life – Winner
100 Most Influential Global HR Professionals Award -South Asian Business Excellence Awards 2017
Best HR Practices for organisational development - WinnerSouth Asian Business Excellence Awards 2017
Outstanding HR Leadership Award - Plantation IndustryAsia Pacific HRM Congress Awards 2017
Organisation with innovative HRM practices - WinnerSLITAD People Development Awards 2017
Sri Lanka Institute of Training & Development (SLITAD) - Gold
Charterd Accountants Annual Report Awards
28
KELANI VALLEY PLANTATIONS PLC
Annual Report 2017/18
GRI 102-14,56
Dear Shareholder,
I am pleased to present the Annual Report
and the Audited Financial Statements of
Kelani Valley Plantations PLC for the year
ended 31 March 2018.
THE YEAR IN REVIEW
A revival in economic activity was seen
across many of the world’s economies
in 2017. Global trade too strengthened
significantly, benefiting from this cyclical
recovery, while commodity prices remained
stable.
On the local front, Sri Lanka’s economy
showed, recorded a growth of 3.1%,
lowest in the recent years as the country
was plagued by drought and floods.
The growth of the economy was driven
mainly by the service and industry sectors.
The country’s agricultural base however
continues, to be affected by prolonged
adverse weather conditions for the second
consecutive year. The Rubber industry,
which has seen a downturn in fortunes for
the past two years, is an example of the
severity of the problem.
In contrast, the Tea industry appears to
be a beacon of hope for the country’s
agriculture sector, posting a greatly
improved performance in 2017. Despite
negative headwinds caused by the weather
and other serious challenges facing
the industry, including the Glyphosate
weedicide ban, Sri Lanka’s Tea output
Chairman’s Message
increased by 5.17% year-on-year. The
global Tea shortage witnessed due to
declining production volumes in Kenya
and North India was a boon for local
industry, which benefitted from strong
demand and higher prices throughout the
year.
STRATEGY AND FOCUS
Having celebrated the 150th anniversary
for the Tea industry in Sri Lanka and 25
years for your own Company in 2017,
KVPL remains firmly on track to achieve
what we have set out to do; to become
the leading plantation Company in Sri
Lanka.
In looking to build a competitive edge
that will to allow KVPL to take advantage
of positive market developments while
also providing a buffer during challenging
times, we are constantly striving to
push the limits and surpass standards
of excellence through continuous
improvement, exploring new ideas and
promoting creative thinking.
Currently our main strategic thrust is
centered on migrating to a more agile
business framework that would enable
the Company to sustainably scale up
operations in the long-term and are now
focusing our business transformation
efforts to enter a new age of efficiency,
sustainability and innovation throughout
both our Tea and Rubber value chains.
29
KELANI VALLEY PLANTATIONS PLC
Annual Report 2017/18
Hig
hlig
hts
for
2017
/18
It is of significance to note that many accolades were bestowed on KVPL during the year under review, the high point being winning Five Gold, Three Silver and Wining the overall Bronze at the “National Business Excellence Awards” in 2017 is a direct attribute to the professionalism, talent and skill of our people, who are the value creators of our Group. In turn,
Being an advocate of good agricultural
practices, we have begun leveraging
technology and precision agriculture
solutions to further improve input quality
and consistency, while investing to
upgrade infrastructure and introduce
automation, aimed at enhancing efficiency
and productivity ultimately leading to
operational excellence.
As part of our strategy to build a
sustainable foundation for growth, we
have continued our replanting programme,
covering over 30% of our Rubber extent.
The Company’s strategic decision
to expedite the Crop Diversification
model, has led to a significant increase
in Cinnamon cultivation of almost 100
hectares as at 31 March 2018.
The shortage of workers remains a
critical challenge that we face in both
Tea and Rubber plantations, especially
30
KELANI VALLEY PLANTATIONS PLC
Annual Report 2017/18
in recent times where worker migration
has increased to urban cities in the
country and overseas seeking better
prospects. KVPL has already begun taking
action to provide a sustainable solution.
Spearheading this effort is the revenue-
sharing model rolled out as a pilot project
in mid-2017 in predominant Tea cultivated
estates. Designed along the lines of the
Tea smallholder ownership programme,
we expect the revenue-sharing model
will enable KVPL to secure a firmer
commitment from the work force and more
importantly prevent worker migration from
the plantations in the long term.
PERFORMANCE
KVPL turnover for the year in review
increased by 28% over the corresponding
year mainly due to the increased Tea
production and a high prices for its end
product. The net profit after tax increased
to Rs. 326 m for the financial year under
review.
The Group’s turnover for the year under
review increased by 26% to Rs. 8.6 b over
the previous year and Mabroc Teas our
marketing subsidiary, with a turnover of
Rs. 4.5 b, being the main contributor.
KVPL Group recorded Rs. 160 m net
profit after tax over the financial year
under consideration. Mabroc Teas (Pvt)
Ltd., recorded yet another good year with
the highest export volume on record in
its history. With favorable wide spread
rain fall received in and around the hydro
catchment area of Kalupahana Power
Company (Pvt) Ltd., the power generation
was higher over the corresponding year,
which also contributed positively towards
the Groups profitability.
Hayleys Global Beverages (Pvt) Ltd., the
state of the art Tea extract plant in Hatton is
awaiting approval of our samples with major
overseas tea extract buyers to executing
commercial orders. We are optimistic that
the company would turn around in the
near future, as several large B2B players
in the tea extract industry have shown
interest. Kelani Valley Resorts (Pvt) Ltd., the
newest venture of the Group, with its “The
Oliphant Boutique Bungalow”, commenced
operations in December 2017 which is
managed by Amaya Leisure PLC has shown
potential in its short spell since operation
receiving good reviews from the travelers.
Based on your Company’s performance for
the financial year concluded, the Directors
have proposed a final dividend of Rs. 1.00
per share.
AWARDS
It is of significance to note that many
accolades were bestowed on KVPL during
the year under review, the high point
being winning Five Gold, Three Silver and
Wining the overall Bronze at the “National
Business Excellence Awards” in 2017 is
a direct attribute to the professionalism,
talent and skill of our people, who are the
value creators of our Group. In turn, our
Group is committed to supporting and
caring for them. It is also a reflection of how
the Company safeguards its assets and
follow good sustainable agri-business.
FUTURE PLANS
With the positive outlook for Sri Lanka’s
economy, I expect the coming year would
bring strong growth possibilities for KVPL’s
Tea and Rubber businesses. While we
expect the actions taken in the past and in
the current financial year would continue to
yield positive results for both segments, we
remain committed to further strengthen our
foundations in order to tangibly enhance
the position of each business in their
respective space. It is also envisaged to
continue to diversify into other crops and
sustainable renewable energy.
Chairman’s Message Contd.
Being an advocate of good agricultural practices, we have begun leveraging technology and precision agriculture solutions to further improve input quality and consistency, while investing to upgrade infrastructure and introduce automation, aimed at enhancing efficiency and productivity ultimately leading to operational excellence.
31
KELANI VALLEY PLANTATIONS PLC
Annual Report 2017/18
Hig
hlig
hts
for
2017
/18
APPRECIATIONS
To conclude I would like to thank
my colleagues on the Board for their
outstanding service and insightfulness with
which they have steered the Company over
the year. My heartfelt gratitude also goes to
the Management team and all employees
of KVPL for the commitment and passion
they have shown in executing their duties
year after year.
I take this opportunity also to thank
our shareholders, investors, business
partners and all other stakeholders for
their continued support. On behalf of the
Board, I reiterate the commitment to keep
on enhancing the value delivered to all
stakeholders in the years ahead.
A M Pandithage
Chairman
09 May 2018
32
KELANI VALLEY PLANTATIONS PLC
Annual Report 2017/18
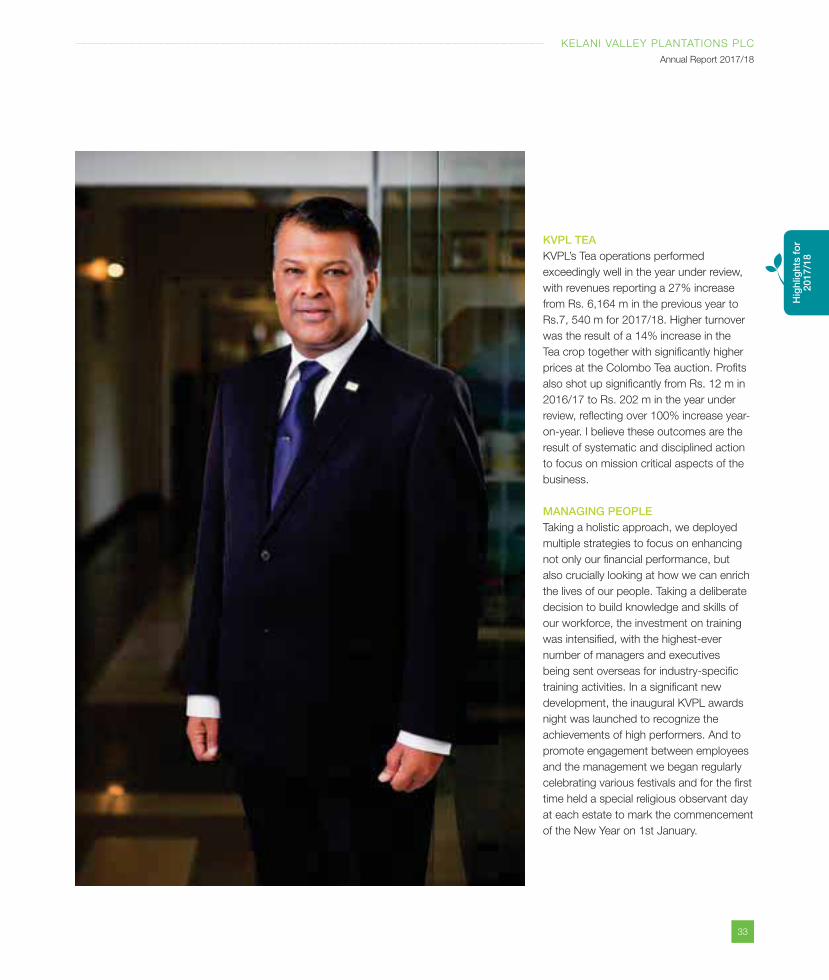
Managing Director’s MessageGRI 102-14
Taking a holistic approach, we deployed multiple strategies to focus on enhancing not only our financial performance, butalso crucially looking at how we can enrich the lives of our people.
We’ve made great strides as a company that’s keen to shake up the industry
Keeping our eyes on the prize
Having emerged from a period of average
growth for the past few years, KVPL
recorded an impressive performance in the
year under review, undoubtedly the result
of our responsible, and ethical approach
to build resilience across all aspects of the
business.
As I reflect over the year, I must admit the
journey to get to this point has been both
rewarding and challenging at the same
time. Throughout the year we looked to
consolidate our core competencies and
push for a more sustainable operating
model that would not only to spearhead
growth of the core businesses but also
enable us to work from the ground-up to
help the country’s Tea and Rubber sectors
to thrive and grow well into the future.
33
KELANI VALLEY PLANTATIONS PLC
Annual Report 2017/18
Hig
hlig
hts
for
2017
/18
KVPL TEAKVPL’s Tea operations performed
exceedingly well in the year under review,
with revenues reporting a 27% increase
from Rs. 6,164 m in the previous year to
Rs.7, 540 m for 2017/18. Higher turnover
was the result of a 14% increase in the
Tea crop together with significantly higher
prices at the Colombo Tea auction. Profits
also shot up significantly from Rs. 12 m in
2016/17 to Rs. 202 m in the year under
review, reflecting over 100% increase year-
on-year. I believe these outcomes are the
result of systematic and disciplined action
to focus on mission critical aspects of the
business.
MANAGING PEOPLETaking a holistic approach, we deployed
multiple strategies to focus on enhancing
not only our financial performance, but
also crucially looking at how we can enrich
the lives of our people. Taking a deliberate
decision to build knowledge and skills of
our workforce, the investment on training
was intensified, with the highest-ever
number of managers and executives
being sent overseas for industry-specific
training activities. In a significant new
development, the inaugural KVPL awards
night was launched to recognize the
achievements of high performers. And to
promote engagement between employees
and the management we began regularly
celebrating various festivals and for the first
time held a special religious observant day
at each estate to mark the commencement
of the New Year on 1st January.
34
KELANI VALLEY PLANTATIONS PLC
Annual Report 2017/18
Considerable time and effort was also put
in to address the multi-factorial human
issues arising as a result of ongoing ban on
the use of Glyphosate. With bush health
compromised due to inadequate weed
control, manual weeding was initiated at
all estates. Encouraging workers to take
up manual weeding however proved to be
a considerable challenge, understandably
due to the high risk of reptiles and leeches
breeding within the overgrown weeds. With
the manual weeding strategy proving to be
ineffective in many ways, we saw a drop
in productivity levels, prompting renewed
focus on the “Quality Drive” launched
in the previous year. Moreover, with low
productivity having a negative impact on
the earning capacity of the workforce,
we invested in strengthening relations to
keep motivation levels up. And with worker
safety also coming under threat due to the
higher exposure to leeches and reptiles
during the manual weeding process, we
looked to revamp our health and safety
protocols and also raise awareness among
workforce.
INCREASING PRODUCTIVITYFurther we expedited the roll out of the
revenue-share model across all our estates
with the intention of stimulating an increase
in productivity and ensuring supply chain
security. And it is indeed pleasing to see
how well this strategy is working. At this
point it is worth mentioning that while the
national average high-grown Tea crop for
2017 was unchanged from 2016, KVPL
reported a commendable 14% increase in
the high grown Tea crop, which I believe is
largely thanks to the proper application of
the revenue-share model. Serving a dual
purpose, the revenue-share model is also
seen as a sustainable solution to the worker
migration issue that has become a serious
concern in the plantation sector. Our estates
too continue to be plagued by the issue
of worker migration. In fact our workforce
strength today is only 75% of what it was a
decade ago, which illustrates the seriousness
of the issue and call for urgent action.
PERFORMANCE MANAGEMENTWe further enhanced the technology used
in the digital weighing system to capture
the weighing of bought green leaf from
small holders. Moving ahead we intend
linking the weighing to compute and
automate the payment directly to the small
holders’ banks, enabling them to access
their dues. The information derived from
daily operations was made available to the
managers ‘Tabs’ for better management by
installing an Android Application .
BEST AGRICULTURE PRACTICESWe remained committed to ensure
greater sustainability in the long term and
continued best agricultural practices in soil
and water management by incorporating
300,000 kgs at a cost of Rs. 4.5 m of
green matter with bio cha formulated
with a nitrogen fixing microbe’s specific to
tea that would enable the tea to absorb
the nutrients better. In similar vein we
continued to invest on upkeep of our
factory infrastructure and equipment in
keeping to our quality and safety standards
in compliance with our certification.
We continued our corporate standing
of being a preferred tea producer by
committing to sustain the certification
standards of all our 12 tea processing
centres as ISO 22000:2005 food safety
management system, and conform to UTZ,
Rainforest Alliance and the Ethical Tea
Partnership.
COMMUNITY INVESTMENTI am also happy to report that KVPL
made good progress on its community
developments efforts operationalized
through our flagship community initiative
“A Home for every Plantation worker”
programme, which also confirms KVPL’s
alignment to the 10 principles outlined in
the UN Global Compact. The programme
continues to receive international acclaim
and received a considerable boost in the
year under review, following the interest
shown by the Save the Children Fund
to integrate the concept of Mother-and-
child-friendly Tea estates into the main
programme framework. As part of the first
phase of the initiative, the Child Policy was
rolled out across all estates, with KVPL
making history as the first-ever plantation
company anywhere in the world to adopt
the policy. Meanwhile working to support
the UN women’s empowerment goals,
we rolled out the PACE programme for all
women in the estate workforce.
It is encouraging to note that the success of
these initiatives has enabled KVPL to secure
assistance from other global organizations
to expedite our community development
agenda. Notable contributions for the year
Managing Director’s Message Contd.
35
KELANI VALLEY PLANTATIONS PLC
Annual Report 2017/18
Hig
hlig
hts
for
2017
/18
include, the additional commitment by the
“Save the Children fund” under the UNGC -
CEO water mandate, to contribute towards
improving water and sanitation levels as
well as the upliftment of child development
centers at estates in the Hatton region.
In yet another milestone achievement,
KVPL was able to secure the commitment
of the World Bank to develop necessary
infrastructure to provide purified drinking
water to 177 families at the Glassaugh
estate and another 540 families at the
Edinburgh estate. The project also included
the construction of essential sanitation
facilities at both Edinburgh and Glassaugh
estates.
KVPL RUBBERThe Rubber segment too performed
reasonably well in the year under review,
despite some notable challenges. The
sector came under stress as high prices
for Centrifuge Latex in the 3rd and 4th
quarters saw local buyers opting to import
their requirements at a lower cost. The
scenario forced KVPL to shift towards the
manufacture of Crepe Rubber in order
to utilize latex stocks, which meant the
optimum product mix could not be achieved,
in turn bringing pressure on margins.
Nonetheless, the segment’s revenue was
up by 13% to Rs. 1,043 m aided by higher
export volumes of made Rubber and
increased prices at the Colombo Auctions.
Notably, Rubber prices/kg (NSA) of all
grades shot up by 22% to Rs. 334/- per
made Rubber kg from Rs. 274/-.
an experiment to ascertain its capabilities,
Results show that there is hardly any
damages caused to the rubber tree.
Several important steps were taken to build
a more sustainable operating framework
for the Rubber segment as well, among
them the move to expand the Timber Block
programme in pursuit of KVPL’s timber
wood self-sufficiency target set for 2020.
INVESTMENT IN INFRASTRUCTURECapital investments in the segment
included the commissioning of new
effluent plants at Panawatte and Dunedin
estate along with investments in solar
energy, signaling our intention to migrate
to renewable energy sources for business
needs in the long term.
KVPL CINNAMONWe increased our investment in Cinnamon
cultivation with a total of 43.52 hectares of
Cinnamon planted in the year under review.
The cultivation of Cinnamon is more a
long-term strategy targeting larger extents
and adding value to its end products, the
results of which would add to our revenues
in the years to come.
PERFORMANCE OF SUBSIDIARIESMabroc Teas (Pvt) Ltd., performed
exceedingly well. The Company reported
higher Turnover over the previous year
contributed by a larger volume of tea being
exported. A significant growth in exports
to China has been observed while PBT too
I believe our performance for the year under review puts Kelani Valley Plantations PLC on track towards its next big growth phase. We remain optimistic about the future and will look to further consolidate our position and improve yields in both Tea and Rubber segments.
It is encouraging to see that our efforts to
grow direct exports have been successful,
as evidenced by the growth in volumes of
exports over the past few years.
We made progress on many other fronts
as well.
REPLANTING PROGRAMMEOur investment in Rubber replanting also
continues to bear fruit, as more hectares
of the tappable Rubber come into bearing
each year. In the year under review,
approximately 132 hectares of tappable
Rubber came into bearing, With this tried
and tested model delivering consistent
results, we continued with our Rubber
replanting programme, and another 181
hectares of Rubber was planted in the year
under review.
We also began to see visibly improved
yields as the year progressed, which
I credit to success of the early tapper
model launched a year ago. We have also
introduced a motorised tapping machine as
36
KELANI VALLEY PLANTATIONS PLC
Annual Report 2017/18
increased for the period 2017/18. Financial
performance appear in page 22 of this report
The performance of Kalupahana Power
Company (Pvt) Ltd. (KPC), also showed
a strong improvement for the year under
review. The Company increased its
contribution to the national grid by 55%
enabling a 47% increase in turnover to Rs.
Rs. 32 m, from Rs. 21 m in the previous
year. However KPC’s the bottom line took a
hit of Rs. 2 m, as a result of the backdated
tariff adjustment imposed by the Ceylon
Electricity Board in the latter part of the year.
Kelani Valley Resorts (Pvt) Ltd. (KVR)
reported revenue of Rs. 6 m and a gross
profit of Rs. 4.7 m for the three months
ending 31 March 2018. KVR owns the
bungalow at “Oliphant Estate” situated in
Nuwara Eliya, which was refurbished and
launched to the market in October 2017
as a luxury boutique hotel offering a truly
colonial experience.
Hayley’s Global Beverages (Pvt) Ltd.
(HGBL), the state of the art Tea Extract
Plant in Hatton has continued its
product sampling and testing with many
buyers showing interest in these new
developments. While no confirmed
outcomes have yet materialised, we remain
confident that the company would fare well
in due course. In the meantime, HGBL’s
loss amounting to Rs. 213 m for the year
under review was absorbed by KVPL.
AWARDS AND RECOGNITIONOur continued commitment to our people
and environment was recognised at many
forums locally and internationally, key
among them, the overall Bronze award at
the “National Business Excellence Awards
2017. The awards are elaborated further
on page 26.
FUTURE OUTLOOKI believe our performance for the year
under review puts Kelani Valley Plantations
PLC on track towards its next big growth
phase. We remain optimistic about the
future and will look to further consolidate
our position and improve yields in both Tea
and Rubber segments.
In the Tea segment, the focus would be
to expand the revenue-share model, while
systematically reorienting its structure in
the interest of mutual benefit. I believe the
revenue-share model will also play a pivotal
role in our efforts to create a new dynamic
for the entire Tea industry-where workers
are empowered with the right tools to
become entrepreneurs in their own right
and ease away from their dependency on
plantation companies.
In the Rubber segment, we expect
replanting to remain a high a priority.
Further we will also look to expedite our
crop diversification strategies by exploring
the possibility of investing in coconut.
The emphasis on workforce development
will be another key focus area and our
investments in this regard would aim to
make plantations a preferred place to
work. Energy efficient operations and the
adoption of best practices for sustainable
agriculture will be given equal importance
in KVPL’s medium term strategy.
All this is anchored to my vision for the
Company–to be the most economically,
socially and environmentally sustainable
plantation Company in Sri Lanka.
APPRECIATIONSI take this opportunity to thank all
employees of Kelani Valley Plantations PLC,
for their passion and commitment towards
delivering results year-on-year. I also express
my sincere thanks to our Chairman my
fellow Directors for their continuous support
and invaluable advice at all times, buyers,
brokers, suppliers and finally a special word
of thanks to our shareholders for the trust
and confidence placed in the Company.
I seek your continued patronage in the years
ahead as well.
Roshan RajaduraiManaging Director
Kelani Valley Plantations PLC
Managing Director’s Message Contd.

37
KELANI VALLEY PLANTATIONS PLC
Annual Report 2017/18
Str
ateg
y an
d F
ocu
sOur cinnamon is truly a Sri Lankan effort,
with new ventures sure to add spice to our already-diverse portfolio.
- MAHATMA GANDHI -
the change Be
you want to see in theworld
38
KELANI VALLEY PLANTATIONS PLC
Annual Report 2017/18
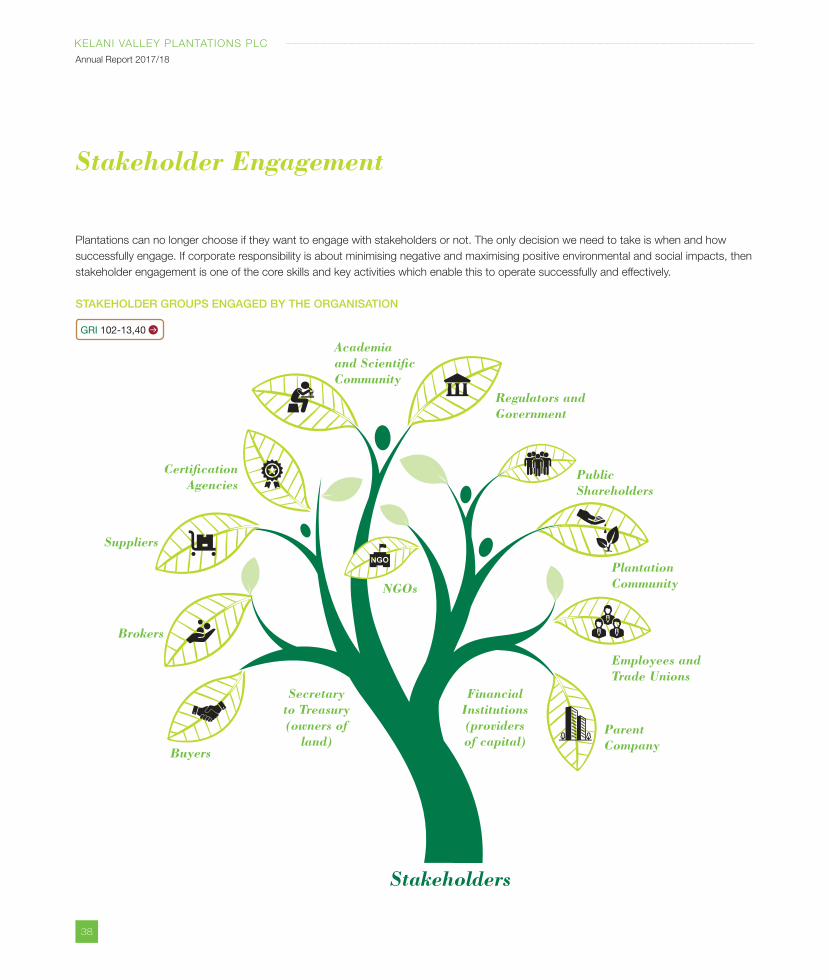
Plantations can no longer choose if they want to engage with stakeholders or not. The only decision we need to take is when and how
successfully engage. If corporate responsibility is about minimising negative and maximising positive environmental and social impacts, then
stakeholder engagement is one of the core skills and key activities which enable this to operate successfully and effectively.
STAKEHOLDER GROUPS ENGAGED BY THE ORGANISATION
GRI 102-13,40
Stakeholder Engagement
Parent Company
Employees and Trade Unions
Plantation Community
Public Shareholders
Regulators and Government
Certification Agencies
Suppliers
Brokers
Buyers
Academia and Scientific Community
NGOs
Stakeholders
Secretary to Treasury(owners of
land)
Financial Institutions (providers of capital)
39
KELANI VALLEY PLANTATIONS PLC
Annual Report 2017/18
Str
ateg
y an
d F
ocu
s
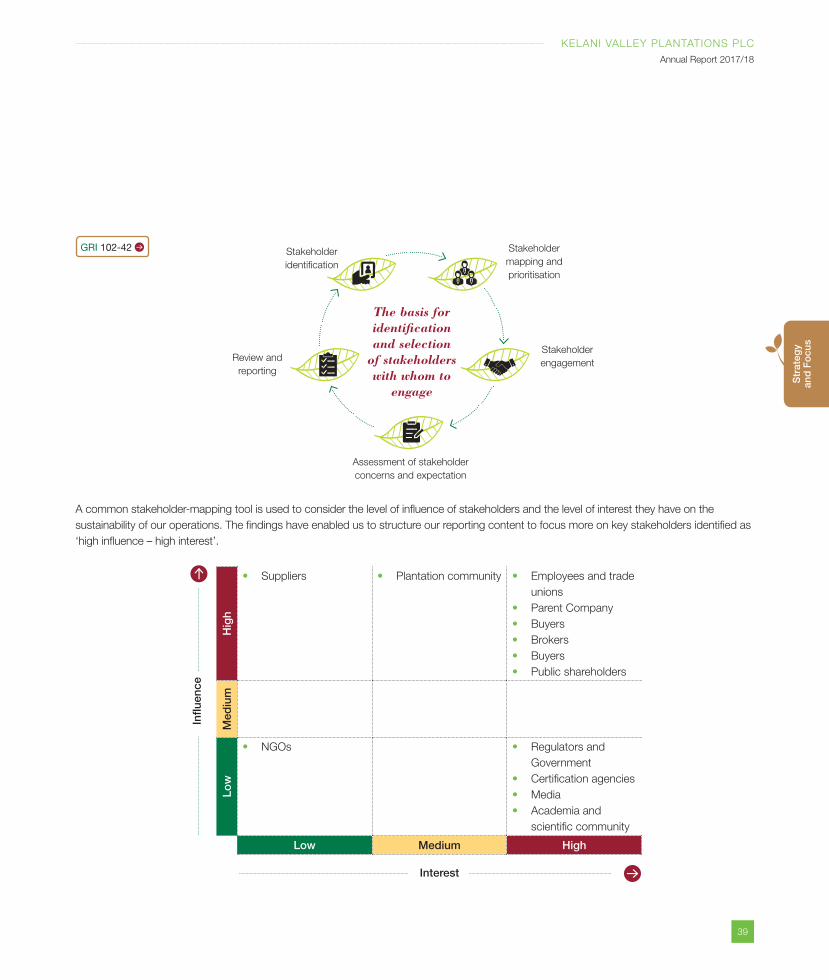
GRI 102-42
A common stakeholder-mapping tool is used to consider the level of influence of stakeholders and the level of interest they have on the
sustainability of our operations. The findings have enabled us to structure our reporting content to focus more on key stakeholders identified as
‘high influence – high interest’.
Influ
ence
Hig
h
Suppliers Plantation community Employees and trade
unions
Parent Company
Buyers
Brokers
Buyers
Public shareholders
Med
ium
Low
NGOs Regulators and
Government
Certification agencies
Media
Academia and
scientific community
Low Medium High
Interest
The basis for identification and selection
of stakeholders with whom to
engage
Stakeholder
mapping and
prioritisation
Stakeholder
engagementReview and
reporting
Stakeholder
identification
Assessment of stakeholder
concerns and expectation
40
KELANI VALLEY PLANTATIONS PLC
Annual Report 2017/18
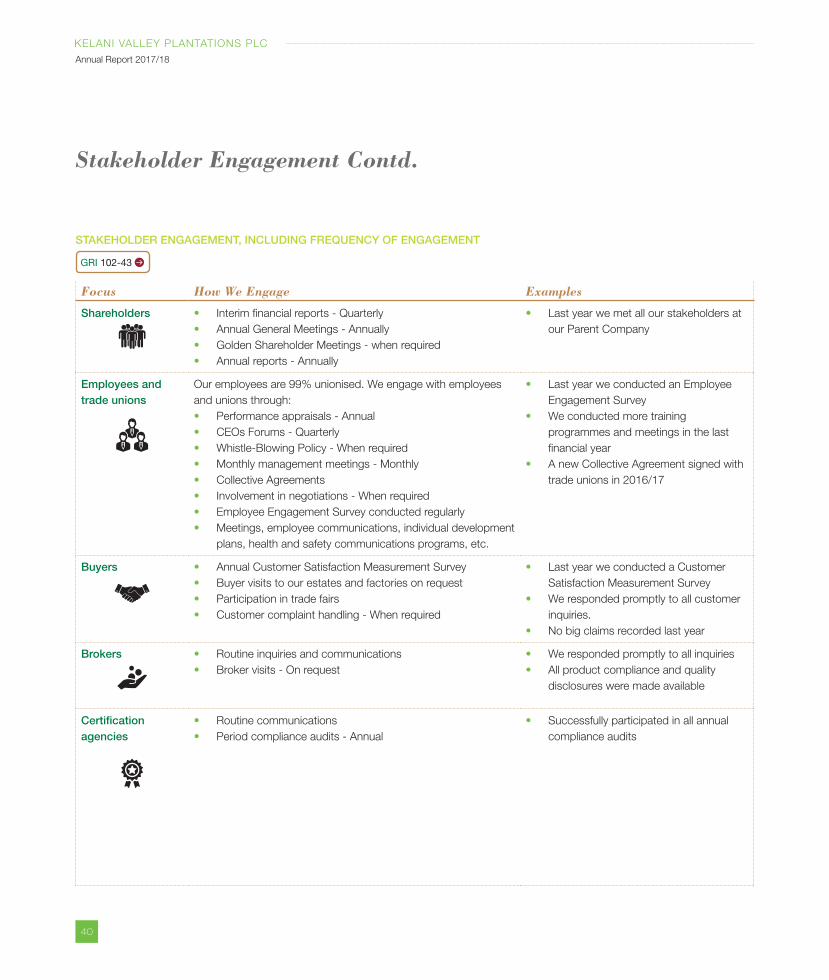
STAKEHOLDER ENGAGEMENT, INCLUDING FREQUENCY OF ENGAGEMENT
GRI 102-43
Focus How We Engage Examples
Shareholders Interim financial reports - Quarterly
Annual General Meetings - Annually
Golden Shareholder Meetings - when required
Annual reports - Annually
Last year we met all our stakeholders at
our Parent Company
Employees and trade unions
Our employees are 99% unionised. We engage with employees
and unions through:
Performance appraisals - Annual
CEOs Forums - Quarterly
Whistle-Blowing Policy - When required
Monthly management meetings - Monthly
Collective Agreements
Involvement in negotiations - When required
Employee Engagement Survey conducted regularly
Meetings, employee communications, individual development
plans, health and safety communications programs, etc.
Last year we conducted an Employee
Engagement Survey
We conducted more training
programmes and meetings in the last
financial year
A new Collective Agreement signed with
trade unions in 2016/17
Buyers Annual Customer Satisfaction Measurement Survey
Buyer visits to our estates and factories on request
Participation in trade fairs
Customer complaint handling - When required
Last year we conducted a Customer
Satisfaction Measurement Survey
We responded promptly to all customer
inquiries.
No big claims recorded last year
Brokers Routine inquiries and communications
Broker visits - On request
We responded promptly to all inquiries
All product compliance and quality
disclosures were made available
Certification agencies
Routine communications
Period compliance audits - Annual
Successfully participated in all annual
compliance audits
Stakeholder Engagement Contd.
41
KELANI VALLEY PLANTATIONS PLC
Annual Report 2017/18
Str
ateg
y an
d F
ocu
s
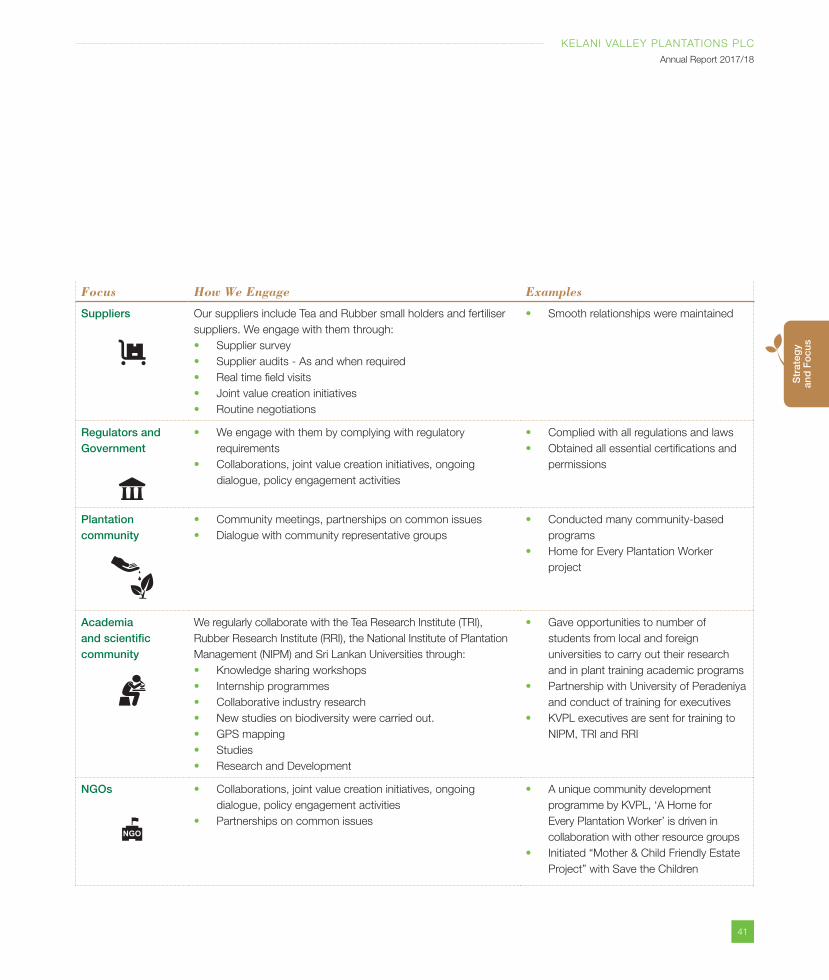
Focus How We Engage Examples
Suppliers Our suppliers include Tea and Rubber small holders and fertiliser
suppliers. We engage with them through:
Supplier survey
Supplier audits - As and when required
Real time field visits
Joint value creation initiatives
Routine negotiations
Smooth relationships were maintained
Regulators and Government
We engage with them by complying with regulatory
requirements
Collaborations, joint value creation initiatives, ongoing
dialogue, policy engagement activities
Complied with all regulations and laws
Obtained all essential certifications and
permissions
Plantation community
Community meetings, partnerships on common issues
Dialogue with community representative groups
Conducted many community-based
programs
Home for Every Plantation Worker
project
Academia and scientific community
We regularly collaborate with the Tea Research Institute (TRI),
Rubber Research Institute (RRI), the National Institute of Plantation
Management (NIPM) and Sri Lankan Universities through:
Knowledge sharing workshops
Internship programmes
Collaborative industry research
New studies on biodiversity were carried out.
GPS mapping
Studies
Research and Development
Gave opportunities to number of
students from local and foreign
universities to carry out their research
and in plant training academic programs
Partnership with University of Peradeniya
and conduct of training for executives
KVPL executives are sent for training to
NIPM, TRI and RRI
NGOs Collaborations, joint value creation initiatives, ongoing
dialogue, policy engagement activities
Partnerships on common issues
A unique community development
programme by KVPL, ‘A Home for
Every Plantation Worker’ is driven in
collaboration with other resource groups
Initiated “Mother & Child Friendly Estate
Project” with Save the Children
42
KELANI VALLEY PLANTATIONS PLC
Annual Report 2017/18
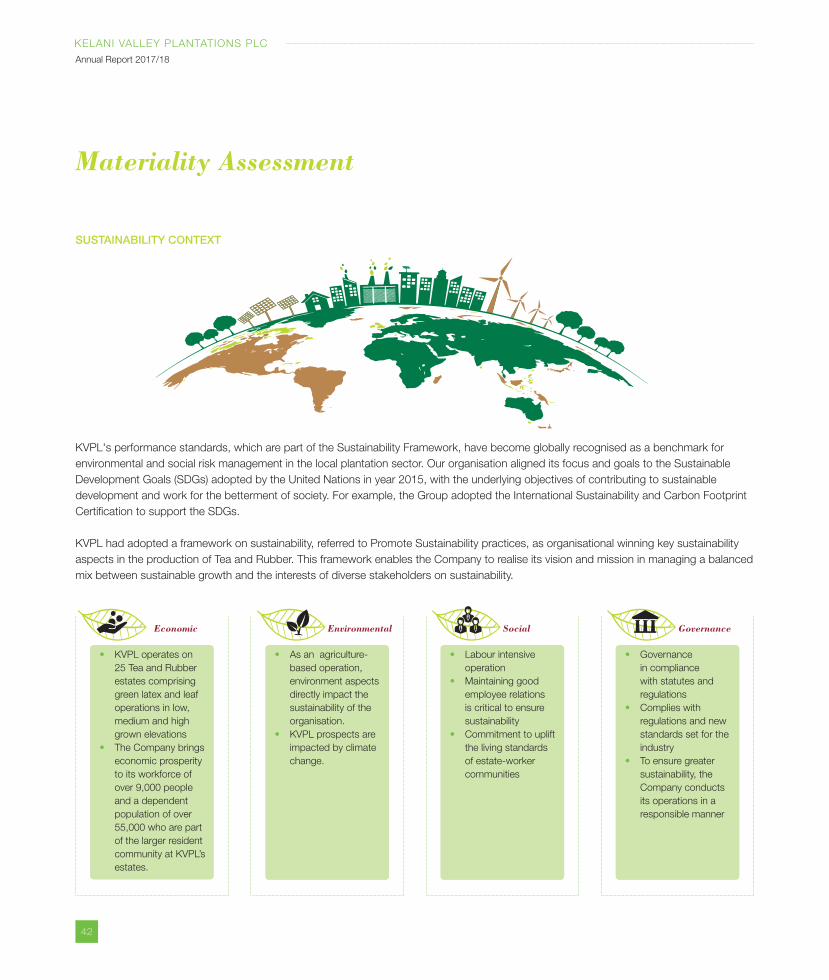
SUSTAINABILITY CONTEXT
KVPL's performance standards, which are part of the Sustainability Framework, have become globally recognised as a benchmark for
environmental and social risk management in the local plantation sector. Our organisation aligned its focus and goals to the Sustainable
Development Goals (SDGs) adopted by the United Nations in year 2015, with the underlying objectives of contributing to sustainable
development and work for the betterment of society. For example, the Group adopted the International Sustainability and Carbon Footprint
Certification to support the SDGs.
KVPL had adopted a framework on sustainability, referred to Promote Sustainability practices, as organisational winning key sustainability
aspects in the production of Tea and Rubber. This framework enables the Company to realise its vision and mission in managing a balanced
mix between sustainable growth and the interests of diverse stakeholders on sustainability.
Materiality Assessment
KVPL operates on
25 Tea and Rubber
estates comprising
green latex and leaf
operations in low,
medium and high
grown elevations
The Company brings
economic prosperity
to its workforce of
over 9,000 people
and a dependent
population of over
55,000 who are part
of the larger resident
community at KVPL’s
estates.
As an agriculture-
based operation,
environment aspects
directly impact the
sustainability of the
organisation.
KVPL prospects are
impacted by climate
change.
Labour intensive
operation
Maintaining good
employee relations
is critical to ensure
sustainability
Commitment to uplift
the living standards
of estate-worker
communities
Governance
in compliance
with statutes and
regulations
Complies with
regulations and new
standards set for the
industry
To ensure greater
sustainability, the
Company conducts
its operations in a
responsible manner
Economic Environmental Social Governance
43
KELANI VALLEY PLANTATIONS PLC
Annual Report 2017/18
Str
ateg
y an
d F
ocu
s
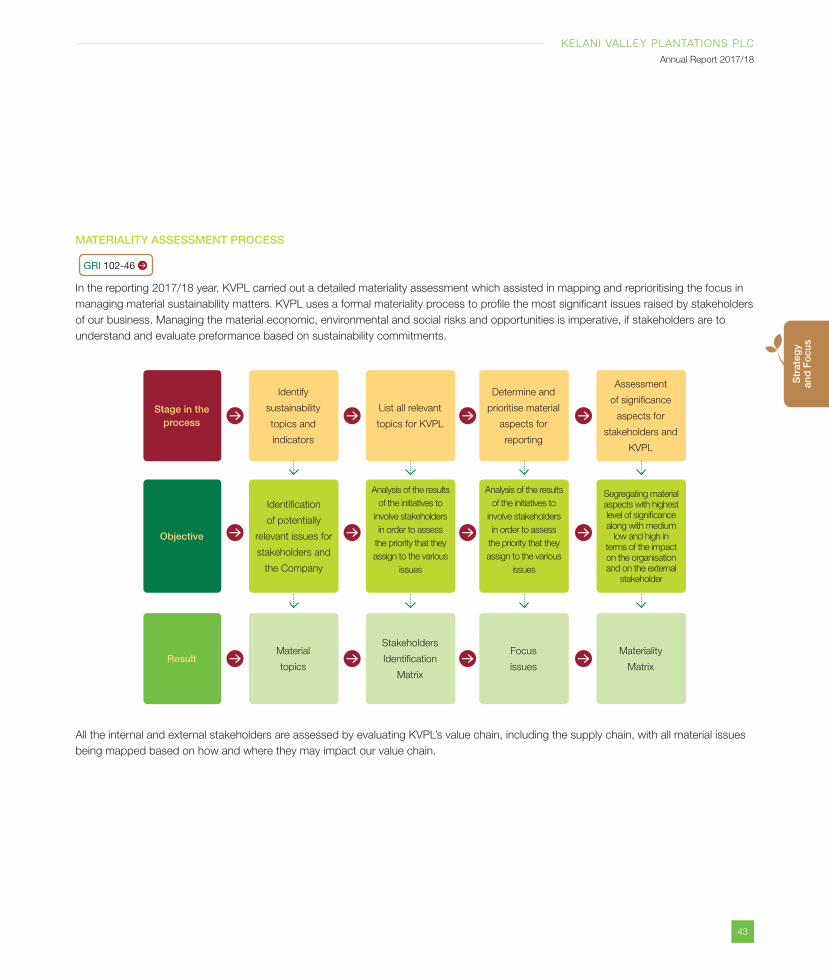
MATERIALITY ASSESSMENT PROCESS
GRI 102-46
In the reporting 2017/18 year, KVPL carried out a detailed materiality assessment which assisted in mapping and reprioritising the focus in
managing material sustainability matters. KVPL uses a formal materiality process to profile the most significant issues raised by stakeholders
of our business. Managing the material economic, environmental and social risks and opportunities is imperative, if stakeholders are to
understand and evaluate preformance based on sustainability commitments.
All the internal and external stakeholders are assessed by evaluating KVPL’s value chain, including the supply chain, with all material issues
being mapped based on how and where they may impact our value chain.
Identify
sustainability
topics and
indicators
Identification
of potentially
relevant issues for
stakeholders and
the Company
Material
topics
List all relevant
topics for KVPL
Analysis of the results
of the initiatives to
involve stakeholders
in order to assess
the priority that they
assign to the various
issues
Stakeholders
Identification
Matrix
Determine and
prioritise material
aspects for
reporting
Analysis of the results
of the initiatives to
involve stakeholders
in order to assess
the priority that they
assign to the various
issues
Focus
issues
Assessment
of significance
aspects for
stakeholders and
KVPL
Segregating material
aspects with highest
level of significance
along with medium
low and high in
terms of the impact
on the organisation
and on the external
stakeholder
Materiality
Matrix
Stage in the process
Objective
Result
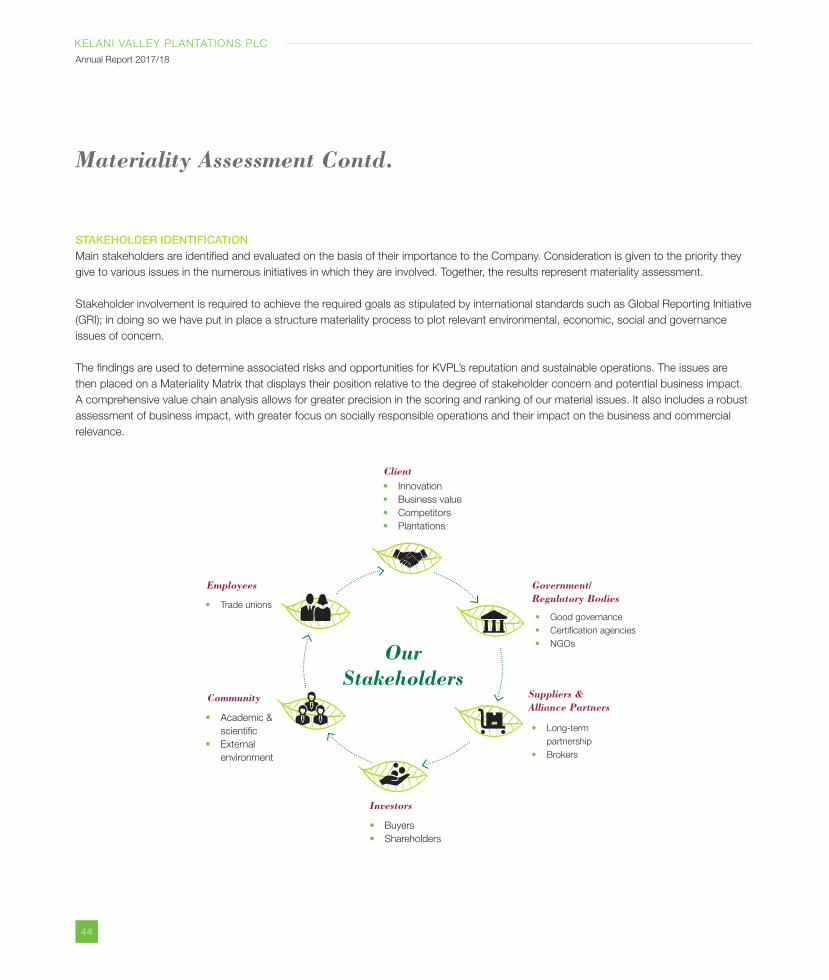
44
KELANI VALLEY PLANTATIONS PLC
Annual Report 2017/18
STAKEHOLDER IDENTIFICATIONMain stakeholders are identified and evaluated on the basis of their importance to the Company. Consideration is given to the priority they
give to various issues in the numerous initiatives in which they are involved. Together, the results represent materiality assessment.
Stakeholder involvement is required to achieve the required goals as stipulated by international standards such as Global Reporting Initiative
(GRI); in doing so we have put in place a structure materiality process to plot relevant environmental, economic, social and governance
issues of concern.
The findings are used to determine associated risks and opportunities for KVPL’s reputation and sustainable operations. The issues are
then placed on a Materiality Matrix that displays their position relative to the degree of stakeholder concern and potential business impact.
A comprehensive value chain analysis allows for greater precision in the scoring and ranking of our material issues. It also includes a robust
assessment of business impact, with greater focus on socially responsible operations and their impact on the business and commercial
relevance.
Materiality Assessment Contd.
Our Stakeholders
Government/Regulatory Bodies
Employees
Suppliers & Alliance Partners
Community
Investors
Innovation
Business value
Competitors
Plantations
Good governance
Certification agencies
NGOs
Trade unions
Long-term
partnership
Brokers
Academic &
scientific
External
environment
Buyers
Shareholders
Client
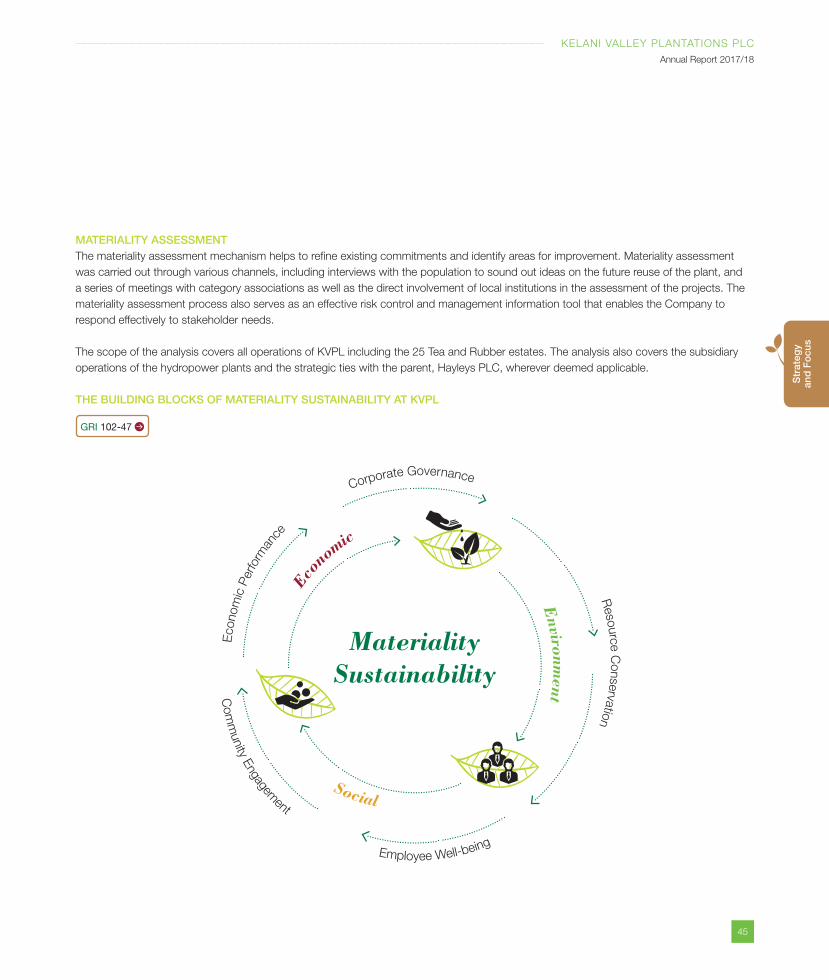
45
KELANI VALLEY PLANTATIONS PLC
Annual Report 2017/18
Str
ateg
y an
d F
ocu
s
MATERIALITY ASSESSMENTThe materiality assessment mechanism helps to refine existing commitments and identify areas for improvement. Materiality assessment
was carried out through various channels, including interviews with the population to sound out ideas on the future reuse of the plant, and
a series of meetings with category associations as well as the direct involvement of local institutions in the assessment of the projects. The
materiality assessment process also serves as an effective risk control and management information tool that enables the Company to
respond effectively to stakeholder needs.
The scope of the analysis covers all operations of KVPL including the 25 Tea and Rubber estates. The analysis also covers the subsidiary
operations of the hydropower plants and the strategic ties with the parent, Hayleys PLC, wherever deemed applicable.
THE BUILDING BLOCKS OF MATERIALITY SUSTAINABILITY AT KVPL
GRI 102-47
Econom
ic P
erform
ance
Com
munity E
ngagem
ent
Employee Well-being
Resourc
e C
onserv
atio
n
Corporate Governance
Materiality Sustainability
Econ
omic
Social
Environm
ent
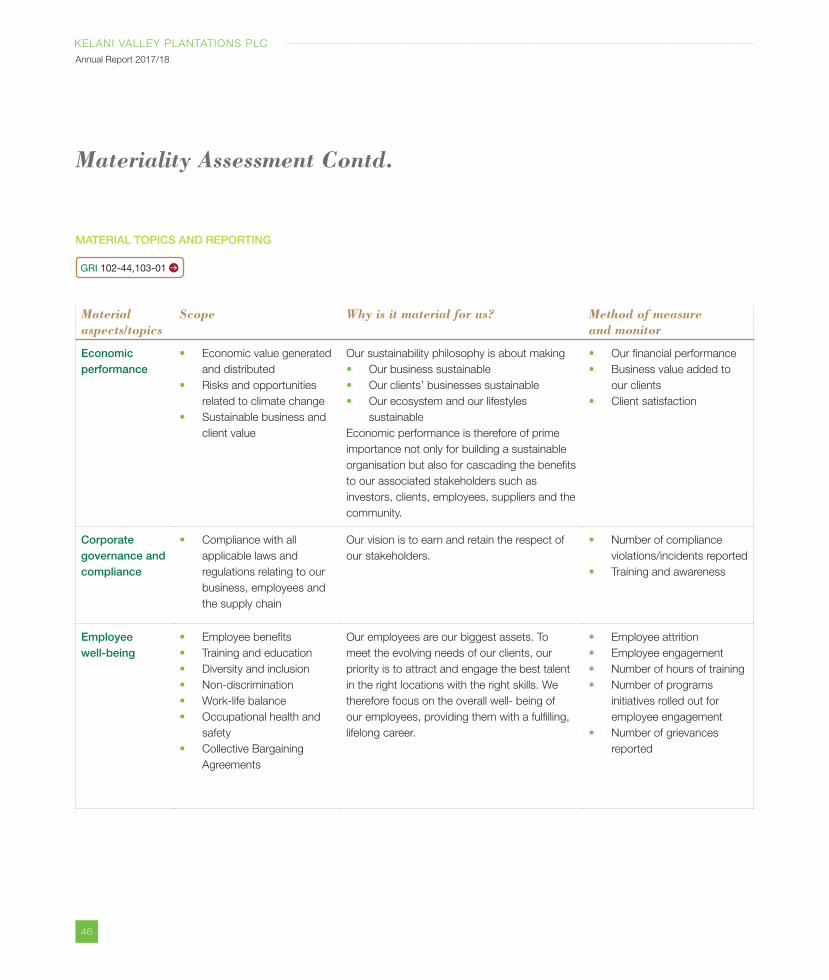
46
KELANI VALLEY PLANTATIONS PLC
Annual Report 2017/18
MATERIAL TOPICS AND REPORTING
GRI 102-44,103-01
Material aspects/topics
Scope Why is it material for us? Method of measureand monitor
Economic performance
Economic value generated
and distributed
Risks and opportunities
related to climate change
Sustainable business and
client value
Our sustainability philosophy is about making
Our business sustainable
Our clients’ businesses sustainable
Our ecosystem and our lifestyles
sustainable
Economic performance is therefore of prime
importance not only for building a sustainable
organisation but also for cascading the benefits
to our associated stakeholders such as
investors, clients, employees, suppliers and the
community.
Our financial performance
Business value added to
our clients
Client satisfaction
Corporate governance and compliance
Compliance with all
applicable laws and
regulations relating to our
business, employees and
the supply chain
Our vision is to earn and retain the respect of
our stakeholders.
Number of compliance
violations/incidents reported
Training and awareness
Employee well-being
Employee benefits
Training and education
Diversity and inclusion
Non-discrimination
Work-life balance
Occupational health and
safety
Collective Bargaining
Agreements
Our employees are our biggest assets. To
meet the evolving needs of our clients, our
priority is to attract and engage the best talent
in the right locations with the right skills. We
therefore focus on the overall well- being of
our employees, providing them with a fulfilling,
lifelong career.
Employee attrition
Employee engagement
Number of hours of training
Number of programs
initiatives rolled out for
employee engagement
Number of grievances
reported
Materiality Assessment Contd.
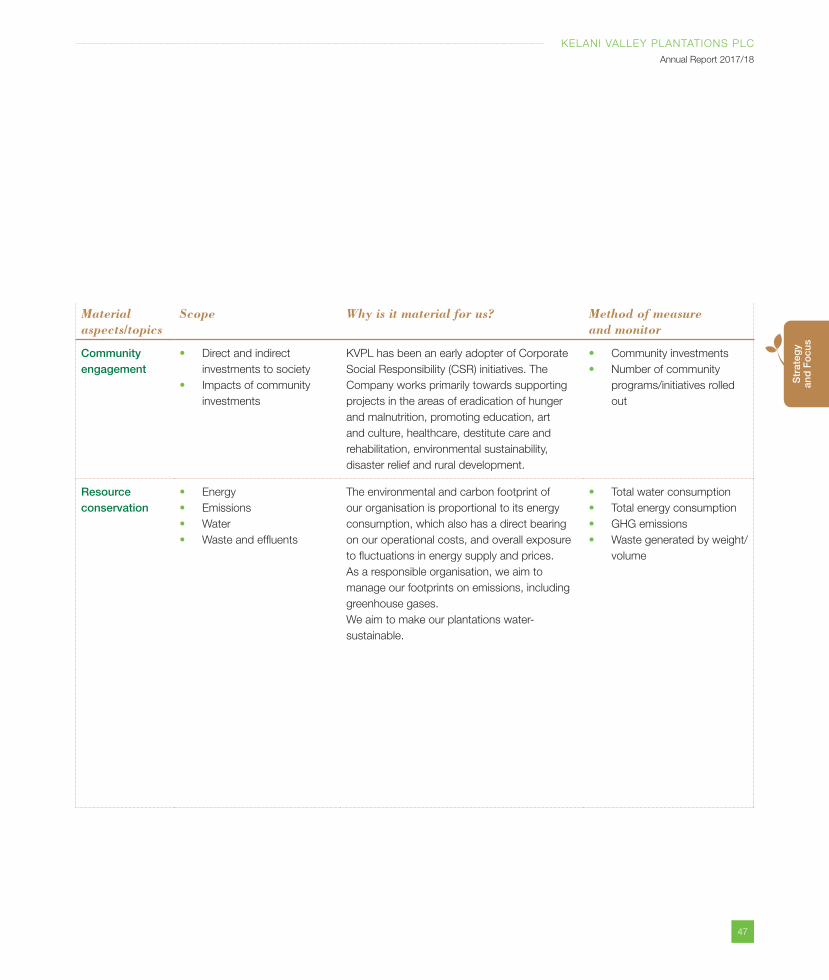
47
KELANI VALLEY PLANTATIONS PLC
Annual Report 2017/18
Str
ateg
y an
d F
ocu
s
Material aspects/topics
Scope Why is it material for us? Method of measureand monitor
Community engagement
Direct and indirect
investments to society
Impacts of community
investments
KVPL has been an early adopter of Corporate
Social Responsibility (CSR) initiatives. The
Company works primarily towards supporting
projects in the areas of eradication of hunger
and malnutrition, promoting education, art
and culture, healthcare, destitute care and
rehabilitation, environmental sustainability,
disaster relief and rural development.
Community investments
Number of community
programs/initiatives rolled
out
Resource conservation
Energy
Emissions
Water
Waste and effluents
The environmental and carbon footprint of
our organisation is proportional to its energy
consumption, which also has a direct bearing
on our operational costs, and overall exposure
to fluctuations in energy supply and prices.
As a responsible organisation, we aim to
manage our footprints on emissions, including
greenhouse gases.
We aim to make our plantations water-
sustainable.
Total water consumption
Total energy consumption
GHG emissions
Waste generated by weight/
volume
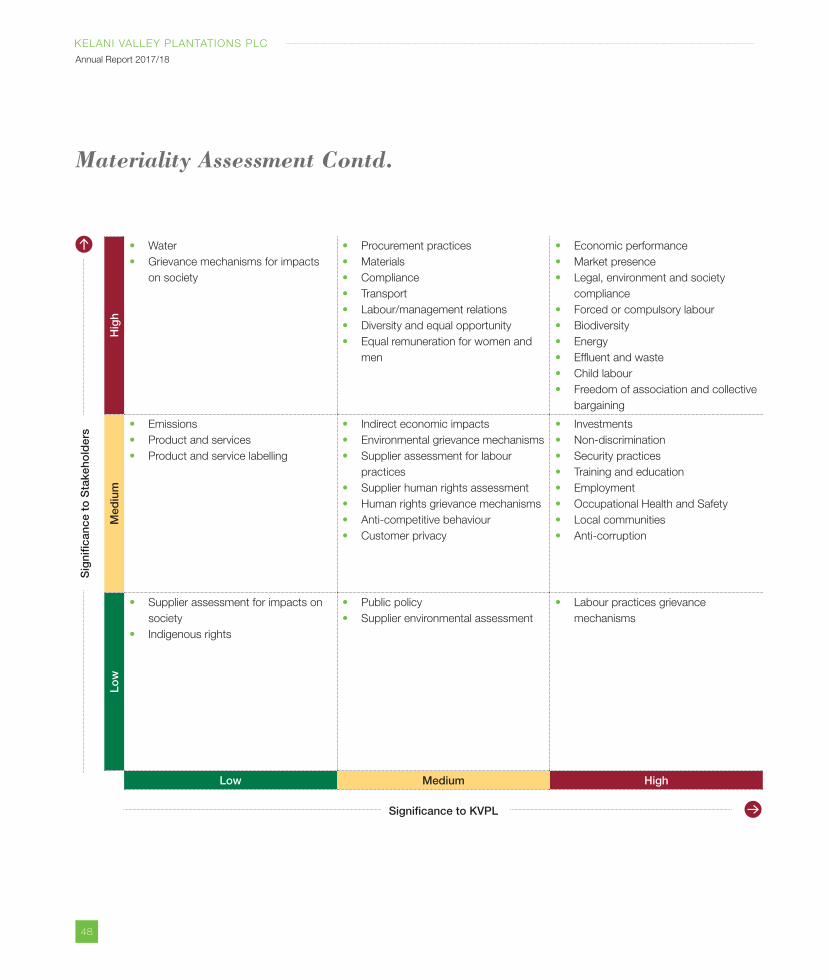
48
KELANI VALLEY PLANTATIONS PLC
Annual Report 2017/18
Sig
nific
ance
to
Sta
keho
lder
s
Hig
h
Water
Grievance mechanisms for impacts
on society
Procurement practices
Materials
Compliance
Transport
Labour/management relations
Diversity and equal opportunity
Equal remuneration for women and
men
Economic performance
Market presence
Legal, environment and society
compliance
Forced or compulsory labour
Biodiversity
Energy
Effluent and waste
Child labour
Freedom of association and collective
bargaining
Med
ium
Emissions
Product and services
Product and service labelling
Indirect economic impacts
Environmental grievance mechanisms
Supplier assessment for labour
practices
Supplier human rights assessment
Human rights grievance mechanisms
Anti-competitive behaviour
Customer privacy
Investments
Non-discrimination
Security practices
Training and education
Employment
Occupational Health and Safety
Local communities
Anti-corruption
Low
Supplier assessment for impacts on
society
Indigenous rights
Public policy
Supplier environmental assessment
Labour practices grievance
mechanisms
Low Medium High
Significance to KVPL
Materiality Assessment Contd.
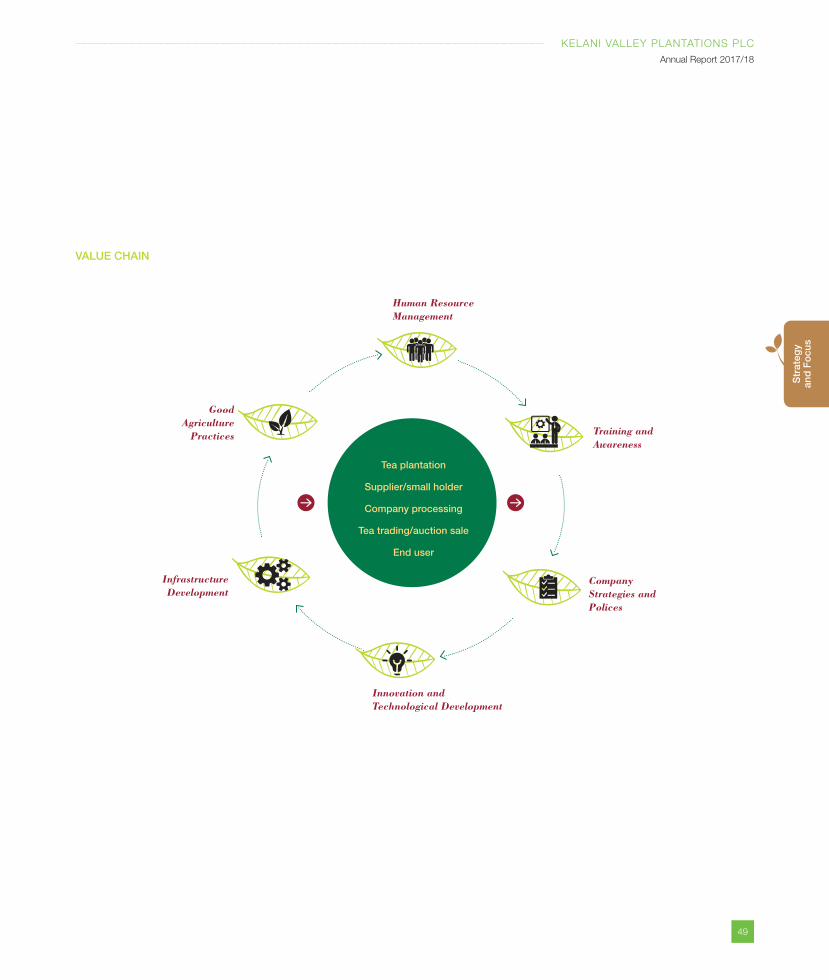
49
KELANI VALLEY PLANTATIONS PLC
Annual Report 2017/18
Str
ateg
y an
d F
ocu
s
VALUE CHAIN
Human Resource Management
Training and Awareness
Good Agriculture
Practices
Company Strategies and Polices
Infrastructure Development
Innovation and Technological Development
Tea plantation
Supplier/small holder
Company processing
End user
Tea trading/auction sale
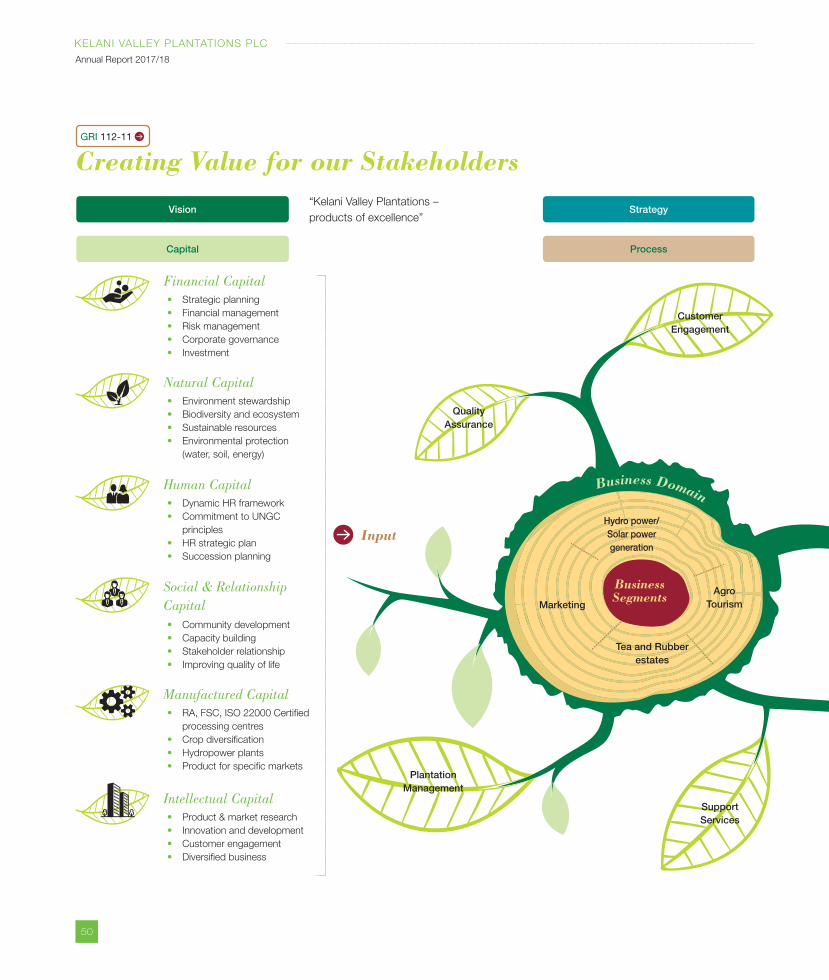
50
KELANI VALLEY PLANTATIONS PLC
Annual Report 2017/18
GRI 112-11
Creating Value for our Stakeholders
Quality Assurance
Customer Engagement
Process
Financial Capital
Natural Capital
Human Capital
Manufactured Capital
Intellectual Capital
Social & Relationship
Capital
Strategic planning
Financial management
Risk management
Corporate governance
Investment
Environment stewardship
Biodiversity and ecosystem
Sustainable resources
Environmental protection
(water, soil, energy)
Dynamic HR framework
Commitment to UNGC
principles
HR strategic plan
Succession planning
RA, FSC, ISO 22000 Certified
processing centres
Crop diversification
Hydropower plants
Product for specific markets
Product & market research
Innovation and development
Customer engagement
Diversified business
Community development
Capacity building
Stakeholder relationship
Improving quality of life
Capital
StrategyVision“Kelani Valley Plantations –
products of excellence”
Input
Support Services
Plantation Management
Business Domain
Business Segments Agro
Tourism
Hydro power/ Solar power generation
Marketing
Tea and Rubber estates
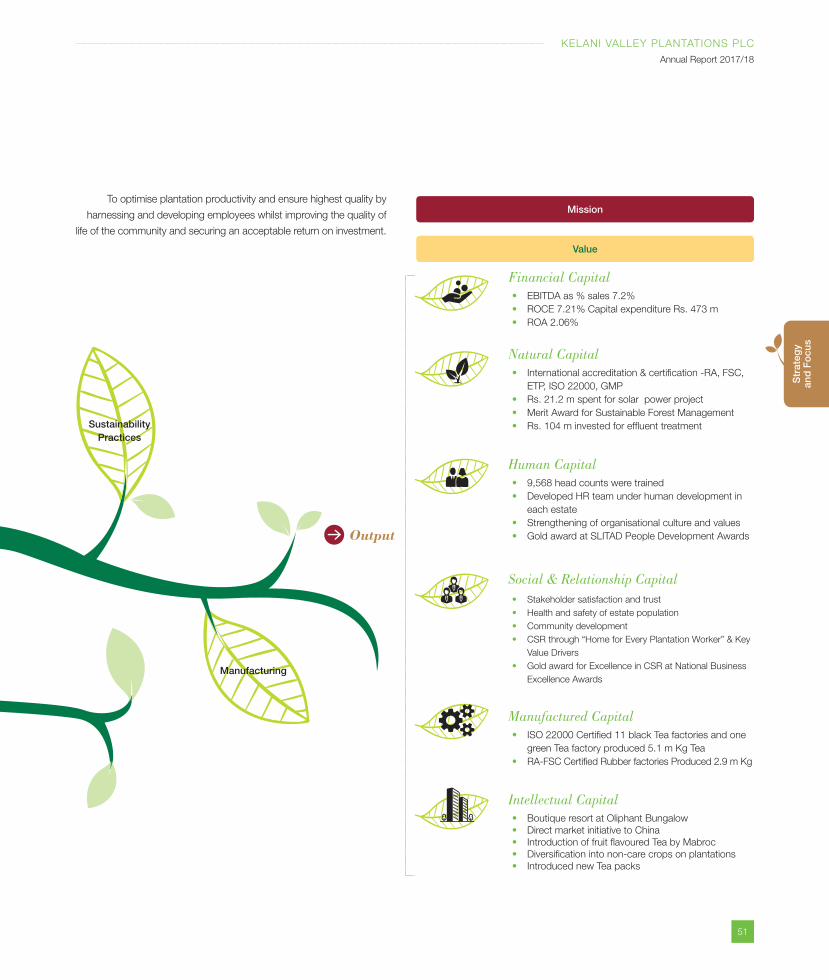
51
KELANI VALLEY PLANTATIONS PLC
Annual Report 2017/18
Str
ateg
y an
d F
ocu
s
Financial Capital
Natural Capital
Human Capital
Manufactured Capital
Intellectual Capital
Social & Relationship Capital
EBITDA as % sales 7.2%
ROCE 7.21% Capital expenditure Rs. 473 m
ROA 2.06%
International accreditation & certification -RA, FSC,
ETP, ISO 22000, GMP
Rs. 21.2 m spent for solar power project
Merit Award for Sustainable Forest Management
Rs. 104 m invested for effluent treatment
9,568 head counts were trained
Developed HR team under human development in
each estate
Strengthening of organisational culture and values
Gold award at SLITAD People Development Awards
ISO 22000 Certified 11 black Tea factories and one
green Tea factory produced 5.1 m Kg Tea
RA-FSC Certified Rubber factories Produced 2.9 m Kg
Boutique resort at Oliphant Bungalow
Direct market initiative to China
Introduction of fruit flavoured Tea by Mabroc
Diversification into non-care crops on plantations
Introduced new Tea packs
Stakeholder satisfaction and trust
Health and safety of estate population
Community development
CSR through “Home for Every Plantation Worker” & Key
Value Drivers
Gold award for Excellence in CSR at National Business
Excellence Awards
Value
Mission
Output
Sustainability Practices
Manufacturing
To optimise plantation productivity and ensure highest quality by
harnessing and developing employees whilst improving the quality of
life of the community and securing an acceptable return on investment.
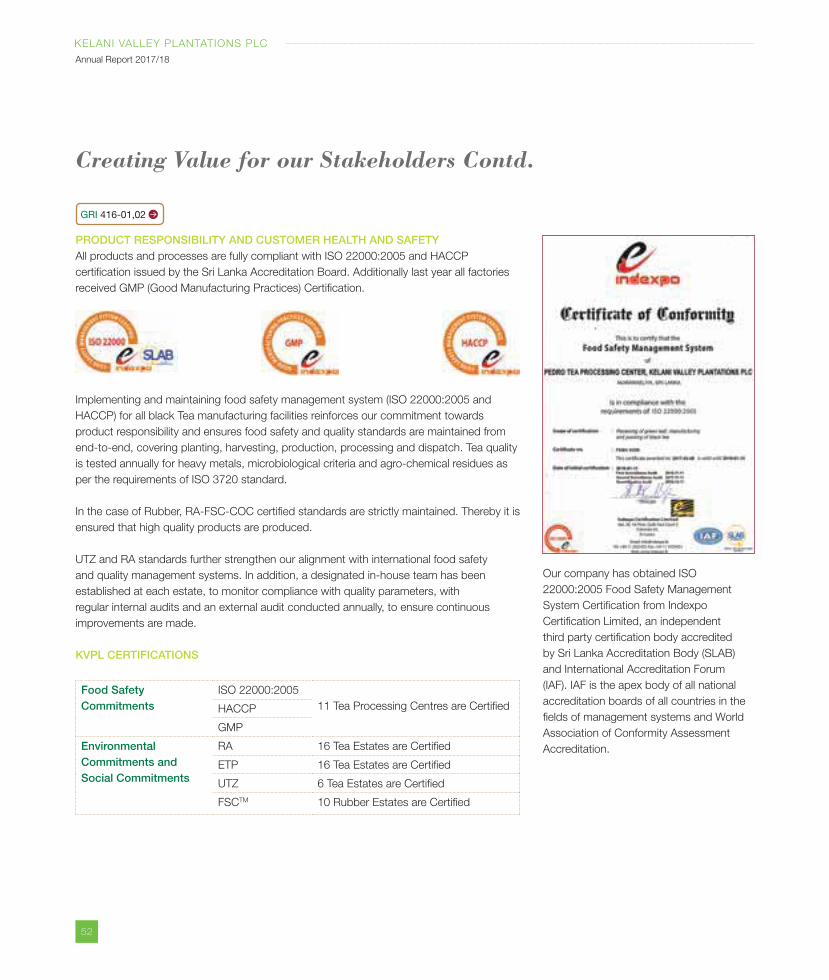
52
KELANI VALLEY PLANTATIONS PLC
Annual Report 2017/18
PRODUCT RESPONSIBILITY AND CUSTOMER HEALTH AND SAFETYAll products and processes are fully compliant with ISO 22000:2005 and HACCP
certification issued by the Sri Lanka Accreditation Board. Additionally last year all factories
received GMP (Good Manufacturing Practices) Certification.
Implementing and maintaining food safety management system (ISO 22000:2005 and
HACCP) for all black Tea manufacturing facilities reinforces our commitment towards
product responsibility and ensures food safety and quality standards are maintained from
end-to-end, covering planting, harvesting, production, processing and dispatch. Tea quality
is tested annually for heavy metals, microbiological criteria and agro-chemical residues as
per the requirements of ISO 3720 standard.
In the case of Rubber, RA-FSC-COC certified standards are strictly maintained. Thereby it is
ensured that high quality products are produced.
UTZ and RA standards further strengthen our alignment with international food safety
and quality management systems. In addition, a designated in-house team has been
established at each estate, to monitor compliance with quality parameters, with
regular internal audits and an external audit conducted annually, to ensure continuous
improvements are made.
KVPL CERTIFICATIONS
Food SafetyCommitments
ISO 22000:2005
11 Tea Processing Centres are Certified HACCP
GMP
Environmental Commitments andSocial Commitments
RA 16 Tea Estates are Certified
ETP 16 Tea Estates are Certified
UTZ 6 Tea Estates are Certified
FSCTM 10 Rubber Estates are Certified
Creating Value for our Stakeholders Contd.
Our company has obtained ISO
22000:2005 Food Safety Management
System Certification from Indexpo
Certification Limited, an independent
third party certification body accredited
by Sri Lanka Accreditation Body (SLAB)
and International Accreditation Forum
(IAF). IAF is the apex body of all national
accreditation boards of all countries in the
fields of management systems and World
Association of Conformity Assessment
Accreditation.
GRI 416-01,02
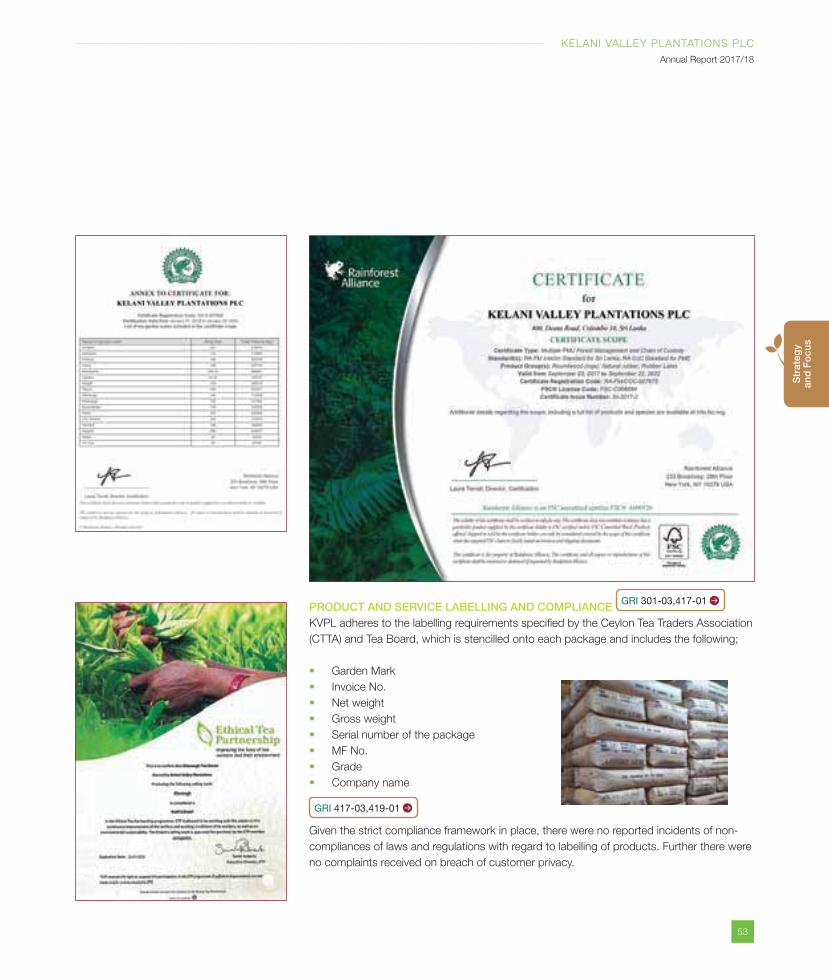
53
KELANI VALLEY PLANTATIONS PLC
Annual Report 2017/18
Str
ateg
y an
d F
ocu
s
PRODUCT AND SERVICE LABELLING AND COMPLIANCEKVPL adheres to the labelling requirements specified by the Ceylon Tea Traders Association
(CTTA) and Tea Board, which is stencilled onto each package and includes the following;
Garden Mark
Invoice No.
Net weight
Gross weight
Serial number of the package
MF No.
Grade
Company name
GRI 417-03,419-01
Given the strict compliance framework in place, there were no reported incidents of non-
compliances of laws and regulations with regard to labelling of products. Further there were
no complaints received on breach of customer privacy.
GRI 301-03,417-01
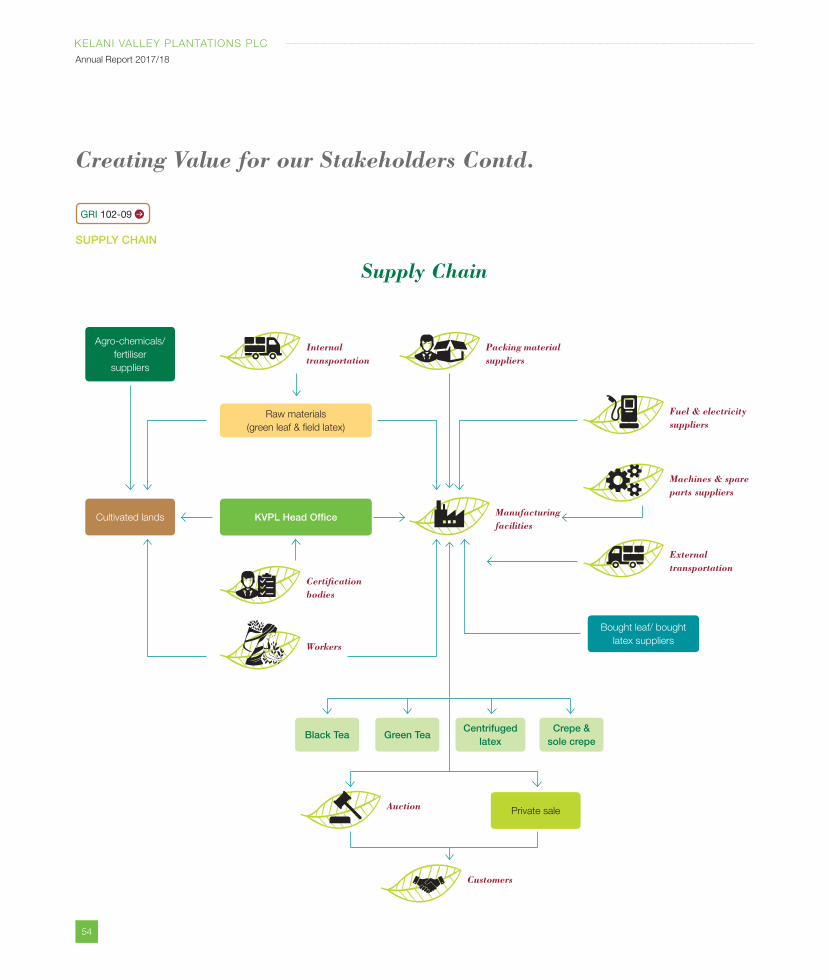
54
KELANI VALLEY PLANTATIONS PLC
Annual Report 2017/18
SUPPLY CHAIN
Creating Value for our Stakeholders Contd.
Supply Chain
Agro-chemicals/
fertiliser
suppliers
Cultivated lands
Bought leaf/ bought
latex suppliers
Private sale
Raw materials
(green leaf & field latex)
KVPL Head Office
Black Tea Green TeaCentrifuged
latexCrepe &
sole crepe
Internal transportation
Certification bodies
Manufacturing facilities
Workers
Packing material suppliers
Auction
Customers
Fuel & electricity suppliers
Machines & spare parts suppliers
External transportation
GRI 102-09
55
KELANI VALLEY PLANTATIONS PLC
Annual Report 2017/18
Bus
ines
s R
evie
wTea
Sector Reviews
EXTERNAL ENVIRONMENTGlobal EconomySource: Global Economic Prospects (January 2018)
The global economy appears to have reached a turning point in 2017. Marking the
end of the two year slump in economic activity, the global economy experienced
what is believed to be a cyclical recovery in 2017, reflecting a rebound in investment,
manufacturing activity, and trade. This improvement comes against the backdrop of
benign global financing conditions, generally accommodative policies, rising confidence,
and firming commodity prices. According to data released by the Global Economic
GRI 102-15
Bus
ines
s R
evie
w
56
KELANI VALLEY PLANTATIONS PLC
Annual Report 2017/18
Prospects (January 2018) Report,
global GDP growth is estimated to have
picked up from 2.4% in 2016 to 3% in
2017, indicating it is on a clear path to
recovery. A further analysis reveals that
advanced economies are estimated to
have rebounded strongly, driven by a
pickup in capital spending, a turnaround
in inventories, and strengthening external
demand. Notably, while growth appears to
have accelerated in all major economies
in 2017, the improvement was markedly
stronger than expected in the Euro area.
According to the report, growth among
EMDEs (Emerging Market and Developing
Economies) in 2017 is estimated to have
accelerated at a much faster pace of 4.3%,
reflecting firming activity in commodity
exporters and continued solid growth in
commodity importers, with most EMDE
regions seemingly benefiting from a
recovery in exports.
Sri Lankan EconomySource: CBSL
As per official data released by the
Department of Census and Statistics
(DCS), Sri Lanka’s real GDP growth
decelerated further during 2017 to 3.1
per cent, from the growth of 4.5 per cent
recorded in 2016. Agriculture related
activities recorded a contraction of 0.8
per cent against the backdrop of adverse
weather conditions that continued from
2016, while a slowdown in economic
activity in both the services and industrial
sectors was observed.
Industry related activities, accounting for
26.8 per cent of real GDP, grew by 3.9
per cent in 2017. The growth in industrial
activities was primarily supported by
manufacturing activities, construction
activities, and mining and quarrying.
Services activities, which accounted for 56.8
per cent of real GDP, grew by 3.2 per cent
in 2017, on a year-on-year basis, driven by
the expansion in financial service activities,
wholesale and retail trade, and other
personal service activities. Both investment
and consumption expenditure also
contributed to the expansion in economic
activities, while net exports continued to
weigh down the growth momentum.
UnemploymentThe unemployment rate declined to 4.2%
during 2017 from 4.4% in 2016. Notably
however, although the unemployment
rate declined, the total number of
unemployed persons increased marginally
during the first half of the year with high
unemployment seen among youth and
educationally qualified.
Inflation Headline inflation, measured using the
National Consumer Price Index as well
as the Colombo Consumer Price Index
remained high during the first quarter of
2017, impacted by supply side disruptions
resulting from adverse weather conditions as
well as the effect of upward tax revisions. A
moderation in inflation was observed during
the second quarter of 2017, underpinned by
improvements in supply conditions and the
Government’s initiatives to import essential
food items. However, a reversal of this trend
was seen from August 2017 mainly due to
a sharp acceleration in volatile food inflation
given continued adverse weather conditions.
Accordingly, headline inflation increased to
8.6%, year-on-year, in September 2017,
mainly reflecting the high food inflation while
CCPI based headline inflation also increased
to 7.1%, year-on-year.
Interest RatesThe CBSL continued to maintain a tight
monetary policy stance in the first nine
months of 2017 in view of the developments
in inflation as well as monetary and credit
aggregates. In response to the monetary
policy stance maintained by the Central
Bank and the high financing requirement
of the Government budget, most market
interest rates moved upwards during the
first nine months of 2017. Consequently
lending rates of commercial banks also
increased before finally stabilising at high
levels by end September 2017.
External SectorReversing the lacklustre performance
experienced during the past two years,
exports recovered from about March 2017,
with the gradual pick up in export earnings
helping to contain further expansion of the
trade deficit in the first eight months of 2017.
The gradual recovery in key export markets,
higher commodity prices in international
markets, the restoration of the GSP+
concessions from the European Union,
conducive external trade policies together
with institutional support and a more
competitive exchange rate, all contributed
towards the increase in export earnings.
CurrenciesImprovements in the external sector
enabled the CBSL to implement a more
Sector Reviews Contd.
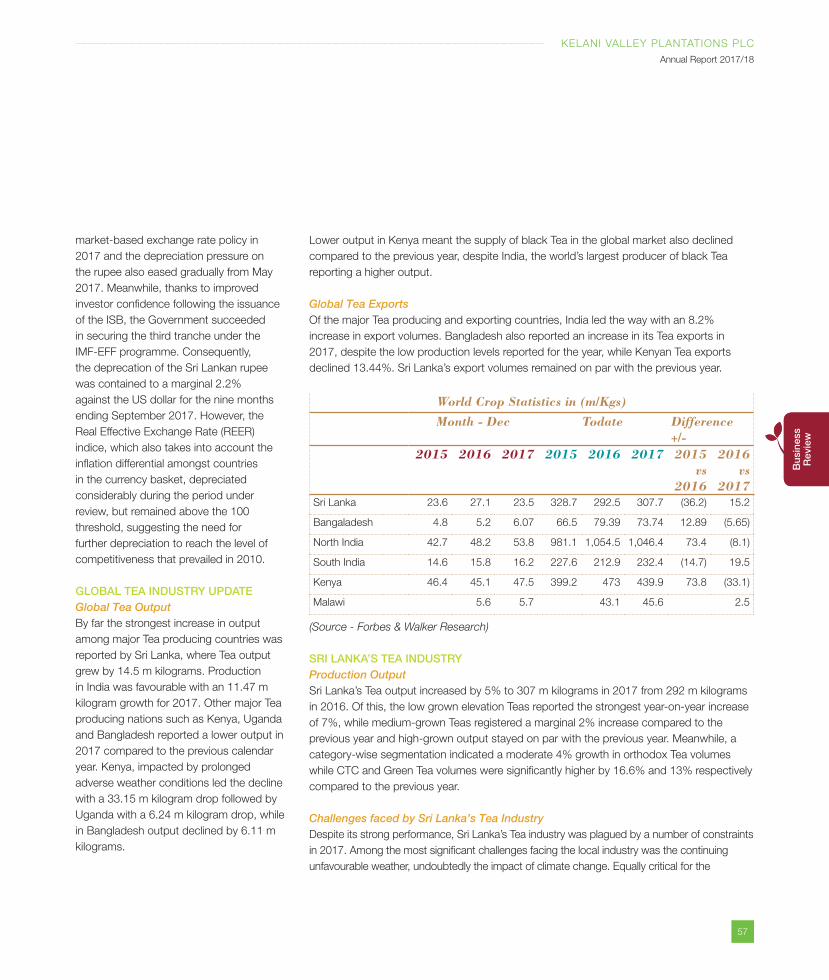
57
KELANI VALLEY PLANTATIONS PLC
Annual Report 2017/18
Bus
ines
s R
evie
wB
usin
ess
Rev
iew
market-based exchange rate policy in
2017 and the depreciation pressure on
the rupee also eased gradually from May
2017. Meanwhile, thanks to improved
investor confidence following the issuance
of the ISB, the Government succeeded
in securing the third tranche under the
IMF-EFF programme. Consequently,
the deprecation of the Sri Lankan rupee
was contained to a marginal 2.2%
against the US dollar for the nine months
ending September 2017. However, the
Real Effective Exchange Rate (REER)
indice, which also takes into account the
inflation differential amongst countries
in the currency basket, depreciated
considerably during the period under
review, but remained above the 100
threshold, suggesting the need for
further depreciation to reach the level of
competitiveness that prevailed in 2010.
GLOBAL TEA INDUSTRY UPDATEGlobal Tea OutputBy far the strongest increase in output
among major Tea producing countries was
reported by Sri Lanka, where Tea output
grew by 14.5 m kilograms. Production
in India was favourable with an 11.47 m
kilogram growth for 2017. Other major Tea
producing nations such as Kenya, Uganda
and Bangladesh reported a lower output in
2017 compared to the previous calendar
year. Kenya, impacted by prolonged
adverse weather conditions led the decline
with a 33.15 m kilogram drop followed by
Uganda with a 6.24 m kilogram drop, while
in Bangladesh output declined by 6.11 m
kilograms.
Lower output in Kenya meant the supply of black Tea in the global market also declined
compared to the previous year, despite India, the world’s largest producer of black Tea
reporting a higher output.
Global Tea ExportsOf the major Tea producing and exporting countries, India led the way with an 8.2%
increase in export volumes. Bangladesh also reported an increase in its Tea exports in
2017, despite the low production levels reported for the year, while Kenyan Tea exports
declined 13.44%. Sri Lanka’s export volumes remained on par with the previous year.
World Crop Statistics in (m/Kgs)
Month - Dec Todate Difference +/-
2015 2016 2017 2015 2016 2017 2015vs
2016
2016 vs
2017Sri Lanka 23.6 27.1 23.5 328.7 292.5 307.7 (36.2) 15.2
Bangaladesh 4.8 5.2 6.07 66.5 79.39 73.74 12.89 (5.65)
North India 42.7 48.2 53.8 981.1 1,054.5 1,046.4 73.4 (8.1)
South India 14.6 15.8 16.2 227.6 212.9 232.4 (14.7) 19.5
Kenya 46.4 45.1 47.5 399.2 473 439.9 73.8 (33.1)
Malawi 5.6 5.7 43.1 45.6 2.5
(Source - Forbes & Walker Research)
SRI LANKA’S TEA INDUSTRYProduction Output Sri Lanka’s Tea output increased by 5% to 307 m kilograms in 2017 from 292 m kilograms
in 2016. Of this, the low grown elevation Teas reported the strongest year-on-year increase
of 7%, while medium-grown Teas registered a marginal 2% increase compared to the
previous year and high-grown output stayed on par with the previous year. Meanwhile, a
category-wise segmentation indicated a moderate 4% growth in orthodox Tea volumes
while CTC and Green Tea volumes were significantly higher by 16.6% and 13% respectively
compared to the previous year.
Challenges faced by Sri Lanka’s Tea Industry Despite its strong performance, Sri Lanka’s Tea industry was plagued by a number of constraints
in 2017. Among the most significant challenges facing the local industry was the continuing
unfavourable weather, undoubtedly the impact of climate change. Equally critical for the
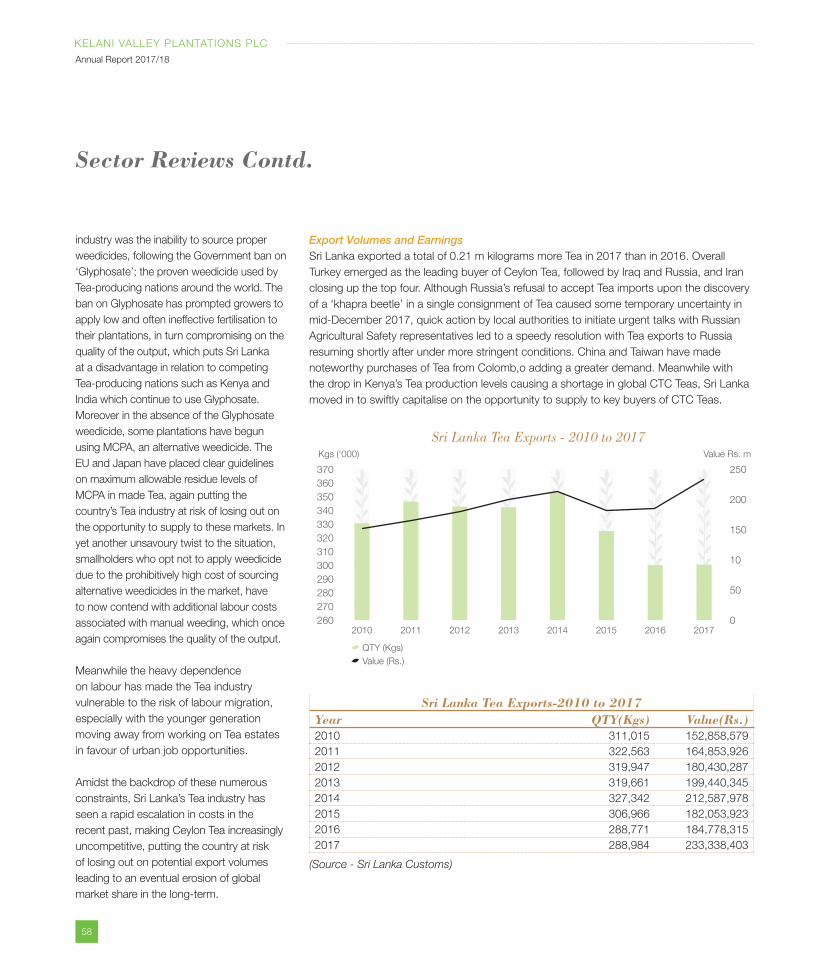
58
KELANI VALLEY PLANTATIONS PLC
Annual Report 2017/18
industry was the inability to source proper
weedicides, following the Government ban on
‘Glyphosate’; the proven weedicide used by
Tea-producing nations around the world. The
ban on Glyphosate has prompted growers to
apply low and often ineffective fertilisation to
their plantations, in turn compromising on the
quality of the output, which puts Sri Lanka
at a disadvantage in relation to competing
Tea-producing nations such as Kenya and
India which continue to use Glyphosate.
Moreover in the absence of the Glyphosate
weedicide, some plantations have begun
using MCPA, an alternative weedicide. The
EU and Japan have placed clear guidelines
on maximum allowable residue levels of
MCPA in made Tea, again putting the
country’s Tea industry at risk of losing out on
the opportunity to supply to these markets. In
yet another unsavoury twist to the situation,
smallholders who opt not to apply weedicide
due to the prohibitively high cost of sourcing
alternative weedicides in the market, have
to now contend with additional labour costs
associated with manual weeding, which once
again compromises the quality of the output.
Meanwhile the heavy dependence
on labour has made the Tea industry
vulnerable to the risk of labour migration,
especially with the younger generation
moving away from working on Tea estates
in favour of urban job opportunities.
Amidst the backdrop of these numerous
constraints, Sri Lanka’s Tea industry has
seen a rapid escalation in costs in the
recent past, making Ceylon Tea increasingly
uncompetitive, putting the country at risk
of losing out on potential export volumes
leading to an eventual erosion of global
market share in the long-term.
Export Volumes and EarningsSri Lanka exported a total of 0.21 m kilograms more Tea in 2017 than in 2016. Overall
Turkey emerged as the leading buyer of Ceylon Tea, followed by Iraq and Russia, and Iran
closing up the top four. Although Russia’s refusal to accept Tea imports upon the discovery
of a ‘khapra beetle’ in a single consignment of Tea caused some temporary uncertainty in
mid-December 2017, quick action by local authorities to initiate urgent talks with Russian
Agricultural Safety representatives led to a speedy resolution with Tea exports to Russia
resuming shortly after under more stringent conditions. China and Taiwan have made
noteworthy purchases of Tea from Colomb,o adding a greater demand. Meanwhile with
the drop in Kenya’s Tea production levels causing a shortage in global CTC Teas, Sri Lanka
moved in to swiftly capitalise on the opportunity to supply to key buyers of CTC Teas.
Sri Lanka Tea Exports - 2010 to 2017Kgs (‘000) Value Rs. m
300
330
200
370
360
250
320
350
310
340
290
150
270
50
260 0
280
10
2010 2011 20142012 20152013 2016 2017
QTY (Kgs)
Value (Rs.)
Sector Reviews Contd.
Sri Lanka Tea Exports-2010 to 2017Year QTY(Kgs) Value(Rs.)2010 311,015 152,858,579
2011 322,563 164,853,926
2012 319,947 180,430,287
2013 319,661 199,440,345
2014 327,342 212,587,978
2015 306,966 182,053,923
2016 288,771 184,778,315
2017 288,984 233,338,403
(Source - Sri Lanka Customs)
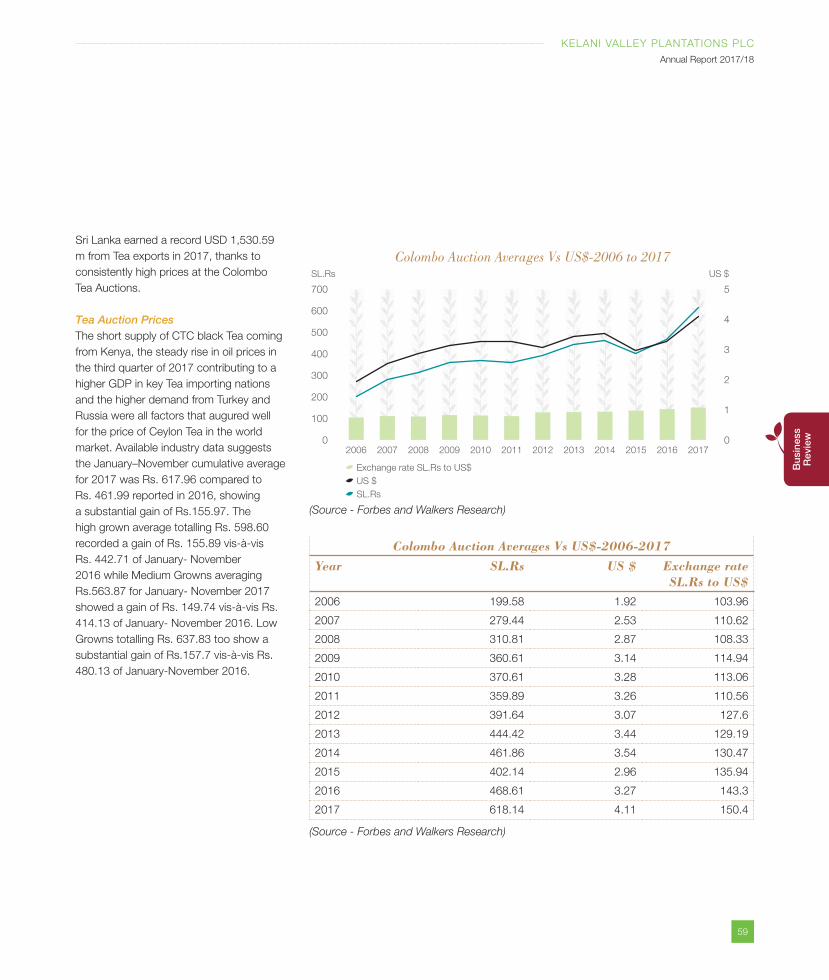
59
KELANI VALLEY PLANTATIONS PLC
Annual Report 2017/18
Bus
ines
s R
evie
w
Sri Lanka earned a record USD 1,530.59
m from Tea exports in 2017, thanks to
consistently high prices at the Colombo
Tea Auctions.
Tea Auction PricesThe short supply of CTC black Tea coming
from Kenya, the steady rise in oil prices in
the third quarter of 2017 contributing to a
higher GDP in key Tea importing nations
and the higher demand from Turkey and
Russia were all factors that augured well
for the price of Ceylon Tea in the world
market. Available industry data suggests
the January–November cumulative average
for 2017 was Rs. 617.96 compared to
Rs. 461.99 reported in 2016, showing
a substantial gain of Rs.155.97. The
high grown average totalling Rs. 598.60
recorded a gain of Rs. 155.89 vis-à-vis
Rs. 442.71 of January- November
2016 while Medium Growns averaging
Rs.563.87 for January- November 2017
showed a gain of Rs. 149.74 vis-à-vis Rs.
414.13 of January- November 2016. Low
Growns totalling Rs. 637.83 too show a
substantial gain of Rs.157.7 vis-à-vis Rs.
480.13 of January-November 2016.
Colombo Auction Averages Vs US$-2006 to 2017SL.Rs US $
400
4
700 5
600
500
300
3
1001
0 0
200
2
2006 20102007 2011 20142008 2012 20152009 2013 2016 2017
Exchange rate SL.Rs to US$
US $
SL.Rs
Colombo Auction Averages Vs US$-2006-2017Year SL.Rs US $ Exchange rate
SL.Rs to US$2006 199.58 1.92 103.96
2007 279.44 2.53 110.62
2008 310.81 2.87 108.33
2009 360.61 3.14 114.94
2010 370.61 3.28 113.06
2011 359.89 3.26 110.56
2012 391.64 3.07 127.6
2013 444.42 3.44 129.19
2014 461.86 3.54 130.47
2015 402.14 2.96 135.94
2016 468.61 3.27 143.3
2017 618.14 4.11 150.4
(Source - Forbes and Walkers Research)
(Source - Forbes and Walkers Research)
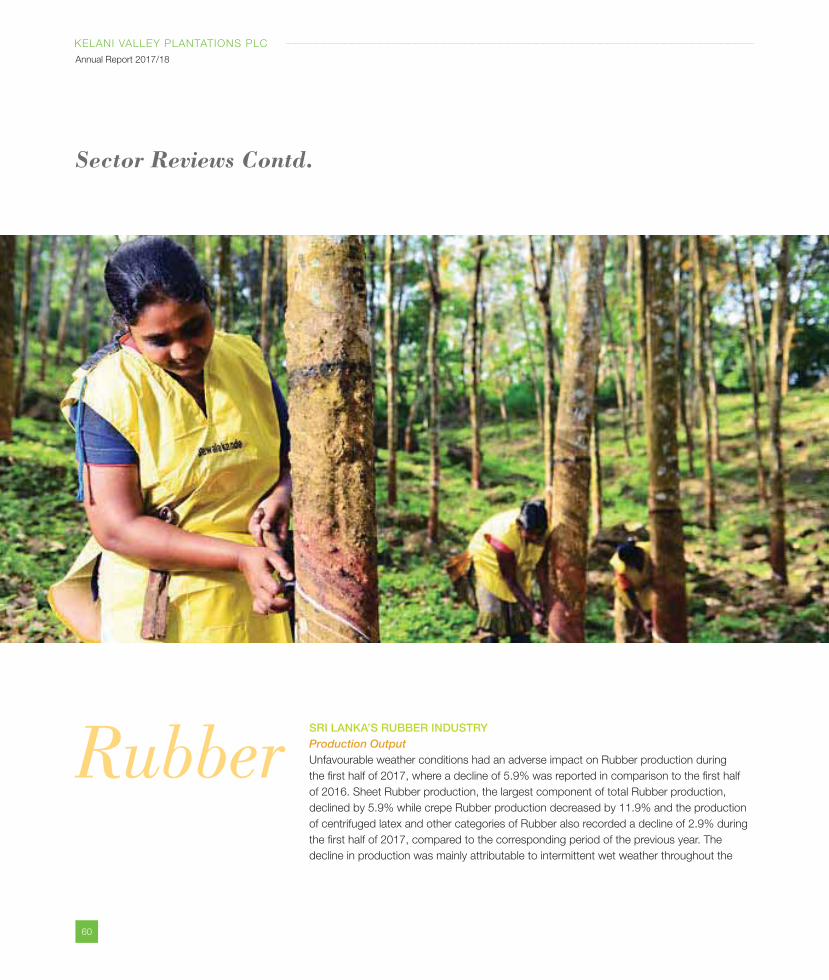
60
KELANI VALLEY PLANTATIONS PLC
Annual Report 2017/18
RubberSRI LANKA’S RUBBER INDUSTRYProduction OutputUnfavourable weather conditions had an adverse impact on Rubber production during
the first half of 2017, where a decline of 5.9% was reported in comparison to the first half
of 2016. Sheet Rubber production, the largest component of total Rubber production,
declined by 5.9% while crepe Rubber production decreased by 11.9% and the production
of centrifuged latex and other categories of Rubber also recorded a decline of 2.9% during
the first half of 2017, compared to the corresponding period of the previous year. The
decline in production was mainly attributable to intermittent wet weather throughout the
Sector Reviews Contd.
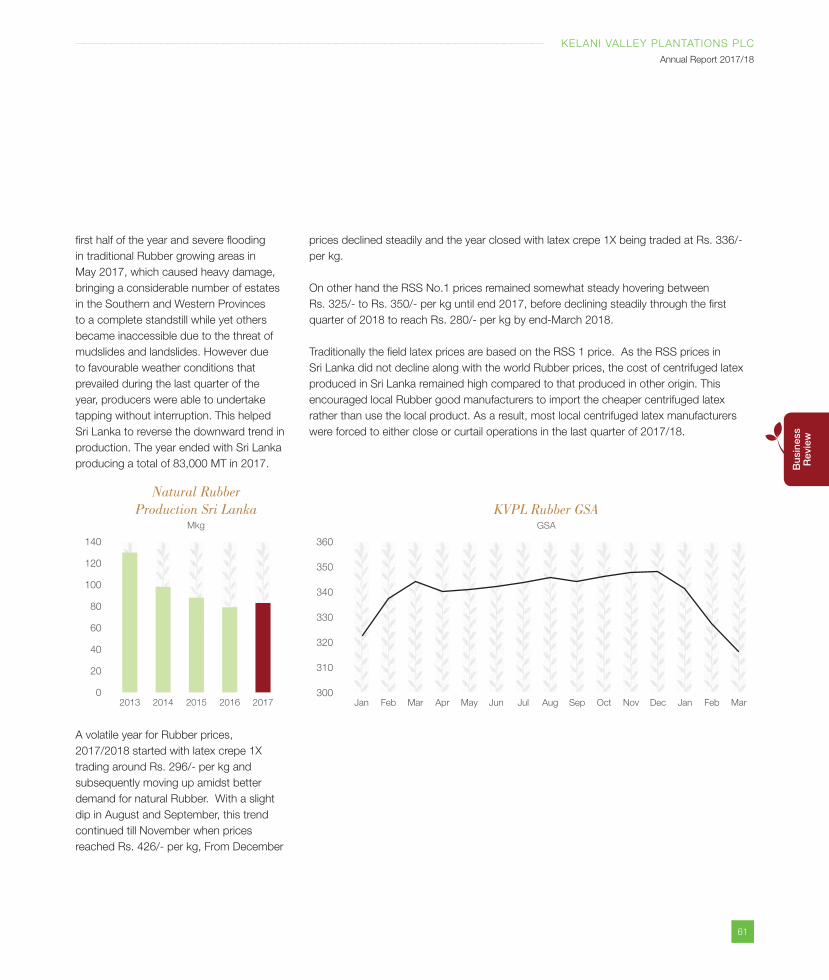
61
KELANI VALLEY PLANTATIONS PLC
Annual Report 2017/18
Bus
ines
s R
evie
w
first half of the year and severe flooding
in traditional Rubber growing areas in
May 2017, which caused heavy damage,
bringing a considerable number of estates
in the Southern and Western Provinces
to a complete standstill while yet others
became inaccessible due to the threat of
mudslides and landslides. However due
to favourable weather conditions that
prevailed during the last quarter of the
year, producers were able to undertake
tapping without interruption. This helped
Sri Lanka to reverse the downward trend in
production. The year ended with Sri Lanka
producing a total of 83,000 MT in 2017.
A volatile year for Rubber prices,
2017/2018 started with latex crepe 1X
trading around Rs. 296/- per kg and
subsequently moving up amidst better
demand for natural Rubber. With a slight
dip in August and September, this trend
continued till November when prices
reached Rs. 426/- per kg, From December
Natural Rubber Production Sri Lanka
Mkg
40
140
80
100
60
0
20
2013 2014 2015 2016 2017
120
prices declined steadily and the year closed with latex crepe 1X being traded at Rs. 336/-
per kg.
On other hand the RSS No.1 prices remained somewhat steady hovering between
Rs. 325/- to Rs. 350/- per kg until end 2017, before declining steadily through the first
quarter of 2018 to reach Rs. 280/- per kg by end-March 2018.
Traditionally the field latex prices are based on the RSS 1 price. As the RSS prices in
Sri Lanka did not decline along with the world Rubber prices, the cost of centrifuged latex
produced in Sri Lanka remained high compared to that produced in other origin. This
encouraged local Rubber good manufacturers to import the cheaper centrifuged latex
rather than use the local product. As a result, most local centrifuged latex manufacturers
were forced to either close or curtail operations in the last quarter of 2017/18.
KVPL Rubber GSA
340
360
350
330
310
300
320
Jan JanMayFeb FebJun SepMar MarJul OctApr Aug Nov Dec
GSA
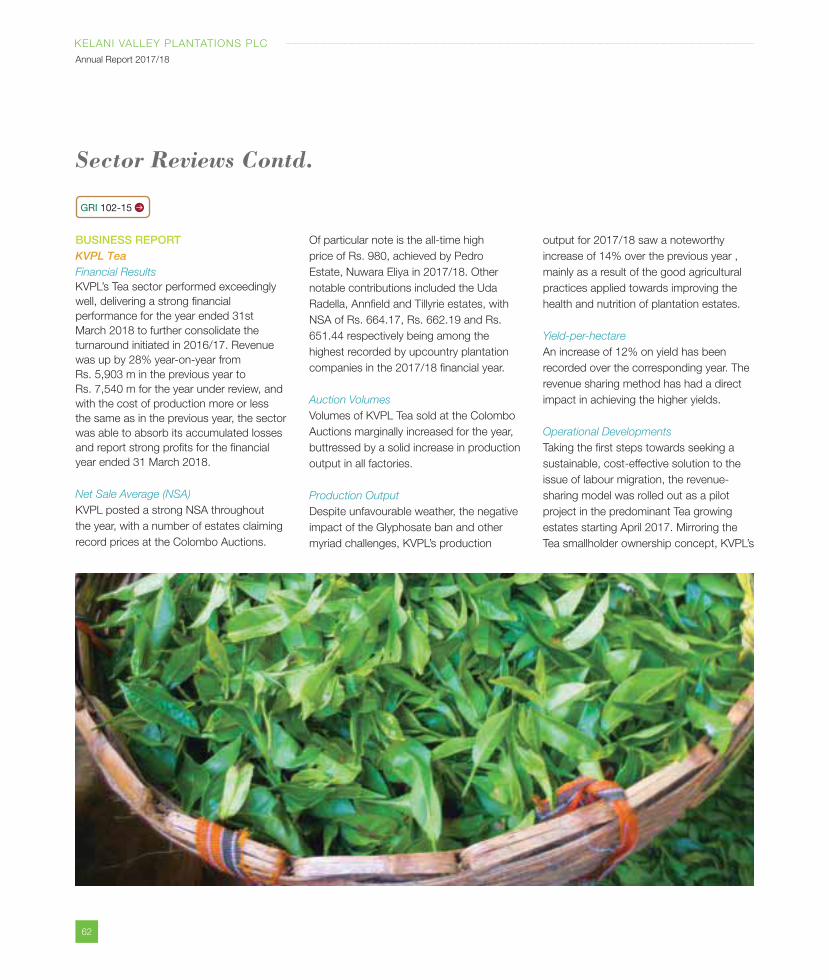
62
KELANI VALLEY PLANTATIONS PLC
Annual Report 2017/18
BUSINESS REPORTKVPL TeaFinancial Results
KVPL’s Tea sector performed exceedingly
well, delivering a strong financial
performance for the year ended 31st
March 2018 to further consolidate the
turnaround initiated in 2016/17. Revenue
was up by 28% year-on-year from
Rs. 5,903 m in the previous year to
Rs. 7,540 m for the year under review, and
with the cost of production more or less
the same as in the previous year, the sector
was able to absorb its accumulated losses
and report strong profits for the financial
year ended 31 March 2018.
Net Sale Average (NSA)
KVPL posted a strong NSA throughout
the year, with a number of estates claiming
record prices at the Colombo Auctions.
Of particular note is the all-time high
price of Rs. 980, achieved by Pedro
Estate, Nuwara Eliya in 2017/18. Other
notable contributions included the Uda
Radella, Annfield and Tillyrie estates, with
NSA of Rs. 664.17, Rs. 662.19 and Rs.
651.44 respectively being among the
highest recorded by upcountry plantation
companies in the 2017/18 financial year.
Auction Volumes
Volumes of KVPL Tea sold at the Colombo
Auctions marginally increased for the year,
buttressed by a solid increase in production
output in all factories.
Production Output
Despite unfavourable weather, the negative
impact of the Glyphosate ban and other
myriad challenges, KVPL’s production
output for 2017/18 saw a noteworthy
increase of 14% over the previous year ,
mainly as a result of the good agricultural
practices applied towards improving the
health and nutrition of plantation estates.
Yield-per-hectare
An increase of 12% on yield has been
recorded over the corresponding year. The
revenue sharing method has had a direct
impact in achieving the higher yields.
Operational Developments
Taking the first steps towards seeking a
sustainable, cost-effective solution to the
issue of labour migration, the revenue-
sharing model was rolled out as a pilot
project in the predominant Tea growing
estates starting April 2017. Mirroring the
Tea smallholder ownership concept, KVPL’s
Sector Reviews Contd.
GRI 102-15
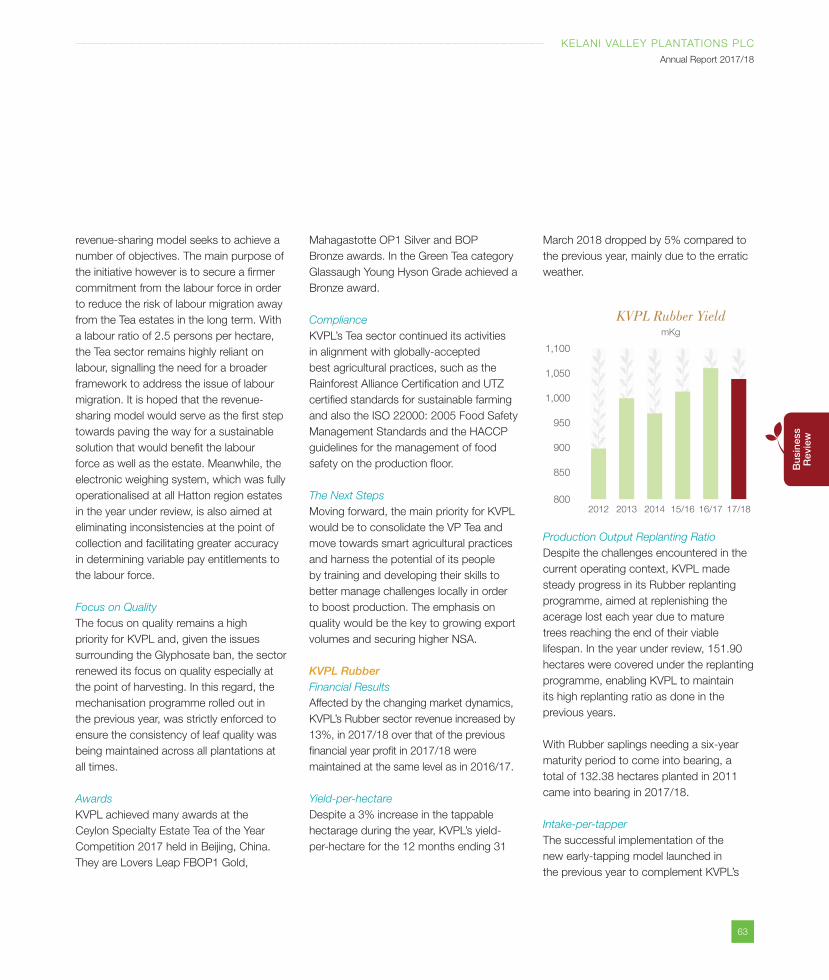
63
KELANI VALLEY PLANTATIONS PLC
Annual Report 2017/18
Bus
ines
s R
evie
w
March 2018 dropped by 5% compared to
the previous year, mainly due to the erratic
weather.
revenue-sharing model seeks to achieve a
number of objectives. The main purpose of
the initiative however is to secure a firmer
commitment from the labour force in order
to reduce the risk of labour migration away
from the Tea estates in the long term. With
a labour ratio of 2.5 persons per hectare,
the Tea sector remains highly reliant on
labour, signalling the need for a broader
framework to address the issue of labour
migration. It is hoped that the revenue-
sharing model would serve as the first step
towards paving the way for a sustainable
solution that would benefit the labour
force as well as the estate. Meanwhile, the
electronic weighing system, which was fully
operationalised at all Hatton region estates
in the year under review, is also aimed at
eliminating inconsistencies at the point of
collection and facilitating greater accuracy
in determining variable pay entitlements to
the labour force.
Focus on Quality
The focus on quality remains a high
priority for KVPL and, given the issues
surrounding the Glyphosate ban, the sector
renewed its focus on quality especially at
the point of harvesting. In this regard, the
mechanisation programme rolled out in
the previous year, was strictly enforced to
ensure the consistency of leaf quality was
being maintained across all plantations at
all times.
Awards
KVPL achieved many awards at the
Ceylon Specialty Estate Tea of the Year
Competition 2017 held in Beijing, China.
They are Lovers Leap FBOP1 Gold,
KVPL Rubber YieldmKg
900
1,100
1,000
1,050
950
800
850
2012 2013 2014 15/16 16/17 17/18
Mahagastotte OP1 Silver and BOP
Bronze awards. In the Green Tea category
Glassaugh Young Hyson Grade achieved a
Bronze award.
Compliance
KVPL’s Tea sector continued its activities
in alignment with globally-accepted
best agricultural practices, such as the
Rainforest Alliance Certification and UTZ
certified standards for sustainable farming
and also the ISO 22000: 2005 Food Safety
Management Standards and the HACCP
guidelines for the management of food
safety on the production floor.
The Next Steps
Moving forward, the main priority for KVPL
would be to consolidate the VP Tea and
move towards smart agricultural practices
and harness the potential of its people
by training and developing their skills to
better manage challenges locally in order
to boost production. The emphasis on
quality would be the key to growing export
volumes and securing higher NSA.
KVPL RubberFinancial Results
Affected by the changing market dynamics,
KVPL’s Rubber sector revenue increased by
13%, in 2017/18 over that of the previous
financial year profit in 2017/18 were
maintained at the same level as in 2016/17.
Yield-per-hectare
Despite a 3% increase in the tappable
hectarage during the year, KVPL’s yield-
per-hectare for the 12 months ending 31
Production Output Replanting Ratio
Despite the challenges encountered in the
current operating context, KVPL made
steady progress in its Rubber replanting
programme, aimed at replenishing the
acerage lost each year due to mature
trees reaching the end of their viable
lifespan. In the year under review, 151.90
hectares were covered under the replanting
programme, enabling KVPL to maintain
its high replanting ratio as done in the
previous years.
With Rubber saplings needing a six-year
maturity period to come into bearing, a
total of 132.38 hectares planted in 2011
came into bearing in 2017/18.
Intake-per-tapper
The successful implementation of the
new early-tapping model launched in
the previous year to complement KVPL’s
64
KELANI VALLEY PLANTATIONS PLC
Annual Report 2017/18
D2 tapping strategy saw tapper intakes
(Intake-per-tapper) increase by 6%, to
7.50 in the current year from 7.10 in the
previous year.
Operational Developments
Efforts to further improve tapper yields saw
the launch of a new pilot project to evaluate
the feasibility of using mechanised tapping
devices. If successful the device would not
only contribute towards increasing tapper
yields but also minimise physical damage
caused to the tree during the manual
tapping process.
Compliance
Despite the difficulties, KVPL’s Rubber
sector remained firmly committed to adhere
to globally-accepted best agricultural
practices, such as the Rainforest Alliance
Certified FSC standards for sustainable
farming.
The Next Steps
Higher intensity tapping methods with
stimulation tapped once every three or
four days would be carried in experimental
blocks. New fertiliser applicators have been
introduced to minimise the leeching of
fertiliser.
KVPL CinnamonFinancial Results
Cinnamon, KVPL’s third largest crop,
produced encouraging results for the year
under review, with revenue up by 331% to
Rs. 15,041,255/-, from the Rs. 4,831,916/-
tabled in the previous year. At present
over 95% of sales volumes are generated
through direct sales to local buyers, with
only 5% attributed to direct sales.
Area Coverage
KVPL’s Cinnamon plantation, which
commenced as a pilot project in 2010 to
plant 4.30 hectares of unused Rubber land
at the Kitulgala estate, has since converged
into a fully-fledged crop cultivation
programme. Having systematically
increased the cultivation of Cinnamon
over the past eight years, KVPL currently
holds approximately 115.25 hectares of
Cinnamon in our low country estates which
includes 43.52 hectares planted in the
2017/18 financial year.
The Next Steps
Moving forward, the focus would be to
expedite the cultivation of Cinnamon
targeting high-end value addition to cater
to the end user.
Cinnamon, KVPL’s third largest
crop, produced encouraging results for the year under
review, with revenue up by 331%
Sector Reviews Contd.
65
KELANI VALLEY PLANTATIONS PLC
Annual Report 2017/18
Cap
ital M
anag
emen
t R
epo
rts
With more than two decades of roots that have solidified our base, we are
springing into new ventures.
Growthit is the result of forces
working together- JAMES CASH PENNY -
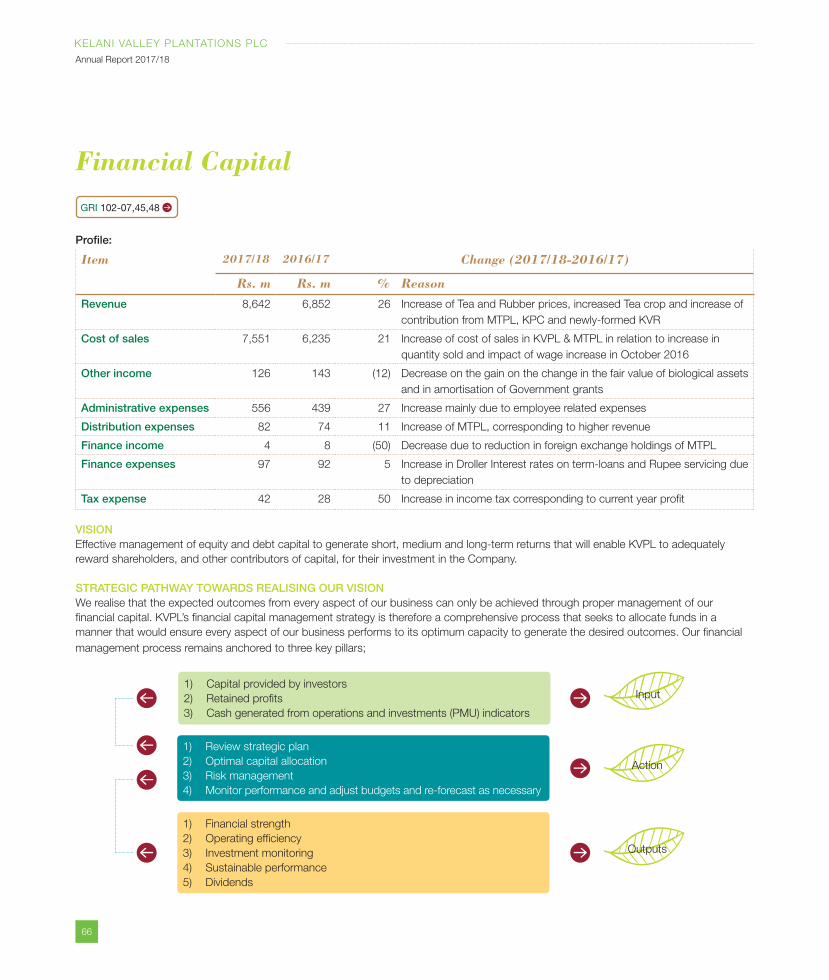
66
KELANI VALLEY PLANTATIONS PLC
Annual Report 2017/18
Financial CapitalGRI 102-07,45,48
Profile:
Item 2017/18 2016/17 Change (2017/18-2016/17)
Rs. m Rs. m % Reason
Revenue 8,642 6,852 26 Increase of Tea and Rubber prices, increased Tea crop and increase of
contribution from MTPL, KPC and newly-formed KVR
Cost of sales 7,551 6,235 21 Increase of cost of sales in KVPL & MTPL in relation to increase in
quantity sold and impact of wage increase in October 2016
Other income 126 143 (12) Decrease on the gain on the change in the fair value of biological assets
and in amortisation of Government grants
Administrative expenses 556 439 27 Increase mainly due to employee related expenses
Distribution expenses 82 74 11 Increase of MTPL, corresponding to higher revenue
Finance income 4 8 (50) Decrease due to reduction in foreign exchange holdings of MTPL
Finance expenses 97 92 5 Increase in Droller Interest rates on term-loans and Rupee servicing due
to depreciation
Tax expense 42 28 50 Increase in income tax corresponding to current year profit
VISIONEffective management of equity and debt capital to generate short, medium and long-term returns that will enable KVPL to adequately
reward shareholders, and other contributors of capital, for their investment in the Company.
STRATEGIC PATHWAY TOWARDS REALISING OUR VISIONWe realise that the expected outcomes from every aspect of our business can only be achieved through proper management of our
financial capital. KVPL’s financial capital management strategy is therefore a comprehensive process that seeks to allocate funds in a
manner that would ensure every aspect of our business performs to its optimum capacity to generate the desired outcomes. Our financial
management process remains anchored to three key pillars;
1) Financial strength
2) Operating efficiency
3) Investment monitoring
4) Sustainable performance
5) Dividends
1) Review strategic plan
2) Optimal capital allocation
3) Risk management
4) Monitor performance and adjust budgets and re-forecast as necessary
1) Capital provided by investors
2) Retained profits
3) Cash generated from operations and investments (PMU) indicators
Input
Action
Outputs
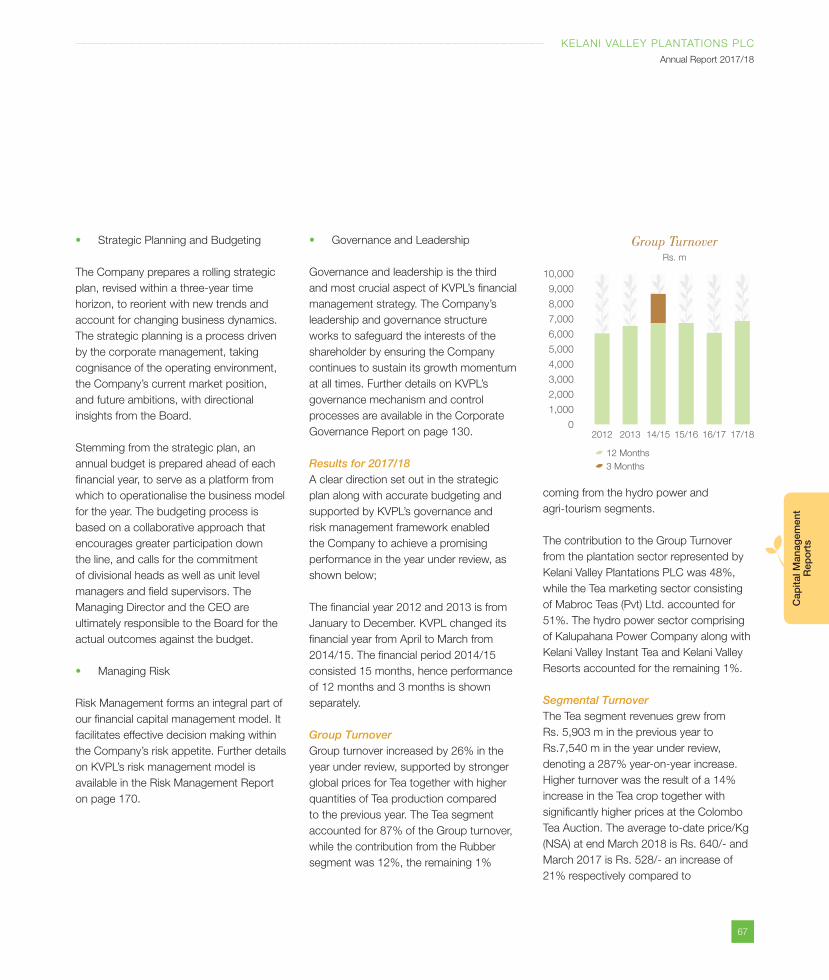
67
KELANI VALLEY PLANTATIONS PLC
Annual Report 2017/18
Cap
ital M
anag
emen
t R
epo
rts
Governance and Leadership
Governance and leadership is the third
and most crucial aspect of KVPL’s financial
management strategy. The Company’s
leadership and governance structure
works to safeguard the interests of the
shareholder by ensuring the Company
continues to sustain its growth momentum
at all times. Further details on KVPL’s
governance mechanism and control
processes are available in the Corporate
Governance Report on page 130.
Results for 2017/18A clear direction set out in the strategic
plan along with accurate budgeting and
supported by KVPL’s governance and
risk management framework enabled
the Company to achieve a promising
performance in the year under review, as
shown below;
The financial year 2012 and 2013 is from
January to December. KVPL changed its
financial year from April to March from
2014/15. The financial period 2014/15
consisted 15 months, hence performance
of 12 months and 3 months is shown
separately.
Group TurnoverGroup turnover increased by 26% in the
year under review, supported by stronger
global prices for Tea together with higher
quantities of Tea production compared
to the previous year. The Tea segment
accounted for 87% of the Group turnover,
while the contribution from the Rubber
segment was 12%, the remaining 1%
Strategic Planning and Budgeting
The Company prepares a rolling strategic
plan, revised within a three-year time
horizon, to reorient with new trends and
account for changing business dynamics.
The strategic planning is a process driven
by the corporate management, taking
cognisance of the operating environment,
the Company’s current market position,
and future ambitions, with directional
insights from the Board.
Stemming from the strategic plan, an
annual budget is prepared ahead of each
financial year, to serve as a platform from
which to operationalise the business model
for the year. The budgeting process is
based on a collaborative approach that
encourages greater participation down
the line, and calls for the commitment
of divisional heads as well as unit level
managers and field supervisors. The
Managing Director and the CEO are
ultimately responsible to the Board for the
actual outcomes against the budget.
Managing Risk
Risk Management forms an integral part of
our financial capital management model. It
facilitates effective decision making within
the Company’s risk appetite. Further details
on KVPL’s risk management model is
available in the Risk Management Report
on page 170.
Group TurnoverRs. m
2,000
10,000
4,000
7,000
5,000
8,000
9,000
3,000
6,000
0
1,000
2012 2013 14/15 15/16 16/17 17/18
12 Months
3 Months
coming from the hydro power and
agri-tourism segments.
The contribution to the Group Turnover
from the plantation sector represented by
Kelani Valley Plantations PLC was 48%,
while the Tea marketing sector consisting
of Mabroc Teas (Pvt) Ltd. accounted for
51%. The hydro power sector comprising
of Kalupahana Power Company along with
Kelani Valley Instant Tea and Kelani Valley
Resorts accounted for the remaining 1%.
Segmental TurnoverThe Tea segment revenues grew from
Rs. 5,903 m in the previous year to
Rs.7,540 m in the year under review,
denoting a 287% year-on-year increase.
Higher turnover was the result of a 14%
increase in the Tea crop together with
significantly higher prices at the Colombo
Tea Auction. The average to-date price/Kg
(NSA) at end March 2018 is Rs. 640/- and
March 2017 is Rs. 528/- an increase of
21% respectively compared to
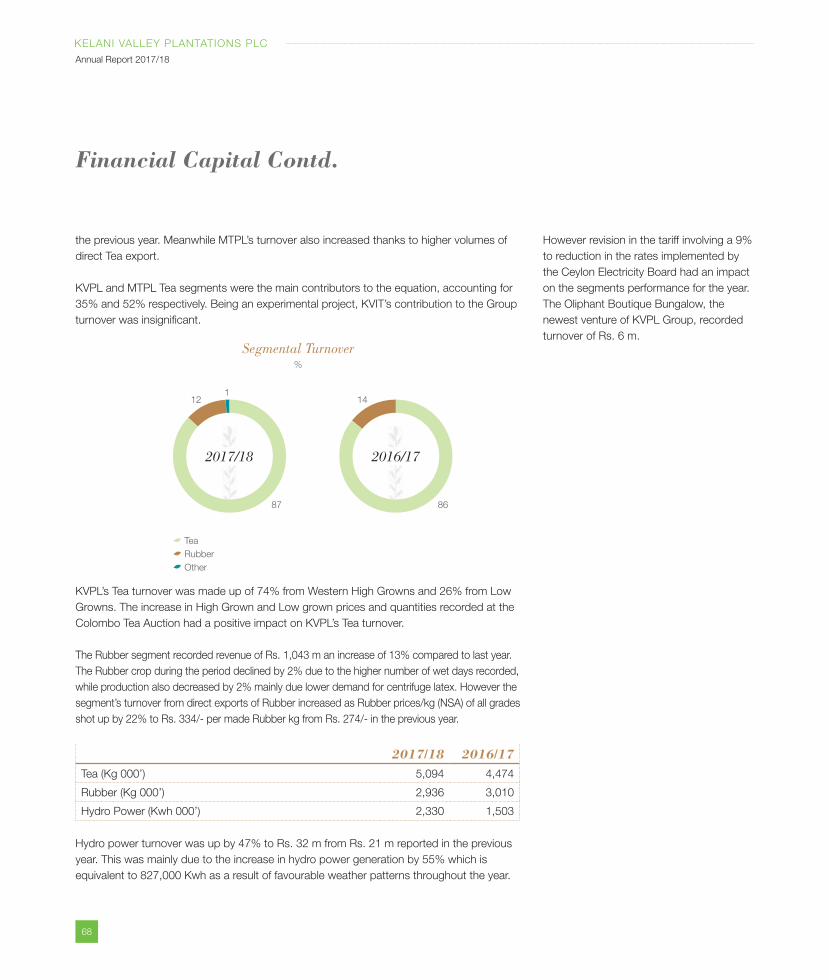
68
KELANI VALLEY PLANTATIONS PLC
Annual Report 2017/18
the previous year. Meanwhile MTPL’s turnover also increased thanks to higher volumes of
direct Tea export.
KVPL and MTPL Tea segments were the main contributors to the equation, accounting for
35% and 52% respectively. Being an experimental project, KVIT’s contribution to the Group
turnover was insignificant.
KVPL’s Tea turnover was made up of 74% from Western High Growns and 26% from Low
Growns. The increase in High Grown and Low grown prices and quantities recorded at the
Colombo Tea Auction had a positive impact on KVPL’s Tea turnover.
The Rubber segment recorded revenue of Rs. 1,043 m an increase of 13% compared to last year.
The Rubber crop during the period declined by 2% due to the higher number of wet days recorded,
while production also decreased by 2% mainly due lower demand for centrifuge latex. However the
segment’s turnover from direct exports of Rubber increased as Rubber prices/kg (NSA) of all grades
shot up by 22% to Rs. 334/- per made Rubber kg from Rs. 274/- in the previous year.
2017/18 2016/17Tea (Kg 000’) 5,094 4,474
Rubber (Kg 000’) 2,936 3,010
Hydro Power (Kwh 000’) 2,330 1,503
Hydro power turnover was up by 47% to Rs. 32 m from Rs. 21 m reported in the previous
year. This was mainly due to the increase in hydro power generation by 55% which is
equivalent to 827,000 Kwh as a result of favourable weather patterns throughout the year.
Tea
Rubber
Other
Segmental Turnover%
87
112
2017/18
86
14
2016/17
Financial Capital Contd.
However revision in the tariff involving a 9%
to reduction in the rates implemented by
the Ceylon Electricity Board had an impact
on the segments performance for the year.
The Oliphant Boutique Bungalow, the
newest venture of KVPL Group, recorded
turnover of Rs. 6 m.
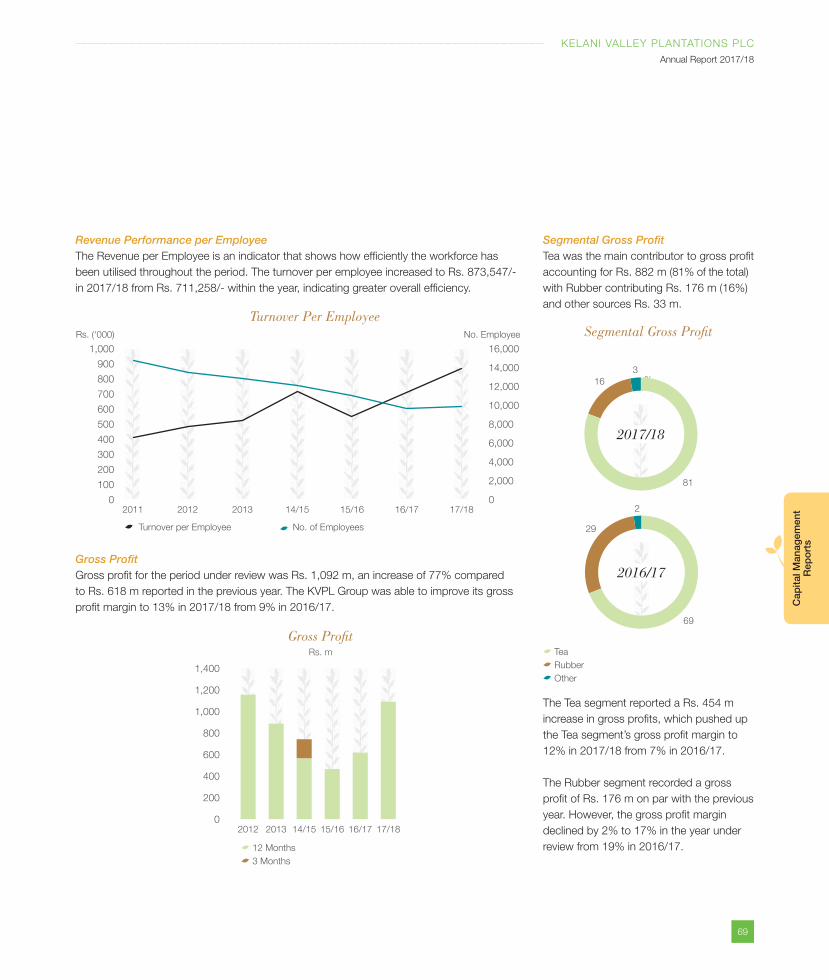
69
KELANI VALLEY PLANTATIONS PLC
Annual Report 2017/18
Cap
ital M
anag
emen
t R
epo
rts
Revenue Performance per EmployeeThe Revenue per Employee is an indicator that shows how efficiently the workforce has
been utilised throughout the period. The turnover per employee increased to Rs. 873,547/-
in 2017/18 from Rs. 711,258/- within the year, indicating greater overall efficiency.
Gross ProfitGross profit for the period under review was Rs. 1,092 m, an increase of 77% compared
to Rs. 618 m reported in the previous year. The KVPL Group was able to improve its gross
profit margin to 13% in 2017/18 from 9% in 2016/17.
Turnover per Employee No. of Employees
Turnover Per Employee
500
1,000
800
900
700
600
400
200
0
100
300
2011 2012 2013 16/17 17/1814/15 15/16
Rs. (‘000)
8,000
16,000
14,000
12,000
10,000
6,000
2,000
0
4,000
No. Employee
Gross ProfitRs. m
400
1,400
800
1,000
600
1,200
0
200
2012 2013 14/15 15/16 16/17 17/18
12 Months
3 Months
Segmental Gross ProfitTea was the main contributor to gross profit
accounting for Rs. 882 m (81% of the total)
with Rubber contributing Rs. 176 m (16%)
and other sources Rs. 33 m.
The Tea segment reported a Rs. 454 m
increase in gross profits, which pushed up
the Tea segment’s gross profit margin to
12% in 2017/18 from 7% in 2016/17.
The Rubber segment recorded a gross
profit of Rs. 176 m on par with the previous
year. However, the gross profit margin
declined by 2% to 17% in the year under
review from 19% in 2016/17.
%
Tea
Rubber
Other
Segmental Gross Profit
81
3
16
2017/18
69
29
2
2016/17
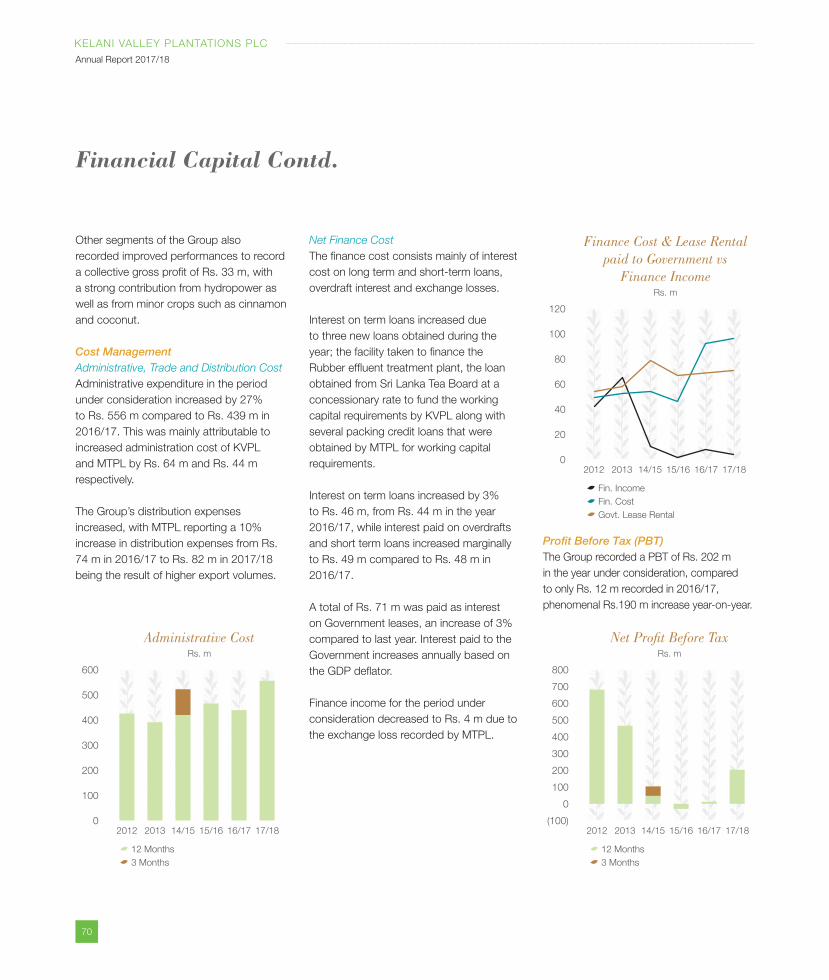
70
KELANI VALLEY PLANTATIONS PLC
Annual Report 2017/18
Other segments of the Group also
recorded improved performances to record
a collective gross profit of Rs. 33 m, with
a strong contribution from hydropower as
well as from minor crops such as cinnamon
and coconut.
Cost ManagementAdministrative, Trade and Distribution Cost
Administrative expenditure in the period
under consideration increased by 27%
to Rs. 556 m compared to Rs. 439 m in
2016/17. This was mainly attributable to
increased administration cost of KVPL
and MTPL by Rs. 64 m and Rs. 44 m
respectively.
The Group’s distribution expenses
increased, with MTPL reporting a 10%
increase in distribution expenses from Rs.
74 m in 2016/17 to Rs. 82 m in 2017/18
being the result of higher export volumes.
Administrative CostRs. m
300
600
500
400
0
200
100
2012 2013 14/15 15/16 16/17 17/18
12 Months
3 Months
Net Finance Cost
The finance cost consists mainly of interest
cost on long term and short-term loans,
overdraft interest and exchange losses.
Interest on term loans increased due
to three new loans obtained during the
year; the facility taken to finance the
Rubber effluent treatment plant, the loan
obtained from Sri Lanka Tea Board at a
concessionary rate to fund the working
capital requirements by KVPL along with
several packing credit loans that were
obtained by MTPL for working capital
requirements.
Interest on term loans increased by 3%
to Rs. 46 m, from Rs. 44 m in the year
2016/17, while interest paid on overdrafts
and short term loans increased marginally
to Rs. 49 m compared to Rs. 48 m in
2016/17.
A total of Rs. 71 m was paid as interest
on Government leases, an increase of 3%
compared to last year. Interest paid to the
Government increases annually based on
the GDP deflator.
Finance income for the period under
consideration decreased to Rs. 4 m due to
the exchange loss recorded by MTPL.
Finance Cost & Lease Rental paid to Government vs
Finance IncomeRs. m
60
120
100
80
0
40
20
Fin. Income
Fin. Cost
Govt. Lease Rental
2012 2013 14/15 15/16 16/17 17/18
Profit Before Tax (PBT)The Group recorded a PBT of Rs. 202 m
in the year under consideration, compared
to only Rs. 12 m recorded in 2016/17,
phenomenal Rs.190 m increase year-on-year.
Net Profit Before TaxRs. m
300
800
500
600
400
700
(100)
200
100
0
2012 2013 14/15 15/16 16/17 17/18
12 Months
3 Months
Financial Capital Contd.
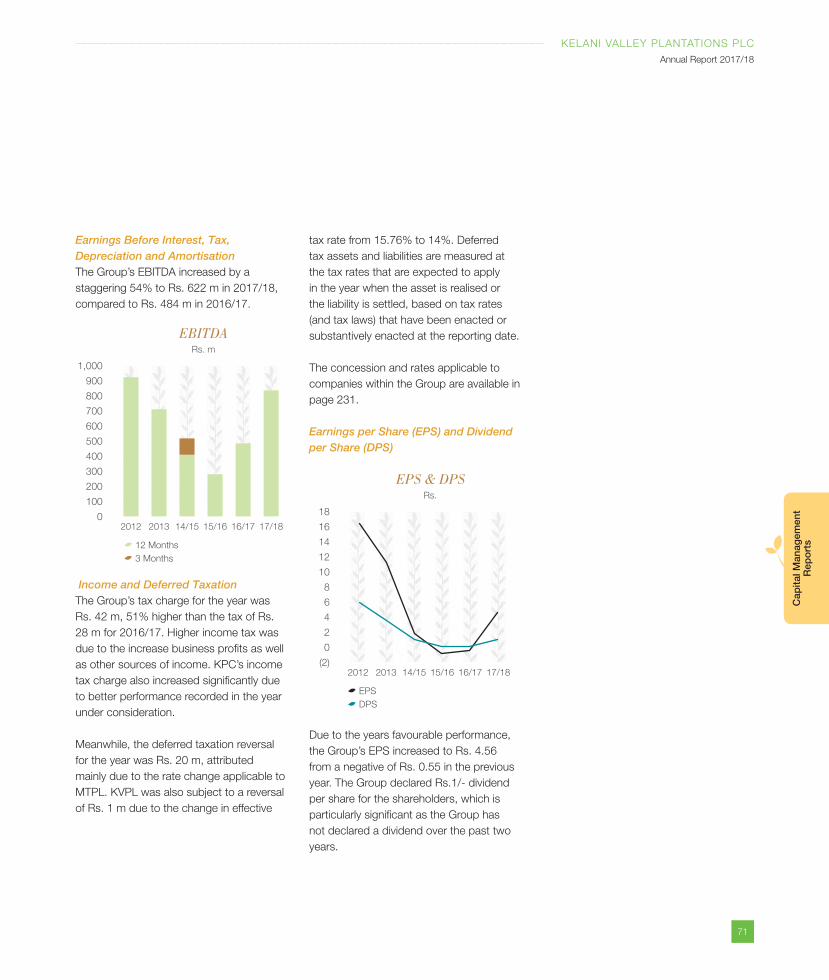
71
KELANI VALLEY PLANTATIONS PLC
Annual Report 2017/18
Cap
ital M
anag
emen
t R
epo
rts
Earnings Before Interest, Tax, Depreciation and AmortisationThe Group’s EBITDA increased by a
staggering 54% to Rs. 622 m in 2017/18,
compared to Rs. 484 m in 2016/17.
EBITDARs. m
300
1,000
500
600
400
700
800
900
0
200
100
2012 2013 14/15 15/16 16/17 17/18
12 Months
3 Months
Income and Deferred TaxationThe Group’s tax charge for the year was
Rs. 42 m, 51% higher than the tax of Rs.
28 m for 2016/17. Higher income tax was
due to the increase business profits as well
as other sources of income. KPC’s income
tax charge also increased significantly due
to better performance recorded in the year
under consideration.
Meanwhile, the deferred taxation reversal
for the year was Rs. 20 m, attributed
mainly due to the rate change applicable to
MTPL. KVPL was also subject to a reversal
of Rs. 1 m due to the change in effective
tax rate from 15.76% to 14%. Deferred
tax assets and liabilities are measured at
the tax rates that are expected to apply
in the year when the asset is realised or
the liability is settled, based on tax rates
(and tax laws) that have been enacted or
substantively enacted at the reporting date.
The concession and rates applicable to
companies within the Group are available in
page 231.
Earnings per Share (EPS) and Dividend per Share (DPS)
Due to the years favourable performance,
the Group’s EPS increased to Rs. 4.56
from a negative of Rs. 0.55 in the previous
year. The Group declared Rs.1/- dividend
per share for the shareholders, which is
particularly significant as the Group has
not declared a dividend over the past two
years.
EPS & DPSRs.
8
18
12
14
16
10
(2)
6
4
0
2
2012 2013 14/15 15/16 16/17 17/18
EPS
DPS
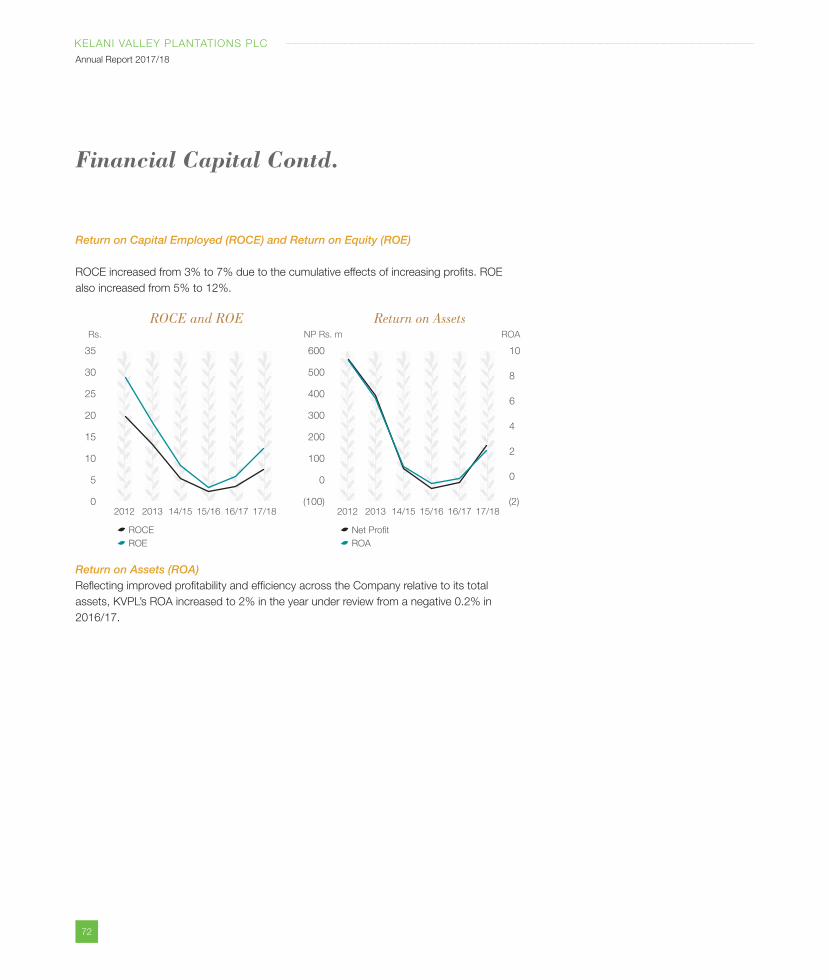
72
KELANI VALLEY PLANTATIONS PLC
Annual Report 2017/18
Return on Capital Employed (ROCE) and Return on Equity (ROE)
ROCE increased from 3% to 7% due to the cumulative effects of increasing profits. ROE
also increased from 5% to 12%.
ROCE
ROE
ROCE and ROE
25
35
30
0
20
15
5
10
2012 2013 14/15 15/16 16/17 17/18
Net Profit
ROA
Return on AssetsNP Rs. m ROA
400
8
600 10
500
(100) (2)
300
6
2004
0 0
1002
2012 2013 14/15 15/16 16/17 17/18
Return on Assets (ROA)Reflecting improved profitability and efficiency across the Company relative to its total
assets, KVPL’s ROA increased to 2% in the year under review from a negative 0.2% in
2016/17.
Financial Capital Contd.
Rs.
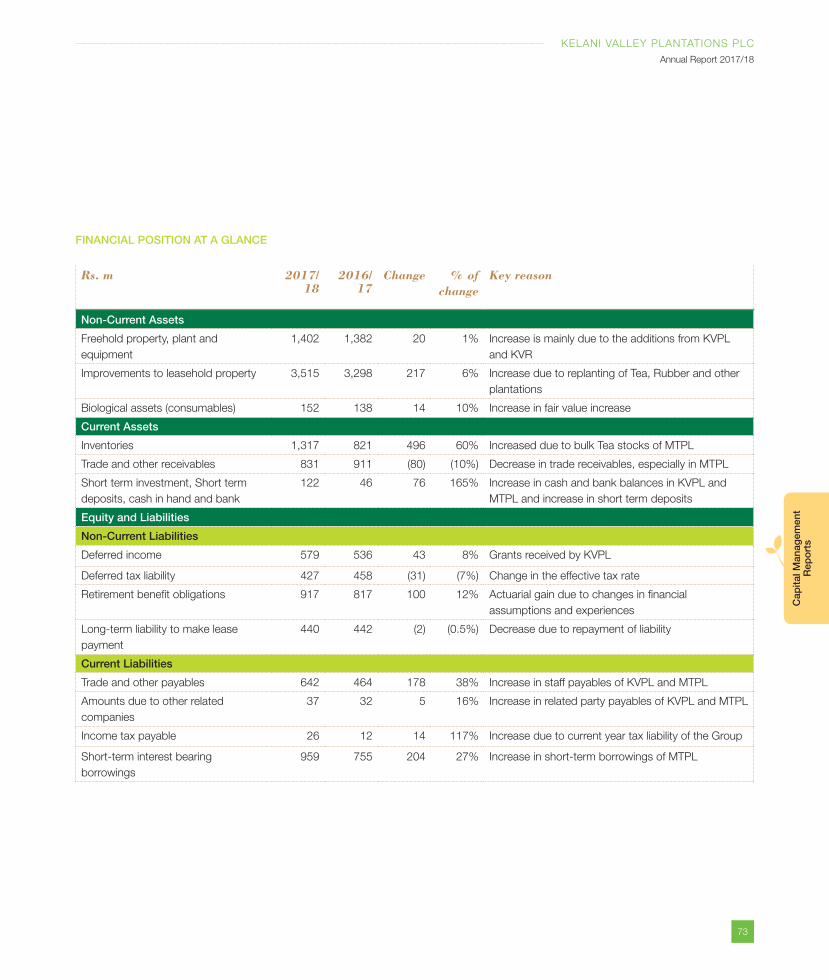
73
KELANI VALLEY PLANTATIONS PLC
Annual Report 2017/18
Cap
ital M
anag
emen
t R
epo
rts
FINANCIAL POSITION AT A GLANCE
Rs. m 2017/ 18
2016/ 17
Change % of change
Key reason
Non-Current Assets
Freehold property, plant and
equipment
1,402 1,382 20 1% Increase is mainly due to the additions from KVPL
and KVR
Improvements to leasehold property 3,515 3,298 217 6% Increase due to replanting of Tea, Rubber and other
plantations
Biological assets (consumables) 152 138 14 10% Increase in fair value increase
Current Assets
Inventories 1,317 821 496 60% Increased due to bulk Tea stocks of MTPL
Trade and other receivables 831 911 (80) (10%) Decrease in trade receivables, especially in MTPL
Short term investment, Short term
deposits, cash in hand and bank
122 46 76 165% Increase in cash and bank balances in KVPL and
MTPL and increase in short term deposits
Equity and Liabilities
Non-Current Liabilities
Deferred income 579 536 43 8% Grants received by KVPL
Deferred tax liability 427 458 (31) (7%) Change in the effective tax rate
Retirement benefit obligations 917 817 100 12% Actuarial gain due to changes in financial
assumptions and experiences
Long-term liability to make lease
payment
440 442 (2) (0.5%) Decrease due to repayment of liability
Current Liabilities
Trade and other payables 642 464 178 38% Increase in staff payables of KVPL and MTPL
Amounts due to other related
companies
37 32 5 16% Increase in related party payables of KVPL and MTPL
Income tax payable 26 12 14 117% Increase due to current year tax liability of the Group
Short-term interest bearing
borrowings
959 755 204 27% Increase in short-term borrowings of MTPL
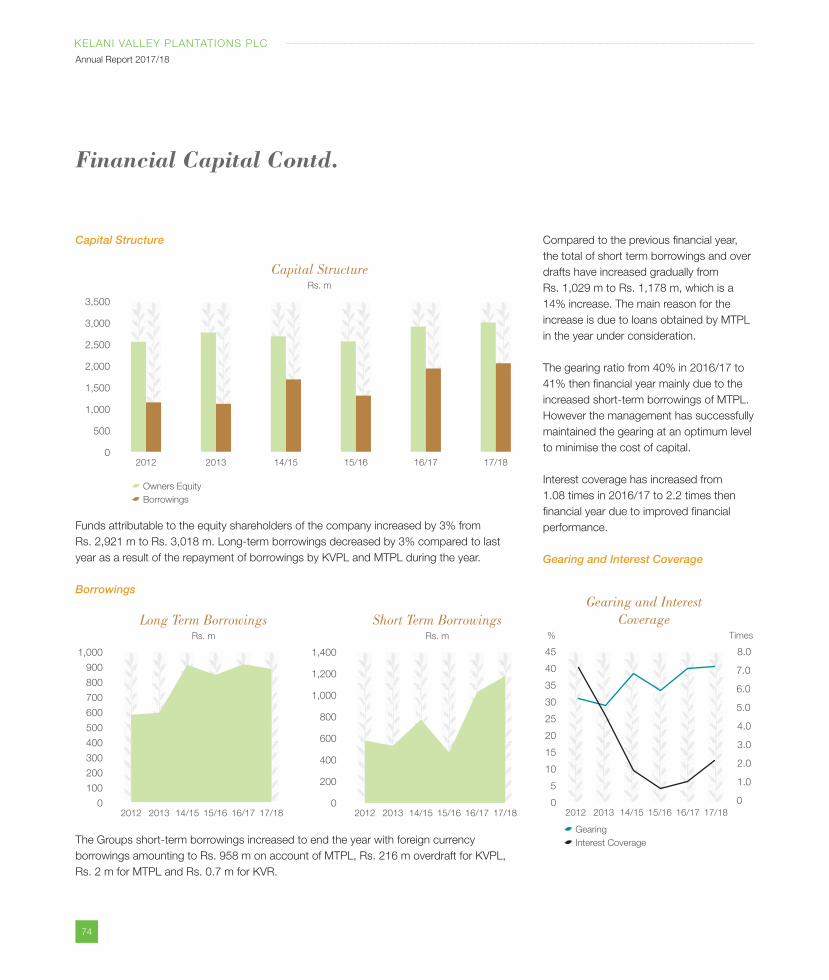
74
KELANI VALLEY PLANTATIONS PLC
Annual Report 2017/18
Capital Structure
Capital Structure Rs. m
2,000
2,500
3,500
3,000
1,000
1,500
0
500
Owners Equity
Borrowings
14/152012 2013 15/16 16/17 17/18
Long Term BorrowingsRs. m
300
1,000
700
600
800
900
500
400
0
200
100
2012 2013 14/15 15/16 16/17 17/18
Short Term BorrowingsRs. m
1,400
800
600
1,000
1,200
400
0
200
2012 2013 14/15 15/16 16/17 17/18
Compared to the previous financial year,
the total of short term borrowings and over
drafts have increased gradually from
Rs. 1,029 m to Rs. 1,178 m, which is a
14% increase. The main reason for the
increase is due to loans obtained by MTPL
in the year under consideration.
The gearing ratio from 40% in 2016/17 to
41% then financial year mainly due to the
increased short-term borrowings of MTPL.
However the management has successfully
maintained the gearing at an optimum level
to minimise the cost of capital.
Interest coverage has increased from
1.08 times in 2016/17 to 2.2 times then
financial year due to improved financial
performance.
Gearing and Interest Coverage
Gearing
Interest Coverage
Gearing and Interest Coverage
% Times
153.0
10
4.0
45 8.0
40
35
30
25
20
5.0
6.0
7.0
0 0
5
2.0
1.0
2012 2013 14/15 15/16 16/17 17/18
Financial Capital Contd.
Funds attributable to the equity shareholders of the company increased by 3% from
Rs. 2,921 m to Rs. 3,018 m. Long-term borrowings decreased by 3% compared to last
year as a result of the repayment of borrowings by KVPL and MTPL during the year.
Borrowings
The Groups short-term borrowings increased to end the year with foreign currency
borrowings amounting to Rs. 958 m on account of MTPL, Rs. 216 m overdraft for KVPL,
Rs. 2 m for MTPL and Rs. 0.7 m for KVR.
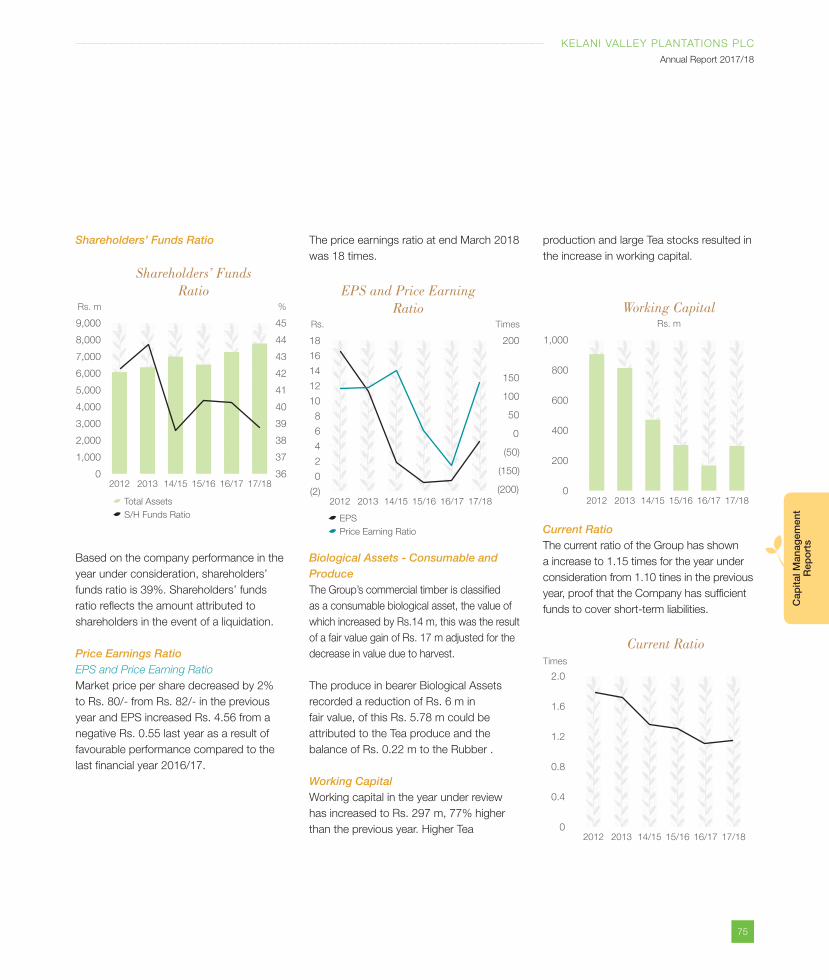
75
KELANI VALLEY PLANTATIONS PLC
Annual Report 2017/18
Cap
ital M
anag
emen
t R
epo
rts
Shareholders’ Funds Ratio The price earnings ratio at end March 2018
was 18 times.
Working CapitalRs. m
400
1,000
800
600
0
200
2012 2013 14/15 15/16 16/17 17/18
production and large Tea stocks resulted in
the increase in working capital.
Current RatioTimes
0.8
2.0
1.6
1.2
0
0.4
2012 2013 14/15 15/16 16/17 17/18
Based on the company performance in the
year under consideration, shareholders’
funds ratio is 39%. Shareholders’ funds
ratio reflects the amount attributed to
shareholders in the event of a liquidation.
Price Earnings RatioEPS and Price Earning Ratio
Market price per share decreased by 2%
to Rs. 80/- from Rs. 82/- in the previous
year and EPS increased Rs. 4.56 from a
negative Rs. 0.55 last year as a result of
favourable performance compared to the
last financial year 2016/17.
Current RatioThe current ratio of the Group has shown
a increase to 1.15 times for the year under
consideration from 1.10 tines in the previous
year, proof that the Company has sufficient
funds to cover short-term liabilities.
EPS
Price Earning Ratio
EPS and Price Earning Ratio
Rs. Times
4
0
2
50
18
16
200
14
12
10
8
6
100
150
(2) (200)
0
(50)
(150)
2012 2013 14/15 15/16 16/17 17/18
Biological Assets - Consumable and ProduceThe Group’s commercial timber is classified
as a consumable biological asset, the value of
which increased by Rs.14 m, this was the result
of a fair value gain of Rs. 17 m adjusted for the
decrease in value due to harvest.
The produce in bearer Biological Assets
recorded a reduction of Rs. 6 m in
fair value, of this Rs. 5.78 m could be
attributed to the Tea produce and the
balance of Rs. 0.22 m to the Rubber .
Working CapitalWorking capital in the year under review
has increased to Rs. 297 m, 77% higher
than the previous year. Higher Tea
Shareholders’ Funds Ratio
Rs. m
2,000 38
9,000 45
8,000 44
6,000 42
0 36
1,000 37
2012 2013 14/15 15/16 16/17 17/18
Total Assets
S/H Funds Ratio
%
3,000 39
4,000 40
5,000 41
7,000 43
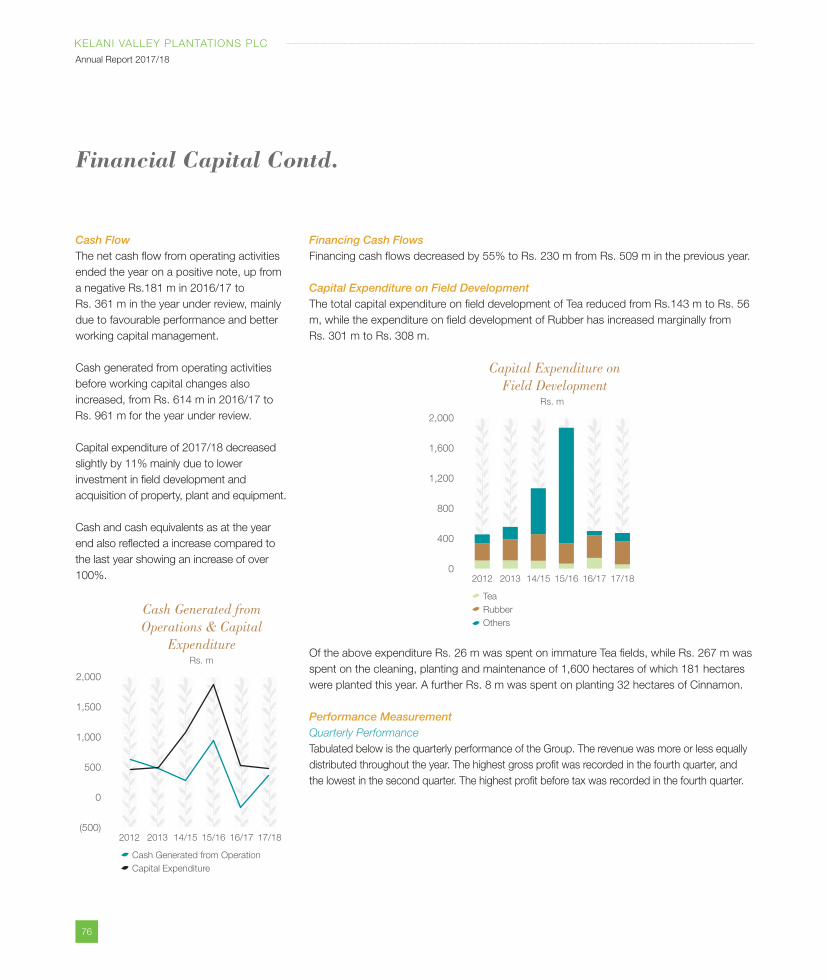
76
KELANI VALLEY PLANTATIONS PLC
Annual Report 2017/18
Cash FlowThe net cash flow from operating activities
ended the year on a positive note, up from
a negative Rs.181 m in 2016/17 to
Rs. 361 m in the year under review, mainly
due to favourable performance and better
working capital management.
Cash generated from operating activities
before working capital changes also
increased, from Rs. 614 m in 2016/17 to
Rs. 961 m for the year under review.
Capital expenditure of 2017/18 decreased
slightly by 11% mainly due to lower
investment in field development and
acquisition of property, plant and equipment.
Cash and cash equivalents as at the year
end also reflected a increase compared to
the last year showing an increase of over
100%.
Cash Generated from Operations & Capital
ExpenditureRs. m
500
2,000
1,500
1,000
(500)
0
2012 2013 14/15 15/16 16/17 17/18
Cash Generated from Operation
Capital Expenditure
Capital Expenditure on Field Development
Rs. m
800
2,000
1,600
1,200
0
400
2012 2013 14/15 15/16 16/17 17/18
Tea
Rubber
Others
Financial Capital Contd.
Financing Cash FlowsFinancing cash flows decreased by 55% to Rs. 230 m from Rs. 509 m in the previous year.
Capital Expenditure on Field DevelopmentThe total capital expenditure on field development of Tea reduced from Rs.143 m to Rs. 56
m, while the expenditure on field development of Rubber has increased marginally from
Rs. 301 m to Rs. 308 m.
Of the above expenditure Rs. 26 m was spent on immature Tea fields, while Rs. 267 m was
spent on the cleaning, planting and maintenance of 1,600 hectares of which 181 hectares
were planted this year. A further Rs. 8 m was spent on planting 32 hectares of Cinnamon.
Performance MeasurementQuarterly Performance
Tabulated below is the quarterly performance of the Group. The revenue was more or less equally
distributed throughout the year. The highest gross profit was recorded in the fourth quarter, and
the lowest in the second quarter. The highest profit before tax was recorded in the fourth quarter.
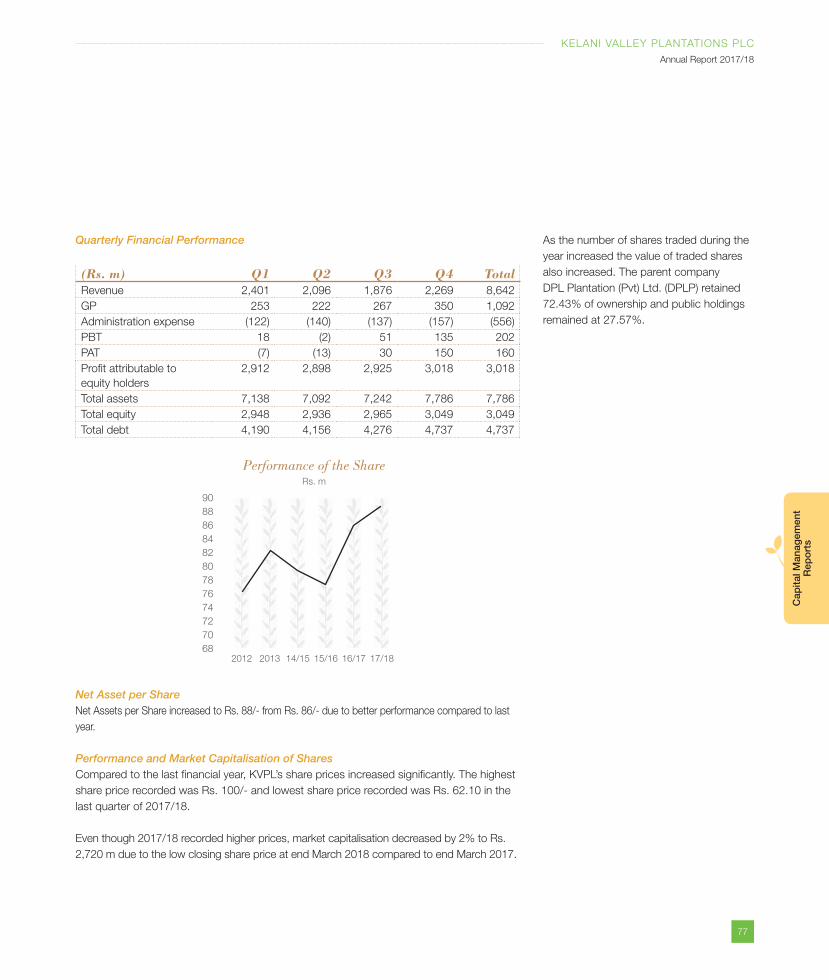
77
KELANI VALLEY PLANTATIONS PLC
Annual Report 2017/18
Cap
ital M
anag
emen
t R
epo
rts
Quarterly Financial Performance
(Rs. m) Q1 Q2 Q3 Q4 TotalRevenue 2,401 2,096 1,876 2,269 8,642
GP 253 222 267 350 1,092
Administration expense (122) (140) (137) (157) (556)
PBT 18 (2) 51 135 202
PAT (7) (13) 30 150 160
Profit attributable to
equity holders
2,912 2,898 2,925 3,018 3,018
Total assets 7,138 7,092 7,242 7,786 7,786
Total equity 2,948 2,936 2,965 3,049 3,049
Total debt 4,190 4,156 4,276 4,737 4,737
Performance of the ShareRs. m
72
90
80
78
84
86
88
82
76
74
68
70
2012 2013 14/15 15/16 16/17 17/18
Net Asset per ShareNet Assets per Share increased to Rs. 88/- from Rs. 86/- due to better performance compared to last
year.
Performance and Market Capitalisation of SharesCompared to the last financial year, KVPL’s share prices increased significantly. The highest
share price recorded was Rs. 100/- and lowest share price recorded was Rs. 62.10 in the
last quarter of 2017/18.
Even though 2017/18 recorded higher prices, market capitalisation decreased by 2% to Rs.
2,720 m due to the low closing share price at end March 2018 compared to end March 2017.
As the number of shares traded during the
year increased the value of traded shares
also increased. The parent company
DPL Plantation (Pvt) Ltd. (DPLP) retained
72.43% of ownership and public holdings
remained at 27.57%.
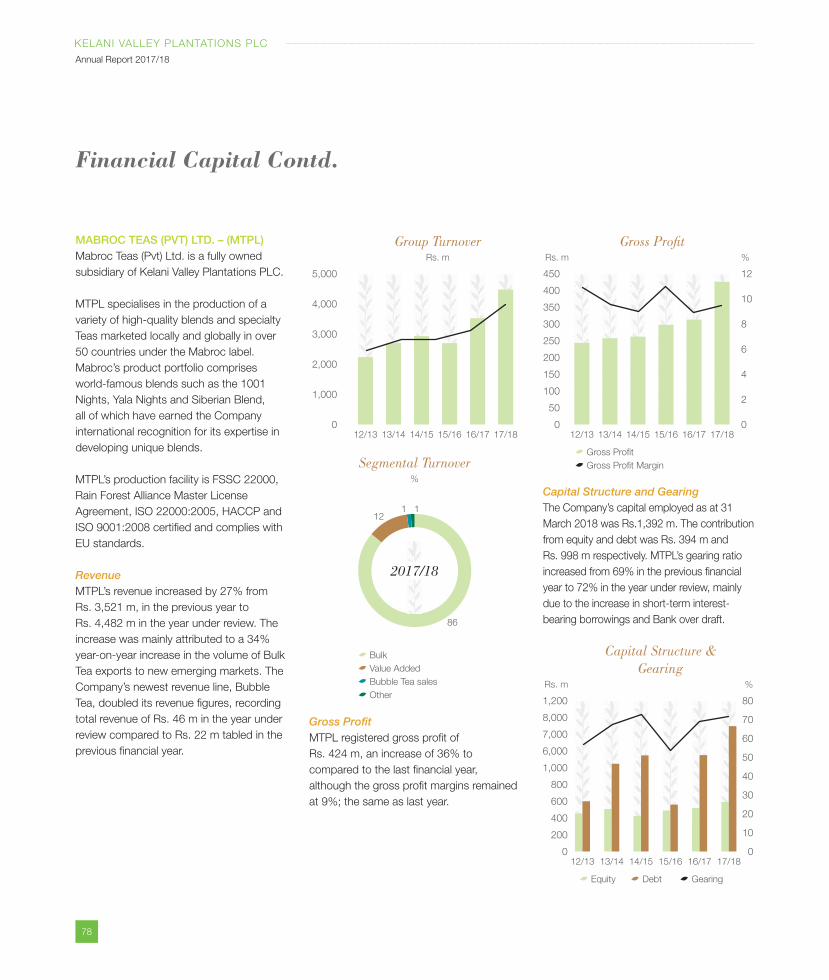
78
KELANI VALLEY PLANTATIONS PLC
Annual Report 2017/18
MABROC TEAS (PVT) LTD. – (MTPL)Mabroc Teas (Pvt) Ltd. is a fully owned
subsidiary of Kelani Valley Plantations PLC.
MTPL specialises in the production of a
variety of high-quality blends and specialty
Teas marketed locally and globally in over
50 countries under the Mabroc label.
Mabroc’s product portfolio comprises
world-famous blends such as the 1001
Nights, Yala Nights and Siberian Blend,
all of which have earned the Company
international recognition for its expertise in
developing unique blends.
MTPL’s production facility is FSSC 22000,
Rain Forest Alliance Master License
Agreement, ISO 22000:2005, HACCP and
ISO 9001:2008 certified and complies with
EU standards.
RevenueMTPL’s revenue increased by 27% from
Rs. 3,521 m, in the previous year to
Rs. 4,482 m in the year under review. The
increase was mainly attributed to a 34%
year-on-year increase in the volume of Bulk
Tea exports to new emerging markets. The
Company’s newest revenue line, Bubble
Tea, doubled its revenue figures, recording
total revenue of Rs. 46 m in the year under
review compared to Rs. 22 m tabled in the
previous financial year.
Gross ProfitMTPL registered gross profit of
Rs. 424 m, an increase of 36% to
compared to the last financial year,
although the gross profit margins remained
at 9%; the same as last year.
Capital Structure and GearingThe Company’s capital employed as at 31
March 2018 was Rs.1,392 m. The contribution
from equity and debt was Rs. 394 m and
Rs. 998 m respectively. MTPL’s gearing ratio
increased from 69% in the previous financial
year to 72% in the year under review, mainly
due to the increase in short-term interest-
bearing borrowings and Bank over draft.
Financial Capital Contd.
Group TurnoverRs. m
2,000
5,000
4,000
3,000
0
1,000
12/13 13/14 14/15 15/16 16/17 17/18
Segmental Turnover%
86
1 112
2017/18
Bulk
Value Added
Bubble Tea sales
Other
Rs. m
400
1,200
8,000
6,000
0
200
600
800
1,000
7,000
20
80
60
0
10
%
30
40
50
70
12/13 13/14 14/15 15/16 16/17 17/18
Capital Structure & Gearing
Equity Debt Gearing
Gross ProfitRs. m
100
4
450 12
400
300
0 0
502
12/13 13/14 14/15 15/16 16/17 17/18
Gross Profit
Gross Profit Margin
%
150
6200
8
250
10350
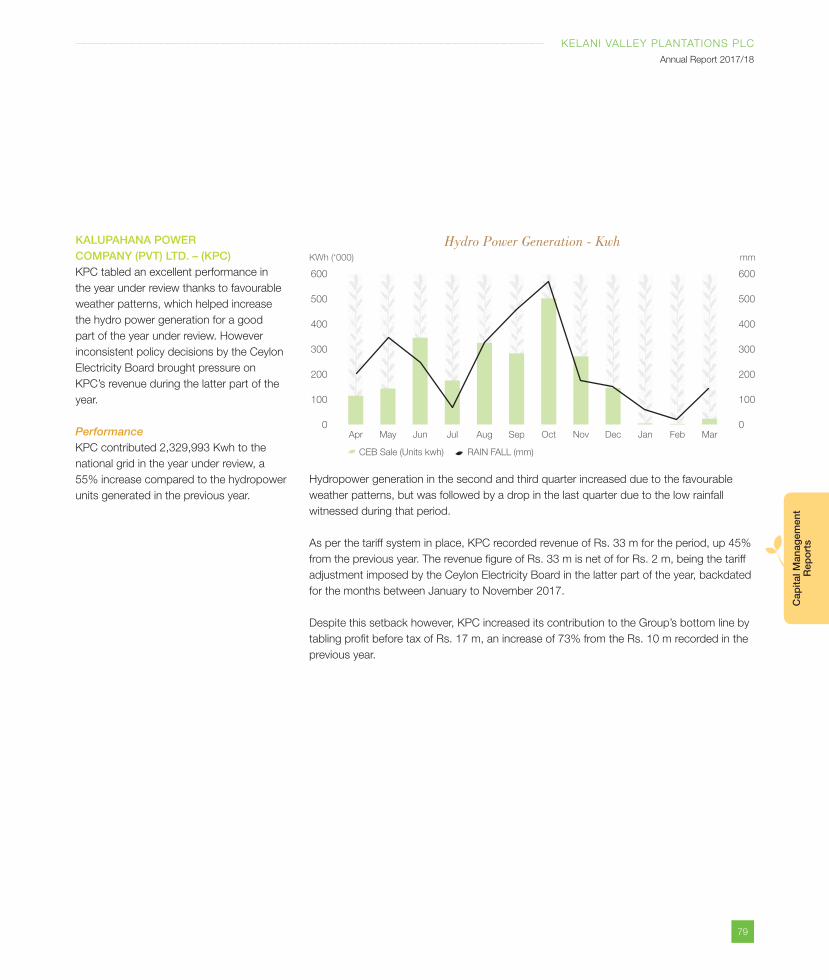
79
KELANI VALLEY PLANTATIONS PLC
Annual Report 2017/18
Cap
ital M
anag
emen
t R
epo
rts
KALUPAHANA POWER COMPANY (PVT) LTD. – (KPC)KPC tabled an excellent performance in
the year under review thanks to favourable
weather patterns, which helped increase
the hydro power generation for a good
part of the year under review. However
inconsistent policy decisions by the Ceylon
Electricity Board brought pressure on
KPC’s revenue during the latter part of the
year.
PerformanceKPC contributed 2,329,993 Kwh to the
national grid in the year under review, a
55% increase compared to the hydropower
units generated in the previous year.
CEB Sale (Units kwh) RAIN FALL (mm)
Hydro Power Generation - Kwh
400 400
600 600
500 500
300 300
100 100
0 0
200 200
Apr JanMay FebJun Sep MarJul OctAug Nov Dec
KWh (‘000) mm
Hydropower generation in the second and third quarter increased due to the favourable
weather patterns, but was followed by a drop in the last quarter due to the low rainfall
witnessed during that period.
As per the tariff system in place, KPC recorded revenue of Rs. 33 m for the period, up 45%
from the previous year. The revenue figure of Rs. 33 m is net of for Rs. 2 m, being the tariff
adjustment imposed by the Ceylon Electricity Board in the latter part of the year, backdated
for the months between January to November 2017.
Despite this setback however, KPC increased its contribution to the Group’s bottom line by
tabling profit before tax of Rs. 17 m, an increase of 73% from the Rs. 10 m recorded in the
previous year.
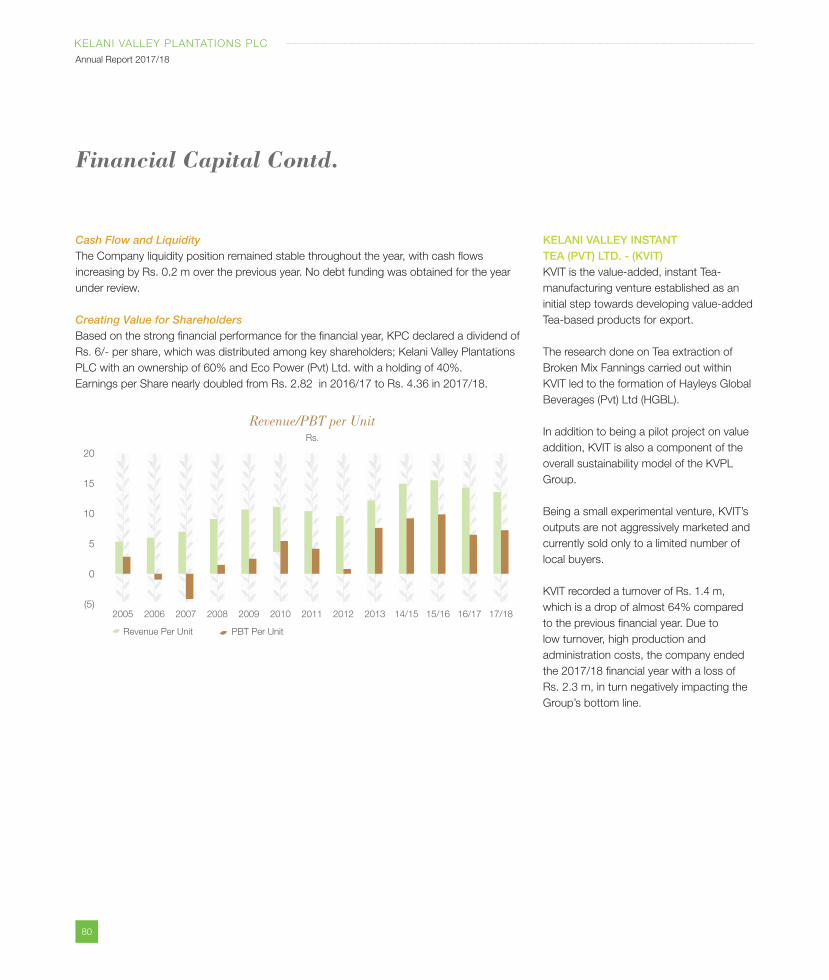
80
KELANI VALLEY PLANTATIONS PLC
Annual Report 2017/18
KELANI VALLEY INSTANT TEA (PVT) LTD. - (KVIT)KVIT is the value-added, instant Tea-
manufacturing venture established as an
initial step towards developing value-added
Tea-based products for export.
The research done on Tea extraction of
Broken Mix Fannings carried out within
KVIT led to the formation of Hayleys Global
Beverages (Pvt) Ltd (HGBL).
In addition to being a pilot project on value
addition, KVIT is also a component of the
overall sustainability model of the KVPL
Group.
Being a small experimental venture, KVIT’s
outputs are not aggressively marketed and
currently sold only to a limited number of
local buyers.
KVIT recorded a turnover of Rs. 1.4 m,
which is a drop of almost 64% compared
to the previous financial year. Due to
low turnover, high production and
administration costs, the company ended
the 2017/18 financial year with a loss of
Rs. 2.3 m, in turn negatively impacting the
Group’s bottom line.
Financial Capital Contd.
Cash Flow and LiquidityThe Company liquidity position remained stable throughout the year, with cash flows
increasing by Rs. 0.2 m over the previous year. No debt funding was obtained for the year
under review.
Creating Value for ShareholdersBased on the strong financial performance for the financial year, KPC declared a dividend of
Rs. 6/- per share, which was distributed among key shareholders; Kelani Valley Plantations
PLC with an ownership of 60% and Eco Power (Pvt) Ltd. with a holding of 40%.
Earnings per Share nearly doubled from Rs. 2.82 in 2016/17 to Rs. 4.36 in 2017/18.
Revenue/PBT per UnitRs.
15
20
10
0
(5)
5
2005 2006 2007 2008 2009 2010 2011 2012 15/162013 17/1816/17
Revenue Per Unit PBT Per Unit
14/15
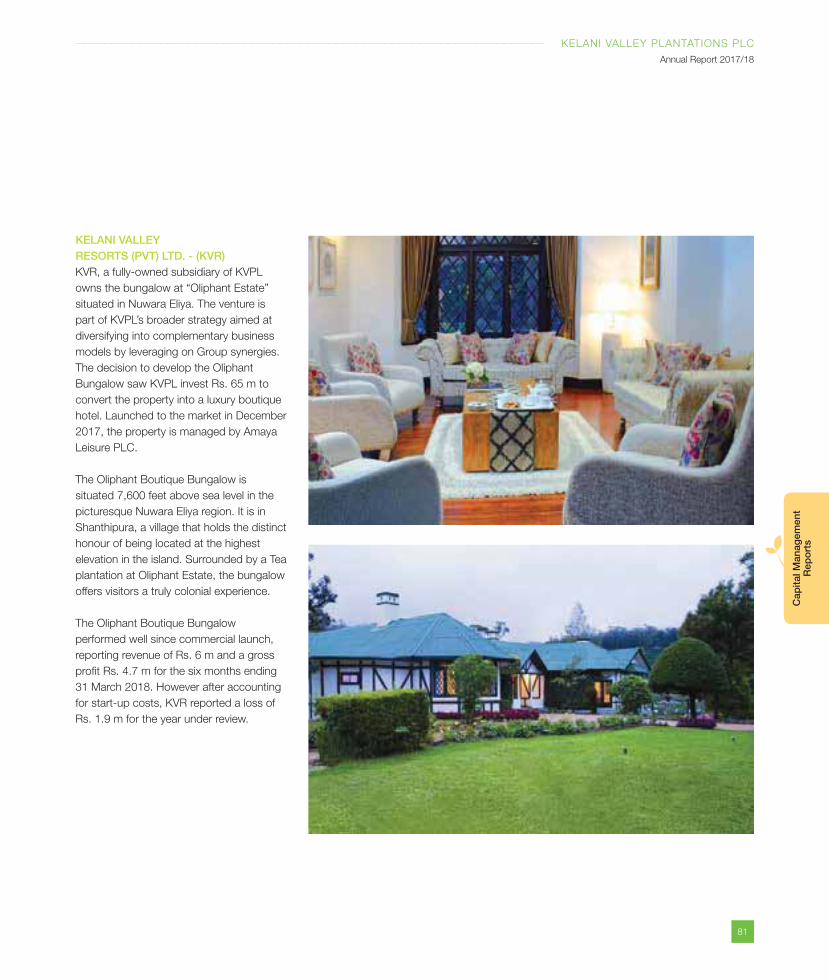
81
KELANI VALLEY PLANTATIONS PLC
Annual Report 2017/18
Cap
ital M
anag
emen
t R
epo
rts
KELANI VALLEY RESORTS (PVT) LTD. - (KVR)KVR, a fully-owned subsidiary of KVPL
owns the bungalow at “Oliphant Estate”
situated in Nuwara Eliya. The venture is
part of KVPL’s broader strategy aimed at
diversifying into complementary business
models by leveraging on Group synergies.
The decision to develop the Oliphant
Bungalow saw KVPL invest Rs. 65 m to
convert the property into a luxury boutique
hotel. Launched to the market in December
2017, the property is managed by Amaya
Leisure PLC.
The Oliphant Boutique Bungalow is
situated 7,600 feet above sea level in the
picturesque Nuwara Eliya region. It is in
Shanthipura, a village that holds the distinct
honour of being located at the highest
elevation in the island. Surrounded by a Tea
plantation at Oliphant Estate, the bungalow
offers visitors a truly colonial experience.
The Oliphant Boutique Bungalow
performed well since commercial launch,
reporting revenue of Rs. 6 m and a gross
profit Rs. 4.7 m for the six months ending
31 March 2018. However after accounting
for start-up costs, KVR reported a loss of
Rs. 1.9 m for the year under review.
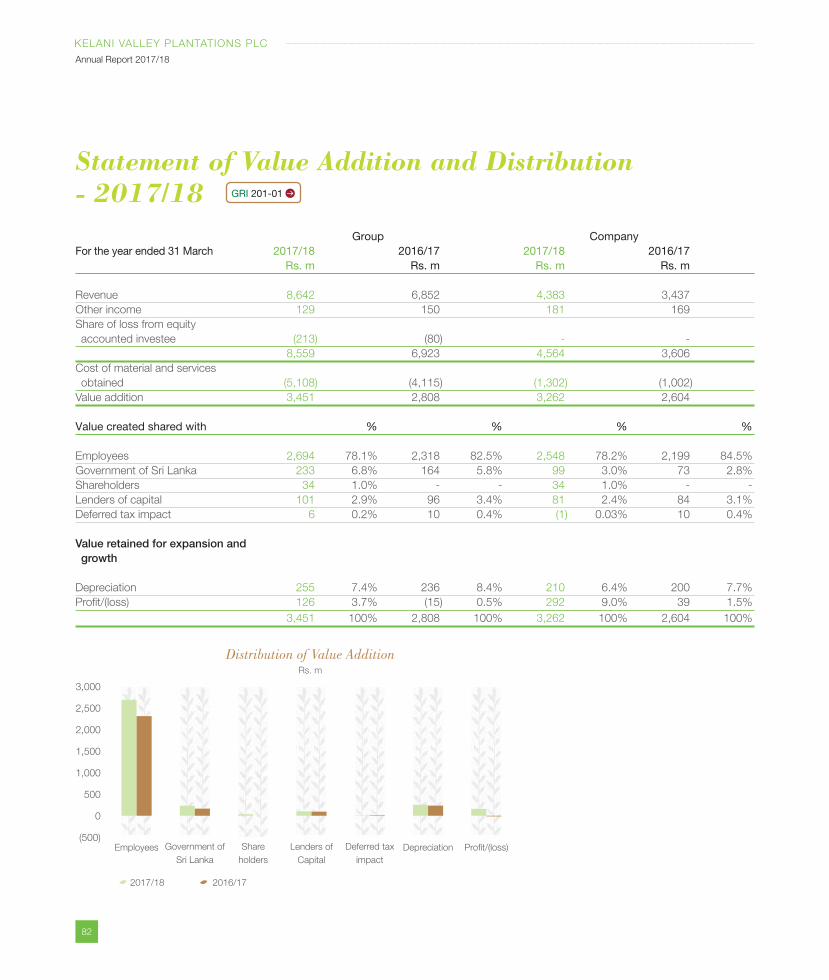
82
KELANI VALLEY PLANTATIONS PLC
Annual Report 2017/18
Group CompanyFor the year ended 31 March 2017/18 2016/17 2017/18 2016/17 Rs. m Rs. m Rs. m Rs. m
Revenue 8,642 6,852 4,383 3,437
Other income 129 150 181 169
Share of loss from equity
accounted investee (213) (80) - -
8,559 6,923 4,564 3,606
Cost of material and services
obtained (5,108) (4,115) (1,302) (1,002)
Value addition 3,451 2,808 3,262 2,604
Value created shared with % % % %
Employees 2,694 78.1% 2,318 82.5% 2,548 78.2% 2,199 84.5%
Government of Sri Lanka 233 6.8% 164 5.8% 99 3.0% 73 2.8%
Shareholders 34 1.0% - - 34 1.0% - -
Lenders of capital 101 2.9% 96 3.4% 81 2.4% 84 3.1%
Deferred tax impact 6 0.2% 10 0.4% (1) 0.03% 10 0.4%
Value retained for expansion and growth
Depreciation 255 7.4% 236 8.4% 210 6.4% 200 7.7%
Profit/(loss) 126 3.7% (15) 0.5% 292 9.0% 39 1.5%
3,451 100% 2,808 100% 3,262 100% 2,604 100%
Statement of Value Addition and Distribution - 2017/18
Distribution of Value AdditionRs. m
2,000
2,500
3,000
1,000
1,500
0
(500)
500
2017/18 2016/17
Employees Government of
Sri Lanka
Share
holders
Lenders of
Capital
Deferred tax
impact
Depreciation Profit/(loss)
GRI 201-01
83
KELANI VALLEY PLANTATIONS PLC
Annual Report 2017/18
Cap
ital M
anag
emen
t R
epo
rts
Manufactured Capital
Profile: Cultivated Tea Land – 3,498 Hectares
Cultivated Rubber Land – 4,501 Hectares
Cultivated Cinnamon Land – 104 Hectares
Factories Location Capacity (per day)
Green leaf (Kgs) TEA Nuwara Eliya 12,150
Uda Radella 12,500
Glassuagh 4,704
Oliphant 6,500
Edinburgh 4,704
Pedro 22,000
Annfield 13,500
Battalgalla 9,120
Fordyce 14,682
Ingestre 30,000
Robgill 13,500
Tillyrie 11,980
Invery 8,565
Made Rubber (Kgs)RUBBER Dewalakande 4,500
Panawatte 5,650
Kiriporuwa 1,800
Urumiwela 3,300
Lavant 3,850
Halgolla 13,500
Kelani 10,500
Ederapola 12,000
VISIONImprove the sustainability of land, production facilities, equipment and other manufacturing
infrastructure in order to strengthen core competencies needed to grow and produce
superior quality output that would enhance the Company’s return, increase the country’s
export earnings and contribute towards future food security.
STRATEGIC PATHWAY TOWARDS REALISING OUR VISIONWe believe the productive use of our manufactured capital will enable KVPL to be flexible
and responsive to market needs through the delivery of high quality products that exceed
customer expectations. As such, our aim has always been to maximise the efficient use
of manufacturing resources. With this clear objective in mind, over the years our efforts to
develop manufactured capital have been
focused on improving the sustainability
of our land base and the quality of our
manufacturing processes. Key strategies
adopted in the past include;
Rubber replanting programmes to achieve the tappable stand of 500 trees per hectare and increase Rubber yield to 1,500 kg/ha.
KVPL’s Rubber replanting programme has
led to little increase in extent of tappable
Rubber land each year leading to higher
yields in recent years.
Reassess the land usage and invest in crop diversification to improve the sustainability of low yielding fields.
The crop diversification programme was
introduced mainly to improve profitability. The
crops that have been introduced are seasonal
and are not highly labour intensive but this
method will help to deploy the present
workforce on more productive fields along
with the maximisation of crop and secure
enhanced income from the uneconomical
areas planted with new crops. The new
crops that have been introduced are not
highly labour intensive and are seasonal in
nature. Thus, the exciting workforce can
bee deployed in a more productive manner
so as to enhance income divided from the
areas planted with the new crops. Cinnamon,
coconut, and fuelwood have already shown
great promise.
GRI 102-07,103-02,417-01
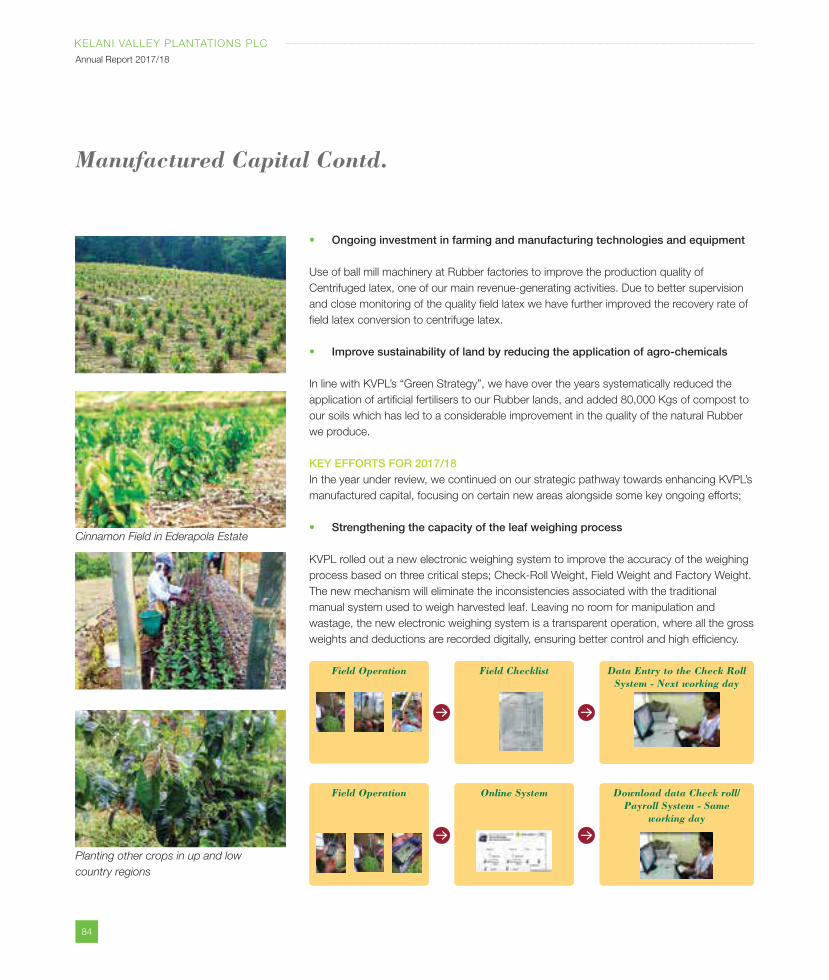
84
KELANI VALLEY PLANTATIONS PLC
Annual Report 2017/18
Ongoing investment in farming and manufacturing technologies and equipment
Use of ball mill machinery at Rubber factories to improve the production quality of
Centrifuged latex, one of our main revenue-generating activities. Due to better supervision
and close monitoring of the quality field latex we have further improved the recovery rate of
field latex conversion to centrifuge latex.
Improve sustainability of land by reducing the application of agro-chemicals
In line with KVPL’s “Green Strategy”, we have over the years systematically reduced the
application of artificial fertilisers to our Rubber lands, and added 80,000 Kgs of compost to
our soils which has led to a considerable improvement in the quality of the natural Rubber
we produce.
KEY EFFORTS FOR 2017/18In the year under review, we continued on our strategic pathway towards enhancing KVPL’s
manufactured capital, focusing on certain new areas alongside some key ongoing efforts;
Strengthening the capacity of the leaf weighing process
KVPL rolled out a new electronic weighing system to improve the accuracy of the weighing
process based on three critical steps; Check-Roll Weight, Field Weight and Factory Weight.
The new mechanism will eliminate the inconsistencies associated with the traditional
manual system used to weigh harvested leaf. Leaving no room for manipulation and
wastage, the new electronic weighing system is a transparent operation, where all the gross
weights and deductions are recorded digitally, ensuring better control and high efficiency.
Manufactured Capital Contd.
Cinnamon Field in Ederapola Estate
Planting other crops in up and low
country regions
Field Operation
Field Operation
Data Entry to the Check Roll System - Next working day
Download data Check roll/Payroll System - Same
working day
Field Checklist
Online System
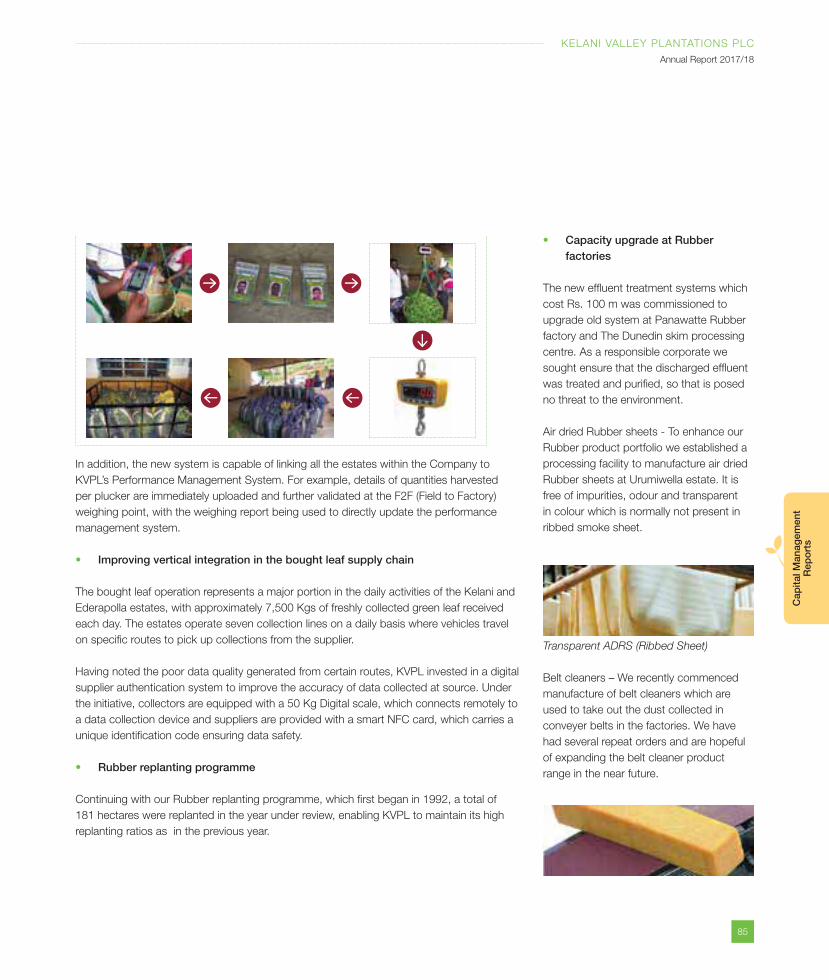
85
KELANI VALLEY PLANTATIONS PLC
Annual Report 2017/18
Cap
ital M
anag
emen
t R
epo
rts
In addition, the new system is capable of linking all the estates within the Company to
KVPL’s Performance Management System. For example, details of quantities harvested
per plucker are immediately uploaded and further validated at the F2F (Field to Factory)
weighing point, with the weighing report being used to directly update the performance
management system.
Improving vertical integration in the bought leaf supply chain
The bought leaf operation represents a major portion in the daily activities of the Kelani and
Ederapolla estates, with approximately 7,500 Kgs of freshly collected green leaf received
each day. The estates operate seven collection lines on a daily basis where vehicles travel
on specific routes to pick up collections from the supplier.
Having noted the poor data quality generated from certain routes, KVPL invested in a digital
supplier authentication system to improve the accuracy of data collected at source. Under
the initiative, collectors are equipped with a 50 Kg Digital scale, which connects remotely to
a data collection device and suppliers are provided with a smart NFC card, which carries a
unique identification code ensuring data safety.
Rubber replanting programme
Continuing with our Rubber replanting programme, which first began in 1992, a total of
181 hectares were replanted in the year under review, enabling KVPL to maintain its high
replanting ratios as in the previous year.
Capacity upgrade at Rubber factories
The new effluent treatment systems which
cost Rs. 100 m was commissioned to
upgrade old system at Panawatte Rubber
factory and The Dunedin skim processing
centre. As a responsible corporate we
sought ensure that the discharged effluent
was treated and purified, so that is posed
no threat to the environment.
Air dried Rubber sheets - To enhance our
Rubber product portfolio we established a
processing facility to manufacture air dried
Rubber sheets at Urumiwella estate. It is
free of impurities, odour and transparent
in colour which is normally not present in
ribbed smoke sheet.
Transparent ADRS (Ribbed Sheet)
Belt cleaners – We recently commenced
manufacture of belt cleaners which are
used to take out the dust collected in
conveyer belts in the factories. We have
had several repeat orders and are hopeful
of expanding the belt cleaner product
range in the near future.
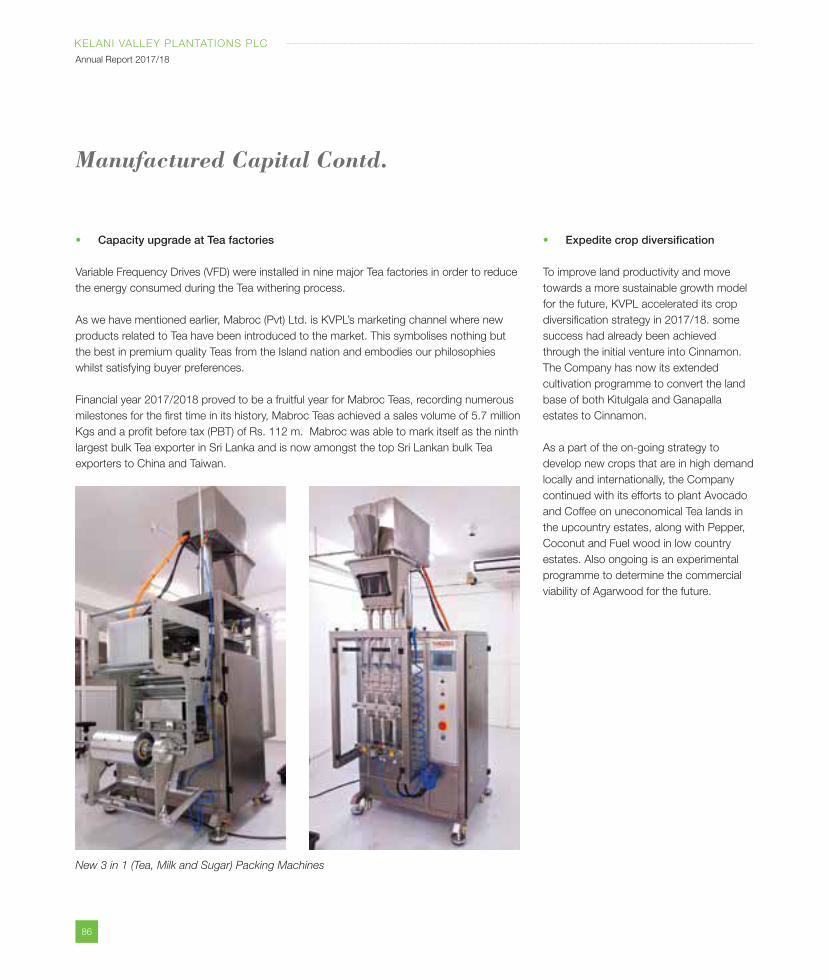
86
KELANI VALLEY PLANTATIONS PLC
Annual Report 2017/18
Capacity upgrade at Tea factories
Variable Frequency Drives (VFD) were installed in nine major Tea factories in order to reduce
the energy consumed during the Tea withering process.
As we have mentioned earlier, Mabroc (Pvt) Ltd. is KVPL’s marketing channel where new
products related to Tea have been introduced to the market. This symbolises nothing but
the best in premium quality Teas from the Island nation and embodies our philosophies
whilst satisfying buyer preferences.
Financial year 2017/2018 proved to be a fruitful year for Mabroc Teas, recording numerous
milestones for the first time in its history, Mabroc Teas achieved a sales volume of 5.7 million
Kgs and a profit before tax (PBT) of Rs. 112 m. Mabroc was able to mark itself as the ninth
largest bulk Tea exporter in Sri Lanka and is now amongst the top Sri Lankan bulk Tea
exporters to China and Taiwan.
New 3 in 1 (Tea, Milk and Sugar) Packing Machines
Manufactured Capital Contd.
Expedite crop diversification
To improve land productivity and move
towards a more sustainable growth model
for the future, KVPL accelerated its crop
diversification strategy in 2017/18. some
success had already been achieved
through the initial venture into Cinnamon.
The Company has now its extended
cultivation programme to convert the land
base of both Kitulgala and Ganapalla
estates to Cinnamon.
As a part of the on-going strategy to
develop new crops that are in high demand
locally and internationally, the Company
continued with its efforts to plant Avocado
and Coffee on uneconomical Tea lands in
the upcountry estates, along with Pepper,
Coconut and Fuel wood in low country
estates. Also ongoing is an experimental
programme to determine the commercial
viability of Agarwood for the future.
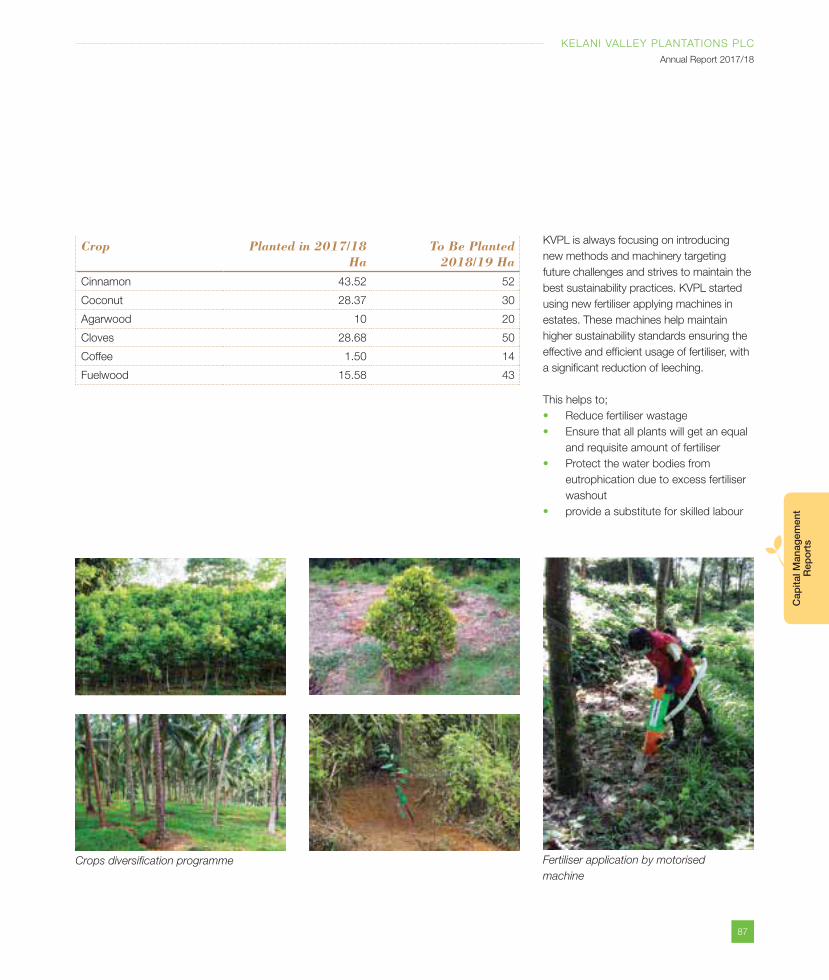
87
KELANI VALLEY PLANTATIONS PLC
Annual Report 2017/18
Cap
ital M
anag
emen
t R
epo
rts
KVPL is always focusing on introducing
new methods and machinery targeting
future challenges and strives to maintain the
best sustainability practices. KVPL started
using new fertiliser applying machines in
estates. These machines help maintain
higher sustainability standards ensuring the
effective and efficient usage of fertiliser, with
a significant reduction of leeching.
This helps to;
Reduce fertiliser wastage
Ensure that all plants will get an equal
and requisite amount of fertiliser
Protect the water bodies from
eutrophication due to excess fertiliser
washout
provide a substitute for skilled labour
Crop Planted in 2017/18 Ha
To Be Planted 2018/19 Ha
Cinnamon 43.52 52
Coconut 28.37 30
Agarwood 10 20
Cloves 28.68 50
Coffee 1.50 14
Fuelwood 15.58 43
Fertiliser application by motorised
machine
Crops diversification programme
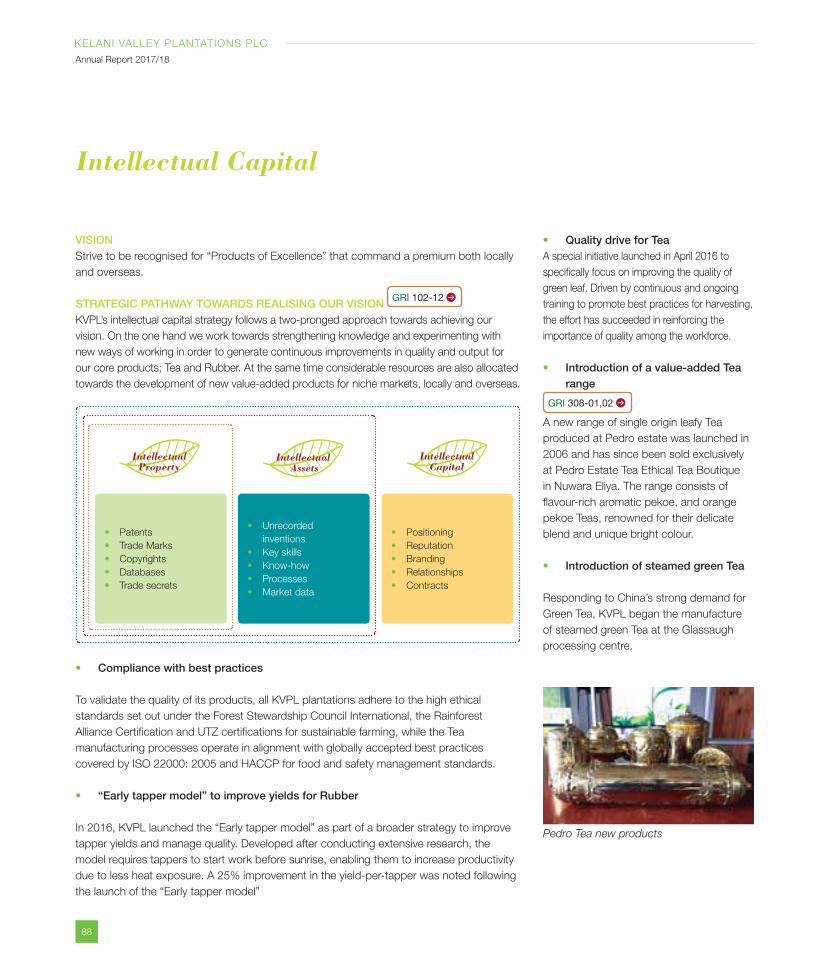
88
KELANI VALLEY PLANTATIONS PLC
Annual Report 2017/18
Intellectual Capital
VISIONStrive to be recognised for “Products of Excellence” that command a premium both locally
and overseas.
STRATEGIC PATHWAY TOWARDS REALISING OUR VISION GRI 102-12
KVPL’s intellectual capital strategy follows a two-pronged approach towards achieving our
vision. On the one hand we work towards strengthening knowledge and experimenting with
new ways of working in order to generate continuous improvements in quality and output for
our core products; Tea and Rubber. At the same time considerable resources are also allocated
towards the development of new value-added products for niche markets, locally and overseas.
Compliance with best practices
To validate the quality of its products, all KVPL plantations adhere to the high ethical
standards set out under the Forest Stewardship Council International, the Rainforest
Alliance Certification and UTZ certifications for sustainable farming, while the Tea
manufacturing processes operate in alignment with globally accepted best practices
covered by ISO 22000: 2005 and HACCP for food and safety management standards.
“Early tapper model” to improve yields for Rubber
In 2016, KVPL launched the “Early tapper model” as part of a broader strategy to improve
tapper yields and manage quality. Developed after conducting extensive research, the
model requires tappers to start work before sunrise, enabling them to increase productivity
due to less heat exposure. A 25% improvement in the yield-per-tapper was noted following
the launch of the “Early tapper model”
Quality drive for TeaA special initiative launched in April 2016 to
specifically focus on improving the quality of
green leaf. Driven by continuous and ongoing
training to promote best practices for harvesting,
the effort has succeeded in reinforcing the
importance of quality among the workforce.
Introduction of a value-added Tea range
GRI 308-01,02
A new range of single origin leafy Tea
produced at Pedro estate was launched in
2006 and has since been sold exclusively
at Pedro Estate Tea Ethical Tea Boutique
in Nuwara Eliya. The range consists of
flavour-rich aromatic pekoe, and orange
pekoe Teas, renowned for their delicate
blend and unique bright colour.
Introduction of steamed green Tea
Responding to China’s strong demand for
Green Tea, KVPL began the manufacture
of steamed green Tea at the Glassaugh
processing centre.
Pedro Tea new products
Patents
Trade Marks
Copyrights
Databases
Trade secrets
Intellectual Property
Unrecorded
inventions
Key skills
Know-how
Processes
Market data
Intellectual Assets
Positioning
Reputation
Branding
Relationships
Contracts
Intellectual Capital
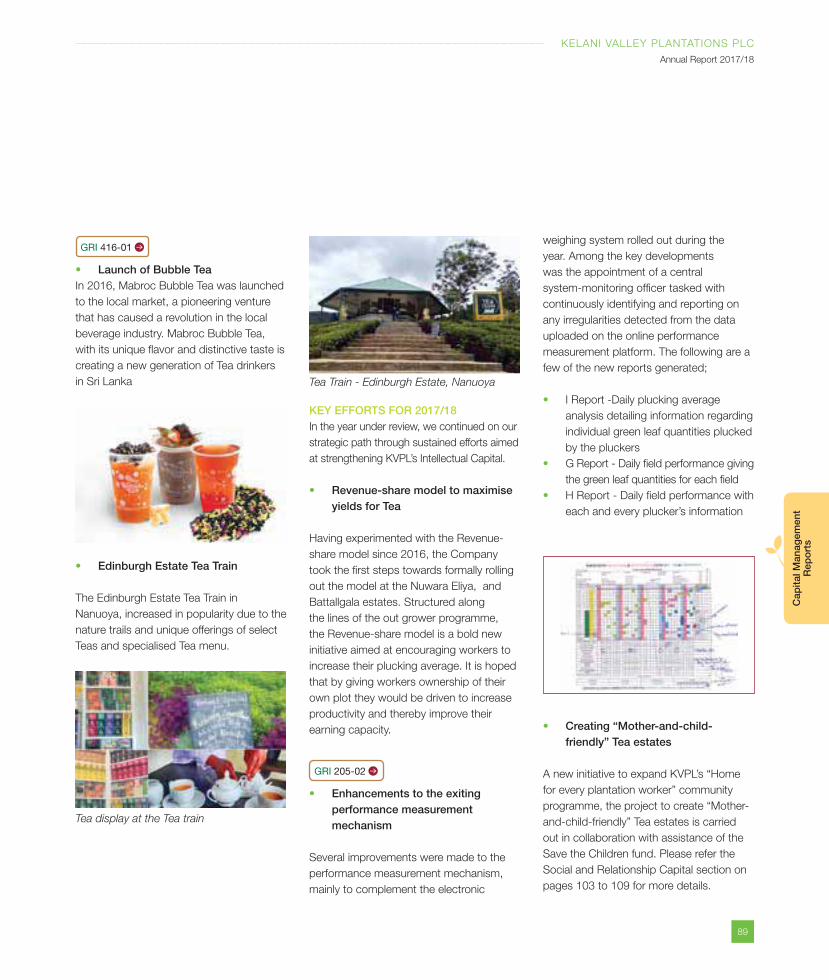
89
KELANI VALLEY PLANTATIONS PLC
Annual Report 2017/18
Cap
ital M
anag
emen
t R
epo
rts
GRI 416-01
Launch of Bubble TeaIn 2016, Mabroc Bubble Tea was launched
to the local market, a pioneering venture
that has caused a revolution in the local
beverage industry. Mabroc Bubble Tea,
with its unique flavor and distinctive taste is
creating a new generation of Tea drinkers
in Sri Lanka
Edinburgh Estate Tea Train
The Edinburgh Estate Tea Train in
Nanuoya, increased in popularity due to the
nature trails and unique offerings of select
Teas and specialised Tea menu.
KEY EFFORTS FOR 2017/18In the year under review, we continued on our
strategic path through sustained efforts aimed
at strengthening KVPL’s Intellectual Capital.
Revenue-share model to maximise yields for Tea
Having experimented with the Revenue-
share model since 2016, the Company
took the first steps towards formally rolling
out the model at the Nuwara Eliya, and
Battallgala estates. Structured along
the lines of the out grower programme,
the Revenue-share model is a bold new
initiative aimed at encouraging workers to
increase their plucking average. It is hoped
that by giving workers ownership of their
own plot they would be driven to increase
productivity and thereby improve their
earning capacity.
GRI 205-02
Enhancements to the exiting performance measurement mechanism
Several improvements were made to the
performance measurement mechanism,
mainly to complement the electronic
weighing system rolled out during the
year. Among the key developments
was the appointment of a central
system-monitoring officer tasked with
continuously identifying and reporting on
any irregularities detected from the data
uploaded on the online performance
measurement platform. The following are a
few of the new reports generated;
I Report -Daily plucking average
analysis detailing information regarding
individual green leaf quantities plucked
by the pluckers
G Report - Daily field performance giving
the green leaf quantities for each field
H Report - Daily field performance with
each and every plucker’s information
Tea Train - Edinburgh Estate, Nanuoya
Tea display at the Tea train
Creating “Mother-and-child-friendly” Tea estates
A new initiative to expand KVPL’s “Home
for every plantation worker” community
programme, the project to create “Mother-
and-child-friendly” Tea estates is carried
out in collaboration with assistance of the
Save the Children fund. Please refer the
Social and Relationship Capital section on
pages 103 to 109 for more details.
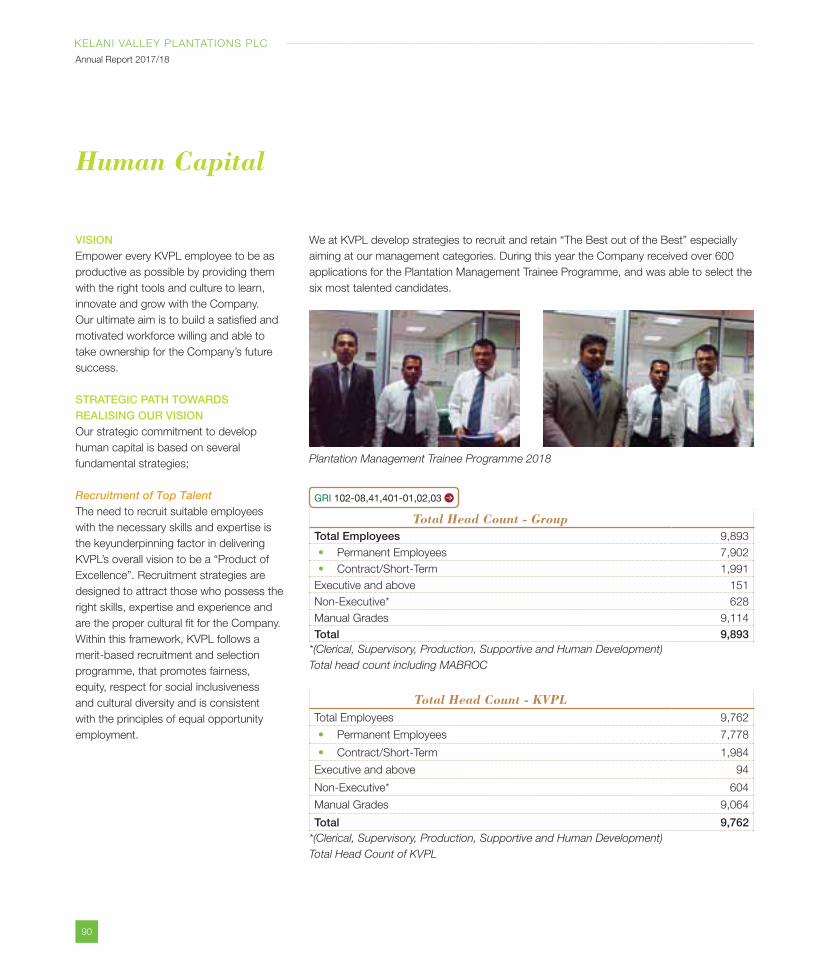
90
KELANI VALLEY PLANTATIONS PLC
Annual Report 2017/18
We at KVPL develop strategies to recruit and retain “The Best out of the Best” especially
aiming at our management categories. During this year the Company received over 600
applications for the Plantation Management Trainee Programme, and was able to select the
six most talented candidates.
Human Capital
VISIONEmpower every KVPL employee to be as
productive as possible by providing them
with the right tools and culture to learn,
innovate and grow with the Company.
Our ultimate aim is to build a satisfied and
motivated workforce willing and able to
take ownership for the Company’s future
success.
STRATEGIC PATH TOWARDS REALISING OUR VISIONOur strategic commitment to develop
human capital is based on several
fundamental strategies;
Recruitment of Top TalentThe need to recruit suitable employees
with the necessary skills and expertise is
the keyunderpinning factor in delivering
KVPL’s overall vision to be a “Product of
Excellence”. Recruitment strategies are
designed to attract those who possess the
right skills, expertise and experience and
are the proper cultural fit for the Company.
Within this framework, KVPL follows a
merit-based recruitment and selection
programme, that promotes fairness,
equity, respect for social inclusiveness
and cultural diversity and is consistent
with the principles of equal opportunity
employment.
GRI 102-08,41,401-01,02,03
Total Head Count - Group Total Employees 9,893
Permanent Employees 7,902
Contract/Short-Term 1,991
Executive and above 151
Non-Executive* 628
Manual Grades 9,114
Total 9,893*(Clerical, Supervisory, Production, Supportive and Human Development)
Total head count including MABROC
Total Head Count - KVPL Total Employees 9,762
Permanent Employees 7,778
Contract/Short-Term 1,984
Executive and above 94
Non-Executive* 604
Manual Grades 9,064
Total 9,762*(Clerical, Supervisory, Production, Supportive and Human Development)
Total Head Count of KVPL
Plantation Management Trainee Programme 2018
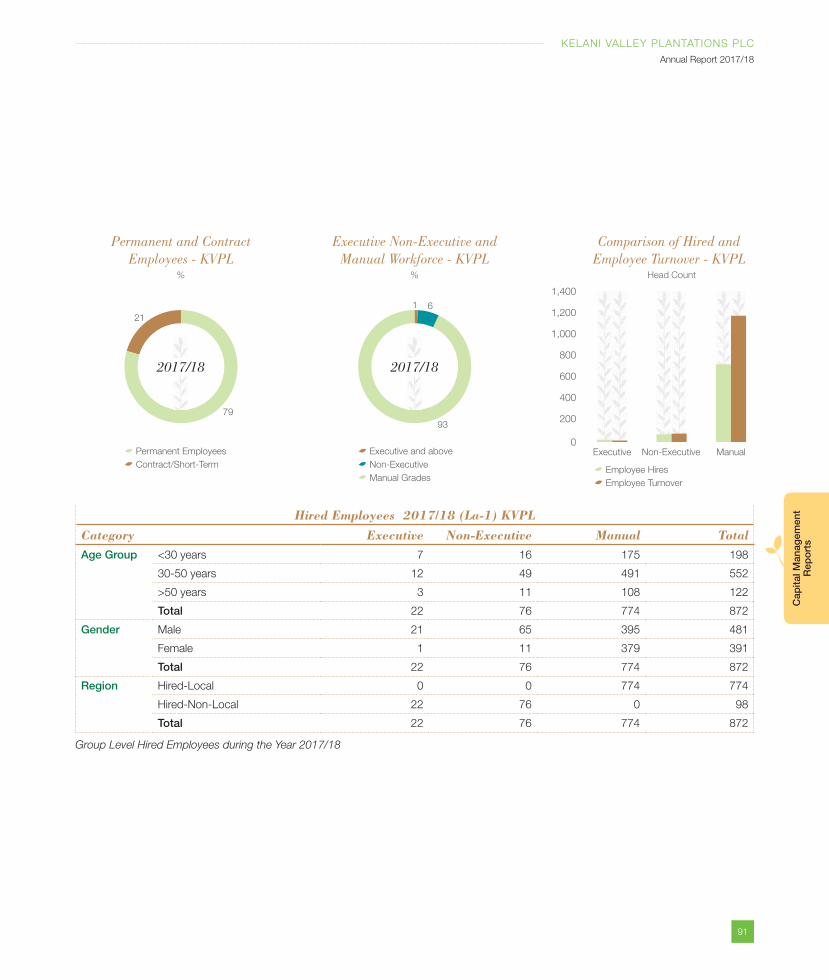
91
KELANI VALLEY PLANTATIONS PLC
Annual Report 2017/18
Cap
ital M
anag
emen
t R
epo
rts
Hired Employees 2017/18 (La-1) KVPLCategory Executive Non-Executive Manual TotalAge Group <30 years 7 16 175 198
30-50 years 12 49 491 552
>50 years 3 11 108 122
Total 22 76 774 872
Gender Male 21 65 395 481
Female 1 11 379 391
Total 22 76 774 872
Region Hired-Local 0 0 774 774
Hired-Non-Local 22 76 0 98
Total 22 76 774 872
Group Level Hired Employees during the Year 2017/18
Comparison of Hired and Employee Turnover - KVPL
Head Count
400
1,400
600
800
1,000
1,200
0
200
Executive Non-Executive Manual
Employee Hires
Employee Turnover
Permanent and Contract Employees - KVPL
%
Permanent Employees
Contract/Short-Term
79
21
2017/18
Executive Non-Executive and Manual Workforce - KVPL
%
Executive and above
Non-Executive
Manual Grades
93
61
2017/18
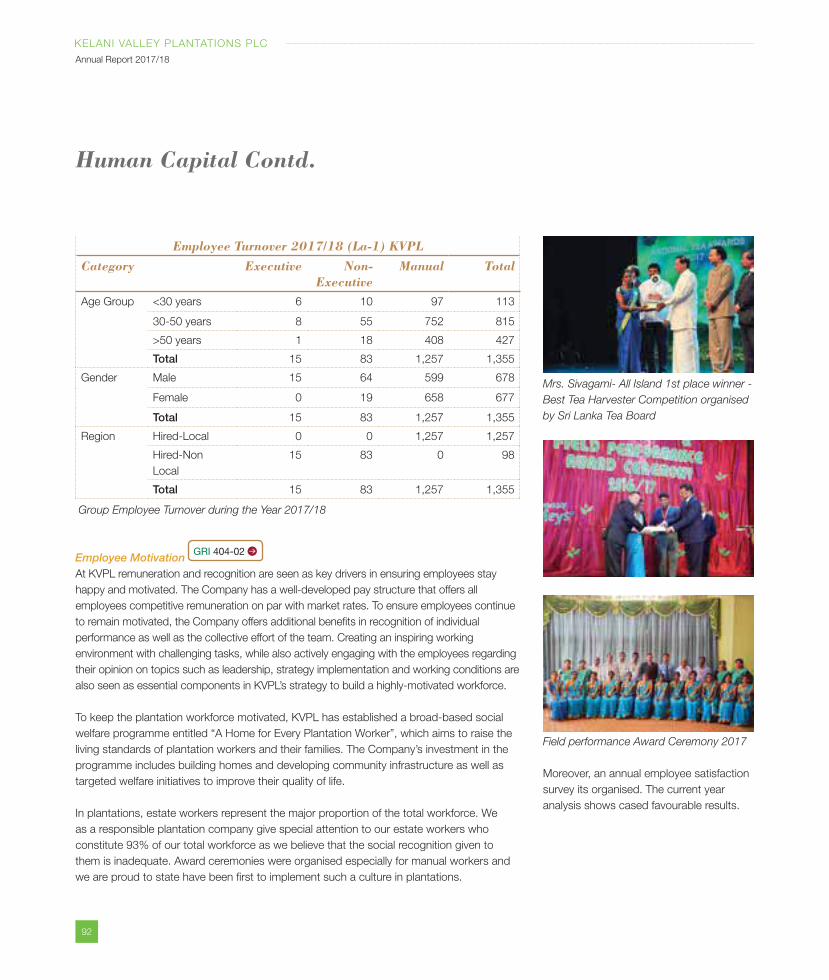
92
KELANI VALLEY PLANTATIONS PLC
Annual Report 2017/18
Employee Turnover 2017/18 (La-1) KVPLCategory Executive Non-
ExecutiveManual Total
Age Group <30 years 6 10 97 113
30-50 years 8 55 752 815
>50 years 1 18 408 427
Total 15 83 1,257 1,355
Gender Male 15 64 599 678
Female 0 19 658 677
Total 15 83 1,257 1,355
Region Hired-Local 0 0 1,257 1,257
Hired-Non
Local
15 83 0 98
Total 15 83 1,257 1,355
Group Employee Turnover during the Year 2017/18
Employee Motivation GRI 404-02
At KVPL remuneration and recognition are seen as key drivers in ensuring employees stay
happy and motivated. The Company has a well-developed pay structure that offers all
employees competitive remuneration on par with market rates. To ensure employees continue
to remain motivated, the Company offers additional benefits in recognition of individual
performance as well as the collective effort of the team. Creating an inspiring working
environment with challenging tasks, while also actively engaging with the employees regarding
their opinion on topics such as leadership, strategy implementation and working conditions are
also seen as essential components in KVPL’s strategy to build a highly-motivated workforce.
To keep the plantation workforce motivated, KVPL has established a broad-based social
welfare programme entitled “A Home for Every Plantation Worker”, which aims to raise the
living standards of plantation workers and their families. The Company’s investment in the
programme includes building homes and developing community infrastructure as well as
targeted welfare initiatives to improve their quality of life.
In plantations, estate workers represent the major proportion of the total workforce. We
as a responsible plantation company give special attention to our estate workers who
constitute 93% of our total workforce as we believe that the social recognition given to
them is inadequate. Award ceremonies were organised especially for manual workers and
we are proud to state have been first to implement such a culture in plantations.
Mrs. Sivagami- All Island 1st place winner -
Best Tea Harvester Competition organised
by Sri Lanka Tea Board
Field performance Award Ceremony 2017
Moreover, an annual employee satisfaction
survey its organised. The current year
analysis shows cased favourable results.
Human Capital Contd.
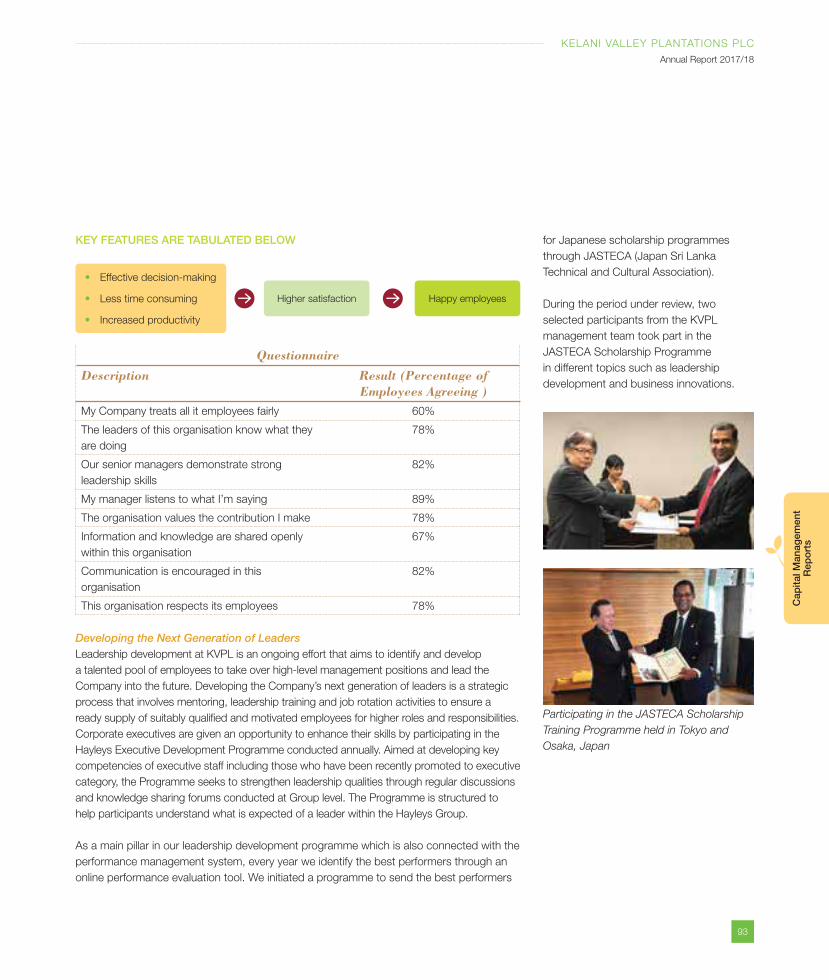
93
KELANI VALLEY PLANTATIONS PLC
Annual Report 2017/18
Cap
ital M
anag
emen
t R
epo
rts
for Japanese scholarship programmes
through JASTECA (Japan Sri Lanka
Technical and Cultural Association).
During the period under review, two
selected participants from the KVPL
management team took part in the
JASTECA Scholarship Programme
in different topics such as leadership
development and business innovations.
KEY FEATURES ARE TABULATED BELOW
Questionnaire
Description Result (Percentage of Employees Agreeing )
My Company treats all it employees fairly 60%
The leaders of this organisation know what they
are doing
78%
Our senior managers demonstrate strong
leadership skills
82%
My manager listens to what I’m saying 89%
The organisation values the contribution I make 78%
Information and knowledge are shared openly
within this organisation
67%
Communication is encouraged in this
organisation
82%
This organisation respects its employees 78%
Developing the Next Generation of LeadersLeadership development at KVPL is an ongoing effort that aims to identify and develop
a talented pool of employees to take over high-level management positions and lead the
Company into the future. Developing the Company’s next generation of leaders is a strategic
process that involves mentoring, leadership training and job rotation activities to ensure a
ready supply of suitably qualified and motivated employees for higher roles and responsibilities.
Corporate executives are given an opportunity to enhance their skills by participating in the
Hayleys Executive Development Programme conducted annually. Aimed at developing key
competencies of executive staff including those who have been recently promoted to executive
category, the Programme seeks to strengthen leadership qualities through regular discussions
and knowledge sharing forums conducted at Group level. The Programme is structured to
help participants understand what is expected of a leader within the Hayleys Group.
As a main pillar in our leadership development programme which is also connected with the
performance management system, every year we identify the best performers through an
online performance evaluation tool. We initiated a programme to send the best performers
Effective decision-making
Less time consuming
Increased productivity
Higher satisfaction Happy employees
Participating in the JASTECA Scholarship
Training Programme held in Tokyo and
Osaka, Japan
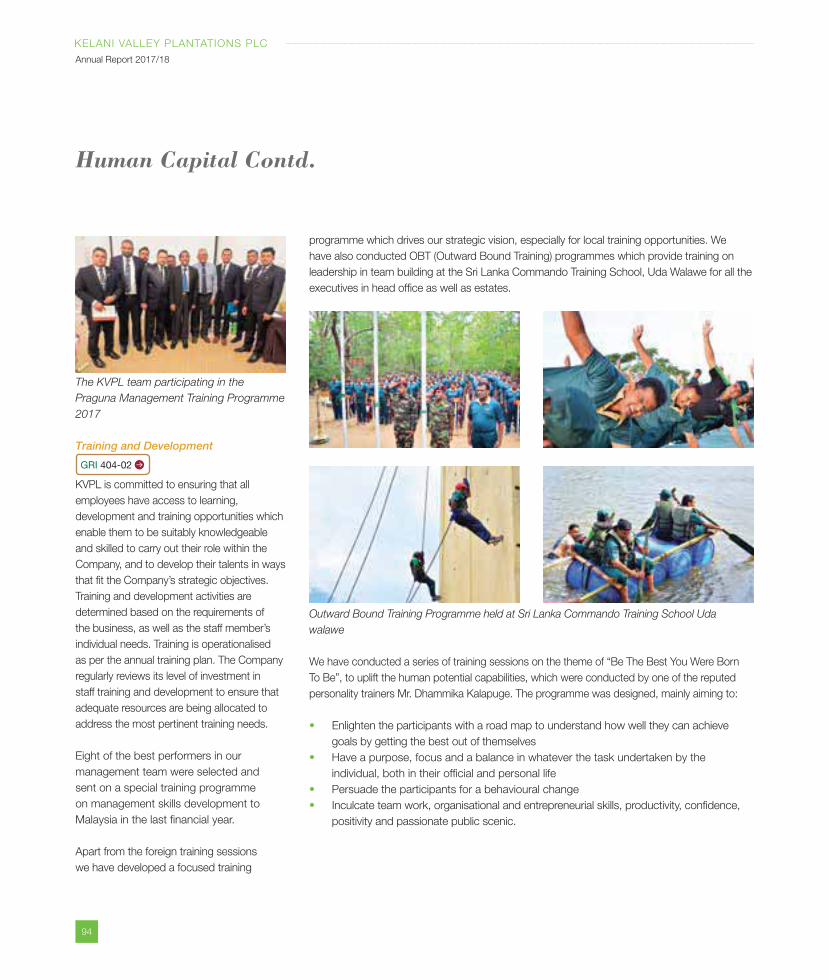
94
KELANI VALLEY PLANTATIONS PLC
Annual Report 2017/18
The KVPL team participating in the
Praguna Management Training Programme
2017
Training and Development
GRI 404-02
KVPL is committed to ensuring that all
employees have access to learning,
development and training opportunities which
enable them to be suitably knowledgeable
and skilled to carry out their role within the
Company, and to develop their talents in ways
that fit the Company’s strategic objectives.
Training and development activities are
determined based on the requirements of
the business, as well as the staff member’s
individual needs. Training is operationalised
as per the annual training plan. The Company
regularly reviews its level of investment in
staff training and development to ensure that
adequate resources are being allocated to
address the most pertinent training needs.
Eight of the best performers in our
management team were selected and
sent on a special training programme
on management skills development to
Malaysia in the last financial year.
Apart from the foreign training sessions
we have developed a focused training
programme which drives our strategic vision, especially for local training opportunities. We
have also conducted OBT (Outward Bound Training) programmes which provide training on
leadership in team building at the Sri Lanka Commando Training School, Uda Walawe for all the
executives in head office as well as estates.
Outward Bound Training Programme held at Sri Lanka Commando Training School Uda
walawe
We have conducted a series of training sessions on the theme of “Be The Best You Were Born
To Be”, to uplift the human potential capabilities, which were conducted by one of the reputed
personality trainers Mr. Dhammika Kalapuge. The programme was designed, mainly aiming to:
Enlighten the participants with a road map to understand how well they can achieve
goals by getting the best out of themselves
Have a purpose, focus and a balance in whatever the task undertaken by the
individual, both in their official and personal life
Persuade the participants for a behavioural change
Inculcate team work, organisational and entrepreneurial skills, productivity, confidence,
positivity and passionate public scenic.
Human Capital Contd.
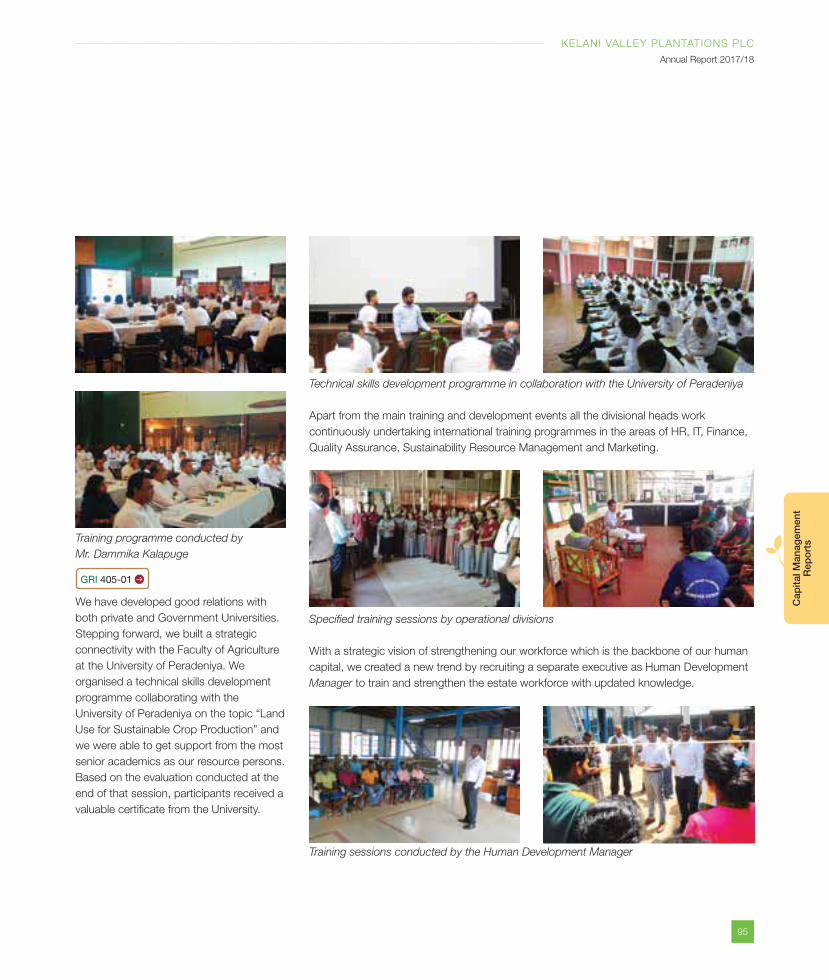
95
KELANI VALLEY PLANTATIONS PLC
Annual Report 2017/18
Cap
ital M
anag
emen
t R
epo
rts
Technical skills development programme in collaboration with the University of Peradeniya
Apart from the main training and development events all the divisional heads work
continuously undertaking international training programmes in the areas of HR, IT, Finance,
Quality Assurance, Sustainability Resource Management and Marketing.
Specified training sessions by operational divisions
With a strategic vision of strengthening our workforce which is the backbone of our human
capital, we created a new trend by recruiting a separate executive as Human Development
Manager to train and strengthen the estate workforce with updated knowledge.
Training sessions conducted by the Human Development Manager
Training programme conducted by
Mr. Dammika Kalapuge
GRI 405-01
We have developed good relations with
both private and Government Universities.
Stepping forward, we built a strategic
connectivity with the Faculty of Agriculture
at the University of Peradeniya. We
organised a technical skills development
programme collaborating with the
University of Peradeniya on the topic “Land
Use for Sustainable Crop Production” and
we were able to get support from the most
senior academics as our resource persons.
Based on the evaluation conducted at the
end of that session, participants received a
valuable certificate from the University.
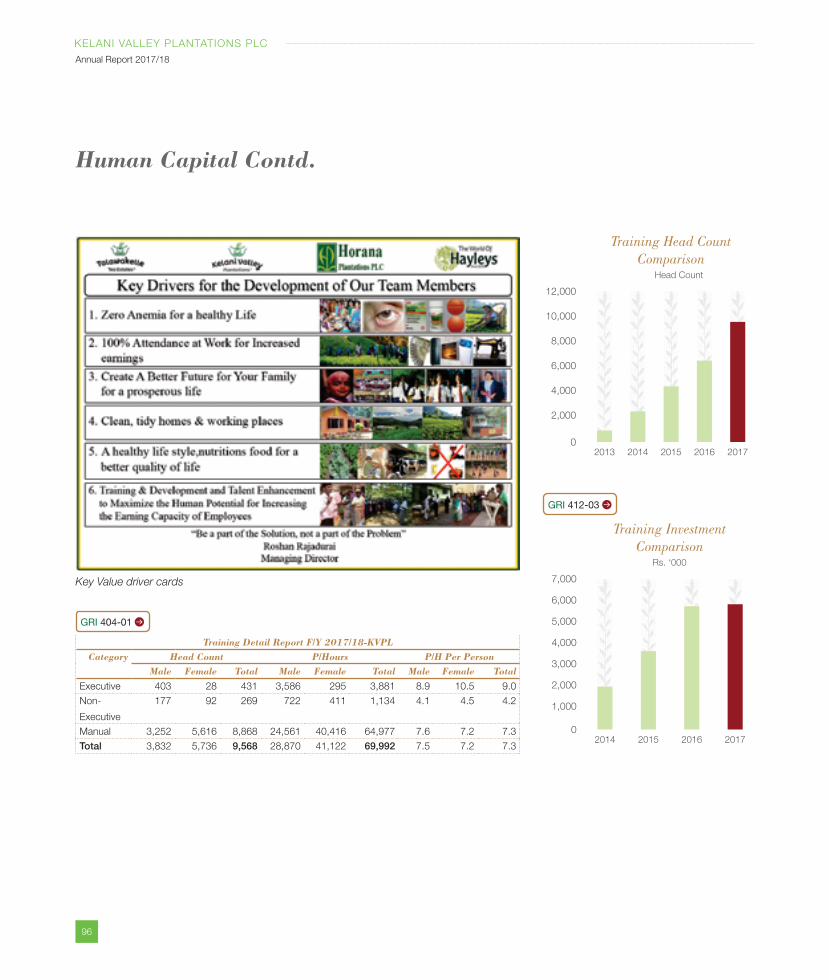
96
KELANI VALLEY PLANTATIONS PLC
Annual Report 2017/18
Human Capital Contd.
GRI 404-01
Training Detail Report F/Y 2017/18-KVPLCategory Head Count P/Hours P/H Per Person
Male Female Total Male Female Total Male Female Total
Executive 403 28 431 3,586 295 3,881 8.9 10.5 9.0
Non-
Executive
177 92 269 722 411 1,134 4.1 4.5 4.2
Manual 3,252 5,616 8,868 24,561 40,416 64,977 7.6 7.2 7.3
Total 3,832 5,736 9,568 28,870 41,122 69,992 7.5 7.2 7.3
Training Head Count Comparison
Head Count
4,000
12,000
8,000
10,000
6,000
0
2,000
2013 2014 2015 2016 2017
Key Value driver cards
Training Investment Comparison
Rs. ‘000
4,000
7,000
6,000
5,000
3,000
1,000
0
2,000
2014 2015 2016 2017
GRI 412-03
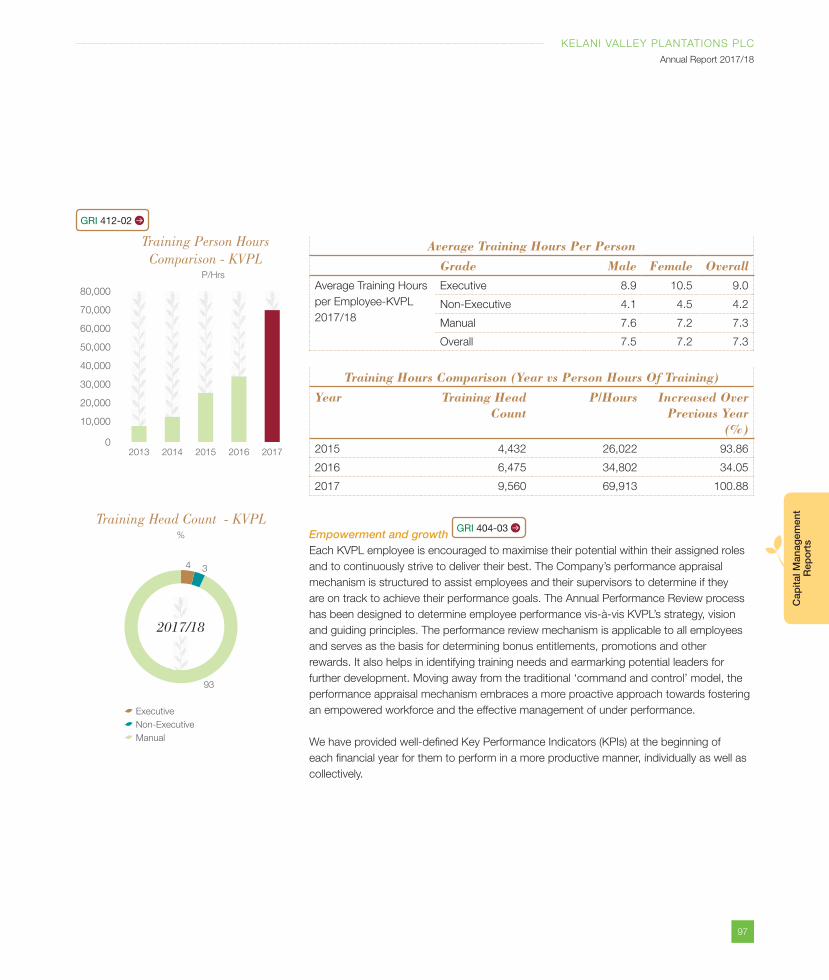
97
KELANI VALLEY PLANTATIONS PLC
Annual Report 2017/18
Cap
ital M
anag
emen
t R
epo
rts
Average Training Hours Per Person Grade Male Female OverallAverage Training Hours
per Employee-KVPL
2017/18
Executive 8.9 10.5 9.0
Non-Executive 4.1 4.5 4.2
Manual 7.6 7.2 7.3
Overall 7.5 7.2 7.3
Training Hours Comparison (Year vs Person Hours Of Training)Year Training Head
CountP/Hours Increased Over
Previous Year (%)
2015 4,432 26,022 93.86
2016 6,475 34,802 34.05
2017 9,560 69,913 100.88
Empowerment and growth GRI 404-03
Each KVPL employee is encouraged to maximise their potential within their assigned roles
and to continuously strive to deliver their best. The Company’s performance appraisal
mechanism is structured to assist employees and their supervisors to determine if they
are on track to achieve their performance goals. The Annual Performance Review process
has been designed to determine employee performance vis-à-vis KVPL’s strategy, vision
and guiding principles. The performance review mechanism is applicable to all employees
and serves as the basis for determining bonus entitlements, promotions and other
rewards. It also helps in identifying training needs and earmarking potential leaders for
further development. Moving away from the traditional ‘command and control’ model, the
performance appraisal mechanism embraces a more proactive approach towards fostering
an empowered workforce and the effective management of under performance.
We have provided well-defined Key Performance Indicators (KPIs) at the beginning of
each financial year for them to perform in a more productive manner, individually as well as
collectively.
Training Head Count - KVPL%
Executive
Non-Executive
Manual
93
34
2017/18
Training Person Hours Comparison - KVPL
P/Hrs
40,000
80,000
70,000
60,000
50,000
30,000
10,000
0
20,000
2013 2014 2015 2016 2017
GRI 412-02
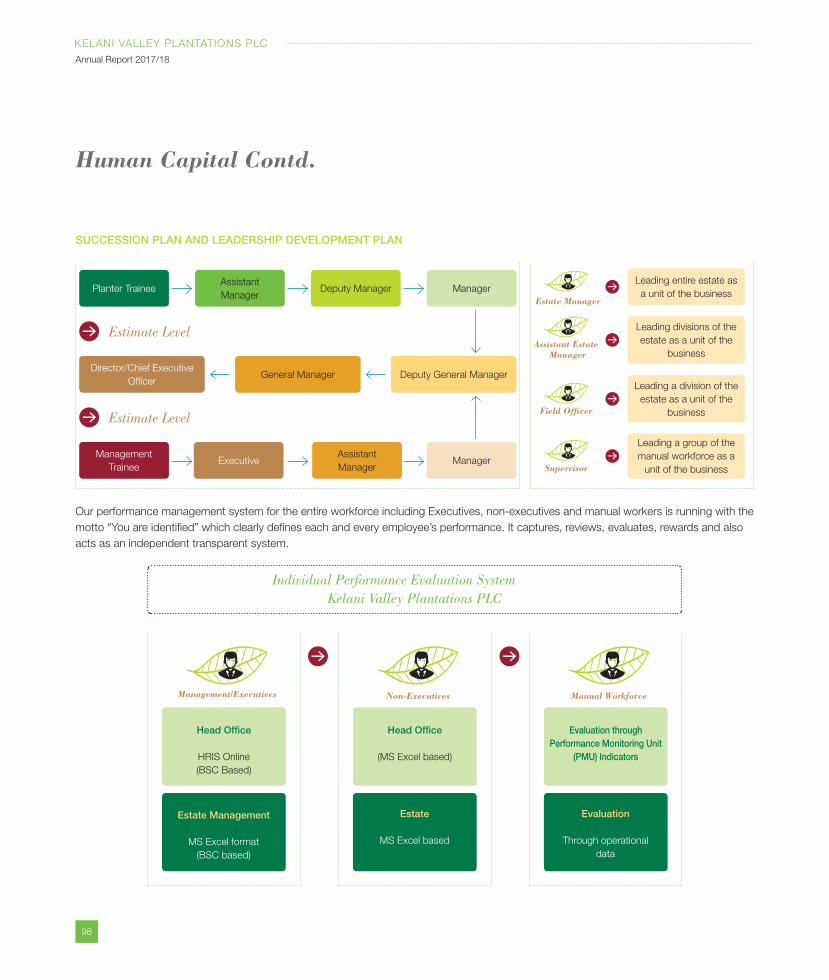
98
KELANI VALLEY PLANTATIONS PLC
Annual Report 2017/18
Human Capital Contd.
SUCCESSION PLAN AND LEADERSHIP DEVELOPMENT PLAN
Our performance management system for the entire workforce including Executives, non-executives and manual workers is running with the
motto “You are identified” which clearly defines each and every employee’s performance. It captures, reviews, evaluates, rewards and also
acts as an independent transparent system.
Planter TraineeAssistant
ManagerDeputy Manager Manager
Management
TraineeExecutive
Assistant
ManagerManager
Director/Chief Executive
OfficerGeneral Manager Deputy General Manager
Estimate Level
Estimate Level
Leading entire estate as
a unit of the business
Leading divisions of the
estate as a unit of the
business
Leading a division of the
estate as a unit of the
business
Leading a group of the
manual workforce as a
unit of the business
Estate Manager
Assistant Estate Manager
Field Officer
Supervisor
Individual Performance Evaluation System
Kelani Valley Plantations PLC
Estate
MS Excel based
Head Office
(MS Excel based)
Non-Executives
Estate Management
MS Excel format
(BSC based)
Head Office
HRIS Online
(BSC Based)
Management/Executives
Evaluation
Through operational
data
Evaluation through Performance Monitoring Unit
(PMU) Indicators
Manual Workforce
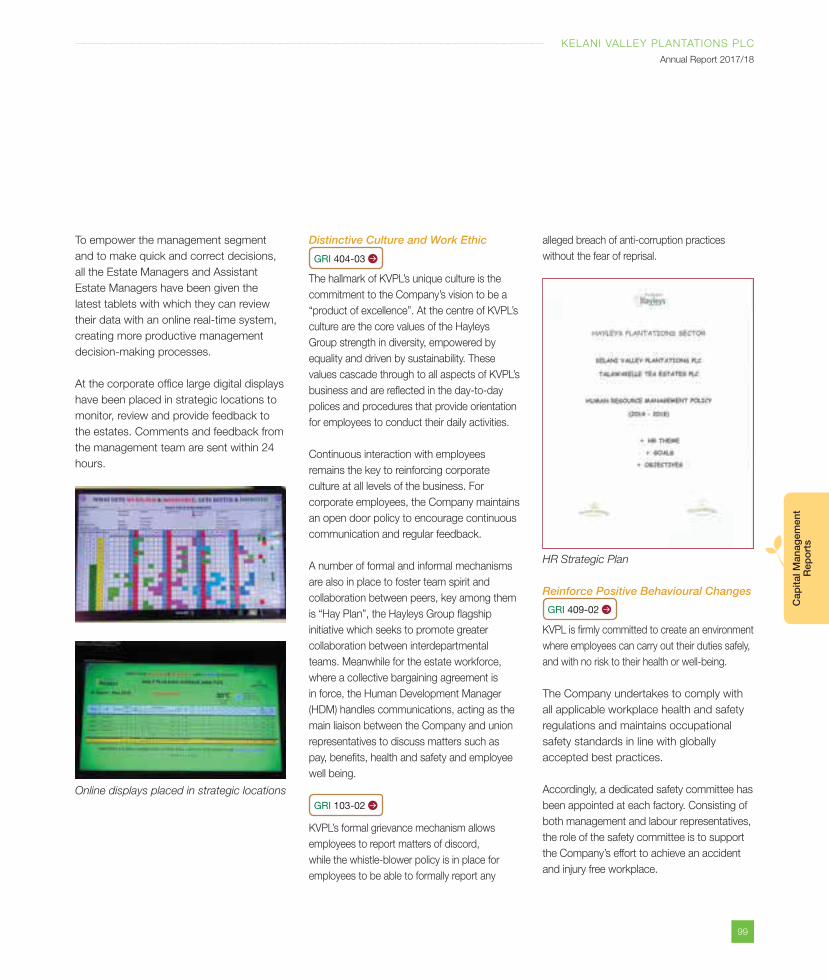
99
KELANI VALLEY PLANTATIONS PLC
Annual Report 2017/18
Cap
ital M
anag
emen
t R
epo
rts
alleged breach of anti-corruption practices
without the fear of reprisal.
HR Strategic Plan
Reinforce Positive Behavioural Changes
GRI 409-02
KVPL is firmly committed to create an environment
where employees can carry out their duties safely,
and with no risk to their health or well-being.
The Company undertakes to comply with
all applicable workplace health and safety
regulations and maintains occupational
safety standards in line with globally
accepted best practices.
Accordingly, a dedicated safety committee has
been appointed at each factory. Consisting of
both management and labour representatives,
the role of the safety committee is to support
the Company’s effort to achieve an accident
and injury free workplace.
To empower the management segment
and to make quick and correct decisions,
all the Estate Managers and Assistant
Estate Managers have been given the
latest tablets with which they can review
their data with an online real-time system,
creating more productive management
decision-making processes.
At the corporate office large digital displays
have been placed in strategic locations to
monitor, review and provide feedback to
the estates. Comments and feedback from
the management team are sent within 24
hours.
Distinctive Culture and Work Ethic
GRI 404-03
The hallmark of KVPL’s unique culture is the
commitment to the Company’s vision to be a
“product of excellence”. At the centre of KVPL’s
culture are the core values of the Hayleys
Group strength in diversity, empowered by
equality and driven by sustainability. These
values cascade through to all aspects of KVPL’s
business and are reflected in the day-to-day
polices and procedures that provide orientation
for employees to conduct their daily activities.
Continuous interaction with employees
remains the key to reinforcing corporate
culture at all levels of the business. For
corporate employees, the Company maintains
an open door policy to encourage continuous
communication and regular feedback.
A number of formal and informal mechanisms
are also in place to foster team spirit and
collaboration between peers, key among them
is “Hay Plan”, the Hayleys Group flagship
initiative which seeks to promote greater
collaboration between interdepartmental
teams. Meanwhile for the estate workforce,
where a collective bargaining agreement is
in force, the Human Development Manager
(HDM) handles communications, acting as the
main liaison between the Company and union
representatives to discuss matters such as
pay, benefits, health and safety and employee
well being.
GRI 103-02
KVPL’s formal grievance mechanism allows
employees to report matters of discord,
while the whistle-blower policy is in place for
employees to be able to formally report any
Online displays placed in strategic locations
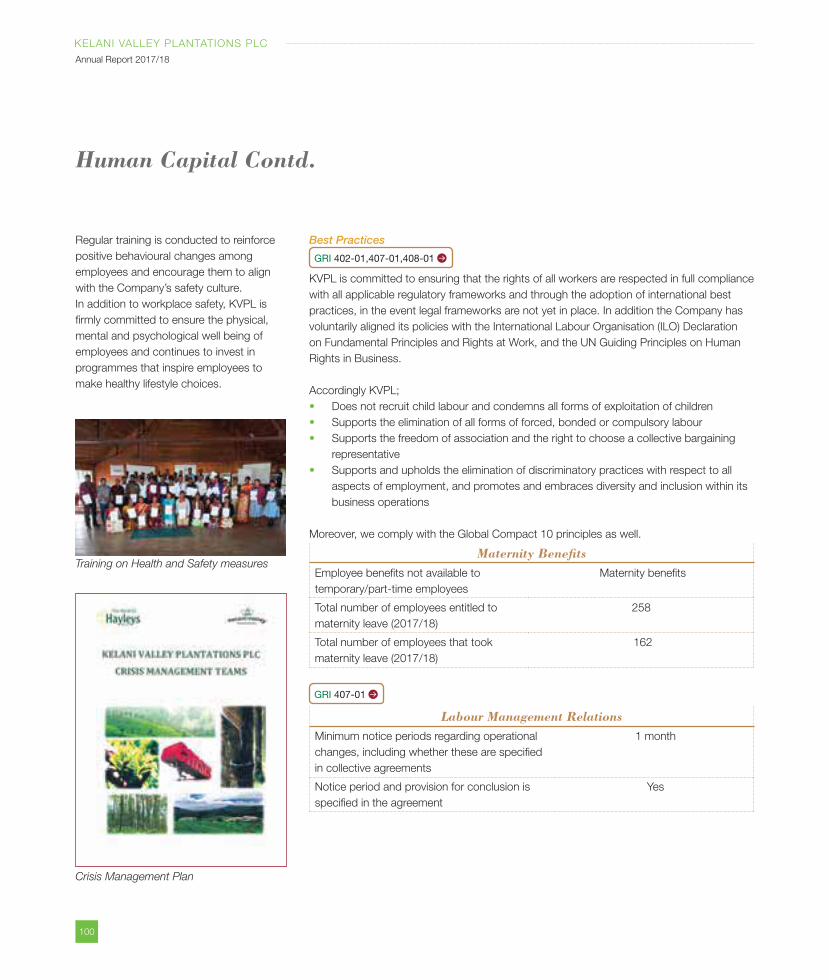
100
KELANI VALLEY PLANTATIONS PLC
Annual Report 2017/18
Regular training is conducted to reinforce
positive behavioural changes among
employees and encourage them to align
with the Company’s safety culture.
In addition to workplace safety, KVPL is
firmly committed to ensure the physical,
mental and psychological well being of
employees and continues to invest in
programmes that inspire employees to
make healthy lifestyle choices.
Human Capital Contd.
Best Practices
GRI 402-01,407-01,408-01
KVPL is committed to ensuring that the rights of all workers are respected in full compliance
with all applicable regulatory frameworks and through the adoption of international best
practices, in the event legal frameworks are not yet in place. In addition the Company has
voluntarily aligned its policies with the International Labour Organisation (ILO) Declaration
on Fundamental Principles and Rights at Work, and the UN Guiding Principles on Human
Rights in Business.
Accordingly KVPL;
Does not recruit child labour and condemns all forms of exploitation of children
Supports the elimination of all forms of forced, bonded or compulsory labour
Supports the freedom of association and the right to choose a collective bargaining
representative
Supports and upholds the elimination of discriminatory practices with respect to all
aspects of employment, and promotes and embraces diversity and inclusion within its
business operations
Moreover, we comply with the Global Compact 10 principles as well.
Maternity BenefitsEmployee benefits not available to
temporary/part-time employees
Maternity benefits
Total number of employees entitled to
maternity leave (2017/18)
258
Total number of employees that took
maternity leave (2017/18)
162
GRI 407-01
Labour Management RelationsMinimum notice periods regarding operational
changes, including whether these are specified
in collective agreements
1 month
Notice period and provision for conclusion is
specified in the agreement
Yes
Training on Health and Safety measures
Crisis Management Plan
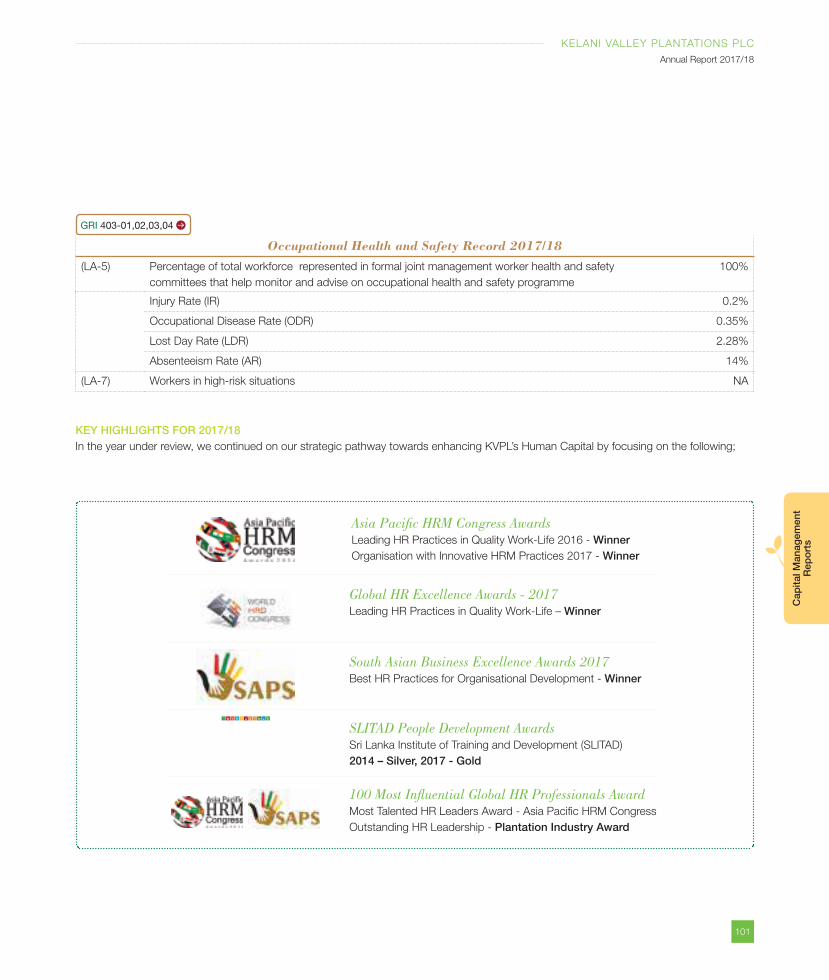
101
KELANI VALLEY PLANTATIONS PLC
Annual Report 2017/18
Cap
ital M
anag
emen
t R
epo
rts
Occupational Health and Safety Record 2017/18
(LA-5) Percentage of total workforce represented in formal joint management worker health and safety
committees that help monitor and advise on occupational health and safety programme
100%
Injury Rate (IR) 0.2%
Occupational Disease Rate (ODR) 0.35%
Lost Day Rate (LDR) 2.28%
Absenteeism Rate (AR) 14%
(LA-7) Workers in high-risk situations NA
KEY HIGHLIGHTS FOR 2017/18In the year under review, we continued on our strategic pathway towards enhancing KVPL’s Human Capital by focusing on the following;
Asia Pacific HRM Congress AwardsLeading HR Practices in Quality Work-Life 2016 - WinnerOrganisation with Innovative HRM Practices 2017 - Winner
Global HR Excellence Awards - 2017Leading HR Practices in Quality Work-Life – Winner
South Asian Business Excellence Awards 2017Best HR Practices for Organisational Development - Winner
SLITAD People Development AwardsSri Lanka Institute of Training and Development (SLITAD)
2014 – Silver, 2017 - Gold
100 Most Influential Global HR Professionals Award Most Talented HR Leaders Award - Asia Pacific HRM Congress
Outstanding HR Leadership - Plantation Industry Award
GRI 403-01,02,03,04
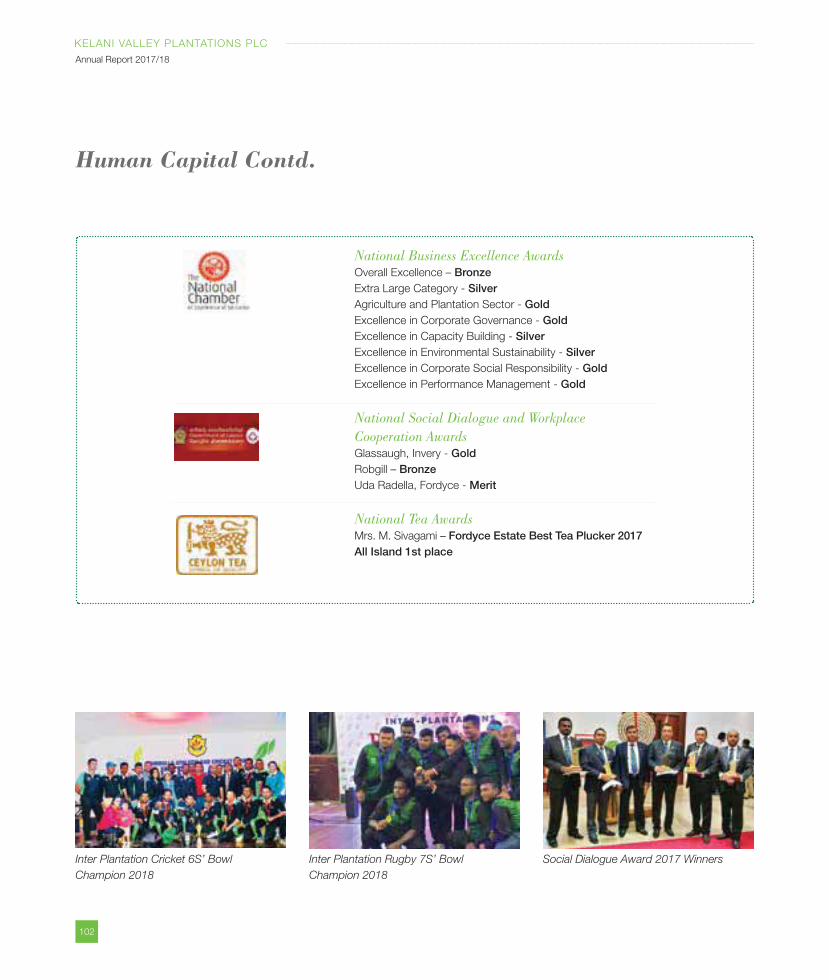
102
KELANI VALLEY PLANTATIONS PLC
Annual Report 2017/18
Human Capital Contd.
National Business Excellence AwardsOverall Excellence – Bronze
Extra Large Category - SilverAgriculture and Plantation Sector - GoldExcellence in Corporate Governance - GoldExcellence in Capacity Building - SilverExcellence in Environmental Sustainability - SilverExcellence in Corporate Social Responsibility - GoldExcellence in Performance Management - Gold
National Social Dialogue and Workplace
Cooperation Awards Glassaugh, Invery - Gold
Robgill – BronzeUda Radella, Fordyce - Merit
National Tea AwardsMrs. M. Sivagami – Fordyce Estate Best Tea Plucker 2017All Island 1st place
Inter Plantation Cricket 6S’ Bowl
Champion 2018
Inter Plantation Rugby 7S’ Bowl
Champion 2018
Social Dialogue Award 2017 Winners
103
KELANI VALLEY PLANTATIONS PLC
Annual Report 2017/18
Cap
ital M
anag
emen
t R
epo
rts
VISIONContribute towards nationwide socio-economic progress by providing a better work-life balance for the
plantation workforce and also ensuring a higher quality of life for the resident plantation communities.
STRATEGIC PATH TOWARDS REALISING OUR VISION GRI 415-01
Being a plantation Company, KVPL is responsible for the well-being of 58,000 people; the
9,762 strong plantation workforce as well as another 48,000 people who are part of the
extended communities residing on the plantations. Striving to maximise value created for
these stakeholders whose socio-economic status is heavily dependent on the Company,
KVPL recently expanded its social responsibility parameters to move away from the purely
philanthropic stance adopted in the past, in favour of a more strategic approach to;
Create a more conducive work environment for the plantation workforce with due
consideration of their physical, social and physiological wellbeing
Develop mutually-beneficial partnerships with plantation workers and communities
through continuous and ongoing engagement and open communication
Uplift the quality of life of KVPL’s plantation workforce and the plantation communities
through consistent investments that minimise socio-economic inequalities
Increase employee motivation and commitment in order to enhance productivity that
will serve as a key lever for growth
Foster a familial culture unique to KVPL
Depict KVPL as a good social steward
Home for Every Plantation Worker
The ‘Home for Every Plantation Worker’
programme, is a unique effort that
epitomises KVPL’s vision of community
care. First launched in 2006 as a CSR
initiative for the benefit of the plantation
workforce, the programme has since
grown to become KVPL’s flagship worker
welfare effort applied across all 25 KVPL
estates located in Nuwara Eliya, Hatton
and Yatiyantota-Bulathkohupitiya regions.
Based on the belief that employees who
benefit from a better quality of life would
be motivated to improve productivity, the
programme has recently been integrated as
a key component of KVPL’s sustainability
framework. This has enabled all community
efforts for the plantation workforce to be
channelled through the ‘Home for Every
Plantation Worker’ programme.
The programme is funded entirely by KVPL
with Rs. 1.50 for every kilo of single origin
leafy Tea sold being channelled to a special
fund created for the purpose. Over the
years the programme has also received
support from various interested parties,
Social and Relationship Capital
104
KELANI VALLEY PLANTATIONS PLC
Annual Report 2017/18
most recently the Save the Children Fund, which has pledged a sum of Rs. 23 m aimed at
improving maternal health.
Four key pillars drive the ‘Home for Every Plantation Worker’ programme;
Living Environment Improve the immediate living conditions of workers and their families by;
Upgrading and rehabilitation of traditional worker houses
Provision of factory and field rest-rooms
Electrification of housing and living quarters
Self–help housing projects involving the construction of new houses for plantation
employees, with 5-7 perches of estate land being allocated per house
Upgrading existing water supply schemes
Installation of new water delivery systems
Improving access roads to worker housing
Establishing rural agency post offices within the plantation boundaries
GRI 403-04
Health and Nutrition Facilitating basic health requirements
through;
Regular medical assistance for all
plantation communities.
Regular health and nutrition check-
ups which includes immunisation
and monitoring of child development,
maternal health and elder health
Common ambulance service for
estates in the same area.
Day care centres (‘crèches’)
Provision of medical facilities
addressing all major health
requirements.
Committed to Sustainable Business
Purity & Food Safety Ethical Business Environment Society
GRI 102-13
Social and Relationship Capital Contd.
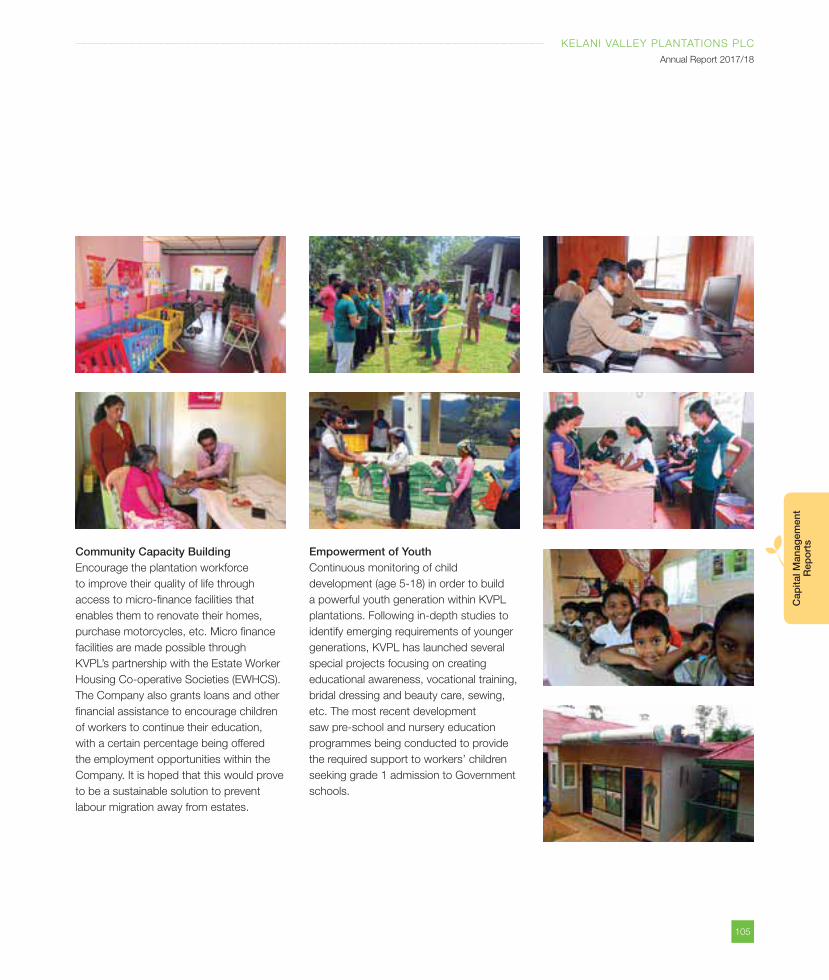
105
KELANI VALLEY PLANTATIONS PLC
Annual Report 2017/18
Cap
ital M
anag
emen
t R
epo
rts
Empowerment of Youth Continuous monitoring of child
development (age 5-18) in order to build
a powerful youth generation within KVPL
plantations. Following in-depth studies to
identify emerging requirements of younger
generations, KVPL has launched several
special projects focusing on creating
educational awareness, vocational training,
bridal dressing and beauty care, sewing,
etc. The most recent development
saw pre-school and nursery education
programmes being conducted to provide
the required support to workers’ children
seeking grade 1 admission to Government
schools.
Community Capacity Building Encourage the plantation workforce
to improve their quality of life through
access to micro-finance facilities that
enables them to renovate their homes,
purchase motorcycles, etc. Micro finance
facilities are made possible through
KVPL’s partnership with the Estate Worker
Housing Co-operative Societies (EWHCS).
The Company also grants loans and other
financial assistance to encourage children
of workers to continue their education,
with a certain percentage being offered
the employment opportunities within the
Company. It is hoped that this would prove
to be a sustainable solution to prevent
labour migration away from estates.
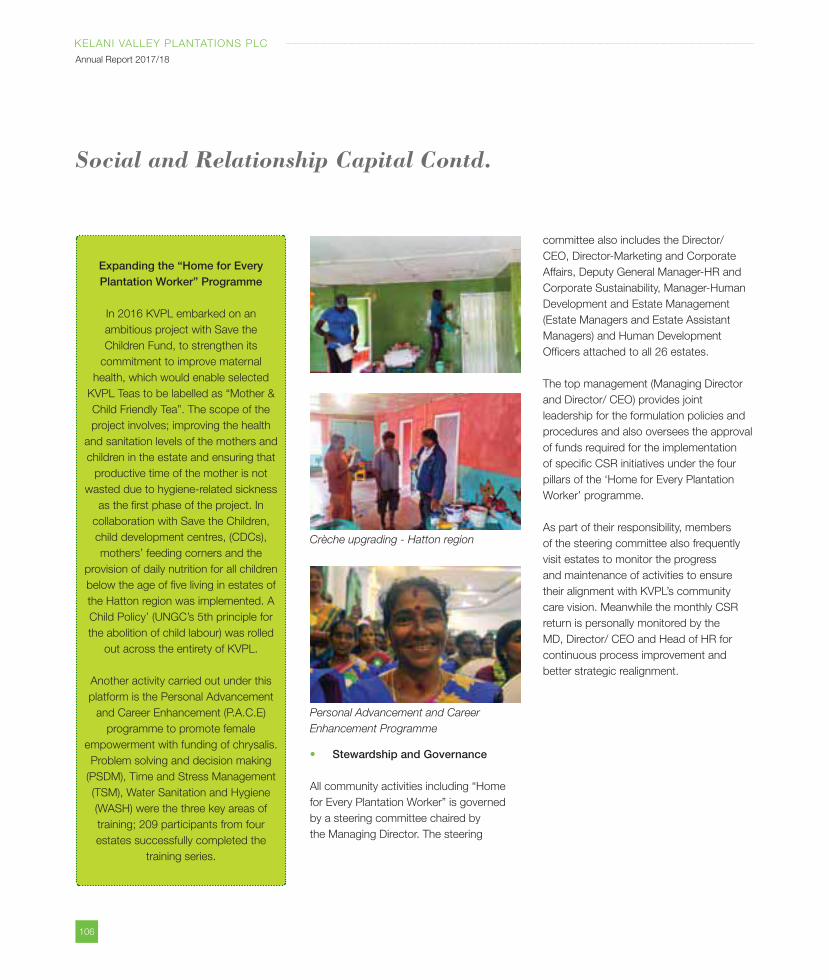
106
KELANI VALLEY PLANTATIONS PLC
Annual Report 2017/18
Stewardship and Governance
All community activities including “Home
for Every Plantation Worker” is governed
by a steering committee chaired by
the Managing Director. The steering
Expanding the “Home for Every Plantation Worker” Programme
In 2016 KVPL embarked on an
ambitious project with Save the
Children Fund, to strengthen its
commitment to improve maternal
health, which would enable selected
KVPL Teas to be labelled as “Mother &
Child Friendly Tea”. The scope of the
project involves; improving the health
and sanitation levels of the mothers and
children in the estate and ensuring that
productive time of the mother is not
wasted due to hygiene-related sickness
as the first phase of the project. In
collaboration with Save the Children,
child development centres, (CDCs),
mothers’ feeding corners and the
provision of daily nutrition for all children
below the age of five living in estates of
the Hatton region was implemented. A
Child Policy’ (UNGC’s 5th principle for
the abolition of child labour) was rolled
out across the entirety of KVPL.
Another activity carried out under this
platform is the Personal Advancement
and Career Enhancement (P.A.C.E)
programme to promote female
empowerment with funding of chrysalis.
Problem solving and decision making
(PSDM), Time and Stress Management
(TSM), Water Sanitation and Hygiene
(WASH) were the three key areas of
training; 209 participants from four
estates successfully completed the
training series.
Social and Relationship Capital Contd.
committee also includes the Director/
CEO, Director-Marketing and Corporate
Affairs, Deputy General Manager-HR and
Corporate Sustainability, Manager-Human
Development and Estate Management
(Estate Managers and Estate Assistant
Managers) and Human Development
Officers attached to all 26 estates.
The top management (Managing Director
and Director/ CEO) provides joint
leadership for the formulation policies and
procedures and also oversees the approval
of funds required for the implementation
of specific CSR initiatives under the four
pillars of the ‘Home for Every Plantation
Worker’ programme.
As part of their responsibility, members
of the steering committee also frequently
visit estates to monitor the progress
and maintenance of activities to ensure
their alignment with KVPL’s community
care vision. Meanwhile the monthly CSR
return is personally monitored by the
MD, Director/ CEO and Head of HR for
continuous process improvement and
better strategic realignment.
Crèche upgrading - Hatton region
Personal Advancement and Career
Enhancement Programme
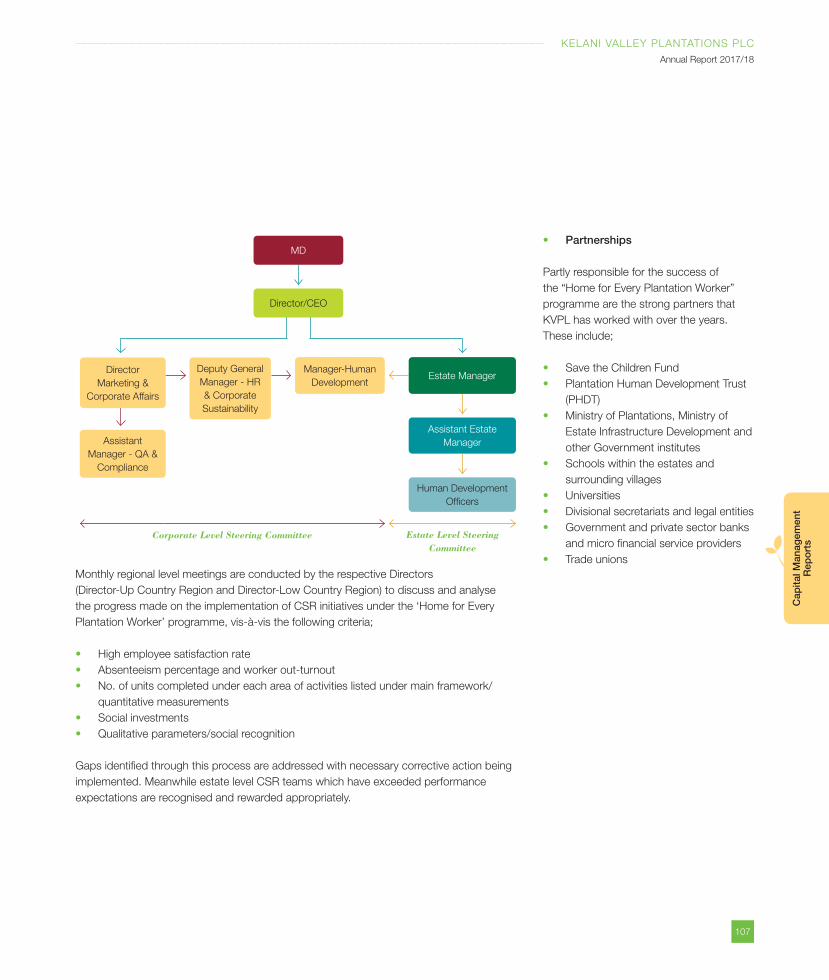
107
KELANI VALLEY PLANTATIONS PLC
Annual Report 2017/18
Cap
ital M
anag
emen
t R
epo
rts
Monthly regional level meetings are conducted by the respective Directors
(Director-Up Country Region and Director-Low Country Region) to discuss and analyse
the progress made on the implementation of CSR initiatives under the ‘Home for Every
Plantation Worker’ programme, vis-à-vis the following criteria;
High employee satisfaction rate
Absenteeism percentage and worker out-turnout
No. of units completed under each area of activities listed under main framework/
quantitative measurements
Social investments
Qualitative parameters/social recognition
Gaps identified through this process are addressed with necessary corrective action being
implemented. Meanwhile estate level CSR teams which have exceeded performance
expectations are recognised and rewarded appropriately.
MD
Director
Marketing &
Corporate Affairs
Assistant
Manager - QA &
Compliance
Deputy General
Manager - HR
& Corporate
Sustainability
Manager-Human
DevelopmentEstate Manager
Assistant Estate
Manager
Human Development
Officers
Director/CEO
Corporate Level Steering Committee Estate Level Steering Committee
Partnerships
Partly responsible for the success of
the “Home for Every Plantation Worker”
programme are the strong partners that
KVPL has worked with over the years.
These include;
Save the Children Fund
Plantation Human Development Trust
(PHDT)
Ministry of Plantations, Ministry of
Estate Infrastructure Development and
other Government institutes
Schools within the estates and
surrounding villages
Universities
Divisional secretariats and legal entities
Government and private sector banks
and micro financial service providers
Trade unions
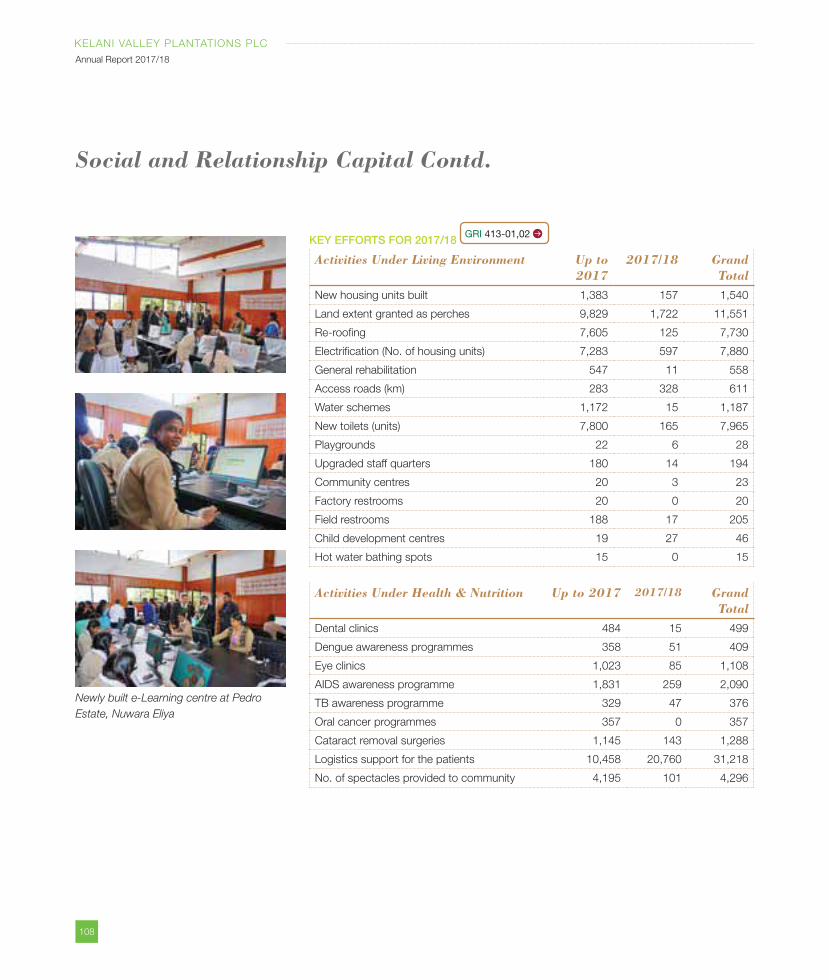
108
KELANI VALLEY PLANTATIONS PLC
Annual Report 2017/18
KEY EFFORTS FOR 2017/18 GRI 413-01,02
Activities Under Living Environment Up to 2017
2017/18 Grand Total
New housing units built 1,383 157 1,540
Land extent granted as perches 9,829 1,722 11,551
Re-roofing 7,605 125 7,730
Electrification (No. of housing units) 7,283 597 7,880
General rehabilitation 547 11 558
Access roads (km) 283 328 611
Water schemes 1,172 15 1,187
New toilets (units) 7,800 165 7,965
Playgrounds 22 6 28
Upgraded staff quarters 180 14 194
Community centres 20 3 23
Factory restrooms 20 0 20
Field restrooms 188 17 205
Child development centres 19 27 46
Hot water bathing spots 15 0 15
Activities Under Health & Nutrition Up to 2017 2017/18 Grand Total
Dental clinics 484 15 499
Dengue awareness programmes 358 51 409
Eye clinics 1,023 85 1,108
AIDS awareness programme 1,831 259 2,090
TB awareness programme 329 47 376
Oral cancer programmes 357 0 357
Cataract removal surgeries 1,145 143 1,288
Logistics support for the patients 10,458 20,760 31,218
No. of spectacles provided to community 4,195 101 4,296
Newly built e-Learning centre at Pedro
Estate, Nuwara Eliya
Social and Relationship Capital Contd.
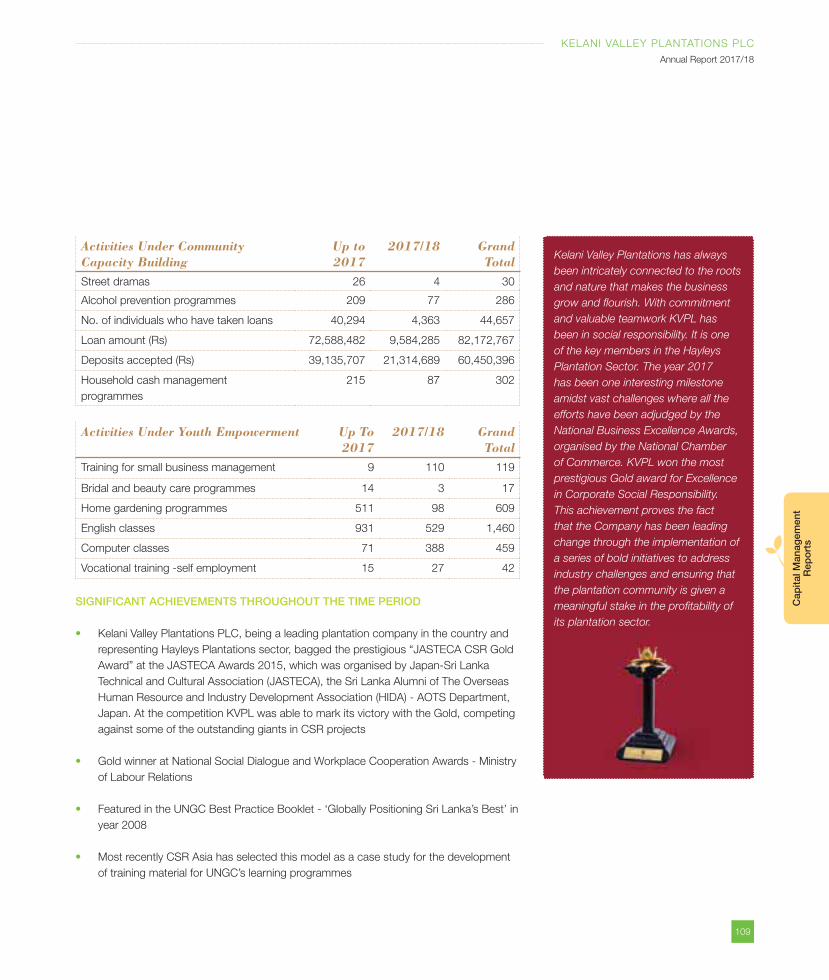
109
KELANI VALLEY PLANTATIONS PLC
Annual Report 2017/18
Cap
ital M
anag
emen
t R
epo
rts
Kelani Valley Plantations has always
been intricately connected to the roots
and nature that makes the business
grow and flourish. With commitment
and valuable teamwork KVPL has
been in social responsibility. It is one
of the key members in the Hayleys
Plantation Sector. The year 2017
has been one interesting milestone
amidst vast challenges where all the
efforts have been adjudged by the
National Business Excellence Awards,
organised by the National Chamber
of Commerce. KVPL won the most
prestigious Gold award for Excellence
in Corporate Social Responsibility.
This achievement proves the fact
that the Company has been leading
change through the implementation of
a series of bold initiatives to address
industry challenges and ensuring that
the plantation community is given a
meaningful stake in the profitability of
its plantation sector.
Activities Under Community Capacity Building
Up to 2017
2017/18 Grand Total
Street dramas 26 4 30
Alcohol prevention programmes 209 77 286
No. of individuals who have taken loans 40,294 4,363 44,657
Loan amount (Rs) 72,588,482 9,584,285 82,172,767
Deposits accepted (Rs) 39,135,707 21,314,689 60,450,396
Household cash management
programmes
215 87 302
Activities Under Youth Empowerment Up To 2017
2017/18 Grand Total
Training for small business management 9 110 119
Bridal and beauty care programmes 14 3 17
Home gardening programmes 511 98 609
English classes 931 529 1,460
Computer classes 71 388 459
Vocational training -self employment 15 27 42
SIGNIFICANT ACHIEVEMENTS THROUGHOUT THE TIME PERIOD
Kelani Valley Plantations PLC, being a leading plantation company in the country and
representing Hayleys Plantations sector, bagged the prestigious “JASTECA CSR Gold
Award” at the JASTECA Awards 2015, which was organised by Japan-Sri Lanka
Technical and Cultural Association (JASTECA), the Sri Lanka Alumni of The Overseas
Human Resource and Industry Development Association (HIDA) - AOTS Department,
Japan. At the competition KVPL was able to mark its victory with the Gold, competing
against some of the outstanding giants in CSR projects
Gold winner at National Social Dialogue and Workplace Cooperation Awards - Ministry
of Labour Relations
Featured in the UNGC Best Practice Booklet - ‘Globally Positioning Sri Lanka’s Best’ in
year 2008
Most recently CSR Asia has selected this model as a case study for the development
of training material for UNGC’s learning programmes
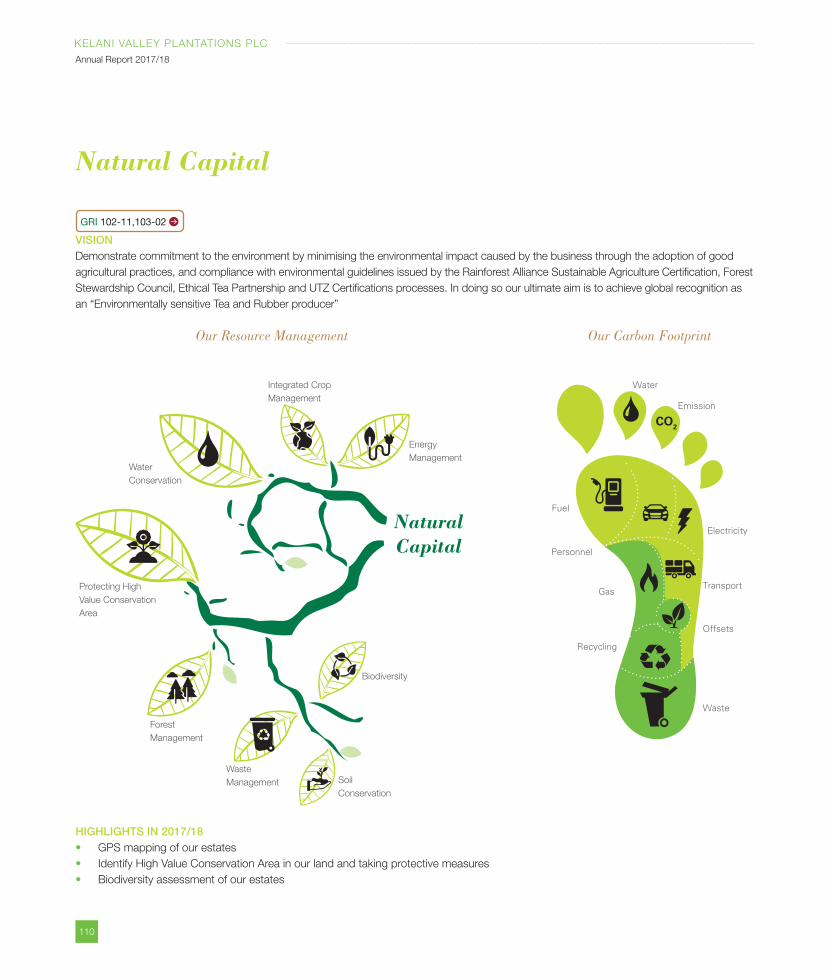
110
KELANI VALLEY PLANTATIONS PLC
Annual Report 2017/18
HIGHLIGHTS IN 2017/18GPS mapping of our estates
Identify High Value Conservation Area in our land and taking protective measures
Biodiversity assessment of our estates
VISIONDemonstrate commitment to the environment by minimising the environmental impact caused by the business through the adoption of good
agricultural practices, and compliance with environmental guidelines issued by the Rainforest Alliance Sustainable Agriculture Certification, Forest
Stewardship Council, Ethical Tea Partnership and UTZ Certifications processes. In doing so our ultimate aim is to achieve global recognition as
an “Environmentally sensitive Tea and Rubber producer”
Natural Capital
Natural Capital
Waste
Management Soil
Conservation
Biodiversity
Forest
Management
Protecting High
Value Conservation
Area
Water
Conservation
Integrated Crop
Management
Energy
Management
Our Resource Management Our Carbon Footprint
GRI 102-11,103-02
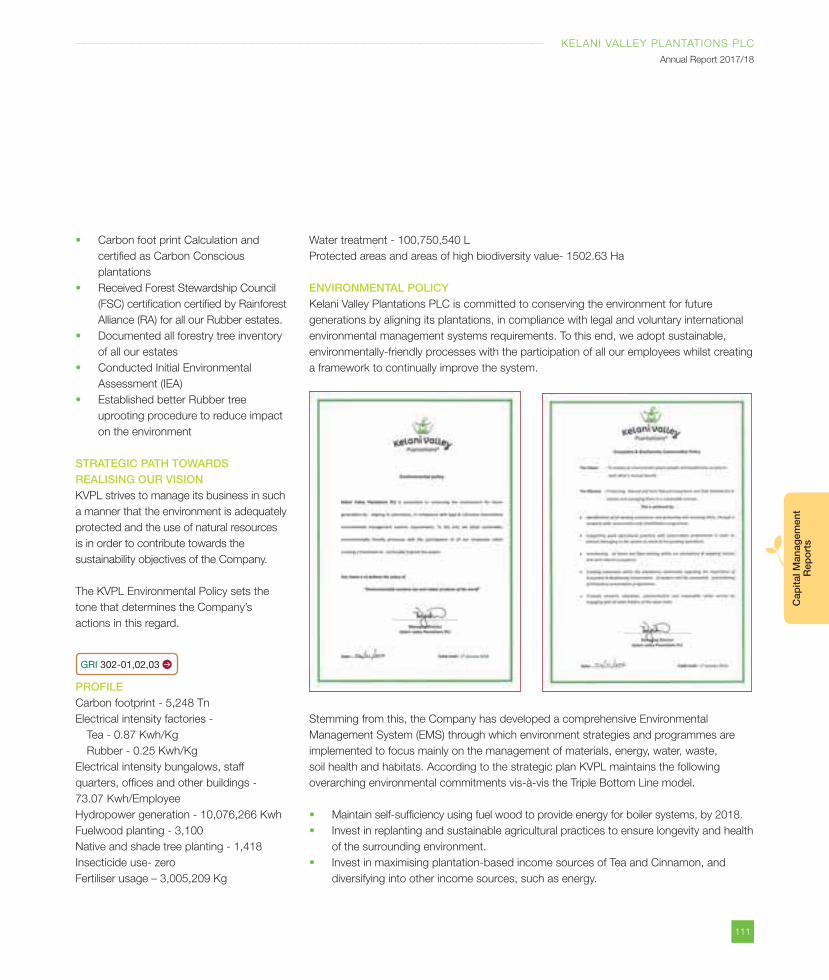
111
KELANI VALLEY PLANTATIONS PLC
Annual Report 2017/18
Cap
ital M
anag
emen
t R
epo
rts
Carbon foot print Calculation and
certified as Carbon Conscious
plantations
Received Forest Stewardship Council
(FSC) certification certified by Rainforest
Alliance (RA) for all our Rubber estates.
Documented all forestry tree inventory
of all our estates
Conducted Initial Environmental
Assessment (IEA)
Established better Rubber tree
uprooting procedure to reduce impact
on the environment
STRATEGIC PATH TOWARDS REALISING OUR VISIONKVPL strives to manage its business in such
a manner that the environment is adequately
protected and the use of natural resources
is in order to contribute towards the
sustainability objectives of the Company.
The KVPL Environmental Policy sets the
tone that determines the Company’s
actions in this regard.
GRI 302-01,02,03
PROFILE Carbon footprint - 5,248 Tn
Electrical intensity factories -
Tea - 0.87 Kwh/Kg
Rubber - 0.25 Kwh/Kg
Electrical intensity bungalows, staff
quarters, offices and other buildings -
73.07 Kwh/Employee
Hydropower generation - 10,076,266 Kwh
Fuelwood planting - 3,100
Native and shade tree planting - 1,418
Insecticide use- zero
Fertiliser usage – 3,005,209 Kg
Water treatment - 100,750,540 L
Protected areas and areas of high biodiversity value- 1502.63 Ha
ENVIRONMENTAL POLICY Kelani Valley Plantations PLC is committed to conserving the environment for future
generations by aligning its plantations, in compliance with legal and voluntary international
environmental management systems requirements. To this end, we adopt sustainable,
environmentally-friendly processes with the participation of all our employees whilst creating
a framework to continually improve the system.
Stemming from this, the Company has developed a comprehensive Environmental
Management System (EMS) through which environment strategies and programmes are
implemented to focus mainly on the management of materials, energy, water, waste,
soil health and habitats. According to the strategic plan KVPL maintains the following
overarching environmental commitments vis-à-vis the Triple Bottom Line model.
Maintain self-sufficiency using fuel wood to provide energy for boiler systems, by 2018.
Invest in replanting and sustainable agricultural practices to ensure longevity and health
of the surrounding environment.
Invest in maximising plantation-based income sources of Tea and Cinnamon, and
diversifying into other income sources, such as energy.
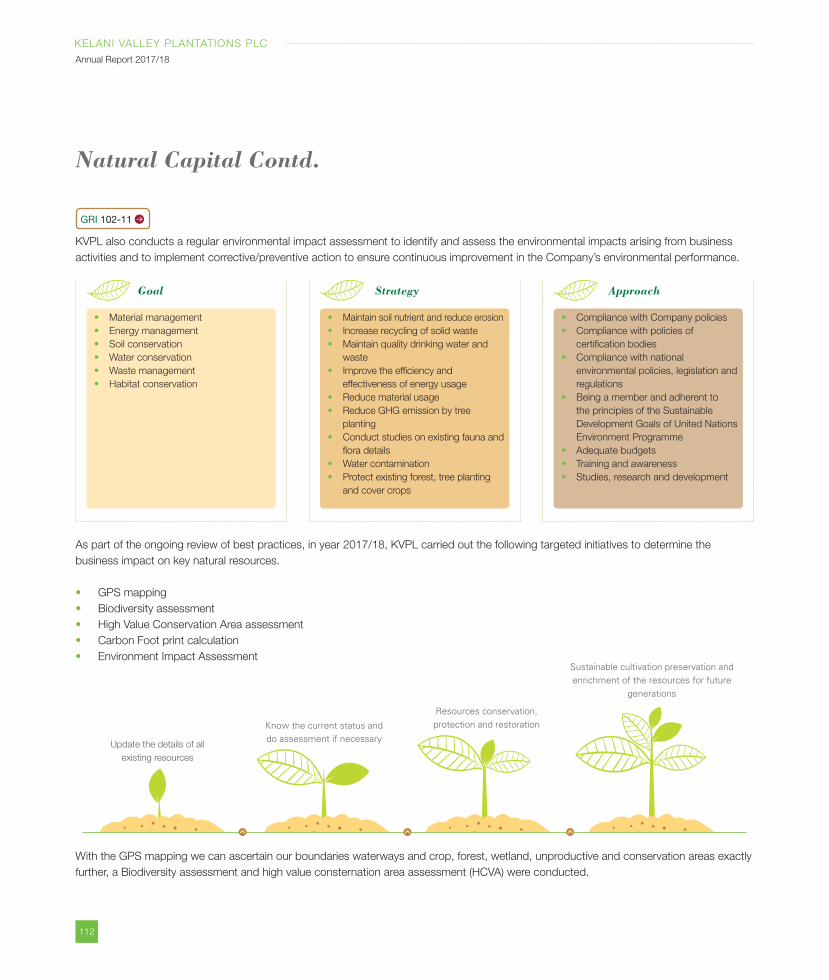
112
KELANI VALLEY PLANTATIONS PLC
Annual Report 2017/18
KVPL also conducts a regular environmental impact assessment to identify and assess the environmental impacts arising from business
activities and to implement corrective/preventive action to ensure continuous improvement in the Company’s environmental performance.
As part of the ongoing review of best practices, in year 2017/18, KVPL carried out the following targeted initiatives to determine the
business impact on key natural resources.
GPS mapping
Biodiversity assessment
High Value Conservation Area assessment
Carbon Foot print calculation
Environment Impact Assessment
Natural Capital Contd.
With the GPS mapping we can ascertain our boundaries waterways and crop, forest, wetland, unproductive and conservation areas exactly
further, a Biodiversity assessment and high value consternation area assessment (HCVA) were conducted.
Material management
Energy management
Soil conservation
Water conservation
Waste management
Habitat conservation
Goal
Maintain soil nutrient and reduce erosion
Increase recycling of solid waste
Maintain quality drinking water and
waste
Improve the efficiency and
effectiveness of energy usage
Reduce material usage
Reduce GHG emission by tree
planting
Conduct studies on existing fauna and
flora details
Water contamination
Protect existing forest, tree planting
and cover crops
Strategy
Compliance with Company policies
Compliance with policies of
certification bodies
Compliance with national
environmental policies, legislation and
regulations
Being a member and adherent to
the principles of the Sustainable
Development Goals of United Nations
Environment Programme
Adequate budgets
Training and awareness
Studies, research and development
Approach
Update the details of all
existing resources
GRI 102-11
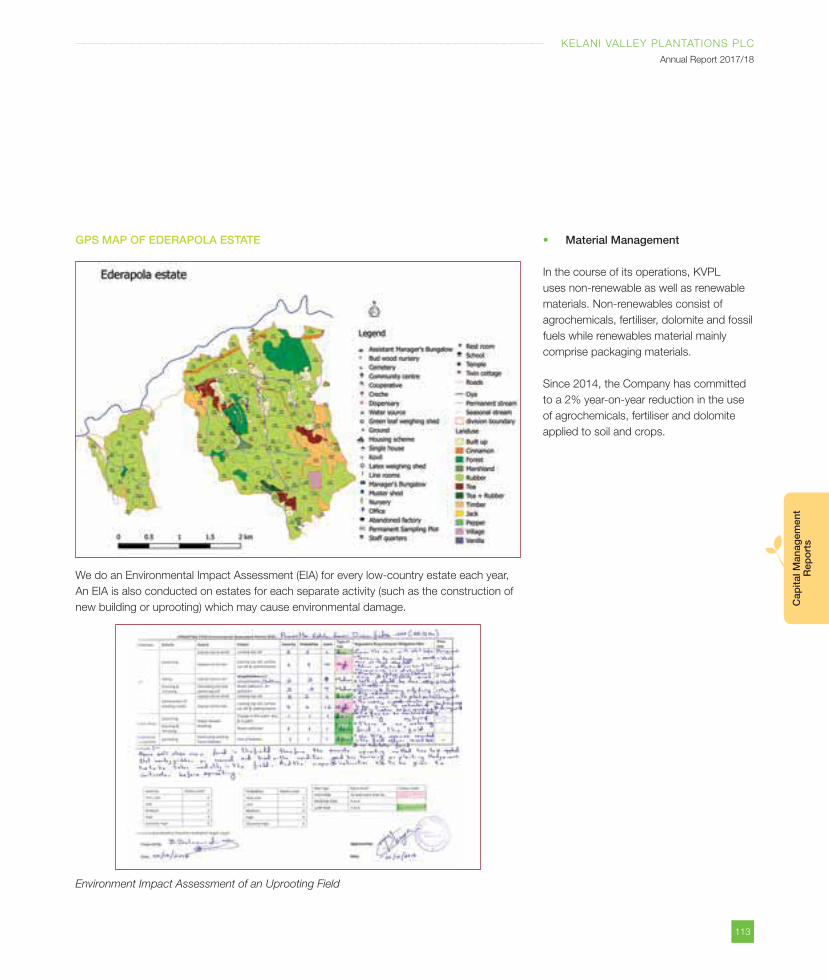
113
KELANI VALLEY PLANTATIONS PLC
Annual Report 2017/18
Cap
ital M
anag
emen
t R
epo
rts
GPS MAP OF EDERAPOLA ESTATE
We do an Environmental Impact Assessment (EIA) for every low-country estate each year,
An EIA is also conducted on estates for each separate activity (such as the construction of
new building or uprooting) which may cause environmental damage.
Environment Impact Assessment of an Uprooting Field
Material Management
In the course of its operations, KVPL
uses non-renewable as well as renewable
materials. Non-renewables consist of
agrochemicals, fertiliser, dolomite and fossil
fuels while renewables material mainly
comprise packaging materials.
Since 2014, the Company has committed
to a 2% year-on-year reduction in the use
of agrochemicals, fertiliser and dolomite
applied to soil and crops.
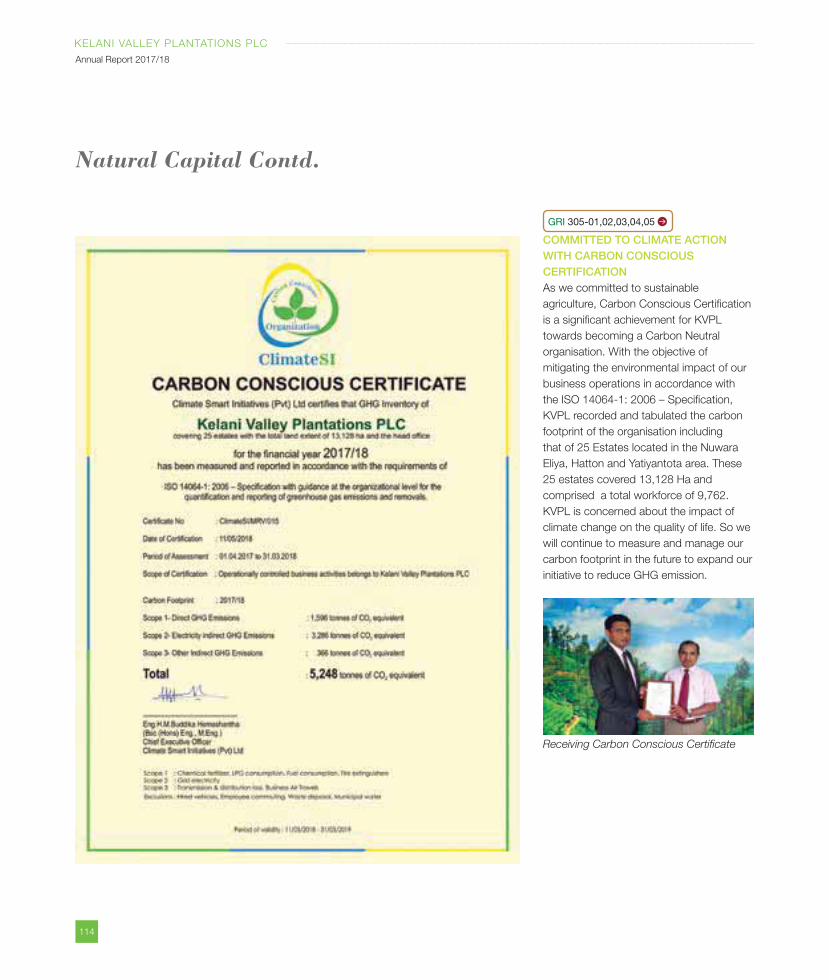
114
KELANI VALLEY PLANTATIONS PLC
Annual Report 2017/18
Natural Capital Contd.
COMMITTED TO CLIMATE ACTION WITH CARBON CONSCIOUS CERTIFICATION As we committed to sustainable
agriculture, Carbon Conscious Certification
is a significant achievement for KVPL
towards becoming a Carbon Neutral
organisation. With the objective of
mitigating the environmental impact of our
business operations in accordance with
the ISO 14064-1: 2006 – Specification,
KVPL recorded and tabulated the carbon
footprint of the organisation including
that of 25 Estates located in the Nuwara
Eliya, Hatton and Yatiyantota area. These
25 estates covered 13,128 Ha and
comprised a total workforce of 9,762.
KVPL is concerned about the impact of
climate change on the quality of life. So we
will continue to measure and manage our
carbon footprint in the future to expand our
initiative to reduce GHG emission.
Receiving Carbon Conscious Certificate
GRI 305-01,02,03,04,05
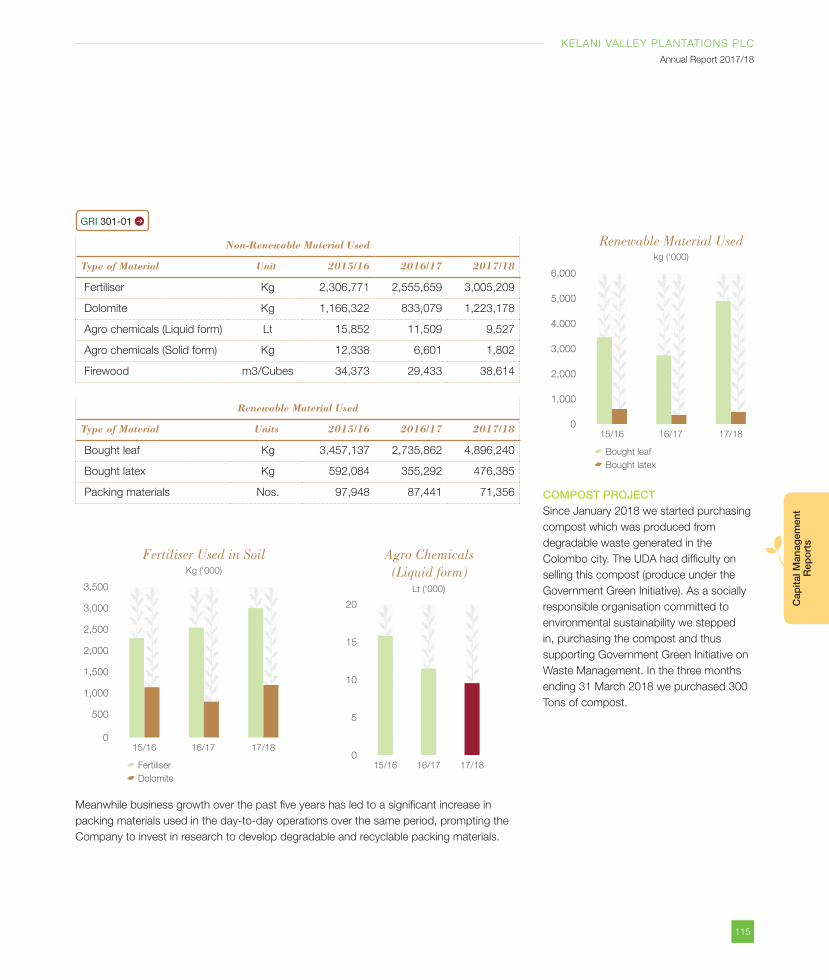
115
KELANI VALLEY PLANTATIONS PLC
Annual Report 2017/18
Cap
ital M
anag
emen
t R
epo
rts
Non-Renewable Material Used
Type of Material Unit 2015/16 2016/17 2017/18
Fertiliser Kg 2,306,771 2,555,659 3,005,209
Dolomite Kg 1,166,322 833,079 1,223,178
Agro chemicals (Liquid form) Lt 15,852 11,509 9,527
Agro chemicals (Solid form) Kg 12,338 6,601 1,802
Firewood m3/Cubes 34,373 29,433 38,614
Renewable Material Used
Type of Material Units 2015/16 2016/17 2017/18
Bought leaf Kg 3,457,137 2,735,862 4,896,240
Bought latex Kg 592,084 355,292 476,385
Packing materials Nos. 97,948 87,441 71,356 COMPOST PROJECTSince January 2018 we started purchasing
compost which was produced from
degradable waste generated in the
Colombo city. The UDA had difficulty on
selling this compost (produce under the
Government Green Initiative). As a socially
responsible organisation committed to
environmental sustainability we stepped
in, purchasing the compost and thus
supporting Government Green Initiative on
Waste Management. In the three months
ending 31 March 2018 we purchased 300
Tons of compost.
Fertiliser Used in SoilKg (‘000)
1,000
3,500
1,500
2,000
2,500
3,000
0
500
15/16 16/17 17/18
Fertiliser
Dolomite
Renewable Material Usedkg (‘000)
1,000
6,000
2,000
3,000
4,000
5,000
015/16 16/17 17/18
Bought leaf
Bought latex
Agro Chemicals (Liquid form)
Lt (‘000)
20
15
5
0
10
15/16 16/17 17/18
GRI 301-01
Meanwhile business growth over the past five years has led to a significant increase in
packing materials used in the day-to-day operations over the same period, prompting the
Company to invest in research to develop degradable and recyclable packing materials.
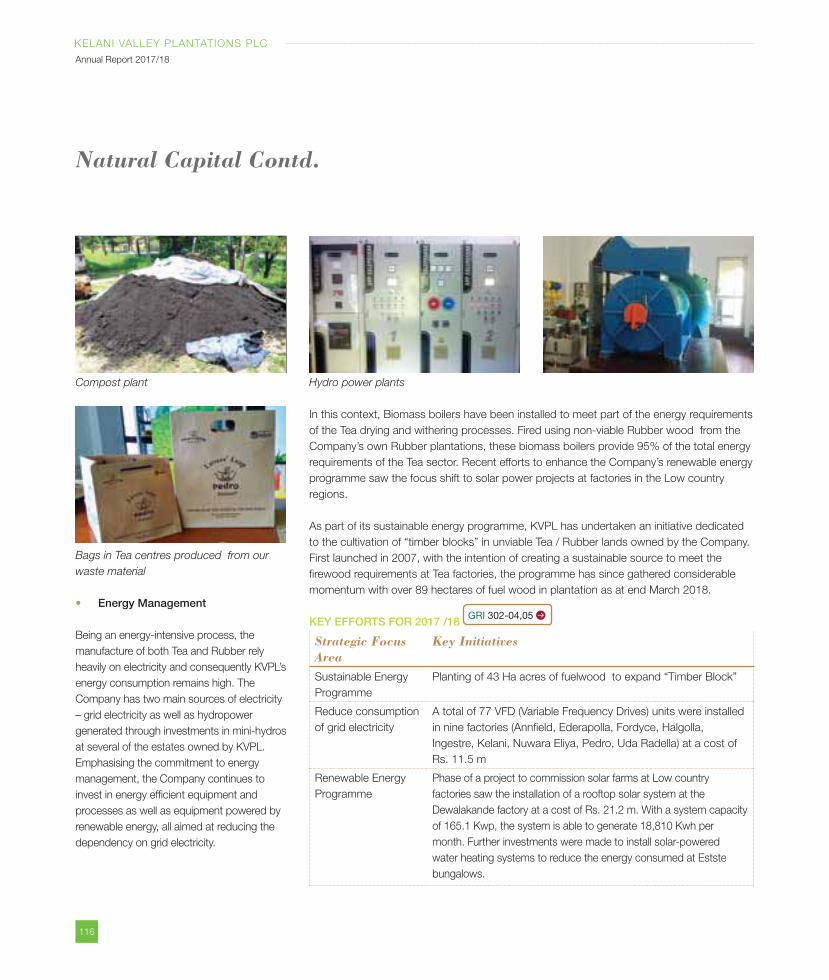
116
KELANI VALLEY PLANTATIONS PLC
Annual Report 2017/18
Hydro power plants
In this context, Biomass boilers have been installed to meet part of the energy requirements
of the Tea drying and withering processes. Fired using non-viable Rubber wood from the
Company’s own Rubber plantations, these biomass boilers provide 95% of the total energy
requirements of the Tea sector. Recent efforts to enhance the Company’s renewable energy
programme saw the focus shift to solar power projects at factories in the Low country
regions.
As part of its sustainable energy programme, KVPL has undertaken an initiative dedicated
to the cultivation of “timber blocks” in unviable Tea / Rubber lands owned by the Company.
First launched in 2007, with the intention of creating a sustainable source to meet the
firewood requirements at Tea factories, the programme has since gathered considerable
momentum with over 89 hectares of fuel wood in plantation as at end March 2018.
KEY EFFORTS FOR 2017 /18 GRI 302-04,05
Strategic Focus Area
Key Initiatives
Sustainable Energy
Programme
Planting of 43 Ha acres of fuelwood to expand “Timber Block”
Reduce consumption
of grid electricity
A total of 77 VFD (Variable Frequency Drives) units were installed
in nine factories (Annfield, Ederapolla, Fordyce, Halgolla,
Ingestre, Kelani, Nuwara Eliya, Pedro, Uda Radella) at a cost of
Rs. 11.5 m
Renewable Energy
Programme
Phase of a project to commission solar farms at Low country
factories saw the installation of a rooftop solar system at the
Dewalakande factory at a cost of Rs. 21.2 m. With a system capacity
of 165.1 Kwp, the system is able to generate 18,810 Kwh per
month. Further investments were made to install solar-powered
water heating systems to reduce the energy consumed at Estste
bungalows.
Compost plant
Bags in Tea centres produced from our
waste material
Energy Management
Being an energy-intensive process, the
manufacture of both Tea and Rubber rely
heavily on electricity and consequently KVPL’s
energy consumption remains high. The
Company has two main sources of electricity
– grid electricity as well as hydropower
generated through investments in mini-hydros
at several of the estates owned by KVPL.
Emphasising the commitment to energy
management, the Company continues to
invest in energy efficient equipment and
processes as well as equipment powered by
renewable energy, all aimed at reducing the
dependency on grid electricity.
Natural Capital Contd.
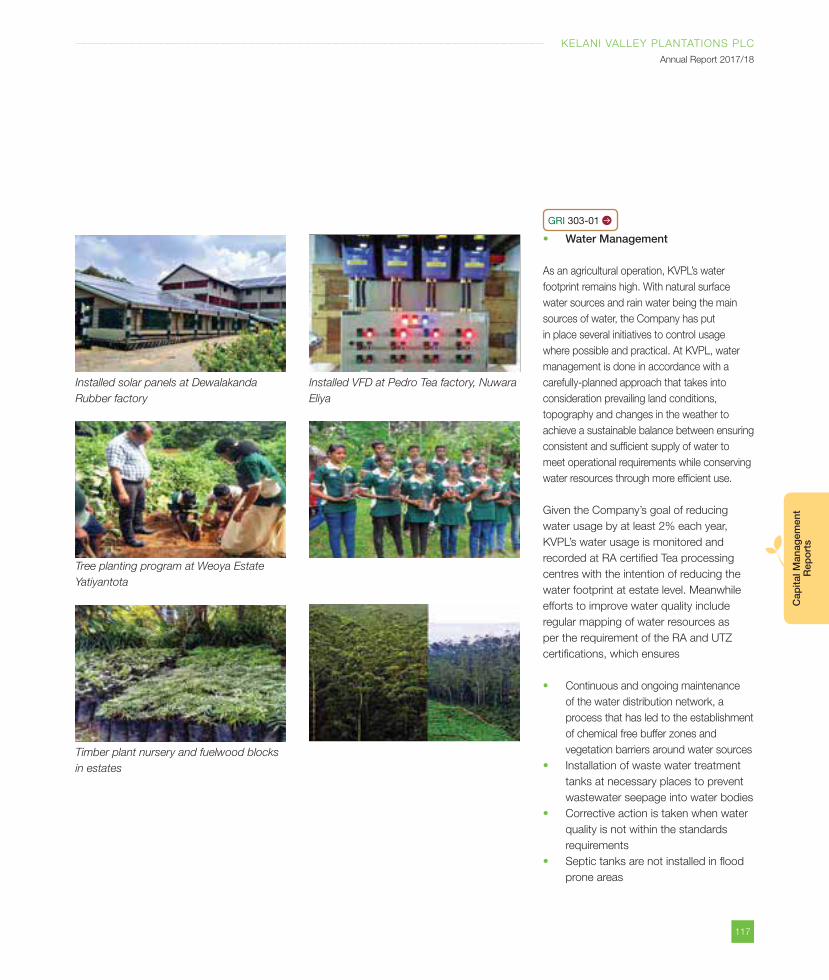
117
KELANI VALLEY PLANTATIONS PLC
Annual Report 2017/18
Cap
ital M
anag
emen
t R
epo
rts
Installed VFD at Pedro Tea factory, Nuwara
Eliya
Installed solar panels at Dewalakanda
Rubber factory
Tree planting program at Weoya Estate
Yatiyantota
Timber plant nursery and fuelwood blocks
in estates
Water Management
As an agricultural operation, KVPL’s water
footprint remains high. With natural surface
water sources and rain water being the main
sources of water, the Company has put
in place several initiatives to control usage
where possible and practical. At KVPL, water
management is done in accordance with a
carefully-planned approach that takes into
consideration prevailing land conditions,
topography and changes in the weather to
achieve a sustainable balance between ensuring
consistent and sufficient supply of water to
meet operational requirements while conserving
water resources through more efficient use.
Given the Company’s goal of reducing
water usage by at least 2% each year,
KVPL’s water usage is monitored and
recorded at RA certified Tea processing
centres with the intention of reducing the
water footprint at estate level. Meanwhile
efforts to improve water quality include
regular mapping of water resources as
per the requirement of the RA and UTZ
certifications, which ensures
Continuous and ongoing maintenance
of the water distribution network, a
process that has led to the establishment
of chemical free buffer zones and
vegetation barriers around water sources
Installation of waste water treatment
tanks at necessary places to prevent
wastewater seepage into water bodies
Corrective action is taken when water
quality is not within the standards
requirements
Septic tanks are not installed in flood
prone areas
GRI 303-01
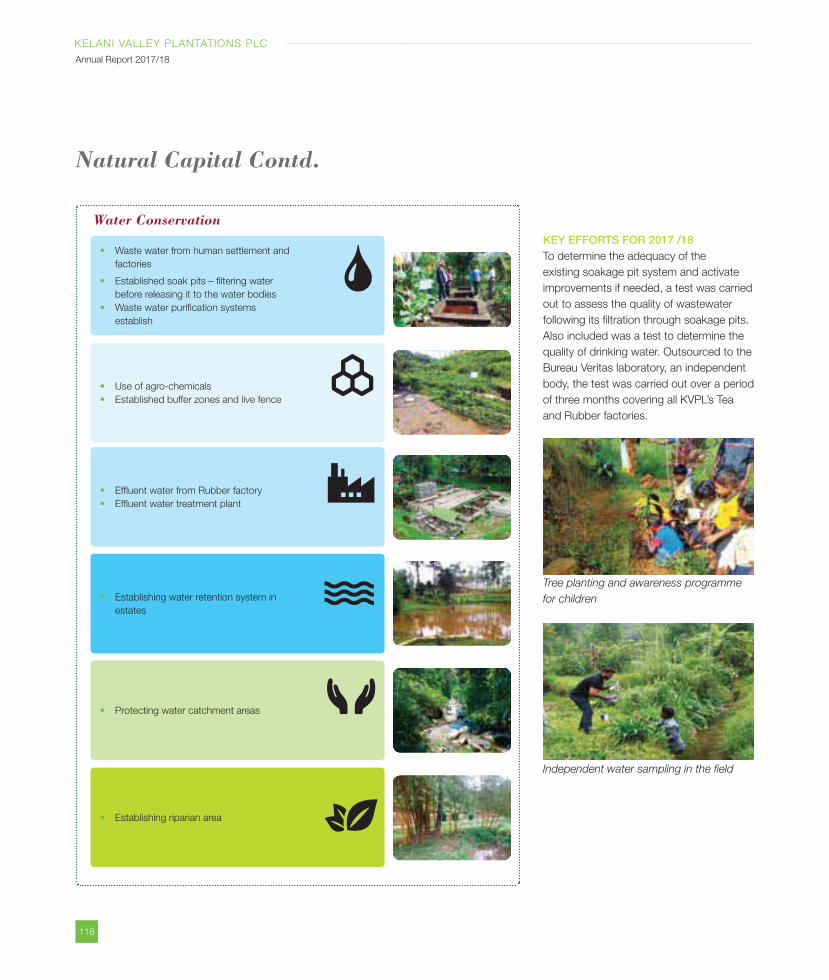
118
KELANI VALLEY PLANTATIONS PLC
Annual Report 2017/18
KEY EFFORTS FOR 2017 /18To determine the adequacy of the
existing soakage pit system and activate
improvements if needed, a test was carried
out to assess the quality of wastewater
following its filtration through soakage pits.
Also included was a test to determine the
quality of drinking water. Outsourced to the
Bureau Veritas laboratory, an independent
body, the test was carried out over a period
of three months covering all KVPL’s Tea
and Rubber factories.
Natural Capital Contd.
Waste water from human settlement and
factories
Established soak pits – filtering water
before releasing it to the water bodies
Waste water purification systems
establish
Use of agro-chemicals
Established buffer zones and live fence
Effluent water from Rubber factory
Effluent water treatment plant
Establishing water retention system in
estates
Protecting water catchment areas
Establishing riparian area
Water Conservation
Independent water sampling in the field
Tree planting and awareness programme
for children
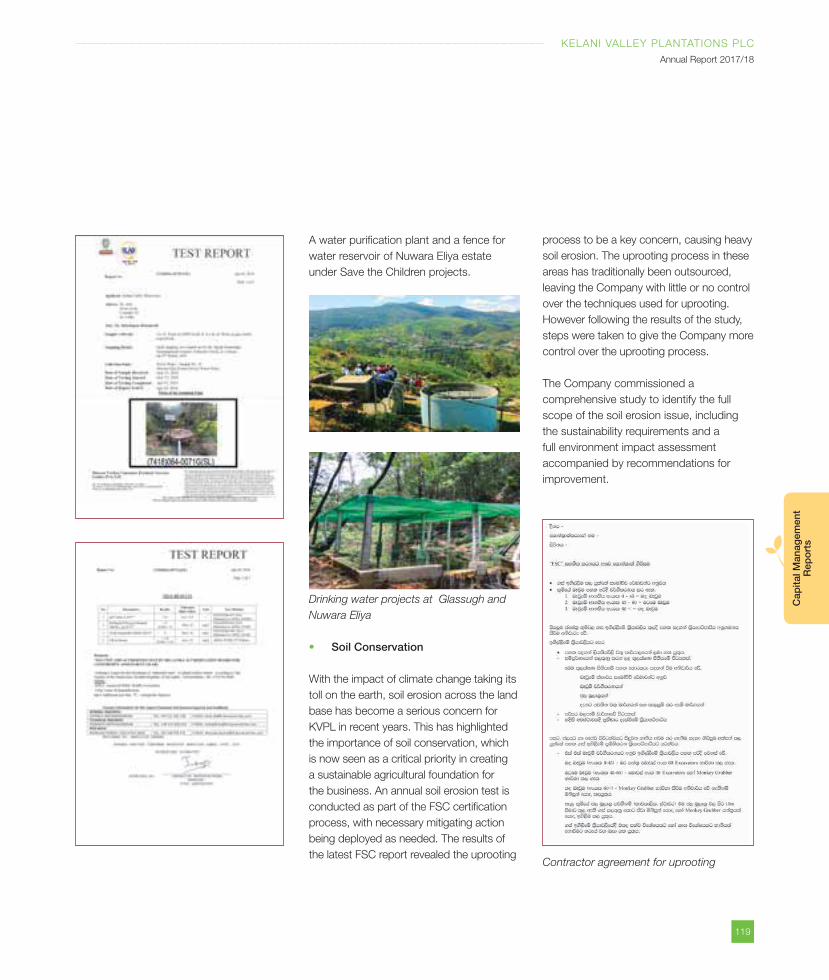
119
KELANI VALLEY PLANTATIONS PLC
Annual Report 2017/18
Cap
ital M
anag
emen
t R
epo
rts
process to be a key concern, causing heavy
soil erosion. The uprooting process in these
areas has traditionally been outsourced,
leaving the Company with little or no control
over the techniques used for uprooting.
However following the results of the study,
steps were taken to give the Company more
control over the uprooting process.
The Company commissioned a
comprehensive study to identify the full
scope of the soil erosion issue, including
the sustainability requirements and a
full environment impact assessment
accompanied by recommendations for
improvement.
Contractor agreement for uprooting
A water purification plant and a fence for
water reservoir of Nuwara Eliya estate
under Save the Children projects.
Drinking water projects at Glassugh and
Nuwara Eliya
Soil Conservation
With the impact of climate change taking its
toll on the earth, soil erosion across the land
base has become a serious concern for
KVPL in recent years. This has highlighted
the importance of soil conservation, which
is now seen as a critical priority in creating
a sustainable agricultural foundation for
the business. An annual soil erosion test is
conducted as part of the FSC certification
process, with necessary mitigating action
being deployed as needed. The results of
the latest FSC report revealed the uprooting
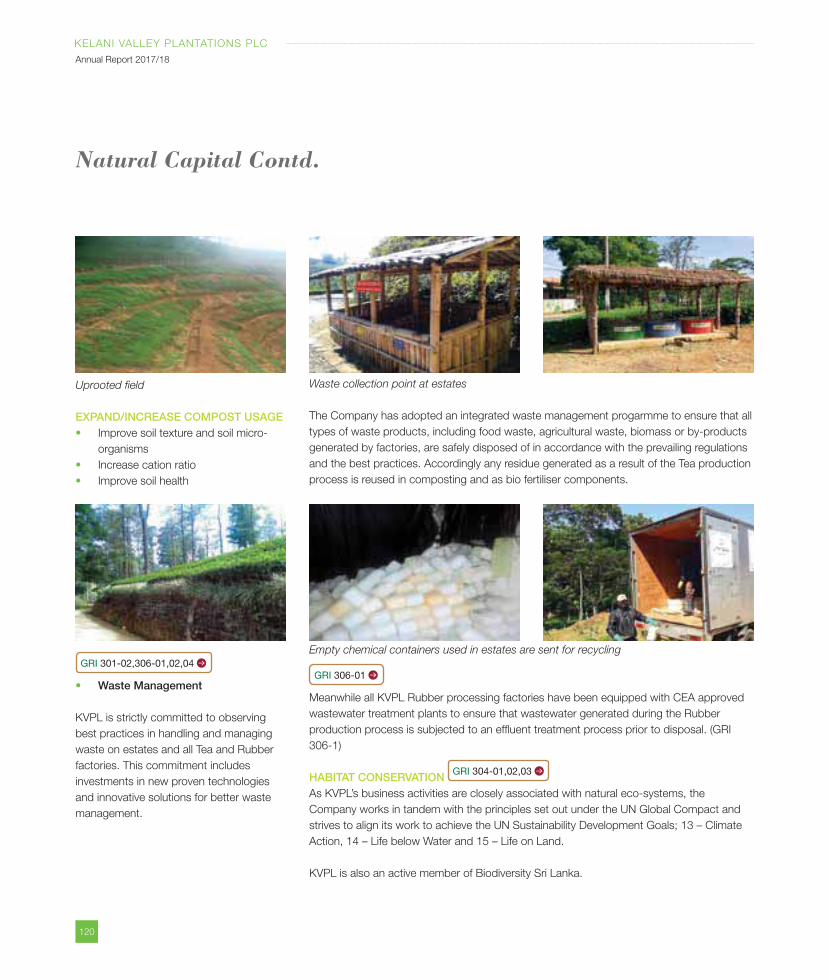
120
KELANI VALLEY PLANTATIONS PLC
Annual Report 2017/18
Waste collection point at estates
The Company has adopted an integrated waste management progarmme to ensure that all
types of waste products, including food waste, agricultural waste, biomass or by-products
generated by factories, are safely disposed of in accordance with the prevailing regulations
and the best practices. Accordingly any residue generated as a result of the Tea production
process is reused in composting and as bio fertiliser components.
Empty chemical containers used in estates are sent for recycling
GRI 306-01
Meanwhile all KVPL Rubber processing factories have been equipped with CEA approved
wastewater treatment plants to ensure that wastewater generated during the Rubber
production process is subjected to an effluent treatment process prior to disposal. (GRI
306-1)
HABITAT CONSERVATIONAs KVPL’s business activities are closely associated with natural eco-systems, the
Company works in tandem with the principles set out under the UN Global Compact and
strives to align its work to achieve the UN Sustainability Development Goals; 13 – Climate
Action, 14 – Life below Water and 15 – Life on Land.
KVPL is also an active member of Biodiversity Sri Lanka.
Uprooted field
EXPAND/INCREASE COMPOST USAGEImprove soil texture and soil micro-
organisms
Increase cation ratio
Improve soil health
GRI 301-02,306-01,02,04
Waste Management
KVPL is strictly committed to observing
best practices in handling and managing
waste on estates and all Tea and Rubber
factories. This commitment includes
investments in new proven technologies
and innovative solutions for better waste
management.
Natural Capital Contd.
GRI 304-01,02,03
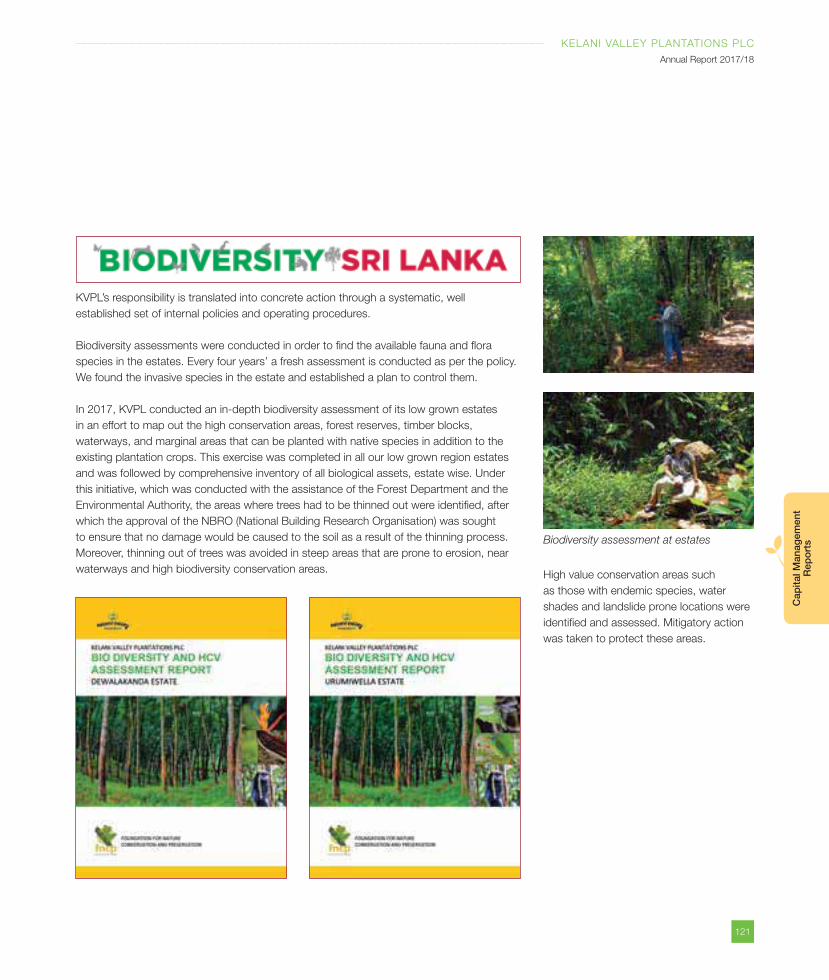
121
KELANI VALLEY PLANTATIONS PLC
Annual Report 2017/18
Cap
ital M
anag
emen
t R
epo
rts
KVPL’s responsibility is translated into concrete action through a systematic, well
established set of internal policies and operating procedures.
Biodiversity assessments were conducted in order to find the available fauna and flora
species in the estates. Every four years’ a fresh assessment is conducted as per the policy.
We found the invasive species in the estate and established a plan to control them.
In 2017, KVPL conducted an in-depth biodiversity assessment of its low grown estates
in an effort to map out the high conservation areas, forest reserves, timber blocks,
waterways, and marginal areas that can be planted with native species in addition to the
existing plantation crops. This exercise was completed in all our low grown region estates
and was followed by comprehensive inventory of all biological assets, estate wise. Under
this initiative, which was conducted with the assistance of the Forest Department and the
Environmental Authority, the areas where trees had to be thinned out were identified, after
which the approval of the NBRO (National Building Research Organisation) was sought
to ensure that no damage would be caused to the soil as a result of the thinning process.
Moreover, thinning out of trees was avoided in steep areas that are prone to erosion, near
waterways and high biodiversity conservation areas.High value conservation areas such
as those with endemic species, water
shades and landslide prone locations were
identified and assessed. Mitigatory action
was taken to protect these areas.
Biodiversity assessment at estates
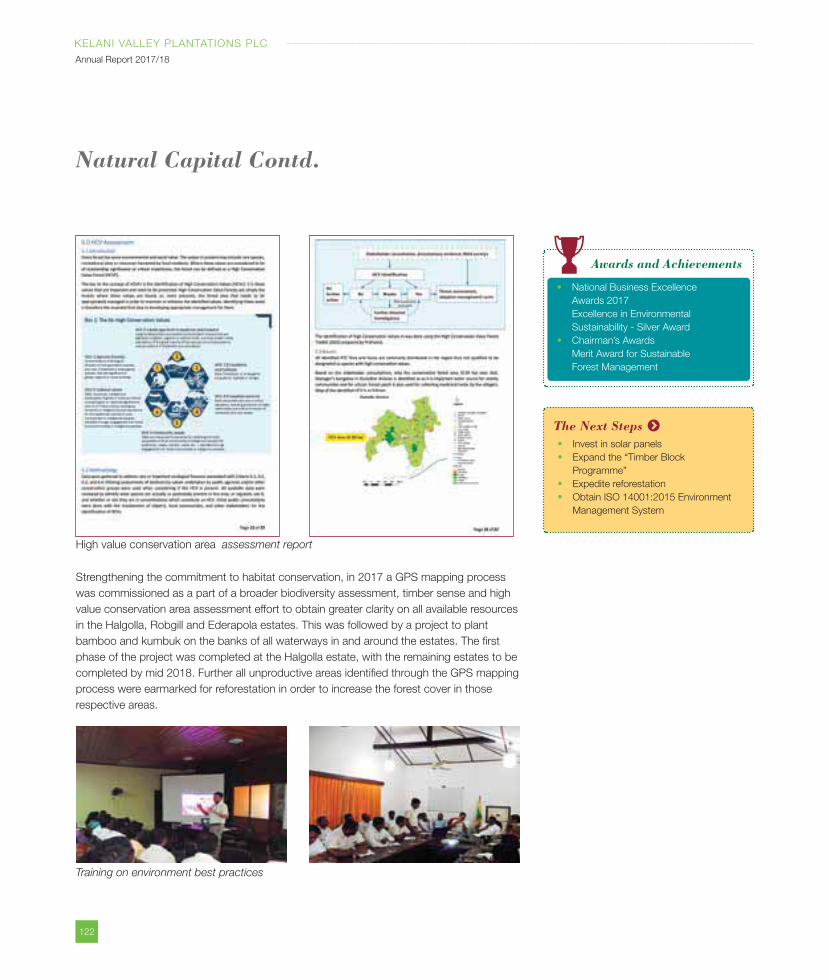
122
KELANI VALLEY PLANTATIONS PLC
Annual Report 2017/18
Strengthening the commitment to habitat conservation, in 2017 a GPS mapping process
was commissioned as a part of a broader biodiversity assessment, timber sense and high
value conservation area assessment effort to obtain greater clarity on all available resources
in the Halgolla, Robgill and Ederapola estates. This was followed by a project to plant
bamboo and kumbuk on the banks of all waterways in and around the estates. The first
phase of the project was completed at the Halgolla estate, with the remaining estates to be
completed by mid 2018. Further all unproductive areas identified through the GPS mapping
process were earmarked for reforestation in order to increase the forest cover in those
respective areas.
Training on environment best practices
Natural Capital Contd.
Awards and Achievements
National Business Excellence
Awards 2017
Excellence in Environmental
Sustainability - Silver Award
Chairman’s Awards
Merit Award for Sustainable
Forest Management
The Next StepsInvest in solar panels
Expand the “Timber Block
Programme”
Expedite reforestation
Obtain ISO 14001:2015 Environment
Management System
High value conservation area assessment report
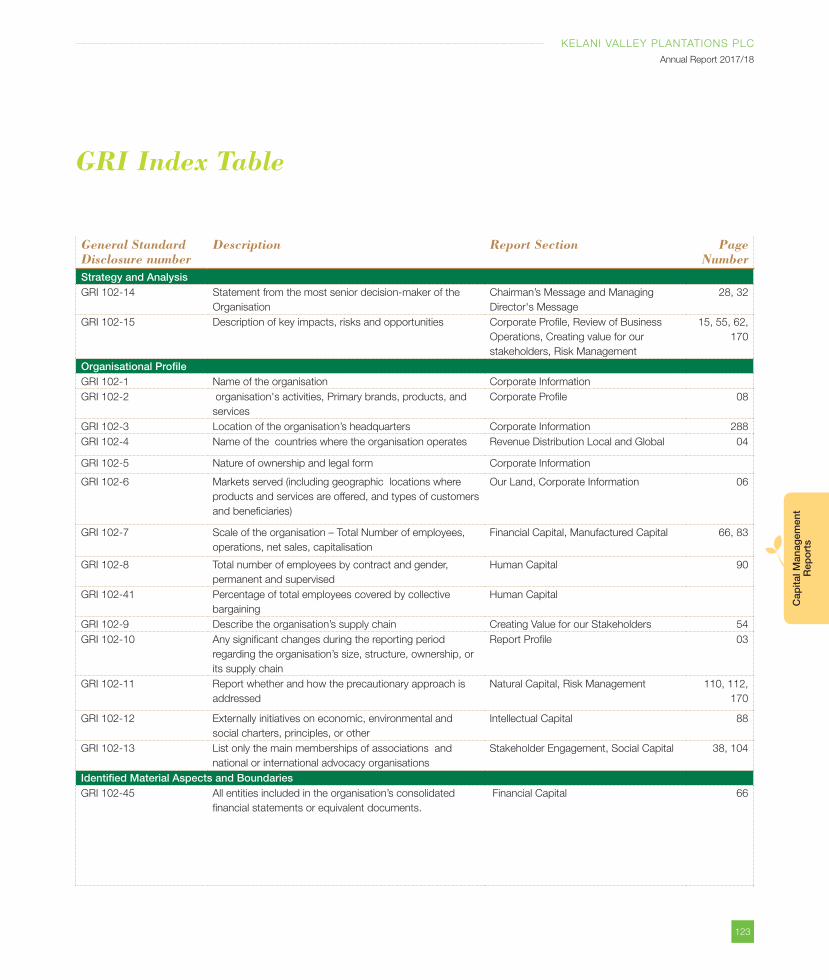
123
KELANI VALLEY PLANTATIONS PLC
Annual Report 2017/18
Cap
ital M
anag
emen
t R
epo
rts
GRI Index Table
General Standard Disclosure number
Description Report Section Page Number
Strategy and AnalysisGRI 102-14 Statement from the most senior decision-maker of the
Organisation
Chairman’s Message and Managing
Director's Message
28, 32
GRI 102-15 Description of key impacts, risks and opportunities Corporate Profile, Review of Business
Operations, Creating value for our
stakeholders, Risk Management
15, 55, 62,
170
Organisational ProfileGRI 102-1 Name of the organisation Corporate Information
GRI 102-2 organisation's activities, Primary brands, products, and
services
Corporate Profile 08
GRI 102-3 Location of the organisation’s headquarters Corporate Information 288
GRI 102-4 Name of the countries where the organisation operates Revenue Distribution Local and Global 04
GRI 102-5 Nature of ownership and legal form Corporate Information
GRI 102-6 Markets served (including geographic locations where
products and services are offered, and types of customers
and beneficiaries)
Our Land, Corporate Information 06
GRI 102-7 Scale of the organisation – Total Number of employees,
operations, net sales, capitalisation
Financial Capital, Manufactured Capital 66, 83
GRI 102-8 Total number of employees by contract and gender,
permanent and supervised
Human Capital 90
GRI 102-41 Percentage of total employees covered by collective
bargaining
Human Capital
GRI 102-9 Describe the organisation’s supply chain Creating Value for our Stakeholders 54
GRI 102-10 Any significant changes during the reporting period
regarding the organisation’s size, structure, ownership, or
its supply chain
Report Profile 03
GRI 102-11 Report whether and how the precautionary approach is
addressed
Natural Capital, Risk Management 110, 112,
170
GRI 102-12 Externally initiatives on economic, environmental and
social charters, principles, or other
Intellectual Capital 88
GRI 102-13 List only the main memberships of associations and
national or international advocacy organisations
Stakeholder Engagement, Social Capital 38, 104
Identified Material Aspects and BoundariesGRI 102-45 All entities included in the organisation’s consolidated
financial statements or equivalent documents.
Financial Capital 66
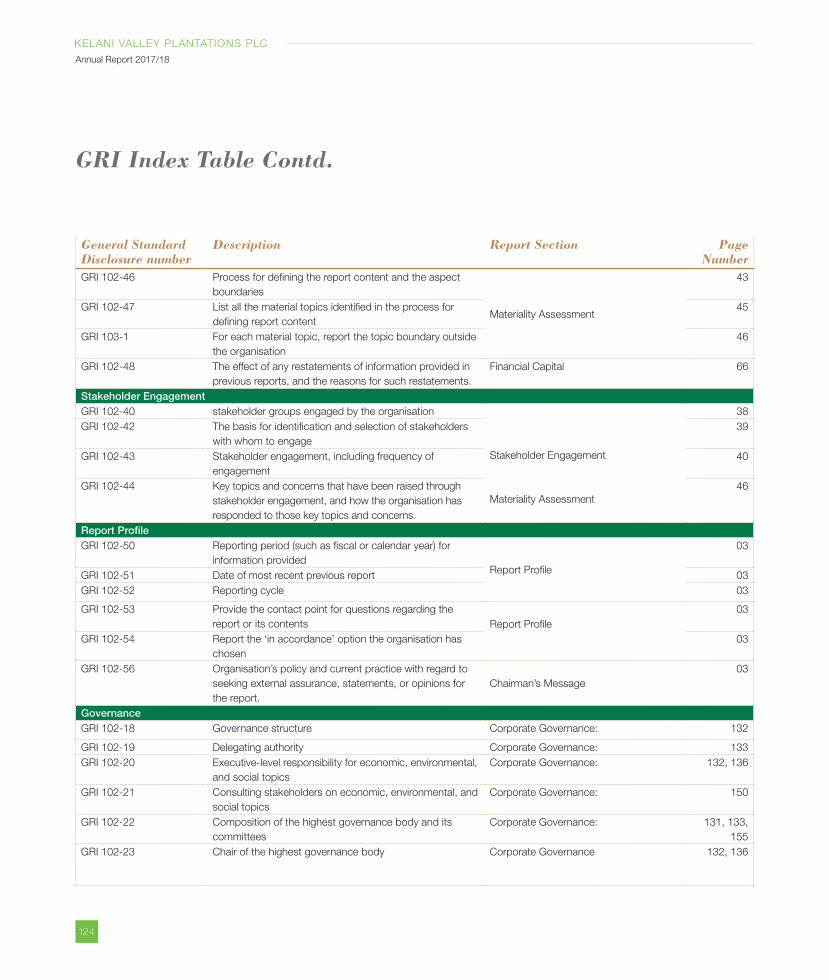
124
KELANI VALLEY PLANTATIONS PLC
Annual Report 2017/18
General Standard Disclosure number
Description Report Section Page Number
GRI 102-46 Process for defining the report content and the aspect
boundaries
Materiality Assessment
43
GRI 102-47 List all the material topics identified in the process for
defining report content
45
GRI 103-1 For each material topic, report the topic boundary outside
the organisation
46
GRI 102-48 The effect of any restatements of information provided in
previous reports, and the reasons for such restatements.
Financial Capital 66
Stakeholder EngagementGRI 102-40 stakeholder groups engaged by the organisation
Stakeholder Engagement
Materiality Assessment
38
GRI 102-42 The basis for identification and selection of stakeholders
with whom to engage
39
GRI 102-43 Stakeholder engagement, including frequency of
engagement
40
GRI 102-44 Key topics and concerns that have been raised through
stakeholder engagement, and how the organisation has
responded to those key topics and concerns.
46
Report ProfileGRI 102-50 Reporting period (such as fiscal or calendar year) for
information providedReport Profile
03
GRI 102-51 Date of most recent previous report 03
GRI 102-52 Reporting cycle 03
GRI 102-53 Provide the contact point for questions regarding the
report or its contents Report Profile
03
GRI 102-54 Report the ‘in accordance’ option the organisation has
chosen
03
GRI 102-56 Organisation’s policy and current practice with regard to
seeking external assurance, statements, or opinions for
the report.
Chairman’s Message
03
GovernanceGRI 102-18 Governance structure Corporate Governance: 132
GRI 102-19 Delegating authority Corporate Governance: 133
GRI 102-20 Executive-level responsibility for economic, environmental,
and social topics
Corporate Governance: 132, 136
GRI 102-21 Consulting stakeholders on economic, environmental, and
social topics
Corporate Governance: 150
GRI 102-22 Composition of the highest governance body and its
committees
Corporate Governance: 131, 133,
155
GRI 102-23 Chair of the highest governance body Corporate Governance 132, 136
GRI Index Table Contd.
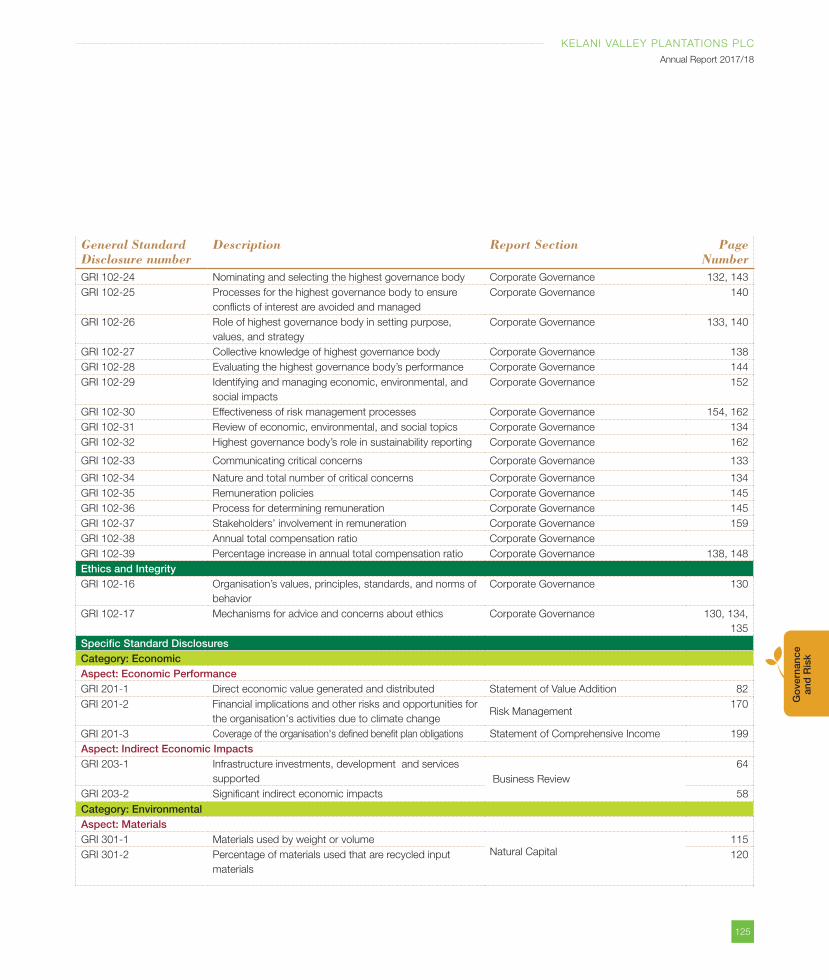
125
KELANI VALLEY PLANTATIONS PLC
Annual Report 2017/18
Go
vern
ance
an
d R
isk
General Standard Disclosure number
Description Report Section Page Number
GRI 102-24 Nominating and selecting the highest governance body Corporate Governance 132, 143
GRI 102-25 Processes for the highest governance body to ensure
conflicts of interest are avoided and managed
Corporate Governance 140
GRI 102-26 Role of highest governance body in setting purpose,
values, and strategy
Corporate Governance 133, 140
GRI 102-27 Collective knowledge of highest governance body Corporate Governance 138
GRI 102-28 Evaluating the highest governance body’s performance Corporate Governance 144
GRI 102-29 Identifying and managing economic, environmental, and
social impacts
Corporate Governance 152
GRI 102-30 Effectiveness of risk management processes Corporate Governance 154, 162
GRI 102-31 Review of economic, environmental, and social topics Corporate Governance 134
GRI 102-32 Highest governance body’s role in sustainability reporting Corporate Governance 162
GRI 102-33 Communicating critical concerns Corporate Governance 133
GRI 102-34 Nature and total number of critical concerns Corporate Governance 134
GRI 102-35 Remuneration policies Corporate Governance 145
GRI 102-36 Process for determining remuneration Corporate Governance 145
GRI 102-37 Stakeholders’ involvement in remuneration Corporate Governance 159
GRI 102-38 Annual total compensation ratio Corporate Governance
GRI 102-39 Percentage increase in annual total compensation ratio Corporate Governance 138, 148
Ethics and IntegrityGRI 102-16 Organisation’s values, principles, standards, and norms of
behavior
Corporate Governance 130
GRI 102-17 Mechanisms for advice and concerns about ethics Corporate Governance 130, 134,
135
Specific Standard DisclosuresCategory: EconomicAspect: Economic PerformanceGRI 201-1 Direct economic value generated and distributed Statement of Value Addition 82
GRI 201-2 Financial implications and other risks and opportunities for
the organisation's activities due to climate changeRisk Management
170
GRI 201-3 Coverage of the organisation's defined benefit plan obligations Statement of Comprehensive Income 199
Aspect: Indirect Economic ImpactsGRI 203-1 Infrastructure investments, development and services
supported Business Review
64
GRI 203-2 Significant indirect economic impacts 58
Category: EnvironmentalAspect: MaterialsGRI 301-1 Materials used by weight or volume
Natural Capital
115
GRI 301-2 Percentage of materials used that are recycled input
materials
120
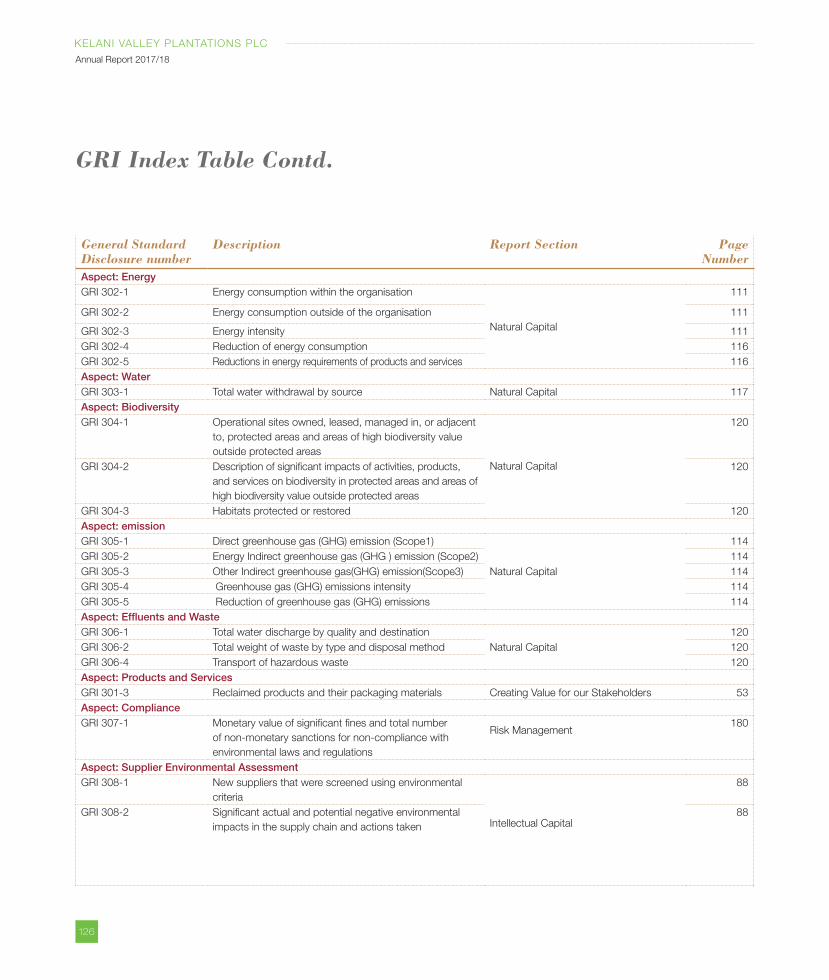
126
KELANI VALLEY PLANTATIONS PLC
Annual Report 2017/18
GRI Index Table Contd.
General Standard Disclosure number
Description Report Section Page Number
Aspect: EnergyGRI 302-1 Energy consumption within the organisation
Natural Capital
111
GRI 302-2 Energy consumption outside of the organisation 111
GRI 302-3 Energy intensity 111
GRI 302-4 Reduction of energy consumption 116
GRI 302-5 Reductions in energy requirements of products and services 116
Aspect: WaterGRI 303-1 Total water withdrawal by source Natural Capital 117
Aspect: BiodiversityGRI 304-1 Operational sites owned, leased, managed in, or adjacent
to, protected areas and areas of high biodiversity value
outside protected areas
Natural Capital
120
GRI 304-2 Description of significant impacts of activities, products,
and services on biodiversity in protected areas and areas of
high biodiversity value outside protected areas
120
GRI 304-3 Habitats protected or restored 120
Aspect: emissionGRI 305-1 Direct greenhouse gas (GHG) emission (Scope1)
Natural Capital
114
GRI 305-2 Energy Indirect greenhouse gas (GHG ) emission (Scope2) 114
GRI 305-3 Other Indirect greenhouse gas(GHG) emission(Scope3) 114
GRI 305-4 Greenhouse gas (GHG) emissions intensity 114
GRI 305-5 Reduction of greenhouse gas (GHG) emissions 114
Aspect: Effluents and WasteGRI 306-1 Total water discharge by quality and destination
Natural Capital
120
GRI 306-2 Total weight of waste by type and disposal method 120
GRI 306-4 Transport of hazardous waste 120
Aspect: Products and ServicesGRI 301-3 Reclaimed products and their packaging materials Creating Value for our Stakeholders 53
Aspect: ComplianceGRI 307-1 Monetary value of significant fines and total number
of non-monetary sanctions for non-compliance with
environmental laws and regulations
Risk Management180
Aspect: Supplier Environmental AssessmentGRI 308-1 New suppliers that were screened using environmental
criteria
Intellectual Capital
88
GRI 308-2 Significant actual and potential negative environmental
impacts in the supply chain and actions taken
88
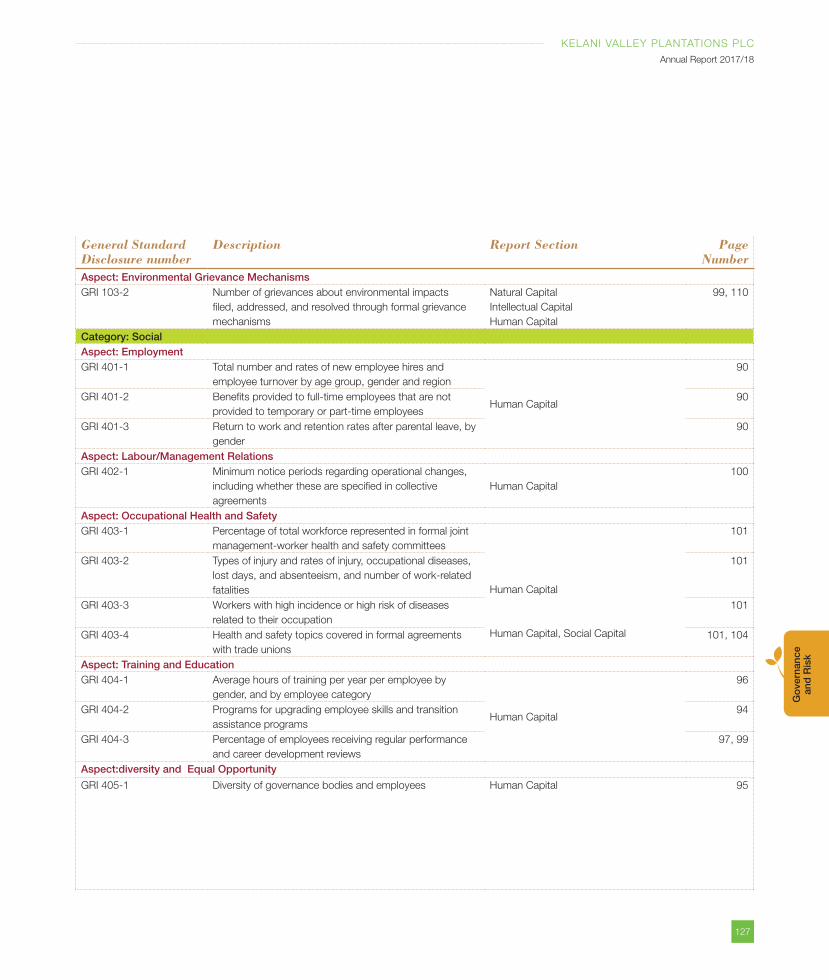
127
KELANI VALLEY PLANTATIONS PLC
Annual Report 2017/18
Go
vern
ance
an
d R
isk
General Standard Disclosure number
Description Report Section Page Number
Aspect: Environmental Grievance MechanismsGRI 103-2 Number of grievances about environmental impacts
filed, addressed, and resolved through formal grievance
mechanisms
Natural Capital
Intellectual Capital
Human Capital
99, 110
Category: SocialAspect: EmploymentGRI 401-1 Total number and rates of new employee hires and
employee turnover by age group, gender and region
Human Capital
90
GRI 401-2 Benefits provided to full-time employees that are not
provided to temporary or part-time employees
90
GRI 401-3 Return to work and retention rates after parental leave, by
gender
90
Aspect: Labour/Management RelationsGRI 402-1 Minimum notice periods regarding operational changes,
including whether these are specified in collective
agreements
Human Capital
100
Aspect: Occupational Health and SafetyGRI 403-1 Percentage of total workforce represented in formal joint
management-worker health and safety committees
Human Capital
Human Capital, Social Capital
101
GRI 403-2 Types of injury and rates of injury, occupational diseases,
lost days, and absenteeism, and number of work-related
fatalities
101
GRI 403-3 Workers with high incidence or high risk of diseases
related to their occupation
101
GRI 403-4 Health and safety topics covered in formal agreements
with trade unions
101, 104
Aspect: Training and EducationGRI 404-1 Average hours of training per year per employee by
gender, and by employee category
Human Capital
96
GRI 404-2 Programs for upgrading employee skills and transition
assistance programs
94
GRI 404-3 Percentage of employees receiving regular performance
and career development reviews
97, 99
Aspect:diversity and Equal Opportunity
GRI 405-1 Diversity of governance bodies and employees Human Capital 95
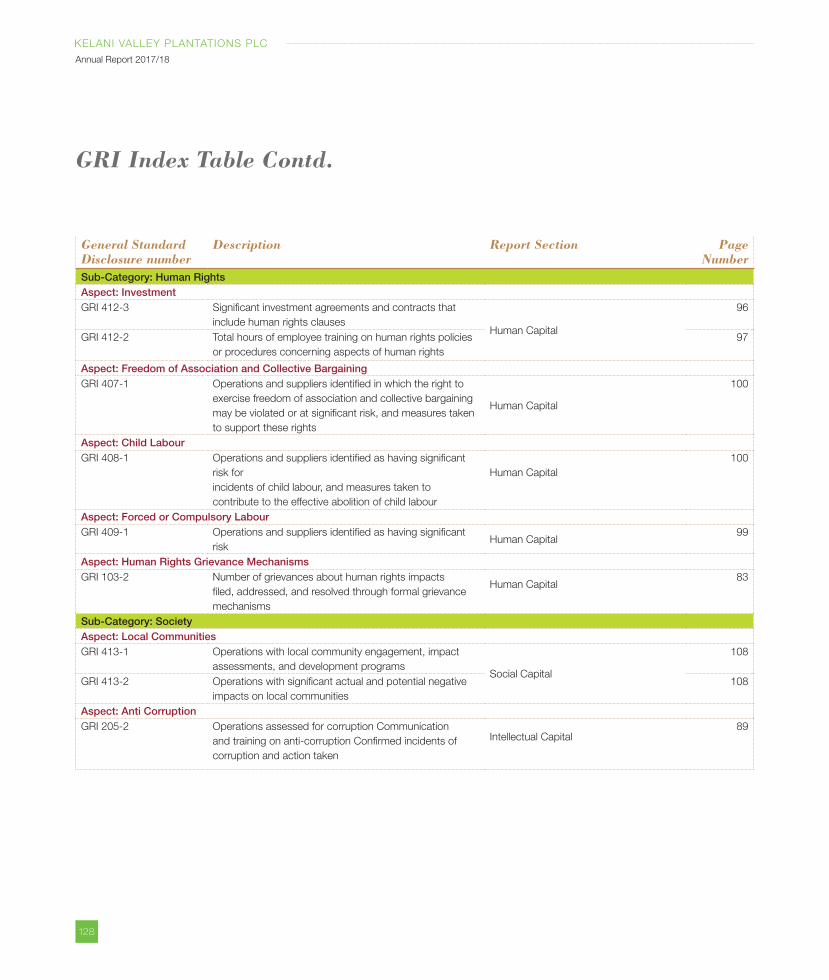
128
KELANI VALLEY PLANTATIONS PLC
Annual Report 2017/18
GRI Index Table Contd.
General Standard Disclosure number
Description Report Section Page Number
Sub-Category: Human RightsAspect: InvestmentGRI 412-3 Significant investment agreements and contracts that
include human rights clauses Human Capital
96
GRI 412-2 Total hours of employee training on human rights policies
or procedures concerning aspects of human rights
97
Aspect: Freedom of Association and Collective BargainingGRI 407-1 Operations and suppliers identified in which the right to
exercise freedom of association and collective bargaining
may be violated or at significant risk, and measures taken
to support these rights
Human Capital
100
Aspect: Child LabourGRI 408-1 Operations and suppliers identified as having significant
risk for
incidents of child labour, and measures taken to
contribute to the effective abolition of child labour
Human Capital
100
Aspect: Forced or Compulsory LabourGRI 409-1 Operations and suppliers identified as having significant
riskHuman Capital
99
Aspect: Human Rights Grievance MechanismsGRI 103-2 Number of grievances about human rights impacts
filed, addressed, and resolved through formal grievance
mechanisms
Human Capital 83
Sub-Category: SocietyAspect: Local CommunitiesGRI 413-1 Operations with local community engagement, impact
assessments, and development programsSocial Capital
108
GRI 413-2 Operations with significant actual and potential negative
impacts on local communities
108
Aspect: Anti CorruptionGRI 205-2 Operations assessed for corruption Communication
and training on anti-corruption Confirmed incidents of
corruption and action taken
Intellectual Capital89
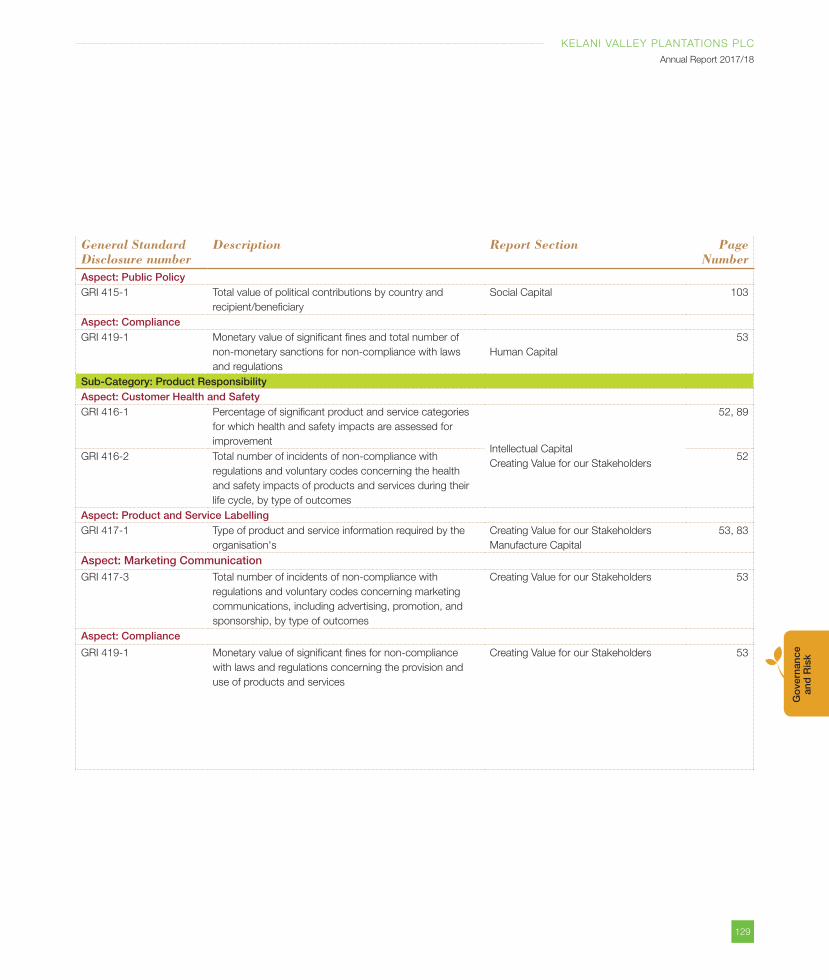
129
KELANI VALLEY PLANTATIONS PLC
Annual Report 2017/18
Go
vern
ance
an
d R
isk
General Standard Disclosure number
Description Report Section Page Number
Aspect: Public PolicyGRI 415-1 Total value of political contributions by country and
recipient/beneficiary
Social Capital 103
Aspect: ComplianceGRI 419-1 Monetary value of significant fines and total number of
non-monetary sanctions for non-compliance with laws
and regulations
Human Capital
53
Sub-Category: Product ResponsibilityAspect: Customer Health and SafetyGRI 416-1 Percentage of significant product and service categories
for which health and safety impacts are assessed for
improvementIntellectual Capital
Creating Value for our Stakeholders
52, 89
GRI 416-2 Total number of incidents of non-compliance with
regulations and voluntary codes concerning the health
and safety impacts of products and services during their
life cycle, by type of outcomes
52
Aspect: Product and Service LabellingGRI 417-1 Type of product and service information required by the
organisation's
Creating Value for our Stakeholders
Manufacture Capital
53, 83
Aspect: Marketing CommunicationGRI 417-3 Total number of incidents of non-compliance with
regulations and voluntary codes concerning marketing
communications, including advertising, promotion, and
sponsorship, by type of outcomes
Creating Value for our Stakeholders 53
Aspect: Compliance
GRI 419-1 Monetary value of significant fines for non-compliance
with laws and regulations concerning the provision and
use of products and services
Creating Value for our Stakeholders 53
130
KELANI VALLEY PLANTATIONS PLC
Annual Report 2017/18
STATEMENT FROM THE CHAIRMAN ON CORPORATE GOVERNANCEGood corporate governance is a vital
element that contributes to the long
term growth and sustainability of KVPL.
We strive to emulate good governance
practices in all our day-to-day activities vis-
à-vis strategies and procedures to facilitate
good ethical behaviour and a sound
ethical culture. Our Corporate Governance
framework consists of strong business
principles, sound policies and procedures,
underpinned by an efficient monitoring
mechanism, where the Board of Directors
stands as the apex governing body.
The Board consists of a diverse mix of
individuals drawn from various disciplines.
Their collective experience and varied
perspectives have enabled the Company to
implement strategic initiatives to enhance
performance of KVPL, to overcome
numerous sector-specific business
challenges that we had to face in the
period under review.
Our governance framework is geared to
strengthen the roles and responsibilities
of the Board of Directors of the Group,
ensure transparency and accountability
and reinforce our commitment to provide
sustainable returns for the benefit of all
internal and external stakeholders, despite
all odds. Our Code of Conduct and
Business Governance offers direction for
all the employees across the organisation,
Corporate Governance
where we continually stress on the values
of good governance, honesty, integrity and
fairness.
This section of the Annual Report seeks
to demonstrate KVPL’s governance
framework in action and its correlation to
the regulatory framework applicable to
our business. Accordingly, our business
principles reflect the standards set out to
ensure that we operate lawfully and comply
with all mandatory requirements including
the Companies Act, No. 07 of 2007 and
the updated Code of Best Practice on
Corporate Governance 2007, issued by the
Institute of Chartered Accountants of Sri
Lanka and the Code of Best Practice on
Related Party Transactions issued by the
Securities and Exchange Commission of
Sri Lanka.
We hope that this brief message will be
of value to you in assessing how the
regulatory requirements and best practices
are being put into action across KVPL.
I assure you that we make every effort
to continuously improve our Corporate
Governance practices by complying with
the relevant regulatory and governance
framework to achieve ethical and
stewardship obligations, while supporting
the creation of long - term sustainable
stakeholder value.
As required in the above Code, I together
with the Board of Directors hereby confirm
that we are not aware of any material
violations of any of the provisions of the
Code of Business Conduct and Ethics as
the case may be by any Director or any
member of the Corporate Management of
KVPL.
A M PandithageChairman
GRI 102-16,17
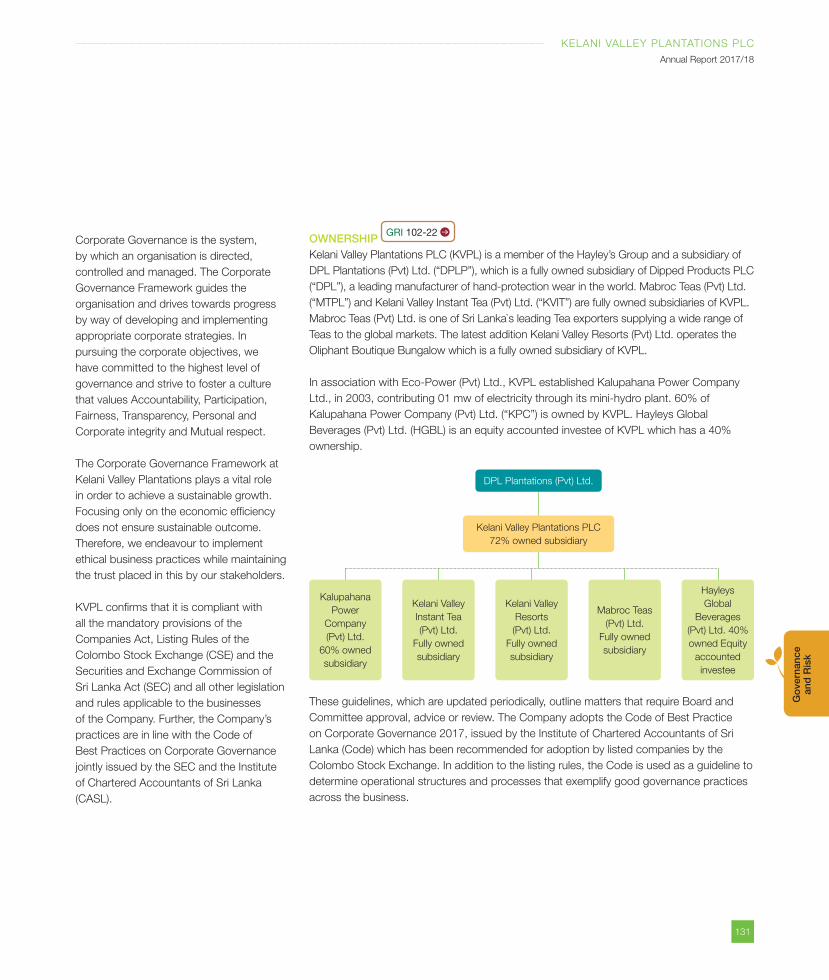
131
KELANI VALLEY PLANTATIONS PLC
Annual Report 2017/18
Go
vern
ance
an
d R
isk
Corporate Governance is the system,
by which an organisation is directed,
controlled and managed. The Corporate
Governance Framework guides the
organisation and drives towards progress
by way of developing and implementing
appropriate corporate strategies. In
pursuing the corporate objectives, we
have committed to the highest level of
governance and strive to foster a culture
that values Accountability, Participation,
Fairness, Transparency, Personal and
Corporate integrity and Mutual respect.
The Corporate Governance Framework at
Kelani Valley Plantations plays a vital role
in order to achieve a sustainable growth.
Focusing only on the economic efficiency
does not ensure sustainable outcome.
Therefore, we endeavour to implement
ethical business practices while maintaining
the trust placed in this by our stakeholders.
KVPL confirms that it is compliant with
all the mandatory provisions of the
Companies Act, Listing Rules of the
Colombo Stock Exchange (CSE) and the
Securities and Exchange Commission of
Sri Lanka Act (SEC) and all other legislation
and rules applicable to the businesses
of the Company. Further, the Company’s
practices are in line with the Code of
Best Practices on Corporate Governance
jointly issued by the SEC and the Institute
of Chartered Accountants of Sri Lanka
(CASL).
OWNERSHIP GRI 102-22
Kelani Valley Plantations PLC (KVPL) is a member of the Hayley’s Group and a subsidiary of
DPL Plantations (Pvt) Ltd. (“DPLP”), which is a fully owned subsidiary of Dipped Products PLC
(“DPL”), a leading manufacturer of hand-protection wear in the world. Mabroc Teas (Pvt) Ltd.
(“MTPL”) and Kelani Valley Instant Tea (Pvt) Ltd. (“KVIT”) are fully owned subsidiaries of KVPL.
Mabroc Teas (Pvt) Ltd. is one of Sri Lanka`s leading Tea exporters supplying a wide range of
Teas to the global markets. The latest addition Kelani Valley Resorts (Pvt) Ltd. operates the
Oliphant Boutique Bungalow which is a fully owned subsidiary of KVPL.
In association with Eco-Power (Pvt) Ltd., KVPL established Kalupahana Power Company
Ltd., in 2003, contributing 01 mw of electricity through its mini-hydro plant. 60% of
Kalupahana Power Company (Pvt) Ltd. (“KPC”) is owned by KVPL. Hayleys Global
Beverages (Pvt) Ltd. (HGBL) is an equity accounted investee of KVPL which has a 40%
ownership.
These guidelines, which are updated periodically, outline matters that require Board and
Committee approval, advice or review. The Company adopts the Code of Best Practice
on Corporate Governance 2017, issued by the Institute of Chartered Accountants of Sri
Lanka (Code) which has been recommended for adoption by listed companies by the
Colombo Stock Exchange. In addition to the listing rules, the Code is used as a guideline to
determine operational structures and processes that exemplify good governance practices
across the business.
DPL Plantations (Pvt) Ltd.
Kelani Valley Plantations PLC
72% owned subsidiary
Kalupahana
Power
Company
(Pvt) Ltd.
60% owned
subsidiary
Kelani Valley
Instant Tea
(Pvt) Ltd.
Fully owned
subsidiary
Kelani Valley
Resorts
(Pvt) Ltd.
Fully owned
subsidiary
Mabroc Teas
(Pvt) Ltd.
Fully owned
subsidiary
Hayleys
Global
Beverages
(Pvt) Ltd. 40%
owned Equity
accounted
investee
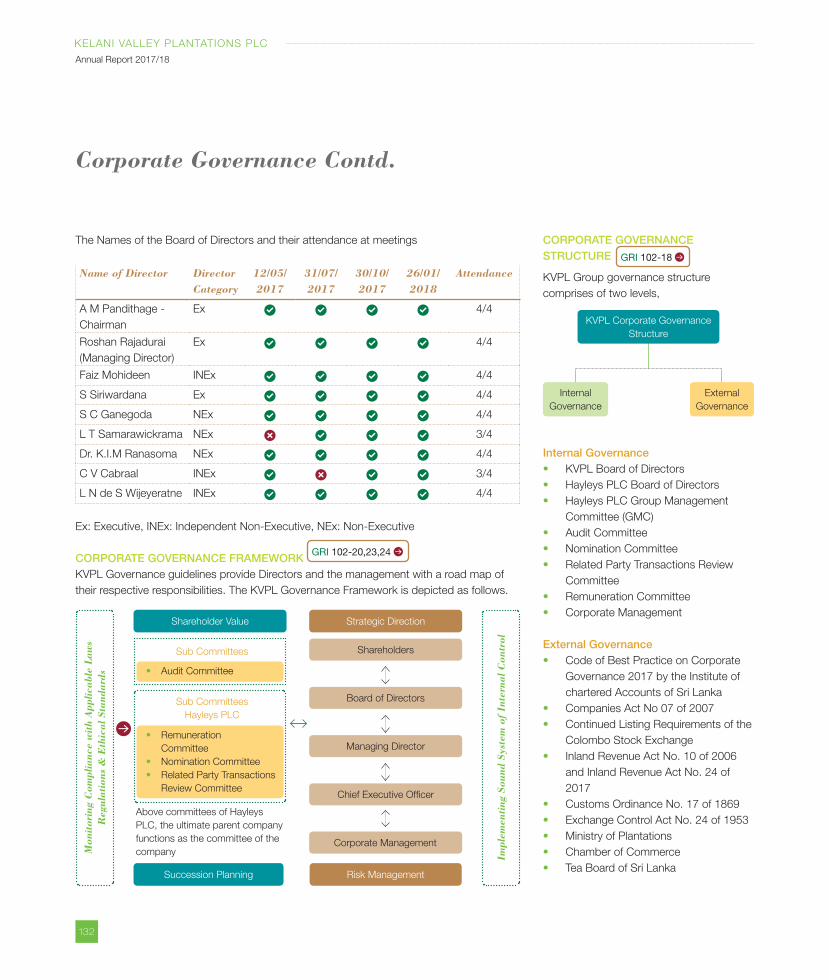
132
KELANI VALLEY PLANTATIONS PLC
Annual Report 2017/18
The Names of the Board of Directors and their attendance at meetings
Name of Director DirectorCategory
12/05/ 2017
31/07/2017
30/10/2017
26/01/2018
Attendance
A M Pandithage -
Chairman
Ex 4/4
Roshan Rajadurai
(Managing Director)
Ex 4/4
Faiz Mohideen INEx 4/4
S Siriwardana Ex 4/4
S C Ganegoda NEx 4/4
L T Samarawickrama NEx 3/4
Dr. K.I.M Ranasoma NEx 4/4
C V Cabraal INEx 3/4
L N de S Wijeyeratne INEx 4/4
Ex: Executive, INEx: Independent Non-Executive, NEx: Non-Executive
CORPORATE GOVERNANCE FRAMEWORK GRI 102-20,23,24
KVPL Governance guidelines provide Directors and the management with a road map of
their respective responsibilities. The KVPL Governance Framework is depicted as follows.
CORPORATE GOVERNANCE STRUCTURE
KVPL Group governance structure
comprises of two levels,
Internal GovernanceKVPL Board of Directors
Hayleys PLC Board of Directors
Hayleys PLC Group Management
Committee (GMC)
Audit Committee
Nomination Committee
Related Party Transactions Review
Committee
Remuneration Committee
Corporate Management
External GovernanceCode of Best Practice on Corporate
Governance 2017 by the Institute of
chartered Accounts of Sri Lanka
Companies Act No 07 of 2007
Continued Listing Requirements of the
Colombo Stock Exchange
Inland Revenue Act No. 10 of 2006
and Inland Revenue Act No. 24 of
2017
Customs Ordinance No. 17 of 1869
Exchange Control Act No. 24 of 1953
Ministry of Plantations
Chamber of Commerce
Tea Board of Sri Lanka
Corporate Governance Contd.
KVPL Corporate Governance
Structure
Internal
Governance
External
Governance
Shareholder Value
Mon
itor
ing
Com
plia
nce
wit
h A
pplic
able
Law
s
Reg
ulat
ions
& E
thic
al S
tand
ards
Impl
emen
ting
Sou
nd S
yste
m o
f In
tern
al C
ontr
ol
Succession Planning Risk Management
Strategic Direction
Shareholders
Board of Directors
Managing Director
Chief Executive Officer
Corporate Management
Audit Committee
Remuneration
Committee
Nomination Committee
Related Party Transactions
Review Committee
Sub Committees
Sub Committees
Hayleys PLC
Above committees of Hayleys
PLC, the ultimate parent company
functions as the committee of the
company
GRI 102-18
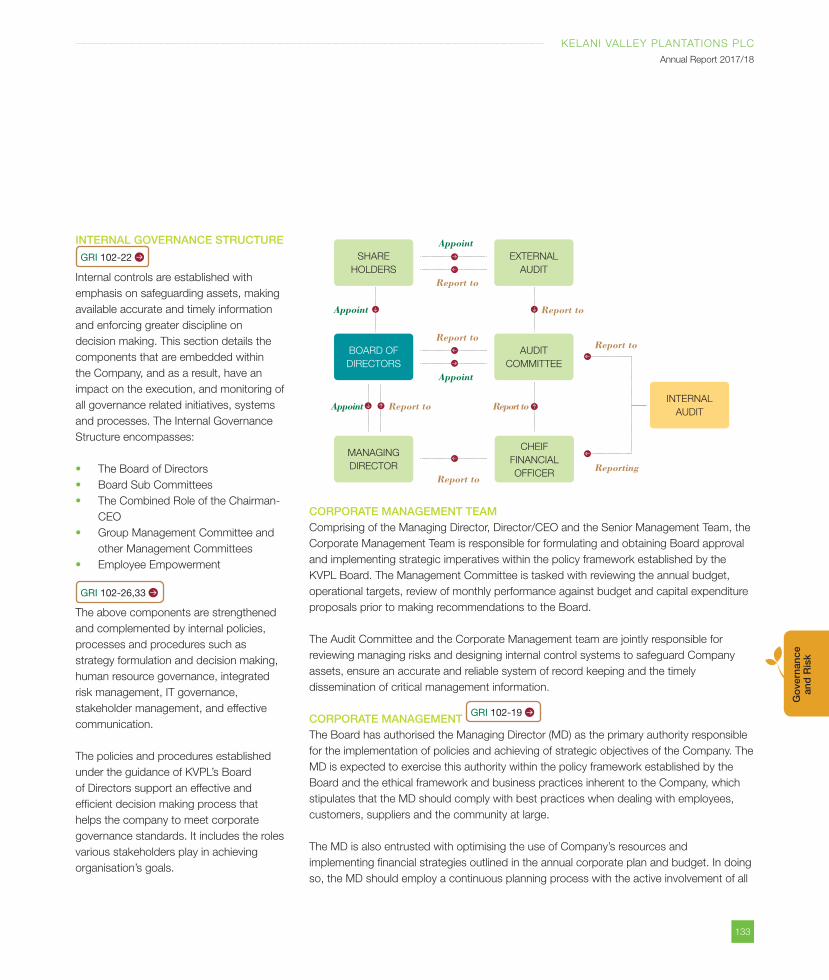
133
KELANI VALLEY PLANTATIONS PLC
Annual Report 2017/18
Go
vern
ance
an
d R
isk
INTERNAL GOVERNANCE STRUCTURE
Internal controls are established with
emphasis on safeguarding assets, making
available accurate and timely information
and enforcing greater discipline on
decision making. This section details the
components that are embedded within
the Company, and as a result, have an
impact on the execution, and monitoring of
all governance related initiatives, systems
and processes. The Internal Governance
Structure encompasses:
The Board of Directors
Board Sub Committees
The Combined Role of the Chairman-
CEO
Group Management Committee and
other Management Committees
Employee Empowerment
The above components are strengthened
and complemented by internal policies,
processes and procedures such as
strategy formulation and decision making,
human resource governance, integrated
risk management, IT governance,
stakeholder management, and effective
communication.
The policies and procedures established
under the guidance of KVPL’s Board
of Directors support an effective and
efficient decision making process that
helps the company to meet corporate
governance standards. It includes the roles
various stakeholders play in achieving
organisation’s goals.
CORPORATE MANAGEMENT TEAMComprising of the Managing Director, Director/CEO and the Senior Management Team, the
Corporate Management Team is responsible for formulating and obtaining Board approval
and implementing strategic imperatives within the policy framework established by the
KVPL Board. The Management Committee is tasked with reviewing the annual budget,
operational targets, review of monthly performance against budget and capital expenditure
proposals prior to making recommendations to the Board.
The Audit Committee and the Corporate Management team are jointly responsible for
reviewing managing risks and designing internal control systems to safeguard Company
assets, ensure an accurate and reliable system of record keeping and the timely
dissemination of critical management information.
CORPORATE MANAGEMENT GRI 102-19
The Board has authorised the Managing Director (MD) as the primary authority responsible
for the implementation of policies and achieving of strategic objectives of the Company. The
MD is expected to exercise this authority within the policy framework established by the
Board and the ethical framework and business practices inherent to the Company, which
stipulates that the MD should comply with best practices when dealing with employees,
customers, suppliers and the community at large.
The MD is also entrusted with optimising the use of Company’s resources and
implementing financial strategies outlined in the annual corporate plan and budget. In doing
so, the MD should employ a continuous planning process with the active involvement of all
MANAGING
DIRECTOR
BOARD OF
DIRECTORS
AUDIT
COMMITTEE
EXTERNAL
AUDIT
SHARE
HOLDERS
CHEIF
FINANCIAL
OFFICER
INTERNAL
AUDIT
Appoint
Appoint
Appoint
Appoint
Report to
Report to
Report to Report to
Report to
Report to
ReportingReport to
GRI 102-22
GRI 102-26,33
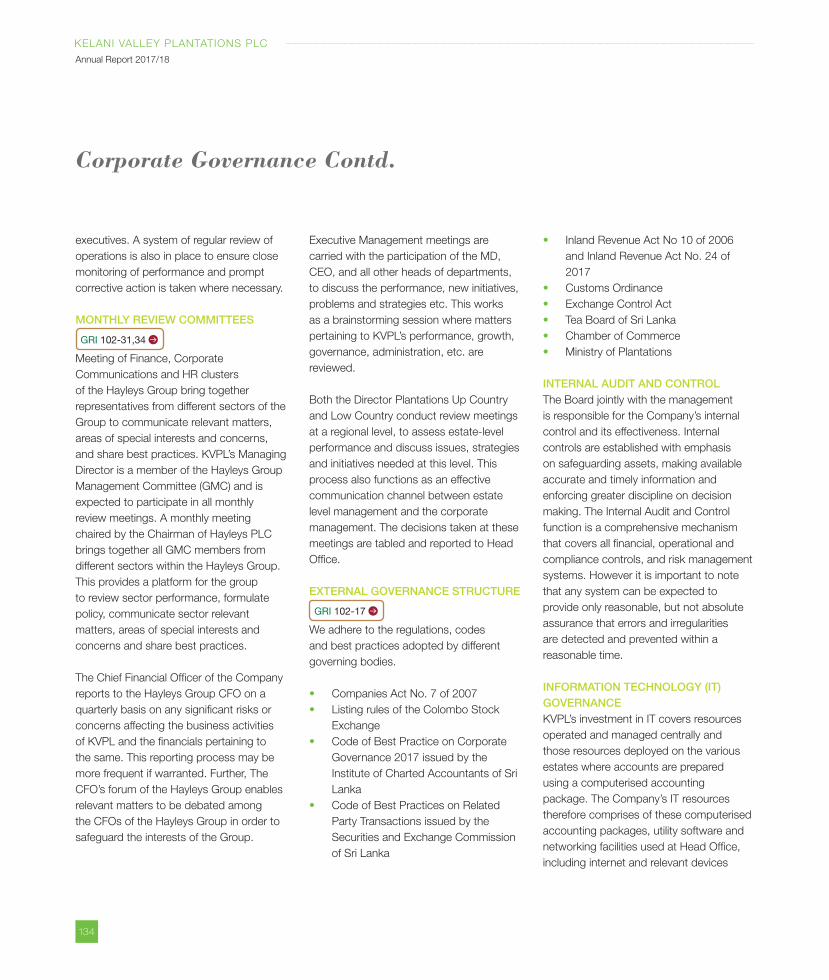
134
KELANI VALLEY PLANTATIONS PLC
Annual Report 2017/18
executives. A system of regular review of
operations is also in place to ensure close
monitoring of performance and prompt
corrective action is taken where necessary.
MONTHLY REVIEW COMMITTEES
GRI 102-31,34
Meeting of Finance, Corporate
Communications and HR clusters
of the Hayleys Group bring together
representatives from different sectors of the
Group to communicate relevant matters,
areas of special interests and concerns,
and share best practices. KVPL’s Managing
Director is a member of the Hayleys Group
Management Committee (GMC) and is
expected to participate in all monthly
review meetings. A monthly meeting
chaired by the Chairman of Hayleys PLC
brings together all GMC members from
different sectors within the Hayleys Group.
This provides a platform for the group
to review sector performance, formulate
policy, communicate sector relevant
matters, areas of special interests and
concerns and share best practices.
The Chief Financial Officer of the Company
reports to the Hayleys Group CFO on a
quarterly basis on any significant risks or
concerns affecting the business activities
of KVPL and the financials pertaining to
the same. This reporting process may be
more frequent if warranted. Further, The
CFO’s forum of the Hayleys Group enables
relevant matters to be debated among
the CFOs of the Hayleys Group in order to
safeguard the interests of the Group.
Executive Management meetings are
carried with the participation of the MD,
CEO, and all other heads of departments,
to discuss the performance, new initiatives,
problems and strategies etc. This works
as a brainstorming session where matters
pertaining to KVPL’s performance, growth,
governance, administration, etc. are
reviewed.
Both the Director Plantations Up Country
and Low Country conduct review meetings
at a regional level, to assess estate-level
performance and discuss issues, strategies
and initiatives needed at this level. This
process also functions as an effective
communication channel between estate
level management and the corporate
management. The decisions taken at these
meetings are tabled and reported to Head
Office.
EXTERNAL GOVERNANCE STRUCTURE
GRI 102-17
We adhere to the regulations, codes
and best practices adopted by different
governing bodies.
Companies Act No. 7 of 2007
Listing rules of the Colombo Stock
Exchange
Code of Best Practice on Corporate
Governance 2017 issued by the
Institute of Charted Accountants of Sri
Lanka
Code of Best Practices on Related
Party Transactions issued by the
Securities and Exchange Commission
of Sri Lanka
Inland Revenue Act No 10 of 2006
and Inland Revenue Act No. 24 of
2017
Customs Ordinance
Exchange Control Act
Tea Board of Sri Lanka
Chamber of Commerce
Ministry of Plantations
INTERNAL AUDIT AND CONTROLThe Board jointly with the management
is responsible for the Company’s internal
control and its effectiveness. Internal
controls are established with emphasis
on safeguarding assets, making available
accurate and timely information and
enforcing greater discipline on decision
making. The Internal Audit and Control
function is a comprehensive mechanism
that covers all financial, operational and
compliance controls, and risk management
systems. However it is important to note
that any system can be expected to
provide only reasonable, but not absolute
assurance that errors and irregularities
are detected and prevented within a
reasonable time.
INFORMATION TECHNOLOGY (IT) GOVERNANCEKVPL’s investment in IT covers resources
operated and managed centrally and
those resources deployed on the various
estates where accounts are prepared
using a computerised accounting
package. The Company’s IT resources
therefore comprises of these computerised
accounting packages, utility software and
networking facilities used at Head Office,
including internet and relevant devices
Corporate Governance Contd.
135
KELANI VALLEY PLANTATIONS PLC
Annual Report 2017/18
Go
vern
ance
an
d R
isk
are used to interconnect Head Office with
estates.
IT VALUE AND ALIGNMENTIn recent years, KVPL has come to
increasingly leverage on IT to improve
processes across the business. However,
investment in IT projects and systems are
made after considering their suitability for
the related projects. Furthermore, aspects
such as cost savings, the provision of
timely information and the balance between
cost and benefits are also considered when
decisions are taken.
With productivity improvement being
identified as a key growth driver for KVPL,
the company set up a Performance
Monitoring Unit at the Head Office, to
monitor the performance of the estates
through an online system that delivers
critical information in real time.
IT RISK MANAGEMENTRisks associated with IT are assessed in
the process of KVPL’s Risk Management
mechanism. The use of licensed software,
close monitoring of internet usage (to
comply with the IT Use Policy), mail
server operations and the use of anti-
virus and firewall software are some of the
safeguards currently in place to minimise IT
related risks.
EXTERNAL AUDITFor the fifth consecutive year, Messrs.
Ernst & Young (EY) were appointed as the
external auditors of the Company. The
Company is guided by the knowledge
and experience of the Audit Committee
to ensure effective usage of our external
auditor’s expertise, while maintaining
independence in order to deliver a
transparent set of Financial Statements
which are certified annually by them.
WHISTLE-BLOWER POLICY
GRI 102-17
The whistle-blower policy provides
a mechanism for employees to raise
concerns regarding any person within the
organisation who they see as engaging
in unlawful behaviour or violating the
Company code of conduct by engaging in
financial fraud, incorrect financial reporting,
and improper conduct, breach of values
and policies of the organisation. Under the
guidelines of the Whistle-blower policy, any
employee who raises such concerns will
be provided a guarantee that they will be
protected from reprisals and victimisation.
The Company’s whistle-blowing policy
enables staff to raise concerns of
suspected wrongdoing without fear of
reprisal or retribution. The policy allows
employees to directly raise concerns with
the Company Secretary or a designated
officer. Such complaints are investigated
and addressed through a formalised
procedure and brought to the notice of the
Board/Audit Committee.
136
KELANI VALLEY PLANTATIONS PLC
Annual Report 2017/18
Reference to CASL & Sec Code
Details of Compliance
Section 1: The CompanyA. Directors
Principle: A.1 The Board
GRI 102-23
AN EFFECTIVE BOARDThe overall effectiveness of the Board is enhanced by the diversity and breadth of perspectives of its members, who combine professional
and academic skills and experience. Collectively, the Board also has sufficient financial acumen and knowledge with three Directors
holding membership in professional accountancy bodies. All Directors have received comprehensive training encompassing both general
aspects of directorship and matters specific to the Company and industry.
During the year under review, the Board consisted of nine Directors – six Non-Executive Directors and three Executive Directors including the
Chairman. The Board considered that the present composition and expertise is sufficient to meet the needs of the Group. The Non-Executive
Directors contribute with their knowledge and experience collectively gained from experience in serving a variety of public and private organisations.
Accordingly, the composition of the Board as at the end of the financial year is illustrated as follows:
The profiles of the Directors are found on pages 14 and 15 of this report.
Principle A.1 The Board
GRI 102-20
Every public company should be headed by an effective Board, which should direct, lead and control the Company
A.1.1
Board meetings
The Board meets on a quarterly basis with special meetings convened if and when the need arises.
During the year under review the Board met on four occasions. Details of meetings of the Board and
attendance of the members are set out on page 32 of this Report.
The information is provided to the Board in a structured manner and regular basis as agreed by the Board.
Information to be reported to the Board includes;
Financial and operational results on pre agreed Key Performance Indicators
Financial performance compared to previous periods, budgets and targets
Impact of risk factors on financial and operating results and actions to mitigate such risks
Compliance with laws and regulations and any non-compliance
Internal control review
Share trading of the company and related party transactions by key management personnel
Any other matters the Board should be aware of
The minutes of the previous Board meeting and above information are distributed among the
members 7 days prior to the meeting.
Corporate Governance Contd.
137
KELANI VALLEY PLANTATIONS PLC
Annual Report 2017/18
Go
vern
ance
an
d R
isk
Reference to CASL & Sec Code
Details of Compliance
A.1.2
Responsibilities of the Board
The Board Charter sets out the responsibility of the Board. The Board is responsible to the
shareholders for creating and delivering long-term sustainable shareholder value through
entrepreneurial leadership.
The Board has engaged DPL Plantations (Pvt) Ltd. as the managing agent to manage the business
and assets of the Company.
The Board’s key responsibilities include:
Providing direction and guidance to the Company in the formulation of high-level medium, and
long-term strategies which are aimed at promoting the sustainable long term success of the
Company
Appointing and reviewing the performance of the Chairman, Managing Director and CEO
Ensure Executive Directors and the key management team possesses the skills, experience and
knowledge to implement strategy effectively, with proper succession arrangements in place.
Reviewing, approving and monitoring annual corporate plans, corporate budgets and capital
expenditure
Reviewing and approving major acquisitions, disposals and major investments by the
management within their limits of authority
Ensure effective systems to secure the integrity of information, internal controls, business
continuity and risk management
Ensure compliance with laws, regulations and ethical standards
Ensure all stakeholder interests are considered in corporate decisions
KVPL has adopted Integrated Reporting since 2012 and recognises sustainable business
development in corporate strategy, decisions and activities
Set and communicate values/standards, with adequate attention being paid to accounting
policies/practices and fostering compliance with financial regulations
Adequacy and the integrity of the Plantation’s Internal control systems over financial reporting
and Management Information Systems are reviewed by the Board Audit Committee
Ensuring that Financial Statements are published quarterly and the Annual Report is published
at the end of the financial year
Determining any changes to the discretions/authorities delegated from the Board to the key
management team
Approving any amendments to constitutional documents
138
KELANI VALLEY PLANTATIONS PLC
Annual Report 2017/18
Reference to CASL & Sec Code
Details of Compliance
A.1.3
GRI 102-27,39
Compliance with the laws of the
country and agreed to obtain
independent professional advice
The Board collectively as well the Directors individually, recognise their duty to comply with laws of the
country which are applicable to the Company. The Board of Directors ensures that procedures and
processes are in place to ensure that the Company complies with all applicable laws and regulations.
Directors have the power to obtain independent professional advice as deemed necessary, in
furtherance of their duties, at the Company’s expense. This will be coordinated through the Board
Secretary facilitated through Hayleys Group Legal and Group Finance, as and when it is requested.
A.1.4
Access to the advice and services
of the Company Secretary
The services and advice of the Company Secretary are available to all the Directors.
The Company Secretary ensures that Board procedures and all applicable rules and regulations are
complied with.
The removal of the secretary is a matter for the Board as a whole.
Obtained a directors and officers’ liability insurance, providing worldwide cover to indemnify all
Directors and Officers.
A.1.5
Independent judgment of the
Directors
Non-Executive Directors are independent from the Management and free from any business and
other relations. None of the other Directors are related to each other. This enables all the members of
the Board to bring independent judgment to bear on issues of strategy, performance, resources and
standards of business conduct.
A.1.6
Dedication of adequate time and
effort of the Directors
The Board of Directors dedicates adequate time and effort to ensure that their duties and
responsibilities towards the Company and Board are discharged.
Dates of regular Board meetings and Board Sub-Committee meetings are scheduled well in advance
and the relevant papers are circulated a week prior to the meeting giving sufficient time for review.
Hence, they are able to familiarise themselves with the business changes, operations, risks and
controls which ultimately help them to satisfactorily discharge their duties and responsibilities to the
Company.
Corporate Governance Contd.
139
KELANI VALLEY PLANTATIONS PLC
Annual Report 2017/18
Go
vern
ance
an
d R
isk
Reference to CASL & Sec Code
Details of Compliance
A.1.8
Training for new and existing
Directors
The Board of Directors recognises the need for continuous training and expansion of knowledge and
undertakes such professional development as they consider necessary in assisting them to carry out
their duties as Directors.
Every new Director and existing Directors are provided training on general aspects of directorship
and matters specific to the industry when they are first appointed to the Board.
Training programmes for top-management cover the training requirement for the directors as well.
Training was provided through the ultimate parent Hayleys Group during the year.
Principle: A.2 Chairman and Chief Executive Officer (CEO)There are two key tasks at the top of every public company – conducting of the business of the Board, and facilitating executive
responsibility for management of the Company’s business. There should be a clear division of responsibilities at the head of the Company,
which will ensure a balance of power and authority, such that no one individual has unfettered powers of decision.
A.2.1
Division of responsibilities of
Chairman and CEO
The Chairman and the Chief Executive Officer of the Company are two different personnel where
power and authority are clearly distinguished. The Chairman of the Company is also the Chairman
of DPL Plantations Limited, DPL PLC and Hayleys PLC. The separation between the position of
the Chairman and officers with executive powers in the Company ensure a balance of power and
authority.
140
KELANI VALLEY PLANTATIONS PLC
Annual Report 2017/18
Reference to CASL & Sec Code
Details of Compliance
Principle: A.3 Chairman's roleThe Chairman’s role in preserving good Corporate Governance is crucial. As the person responsible for running the Board, the Chairman
should preserve order and facilitate the effective discharge of Board functions.
A.3.1
GRI 102-26
Chairman's role
The Chairman’s role involves:
Approving the agenda for each meeting prepared in consultation with the CEO, directors and
the Company Secretary taking in to consideration matters relating to strategy, performance,
resource allocation, risk management and compliance.
Sufficiently detailed information of matters included in the agenda should be provided to
Directors in a timely manner.
Ensuring that all Directors are aware of their duties and responsibilities
All Directors are encouraged to make an effective contribution, within their respective
capabilities for the benefit of the Company
All Directors are encouraged to seek information considered necessary to discuss matters
on the agenda of meetings and to request inclusions of matters of corporate concern on the
agenda
Maintaining the balance of power between Executive and Non-Executive Directors
The view of Directors on issues under consideration are ascertained
The Board is in complete control of the Company’s affairs and alert to its obligations to all
shareholders and other stakeholders
Principle: A.4 Financial AcumenThe Board should ensure the availability within it, of those with sufficient financial acumen and knowledge to offer guidance on matters of
finance.
A.4.1
GRI 102-25
Financial acumen
The Board includes three senior Chartered Accountants, who possess the necessary knowledge
and competence to offer the Board guidance on matters of finance. One of them serves as Director/
CEO of KVPL the other is an Executive Director of Hayleys PLC. The Audit Committee chairman is
also a senior Chartered Accountant. Other members of the Board are adequately experienced in
handling matters of finance by serving in different organisations. Hence the Board is endowed with
sufficient financial acumen and knowledge to offer guidance on matters of finance.
Corporate Governance Contd.
141
KELANI VALLEY PLANTATIONS PLC
Annual Report 2017/18
Go
vern
ance
an
d R
isk
Reference to CASL & Sec Code
Details of Compliance
Principle: A.5 Board BalanceIt is preferable for the Board to have a balance of Executive and Non-Executive Directors so that no individual or small group of individuals
can dominate the Board’s decision making.
A.5.1
Non-Executive Directors
Six out of nine Directors on the Board are Non-Executive Directors. The composition of the
Executive and Non-Executive Directors (the latter are over one third of the total number of Directors)
satisfy the requirements laid down in the Listing Rules of the Colombo Stock Exchange
A.5.2
Independence of Non-Executive
Directors
Three of the six Non-Executive Directors are independent. The Board has determined that three
Non-Executive Directors satisfy the criteria for “independence” set out in the Listing Rules.
A.5.3
Independence of Non-Executive
Directors
Non-Executive Directors’ profiles reflect their calibre and the weight their views carry in Board
deliberations. Each is independent of management and free from any relationship that can interfere
with independent judgment. The balance of Executive, Non-Executive and Independent Non-
Executive Directors on the Board ensures that no individual Director or small Group of Directors
dominate Board discussion and decision-making.
A.5.4
Annual declaration of
independence – of Non-Executive
Directors
Each Non-Executive Director submits annual declarations on his independence or non-
independence in a prescribed format.
142
KELANI VALLEY PLANTATIONS PLC
Annual Report 2017/18
Reference to CASL & Sec Code
Details of Compliance
A.5.5
Board determination of
independence of Non-Executive
Directors and disclosure in Annual
Report
The Board considers the declaration of independence submitted by each Non- Executive Director
with the basis for determination laid down by the Listing Rule of the CSE and the Code of Best
Practices as a fair representation and will continue to evaluate their independence on this basis
annually. Brief resume of all the Directors is available in pages 14 and 15
A.5.6
Appointment of alternate Director
There were no appointments of alternative Directors during the year
A.5.7, A.5.8
Requirement to appoint Senior
Independent Director
This is not applicable as the Chairman and the Managing Director is not the same person.
A.5.9
Chairman’s meetings with Non-
Executive Directors
The Chairman holds meetings with the Non-Executive Directors, without Executive Directors, at least
once in each year and at any other time where necessary.
Corporate Governance Contd.
143
KELANI VALLEY PLANTATIONS PLC
Annual Report 2017/18
Go
vern
ance
an
d R
isk
Reference to CASL & Sec Code
Details of Compliance
A.5.10
Record in the Board minutes
of Concerns not unanimously
resolved
All Board/Committee matters of the Company are accordingly minuted with sufficient detail to enable
a proper assessment to be made of the deliberations and any discussions taken at the meeting. All
discussions during the year were unanimously agreed.
Principle: A.6 Supply of informationThe Board should be provided with timely information in a form and of a quality appropriate to enable it to discharge its duties.
A.6.1
Timely and appropriate
information to the Board
Management provides the Board with appropriate and timely information. When information
volunteered by Management is inadequate Directors could make further inquiries. Chairman ensures
that all Directors are properly briefed on issues arising at meetings.
A.6.2
Information provided in advance
to the Board meetings
The Board meetings are arranged in advance and all Directors are informed.
The Chairman ensures that all Directors are properly briefed on issues arising at Board Meetings
by requiring management to provide comprehensive information including both quantitative and
qualitative information for the monthly Board Meetings 7 days prior to the
Board/Sub-Committee meetings.
Principle: A.7 Appointments to the Board
GRI 102-24
There should be a formal and transparent procedure for the appointment of new Directors to the Board.
A.7.1, A.7.2
Appointment to the Board
As per the recommendation made by the Nomination Committee of Hayleys PLC, the ultimate
parent company, the Board as a whole approves on the appointment of Directors. The Nomination
Committee annually assesses the Board Composition against pre-defined criteria of skill and
knowledge requirements to ascertain whether the combined knowledge and experience of the
Board matches the strategic demands facing the Company.
144
KELANI VALLEY PLANTATIONS PLC
Annual Report 2017/18
Reference to CASL & Sec Code
Details of Compliance
A.7.3
Appointment of a new Director
There were no new Board appointments made during the financial year.
In the event of new appointments, a brief resume of the Director, nature of his experience and
the independency is informed to the Colombo Stock Exchange in line with the Listing Rules and
disclosed in the Annual Report on pages 164 to 169
Principle: A.8 Re-electionAll Directors should be required to submit themselves for re-election at regular intervals and at least once in every three years.
A.8.1, A.8.2
Re-election of Directors
The provisions of the Company’s Articles require a Director appointed by the Board to hold office
until the next Annual General Meeting, and seek re-appointment by the shareholders at that meeting.
The Articles call for one third of the Directors in office to retire at each Annual General Meeting. The
Directors who retire are those who have served for the longest period after their appointment /re-
appointment. Retiring Directors are generally eligible for re-election.
The Managing Director does not retire by rotation.
A.8.3
Resignation
In the event of the resignation of a Director prior to completion of his appointed term, the Director
should provide a written communication to the Board of his reasons for resignation.
Principle: A.9 Appraisal of Board Performance
GRI 102-28
Board periodically appraises its own performance in order to ensure that Board responsibilities are satisfactorily discharged.
A.9.1, A.9.2, A.9.3, A.9.4
Appraisal of Board performance
The performance of the Board and Sub-Committees is evaluated annually on a self-assessment
basis.
Corporate Governance Contd.
145
KELANI VALLEY PLANTATIONS PLC
Annual Report 2017/18
Go
vern
ance
an
d R
isk
Reference to CASL & Sec Code
Details of Compliance
Principle: A.10 Disclosure of Information in respect of DirectorsShareholder should be kept advised of relevant details in respect of Directors
A.10.1
Disclosures about Directors
Name, qualifications, brief profile, and nature of expertise are given in pages 14 and 15 of this Annual
Report. Director’s interests in contracts are given in the page 184 of this report. The numbers of
Board meetings attended by the Directors are available on the page 132 of this report.
Names of the Directors who serve as chairmen or members of Board Committees and their
attendance are given on page 132.
Principle: A.11 Appraisal of Chief Executive OfficerThe Board should be required at least annually, to assess the performance of the CEO
A.11.1, A.11.2
Evaluation of the performance of
the CEO
The short, medium and long-term objectives determined by the board including financial and non-
financial targets that should be met by the CEO are set and evaluated at the commencement of
each financial year. The performances were evaluated annually and it was ascertained whether the
targets were achieved or whether achievements were reasonable in the circumstances.
B. Directors Remuneration
Principle: B.1 Remuneration procedure
GRI 102-35,36
Companies should establish a formal and transparent procedure for developing policy on executive remuneration and for fixing the
remuneration packages of individual Directors. No Director should be involved in deciding his/her own remuneration.
B.1.1
Remuneration Committee
The Remuneration Committee of Hayleys PLC, the ultimate Parent Company, is responsible
in assisting the Board in recommending the remuneration payable for the Executive Directors
and Corporate Management. The Board makes the final determination after considering such
recommendations. No Director is involved in deciding his own remuneration.
146
KELANI VALLEY PLANTATIONS PLC
Annual Report 2017/18
Reference to CASL & Sec Code
Details of Compliance
B.1.2, B1.3
Composition of the remuneration
committee
B1.4
Remuneration of the Non-
Executive Directors
The Remuneration Committee of Hayleys PLC, which is the ultimate parent of the Company, acts as
the Remuneration Committee of KVPL. The Remuneration Committee comprises of three Independent/
Non-Executive Directors including Chairman and a Non-Executive director of Hayleys PLC
Dr. H Cabral, PC – Chairman (IND/NED)
Mr. K D D.Perera (NED)
Mr. M Y A Perera (IND/NED)
Mr. M H Jamaldeen (IND/NED)
(IND – Independent, NED- Non-executive Director)
The Board as a whole decides the remuneration of the Non-Executive Directors in line with the
market rates and within the limit set in the Articles of Association of the Company.
B1.5
Consultation of the Chairman and
access to professional advice
Remuneration Committee consults the Chairman about its proposal regarding the remuneration of
other Executive Directors. Both internal and external professional advice has been taken during the
year under review.
Principle: B.2 The level and make up of remunerationLevels of remuneration of both Executive and Non-Executive Directors should be sufficient to attract and retain the Directors needed to
run the Company successfully. A proportion of Executive Directors’ remuneration should be structured to link rewards to corporate and
individual performance.
B.2.1, B.2.2
Levels of remuneration for
Executive Directors
Remuneration package is designed to attract, retain and motivate the Directors needed to run the
Company successfully, but avoid paying more than necessary for this purpose.
The Remuneration Committee takes into account market practices. Their remuneration comprises a
fixed salary component, which include perquisites and allowances to promote the long-term success
of the Company.
Corporate Governance Contd.
147
KELANI VALLEY PLANTATIONS PLC
Annual Report 2017/18
Go
vern
ance
an
d R
isk
Reference to CASL & Sec Code
Details of Compliance
B.2.3
Positioning company remuneration
levels relative to other companies
The Remuneration Committee structures and reviews the Company’s remuneration levels in relation
to performance comparing with other companies and other parts of the Hayleys Group.
B.2.4
Determining annual salary
increases and employment
conditions
The Remuneration Committee considers remuneration and employment conditions sensitively
elsewhere in the Company or the Group of which it is part.
B.2.5
Performance related elements
of remuneration for Executive
Directors
The performance-based incentives have been determined by the Remuneration Committee to
ensure that the earnings of the Executives are aligned with the achievement of objectives and
budgets of the Group companies.
B.2.6
Share option
Schemes
Presently the Group does not have an Executive Share Option scheme.
148
KELANI VALLEY PLANTATIONS PLC
Annual Report 2017/18
Reference to CASL & Sec Code
Details of Compliance
B.2.7
Designing performance-related
remuneration
Performance-related remuneration is designed by the Remuneration Committee based on the
provisions set out.
B.2.8, B.2.9
GRI 102-39
Compensation, commitments in
the event of early termination and
dealing with early termination
There are no provisions for compensation for early termination in the letter of contract. However, the
Directors would determine this on a case by case basis.
B.2.10
Levels of remuneration for Non-
Executive Directors
The Remuneration Committee determines the levels of remuneration for Non-Executive Directors
taking into account the time commitment and responsibilities of their role and market practices.
Remuneration for Non-Executive Directors does not include share options.
Principle: B.3 Disclosure of the RemunerationThe Company’s Annual Report should contain a Statement of Remuneration Policy and details of remuneration of the Board as a whole.
B.3.1
Disclosure of the remuneration
The names of the Directors of the Remuneration Committee are given under section B.1.2 above.
The remuneration policy is to attract and retain a highly-qualified and experienced work force, and reward
performance accordingly in the backdrop of industry norms. These compensation packages provide
compensation appropriate for each business within the Group and commensurate with each employee’s
level of expertise and contribution, bearing in mind the business’ performance and shareholder return.
The total of Directors’ Remuneration is reported in note 9 to the Financial Statements.
Corporate Governance Contd.
149
KELANI VALLEY PLANTATIONS PLC
Annual Report 2017/18
Go
vern
ance
an
d R
isk
Reference to CASL & Sec Code
Details of Compliance
C. Relations with Shareholders - Constructive use of the AGM and conduct of General MeetingsPrinciple: C.1 Boards should use the AGM to communicate with shareholder and should encourage their participation.
C.1.1
Notice of the AGM
The notice and the agenda of the Annual General Meeting together with the Annual Report with all
other relevant documents are sent to the shareholders 15 working days prior to the meeting.
C.1.2
Separate resolution on each
substantially separate issue
Separate resolutions are proposed at an Annual General Meeting on each substantially separate
issue.
A resolution for adoption of the Annual Report of the Board of Directors and the Financial
Statements with the Independent Auditor’s Report is proposed separately.
A form of Proxy is provided with the Annual Report to all shareholders to direct their Proxy to vote.
C.1.3
Votes and use of proxy
The Company ensures that all proxy votes are properly recorded and counted. The level of proxies
lodged on each resolution is conveyed to the Chairman.
C.1.4
Answer questions at the AGM
The Board invites the Chairman of the Audit Committee to be available to answer queries at the
AGM when necessary.
150
KELANI VALLEY PLANTATIONS PLC
Annual Report 2017/18
Corporate Governance Contd.
Reference to CASL & Sec Code
Details of Compliance
Principle: C.2 Communication with shareholders
GRI 102-21
The Board should implement effective communication with shareholders.
C.2.1
Channel to reach all shareholders
of the company.
The modes of communication between the Company and the shareholders are the Annual Reports,
Quarterly Financial Statements, and Interim Reports, announcements made through the Colombo
Stock Exchange, other press releases and Annual/Extraordinary General Meetings.
Shareholders may bring up concerns they have, with the Chairman, the Managing Director or the
Secretaries, as appropriate.
The soft version of the Annual Report is posted on the Company website as soon as it has been
released to the Stock Exchange. The website posts news and latest updates of the company.
The active participation of shareholders at the Annual General Meeting is encouraged. The Board
believes the AGM is a means of continuing effective dialogue with shareholders.
The Board offers clarifications and responds to concerns shareholders have over the content of the
Annual Report as well as other matters which are important to them. The AGM is also used to adopt
the Financial Statements for the year.
C.2.2
Disclosure of the communication
policy
The communication policy and methodology for communication with the shareholders are given in
the stakeholder engagement.
C.2.3
Implementation of the policy and
methodology for communication
with Shareholders
In terms of the CSE Listing Rules, Annual Reports are issued in CD form. However a shareholder
could be provided with a printed copy of the Annual Report if he/she do request.
A copy of the interim Financial Statements is released to the Colombo Stock Exchange and
posted on their website. Copies of all public announcements are made available to the CSE for
dissemination to the public.
151
KELANI VALLEY PLANTATIONS PLC
Annual Report 2017/18
Go
vern
ance
an
d R
isk
Reference to CASL & Sec Code
Details of Compliance
C.2.4
Disclosure of contact person
Shareholders can forward their inquiries via electronic media (e-mail, telephone call or in writing) to
the relevant person to raise queries. The contact person for such communication is the Company
Secretary.
C.2.5
Major issues and concerns of
shareholders
All the major issues relating to shareholders are brought to the attention of the Board.
C.2.6
Person to be contacted with
regard to shareholders’ matters
The Company Secretary holds the responsibility to be contacted in relation to shareholders’ matters.
C.2.7
Process for responding to
shareholder matters
The Chairman and the Directors answer all the queries raised by the shareholders at the AGM and
General meetings.
The Board in conjunction with the Company Secretary formulates the process for addressing
shareholder matters.
Principle: C.3 Major and material TransactionsFurther to complying with the requirements under the Companies Act, Securities and Exchange Commission law and Colombo Stock
Exchange regulations; as applicable, Directors should disclose to shareholders all proposed material transactions, which if entered into, would
material alter/vary the Company’s net assets base or in the case of a Company with subsidiaries, the consolidated Group net asset base.
C.3.1
Major Related Party Transactions
Prior to engaging in a major transaction with a related party or related party transactions which have
the effect of substantially altering the nature of business, the Directors disclose to shareholders the
purpose and all material facts of such transaction and obtain shareholders’ approval by ordinary
resolution at an Extra Ordinary General Meeting.
152
KELANI VALLEY PLANTATIONS PLC
Annual Report 2017/18
Reference to CASL & Sec Code
Details of Compliance
C.3.2
Disclosure of major transactions to
shareholders
There have been no transactions during the year falling within the definition of “Major Transactions”
as set out in the Companies Act No 7 of 2007.
D. Accountability and Audit – Financial and Business Reporting ( The Annual Report)
GRI 102-29
Principle: D.1 The Board should present a balanced and an understandable assessment of the Company’s financial position, performance, business model, governance structure, risk management, internal controls and challenges, opportunities and prospects.
D.1.1
D.1.2
Balanced and understandable
information to shareholders
The Company has presented balanced and understandable Financial Statements which gives a true
and fair view quarterly and annually. In the preparation of Financial Statements, the Company has
complied with the requirements of the Companies Act No 07 of 2007 and requirements of Sri Lanka
Accounting Standards and Securities and Exchange Commission.
Price sensitive public reports and reports for statutory requirements are also presented in a balanced
and understandable manner.
D.1.3
CEO’s and CFO’s approval of
Financial Statements prior to
Board approval
The Chief Financial Officer and two other Directors have signed the Financial Statements on behalf of
the Board.
Responsibilities of Board of Directors and Directors’ statement on internal controls are given on
pages 14, 15 and 190 respectively.
Corporate Governance Contd.
153
KELANI VALLEY PLANTATIONS PLC
Annual Report 2017/18
Go
vern
ance
an
d R
isk
Reference to CASL & Sec Code
Details of Compliance
D.1.4
The Directors ‘ Report
The Annual Report of the Board of Directors on the affairs of the Company is given on pages 183 to
187 of this Annual Report which contains the following:
Declaration that the Company has not engaged in activities that contravene laws and
regulations of Sri Lanka (refer page 183);
Declaration by the Directors on all material interests in contracts that they have involving the
Company and has refrained from voting on matters in which they were materially interested
(refer pages 184).
Equitable treatment to shareholders (refer page 186)
Compliance with best practices of corporate governance (refer pages 130 to 169)
Information relating to PPE has been given in notes 12, 13 and 14 to the Financial Statements.
Review of internal controls, risk management and reasonable assurance of effectiveness and
adherence (refer page 188 and 170 to 182).
Going concern of the business (refer page 187).
D.1.5
Statement of Directors’
Responsibility, statement on
internal controls and Auditors’
Report.
The Statement of Director’s Responsibilities for the Financial Statements is given in page 190 and
Directors statement on internal controls are given in page 188.
The Auditors’ Report is available on pages 195 to 197.
D.1.6
Management Discussion &
Analysis
A comprehensive coverage of key initiatives undertaken during the year, business model, industry
structure and development, opportunities and threats, risk management, internal controls and
their adequacy, governance, stakeholder relationship, social and environment protection activities,
financial performance, Investment in physical and intellectual capital, human resource/industrial
relations, sector performances, achievements and prospects for the future. Awards won and
certifications received are available in the Management Discussion (pages 26 and 27) of this Report.
154
KELANI VALLEY PLANTATIONS PLC
Annual Report 2017/18
Reference to CASL & Sec Code
Details of Compliance
D.1.7
Summon an EGM
to notify serious
loss of capital
In the event the net assets of the Company fall below 50% of its Stated Capital, the Directors will
forthwith summon an Extra ordinary General Meeting to notify shareholders of the remedial action
being taken. However such an event has not taken place since the adoption of New Companies Act
No 07 of 2007.
D.1.8
Related party transactions
The Company adheres to the Code of Best Practices on Related Party Transactions which is issued
by the Securities and Exchange Commission of Sri Lanka. The company secretary keeps records
on related party transactions quarterly.
Principle: D.2 Risk Management and Internal Control
GRI 102-30
The Board is responsible for determining the nature and extent of the principal risks it is willing to take in achieving its strategic objectives.
The Board should have a process of risk management and a sound system of internal control to safeguard shareholders’ investments
and the Company’s assets. Broadly, risk management and internal control is a process, effected by a Company’s Board of Directors and
management designed to provide reasonable assurance regarding the achievement of the Company’s objectives.
D.2.1
Monitoring sound system of
internal control
The Directors review the risks facing the Company and the effectiveness of the internal controls. The
Audit Committee executes this function evaluating the effectiveness of the internal controls and risk
management on behalf of the Board and makes necessary recommendations to the Board.
D.2.2
Review of the process and
effectiveness of risk management
The details of those risks affecting the Company and mitigation actions are explained in pages 176
to 182.
Corporate Governance Contd.
155
KELANI VALLEY PLANTATIONS PLC
Annual Report 2017/18
Go
vern
ance
an
d R
isk
Reference to CASL & Sec Code
Details of Compliance
D.2.3
Internal Audit function
The Company has an internal audit function at Head Office and sub offices. Audits are conducted in
accordance with the programme prepared at the beginning of the year.
The Hayleys Group Management Audit and System Review Department (MA&SRD) carried internal
audits according to the annual plan. The internal audit function is also outsourced to leading audit
firms according to the annual audit plan.
D.2.4
Review the internal controls and
risk management by the Audit
Committee
The Board has delegated to the Audit Committee to carry out reviews of the process and
effectiveness of risk management and internal controls, and to report it to the Board.
D.2.5
Content of Statement Internal
Controls
Directors’ Statement on Internal Controls is given on page 188.
Principle: D.3 Audit Committee
GRI 102-22
The Board should establish formal and transparent arrangements for considering how they should; select and apply accounting policies
for financial reporting determine the structure and content of corporate reporting, implement internal control and risk management
principles and for maintaining an appropriate relationship with the Company’s Auditors.
D.3.1
Composition of Audit Committee
The Audit Committee was established in 2008. The Committee consists three Independent Non-
Executive Directors and is chaired by Mr L N De S Wijeyeratne. He is a Fellow Member of The
Institute of Chartered Accountants of Sri Lanka.
156
KELANI VALLEY PLANTATIONS PLC
Annual Report 2017/18
Reference to CASL & Sec Code
Details of Compliance
D.3.2
Committees’ terms of reference
Terms of Reference (TOR) provides proper guideline duty and authority to deliver the responsibilities.
The Committee is empowered to examine any matters relating to the Financial Reporting systems
of KVPL, risk management, external audits and internal audits. Its duties include the detailed review
of Financial Statements, internal control procedures and risk management framework, accounting
policies and compliance with applicable accounting standards and other rules and regulations.
It reviews the adequacy of systems in place for compliance with relevant legal, regulatory and ethical
requirements and company policies.
The Audit Committee makes recommendations to the Board pertaining to the appointment and
re –appointment of External Auditors after assessing their independence and performance, and
approves the remuneration and terms of engagement of the external auditors.
The Chairman, the Managing Director, the Chief Executive Officer of the Company, Head of Group
Internal Audit and Hayleys Group CFO are invited to attend Meetings. Other Directors and Senior
Managers attend meetings as required. The input of the External Auditors is obtained where
necessary. The Audit Committee helps the Group to achieve a balance between conformance and
performance.
D.3.3
Disclosures
Mr. L N De S Wijeyeratne is the Chairman of the Audit Committee. Mr. F Mohideen and
Mr. C V Cabraal are the two other members. Annual report contains a compliance report of the Audit
Committee in pages 195 to 197.
Principle: D.4 Related Party Transactions Review CommitteeThe Board should establish a procedure to ensure that the Company does not engage in transactions with “related parties” in a manner
that would grant such parties “more favourable treatment” than that accorded to third parties in the normal course of business
D.4.1
Related Party Transactions
The Company is adhering to LKAS 24 and transactions entered into with related parties during the
year are disclosed in note 29.1 to the financial statements.
Corporate Governance Contd.
157
KELANI VALLEY PLANTATIONS PLC
Annual Report 2017/18
Go
vern
ance
an
d R
isk
Reference to CASL & Sec Code
Details of Compliance
D.4.2
Composition of Related Party
Transactions Committee
The Related Party Transactions (RPT) Review Committee of Hayleys PLC acts as the Company’s
RPT review committee and consists of
Dr H Cabral,PC – (Chairman) Independent Non–Executive
M Y A Perera – Independent Non–Executive
S C Ganegoda–Executive
D.4.3
Terms of Reference
Related Party Transactions Review Committee has written terms of reference dealing with its
authority and duties. RPT review committee report describing the duties, task and attendance of the
committee appears on page 193
Principle: D.5 Code of Business Conduct and EthicsCompanies must adopt a Code of Business Conduct and Ethics for Directors, Key Management Personnel and all other employees’
including but not limited to: dealing with shares of the Company; compliance with listing rules; bribery and corruption; confidentiality;
encouraging that any illegal fraudulent and unethical behaviour be promptly reported to those charged with governance. The Company
must disclose waivers of the Code of Directors, if any.
D.5.1
Disclosure on presence of Code of
Business Conduct and Ethics
The Directors and members of the Senior Management team are bound by a Code of Business
Conduct and Ethics which is developed by the Hayleys Group. The Code consists of important
topics such as:
conflict of interest, bribery and corruption, entertainment and gifts, accurate accounting
and record keeping, fair and transparent procurement practices, corporate opportunities,
confidentiality, fair dealing, protection and proper use of Company assets including information
assets, compliance with laws, rules and regulations (including insider trading laws) and
encouraging the reporting of any illegal, fraudulent or unethical behaviour.
The Board ensures the compliance with the code and non-compliance may result in disciplinary
actions.
158
KELANI VALLEY PLANTATIONS PLC
Annual Report 2017/18
Reference to CASL & Sec Code
Details of Compliance
D.5.2
Process to identify and report
price sensitive information
The Company has a process in place to ensure that material and price sensitive information is
promptly identified and reported.
D.5.3
Shares purchased by Directors
and key management personnel
The Company has a policy and a process for monitoring and disclosure of shares purchased by any
Director and key management personnel.
Details of Directors shareholdings are given in page 185 of the Annual Report of Board of Directors
on the affairs of the Company.
D.5.4
Affirmation of Code in the Annual
Report by the Chairman
The Chairman affirms that the Code of Conduct and Business Governance offers direction for all the
employees across the organisation and he is not aware of any violation of any of the provisions of
the Code of Business Conduct and Ethics in Statement from the Chairman on corporate governance
is discussed on page 130.
Principle: D.6 Corporate Governance disclosuresDirectors should be required to disclose the extent to which the Company adheres to established principles and practices of good
corporate governance.
D.6.1
Disclosure of adherence to
corporate governance
The extent to which the Company adheres to established principles and practices of good corporate
governance is disclosed on page 186 under the Annual Report of the Board of Directors on the
affairs of the Company.
Corporate Governance Contd.
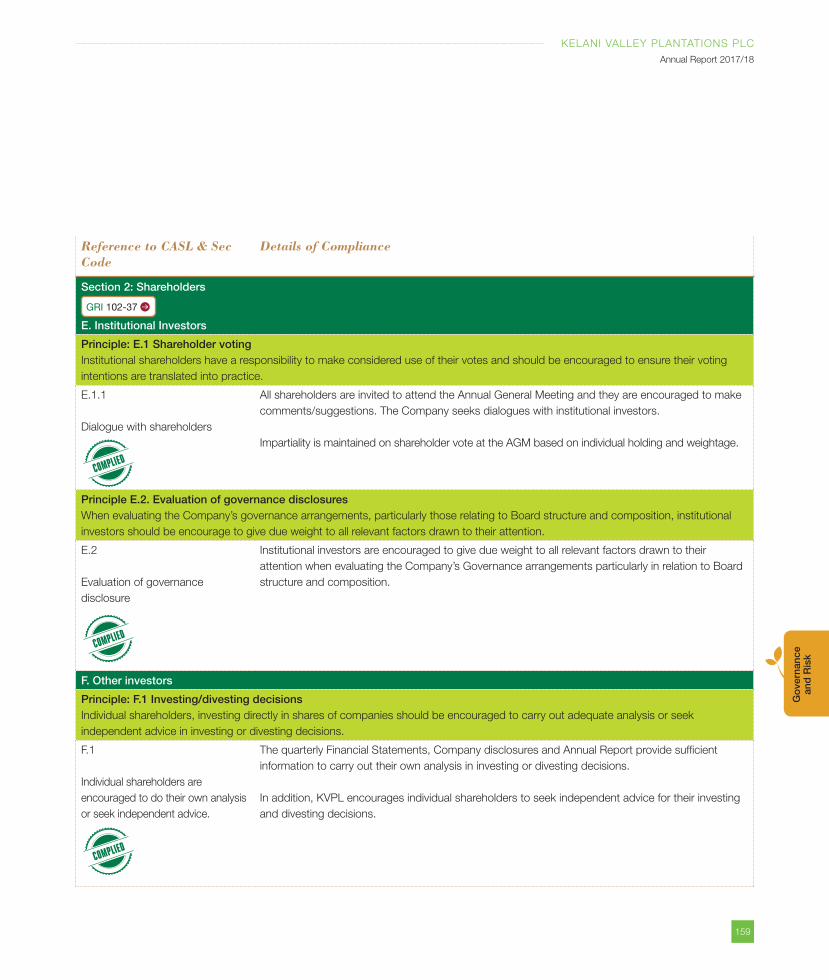
159
KELANI VALLEY PLANTATIONS PLC
Annual Report 2017/18
Go
vern
ance
an
d R
isk
Reference to CASL & Sec Code
Details of Compliance
Section 2: Shareholders
GRI 102-37
E. Institutional Investors
Principle: E.1 Shareholder votingInstitutional shareholders have a responsibility to make considered use of their votes and should be encouraged to ensure their voting
intentions are translated into practice.
E.1.1
Dialogue with shareholders
All shareholders are invited to attend the Annual General Meeting and they are encouraged to make
comments/suggestions. The Company seeks dialogues with institutional investors.
Impartiality is maintained on shareholder vote at the AGM based on individual holding and weightage.
Principle E.2. Evaluation of governance disclosuresWhen evaluating the Company’s governance arrangements, particularly those relating to Board structure and composition, institutional
investors should be encourage to give due weight to all relevant factors drawn to their attention.
E.2
Evaluation of governance
disclosure
Institutional investors are encouraged to give due weight to all relevant factors drawn to their
attention when evaluating the Company’s Governance arrangements particularly in relation to Board
structure and composition.
F. Other investors
Principle: F.1 Investing/divesting decisionsIndividual shareholders, investing directly in shares of companies should be encouraged to carry out adequate analysis or seek
independent advice in investing or divesting decisions.
F.1
Individual shareholders are
encouraged to do their own analysis
or seek independent advice.
The quarterly Financial Statements, Company disclosures and Annual Report provide sufficient
information to carry out their own analysis in investing or divesting decisions.
In addition, KVPL encourages individual shareholders to seek independent advice for their investing
and divesting decisions.
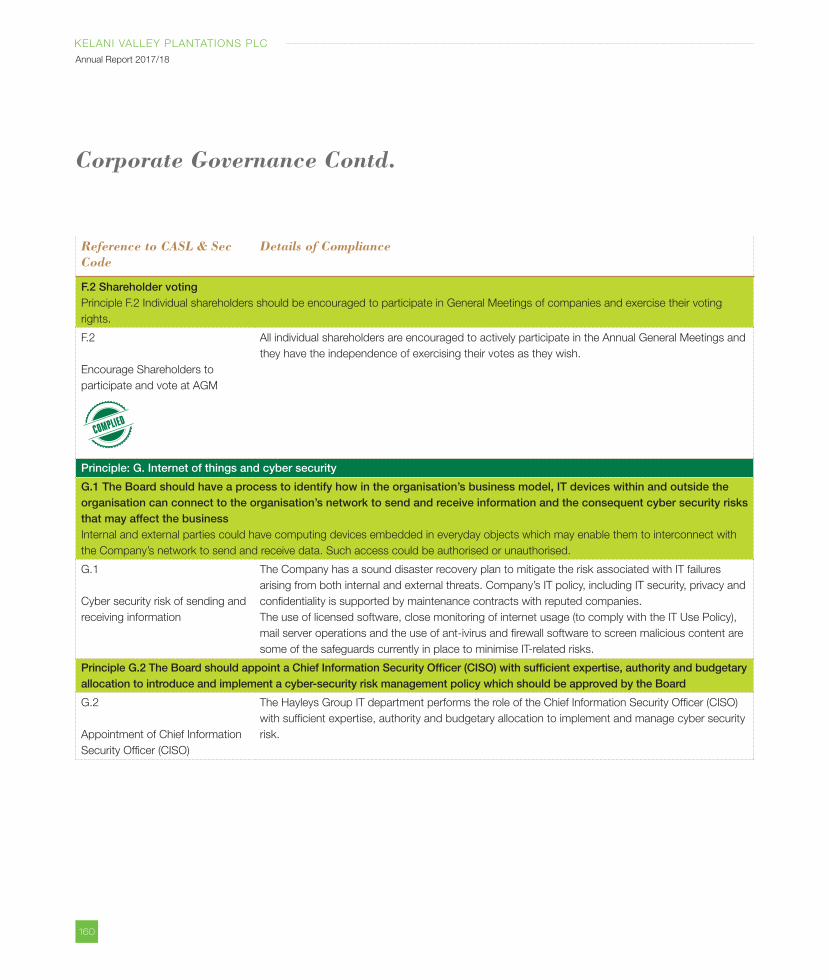
160
KELANI VALLEY PLANTATIONS PLC
Annual Report 2017/18
Reference to CASL & Sec Code
Details of Compliance
F.2 Shareholder votingPrinciple F.2 Individual shareholders should be encouraged to participate in General Meetings of companies and exercise their voting
rights.
F.2
Encourage Shareholders to
participate and vote at AGM
All individual shareholders are encouraged to actively participate in the Annual General Meetings and
they have the independence of exercising their votes as they wish.
Principle: G. Internet of things and cyber security
G.1 The Board should have a process to identify how in the organisation’s business model, IT devices within and outside the organisation can connect to the organisation’s network to send and receive information and the consequent cyber security risks that may affect the businessInternal and external parties could have computing devices embedded in everyday objects which may enable them to interconnect with
the Company’s network to send and receive data. Such access could be authorised or unauthorised.
G.1
Cyber security risk of sending and
receiving information
The Company has a sound disaster recovery plan to mitigate the risk associated with IT failures
arising from both internal and external threats. Company’s IT policy, including IT security, privacy and
confidentiality is supported by maintenance contracts with reputed companies.
The use of licensed software, close monitoring of internet usage (to comply with the IT Use Policy),
mail server operations and the use of ant-ivirus and firewall software to screen malicious content are
some of the safeguards currently in place to minimise IT-related risks.
Principle G.2 The Board should appoint a Chief Information Security Officer (CISO) with sufficient expertise, authority and budgetary allocation to introduce and implement a cyber-security risk management policy which should be approved by the Board
G.2
Appointment of Chief Information
Security Officer (CISO)
The Hayleys Group IT department performs the role of the Chief Information Security Officer (CISO)
with sufficient expertise, authority and budgetary allocation to implement and manage cyber security
risk.
Corporate Governance Contd.
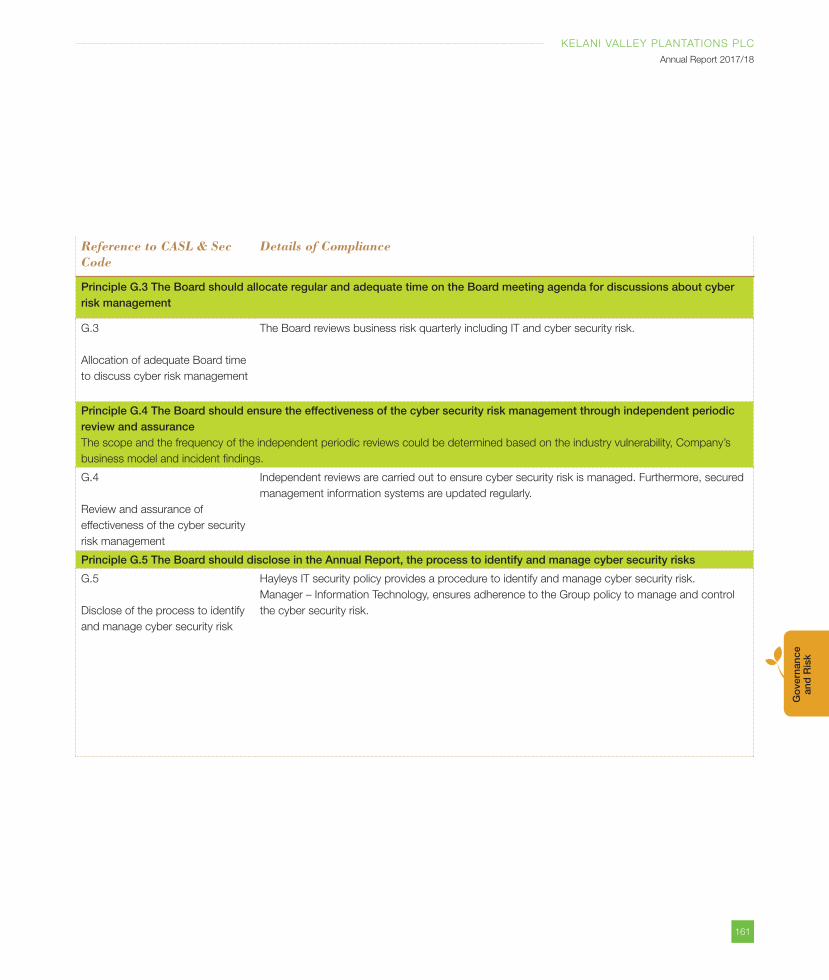
161
KELANI VALLEY PLANTATIONS PLC
Annual Report 2017/18
Go
vern
ance
an
d R
isk
Reference to CASL & Sec Code
Details of Compliance
Principle G.3 The Board should allocate regular and adequate time on the Board meeting agenda for discussions about cyber risk management
G.3
Allocation of adequate Board time
to discuss cyber risk management
The Board reviews business risk quarterly including IT and cyber security risk.
Principle G.4 The Board should ensure the effectiveness of the cyber security risk management through independent periodic review and assuranceThe scope and the frequency of the independent periodic reviews could be determined based on the industry vulnerability, Company’s
business model and incident findings.
G.4
Review and assurance of
effectiveness of the cyber security
risk management
Independent reviews are carried out to ensure cyber security risk is managed. Furthermore, secured
management information systems are updated regularly.
Principle G.5 The Board should disclose in the Annual Report, the process to identify and manage cyber security risks
G.5
Disclose of the process to identify
and manage cyber security risk
Hayleys IT security policy provides a procedure to identify and manage cyber security risk.
Manager – Information Technology, ensures adherence to the Group policy to manage and control
the cyber security risk.
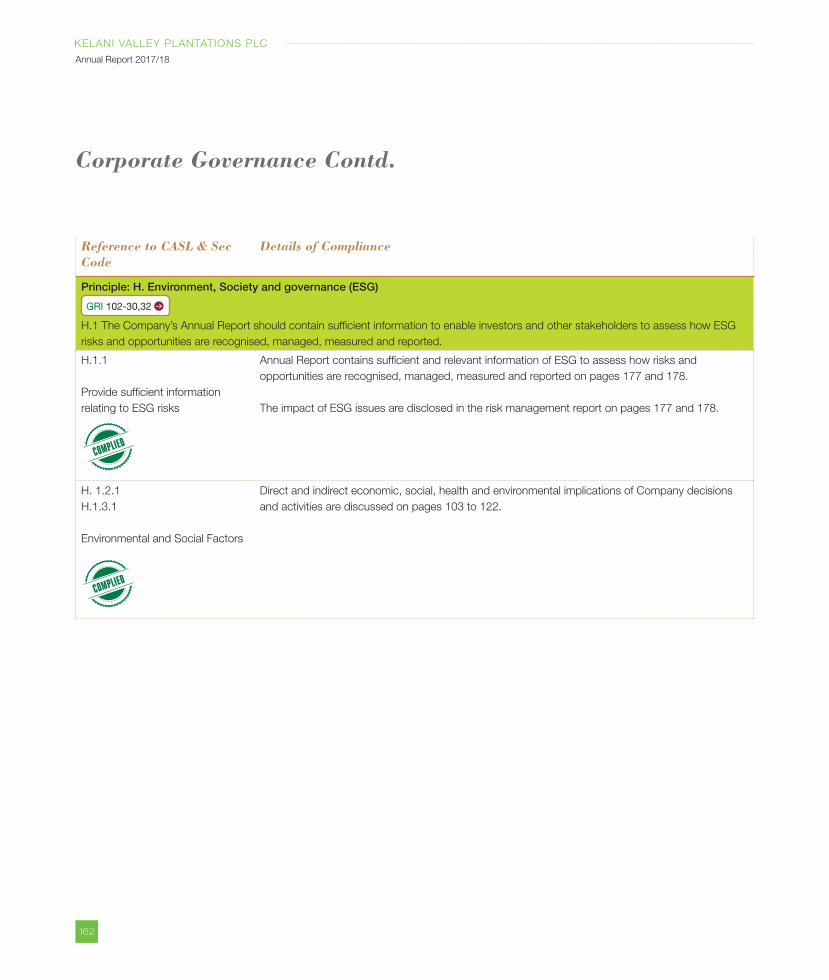
162
KELANI VALLEY PLANTATIONS PLC
Annual Report 2017/18
Reference to CASL & Sec Code
Details of Compliance
Principle: H. Environment, Society and governance (ESG)
GRI 102-30,32
H.1 The Company’s Annual Report should contain sufficient information to enable investors and other stakeholders to assess how ESG
risks and opportunities are recognised, managed, measured and reported.
H.1.1
Provide sufficient information
relating to ESG risks
Annual Report contains sufficient and relevant information of ESG to assess how risks and
opportunities are recognised, managed, measured and reported on pages 177 and 178.
The impact of ESG issues are disclosed in the risk management report on pages 177 and 178.
H. 1.2.1
H.1.3.1
Environmental and Social Factors
Direct and indirect economic, social, health and environmental implications of Company decisions
and activities are discussed on pages 103 to 122.
Corporate Governance Contd.
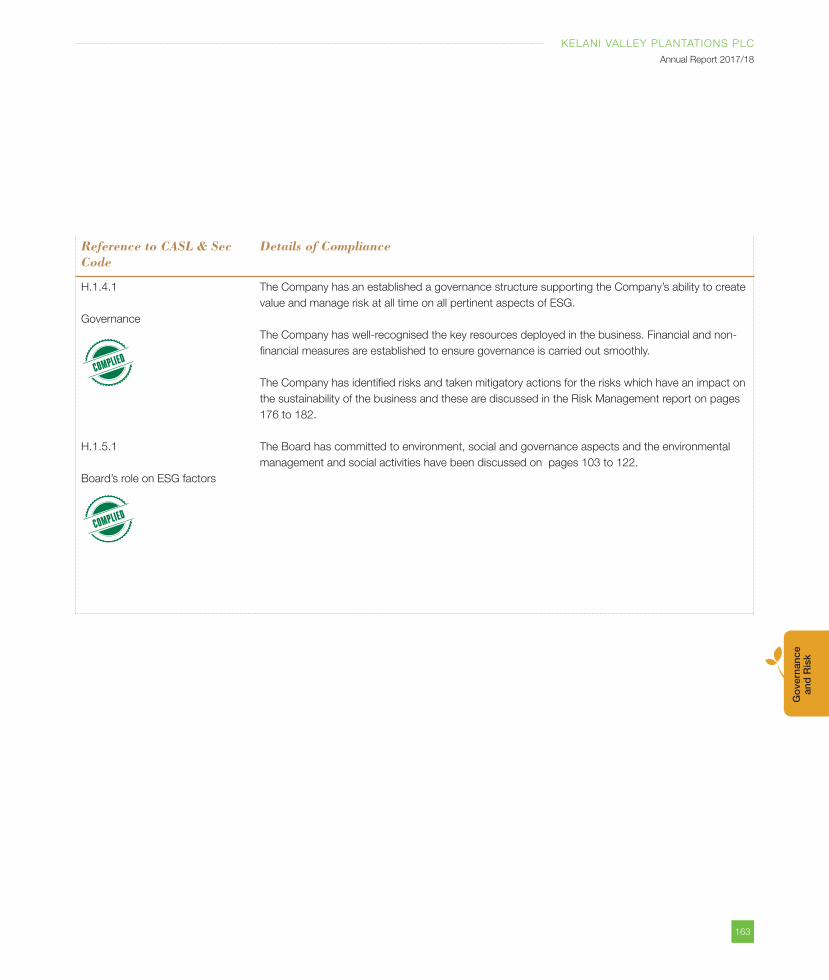
163
KELANI VALLEY PLANTATIONS PLC
Annual Report 2017/18
Go
vern
ance
an
d R
isk
Reference to CASL & Sec Code
Details of Compliance
H.1.4.1
Governance
H.1.5.1
Board’s role on ESG factors
The Company has an established a governance structure supporting the Company’s ability to create
value and manage risk at all time on all pertinent aspects of ESG.
The Company has well-recognised the key resources deployed in the business. Financial and non-
financial measures are established to ensure governance is carried out smoothly.
The Company has identified risks and taken mitigatory actions for the risks which have an impact on
the sustainability of the business and these are discussed in the Risk Management report on pages
176 to 182.
The Board has committed to environment, social and governance aspects and the environmental
management and social activities have been discussed on pages 103 to 122.
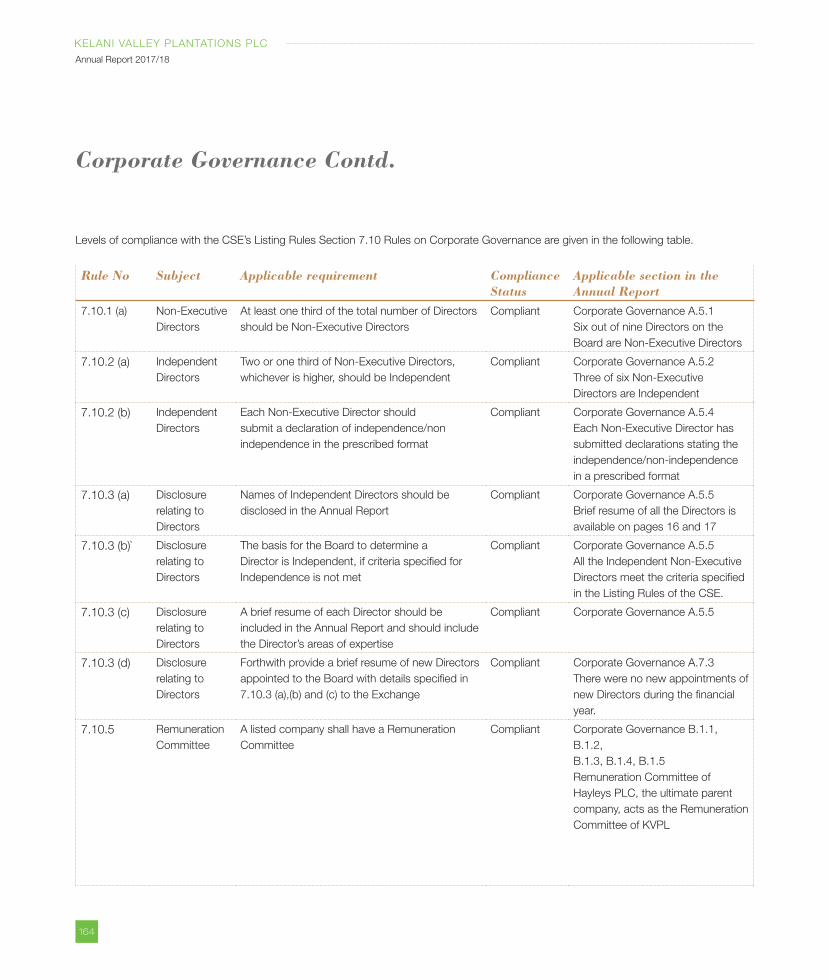
164
KELANI VALLEY PLANTATIONS PLC
Annual Report 2017/18
Levels of compliance with the CSE’s Listing Rules Section 7.10 Rules on Corporate Governance are given in the following table.
Rule No Subject Applicable requirement ComplianceStatus
Applicable section in theAnnual Report
7.10.1 (a) Non-Executive
Directors
At least one third of the total number of Directors
should be Non-Executive Directors
Compliant Corporate Governance A.5.1
Six out of nine Directors on the
Board are Non-Executive Directors
7.10.2 (a) Independent
Directors
Two or one third of Non-Executive Directors,
whichever is higher, should be Independent
Compliant Corporate Governance A.5.2
Three of six Non-Executive
Directors are Independent
7.10.2 (b) Independent
Directors
Each Non-Executive Director should
submit a declaration of independence/non
independence in the prescribed format
Compliant Corporate Governance A.5.4
Each Non-Executive Director has
submitted declarations stating the
independence/non-independence
in a prescribed format
7.10.3 (a) Disclosure
relating to
Directors
Names of Independent Directors should be
disclosed in the Annual Report
Compliant Corporate Governance A.5.5
Brief resume of all the Directors is
available on pages 16 and 17
7.10.3 (b)` Disclosure
relating to
Directors
The basis for the Board to determine a
Director is Independent, if criteria specified for
Independence is not met
Compliant Corporate Governance A.5.5
All the Independent Non-Executive
Directors meet the criteria specified
in the Listing Rules of the CSE.
7.10.3 (c) Disclosure
relating to
Directors
A brief resume of each Director should be
included in the Annual Report and should include
the Director’s areas of expertise
Compliant Corporate Governance A.5.5
7.10.3 (d) Disclosure
relating to
Directors
Forthwith provide a brief resume of new Directors
appointed to the Board with details specified in
7.10.3 (a),(b) and (c) to the Exchange
Compliant Corporate Governance A.7.3
There were no new appointments of
new Directors during the financial
year.
7.10.5 Remuneration
Committee
A listed company shall have a Remuneration
Committee
Compliant Corporate Governance B.1.1,
B.1.2,
B.1.3, B.1.4, B.1.5
Remuneration Committee of
Hayleys PLC, the ultimate parent
company, acts as the Remuneration
Committee of KVPL
Corporate Governance Contd.
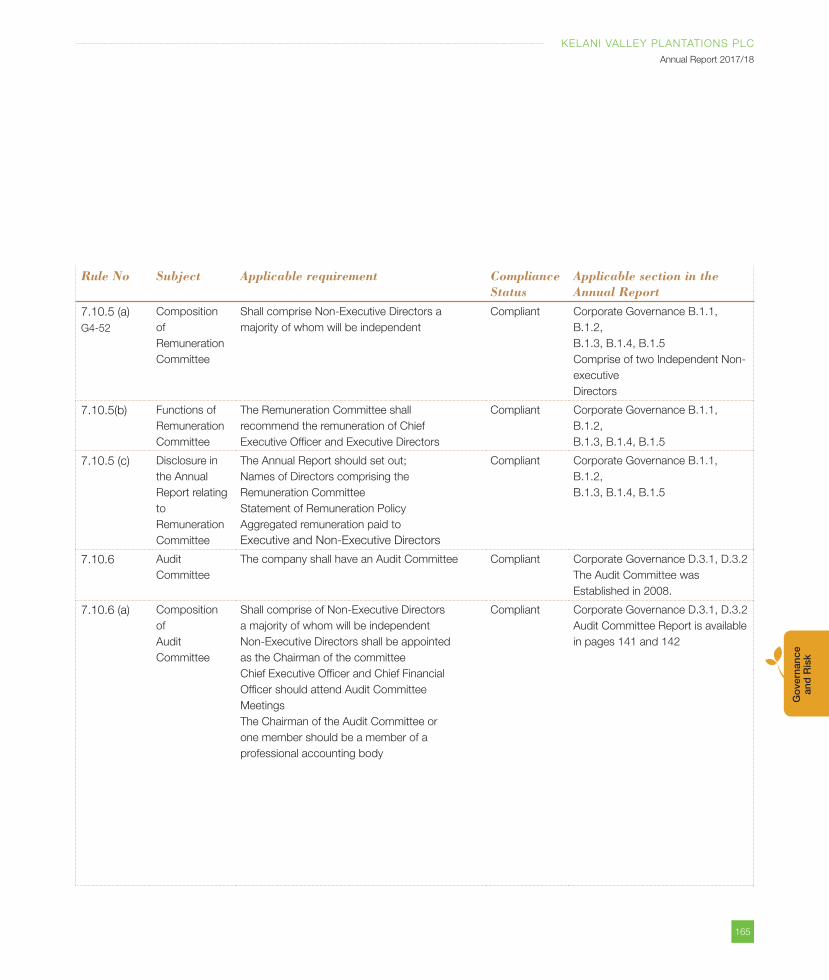
165
KELANI VALLEY PLANTATIONS PLC
Annual Report 2017/18
Go
vern
ance
an
d R
isk
Rule No Subject Applicable requirement ComplianceStatus
Applicable section in theAnnual Report
7.10.5 (a)
G4-52
Composition
of
Remuneration
Committee
Shall comprise Non-Executive Directors a
majority of whom will be independent
Compliant Corporate Governance B.1.1,
B.1.2,
B.1.3, B.1.4, B.1.5
Comprise of two Independent Non-
executive
Directors
7.10.5(b) Functions of
Remuneration
Committee
The Remuneration Committee shall
recommend the remuneration of Chief
Executive Officer and Executive Directors
Compliant Corporate Governance B.1.1,
B.1.2,
B.1.3, B.1.4, B.1.5
7.10.5 (c) Disclosure in
the Annual
Report relating
to
Remuneration
Committee
The Annual Report should set out;
Names of Directors comprising the
Remuneration Committee
Statement of Remuneration Policy
Aggregated remuneration paid to
Executive and Non-Executive Directors
Compliant Corporate Governance B.1.1,
B.1.2,
B.1.3, B.1.4, B.1.5
7.10.6 Audit
Committee
The company shall have an Audit Committee Compliant Corporate Governance D.3.1, D.3.2
The Audit Committee was
Established in 2008.
7.10.6 (a) Composition
of
Audit
Committee
Shall comprise of Non-Executive Directors
a majority of whom will be independent
Non-Executive Directors shall be appointed
as the Chairman of the committee
Chief Executive Officer and Chief Financial
Officer should attend Audit Committee
Meetings
The Chairman of the Audit Committee or
one member should be a member of a
professional accounting body
Compliant Corporate Governance D.3.1, D.3.2
Audit Committee Report is available
in pages 141 and 142
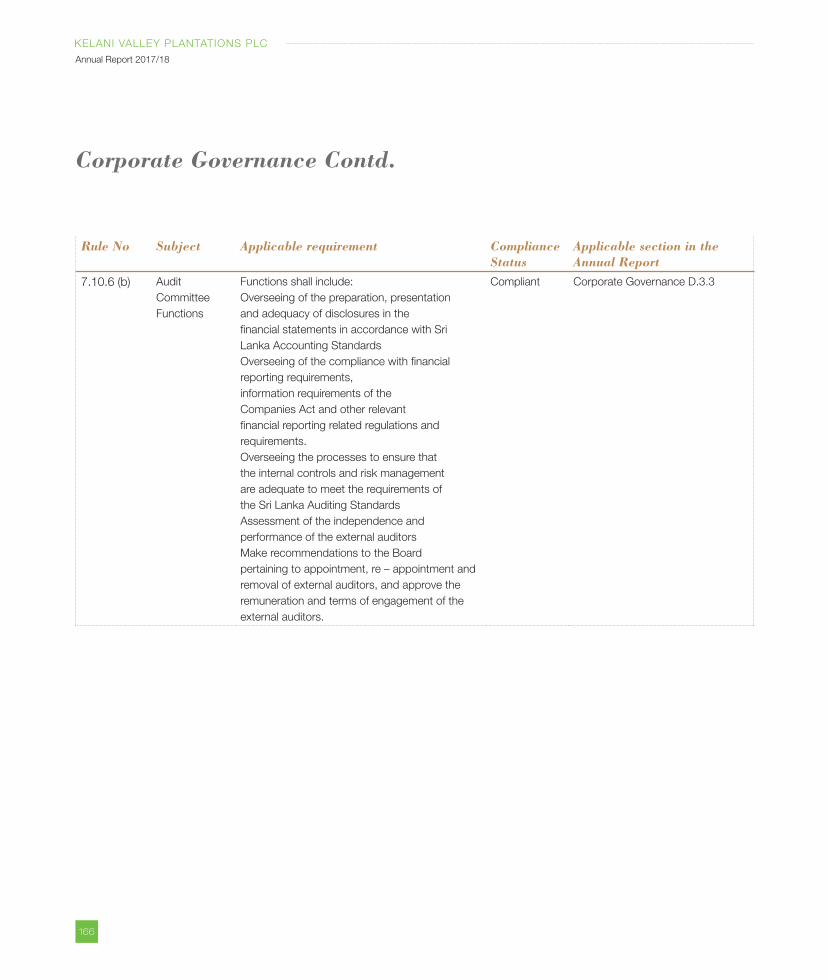
166
KELANI VALLEY PLANTATIONS PLC
Annual Report 2017/18
Corporate Governance Contd.
Rule No Subject Applicable requirement ComplianceStatus
Applicable section in theAnnual Report
7.10.6 (b) Audit
Committee
Functions
Functions shall include:
Overseeing of the preparation, presentation
and adequacy of disclosures in the
financial statements in accordance with Sri
Lanka Accounting Standards
Overseeing of the compliance with financial
reporting requirements,
information requirements of the
Companies Act and other relevant
financial reporting related regulations and
requirements.
Overseeing the processes to ensure that
the internal controls and risk management
are adequate to meet the requirements of
the Sri Lanka Auditing Standards
Assessment of the independence and
performance of the external auditors
Make recommendations to the Board
pertaining to appointment, re – appointment and
removal of external auditors, and approve the
remuneration and terms of engagement of the
external auditors.
Compliant Corporate Governance D.3.3
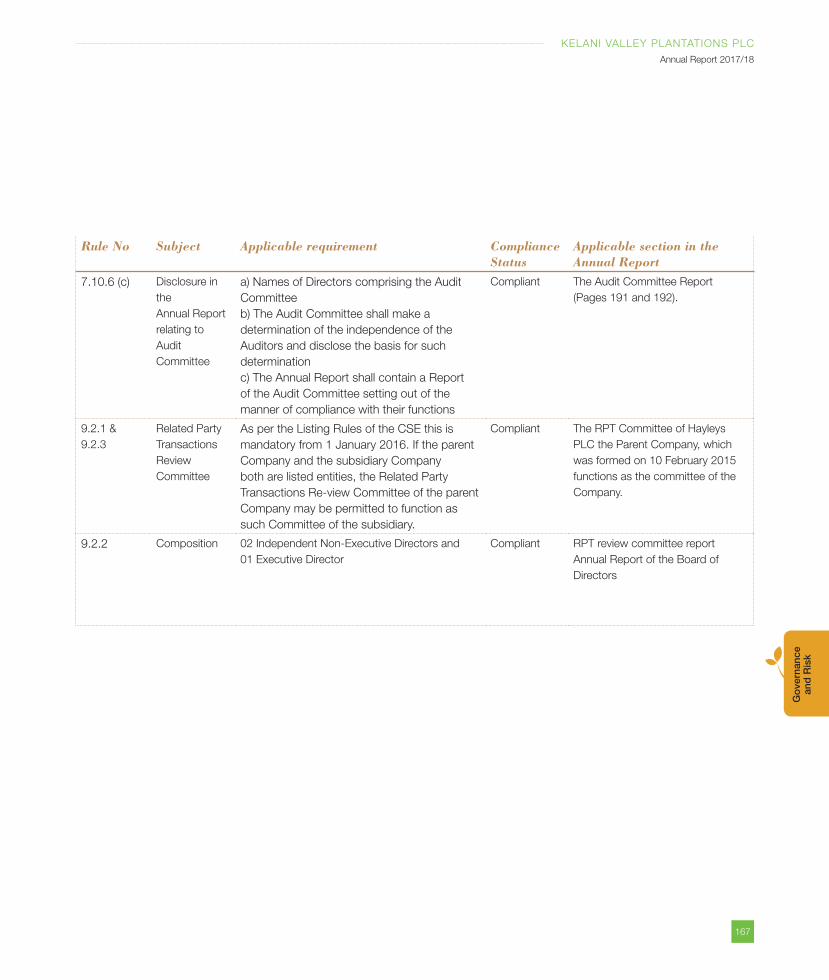
167
KELANI VALLEY PLANTATIONS PLC
Annual Report 2017/18
Go
vern
ance
an
d R
isk
Rule No Subject Applicable requirement ComplianceStatus
Applicable section in theAnnual Report
7.10.6 (c) Disclosure in
the
Annual Report
relating to
Audit
Committee
a) Names of Directors comprising the Audit
Committee
b) The Audit Committee shall make a
determination of the independence of the
Auditors and disclose the basis for such
determination
c) The Annual Report shall contain a Report
of the Audit Committee setting out of the
manner of compliance with their functions
Compliant The Audit Committee Report
(Pages 191 and 192).
9.2.1 &
9.2.3
Related Party
Transactions
Review
Committee
As per the Listing Rules of the CSE this is
mandatory from 1 January 2016. If the parent
Company and the subsidiary Company
both are listed entities, the Related Party
Transactions Re-view Committee of the parent
Company may be permitted to function as
such Committee of the subsidiary.
Compliant The RPT Committee of Hayleys
PLC the Parent Company, which
was formed on 10 February 2015
functions as the committee of the
Company.
9.2.2 Composition 02 Independent Non-Executive Directors and
01 Executive Director
Compliant RPT review committee report
Annual Report of the Board of
Directors
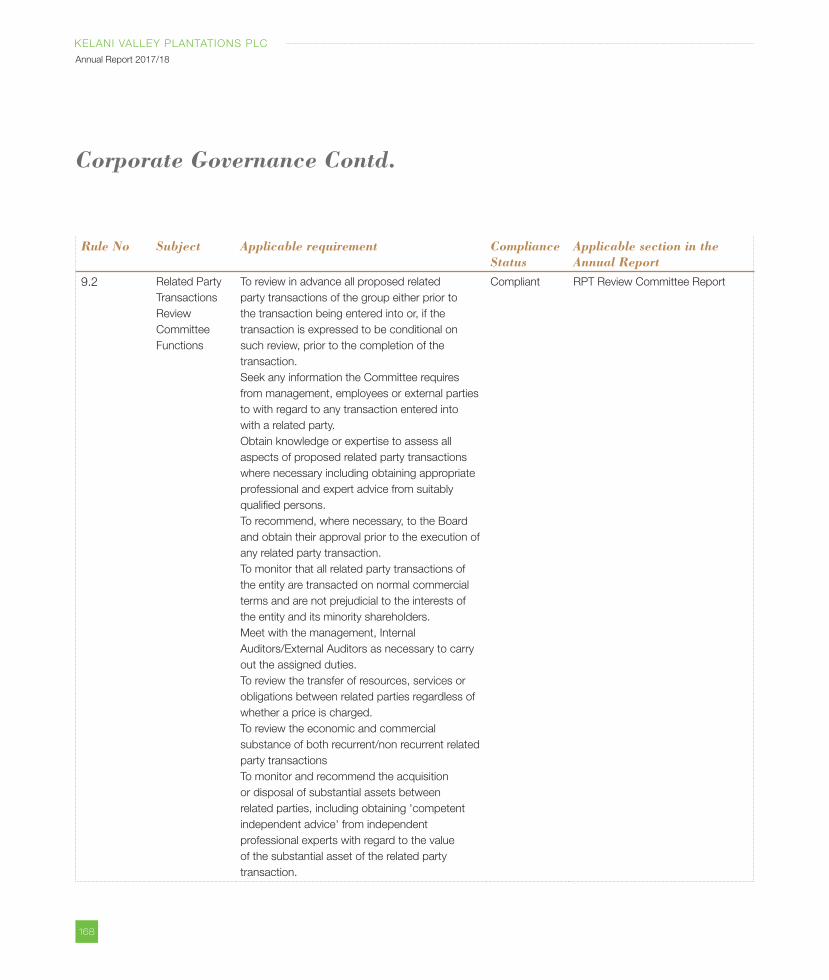
168
KELANI VALLEY PLANTATIONS PLC
Annual Report 2017/18
Corporate Governance Contd.
Rule No Subject Applicable requirement ComplianceStatus
Applicable section in theAnnual Report
9.2 Related Party
Transactions
Review
Committee
Functions
To review in advance all proposed related
party transactions of the group either prior to
the transaction being entered into or, if the
transaction is expressed to be conditional on
such review, prior to the completion of the
transaction.
Seek any information the Committee requires
from management, employees or external parties
to with regard to any transaction entered into
with a related party.
Obtain knowledge or expertise to assess all
aspects of proposed related party transactions
where necessary including obtaining appropriate
professional and expert advice from suitably
qualified persons.
To recommend, where necessary, to the Board
and obtain their approval prior to the execution of
any related party transaction.
To monitor that all related party transactions of
the entity are transacted on normal commercial
terms and are not prejudicial to the interests of
the entity and its minority shareholders.
Meet with the management, Internal
Auditors/External Auditors as necessary to carry
out the assigned duties.
To review the transfer of resources, services or
obligations between related parties regardless of
whether a price is charged.
To review the economic and commercial
substance of both recurrent/non recurrent related
party transactions
To monitor and recommend the acquisition
or disposal of substantial assets between
related parties, including obtaining 'competent
independent advice' from independent
professional experts with regard to the value
of the substantial asset of the related party
transaction.
Compliant RPT Review Committee Report
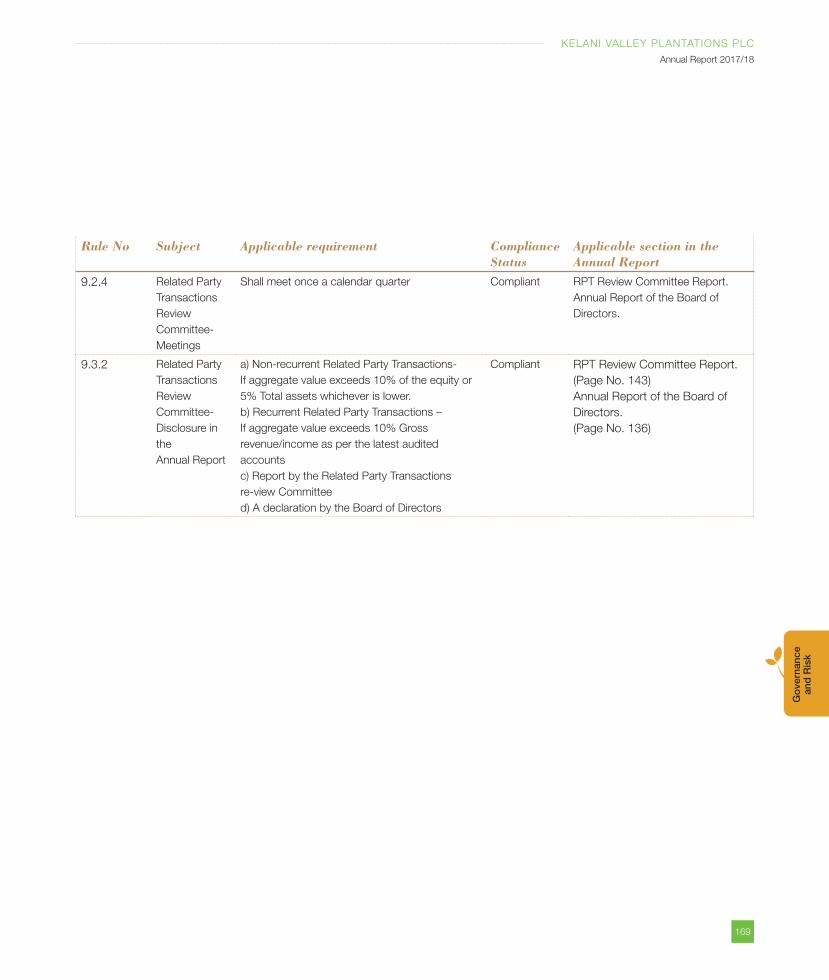
169
KELANI VALLEY PLANTATIONS PLC
Annual Report 2017/18
Go
vern
ance
an
d R
isk
Rule No Subject Applicable requirement ComplianceStatus
Applicable section in theAnnual Report
9.2.4 Related Party
Transactions
Review
Committee-
Meetings
Shall meet once a calendar quarter Compliant RPT Review Committee Report.
Annual Report of the Board of
Directors.
9.3.2 Related Party
Transactions
Review
Committee-
Disclosure in
the
Annual Report
a) Non-recurrent Related Party Transactions-
If aggregate value exceeds 10% of the equity or
5% Total assets whichever is lower.
b) Recurrent Related Party Transactions –
If aggregate value exceeds 10% Gross
revenue/income as per the latest audited
accounts
c) Report by the Related Party Transactions
re-view Committee
d) A declaration by the Board of Directors
Compliant RPT Review Committee Report.
(Page No. 143)
Annual Report of the Board of
Directors.
(Page No. 136)
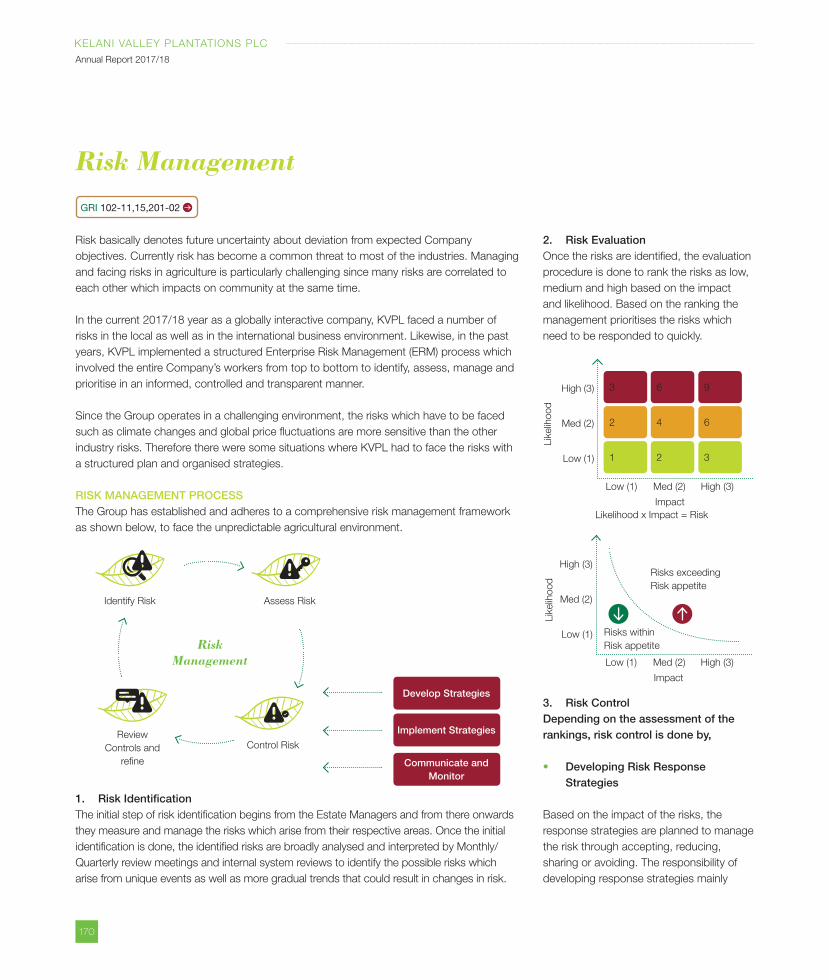
170
KELANI VALLEY PLANTATIONS PLC
Annual Report 2017/18
Risk basically denotes future uncertainty about deviation from expected Company
objectives. Currently risk has become a common threat to most of the industries. Managing
and facing risks in agriculture is particularly challenging since many risks are correlated to
each other which impacts on community at the same time.
In the current 2017/18 year as a globally interactive company, KVPL faced a number of
risks in the local as well as in the international business environment. Likewise, in the past
years, KVPL implemented a structured Enterprise Risk Management (ERM) process which
involved the entire Company’s workers from top to bottom to identify, assess, manage and
prioritise in an informed, controlled and transparent manner.
Since the Group operates in a challenging environment, the risks which have to be faced
such as climate changes and global price fluctuations are more sensitive than the other
industry risks. Therefore there were some situations where KVPL had to face the risks with
a structured plan and organised strategies.
RISK MANAGEMENT PROCESSThe Group has established and adheres to a comprehensive risk management framework
as shown below, to face the unpredictable agricultural environment.
1. Risk IdentificationThe initial step of risk identification begins from the Estate Managers and from there onwards
they measure and manage the risks which arise from their respective areas. Once the initial
identification is done, the identified risks are broadly analysed and interpreted by Monthly/
Quarterly review meetings and internal system reviews to identify the possible risks which
arise from unique events as well as more gradual trends that could result in changes in risk.
Risk Management
2. Risk EvaluationOnce the risks are identified, the evaluation
procedure is done to rank the risks as low,
medium and high based on the impact
and likelihood. Based on the ranking the
management prioritises the risks which
need to be responded to quickly.
3. Risk ControlDepending on the assessment of the rankings, risk control is done by,
Developing Risk Response Strategies
Based on the impact of the risks, the
response strategies are planned to manage
the risk through accepting, reducing,
sharing or avoiding. The responsibility of
developing response strategies mainly
Develop Strategies
Implement Strategies
Communicate and Monitor
Risk Management
Assess Risk
Control RiskReview
Controls and
refine
Identify Risk
2
3
4
6
1 2 3
6
9High (3)
Med (2)
Lik
elih
ood
Impact
Likelihood x Impact = Risk
Low (1)
Low (1) Med (2) High (3)
High (3)
Med (2)
Lik
elih
ood
Impact
Low (1)
Low (1) Med (2) High (3)
Risks within
Risk appetite
Risks exceeding
Risk appetite
GRI 102-11,15,201-02
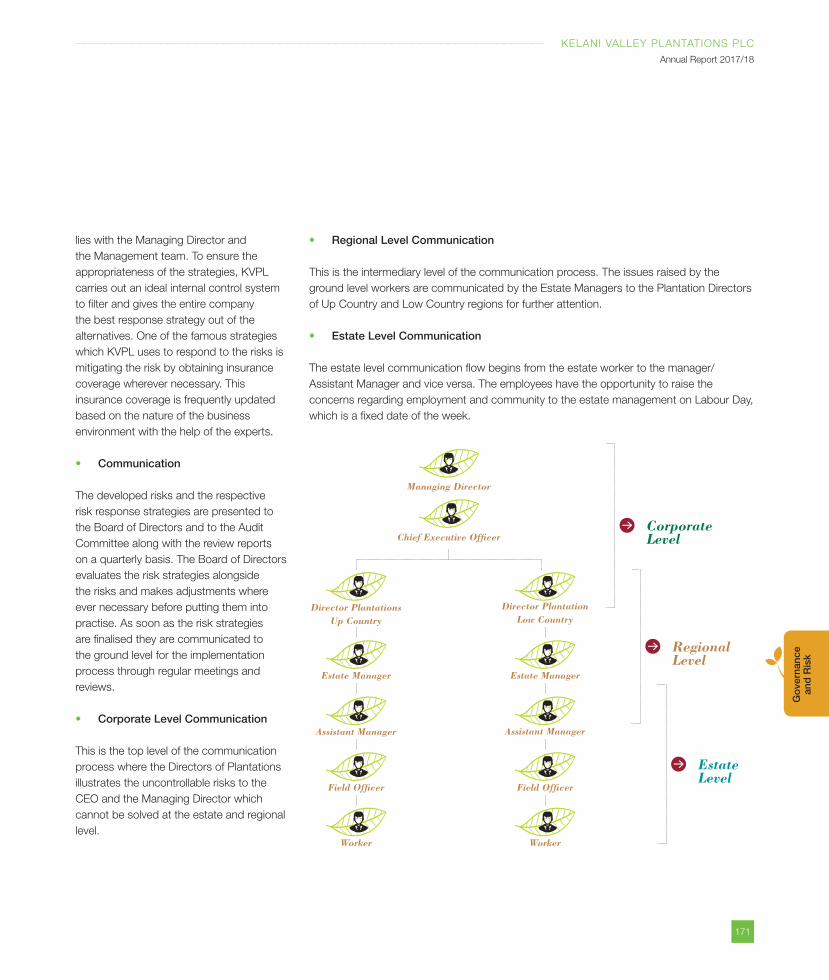
171
KELANI VALLEY PLANTATIONS PLC
Annual Report 2017/18
Go
vern
ance
an
d R
isk
lies with the Managing Director and
the Management team. To ensure the
appropriateness of the strategies, KVPL
carries out an ideal internal control system
to filter and gives the entire company
the best response strategy out of the
alternatives. One of the famous strategies
which KVPL uses to respond to the risks is
mitigating the risk by obtaining insurance
coverage wherever necessary. This
insurance coverage is frequently updated
based on the nature of the business
environment with the help of the experts.
Communication
The developed risks and the respective
risk response strategies are presented to
the Board of Directors and to the Audit
Committee along with the review reports
on a quarterly basis. The Board of Directors
evaluates the risk strategies alongside
the risks and makes adjustments where
ever necessary before putting them into
practise. As soon as the risk strategies
are finalised they are communicated to
the ground level for the implementation
process through regular meetings and
reviews.
Corporate Level Communication
This is the top level of the communication
process where the Directors of Plantations
illustrates the uncontrollable risks to the
CEO and the Managing Director which
cannot be solved at the estate and regional
level.
Regional Level Communication
This is the intermediary level of the communication process. The issues raised by the
ground level workers are communicated by the Estate Managers to the Plantation Directors
of Up Country and Low Country regions for further attention.
Estate Level Communication
The estate level communication flow begins from the estate worker to the manager/
Assistant Manager and vice versa. The employees have the opportunity to raise the
concerns regarding employment and community to the estate management on Labour Day,
which is a fixed date of the week.
Managing Director
Director Plantations Up Country
Director Plantation Low Country
Estate Manager Estate Manager
Assistant Manager Assistant Manager
Field Officer Field Officer
Worker Worker
Chief Executive OfficerCorporate Level
Regional Level
Estate Level
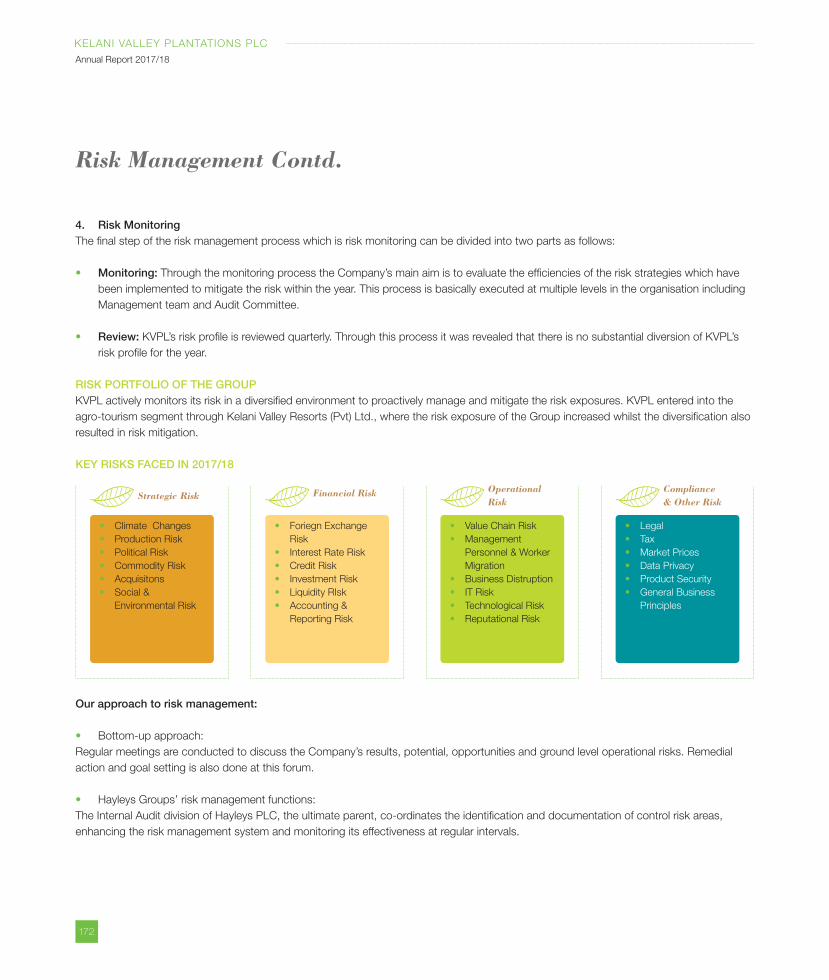
172
KELANI VALLEY PLANTATIONS PLC
Annual Report 2017/18
4. Risk MonitoringThe final step of the risk management process which is risk monitoring can be divided into two parts as follows:
Monitoring: Through the monitoring process the Company’s main aim is to evaluate the efficiencies of the risk strategies which have
been implemented to mitigate the risk within the year. This process is basically executed at multiple levels in the organisation including
Management team and Audit Committee.
Review: KVPL’s risk profile is reviewed quarterly. Through this process it was revealed that there is no substantial diversion of KVPL’s
risk profile for the year.
RISK PORTFOLIO OF THE GROUPKVPL actively monitors its risk in a diversified environment to proactively manage and mitigate the risk exposures. KVPL entered into the
agro-tourism segment through Kelani Valley Resorts (Pvt) Ltd., where the risk exposure of the Group increased whilst the diversification also
resulted in risk mitigation.
KEY RISKS FACED IN 2017/18
Our approach to risk management:
Bottom-up approach:
Regular meetings are conducted to discuss the Company’s results, potential, opportunities and ground level operational risks. Remedial
action and goal setting is also done at this forum.
Hayleys Groups’ risk management functions:
The Internal Audit division of Hayleys PLC, the ultimate parent, co-ordinates the identification and documentation of control risk areas,
enhancing the risk management system and monitoring its effectiveness at regular intervals.
Climate Changes
Production Risk
Political Risk
Commodity Risk
Acquisitons
Social &
Environmental Risk
Strategic Risk
Foriegn Exchange
Risk
Interest Rate Risk
Credit Risk
Investment Risk
Liquidity RIsk
Accounting &
Reporting Risk
Financial Risk
Value Chain Risk
Management
Personnel & Worker
Migration
Business Distruption
IT Risk
Technological Risk
Reputational Risk
Operational Risk
Legal
Tax
Market Prices
Data Privacy
Product Security
General Business
Principles
Compliance & Other Risk
Risk Management Contd.
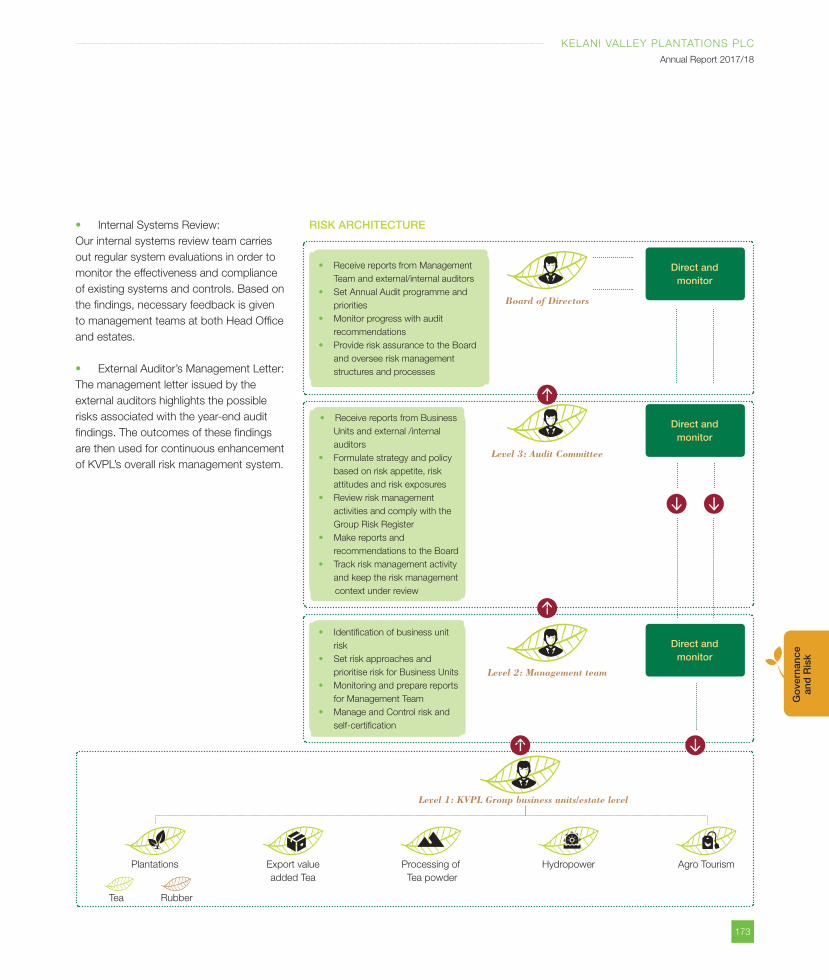
173
KELANI VALLEY PLANTATIONS PLC
Annual Report 2017/18
Go
vern
ance
an
d R
isk
Internal Systems Review:
Our internal systems review team carries
out regular system evaluations in order to
monitor the effectiveness and compliance
of existing systems and controls. Based on
the findings, necessary feedback is given
to management teams at both Head Office
and estates.
External Auditor’s Management Letter:
The management letter issued by the
external auditors highlights the possible
risks associated with the year-end audit
findings. The outcomes of these findings
are then used for continuous enhancement
of KVPL’s overall risk management system.
RISK ARCHITECTURE
Identification of business unit
risk
Set risk approaches and
prioritise risk for Business Units
Monitoring and prepare reports
for Management Team
Manage and Control risk and
self-certification
Receive reports from Business
Units and external /internal
auditors
Formulate strategy and policy
based on risk appetite, risk
attitudes and risk exposures
Review risk management
activities and comply with the
Group Risk Register
Make reports and
recommendations to the Board
Track risk management activity
and keep the risk management
context under review
Receive reports from Management
Team and external/internal auditors
Set Annual Audit programme and
priorities
Monitor progress with audit
recommendations
Provide risk assurance to the Board
and oversee risk management
structures and processes
Direct and monitor
Direct and monitor
Direct and monitor
Board of Directors
Level 3: Audit Committee
Level 2: Management team
Level 1: KVPL Group business units/estate level
Tea Rubber
Plantations Processing of
Tea powder
HydropowerExport value
added Tea
Agro Tourism
174
KELANI VALLEY PLANTATIONS PLC
Annual Report 2017/18
BUSINESS UNITS/ESTATES:Divisional business units identify each unit’s
value creation model and shareholder
concerns recognised from the stakeholder
engagement processes, to identify material
aspects and risk indicators. The risks
originated are evaluated and managed
within their approved risk appetites and
policies. To manage these risks, they
are required to establish and maintain
appropriate risk management controls,
resources and self-assurance processes.
MANAGEMENT TEAM/EXECUTIVE COMMITTEE:The management team is responsible
for developing division specific risk
appetite statements, policies, controls
and procedures, in addition to monitoring
and reporting in line with the Board’s
statement of risk appetite and the risk
management framework approved by
the Board of Directors. The Heads of the
business units evaluate operational risk
and consult operational management.
The significant risks are reported to the
corporate management where risks are
analysed, mitigated and implemented at
the operational level.
AUDIT COMMITTEE:The Group Audit Committee leads the
optimisation of the risk reward concept
by overseeing the development of risk
appetite statements, risk management
framework, policies and risk concentration
controls and monitoring diverse risk profiles
to sharpen the alignment with approved
risk appetites and strategies.
BOARD OF DIRECTORS:Overall responsibility for the management
of risk rests with the Board of Directors,
to ensure that the risk management
is embedded into all processes and
review group risk profile. The Audit
Committee assists the Board of Directors
by overseeing responsibility for risk and
internal control.
ESTATE LEVEL RISK MANAGEMENT PROCESS:According to KVPL’s Estate Risk
Management Process, it has been
identified that there is a high probability
of risks exposed towards the estate
workers and other estate communities
while on duty and off duty. These risks can
be mainly categorised into two parts as
follows,
Environmental risks
Housing and other risks
Environmental risks mainly include earth
slips, cyclones, floods, lightning strikes,
Risk Management Contd.
bee attacks and others. Housing and
other risks include factory fires and factory
accidents, fires at worker houses, field
accidents and sudden illness, violence and
strikes, customer complaints, etc. For each
of these risks the Estate Risk Management
process identifies:
How the risk could occur
Who might be harmed
What is being done already
Is anything else required to control
this risk
Action by who
Action by when
PROCESS OF MANAGING ESTATE RISKS:According to the risk arising location,
Estate Risk Management has divided the
risks into two components as,
Field level risk management
Worker housing/ environment risk
management
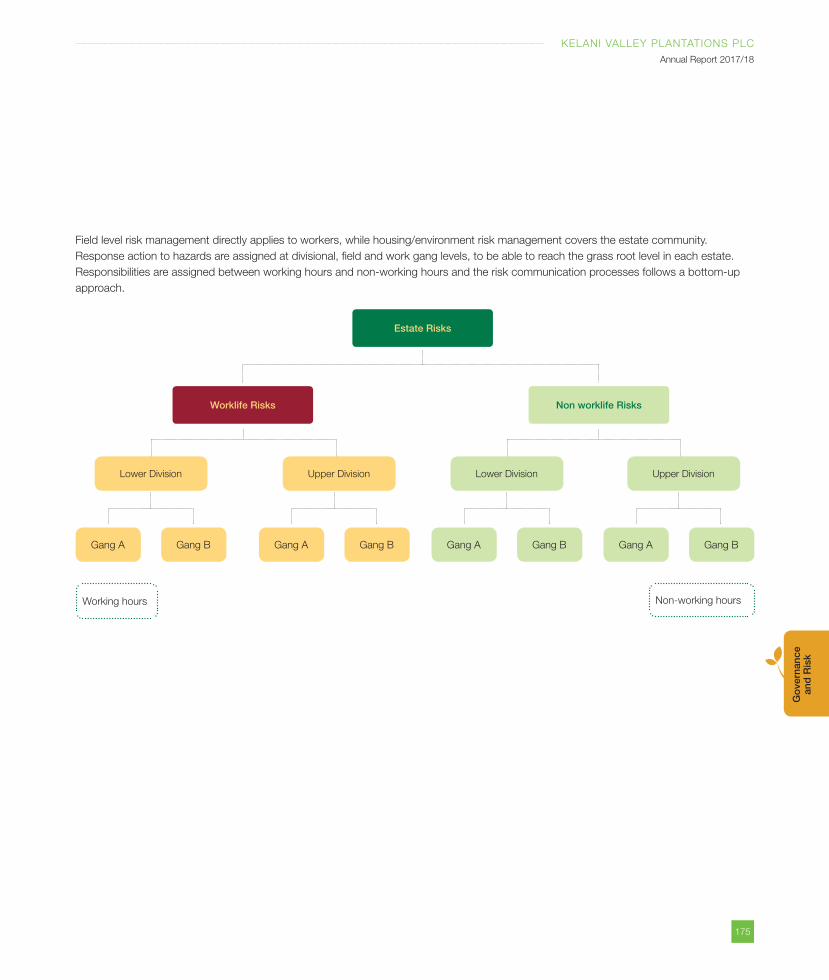
175
KELANI VALLEY PLANTATIONS PLC
Annual Report 2017/18
Go
vern
ance
an
d R
isk
Field level risk management directly applies to workers, while housing/environment risk management covers the estate community.
Response action to hazards are assigned at divisional, field and work gang levels, to be able to reach the grass root level in each estate.
Responsibilities are assigned between working hours and non-working hours and the risk communication processes follows a bottom-up
approach.
Estate Risks
Lower Division Lower DivisionUpper Division Upper Division
Worklife Risks Non worklife Risks
Non-working hours
Gang B Gang BGang B Gang BGang A Gang AGang A Gang A
Working hours
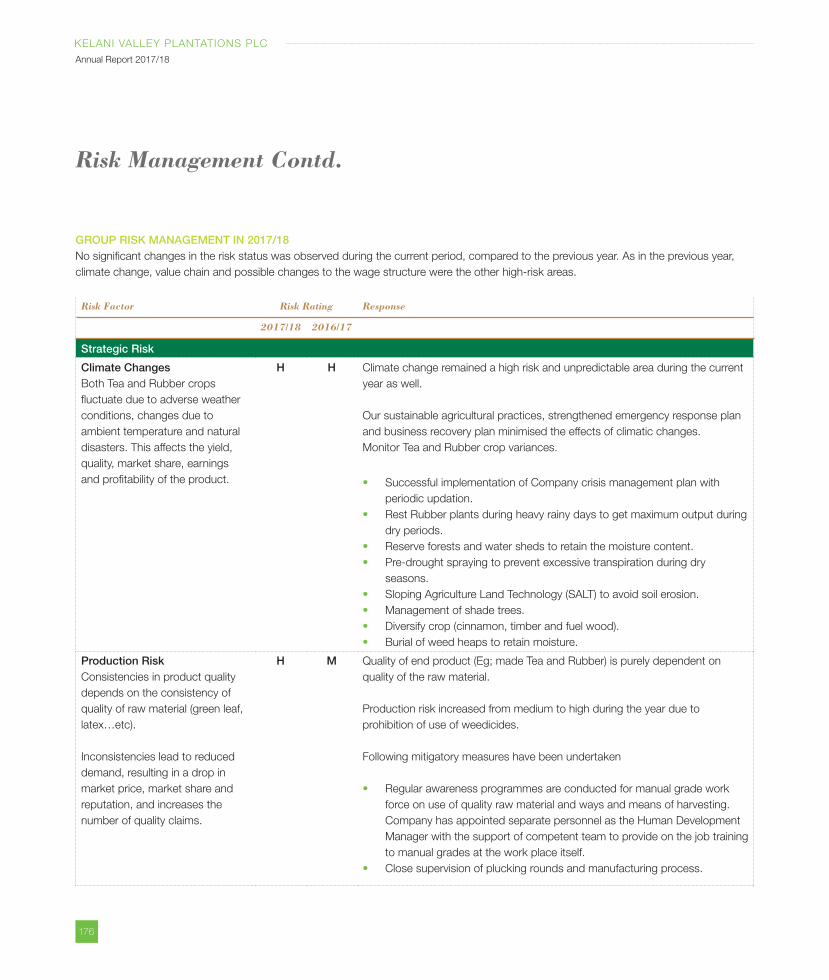
176
KELANI VALLEY PLANTATIONS PLC
Annual Report 2017/18
GROUP RISK MANAGEMENT IN 2017/18No significant changes in the risk status was observed during the current period, compared to the previous year. As in the previous year,
climate change, value chain and possible changes to the wage structure were the other high-risk areas.
Risk Factor Risk Rating Response
2017/18 2016/17
Strategic Risk
Climate ChangesBoth Tea and Rubber crops
fluctuate due to adverse weather
conditions, changes due to
ambient temperature and natural
disasters. This affects the yield,
quality, market share, earnings
and profitability of the product.
H H Climate change remained a high risk and unpredictable area during the current
year as well.
Our sustainable agricultural practices, strengthened emergency response plan
and business recovery plan minimised the effects of climatic changes.
Monitor Tea and Rubber crop variances.
Successful implementation of Company crisis management plan with
periodic updation.
Rest Rubber plants during heavy rainy days to get maximum output during
dry periods.
Reserve forests and water sheds to retain the moisture content.
Pre-drought spraying to prevent excessive transpiration during dry
seasons.
Sloping Agriculture Land Technology (SALT) to avoid soil erosion.
Management of shade trees.
Diversify crop (cinnamon, timber and fuel wood).
Burial of weed heaps to retain moisture.
Production RiskConsistencies in product quality
depends on the consistency of
quality of raw material (green leaf,
latex…etc).
Inconsistencies lead to reduced
demand, resulting in a drop in
market price, market share and
reputation, and increases the
number of quality claims.
H M Quality of end product (Eg; made Tea and Rubber) is purely dependent on
quality of the raw material.
Production risk increased from medium to high during the year due to
prohibition of use of weedicides.
Following mitigatory measures have been undertaken
Regular awareness programmes are conducted for manual grade work
force on use of quality raw material and ways and means of harvesting.
Company has appointed separate personnel as the Human Development
Manager with the support of competent team to provide on the job training
to manual grades at the work place itself.
Close supervision of plucking rounds and manufacturing process.
Risk Management Contd.
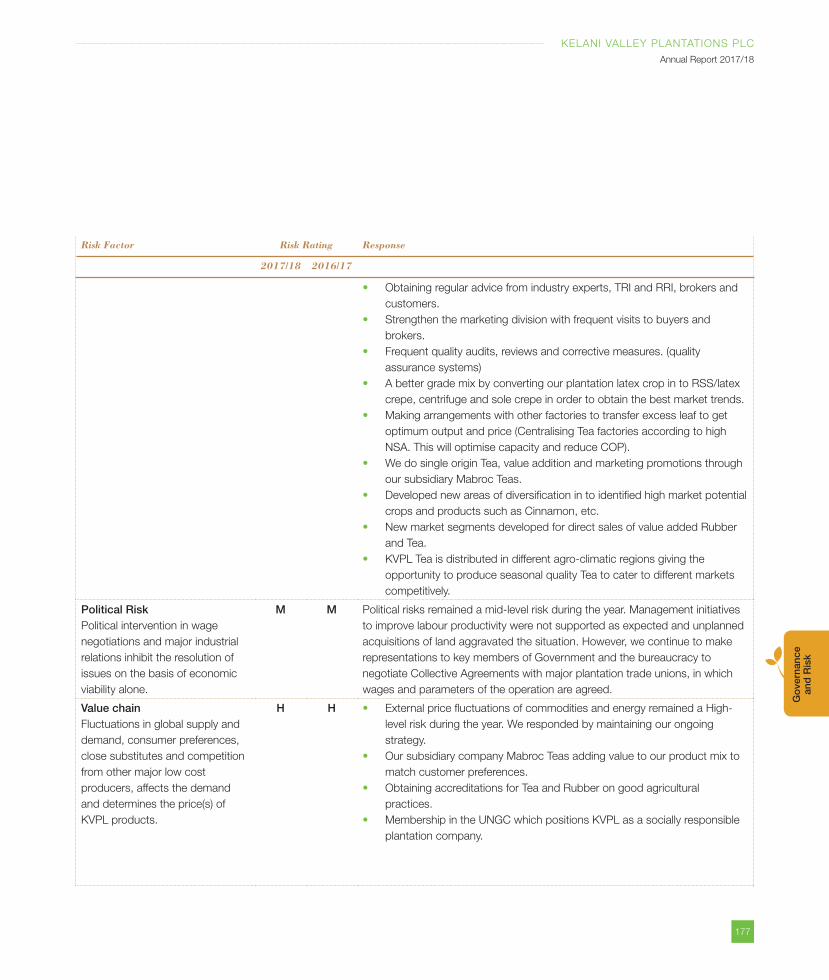
177
KELANI VALLEY PLANTATIONS PLC
Annual Report 2017/18
Go
vern
ance
an
d R
isk
Risk Factor Risk Rating Response
2017/18 2016/17
Obtaining regular advice from industry experts, TRI and RRI, brokers and
customers.
Strengthen the marketing division with frequent visits to buyers and
brokers.
Frequent quality audits, reviews and corrective measures. (quality
assurance systems)
A better grade mix by converting our plantation latex crop in to RSS/latex
crepe, centrifuge and sole crepe in order to obtain the best market trends.
Making arrangements with other factories to transfer excess leaf to get
optimum output and price (Centralising Tea factories according to high
NSA. This will optimise capacity and reduce COP).
We do single origin Tea, value addition and marketing promotions through
our subsidiary Mabroc Teas.
Developed new areas of diversification in to identified high market potential
crops and products such as Cinnamon, etc.
New market segments developed for direct sales of value added Rubber
and Tea.
KVPL Tea is distributed in different agro-climatic regions giving the
opportunity to produce seasonal quality Tea to cater to different markets
competitively.
Political RiskPolitical intervention in wage
negotiations and major industrial
relations inhibit the resolution of
issues on the basis of economic
viability alone.
M M Political risks remained a mid-level risk during the year. Management initiatives
to improve labour productivity were not supported as expected and unplanned
acquisitions of land aggravated the situation. However, we continue to make
representations to key members of Government and the bureaucracy to
negotiate Collective Agreements with major plantation trade unions, in which
wages and parameters of the operation are agreed.
Value chainFluctuations in global supply and
demand, consumer preferences,
close substitutes and competition
from other major low cost
producers, affects the demand
and determines the price(s) of
KVPL products.
H H External price fluctuations of commodities and energy remained a High-
level risk during the year. We responded by maintaining our ongoing
strategy.
Our subsidiary company Mabroc Teas adding value to our product mix to
match customer preferences.
Obtaining accreditations for Tea and Rubber on good agricultural
practices.
Membership in the UNGC which positions KVPL as a socially responsible
plantation company.
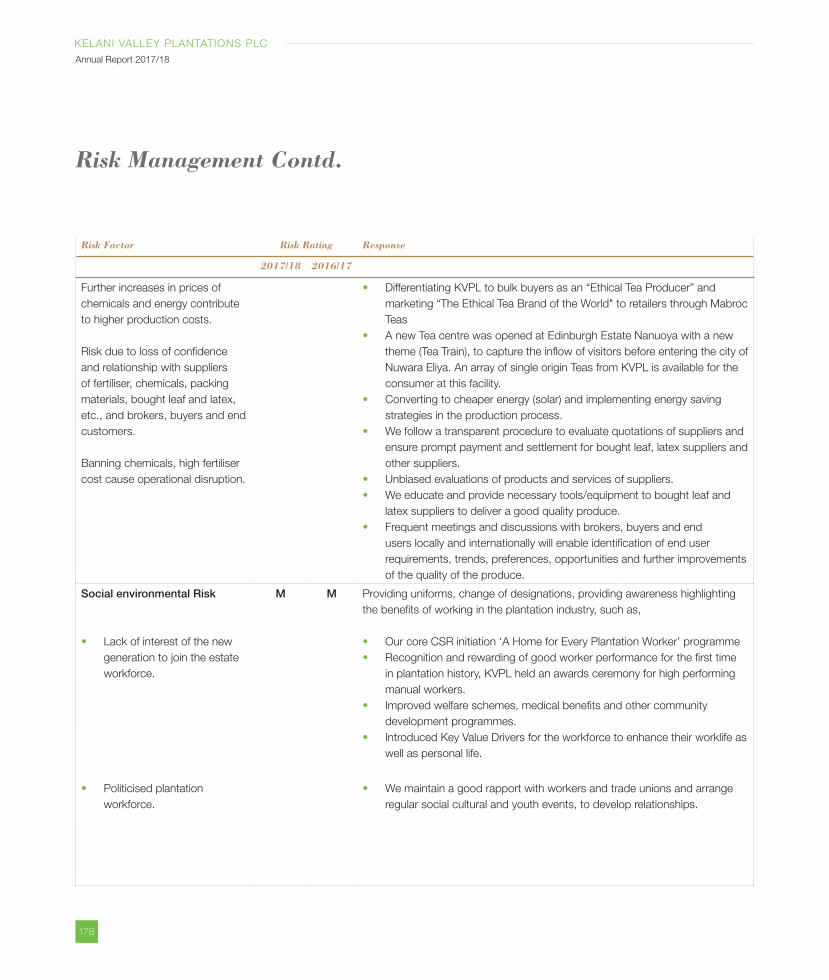
178
KELANI VALLEY PLANTATIONS PLC
Annual Report 2017/18
Risk Factor Risk Rating Response
2017/18 2016/17
Further increases in prices of
chemicals and energy contribute
to higher production costs.
Risk due to loss of confidence
and relationship with suppliers
of fertiliser, chemicals, packing
materials, bought leaf and latex,
etc., and brokers, buyers and end
customers.
Banning chemicals, high fertiliser
cost cause operational disruption.
Differentiating KVPL to bulk buyers as an “Ethical Tea Producer” and
marketing “The Ethical Tea Brand of the World" to retailers through Mabroc
Teas
A new Tea centre was opened at Edinburgh Estate Nanuoya with a new
theme (Tea Train), to capture the inflow of visitors before entering the city of
Nuwara Eliya. An array of single origin Teas from KVPL is available for the
consumer at this facility.
Converting to cheaper energy (solar) and implementing energy saving
strategies in the production process.
We follow a transparent procedure to evaluate quotations of suppliers and
ensure prompt payment and settlement for bought leaf, latex suppliers and
other suppliers.
Unbiased evaluations of products and services of suppliers.
We educate and provide necessary tools/equipment to bought leaf and
latex suppliers to deliver a good quality produce.
Frequent meetings and discussions with brokers, buyers and end
users locally and internationally will enable identification of end user
requirements, trends, preferences, opportunities and further improvements
of the quality of the produce.
Social environmental Risk
Lack of interest of the new
generation to join the estate
workforce.
Politicised plantation
workforce.
M M Providing uniforms, change of designations, providing awareness highlighting
the benefits of working in the plantation industry, such as,
Our core CSR initiation ‘A Home for Every Plantation Worker’ programme
Recognition and rewarding of good worker performance for the first time
in plantation history, KVPL held an awards ceremony for high performing
manual workers.
Improved welfare schemes, medical benefits and other community
development programmes.
Introduced Key Value Drivers for the workforce to enhance their worklife as
well as personal life.
We maintain a good rapport with workers and trade unions and arrange
regular social cultural and youth events, to develop relationships.
Risk Management Contd.
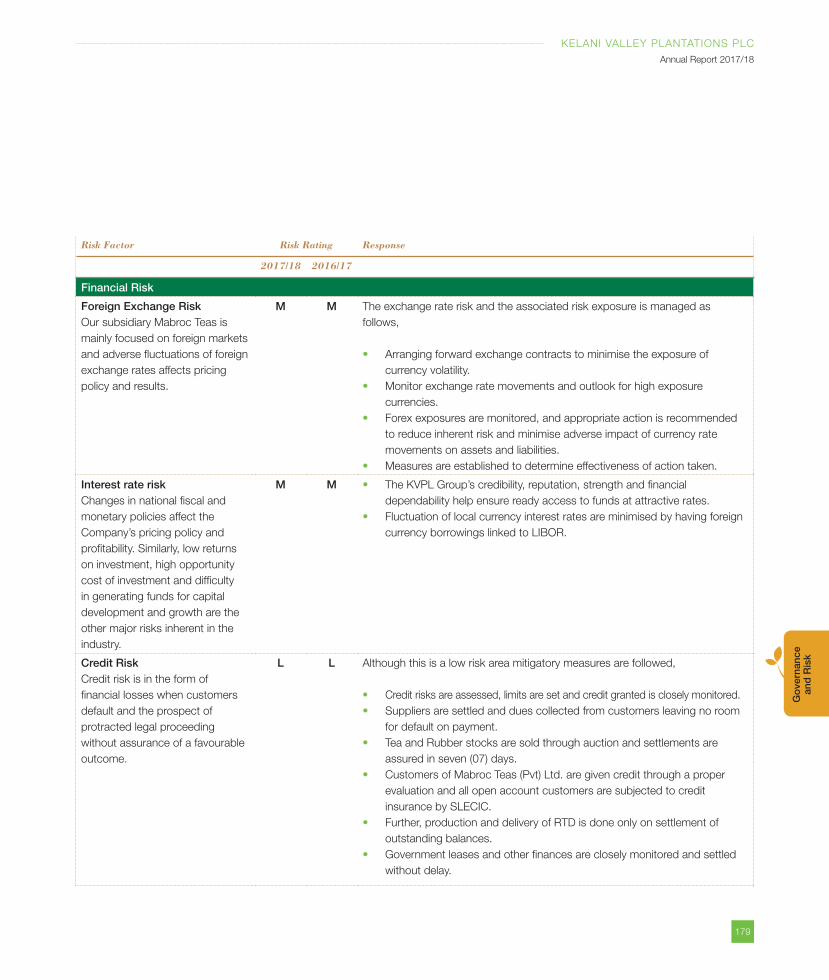
179
KELANI VALLEY PLANTATIONS PLC
Annual Report 2017/18
Go
vern
ance
an
d R
isk
Risk Factor Risk Rating Response
2017/18 2016/17
Financial Risk
Foreign Exchange RiskOur subsidiary Mabroc Teas is
mainly focused on foreign markets
and adverse fluctuations of foreign
exchange rates affects pricing
policy and results.
M M The exchange rate risk and the associated risk exposure is managed as
follows,
Arranging forward exchange contracts to minimise the exposure of
currency volatility.
Monitor exchange rate movements and outlook for high exposure
currencies.
Forex exposures are monitored, and appropriate action is recommended
to reduce inherent risk and minimise adverse impact of currency rate
movements on assets and liabilities.
Measures are established to determine effectiveness of action taken.
Interest rate riskChanges in national fiscal and
monetary policies affect the
Company’s pricing policy and
profitability. Similarly, low returns
on investment, high opportunity
cost of investment and difficulty
in generating funds for capital
development and growth are the
other major risks inherent in the
industry.
M M The KVPL Group’s credibility, reputation, strength and financial
dependability help ensure ready access to funds at attractive rates.
Fluctuation of local currency interest rates are minimised by having foreign
currency borrowings linked to LIBOR.
Credit RiskCredit risk is in the form of
financial losses when customers
default and the prospect of
protracted legal proceeding
without assurance of a favourable
outcome.
L L Although this is a low risk area mitigatory measures are followed,
Credit risks are assessed, limits are set and credit granted is closely monitored.
Suppliers are settled and dues collected from customers leaving no room
for default on payment.
Tea and Rubber stocks are sold through auction and settlements are
assured in seven (07) days.
Customers of Mabroc Teas (Pvt) Ltd. are given credit through a proper
evaluation and all open account customers are subjected to credit
insurance by SLECIC.
Further, production and delivery of RTD is done only on settlement of
outstanding balances.
Government leases and other finances are closely monitored and settled
without delay.
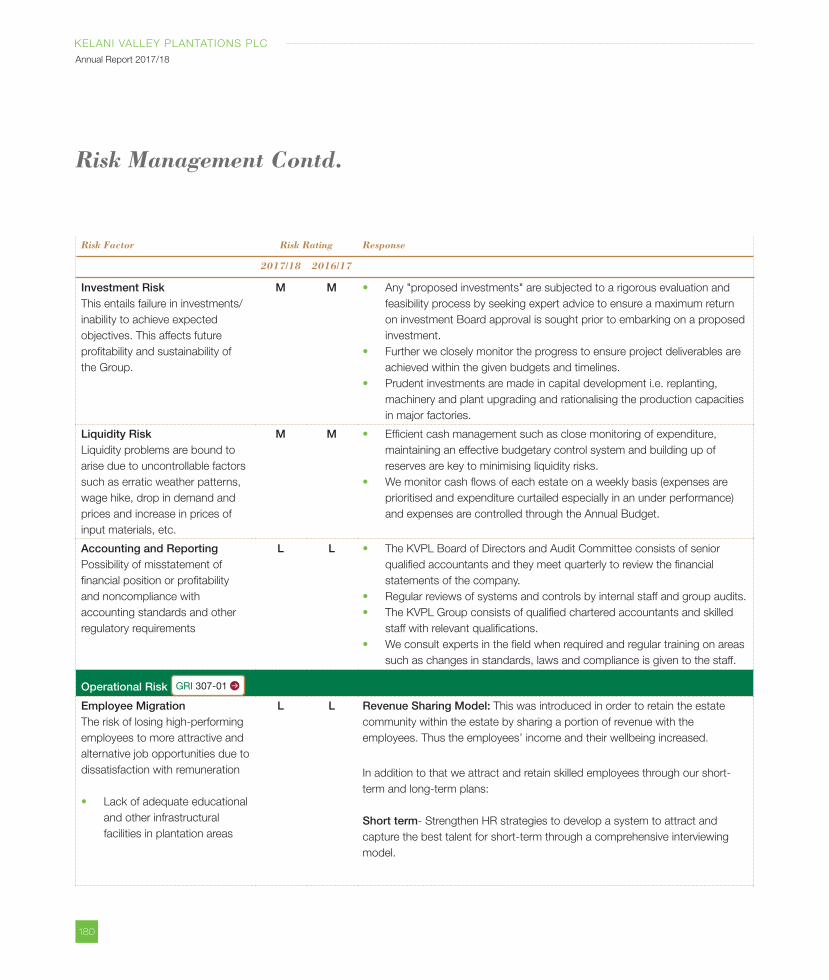
180
KELANI VALLEY PLANTATIONS PLC
Annual Report 2017/18
Risk Factor Risk Rating Response
2017/18 2016/17
Investment RiskThis entails failure in investments/
inability to achieve expected
objectives. This affects future
profitability and sustainability of
the Group.
M M Any "proposed investments" are subjected to a rigorous evaluation and
feasibility process by seeking expert advice to ensure a maximum return
on investment Board approval is sought prior to embarking on a proposed
investment.
Further we closely monitor the progress to ensure project deliverables are
achieved within the given budgets and timelines.
Prudent investments are made in capital development i.e. replanting,
machinery and plant upgrading and rationalising the production capacities
in major factories.
Liquidity RiskLiquidity problems are bound to
arise due to uncontrollable factors
such as erratic weather patterns,
wage hike, drop in demand and
prices and increase in prices of
input materials, etc.
M M Efficient cash management such as close monitoring of expenditure,
maintaining an effective budgetary control system and building up of
reserves are key to minimising liquidity risks.
We monitor cash flows of each estate on a weekly basis (expenses are
prioritised and expenditure curtailed especially in an under performance)
and expenses are controlled through the Annual Budget.
Accounting and ReportingPossibility of misstatement of
financial position or profitability
and noncompliance with
accounting standards and other
regulatory requirements
L L The KVPL Board of Directors and Audit Committee consists of senior
qualified accountants and they meet quarterly to review the financial
statements of the company.
Regular reviews of systems and controls by internal staff and group audits.
The KVPL Group consists of qualified chartered accountants and skilled
staff with relevant qualifications.
We consult experts in the field when required and regular training on areas
such as changes in standards, laws and compliance is given to the staff.
Operational Risk GRI 307-01
Employee MigrationThe risk of losing high-performing
employees to more attractive and
alternative job opportunities due to
dissatisfaction with remuneration
Lack of adequate educational
and other infrastructural
facilities in plantation areas
L L Revenue Sharing Model: This was introduced in order to retain the estate
community within the estate by sharing a portion of revenue with the
employees. Thus the employees’ income and their wellbeing increased.
In addition to that we attract and retain skilled employees through our short-
term and long-term plans:
Short term- Strengthen HR strategies to develop a system to attract and
capture the best talent for short-term through a comprehensive interviewing
model.
Risk Management Contd.
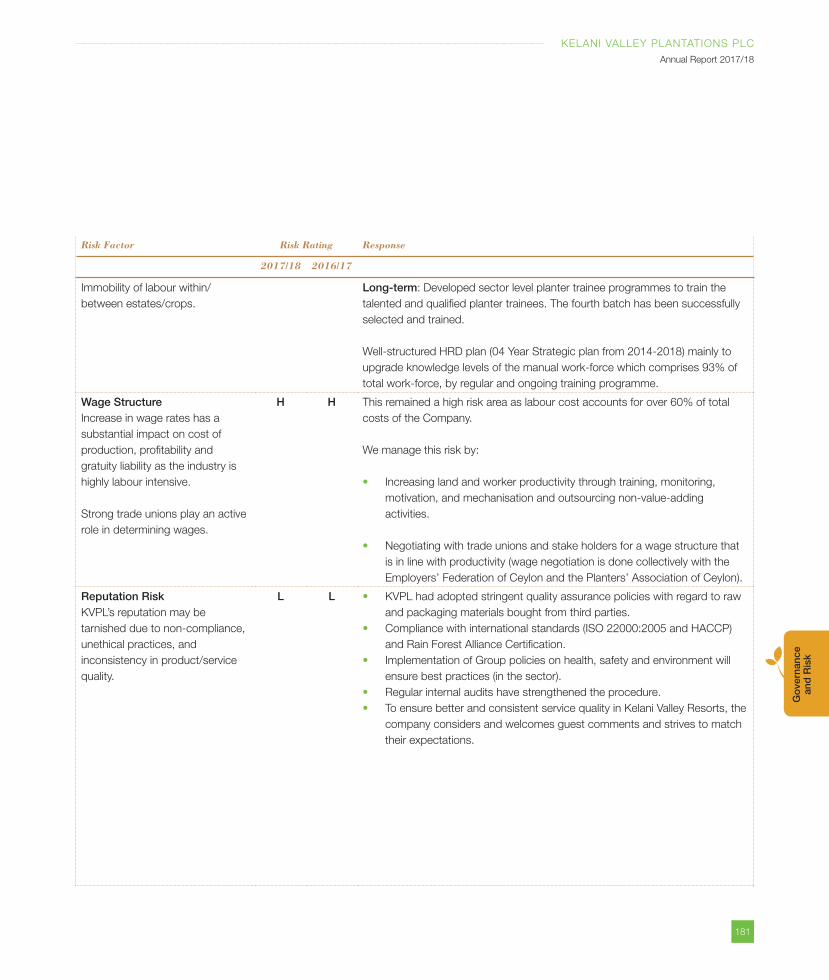
181
KELANI VALLEY PLANTATIONS PLC
Annual Report 2017/18
Go
vern
ance
an
d R
isk
Risk Factor Risk Rating Response
2017/18 2016/17
Immobility of labour within/
between estates/crops.
Long-term: Developed sector level planter trainee programmes to train the
talented and qualified planter trainees. The fourth batch has been successfully
selected and trained.
Well-structured HRD plan (04 Year Strategic plan from 2014-2018) mainly to
upgrade knowledge levels of the manual work-force which comprises 93% of
total work-force, by regular and ongoing training programme.
Wage StructureIncrease in wage rates has a
substantial impact on cost of
production, profitability and
gratuity liability as the industry is
highly labour intensive.
Strong trade unions play an active
role in determining wages.
H H This remained a high risk area as labour cost accounts for over 60% of total
costs of the Company.
We manage this risk by:
Increasing land and worker productivity through training, monitoring,
motivation, and mechanisation and outsourcing non-value-adding
activities.
Negotiating with trade unions and stake holders for a wage structure that
is in line with productivity (wage negotiation is done collectively with the
Employers’ Federation of Ceylon and the Planters’ Association of Ceylon).
Reputation RiskKVPL’s reputation may be
tarnished due to non-compliance,
unethical practices, and
inconsistency in product/service
quality.
L L KVPL had adopted stringent quality assurance policies with regard to raw
and packaging materials bought from third parties.
Compliance with international standards (ISO 22000:2005 and HACCP)
and Rain Forest Alliance Certification.
Implementation of Group policies on health, safety and environment will
ensure best practices (in the sector).
Regular internal audits have strengthened the procedure.
To ensure better and consistent service quality in Kelani Valley Resorts, the
company considers and welcomes guest comments and strives to match
their expectations.
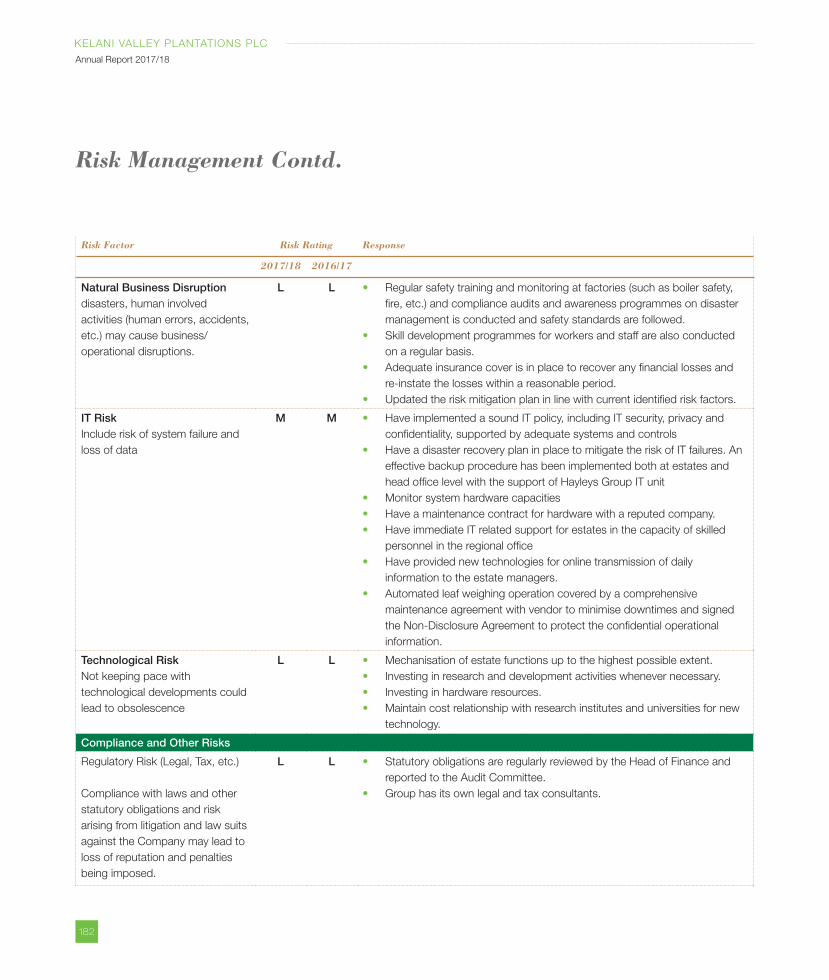
182
KELANI VALLEY PLANTATIONS PLC
Annual Report 2017/18
Risk Factor Risk Rating Response
2017/18 2016/17
Natural Business Disruption disasters, human involved
activities (human errors, accidents,
etc.) may cause business/
operational disruptions.
L L Regular safety training and monitoring at factories (such as boiler safety,
fire, etc.) and compliance audits and awareness programmes on disaster
management is conducted and safety standards are followed.
Skill development programmes for workers and staff are also conducted
on a regular basis.
Adequate insurance cover is in place to recover any financial losses and
re-instate the losses within a reasonable period.
Updated the risk mitigation plan in line with current identified risk factors.
IT RiskInclude risk of system failure and
loss of data
M M Have implemented a sound IT policy, including IT security, privacy and
confidentiality, supported by adequate systems and controls
Have a disaster recovery plan in place to mitigate the risk of IT failures. An
effective backup procedure has been implemented both at estates and
head office level with the support of Hayleys Group IT unit
Monitor system hardware capacities
Have a maintenance contract for hardware with a reputed company.
Have immediate IT related support for estates in the capacity of skilled
personnel in the regional office
Have provided new technologies for online transmission of daily
information to the estate managers.
Automated leaf weighing operation covered by a comprehensive
maintenance agreement with vendor to minimise downtimes and signed
the Non-Disclosure Agreement to protect the confidential operational
information.
Technological RiskNot keeping pace with
technological developments could
lead to obsolescence
L L Mechanisation of estate functions up to the highest possible extent.
Investing in research and development activities whenever necessary.
Investing in hardware resources.
Maintain cost relationship with research institutes and universities for new
technology.
Compliance and Other Risks
Regulatory Risk (Legal, Tax, etc.)
Compliance with laws and other
statutory obligations and risk
arising from litigation and law suits
against the Company may lead to
loss of reputation and penalties
being imposed.
L L Statutory obligations are regularly reviewed by the Head of Finance and
reported to the Audit Committee.
Group has its own legal and tax consultants.
Risk Management Contd.
183
KELANI VALLEY PLANTATIONS PLC
Annual Report 2017/18
Go
vern
ance
an
d R
isk
Annual Report of the Board of Directors on the Affairs of the CompanyThe Board of Directors of Kelani Valley
Plantations PLC has pleasure in presenting
their Report on the Affairs of the Company
together with the Audited Consolidated
Financial Statements for the year ended 31
March, 2018.
The details set out herein provide the
pertinent information required by the
Companies Act No. 07 of 2007, the
Colombo Stock Exchange Listing Rules
and are guided by recommended best
reporting practices.
PRINCIPAL ACTIVITIES, BUSINESS REVIEW AND FUTURE DEVELOPMENTSThe principal activities of the Company
are production and processing of Tea
and Rubber. Details of activities of other
companies in the Group are given on
page 16 of this Report. The Chairman’s
Message (pages 28 to 31), Management
Discussion and Analysis (pages 38 to
122), Sustainability Report (pages 110
to 122) and Financial Capital (pages 66
to 81) describe the performance of the
Company during the year, with comments
on the financial results, future strategic
developments and the progress of its
subsidiaries, Kalupahana Power Company
(Pvt) Ltd., Kelani Valley Instant Tea (Pvt)
Ltd., Mabroc Teas (Pvt) Ltd. and equity
accounted investee, Hayleys Global
Beverages (Pvt) Ltd.
During the period under review, Kelani
Valley Plantations PLC incorporated a new
fully-owned subsidiary company Kelani
Valley Resorts (Pvt) Ltd. to promote agro
tourism.
There were no material changes in the
nature of business of the Company and the
Group other than mentioned above.
The Directors, to the best of their
knowledge and belief, confirm that the
Group has not engaged in any activities
that contravene laws and regulations.
FINANCIAL STATEMENTSThe Financial Statements of the Company
and the Group are given on pages 189 to
271.
AUDITOR’S REPORTThe Auditor’s Report on the Financial
Statements of the Company and the Group
is given on pages 195 to 197.
ACCOUNTING POLICIESThe accounting policies adopted in the
preparation of the Financial Statements are
given in pages 206 to 227.
GROUP REVENUEThe Group revenue during the year was
Rs. 8,642,220,492/- (2016/17 -
Rs. 6,852,261,668/-) and an analysis
is given in Note 6.1 to the Financial
Statements.
The Group revenue from Tea increased by
Rs. 1,637,088,337/- (2016/17 – increased
by Rs. 717,197,749/-) and Rubber
increased by Rs.118, 555,914/- (2016/17 –
increased by Rs. 78,536,253/-) during the
year, respectively.
RESULTS AND DIVIDENDSThe Group profit before taxation amounted
to Rs. 202,486,507/- (2016/17-
Rs. 12,473,512/-).
After deducting Rs. 42,064,914/- (2016/17
- Rs. 27,822,507/-) for taxation, the
profit for the year was Rs. 160,421,593/-
(2016/17 – loss of Rs. 15,348,994/-).
The Group profit attributable to owners
of the parent which was deducted for
non-controlling interest of Rs. 5,231,697/-
(2016/17-3,383,973/-) for the year was
Rs.155,189,897/- (2016/17 – loss of
Rs. 18,732.968/-).
The Profit available for appropriation,
inclusive of Rs. 880,914,240/-
(2016/17- Rs. 592,660,320/-) of brought
forward retained profit amounted to
Rs.977,740,165/- (2016/17-
Rs. 880,914,240/-)
The Board of Directors recommends a
first and final dividend of Rs. 1/- per share
payable on 04 July 2018 to the holders of
the issued ordinary shares of the Company
as at close of business on 22 June 2018.
The dividend is paid out of the dividend
received and therefore is not be liable to
14% dividend tax.
The Directors have confirmed that the
Company satisfies the solvency test
requirement under Section 57 of the
Companies Act No. 07 of 2007 for the first
and final dividend proposed. A Solvency
Certificate by the Auditors has been sought
in respect of the proposed dividend of
Rs. 1/- (2016/17 – Rs. Nil)
184
KELANI VALLEY PLANTATIONS PLC
Annual Report 2017/18
Annual Report of the Board of Directors on the Affairs of the Company Contd.
PROPERTY, PLANT & EQUIPMENTThe capital expenditure of the Group during
the period amounted to Rs. 473,086,184/-
(2016/17 - Rs. 499,236,429/-) whilst that
of the Company was Rs. 387,573,783/-
(2016/17 – Rs. 424,375,448/-) which
includes replanting expenditure of
Rs. 314,304,491/- (2016/17 -
Rs. 318,308,290/-) on Tea, Rubber and
Cinnamon.
Information relating to movement of
Property, plant & equipment is given in
Notes 12, 13 and 14 to the Financial
Statements.
STATED CAPITAL AND RESERVESIn compliance with the Companies Act
No. 07 of 2007, the Financial Statements
reflect the stated capital of the Company.
The stated capital is the total of all amounts
received, due or payable to the Company
in respect of the issue of shares.
The stated capital of the Company,
consisting of 34,000,000 ordinary shares
and one Golden share amounts to Rs.
340,000,010/-. There was no change to
the stated capital during the year.
The Golden share of Rs. 10/- held by
the Secretary to the Treasury, enjoys the
following special rights:
The concurrence of the Golden
Shareholder should be obtained to
sub-lease estate lands and amend the
Articles of Association of the Company
in which the Golden Shareholders’
rights are given.
The Golden Shareholder, or his
nominee, has the right to examine the
books and accounts of the Company.
The Company is required to submit a
detailed quarterly report to the Golden
Shareholder.
The Golden Shareholder can request
the Board of Directors of the Company
to meet with him.
RESERVESThe total reserves of the Group as at 31
March, 2018 amounted to
Rs. 2,677,740,165/- (2016/17 -
Rs. 2,580,914,025/-) comprising the
general reserve of Rs. 1,700,000,000/-
(2016/17 - Rs. 1,700,000,000/-) and the
carried forward profit of Rs. 977,740,165/-
(2016/17 - Rs. 880,914,025/-).
The movement is shown in the Statements
of Changes in Equity in the Financial
Statements.
TAXATIONIt is the Company’s policy to provide for
deferred taxation on all known temporary
differences on the liability method. The
Company is liable to income tax at the rate
of 10% on its agricultural profits and 28%
on manufacturing profits and other income
for the year of assessment 2017/18.
Information relating to income tax rates of
subsidiary companies is shown in Note 10
to the Financial Statements.
INTEREST REGISTERThe Company, in compliance with the
Companies Act No. 07 of 2007, maintains
an Interest Register. Particulars of entries
in the Interest Register are detailed
below. The subsidiary companies have
unanimously agreed to dispense with the
keeping of an Interest Register.
DIRECTORS’ INTERESTS IN TRANSACTIONSThe Directors of the Company have
made the general disclosures provided
for in Section 192 (2) of the Companies
Act No. 07 of 2007. Note 32 to the
Financial Statements dealing with related
party disclosures includes details of their
interests in transactions.
RELATED PARTY TRANSACTIONSThe Board of Directors has given the
following statement in respect of the
related party transactions.
The related party transactions of the
Company during the financial year have been
re-viewed by the Related Party Transactions
Re-view Committee of Hayleys PLC the
Parent Company and are in compliance with
Section 09 of the CSE Listing Rules.
The Related Party Transactions Review
Committee comprises two Independent
Non-Executive Directors and one Executive
Director of Hayleys PLC and the name of
the members and their attendants at the
meetings are given on page 193 under the
related party transaction committee report.
185
KELANI VALLEY PLANTATIONS PLC
Annual Report 2017/18
Go
vern
ance
an
d R
isk
DIRECTORS’ INTERESTS IN SHARESDirectors who have relevant interests in the shares of the Company have disclosed their
shareholdings and any acquisitions/disposals during the year to the Boards, in compliance
with Section 200 of the Companies Act.
Details of Directors shareholding as per the rules of the CSE is as below.
As at 31.03.18
As at 31.03.17
No. of shares No. of sharesMr Roshan Rajadurai,
Managing Director
91 91
Mr S Siriwardana,
Chief Executive Officer/Director
193 193
Dr K I M Ranasoma,
Director
300 300
None of the other Directors held shares of the Company as at 31 March 2018.
There were no share transactions by the Directors during the year in terms of Section 200
of the Companies Act in respect of the subsidiaries.
INSURANCE AND INDEMNITYThe ultimate parent of the Company, Hayleys PLC has obtained a Directors and Officers
liability insurance from Orient Insurance Ltd., providing worldwide cover to indemnify all
past, present and future Directors and Officers (D & O) of the Group.
The limit on liability of the cover is USD 5 m per annum.
PAYMENT OF REMUNERATION TO DIRECTORSExecutive Directors’ remuneration is determined within an established framework. The total
remuneration of the Executive Directors of the Group and the Company for the year ended
31 March, 2018, is Rs. 35,312,000/- and Rs. 9,956,000/- respectively, including the value
of perquisites granted to them as part of their terms of service.
The total remuneration of Independent Non-Executive Directors of both Group and the
Company for the year ended 31 March, 2018, is Rs. 1,770,000/-, determined according
to scales of payment decided upon by the Board previously. The Board is satisfied that the
payment of this remuneration is fair to the Company.
CORPORATE DONATIONSNo donations were made during the year
(2016/17 - Nil) by the Company and its
subsidiaries.
No donations were made for political
purposes.
DIRECTORATEThe names of the Directors who held office
during the financial year are given below
and their brief profiles appear on pages 12
and 15.
EXECUTIVE DIRECTORSA M Pandithage, Roshan Rajadurai,
S Siriwardana.
NON-EXECUTIVE DIRECTORSS C Ganegoda , L T Samarawickrama ,
Dr K I M Ranasoma.
INDEPENDENT NON-EXECUTIVE DIRECTORSF Mohideen, C V Cabraal,
L N De S Wijeyeratne.
In terms of Article No.30 of the Articles of
Association of the Company,
Mr A M Pandithage and
Dr K I M Ranasoma retire by rotation, and
being eligible offer themselves for
re-election.
Notice has been given pursuant to Section
211 of the Companies Act No. 07 of 2007, of
the intention to propose an ordinary resolution
for the re-appointment of Mr F Mohideen,
who is over 70 years of age, notwithstanding
the age limit stipulated by Section 210 of the
Companies Act. No 07 of 2007.
186
KELANI VALLEY PLANTATIONS PLC
Annual Report 2017/18
Annual Report of the Board of Directors on the Affairs of the Company Contd.
Directors of the Company and subsidiaries
are given in page 16
CORPORATE GOVERNANCEThe Company has complied with the
Corporate Governance Rules laid down
under the Listing Rules of the Colombo
Stock Exchange. Adoption of good
governance practices has become an
essential requirement in today’s corporate
culture. The practices carried out by the
Group are explained in the Corporate
Governance Statement on pages 130 to
169.
AUDITORSThe Auditors, Messrs Ernst & Young, were
paid Rs. 5,493,418/- (2016/17 -
Rs. 4,940,193/-) and Rs. 4,819,448/-
(2015/16 - Rs. 3,903,300/-) by the Group
and the Company respectively as audit
fees for the financial year ended 31 March
2018.
In addition, the Group paid Rs. 644,159/-
(2016/17 - Rs. 943,969/-) to Messrs Ernst
& Young for the year whilst the Company
incurred Rs. 316,837/- (2016/17 –
Rs. 220,000) on non – audit related work
which is mainly consists of tax consultancy
services.
The Auditors of the Company and its
subsidiaries have confirmed that they do
not have any relationships (other than
that of Auditor) with, or interests in the
Company or any of its subsidiaries other
than those disclosed above.
Messrs Ernst & Young, Chartered
Accountants are deemed re-appointed,
in term of Section 158 of the Companies
Act No. 7 of 2007, as Auditors of the
Company.
A resolution proposing the Directors be
authorised to determine their remuneration
will be submitted at the Annual General
Meeting.
SHARE INFORMATION AND MAJOR SHAREHOLDINGSInformation relating to earnings, dividend,
Net Assets Per Share, Market Value Per
Share and share trading is shown on pages
22 and 275 respectively.
SHAREHOLDERSIt is the Group / Company policy to
endeavour to ensure equitable treatment
to its shareholders. The Twenty major
shareholders’ names, comparative number
of shares held and the percentage held
as at 31 March, 2018 are given on page
275 of this report. Public shareholding
percentage and total number of public
shareholders is shown on page 274.
EVENTS OCCURRING AFTER THE DATE OF STATEMENT OF FINANCIAL POSITIONNo circumstances have arisen since the
date of Statement of Financial Position,
which would require adjustments to, or
disclosure of other than those disclosed in
Note 35 to the Financial Statements.
EMPLOYEES AND INDUSTRIAL RELATIONSThe Company has a structure and a
culture that recognises the aspirations,
competencies and commitment
of employees. Career growth and
advancement within the Company is
promoted. Details of Company’s human
resource practices and employee and
industrial relationships are given in Human
Capital Section.
The number of persons employed by the
Group at financial year-end was 9,893
(2016/17 – 9,634) of which 9,722 (2016/17
– 9,457) are engaged in employment
outside the Western province.
STATUTORY PAYMENTSThe Directors, to the best of their knowledge
and belief, are satisfied that all statutory
payments due to the Government, other
regulatory institutions and those related to
employees have been made promptly.
The declaration relating to statutory
payments is made in the Statement of
Directors’ Responsibilities on page 190.
RATIOS AND MARKET PRICE INFORMATIONThe ratios relating to equity and debt as
required by the listing requirements of the
Colombo Stock Exchange are given in
page 22.
187
KELANI VALLEY PLANTATIONS PLC
Annual Report 2017/18
Go
vern
ance
an
d R
isk
ENVIRONMENTAL PROTECTIONThe Group’s efforts to conserve scarce and
non-renewable resources, as well as its
environmental objectives and key initiatives,
are described in the environment section
of the Sustainability Report in pages 83 to
122.
The Group’s business activities can
have direct and indirect effect on the
environment. It is the Group’s policy to
minimise any adverse effects its activities
may have on the environment and to
promote co-operation and compliance with
the relevant authorities and regulations.
INTERNAL CONTROLThe Directors acknowledge their
responsibility for the Group’s system of
internal control. The system is designed
to give assurance, inter alia, regarding the
safeguarding of assets, the maintenance
of proper accounting records and the
reliability of financial information generated.
However, any system can only ensure
reasonable and not absolute assurance
that errors and irregularities are either
prevented or detected within a reasonable
time period.
The Board, having reviewed the system
of internal controls, is satisfied with its
effectiveness for the period up to the date
of signing the Financial Statements.
GOING CONCERNAfter considering the financial position,
operating conditions, regulatory and other
factors and such matters required to be
addressed in the corporate governance
code, the Directors have a reasonable
expectation that the Group and Company
possesses adequate resources to continue
in operation for the foreseeable future.
For this reason, they continue to adopt
the Going Concern basis in preparing the
financial statements.
ANNUAL GENERAL MEETINGThe Annual General Meeting will be held at
the registered office of the Company at No.
400, Deans Road, Colombo 10, Sri Lanka
on Friday, 22 June 2018 at 3.00 p.m. The
Notice of the Annual General Meeting
appears on page 282.
For and on behalf of the Board,
A M PandithageChairman
Roshan RajaduraiManaging Director
Hayleys Group Services (Pvt) Ltd.Secretaries
09 May, 2018
188
KELANI VALLEY PLANTATIONS PLC
Annual Report 2017/18
Directors’ Statement on Internal Controls
The following statement fulfills the
requirement to publish the Directors’
Statement on internal control as per
the Code of best practice on Corporate
Governance 2017 issued by the Institute of
Chartered Accountants of Sri Lanka .
The Board of Directors is responsible for
maintaining a sound system of internal
controls to safeguard shareholder’s
investments and the Company’s assets.
The Board has established an ongoing
process for identifying, evaluating and
managing the significant risks faced by
the Company and Group. This process
includes enhancing the system of internal
controls as and when there are changes
to business environment or regulatory
guidelines. The process is regularly
reviewed by the Board.
The Board is of the view that the system
of internal controls in place is sound and
adequate to provide reasonable assurance
regarding the reliability of financial
reporting, and the preparation of Financial
Statements for external purposes and is
in accordance with relevant accounting
principles and regulatory requirements.
The Board has implemented the following
to obtain reasonable assurance that proper
systems of internal controls are in place:
Instituted committees to assist the
Board in ensuring the effectiveness
of Company’s operations and the
operations are in accordance with
the corporate strategies and annual
budget.
The Hayleys Management Audit and
System Review Division ( MA & SRD)
to review and report on the internal
control environment in the Company
and Group. Audits are carried out on
all subsidiaries in accordance with
the annual audit plan approved by
the Audit Committee. Findings are
submitted to the Audit Committee for
review at their periodic meetings.
The Audit Committee reviews internal
control issues identified by MA & SRD
and management, and evaluates
the adequacy and effectiveness of
the risk management and internal
control systems. They also review the
internal audit functions with particular
emphasis on the scope of audits and
quality of internal audits.
The adoption of new Sri Lanka
Accounting Standards, processes
that are required to comply with
new requirements of recognition,
measurement, presentation and
disclosures were introduced and
implemented. Continuous monitoring
is in progress to ensure effective
implementation of the required
processes.
The comments made by External
Auditors in connection with the
internal control system during the
financial year 2016/17 were taken into
consideration and appropriate steps
have been taken to incorporate them
where appropriate.
CONCLUSIONThe Board having implemented the above
is aware that such systems are designed
to manage rather than eliminate the risk
of failure to achieve business objective
and can only provide reasonable and
not absolute assurance against material
misstatements of loss.
The Board of Directors confirm that the
financial reporting system has been
designed to provide reasonable assurance
regarding the reliability of financial reporting
and the preparation of Financial Statements
for external purposes has been done in
accordance with the Sri Lanka Accounting
Standards, requirements of the Company’s
Act no 7 of 2007 and the Listing Rules of
the Colombo Stock Exchange.
Roshan RajaduraiManaging Director
Sarath SiriwardanaDirector / Chief Executive Officer
09 May 2018
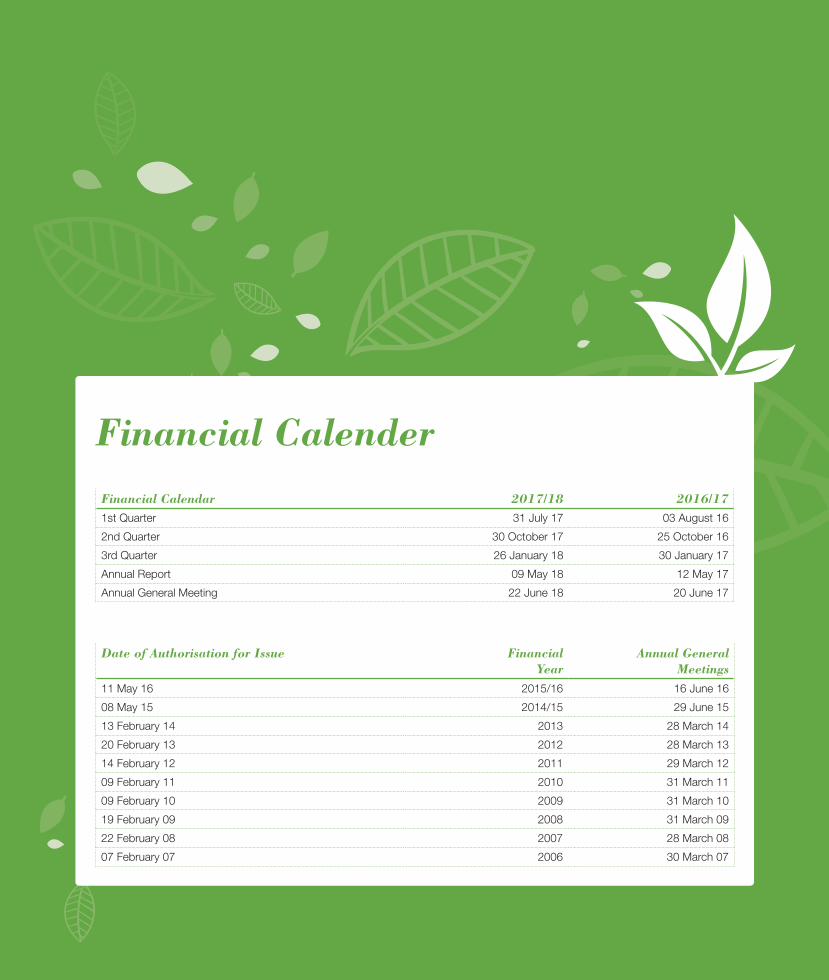
189
KELANI VALLEY PLANTATIONS PLC
Annual Report 2017/18
Fin
anci
al
Rep
ort
s
Financial CalenderFinancial Calendar 2017/18 2016/171st Quarter 31 July 17 03 August 16
2nd Quarter 30 October 17 25 October 16
3rd Quarter 26 January 18 30 January 17
Annual Report 09 May 18 12 May 17
Annual General Meeting 22 June 18 20 June 17
Date of Authorisation for Issue Financial Year
Annual General Meetings
11 May 16 2015/16 16 June 16
08 May 15 2014/15 29 June 15
13 February 14 2013 28 March 14
20 February 13 2012 28 March 13
14 February 12 2011 29 March 12
09 February 11 2010 31 March 11
09 February 10 2009 31 March 10
19 February 09 2008 31 March 09
22 February 08 2007 28 March 08
07 February 07 2006 30 March 07
190
KELANI VALLEY PLANTATIONS PLC
Annual Report 2017/18
Statement of Directors’ Responsibilities
The Directors are responsible under
sections 150 (1), 151, 152 (1),) and 153
of the Companies Act No. 7 of 2007, to
ensure compliance with the requirements
set out therein to prepare Financial
Statements for each financial year giving
a true and fair view of the state of affairs
of the Company and the Group as at the
end of the financial year and of the profit &
loss of the Company and the Group for the
financial year.
The Directors are also responsible, under
section 148, for ensuring that proper
accounting records are kept to enable,
determination of financial position with
reasonable accuracy, preparation of
Financial Statements and audit of such
statements to be carried out readily and
properly.
The Board accepts responsibility for the
integrity and objectivity of the Financial
Statements presented. The Directors
confirm that in preparing the Financial
Statements, appropriate accounting
policies have been selected and applied
consistently while reasonable and prudent
judgments have been made so that the
form and substance of transactions are
properly reflected.
They also confirm that the Financial
Statements have been prepared and
presented in accordance with the Sri
Lanka Accounting Standards, (SLFRS/
LKAS) Companies Act No 07 of 2007
and the listing rules of the Colombo
Stock Exchange. Further, the Financial
Statements provide the information
required by the Companies Act and
the listing rules of the Colombo Stock
Exchange.
The Directors are of the opinion, based
on their knowledge of the company, key
operations and specific inquiries that
adequate resources exist to support the
Company on a going concern basis over
the next year. These Financial Statements
have been prepared on that basis.
The Directors have taken reasonable
measures to safeguard the assets of the
Group and, in that context, have instituted
appropriate systems of internal control with
a view to preventing and detecting fraud
and other irregularities.
As required by Section 56(2) of the
Companies Act No. 7 of 2007, the Board
of Directors has authorized distribution
of the dividends now proposed, being
satisfied, based on information available
to it, that the Company would satisfy the
Solvency Test after such distributions,
in accordance with section 57 of the
Companies Act No. 7 of 2007 and have
sought in respect of the dividend now
proposed, Certificate of Solvency from its
Auditors.
The external Auditors, Messrs Ernst &
Young deemed re-appointed in terms
of Section 158 of the Companies Act
were provided with every opportunity to
undertake the inspections they considered
appropriate to enable them to form their
opinion on the Financial Statements. The
report of the Auditors, shown on pages
195 to 197 sets out their responsibilities in
relation to the Financial Statements.
COMPLIANCE REPORTThe Directors confirm that to the best of
their knowledge, all statutory payments
relating to employees and the Government
that were due in respect of the Company
and its Subsidiaries as at the Balance
Sheet date have been paid or where
relevant, provided for.
By order of the Board
HAYLEYS GROUP SERVICES (PVT) LTD.Secretaries
09 May 2018
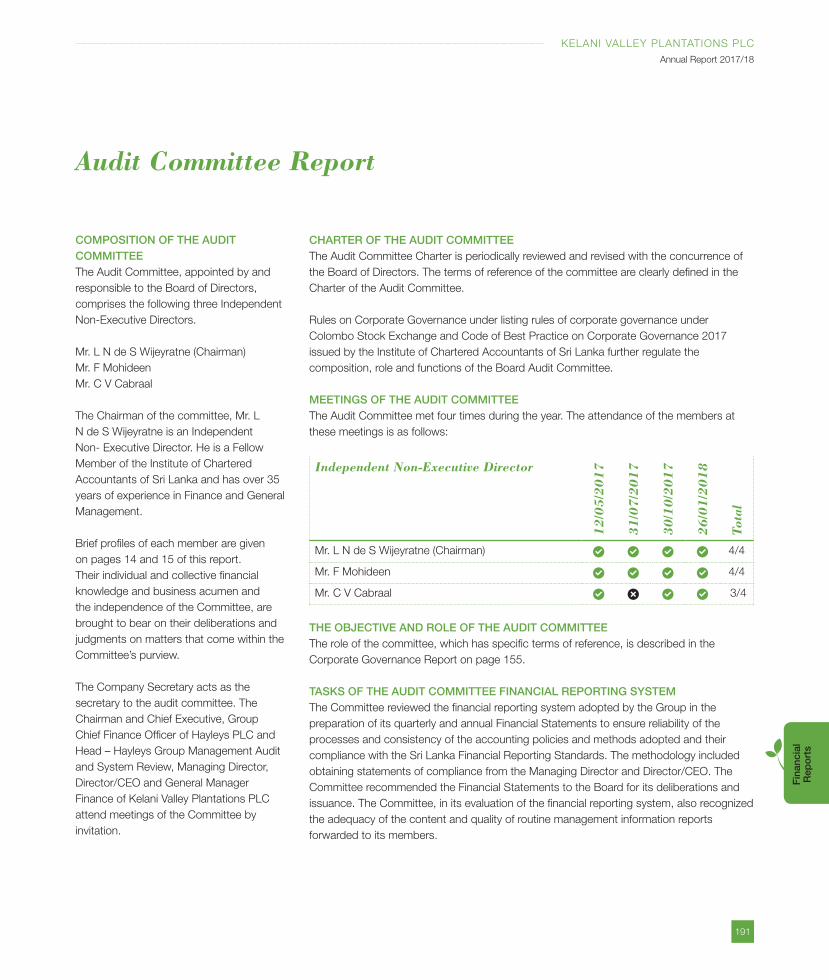
191
KELANI VALLEY PLANTATIONS PLC
Annual Report 2017/18
Fin
anci
al
Rep
ort
s
Audit Committee Report
COMPOSITION OF THE AUDIT COMMITTEEThe Audit Committee, appointed by and
responsible to the Board of Directors,
comprises the following three Independent
Non-Executive Directors.
Mr. L N de S Wijeyratne (Chairman)
Mr. F Mohideen
Mr. C V Cabraal
The Chairman of the committee, Mr. L
N de S Wijeyratne is an Independent
Non- Executive Director. He is a Fellow
Member of the Institute of Chartered
Accountants of Sri Lanka and has over 35
years of experience in Finance and General
Management.
Brief profiles of each member are given
on pages 14 and 15 of this report.
Their individual and collective financial
knowledge and business acumen and
the independence of the Committee, are
brought to bear on their deliberations and
judgments on matters that come within the
Committee’s purview.
The Company Secretary acts as the
secretary to the audit committee. The
Chairman and Chief Executive, Group
Chief Finance Officer of Hayleys PLC and
Head – Hayleys Group Management Audit
and System Review, Managing Director,
Director/CEO and General Manager
Finance of Kelani Valley Plantations PLC
attend meetings of the Committee by
invitation.
CHARTER OF THE AUDIT COMMITTEEThe Audit Committee Charter is periodically reviewed and revised with the concurrence of
the Board of Directors. The terms of reference of the committee are clearly defined in the
Charter of the Audit Committee.
Rules on Corporate Governance under listing rules of corporate governance under
Colombo Stock Exchange and Code of Best Practice on Corporate Governance 2017
issued by the Institute of Chartered Accountants of Sri Lanka further regulate the
composition, role and functions of the Board Audit Committee.
MEETINGS OF THE AUDIT COMMITTEEThe Audit Committee met four times during the year. The attendance of the members at
these meetings is as follows:
Independent Non-Executive Director
12
/05
/20
17
31
/07
/20
17
30
/10
/20
17
26
/01
/20
18
Tota
l
Mr. L N de S Wijeyratne (Chairman) 4/4
Mr. F Mohideen 4/4
Mr. C V Cabraal 3/4
THE OBJECTIVE AND ROLE OF THE AUDIT COMMITTEEThe role of the committee, which has specific terms of reference, is described in the
Corporate Governance Report on page 155.
TASKS OF THE AUDIT COMMITTEE FINANCIAL REPORTING SYSTEMThe Committee reviewed the financial reporting system adopted by the Group in the
preparation of its quarterly and annual Financial Statements to ensure reliability of the
processes and consistency of the accounting policies and methods adopted and their
compliance with the Sri Lanka Financial Reporting Standards. The methodology included
obtaining statements of compliance from the Managing Director and Director/CEO. The
Committee recommended the Financial Statements to the Board for its deliberations and
issuance. The Committee, in its evaluation of the financial reporting system, also recognized
the adequacy of the content and quality of routine management information reports
forwarded to its members.
192
KELANI VALLEY PLANTATIONS PLC
Annual Report 2017/18
INTERNAL AUDITSThe Committee reviewed the process to
assess the effectiveness of the Internal
Controls that have been designed to
provide reasonable assurance to the
Directors that assets are safeguarded
and that the financial reporting system
can be relied upon in preparation and
presentation of Financial Statements.
The Hayleys Group Management Audit
& Systems Review Department (MA &
SRD) reports on key control elements and
procedure in Group companies (that are
selected according to an annual plan) were
reviewed. Internal Audits are outsourced
wherever necessary, to leading audit
firms in line with an agreed annual audit
plan. Follow up reviews are scheduled
to ascertain that audit recommendations
are being acted upon. The Committee
appraised the independence of the
MA&SRD and other internal auditors, in the
conduct of their assignments.
The committee reviewed statements that
indicated major business risks, mitigating
actions or contemplated for management
of these risks.
EXTERNAL AUDITSThe Committee held meetings with the
External Auditors to review the nature,
approach, scope of the audit and the Audit
Management Letters of Group Companies.
Actions taken by the management in
response to the issues raised, as well as
the effectiveness of the internal controls
in place, were discussed with the heads
of business units. Remedial action was
recommended wherever necessary.
The Audit Committee has reviewed the
other services provided by the External
Auditors to the group to ensure that their
independence as External Auditors has not
been compromised.
APPOINTMENT OF EXTERNAL AUDITORSThe Audit Committee has recommended
to the Board of Directors that Messers
Ernst & Young; continue as Auditors for the
financial year ending March 31, 2019.
SUPPORT TO THE COMMITTEEThe Committee received information and
support from management during the
year to enable it to carry out its duties and
responsibilities effectively.
ETHICS AND GOOD GOVERNANCEThe committee continuously emphasized
on upholding ethical values of the staff
members. In this regard, Code of Ethics
and Whistle-Blowers Policies were put
in place and followed educating and
encouraging all members of the staff. All
appropriate procedures are in place to
conduct independent investigations into
incidents reported through whistle-blowing
or identified through other means. The
whistle-blower policy guarantees strict
confidentiality of the identity of the whistle-
blowers.
SRI LANKA ACCOUNTING STANDARDSCommittee reviewed the revised policy
decisions relating to adoption of new and
revised Sri Lanka Accounting Standards
(SLFRS/LKAS) applicable to the Group
companies and made recommendation to
the Board of Directors.
The Committee would continue to monitor
the compliance with relevant accounting
standards and keep the Board of Directors
informed at regular intervals.
The committee has pursued the support
of Messers Ernst and Young to assess and
review the existing SLFRS policies and
procedures adopted by the Group.
L N de S WijeyratneChairman
Audit Committee
09 May 2018
Audit Committee Report contd.
193
KELANI VALLEY PLANTATIONS PLC
Annual Report 2017/18
Fin
anci
al
Rep
ort
s
Related Party Transactions Review Committee Report
The Related Party Transaction review
Committee of Hayleys PLC, the Parent
Company functions as the Committee of
the Company in terms of the Section 9 of
the Listing Rules of the Colombo Stock
Exchange.
COMPOSITION OF THE COMMITTEEThe Related Party Transactions Review
Committee comprises two Independent
Non-Executive Directors and one Executive
Director and the members are as follows.
Dr. H Cabral**, PC - Chairman
Mr. M Y A Perera **
Mr. S C Ganegoda*
** Independent Non-Executive
*Executive
ATTENDANCECommittee met – 04 times during the
Financial Year 2017/18.
Meetings were held on 17 May 2017, 4
August 2017, 2 November 2017 and 7
February 2018.
Meetings
Dr. H Cabral, PC 4/4
Mr. M Y A Perera 4/4
Mr. S C Ganegoda 1/4
THE DUTIES OF THE COMMITTEETo review in advance all proposed
related party transactions of the Group
either prior to the transaction being
entered into or, if the transaction is
expressed to be conditional on such
review, prior to the completion of the
transaction.
Seek any information the Committee
requires from management,
employees or external parties to with
regard to any transaction entered into
with a related party.
Obtain knowledge or expertise to
assess all aspects of proposed related
party transactions where necessary
including obtaining appropriate
professional and expert advice from
suitably qualified persons.
To recommend, where necessary, to
the Board and obtain their approval
prior to the execution of any related
party transaction.
To monitor that all related party
transactions of the entity are
transacted on normal commercial
terms and are not prejudicial to the
interests of the entity and its minority
shareholders.
Meet with the management, Internal
Auditors/External Auditors as
necessary to carry out the assigned
duties.
To review the transfer of resources,
services or obligations between
related parties regardless of whether a
price is charged.
To review the economic and
commercial substance of both
recurrent/non recurrent related party
transactions
To monitor and recommend the
acquisition or disposal of substantial
assets between related parties,
including obtaining 'competent
independent advice' from independent
professional experts with regard to the
value of the substantial asset of the
related party transaction.
TASK OF THE COMMITTEEThe Committee reviewed the related
party transactions and their compliances
of Kelani Valley Plantations PLC and
communicated the same to the Board.
The Committee in its review process
recognised the adequately of the content
and quality of the information forwarded to
its members by the management.
Dr. Harsha Cabral, PC.Chairman
Related Party Transactions Review Committee of Hayleys PLC
16 May 2018
194
KELANI VALLEY PLANTATIONS PLC
Annual Report 2017/18
Managing Director’s and Chief Financial Officer’s Responsibility StatementThe Financial Statements of Kelani Valley
Plantations PLC and the Consolidated
Financial Statements of the Group as at 31
March, 2018 are prepared and presented
in compliance with the requirements of the
following:
Sri Lanka Accounting Standards
issued by The Institute of Charted
Accounts of Sri Lanka;
Companies Act No. 07 of 2007;
Sri Lanka Accounting and Auditing
Standards Act No. 15 of 1995;
Listing Rules of the Colombo Stock
Exchange; and
Code of Best Practice on Corporate
Governance 2017 issued by the
Institute of Chartered Accountants of
Sri Lanka.
Code of Best Practices on Related
Party Transactions issued by the
Securities and Exchange Commission
of Sri Lanka.
We confirm that the significant accounting
policies used in the preparation of the
Financial Statements are appropriate and
are constantly applied, as described in
the Notes to the Financial Statements.
The significant accounting policies and
estimates that involved a high degree of
judgment and complexity were discussed
with the Audit Committee and our External
Auditors.
We have taken measures in installing
systems of internal control and accounting
records to safeguard assets and to
prevent and detect frauds as well as other
irregularities. These have been reviewed,
evaluated and updated on an ongoing
basis. Reasonable assurance that the
established policies and procedures have
been consistently followed was provided
through periodic audits conducted by
Hayleys Group Internal Auditors (MA &
SRD) and our own staff. However, there
are inherent limitations that should be
recognised in weighing the assurances
provided by any system of internal controls
and accounting.
The Audit Committee of the Company
meets quarterly and additionally if
required with the Internal Auditors and
the Independent Auditors to review the
effectiveness of the audits, and to discuss
auditing, internal control and financial
reporting issues. The Independent Auditors
and the Internal Auditors have full and free
access to the Audit Committee to discuss
any matter of substance.
The Financial Statements were audited
by Messrs Ernst & Young, Charted
Accountants, the Independent External
Auditors. Their report is given on page 195
to 197 of the Annual Report.
The Audit Committee reviews the audit
and non-audit services provided by the
External Auditor, in order to ensure that the
provision of such services does not impair
their independence.
We confirm that:
The Company and its subsidiaries
have complied with all applicable
laws, regulations and prudential
requirements:
There are no non-compliances: and
There is no material litigation that is
pending against the Group.
Roshan RajaduraiManaging Director
Sarath SiriwardanaDirector/Chief Executive Officer/Chief
Financial Officer
09 May 2018
195
KELANI VALLEY PLANTATIONS PLC
Annual Report 2017/18
Fin
anci
al
Rep
ort
s
Independent Auditors’ Report
BW/CSW/BHNJ
INDEPENDENT AUDITORS’ REPORT TO THE SHAREHOLDERS OF KELANI VALLEY PLANTATIONS PLCOpinionWe have audited the financial statements of
Kelani Valley Plantations PLC (“the Company”)
and the consolidated financial statements
of the Company and its subsidiaries (“the
Group”), which comprise the statement of
financial position as at March 31, 2018, and
the statement of profit or loss, statement of
comprehensive income, statement of changes
in equity and statement of cash flows for the
year then ended, and notes to the financial
statements, including a summary of significant
accounting policies.
In our opinion, the accompanying financial
statements of the Company and the Group
give a true and fair view of the financial
position of the Company and the Group as
at March 31, 2018, and of their financial
performance and cash flows for the year
then ended in accordance with Sri Lanka
Accounting Standards.
Basis for opinionWe conducted our audit in accordance with
Sri Lanka Auditing Standards (SLAuSs).
Our responsibilities under those standards
are further described in the Auditor’s
responsibilities for the audit of the financial
statements section of our report. We are
independent of the Group in accordance with
the Code of Ethics issued by CA Sri Lanka
(Code of Ethics) and we have fulfilled our
other ethical responsibilities in accordance
with the Code of Ethics. We believe that the
audit evidence we have obtained is sufficient
and appropriate to provide a basis for our
opinion.
Key audit mattersKey audit matters are those matters that,
in our professional judgment, were of most
significance in our audit of the financial
statements of the current period. These
matters were addressed in the context of
our audit of the financial statements as a
whole, and in forming our opinion thereon,
and we do not provide a separate opinion on
these matters. For each matter below, our
description of how our audit addressed the
matter is provided in that context.
We have fulfilled the responsibilities
described in the Auditor’s responsibilities
for the audit of the financial statements
section of our report, including in relation
to these matters. Accordingly, our audit
included the performance of procedures
designed to respond to our assessment
of the risks of material misstatement of
the financial statements. The results of our
audit procedures, including the procedures
performed to address the matters below,
provide the basis for our audit opinion on the
accompanying financial statements.
196
KELANI VALLEY PLANTATIONS PLC
Annual Report 2017/18
Key audit matter How our audit addressed the key audit matter
Retirement Benefit Obligation
The retirement benefit obligation of
the Group is significant (Rs.917 Mn) in
the context of the total liabilities of the
Group. The valuation of the Group's
retirement benefit obligation requires
significant judgment and estimation
to be applied across numerous
assumptions, including salary increases
and discount rate. Small changes
in those assumptions could have
a significant effect on the financial
performance and financial position
of the Group. Accordingly, actuarial
valuation of retirement benefit obligation
is considered to be a key audit matter.
We evaluated the assumptions made in
relation to the actuarial valuation of the
retirement benefit obligation. In particular:
We assessed the assumption for salary
increases against the group’s historic
trend and expected future outlook.
We agreed the discount rate used, to our
internally developed benchmarks.
We validated the key data used by the
actuary to the underlying data held by the
Group.
We evaluated the adequacy of the related
disclosures given in Note 25 in the financial
statements.
Other information included in The Company’s 2018 Annual ReportOther information consists of the information included in the Annual Report, other than the
financial statements and our auditor’s report thereon. Management is responsible for the other
information. Our opinion on the financial statements does not cover the other information and we
do not express any form of assurance conclusion thereon.
In connection with our audit of the financial statements, our responsibility is to read the other information
and, in doing so, consider whether the other information is materially inconsistent with the financial
statements or our knowledge obtained in the audit or otherwise appears to be materially misstated. If,
based on the work we have performed, we conclude that there is a material misstatement of this other
information, we are required to report that fact. We have nothing to report in this regard.
Responsibilities of management and those charged with governance for the financial statementsManagement is responsible for the preparation of financial statements that give a true and
fair view in accordance with Sri Lanka Accounting Standards, and for such internal control as
management determines is necessary to enable the preparation of financial statements that are
free from material misstatement, whether due to fraud or error.
In preparing the financial statements,
management is responsible for assessing
the Group’s ability to continue as a going
concern, disclosing, as applicable, matters
related to going concern and using the
going concern basis of accounting unless
management either intends to liquidate the
Group or to cease operations, or has no
realistic alternative but to do so.
Those charged with governance are
responsible for overseeing the Company’s
and the Group’s financial reporting process.
Auditor’s responsibilities for the audit of the financial statementsOur objectives are to obtain reasonable
assurance about whether the financial
statements as a whole are free from material
misstatement, whether due to fraud or
error, and to issue an auditor’s report that
includes our opinion. Reasonable assurance
is a high level of assurance, but is not
a guarantee that an audit conducted in
accordance with SLAuSs will always detect
a material misstatement when it exists.
Misstatements can arise from fraud or error
and are considered material if, individually or
in the aggregate, they could reasonably be
expected to influence the economic decisions
of users taken on the basis of these financial
statements.
As part of an audit in accordance with
SLAuSs, we exercise professional judgment
and maintain professional skepticism
throughout the audit. We also:
Independent Auditors’ Report Contd.
197
KELANI VALLEY PLANTATIONS PLC
Annual Report 2017/18
Fin
anci
al
Rep
ort
s
Identify and assess the risks of material
misstatement of the financial statements,
whether due to fraud or error, design and
perform audit procedures responsive to
those risks, and obtain audit evidence
that is sufficient and appropriate to
provide a basis for our opinion. The risk
of not detecting a material misstatement
resulting from fraud is higher than for one
resulting from error, as fraud may involve
collusion, forgery, intentional omissions,
misrepresentations, or the override of
internal control.
Obtain an understanding of internal
control relevant to the audit in order
to design audit procedures that are
appropriate in the circumstances, but not
for the purpose of expressing an opinion
on the effectiveness of the internal
controls of the Company and the Group.
Evaluate the appropriateness of accounting
policies used and the reasonableness
of accounting estimates and related
disclosures made by management.
Conclude on the appropriateness of
management’s use of the going concern
basis of accounting and, based on
the audit evidence obtained, whether
a material uncertainty exists related
to events or conditions that may cast
significant doubt on the Group’s ability
to continue as a going concern. If we
conclude that a material uncertainty
exists, we are required to draw attention
in our auditor’s report to the related
disclosures in the financial statements
or, if such disclosures are inadequate, to
modify our opinion. Our conclusions are
based on the audit evidence obtained
up to the date of our auditor’s report.
However, future events or conditions
may cause the Group to cease to
continue as a going concern.
Evaluate the overall presentation, structure
and content of the financial statements,
including the disclosures, and whether the
financial statements represent the underlying
transactions and events in a manner that
achieves fair presentation.
Obtain sufficient appropriate audit
evidence regarding the financial
information of the entities or business
activities within the Group to express
an opinion on the consolidated financial
statements. We are responsible for the
direction, supervision and performance
of the group audit. We remain solely
responsible for our audit opinion.
We communicate with those charged with
governance regarding, among other matters,
the planned scope and timing of the audit
and significant audit findings, including any
significant deficiencies in internal control that
we identify during our audit.
We also provide those charged with
governance with a statement that we
have complied with ethical requirements in
accordance with the Code of Ethics regarding
independence, and to communicate with
them all relationships and other matters that
may reasonably be thought to bear on our
independence, and where applicable, related
safeguards.
From the matters communicated with those
charged with governance, we determine those
matters that were of most significance in the
audit of the financial statements of the current
period and are therefore the key audit matters.
We describe these matters in our auditor’s
report unless law or regulation precludes public
disclosure about the matter or when, in extremely
rare circumstances, we determine that a matter
should not be communicated in our report
because the adverse consequences of doing so
would reasonably be expected to outweigh the
public interest benefits of such communication.
Report on other legal and regulatory requirementsAs required by section 163 (2) of the
Companies Act No. 07 of 2007, we have
obtained all the information and explanations
that were required for the audit and, as far
as appears from our examination, proper
accounting records have been kept by the
Company.
CA Sri Lanka membership number of the
engagement partner responsible for signing
this independent auditor’s report is M-2440.
Ernst & YoungCharted Accountants
09 May 2018
Colombo

198
KELANI VALLEY PLANTATIONS PLC
Annual Report 2017/18
Statement of Profit or Loss
Group CompanyFor the year ended 31 March, 2017/18 2016/17 2017/18 2016/17 Notes Rs. ’000 Rs. ’000 Rs. ’000 Rs. ’000
Revenue 6.1 8,642,220 6,852,262 4,382,866 3,436,658
Cost of sales (7,550,537) (6,234,523) (3,739,560) (3,143,093)
Gross profit 6.2 1,091,683 617,739 643,306 293,565
Gain on change in fair value of biological assets 14.2.1 11,332 26,517 11,332 26,517
Other income 7 114,374 116,151 166,678 140,750
Administrative expenses (556,078) (439,472) (331,179) (266,843)
Distribution expenses (81,774) (74,203) - -
Results from operating activities 579,537 246,732 490,137 193,989
Finance income 8.1 3,693 7,594 3,158 1,912
Finance expenses 8.2 (96,671) (92,365) (73,967) (77,949)
Interest paid to Government on finance lease 8.3 (71,080) (68,999) (71,080) (68,999)
Net finance cost 8 (164,058) (153,770) (141,889) (145,036)
Share of profit from equity accounted investee 15.1 (212,992) (80,488) - -
Profit before tax 9 202,487 12,474 348,248 48,953
Tax expense 10.1 (42,065) (27,823) (22,068) (10,123)
Profit/(loss) for the year 160,422 (15,349) 326,180 38,830
Attributable to:Equity holders of the Parent 155,190 (18,733) 326,180 38,830
Non-controlling interest 5,232 3,384 - -
Profit/(loss) for the year 160,422 (15,349) 326,180 38,830
Earnings per ShareBasic earnings per share (Rs.) 11.1 (A) 4.56 (0.55) 9.59 1.14
Diluted earnings per share (Rs.) 11.1 (B) 4.56 (0.55) 9.59 1.14
Dividend per Share (Rs.) 11.2 - - 1.00 -
Figures in brackets indicate deductions.
Notes to the Financial Statements from pages 206 to 271 form an integral part of these Financial Statements.
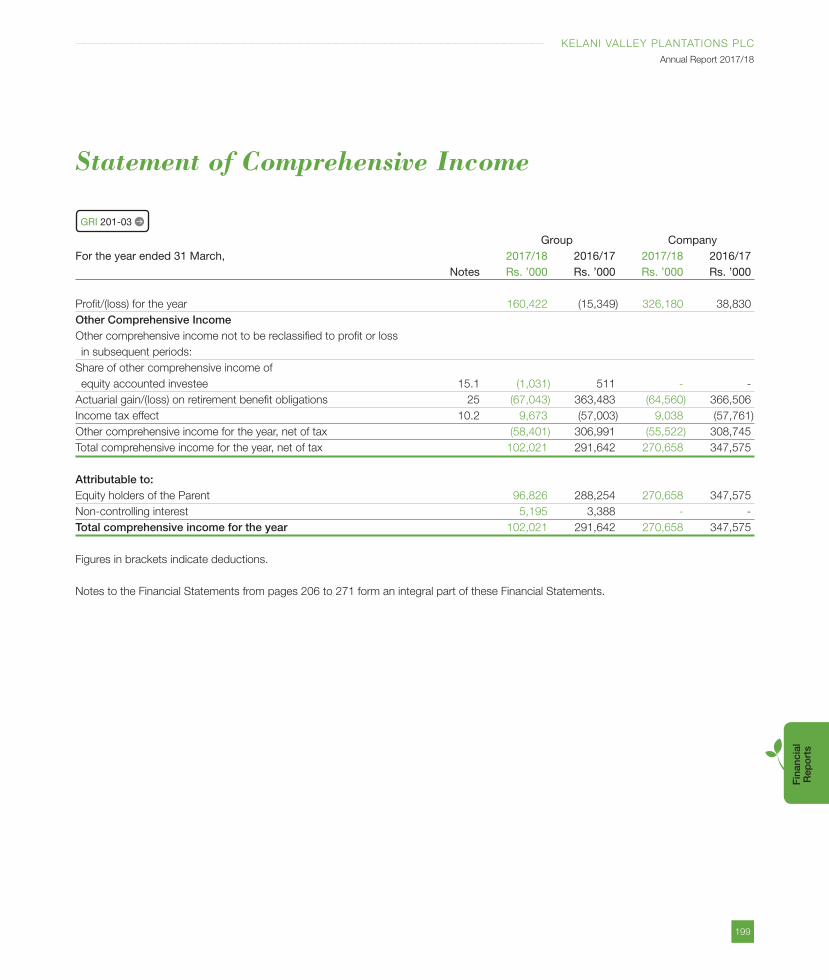
199
KELANI VALLEY PLANTATIONS PLC
Annual Report 2017/18
Fin
anci
al
Rep
ort
s
Statement of Comprehensive Income
Group CompanyFor the year ended 31 March, 2017/18 2016/17 2017/18 2016/17 Notes Rs. ’000 Rs. ’000 Rs. ’000 Rs. ’000
Profit/(loss) for the year 160,422 (15,349) 326,180 38,830
Other Comprehensive Income Other comprehensive income not to be reclassified to profit or loss
in subsequent periods:
Share of other comprehensive income of
equity accounted investee 15.1 (1,031) 511 - -
Actuarial gain/(loss) on retirement benefit obligations 25 (67,043) 363,483 (64,560) 366,506
Income tax effect 10.2 9,673 (57,003) 9,038 (57,761)
Other comprehensive income for the year, net of tax (58,401) 306,991 (55,522) 308,745
Total comprehensive income for the year, net of tax 102,021 291,642 270,658 347,575
Attributable to:Equity holders of the Parent 96,826 288,254 270,658 347,575
Non-controlling interest 5,195 3,388 - -
Total comprehensive income for the year 102,021 291,642 270,658 347,575
Figures in brackets indicate deductions.
Notes to the Financial Statements from pages 206 to 271 form an integral part of these Financial Statements.
GRI 201-03
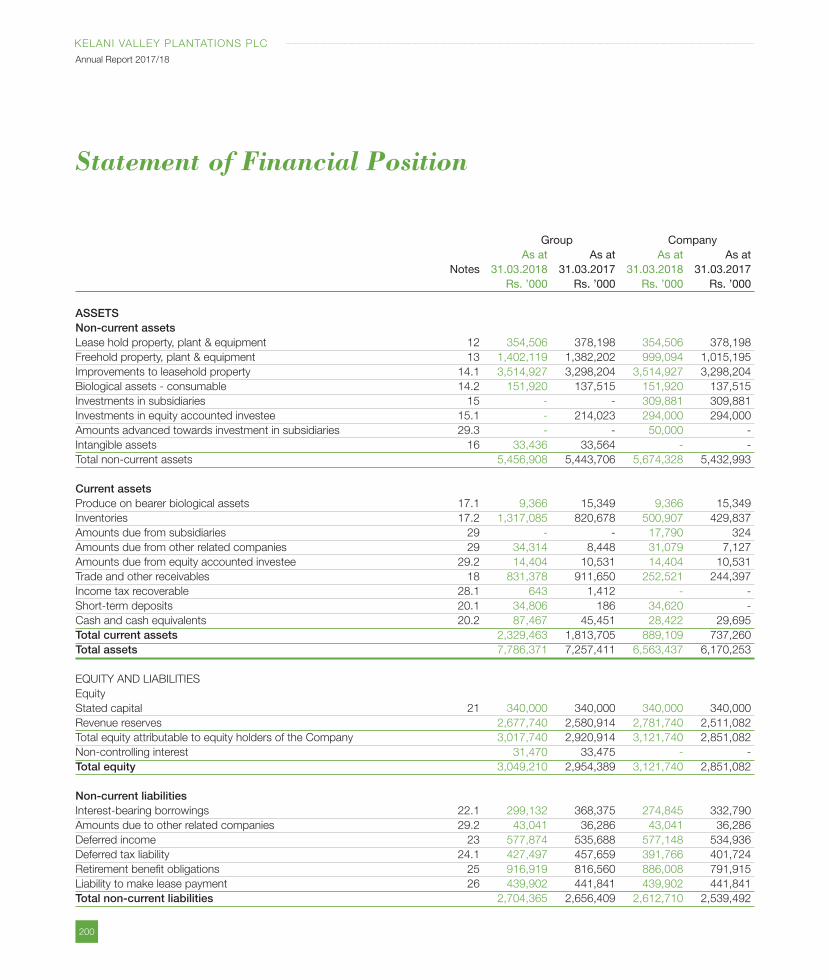
200
KELANI VALLEY PLANTATIONS PLC
Annual Report 2017/18
Statement of Financial Position
Group Company As at As at As at As at Notes 31.03.2018 31.03.2017 31.03.2018 31.03.2017 Rs. ’000 Rs. ’000 Rs. ’000 Rs. ’000
ASSETSNon-current assetsLease hold property, plant & equipment 12 354,506 378,198 354,506 378,198
Freehold property, plant & equipment 13 1,402,119 1,382,202 999,094 1,015,195
Improvements to leasehold property 14.1 3,514,927 3,298,204 3,514,927 3,298,204
Biological assets - consumable 14.2 151,920 137,515 151,920 137,515
Investments in subsidiaries 15 - - 309,881 309,881
Investments in equity accounted investee 15.1 - 214,023 294,000 294,000
Amounts advanced towards investment in subsidiaries 29.3 - - 50,000 -
Intangible assets 16 33,436 33,564 - -
Total non-current assets 5,456,908 5,443,706 5,674,328 5,432,993
Current assetsProduce on bearer biological assets 17.1 9,366 15,349 9,366 15,349
Inventories 17.2 1,317,085 820,678 500,907 429,837
Amounts due from subsidiaries 29 - - 17,790 324
Amounts due from other related companies 29 34,314 8,448 31,079 7,127
Amounts due from equity accounted investee 29.2 14,404 10,531 14,404 10,531
Trade and other receivables 18 831,378 911,650 252,521 244,397
Income tax recoverable 28.1 643 1,412 - -
Short-term deposits 20.1 34,806 186 34,620 -
Cash and cash equivalents 20.2 87,467 45,451 28,422 29,695
Total current assets 2,329,463 1,813,705 889,109 737,260
Total assets 7,786,371 7,257,411 6,563,437 6,170,253
EQUITY AND LIABILITIES
Equity
Stated capital 21 340,000 340,000 340,000 340,000
Revenue reserves 2,677,740 2,580,914 2,781,740 2,511,082
Total equity attributable to equity holders of the Company 3,017,740 2,920,914 3,121,740 2,851,082
Non-controlling interest 31,470 33,475 - -
Total equity 3,049,210 2,954,389 3,121,740 2,851,082
Non-current liabilitiesInterest-bearing borrowings 22.1 299,132 368,375 274,845 332,790
Amounts due to other related companies 29.2 43,041 36,286 43,041 36,286
Deferred income 23 577,874 535,688 577,148 534,936
Deferred tax liability 24.1 427,497 457,659 391,766 401,724
Retirement benefit obligations 25 916,919 816,560 886,008 791,915
Liability to make lease payment 26 439,902 441,841 439,902 441,841
Total non-current liabilities 2,704,365 2,656,409 2,612,710 2,539,492
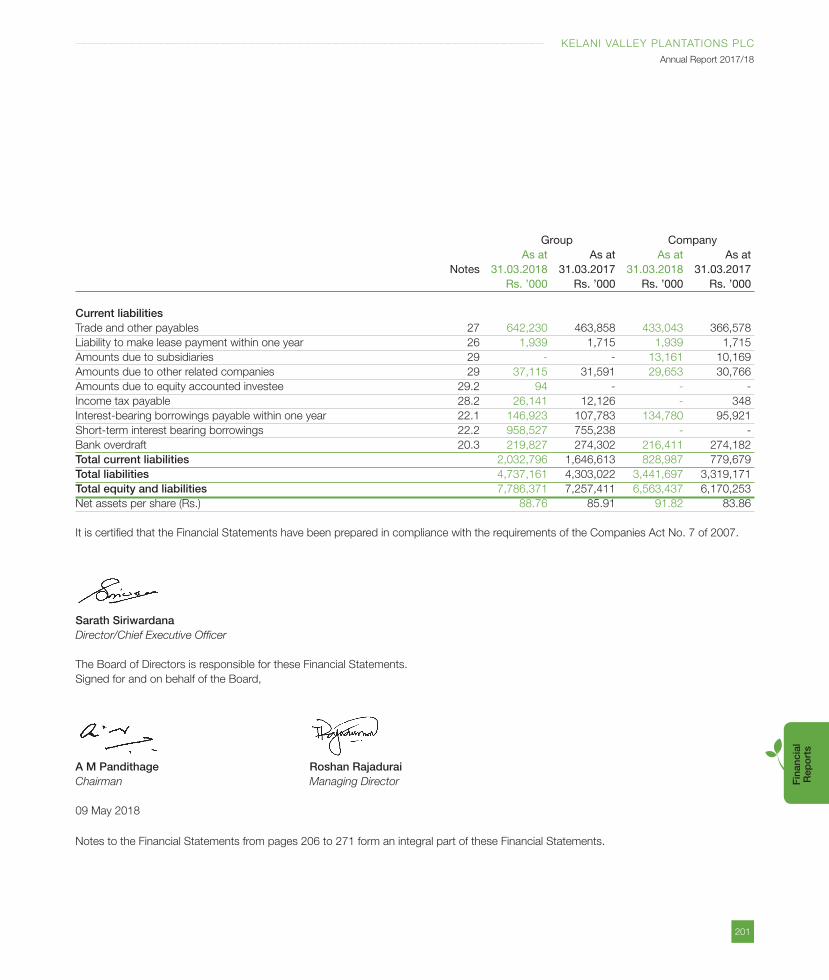
201
KELANI VALLEY PLANTATIONS PLC
Annual Report 2017/18
Fin
anci
al
Rep
ort
s
Group Company As at As at As at As at Notes 31.03.2018 31.03.2017 31.03.2018 31.03.2017 Rs. ’000 Rs. ’000 Rs. ’000 Rs. ’000
Current liabilitiesTrade and other payables 27 642,230 463,858 433,043 366,578
Liability to make lease payment within one year 26 1,939 1,715 1,939 1,715
Amounts due to subsidiaries 29 - - 13,161 10,169
Amounts due to other related companies 29 37,115 31,591 29,653 30,766
Amounts due to equity accounted investee 29.2 94 - - -
Income tax payable 28.2 26,141 12,126 - 348
Interest-bearing borrowings payable within one year 22.1 146,923 107,783 134,780 95,921
Short-term interest bearing borrowings 22.2 958,527 755,238 - -
Bank overdraft 20.3 219,827 274,302 216,411 274,182
Total current liabilities 2,032,796 1,646,613 828,987 779,679
Total liabilities 4,737,161 4,303,022 3,441,697 3,319,171
Total equity and liabilities 7,786,371 7,257,411 6,563,437 6,170,253
Net assets per share (Rs.) 88.76 85.91 91.82 83.86
It is certified that the Financial Statements have been prepared in compliance with the requirements of the Companies Act No. 7 of 2007.
Sarath SiriwardanaDirector/Chief Executive Officer
The Board of Directors is responsible for these Financial Statements.
Signed for and on behalf of the Board,
A M Pandithage Roshan RajaduraiChairman Managing Director
09 May 2018
Notes to the Financial Statements from pages 206 to 271 form an integral part of these Financial Statements.
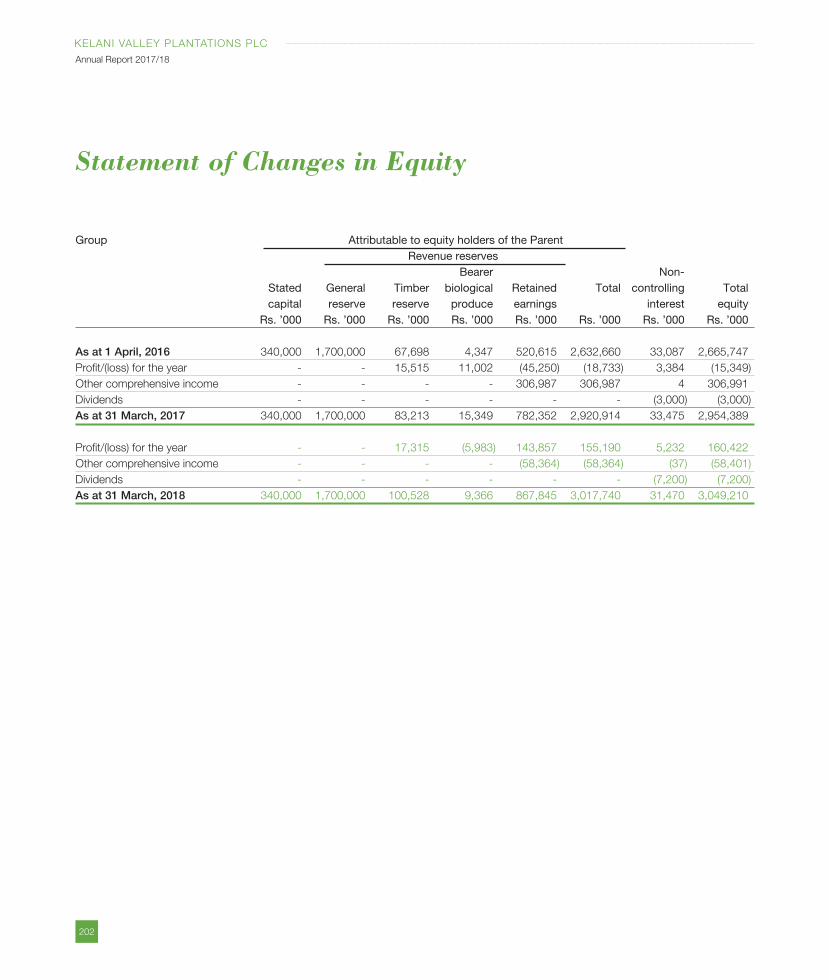
202
KELANI VALLEY PLANTATIONS PLC
Annual Report 2017/18
Statement of Changes in Equity
Group Attributable to equity holders of the Parent Revenue reserves Bearer Non- Stated General Timber biological Retained Total controlling Total capital reserve reserve produce earnings interest equity Rs. ’000 Rs. ’000 Rs. ’000 Rs. ’000 Rs. ’000 Rs. ’000 Rs. ’000 Rs. ’000
As at 1 April, 2016 340,000 1,700,000 67,698 4,347 520,615 2,632,660 33,087 2,665,747
Profit/(loss) for the year - - 15,515 11,002 (45,250) (18,733) 3,384 (15,349)
Other comprehensive income - - - - 306,987 306,987 4 306,991
Dividends - - - - - - (3,000) (3,000)
As at 31 March, 2017 340,000 1,700,000 83,213 15,349 782,352 2,920,914 33,475 2,954,389
Profit/(loss) for the year - - 17,315 (5,983) 143,857 155,190 5,232 160,422
Other comprehensive income - - - - (58,364) (58,364) (37) (58,401)
Dividends - - - - - - (7,200) (7,200)
As at 31 March, 2018 340,000 1,700,000 100,528 9,366 867,845 3,017,740 31,470 3,049,210
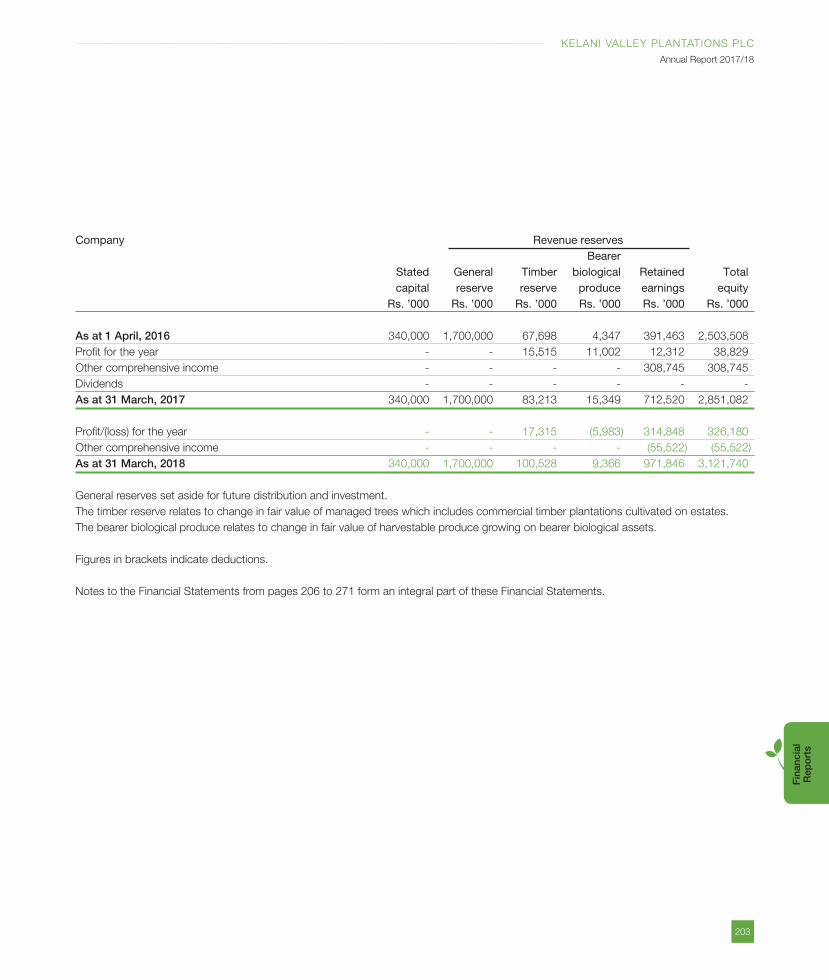
203
KELANI VALLEY PLANTATIONS PLC
Annual Report 2017/18
Fin
anci
al
Rep
ort
s
Company Revenue reserves Bearer Stated General Timber biological Retained Total capital reserve reserve produce earnings equity Rs. ’000 Rs. ’000 Rs. ’000 Rs. ’000 Rs. ’000 Rs. ’000
As at 1 April, 2016 340,000 1,700,000 67,698 4,347 391,463 2,503,508
Profit for the year - - 15,515 11,002 12,312 38,829
Other comprehensive income - - - - 308,745 308,745
Dividends - - - - - -
As at 31 March, 2017 340,000 1,700,000 83,213 15,349 712,520 2,851,082
Profit/(loss) for the year - - 17,315 (5,983) 314,848 326,180
Other comprehensive income - - - - (55,522) (55,522)
As at 31 March, 2018 340,000 1,700,000 100,528 9,366 971,846 3,121,740
General reserves set aside for future distribution and investment.
The timber reserve relates to change in fair value of managed trees which includes commercial timber plantations cultivated on estates.
The bearer biological produce relates to change in fair value of harvestable produce growing on bearer biological assets.
Figures in brackets indicate deductions.
Notes to the Financial Statements from pages 206 to 271 form an integral part of these Financial Statements.
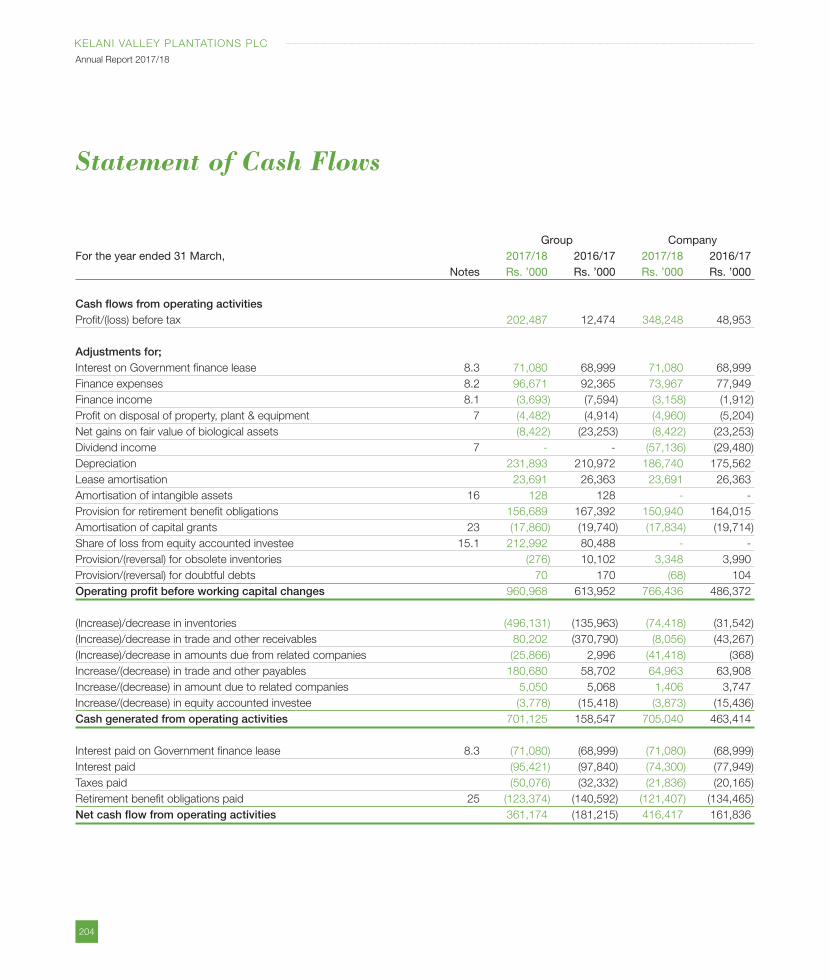
204
KELANI VALLEY PLANTATIONS PLC
Annual Report 2017/18
Statement of Cash Flows
Group CompanyFor the year ended 31 March, 2017/18 2016/17 2017/18 2016/17 Notes Rs. ’000 Rs. ’000 Rs. ’000 Rs. ’000
Cash flows from operating activitiesProfit/(loss) before tax 202,487 12,474 348,248 48,953
Adjustments for;Interest on Government finance lease 8.3 71,080 68,999 71,080 68,999
Finance expenses 8.2 96,671 92,365 73,967 77,949
Finance income 8.1 (3,693) (7,594) (3,158) (1,912)
Profit on disposal of property, plant & equipment 7 (4,482) (4,914) (4,960) (5,204)
Net gains on fair value of biological assets (8,422) (23,253) (8,422) (23,253)
Dividend income 7 - - (57,136) (29,480)
Depreciation 231,893 210,972 186,740 175,562
Lease amortisation 23,691 26,363 23,691 26,363
Amortisation of intangible assets 16 128 128 - -
Provision for retirement benefit obligations 156,689 167,392 150,940 164,015
Amortisation of capital grants 23 (17,860) (19,740) (17,834) (19,714)
Share of loss from equity accounted investee 15.1 212,992 80,488 - -
Provision/(reversal) for obsolete inventories (276) 10,102 3,348 3,990
Provision/(reversal) for doubtful debts 70 170 (68) 104
Operating profit before working capital changes 960,968 613,952 766,436 486,372
(Increase)/decrease in inventories (496,131) (135,963) (74,418) (31,542)
(Increase)/decrease in trade and other receivables 80,202 (370,790) (8,056) (43,267)
(Increase)/decrease in amounts due from related companies (25,866) 2,996 (41,418) (368)
Increase/(decrease) in trade and other payables 180,680 58,702 64,963 63,908
Increase/(decrease) in amount due to related companies 5,050 5,068 1,406 3,747
Increase/(decrease) in equity accounted investee (3,778) (15,418) (3,873) (15,436)
Cash generated from operating activities 701,125 158,547 705,040 463,414
Interest paid on Government finance lease 8.3 (71,080) (68,999) (71,080) (68,999)
Interest paid (95,421) (97,840) (74,300) (77,949)
Taxes paid (50,076) (32,332) (21,836) (20,165)
Retirement benefit obligations paid 25 (123,374) (140,592) (121,407) (134,465)
Net cash flow from operating activities 361,174 (181,215) 416,417 161,836
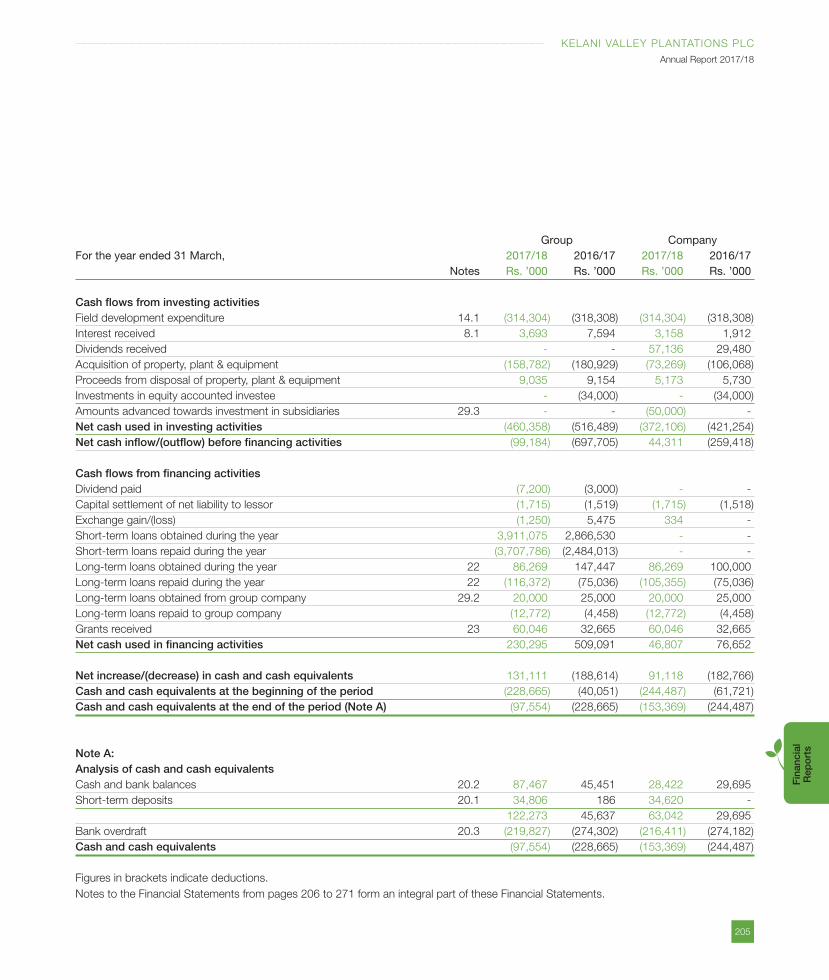
205
KELANI VALLEY PLANTATIONS PLC
Annual Report 2017/18
Fin
anci
al
Rep
ort
s
Group CompanyFor the year ended 31 March, 2017/18 2016/17 2017/18 2016/17 Notes Rs. ’000 Rs. ’000 Rs. ’000 Rs. ’000
Cash flows from investing activitiesField development expenditure 14.1 (314,304) (318,308) (314,304) (318,308)
Interest received 8.1 3,693 7,594 3,158 1,912
Dividends received - - 57,136 29,480
Acquisition of property, plant & equipment (158,782) (180,929) (73,269) (106,068)
Proceeds from disposal of property, plant & equipment 9,035 9,154 5,173 5,730
Investments in equity accounted investee - (34,000) - (34,000)
Amounts advanced towards investment in subsidiaries 29.3 - - (50,000) -
Net cash used in investing activities (460,358) (516,489) (372,106) (421,254)
Net cash inflow/(outflow) before financing activities (99,184) (697,705) 44,311 (259,418)
Cash flows from financing activitiesDividend paid (7,200) (3,000) - -
Capital settlement of net liability to lessor (1,715) (1,519) (1,715) (1,518)
Exchange gain/(loss) (1,250) 5,475 334 -
Short-term loans obtained during the year 3,911,075 2,866,530 - -
Short-term loans repaid during the year (3,707,786) (2,484,013) - -
Long-term loans obtained during the year 22 86,269 147,447 86,269 100,000
Long-term loans repaid during the year 22 (116,372) (75,036) (105,355) (75,036)
Long-term loans obtained from group company 29.2 20,000 25,000 20,000 25,000
Long-term loans repaid to group company (12,772) (4,458) (12,772) (4,458)
Grants received 23 60,046 32,665 60,046 32,665
Net cash used in financing activities 230,295 509,091 46,807 76,652
Net increase/(decrease) in cash and cash equivalents 131,111 (188,614) 91,118 (182,766)
Cash and cash equivalents at the beginning of the period (228,665) (40,051) (244,487) (61,721)
Cash and cash equivalents at the end of the period (Note A) (97,554) (228,665) (153,369) (244,487)
Note A: Analysis of cash and cash equivalentsCash and bank balances 20.2 87,467 45,451 28,422 29,695
Short-term deposits 20.1 34,806 186 34,620 -
122,273 45,637 63,042 29,695
Bank overdraft 20.3 (219,827) (274,302) (216,411) (274,182)
Cash and cash equivalents (97,554) (228,665) (153,369) (244,487)
Figures in brackets indicate deductions.
Notes to the Financial Statements from pages 206 to 271 form an integral part of these Financial Statements.
206
KELANI VALLEY PLANTATIONS PLC
Annual Report 2017/18
1. REPORTING ENTITYKelani Valley Plantations PLC was
incorporated on 18th June, 1992 under
the Companies Act No. 17 of 1982 (The
Company was re-registered under the
Companies Act No. 07 of 2007) in terms
of the provisions of the Conversion of
Public Corporation and Government-
Owned Business Undertakings into Public
Companies under Public Companies Act
No. 23 of 1987.
The registered office of the Company is
located at No 400, Deans Road, Colombo
10, and Plantations are situated in the
planting districts of Nuwara Eliya, Hatton
and Yatiyantota.
The ordinary shares of the Company are
listed on the Colombo Stock Exchange of
Sri Lanka.
All companies in the Group are limited
liability companies incorporated and
domiciled in Sri Lanka.
The Consolidated Financial Statements of
Kelani Valley Plantations PLC., as at and for
the year ended 31 March, 2018 comprise
the Company and its Subsidiaries namely,
Kalupahana Power Company (Pvt.) Ltd.
(“KPC”), Kelani Valley Instant Tea (Pvt.) Ltd.
(“KVIT”), Mabroc Teas (Pvt.) Ltd. (“MTPL”),
Kelani Valley Resorts (Pvt.) Ltd. (“KVRL”)
and the Group’s interest in Equity Account
Investees, Hayleys Global Beverages (Pvt.)
Limited (“HGBL”) (together referred to as the
‘Group’).
The Financial Statements of all companies
in the Group are prepared for a common
financial year, which ends on 31st March.
1.1 Principal Activities and nature of the operationsDuring the year, the principal activities of the Company were the producing and processing
of Tea and Rubber.
Principle activities of other companies in the Group are as follows.
Company Nature of the business/Principal place of business
Kalupahana Power Company (Pvt) Ltd Generating Hydropower/Kalupahana Estate,
Bulathkohupitiya
Kelani Valley Instant Tea (Pvt) Ltd Manufacture of Ready-To-Drink Tea Powder/
Nuwara Eliya Estate, Labukelle
Mabroc Teas (Pvt) Ltd Export of bulk and retail packed Tea/No.57/3
New Hunupitiya Road, Kiribathgoda
Kelani Valley Resorts (Pvt) Ltd Provide services in the hospitality industry/
Oliphant Estate, Nuwara Eliya
Hayleys Global Beverages (Pvt) Limited Manufacturing Instant Tea and Tea Extracts/
Blinkbonnie Estate, Dickoya
1.2 Holding CompanyThe Company is a subsidiary of DPL Plantations (Pvt) Ltd., which is a wholly-owned
subsidiary of Dipped Products PLC, whose ultimate Parent enterprise is Hayleys PLC.
1.3 Date of Authorization for issue.The Financial Statements of Kelani Valley Plantations PLC for the period ended 31 March 2018,
were authorised for issue in accordance with a resolution of the Board of Directors on 09 May 2018.
1.4 Responsibility for Financial Statements.The responsibility of the Directors in relation to the Financial Statements is set out in the
Statement of Directors’ Responsibility Report in the Annual Report.
2. BASIS OF PREPERATION2.1 Statement of ComplianceThe Financial Statements of the Company and the Group which comprise the Statement of Profit
or Loss, Statement of Comprehensive Income, Statement of Financial Position, Statement of
Changes in Equity, Statement of Cash Flows together with Accounting Policies and Notes to the
Financial Statements (“the Consolidated Financial Statements”) have been prepared in accordance
with Sri Lanka Accounting and Auditing Standards Act No. 15 of 1995, which requires compliance
with Sri Lanka Accounting Standards promulgated by The Institute of Chartered Accountants of Sri
Lanka (CASL), and with the requirements of the Companies Act No. 07 of 2007.
Notes to the Financial Statements
207
KELANI VALLEY PLANTATIONS PLC
Annual Report 2017/18
Fin
anci
al
Rep
ort
s
2.2 Basis of MeasurementThese Consolidated Financial Statements
have been prepared in accordance with the
historical cost convention other than the
following items in the Financial Statements.
Managed consumable biological
assets are measured at fair value
Where appropriate, the specific policies are
explained in the succeeding Notes.
No adjustments have been made for
inflationary factors in the Consolidated
Financial Statements.
2.3 Functional and Presentation Currency
The Financial Statements are presented
in Sri Lankan Rupees (Rs.), which is
the Group’s functional and presentation
currency. All financial information presented
in Sri Lankan Rupees has been given to the
nearest thousand, unless stated otherwise.
2.4 Materiality and AggregationEach material class of similar items is
presented separately in the Consolidated
Financial Statements. Items of a dissimilar
nature or function are presented separately
unless they are immaterial.
3 SUMMARY OF SIGNIFICANT ACCOUNTING POLICIES
The accounting policies set out below are
consistent with those used in the previous
year. Accounting policies of subsidiaries
have been changed where necessary
to ensure consistency with the policies
adopted by the Group.
3.1 Going ConcernThe Consolidated Financial Statements
have been prepared on the assumption
that the Company is a going concern.
The Directors have made an assessment
of the Group’s ability to continue as a
going concern in the foreseeable future.
Furthermore, the board is not aware of
any material uncertainties that may cast
significant doubt upon the Group’s ability
to continue as going concern and they
do not intend either to liquidate or to
cease operations of the Group. Therefore,
the Consolidated Financial Statements
continue to be prepared on the going
concern basis.
3.2 Basis of ConsolidationThe Consolidated Financial Statements
comprise the Financial Statements of the
Group and its subsidiaries as at 31 March
2018. Subsidiaries are those entities
controlled by the Group. Control is achieved
when the Group is exposed, or has rights,
to variable returns from its involvement with
the investee and has the ability to affect
those returns through its power over the
investee. Specifically, the Group controls an
investee if, and only if, the Group has:
Power over the investee (i.e., existing
rights that give it the current ability
to direct the relevant activities of the
investee)
Exposure, or rights, to variable returns
from its involvement with the investee
The ability to use its power over the
investee to affect its returns
Generally, there is a presumption that a
majority of voting rights result in control.
To support this presumption and when
the Group has less than a majority of the
voting or similar rights of an investee, the
Group considers all relevant facts and
circumstances in assessing whether it has
power over an investee, including:
The contractual arrangement with the
other vote holders of the investee
Rights arising from other contractual
arrangements
The Group’s voting rights and potential
voting rights
The Group re-assesses whether or
not it controls an investee if facts and
circumstances indicate that there are
changes to one or more of the three
elements of control. Consolidation of
a subsidiary begins when the Group
obtains control over the subsidiary and
ceases when the Group loses control of
the subsidiary. Assets, liabilities, income
and expenses of a subsidiary acquired or
disposed of during the year are included
in the Consolidated Financial Statements
from the date the Group gains control until
the date the Group ceases to control the
subsidiary.
Profit or loss and each component of Other
Comprehensive Income (OCI) are attributed
to the equity holders of the parent of the
Group and to the non-controlling interests,
even if this results in the non-controlling
interests having a deficit balance. When
necessary, adjustments are made to the
Financial Statements of subsidiaries to
bring their accounting policies into line
with the Group’s accounting policies. All
intra-group assets and liabilities, equity,
208
KELANI VALLEY PLANTATIONS PLC
Annual Report 2017/18
income, expenses and cash flows relating
to transactions between members
of the Group are eliminated in full on
consolidation.
A change in the ownership interest of a
subsidiary, without a loss of control, is
accounted for as an equity transaction.
If the Group loses control over a subsidiary,
it derecognises the related assets (including
goodwill), liabilities, non-controlling interest
and other components of equity while
any resultant gain or loss is recognised in
profit or loss. Any investment retained is
recognised at fair value.
3.2.1 Business Combinations and Goodwill
Business combinations are accounted
for using the acquisition method. The
cost of an acquisition is measured as the
aggregate of the consideration transferred,
measured at acquisition date fair value
and the amount of any Non-Controlling
Interest in the acquiree. For each business
combination, the Group elects whether
it measures the Non-Controlling Interest
in the acquiree either at fair value or at
the proportionate share of the acquiree’s
identifiable net assets. Acquisition-related
costs are expensed as incurred and
included in administrative expenses.
When the Group acquires a business, it
assesses the financial assets and liabilities
assumed for appropriate classification
and designation in accordance with
the contractual terms, economic
circumstances and pertinent conditions as
at the acquisition date.
If the business combination is achieved in
stages, any previously held equity interest
is remeasured at its acquisition date fair
value and any resulting gain or loss is
recognised in profit or loss.
Any contingent consideration to be
transferred by the acquirer will be
recognised at fair value at the acquisition
date. Contingent consideration classified
as an asset or liability that is a financial
instrument and within the scope of LKAS
39 Financial Instruments: Recognition and
Measurement, is measured at fair value
with changes in fair value recognised
either in statement of profit or loss or
as a change to OCI. If the contingent
consideration is not within the scope of
LKAS 39, it is measured in accordance
with the appropriate SLFRS. Contingent
consideration that is classified as equity
is not remeasured and subsequent
settlement is accounted for within equity.
Goodwill is initially measured at cost,
being the excess of the aggregate of the
consideration transferred and the amount
recognised for non-controlling interests,
and any previous interest held, over
the net identifiable assets acquired and
liabilities assumed. If the fair value of the
net assets acquired is in excess of the
aggregate consideration transferred, the
Group re-assesses whether it has correctly
identified all of the assets acquired and all
of the liabilities assumed and reviews the
procedures used to measure the amounts
to be recognised at the acquisition date. If
the reassessment still results in an excess
of the fair value of net assets acquired over
the aggregate consideration transferred,
then the gain is recognised in statement of
profit or loss.
After initial recognition, goodwill is
measured at cost less any accumulated
impairment losses. For the purpose of
impairment testing, goodwill acquired
in a business combination is, from the
acquisition date, allocated to each of the
Group’s cash-generating units that are
expected to benefit from the combination,
irrespective of whether other assets or
liabilities of the acquiree are assigned to
those units.
Where goodwill has been allocated to
a cash-generating unit and part of the
operation within that unit is disposed
of, the goodwill associated with the
disposed operation is included in the
carrying amount of the operation when
determining the gain or loss on disposal.
Goodwill disposed in these circumstances
is measured based on the relative values of
the disposed operation and the portion of
the cash-generating unit retained.
3.2.2 Equity Accounted Investees
Equity accounted investees are those
entities in which the Group has significant
influence, but not control, over the financial
and operating policies. Significant influence
is presumed to exist when the Group holds
between 20 and 50 percent of the voting
power of another entity. Equity accounted
investees are accounted for using the
equity method.
Under the equity method, the investment
in the equity accounted investee is carried
on the Statement of Financial Position at
Notes to the Financial Statements Contd.
209
KELANI VALLEY PLANTATIONS PLC
Annual Report 2017/18
Fin
anci
al
Rep
ort
s
cost plus post acquisition changes in the
Group‘s share of net assets of the equity
accounted investee. Goodwill relating to
the equity accounted investee is included
in the carrying amount of the investment
and is neither amortised nor individually
tested for impairment.
The Income Statement reflects the Group’s
share of the results of operations of the
equity accounted investee. When there has
been a change recognised directly in the
equity of the equity accounted investee, the
Group recognises its share of any changes
and discloses this, when applicable,
in the Statement of Changes in Equity.
Unrealised gains and losses resulting from
transactions between the Group and the
equity accounted investee are eliminated
to the extent of the interest in the equity
accounted investee.
The Consolidated Financial Statements
include the Group’s share of profit net
of tax and equity movements of equity
accounted investees from the date that
significant influence commences until
the date significant influence ceases.
When the Group’s share of losses
exceeds its investment in an equity
accounted investee, the carrying amount
of that interest is reduced to nil and the
recognition of further losses is discontinued
except to the extent that the Group has
incurred obligations or has made payments
on behalf of the investee.
The Financial Statements of the equity
accounted investees are prepared for
the same reporting period as the Group.
After application of the equity method, the
Group determines whether it is necessary
to recognise an additional impairment loss
on its investment in its equity accounted
investee. The Group determines at each
reporting date whether there is any
objective evidence that the investment in
the equity accounted investee is impaired.
If this is the case, the Group calculates the
amount of impairment as the difference
between the recoverable amounts of the
equity accounted investee and its carrying
value and recognises the amount in the
‘share of profit of an equity accounted
investee, in the Income Statement.
Upon loss of significant influence over
the equity accounted investee, the Group
measures and recognises any retaining
investment at its fair value. Any difference
between the carrying amount of the equity
accounted investee upon loss of significant
influence and the fair value of the retained
investment and proceeds from disposal
is recognised in profit or loss. In the
Company level, investments in subsidiaries
and associates are recognised at cost.
3.3 Current versus non-current classification
The Group presents assets and liabilities
in statement of financial position based on
current/non-current classification. An asset
as current when it is:
Expected to be realised or intended to
sold or consumed in normal operating
cycle
Held primarily for the purpose of
trading
Expected to be realised within 12
months after the reporting period
Or
Cash or cash equivalent unless
restricted from being exchanged or
used to settle a liability for at least 12
months after the reporting period
All other assets are classified as non-
current.
A liability is current when:
It is expected to be settled in normal
operating cycle
It is held primarily for the purpose of
trading
It is due to be settled within 12 months
after the reporting period
Or
There is no right to defer the
settlement of the liability for at least 12
months after the reporting period
The Group classifies all other liabilities as
non-current.
Deferred tax assets and liabilities are
classified as non-current assets and
liabilities.
3.4 Fair Value MeasurementThe Group measures financial instruments
and non-financial assets at fair value at
each Statement of Financial Position date.
Fair value related disclosures for financial
instruments and non-financial assets that
are measured at fair value or where fair
values are disclosed, are summarised in
the following Notes:
210
KELANI VALLEY PLANTATIONS PLC
Annual Report 2017/18
Managed Consumable Biological
Assets Note 14.2
Fair value is the price that would be
received to sell an asset or paid to transfer
a liability in an orderly transaction between
market participants at the measurement
date. The fair value measurement is based
on the presumption that the transaction to
sell the asset or transfer the liability takes
place either:
In the principal market for the asset or
liability
Or
In the absence of a principal market, in
the most advantageous market for the
asset or liability
The principal or the most advantageous
market must be accessible by the Group.
The fair value of an asset or a liability is
measured using the assumptions that
market participants would use when
pricing the asset or liability, assuming that
market participants act in their economic
best interest.
A fair value measurement of a non-
financial asset takes into account a market
participant’s ability to generate economic
benefits by using the asset in its highest
and best use or by selling it to another
market participant that would use the asset
in its highest and best use.
The Group uses valuation techniques that
are appropriate in the circumstances and
for which sufficient data is available to
measure fair value, maximising the use of
relevant observable inputs and minimising
the use of unobservable inputs.
All assets and liabilities for which fair value
is measured or disclosed in the financial
statements are categorised within the
fair value hierarchy, described as follows,
based on the lowest level input that is
significant to the fair value measurement as
a whole:
Level 1 — Quoted (unadjusted) market
prices in active markets for identical
assets or liabilities
Level 2 — Valuation techniques
for which the lowest level input
that is significant to the fair value
measurement is directly or indirectly
observable
Level 3 — Valuation techniques
for which the lowest level input
that is significant to the fair value
measurement is unobservable
For assets and liabilities that are
recognised in the Financial Statements on
a recurring basis, the Group determines
whether transfers have occurred between
levels in the hierarchy by re-assessing
categorisation (based on the lowest level
input that is significant to the fair value
measurement as a whole) at the end of
each reporting period.
External Valuers are involved for valuation
of significant assets, such as managed
consumable biological assets. Involvement
of external Valuers is decided upon
annually by the Management Committee
after discussion with and approval by the
Company’s Audit Committee. Selection
criteria include market knowledge,
reputation, independence and whether
professional standards are maintained.
Valuers are normally rotated every three
years. The Management Committee
decides, after discussions with the
Group’s external Valuers, which valuation
techniques and inputs to use for each
case.
For the purpose of fair value disclosures,
the Group has determined classes of
assets and liabilities on the basis of the
nature, characteristics and risks of the
asset or liability and the level of the fair
value hierarchy as explained above.
3.5 Foreign CurrenciesThe Group’s Consolidated Financial
Statements are presented in Sri Lankan
Rupees, which is also the parent
company’s functional currency. For each
entity the Group determines the functional
currency and items included in the
Financial Statements of each entity are
measured using that functional currency.
Transactions in foreign currencies are
initially recorded by the Group’s entities
at their respective functional currency
spot rates at the date the transaction first
qualifies for recognition.
Monetary assets and liabilities denominated
in foreign currencies are translated at the
functional currency spot rates of exchange
at the reporting date.
Notes to the Financial Statements Contd.
211
KELANI VALLEY PLANTATIONS PLC
Annual Report 2017/18
Fin
anci
al
Rep
ort
s
Differences arising on settlement or
translation of monetary items are
recognised in the statement of profit or
loss with the exception of monetary items
that are designated as part of the hedge
of the Group’s net investment of a foreign
operation. These are recognised in OCI
until the net investment is disposed of,
at which time, the cumulative amount is
reclassified to Statement of Profit or Loss.
Tax charges and credits attributable to
exchange differences on those monetary
items are also recorded in OCI.
Non-monetary items that are measured
in terms of historical cost in a foreign
currency are translated using the exchange
rates at the dates of the initial transactions.
Non-monetary items measured at fair value
in a foreign currency are translated using
the exchange rates at the date when the
fair value is determined. The gain or loss
arising on translation of non-monetary
items measured at fair value is treated in
line with the recognition of the gain or loss
on the change in fair value of the item (i.e.,
translation differences on items whose
fair value gain or loss is recognised in OCI
or Statement of Profit or Loss are also
recognised in OCI or Statement of Profit or
Loss, respectively).
3.6 Cash dividend and non-cash distribution to equity holders of the parent
The Company recognises a liability to
make cash or non-cash distributions
to equity holders of the Parent when
the distribution is authorised and the
distribution is no longer at the discretion of
the Company. A distribution is authorised
when it is approved by the shareholders.
A corresponding amount is recognised
directly in equity.
Non-cash distributions are measured at
the fair value of the assets to be distributed
with fair value remeasurement recognised
directly in equity.
Upon distribution of non-cash assets, any
difference between the carrying amount
of the liability and the carrying amount of
the assets distributed is recognised in the
Statement of Profit or Loss.
3.7 Property, Plant & EquipmentThe Group applies the requirements
of LKAS 16 on ‘Property Plant and
Equipment’ in accounting for its assets
which are held for and use in the provision
of the services, for rental to other or for
administration purpose and are expected
to be used for more than one year.
3.7.1 Basis of Recognition
Property Plant and Equipment is
recognised if it is probable that future
economic benefits associated with the
assets will flow to the Group and cost of
the assets can be reliably measured.
3.7.2 Measurement
Items of Property, Plant and Equipment
are measured at cost (or at fair value
in the case of land) less accumulated
depreciation and accumulated impairment
losses, if any.
3.7.3 Borrowing Cost
Borrowing costs that are directly
attributable to acquisition, construction
or production of a qualifying asset, which
takes a substantial period of time to get
ready for its intended use or sale are
capitalised as a part of the asset.
Borrowing costs that are not capitalised
are recognised as expenses in the period in
which they are incurred and charged to the
Statement of Profit or Loss.
The amounts of the borrowing costs which
are eligible for capitalisation are determined
in accordance with the in LKAS 23 -
Borrowing Costs.
Borrowing costs incurred in respect
of specific loans that are utilised for
field development activities have been
capitalised as a part of the cost of
the relevant immature plantation. The
capitalisation will cease when the crops are
ready for commercial harvest.
The amount so capitalised and the
capitalisation rates are disclosed in Notes
to the Financial Statements.
3.7.4 Owned Assets
The cost of Property, Plant and Equipment
includes expenditures that are directly
attributable to the acquisition of the
asset. Such costs includes the cost
of replacing part of the Property, Plant
and Equipment and borrowing costs for
long-term construction projects if the
recognition criteria are met. The cost of
self-constructed assets includes the cost of
212
KELANI VALLEY PLANTATIONS PLC
Annual Report 2017/18
materials and direct labour, any other cost
directly attributable to bringing the asset
to a working condition for its intended use,
and the costs of dismantling and removing
the items and restoring the site on which
they are located.
Purchased software that is integral to the
functionality of the related equipment is
capitalised as a part of that equipment.
When significant parts of Property,
Plant and Equipment are required to be
replaced at intervals, the entity recognises
such parts as individual assets (major
components) with specific useful lives and
depreciation, respectively. Likewise, when
a major inspection is performed, its cost
is recognised in the carrying amount of
the plant and equipment as a replacement
if the recognition criteria are satisfied. All
other repair and maintenance costs are
recognised in the Statement of Profit and
Loss as incurred. The present value of the
expected cost for the decommissioning
of the asset after its use is included in
the cost of the respective asset if the
recognition criteria for a provision are met.
Capital work-in-progress is transferred to
the respective asset accounts at the time
of first utilisation or at the time the asset is
commissioned.
3.7.5 Leased Assets
The determination of whether an
arrangement is (or contains) a lease
is based on the substance of the
arrangement at the inception of the lease.
The arrangement is, or contains, a lease if
fulfilment of the arrangement is dependent
on the use of a specific asset or assets and
the arrangement conveys a right to use
the asset or assets, even if that right is not
explicitly specified in an arrangement.
Group as a lesseeA lease is classified at the inception date
as a finance lease or an operating lease.
A lease that transfers substantially all the
risks and rewards incidental to ownership
to the Group is classified as a finance
lease.
Finance leases are capitalised at the
commencement of the lease at the
inception date fair value of the leased
property or, if lower, at the present value
of the minimum lease payments. Lease
payments are apportioned between finance
charges and reduction of the lease liability
so as to achieve a constant rate of interest
on the remaining balance of the liability.
Finance charges are recognised in finance
costs in the Statement of Profit or Loss.
A leased asset is depreciated over the
useful life of the asset. However, if there is
no reasonable certainty that the Group will
obtain ownership by the end of the lease
term, the asset is depreciated over the
shorter of the estimated useful life of the
asset and the lease term.
Operating lease payments are recognised
as an operating expense in the Statement
of Profit or Loss on a straight-line basis
over the lease term.
3.7.6 De-recognition
An item of Property, Plant and Equipment
and any significant part initially recognised
is derecognised upon disposal or when no
future economic benefits are expected from
its use or disposal. Any gain or loss arising
on de-recognition of the asset (calculated
as the difference between the net disposal
proceeds and the carrying amount of the
asset) is included in the Statement of Profit
or Loss when the asset is derecognised
and gains are not classified as revenue.
3.7.7 Land Development Cost
Permanent land development costs are
those costs incurred in making major
infrastructure development and building
new access roads on leasehold lands.
These costs have been capitalised and
amortised over the remaining lease period
Permanent impairments to land
development costs are charged to the
Statement of Profit or Loss in full or
reduced to the net carrying amounts of
such assets in the year of occurrence after
ascertaining the loss.
3.7.8 Biological Assets
Biological assets are classified in to
mature biological assets and immature
biological assets. Mature biological assets
are those that have attained harvestable
specifications or are able to sustain
regular harvests. Immature biological
assets are those that have not yet attained
harvestable specifications. Tea, rubber,
Notes to the Financial Statements Contd.
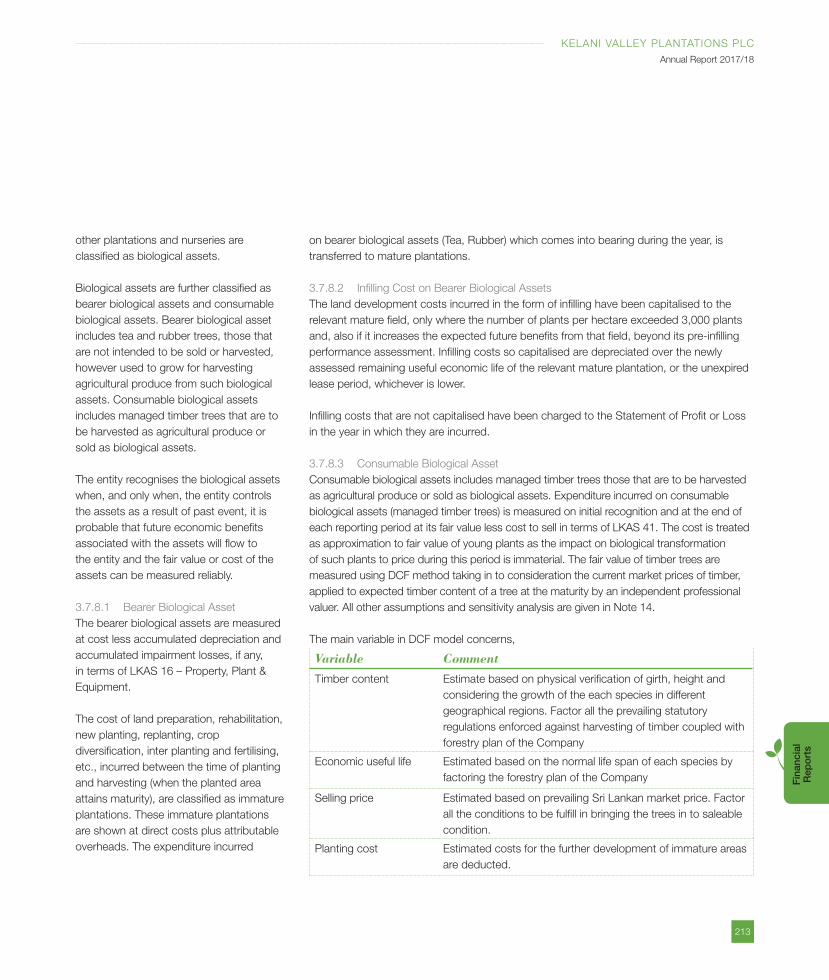
213
KELANI VALLEY PLANTATIONS PLC
Annual Report 2017/18
Fin
anci
al
Rep
ort
s
other plantations and nurseries are
classified as biological assets.
Biological assets are further classified as
bearer biological assets and consumable
biological assets. Bearer biological asset
includes tea and rubber trees, those that
are not intended to be sold or harvested,
however used to grow for harvesting
agricultural produce from such biological
assets. Consumable biological assets
includes managed timber trees that are to
be harvested as agricultural produce or
sold as biological assets.
The entity recognises the biological assets
when, and only when, the entity controls
the assets as a result of past event, it is
probable that future economic benefits
associated with the assets will flow to
the entity and the fair value or cost of the
assets can be measured reliably.
3.7.8.1 Bearer Biological Asset
The bearer biological assets are measured
at cost less accumulated depreciation and
accumulated impairment losses, if any,
in terms of LKAS 16 – Property, Plant &
Equipment.
The cost of land preparation, rehabilitation,
new planting, replanting, crop
diversification, inter planting and fertilising,
etc., incurred between the time of planting
and harvesting (when the planted area
attains maturity), are classified as immature
plantations. These immature plantations
are shown at direct costs plus attributable
overheads. The expenditure incurred
on bearer biological assets (Tea, Rubber) which comes into bearing during the year, is
transferred to mature plantations.
3.7.8.2 Infilling Cost on Bearer Biological Assets
The land development costs incurred in the form of infilling have been capitalised to the
relevant mature field, only where the number of plants per hectare exceeded 3,000 plants
and, also if it increases the expected future benefits from that field, beyond its pre-infilling
performance assessment. Infilling costs so capitalised are depreciated over the newly
assessed remaining useful economic life of the relevant mature plantation, or the unexpired
lease period, whichever is lower.
Infilling costs that are not capitalised have been charged to the Statement of Profit or Loss
in the year in which they are incurred.
3.7.8.3 Consumable Biological Asset
Consumable biological assets includes managed timber trees those that are to be harvested
as agricultural produce or sold as biological assets. Expenditure incurred on consumable
biological assets (managed timber trees) is measured on initial recognition and at the end of
each reporting period at its fair value less cost to sell in terms of LKAS 41. The cost is treated
as approximation to fair value of young plants as the impact on biological transformation
of such plants to price during this period is immaterial. The fair value of timber trees are
measured using DCF method taking in to consideration the current market prices of timber,
applied to expected timber content of a tree at the maturity by an independent professional
valuer. All other assumptions and sensitivity analysis are given in Note 14.
The main variable in DCF model concerns,
Variable Comment
Timber content Estimate based on physical verification of girth, height and
considering the growth of the each species in different
geographical regions. Factor all the prevailing statutory
regulations enforced against harvesting of timber coupled with
forestry plan of the Company
Economic useful life Estimated based on the normal life span of each species by
factoring the forestry plan of the Company
Selling price Estimated based on prevailing Sri Lankan market price. Factor
all the conditions to be fulfill in bringing the trees in to saleable
condition.
Planting cost Estimated costs for the further development of immature areas
are deducted.
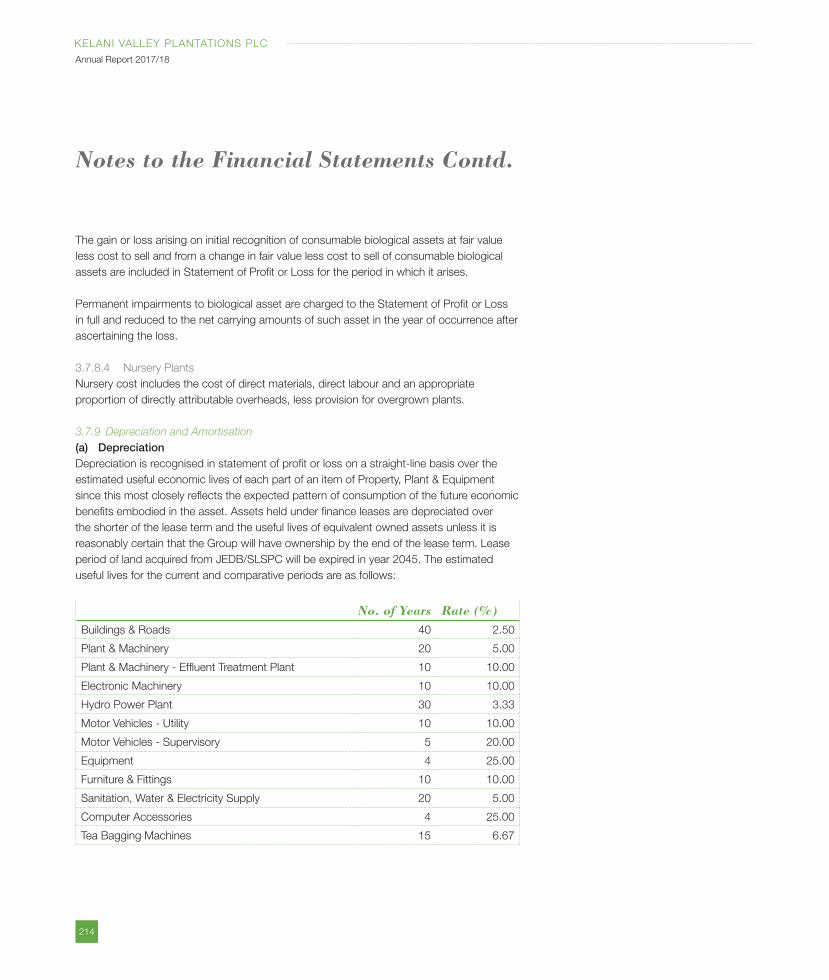
214
KELANI VALLEY PLANTATIONS PLC
Annual Report 2017/18
The gain or loss arising on initial recognition of consumable biological assets at fair value
less cost to sell and from a change in fair value less cost to sell of consumable biological
assets are included in Statement of Profit or Loss for the period in which it arises.
Permanent impairments to biological asset are charged to the Statement of Profit or Loss
in full and reduced to the net carrying amounts of such asset in the year of occurrence after
ascertaining the loss.
3.7.8.4 Nursery Plants
Nursery cost includes the cost of direct materials, direct labour and an appropriate
proportion of directly attributable overheads, less provision for overgrown plants.
3.7.9 Depreciation and Amortisation
(a) DepreciationDepreciation is recognised in statement of profit or loss on a straight-line basis over the
estimated useful economic lives of each part of an item of Property, Plant & Equipment
since this most closely reflects the expected pattern of consumption of the future economic
benefits embodied in the asset. Assets held under finance leases are depreciated over
the shorter of the lease term and the useful lives of equivalent owned assets unless it is
reasonably certain that the Group will have ownership by the end of the lease term. Lease
period of land acquired from JEDB/SLSPC will be expired in year 2045. The estimated
useful lives for the current and comparative periods are as follows:
No. of Years Rate (%)Buildings & Roads 40 2.50
Plant & Machinery 20 5.00
Plant & Machinery - Effluent Treatment Plant 10 10.00
Electronic Machinery 10 10.00
Hydro Power Plant 30 3.33
Motor Vehicles - Utility 10 10.00
Motor Vehicles - Supervisory 5 20.00
Equipment 4 25.00
Furniture & Fittings 10 10.00
Sanitation, Water & Electricity Supply 20 5.00
Computer Accessories 4 25.00
Tea Bagging Machines 15 6.67
Notes to the Financial Statements Contd.
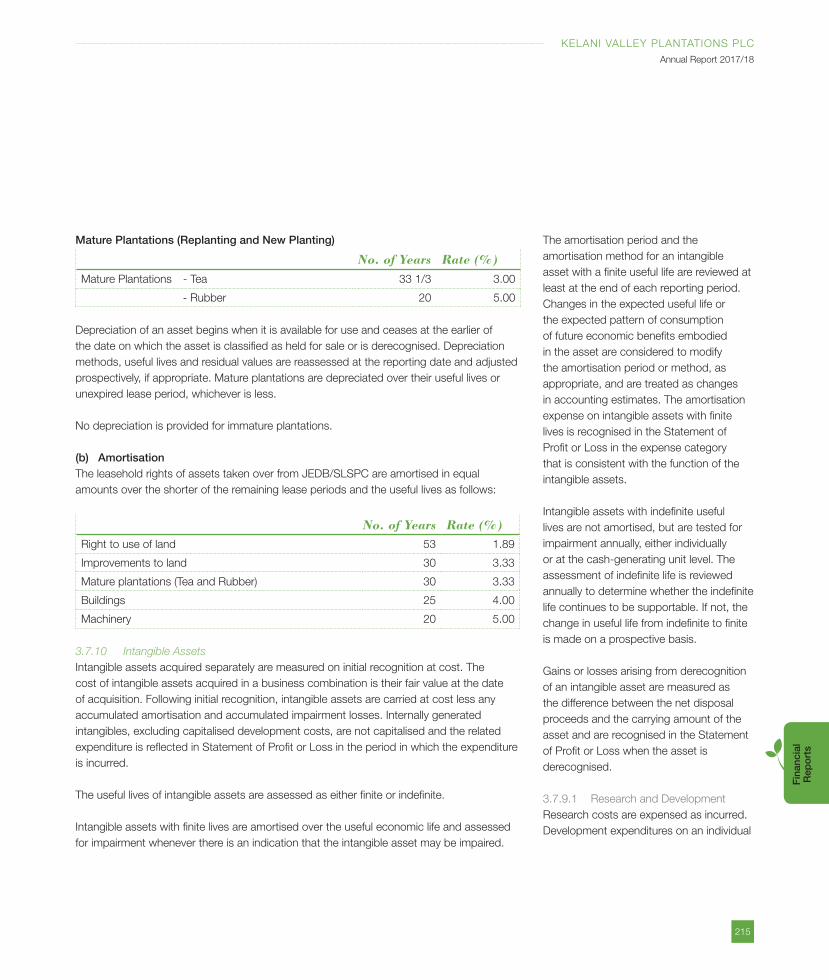
215
KELANI VALLEY PLANTATIONS PLC
Annual Report 2017/18
Fin
anci
al
Rep
ort
s
Mature Plantations (Replanting and New Planting)
No. of Years Rate (%)Mature Plantations - Tea 33 1/3 3.00
- Rubber 20 5.00
Depreciation of an asset begins when it is available for use and ceases at the earlier of
the date on which the asset is classified as held for sale or is derecognised. Depreciation
methods, useful lives and residual values are reassessed at the reporting date and adjusted
prospectively, if appropriate. Mature plantations are depreciated over their useful lives or
unexpired lease period, whichever is less.
No depreciation is provided for immature plantations.
(b) AmortisationThe leasehold rights of assets taken over from JEDB/SLSPC are amortised in equal
amounts over the shorter of the remaining lease periods and the useful lives as follows:
No. of Years Rate (%)Right to use of land 53 1.89
Improvements to land 30 3.33
Mature plantations (Tea and Rubber) 30 3.33
Buildings 25 4.00
Machinery 20 5.00
3.7.10 Intangible Assets
Intangible assets acquired separately are measured on initial recognition at cost. The
cost of intangible assets acquired in a business combination is their fair value at the date
of acquisition. Following initial recognition, intangible assets are carried at cost less any
accumulated amortisation and accumulated impairment losses. Internally generated
intangibles, excluding capitalised development costs, are not capitalised and the related
expenditure is reflected in Statement of Profit or Loss in the period in which the expenditure
is incurred.
The useful lives of intangible assets are assessed as either finite or indefinite.
Intangible assets with finite lives are amortised over the useful economic life and assessed
for impairment whenever there is an indication that the intangible asset may be impaired.
The amortisation period and the
amortisation method for an intangible
asset with a finite useful life are reviewed at
least at the end of each reporting period.
Changes in the expected useful life or
the expected pattern of consumption
of future economic benefits embodied
in the asset are considered to modify
the amortisation period or method, as
appropriate, and are treated as changes
in accounting estimates. The amortisation
expense on intangible assets with finite
lives is recognised in the Statement of
Profit or Loss in the expense category
that is consistent with the function of the
intangible assets.
Intangible assets with indefinite useful
lives are not amortised, but are tested for
impairment annually, either individually
or at the cash-generating unit level. The
assessment of indefinite life is reviewed
annually to determine whether the indefinite
life continues to be supportable. If not, the
change in useful life from indefinite to finite
is made on a prospective basis.
Gains or losses arising from derecognition
of an intangible asset are measured as
the difference between the net disposal
proceeds and the carrying amount of the
asset and are recognised in the Statement
of Profit or Loss when the asset is
derecognised.
3.7.9.1 Research and Development
Research costs are expensed as incurred.
Development expenditures on an individual
216
KELANI VALLEY PLANTATIONS PLC
Annual Report 2017/18
project are recognised as an intangible
asset when the Group can demonstrate:
The technical feasibility of completing
the intangible asset so that the asset
will be available for use or sale
Its intention to complete and its ability
and intention to use or sell the asset
How the asset will generate future
economic benefits
The availability of resources to
complete the asset
The ability to measure reliably the
expenditure during development
Following initial recognition of the
development expenditure as an
asset, the asset is carried at cost
less any accumulated amortisation
and accumulated impairment losses.
Amortisation of the asset begins when
development is complete and the asset
is available for use. It is amortised over
the period of expected future benefit.
Amortisation is recorded in cost of sales.
During the period of development, the
asset is tested for impairment annually.
3.8 Financial InstrumentsA financial instrument is any contract that
gives rise to a financial asset of one entity
and a financial liability or equity instrument
of another entity.
3.8.1 Financial assets
3.8.1.1 Initial Recognition and
Measurement
Financial assets are classified, at initial
recognition, as financial assets at fair
value through profit or loss, loans and
receivables, held-to-maturity investments,
AFS financial assets, or as derivatives
designated as hedging instruments in an
effective hedge, as appropriate. All financial
assets are recognised initially at fair value
plus, in the case of financial assets not
recorded at fair value through profit or loss,
transaction costs that are attributable to
the acquisition of the financial asset.
Purchases or sales of financial assets
that require delivery of assets within a
time frame established by regulation or
convention in the market place (regular way
trades) are recognised i.e., the date that
the Group commits to purchase or sell the
asset.
The Group’s financial assets include cash
and short-term deposits, short-term
investments, trade and other receivables,
loans and other receivables, quoted and
unquoted financial instruments.
3.8.1.2 Subsequent Measurement
The subsequent measurement of financial
assets depends on their classification as
described below:
(a) Financial assets at fair value through profit or loss
Financial assets at fair value through profit or
loss include financial assets held for trading
and financial assets designated upon initial
recognition at fair value through profit or loss.
Financial assets are classified as held for
trading if they are acquired for the purpose
of selling or repurchasing in the near term.
Financial assets at fair value through profit
and loss are carried in the Statement of
Financial Position at fair value with net
changes in fair value recognised in finance
income or finance costs in the Statement
of Profit or Loss.
The Group has not designated any financial
assets as at fair value through profit or loss.
(b) Loans and receivablesLoans and receivables are non-derivative
financial assets with fixed or determinable
payments that are not quoted in an
active market. After initial measurement,
such financial assets are subsequently
measured at amortised cost using the
effective interest rate method (EIR), less
impairment. Amortised cost is calculated
by taking into account any discount or
premium on acquisition and fees or costs
that are an integral part of the EIR. The EIR
amortization is included in finance income in
the Statement of Profit or Loss. The losses
arising from impairment are recognised in
the Statement of Profit or Loss in finance
costs for loans and in cost of sales or other
operating expenses for receivables.
Loans and receivables comprise of trade
receivables, amounts due from related
parties, deposits, advances and other
receivables and cash and cash equivalents.
(c) Held-to-maturity investmentsNon-derivative financial assets with fixed
or determinable payments and fixed
maturities are classified as held-to-maturity
when the Group has the positive intention
Notes to the Financial Statements Contd.
217
KELANI VALLEY PLANTATIONS PLC
Annual Report 2017/18
Fin
anci
al
Rep
ort
s
and ability to hold them to maturity. After
initial measurement, held-to-maturity
investments are measured at amortised
cost using the effective interest method,
less impairment.
Amortised cost is calculated by taking
into account any discount or premium
on acquisition and fees or costs that
are an integral part of the EIR. The
EIR amortisation is included in finance
income in the Statement of Profit or Loss.
The losses arising from impairment are
recognised in the Statement of Profit or
Loss in finance costs.
(d) Available for sale financial investments
AFS financial assets include equity
investments and debt securities. Equity
investments classified as AFS are those
that are neither classified as held for trading
nor designated at fair value through profit
or loss. Debt securities in this category
are those that are intended to be held for
an indefinite period of time and that may
be sold in response to needs for liquidity
or in response to changes in the market
conditions.
After initial measurement, AFS financial
assets are subsequently measured at
fair value with unrealised gains or losses
recognised in OCI and credited in the
AFS reserve until the investment is
derecognised, at which time the cumulative
gain or loss is recognised in other operating
income, or the investment is determined
to be impaired, when the cumulative loss
is reclassified from the AFS reserve to the
statement of profit or loss in finance costs.
Interest earned whilst holding AFS financial
assets is reported as interest income using
the EIR method.
The Group evaluates whether the ability
and intention to sell its AFS financial
assets in the near term is still appropriate.
When, in rare circumstances, the Group is
unable to trade these financial assets due
to inactive markets, the Group may elect
to reclassify these financial assets if the
management has the ability and intention
to hold the assets for foreseeable future or
until maturity.
For a financial asset reclassified from
the AFS category, the fair value carrying
amount at the date of reclassification
becomes its new amortised cost and any
previous gain or loss on the asset that has
been recognised in equity is amortised to
profit or loss over the remaining life of the
investment using the EIR. Any difference
between the new amortised cost and the
maturity amount is also amortised over the
remaining life of the asset using the EIR.
If the asset is subsequently determined to
be impaired, then the amount recorded in
equity is reclassified to the Statement of
Profit or Loss.
3.8.1.3 De-recognition
A financial asset (or, where applicable, a
part of a financial asset or part of a group
of similar financial assets) is de-recognised
when:
The rights to receive cash flows from
the asset have expired
The Group has transferred its rights
to receive cash flows from the asset
or has assumed an obligation to pay
the received cash flows in full without
material delay to a third party under
a ‘pass-through’ arrangement; and
either (a) the Group has transferred
substantially all the risks and rewards
of the asset, or (b) the Group has
neither transferred nor retained
substantially all the risks and rewards
of the asset, but has transferred
control of the asset.
When the Group has transferred its rights
to receive cash flows from an asset or has
entered into a pass-through arrangement,
it evaluates if and to what extent it
has retained the risks and rewards of
ownership. When it has neither transferred
nor retained substantially all of the risks
and rewards of the asset, nor transferred
control of the asset, the asset is recognised
to the extent of the Group’s continuing
involvement in the asset. In that case,
the Group also recognises an associated
liability. The transferred asset and the
associated liability are measured on a basis
that reflects the rights and obligations that
the Group has retained.
Continuing involvement that takes the form
of a guarantee over the transferred asset
is measured at the lower of the original
carrying amount of the asset and the
maximum amount of consideration that the
Group could be required to repay.
218
KELANI VALLEY PLANTATIONS PLC
Annual Report 2017/18
3.8.1.4 Impairment of financial assets
The Group assesses at each reporting
date whether there is any objective
evidence that a financial asset or a group
of financial assets is impaired and if such
has been incurred, the amount of the loss
is measured as the difference between the
assets carrying amount and the present
value of estimated future cash flows.
Evidence of impairment may include
indications that the debtors or a group of
debtors is experiencing significant financial
difficulty, default or delinquency in interest
or principal payments, the probability that
they will enter bankruptcy or other financial
reorganisation and when observable
data indicate that there is a measurable
decrease in the estimated future cash
flows, such as changes in arrears or
economic conditions that correlate with
defaults.
3.8.1.4.1 Financial assets carried at
amortised cost
For financial assets carried at amortised
cost, the Group first assesses whether
impairment exists individually for financial
assets that are individually significant, or
collectively for financial assets that are
not individually significant. If the Group
determines that no objective evidence
of impairment exists for an individually
assessed financial asset, whether
significant or not, it includes the asset in
a group of financial assets with similar
credit risk characteristics and collectively
assesses them for impairment. Assets that
are individually assessed for impairment
and for which an impairment loss is,
or continues to be, recognised are not
included in a collective assessment of
impairment.
The amount of any impairment loss
identified is measured as the difference
between the asset’s carrying amount and
the present value of estimated future cash
flows (excluding future expected credit
losses that have not yet been incurred).
The present value of the estimated future
cash flows is discounted at the financial
asset’s original effective interest rate.
The carrying amount of the asset is reduced
through the use of an allowance account
and the loss is recognised in the statement
of profit or loss. Interest income (recorded
as finance income in the statement of profit
or loss) continues to be accrued on the
reduced carrying amount and is accrued
using the rate of interest used to discount
the future cash flows for the purpose of
measuring the impairment loss. Loans
together with the associated allowance
are written off when there is no realistic
prospect of future recovery and all collateral
has been realised or has been transferred
to the Group. If, in a subsequent year,
the amount of the estimated impairment
loss increases or decreases because of
an event occurring after the impairment
was recognised, the previously recognised
impairment loss is increased or reduced
by adjusting the allowance account. If a
write-off is later recovered, the recovery is
credited to finance costs in the statement of
profit or loss.
3.8.1.4.2 Available for sale financial Assets
For AFS financial assets, the Group
assesses at each reporting date whether
there is objective evidence that an
investment or a group of investments is
impaired.
In the case of equity investments classified
as AFS, objective evidence would include
a significant or prolonged decline in the
fair value of the investment below its
cost. ‘Significant’ is evaluated against
the original cost of the investment and
‘prolonged’ against the period in which the
fair value has been below its original cost.
When there is evidence of impairment,
the cumulative loss – measured as the
difference between the acquisition cost and
the current fair value, less any impairment
loss on that investment previously
recognised in the statement of profit or loss
is removed from OCI and recognised in
the statement of profit or loss. Impairment
losses on equity investments are not
reversed through profit or loss; increases
in their fair value after impairment are
recognised in OCI.
The determination of what is ‘significant’ or
‘prolonged’ requires judgement. In making
this judgement, the Group evaluates,
among other factors, the duration or extent
to which the fair value of an investment is
less than its cost.
In the case of debt instruments classified
as AFS, the impairment is assessed based
on the same criteria as financial assets
carried at amortised cost. However, the
Notes to the Financial Statements Contd.
219
KELANI VALLEY PLANTATIONS PLC
Annual Report 2017/18
Fin
anci
al
Rep
ort
s
amount recorded for impairment is the
cumulative loss measured as the difference
between the amortised cost and the
current fair value, less any impairment loss
on that investment previously recognised in
the Statement of Profit or Loss.
Future interest income continues to be
accrued based on the reduced carrying
amount of the asset, using the rate of
interest used to discount the future cash
flows for the purpose of measuring the
impairment loss. The interest income is
recorded as part of finance income. If, in
a subsequent year, the fair value of a debt
instrument increases and the increase can
be objectively related to an event occurring
after the impairment loss was recognised
in the statement of profit or loss, the
impairment loss is reversed through the
Statement of Profit or Loss.
3.8.2 Financial liabilities
3.8.2.1 Initial recognition and
measurement
Financial liabilities are classified as financial
liabilities at fair value through profit or loss,
loans and borrowings, or as derivatives
designated as hedging instruments in an
effective hedge, as appropriate.
All financial liabilities are recognised initially
at fair value and, in the case of loans and
borrowings and payables net of directly
attributable transaction cost. This includes
directly attributable transaction costs.
The Group’s financial liabilities include
trade and other payables, bank overdrafts,
loans and borrowings, financial guarantee
contracts.
3.8.2.2 Subsequent measurement
The subsequent measurement of financial
liabilities depends on their classification as
described below:
(a) Financial liabilities at fair value through profit or loss
Financial liabilities at fair value through profit
or loss include financial liabilities held for
trading and financial liabilities designated
upon initial recognition as at fair value
through profit or loss.
Financial liabilities are classified as held for
trading if they are incurred for the purpose
of repurchasing in the near term. This
category also includes derivative financial
instruments entered into by the Group that
are not designated as hedging instruments
in hedge relationships as defined by LKAS
39. Separated embedded derivatives are
also classified as held for trading unless
they are designated as effective hedging
instruments.
Gains or losses on liabilities held for trading
are recognised in the Statement of Profit
or Loss.
Financial liabilities designated upon initial
recognition at fair value through profit
or loss are designated at the initial date
of recognition, and only if the criteria in
LKAS 39 are satisfied. The Group has not
designated any financial liability as at fair
value through profit or loss.
(b) Loans and borrowingsAfter initial recognition, interest bearing
loans and borrowings are subsequently
measured at amortised cost using the
Effective Interest Rate (EIR) method. Gains
and losses are recognised in profit or loss
when, the liabilities are derecognised as well
as through the (EIR) amortisation process.
Amortised cost is calculated by taking
into account any discount or premium
on acquisition and fees or costs that
are an integral part of the EIR. The EIR
amortisation is included as finance costs in
the statement of profit or loss.
(c) Financial guarantee contractsFinancial guarantee contracts are
recognised initially as a liability at fair
value, adjusted for transaction costs that
are directly attributable to the issuance of
the guarantee. Subsequently, the liability
is measured at the higher of the best
estimate of the expenditure required to
settle the present obligation at the reporting
date and the amount recognised less
cumulative amortisation.
3.8.2.3 De-recognition
A financial liability is de-recognised
when the obligation under the liability is
discharged or cancelled or expires.
220
KELANI VALLEY PLANTATIONS PLC
Annual Report 2017/18
When an existing financial liability is replaced
by another from the same lender on
substantially different terms, or the terms of
an existing liability are substantially modified,
such an exchange or modification is
treated as the de-recognition of the original
liability and the recognition of a new liability.
The difference in the respective carrying
amounts is recognised in the Statement of
Profit or Loss.
3.8.3 Offsetting of financial instruments
Financial assets and financial liabilities
are offset and the net amount reported in
the Consolidated Statement of Financial
Position if, and only if, there is a currently
enforceable legal right to offset the
recognised amounts and there is an
intention to settle on a net basis, or to
realise the assets and settle the liabilities
simultaneously.
3.9 Harvestable Agricultural Produce Growing on Bearer Biological Assets
In accordance with LKAS 41, the Company
recognises agricultural produce growing on
bearer plants at fair value less cost to sell.
Change in the fair value of such agricultural
produce recognised in profit or loss at the
end of each reporting period.
For this purpose, quantities of harvestable
agricultural produce ascertained based on
harvesting cycle of each crop category by
limiting to one harvesting cycle based on
last day of the harvest in the immediately
preceding cycle. Further 50% of the crop
in that harvesting cycle considered for the
valuation.
For the valuation of the harvestable
agricultural produce, the company uses the
following price formulas.
Tea – Bought leaf rate less cost of
harvesting and transport
Rubber – Latex price (92.5% of
current RSS1 price) less cost of
tapping and transport
3.10 InventoriesFinished Goods Manufactured From Agricultural Produce of Biological AssetsThese are valued at the lower of cost
and estimated net realisable value. Net
realisable value is the estimated selling
price at which stocks can be sold in the
ordinary course of business after allowing
for cost of realisation and/or cost of
conversion from their existing state to
saleable condition.
Input Material, Spares and ConsumablesAt actual cost on weighted average basis.
Agricultural Produce Harvested from Biological AssetsAgricultural produce harvested from its
biological assets are measured at their
fair value less cost to sell at the point of
harvest. The finished and semi-finished
inventories from agriculture produce are
valued by adding the cost of conversion to
the fair value of the agricultural produce.
3.11 Trade and Other ReceivablesTrade and other receivables are stated at
their estimated realisable amounts inclusive
of provisions for bad and doubtful debts.
3.12 Cash and Cash EquivalentsCash and cash equivalents comprise
cash balances and call deposits. Bank
overdrafts that are repayable on demand
form an integral part of the Group’s cash
management and are included as a
component of cash and cash equivalents
for the purpose of the Statement of Cash
Flows.
3.13 Impairment of Non-Financial Assets
The Group assesses, at each reporting
date, whether there is an indication that
an asset may be impaired. If any indication
exists, or when annual impairment
testing for an asset is required, the Group
estimates the asset’s recoverable amount.
An asset’s recoverable amount is the higher
of an asset’s or cash-generating unit’s
(CGU) fair value less costs of disposal and
its value in use. The recoverable amount is
determined for an individual asset, unless
the asset does not generate cash inflows
that are largely independent of those from
other assets or groups of assets. When
the carrying amount of an asset or CGU
exceeds its recoverable amount, the asset
is considered impaired and is written down
to its recoverable amount.
In assessing value in use, the estimated future
cash flows are discounted to their present
Notes to the Financial Statements Contd.
221
KELANI VALLEY PLANTATIONS PLC
Annual Report 2017/18
Fin
anci
al
Rep
ort
s
value using a pre-tax discount rate that
reflects current market assessments of the
time value of money and the risks specific to
the asset. In determining fair value less costs
of disposal, recent market transactions are
taken into account. If no such transactions
can be identified, an appropriate valuation
model is used. These calculations are
corroborated by valuation multiples, quoted
share prices for publicly traded companies or
other available fair value indicators.
The Group bases its impairment
calculation on detailed budgets and
forecast calculations, which are prepared
separately for each of the Group’s CGUs to
which the individual assets are allocated.
These budgets and forecast calculations
generally cover a period of five years. For
longer periods, a long-term growth rate
is calculated and applied to project future
cash flows after the fifth year.
Impairment losses of continuing operations,
including impairment on inventories, are
recognised in the Statement of Profit or
Loss in expense categories consistent
with the function of the impaired asset,
except for properties previously revalued
with the revaluation taken to OCI. For such
properties, the impairment is recognised
in OCI up to the amount of any previous
revaluation.
For assets excluding goodwill, an
assessment is made at each reporting date
to determine whether there is an indication
that previously recognised impairment
losses no longer exist or have decreased. If
such indication exists, the Group estimates
the asset’s or CGU’s recoverable amount.
A previously recognised impairment loss is
reversed only if there has been a change
in the assumptions used to determine
the asset’s recoverable amount since
the last impairment loss was recognised.
The reversal is limited so that the carrying
amount of the asset does not exceed
its recoverable amount, nor exceed the
carrying amount that would have been
determined, net of depreciation, had no
impairment loss been recognised for
the asset in prior years. Such reversal
is recognised in the Statement of Profit
or Loss unless the asset is carried at
a revalued amount, in which case, the
reversal is treated as a revaluation increase.
Goodwill is tested for impairment annually
as at 31 March and when circumstances
indicate that the carrying value may be
impaired.
Impairment is determined for goodwill
by assessing the recoverable amount of
each CGU (or group of CGUs) to which
the goodwill relates. When the recoverable
amount of the CGU is less than its carrying
amount, an impairment loss is recognised.
Impairment losses relating to goodwill
cannot be reversed in future periods.
Intangible assets with indefinite useful lives
are tested for impairment annually as at 31
March at the CGU level, as appropriate,
and when circumstances indicate that the
carrying value may be impaired.
3.14 ProvisionsProvisions are recognised when the
Group has a present obligation (legal
or constructive) as a result of a past
event, it is probable that an outflow of
resources embodying economic benefits
will be required to settle the obligation
and a reliable estimate can be made of
the amount of the obligation. When the
Group expects some or all of a provision
to be reimbursed, the reimbursement is
recognised as a separate asset, but only
when the reimbursement is virtually certain.
The expense relating to any provision is
presented in the Statement of Profit or
Loss net of any reimbursement.
3.15 Employees Benefits(a) Defined Contribution Plans -
Provident Funds and Trust FundA defined contribution plan is a post-
employment benefit plan under which
an entity pays fixed contributions into
a separate entity and will have no legal
or constructive obligation to pay further
amounts. Obligations for contributions
to Provident and Trust Funds covering all
employees are recognised as an expense
in profit and loss in the periods during
which services are rendered by employees.
The Company contributes 12% on
consolidated salary of the employees to
Ceylon Planters’ Provident Society (CPPS)/
Estate Staff Provident Society (ESPS)/
Employees’ Provident Fund (EPF).
222
KELANI VALLEY PLANTATIONS PLC
Annual Report 2017/18
All the employees of the Company are
members of the Employees’ Trust Fund, to
which the Company contributes 3% on the
consolidated salary of such employees.
(b) Defined Benefit PlanA defined benefit plan is a post-employment
benefit plan other than a defined
contribution plan. The liability recognised
in the Financial Statements in respect
of defined benefit plan is the present
value of the defined benefit obligation at
the Reporting date. The defined benefit
obligation is calculated annually using the
projected unit credit method. The present
value of the defined benefit obligation is
determined by discounting the estimated
future cash flows using the interest rates
that are denominated in the currency in
which the benefits will be paid, and that
have terms to maturity approximating to
the terms of the related liability. Actuarial
gains and losses arising from experience
adjustments and changes in actuarial
assumptions are recognised as in retained
earnings through comprehensive income.
Past service costs are recognised
immediately in Statement of Profit or Loss
The provision has been made for retirement
gratuities from the first year of service for
all employees, in conformity with LKAS 19,
Employee Benefits. However, under the
Payment of Gratuity Act No. 12 of 1983,
the liability to an employee arises only on
completion of 5 years of continued service.
The Liability is not externally funded.
The key assumptions used in determining
the retirement benefit obligations are given
in Note 25.
3.16 Trade and Other PayablesTrade and other payables are stated at
their costs.
3.17 Capital Commitments and Contingencies
Capital commitments and contingent
liabilities of the Group have been disclosed
in the respective Notes to the Financial
Statements.
3.18 Events Occurring after the Reporting Date
All material events after the Statement
of Financial Position date have been
considered where appropriate; either
adjustments have been made or adequately
disclosed in the Financial Statements.
3.19 Earnings per ShareThe Group presents basic and diluted
earnings per share (EPS) for its ordinary
shares. Basic EPS is calculated by dividing
the profit or loss attributable to ordinary
shareholders of the Company by the
weighted average number of ordinary
shares outstanding during the period.
Diluted EPS is determined by adjusting
the profit or loss attributable to ordinary
shareholders and the weighted average
number of ordinary shares outstanding for
the effects of all dilutive potential ordinary
shares.
3.20 Deferred Income3.20.1 Grants and Subsidies
Government grants are recognised where
there is reasonable assurance that the
grant will be received and all attached
conditions will be complied with. When
the grant relates to an expense item,
it is recognised as income over the
period necessary to match the grant on
a systematic basis to the costs that it is
intended to compensate. Where the grant
relates to an asset, it is recognised as
deferred income and released to income in
equal amounts over the expected useful life
of the related asset.
Where the Group receives non-monetary
grants, the asset and the grant are
recorded gross at nominal amounts and
released to the Statement of Profit or
Loss over the expected useful life and
pattern of consumption of the benefit
of the underlying asset by equal annual
installments. Where loans or similar
assistance are provided by governments
or related institutions with an interest rate
below the current applicable market rate,
the effect of this favourable interest is
regarded as additional government grant.
Grants related to Property, Plant and
Equipment other than grants received for
forestry are initially deferred and allocated
to income on a systematic basis over
Notes to the Financial Statements Contd.
223
KELANI VALLEY PLANTATIONS PLC
Annual Report 2017/18
Fin
anci
al
Rep
ort
s
the useful life of the related Property,
Plant and Equipment as follows: Assets
are amortised over their useful lives or
unexpired lease period, whichever is less.
Buildings 40 years
Sanitation & water supply 20 years
Plant & equipment 13 1/3
years
Grants received for forestry are initially
deferred and credited to income once
when the related blocks of trees are
harvested.
3.21 Statement of Profit or LossFor the purpose of presentation of
Statement of Profit or Loss, the function
of expenses method is adopted, as it
represents fairly the elements of the
Group’s performance.
3.21.1 Revenue
Revenue is recognised to the extent that
it is probable that the economic benefits
will flow to the Group and the revenue can
be reliably measured, regardless of when
the payment is being made. Revenue
is measured at the fair value of the
consideration received or receivable, taking
into account contractually defined terms of
payment and excluding taxes or duty.
(a) Revenue from the sale of goods
is recognised when the significant
risks and rewards of ownership of
the goods have passed to the buyer,
usually on delivery of the goods.
Revenue is recorded at invoice value
net of brokerage, sale expenses and
other levies related to revenue.
(b) Gains and losses on disposal of an
item of Property, Plant and Equipment
are determined by comparing the
net sales proceeds with the carrying
amounts of Property, Plant and
Equipment and are recognised
within ‘other operating income’ in the
Statement of Profit or Loss.
(c) For all financial instruments measured
at amortised cost and interest-bearing
financial assets classified as AFS,
interest income is recorded using
the effective interest rate (EIR). EIR
is the rate that exactly discounts the
estimated future cash payments or
receipts over the expected life of
the financial instrument or a shorter
period, where appropriate, to the net
carrying amount of the financial asset
or liability. Interest income is included
in finance income in the Statement of
Profit or Loss.
(d) Dividend is recognised when the
Group’s right to receive the payment
is established, which is generally when
shareholders approve the dividend.
(e) Rental income arising from operating
leases on investment properties is
accounted for on a straight-line basis
over the lease terms.
3.21.2 Expenses
All expenditure incurred in the running
of the business and in maintaining the
Property, Plant and Equipment in a state of
efficiency is charged to revenue in arriving
at the profit/(loss) for the year.
3.21.2.1 Financing Income and Finance
cost
Finance income comprises interest income
on funds invested. Interest income is
recognised as it accrues in profit or loss.
Finance costs comprise interest expense
on borrowings, unwinding of the discount
on provisions, changes in the fair value
of financial assets at fair value through
profit or loss, and losses on hedging
instruments that are recognised in profit or
loss. Borrowing costs that are not directly
attributable to the acquisition, construction
or production of a qualifying asset are
recognised in profit or loss using the
effective interest method.
The interest expense component of finance
lease payments is allocated to each period
during the lease term so as to produce a
constant periodic rate of interest on the
remaining balance of the liability.
Foreign currency gains and losses are
reported on a net basis.
3.21.2.2 Taxes
3.21.2.2.1 Current Income Tax
Current income tax assets and liabilities
are measured at the amount expected to
224
KELANI VALLEY PLANTATIONS PLC
Annual Report 2017/18
be recovered from or paid to the taxation
authorities. The tax rates and tax laws used
to compute the amount are those that are
enacted or substantively enacted, at the
reporting date in the countries where the
Group operates and generates taxable
income.
Current income tax relating to items
recognised directly in equity is recognised
in equity and not in the statement of profit
or loss. Management periodically evaluates
positions taken in the tax returns with
respect to situations in which applicable tax
regulations are subject to interpretation and
establishes provisions where appropriate.
3.21.2.2.2 Deferred Tax
Deferred tax is provided using the liability
method on temporary differences between
the tax bases of assets and liabilities
and their carrying amounts for financial
reporting purposes at the reporting date.
Deferred tax liabilities are recognised for all
taxable temporary differences, except:
When the deferred tax liability arises
from the initial recognition of goodwill
or an asset or liability in a transaction
that is not a business combination
and, at the time of the transaction,
affects neither the accounting profit
nor taxable profit or loss
In respect of taxable temporary
differences associated with
investments in subsidiaries, associates
and interests in joint ventures,
when the timing of the reversal of
the temporary differences can be
controlled and it is probable that the
temporary differences will not reverse
in the foreseeable future.
Deferred tax assets are recognised for
all deductible temporary differences, the
carry forward of unused tax credits and
any unused tax losses. Deferred tax assets
are recognised to the extent that it is
probable that taxable profit will be available
against which the deductible temporary
differences, and the carry forward of
unused tax credits and unused tax losses
can be utilised, except:
When the deferred tax asset relating
to the deductible temporary difference
arises from the initial recognition of an
asset or liability in a transaction that
is not a business combination and,
at the time of the transaction, affects
neither the accounting profit nor
taxable profit or loss
In respect of deductible temporary
differences associated with
investments in subsidiaries, associates
and interests in joint ventures, deferred
tax assets are recognised only to
the extent that it is probable that the
temporary differences will reverse in
the foreseeable future and taxable
profit will be available against which
the temporary differences can be
utilized.
The carrying amount of deferred tax assets
is reviewed at each reporting date and
reduced to the extent that it is no longer
probable that sufficient taxable profit will be
available to allow all or part of the deferred
tax asset to be utilised. Unrecognised
deferred tax assets are re-assessed at
each reporting date and are recognised to
the extent that it has become probable that
future taxable profits will allow the deferred
tax asset to be recovered.
Deferred tax assets and liabilities are
measured at the tax rates that are
expected to apply in the year when the
asset is realised or the liability is settled,
based on tax rates (and tax laws) that have
been enacted or substantively enacted at
the reporting date.
Deferred tax relating to items recognised
outside profit or loss is recognised outside
profit or loss. Deferred tax items are
recognised in correlation to the underlying
transaction either in OCI or directly in equity.
Deferred tax assets and deferred tax
liabilities are offset if a legally enforceable
right exists to set off current tax assets
against current tax liabilities and the
deferred taxes relate to the same taxable
entity and the same taxation authority.
Tax benefits acquired as part of a business
combination, but not satisfying the criteria
for separate recognition at that date, are
recognised subsequently if new information
about facts and circumstances change.
The adjustment is either treated as a
reduction in goodwill (as long as it does not
exceed goodwill) if it was incurred during
the measurement period or recognised in
profit or loss.
Notes to the Financial Statements Contd.
225
KELANI VALLEY PLANTATIONS PLC
Annual Report 2017/18
Fin
anci
al
Rep
ort
s
3.22 Statement of Cash FlowThe Statement of Cash Flow has been
prepared using the ‘indirect method’.
Interest paid is classified as operating cash
flows, interest and dividends received are
classified as investing cash flows while
dividends paid and Government grants
received are classified as financing cash
flows, for the purpose of presenting the
Cash Flow Statement.
3.23 Segment ReportingSegmental information is provided for the
different business segments of the Group.
An operating segment is a component
of the Group that engages in business
activities from which it may earn revenues
and incur expenses, including revenues
and expenses that relate to transactions
with any of the Group’s other components.
Since the individual segments are located
close to each other and operate in the
same industrial environment, the need for
geographical segmentation has no material
impact.
The activities of the segments are
described in note 36 in the Notes to the
Financial Statements. The Group transfers
products from one industry segment for
use in another. Inter-segment transfers are
based on fair market prices.
Revenue and expenses directly attributable
to each segment are allocated to the
respective segments. Revenue and
expenses not directly attributable to a
segment are allocated on the basis of their
resource utilisation, wherever possible.
Assets and liabilities directly attributable
to each segment are allocated to the
respective segments. Assets and liabilities,
which are not directly attributable to a
segment, are allocated on a reasonable
basis wherever possible. Unallocated items
comprise mainly interest bearing loans,
borrowings, and expenses.
Segment capital expenditure is the total
cost incurred during the period to acquire
segment assets that are expected to be
used for more than one accounting period.
All operating segments’ operating results
are reviewed regularly to make decisions
about resources to be allocated to the
segment and assess its performance, and
for which discrete financial information is
available.
4 USE OF ESTIMATES AND JUDGMENTS
The preparation of the Group’s
Consolidated Financial Statements requires
management to make judgements,
estimates and assumptions that affect
the reported amounts of revenues,
expenses, assets and liabilities, and
the accompanying disclosures, and
the disclosure of contingent liabilities.
Uncertainty about these assumptions
and estimates could result in outcomes
that require a material adjustment to the
carrying amount of assets or liabilities
affected in future periods.
Estimates and underlying assumptions are
reviewed on an ongoing basis. Revisions to
accounting estimates are recognised in the
period in which the estimate is revised, if
the revision affects only that period and any
future periods affected.
Information about significant areas
of estimation uncertainty and critical
judgments in applying accounting policies
that have the most significant effect on
the amounts recognised in the Financial
Statements is included in the following
notes:
4.1 TaxationDeferred tax assets are recognised for
unused tax losses to the extent that it is
probable that taxable profit will be available
against which the losses can be utilised.
Significant management judgement is
required to determine the amount of
deferred tax assets that can be recognised,
based upon the likely timing and the level
of future taxable profits together with future
tax planning strategies. Unused tax losses
as of 31 March 2018 are given in Note
10B.
Deferred tax assets and liabilities are
measured at the tax rates that are
expected to apply in the year when the
asset is realised or the liability is settled,
based on tax rates (and tax laws) that have
been enacted or substantively enacted
226
KELANI VALLEY PLANTATIONS PLC
Annual Report 2017/18
at the reporting date. As per the Inland
Revenue Act no 24 of 2017 (ACT), in
the case of a company predominantly
conducting an agricultural business, the
applicable income tax rate is 14%. As per
the above Act, “Predominantly” is defined
as 80% or more calculated based on
gross income. The “Agriculture business”
is defined in section 195 (1) as business
of producing agricultural, horticultural
or any animal produce and includes an
undertaking for the purpose of rearing
livestock or poultry. Based on the legal
expert opinion obtained, the management
is of the view that the company is
predominantly engaged in agricultural
business.
4.2 Measurement of Retirement Benefit Obligation
The present value of the retirement benefit
obligations depends on a number of
factors that are determined on an actuarial
basis using a number of assumptions.
Key assumptions used in determining
the retirement benefit obligations are
given in Note 25. Any changes in these
assumptions will impact the carrying
amount of retirement benefit obligations.
4.3 Fair Valuation of Biological AssetsThe fair value of managed timber depends
on number of factors that are determined
on a discounted method using various
financial and non financial assumptions.
The growth of the trees is determined
by various biological factors that are
highly unpredictable. Any change to the
assumptions will impact to the fair value
of biological assets. Key assumptions and
sensitivity analysis of the biological assets
are given in the Note 14.
4.4 Impairment of Non-financial Assets
Impairment exists when the carrying
value of an asset or cash generating unit
exceeds its recoverable amount, which
is the higher of its fair value less costs
of disposal and its value in use. The fair
value less costs of disposal calculation
is based on available data from binding
sales transactions, conducted at arm’s
length, for similar assets or observable
market prices less incremental costs for
disposing of the asset. The value in use
calculation is based on a DCF model. The
cash flows are derived from the budget
for the next five years and do not include
restructuring activities that the Group is
not yet committed to or significant future
investments that will enhance the asset’s
performance of the CGU being tested.
The recoverable amount is sensitive to the
discount rate used for the DCF model as
well as the expected future cash-inflows
and the growth rate used for extrapolation
purposes. These estimates are most
relevant to goodwill and other intangibles
with indefinite useful lives recognised by
the Group.
5 STANDARDS ISSUED BUT NOT YET EFFECTIVE
Standards issued but not yet effective
up to the date of issuance of the Group’s
financial statements are listed below. This
listing of standards and interpretations
issued are those that the Group reasonably
expects to have an impact on disclosures,
financial position or performance when
applied at a future date. The Group intends
to adopt these standards when they
become effective.
SLFRS 9 -Financial Instruments: Classification and Measurement
SLFRS 9, as issued reflects the first
phase of work on replacement of LKAS
39 and applies to classification and
measurement of financial assets and
liabilities. This standard was originally
effective for annual periods commencing
on or after 01 January 2018.
SLFRS 15 -Revenue from Contracts with Customers
SLFRS 15 establishes a comprehensive
framework for determining whether, how
much and when revenue is recognised.
It replaces existing revenue recognition
Notes to the Financial Statements Contd.
227
KELANI VALLEY PLANTATIONS PLC
Annual Report 2017/18
Fin
anci
al
Rep
ort
s
guidance, including LKAS 18 Revenue,
LKAS 11 Construction Contracts and IFRIC
13 Customer Loyalty Programmes. This
standard is effective for the annual periods
beginning on or after 01 January 2018.
SLFRS 16 - LeasesSLFRS 16 sets out the principles for the
recognition, measurement, presentation
and disclosure of leases and requires
lessees to account for all leases under a
single on balance sheet model similar to
the accounting for finance leases, under
LKAS 17 except for few exemptions for
leases for “low value” assets and short
term leases with a lease term of 12 months
or less. This standard is effective for the
annual periods beginning on or after 01
January 2019.
Pending the detailed review of such
standards and interpretations, the extent of
the impact has not been determined by the
management.
Amendments to Existing Accounting StandardsLKAS 7 - Statement of Cash Flows
The amendment requires an entity to
disclose information that enables users of
financial statements to evaluate changes
in liabilities arising from financing activities,
including both changes arising from cash
flows and non-cash changes.
Accordingly an entity shall disclose the
following changes in liabilities arising from
financing activities:
Changes from financing cash flows
Changes arising from obtaining or
losing control of subsidiaries or other
businesses
Changes in fair values and
Other changes
Necessary disclosures have been given
under Note 19 to the Financial Statements.
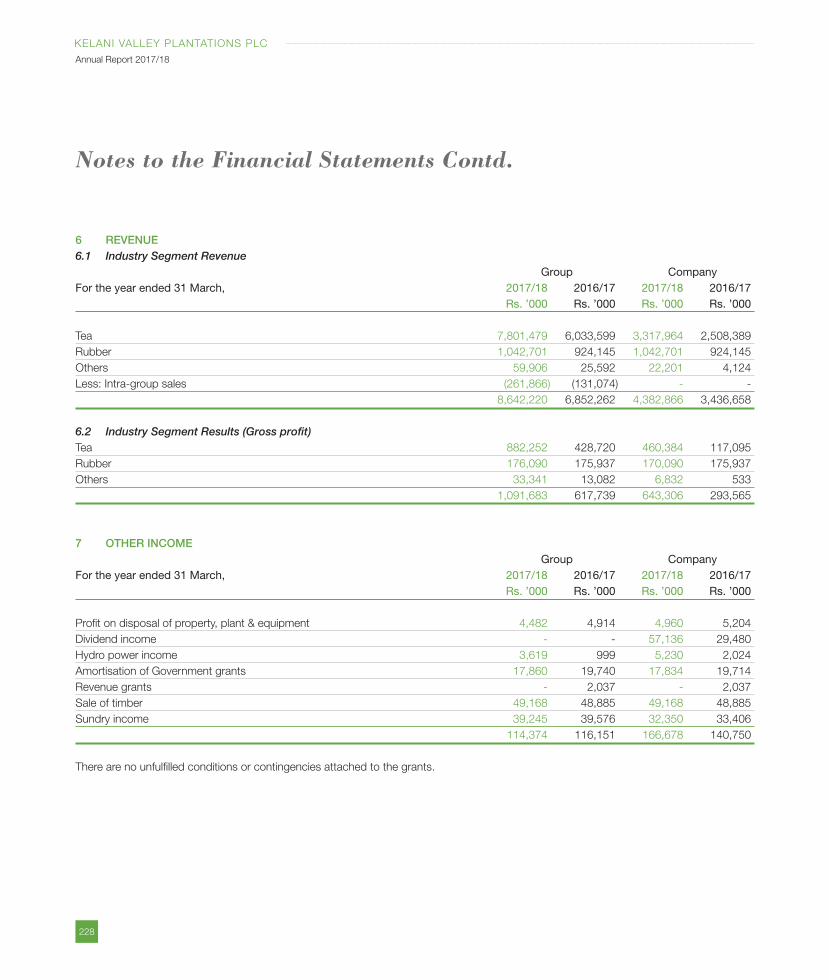
228
KELANI VALLEY PLANTATIONS PLC
Annual Report 2017/18
6 REVENUE6.1 Industry Segment Revenue Group CompanyFor the year ended 31 March, 2017/18 2016/17 2017/18 2016/17 Rs. ’000 Rs. ’000 Rs. ’000 Rs. ’000
Tea 7,801,479 6,033,599 3,317,964 2,508,389
Rubber 1,042,701 924,145 1,042,701 924,145
Others 59,906 25,592 22,201 4,124
Less: Intra-group sales (261,866) (131,074) - -
8,642,220 6,852,262 4,382,866 3,436,658
6.2 Industry Segment Results (Gross profit)Tea 882,252 428,720 460,384 117,095
Rubber 176,090 175,937 170,090 175,937
Others 33,341 13,082 6,832 533
1,091,683 617,739 643,306 293,565
7 OTHER INCOME Group CompanyFor the year ended 31 March, 2017/18 2016/17 2017/18 2016/17 Rs. ’000 Rs. ’000 Rs. ’000 Rs. ’000
Profit on disposal of property, plant & equipment 4,482 4,914 4,960 5,204
Dividend income - - 57,136 29,480
Hydro power income 3,619 999 5,230 2,024
Amortisation of Government grants 17,860 19,740 17,834 19,714
Revenue grants - 2,037 - 2,037
Sale of timber 49,168 48,885 49,168 48,885
Sundry income 39,245 39,576 32,350 33,406
114,374 116,151 166,678 140,750
There are no unfulfilled conditions or contingencies attached to the grants.
Notes to the Financial Statements Contd.
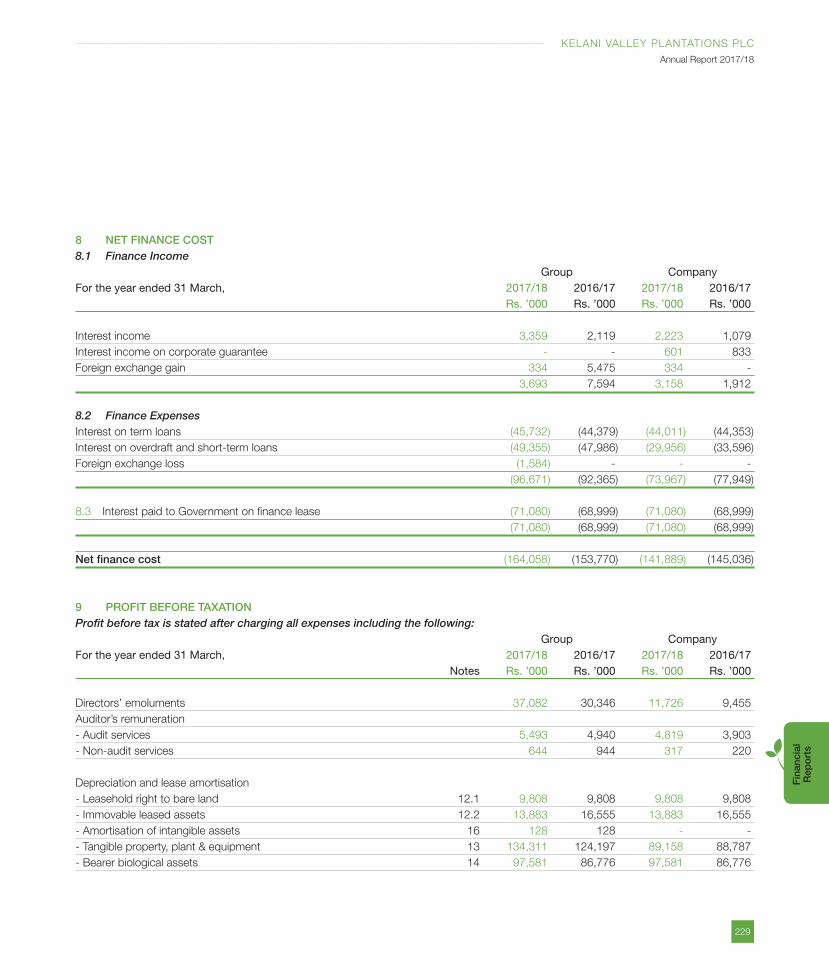
229
KELANI VALLEY PLANTATIONS PLC
Annual Report 2017/18
Fin
anci
al
Rep
ort
s
8 NET FINANCE COST8.1 Finance Income Group CompanyFor the year ended 31 March, 2017/18 2016/17 2017/18 2016/17 Rs. ’000 Rs. ’000 Rs. ’000 Rs. ’000
Interest income 3,359 2,119 2,223 1,079
Interest income on corporate guarantee - - 601 833
Foreign exchange gain 334 5,475 334 -
3,693 7,594 3,158 1,912
8.2 Finance ExpensesInterest on term loans (45,732) (44,379) (44,011) (44,353)
Interest on overdraft and short-term loans (49,355) (47,986) (29,956) (33,596)
Foreign exchange loss (1,584) - - -
(96,671) (92,365) (73,967) (77,949)
8.3 Interest paid to Government on finance lease (71,080) (68,999) (71,080) (68,999)
(71,080) (68,999) (71,080) (68,999)
Net finance cost (164,058) (153,770) (141,889) (145,036)
9 PROFIT BEFORE TAXATIONProfit before tax is stated after charging all expenses including the following: Group CompanyFor the year ended 31 March, 2017/18 2016/17 2017/18 2016/17 Notes Rs. ’000 Rs. ’000 Rs. ’000 Rs. ’000
Directors’ emoluments 37,082 30,346 11,726 9,455
Auditor’s remuneration
- Audit services 5,493 4,940 4,819 3,903
- Non-audit services 644 944 317 220
Depreciation and lease amortisation
- Leasehold right to bare land 12.1 9,808 9,808 9,808 9,808
- Immovable leased assets 12.2 13,883 16,555 13,883 16,555
- Amortisation of intangible assets 16 128 128 - -
- Tangible property, plant & equipment 13 134,311 124,197 89,158 88,787
- Bearer biological assets 14 97,581 86,776 97,581 86,776
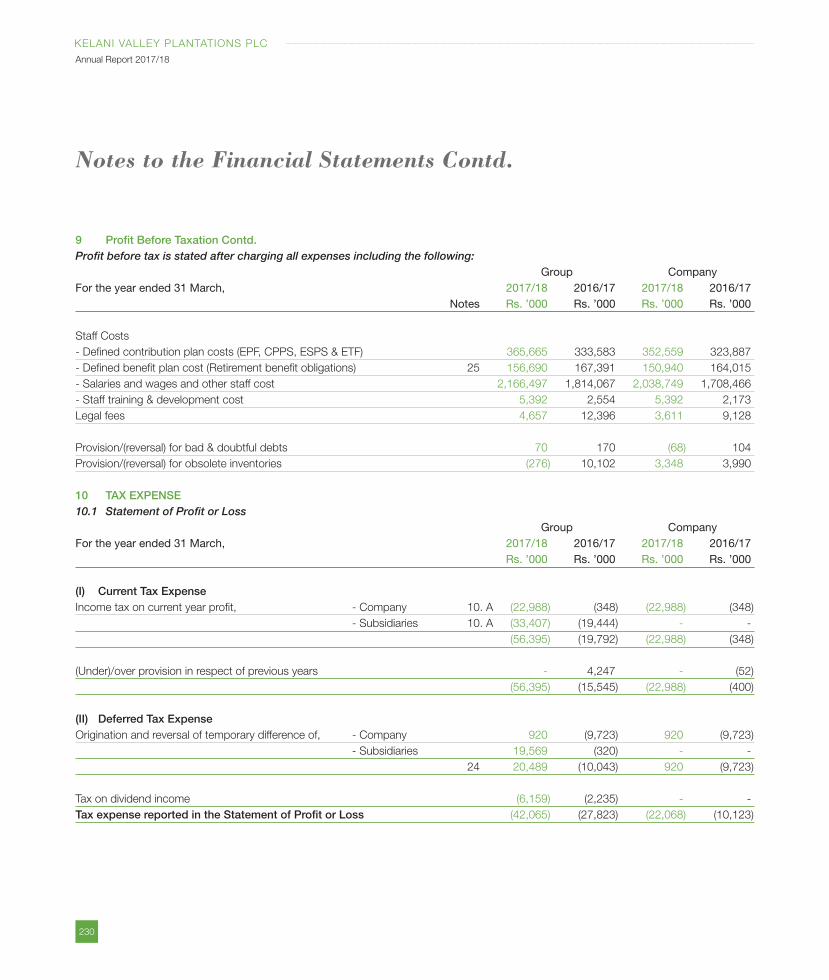
230
KELANI VALLEY PLANTATIONS PLC
Annual Report 2017/18
9 Profit Before Taxation Contd.Profit before tax is stated after charging all expenses including the following: Group CompanyFor the year ended 31 March, 2017/18 2016/17 2017/18 2016/17 Notes Rs. ’000 Rs. ’000 Rs. ’000 Rs. ’000
Staff Costs
- Defined contribution plan costs (EPF, CPPS, ESPS & ETF) 365,665 333,583 352,559 323,887
- Defined benefit plan cost (Retirement benefit obligations) 25 156,690 167,391 150,940 164,015
- Salaries and wages and other staff cost 2,166,497 1,814,067 2,038,749 1,708,466
- Staff training & development cost 5,392 2,554 5,392 2,173
Legal fees 4,657 12,396 3,611 9,128
Provision/(reversal) for bad & doubtful debts 70 170 (68) 104
Provision/(reversal) for obsolete inventories (276) 10,102 3,348 3,990
10 TAX EXPENSE10.1 Statement of Profit or Loss Group CompanyFor the year ended 31 March, 2017/18 2016/17 2017/18 2016/17 Rs. ’000 Rs. ’000 Rs. ’000 Rs. ’000
(I) Current Tax ExpenseIncome tax on current year profit, - Company 10. A (22,988) (348) (22,988) (348)
- Subsidiaries 10. A (33,407) (19,444) - -
(56,395) (19,792) (22,988) (348)
(Under)/over provision in respect of previous years - 4,247 - (52)
(56,395) (15,545) (22,988) (400)
(II) Deferred Tax ExpenseOrigination and reversal of temporary difference of, - Company 920 (9,723) 920 (9,723)
- Subsidiaries 19,569 (320) - -
24 20,489 (10,043) 920 (9,723)
Tax on dividend income (6,159) (2,235) - -
Tax expense reported in the Statement of Profit or Loss (42,065) (27,823) (22,068) (10,123)
Notes to the Financial Statements Contd.
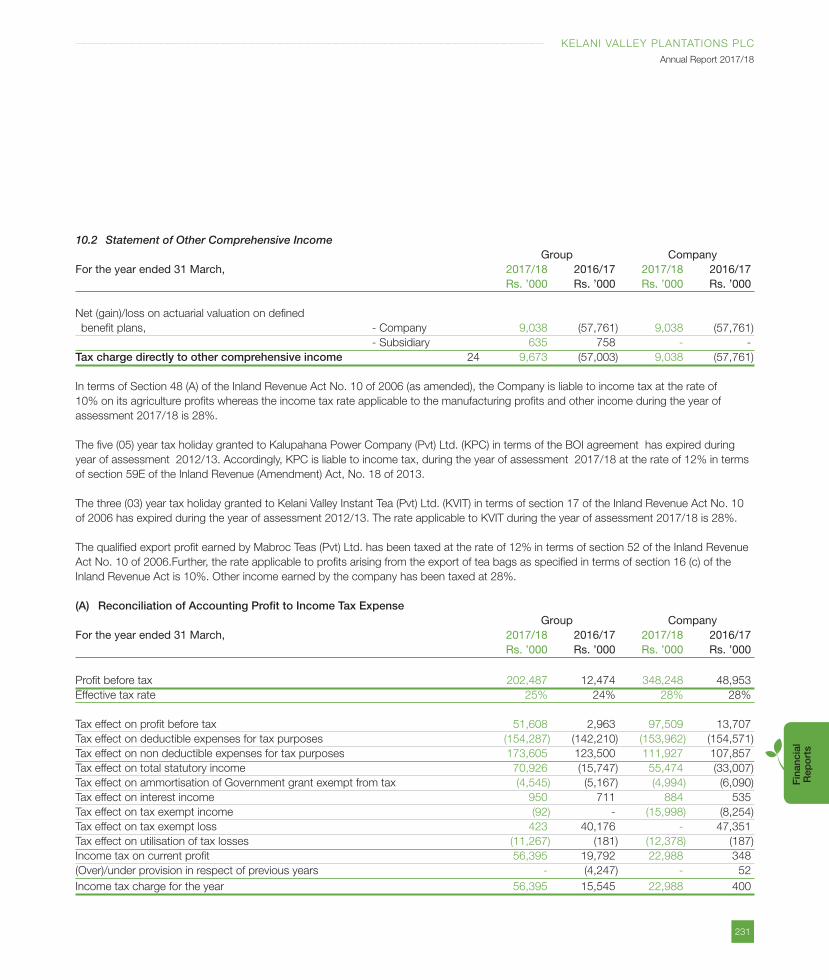
231
KELANI VALLEY PLANTATIONS PLC
Annual Report 2017/18
Fin
anci
al
Rep
ort
s
10.2 Statement of Other Comprehensive Income Group CompanyFor the year ended 31 March, 2017/18 2016/17 2017/18 2016/17 Rs. ’000 Rs. ’000 Rs. ’000 Rs. ’000
Net (gain)/loss on actuarial valuation on defined
benefit plans, - Company 9,038 (57,761) 9,038 (57,761)
- Subsidiary 635 758 - -
Tax charge directly to other comprehensive income 24 9,673 (57,003) 9,038 (57,761)
In terms of Section 48 (A) of the Inland Revenue Act No. 10 of 2006 (as amended), the Company is liable to income tax at the rate of
10% on its agriculture profits whereas the income tax rate applicable to the manufacturing profits and other income during the year of
assessment 2017/18 is 28%.
The five (05) year tax holiday granted to Kalupahana Power Company (Pvt) Ltd. (KPC) in terms of the BOI agreement has expired during
year of assessment 2012/13. Accordingly, KPC is liable to income tax, during the year of assessment 2017/18 at the rate of 12% in terms
of section 59E of the Inland Revenue (Amendment) Act, No. 18 of 2013.
The three (03) year tax holiday granted to Kelani Valley Instant Tea (Pvt) Ltd. (KVIT) in terms of section 17 of the Inland Revenue Act No. 10
of 2006 has expired during the year of assessment 2012/13. The rate applicable to KVIT during the year of assessment 2017/18 is 28%.
The qualified export profit earned by Mabroc Teas (Pvt) Ltd. has been taxed at the rate of 12% in terms of section 52 of the Inland Revenue
Act No. 10 of 2006.Further, the rate applicable to profits arising from the export of tea bags as specified in terms of section 16 (c) of the
Inland Revenue Act is 10%. Other income earned by the company has been taxed at 28%.
(A) Reconciliation of Accounting Profit to Income Tax Expense Group CompanyFor the year ended 31 March, 2017/18 2016/17 2017/18 2016/17 Rs. ’000 Rs. ’000 Rs. ’000 Rs. ’000
Profit before tax 202,487 12,474 348,248 48,953
Effective tax rate 25% 24% 28% 28%
Tax effect on profit before tax 51,608 2,963 97,509 13,707
Tax effect on deductible expenses for tax purposes (154,287) (142,210) (153,962) (154,571)
Tax effect on non deductible expenses for tax purposes 173,605 123,500 111,927 107,857
Tax effect on total statutory income 70,926 (15,747) 55,474 (33,007)
Tax effect on ammortisation of Government grant exempt from tax (4,545) (5,167) (4,994) (6,090)
Tax effect on interest income 950 711 884 535
Tax effect on tax exempt income (92) - (15,998) (8,254)
Tax effect on tax exempt loss 423 40,176 - 47,351
Tax effect on utilisation of tax losses (11,267) (181) (12,378) (187)
Income tax on current profit 56,395 19,792 22,988 348
(Over)/under provision in respect of previous years - (4,247) - 52
Income tax charge for the year 56,395 15,545 22,988 400
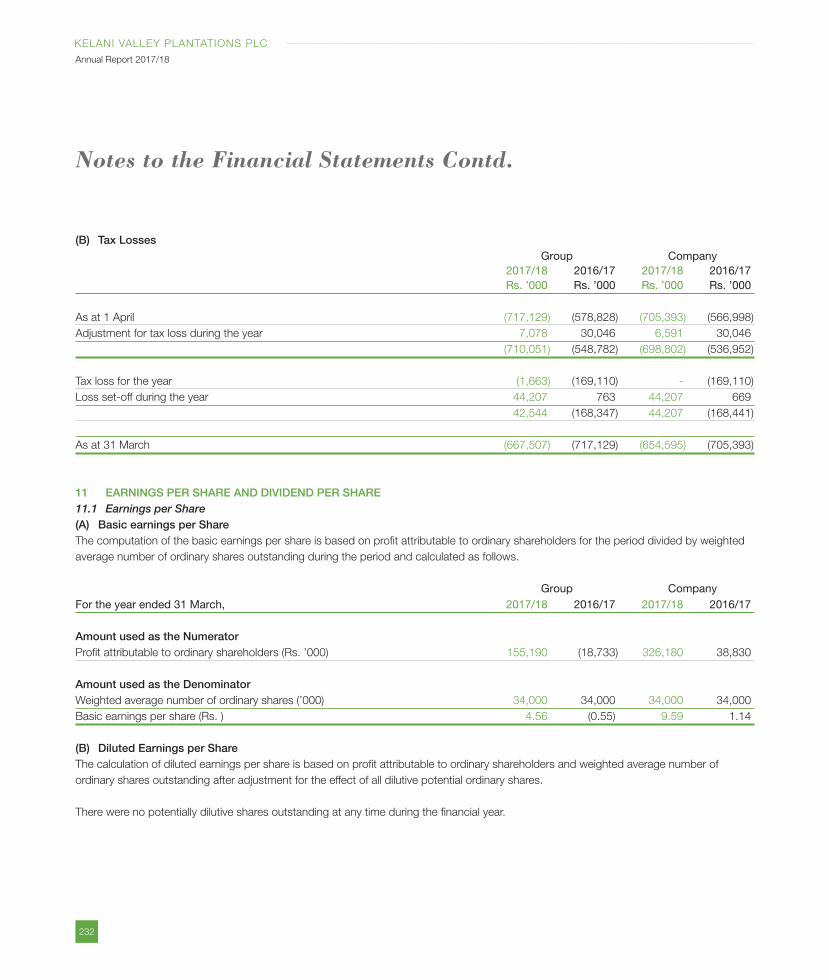
232
KELANI VALLEY PLANTATIONS PLC
Annual Report 2017/18
(B) Tax Losses Group Company 2017/18 2016/17 2017/18 2016/17 Rs. ’000 Rs. ’000 Rs. ’000 Rs. ’000
As at 1 April (717,129) (578,828) (705,393) (566,998)
Adjustment for tax loss during the year 7,078 30,046 6,591 30,046
(710,051) (548,782) (698,802) (536,952)
Tax loss for the year (1,663) (169,110) - (169,110)
Loss set-off during the year 44,207 763 44,207 669
42,544 (168,347) 44,207 (168,441)
As at 31 March (667,507) (717,129) (654,595) (705,393)
11 EARNINGS PER SHARE AND DIVIDEND PER SHARE11.1 Earnings per Share(A) Basic earnings per ShareThe computation of the basic earnings per share is based on profit attributable to ordinary shareholders for the period divided by weighted
average number of ordinary shares outstanding during the period and calculated as follows.
Group CompanyFor the year ended 31 March, 2017/18 2016/17 2017/18 2016/17
Amount used as the NumeratorProfit attributable to ordinary shareholders (Rs. ’000) 155,190 (18,733) 326,180 38,830
Amount used as the DenominatorWeighted average number of ordinary shares (’000) 34,000 34,000 34,000 34,000
Basic earnings per share (Rs. ) 4.56 (0.55) 9.59 1.14
(B) Diluted Earnings per ShareThe calculation of diluted earnings per share is based on profit attributable to ordinary shareholders and weighted average number of
ordinary shares outstanding after adjustment for the effect of all dilutive potential ordinary shares.
There were no potentially dilutive shares outstanding at any time during the financial year.
Notes to the Financial Statements Contd.
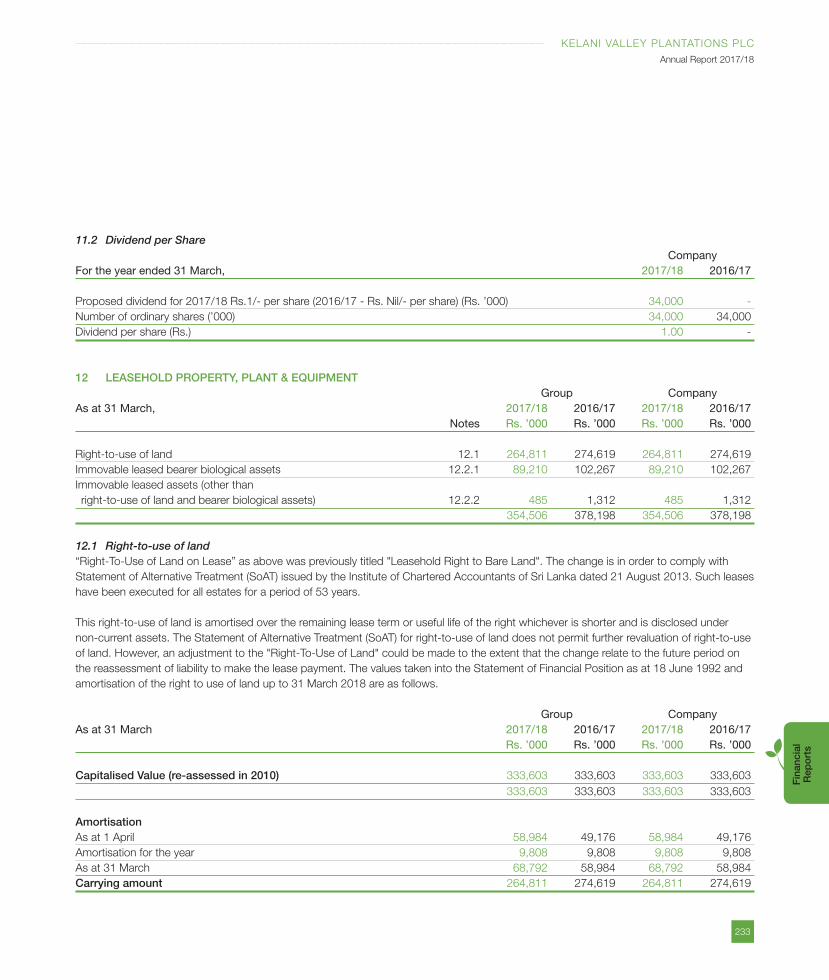
233
KELANI VALLEY PLANTATIONS PLC
Annual Report 2017/18
Fin
anci
al
Rep
ort
s
11.2 Dividend per Share CompanyFor the year ended 31 March, 2017/18 2016/17
Proposed dividend for 2017/18 Rs.1/- per share (2016/17 - Rs. Nil/- per share) (Rs. ’000) 34,000 -
Number of ordinary shares (’000) 34,000 34,000
Dividend per share (Rs.) 1.00 -
12 LEASEHOLD PROPERTY, PLANT & EQUIPMENT Group CompanyAs at 31 March, 2017/18 2016/17 2017/18 2016/17 Notes Rs. ’000 Rs. ’000 Rs. ’000 Rs. ’000
Right-to-use of land 12.1 264,811 274,619 264,811 274,619
Immovable leased bearer biological assets 12.2.1 89,210 102,267 89,210 102,267
Immovable leased assets (other than
right-to-use of land and bearer biological assets) 12.2.2 485 1,312 485 1,312
354,506 378,198 354,506 378,198
12.1 Right-to-use of land“Right-To-Use of Land on Lease” as above was previously titled "Leasehold Right to Bare Land". The change is in order to comply with
Statement of Alternative Treatment (SoAT) issued by the Institute of Chartered Accountants of Sri Lanka dated 21 August 2013. Such leases
have been executed for all estates for a period of 53 years.
This right-to-use of land is amortised over the remaining lease term or useful life of the right whichever is shorter and is disclosed under
non-current assets. The Statement of Alternative Treatment (SoAT) for right-to-use of land does not permit further revaluation of right-to-use
of land. However, an adjustment to the "Right-To-Use of Land" could be made to the extent that the change relate to the future period on
the reassessment of liability to make the lease payment. The values taken into the Statement of Financial Position as at 18 June 1992 and
amortisation of the right to use of land up to 31 March 2018 are as follows.
Group CompanyAs at 31 March 2017/18 2016/17 2017/18 2016/17 Rs. ’000 Rs. ’000 Rs. ’000 Rs. ’000
Capitalised Value (re-assessed in 2010) 333,603 333,603 333,603 333,603
333,603 333,603 333,603 333,603
AmortisationAs at 1 April 58,984 49,176 58,984 49,176
Amortisation for the year 9,808 9,808 9,808 9,808
As at 31 March 68,792 58,984 68,792 58,984
Carrying amount 264,811 274,619 264,811 274,619
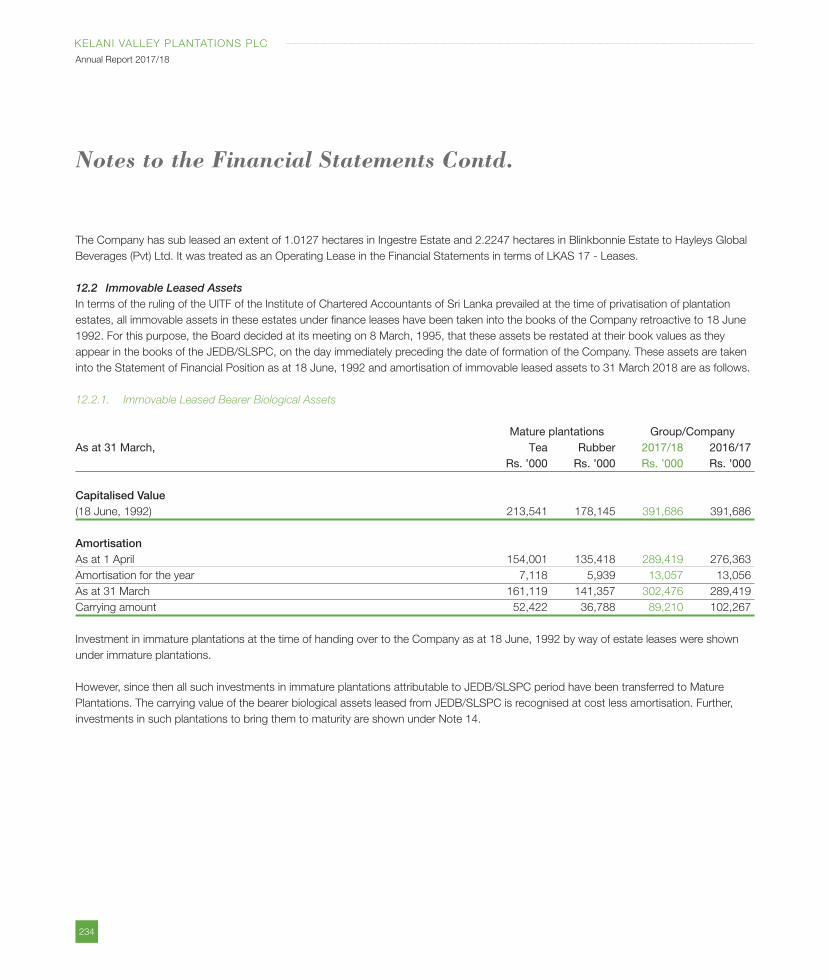
234
KELANI VALLEY PLANTATIONS PLC
Annual Report 2017/18
The Company has sub leased an extent of 1.0127 hectares in Ingestre Estate and 2.2247 hectares in Blinkbonnie Estate to Hayleys Global
Beverages (Pvt) Ltd. It was treated as an Operating Lease in the Financial Statements in terms of LKAS 17 - Leases.
12.2 Immovable Leased AssetsIn terms of the ruling of the UITF of the Institute of Chartered Accountants of Sri Lanka prevailed at the time of privatisation of plantation
estates, all immovable assets in these estates under finance leases have been taken into the books of the Company retroactive to 18 June
1992. For this purpose, the Board decided at its meeting on 8 March, 1995, that these assets be restated at their book values as they
appear in the books of the JEDB/SLSPC, on the day immediately preceding the date of formation of the Company. These assets are taken
into the Statement of Financial Position as at 18 June, 1992 and amortisation of immovable leased assets to 31 March 2018 are as follows.
12.2.1. Immovable Leased Bearer Biological Assets
Mature plantations Group/CompanyAs at 31 March, Tea Rubber 2017/18 2016/17 Rs. ’000 Rs. ’000 Rs. ’000 Rs. ’000
Capitalised Value(18 June, 1992) 213,541 178,145 391,686 391,686
AmortisationAs at 1 April 154,001 135,418 289,419 276,363
Amortisation for the year 7,118 5,939 13,057 13,056
As at 31 March 161,119 141,357 302,476 289,419
Carrying amount 52,422 36,788 89,210 102,267
Investment in immature plantations at the time of handing over to the Company as at 18 June, 1992 by way of estate leases were shown
under immature plantations.
However, since then all such investments in immature plantations attributable to JEDB/SLSPC period have been transferred to Mature
Plantations. The carrying value of the bearer biological assets leased from JEDB/SLSPC is recognised at cost less amortisation. Further,
investments in such plantations to bring them to maturity are shown under Note 14.
Notes to the Financial Statements Contd.
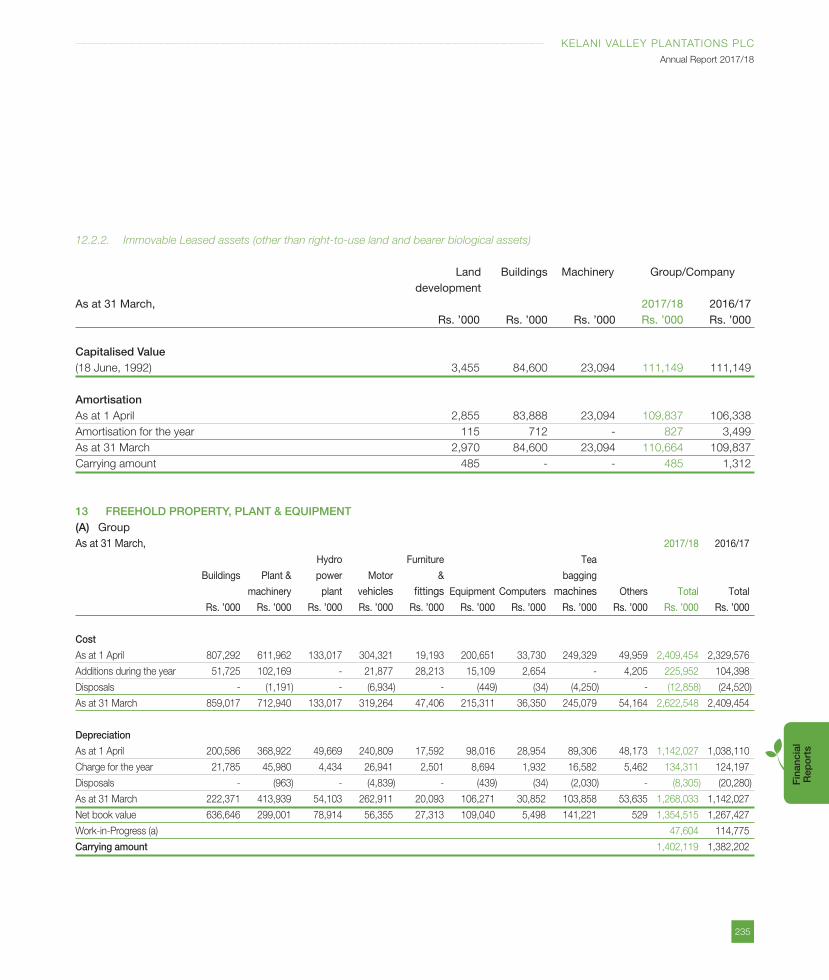
235
KELANI VALLEY PLANTATIONS PLC
Annual Report 2017/18
Fin
anci
al
Rep
ort
s
12.2.2. Immovable Leased assets (other than right-to-use land and bearer biological assets)
Land Buildings Machinery Group/Company developmentAs at 31 March, 2017/18 2016/17 Rs. ’000 Rs. ’000 Rs. ’000 Rs. ’000 Rs. ’000
Capitalised Value(18 June, 1992) 3,455 84,600 23,094 111,149 111,149
AmortisationAs at 1 April 2,855 83,888 23,094 109,837 106,338
Amortisation for the year 115 712 - 827 3,499
As at 31 March 2,970 84,600 23,094 110,664 109,837
Carrying amount 485 - - 485 1,312
13 FREEHOLD PROPERTY, PLANT & EQUIPMENT(A) GroupAs at 31 March, 2017/18 2016/17
Hydro Furniture Tea
Buildings Plant & power Motor & bagging
machinery plant vehicles fittings Equipment Computers machines Others Total Total
Rs. ’000 Rs. ’000 Rs. ’000 Rs. ’000 Rs. ’000 Rs. ’000 Rs. ’000 Rs. ’000 Rs. ’000 Rs. ’000 Rs. ’000
Cost
As at 1 April 807,292 611,962 133,017 304,321 19,193 200,651 33,730 249,329 49,959 2,409,454 2,329,576
Additions during the year 51,725 102,169 - 21,877 28,213 15,109 2,654 - 4,205 225,952 104,398
Disposals - (1,191) - (6,934) - (449) (34) (4,250) - (12,858) (24,520)
As at 31 March 859,017 712,940 133,017 319,264 47,406 215,311 36,350 245,079 54,164 2,622,548 2,409,454
Depreciation
As at 1 April 200,586 368,922 49,669 240,809 17,592 98,016 28,954 89,306 48,173 1,142,027 1,038,110
Charge for the year 21,785 45,980 4,434 26,941 2,501 8,694 1,932 16,582 5,462 134,311 124,197
Disposals - (963) - (4,839) - (439) (34) (2,030) - (8,305) (20,280)
As at 31 March 222,371 413,939 54,103 262,911 20,093 106,271 30,852 103,858 53,635 1,268,033 1,142,027
Net book value 636,646 299,001 78,914 56,355 27,313 109,040 5,498 141,221 529 1,354,515 1,267,427
Work-in-Progress (a) 47,604 114,775
Carrying amount 1,402,119 1,382,202
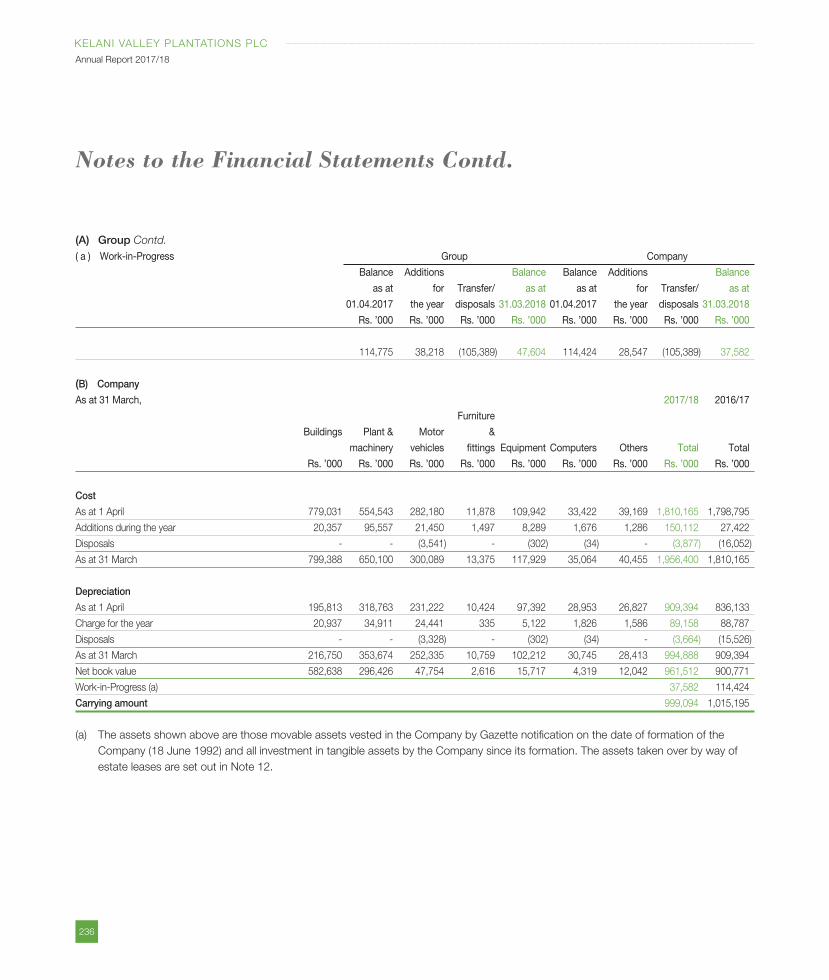
236
KELANI VALLEY PLANTATIONS PLC
Annual Report 2017/18
(A) Group Contd.
( a ) Work-in-Progress Group Company
Balance Additions Balance Balance Additions Balance
as at for Transfer/ as at as at for Transfer/ as at
01.04.2017 the year disposals 31.03.2018 01.04.2017 the year disposals 31.03.2018
Rs. ’000 Rs. ’000 Rs. ’000 Rs. ’000 Rs. ’000 Rs. ’000 Rs. ’000 Rs. ’000
114,775 38,218 (105,389) 47,604 114,424 28,547 (105,389) 37,582
(B) Company
As at 31 March, 2017/18 2016/17
Furniture
Buildings Plant & Motor &
machinery vehicles fittings Equipment Computers Others Total Total
Rs. ’000 Rs. ’000 Rs. ’000 Rs. ’000 Rs. ’000 Rs. ’000 Rs. ’000 Rs. ’000 Rs. ’000
Cost
As at 1 April 779,031 554,543 282,180 11,878 109,942 33,422 39,169 1,810,165 1,798,795
Additions during the year 20,357 95,557 21,450 1,497 8,289 1,676 1,286 150,112 27,422
Disposals - - (3,541) - (302) (34) - (3,877) (16,052)
As at 31 March 799,388 650,100 300,089 13,375 117,929 35,064 40,455 1,956,400 1,810,165
Depreciation
As at 1 April 195,813 318,763 231,222 10,424 97,392 28,953 26,827 909,394 836,133
Charge for the year 20,937 34,911 24,441 335 5,122 1,826 1,586 89,158 88,787
Disposals - - (3,328) - (302) (34) - (3,664) (15,526)
As at 31 March 216,750 353,674 252,335 10,759 102,212 30,745 28,413 994,888 909,394
Net book value 582,638 296,426 47,754 2,616 15,717 4,319 12,042 961,512 900,771
Work-in-Progress (a) 37,582 114,424
Carrying amount 999,094 1,015,195
(a) The assets shown above are those movable assets vested in the Company by Gazette notification on the date of formation of the
Company (18 June 1992) and all investment in tangible assets by the Company since its formation. The assets taken over by way of
estate leases are set out in Note 12.
Notes to the Financial Statements Contd.
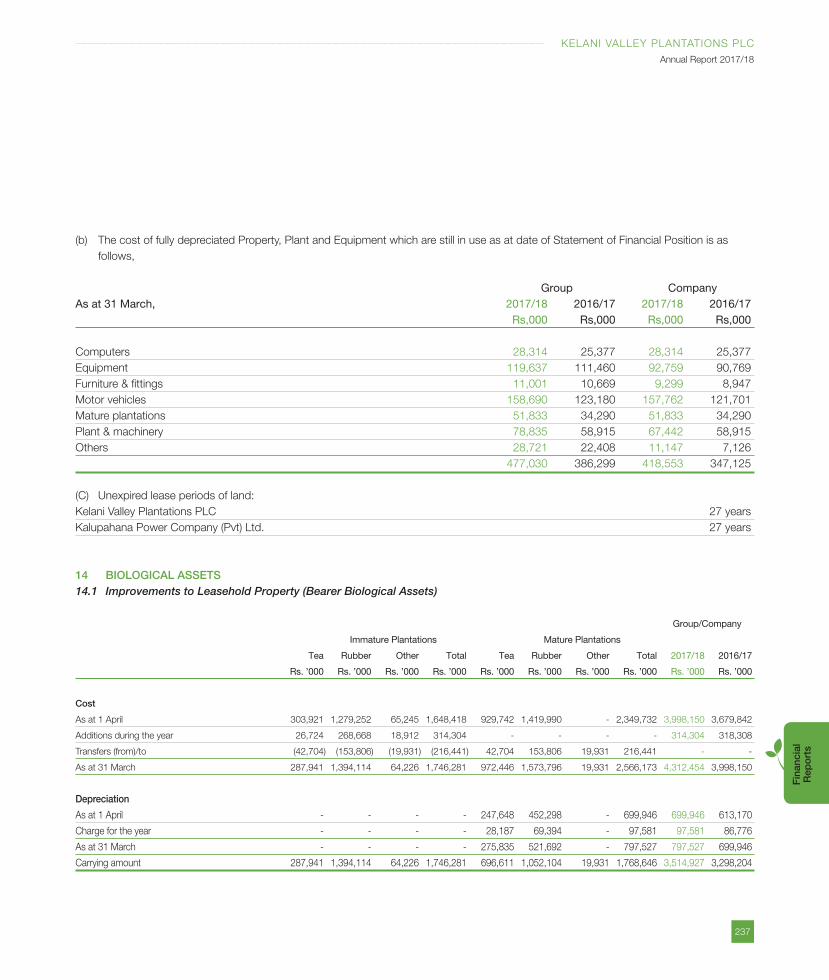
237
KELANI VALLEY PLANTATIONS PLC
Annual Report 2017/18
Fin
anci
al
Rep
ort
s
(b) The cost of fully depreciated Property, Plant and Equipment which are still in use as at date of Statement of Financial Position is as
follows,
Group CompanyAs at 31 March, 2017/18 2016/17 2017/18 2016/17 Rs,000 Rs,000 Rs,000 Rs,000
Computers 28,314 25,377 28,314 25,377
Equipment 119,637 111,460 92,759 90,769
Furniture & fittings 11,001 10,669 9,299 8,947
Motor vehicles 158,690 123,180 157,762 121,701
Mature plantations 51,833 34,290 51,833 34,290
Plant & machinery 78,835 58,915 67,442 58,915
Others 28,721 22,408 11,147 7,126
477,030 386,299 418,553 347,125
(C) Unexpired lease periods of land:
Kelani Valley Plantations PLC 27 years
Kalupahana Power Company (Pvt) Ltd. 27 years
14 BIOLOGICAL ASSETS14.1 Improvements to Leasehold Property (Bearer Biological Assets)
Group/Company
Immature Plantations Mature Plantations
Tea Rubber Other Total Tea Rubber Other Total 2017/18 2016/17
Rs. ’000 Rs. ’000 Rs. ’000 Rs. ’000 Rs. ’000 Rs. ’000 Rs. ’000 Rs. ’000 Rs. ’000 Rs. ’000
Cost
As at 1 April 303,921 1,279,252 65,245 1,648,418 929,742 1,419,990 - 2,349,732 3,998,150 3,679,842
Additions during the year 26,724 268,668 18,912 314,304 - - - - 314,304 318,308
Transfers (from)/to (42,704) (153,806) (19,931) (216,441) 42,704 153,806 19,931 216,441 - -
As at 31 March 287,941 1,394,114 64,226 1,746,281 972,446 1,573,796 19,931 2,566,173 4,312,454 3,998,150
Depreciation
As at 1 April - - - - 247,648 452,298 - 699,946 699,946 613,170
Charge for the year - - - - 28,187 69,394 - 97,581 97,581 86,776
As at 31 March - - - - 275,835 521,692 - 797,527 797,527 699,946
Carrying amount 287,941 1,394,114 64,226 1,746,281 696,611 1,052,104 19,931 1,768,646 3,514,927 3,298,204
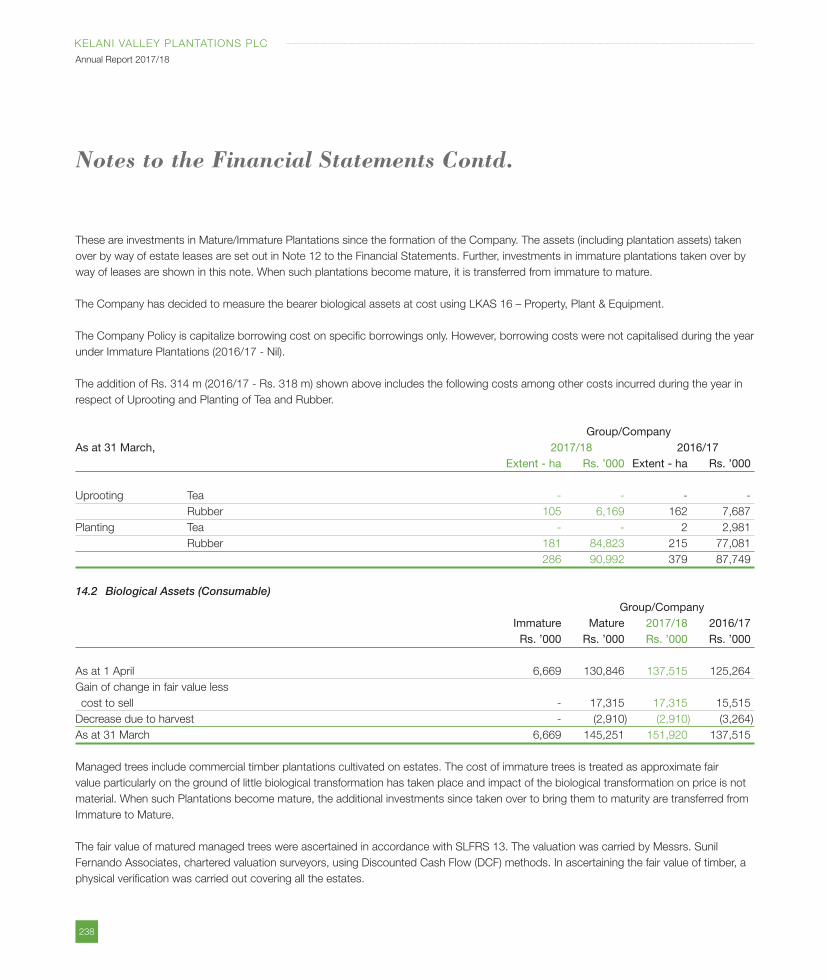
238
KELANI VALLEY PLANTATIONS PLC
Annual Report 2017/18
These are investments in Mature/Immature Plantations since the formation of the Company. The assets (including plantation assets) taken
over by way of estate leases are set out in Note 12 to the Financial Statements. Further, investments in immature plantations taken over by
way of leases are shown in this note. When such plantations become mature, it is transferred from immature to mature.
The Company has decided to measure the bearer biological assets at cost using LKAS 16 – Property, Plant & Equipment.
The Company Policy is capitalize borrowing cost on specific borrowings only. However, borrowing costs were not capitalised during the year
under Immature Plantations (2016/17 - Nil).
The addition of Rs. 314 m (2016/17 - Rs. 318 m) shown above includes the following costs among other costs incurred during the year in
respect of Uprooting and Planting of Tea and Rubber.
Group/CompanyAs at 31 March, 2017/18 2016/17 Extent - ha Rs. ’000 Extent - ha Rs. ’000
Uprooting Tea - - - -
Rubber 105 6,169 162 7,687
Planting Tea - - 2 2,981
Rubber 181 84,823 215 77,081
286 90,992 379 87,749
14.2 Biological Assets (Consumable) Group/Company Immature Mature 2017/18 2016/17 Rs. ’000 Rs. ’000 Rs. ’000 Rs. ’000
As at 1 April 6,669 130,846 137,515 125,264
Gain of change in fair value less
cost to sell - 17,315 17,315 15,515
Decrease due to harvest - (2,910) (2,910) (3,264)
As at 31 March 6,669 145,251 151,920 137,515
Managed trees include commercial timber plantations cultivated on estates. The cost of immature trees is treated as approximate fair
value particularly on the ground of little biological transformation has taken place and impact of the biological transformation on price is not
material. When such Plantations become mature, the additional investments since taken over to bring them to maturity are transferred from
Immature to Mature.
The fair value of matured managed trees were ascertained in accordance with SLFRS 13. The valuation was carried by Messrs. Sunil
Fernando Associates, chartered valuation surveyors, using Discounted Cash Flow (DCF) methods. In ascertaining the fair value of timber, a
physical verification was carried out covering all the estates.
Notes to the Financial Statements Contd.
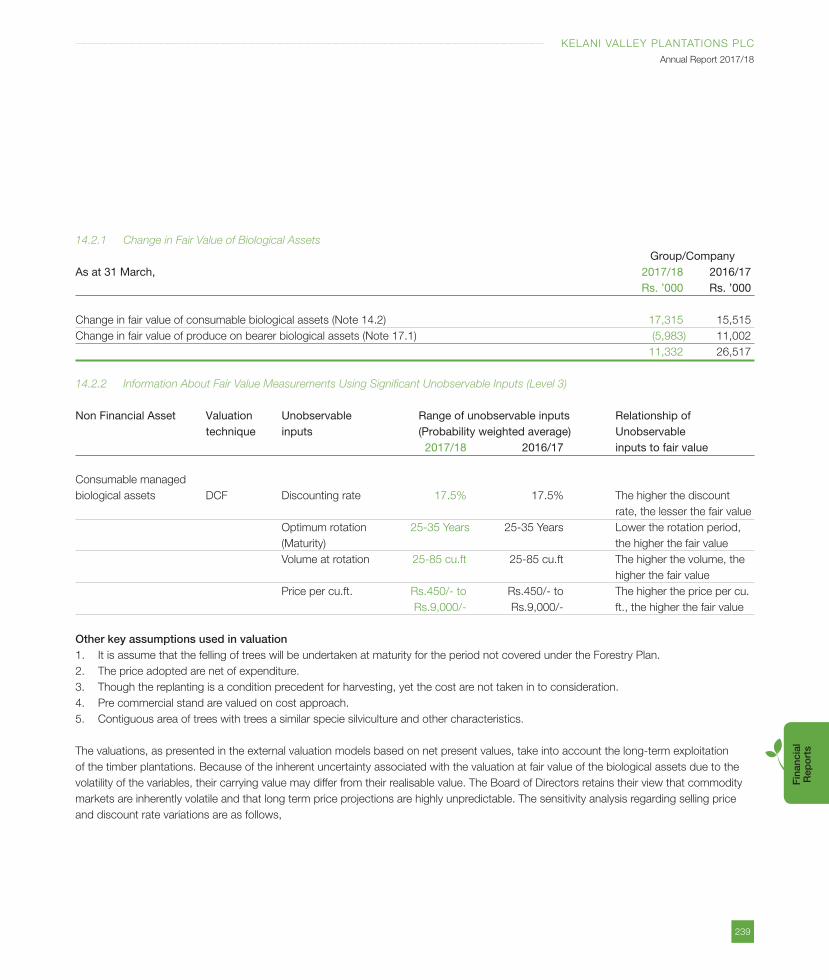
239
KELANI VALLEY PLANTATIONS PLC
Annual Report 2017/18
Fin
anci
al
Rep
ort
s
14.2.1 Change in Fair Value of Biological Assets
Group/CompanyAs at 31 March, 2017/18 2016/17 Rs. ’000 Rs. ’000
Change in fair value of consumable biological assets (Note 14.2) 17,315 15,515
Change in fair value of produce on bearer biological assets (Note 17.1) (5,983) 11,002
11,332 26,517
14.2.2 Information About Fair Value Measurements Using Significant Unobservable Inputs (Level 3)
Non Financial Asset Valuation Unobservable Range of unobservable inputs Relationship of technique inputs (Probability weighted average) Unobservable 2017/18 2016/17 inputs to fair value
Consumable managed
biological assets DCF Discounting rate 17.5% 17.5% The higher the discount
rate, the lesser the fair value
Optimum rotation 25-35 Years 25-35 Years Lower the rotation period,
(Maturity) the higher the fair value
Volume at rotation 25-85 cu.ft 25-85 cu.ft The higher the volume, the
higher the fair value
Price per cu.ft. Rs.450/- to Rs.450/- to The higher the price per cu.
Rs.9,000/- Rs.9,000/- ft., the higher the fair value
Other key assumptions used in valuation1. It is assume that the felling of trees will be undertaken at maturity for the period not covered under the Forestry Plan.
2. The price adopted are net of expenditure.
3. Though the replanting is a condition precedent for harvesting, yet the cost are not taken in to consideration.
4. Pre commercial stand are valued on cost approach.
5. Contiguous area of trees with trees a similar specie silviculture and other characteristics.
The valuations, as presented in the external valuation models based on net present values, take into account the long-term exploitation
of the timber plantations. Because of the inherent uncertainty associated with the valuation at fair value of the biological assets due to the
volatility of the variables, their carrying value may differ from their realisable value. The Board of Directors retains their view that commodity
markets are inherently volatile and that long term price projections are highly unpredictable. The sensitivity analysis regarding selling price
and discount rate variations are as follows,
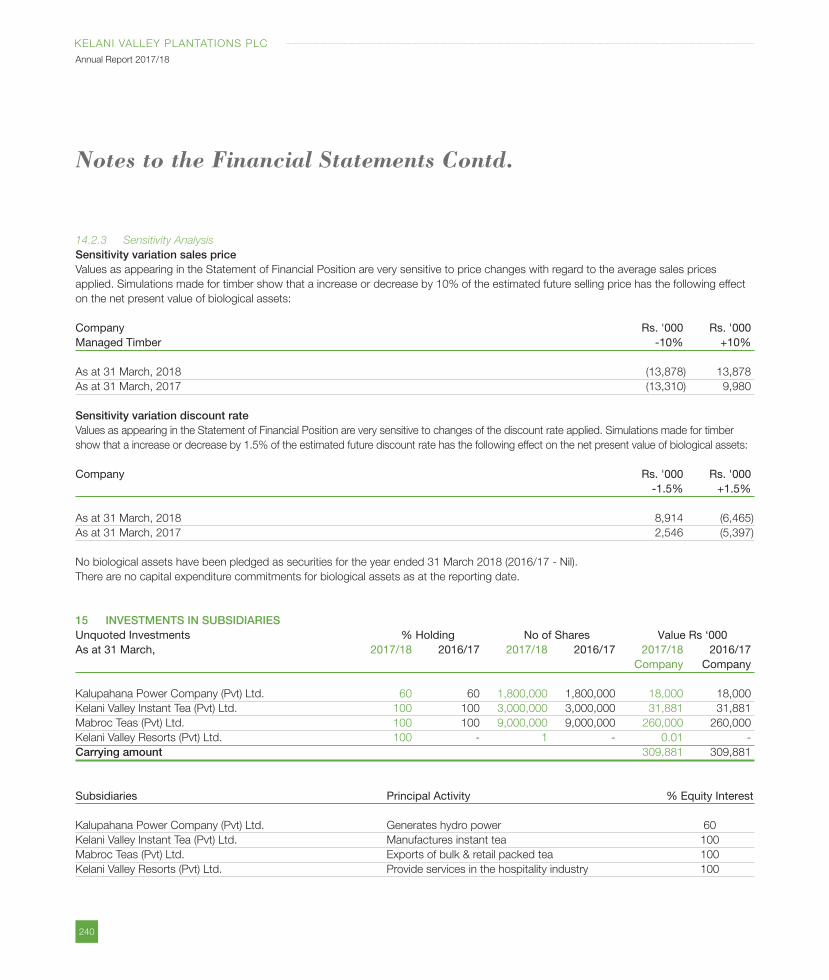
240
KELANI VALLEY PLANTATIONS PLC
Annual Report 2017/18
14.2.3 Sensitivity Analysis
Sensitivity variation sales priceValues as appearing in the Statement of Financial Position are very sensitive to price changes with regard to the average sales prices
applied. Simulations made for timber show that a increase or decrease by 10% of the estimated future selling price has the following effect
on the net present value of biological assets:
Company Rs. '000 Rs. '000Managed Timber -10% +10%
As at 31 March, 2018 (13,878) 13,878
As at 31 March, 2017 (13,310) 9,980
Sensitivity variation discount rateValues as appearing in the Statement of Financial Position are very sensitive to changes of the discount rate applied. Simulations made for timber
show that a increase or decrease by 1.5% of the estimated future discount rate has the following effect on the net present value of biological assets:
Company Rs. '000 Rs. '000 -1.5% +1.5%
As at 31 March, 2018 8,914 (6,465)
As at 31 March, 2017 2,546 (5,397)
No biological assets have been pledged as securities for the year ended 31 March 2018 (2016/17 - Nil).
There are no capital expenditure commitments for biological assets as at the reporting date.
15 INVESTMENTS IN SUBSIDIARIESUnquoted Investments % Holding No of Shares Value Rs ‘000As at 31 March, 2017/18 2016/17 2017/18 2016/17 2017/18 2016/17 Company Company
Kalupahana Power Company (Pvt) Ltd. 60 60 1,800,000 1,800,000 18,000 18,000
Kelani Valley Instant Tea (Pvt) Ltd. 100 100 3,000,000 3,000,000 31,881 31,881
Mabroc Teas (Pvt) Ltd. 100 100 9,000,000 9,000,000 260,000 260,000
Kelani Valley Resorts (Pvt) Ltd. 100 - 1 - 0.01 -
Carrying amount 309,881 309,881
Subsidiaries Principal Activity % Equity Interest
Kalupahana Power Company (Pvt) Ltd. Generates hydro power 60
Kelani Valley Instant Tea (Pvt) Ltd. Manufactures instant tea 100
Mabroc Teas (Pvt) Ltd. Exports of bulk & retail packed tea 100
Kelani Valley Resorts (Pvt) Ltd. Provide services in the hospitality industry 100
Notes to the Financial Statements Contd.
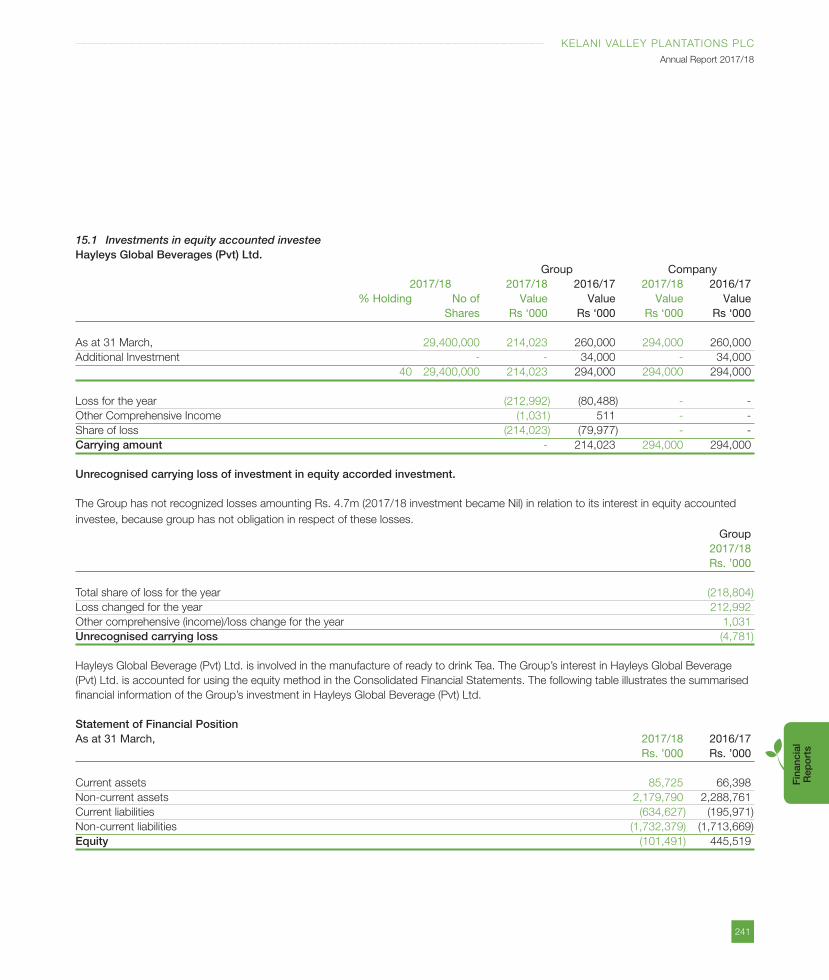
241
KELANI VALLEY PLANTATIONS PLC
Annual Report 2017/18
Fin
anci
al
Rep
ort
s
15.1 Investments in equity accounted investeeHayleys Global Beverages (Pvt) Ltd. Group Company 2017/18 2017/18 2016/17 2017/18 2016/17 % Holding No of Value Value Value Value Shares Rs ‘000 Rs ‘000 Rs ‘000 Rs ‘000
As at 31 March, 29,400,000 214,023 260,000 294,000 260,000
Additional Investment - - 34,000 - 34,000
40 29,400,000 214,023 294,000 294,000 294,000
Loss for the year (212,992) (80,488) - -
Other Comprehensive Income (1,031) 511 - -
Share of loss (214,023) (79,977) - -
Carrying amount - 214,023 294,000 294,000
Unrecognised carrying loss of investment in equity accorded investment.
The Group has not recognized losses amounting Rs. 4.7m (2017/18 investment became Nil) in relation to its interest in equity accounted
investee, because group has not obligation in respect of these losses.
Group 2017/18 Rs. ’000
Total share of loss for the year (218,804)
Loss changed for the year 212,992
Other comprehensive (income)/loss change for the year 1,031
Unrecognised carrying loss (4,781)
Hayleys Global Beverage (Pvt) Ltd. is involved in the manufacture of ready to drink Tea. The Group’s interest in Hayleys Global Beverage
(Pvt) Ltd. is accounted for using the equity method in the Consolidated Financial Statements. The following table illustrates the summarised
financial information of the Group’s investment in Hayleys Global Beverage (Pvt) Ltd.
Statement of Financial PositionAs at 31 March, 2017/18 2016/17 Rs. ’000 Rs. ’000
Current assets 85,725 66,398
Non-current assets 2,179,790 2,288,761
Current liabilities (634,627) (195,971)
Non-current liabilities (1,732,379) (1,713,669)
Equity (101,491) 445,519
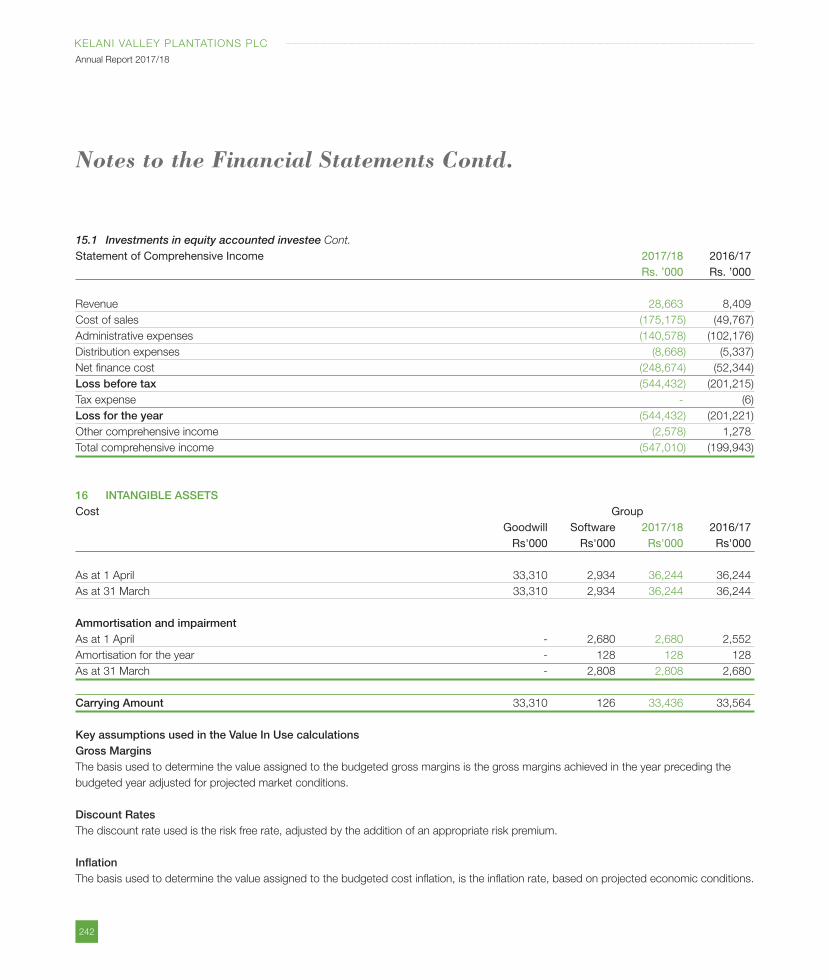
242
KELANI VALLEY PLANTATIONS PLC
Annual Report 2017/18
15.1 Investments in equity accounted investee Cont.
Statement of Comprehensive Income 2017/18 2016/17 Rs. ’000 Rs. ’000
Revenue 28,663 8,409
Cost of sales (175,175) (49,767)
Administrative expenses (140,578) (102,176)
Distribution expenses (8,668) (5,337)
Net finance cost (248,674) (52,344)
Loss before tax (544,432) (201,215)
Tax expense - (6)
Loss for the year (544,432) (201,221)
Other comprehensive income (2,578) 1,278
Total comprehensive income (547,010) (199,943)
16 INTANGIBLE ASSETSCost Group Goodwill Software 2017/18 2016/17 Rs'000 Rs'000 Rs'000 Rs'000
As at 1 April 33,310 2,934 36,244 36,244
As at 31 March 33,310 2,934 36,244 36,244
Ammortisation and impairmentAs at 1 April - 2,680 2,680 2,552
Amortisation for the year - 128 128 128
As at 31 March - 2,808 2,808 2,680
Carrying Amount 33,310 126 33,436 33,564
Key assumptions used in the Value In Use calculationsGross MarginsThe basis used to determine the value assigned to the budgeted gross margins is the gross margins achieved in the year preceding the
budgeted year adjusted for projected market conditions.
Discount RatesThe discount rate used is the risk free rate, adjusted by the addition of an appropriate risk premium.
InflationThe basis used to determine the value assigned to the budgeted cost inflation, is the inflation rate, based on projected economic conditions.
Notes to the Financial Statements Contd.
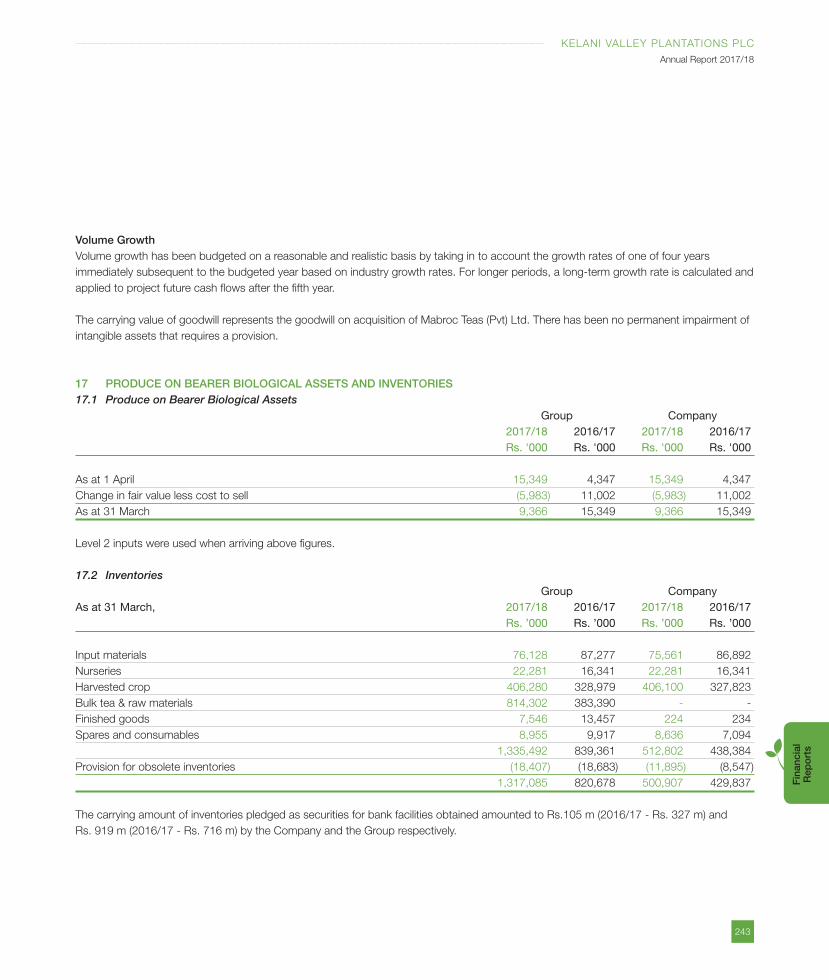
243
KELANI VALLEY PLANTATIONS PLC
Annual Report 2017/18
Fin
anci
al
Rep
ort
s
Volume GrowthVolume growth has been budgeted on a reasonable and realistic basis by taking in to account the growth rates of one of four years
immediately subsequent to the budgeted year based on industry growth rates. For longer periods, a long-term growth rate is calculated and
applied to project future cash flows after the fifth year.
The carrying value of goodwill represents the goodwill on acquisition of Mabroc Teas (Pvt) Ltd. There has been no permanent impairment of
intangible assets that requires a provision.
17 PRODUCE ON BEARER BIOLOGICAL ASSETS AND INVENTORIES17.1 Produce on Bearer Biological Assets Group Company 2017/18 2016/17 2017/18 2016/17 Rs. '000 Rs. '000 Rs. '000 Rs. '000
As at 1 April 15,349 4,347 15,349 4,347
Change in fair value less cost to sell (5,983) 11,002 (5,983) 11,002
As at 31 March 9,366 15,349 9,366 15,349
Level 2 inputs were used when arriving above figures.
17.2 Inventories Group CompanyAs at 31 March, 2017/18 2016/17 2017/18 2016/17 Rs. ’000 Rs. ’000 Rs. ’000 Rs. ’000
Input materials 76,128 87,277 75,561 86,892
Nurseries 22,281 16,341 22,281 16,341
Harvested crop 406,280 328,979 406,100 327,823
Bulk tea & raw materials 814,302 383,390 - -
Finished goods 7,546 13,457 224 234
Spares and consumables 8,955 9,917 8,636 7,094
1,335,492 839,361 512,802 438,384
Provision for obsolete inventories (18,407) (18,683) (11,895) (8,547)
1,317,085 820,678 500,907 429,837
The carrying amount of inventories pledged as securities for bank facilities obtained amounted to Rs.105 m (2016/17 - Rs. 327 m) and
Rs. 919 m (2016/17 - Rs. 716 m) by the Company and the Group respectively.
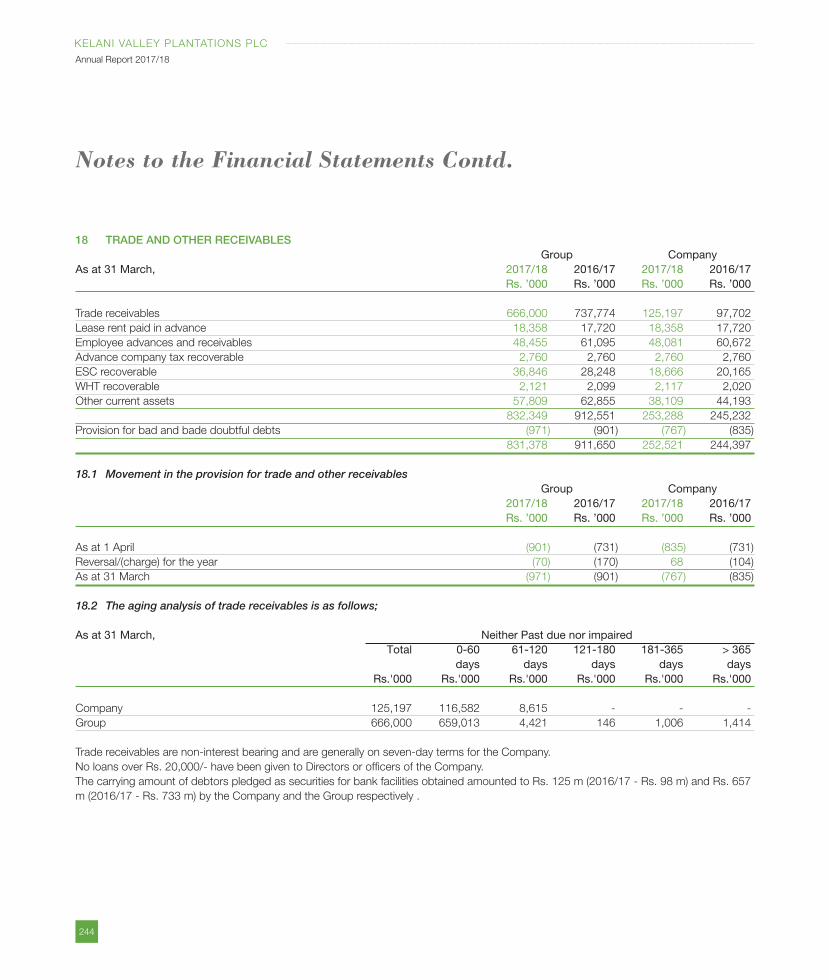
244
KELANI VALLEY PLANTATIONS PLC
Annual Report 2017/18
18 TRADE AND OTHER RECEIVABLES Group CompanyAs at 31 March, 2017/18 2016/17 2017/18 2016/17 Rs. ’000 Rs. ’000 Rs. ’000 Rs. ’000
Trade receivables 666,000 737,774 125,197 97,702
Lease rent paid in advance 18,358 17,720 18,358 17,720
Employee advances and receivables 48,455 61,095 48,081 60,672
Advance company tax recoverable 2,760 2,760 2,760 2,760
ESC recoverable 36,846 28,248 18,666 20,165
WHT recoverable 2,121 2,099 2,117 2,020
Other current assets 57,809 62,855 38,109 44,193
832,349 912,551 253,288 245,232
Provision for bad and bade doubtful debts (971) (901) (767) (835)
831,378 911,650 252,521 244,397
18.1 Movement in the provision for trade and other receivables Group Company 2017/18 2016/17 2017/18 2016/17 Rs. ’000 Rs. ’000 Rs. ’000 Rs. ’000
As at 1 April (901) (731) (835) (731)
Reversal/(charge) for the year (70) (170) 68 (104)
As at 31 March (971) (901) (767) (835)
18.2 The aging analysis of trade receivables is as follows;
As at 31 March, Neither Past due nor impaired Total 0-60 61-120 121-180 181-365 > 365 days days days days days Rs.'000 Rs.'000 Rs.'000 Rs.'000 Rs.'000 Rs.'000
Company 125,197 116,582 8,615 - - -
Group 666,000 659,013 4,421 146 1,006 1,414
Trade receivables are non-interest bearing and are generally on seven-day terms for the Company.
No loans over Rs. 20,000/- have been given to Directors or officers of the Company.
The carrying amount of debtors pledged as securities for bank facilities obtained amounted to Rs. 125 m (2016/17 - Rs. 98 m) and Rs. 657
m (2016/17 - Rs. 733 m) by the Company and the Group respectively .
Notes to the Financial Statements Contd.
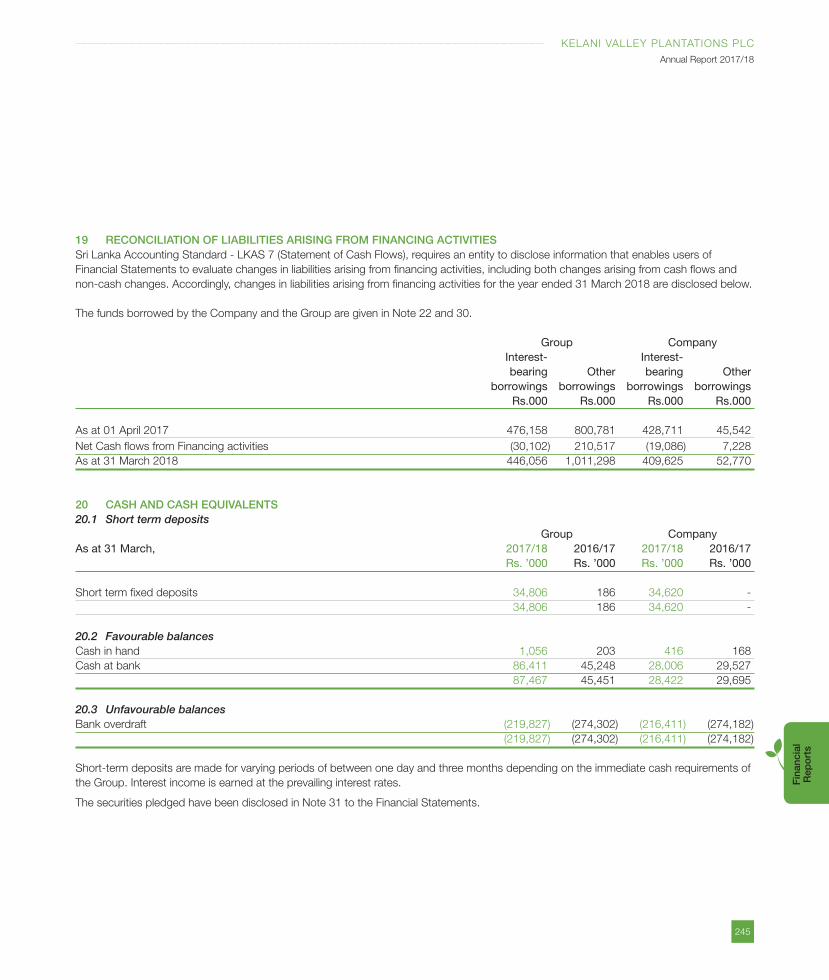
245
KELANI VALLEY PLANTATIONS PLC
Annual Report 2017/18
Fin
anci
al
Rep
ort
s
19 RECONCILIATION OF LIABILITIES ARISING FROM FINANCING ACTIVITIESSri Lanka Accounting Standard - LKAS 7 (Statement of Cash Flows), requires an entity to disclose information that enables users of
Financial Statements to evaluate changes in liabilities arising from financing activities, including both changes arising from cash flows and
non-cash changes. Accordingly, changes in liabilities arising from financing activities for the year ended 31 March 2018 are disclosed below.
The funds borrowed by the Company and the Group are given in Note 22 and 30.
Group Company Interest- Interest- bearing Other bearing Other borrowings borrowings borrowings borrowings Rs.000 Rs.000 Rs.000 Rs.000
As at 01 April 2017 476,158 800,781 428,711 45,542
Net Cash flows from Financing activities (30,102) 210,517 (19,086) 7,228
As at 31 March 2018 446,056 1,011,298 409,625 52,770
20 CASH AND CASH EQUIVALENTS20.1 Short term deposits Group CompanyAs at 31 March, 2017/18 2016/17 2017/18 2016/17 Rs. ’000 Rs. ’000 Rs. ’000 Rs. ’000
Short term fixed deposits 34,806 186 34,620 -
34,806 186 34,620 -
20.2 Favourable balancesCash in hand 1,056 203 416 168
Cash at bank 86,411 45,248 28,006 29,527
87,467 45,451 28,422 29,695
20.3 Unfavourable balancesBank overdraft (219,827) (274,302) (216,411) (274,182)
(219,827) (274,302) (216,411) (274,182)
Short-term deposits are made for varying periods of between one day and three months depending on the immediate cash requirements of
the Group. Interest income is earned at the prevailing interest rates.
The securities pledged have been disclosed in Note 31 to the Financial Statements.
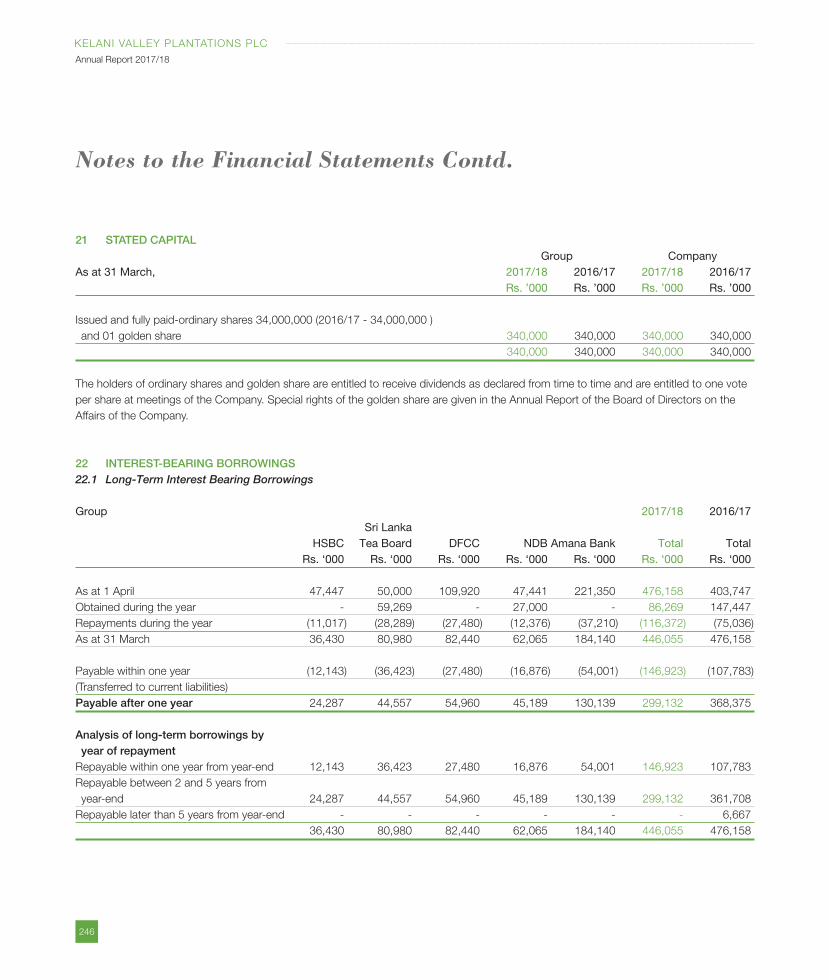
246
KELANI VALLEY PLANTATIONS PLC
Annual Report 2017/18
21 STATED CAPITAL Group CompanyAs at 31 March, 2017/18 2016/17 2017/18 2016/17 Rs. ’000 Rs. ’000 Rs. ’000 Rs. ’000
Issued and fully paid-ordinary shares 34,000,000 (2016/17 - 34,000,000 )
and 01 golden share 340,000 340,000 340,000 340,000
340,000 340,000 340,000 340,000
The holders of ordinary shares and golden share are entitled to receive dividends as declared from time to time and are entitled to one vote
per share at meetings of the Company. Special rights of the golden share are given in the Annual Report of the Board of Directors on the
Affairs of the Company.
22 INTEREST-BEARING BORROWINGS22.1 Long-Term Interest Bearing Borrowings
Group 2017/18 2016/17 Sri Lanka HSBC Tea Board DFCC NDB Amana Bank Total Total Rs. ‘000 Rs. ‘000 Rs. ‘000 Rs. ‘000 Rs. ‘000 Rs. ‘000 Rs. ‘000
As at 1 April 47,447 50,000 109,920 47,441 221,350 476,158 403,747
Obtained during the year - 59,269 - 27,000 - 86,269 147,447
Repayments during the year (11,017) (28,289) (27,480) (12,376) (37,210) (116,372) (75,036)
As at 31 March 36,430 80,980 82,440 62,065 184,140 446,055 476,158
Payable within one year (12,143) (36,423) (27,480) (16,876) (54,001) (146,923) (107,783)
(Transferred to current liabilities)
Payable after one year 24,287 44,557 54,960 45,189 130,139 299,132 368,375
Analysis of long-term borrowings by year of repaymentRepayable within one year from year-end 12,143 36,423 27,480 16,876 54,001 146,923 107,783
Repayable between 2 and 5 years from
year-end 24,287 44,557 54,960 45,189 130,139 299,132 361,708
Repayable later than 5 years from year-end - - - - - - 6,667
36,430 80,980 82,440 62,065 184,140 446,055 476,158
Notes to the Financial Statements Contd.
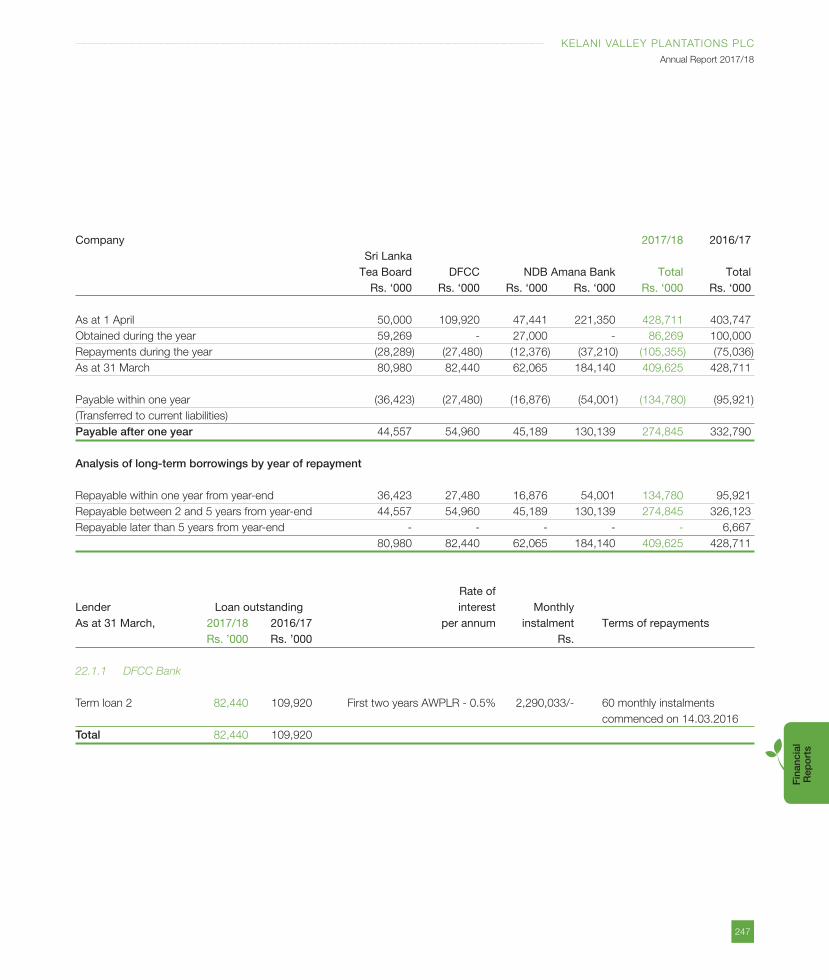
247
KELANI VALLEY PLANTATIONS PLC
Annual Report 2017/18
Fin
anci
al
Rep
ort
s
Company 2017/18 2016/17 Sri Lanka Tea Board DFCC NDB Amana Bank Total Total Rs. ‘000 Rs. ‘000 Rs. ‘000 Rs. ‘000 Rs. ‘000 Rs. ‘000
As at 1 April 50,000 109,920 47,441 221,350 428,711 403,747
Obtained during the year 59,269 - 27,000 - 86,269 100,000
Repayments during the year (28,289) (27,480) (12,376) (37,210) (105,355) (75,036)
As at 31 March 80,980 82,440 62,065 184,140 409,625 428,711
Payable within one year (36,423) (27,480) (16,876) (54,001) (134,780) (95,921)
(Transferred to current liabilities)
Payable after one year 44,557 54,960 45,189 130,139 274,845 332,790
Analysis of long-term borrowings by year of repayment
Repayable within one year from year-end 36,423 27,480 16,876 54,001 134,780 95,921
Repayable between 2 and 5 years from year-end 44,557 54,960 45,189 130,139 274,845 326,123
Repayable later than 5 years from year-end - - - - - 6,667
80,980 82,440 62,065 184,140 409,625 428,711
Rate of Lender Loan outstanding interest MonthlyAs at 31 March, 2017/18 2016/17 per annum instalment Terms of repayments Rs. ’000 Rs. ’000 Rs.
22.1.1 DFCC Bank
Term loan 2 82,440 109,920 First two years AWPLR - 0.5% 2,290,033/- 60 monthly instalments
commenced on 14.03.2016
Total 82,440 109,920
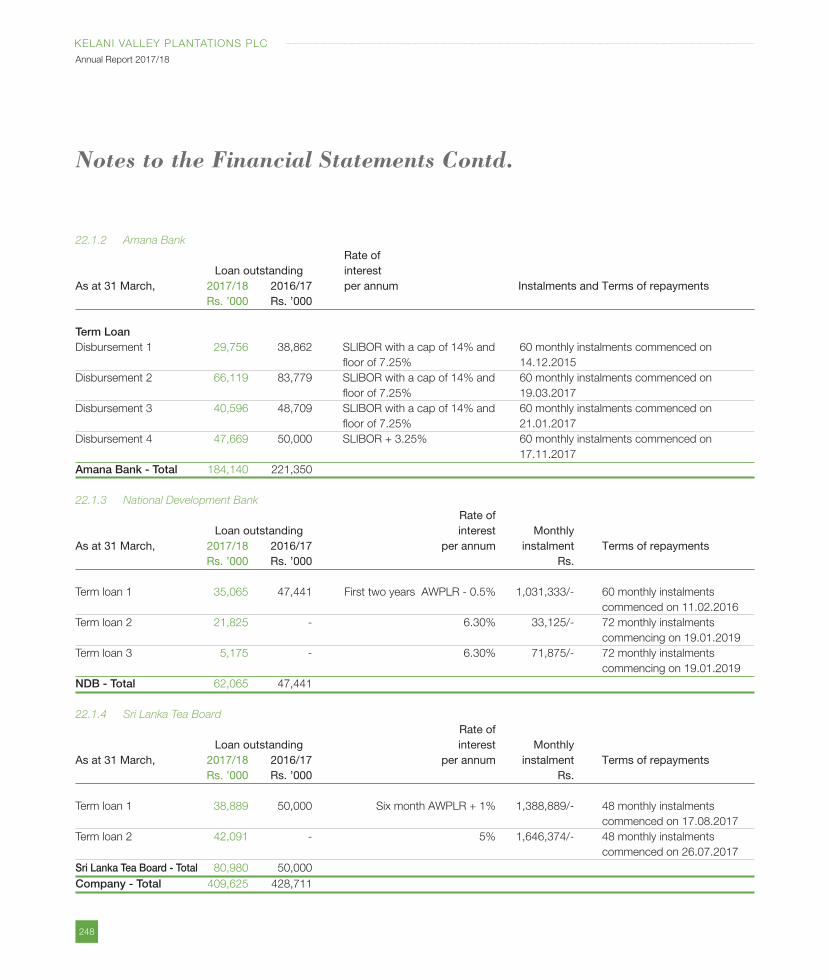
248
KELANI VALLEY PLANTATIONS PLC
Annual Report 2017/18
22.1.2 Amana Bank
Rate of Loan outstanding interest As at 31 March, 2017/18 2016/17 per annum Instalments and Terms of repayments Rs. ’000 Rs. ’000
Term LoanDisbursement 1 29,756 38,862 SLIBOR with a cap of 14% and 60 monthly instalments commenced on
floor of 7.25% 14.12.2015
Disbursement 2 66,119 83,779 SLIBOR with a cap of 14% and 60 monthly instalments commenced on
floor of 7.25% 19.03.2017
Disbursement 3 40,596 48,709 SLIBOR with a cap of 14% and 60 monthly instalments commenced on
floor of 7.25% 21.01.2017
Disbursement 4 47,669 50,000 SLIBOR + 3.25% 60 monthly instalments commenced on
17.11.2017
Amana Bank - Total 184,140 221,350
22.1.3 National Development Bank
Rate of Loan outstanding interest MonthlyAs at 31 March, 2017/18 2016/17 per annum instalment Terms of repayments Rs. ’000 Rs. ’000 Rs.
Term loan 1 35,065 47,441 First two years AWPLR - 0.5% 1,031,333/- 60 monthly instalments
commenced on 11.02.2016
Term loan 2 21,825 - 6.30% 33,125/- 72 monthly instalments
commencing on 19.01.2019
Term loan 3 5,175 - 6.30% 71,875/- 72 monthly instalments
commencing on 19.01.2019
NDB - Total 62,065 47,441
22.1.4 Sri Lanka Tea Board
Rate of Loan outstanding interest MonthlyAs at 31 March, 2017/18 2016/17 per annum instalment Terms of repayments Rs. ’000 Rs. ’000 Rs.
Term loan 1 38,889 50,000 Six month AWPLR + 1% 1,388,889/- 48 monthly instalments
commenced on 17.08.2017
Term loan 2 42,091 - 5% 1,646,374/- 48 monthly instalments
commenced on 26.07.2017
Sri Lanka Tea Board - Total 80,980 50,000
Company - Total 409,625 428,711
Notes to the Financial Statements Contd.
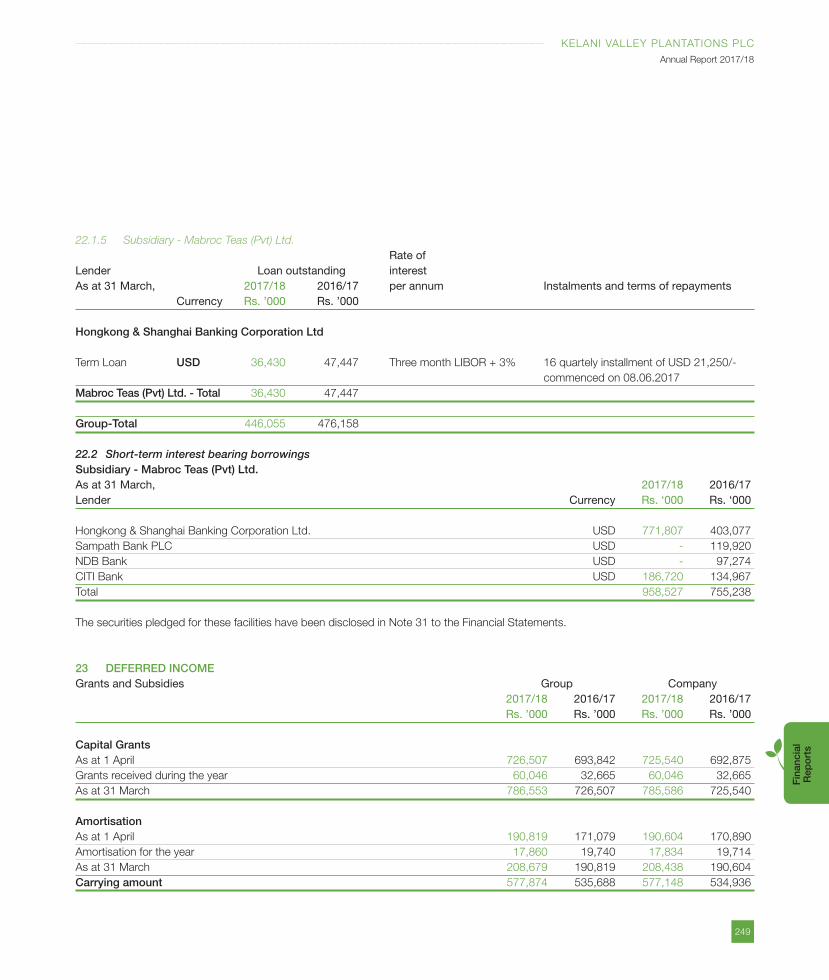
249
KELANI VALLEY PLANTATIONS PLC
Annual Report 2017/18
Fin
anci
al
Rep
ort
s
22.1.5 Subsidiary - Mabroc Teas (Pvt) Ltd.
Rate of Lender Loan outstanding interest As at 31 March, 2017/18 2016/17 per annum Instalments and terms of repayments Currency Rs. ’000 Rs. ’000
Hongkong & Shanghai Banking Corporation Ltd
Term Loan USD 36,430 47,447 Three month LIBOR + 3% 16 quartely installment of USD 21,250/-
commenced on 08.06.2017
Mabroc Teas (Pvt) Ltd. - Total 36,430 47,447
Group-Total 446,055 476,158
22.2 Short-term interest bearing borrowingsSubsidiary - Mabroc Teas (Pvt) Ltd.As at 31 March, 2017/18 2016/17Lender Currency Rs. ‘000 Rs. ‘000
Hongkong & Shanghai Banking Corporation Ltd. USD 771,807 403,077
Sampath Bank PLC USD - 119,920
NDB Bank USD - 97,274
CITI Bank USD 186,720 134,967
Total 958,527 755,238
The securities pledged for these facilities have been disclosed in Note 31 to the Financial Statements.
23 DEFERRED INCOMEGrants and Subsidies Group Company 2017/18 2016/17 2017/18 2016/17 Rs. ’000 Rs. ’000 Rs. ’000 Rs. ’000
Capital GrantsAs at 1 April 726,507 693,842 725,540 692,875
Grants received during the year 60,046 32,665 60,046 32,665
As at 31 March 786,553 726,507 785,586 725,540
AmortisationAs at 1 April 190,819 171,079 190,604 170,890
Amortisation for the year 17,860 19,740 17,834 19,714
As at 31 March 208,679 190,819 208,438 190,604
Carrying amount 577,874 535,688 577,148 534,936
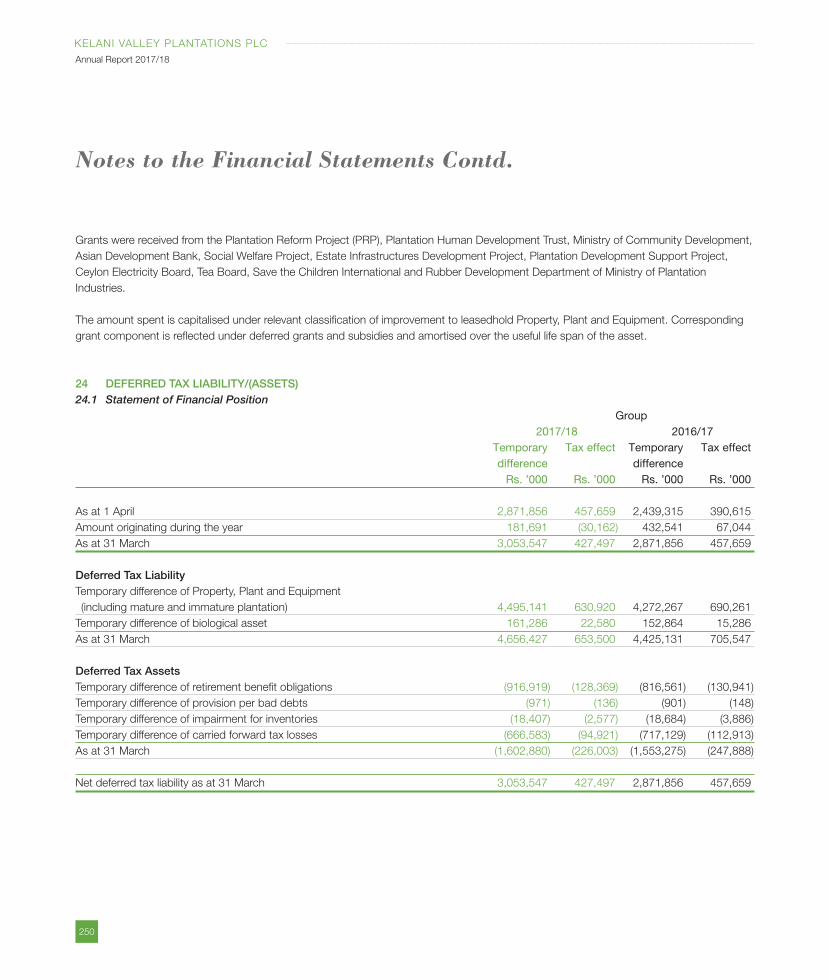
250
KELANI VALLEY PLANTATIONS PLC
Annual Report 2017/18
Grants were received from the Plantation Reform Project (PRP), Plantation Human Development Trust, Ministry of Community Development,
Asian Development Bank, Social Welfare Project, Estate Infrastructures Development Project, Plantation Development Support Project,
Ceylon Electricity Board, Tea Board, Save the Children International and Rubber Development Department of Ministry of Plantation
Industries.
The amount spent is capitalised under relevant classification of improvement to leasedhold Property, Plant and Equipment. Corresponding
grant component is reflected under deferred grants and subsidies and amortised over the useful life span of the asset.
24 DEFERRED TAX LIABILITY/(ASSETS)24.1 Statement of Financial Position Group 2017/18 2016/17 Temporary Tax effect Temporary Tax effect difference difference Rs. ’000 Rs. ’000 Rs. ’000 Rs. ’000
As at 1 April 2,871,856 457,659 2,439,315 390,615
Amount originating during the year 181,691 (30,162) 432,541 67,044
As at 31 March 3,053,547 427,497 2,871,856 457,659
Deferred Tax LiabilityTemporary difference of Property, Plant and Equipment
(including mature and immature plantation) 4,495,141 630,920 4,272,267 690,261
Temporary difference of biological asset 161,286 22,580 152,864 15,286
As at 31 March 4,656,427 653,500 4,425,131 705,547
Deferred Tax AssetsTemporary difference of retirement benefit obligations (916,919) (128,369) (816,561) (130,941)
Temporary difference of provision per bad debts (971) (136) (901) (148)
Temporary difference of impairment for inventories (18,407) (2,577) (18,684) (3,886)
Temporary difference of carried forward tax losses (666,583) (94,921) (717,129) (112,913)
As at 31 March (1,602,880) (226,003) (1,553,275) (247,888)
Net deferred tax liability as at 31 March 3,053,547 427,497 2,871,856 457,659
Notes to the Financial Statements Contd.
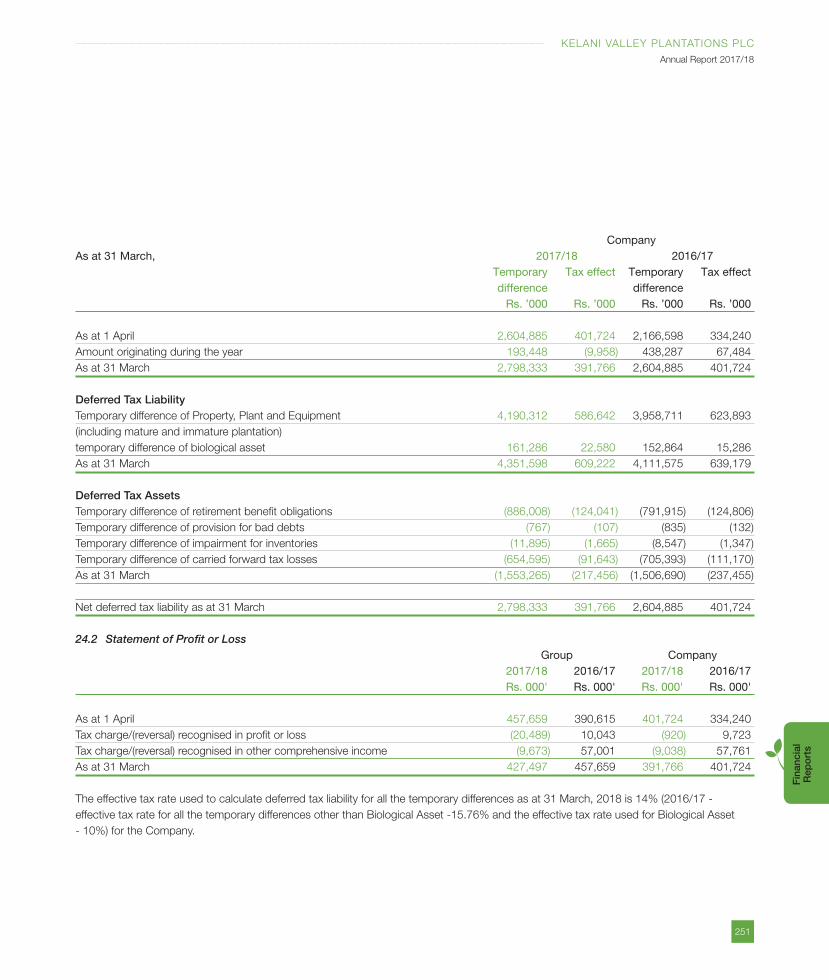
251
KELANI VALLEY PLANTATIONS PLC
Annual Report 2017/18
Fin
anci
al
Rep
ort
s
CompanyAs at 31 March, 2017/18 2016/17 Temporary Tax effect Temporary Tax effect difference difference Rs. ’000 Rs. ’000 Rs. ’000 Rs. ’000
As at 1 April 2,604,885 401,724 2,166,598 334,240
Amount originating during the year 193,448 (9,958) 438,287 67,484
As at 31 March 2,798,333 391,766 2,604,885 401,724
Deferred Tax LiabilityTemporary difference of Property, Plant and Equipment 4,190,312 586,642 3,958,711 623,893
(including mature and immature plantation)
temporary difference of biological asset 161,286 22,580 152,864 15,286
As at 31 March 4,351,598 609,222 4,111,575 639,179
Deferred Tax AssetsTemporary difference of retirement benefit obligations (886,008) (124,041) (791,915) (124,806)
Temporary difference of provision for bad debts (767) (107) (835) (132)
Temporary difference of impairment for inventories (11,895) (1,665) (8,547) (1,347)
Temporary difference of carried forward tax losses (654,595) (91,643) (705,393) (111,170)
As at 31 March (1,553,265) (217,456) (1,506,690) (237,455)
Net deferred tax liability as at 31 March 2,798,333 391,766 2,604,885 401,724
24.2 Statement of Profit or Loss Group Company 2017/18 2016/17 2017/18 2016/17 Rs. 000' Rs. 000' Rs. 000' Rs. 000'
As at 1 April 457,659 390,615 401,724 334,240
Tax charge/(reversal) recognised in profit or loss (20,489) 10,043 (920) 9,723
Tax charge/(reversal) recognised in other comprehensive income (9,673) 57,001 (9,038) 57,761
As at 31 March 427,497 457,659 391,766 401,724
The effective tax rate used to calculate deferred tax liability for all the temporary differences as at 31 March, 2018 is 14% (2016/17 -
effective tax rate for all the temporary differences other than Biological Asset -15.76% and the effective tax rate used for Biological Asset
- 10%) for the Company.
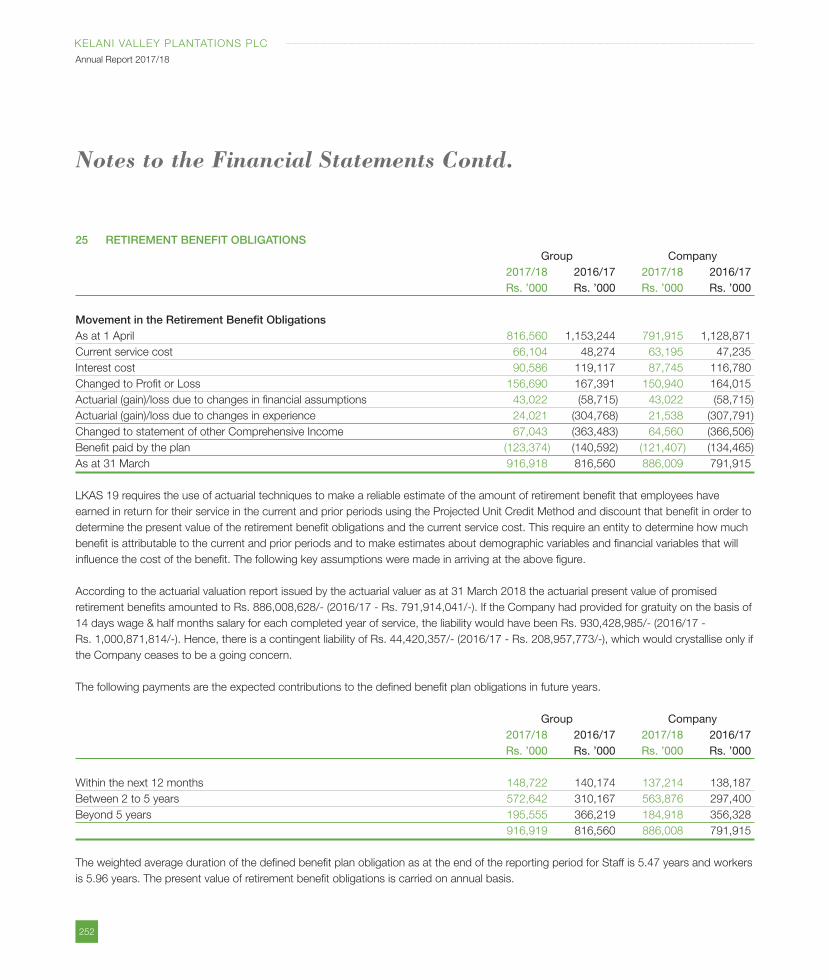
252
KELANI VALLEY PLANTATIONS PLC
Annual Report 2017/18
25 RETIREMENT BENEFIT OBLIGATIONS Group Company 2017/18 2016/17 2017/18 2016/17 Rs. ’000 Rs. ’000 Rs. ’000 Rs. ’000
Movement in the Retirement Benefit ObligationsAs at 1 April 816,560 1,153,244 791,915 1,128,871
Current service cost 66,104 48,274 63,195 47,235
Interest cost 90,586 119,117 87,745 116,780
Changed to Profit or Loss 156,690 167,391 150,940 164,015
Actuarial (gain)/loss due to changes in financial assumptions 43,022 (58,715) 43,022 (58,715)
Actuarial (gain)/loss due to changes in experience 24,021 (304,768) 21,538 (307,791)
Changed to statement of other Comprehensive Income 67,043 (363,483) 64,560 (366,506)
Benefit paid by the plan (123,374) (140,592) (121,407) (134,465)
As at 31 March 916,918 816,560 886,009 791,915
LKAS 19 requires the use of actuarial techniques to make a reliable estimate of the amount of retirement benefit that employees have
earned in return for their service in the current and prior periods using the Projected Unit Credit Method and discount that benefit in order to
determine the present value of the retirement benefit obligations and the current service cost. This require an entity to determine how much
benefit is attributable to the current and prior periods and to make estimates about demographic variables and financial variables that will
influence the cost of the benefit. The following key assumptions were made in arriving at the above figure.
According to the actuarial valuation report issued by the actuarial valuer as at 31 March 2018 the actuarial present value of promised
retirement benefits amounted to Rs. 886,008,628/- (2016/17 - Rs. 791,914,041/-). If the Company had provided for gratuity on the basis of
14 days wage & half months salary for each completed year of service, the liability would have been Rs. 930,428,985/- (2016/17 -
Rs. 1,000,871,814/-). Hence, there is a contingent liability of Rs. 44,420,357/- (2016/17 - Rs. 208,957,773/-), which would crystallise only if
the Company ceases to be a going concern.
The following payments are the expected contributions to the defined benefit plan obligations in future years.
Group Company 2017/18 2016/17 2017/18 2016/17 Rs. ’000 Rs. ’000 Rs. ’000 Rs. ’000
Within the next 12 months 148,722 140,174 137,214 138,187
Between 2 to 5 years 572,642 310,167 563,876 297,400
Beyond 5 years 195,555 366,219 184,918 356,328
916,919 816,560 886,008 791,915
The weighted average duration of the defined benefit plan obligation as at the end of the reporting period for Staff is 5.47 years and workers
is 5.96 years. The present value of retirement benefit obligations is carried on annual basis.
Notes to the Financial Statements Contd.
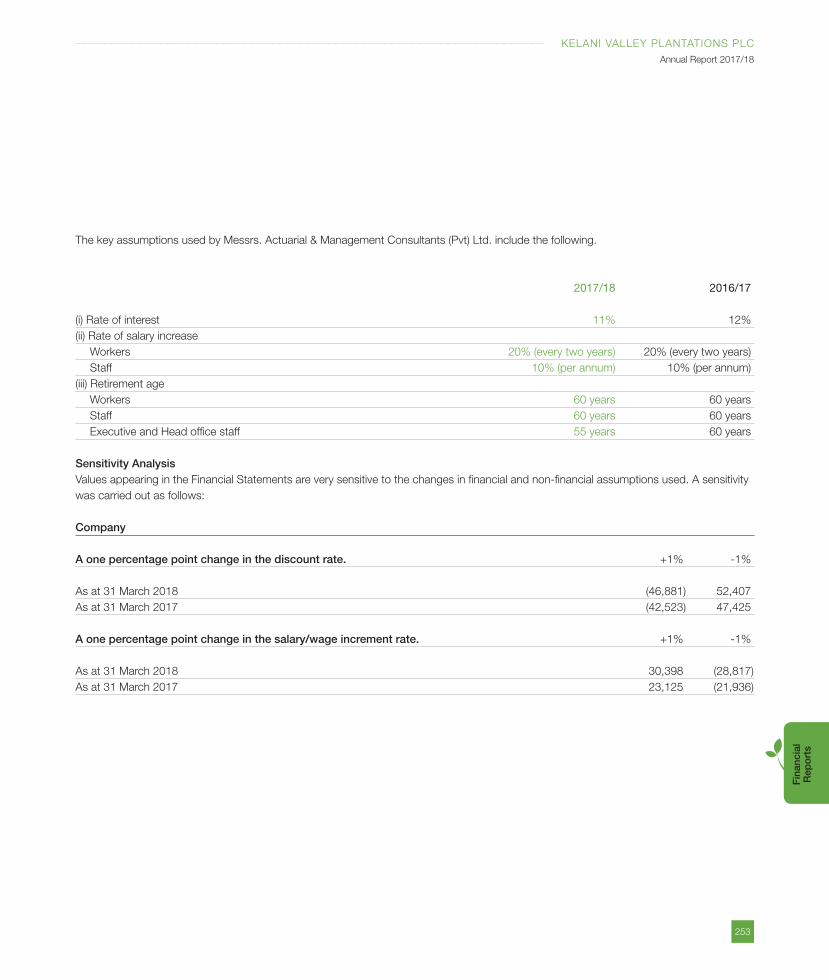
253
KELANI VALLEY PLANTATIONS PLC
Annual Report 2017/18
Fin
anci
al
Rep
ort
s
The key assumptions used by Messrs. Actuarial & Management Consultants (Pvt) Ltd. include the following.
2017/18 2016/17
(i) Rate of interest 11% 12%
(ii) Rate of salary increase
Workers 20% (every two years) 20% (every two years)
Staff 10% (per annum) 10% (per annum)
(iii) Retirement age
Workers 60 years 60 years
Staff 60 years 60 years
Executive and Head office staff 55 years 60 years
Sensitivity AnalysisValues appearing in the Financial Statements are very sensitive to the changes in financial and non-financial assumptions used. A sensitivity
was carried out as follows:
Company
A one percentage point change in the discount rate. +1% -1%
As at 31 March 2018 (46,881) 52,407
As at 31 March 2017 (42,523) 47,425
A one percentage point change in the salary/wage increment rate. +1% -1%
As at 31 March 2018 30,398 (28,817)
As at 31 March 2017 23,125 (21,936)
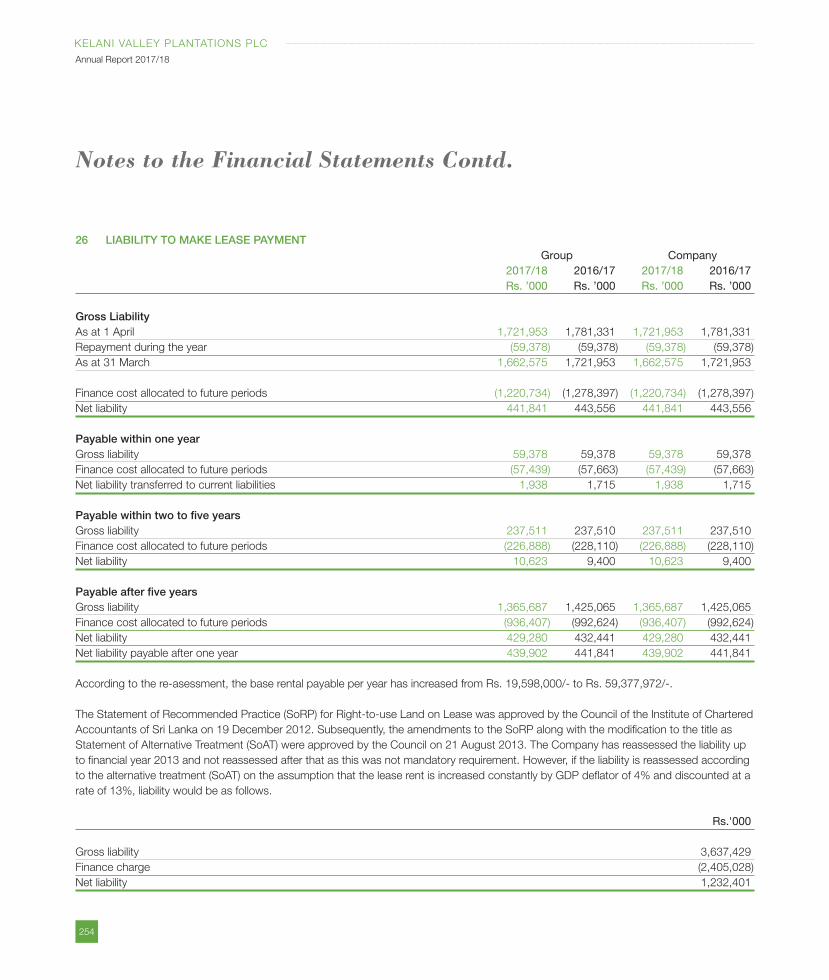
254
KELANI VALLEY PLANTATIONS PLC
Annual Report 2017/18
26 LIABILITY TO MAKE LEASE PAYMENT Group Company 2017/18 2016/17 2017/18 2016/17 Rs. ’000 Rs. ’000 Rs. ’000 Rs. ’000
Gross LiabilityAs at 1 April 1,721,953 1,781,331 1,721,953 1,781,331
Repayment during the year (59,378) (59,378) (59,378) (59,378)
As at 31 March 1,662,575 1,721,953 1,662,575 1,721,953
Finance cost allocated to future periods (1,220,734) (1,278,397) (1,220,734) (1,278,397)
Net liability 441,841 443,556 441,841 443,556
Payable within one yearGross liability 59,378 59,378 59,378 59,378
Finance cost allocated to future periods (57,439) (57,663) (57,439) (57,663)
Net liability transferred to current liabilities 1,938 1,715 1,938 1,715
Payable within two to five yearsGross liability 237,511 237,510 237,511 237,510
Finance cost allocated to future periods (226,888) (228,110) (226,888) (228,110)
Net liability 10,623 9,400 10,623 9,400
Payable after five yearsGross liability 1,365,687 1,425,065 1,365,687 1,425,065
Finance cost allocated to future periods (936,407) (992,624) (936,407) (992,624)
Net liability 429,280 432,441 429,280 432,441
Net liability payable after one year 439,902 441,841 439,902 441,841
According to the re-asessment, the base rental payable per year has increased from Rs. 19,598,000/- to Rs. 59,377,972/-.
The Statement of Recommended Practice (SoRP) for Right-to-use Land on Lease was approved by the Council of the Institute of Chartered
Accountants of Sri Lanka on 19 December 2012. Subsequently, the amendments to the SoRP along with the modification to the title as
Statement of Alternative Treatment (SoAT) were approved by the Council on 21 August 2013. The Company has reassessed the liability up
to financial year 2013 and not reassessed after that as this was not mandatory requirement. However, if the liability is reassessed according
to the alternative treatment (SoAT) on the assumption that the lease rent is increased constantly by GDP deflator of 4% and discounted at a
rate of 13%, liability would be as follows.
Rs.'000
Gross liability 3,637,429
Finance charge (2,405,028)
Net liability 1,232,401
Notes to the Financial Statements Contd.
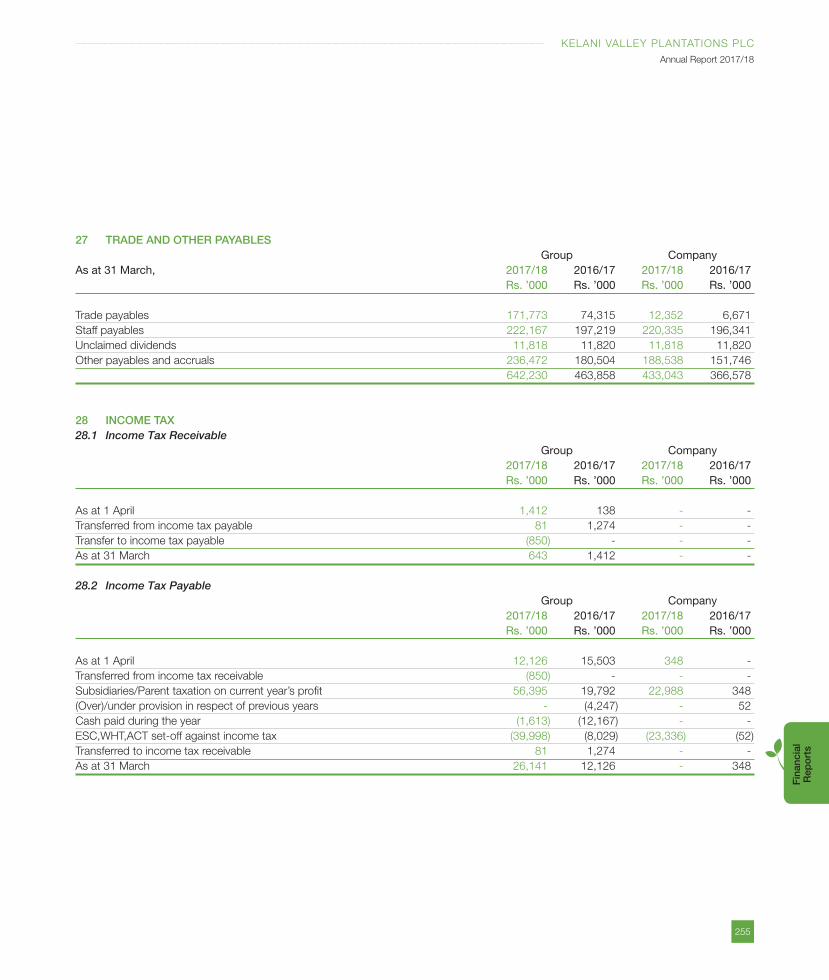
255
KELANI VALLEY PLANTATIONS PLC
Annual Report 2017/18
Fin
anci
al
Rep
ort
s
27 TRADE AND OTHER PAYABLES Group CompanyAs at 31 March, 2017/18 2016/17 2017/18 2016/17 Rs. ’000 Rs. ’000 Rs. ’000 Rs. ’000
Trade payables 171,773 74,315 12,352 6,671
Staff payables 222,167 197,219 220,335 196,341
Unclaimed dividends 11,818 11,820 11,818 11,820
Other payables and accruals 236,472 180,504 188,538 151,746
642,230 463,858 433,043 366,578
28 INCOME TAX28.1 Income Tax Receivable Group Company 2017/18 2016/17 2017/18 2016/17 Rs. ’000 Rs. ’000 Rs. ’000 Rs. ’000
As at 1 April 1,412 138 - -
Transferred from income tax payable 81 1,274 - -
Transfer to income tax payable (850) - - -
As at 31 March 643 1,412 - -
28.2 Income Tax Payable Group Company 2017/18 2016/17 2017/18 2016/17 Rs. ’000 Rs. ’000 Rs. ’000 Rs. ’000
As at 1 April 12,126 15,503 348 -
Transferred from income tax receivable (850) - - -
Subsidiaries/Parent taxation on current year’s profit 56,395 19,792 22,988 348
(Over)/under provision in respect of previous years - (4,247) - 52
Cash paid during the year (1,613) (12,167) - -
ESC,WHT,ACT set-off against income tax (39,998) (8,029) (23,336) (52)
Transferred to income tax receivable 81 1,274 - -
As at 31 March 26,141 12,126 - 348
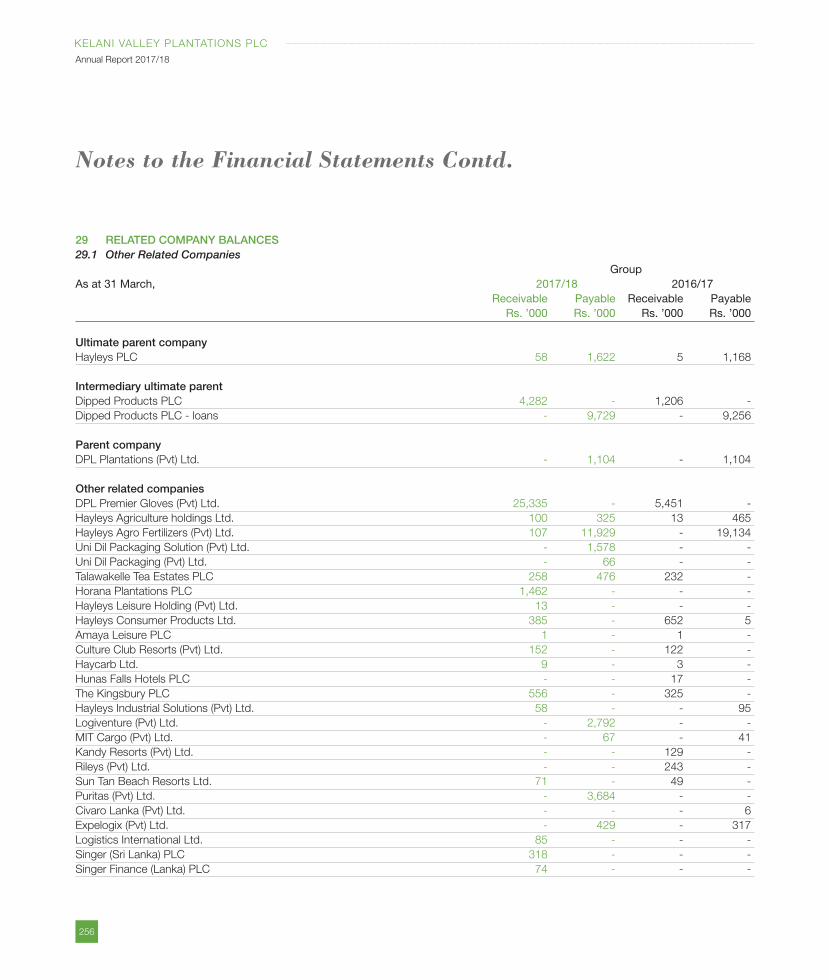
256
KELANI VALLEY PLANTATIONS PLC
Annual Report 2017/18
29 RELATED COMPANY BALANCES29.1 Other Related Companies GroupAs at 31 March, 2017/18 2016/17 Receivable Payable Receivable Payable Rs. ’000 Rs. ’000 Rs. ’000 Rs. ’000
Ultimate parent company Hayleys PLC 58 1,622 5 1,168
Intermediary ultimate parent Dipped Products PLC 4,282 - 1,206 -
Dipped Products PLC - loans - 9,729 - 9,256
Parent company DPL Plantations (Pvt) Ltd. - 1,104 - 1,104
Other related companies DPL Premier Gloves (Pvt) Ltd. 25,335 - 5,451 -
Hayleys Agriculture holdings Ltd. 100 325 13 465
Hayleys Agro Fertilizers (Pvt) Ltd. 107 11,929 - 19,134
Uni Dil Packaging Solution (Pvt) Ltd. - 1,578 - -
Uni Dil Packaging (Pvt) Ltd. - 66 - -
Talawakelle Tea Estates PLC 258 476 232 -
Horana Plantations PLC 1,462 - - -
Hayleys Leisure Holding (Pvt) Ltd. 13 - - -
Hayleys Consumer Products Ltd. 385 - 652 5
Amaya Leisure PLC 1 - 1 -
Culture Club Resorts (Pvt) Ltd. 152 - 122 -
Haycarb Ltd. 9 - 3 -
Hunas Falls Hotels PLC - - 17 -
The Kingsbury PLC 556 - 325 -
Hayleys Industrial Solutions (Pvt) Ltd. 58 - - 95
Logiventure (Pvt) Ltd. - 2,792 - -
MIT Cargo (Pvt) Ltd. - 67 - 41
Kandy Resorts (Pvt) Ltd. - - 129 -
Rileys (Pvt) Ltd. - - 243 -
Sun Tan Beach Resorts Ltd. 71 - 49 -
Puritas (Pvt) Ltd. - 3,684 - -
Civaro Lanka (Pvt) Ltd. - - - 6
Expelogix (Pvt) Ltd. - 429 - 317
Logistics International Ltd. 85 - - -
Singer (Sri Lanka) PLC 318 - - -
Singer Finance (Lanka) PLC 74 - - -
Notes to the Financial Statements Contd.
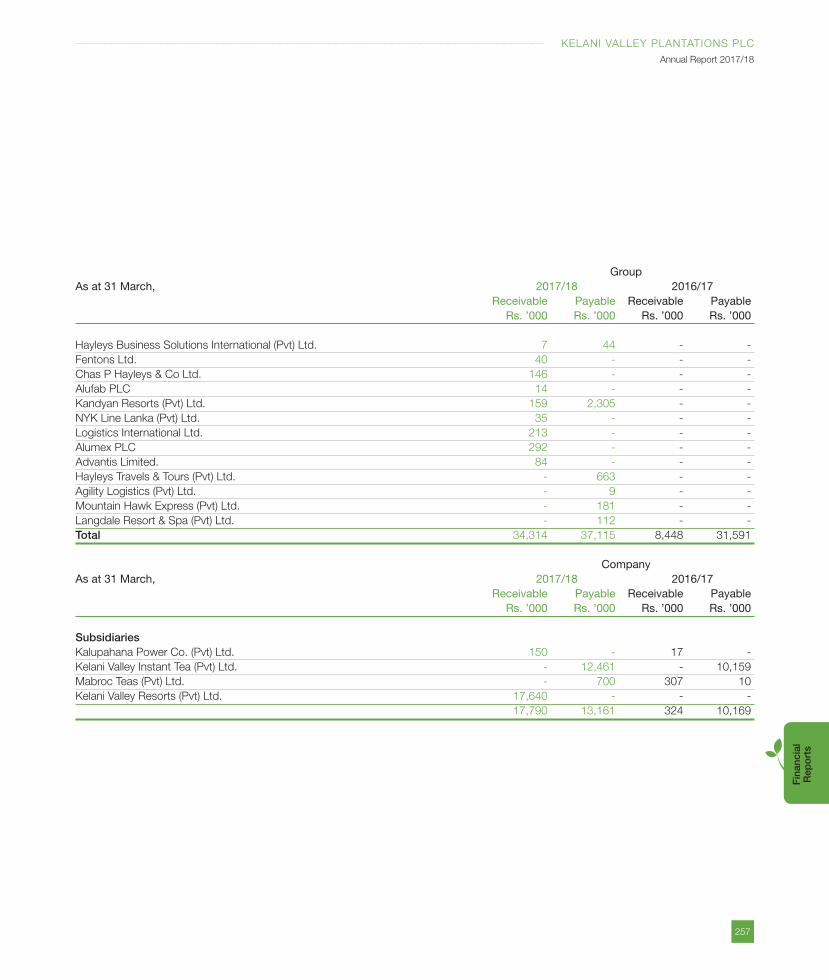
257
KELANI VALLEY PLANTATIONS PLC
Annual Report 2017/18
Fin
anci
al
Rep
ort
s
GroupAs at 31 March, 2017/18 2016/17 Receivable Payable Receivable Payable Rs. ’000 Rs. ’000 Rs. ’000 Rs. ’000
Hayleys Business Solutions International (Pvt) Ltd. 7 44 - -
Fentons Ltd. 40 - - -
Chas P Hayleys & Co Ltd. 146 - - -
Alufab PLC 14 - - -
Kandyan Resorts (Pvt) Ltd. 159 2,305 - -
NYK Line Lanka (Pvt) Ltd. 35 - - -
Logistics International Ltd. 213 - - -
Alumex PLC 292 - - -
Advantis Limited. 84 - - -
Hayleys Travels & Tours (Pvt) Ltd. - 663 - -
Agility Logistics (Pvt) Ltd. - 9 - -
Mountain Hawk Express (Pvt) Ltd. - 181 - -
Langdale Resort & Spa (Pvt) Ltd. - 112 - -
Total 34,314 37,115 8,448 31,591
CompanyAs at 31 March, 2017/18 2016/17 Receivable Payable Receivable Payable Rs. ’000 Rs. ’000 Rs. ’000 Rs. ’000
SubsidiariesKalupahana Power Co. (Pvt) Ltd. 150 - 17 -
Kelani Valley Instant Tea (Pvt) Ltd. - 12,461 - 10,159
Mabroc Teas (Pvt) Ltd. - 700 307 10
Kelani Valley Resorts (Pvt) Ltd. 17,640 - - -
17,790 13,161 324 10,169
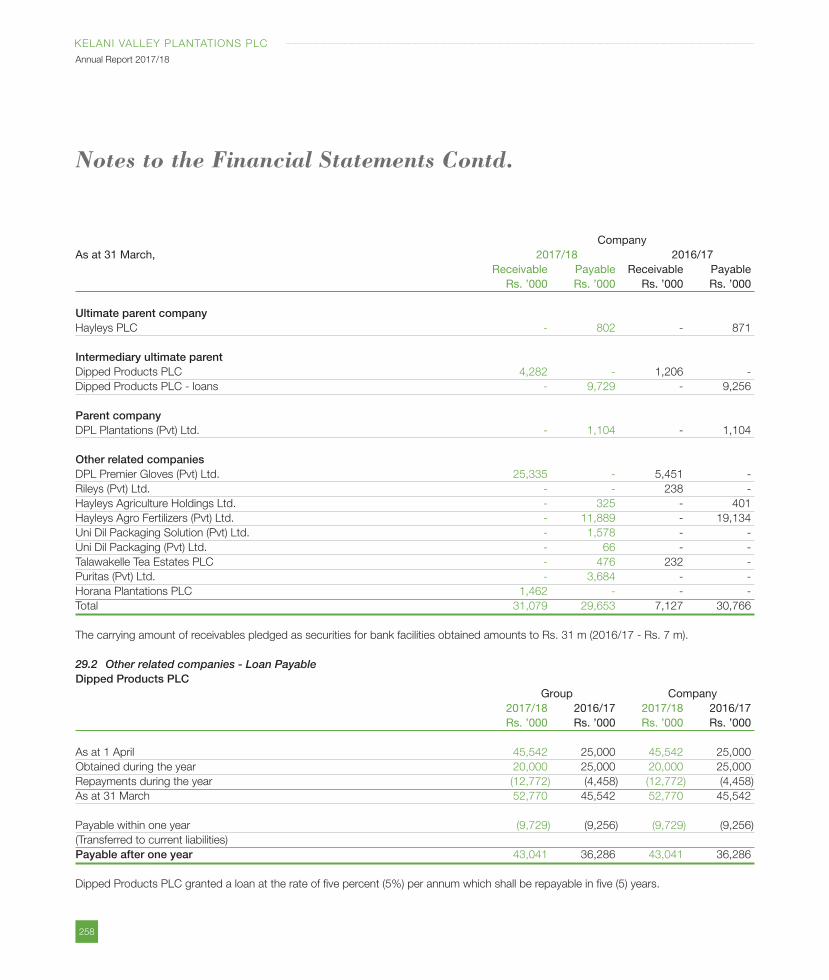
258
KELANI VALLEY PLANTATIONS PLC
Annual Report 2017/18
CompanyAs at 31 March, 2017/18 2016/17 Receivable Payable Receivable Payable Rs. ’000 Rs. ’000 Rs. ’000 Rs. ’000
Ultimate parent companyHayleys PLC - 802 - 871
Intermediary ultimate parent Dipped Products PLC 4,282 - 1,206 -
Dipped Products PLC - loans - 9,729 - 9,256
Parent company DPL Plantations (Pvt) Ltd. - 1,104 - 1,104
Other related companies DPL Premier Gloves (Pvt) Ltd. 25,335 - 5,451 -
Rileys (Pvt) Ltd. - - 238 -
Hayleys Agriculture Holdings Ltd. - 325 - 401
Hayleys Agro Fertilizers (Pvt) Ltd. - 11,889 - 19,134
Uni Dil Packaging Solution (Pvt) Ltd. - 1,578 - -
Uni Dil Packaging (Pvt) Ltd. - 66 - -
Talawakelle Tea Estates PLC - 476 232 -
Puritas (Pvt) Ltd. - 3,684 - -
Horana Plantations PLC 1,462 - - -
Total 31,079 29,653 7,127 30,766
The carrying amount of receivables pledged as securities for bank facilities obtained amounts to Rs. 31 m (2016/17 - Rs. 7 m).
29.2 Other related companies - Loan PayableDipped Products PLC Group Company 2017/18 2016/17 2017/18 2016/17 Rs. ’000 Rs. ’000 Rs. ’000 Rs. ’000
As at 1 April 45,542 25,000 45,542 25,000
Obtained during the year 20,000 25,000 20,000 25,000
Repayments during the year (12,772) (4,458) (12,772) (4,458)
As at 31 March 52,770 45,542 52,770 45,542
Payable within one year (9,729) (9,256) (9,729) (9,256)
(Transferred to current liabilities)
Payable after one year 43,041 36,286 43,041 36,286
Dipped Products PLC granted a loan at the rate of five percent (5%) per annum which shall be repayable in five (5) years.
Notes to the Financial Statements Contd.
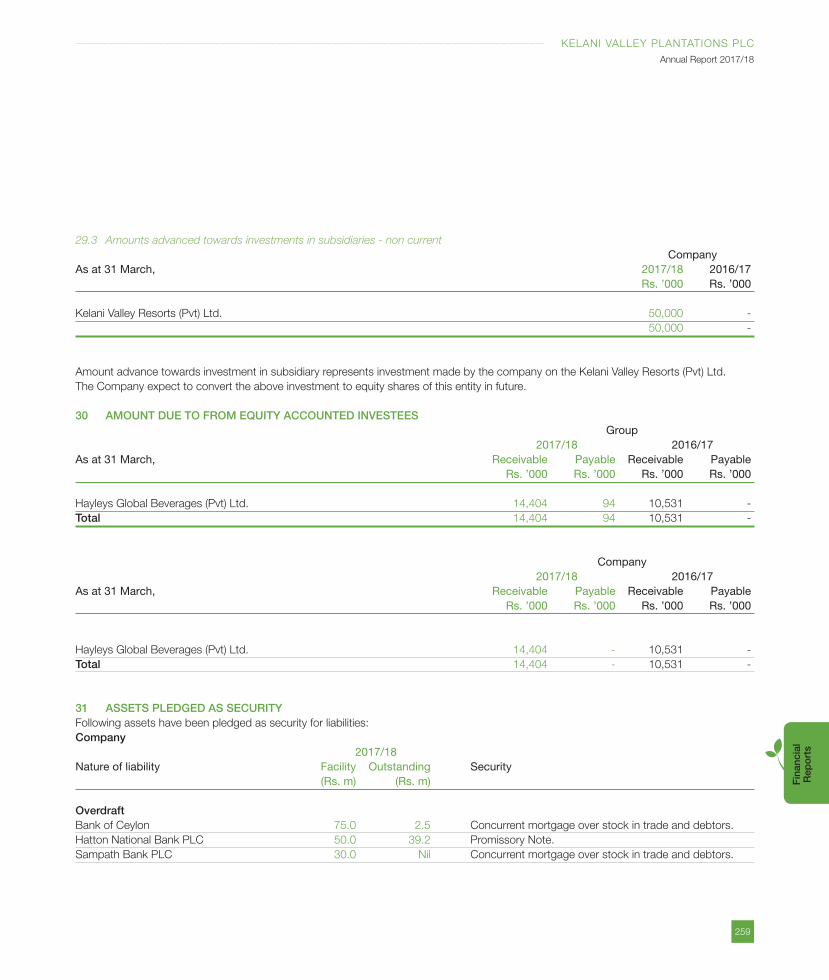
259
KELANI VALLEY PLANTATIONS PLC
Annual Report 2017/18
Fin
anci
al
Rep
ort
s
29.3 Amounts advanced towards investments in subsidiaries - non current
CompanyAs at 31 March, 2017/18 2016/17 Rs. ’000 Rs. ’000
Kelani Valley Resorts (Pvt) Ltd. 50,000 -
50,000 -
Amount advance towards investment in subsidiary represents investment made by the company on the Kelani Valley Resorts (Pvt) Ltd.
The Company expect to convert the above investment to equity shares of this entity in future.
30 AMOUNT DUE TO FROM EQUITY ACCOUNTED INVESTEES Group 2017/18 2016/17As at 31 March, Receivable Payable Receivable Payable Rs. ’000 Rs. ’000 Rs. ’000 Rs. ’000
Hayleys Global Beverages (Pvt) Ltd. 14,404 94 10,531 -
Total 14,404 94 10,531 -
Company 2017/18 2016/17As at 31 March, Receivable Payable Receivable Payable Rs. ’000 Rs. ’000 Rs. ’000 Rs. ’000
Hayleys Global Beverages (Pvt) Ltd. 14,404 - 10,531 -
Total 14,404 - 10,531 -
31 ASSETS PLEDGED AS SECURITYFollowing assets have been pledged as security for liabilities:
Company 2017/18Nature of liability Facility Outstanding Security (Rs. m) (Rs. m)
OverdraftBank of Ceylon 75.0 2.5 Concurrent mortgage over stock in trade and debtors.
Hatton National Bank PLC 50.0 39.2 Promissory Note.
Sampath Bank PLC 30.0 Nil Concurrent mortgage over stock in trade and debtors.
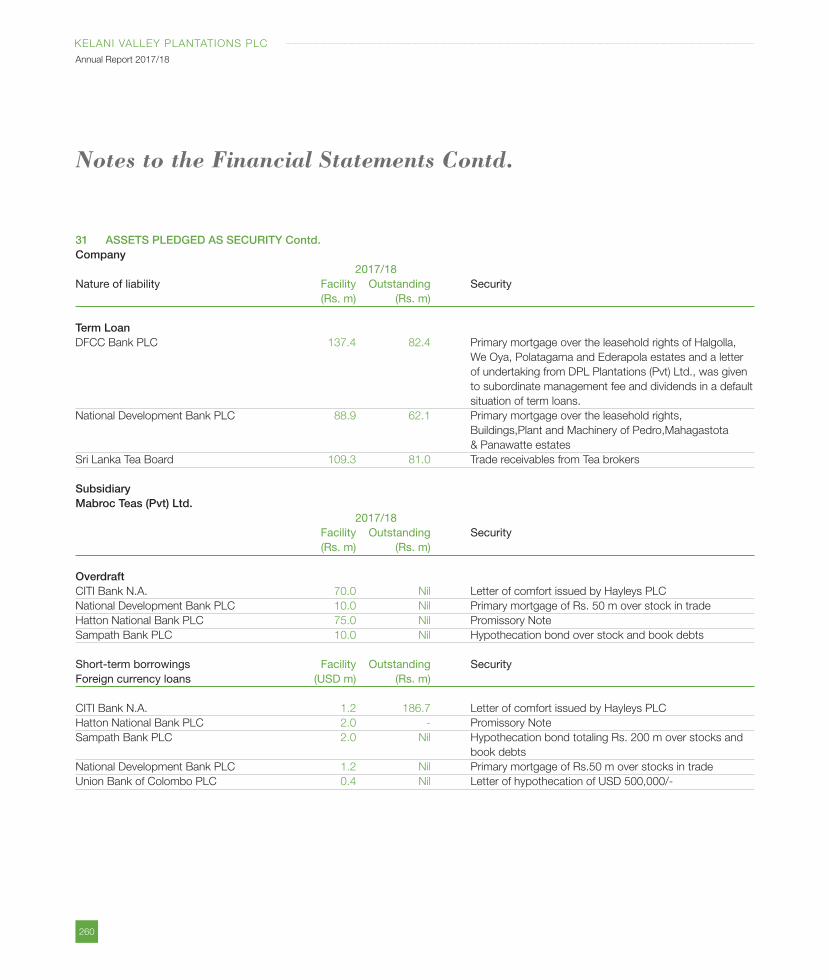
260
KELANI VALLEY PLANTATIONS PLC
Annual Report 2017/18
31 ASSETS PLEDGED AS SECURITY Contd.Company 2017/18Nature of liability Facility Outstanding Security (Rs. m) (Rs. m)
Term LoanDFCC Bank PLC 137.4 82.4 Primary mortgage over the leasehold rights of Halgolla,
We Oya, Polatagama and Ederapola estates and a letter
of undertaking from DPL Plantations (Pvt) Ltd., was given
to subordinate management fee and dividends in a default
situation of term loans.
National Development Bank PLC 88.9 62.1 Primary mortgage over the leasehold rights,
Buildings,Plant and Machinery of Pedro,Mahagastota
& Panawatte estates
Sri Lanka Tea Board 109.3 81.0 Trade receivables from Tea brokers
SubsidiaryMabroc Teas (Pvt) Ltd. 2017/18 Facility Outstanding Security (Rs. m) (Rs. m)
Overdraft CITI Bank N.A. 70.0 Nil Letter of comfort issued by Hayleys PLC
National Development Bank PLC 10.0 Nil Primary mortgage of Rs. 50 m over stock in trade
Hatton National Bank PLC 75.0 Nil Promissory Note
Sampath Bank PLC 10.0 Nil Hypothecation bond over stock and book debts
Short-term borrowings Facility Outstanding SecurityForeign currency loans (USD m) (Rs. m)
CITI Bank N.A. 1.2 186.7 Letter of comfort issued by Hayleys PLC
Hatton National Bank PLC 2.0 - Promissory Note
Sampath Bank PLC 2.0 Nil Hypothecation bond totaling Rs. 200 m over stocks and
book debts
National Development Bank PLC 1.2 Nil Primary mortgage of Rs.50 m over stocks in trade
Union Bank of Colombo PLC 0.4 Nil Letter of hypothecation of USD 500,000/-
Notes to the Financial Statements Contd.
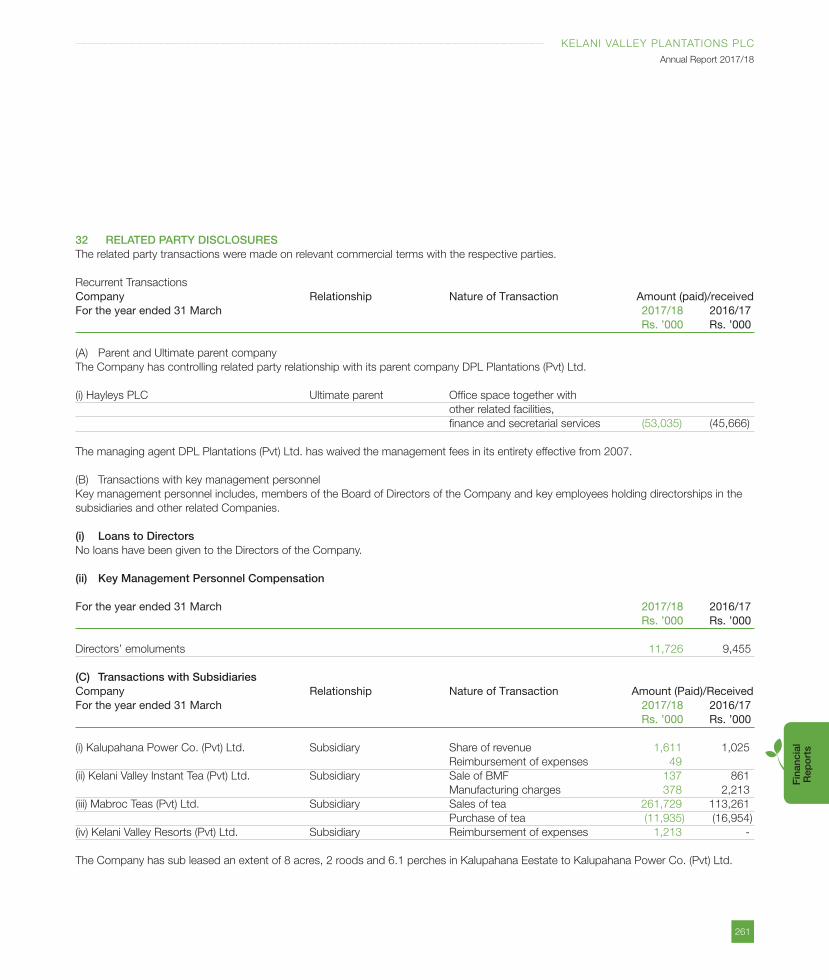
261
KELANI VALLEY PLANTATIONS PLC
Annual Report 2017/18
Fin
anci
al
Rep
ort
s
32 RELATED PARTY DISCLOSURESThe related party transactions were made on relevant commercial terms with the respective parties.
Recurrent Transactions
Company Relationship Nature of Transaction Amount (paid)/receivedFor the year ended 31 March 2017/18 2016/17 Rs. ’000 Rs. ’000
(A) Parent and Ultimate parent company
The Company has controlling related party relationship with its parent company DPL Plantations (Pvt) Ltd.
(i) Hayleys PLC Ultimate parent Office space together with
other related facilities,
finance and secretarial services (53,035) (45,666)
The managing agent DPL Plantations (Pvt) Ltd. has waived the management fees in its entirety effective from 2007.
(B) Transactions with key management personnel
Key management personnel includes, members of the Board of Directors of the Company and key employees holding directorships in the
subsidiaries and other related Companies.
(i) Loans to DirectorsNo loans have been given to the Directors of the Company.
(ii) Key Management Personnel Compensation
For the year ended 31 March 2017/18 2016/17 Rs. ’000 Rs. ’000
Directors’ emoluments 11,726 9,455
(C) Transactions with SubsidiariesCompany Relationship Nature of Transaction Amount (Paid)/ReceivedFor the year ended 31 March 2017/18 2016/17 Rs. ’000 Rs. ’000
(i) Kalupahana Power Co. (Pvt) Ltd. Subsidiary Share of revenue 1,611 1,025
Reimbursement of expenses 49
(ii) Kelani Valley Instant Tea (Pvt) Ltd. Subsidiary Sale of BMF 137 861
Manufacturing charges 378 2,213
(iii) Mabroc Teas (Pvt) Ltd. Subsidiary Sales of tea 261,729 113,261
Purchase of tea (11,935) (16,954)
(iv) Kelani Valley Resorts (Pvt) Ltd. Subsidiary Reimbursement of expenses 1,213 -
The Company has sub leased an extent of 8 acres, 2 roods and 6.1 perches in Kalupahana Eestate to Kalupahana Power Co. (Pvt) Ltd.
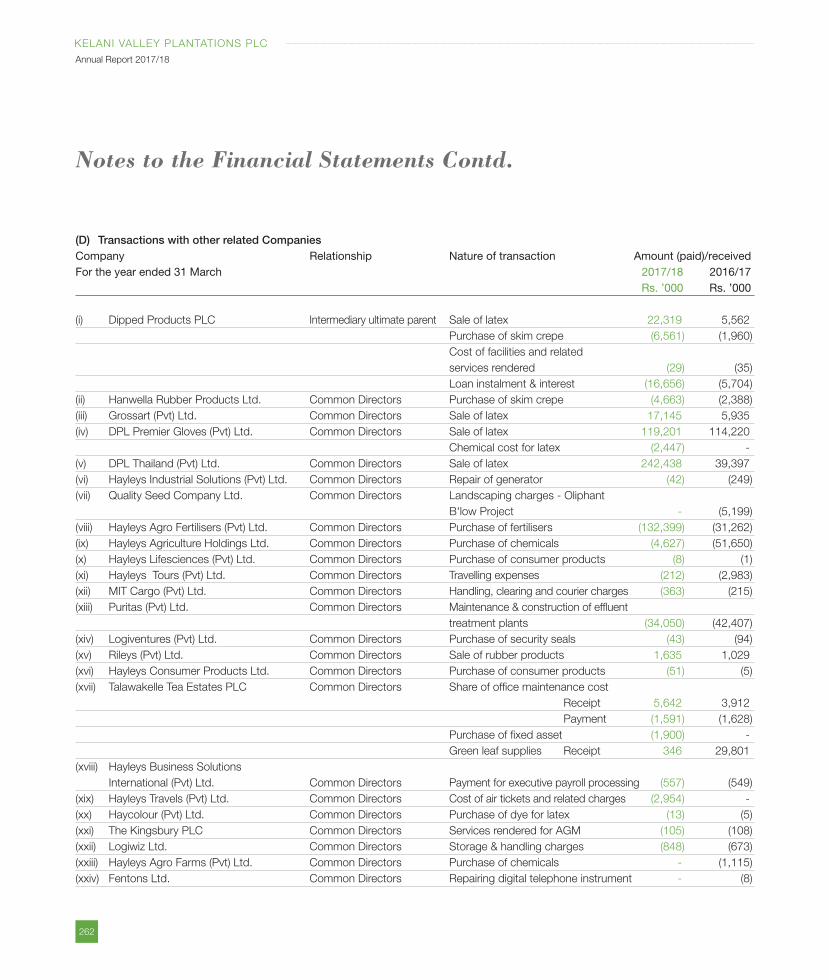
262
KELANI VALLEY PLANTATIONS PLC
Annual Report 2017/18
(D) Transactions with other related CompaniesCompany Relationship Nature of transaction Amount (paid)/receivedFor the year ended 31 March 2017/18 2016/17 Rs. ’000 Rs. ’000
(i) Dipped Products PLC Intermediary ultimate parent Sale of latex 22,319 5,562
Purchase of skim crepe (6,561) (1,960)
Cost of facilities and related
services rendered (29) (35)
Loan instalment & interest (16,656) (5,704)
(ii) Hanwella Rubber Products Ltd. Common Directors Purchase of skim crepe (4,663) (2,388)
(iii) Grossart (Pvt) Ltd. Common Directors Sale of latex 17,145 5,935
(iv) DPL Premier Gloves (Pvt) Ltd. Common Directors Sale of latex 119,201 114,220
Chemical cost for latex (2,447) -
(v) DPL Thailand (Pvt) Ltd. Common Directors Sale of latex 242,438 39,397
(vi) Hayleys Industrial Solutions (Pvt) Ltd. Common Directors Repair of generator (42) (249)
(vii) Quality Seed Company Ltd. Common Directors Landscaping charges - Oliphant
B'low Project - (5,199)
(viii) Hayleys Agro Fertilisers (Pvt) Ltd. Common Directors Purchase of fertilisers (132,399) (31,262)
(ix) Hayleys Agriculture Holdings Ltd. Common Directors Purchase of chemicals (4,627) (51,650)
(x) Hayleys Lifesciences (Pvt) Ltd. Common Directors Purchase of consumer products (8) (1)
(xi) Hayleys Tours (Pvt) Ltd. Common Directors Travelling expenses (212) (2,983)
(xii) MIT Cargo (Pvt) Ltd. Common Directors Handling, clearing and courier charges (363) (215)
(xiii) Puritas (Pvt) Ltd. Common Directors Maintenance & construction of effluent
treatment plants (34,050) (42,407)
(xiv) Logiventures (Pvt) Ltd. Common Directors Purchase of security seals (43) (94)
(xv) Rileys (Pvt) Ltd. Common Directors Sale of rubber products 1,635 1,029
(xvi) Hayleys Consumer Products Ltd. Common Directors Purchase of consumer products (51) (5)
(xvii) Talawakelle Tea Estates PLC Common Directors Share of office maintenance cost
Receipt 5,642 3,912
Payment (1,591) (1,628)
Purchase of fixed asset (1,900) -
Green leaf supplies Receipt 346 29,801
(xviii) Hayleys Business Solutions
International (Pvt) Ltd. Common Directors Payment for executive payroll processing (557) (549)
(xix) Hayleys Travels (Pvt) Ltd. Common Directors Cost of air tickets and related charges (2,954) -
(xx) Haycolour (Pvt) Ltd. Common Directors Purchase of dye for latex (13) (5)
(xxi) The Kingsbury PLC Common Directors Services rendered for AGM (105) (108)
(xxii) Logiwiz Ltd. Common Directors Storage & handling charges (848) (673)
(xxiii) Hayleys Agro Farms (Pvt) Ltd. Common Directors Purchase of chemicals - (1,115)
(xxiv) Fentons Ltd. Common Directors Repairing digital telephone instrument - (8)
Notes to the Financial Statements Contd.
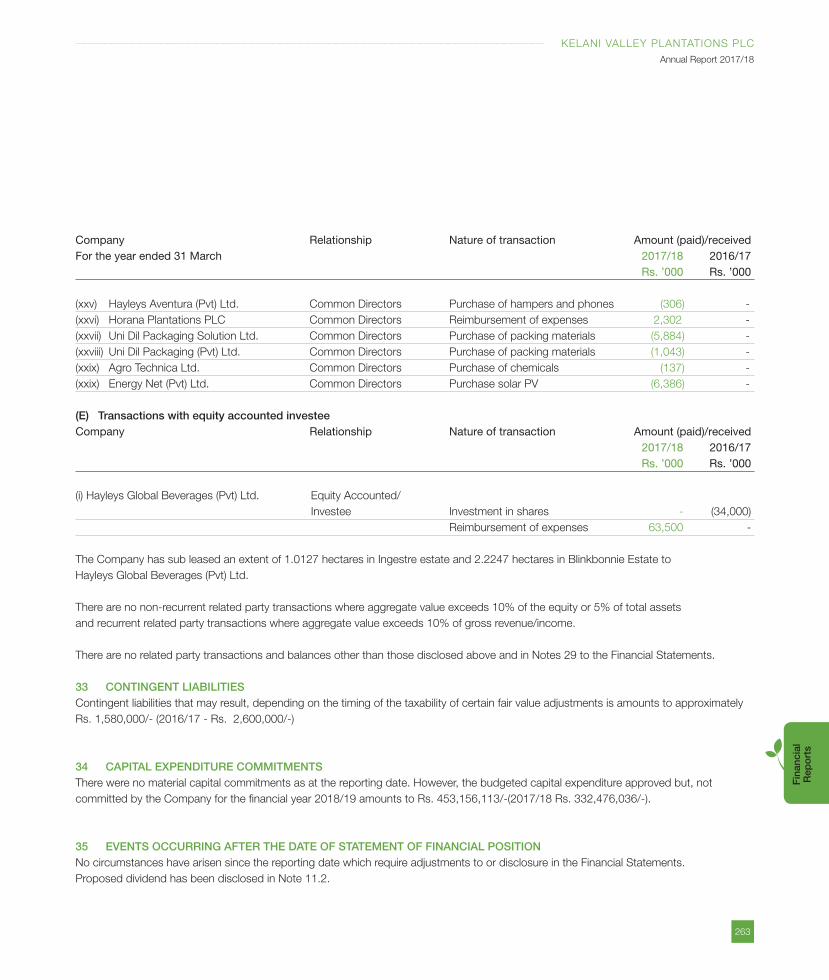
263
KELANI VALLEY PLANTATIONS PLC
Annual Report 2017/18
Fin
anci
al
Rep
ort
s
Company Relationship Nature of transaction Amount (paid)/receivedFor the year ended 31 March 2017/18 2016/17 Rs. ’000 Rs. ’000
(xxv) Hayleys Aventura (Pvt) Ltd. Common Directors Purchase of hampers and phones (306) -
(xxvi) Horana Plantations PLC Common Directors Reimbursement of expenses 2,302 -
(xxvii) Uni Dil Packaging Solution Ltd. Common Directors Purchase of packing materials (5,884) -
(xxviii) Uni Dil Packaging (Pvt) Ltd. Common Directors Purchase of packing materials (1,043) -
(xxix) Agro Technica Ltd. Common Directors Purchase of chemicals (137) -
(xxix) Energy Net (Pvt) Ltd. Common Directors Purchase solar PV (6,386) -
(E) Transactions with equity accounted investeeCompany Relationship Nature of transaction Amount (paid)/received 2017/18 2016/17 Rs. ’000 Rs. ’000
(i) Hayleys Global Beverages (Pvt) Ltd. Equity Accounted/
Investee Investment in shares - (34,000)
Reimbursement of expenses 63,500 -
The Company has sub leased an extent of 1.0127 hectares in Ingestre estate and 2.2247 hectares in Blinkbonnie Estate to
Hayleys Global Beverages (Pvt) Ltd.
There are no non-recurrent related party transactions where aggregate value exceeds 10% of the equity or 5% of total assets
and recurrent related party transactions where aggregate value exceeds 10% of gross revenue/income.
There are no related party transactions and balances other than those disclosed above and in Notes 29 to the Financial Statements.
33 CONTINGENT LIABILITIESContingent liabilities that may result, depending on the timing of the taxability of certain fair value adjustments is amounts to approximately
Rs. 1,580,000/- (2016/17 - Rs. 2,600,000/-)
34 CAPITAL EXPENDITURE COMMITMENTSThere were no material capital commitments as at the reporting date. However, the budgeted capital expenditure approved but, not
committed by the Company for the financial year 2018/19 amounts to Rs. 453,156,113/-(2017/18 Rs. 332,476,036/-).
35 EVENTS OCCURRING AFTER THE DATE OF STATEMENT OF FINANCIAL POSITIONNo circumstances have arisen since the reporting date which require adjustments to or disclosure in the Financial Statements.
Proposed dividend has been disclosed in Note 11.2.
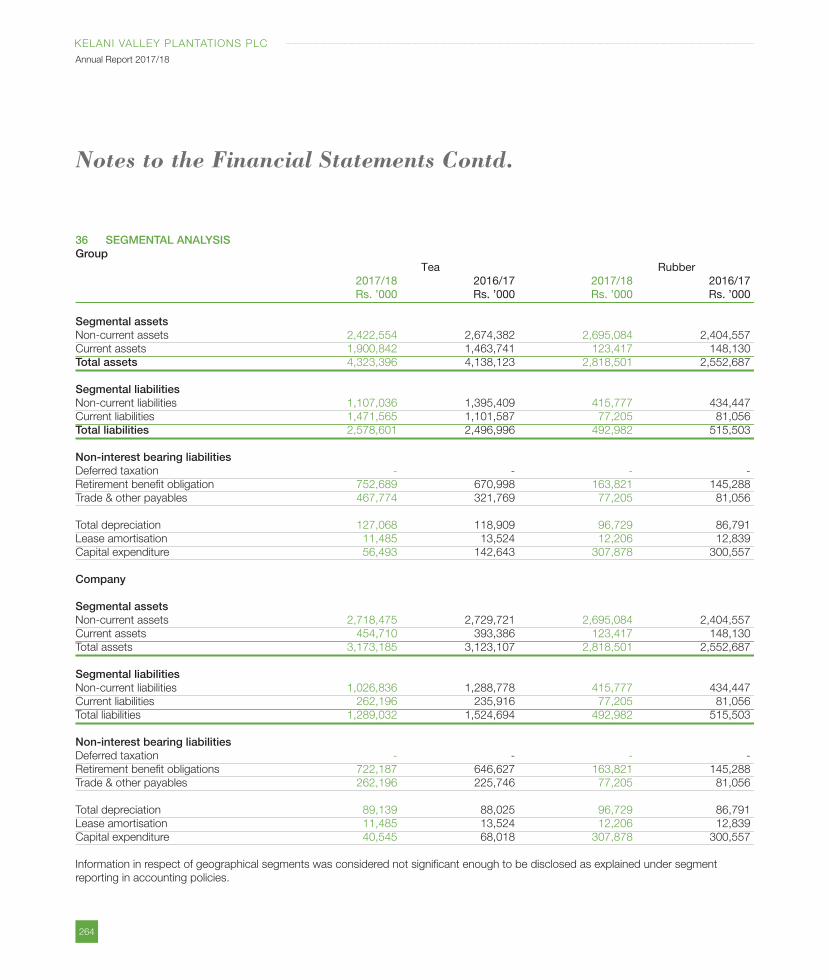
264
KELANI VALLEY PLANTATIONS PLC
Annual Report 2017/18
36 SEGMENTAL ANALYSISGroup Tea Rubber 2017/18 2016/17 2017/18 2016/17 Rs. ’000 Rs. ’000 Rs. ’000 Rs. ’000
Segmental assetsNon-current assets 2,422,554 2,674,382 2,695,084 2,404,557
Current assets 1,900,842 1,463,741 123,417 148,130
Total assets 4,323,396 4,138,123 2,818,501 2,552,687
Segmental liabilitiesNon-current liabilities 1,107,036 1,395,409 415,777 434,447
Current liabilities 1,471,565 1,101,587 77,205 81,056
Total liabilities 2,578,601 2,496,996 492,982 515,503
Non-interest bearing liabilitiesDeferred taxation - - - -
Retirement benefit obligation 752,689 670,998 163,821 145,288
Trade & other payables 467,774 321,769 77,205 81,056
Total depreciation 127,068 118,909 96,729 86,791
Lease amortisation 11,485 13,524 12,206 12,839
Capital expenditure 56,493 142,643 307,878 300,557
Company
Segmental assetsNon-current assets 2,718,475 2,729,721 2,695,084 2,404,557
Current assets 454,710 393,386 123,417 148,130
Total assets 3,173,185 3,123,107 2,818,501 2,552,687
Segmental liabilitiesNon-current liabilities 1,026,836 1,288,778 415,777 434,447
Current liabilities 262,196 235,916 77,205 81,056
Total liabilities 1,289,032 1,524,694 492,982 515,503
Non-interest bearing liabilitiesDeferred taxation - - - -
Retirement benefit obligations 722,187 646,627 163,821 145,288
Trade & other payables 262,196 225,746 77,205 81,056
Total depreciation 89,139 88,025 96,729 86,791
Lease amortisation 11,485 13,524 12,206 12,839
Capital expenditure 40,545 68,018 307,878 300,557
Information in respect of geographical segments was considered not significant enough to be disclosed as explained under segment
reporting in accounting policies.
Notes to the Financial Statements Contd.
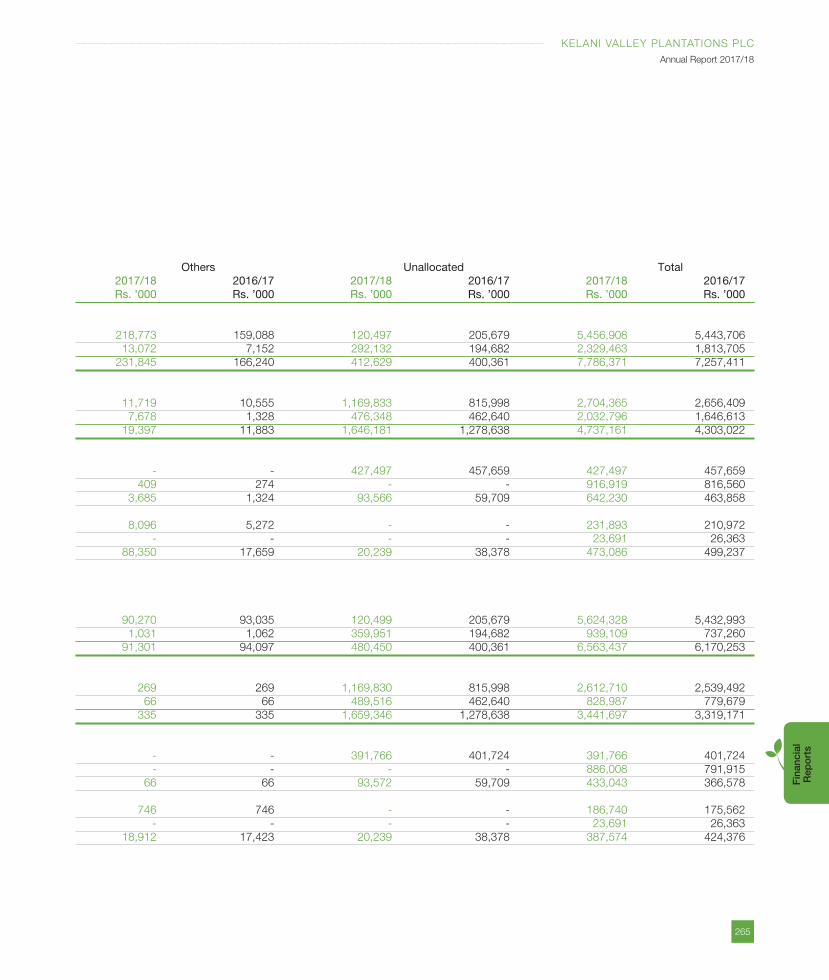
265
KELANI VALLEY PLANTATIONS PLC
Annual Report 2017/18
Fin
anci
al
Rep
ort
s
Others Unallocated Total 2017/18 2016/17 2017/18 2016/17 2017/18 2016/17 Rs. ’000 Rs. ’000 Rs. ’000 Rs. ’000 Rs. ’000 Rs. ’000
218,773 159,088 120,497 205,679 5,456,908 5,443,706
13,072 7,152 292,132 194,682 2,329,463 1,813,705
231,845 166,240 412,629 400,361 7,786,371 7,257,411
11,719 10,555 1,169,833 815,998 2,704,365 2,656,409
7,678 1,328 476,348 462,640 2,032,796 1,646,613
19,397 11,883 1,646,181 1,278,638 4,737,161 4,303,022
- - 427,497 457,659 427,497 457,659
409 274 - - 916,919 816,560
3,685 1,324 93,566 59,709 642,230 463,858
8,096 5,272 - - 231,893 210,972
- - - - 23,691 26,363
88,350 17,659 20,239 38,378 473,086 499,237
90,270 93,035 120,499 205,679 5,624,328 5,432,993
1,031 1,062 359,951 194,682 939,109 737,260
91,301 94,097 480,450 400,361 6,563,437 6,170,253
269 269 1,169,830 815,998 2,612,710 2,539,492
66 66 489,516 462,640 828,987 779,679
335 335 1,659,346 1,278,638 3,441,697 3,319,171
- - 391,766 401,724 391,766 401,724
- - - - 886,008 791,915
66 66 93,572 59,709 433,043 366,578
746 746 - - 186,740 175,562
- - - - 23,691 26,363
18,912 17,423 20,239 38,378 387,574 424,376
266
KELANI VALLEY PLANTATIONS PLC
Annual Report 2017/18
37 FINANCIAL RISK MANAGEMENT OBJECTIVES AND POLICIESThe Group’s principal financial liabilities, other than derivatives, comprise loans and borrowings, trade and other payables, and financial
guarantee contracts. The main purpose of these financial liabilities is to finance the Group’s operations and to provide guarantees to support
its operations. The Group has loan and other receivables, trade and other receivables, and cash and short-term deposits that arise directly
from its operations. Accordingly, the Group has exposure to mainly Credit Risk, Liquidity Risk, Currency Risk and Market Risks from its use
of financial instruments.
This note presents information about the Groups exposure to each of the above risks, the Group’s objectives, policies and processes for
measuring and managing risk.
37.1 Financial Risk Management FrameworkThe Board of Directors has the overall responsibility for the establishment and oversight of the group’s financial risk management framework
which includes developing and monitoring the Group’s financial risk management policies.
The Group financial risk management policies are established to identify, quantify and analyse the financial risks faced by the Group, to set
appropriate risk limits and controls and to monitor financial risks and adherence to limits. Financial risk management policies and systems
are reviewed regularly to reflect changes in market conditions and the Group’s activities.
The KVPL Audit Committee oversees how management monitors compliance with the Group’s financial risk management policies and
procedures and reviews the adequacy of the financial risk management framework in relation to the risks faced by the Group.
37.2 Credit RiskCredit Risk is the risk of financial loss to the Group if a customer or counterparty to a financial instrument fails to meet its contractual
obligations, and arise principally from the Group’s receivable from customers and from its financing activities including deposits with banks
and financial institution's foreign exchange transactions and other financial instruments.
37.2.1 Trade and Other Receivables
The Group’s exposure to credit risk is influenced by the individual characteristics of each customer. The new customers are analysed
individually for credit worthiness before Group’s standard payment and delivery terms and conditions are offered. Group review includes
external ratings, when available and in some cases, bank references, purchases limit etc., which also subject to under review on quarterly
basis. The past experience of the management is considered when revisions are made to terms and conditions.
The Group establishes an allowance for impairment that represents its estimate of incurred losses in respect of trade and other receivables.
The maximum exposure to credit risk for trade and other receivables at the reporting date is Rs. 831 m (2016/17 – Rs. 912 m).
KVPL has a minimal credit risk of its trade receivables as the repayment is guaranteed within seven days by the Tea and Rubber auction
systems.
Notes to the Financial Statements Contd.
267
KELANI VALLEY PLANTATIONS PLC
Annual Report 2017/18
Fin
anci
al
Rep
ort
s
MTPL has the largest exposure to credit risk as a major portion of the trade receivables are from foreign currencies. All open account
debtors are covered with export credit Insurance. Settlement of other debtors are carried through banks.
37.2.2 Investments
Credit risk from invested balances with the financial institutions are managed by the Hayleys Group Treasury Department in accordance
with the Group’s policy. Investments of surplus funds are made only with approved counterparties and within credit limits assigned to each
counterparty. The limits are set to minimise the concentration of risks and therefore, mitigate financial loss through potential counterparty’s
failure
The Group held short term investments of Rs. 35 m as at 31 March 2018 (2016/17 – Rs. 0.186 m) which represents the maximum credit
exposure on these assets.
Hayleys Global Beverages (Pvt) Ltd. (HGBL) is an equity accounted investee of the company. HGBL is in the early stage of the commercial
operations and acquired considerable long term assets for its commercial operations. The group board of directors continuously review the
operations of HGBL to ensure that the group investment is secured.
37.2.3 Cash and Cash Equivalents
The Group held cash at bank and in hand of Rs. 87 m as at 31 March 2018 (2016/17 – Rs. 45 m) which represents its maximum credit
exposure on these assets.
Sampath Bank PLC – A+ (lka)
Hatton National Bank PLC – AA – (lka)
Bank of Ceylon – AA+ (lka)
Citi Bank N.A. – AAA (lka)
Hong Kong and Shanghai Banking Corporation Ltd. – AAA(lka)
Pan Asia Banking Corporation PLC – BBB- (lka)
Union Bank of Colombo PLC – BBB
DFCC Bank PLC – AA- (lka)
Seylan Bank Ltd. – A+ (lka)
National Development Bank PLC – A+ (lka)
37.3. Liquidy RiskLiquidity risk is the risk that the Group will encounter difficulty in meeting the obligations associated with its financial liabilities that are settled
by delivering cash or another financial asset. The Group’s approach to managing liquidity is to ensure, as far as possible, that it will always
have sufficient liquidity to meet its liabilities when due, under both normal and stressed conditions, without incurring unacceptable losses or
risking damage to the Group’s reputation.
The Group does not concentrate on a single financial institution, thereby minimising the exposure to liquidity risk through diversification
of funding sources. The Group aims to fund investment activities of the individual and Group level by funding the long-term investment
with long-term financial sources and short-term investment with short-term financing. Where necessary, the Group consults the Treasury
Department and Strategic Business Development Unit in Parent Company for scrutinising the funding decisions.
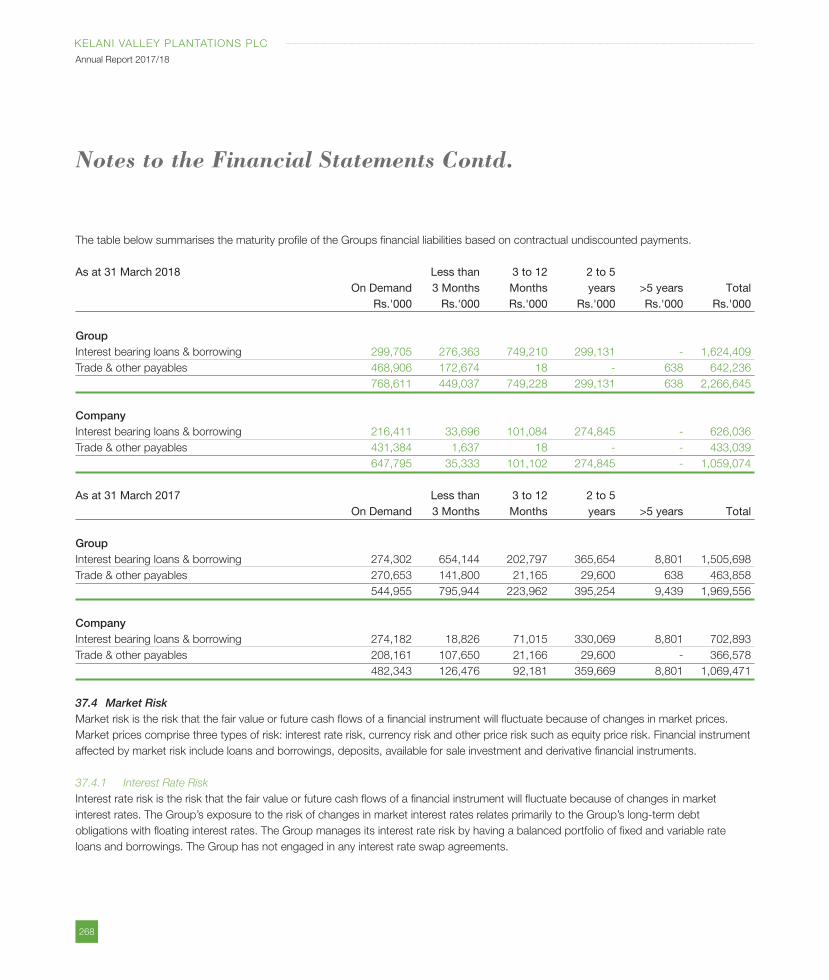
268
KELANI VALLEY PLANTATIONS PLC
Annual Report 2017/18
The table below summarises the maturity profile of the Groups financial liabilities based on contractual undiscounted payments.
As at 31 March 2018 Less than 3 to 12 2 to 5 On Demand 3 Months Months years >5 years Total Rs.'000 Rs.'000 Rs.'000 Rs.'000 Rs.'000 Rs.'000
GroupInterest bearing loans & borrowing 299,705 276,363 749,210 299,131 - 1,624,409
Trade & other payables 468,906 172,674 18 - 638 642,236
768,611 449,037 749,228 299,131 638 2,266,645
CompanyInterest bearing loans & borrowing 216,411 33,696 101,084 274,845 - 626,036
Trade & other payables 431,384 1,637 18 - - 433,039
647,795 35,333 101,102 274,845 - 1,059,074
As at 31 March 2017 Less than 3 to 12 2 to 5 On Demand 3 Months Months years >5 years Total
GroupInterest bearing loans & borrowing 274,302 654,144 202,797 365,654 8,801 1,505,698
Trade & other payables 270,653 141,800 21,165 29,600 638 463,858
544,955 795,944 223,962 395,254 9,439 1,969,556
CompanyInterest bearing loans & borrowing 274,182 18,826 71,015 330,069 8,801 702,893
Trade & other payables 208,161 107,650 21,166 29,600 - 366,578
482,343 126,476 92,181 359,669 8,801 1,069,471
37.4 Market RiskMarket risk is the risk that the fair value or future cash flows of a financial instrument will fluctuate because of changes in market prices.
Market prices comprise three types of risk: interest rate risk, currency risk and other price risk such as equity price risk. Financial instrument
affected by market risk include loans and borrowings, deposits, available for sale investment and derivative financial instruments.
37.4.1 Interest Rate Risk
Interest rate risk is the risk that the fair value or future cash flows of a financial instrument will fluctuate because of changes in market
interest rates. The Group’s exposure to the risk of changes in market interest rates relates primarily to the Group’s long-term debt
obligations with floating interest rates. The Group manages its interest rate risk by having a balanced portfolio of fixed and variable rate
loans and borrowings. The Group has not engaged in any interest rate swap agreements.
Notes to the Financial Statements Contd.
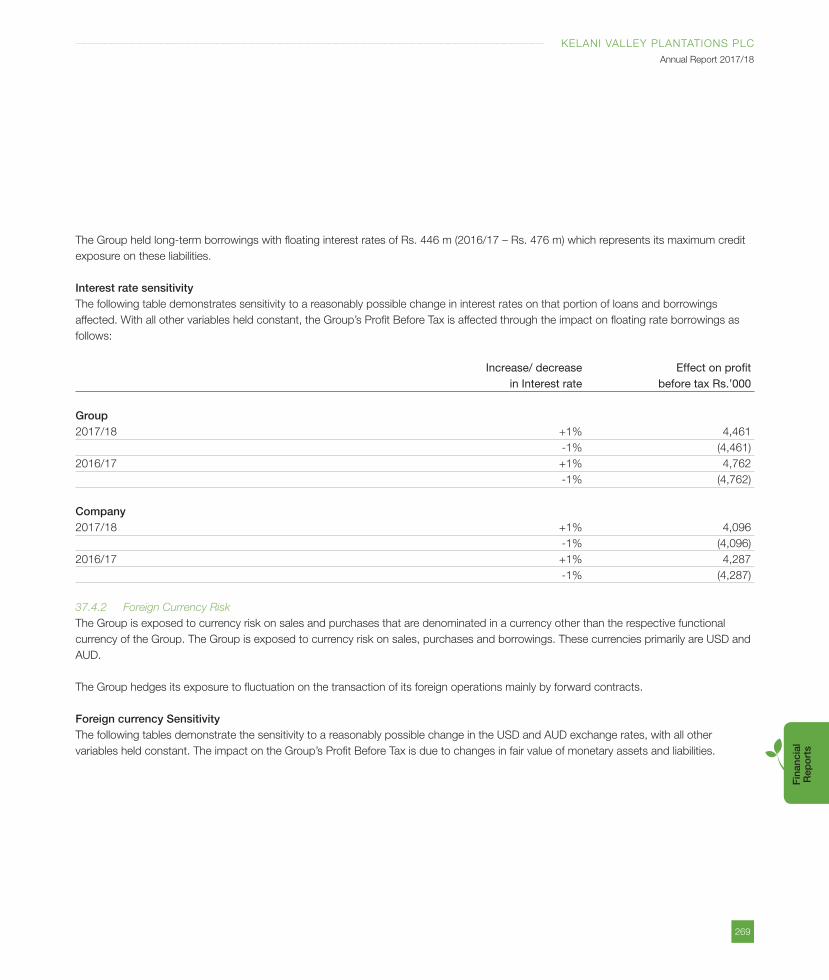
269
KELANI VALLEY PLANTATIONS PLC
Annual Report 2017/18
Fin
anci
al
Rep
ort
s
The Group held long-term borrowings with floating interest rates of Rs. 446 m (2016/17 – Rs. 476 m) which represents its maximum credit
exposure on these liabilities.
Interest rate sensitivityThe following table demonstrates sensitivity to a reasonably possible change in interest rates on that portion of loans and borrowings
affected. With all other variables held constant, the Group’s Profit Before Tax is affected through the impact on floating rate borrowings as
follows:
Increase/ decrease Effect on profit in Interest rate before tax Rs.’000
Group2017/18 +1% 4,461
-1% (4,461)
2016/17 +1% 4,762
-1% (4,762)
Company2017/18 +1% 4,096
-1% (4,096)
2016/17 +1% 4,287
-1% (4,287)
37.4.2 Foreign Currency Risk
The Group is exposed to currency risk on sales and purchases that are denominated in a currency other than the respective functional
currency of the Group. The Group is exposed to currency risk on sales, purchases and borrowings. These currencies primarily are USD and
AUD.
The Group hedges its exposure to fluctuation on the transaction of its foreign operations mainly by forward contracts.
Foreign currency SensitivityThe following tables demonstrate the sensitivity to a reasonably possible change in the USD and AUD exchange rates, with all other
variables held constant. The impact on the Group’s Profit Before Tax is due to changes in fair value of monetary assets and liabilities.
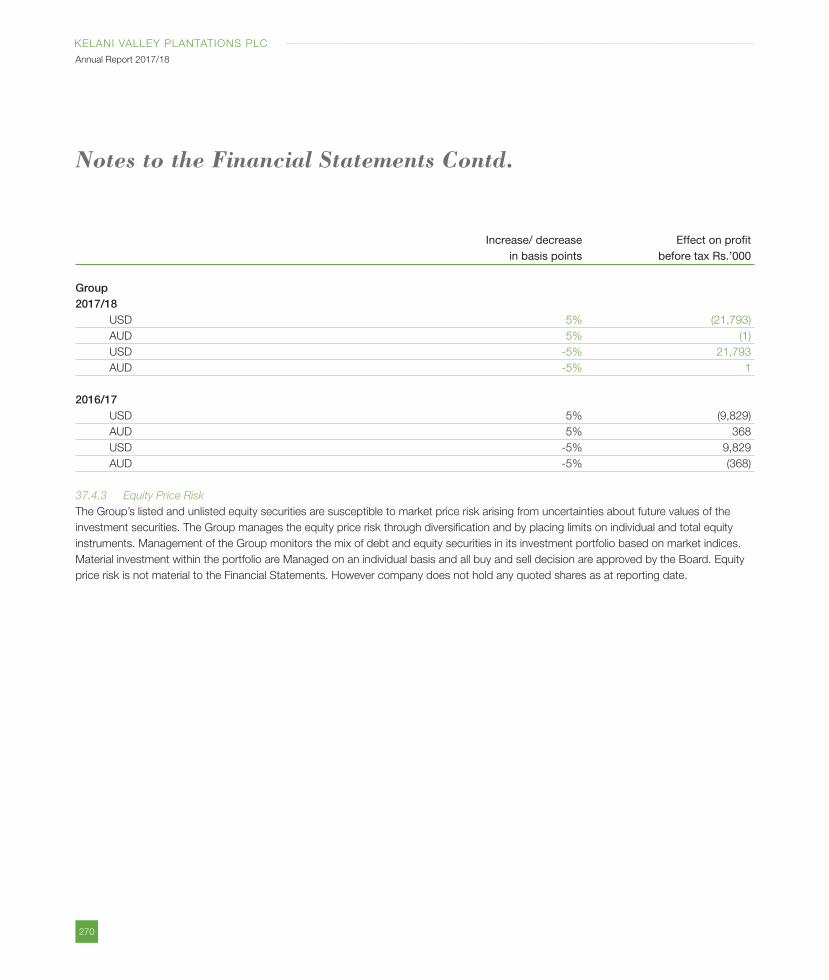
270
KELANI VALLEY PLANTATIONS PLC
Annual Report 2017/18
Increase/ decrease Effect on profit in basis points before tax Rs.’000
Group2017/18 USD 5% (21,793)
AUD 5% (1)
USD -5% 21,793
AUD -5% 1
2016/17 USD 5% (9,829)
AUD 5% 368
USD -5% 9,829
AUD -5% (368)
37.4.3 Equity Price Risk
The Group’s listed and unlisted equity securities are susceptible to market price risk arising from uncertainties about future values of the
investment securities. The Group manages the equity price risk through diversification and by placing limits on individual and total equity
instruments. Management of the Group monitors the mix of debt and equity securities in its investment portfolio based on market indices.
Material investment within the portfolio are Managed on an individual basis and all buy and sell decision are approved by the Board. Equity
price risk is not material to the Financial Statements. However company does not hold any quoted shares as at reporting date.
Notes to the Financial Statements Contd.
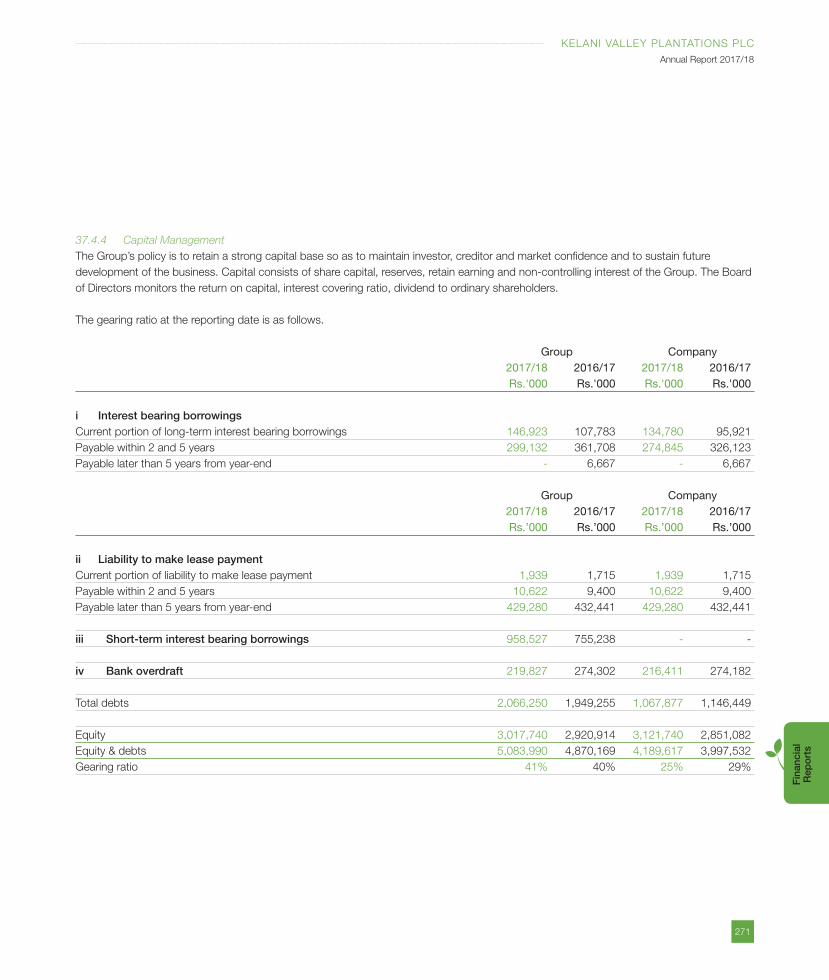
271
KELANI VALLEY PLANTATIONS PLC
Annual Report 2017/18
Fin
anci
al
Rep
ort
s
37.4.4 Capital Management
The Group’s policy is to retain a strong capital base so as to maintain investor, creditor and market confidence and to sustain future
development of the business. Capital consists of share capital, reserves, retain earning and non-controlling interest of the Group. The Board
of Directors monitors the return on capital, interest covering ratio, dividend to ordinary shareholders.
The gearing ratio at the reporting date is as follows.
Group Company 2017/18 2016/17 2017/18 2016/17 Rs.'000 Rs.'000 Rs.'000 Rs.'000
i Interest bearing borrowingsCurrent portion of long-term interest bearing borrowings 146,923 107,783 134,780 95,921
Payable within 2 and 5 years 299,132 361,708 274,845 326,123
Payable later than 5 years from year-end - 6,667 - 6,667
Group Company 2017/18 2016/17 2017/18 2016/17 Rs.’000 Rs.’000 Rs.’000 Rs.’000
ii Liability to make lease paymentCurrent portion of liability to make lease payment 1,939 1,715 1,939 1,715
Payable within 2 and 5 years 10,622 9,400 10,622 9,400
Payable later than 5 years from year-end 429,280 432,441 429,280 432,441
iii Short-term interest bearing borrowings 958,527 755,238 - -
iv Bank overdraft 219,827 274,302 216,411 274,182
Total debts 2,066,250 1,949,255 1,067,877 1,146,449
Equity 3,017,740 2,920,914 3,121,740 2,851,082
Equity & debts 5,083,990 4,870,169 4,189,617 3,997,532
Gearing ratio 41% 40% 25% 29%
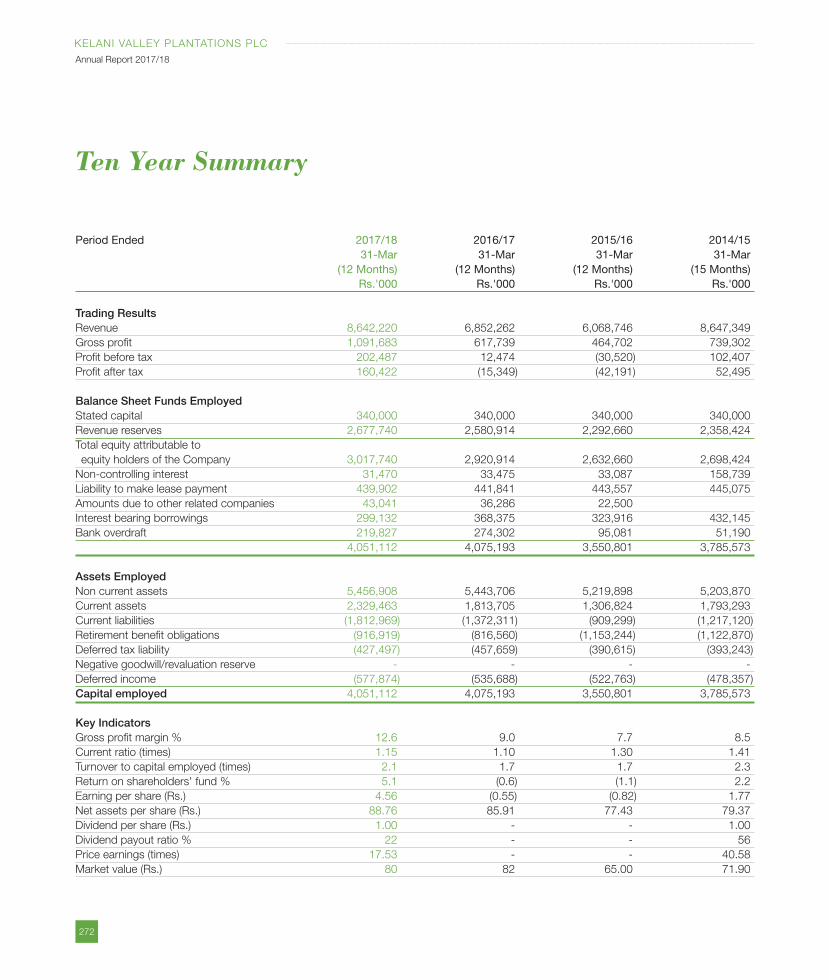
272
KELANI VALLEY PLANTATIONS PLC
Annual Report 2017/18
Ten Year Summary
Period Ended 2017/18 2016/17 2015/16 2014/15 31-Mar 31-Mar 31-Mar 31-Mar (12 Months) (12 Months) (12 Months) (15 Months) Rs.'000 Rs.'000 Rs.'000 Rs.'000
Trading ResultsRevenue 8,642,220 6,852,262 6,068,746 8,647,349
Gross profit 1,091,683 617,739 464,702 739,302
Profit before tax 202,487 12,474 (30,520) 102,407
Profit after tax 160,422 (15,349) (42,191) 52,495
Balance Sheet Funds EmployedStated capital 340,000 340,000 340,000 340,000
Revenue reserves 2,677,740 2,580,914 2,292,660 2,358,424
Total equity attributable to
equity holders of the Company 3,017,740 2,920,914 2,632,660 2,698,424
Non-controlling interest 31,470 33,475 33,087 158,739
Liability to make lease payment 439,902 441,841 443,557 445,075
Amounts due to other related companies 43,041 36,286 22,500
Interest bearing borrowings 299,132 368,375 323,916 432,145
Bank overdraft 219,827 274,302 95,081 51,190
4,051,112 4,075,193 3,550,801 3,785,573
Assets EmployedNon current assets 5,456,908 5,443,706 5,219,898 5,203,870
Current assets 2,329,463 1,813,705 1,306,824 1,793,293
Current liabilities (1,812,969) (1,372,311) (909,299) (1,217,120)
Retirement benefit obligations (916,919) (816,560) (1,153,244) (1,122,870)
Deferred tax liability (427,497) (457,659) (390,615) (393,243)
Negative goodwill/revaluation reserve - - - -
Deferred income (577,874) (535,688) (522,763) (478,357)
Capital employed 4,051,112 4,075,193 3,550,801 3,785,573
Key IndicatorsGross profit margin % 12.6 9.0 7.7 8.5
Current ratio (times) 1.15 1.10 1.30 1.41
Turnover to capital employed (times) 2.1 1.7 1.7 2.3
Return on shareholders' fund % 5.1 (0.6) (1.1) 2.2
Earning per share (Rs.) 4.56 (0.55) (0.82) 1.77
Net assets per share (Rs.) 88.76 85.91 77.43 79.37
Dividend per share (Rs.) 1.00 - - 1.00
Dividend payout ratio % 22 - - 56
Price earnings (times) 17.53 - - 40.58
Market value (Rs.) 80 82 65.00 71.90
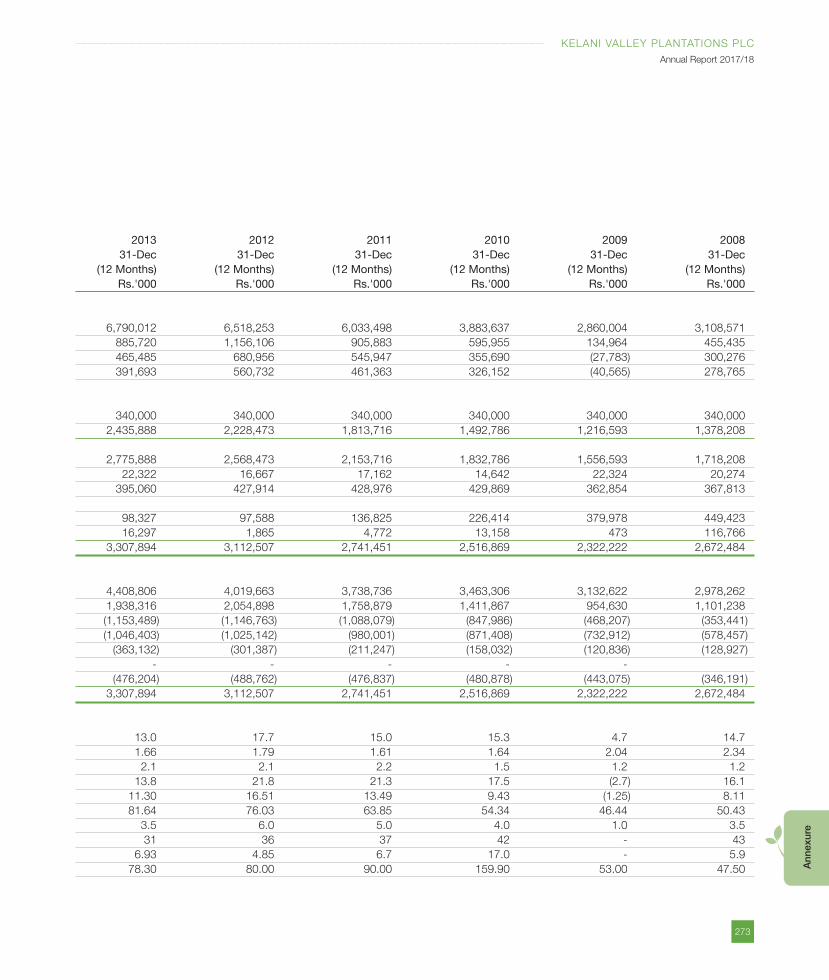
273
KELANI VALLEY PLANTATIONS PLC
Annual Report 2017/18
Ann
exur
e
2013 2012 2011 2010 2009 2008 31-Dec 31-Dec 31-Dec 31-Dec 31-Dec 31-Dec (12 Months) (12 Months) (12 Months) (12 Months) (12 Months) (12 Months) Rs.'000 Rs.'000 Rs.'000 Rs.'000 Rs.'000 Rs.'000
6,790,012 6,518,253 6,033,498 3,883,637 2,860,004 3,108,571
885,720 1,156,106 905,883 595,955 134,964 455,435
465,485 680,956 545,947 355,690 (27,783) 300,276
391,693 560,732 461,363 326,152 (40,565) 278,765
340,000 340,000 340,000 340,000 340,000 340,000
2,435,888 2,228,473 1,813,716 1,492,786 1,216,593 1,378,208
2,775,888 2,568,473 2,153,716 1,832,786 1,556,593 1,718,208
22,322 16,667 17,162 14,642 22,324 20,274
395,060 427,914 428,976 429,869 362,854 367,813
98,327 97,588 136,825 226,414 379,978 449,423
16,297 1,865 4,772 13,158 473 116,766
3,307,894 3,112,507 2,741,451 2,516,869 2,322,222 2,672,484
4,408,806 4,019,663 3,738,736 3,463,306 3,132,622 2,978,262
1,938,316 2,054,898 1,758,879 1,411,867 954,630 1,101,238
(1,153,489) (1,146,763) (1,088,079) (847,986) (468,207) (353,441)
(1,046,403) (1,025,142) (980,001) (871,408) (732,912) (578,457)
(363,132) (301,387) (211,247) (158,032) (120,836) (128,927)
- - - - -
(476,204) (488,762) (476,837) (480,878) (443,075) (346,191)
3,307,894 3,112,507 2,741,451 2,516,869 2,322,222 2,672,484
13.0 17.7 15.0 15.3 4.7 14.7
1.66 1.79 1.61 1.64 2.04 2.34
2.1 2.1 2.2 1.5 1.2 1.2
13.8 21.8 21.3 17.5 (2.7) 16.1
11.30 16.51 13.49 9.43 (1.25) 8.11
81.64 76.03 63.85 54.34 46.44 50.43
3.5 6.0 5.0 4.0 1.0 3.5
31 36 37 42 - 43
6.93 4.85 6.7 17.0 - 5.9
78.30 80.00 90.00 159.90 53.00 47.50
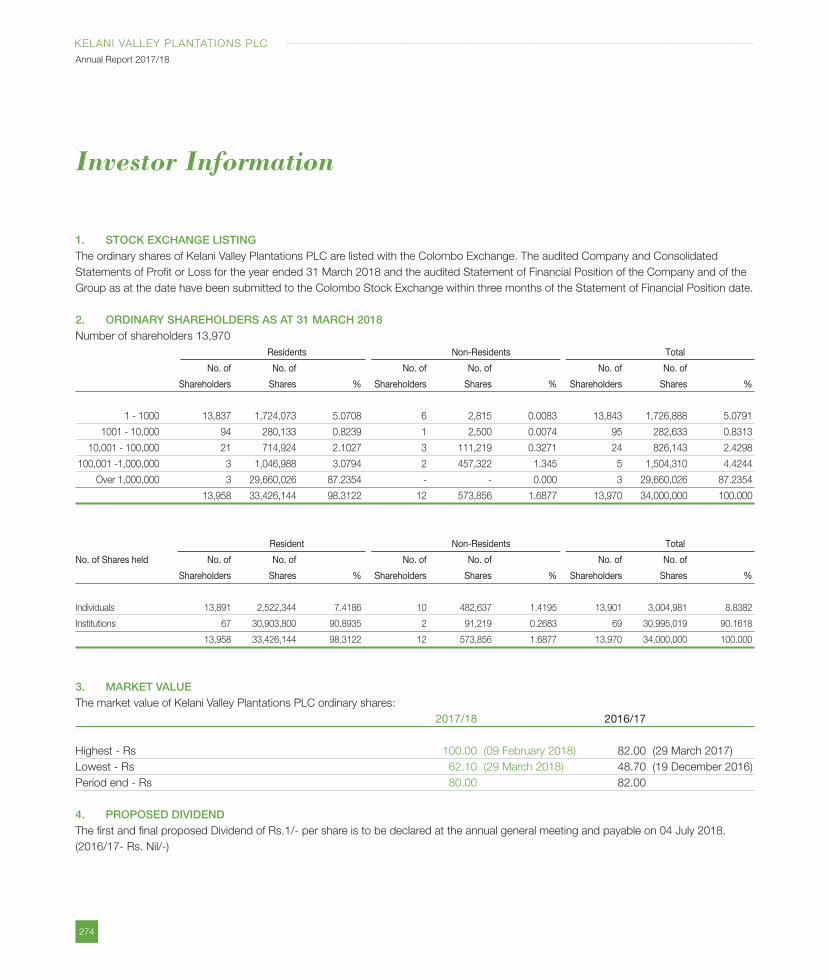
274
KELANI VALLEY PLANTATIONS PLC
Annual Report 2017/18
Investor Information
1. STOCK EXCHANGE LISTINGThe ordinary shares of Kelani Valley Plantations PLC are listed with the Colombo Exchange. The audited Company and Consolidated
Statements of Profit or Loss for the year ended 31 March 2018 and the audited Statement of Financial Position of the Company and of the
Group as at the date have been submitted to the Colombo Stock Exchange within three months of the Statement of Financial Position date.
2. ORDINARY SHAREHOLDERS AS AT 31 MARCH 2018Number of shareholders 13,970
Residents Non-Residents Total
No. of No. of No. of No. of No. of No. of
Shareholders Shares % Shareholders Shares % Shareholders Shares %
1 - 1000 13,837 1,724,073 5.0708 6 2,815 0.0083 13,843 1,726,888 5.0791
1001 - 10,000 94 280,133 0.8239 1 2,500 0.0074 95 282,633 0.8313
10,001 - 100,000 21 714,924 2.1027 3 111,219 0.3271 24 826,143 2.4298
100,001 -1,000,000 3 1,046,988 3.0794 2 457,322 1.345 5 1,504,310 4.4244
Over 1,000,000 3 29,660,026 87.2354 - - 0.000 3 29,660,026 87.2354
13,958 33,426,144 98.3122 12 573,856 1.6877 13,970 34,000,000 100.000
Resident Non-Residents Total
No. of Shares held No. of No. of No. of No. of No. of No. of
Shareholders Shares % Shareholders Shares % Shareholders Shares %
Individuals 13,891 2,522,344 7.4186 10 482,637 1.4195 13,901 3,004,981 8.8382
Institutions 67 30,903,800 90.8935 2 91,219 0.2683 69 30,995,019 90.1618
13,958 33,426,144 98.3122 12 573,856 1.6877 13,970 34,000,000 100.000
3. MARKET VALUEThe market value of Kelani Valley Plantations PLC ordinary shares:
2017/18 2016/17
Highest - Rs 100.00 (09 February 2018) 82.00 (29 March 2017)
Lowest - Rs 62.10 (29 March 2018) 48.70 (19 December 2016)
Period end - Rs 80.00 82.00
4. PROPOSED DIVIDENDThe first and final proposed Dividend of Rs.1/- per share is to be declared at the annual general meeting and payable on 04 July 2018.
(2016/17- Rs. Nil/-)
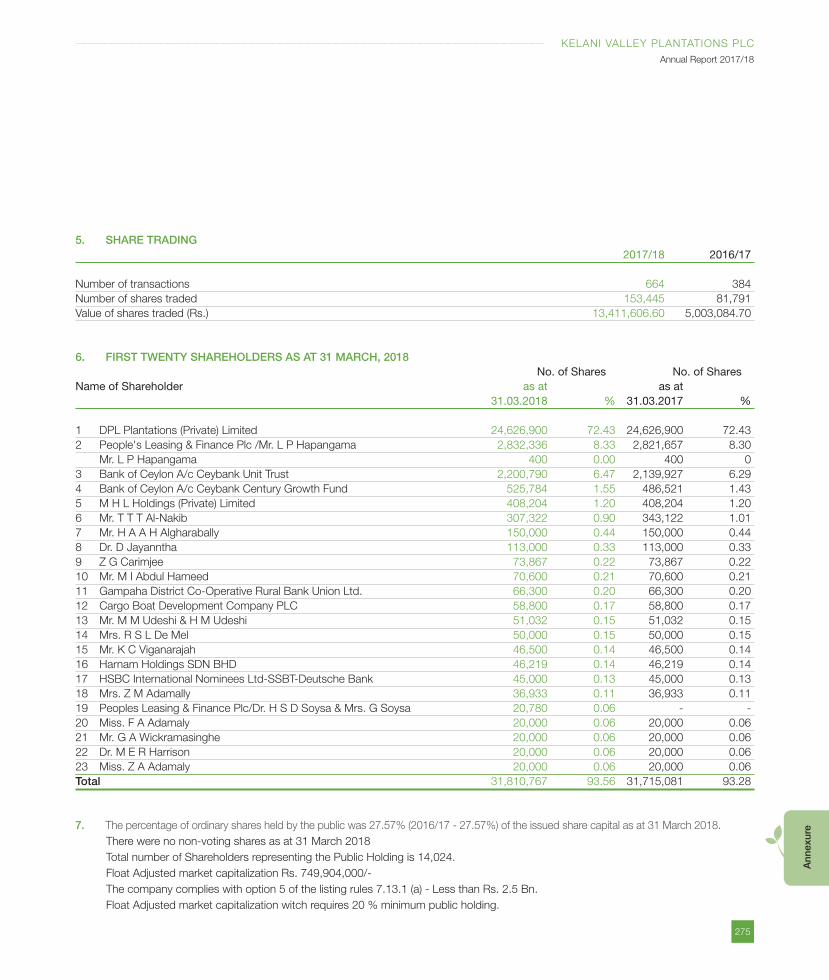
275
KELANI VALLEY PLANTATIONS PLC
Annual Report 2017/18
Ann
exur
e
5. SHARE TRADING 2017/18 2016/17
Number of transactions 664 384
Number of shares traded 153,445 81,791
Value of shares traded (Rs.) 13,411,606.60 5,003,084.70
6. FIRST TWENTY SHAREHOLDERS AS AT 31 MARCH, 2018 No. of Shares No. of SharesName of Shareholder as at as at 31.03.2018 % 31.03.2017 %
1 DPL Plantations (Private) Limited 24,626,900 72.43 24,626,900 72.43
2 People's Leasing & Finance Plc /Mr. L P Hapangama 2,832,336 8.33 2,821,657 8.30
Mr. L P Hapangama 400 0.00 400 0
3 Bank of Ceylon A/c Ceybank Unit Trust 2,200,790 6.47 2,139,927 6.29
4 Bank of Ceylon A/c Ceybank Century Growth Fund 525,784 1.55 486,521 1.43
5 M H L Holdings (Private) Limited 408,204 1.20 408,204 1.20
6 Mr. T T T Al-Nakib 307,322 0.90 343,122 1.01
7 Mr. H A A H Algharabally 150,000 0.44 150,000 0.44
8 Dr. D Jayanntha 113,000 0.33 113,000 0.33
9 Z G Carimjee 73,867 0.22 73,867 0.22
10 Mr. M I Abdul Hameed 70,600 0.21 70,600 0.21
11 Gampaha District Co-Operative Rural Bank Union Ltd. 66,300 0.20 66,300 0.20
12 Cargo Boat Development Company PLC 58,800 0.17 58,800 0.17
13 Mr. M M Udeshi & H M Udeshi 51,032 0.15 51,032 0.15
14 Mrs. R S L De Mel 50,000 0.15 50,000 0.15
15 Mr. K C Viganarajah 46,500 0.14 46,500 0.14
16 Harnam Holdings SDN BHD 46,219 0.14 46,219 0.14
17 HSBC International Nominees Ltd-SSBT-Deutsche Bank 45,000 0.13 45,000 0.13
18 Mrs. Z M Adamally 36,933 0.11 36,933 0.11
19 Peoples Leasing & Finance Plc/Dr. H S D Soysa & Mrs. G Soysa 20,780 0.06 - -
20 Miss. F A Adamaly 20,000 0.06 20,000 0.06
21 Mr. G A Wickramasinghe 20,000 0.06 20,000 0.06
22 Dr. M E R Harrison 20,000 0.06 20,000 0.06
23 Miss. Z A Adamaly 20,000 0.06 20,000 0.06
Total 31,810,767 93.56 31,715,081 93.28
7. The percentage of ordinary shares held by the public was 27.57% (2016/17 - 27.57%) of the issued share capital as at 31 March 2018.
There were no non-voting shares as at 31 March 2018
Total number of Shareholders representing the Public Holding is 14,024.
Float Adjusted market capitalization Rs. 749,904,000/-
The company complies with option 5 of the listing rules 7.13.1 (a) - Less than Rs. 2.5 Bn.
Float Adjusted market capitalization witch requires 20 % minimum public holding.
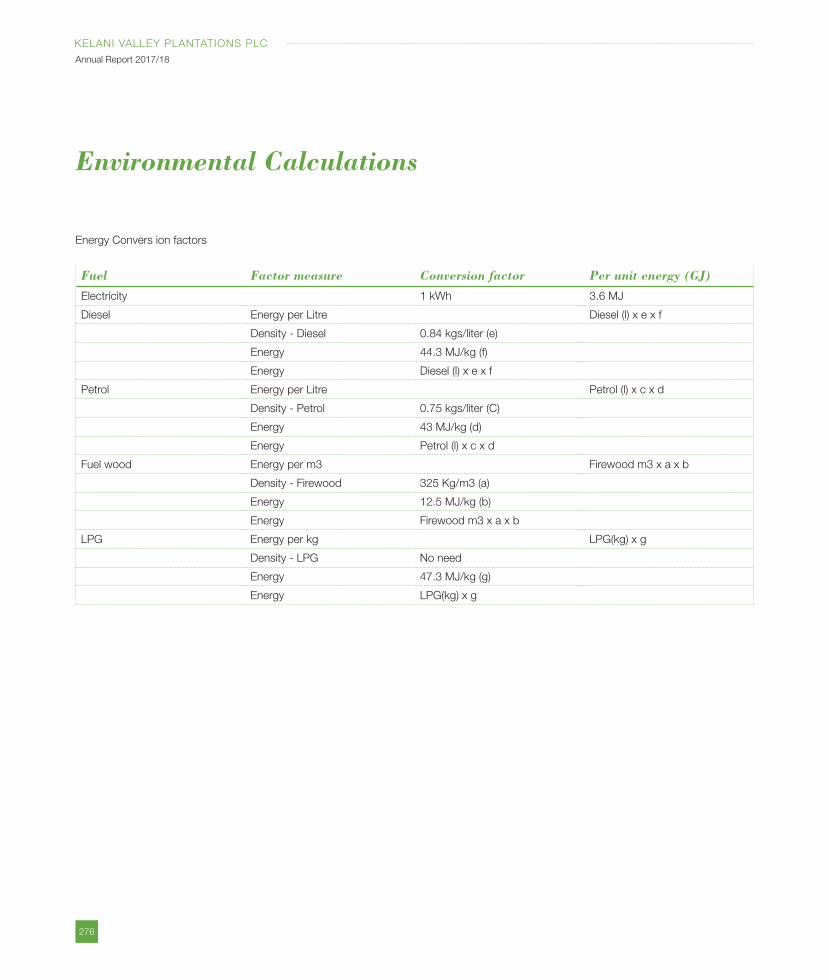
276
KELANI VALLEY PLANTATIONS PLC
Annual Report 2017/18
Environmental Calculations
Energy Convers ion factors
Fuel Factor measure Conversion factor Per unit energy (GJ)
Electricity 1 kWh 3.6 MJ
Diesel Energy per Litre Diesel (l) x e x f
Density - Diesel 0.84 kgs/liter (e)
Energy 44.3 MJ/kg (f)
Energy Diesel (l) x e x f
Petrol Energy per Litre Petrol (l) x c x d
Density - Petrol 0.75 kgs/liter (C)
Energy 43 MJ/kg (d)
Energy Petrol (l) x c x d
Fuel wood Energy per m3 Firewood m3 x a x b
Density - Firewood 325 Kg/m3 (a)
Energy 12.5 MJ/kg (b)
Energy Firewood m3 x a x b
LPG Energy per kg LPG(kg) x g
Density - LPG No need
Energy 47.3 MJ/kg (g)
Energy LPG(kg) x g
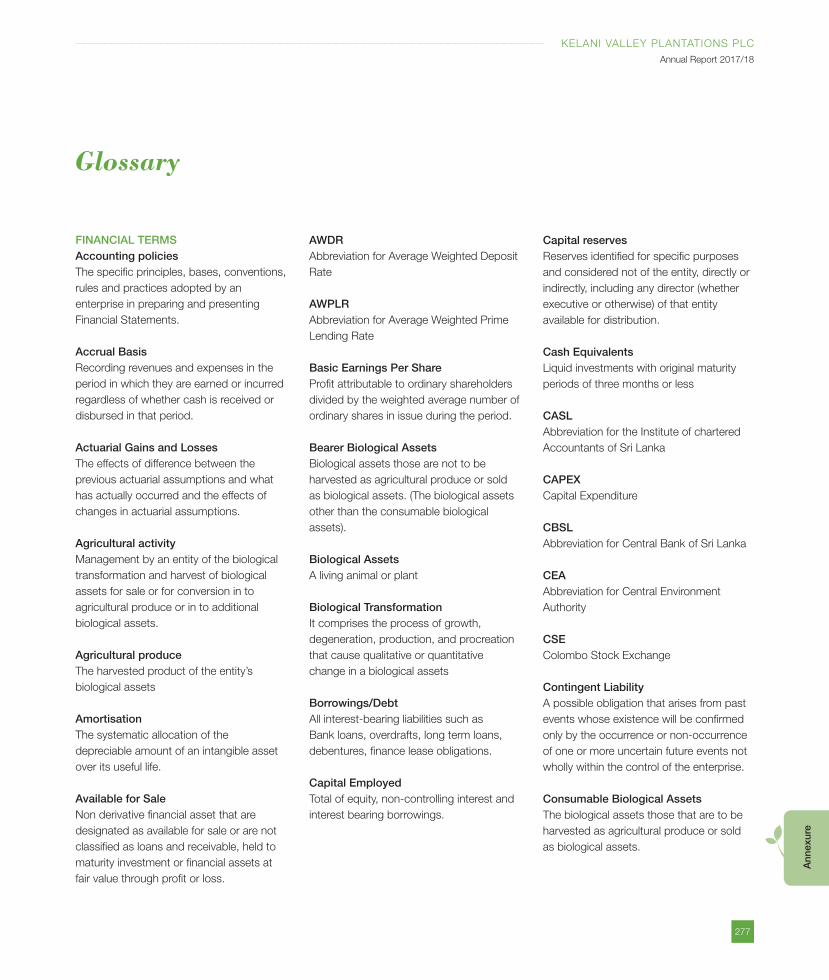
277
KELANI VALLEY PLANTATIONS PLC
Annual Report 2017/18
Ann
exur
e
Glossary
FINANCIAL TERMSAccounting policiesThe specific principles, bases, conventions,
rules and practices adopted by an
enterprise in preparing and presenting
Financial Statements.
Accrual BasisRecording revenues and expenses in the
period in which they are earned or incurred
regardless of whether cash is received or
disbursed in that period.
Actuarial Gains and LossesThe effects of difference between the
previous actuarial assumptions and what
has actually occurred and the effects of
changes in actuarial assumptions.
Agricultural activityManagement by an entity of the biological
transformation and harvest of biological
assets for sale or for conversion in to
agricultural produce or in to additional
biological assets.
Agricultural produceThe harvested product of the entity’s
biological assets
AmortisationThe systematic allocation of the
depreciable amount of an intangible asset
over its useful life.
Available for SaleNon derivative financial asset that are
designated as available for sale or are not
classified as loans and receivable, held to
maturity investment or financial assets at
fair value through profit or loss.
AWDRAbbreviation for Average Weighted Deposit
Rate
AWPLRAbbreviation for Average Weighted Prime
Lending Rate
Basic Earnings Per ShareProfit attributable to ordinary shareholders
divided by the weighted average number of
ordinary shares in issue during the period.
Bearer Biological AssetsBiological assets those are not to be
harvested as agricultural produce or sold
as biological assets. (The biological assets
other than the consumable biological
assets).
Biological AssetsA living animal or plant
Biological TransformationIt comprises the process of growth,
degeneration, production, and procreation
that cause qualitative or quantitative
change in a biological assets
Borrowings/DebtAll interest-bearing liabilities such as
Bank loans, overdrafts, long term loans,
debentures, finance lease obligations.
Capital EmployedTotal of equity, non-controlling interest and
interest bearing borrowings.
Capital reservesReserves identified for specific purposes
and considered not of the entity, directly or
indirectly, including any director (whether
executive or otherwise) of that entity
available for distribution.
Cash EquivalentsLiquid investments with original maturity
periods of three months or less
CASLAbbreviation for the Institute of chartered
Accountants of Sri Lanka
CAPEXCapital Expenditure
CBSLAbbreviation for Central Bank of Sri Lanka
CEAAbbreviation for Central Environment
Authority
CSEColombo Stock Exchange
Contingent LiabilityA possible obligation that arises from past
events whose existence will be confirmed
only by the occurrence or non-occurrence
of one or more uncertain future events not
wholly within the control of the enterprise.
Consumable Biological AssetsThe biological assets those that are to be
harvested as agricultural produce or sold
as biological assets.
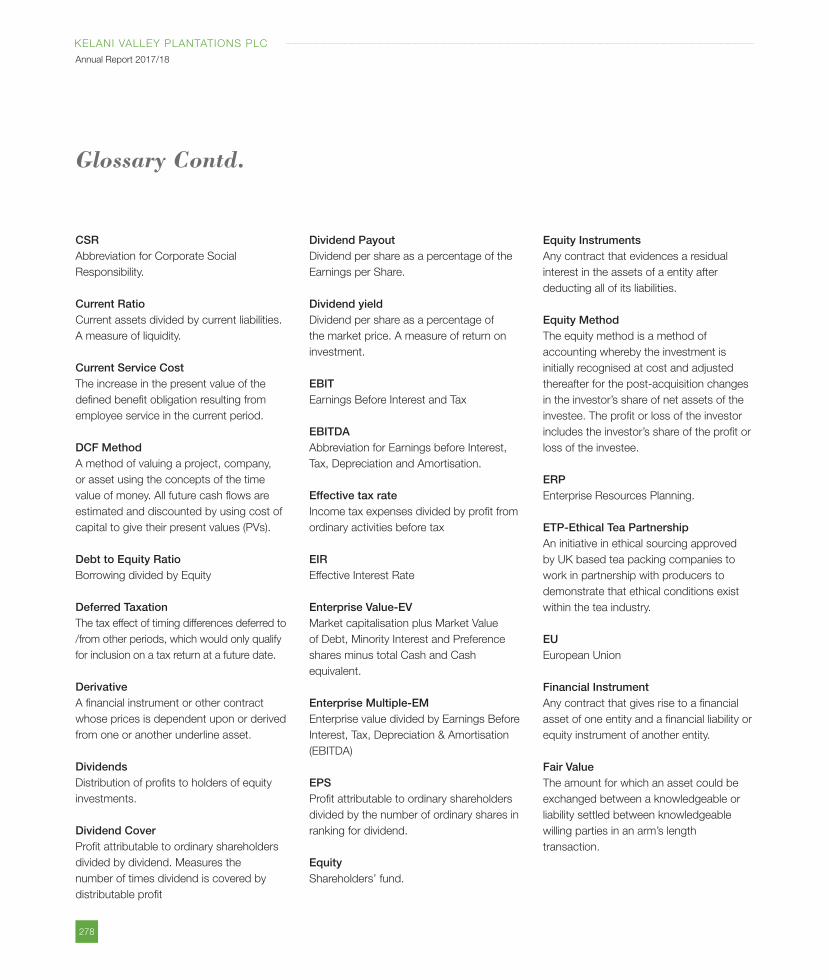
278
KELANI VALLEY PLANTATIONS PLC
Annual Report 2017/18
CSRAbbreviation for Corporate Social
Responsibility.
Current RatioCurrent assets divided by current liabilities.
A measure of liquidity.
Current Service CostThe increase in the present value of the
defined benefit obligation resulting from
employee service in the current period.
DCF MethodA method of valuing a project, company,
or asset using the concepts of the time
value of money. All future cash flows are
estimated and discounted by using cost of
capital to give their present values (PVs).
Debt to Equity RatioBorrowing divided by Equity
Deferred TaxationThe tax effect of timing differences deferred to
/from other periods, which would only qualify
for inclusion on a tax return at a future date.
DerivativeA financial instrument or other contract
whose prices is dependent upon or derived
from one or another underline asset.
DividendsDistribution of profits to holders of equity
investments.
Dividend CoverProfit attributable to ordinary shareholders
divided by dividend. Measures the
number of times dividend is covered by
distributable profit
Dividend PayoutDividend per share as a percentage of the
Earnings per Share.
Dividend yieldDividend per share as a percentage of
the market price. A measure of return on
investment.
EBITEarnings Before Interest and Tax
EBITDAAbbreviation for Earnings before Interest,
Tax, Depreciation and Amortisation.
Effective tax rateIncome tax expenses divided by profit from
ordinary activities before tax
EIREffective Interest Rate
Enterprise Value-EVMarket capitalisation plus Market Value
of Debt, Minority Interest and Preference
shares minus total Cash and Cash
equivalent.
Enterprise Multiple-EMEnterprise value divided by Earnings Before
Interest, Tax, Depreciation & Amortisation
(EBITDA)
EPSProfit attributable to ordinary shareholders
divided by the number of ordinary shares in
ranking for dividend.
EquityShareholders’ fund.
Equity InstrumentsAny contract that evidences a residual
interest in the assets of a entity after
deducting all of its liabilities.
Equity MethodThe equity method is a method of
accounting whereby the investment is
initially recognised at cost and adjusted
thereafter for the post-acquisition changes
in the investor’s share of net assets of the
investee. The profit or loss of the investor
includes the investor’s share of the profit or
loss of the investee.
ERPEnterprise Resources Planning.
ETP-Ethical Tea PartnershipAn initiative in ethical sourcing approved
by UK based tea packing companies to
work in partnership with producers to
demonstrate that ethical conditions exist
within the tea industry.
EUEuropean Union
Financial InstrumentAny contract that gives rise to a financial
asset of one entity and a financial liability or
equity instrument of another entity.
Fair ValueThe amount for which an asset could be
exchanged between a knowledgeable or
liability settled between knowledgeable
willing parties in an arm’s length
transaction.
Glossary Contd.
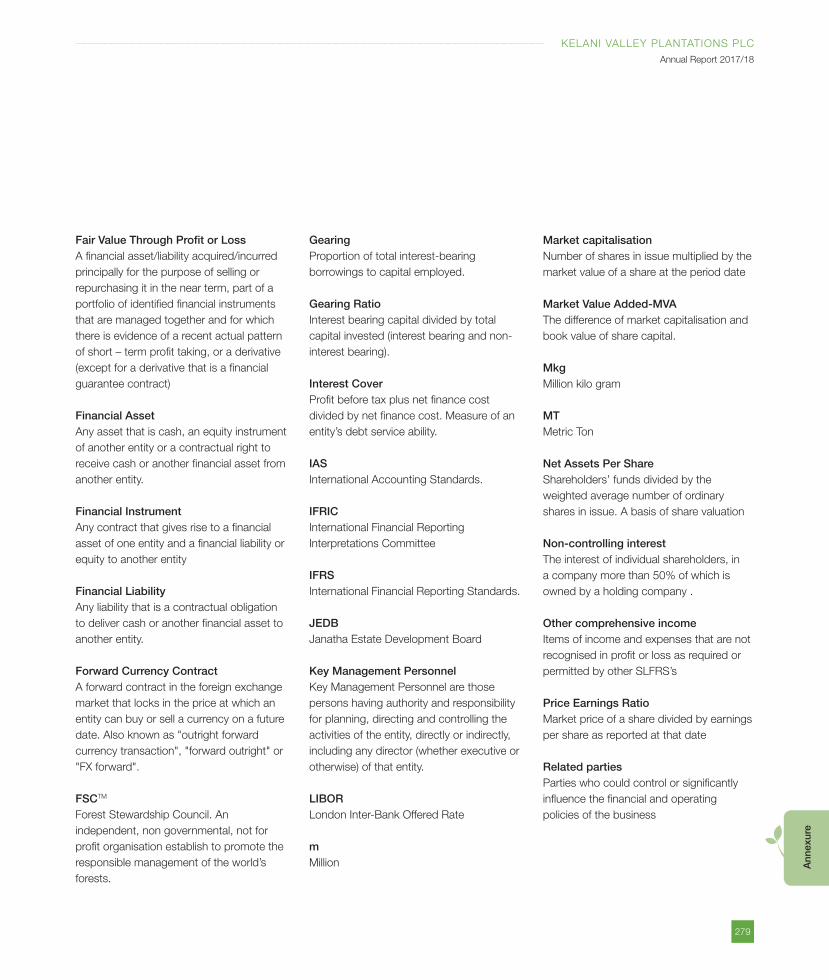
279
KELANI VALLEY PLANTATIONS PLC
Annual Report 2017/18
Ann
exur
e
Fair Value Through Profit or LossA financial asset/liability acquired/incurred
principally for the purpose of selling or
repurchasing it in the near term, part of a
portfolio of identified financial instruments
that are managed together and for which
there is evidence of a recent actual pattern
of short – term profit taking, or a derivative
(except for a derivative that is a financial
guarantee contract)
Financial AssetAny asset that is cash, an equity instrument
of another entity or a contractual right to
receive cash or another financial asset from
another entity.
Financial InstrumentAny contract that gives rise to a financial
asset of one entity and a financial liability or
equity to another entity
Financial LiabilityAny liability that is a contractual obligation
to deliver cash or another financial asset to
another entity.
Forward Currency ContractA forward contract in the foreign exchange
market that locks in the price at which an
entity can buy or sell a currency on a future
date. Also known as "outright forward
currency transaction", "forward outright" or
"FX forward".
FSCTM
Forest Stewardship Council. An
independent, non governmental, not for
profit organisation establish to promote the
responsible management of the world’s
forests.
GearingProportion of total interest-bearing
borrowings to capital employed.
Gearing RatioInterest bearing capital divided by total
capital invested (interest bearing and non-
interest bearing).
Interest CoverProfit before tax plus net finance cost
divided by net finance cost. Measure of an
entity’s debt service ability.
IASInternational Accounting Standards.
IFRICInternational Financial Reporting
Interpretations Committee
IFRSInternational Financial Reporting Standards.
JEDBJanatha Estate Development Board
Key Management PersonnelKey Management Personnel are those
persons having authority and responsibility
for planning, directing and controlling the
activities of the entity, directly or indirectly,
including any director (whether executive or
otherwise) of that entity.
LIBORLondon Inter-Bank Offered Rate
mMillion
Market capitalisationNumber of shares in issue multiplied by the
market value of a share at the period date
Market Value Added-MVAThe difference of market capitalisation and
book value of share capital.
MkgMillion kilo gram
MTMetric Ton
Net Assets Per ShareShareholders’ funds divided by the
weighted average number of ordinary
shares in issue. A basis of share valuation
Non-controlling interestThe interest of individual shareholders, in
a company more than 50% of which is
owned by a holding company .
Other comprehensive incomeItems of income and expenses that are not
recognised in profit or loss as required or
permitted by other SLFRS’s
Price Earnings RatioMarket price of a share divided by earnings
per share as reported at that date
Related partiesParties who could control or significantly
influence the financial and operating
policies of the business
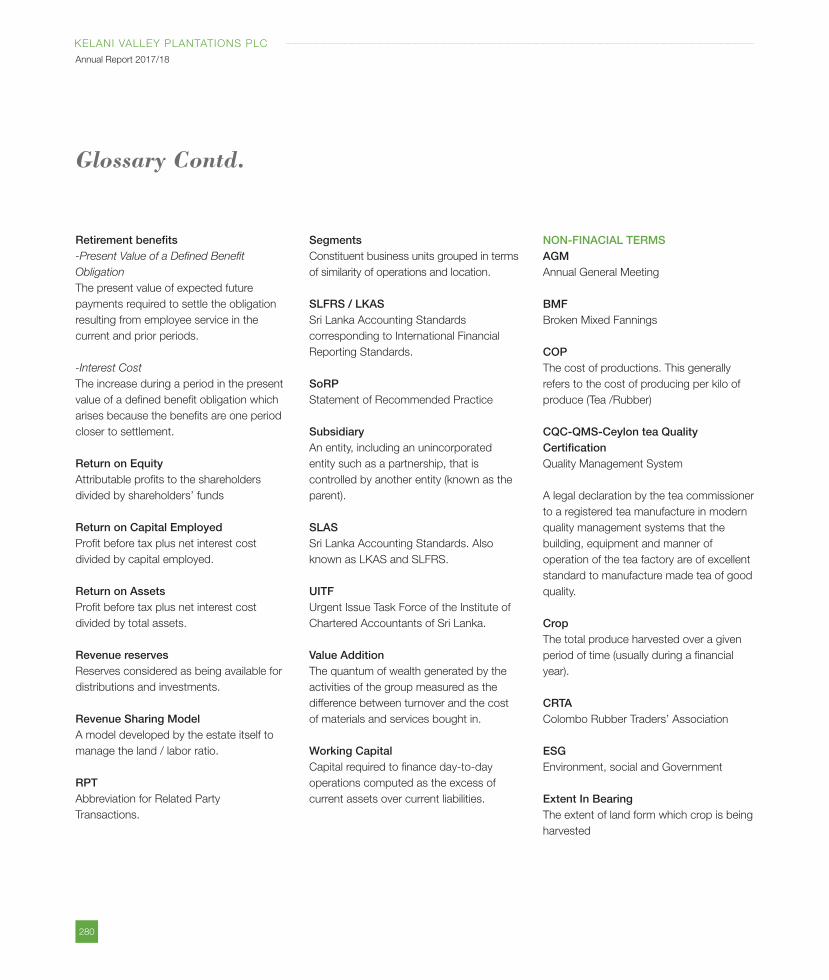
280
KELANI VALLEY PLANTATIONS PLC
Annual Report 2017/18
Retirement benefits-Present Value of a Defined Benefit
Obligation
The present value of expected future
payments required to settle the obligation
resulting from employee service in the
current and prior periods.
-Interest Cost
The increase during a period in the present
value of a defined benefit obligation which
arises because the benefits are one period
closer to settlement.
Return on EquityAttributable profits to the shareholders
divided by shareholders’ funds
Return on Capital EmployedProfit before tax plus net interest cost
divided by capital employed.
Return on AssetsProfit before tax plus net interest cost
divided by total assets.
Revenue reservesReserves considered as being available for
distributions and investments.
Revenue Sharing ModelA model developed by the estate itself to
manage the land / labor ratio.
RPTAbbreviation for Related Party
Transactions.
SegmentsConstituent business units grouped in terms
of similarity of operations and location.
SLFRS / LKASSri Lanka Accounting Standards
corresponding to International Financial
Reporting Standards.
SoRPStatement of Recommended Practice
SubsidiaryAn entity, including an unincorporated
entity such as a partnership, that is
controlled by another entity (known as the
parent).
SLASSri Lanka Accounting Standards. Also
known as LKAS and SLFRS.
UITFUrgent Issue Task Force of the Institute of
Chartered Accountants of Sri Lanka.
Value AdditionThe quantum of wealth generated by the
activities of the group measured as the
difference between turnover and the cost
of materials and services bought in.
Working CapitalCapital required to finance day-to-day
operations computed as the excess of
current assets over current liabilities.
NON-FINACIAL TERMSAGMAnnual General Meeting
BMFBroken Mixed Fannings
COPThe cost of productions. This generally
refers to the cost of producing per kilo of
produce (Tea /Rubber)
CQC-QMS-Ceylon tea Quality CertificationQuality Management System
A legal declaration by the tea commissioner
to a registered tea manufacture in modern
quality management systems that the
building, equipment and manner of
operation of the tea factory are of excellent
standard to manufacture made tea of good
quality.
CropThe total produce harvested over a given
period of time (usually during a financial
year).
CRTAColombo Rubber Traders’ Association
ESGEnvironment, social and Government
Extent In BearingThe extent of land form which crop is being
harvested
Glossary Contd.
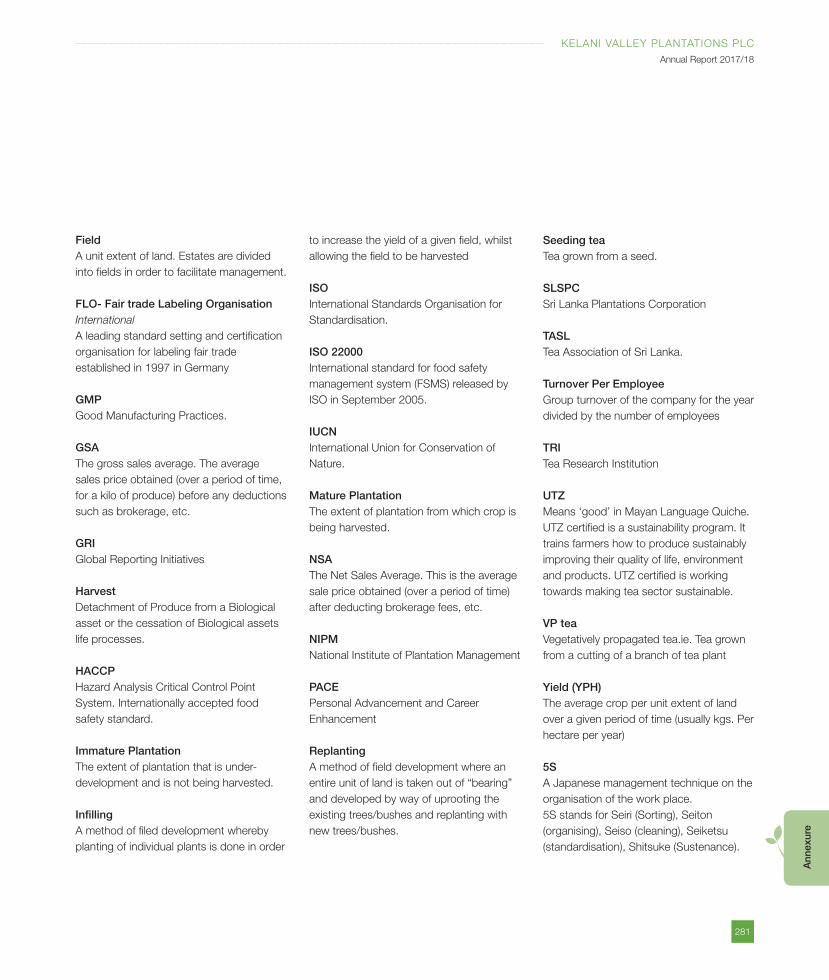
281
KELANI VALLEY PLANTATIONS PLC
Annual Report 2017/18
Ann
exur
e
FieldA unit extent of land. Estates are divided
into fields in order to facilitate management.
FLO- Fair trade Labeling Organisation International
A leading standard setting and certification
organisation for labeling fair trade
established in 1997 in Germany
GMPGood Manufacturing Practices.
GSAThe gross sales average. The average
sales price obtained (over a period of time,
for a kilo of produce) before any deductions
such as brokerage, etc.
GRIGlobal Reporting Initiatives
HarvestDetachment of Produce from a Biological
asset or the cessation of Biological assets
life processes.
HACCPHazard Analysis Critical Control Point
System. Internationally accepted food
safety standard.
Immature PlantationThe extent of plantation that is under-
development and is not being harvested.
InfillingA method of filed development whereby
planting of individual plants is done in order
to increase the yield of a given field, whilst
allowing the field to be harvested
ISOInternational Standards Organisation for
Standardisation.
ISO 22000International standard for food safety
management system (FSMS) released by
ISO in September 2005.
IUCNInternational Union for Conservation of
Nature.
Mature PlantationThe extent of plantation from which crop is
being harvested.
NSAThe Net Sales Average. This is the average
sale price obtained (over a period of time)
after deducting brokerage fees, etc.
NIPMNational Institute of Plantation Management
PACEPersonal Advancement and Career
Enhancement
ReplantingA method of field development where an
entire unit of land is taken out of “bearing”
and developed by way of uprooting the
existing trees/bushes and replanting with
new trees/bushes.
Seeding teaTea grown from a seed.
SLSPCSri Lanka Plantations Corporation
TASLTea Association of Sri Lanka.
Turnover Per EmployeeGroup turnover of the company for the year
divided by the number of employees
TRITea Research Institution
UTZMeans ‘good’ in Mayan Language Quiche.
UTZ certified is a sustainability program. It
trains farmers how to produce sustainably
improving their quality of life, environment
and products. UTZ certified is working
towards making tea sector sustainable.
VP teaVegetatively propagated tea.ie. Tea grown
from a cutting of a branch of tea plant
Yield (YPH)The average crop per unit extent of land
over a given period of time (usually kgs. Per
hectare per year)
5SA Japanese management technique on the
organisation of the work place.
5S stands for Seiri (Sorting), Seiton
(organising), Seiso (cleaning), Seiketsu
(standardisation), Shitsuke (Sustenance).
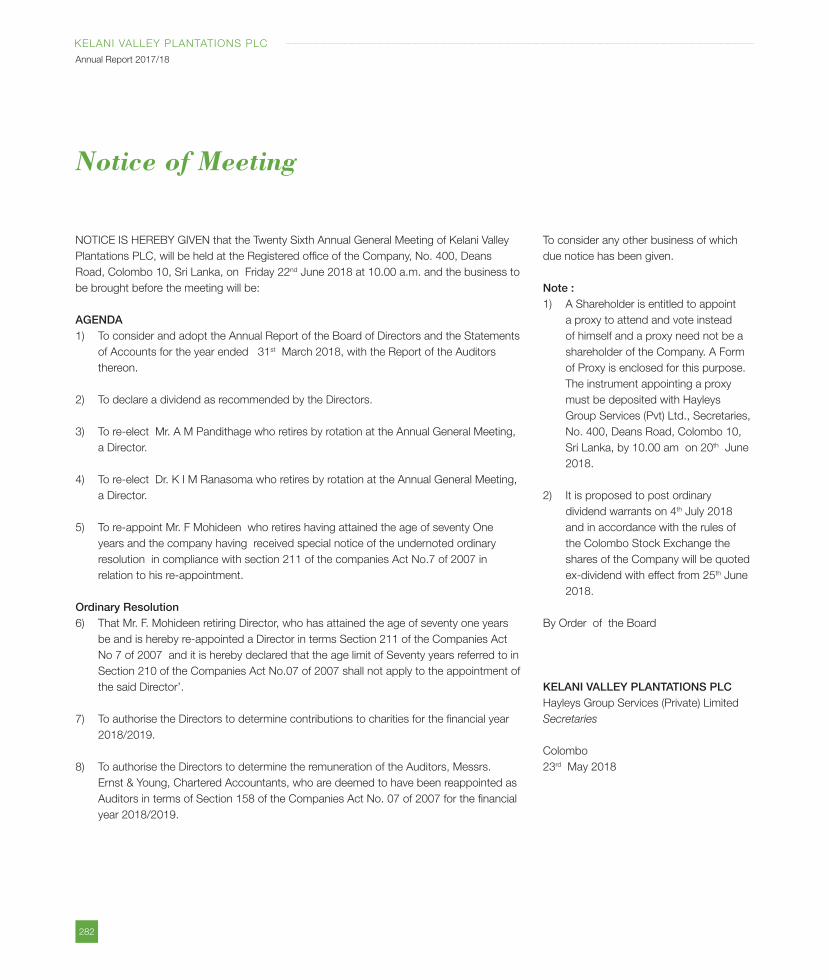
282
KELANI VALLEY PLANTATIONS PLC
Annual Report 2017/18
Notice of Meeting
NOTICE IS HEREBY GIVEN that the Twenty Sixth Annual General Meeting of Kelani Valley
Plantations PLC, will be held at the Registered office of the Company, No. 400, Deans
Road, Colombo 10, Sri Lanka, on Friday 22nd June 2018 at 10.00 a.m. and the business to
be brought before the meeting will be:
AGENDA1) To consider and adopt the Annual Report of the Board of Directors and the Statements
of Accounts for the year ended 31st March 2018, with the Report of the Auditors
thereon.
2) To declare a dividend as recommended by the Directors.
3) To re-elect Mr. A M Pandithage who retires by rotation at the Annual General Meeting,
a Director.
4) To re-elect Dr. K I M Ranasoma who retires by rotation at the Annual General Meeting,
a Director.
5) To re-appoint Mr. F Mohideen who retires having attained the age of seventy One
years and the company having received special notice of the undernoted ordinary
resolution in compliance with section 211 of the companies Act No.7 of 2007 in
relation to his re-appointment.
Ordinary Resolution6) That Mr. F. Mohideen retiring Director, who has attained the age of seventy one years
be and is hereby re-appointed a Director in terms Section 211 of the Companies Act
No 7 of 2007 and it is hereby declared that the age limit of Seventy years referred to in
Section 210 of the Companies Act No.07 of 2007 shall not apply to the appointment of
the said Director’.
7) To authorise the Directors to determine contributions to charities for the financial year
2018/2019.
8) To authorise the Directors to determine the remuneration of the Auditors, Messrs.
Ernst & Young, Chartered Accountants, who are deemed to have been reappointed as
Auditors in terms of Section 158 of the Companies Act No. 07 of 2007 for the financial
year 2018/2019.
To consider any other business of which
due notice has been given.
Note :1) A Shareholder is entitled to appoint
a proxy to attend and vote instead
of himself and a proxy need not be a
shareholder of the Company. A Form
of Proxy is enclosed for this purpose.
The instrument appointing a proxy
must be deposited with Hayleys
Group Services (Pvt) Ltd., Secretaries,
No. 400, Deans Road, Colombo 10,
Sri Lanka, by 10.00 am on 20th June
2018.
2) It is proposed to post ordinary
dividend warrants on 4th July 2018
and in accordance with the rules of
the Colombo Stock Exchange the
shares of the Company will be quoted
ex-dividend with effect from 25th June
2018.
By Order of the Board
KELANI VALLEY PLANTATIONS PLCHayleys Group Services (Private) Limited
Secretaries
Colombo
23rd May 2018
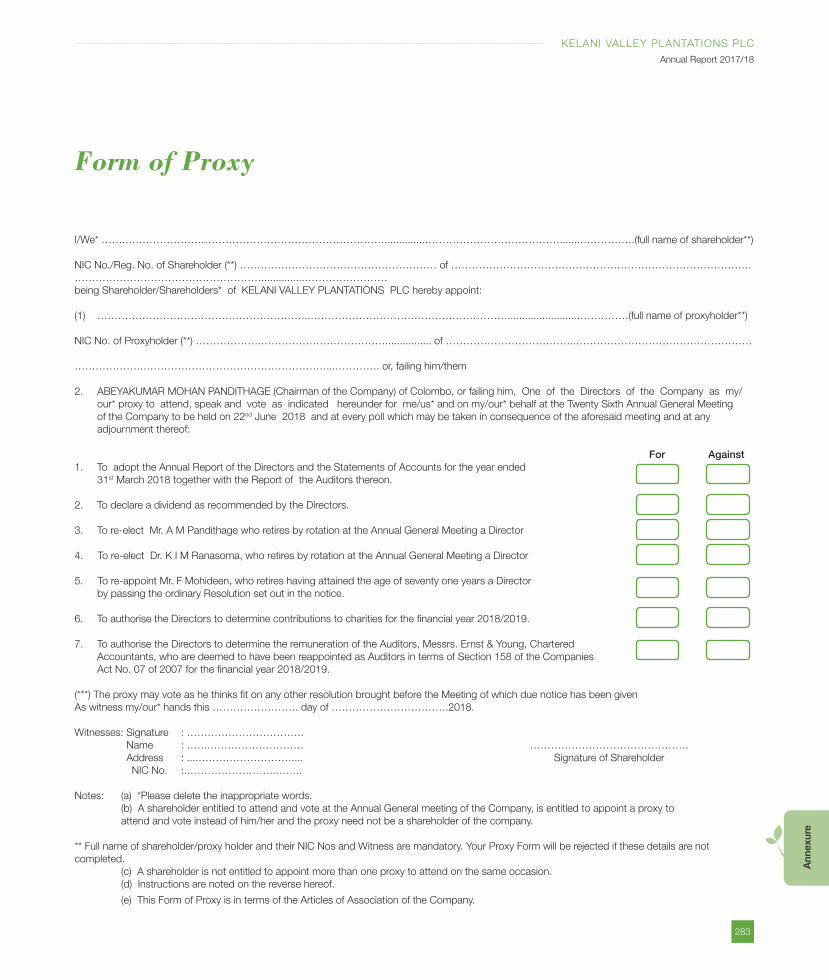
283
KELANI VALLEY PLANTATIONS PLC
Annual Report 2017/18
Ann
exur
e
I/We* …….…………………………………………………………………..............………………………………….......…………….(full name of shareholder**)
NIC No./Reg. No. of Shareholder (**) ………………………………………………… of ……………………………………………………………………………
………………………………………………...............……………………
being Shareholder/Shareholders* of KELANI VALLEY PLANTATIONS PLC hereby appoint:
(1) ……………………………………………………..…………………………………………………........................……………(full name of proxyholder**)
NIC No. of Proxyholder (**) ……………….………………………………................ of ………………………………..……………………………………………
……………….………………………………………………...…………. or, failing him/them
2. ABEYAKUMAR MOHAN PANDITHAGE (Chairman of the Company) of Colombo, or failing him, One of the Directors of the Company as my/
our* proxy to attend, speak and vote as indicated hereunder for me/us* and on my/our* behalf at the Twenty Sixth Annual General Meeting
of the Company to be held on 22nd June 2018 and at every poll which may be taken in consequence of the aforesaid meeting and at any
adjournment thereof:
For Against1. To adopt the Annual Report of the Directors and the Statements of Accounts for the year ended
31st March 2018 together with the Report of the Auditors thereon.
2. To declare a dividend as recommended by the Directors.
3. To re-elect Mr. A M Pandithage who retires by rotation at the Annual General Meeting a Director
4. To re-elect Dr. K I M Ranasoma, who retires by rotation at the Annual General Meeting a Director
5. To re-appoint Mr. F Mohideen, who retires having attained the age of seventy one years a Director
by passing the ordinary Resolution set out in the notice.
6. To authorise the Directors to determine contributions to charities for the financial year 2018/2019.
7. To authorise the Directors to determine the remuneration of the Auditors, Messrs. Ernst & Young, Chartered
Accountants, who are deemed to have been reappointed as Auditors in terms of Section 158 of the Companies
Act No. 07 of 2007 for the financial year 2018/2019.
(***) The proxy may vote as he thinks fit on any other resolution brought before the Meeting of which due notice has been given
As witness my/our* hands this ……………………. day of …………………………….2018.
Witnesses: Signature : …………………………….
Name : …….……………………… ……………………………………….
Address : ....……………………….... Signature of Shareholder
NIC No. :.……………………..……..
Notes: (a) *Please delete the inappropriate words.
(b) A shareholder entitled to attend and vote at the Annual General meeting of the Company, is entitled to appoint a proxy to
attend and vote instead of him/her and the proxy need not be a shareholder of the company.
** Full name of shareholder/proxy holder and their NIC Nos and Witness are mandatory. Your Proxy Form will be rejected if these details are not
completed.
(c) A shareholder is not entitled to appoint more than one proxy to attend on the same occasion.
(d) Instructions are noted on the reverse hereof.
(e) This Form of Proxy is in terms of the Articles of Association of the Company.
Form of Proxy
284
KELANI VALLEY PLANTATIONS PLC
Annual Report 2017/18
INSTRUCTIONS AS TO COMPLETION :
1. To be valid, the completed Form of Proxy must be deposited with the Company Secretaries, Hayleys Group Services (Pvt) Ltd. at
No.400, Deans Road, Colombo 10, Sri Lanka not less than 48 hours before the start of the Meeting.
2. In perfecting the Form of Proxy, please ensure that all requested details are filled in legibly including mandatory details. Kindly Sign and
fill in the date of signing.
3. If you wish to appoint a person other than the Chairman of the Company (or failing him, one of the Directors) as your proxy, please
insert the relevant details at (1) overleaf. The proxy need not be a member of the Company.
4. Please indicate with an X in the space provided how your proxy is to vote on the resolutions. If no indication is given, the proxy in his
discretion will vote as he thinks fit. Please also delete (***) if you do not wish your proxy to vote as he thinks fit on any other resolution
brought before the Meeting.
5. In the Case of a Company/Corporation the proxy must be under its common seal which should be affixed and attested in the manner
prescribed by its Articles of Association.
In the case of the individual shareholders, the signature of the shareholder should be witnessed by any person over 18 years of age.
6. Where the Form of Proxy is signed under a Power of Attorney (POA) which has not been registered with the Company, the original POA
together with a photocopy of same or a copy certified by a Notary Public must be lodged with the Company along with the Form of
Proxy.
7. In case of Marginal Trading Accounts (slash accounts), the form of Proxy should be signed by the respective authorised Fund Manager/
Banker with whom the account is maintained.
Form of Proxy Contd.

285
KELANI VALLEY PLANTATIONS PLC
Annual Report 2017/18
Ann
exur
e
Notes
.......................................................................................................................................................................................................................
.......................................................................................................................................................................................................................
.......................................................................................................................................................................................................................
.......................................................................................................................................................................................................................
.......................................................................................................................................................................................................................
.......................................................................................................................................................................................................................
.......................................................................................................................................................................................................................
.......................................................................................................................................................................................................................
.......................................................................................................................................................................................................................
.......................................................................................................................................................................................................................
.......................................................................................................................................................................................................................
.......................................................................................................................................................................................................................
.......................................................................................................................................................................................................................
.......................................................................................................................................................................................................................
.......................................................................................................................................................................................................................
.......................................................................................................................................................................................................................
.......................................................................................................................................................................................................................
.......................................................................................................................................................................................................................
.......................................................................................................................................................................................................................
.......................................................................................................................................................................................................................
.......................................................................................................................................................................................................................
.......................................................................................................................................................................................................................
.......................................................................................................................................................................................................................
286
KELANI VALLEY PLANTATIONS PLC
Annual Report 2017/18
.......................................................................................................................................................................................................................
.......................................................................................................................................................................................................................
.......................................................................................................................................................................................................................
.......................................................................................................................................................................................................................
.......................................................................................................................................................................................................................
.......................................................................................................................................................................................................................
.......................................................................................................................................................................................................................
.......................................................................................................................................................................................................................
.......................................................................................................................................................................................................................
.......................................................................................................................................................................................................................
.......................................................................................................................................................................................................................
.......................................................................................................................................................................................................................
.......................................................................................................................................................................................................................
.......................................................................................................................................................................................................................
.......................................................................................................................................................................................................................
.......................................................................................................................................................................................................................
.......................................................................................................................................................................................................................
.......................................................................................................................................................................................................................
.......................................................................................................................................................................................................................
.......................................................................................................................................................................................................................
.......................................................................................................................................................................................................................
.......................................................................................................................................................................................................................
.......................................................................................................................................................................................................................
Notes Contd.
287
KELANI VALLEY PLANTATIONS PLC
Annual Report 2017/18
Ann
exur
e
.......................................................................................................................................................................................................................
.......................................................................................................................................................................................................................
.......................................................................................................................................................................................................................
.......................................................................................................................................................................................................................
.......................................................................................................................................................................................................................
.......................................................................................................................................................................................................................
.......................................................................................................................................................................................................................
.......................................................................................................................................................................................................................
.......................................................................................................................................................................................................................
.......................................................................................................................................................................................................................
.......................................................................................................................................................................................................................
.......................................................................................................................................................................................................................
.......................................................................................................................................................................................................................
.......................................................................................................................................................................................................................
.......................................................................................................................................................................................................................
.......................................................................................................................................................................................................................
.......................................................................................................................................................................................................................
.......................................................................................................................................................................................................................
.......................................................................................................................................................................................................................
.......................................................................................................................................................................................................................
.......................................................................................................................................................................................................................
.......................................................................................................................................................................................................................
.......................................................................................................................................................................................................................
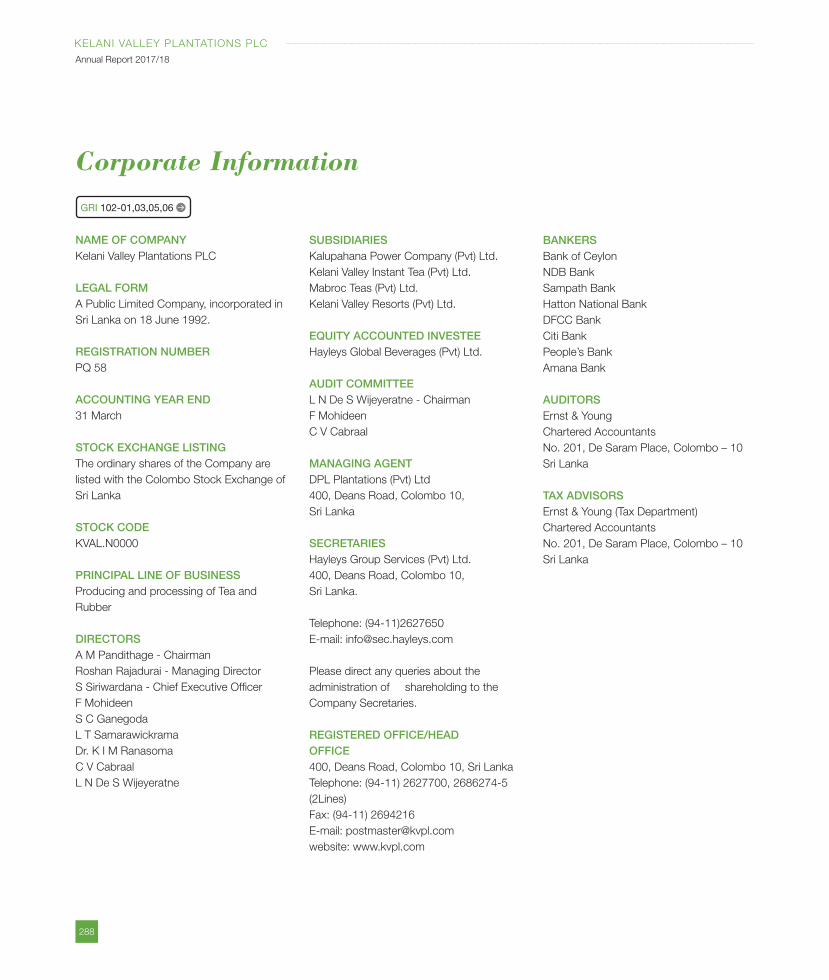
288
KELANI VALLEY PLANTATIONS PLC
Annual Report 2017/18
Corporate Information
NAME OF COMPANYKelani Valley Plantations PLC
LEGAL FORM A Public Limited Company, incorporated in
Sri Lanka on 18 June 1992.
REGISTRATION NUMBERPQ 58
ACCOUNTING YEAR END31 March
STOCK EXCHANGE LISTING The ordinary shares of the Company are
listed with the Colombo Stock Exchange of
Sri Lanka
STOCK CODEKVAL.N0000
PRINCIPAL LINE OF BUSINESSProducing and processing of Tea and
Rubber
DIRECTORSA M Pandithage - Chairman
Roshan Rajadurai - Managing Director
S Siriwardana - Chief Executive Officer
F Mohideen
S C Ganegoda
L T Samarawickrama
Dr. K I M Ranasoma
C V Cabraal
L N De S Wijeyeratne
SUBSIDIARIESKalupahana Power Company (Pvt) Ltd.
Kelani Valley Instant Tea (Pvt) Ltd.
Mabroc Teas (Pvt) Ltd.
Kelani Valley Resorts (Pvt) Ltd.
EQUITY ACCOUNTED INVESTEEHayleys Global Beverages (Pvt) Ltd.
AUDIT COMMITTEEL N De S Wijeyeratne - Chairman
F Mohideen
C V Cabraal
MANAGING AGENTDPL Plantations (Pvt) Ltd
400, Deans Road, Colombo 10,
Sri Lanka
SECRETARIESHayleys Group Services (Pvt) Ltd.
400, Deans Road, Colombo 10,
Sri Lanka.
Telephone: (94-11)2627650
E-mail: [email protected]
Please direct any queries about the
administration of shareholding to the
Company Secretaries.
REGISTERED OFFICE/HEAD OFFICE 400, Deans Road, Colombo 10, Sri Lanka
Telephone: (94-11) 2627700, 2686274-5
(2Lines)
Fax: (94-11) 2694216
E-mail: [email protected]
website: www.kvpl.com
BANKERSBank of Ceylon
NDB Bank
Sampath Bank
Hatton National Bank
DFCC Bank
Citi Bank
People’s Bank
Amana Bank
AUDITORSErnst & Young
Chartered Accountants
No. 201, De Saram Place, Colombo – 10
Sri Lanka
TAX ADVISORSErnst & Young (Tax Department)
Chartered Accountants
No. 201, De Saram Place, Colombo – 10
Sri Lanka
GRI 102-01,03,05,06


![Cancellation of Plans€¦ · Section 132 Opposition by local authority [§8.52] Section 133 Opposition by minister [§8.53] Section 134 Preparation and registration of order [§8.54]](https://img.pdfslide.us/doc/110x75/606137fc8450f80ec71bf27e/cancellation-of-plans-section-132-opposition-by-local-authority-852-section.jpg)


![pyAcceptedForReuurilocdimage.emnrd.state.nm.us/Imaging/FileStore/aztec/... · U Deepen ^ Production (Start/Resume) ] Water Shut-Off ... 1/25/2016 3.62 1/25/2016 8.41 1/25/2016 8.30](https://img.pdfslide.us/doc/110x75/602d4a5c910e586dd43b0c3a/pyaccept-u-deepen-production-startresume-water-shut-off-1252016-362.jpg)