Embed Size (px)
Citation preview
Federal Democratic Republic of Ethiopia
Growth and Transformation Plan
Annual Progress Report for F.Y. 2012/13
Ministry of Finance and Economic Development
February 2014
Addis Ababa
TABLE OF CONTENTS
CHAPTER Page
Executive Summary ------------------------------------------------------------------------------------------------------------------- i Introduction ---------------------------------------------------------------------------------------------------------------------------- 1 CHAPTER I MACRO ECONOMIC PERFORMANCE -------------------------------------------------------------------- 2
1.1 Economic Growth ---------------------------------------------------------------------------------------------------------- 2 1.1.1 Supply Side GDP Growth --------------------------------------------------------------------------------------------------------- 2 1.1.2 Demand Side Economic Growth ------------------------------------------------------------------------------------------------ 4
1.2 Employment ---------------------------------------------------------------------------------------------------------------- 6 1.3 Wellbeing and Poverty ----------------------------------------------------------------------------------------------------- 6 1.4 Price Developments ----------------------------------------------------------------------------------------------------- 8 1.5 Fiscal Policy and Public Finance ------------------------------------------------------------------------------------------ 8
1.5.1 Total Government Revenue ------------------------------------------------------------------------------------------------------ 8 1.5.2 Public Expenditure ---------------------------------------------------------------------------------------------------------------- 16 1.5.3 Financing ---------------------------------------------------------------------------------------------------------------------------- 17
1.6 External Finance Mobilization and Management ----------------------------------------------------------------------- 17 1.6.1 External Resource Commitment -------------------------------------------------------------------------------------------------- 17 1.6.2 External Resource Disbursement ------------------------------------------------------------------------------------------------- 17 1.6.3 Debt Management ----------------------------------------------------------------------------------------------------------------- 18
1.7 Monetary Policy ----------------------------------------------------------------------------------------------------------- 19 1.7.1 Interest Rate Development --------------------------------------------------------------------------------------------------------- 20 1.7.2 Financial System ---------------------------------------------------------------------------------------------------------------------- 20 1.7.3 Modernization of the National Payment System ----------------------------------------------------------------------------- 21 1.7.4 External Sector Performance ------------------------------------------------------------------------------------------------------ 21
1.8 Private Sector Development --------------------------------------------------------------------------------------------- 25 1.8.1 Legal framework and service delivery ------------------------------------------------------------------------------------------ 25 1.8.2 Capacity Development of the Manufacturing Sub Sector ----------------------------------------------------------------- 25 1.8.3 Industrial Zone Development -------------------------------------------------------------------------------------------------- 26 1.8.4 Privatization ------------------------------------------------------------------------------------------------------------------------ 26 1.8.5 Credit Service ---------------------------------------------------------------------------------------------------------------------- 26 1.8.6 Developments in Private Investment -------------------------------------------------------------------------------------------- 27
CHAPTER II ECONOMIC SECTOR ------------------------------------------------------------------------------------------ 31 2.1 Agriculture ----------------------------------------------------------------------------------------------------------------- 31
2.1.1 Crop Production and Productivity ------------------------------------------------------------------------------------------------ 31 2.1.2 Natural Resource Conservation and Development -------------------------------------------------------------------------- 36 2.1.3. Food Security and Disaster Prevention and Preparedness ---------------------------------------------------------------- 37 2.1.4. Private Sector Participation ------------------------------------------------------------------------------------------------------- 37
2.2 Industry --------------------------------------------------------------------------------------------------------------------- 38 2.2.1 Micro and Small Scale Enterprises Development ---------------------------------------------------------------------------- 38 2.2.2 Medium and Large-Scale Manufacturing Industry Development ------------------------------------------------------- 39
2.3 Trade ----------------------------------------------------------------------------------------------------------------------- 41 2.3.1 Trade Practice and Regulatory Activities -------------------------------------------------------------------------------- 41
2.3.2 Trade Relation and Negotiation -------------------------------------------------------------------------------------------- 42
2.4 Mining --------------------------------------------------------------------------------------------------------------------- 42 2.4.1 Geo-science Data Coverage and Mineral Exploration --------------------------------------------------------------------- 42 2.4.2 Mineral and Petroleum Investment Expansion ------------------------------------------------------------------------------- 43 2.4.3 Artisanal Mining and Marketing Promotion ---------------------------------------------------------------------------------- 43 2.4.4 Geosciences Sector Research and Development ---------------------------------------------------------------------------- 44
CHAPTER III INFRASTRUCTURE DEVELOPMENT ------------------------------------------------------------------- 45 3.1 Road Development ----------------------------------------------------------------------------------------------------- 45
3.1.1 Road sector capacity building -------------------------------------------------------------------------------------------------- 45 3.1.2 Federal Roads ---------------------------------------------------------------------------------------------------------------------- 45 3.1.3 Regional and Woreda Roads --------------------------------------------------------------------------------------------------- 45 3.1.4 Strategies to Improve Productivity and Efficiency in the Road Sector ---------------------------------------------- 48 3.1.5 Cross Cutting Issues -------------------------------------------------------------------------------------------------------------- 48 3.1.6 Challenges encountered and Measures Taken ----------------------------------------------------------------------------- 49
3.2 Railway Development -------------------------------------------------------------------------------------------------- 49 3.3 Energy Development --------------------------------------------------------------------------------------------------- 50
- 2 -
3.3.1 Reorganization of the Ethiopian Electric Light and Power Corporation -------------------------------------------- 50 3.3.2 Electric Power Generation ------------------------------------------------------------------------------------------------------ 50 3.3.3 Electric Power Transmission and Distribution Lines -------------------------------------------------------------------- 51 3.3.4 Bio-fuel Development ------------------------------------------------------------------------------------------------------------ 51 3.3.5 Alternative Energy Technology Promotion -------------------------------------------------------------------------------- 52 3.3.6 Electric Power Operation Regulation ---------------------------------------------------------------------------------------- 52 3.3.7 Petroleum Downstream Operation Regulation ---------------------------------------------------------------------------- 52
3.4 Telecommunication Development------------------------------------------------------------------------------------- 53 3.4.1 Reforming the Public Telecom Company -------------------------------------------------------------------------------------- 53 3.4.2 Enhancing services and network quality --------------------------------------------------------------------------------------- 53 3.4.3 Service coverage ---------------------------------------------------------------------------------------------------------------------- 54 3.5.1 Expansion of information technology ---------------------------------------------------------------------------------------- 54 3.5.2 Promoting Community Use of Information Technology ----------------------------------------------------------- 55 3.5.3 Supporting Agriculture-led Industrial Development and Export ----------------------------------------------------- 55 3.5.4 Accelerating Information Technology Assisted Social development ------------------------------------------------ 55 3.5.5 Developing public participation for good governance ------------------------------------------------------------------- 55 3.5.6 Producing trained manpower in due quality and quantity -------------------------------------------------------------- 55
3.6 Potable Water Supply and Irrigation Development ------------------------------------------------------------------ 56 3.6.1 Potable Water Supply ------------------------------------------------------------------------------------------------------------ 56 3.6.2 Irrigation and Drainage Development --------------------------------------------------------------------------------------- 56 3.6.3 Ground and Surface water study and Integrated Basin Development ----------------------------------------------- 57 3.6.4 Challenges --------------------------------------------------------------------------------------------------------------------------- 57
3.7 Road Transport Development ----------------------------------------------------------------------------------------- 58 3.8 Sea Transport and Logistics Services Development ----------------------------------------------------------------- 58 3.9 Aviation Sector (Air Transport) Development ----------------------------------------------------------------------- 60 3.10Construction and Urban Development ---------------------------------------------------------------------------------- 61
3.10.1 Integrated Housing Development Program -------------------------------------------------------------------------------- 61 3.10.2 Urban Infrastructure Development Program ------------------------------------------------------------------------------- 62 3.10.3 Construction Industry Development ------------------------------------------------------------------------------------------ 62 3.10.4 Urban land development and management --------------------------------------------------------------------------------- 62
CHAPTER IV SOCIAL SECTOR DEVELOPMENT----------------------------------------------------------------------- 63 4.1 Education and training ---------------------------------------------------------------------------------------------------- 63
4.1.1 General Education -------------------------------------------------------------------------------------------------------------------- 63 4.1.2 Technical and vocational education and training (TVET) ----------------------------------------------------------------- 68 4.1.3 Higher education ---------------------------------------------------------------------------------------------------------------------- 68
4.2 Health Sector --------------------------------------------------------------------------------------------------------------- 70 4.2.1 Community participation and ownership --------------------------------------------------------------------------------------- 70 4.2.2 Improve Access to Health Services ---------------------------------------------------------------------------------------------- 70 4.2.3 Expansion of nutrition program --------------------------------------------------------------------------------------------------- 72 4.2.4 Hygiene and environmental health ----------------------------------------------------------------------------------------------- 72 4.2.5 Improving disease prevention and control ------------------------------------------------------------------------------------- 73 4.2.6 Improving inputs supply and usage systems ---------------------------------------------------------------------------------- 73 4.2.7 Improve quality of health service delivery ------------------------------------------------------------------------------------ 73 4.2.8 Improve health regulatory system ----------------------------------------------------------------------------------------------- 74 4.2.9 Evidenced – based Decision making by enhanced harmonization and alignment ---------------------------------- 74 4.2.10 Improve pharmaceutical supplies and equipments ------------------------------------------------------------------------- 74 4.2.11 Improve public health infrastructure ------------------------------------------------------------------------------------------ 74 4.2.12 Improve human capital and leadership --------------------------------------------------------------------------------------- 75
CHAPTER V CAPACITY BUILDING AND GOOD GOVERNANCE ------------------------------------------------- 76 5.1 Public Sector Capacity Building -------------------------------------------------------------------------------------- 76
5.1.1 Enhancing leadership, managerial and professional capacity---------------------------------------------------------- 76 5.1.2 Improve public organizations structure and working system ---------------------------------------------------------- 76 5.1.3 Developing the System of Transparency and Accountability ---------------------------------------------------------- 76 5.1.4 Enhance Public Participation --------------------------------------------------------------------------------------------------- 77
5.2 Justices Sector ---------------------------------------------------------------------------------------------------------- 77 5.2.1 Human Resource Capacity Building ----------------------------------------------------------------------------------------- 77 5.2.2 Enhance efficiency and effectiveness of the sector ----------------------------------------------------------------------- 77
- 3 -
5.2.3 Ensure Supremacy of Law ------------------------------------------------------------------------------------------------------ 77 5.2.4 Improving transparency and accountability of the justice sector ----------------------------------------------------- 78 5.2.5 Improve access to justice service ---------------------------------------------------------------------------------------------- 78 5.2.6 Rehabilitation of prisoners ------------------------------------------------------------------------------------------------------ 78 5.2.7 Enhance public participation in the Justice Sector ------------------------------------------------------------------------ 78
5.3 Deepening the Democracy Process ----------------------------------------------------------------------------------- 78 5.3.1 Strengthening the Federal Democratic System ---------------------------------------------------------------------------- 78 5.3.2 Strengthening representatives’ councils ------------------------------------------------------------------------------------- 79 5.3.3 Human rights protection and monitoring ------------------------------------------------------------------------------------ 80 5.3.4 Electoral and Multiparty Political systems --------------------------------------------------------------------------------- 81 5.3.5 Civic Societies and Charity Organizations --------------------------------------------------------------------------------- 82
5.4 Ensuring Good Governance ------------------------------------------------------------------------------------------- 83 5.4.1 Strengthening institutional capacity to prevent and control corruption --------------------------------------------- 83 5.4.2 Strengthen tax administration system ---------------------------------------------------------------------------------------- 84 5.4.3 Urban good governance ------------------------------------------------------------------------------------------------------------- 85 5.4.4 Transparent & Accountable Government Financial System ------------------------------------------------------------- 85
CHAPTER VI CROSS CUTTING SECTORS -------------------------------------------------------------------------------- 87 6.1 Women, Children and Youth Affairs --------------------------------------------------------------------------------- 87 6.2 Sport Sector ------------------------------------------------------------------------------------------------------------- 88 6.3 Prevention and control of HIV/AIDS --------------------------------------------------------------------------------- 89 6.4 Social Affairs ----------------------------------------------------------------------------------------------------------- 90 6.5 Labor Affairs ------------------------------------------------------------------------------------------------------------ 90 6.6 Population and Development ------------------------------------------------------------------------------------------ 91 6.7 Culture and Tourism ---------------------------------------------------------------------------------------------------- 92 6.8 Science and technology development --------------------------------------------------------------------------------- 93 6.9 Environment and Climate Change ------------------------------------------------------------------------------------ 94
CHAPTER VII MONITORIING AND EVALUATION SYSTEM ------------------------------------------------------- 95 7.1 Monitoring the Overall Plan Performance by MoFED ----------------------------------------------------------------- 95 7.2 Performances of the Federal Executive Bodies ------------------------------------------------------------------------- 95 7.3 National Survey and Census studies ------------------------------------------------------------------------------------- 95 7.4 Geo-Information ----------------------------------------------------------------------------------------------------------- 96
CHAPTER VIII SUMMARY AND CONCLUSION ------------------------------------------------------------------------- 97 APPENDIX -------------------------------------------------------------------------------------------------------------------------- 100
Appendix 1. Regional Dirking Water Access Coverage in percent ----------------------------------------------------- 101 Appendix 2a. DAG Adjusted Indicators ----------------------------------------------------------------------------------- 102 Appendix 2b. New Indicators Suggested by DAG ------------------------------------------------------------------------ 105
Tables
Table 1. Real GDP Growth and Sectoral Distribution in Percent ..................................................................... 4
Table 2. Demand Side GDP: Major Components as a Ratio to GDP at Current Market Price (percent) ......... 5
Table 3. Annual General Inflation ................................................................................................................... 8
Table 4. Government Revenue and Expenditure (in million Birr) .................................................................. 9
Table 5. Government Revenue and expenditure as percent of GDP@CMP ................................................. 10
Table 6. Total Federal Revenue in million Birr ............................................................................................. 11
Table 7. Total Regional Revenue in million Birr ........................................................................................... 11
Table 8. Total and Pro poor Government spending (million Birr) ................................................................ 16
Table 9. Resource Disbursements in 2010/11- 2012/13 by Source in Million USD ..................................... 18
Table 10. Loan disbursement in million USD .............................................................................................. 19
Table 11. Commodities’ Export Revenue in Million USD ........................................................................... 22
Table 12. Import in million USD ................................................................................................................... 23
Table 13. The balance of Payment (BoP) ...................................................................................................... 24
Table 14. Exchange Rates in the Inter-bank and Parallel Foreign Exchange Market .................................... 25
Table 15. Disbursement of credit in 2011/12 and 2012/13 ............................................................................ 27
Table 16. Domestic private investment projects under establishment and operation .................................... 27
- 4 -
Table 17. Summary of macroeconomic and main sectoral performances ..................................................... 29
Table 18. Area coverage and production of major food crops in 2012/13 fiscal year ................................... 31
Table 19. The productivity of selected crops for the first three years of the GTP (2010/11-2012/13) .......... 33
Table 20. Manufacturing sector export earnings performance (in million dollar) ......................................... 40
Table 21. Physical Accomplishment for 2012/13 ......................................................................................... 46
Table 22. Comparison of three years accomplishment against the five year plan ......................................... 47
Table 23. Targets and Accomplishment for road network in 2012/13........................................................... 48
Table 24. Employment created in road projects............................................................................................. 49
Table 25. Energy Sector Performance (2012/13) ........................................................................................... 51
Table 26. The Performance of Ethio-telecom in 2012/13 .............................................................................. 53
Table 27. The 2012/13 fiscal year potable water supply plan and performance (%) ..................................... 56
Table 28. Performance of Medium, Large and Small scale irrigation plan in 2012/13 (in hectares) ........... 57
Table 29. Performance of road transport in 2012/13 Fiscal Year ................................................................. 58
Table 30. Performance of multi-modal operation in 2012/13 Fiscal Year...................................................... 58
Table 31. Performance of dry port/ terminal in 2011/12 Fiscal Year ............................................................. 59
Table 32. Shipping capacity ............................................................................................................................ 60
Table 33. The Aviation sector Performance ................................................................................................... 61
Table 34. Performance of Primary Education Enrolment .............................................................................. 64
Table 35. Performance of secondary education enrolment ............................................................................ 66
Table 36. Number of teachers at all levels (in thousands) ............................................................................. 67
Table 37. Number of students in higher education institution (both Government and Private) .................... 69
Table 38. Number of higher education institution graduates (Government and Private) .............................. 69
Table 39. Performance of Major Health Indicators ....................................................................................... 72
Table 40. Number of Charities & societies re-registered & newly registered from 2011-2013 .................... 82
Figures
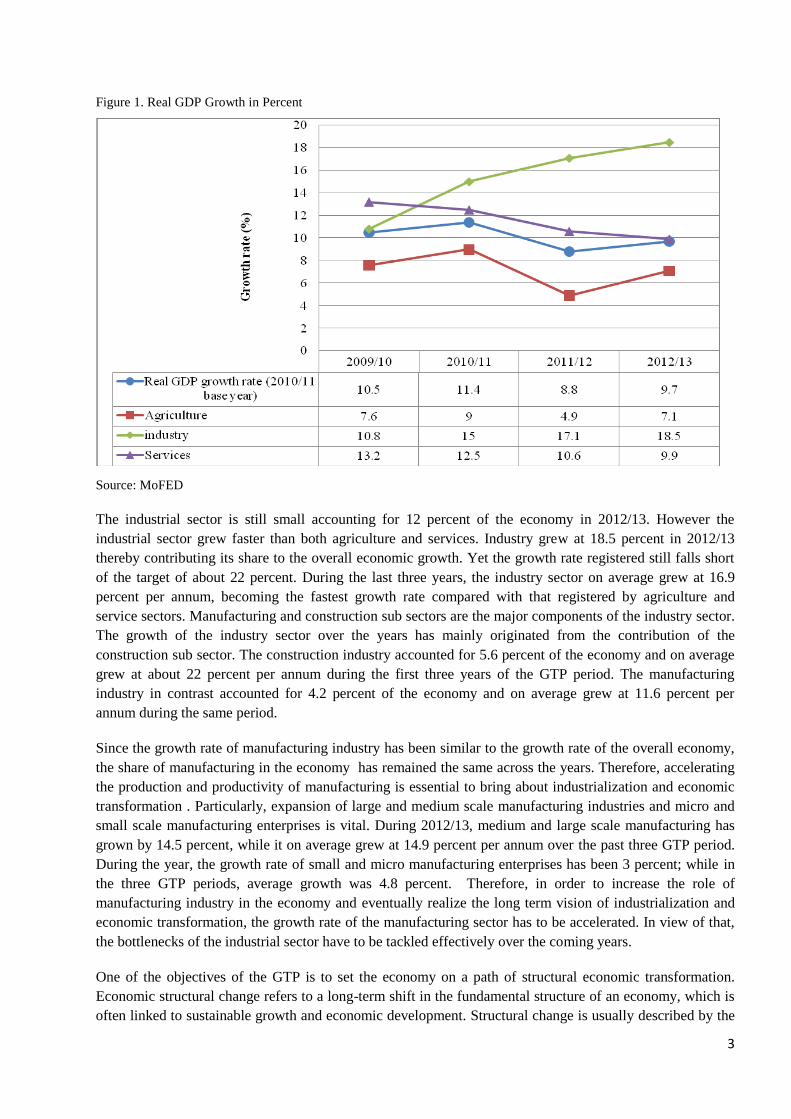
Figure 1. Real GDP Growth in Percent ............................................................................................................. 3
Figure 2. Source of Total Government Revenue ............................................................................................ 10
Figure 3. Federal and regional states tax revenue performance ...................................................................... 12
Figure 4. Share of recurrent, capital and pro-poor expenditure to total government spending ....................... 17
Executive Summary
1. The 2012/13 Annual Progress Report of the Growth and Transformation Plan (APR) is the third
publication in the series of the APRs. The report provides analyses of the progresses in the macro-
economy, economic development, infrastructure, social development, democracy, governance and cross
cutting agendas. The report analyses and compares the 2012/13 achievements against the target set for
the fiscal year and the performances of the previous fiscal years (2010/11 and 2011/12). The report also
evaluates the cumulative achievements registered over the last three years of GTP period in light of the
targets set to be achieved at the end of the GTP period.
2. The Gross Domestic Product (GDP) grew by 9.7 percent in 2012/13 against the target of 11.3 percent
set for the fiscal year. During the same period, agriculture, industry and services grew by 7.1 percent,
18.5 percent and 9.9 percent respectively. The rate of GDP growth registered in 2012/13 is rapid, broad-
based and well above the average growth rate of about 5 percent registered by Sub-Saharan African
countries for the same period. In the last three years (2010/11-2012/13) of GTP implementation, real
GDP on average grew by 10 percent per annum. During the same period, value added in agriculture,
industry and services on average grew by 7 percent, 17 percent and 11 percent per annum respectively.
Furthermore, the rate of real GDP growth registered in 2012/13 has enabled the economy to sustain the
high growth trajectory for the last ten years. Real GDP on average grew at about 11 percent per annum
over the last ten years between 2003/04 and 2012/13.
3. The structure of the economy has been evolving but slower than planned. In 2012/13 agriculture
accounted for 42.9 percent of GDP compared to 46.5 percent in 2009/10. The share of the industrial
sector in GDP increased to 12.4 percent in 2012/13 from 10.3 percent in 2009/10, while the service
sector accounted for 45.2 percent in 2012/13 compared to 44.1 percent in 2009/10. . Thus although the
composition of the economy has changed in favor of industry and service sectors over the last three
years, the process need to be accelerated to bring about a significant shift in the structure of the
economy. Particularly to set the economy on a rapid process of industrialization and structural
transformation, the growth of the industrial sector and particularly the manufacturing industry has to be
accelerated even further. This in turn entails extensively promoting investment in the industrial sector,
particularly in manufacturing, and enhancing productivity of agriculture so as to support the process of
industrialization and export development.
4. On the supply side the main driver of the rapid economic growth in Ethiopia has been the agricultural
sector. In particular, agricultural crop production which accounted for about 30 percent of the GDP was
the single most important source of the rapid economic growth registered over the last three years. Thus
to sustain the rapid economic growth, enhancing the productivity of agriculture and particularly of crop
production remains critical in the coming years. In addition retail and wholesale trading, construction
industry, hotels and restaurants, transport and communications, as well as education and health services
have played crucial roles in driving the rapid growth over the last three GTP years. These show that
the sources of economic growth in Ethiopia have been sectorally broad-based and diversified.
5. The rapid and broad-based economic growth registered over the last three years has been effective in
generating employment, improving income and reducing poverty. The per capita GDP in current prices
has grown from USD 373 in 2009/10 to USD 550 in 2012/13. The overall poverty level is estimated to
decline from 29.6 percent in 2010/11 to 26 percent in 2012/13. In the same period, food poverty is
estimated to decline from 33.6 percent in 2010/11 to 31.8 in 2012/13. The progress made so far over the
last three years in economic growth and social development has set Ethiopia in a better position to
achieve the MDGs target of reducing poverty level to 22.2 percent in 2015.
ii
6. With regard to price development, the objective of the GTP was to contain inflation in a single digit
throughout the plan period. However, the past three years of GTP implementation witnessed double
digit inflation averaging 18 percent, 33.7 percent and 13.5 percent respectively in 2010/11, 2011/12 and
2012/13. The high rate of inflation witnessed particularly in 2010/11 and in 2011/12 had undermined
the efforts to expand productive investment and reduce poverty. However, as a result of prudent fiscal
and monetary policy, as well as the regulatory and administrative measures that have been taken by the
Government, inflation has been arrested at the end of 2012/13 and then after. Apart from its prudent
fiscal and monetary policy, the Government has continued to aggressively implement trade regulation
which ensures transparency, efficiency and competitiveness of the domestic market. In addition, the
Government has imported and distributed basic commodities of wheat, edible oil and sugar in order to
stabilize the domestic market and protect the low income group of the community against inflationary.
In order inflation not to be a threat ahead, the Government has placed a strong focus on increasing the
productivity of agriculture and investment in manufacturing so as to significantly expand supplies of
agricultural and manufacturing outputs. Moreover the government remains committed to pursue prudent
fiscal and monetary policies, as well as to improving the efficiency of the domestic marketing system.
7. In 2012/13, the government collected a total of Birr 137.2 billion revenue including grants. About Birr
124.1 billion (91 percent) was collected from domestic sources (Birr 107 billion tax and Birr 17.1
billion non-tax revenues), clearly indicating the dominant significance of domestic revenue sources in
financing the government budget. Tax revenues are the dominant domestic government receipts
accounting for over 86 percent of the domestic government revenue. Tax revenue alone account for 78
percent of the total government revenue including grants. All these indicate that the government largely
relies on domestic sources particular tax revenues for its budget, which are more reliable sources and
give the government more leverage to advance its policy priorities. The total Government revenue
collected in 2012/13 has grown by 18.62 percent compared to the receipts in the previous year. Total
domestic revenue and tax revenue collected in 2012/13 were 31.8 percent and 31.7 percent higher than
their respective targets set for the fiscal year. In 2012/13, total revenue increased by 20.6 percent, while
tax revenue grew by 24.8 percent compared to the previous fiscal year of 2011/12.. In the past three
years of GTP period, the share of domestic revenue in total Government revenue was on average 90.44
percent indicating a significant increase in domestic capacity of undertaking socio-economic
development with own resources. Furthermore, on average about 85 percent of the total domestic
revenue in 2010/11-2012/13 was generated from tax. The increase in domestic revenue and particularly
tax revenue has led to an increase in tax revenue as a proportion of GDP. The tax to GDP ratio has
increased from 11.7 percent in 2010/11 to 12.5 percent in 2012/13. Although the tax revenue has
increased in real terms over the last three years, it still remains low compared to the tax revenue
generating capacity of the economy, the financing requirements of the country’s development programs
and the average performances of sub-Saharan countries. Therefore, focus needs to be made to further
deepening the implementation of the undergoing tax reform and administration measures so as to
further increase tax revenue in the remain two years. Therefore further deepening of the undergoing tax
administration reforms is essential to enhance tax revenue and realize the GTP target of 15-17% of tax
to GDP ratio by the end of the planning period.
The fiscal and monetary policy objectives of the GTP are macroeconomic stability, rapid and
sustainable economic growth and increased public spending on the pro-poor sectors. Total Government
expenditure in 2012/13 was Birr 153.9 billion while the planned target was Birr 130.2 billion indicating
18.2 percent higher expenditure than the planned target. Of the total expenditure, Birr 91.2 billion (59.2
percent) were spent on capital expenditure, while the remaining Birr 62.8 billion (40.8 percent) went to
recurrent expenditure. Over the past three years of the GTP period, the Government on average spent
Birr 125.5 billion per annum. Out of this government expenditure, over 69 percent was spent on pro-
iii
poor sectors of education, health, water and sanitation, agriculture and road infrastructure. This clearly
shows the government’s commitment to sustain its efforts to eradicate poverty and improve the welfare
of citizens. In 2012/13, government budget deficit was 2% of GDP. It is to be recalled that the budget
deficits were 1.6 percent and 1.2 percent in 2010/11 and 2011/12 respectively. In 2012/13, the budget
deficit was largely financed by net external debt, while net domestic debt financing played a marginal
role.
8. With regard to domestic saving, the target was to increase domestic savings to 15 percent of GDP.
Accordingly, various measures have been taken to achieve this target in the past three years, including
awareness raising of the citizens on saving culture, expanding access to financial services, launching and
implementing social insurance program for private sector employees, strengthening Government social
insurance coverage, introducing saving bonds and other saving instruments such as housing saving
program, investment equipment saving program, etc. and allocating more Government expenditure on
investments that increase capital accumulation. As a result of these measures, domestic saving increased
from 5.2 percent in 2009/10 to 17.7 percent in 2012/13. Similarly, the share of gross domestic
investment increased from 24.7 percent in 2009/10 to 33 percent in 2012/13 which is relatively high
compared to countries at similar stage of development with Ethiopia. Though the achievements made so
far in domestic savings and investment were remarkable, the gap between gross domestic savings and
investment has remained high indicating that additional efforts are required to further increase growth in
domestic savings in the remaining two years of GTP.
9. Merchandise export earnings of were USD 2.7 billion, USD 3.2 billion and USD 3.1 billion in 2010/11,
2011/12 and 2012/13 respectively. The performance registered in merchandise export earnings in the
past three years of GTP is far behind the 6.5 billion USD target set to be achieved at the end of the GTP
period. One of the reasons for the low performance in merchandise export earnings is a decline in
international market prices of export commodities such as coffee and gold. However, the key factor for
the low export performance is limited supply capacity to significantly expand export production. The
focus therefore should therefore be on increasing the production of export commodities given the
required quality standards and prices. Thus to enhance the foreign exchange revenue generation, it is
critical to improve the domestic productive capacity in general, and increase agricultural productivity
and industrial production in particular. To this end, improving the effectiveness of the implementation
of the various export promotion policies is essential to accelerate export trade.
10. Growing by 3.7 percent over the preceding fiscal year, the value of total imports registered in 2012/13,
was USD 11.5 billion. The growth in the value of total imports in 2012/13 was due mainly to increased
imports of capital goods (20.6 percent) and increased imports of fuel (1.8 percent). Compared with its
target, the performance of total imports in 2012/13 was 93.3 percent. In general, in 2012/13, due to high
import performance (USD 11.5 billion) and low export performance (USD 3.1 billion) compared with
their respective targets set for the fiscal year, the deficit in balance of trade increased from USD 7.9
billion in 2011/12 to USD 8.4 billion in 2012/13. As a result, the capacity of export earnings to cover
import bills declined from 29 percent in 2011/12 to 27 percent in 2012/13.
11. In 2012/2013, a total of 251.05 million quintals of major food crops (cereals, pulses and oilseeds) have
been produced by smallholder farmers and commercial farms which is 18.61 million quintals higher than
the production registered in the preceding year. In terms of productivity, the target was to increase the
average productivity of these major food crops to 19.2 quintals per hectare, and the performance shows
that the average productivity of these food crops is 17.82 quintals per hectare. The average productivity
of smallholder farmers alone (in the main rainy season-Meher) was 17.2 quintals per hectare, 18.08
quintal per hectare and 18.83 quintal per hectare in 2010/11, 2011/12 and 2012/13 respectively. These
iv
average productivity estimates of major food crops registered in 2010/11-2012/13 were behind the target
set in the GTP. This overtly signifies the pressing need to fully and effectively implement the scaling-up
strategy of agricultural best practices to achieve the targets set in terms of crop productivity by the end
of the GTP period.
12. With regard to industrial development, the primary focus has been on promoting the development of
micro and small scale enterprises. Support was provided to establish new micro and small scale
enterprises and to promote the existing ones into medium-scale enterprises. In order to build the
entrepreneurship and technical capacity of the enterprises, business and vocational training and
counseling have been provided to promoters of micro and small enterprises. To solve problems related
to capital and equipment of the enterprises, credit services and production and marketing facilities have
been provided. The comprehensive support provided to micro and small enterprises has helped the
enterprises to create temporary and permanent employment opportunities for about 2.02 million citizens
in the fiscal year of 2012/13. During the last three years of GTP implementation it was possible to create
jobs to over 3.96 million new temporary and permanent workers. Accordingly the number of people who
secured temporary and permanent employment in 2010/11, 2011/12 and 2012/13 was 651 thousand,
1291 thousand and 2021.7 thousand of which about 40 percent the beneficiaries were women. Since
micro and small scale enterprises serve as spring boards for the development of a vibrant private sector,
the implementation of the micro and small enterprises program will be vigorously consolidated over the
coming two GTP years. Furthermore, micro and small enterprises need to be expanded focusing on
manufacturing industries and on increasing their productivity and competitiveness.
13. The GTP envisages the private sector to play a critical role in the development of the medium and large-
scale manufacturing industry. Accordingly, in the first three years of GTP period, measures were
undertaken to further improve the enabling environment for the private sector, including revision of the
investment code and restructuring of the Investment Agency to establish a one stop service for private
investment. Medium and large-scale enterprises play a crucial role in creating a competitive economy
through rapid and continuous technological transfer and accumulation, generating foreign exchange
earnings, and supporting the development of small scale enterprise and agricultural growth.
Accordingly, in 2012/13, the industrial sector generated a total of USD 281.1 million revenues in foreign
exchange and in 2011/12 and 2010/11 generated a total of USD 255.4 million and 207.9 million,
respectively. These achievements although showing improvements still remain short of their targets. In
the first three GTP period, import substituting industries have been promoted with encouraging results
particularly in cement production. In 2012/13, the annual capacity of producing cement reached 12.5
million ton at national level. In 2011/12 and 2010/11 the annual production capacity of cement were
10.62 million ton and 4.7 million ton respectively.
14. To address one of the critical constraints of the private sector, the Government has invested significantly
in developing industrial zones . Accordingly, a total of 3,537 hectares of land has been identified in
different cities for industrial zone development. So far though only the Lemi industrial zone with 342
hectare of land in Addis Ababa is being developed. In this industrial zone, construction work is
underway in 156 hectare of land.
15. Privatization of public enterprises is another strategy pursued to promote the development of the private
sector. Accordingly, in the past three years of GTP, a total of 37 public enterprises (14 enterprises in
2010/11, 13 enterprises in 2011/12 and 5 enterprises 2012/13) were privatized through selling (32
enterprises) and joint development (5 enterprises).
v
16. Over the first three years of the GTP period, a total of 9538 km (4343 km in 2010/11, 3047 km in
2011/12 and 2148 km in 2012/13) of federal and regional roads were constructed. This accomplishment
is 60.64 percent of the overall target of the GTP set for 2010/11-2014/15. Correspondingly, total federal
and regional road network increased from 48,800 km in 2009/10 to 58,338 km in 2012/13. With regard
to woreda roads which have been implemented under the Universal Rural Road Access Program
(URRAP), the length of total woreda road network increased from 854 in 2010/11 to 6,983 km in
2011/12 and further to 27,628 km in 2012/13. This accomplishment is 69 percent of the target set for the
same period (2010/11-2012/13) and 38.6 percent of the five years target of the GTP. Due to improved
access of road network in the last three years, average time required to reach all weather roads declined
from 3.7 hours in 2009/10 to 2.1 hours in 2012/13. To realize the target of 1.4 hours average time
required to reach to an all weather road by 2014/15, consolidating the capacities and momentum in
executing the URRAP is essential.
17. In the rail ways sector, the first year of the GTP was a preparation period of conducting studies, design
works, capacity building and other pre-construction undertakings. The actual construction works in the
prioritized railway lines of the Addis Ababa/Sebeta-Djibouti project and the Addis Ababa Light Rail
Transit Line project were started in 2011/12. Accordingly, by the end of 2012/13, the construction status
of Addis Ababa/Sebeta-Mieso project was 22 percent, while that of the Mieso-Dewanle Project was 20
percent. The Addis Ababa Light Rail Transit project total construction work reached 43 percent by the
end of 2012/13.
18. With regard to energy development, the national energy generating capacity increased from 2000 MW in
2009/10 to to 2177 MW in 2012/13. Electricity service coverage at the national level increased from 41
percent in 2009/10 to 45.4 percent in 2010/11, 48.5 percent in 2011/12 and further to 53.5 percent in
2012/13. The construction of the Grand Renaissance hydroelectric power project has made progress
during the reporting period and its total construction work reached 23.89 per cent in 2012/13. The
construction work of Gilgel Gibe-III hydropower project has also made progress and reached at 75.46
percent of its total physical work in 2012/13 fiscal year. Other energy projects are also progressing as
planned.
19. In 2012/13, in all telecom services, the number of subscribers reached 28.98 million. Out of which 23.76
million are mobile telephone subscribers, 4.43 million are internet and data subscribers and 0.79 million
are fixed line subscribers. Next Generation Network calling center has been established that customers
can easily access to different telecom services with going to telecom services centers. Despite the above
activities network quality continues to be a major challenge of the sector. Thus, the undergoing
investments need to be accelerated to improve the quality of the telecom services.
20. The national, rural and urban potable water supply coverage were 52.12 percent, 48.85 percent and
74.64 percent respectively in the 2010/11. These increased to 58.25 percent, 55.21 percent and 78.71
percent in 2011/12 and further to 68.45 percent, 66.5 percent and 81.3 percent in 2012/13 respectively.
The target is to increase the potable water supply coverage to 98-100 percent by 2015. Clearly, the
progress so far calls for redoubling of efforts. Thus it is planned to intensify the efforts to mobilize and
coordinate the technical and financial capacities of communities, governments, non-governmental
organizations and development partners to expand coverage of potable water supply over the coming
two years. With regard to medium and large scale irrigation; design works were undertaken for 540,520
hectares of irrigable land. In addition, 170,913 hectares of irrigation land was developed, while 4,100
hectares of irrigation land were rehabilitated between 2010/11 and 2012/13. Furthermore, a total of 1.8
million hectares of land were developed under small scale irrigation schemes during the same period.
vi
21. The progress made during the last three years of GTP period in terms of infrastructure development has
been encouraging. However, there still remain serious challenges in consolidating the gains made so far.
First, the domestic capacity in project planning and management of large scale infrastructure programs
though growing still remains modest. Second, in spite of the ongoing reforms, the institutional capacity
to deliver competitive services from the operation of infrastructure projects remains inadequate. Finally,
despite their critical role in sustaining the rapid economic growth and their feasibility, some
infrastructure programs are facing financial constraints. The strategies to address these challenges are
consolidating the domestic capacity development programs of project planning and management,
construction and manufacturing industries. In addition, fundamentally transforming the institutional
capacity of the domestic infrastructure and utility companies following the ongoing reforms and
enhancing domestic savings and export earnings form part of the strategies designed to circumvent the
challenges.
22. The number of primary schools (Grades 1-8) has increased from 26,951 in 2009/10 to 28,349 in
2010/11. The number of primary schools has further increased to 29,507 in 2011/12 and to 30,495 in
2012/13. These show that a total of 3,544 primary schools were constructed over the last three years.
As a result, primary gross enrolment rate increased from 93.4 percent in 2009/10 to 95.1 percent in
2012/13, while net enrolment rate increased from 82.1 percent in 2009/10 to 85.9 percent in 2012/13.
During the same period, the gender parity index in primary schools as approximated as the ratio of girls
to boys reached 0.94:1 in 2012/13. The number of students in primary schools increased from 15.8
million in 2009/10 to 16.7 million in 2010/11, 17 million in 2011/12 and further to 17.4 million in
2012/13. The progress indicates that Ethiopia is getting closer to achieving the MDGs target of
universal access to primary education. However, additional efforts are required to increased the net
primary enrolment rate (particularly net enrolment in upper primary) in the remaining two years of the
GTP period. The number of adults who participated in functional adult education program increased
from 1.2 million in 2010/11 to 2.1 million in 2011/12 and further to 3.4 million in 2012/13. However,
compared to the planned target of 18.2 million in 2012/13, the cumulative progress achieved in 2012/13
is very low. With regard to secondary education (grades 9-12), the number of schools has expanded
both in rural and urban areas of the country. Accordingly, the number of secondary schools increased
from 1335 in 2009/10 to 1517 in 2010/11, 1710 in 2011/12 and further to 1912 in 2012/13. These
indicate that a total of 577 secondary schools were constructed over the first three GTP years. Gross
enrolment in secondary school First Cycle (9-10) and preparatory (11-12) reached 1,540,525 and
358,493 in 2012/13 respectively. Concerning technical and vocational training, the number of students
in 2010/11 was 371,347. This figure, however, has declined to 335,058 in 2011/12 and further to
238,884 in 2012/13. The enrollment in technical and vocation education is lower compared to the plan
and the labor market demand. Therefore, more efforts are required to expand technical and vocation
education in the remaining GTP period. Furthermore, the quality and relevance of technical and
vocational training need to be further enhanced through more effective implementation of the relevant
strategy in the remaining periods of the GTP. Likewise strengthening the certification of occupational
competencies in all trades is essential to supply the required skill to the labor market. With regard to
higher education both in public and private institutions, undergraduate enrolment rate has increased
from 447,693 in 2010/11 to 494,110 in 2011/12 and further to 553,849. In higher education
undergraduate program girls enrolment rate has reached 30 percent in 2012/13. In post graduate
program both in public and private institutions, the number of graduate students has increased from
20,150 in 2010/11 to 25,660 in 2011/12 and further to 31,304 in 2012/13. In postgraduate program girls
enrolment rate has reached 30 percent in the same period. Quality and relevance are the main focus in
higher education too, and hence the quality and relevance improvement program of higher education
vii
has to be implemented more effectively to ensure the expected quality and relevance in the remaining
period of the GTP.
23. With regard to the health sector; health infrastructure and health extension program have expanded over
the the last three years (2010/11-2012/13). The number of health posts increased from 14,192 in 2009/10
to 16,048 in 2012/13, showing the construction of a total of 1,856 additional health posts during the first
three years of GTP period. As a result, the ratio of health posts to population was 1:5352 in 2012/13
indicating that the standard of 1:5000 is almost already achieved. The number of Health Centres
increased from 2142 in 2009/10 to 3100 in 2012/13, indicating the construction of 958 health centres
over the first three years of the GTP period. Accordingly, the ratio of Health Centres to population
declined from 1: 37,299 in 2009/10 to 1:27,706 in 2012/13, which is very close to the standard of
1:25,000 set by the Ministry of Health. Similarly, the number of hospitals increased from 116 in 2009/10
to 127 in 2012/13. As a result primary health service coverage reached 93.4 percent in 2012/13,
indicating the significant progress made in ensuring universal access to primary health care. The number
of nurses with different specialization was 37,218 in 2012/13. To address the shortage of physicians,
more than 10,232 medical doctors are enrolled in university medical training programs during the same
period. Close to 40 thousand health extension workers were deployed throughout the country to
delivery primary health care. In 2012/13, a total of 811 ambulances were distributed to woredas
throughout the country. As a result of the massive investments in infrastructure, facilities and human
resource development, health services have increased resulting in better child and maternal health. The
ante-natal and post-natal service coverage were 97.4 percent and 50.5 percent in 2012/13 respectively,
while births attended by skilled personnel improved from 20.4 percent in 2011/12 to 23.1 percent in
2012/13. Ethiopia has now achieved the MDGs target of reducing child mortality by two third well
ahead of the MDG period. Given the substantial investments in the health sector, maternal health is also
expected to improve. However, additional efforts need to be exerted to meet the MDG target of reducing
maternal mortality by three fourth by 2015 through organized community participation to effectively
implement the health extension program and expanding access and improving quality of basic health
services.
24. Over the last three years, extensive leadership and technical trainings have been provided to top
management and civil service professionals to strengthen the capacity of the public sector. Young
professionals have been recruited and hired in the public sector at different levels of government
administration. Extensive consultations and awareness creations were undertaken among the private
sector and the public at large concerning the significance of developmental attitudes and behaviors in
accelerating rapid and inclusive growth as well as promoting good governance. The public education
campaigns are meant to increase awareness about the dangers of rent-seeking in undermining
development and good governance in the country, and thereby mobilize the public in the fight against
rent seeking. With this background, a working system has been established to ensure an effective public
participation in public service delivery and decision making by requiring public institution to effectively
engage the public in their decision making process. This strategy of promoting change in the public
sector through effective public participation is expected to be consolidated so as to further improve
efficiency and effectiveness in the public sector, and circumvent rent-seeking attitudes and behaviors in
all sectors.
25. The role of civil societies and charities in the development and democratization process of the country
has also been enhanced over the last three years through improving transparency, accountability and
capacity development in the sector. A total of 1,152 charities and societies organizations were registered
and licensed in the past three years, showing increasing engagement of civil society organizations in the
development and governance process. The on-going regulatory and capacity building program of civil
viii
societies and charities will therefore be deepened in order to enhance the role of non-governmental
organizations in the development and governance process of the country.
26. To ensure transparency and accountability and thereby eliminate corruption, a number of appropriate
measures have been undertaken with regard to strengthening an efficient tax administration, and urban
land administration systems. Furthermore, the ongoing reforms of improving transparency and
accountability in public financial management have been deepened during the past three years of GTP
period. Registration of assets of higher Government Officials, and senior civil servants has been carried
out. Accordingly, a total of 97,317 higher officials and civil servants have registered their assets over
the last three years. Different media have also been used by the Ethics and Anticorruption Commission
to enhance awareness among the society on the problem of corruption in the development process and
thereby promote ethical behavior among the society. Moreover, the Commission has been monitoring
corruption through receipt of verifiable lists of criminal suspects, investigation and prosecution of
corrupt practices. In 2010/11-2012/13, about 21,648 criminal suspects were identified by the
Anticorruption Commission of which 8,027 were subjected to investigation and 2,941 of them were
prosecuted to the court. Furthermore, to protect the tax system against corruption, measures have been
taken by the Anticorruption Commission on suspects of high Government Officials and those in the
business community for investigation.
27. Building the capacity of the legislative bodies is indispensable in order to strengthen the
democratization process in the country. Over the past three years of GTP period, short and long-term
training has been provided to more than 130,080 staff of the justice sector including judges, lawyers,
police and other professionals. Large awareness creation were also provided through different media to
citizens, Government bodies and other institutions so as to enhance the knowledge on basic
constitutional provisions, as well as the concepts of human and democratic rights.
28. To protect women and children from harmful traditional practices,
concerted efforts have been made to ensure women and youth participation in national development and
governance processes of the country. Accordingly, in 2012/13, women participation in the decision making
process in the legislative, executive and judicial bodies has reached 27.9 percent, 30 percent and 20 percent
respectively. More than 20 million people participated in different forums organized by youths to create
awareness on harmful traditional practices such as female genital mutilations, abduction of girls, etc.
Training was also provided to about 12 million males and females on the same issues during the same
period. Furthermore, national strategy was developed to protect women and children against harmful
traditional practices. In line with this communities organized themselves into groups to support each other
and make effective and gainful participation in their local affairs in Tigray, Amhara, Oromyia and SNNP
Regions. During 2010/11-/2012/13, 279 youth centers were constructed and about 10.3 million youths
provided voluntary services while 6.7 million youths participated in conferences organized on Development,
Democracy and Good Governance.
Introduction
Poverty eradication is the core development objective of the Ethiopian Government while rapid economic
growth is a key strategy to this objective. This rapid economic growth has to be broad-based, equitable and
sustainable. The ongoing Growth and Transformation Plan (GTP) has been drafted based on the
achievements of the Plan for Accelerated and Sustained Development to End Poverty (PASDEP) and the
MDGs and the National Vision. The major objectives of the plan are (1) maintain at least an average real
GDP growth rate of 11.2 percent per annum and attain MDGs, (2) expand and ensure the qualities of
education and health services and achieve MDGs in the social sector, (3) establish suitable conditions for
sustainable nation building through the creation of a stable democratic and developmental state; and (4)
ensure the sustainability of growth by realizing all the above objectives within a stable macroeconomic
framework.
It is three years now since GTP started to be implemented in all areas of the country. During these three
years, the average GDP growth rate was 10 per cent per annum. Moreover, remarkable results were
registered particularly in infrastructure development, human development and good governance. The
objective of this annual progress report (APR) is to provide information on achievements of planned targets,
challenges encountered, measures taken and lessons drawn from the implementation of the GTP in 2010/11-
2012/13. In addition, the report will be used as a foundation to look into the targets in 2014/15 against
progress to date and increase effort to achieve the targets. Moreover, the performance report will be used as
a basis for the preparation of the next phase of the GTP.
Survey data were used from the Central Statistics Agency (CSA), while administrative data were collected
from sectoral government institutions in the preparation of this APR. Technical support was provided to
some sectors in organizing their annual progress reports. This annual progress report is prepared in a more
analytical and evaluative manner compared to its preceding reports .
This annual progress report includes major achievements, challenges and problems encountered and
measures taken, focusing on the macroeconomic, major economic and social sectors, capacity building and
good governance and cross cutting issues. After approval by the Government, consultations on the APR with
various actors and stakeholders are organized at regional and federal levels. Representatives from the
government institutions, private sector, development partners, professional associations, civil society
organizations, women association, youth association, NGOs and religious institutions are expected to
participate in the APR consultations.
The annual progress report is structured in eight chapters: Chapter one deals with macroeconomic
performance while chapters two and three present progresses in economic and infrastructure sectors
respectively. Chapter four offers status of progress in social sectors, chapter five assesses performances in
capacity building and good governance and chapter six deals with cross cutting sectors. Chapter seven
provides progresses in the Monitoring and Evaluation (M& E) System of the GTP while chapter eight
summarizes the major findings of the progress report.
2
CHAPTER I
MACRO ECONOMIC PERFORMANCE
1.1 Economic Growth
1.1.1 Supply Side GDP Growth
During the first year (2010/11) of GTP implementation, gross domestic product (GDP) in real terms grew by
11.4 percent. The GDP growth rate registered in 2011/12 was 8.8 percent. In 2012/13, the GDP grew by 9.7
percent in real terms. Accordingly, the average economic growth rate during the last three years (2010/11-
2012/13) of the GTP period was about 10 percent per annum. Though the 9.7 percent growth performance
registered in 2012/13 is below the 11.3 percent target set for the fiscal year under review, it was achieved
under difficult domestic and global environment. This rapid growth was realized given the uncertainties
created following the untimely departure of the late Ethiopian Prime Minister. The growth was also realized
amidst tight monetary and fiscal policies, which Ethiopia pursued in order to stabilize prices, The reform
introduced in the multimodal transportation and logistics system could have also adversely affected the
economic performance during the fiscal year under review. Furthermore, the 9.7 percent GDP growth was
achieved given that prices of Ethiopia’s major export commodities such coffee and gold significantly
declined while prices of its major import items such as fuel continued to be high. On the other hand, the
2012/13 economic growth was high compared to the sub Saharan average performance of around 5 percent.
The performance was also above the 7 percent growth requirement set to achieve the Millennium
Development Goals. In general Ethiopia’s economic performance in 2012/13 was widely regarded as one of
the fastest growth rates in the world by different international financial institutions and economic analysts.
The economic growth over the fiscal year has been inclusive in the sense that it was sectorally broad based.
Agriculture, services and industry all grew rapidly and contributed to the overall economic growth.
However, agriculture was the dominant source of the rapid economic growth, accounting for about 43
percent of the economy and growing at 7.1 percent. Particularly the crop production sub-sector was the
dominant driver of the economic growth, accounting for about 30 percent of GDP and growing at 8.2
percent during the fiscal year under review. The performance of the crop production sub-sector last year
provides a clear picture as to its significance in the performance of the overall economy. During 2011/12, the
crop sub sector grew by 5 percent. Consequently the growth rate of agriculture was only 4.9 percent, which
in turn drove the overall economic growth down to 8.8 percent. This implies the significance of crop
production in determining the growth of the agriculture sector and the overall economy. Clearly, agriculture
and particularly the crop sub sector is the major determinant of the performance of the overall economy.
This vindicates the policy focus of Ethiopia on agriculture as the major source of economic growth. The
corollary is that Ethiopia has to improve further the productivity of agriculture in order to sustain the rapid
economic growth registered over the last decade. The undergoing efforts to expand best agricultural
technologies and farming practices using the extension program and scaling up strategy should therefore be
consolidated to enhance the productivity of smallholder farmers and thereby sustain the rapid economic
growth registered over the last ten years.
Next to agriculture, the major components of the service sector including whole sale and retail trade, real
estate and rental, transport services, hotels and restaurants and education and health services have served as
important sources of the growth of the economy. The service sector as a whole grew by 9.9 percent, and
accounted for about 45 percent of the economy during 2012/13. Accordingly, the service sector grew on
average at about 11 percent per annum during the first three GTP periods. Again expansion and productivity
improvements of the service sector could continue to serve as crucial sources of economic growth in the
coming years.
3
Figure 1. Real GDP Growth in Percent
Source: MoFED
The industrial sector is still small accounting for 12 percent of the economy in 2012/13. However the
industrial sector grew faster than both agriculture and services. Industry grew at 18.5 percent in 2012/13
thereby contributing its share to the overall economic growth. Yet the growth rate registered still falls short
of the target of about 22 percent. During the last three years, the industry sector on average grew at 16.9
percent per annum, becoming the fastest growth rate compared with that registered by agriculture and
service sectors. Manufacturing and construction sub sectors are the major components of the industry sector.
The growth of the industry sector over the years has mainly originated from the contribution of the
construction sub sector. The construction industry accounted for 5.6 percent of the economy and on average
grew at about 22 percent per annum during the first three years of the GTP period. The manufacturing
industry in contrast accounted for 4.2 percent of the economy and on average grew at 11.6 percent per
annum during the same period.
Since the growth rate of manufacturing industry has been similar to the growth rate of the overall economy,
the share of manufacturing in the economy has remained the same across the years. Therefore, accelerating
the production and productivity of manufacturing is essential to bring about industrialization and economic
transformation . Particularly, expansion of large and medium scale manufacturing industries and micro and
small scale manufacturing enterprises is vital. During 2012/13, medium and large scale manufacturing has
grown by 14.5 percent, while it on average grew at 14.9 percent per annum over the past three GTP period.
During the year, the growth rate of small and micro manufacturing enterprises has been 3 percent; while in
the three GTP periods, average growth was 4.8 percent. Therefore, in order to increase the role of
manufacturing industry in the economy and eventually realize the long term vision of industrialization and
economic transformation, the growth rate of the manufacturing sector has to be accelerated. In view of that,
the bottlenecks of the industrial sector have to be tackled effectively over the coming years.
One of the objectives of the GTP is to set the economy on a path of structural economic transformation.
Economic structural change refers to a long-term shift in the fundamental structure of an economy, which is
often linked to sustainable growth and economic development. Structural change is usually described by the
4
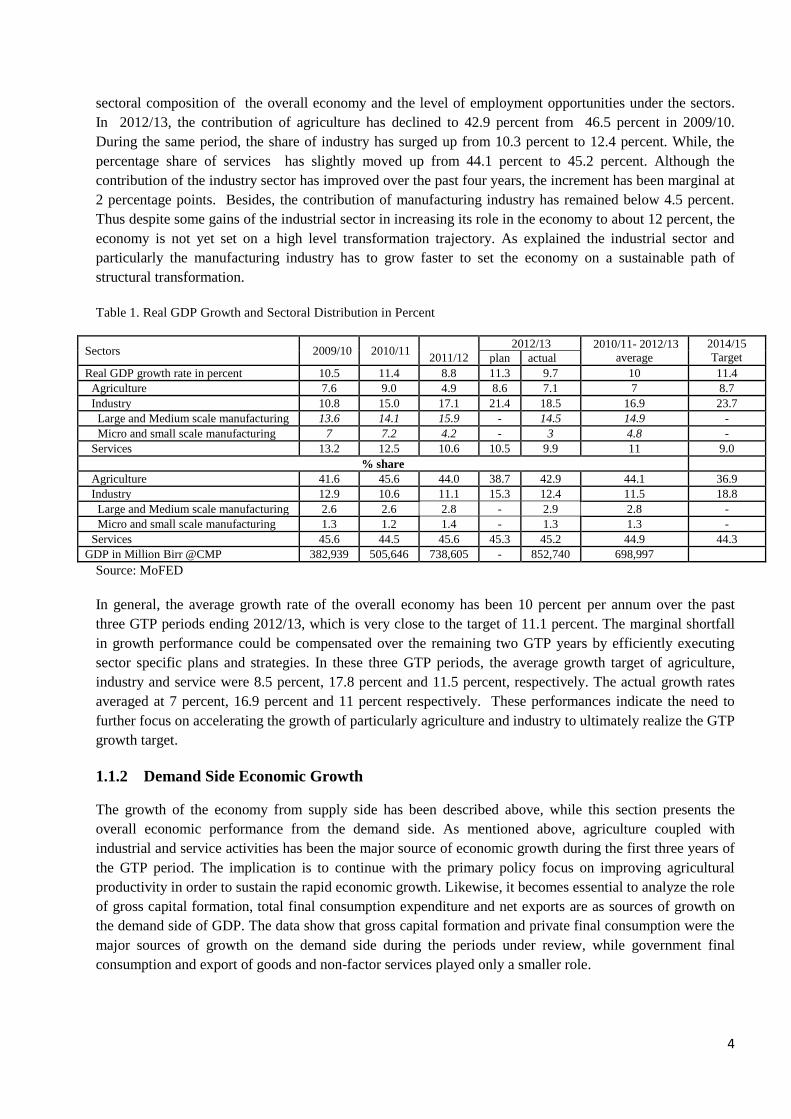
sectoral composition of the overall economy and the level of employment opportunities under the sectors.
In 2012/13, the contribution of agriculture has declined to 42.9 percent from 46.5 percent in 2009/10.
During the same period, the share of industry has surged up from 10.3 percent to 12.4 percent. While, the
percentage share of services has slightly moved up from 44.1 percent to 45.2 percent. Although the
contribution of the industry sector has improved over the past four years, the increment has been marginal at
2 percentage points. Besides, the contribution of manufacturing industry has remained below 4.5 percent.
Thus despite some gains of the industrial sector in increasing its role in the economy to about 12 percent, the
economy is not yet set on a high level transformation trajectory. As explained the industrial sector and
particularly the manufacturing industry has to grow faster to set the economy on a sustainable path of
structural transformation.
Table 1. Real GDP Growth and Sectoral Distribution in Percent
Sectors 2009/10 2010/11
2011/12
2012/13 2010/11- 2012/13
average
2014/15
Target plan actual
Real GDP growth rate in percent 10.5 11.4 8.8 11.3 9.7 10 11.4
Agriculture 7.6 9.0 4.9 8.6 7.1 7 8.7
Industry 10.8 15.0 17.1 21.4 18.5 16.9 23.7
Large and Medium scale manufacturing 13.6 14.1 15.9 - 14.5 14.9 -
Micro and small scale manufacturing 7 7.2 4.2 - 3 4.8 -
Services 13.2 12.5 10.6 10.5 9.9 11 9.0
% share
Agriculture 41.6 45.6 44.0 38.7 42.9 44.1 36.9
Industry 12.9 10.6 11.1 15.3 12.4 11.5 18.8
Large and Medium scale manufacturing 2.6 2.6 2.8 - 2.9 2.8 -
Micro and small scale manufacturing 1.3 1.2 1.4 - 1.3 1.3 -
Services 45.6 44.5 45.6 45.3 45.2 44.9 44.3
GDP in Million Birr @CMP 382,939 505,646 738,605 - 852,740 698,997
Source: MoFED
In general, the average growth rate of the overall economy has been 10 percent per annum over the past
three GTP periods ending 2012/13, which is very close to the target of 11.1 percent. The marginal shortfall
in growth performance could be compensated over the remaining two GTP years by efficiently executing
sector specific plans and strategies. In these three GTP periods, the average growth target of agriculture,
industry and service were 8.5 percent, 17.8 percent and 11.5 percent, respectively. The actual growth rates
averaged at 7 percent, 16.9 percent and 11 percent respectively. These performances indicate the need to
further focus on accelerating the growth of particularly agriculture and industry to ultimately realize the GTP
growth target.
1.1.2 Demand Side Economic Growth
The growth of the economy from supply side has been described above, while this section presents the
overall economic performance from the demand side. As mentioned above, agriculture coupled with
industrial and service activities has been the major source of economic growth during the first three years of
the GTP period. The implication is to continue with the primary policy focus on improving agricultural
productivity in order to sustain the rapid economic growth. Likewise, it becomes essential to analyze the role
of gross capital formation, total final consumption expenditure and net exports are as sources of growth on
the demand side of GDP. The data show that gross capital formation and private final consumption were the
major sources of growth on the demand side during the periods under review, while government final
consumption and export of goods and non-factor services played only a smaller role.
5
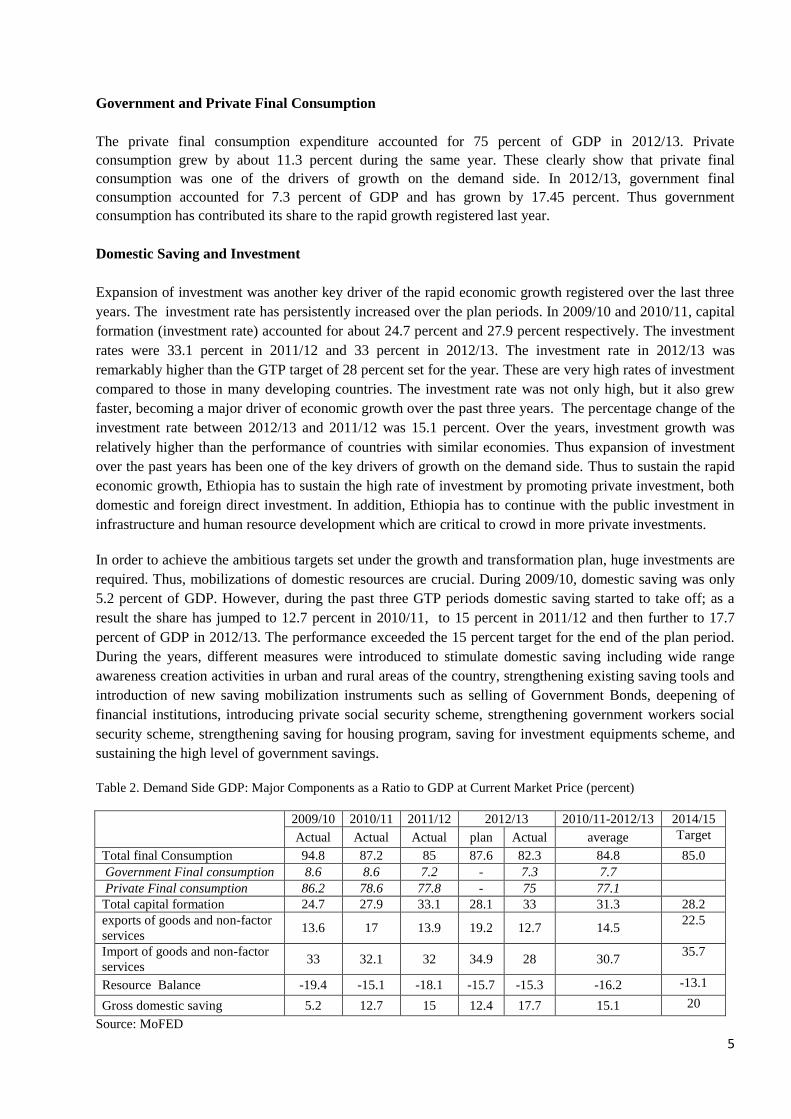
Government and Private Final Consumption
The private final consumption expenditure accounted for 75 percent of GDP in 2012/13. Private
consumption grew by about 11.3 percent during the same year. These clearly show that private final
consumption was one of the drivers of growth on the demand side. In 2012/13, government final
consumption accounted for 7.3 percent of GDP and has grown by 17.45 percent. Thus government
consumption has contributed its share to the rapid growth registered last year.
Domestic Saving and Investment
Expansion of investment was another key driver of the rapid economic growth registered over the last three
years. The investment rate has persistently increased over the plan periods. In 2009/10 and 2010/11, capital
formation (investment rate) accounted for about 24.7 percent and 27.9 percent respectively. The investment
rates were 33.1 percent in 2011/12 and 33 percent in 2012/13. The investment rate in 2012/13 was
remarkably higher than the GTP target of 28 percent set for the year. These are very high rates of investment
compared to those in many developing countries. The investment rate was not only high, but it also grew
faster, becoming a major driver of economic growth over the past three years. The percentage change of the
investment rate between 2012/13 and 2011/12 was 15.1 percent. Over the years, investment growth was
relatively higher than the performance of countries with similar economies. Thus expansion of investment
over the past years has been one of the key drivers of growth on the demand side. Thus to sustain the rapid
economic growth, Ethiopia has to sustain the high rate of investment by promoting private investment, both
domestic and foreign direct investment. In addition, Ethiopia has to continue with the public investment in
infrastructure and human resource development which are critical to crowd in more private investments.
In order to achieve the ambitious targets set under the growth and transformation plan, huge investments are
required. Thus, mobilizations of domestic resources are crucial. During 2009/10, domestic saving was only
5.2 percent of GDP. However, during the past three GTP periods domestic saving started to take off; as a
result the share has jumped to 12.7 percent in 2010/11, to 15 percent in 2011/12 and then further to 17.7
percent of GDP in 2012/13. The performance exceeded the 15 percent target for the end of the plan period.
During the years, different measures were introduced to stimulate domestic saving including wide range
awareness creation activities in urban and rural areas of the country, strengthening existing saving tools and
introduction of new saving mobilization instruments such as selling of Government Bonds, deepening of
financial institutions, introducing private social security scheme, strengthening government workers social
security scheme, strengthening saving for housing program, saving for investment equipments scheme, and
sustaining the high level of government savings.
Table 2. Demand Side GDP: Major Components as a Ratio to GDP at Current Market Price (percent)
2009/10 2010/11 2011/12 2012/13 2010/11-2012/13 2014/15
Actual Actual Actual plan Actual average Target
Total final Consumption 94.8 87.2 85 87.6 82.3 84.8 85.0
Government Final consumption 8.6 8.6 7.2 - 7.3 7.7
Private Final consumption 86.2 78.6 77.8 - 75 77.1
Total capital formation 24.7 27.9 33.1 28.1 33 31.3 28.2
exports of goods and non-factor
services 13.6 17 13.9 19.2 12.7 14.5
22.5
Import of goods and non-factor
services 33 32.1 32 34.9 28 30.7
35.7
Resource Balance -19.4 -15.1 -18.1 -15.7 -15.3 -16.2 -13.1
Gross domestic saving 5.2 12.7 15 12.4 17.7 15.1 20
Source: MoFED
6
Despite the significant improvements in domestic saving mobilization over the last three years, the gap
between the investment requirements and the level of domestic savings remains huge, primary calling for
consolidating the domestic resource mobilization efforts. Therefore, in the remaining GTP periods and
beyond domestic saving should increase to narrow the savings-investment gap and fulfill the financial
requirement of the economy. In this regard, curbing the inflationary pressure, strengthening public
awareness creation and enhancing financial education among the grass root community, deepening of
financial institutions, strengthening the application of existing saving instruments and introduction of new
saving schemes, placing massive push towards creating new job opportunities to further stimulate saving
behavior of the youth are some of the strategies that will be pursued in the upcoming periods to increase
domestic savings. Furthermore, the ongoing strategies would be executed more effectively to increase
government revenues and improve the efficiency and effectiveness of government resource use.
Export and Import of Goods and Non-Factor Services
Export of goods and non-factor services were expected to play an important role in accelerating the growth
of the economy. However, the export sector played an insignificant role particularly in 2011/12 and 2012/13.
The share of exports of goods and non-factor services in GDP has declined to 12.7 percent in 2012/13 from
17 percent and 13.9 percent in 2010/11 and 2011/12, respectively. The performance of the year has also been
below the target of 19.2 percent of GDP. Exports of goods and services grew by 19.7 percent in 2011/12
and by 4.9 percent in 2012/13 in nominal terms. These are indicative that the export sector leaves much to be
desired in terms of driving economic growth in Ethiopia. The main reason for the decline in the share of
exports in GDP is the poor performance of the sector due to low production of exportable commodities and
the fall in coffee and gold prices in international markets. Hence the export promoting strategies need to be
implemented more effectively in order to reverse the poor performance of the export sector over the last two
years. The strategy should primarily focus promoting diversification of exports, exports of value-added
manufactured commodities, and other non-traditional high value export items.
Import of goods and non-factor services accounted for 32.1 percent and 32 percent of GDP in 2010/11 and
2011/12 respectively. However, the share has declined to 28 percent in 2012/13 mainly due to the slowdown
in the growth of imports. The decline was mainly associated with the decrease in consumer goods import by
2.2 percent during the fiscal year under review. Imports of goods and services grew by 45.5 percent and 0.8
percent in 2011/12 and 2012/13 respectively in nominal terms.
1.2 Employment
During the past three GTP years, the expansion of investments by micro and small enterprise as well as
medium and large scale industries has resulted in the creation of significant number of job opportunities. In
2012/13 alone, micro and small scale enterprises created employment opportunities to over 1.2 million
individuals (0.5 million temporary and 0.72 million permanent). In addition large scale public projects have
created employment opportunities to over 797 995 individuals. Private investments in medium and large
manufacturing, hotels and restaurant, real estate and housing, etc are also expected to have created
additional job opportunities during the fiscal year under review. Thus the rapid economic growth has been
accompanied by jobs. As a result, in 2011/12 urban unemployment rate has decreased to 17.5 percent from
18.9 in 2009/10. Yet, even though the economic growth has been creating new job opportunities for citizens,
unemployment and underemployment remain critical challenges in Ethiopia.
1.3 Wellbeing and Poverty
The primary objective of the Growth and Transformation Plan is reducing poverty in all its dimensions via
recording broad based, inclusive, accelerated and sustainable economic growth. In order to measure the
7
outcome of the overall economic growth on the welfare of the poor, impact assessment (Household Income
and Consumption Expenditure –HICE analysis) has been conducted in 2011. According to the assessment
report and other research findings, the economic growth that has been registered in the past years has been
inclusive, benefiting the citizens at large. Inclusive growth is a concept which advances equitable
opportunities for economic participants during the process of economic growth with benefits accruing to
every section of society. The socio-economic gains of the progress that has been realized in the past three
years improved the income of the citizens, reduced urban unemployment and improved the living standard
of the society. The impact of economic growth on the welfare and poverty conditions of the society is
explained from two dimensions – income and non-income dimension. This section discusses the impact of
economic growth on both dimensions of welfare.
Per capita income has increased from USD 510 in 2011/12 to USD 550 in 2012/13. According to the
Household Income and Consumption Expenditure Survey, the proportion of population living below the
poverty line has declined from 38.7 percent in 2004/05 to 29.6 percent in 2010/11, showing a decline of 9.1
percentage points over the five years. Assuming the same trend and growth elasticity of poverty, poverty
index is estimated to decrease to about 26 percent in 2012/13. The analysis also indicates that about one
million poor people have been lifted out of poverty in 2012/13 alone. The Survey results show that poverty
headcount index has been declining in all regional states and city governments. With regard to food poverty,
the Survey result indicates that food poverty index has declined from 38 percent in 2004/05 to 33.6 percent
in 2010/11, registering a decline of 4.4 percentage points. The food poverty level is estimated to decrease to
32.7 percent in 2011/12 and 31.8 percent in 2012/13.
Disaggregated estimation of poverty levels across areas of residence also indicates that poverty is declining
in both rural and urban areas. Rural poverty headcount index was 39.3 percent in 2004/05 and 30.4 percent
in 2010/11, showing a decline of 8.9 percentage points in poverty index over the same period. Using this
trend, rural head count poverty index is estimated to decline to about 28.6 percent in 2011/12 and 26.8 in
2012/13. According to the Survey, urban poverty headcount index has declined from 35.1 percent in 2004/05
to 25.7 percent in 2010/11, showing a decline in poverty level by 9.4 percentage points. Urban poverty is
estimated to have further declined to 23.8 percent in 2011/12 and 22 percent in 2012/13. These are indicative
that the rapid and broad-based economic growth has been associated with a marked decline in income
poverty in the country.
With regard to non-income poverty, the rapid economic growth has enabled to undertake massive public
investments in social and infrastructure sectors, which have a direct bearing on the wellbeing of citizens.
Investments in the construction of new health facilities and upgrading of the existing ones, and in
strengthening the implementation of the health extension program have brought about significant
improvements in the health condition and wellbeing of people. During 2012/13, primary health service
coverage has increased to 93 percent, while significant progress has been made in improving maternal and
child health. Ethiopia has already achieved the MDG target of of reducing child mortality by two thirds well
before the target period of 20151. Likewise, the rapid economic growth has enabled to undertake massive
investments in the expansion of primary, secondary and tertiary education. As a result, primary gross
enrolment rate has increased to 95.4 percent and over 17.3 million children were enrolled in primary schools
all over the country in 2012/13.
In addition, Ethiopia was able to invest massively in road rehabilitation and construction, in potable water
supply as well as in energy. The average time to reach all weather roads has decreased to 2.1 hour, national
potable water supply has increased to 68.5 percent, while electric power coverage has improved to 56
1 UNICEF: Inter-Agency Group for Child Mortality Estimation (IGME).
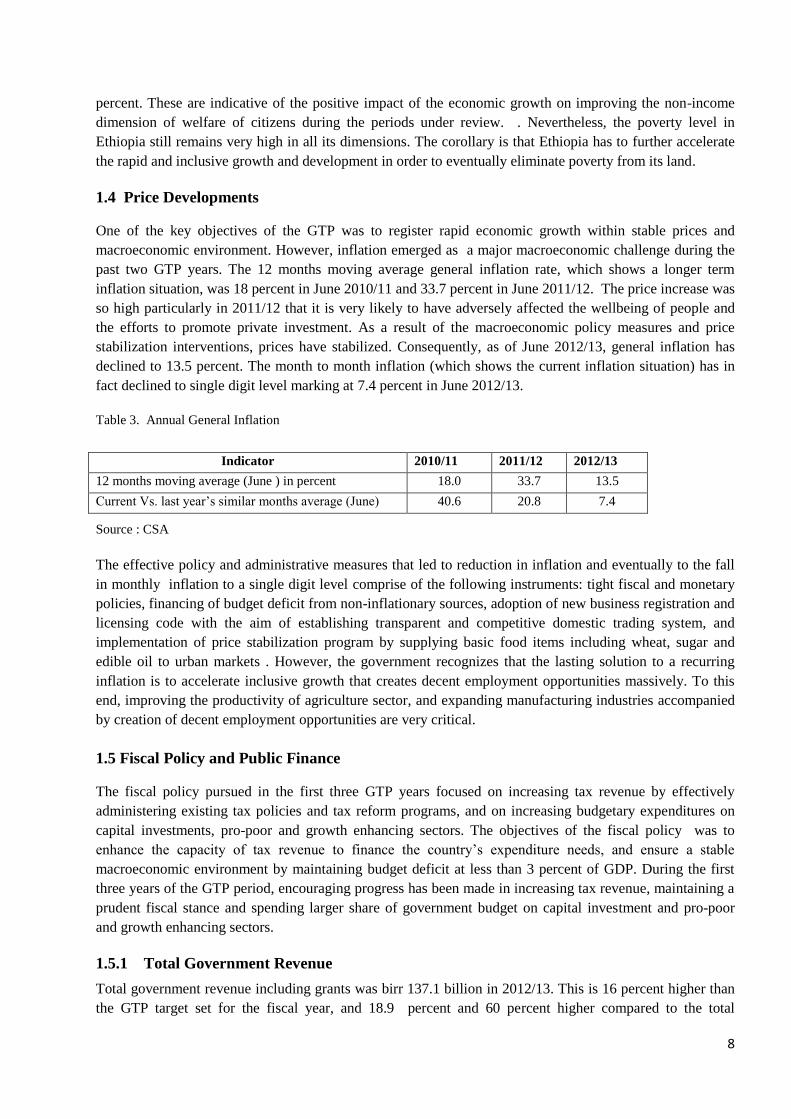
8
percent. These are indicative of the positive impact of the economic growth on improving the non-income
dimension of welfare of citizens during the periods under review. . Nevertheless, the poverty level in
Ethiopia still remains very high in all its dimensions. The corollary is that Ethiopia has to further accelerate
the rapid and inclusive growth and development in order to eventually eliminate poverty from its land.
1.4 Price Developments
One of the key objectives of the GTP was to register rapid economic growth within stable prices and
macroeconomic environment. However, inflation emerged as a major macroeconomic challenge during the
past two GTP years. The 12 months moving average general inflation rate, which shows a longer term
inflation situation, was 18 percent in June 2010/11 and 33.7 percent in June 2011/12. The price increase was
so high particularly in 2011/12 that it is very likely to have adversely affected the wellbeing of people and
the efforts to promote private investment. As a result of the macroeconomic policy measures and price
stabilization interventions, prices have stabilized. Consequently, as of June 2012/13, general inflation has
declined to 13.5 percent. The month to month inflation (which shows the current inflation situation) has in
fact declined to single digit level marking at 7.4 percent in June 2012/13.
Table 3. Annual General Inflation
Indicator 2010/11 2011/12 2012/13
12 months moving average (June ) in percent 18.0 33.7 13.5
Current Vs. last year’s similar months average (June) 40.6 20.8 7.4
Source : CSA
The effective policy and administrative measures that led to reduction in inflation and eventually to the fall
in monthly inflation to a single digit level comprise of the following instruments: tight fiscal and monetary
policies, financing of budget deficit from non-inflationary sources, adoption of new business registration and
licensing code with the aim of establishing transparent and competitive domestic trading system, and
implementation of price stabilization program by supplying basic food items including wheat, sugar and
edible oil to urban markets . However, the government recognizes that the lasting solution to a recurring
inflation is to accelerate inclusive growth that creates decent employment opportunities massively. To this
end, improving the productivity of agriculture sector, and expanding manufacturing industries accompanied
by creation of decent employment opportunities are very critical.
1.5 Fiscal Policy and Public Finance
The fiscal policy pursued in the first three GTP years focused on increasing tax revenue by effectively
administering existing tax policies and tax reform programs, and on increasing budgetary expenditures on
capital investments, pro-poor and growth enhancing sectors. The objectives of the fiscal policy was to
enhance the capacity of tax revenue to finance the country’s expenditure needs, and ensure a stable
macroeconomic environment by maintaining budget deficit at less than 3 percent of GDP. During the first
three years of the GTP period, encouraging progress has been made in increasing tax revenue, maintaining a
prudent fiscal stance and spending larger share of government budget on capital investment and pro-poor
and growth enhancing sectors.
1.5.1 Total Government Revenue
Total government revenue including grants was birr 137.1 billion in 2012/13. This is 16 percent higher than
the GTP target set for the fiscal year, and 18.9 percent and 60 percent higher compared to the total
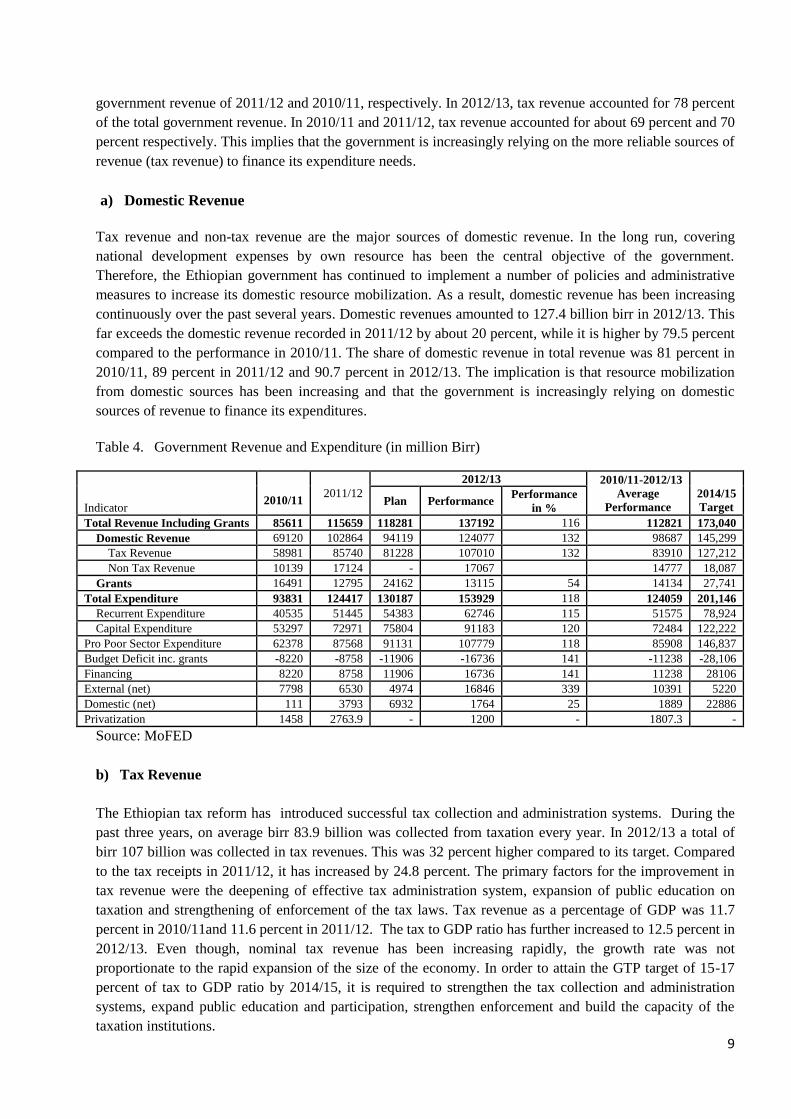
9
government revenue of 2011/12 and 2010/11, respectively. In 2012/13, tax revenue accounted for 78 percent
of the total government revenue. In 2010/11 and 2011/12, tax revenue accounted for about 69 percent and 70
percent respectively. This implies that the government is increasingly relying on the more reliable sources of
revenue (tax revenue) to finance its expenditure needs.
a) Domestic Revenue
Tax revenue and non-tax revenue are the major sources of domestic revenue. In the long run, covering
national development expenses by own resource has been the central objective of the government.
Therefore, the Ethiopian government has continued to implement a number of policies and administrative
measures to increase its domestic resource mobilization. As a result, domestic revenue has been increasing
continuously over the past several years. Domestic revenues amounted to 127.4 billion birr in 2012/13. This
far exceeds the domestic revenue recorded in 2011/12 by about 20 percent, while it is higher by 79.5 percent
compared to the performance in 2010/11. The share of domestic revenue in total revenue was 81 percent in
2010/11, 89 percent in 2011/12 and 90.7 percent in 2012/13. The implication is that resource mobilization
from domestic sources has been increasing and that the government is increasingly relying on domestic
sources of revenue to finance its expenditures.
Table 4. Government Revenue and Expenditure (in million Birr)
Indicator
2010/11 2011/12
2012/13 2010/11-2012/13
Average
Performance
2014/15
Target Plan Performance
Performance
in %
Total Revenue Including Grants 85611 115659 118281 137192 116 112821 173,040
Domestic Revenue 69120 102864 94119 124077 132 98687 145,299
Tax Revenue 58981 85740 81228 107010 132 83910 127,212
Non Tax Revenue 10139 17124 - 17067
14777 18,087
Grants 16491 12795 24162 13115 54 14134 27,741
Total Expenditure 93831 124417 130187 153929 118 124059 201,146
Recurrent Expenditure 40535 51445 54383 62746 115 51575 78,924
Capital Expenditure 53297 72971 75804 91183 120 72484 122,222
Pro Poor Sector Expenditure 62378 87568 91131 107779 118 85908 146,837
Budget Deficit inc. grants -8220 -8758 -11906 -16736 141 -11238 -28,106
Financing 8220 8758 11906 16736 141 11238 28106
External (net) 7798 6530 4974 16846 339 10391 5220
Domestic (net) 111 3793 6932 1764 25 1889 22886
Privatization 1458 2763.9 - 1200 - 1807.3 -
Source: MoFED
b) Tax Revenue
The Ethiopian tax reform has introduced successful tax collection and administration systems. During the
past three years, on average birr 83.9 billion was collected from taxation every year. In 2012/13 a total of
birr 107 billion was collected in tax revenues. This was 32 percent higher compared to its target. Compared
to the tax receipts in 2011/12, it has increased by 24.8 percent. The primary factors for the improvement in
tax revenue were the deepening of effective tax administration system, expansion of public education on
taxation and strengthening of enforcement of the tax laws. Tax revenue as a percentage of GDP was 11.7
percent in 2010/11and 11.6 percent in 2011/12. The tax to GDP ratio has further increased to 12.5 percent in
2012/13. Even though, nominal tax revenue has been increasing rapidly, the growth rate was not
proportionate to the rapid expansion of the size of the economy. In order to attain the GTP target of 15-17
percent of tax to GDP ratio by 2014/15, it is required to strengthen the tax collection and administration
systems, expand public education and participation, strengthen enforcement and build the capacity of the
taxation institutions.
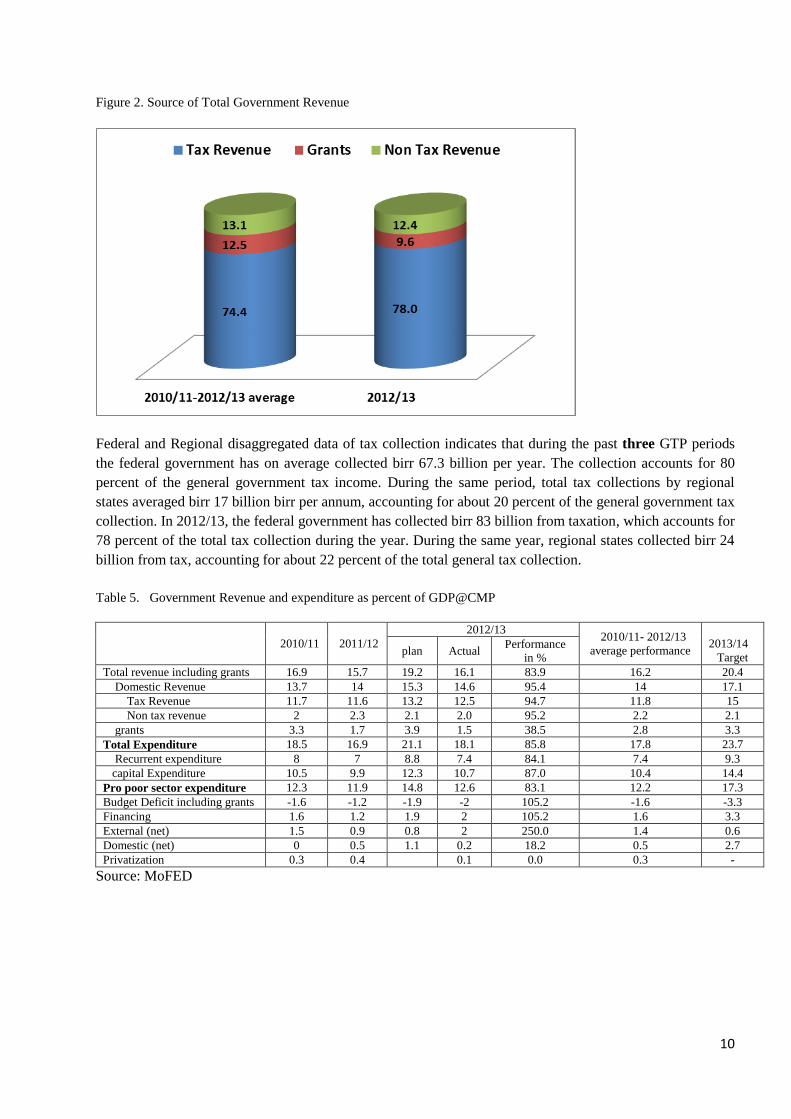
10
Figure 2. Source of Total Government Revenue
Federal and Regional disaggregated data of tax collection indicates that during the past three GTP periods
the federal government has on average collected birr 67.3 billion per year. The collection accounts for 80
percent of the general government tax income. During the same period, total tax collections by regional
states averaged birr 17 billion birr per annum, accounting for about 20 percent of the general government tax
collection. In 2012/13, the federal government has collected birr 83 billion from taxation, which accounts for
78 percent of the total tax collection during the year. During the same year, regional states collected birr 24
billion from tax, accounting for about 22 percent of the total general tax collection.
Table 5. Government Revenue and expenditure as percent of GDP@CMP
2010/11 2011/12
2012/13 2010/11- 2012/13
average performance
2013/14
Target plan Actual
Performance
in %
Total revenue including grants 16.9 15.7 19.2 16.1 83.9 16.2 20.4
Domestic Revenue 13.7 14 15.3 14.6 95.4 14 17.1
Tax Revenue 11.7 11.6 13.2 12.5 94.7 11.8 15
Non tax revenue 2 2.3 2.1 2.0 95.2 2.2 2.1
grants 3.3 1.7 3.9 1.5 38.5 2.8 3.3
Total Expenditure 18.5 16.9 21.1 18.1 85.8 17.8 23.7
Recurrent expenditure 8 7 8.8 7.4 84.1 7.4 9.3
capital Expenditure 10.5 9.9 12.3 10.7 87.0 10.4 14.4
Pro poor sector expenditure 12.3 11.9 14.8 12.6 83.1 12.2 17.3
Budget Deficit including grants -1.6 -1.2 -1.9 -2 105.2 -1.6 -3.3
Financing 1.6 1.2 1.9 2 105.2 1.6 3.3
External (net) 1.5 0.9 0.8 2 250.0 1.4 0.6
Domestic (net) 0 0.5 1.1 0.2 18.2 0.5 2.7
Privatization 0.3 0.4
0.1 0.0 0.3 -
Source: MoFED
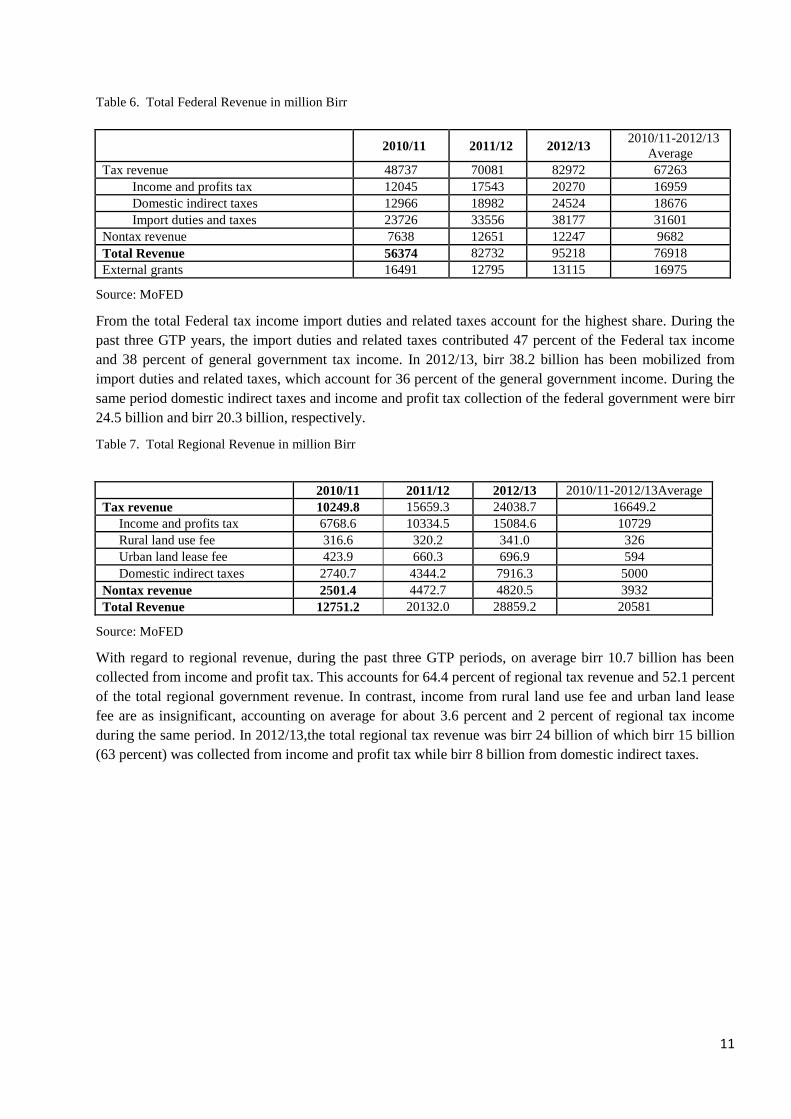
11
Table 6. Total Federal Revenue in million Birr
2010/11 2011/12 2012/13 2010/11-2012/13
Average
Tax revenue 48737 70081 82972 67263
Income and profits tax 12045 17543 20270 16959
Domestic indirect taxes 12966 18982 24524 18676
Import duties and taxes 23726 33556 38177 31601
Nontax revenue 7638 12651 12247 9682
Total Revenue 56374 82732 95218 76918
External grants 16491 12795 13115 16975
Source: MoFED
From the total Federal tax income import duties and related taxes account for the highest share. During the
past three GTP years, the import duties and related taxes contributed 47 percent of the Federal tax income
and 38 percent of general government tax income. In 2012/13, birr 38.2 billion has been mobilized from
import duties and related taxes, which account for 36 percent of the general government income. During the
same period domestic indirect taxes and income and profit tax collection of the federal government were birr
24.5 billion and birr 20.3 billion, respectively.
Table 7. Total Regional Revenue in million Birr
2010/11 2011/12 2012/13 2010/11-2012/13Average
Tax revenue 10249.8 15659.3 24038.7 16649.2
Income and profits tax 6768.6 10334.5 15084.6 10729
Rural land use fee 316.6 320.2 341.0 326
Urban land lease fee 423.9 660.3 696.9 594
Domestic indirect taxes 2740.7 4344.2 7916.3 5000
Nontax revenue 2501.4 4472.7 4820.5 3932
Total Revenue 12751.2 20132.0 28859.2 20581
Source: MoFED
With regard to regional revenue, during the past three GTP periods, on average birr 10.7 billion has been
collected from income and profit tax. This accounts for 64.4 percent of regional tax revenue and 52.1 percent
of the total regional government revenue. In contrast, income from rural land use fee and urban land lease
fee are as insignificant, accounting on average for about 3.6 percent and 2 percent of regional tax income
during the same period. In 2012/13,the total regional tax revenue was birr 24 billion of which birr 15 billion
(63 percent) was collected from income and profit tax while birr 8 billion from domestic indirect taxes.
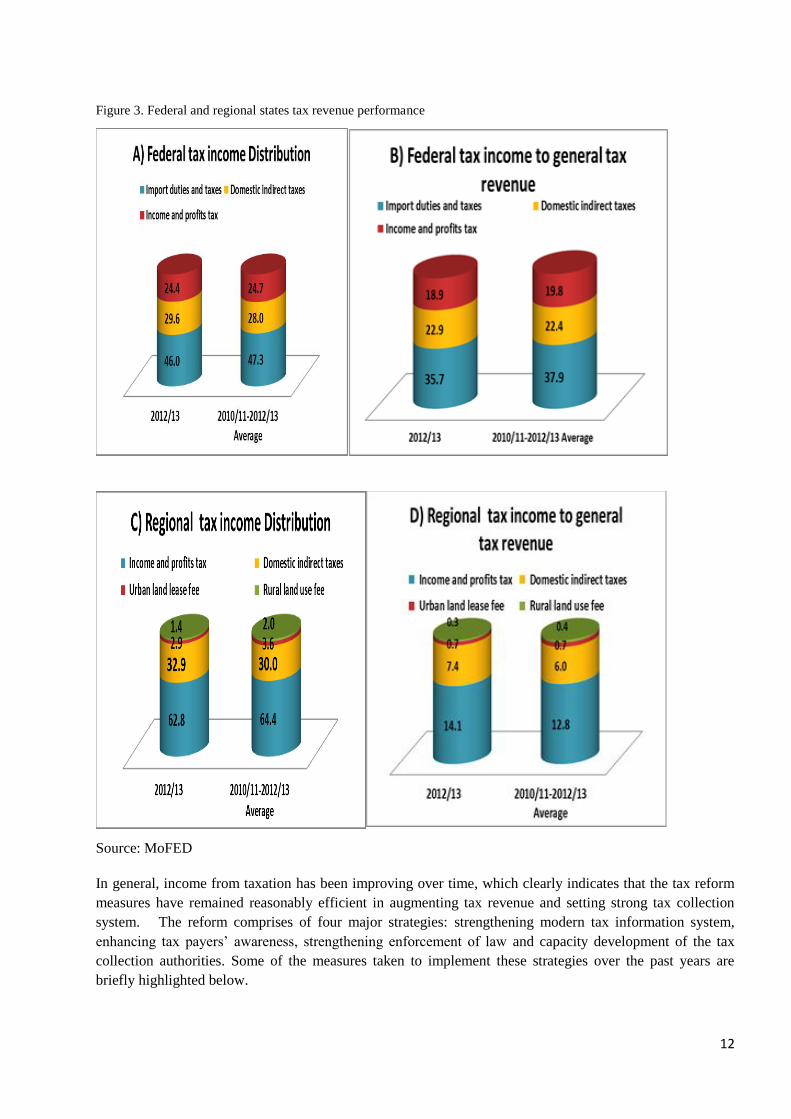
12
Figure 3. Federal and regional states tax revenue performance
Source: MoFED
In general, income from taxation has been improving over time, which clearly indicates that the tax reform
measures have remained reasonably efficient in augmenting tax revenue and setting strong tax collection
system. The reform comprises of four major strategies: strengthening modern tax information system,
enhancing tax payers’ awareness, strengthening enforcement of law and capacity development of the tax
collection authorities. Some of the measures taken to implement these strategies over the past years are
briefly highlighted below.
13
1) Strengthening Institutional Capacity
During the fiscal year under review, the revenue authority gave due attention for human resource planning
and development. As a result, the authority has recruited 1,834 new and experienced employees from
universities and the market.
In an endeavor to build the capacity of its employees and increase their efficiency, the authority has
identified training needs and has conducted short and long term trainings for 2,696 staffs and mangers with
the help of experienced training institution. It is expected that these training and education will strengthen
the implementation and execution capacity of the authority and thereby contribute to the quality of service
delivery and customers’ satisfaction. In addition, in collaboration with the federal Ethics and Anti-
Corruption Commission the authority has provided short term ethics training to its performers to enhance
their attitudinal capabilities.
2) Strengthening Modern Tax Information System
This has the objective of establishing improved efficiency, supply and usage of tax administration
information system by using computerized database. The system provides reliable and fast flow of
information within and outside the authority, fast service delivery, controls tax evasion, create a dependable
database, and help for efficient and effective tax collection. A number of activities were implemented in this
regard as described below.
Improving tax information administration
Strengthening Taxpayer Identification Number with biometric (Biometric TIN): under the current
taxpayers’ registration system, all taxpayers are expected to have Tax Identification Number (TIN). An
automated TIN system has been developed, deployed and supported by biometric finger print system at a
national level. In 2012/13, a total of 249,839 finger prints information were collected. From the
commencement of the project in 2008/09 till 2012/13 fiscal year, a total of 2,264,750 finger prints were
collected which is 141.3 percent of the plan of 1.6 million finger prints information. With regard to
distribution of biometric ID card, a total of 1.5 million (68.2 percent) finger print identification card have
been printed and distributed.
Expanding sales register machine delivery and usage: In 2012/13 fiscal year, 14 sales register machine
and 7 fiscal printer software suppliers have been supervised. During the fiscal year, a total of 20,883
taxpayers purchased and used 22,362 sales register machines. Since the beginning of the project in 2007/08
to 2012/13, at national level 66,250 taxpayers have been using 72,969 sales register machines.
Increasing delivery of information through technology - SIGTAS E-Filing Deployment:. The objective
of this system is to introduce a system which helps taxpayers to declare their tax from their work place and
without coming to tax centers. In this regard, in 2012/13, training was given to 816 taxpayers’ and among
these 634 taxpayers have fulfilled the requirements and have started to declare with e-filling system.
SIGTAS regional deployment: To establish efficient tax administration and information system in all tax
types Standard Integrated Government Tax Administration System (SIGTAS) has been implemented fully at
the federal level. In addition, to create a harmonized tax administration among federal and the regions, the
authority is deploying SIGTAS in the regional state tax collecting bodies. Accordingly, a total 50 tax centers
have been connected in 2012/13 (4 in Oromia; 13 in South Nations Nationalities and Peoples; 27 in
14
Amhara; and 6 in Addis Ababa city administration). In implementing the project, attitudinal and skill
problems have been observed as major challenges for not using the system at full scale.
Electronic Cargo Trucking: Electronic cargo trucking helps to maximize use of technologies to support and
efficiently control customs and to effectively monitor the flow and movement of goods and vehicles in
transit corridors. During the fiscal year under review, the system has been arranged for application in the
corridors from Addis Ababa to Djibouti and Combolcha. Preliminary experiment has been started with 95
vehicles in the Addis Ababa to Djibouti transit corridor.
Electronic Cargo Scanning Machine: Electronic cargo scanning machine has been implemented with the
objective of optimization the use of technologies to support trade facilitation. During the fiscal year under
review, in Galafi customs control station two re-locatable cargo scanning machines and two weight bridges
with their civil works infrastructures have been standing for use. On the other hand, four sites for mobile
cargo scanning machines and three weight bridges are under construction in Mojo, Moyale, Metema,
Humera and Tegowchale customs control stations.
Development and Implementation of Ethiopian Customs Valuation System: Development and
implementation of Ethiopian customs valuation system has been undertaked with the objective of shifting
from a minimum price data base valuation system towards the WTO Valuation Agreement Principles
system. By accomplishing system development and related works, pilot test has been commenced in Addis
Ababa airport custom and Addis Ababa Kality custom branch offices.
Customers Call Center Service: Customers call center service has been established in a tax and customs
national Call Centre to provide transparent and consistent information on tax and customs laws and other
information to the public. During the fiscal year under review, the center has started giving information to its
customers through telephone.
Automated System for Customs Data (ASYCUDA++): this system provides full import-export
information (with special attention for industrialists and exporters); customs duty and tax assessment; and
enforcement activities for selected customers. As a result, during the fiscal year under review, the authority
has undertaken system gap assessment. In addition to this, software has been developed to facilitate service
delivery of foreign trade activity.
Strengthening of Direct Trade Information Service (DTI Service): with the objective of enabling
Remote Direct Trade Information Service to customs, transits, remote DTI Service network has been
upgraded and fiber optics installed, which was connected with Automated System for Customs Data
(ASYCUDA++). As a result, the information flow between the authority and customs transits has become
faster and more efficient.
Interfacing With Third Parties For Data Exchange: with the aim of establishing collaboration with third
parties to exchange data among government institution, a network communication was established and data
exchange has been started with Ministry of Finance and Economic Development, Road Transport Authority,
Ethio-telecom, National Bank of Ethiopia, Ethiopian Airlines and Customs of Djibouti. The Ethiopian
Horticulture Agency is also interfaced with Automated System for Customs Data (ASYCUDA++) in order
to get customs data.
15
3) Enhance taxpayers education and communication
To improve taxpayers voluntary compliance, the authority has worked on public education and
communication with different customers and partners in the fiscal year 2012/13. In this regard, intensive
taxpayers’ education has been undertaken using electronic media and taxpayer face-to-face consultation
forum. As a result of the above measures taxpayers registration has increased. In 2012/13 alone, 29,743 (of
which 2,510 are federal and 27,233 are Regions & city administrations) VAT registrants were registered.
Since its introduction, the total number of VAT registrants throughout the country was 116,698 by 2012/13.
On the other hand, during the fiscal year under review, about 3,107 (of which 289 are federal and 2,818 are
Regions & city administrations) VAT registrants were deregistered. With regard to profit tax payers’
registration, 26,436 (of which 2,409 are federal and 24,027 are Regions & city administrations) tax payers
were registered, while about 3,037 (of which 284 are federal and 2,753 are Regions & city administrations)
were deregistered. At the end of this fiscal year, 123,226 (of which 21,985 are federal and 101,241 are
Regions & city administrations) taxpayers were registered as profit tax payers.
4) Enforcing the Taxation Law
The initiative is intended to improve relationship and cooperation among citizens and stakeholders to protect
tax evasion, improve judiciary on tax evaders and suspected counterfeiters, develop risk averting works,
establish improved tax audit system and enhance taxpayers’ compliance. To achieve the objective several
activities were undertaken. The details are presented as follows.
Strengthening tax Audit system: During the fiscal year under review, domestic tax audit and post
clearance audit activities have been done for different tax payers. As a result, from domestic tax 8,492
taxpayers file are audited as a result total of birr 18,293.4 million birr has been decided. And from customs
through post clearance audit 765.5 million birr in total 19,058.8 million birr were decided.
Improving suspected counter filters: In 2012/13 higher government officials in domestic revenue
collection and those in the business community who are suspected of corruption, tax evasion, illicit trade and
contraband were sent to court for investigation and prosecution. The measure taken by the government
shows its commitment to fight against corruption and rent seeking.
Improving law and administrative decision: During the fiscal year, the proportion of criminal court cases
decided for the authority was 1,480 and 161 for suspected counterfeiters. As a result, the conviction rate
court cases were on average about 89.4 percent.
During the fiscal year, proportion of non-criminal court cases decided for the authority was 478 and
57 for taxpayers. As a result the conviction rate court cases were on the average 86 percent.
During the fiscal year under review, a total of 4,125 suspected counterfeiters on tax evasion, illicit
trade and contraband cases were directed to tax investigation unit. Out of which 1,001 (18.3 percent)
cases were solved administratively dealing with suspected counterfeiters to pay taxes with penalty. At
same time 1,887 (45.8 percent) cases were sent to prosecution unit.
Preventing and controlling contraband: This is one of the activities performed by the authority to
encourage legal traders and investors, and to combat contraband at its roots. The authority has opened
discussions about the adverse effects of contraband with different religious leaders, region managers and
federal police. By studying different smuggling techniques around the borders, different actions have also
been taken to control and prevent import as well as export contraband.
Improving risk management system: - In order to use human and financial resources efficiently and
effectively the authority has implemented eight criteria of its risk management system including importer
profile; customs transit profile; tariff code; goods value; country of origin; country of consignment; customs
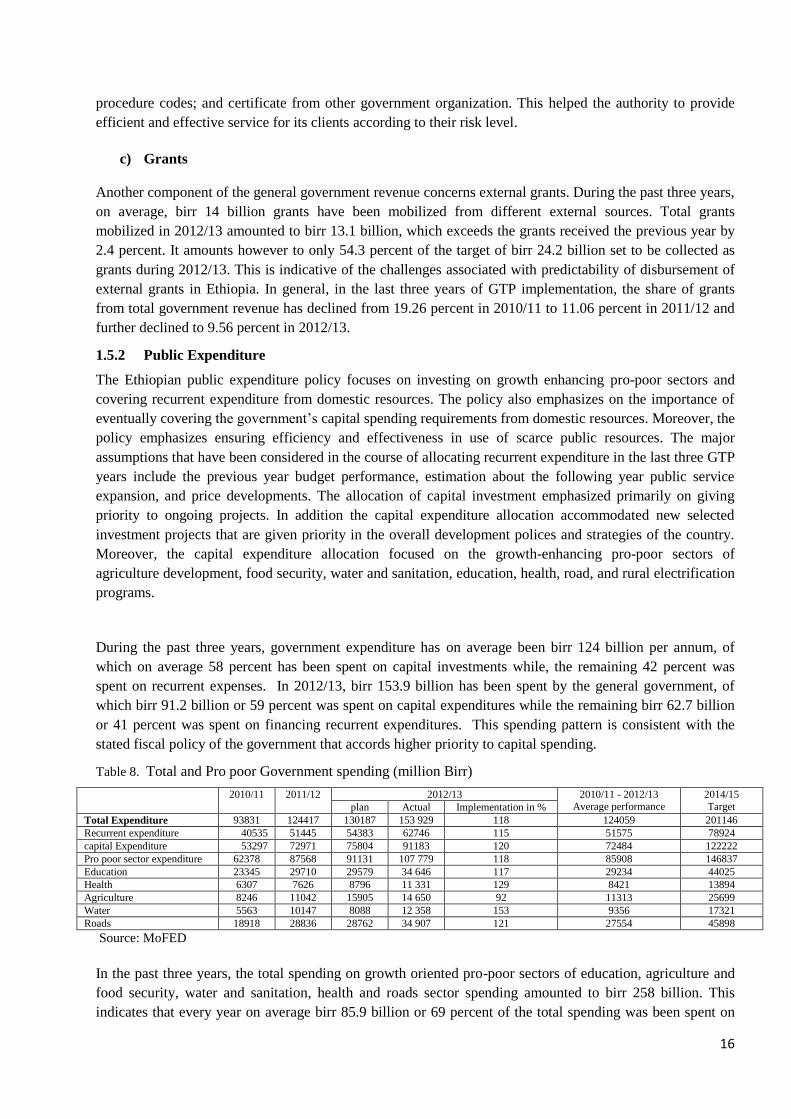
16
procedure codes; and certificate from other government organization. This helped the authority to provide
efficient and effective service for its clients according to their risk level.
c) Grants
Another component of the general government revenue concerns external grants. During the past three years,
on average, birr 14 billion grants have been mobilized from different external sources. Total grants
mobilized in 2012/13 amounted to birr 13.1 billion, which exceeds the grants received the previous year by
2.4 percent. It amounts however to only 54.3 percent of the target of birr 24.2 billion set to be collected as
grants during 2012/13. This is indicative of the challenges associated with predictability of disbursement of
external grants in Ethiopia. In general, in the last three years of GTP implementation, the share of grants
from total government revenue has declined from 19.26 percent in 2010/11 to 11.06 percent in 2011/12 and
further declined to 9.56 percent in 2012/13.
1.5.2 Public Expenditure
The Ethiopian public expenditure policy focuses on investing on growth enhancing pro-poor sectors and
covering recurrent expenditure from domestic resources. The policy also emphasizes on the importance of
eventually covering the government’s capital spending requirements from domestic resources. Moreover, the
policy emphasizes ensuring efficiency and effectiveness in use of scarce public resources. The major
assumptions that have been considered in the course of allocating recurrent expenditure in the last three GTP
years include the previous year budget performance, estimation about the following year public service
expansion, and price developments. The allocation of capital investment emphasized primarily on giving
priority to ongoing projects. In addition the capital expenditure allocation accommodated new selected
investment projects that are given priority in the overall development polices and strategies of the country.
Moreover, the capital expenditure allocation focused on the growth-enhancing pro-poor sectors of
agriculture development, food security, water and sanitation, education, health, road, and rural electrification
programs.
During the past three years, government expenditure has on average been birr 124 billion per annum, of
which on average 58 percent has been spent on capital investments while, the remaining 42 percent was
spent on recurrent expenses. In 2012/13, birr 153.9 billion has been spent by the general government, of
which birr 91.2 billion or 59 percent was spent on capital expenditures while the remaining birr 62.7 billion
or 41 percent was spent on financing recurrent expenditures. This spending pattern is consistent with the
stated fiscal policy of the government that accords higher priority to capital spending.
Table 8. Total and Pro poor Government spending (million Birr)
2010/11 2011/12 2012/13 2010/11 - 2012/13 Average performance
2014/15 Target plan Actual Implementation in %
Total Expenditure 93831 124417 130187 153 929 118 124059 201146
Recurrent expenditure 40535 51445 54383 62746 115 51575 78924
capital Expenditure 53297 72971 75804 91183 120 72484 122222
Pro poor sector expenditure 62378 87568 91131 107 779 118 85908 146837
Education 23345 29710 29579 34 646 117 29234 44025
Health 6307 7626 8796 11 331 129 8421 13894
Agriculture 8246 11042 15905 14 650 92 11313 25699
Water 5563 10147 8088 12 358 153 9356 17321
Roads 18918 28836 28762 34 907 121 27554 45898
Source: MoFED
In the past three years, the total spending on growth oriented pro-poor sectors of education, agriculture and
food security, water and sanitation, health and roads sector spending amounted to birr 258 billion. This
indicates that every year on average birr 85.9 billion or 69 percent of the total spending was been spent on
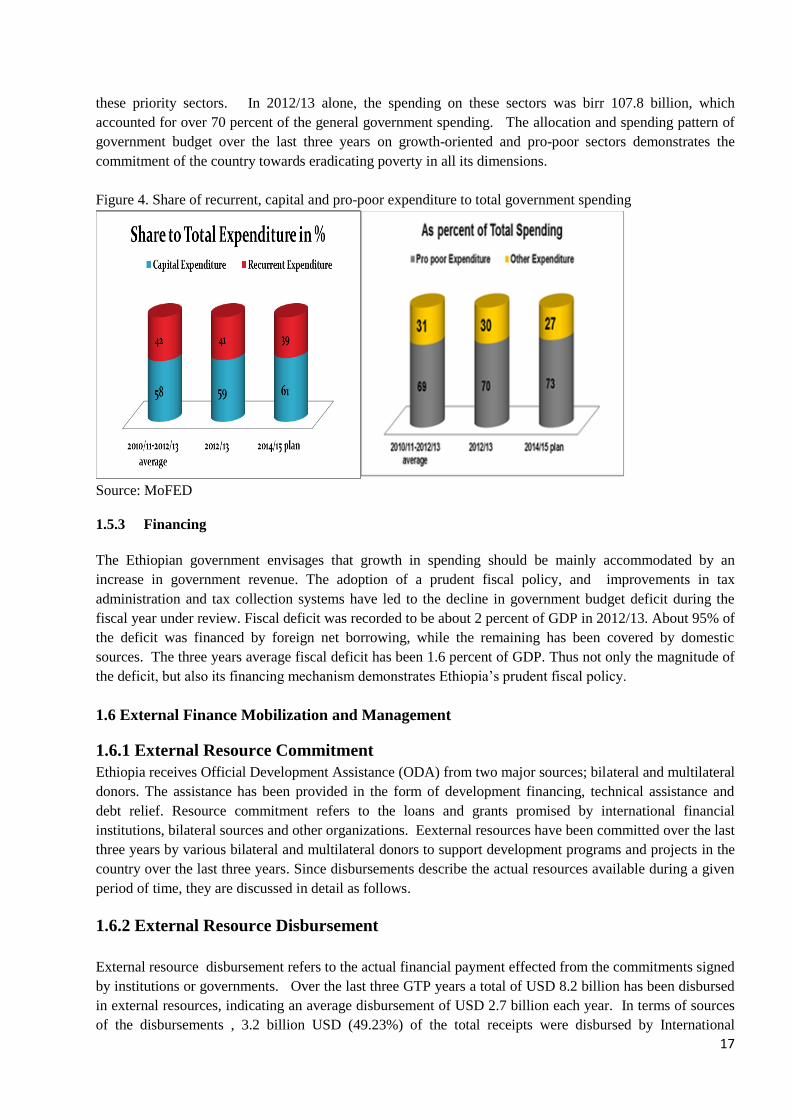
17
these priority sectors. In 2012/13 alone, the spending on these sectors was birr 107.8 billion, which
accounted for over 70 percent of the general government spending. The allocation and spending pattern of
government budget over the last three years on growth-oriented and pro-poor sectors demonstrates the
commitment of the country towards eradicating poverty in all its dimensions.
Figure 4. Share of recurrent, capital and pro-poor expenditure to total government spending
Source: MoFED
1.5.3 Financing
The Ethiopian government envisages that growth in spending should be mainly accommodated by an
increase in government revenue. The adoption of a prudent fiscal policy, and improvements in tax
administration and tax collection systems have led to the decline in government budget deficit during the
fiscal year under review. Fiscal deficit was recorded to be about 2 percent of GDP in 2012/13. About 95% of
the deficit was financed by foreign net borrowing, while the remaining has been covered by domestic
sources. The three years average fiscal deficit has been 1.6 percent of GDP. Thus not only the magnitude of
the deficit, but also its financing mechanism demonstrates Ethiopia’s prudent fiscal policy.
1.6 External Finance Mobilization and Management
1.6.1 External Resource Commitment
Ethiopia receives Official Development Assistance (ODA) from two major sources; bilateral and multilateral
donors. The assistance has been provided in the form of development financing, technical assistance and
debt relief. Resource commitment refers to the loans and grants promised by international financial
institutions, bilateral sources and other organizations. Eexternal resources have been committed over the last
three years by various bilateral and multilateral donors to support development programs and projects in the
country over the last three years. Since disbursements describe the actual resources available during a given
period of time, they are discussed in detail as follows.
1.6.2 External Resource Disbursement
External resource disbursement refers to the actual financial payment effected from the commitments signed
by institutions or governments. Over the last three GTP years a total of USD 8.2 billion has been disbursed
in external resources, indicating an average disbursement of USD 2.7 billion each year. In terms of sources
of the disbursements , 3.2 billion USD (49.23%) of the total receipts were disbursed by International
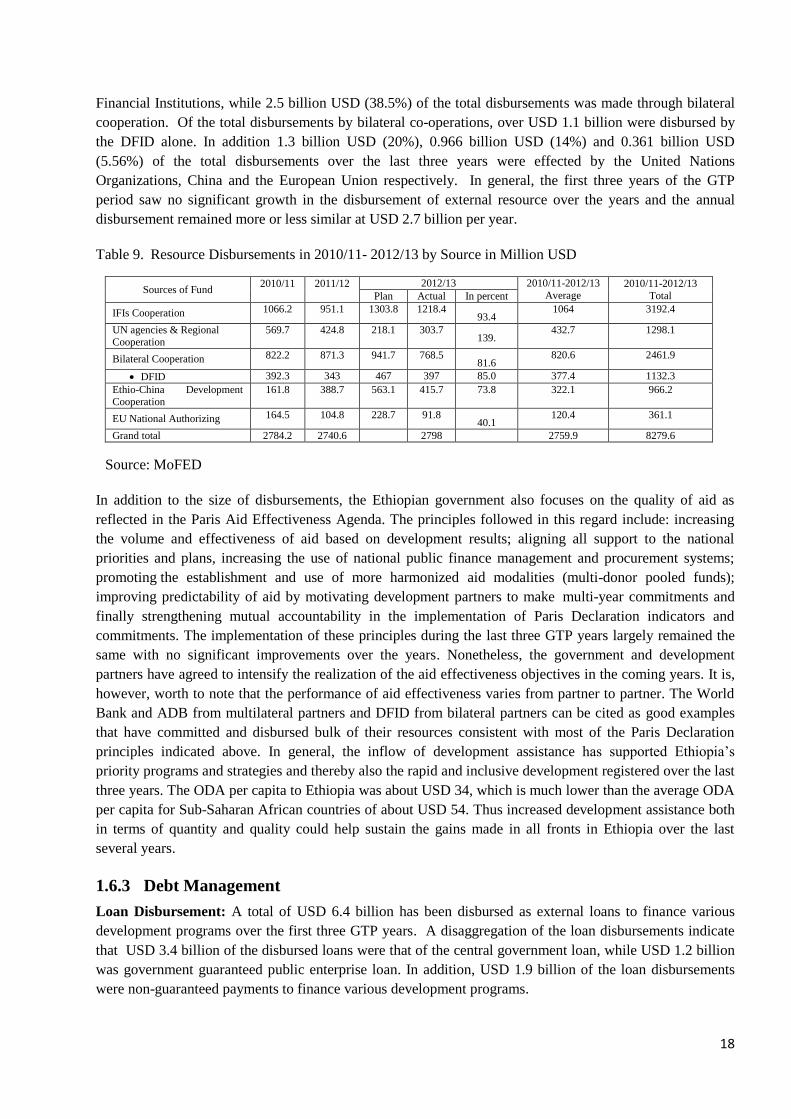
18
Financial Institutions, while 2.5 billion USD (38.5%) of the total disbursements was made through bilateral
cooperation. Of the total disbursements by bilateral co-operations, over USD 1.1 billion were disbursed by
the DFID alone. In addition 1.3 billion USD (20%), 0.966 billion USD (14%) and 0.361 billion USD
(5.56%) of the total disbursements over the last three years were effected by the United Nations
Organizations, China and the European Union respectively. In general, the first three years of the GTP
period saw no significant growth in the disbursement of external resource over the years and the annual
disbursement remained more or less similar at USD 2.7 billion per year.
Table 9. Resource Disbursements in 2010/11- 2012/13 by Source in Million USD
Sources of Fund 2010/11
2011/12
2012/13 2010/11-2012/13
Average 2010/11-2012/13
Total Plan Actual In percent
IFIs Cooperation 1066.2 951.1 1303.8 1218.4 93.4
1064 3192.4
UN agencies & Regional Cooperation
569.7 424.8 218.1 303.7 139.
432.7 1298.1
Bilateral Cooperation 822.2 871.3 941.7 768.5 81.6
820.6 2461.9
DFID 392.3 343 467 397 85.0 377.4 1132.3
Ethio-China Development Cooperation
161.8 388.7 563.1 415.7 73.8 322.1 966.2
EU National Authorizing 164.5 104.8 228.7 91.8 40.1
120.4 361.1
Grand total 2784.2 2740.6 2798 2759.9 8279.6
Source: MoFED
In addition to the size of disbursements, the Ethiopian government also focuses on the quality of aid as
reflected in the Paris Aid Effectiveness Agenda. The principles followed in this regard include: increasing
the volume and effectiveness of aid based on development results; aligning all support to the national
priorities and plans, increasing the use of national public finance management and procurement systems;
promoting the establishment and use of more harmonized aid modalities (multi-donor pooled funds);
improving predictability of aid by motivating development partners to make multi-year commitments and
finally strengthening mutual accountability in the implementation of Paris Declaration indicators and
commitments. The implementation of these principles during the last three GTP years largely remained the
same with no significant improvements over the years. Nonetheless, the government and development
partners have agreed to intensify the realization of the aid effectiveness objectives in the coming years. It is,
however, worth to note that the performance of aid effectiveness varies from partner to partner. The World
Bank and ADB from multilateral partners and DFID from bilateral partners can be cited as good examples
that have committed and disbursed bulk of their resources consistent with most of the Paris Declaration
principles indicated above. In general, the inflow of development assistance has supported Ethiopia’s
priority programs and strategies and thereby also the rapid and inclusive development registered over the last
three years. The ODA per capita to Ethiopia was about USD 34, which is much lower than the average ODA
per capita for Sub-Saharan African countries of about USD 54. Thus increased development assistance both
in terms of quantity and quality could help sustain the gains made in all fronts in Ethiopia over the last
several years.
1.6.3 Debt Management
Loan Disbursement: A total of USD 6.4 billion has been disbursed as external loans to finance various
development programs over the first three GTP years. A disaggregation of the loan disbursements indicate
that USD 3.4 billion of the disbursed loans were that of the central government loan, while USD 1.2 billion
was government guaranteed public enterprise loan. In addition, USD 1.9 billion of the loan disbursements
were non-guaranteed payments to finance various development programs.
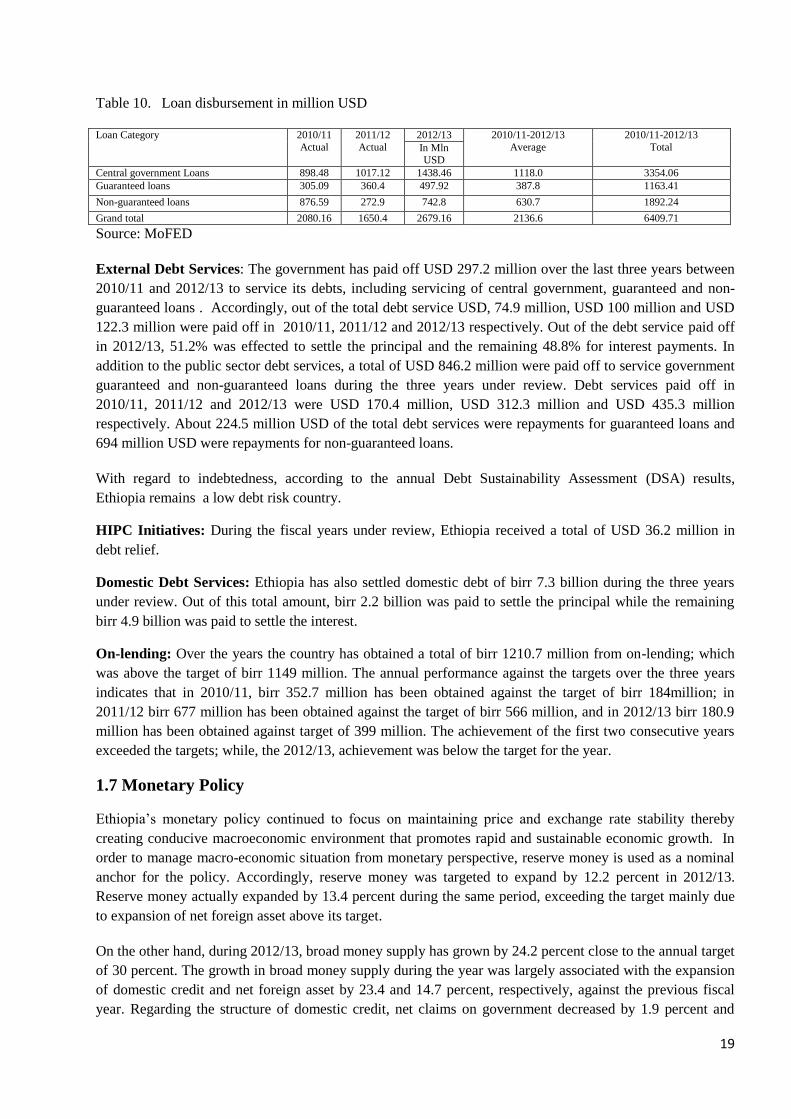
19
Table 10. Loan disbursement in million USD
Loan Category 2010/11
Actual
2011/12
Actual
2012/13 2010/11-2012/13
Average
2010/11-2012/13
Total In Mln USD
Central government Loans 898.48 1017.12 1438.46 1118.0 3354.06
Guaranteed loans 305.09 360.4 497.92 387.8 1163.41
Non-guaranteed loans 876.59 272.9 742.8 630.7 1892.24
Grand total 2080.16 1650.4 2679.16 2136.6 6409.71
Source: MoFED
External Debt Services: The government has paid off USD 297.2 million over the last three years between
2010/11 and 2012/13 to service its debts, including servicing of central government, guaranteed and non-
guaranteed loans . Accordingly, out of the total debt service USD, 74.9 million, USD 100 million and USD
122.3 million were paid off in 2010/11, 2011/12 and 2012/13 respectively. Out of the debt service paid off
in 2012/13, 51.2% was effected to settle the principal and the remaining 48.8% for interest payments. In
addition to the public sector debt services, a total of USD 846.2 million were paid off to service government
guaranteed and non-guaranteed loans during the three years under review. Debt services paid off in
2010/11, 2011/12 and 2012/13 were USD 170.4 million, USD 312.3 million and USD 435.3 million
respectively. About 224.5 million USD of the total debt services were repayments for guaranteed loans and
694 million USD were repayments for non-guaranteed loans.
With regard to indebtedness, according to the annual Debt Sustainability Assessment (DSA) results,
Ethiopia remains a low debt risk country.
HIPC Initiatives: During the fiscal years under review, Ethiopia received a total of USD 36.2 million in
debt relief.
Domestic Debt Services: Ethiopia has also settled domestic debt of birr 7.3 billion during the three years
under review. Out of this total amount, birr 2.2 billion was paid to settle the principal while the remaining
birr 4.9 billion was paid to settle the interest.
On-lending: Over the years the country has obtained a total of birr 1210.7 million from on-lending; which
was above the target of birr 1149 million. The annual performance against the targets over the three years
indicates that in 2010/11, birr 352.7 million has been obtained against the target of birr 184million; in
2011/12 birr 677 million has been obtained against the target of birr 566 million, and in 2012/13 birr 180.9
million has been obtained against target of 399 million. The achievement of the first two consecutive years
exceeded the targets; while, the 2012/13, achievement was below the target for the year.
1.7 Monetary Policy
Ethiopia’s monetary policy continued to focus on maintaining price and exchange rate stability thereby
creating conducive macroeconomic environment that promotes rapid and sustainable economic growth. In
order to manage macro-economic situation from monetary perspective, reserve money is used as a nominal
anchor for the policy. Accordingly, reserve money was targeted to expand by 12.2 percent in 2012/13.
Reserve money actually expanded by 13.4 percent during the same period, exceeding the target mainly due
to expansion of net foreign asset above its target.
On the other hand, during 2012/13, broad money supply has grown by 24.2 percent close to the annual target
of 30 percent. The growth in broad money supply during the year was largely associated with the expansion
of domestic credit and net foreign asset by 23.4 and 14.7 percent, respectively, against the previous fiscal
year. Regarding the structure of domestic credit, net claims on government decreased by 1.9 percent and
20
credit to non-government sector expanded by 26.2 percent. These developments clearly reflect that the
ongoing policy direction has encouraged the private sector to continue as an engine of the country’s
economic growth.
As one of its monetary policy instruments, the National Bank of Ethiopia continued selling T-bills mainly to
mobilize non-inflationary resources to finance government budget deficit and for monetary policy purpose.
Accordingly, in 2012/13, the amount of T-bills offered for the fortnightly auction market amounted to birr
107.5 billion. The amount of T-bills sold, on the other hand, was birr 109.2 billion, which is higher than the
performance during the previous fiscal year by 46.2 percent . Out of the total T-bills sold in the fiscal year,
the share of non-banks and commercial banks was 52.8 percent and 47.2 percent, respectively. As a result,
the share of commercial banks is scaled up by 112.7 percent compared to that of the previous fiscal year.
1.7.1 Interest Rate Development
During the 2012/13 fiscal year, the minimum, average and maximum interest rates on savings were 5
percent, 5.38 percent and 5.75 percent, respectively. Accordingly, on average the real interest rate was about
negative 2 percent . On the other hand, the minimum and the maximum lending rate of commercial banks
stood at 7.5 and 16.25 percent, respectively. As a result, the average lending rate became 11.9 percent.
1.7.2 Financial System
The aim of the financial system during the GTP period has been establishing an accessible, efficient and
competitive financial system. In relation to this, emphasis has been given to strengthen modern payment and
settlement system, develop access to financial services, supporting the bank system with modern technology
and extending the information exchange system to microfinance institutions, among others. Accordingly, the
NBE has undertaken various measures in order to realize GTP targets. These includes, improving the
coverage and quality of the financial services, minimizing non-performing loans, expansion and
improvement of modern Information and Technology system in the finance industry, introduction of cards
and mobile banking services, and credit information system.
Improvements in the financial sector promote economic growth through facilitating payment and exchange
systems as well as mobilizing and channeling scarce financial resources to efficient users. In 2012/13,
encouraging developments have been observed in financial services and in improving efficiency of banks.
For instance, in line with the 5 percent limit on non-performing loan (NPL) of commercial banks set by the
NBE effective from June 2010, the NPL of banks as a percent of total loans went down to 3.4 in 2012/13,
reflecting improvement in loan quality of banks.
In 2012/13, there were 19banks operating in the industry , of which 16 banks were owned by the private
sector while the remaining three banks were owned by government. The number of bank branches has also
registered a substantial improvement in the 2012/13 fiscal year. The banking system has opened a total of
438 new branches in 2012/13 alone, with growth rate of 34.1 percent compared to the previous year.
Henceforth, the total number of bank branches has increased to 1724 by the end of the review period.
Similarly, the ratio of population to bank branches declined to 49,819 in 2012/13 from 66,096 in 2011/12,
reflecting an encouraging performance in financial service outreach. However, the achievement still remains
far below the sub Saharan average of 29,1142 adults per branch in 2010/11.
The amount of new loans disbursed (including corporate bond purchases) was birr 76.1 billion, down by 4.4
percent compared to previous year. CLoan disbursed to domestic and international trade and agriculture
2 WDI 2011
21
decreased by 14.7 and 31.5 percent, respectively compared to disbursements last year. However, loan
disbursements to industry and housing and construction sectors have increased by 16.9 and 30.6 percent
respectively. The industry sector was the largest beneficiary by taking 25.4 percent of the disbursement.
While, mines, power and water together accounted for 21.4 percent, domestic and international trade
accounted for 18.8 percent of the disbursements in 2012/13. Housing and construction accounted for 15.8
percent and agriculture took 12.8 percent of the total fresh loans disbursed in the fiscal year.
Loan collection by the banking system also increased by 24.6 percent annually and reached birr 46 billion.
By the end of 2012/13 fiscal year, outstanding loan (including corporate bonds) of the banking system
reached birr 215.3 billion, indicating an annual growth of 25.2 percent. About 30.3 percent of the
outstanding loans was owed by mines, power and water sector, while 22.6 percent, 19.4 percent and 14
percent of the outstanding credit were owed by industry, domestic and international trade, and housing and
construction respectively.
The fiscal year also witnessed improvement in the banking sector in terms of capital accumulation and
deposit mobilization. Accordingly, the total bank capital during the year was birr 23.5 billion, signifying an
increase of 30.5 percent compared to that of the previous fiscal year. Similarly, total deposits mobilized by
commercial banks surged by 26.6 percent, and reached birr 237.1 billion. Of the total deposit, demand
deposit constituted 49 percent while savings and time deposits constitute 44.7 and 6.3 percent, respectively.
Similarly, Micro-Finance Institutions (MFIs) have recorded strong performance during the fiscal year.
Accordingly, their capital has increased to birr 4.3 billion from birr 3.8 billion in 2011/12, showing a growth
rate of 22.8 percent. The stock of total loans extended by MFIs also grew from birr 9.3 billion in 2011/12
and to birr 10.7 billion in 2012/13. The amount of savings mobilized by these institutions rose from birr 5.5
billion in 2011/12 to birr 6.9 billion 2012/13.
1.7.3 Modernization of the National Payment System
In order to increase the provision and access to financial services, as per the targets stated under GTP, the
National Bank of Ethiopia is undertaking various initiatives to modernize the national payment system. In
line with, the bank has implemented an interbank payment system which handles both high value time
critical and low value bulk payments. The system is facilitating online fund transfers since 2011. The
National Bank of Ethiopia, all authorized commercial banks and Ethiopian Commodity Exchange are linked
to the central system and participating in the process.
Banks are also working towards automating their internal system by core banking system which enables
them to link their branches with their respective head offices. Most of the banks have implemented the
system and are working to interface it with the central system at the National Bank of Ethiopia. Once it is
completed funds can be transferred electronically among financial institution branches.
1.7.4 External Sector Performance
1.7.4.1 Merchandise Export
As stated in the five year plan of the National Bank of Ethiopia, USD 6.5 billion are expected to be obtained
from export of commodity and USD 16.7 billion will be paid for imported commodities by the end of the
GTP period. However, total merchandise export earnings during 2012/13 amounted to USD 3.1 billion,
depicting 2.5 percent year-on-year decline driven by the fall in volume of exports and decline in the
international commodity prices. Total merchandise export earnings of the fiscal year under review accounted
for 62 percent of the 5 billion USD annual target set in the GTP.
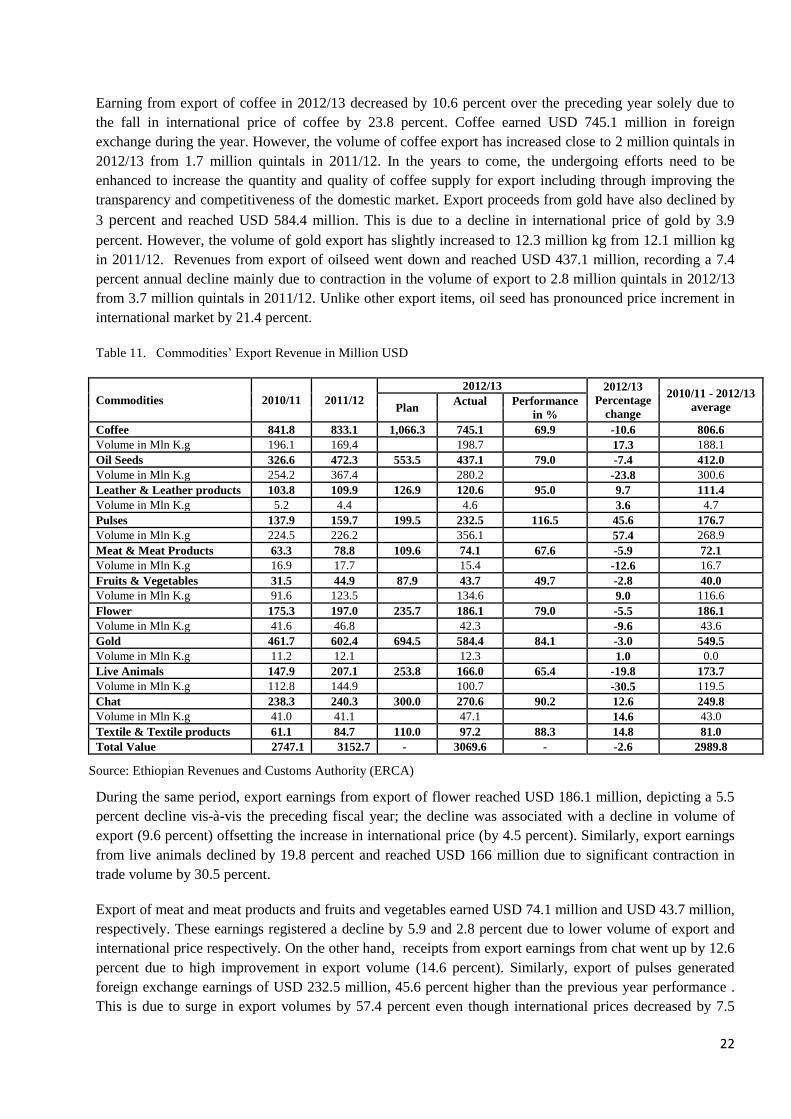
22
Earning from export of coffee in 2012/13 decreased by 10.6 percent over the preceding year solely due to
the fall in international price of coffee by 23.8 percent. Coffee earned USD 745.1 million in foreign
exchange during the year. However, the volume of coffee export has increased close to 2 million quintals in
2012/13 from 1.7 million quintals in 2011/12. In the years to come, the undergoing efforts need to be
enhanced to increase the quantity and quality of coffee supply for export including through improving the
transparency and competitiveness of the domestic market. Export proceeds from gold have also declined by
3 percent and reached USD 584.4 million. This is due to a decline in international price of gold by 3.9
percent. However, the volume of gold export has slightly increased to 12.3 million kg from 12.1 million kg
in 2011/12. Revenues from export of oilseed went down and reached USD 437.1 million, recording a 7.4
percent annual decline mainly due to contraction in the volume of export to 2.8 million quintals in 2012/13
from 3.7 million quintals in 2011/12. Unlike other export items, oil seed has pronounced price increment in
international market by 21.4 percent.
Table 11. Commodities’ Export Revenue in Million USD
Commodities 2010/11 2011/12
2012/13 2012/13
Percentage
change
2010/11 - 2012/13
average Plan Actual Performance
in %
Coffee 841.8 833.1 1,066.3 745.1 69.9 -10.6 806.6
Volume in Mln K.g 196.1 169.4 198.7 17.3 188.1
Oil Seeds 326.6 472.3 553.5 437.1 79.0 -7.4 412.0
Volume in Mln K.g 254.2 367.4 280.2 -23.8 300.6
Leather & Leather products 103.8 109.9 126.9 120.6 95.0 9.7 111.4
Volume in Mln K.g 5.2 4.4 4.6 3.6 4.7
Pulses 137.9 159.7 199.5 232.5 116.5 45.6 176.7
Volume in Mln K.g 224.5 226.2 356.1 57.4 268.9
Meat & Meat Products 63.3 78.8 109.6 74.1 67.6 -5.9 72.1
Volume in Mln K.g 16.9 17.7 15.4 -12.6 16.7
Fruits & Vegetables 31.5 44.9 87.9 43.7 49.7 -2.8 40.0
Volume in Mln K.g 91.6 123.5 134.6 9.0 116.6
Flower 175.3 197.0 235.7 186.1 79.0 -5.5 186.1
Volume in Mln K.g 41.6 46.8 42.3 -9.6 43.6
Gold 461.7 602.4 694.5 584.4 84.1 -3.0 549.5
Volume in Mln K.g 11.2 12.1 12.3 1.0 0.0
Live Animals 147.9 207.1 253.8 166.0 65.4 -19.8 173.7
Volume in Mln K.g 112.8 144.9 100.7 -30.5 119.5
Chat 238.3 240.3 300.0 270.6 90.2 12.6 249.8
Volume in Mln K.g 41.0 41.1 47.1 14.6 43.0
Textile & Textile products 61.1 84.7 110.0 97.2 88.3 14.8 81.0
Total Value 2747.1 3152.7 - 3069.6 - -2.6 2989.8
Source: Ethiopian Revenues and Customs Authority (ERCA)
During the same period, export earnings from export of flower reached USD 186.1 million, depicting a 5.5
percent decline vis-à-vis the preceding fiscal year; the decline was associated with a decline in volume of
export (9.6 percent) offsetting the increase in international price (by 4.5 percent). Similarly, export earnings
from live animals declined by 19.8 percent and reached USD 166 million due to significant contraction in
trade volume by 30.5 percent.
Export of meat and meat products and fruits and vegetables earned USD 74.1 million and USD 43.7 million,
respectively. These earnings registered a decline by 5.9 and 2.8 percent due to lower volume of export and
international price respectively. On the other hand, receipts from export earnings from chat went up by 12.6
percent due to high improvement in export volume (14.6 percent). Similarly, export of pulses generated
foreign exchange earnings of USD 232.5 million, 45.6 percent higher than the previous year performance .
This is due to surge in export volumes by 57.4 percent even though international prices decreased by 7.5
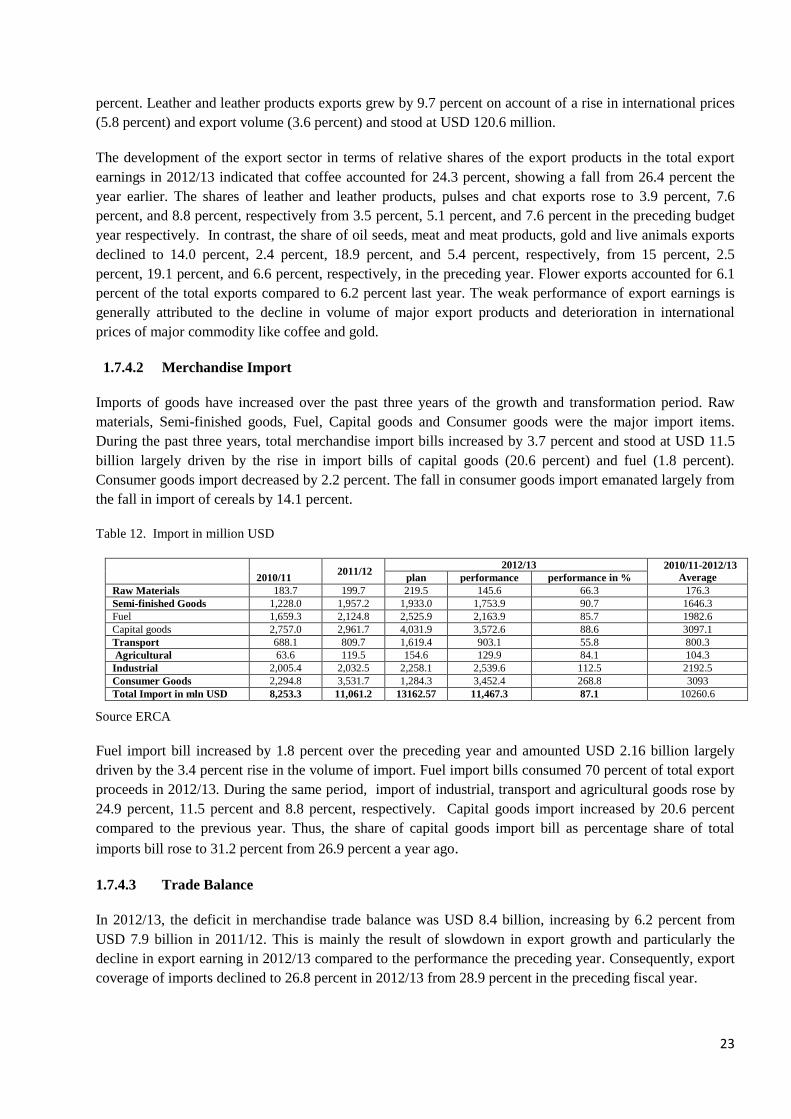
23
percent. Leather and leather products exports grew by 9.7 percent on account of a rise in international prices
(5.8 percent) and export volume (3.6 percent) and stood at USD 120.6 million.
The development of the export sector in terms of relative shares of the export products in the total export
earnings in 2012/13 indicated that coffee accounted for 24.3 percent, showing a fall from 26.4 percent the
year earlier. The shares of leather and leather products, pulses and chat exports rose to 3.9 percent, 7.6
percent, and 8.8 percent, respectively from 3.5 percent, 5.1 percent, and 7.6 percent in the preceding budget
year respectively. In contrast, the share of oil seeds, meat and meat products, gold and live animals exports
declined to 14.0 percent, 2.4 percent, 18.9 percent, and 5.4 percent, respectively, from 15 percent, 2.5
percent, 19.1 percent, and 6.6 percent, respectively, in the preceding year. Flower exports accounted for 6.1
percent of the total exports compared to 6.2 percent last year. The weak performance of export earnings is
generally attributed to the decline in volume of major export products and deterioration in international
prices of major commodity like coffee and gold.
1.7.4.2 Merchandise Import
Imports of goods have increased over the past three years of the growth and transformation period. Raw
materials, Semi-finished goods, Fuel, Capital goods and Consumer goods were the major import items.
During the past three years, total merchandise import bills increased by 3.7 percent and stood at USD 11.5
billion largely driven by the rise in import bills of capital goods (20.6 percent) and fuel (1.8 percent).
Consumer goods import decreased by 2.2 percent. The fall in consumer goods import emanated largely from
the fall in import of cereals by 14.1 percent.
Table 12. Import in million USD
2010/11
2011/12 2012/13 2010/11-2012/13
Average plan performance performance in %
Raw Materials 183.7 199.7 219.5 145.6 66.3 176.3
Semi-finished Goods 1,228.0 1,957.2 1,933.0 1,753.9 90.7 1646.3
Fuel 1,659.3 2,124.8 2,525.9 2,163.9 85.7 1982.6
Capital goods 2,757.0 2,961.7 4,031.9 3,572.6 88.6 3097.1
Transport 688.1 809.7 1,619.4 903.1 55.8 800.3
Agricultural 63.6 119.5 154.6 129.9 84.1 104.3
Industrial 2,005.4 2,032.5 2,258.1 2,539.6 112.5 2192.5
Consumer Goods 2,294.8 3,531.7 1,284.3 3,452.4 268.8 3093
Total Import in mln USD 8,253.3 11,061.2 13162.57 11,467.3 87.1 10260.6
Source ERCA
Fuel import bill increased by 1.8 percent over the preceding year and amounted USD 2.16 billion largely
driven by the 3.4 percent rise in the volume of import. Fuel import bills consumed 70 percent of total export
proceeds in 2012/13. During the same period, import of industrial, transport and agricultural goods rose by
24.9 percent, 11.5 percent and 8.8 percent, respectively. Capital goods import increased by 20.6 percent
compared to the previous year. Thus, the share of capital goods import bill as percentage share of total
imports bill rose to 31.2 percent from 26.9 percent a year ago.
1.7.4.3 Trade Balance
In 2012/13, the deficit in merchandise trade balance was USD 8.4 billion, increasing by 6.2 percent from
USD 7.9 billion in 2011/12. This is mainly the result of slowdown in export growth and particularly the
decline in export earning in 2012/13 compared to the performance the preceding year. Consequently, export
coverage of imports declined to 26.8 percent in 2012/13 from 28.9 percent in the preceding fiscal year.
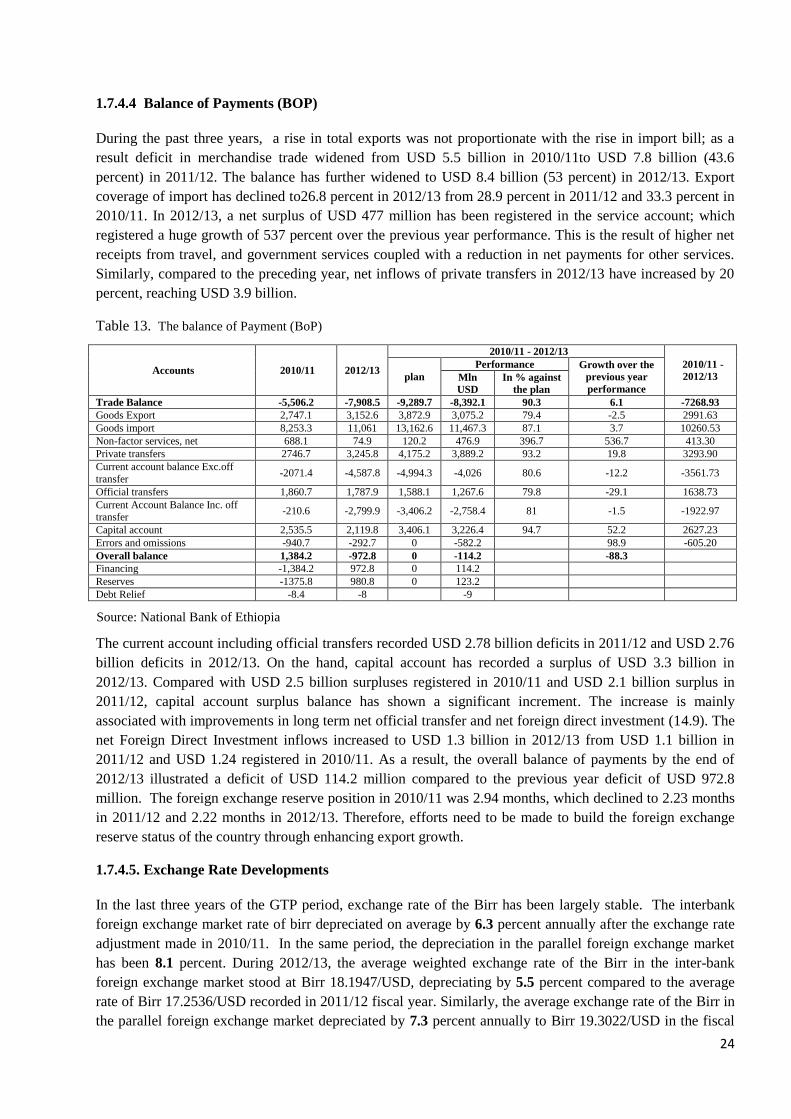
24
1.7.4.4 Balance of Payments (BOP)
During the past three years, a rise in total exports was not proportionate with the rise in import bill; as a
result deficit in merchandise trade widened from USD 5.5 billion in 2010/11to USD 7.8 billion (43.6
percent) in 2011/12. The balance has further widened to USD 8.4 billion (53 percent) in 2012/13. Export
coverage of import has declined to26.8 percent in 2012/13 from 28.9 percent in 2011/12 and 33.3 percent in
2010/11. In 2012/13, a net surplus of USD 477 million has been registered in the service account; which
registered a huge growth of 537 percent over the previous year performance. This is the result of higher net
receipts from travel, and government services coupled with a reduction in net payments for other services.
Similarly, compared to the preceding year, net inflows of private transfers in 2012/13 have increased by 20
percent, reaching USD 3.9 billion.
Table 13. The balance of Payment (BoP)
Accounts 2010/11 2012/13
2010/11 - 2012/13
2010/11 -
2012/13 plan
Performance Growth over the
previous year
performance Mln
USD
In % against
the plan
Trade Balance -5,506.2 -7,908.5 -9,289.7 -8,392.1 90.3 6.1 -7268.93
Goods Export 2,747.1 3,152.6 3,872.9 3,075.2 79.4 -2.5 2991.63
Goods import 8,253.3 11,061 13,162.6 11,467.3 87.1 3.7 10260.53
Non-factor services, net 688.1 74.9 120.2 476.9 396.7 536.7 413.30
Private transfers 2746.7 3,245.8 4,175.2 3,889.2 93.2 19.8 3293.90
Current account balance Exc.off
transfer -2071.4 -4,587.8 -4,994.3 -4,026 80.6 -12.2 -3561.73
Official transfers 1,860.7 1,787.9 1,588.1 1,267.6 79.8 -29.1 1638.73
Current Account Balance Inc. off transfer
-210.6 -2,799.9 -3,406.2 -2,758.4 81 -1.5 -1922.97
Capital account 2,535.5 2,119.8 3,406.1 3,226.4 94.7 52.2 2627.23
Errors and omissions -940.7 -292.7 0 -582.2 98.9 -605.20
Overall balance 1,384.2 -972.8 0 -114.2 -88.3
Financing -1,384.2 972.8 0 114.2
Reserves -1375.8 980.8 0 123.2
Debt Relief -8.4 -8 -9
Source: National Bank of Ethiopia
The current account including official transfers recorded USD 2.78 billion deficits in 2011/12 and USD 2.76
billion deficits in 2012/13. On the hand, capital account has recorded a surplus of USD 3.3 billion in
2012/13. Compared with USD 2.5 billion surpluses registered in 2010/11 and USD 2.1 billion surplus in
2011/12, capital account surplus balance has shown a significant increment. The increase is mainly
associated with improvements in long term net official transfer and net foreign direct investment (14.9). The
net Foreign Direct Investment inflows increased to USD 1.3 billion in 2012/13 from USD 1.1 billion in
2011/12 and USD 1.24 registered in 2010/11. As a result, the overall balance of payments by the end of
2012/13 illustrated a deficit of USD 114.2 million compared to the previous year deficit of USD 972.8
million. The foreign exchange reserve position in 2010/11 was 2.94 months, which declined to 2.23 months
in 2011/12 and 2.22 months in 2012/13. Therefore, efforts need to be made to build the foreign exchange
reserve status of the country through enhancing export growth.
1.7.4.5. Exchange Rate Developments
In the last three years of the GTP period, exchange rate of the Birr has been largely stable. The interbank
foreign exchange market rate of birr depreciated on average by 6.3 percent annually after the exchange rate
adjustment made in 2010/11. In the same period, the depreciation in the parallel foreign exchange market
has been 8.1 percent. During 2012/13, the average weighted exchange rate of the Birr in the inter-bank
foreign exchange market stood at Birr 18.1947/USD, depreciating by 5.5 percent compared to the average
rate of Birr 17.2536/USD recorded in 2011/12 fiscal year. Similarly, the average exchange rate of the Birr in
the parallel foreign exchange market depreciated by 7.3 percent annually to Birr 19.3022/USD in the fiscal
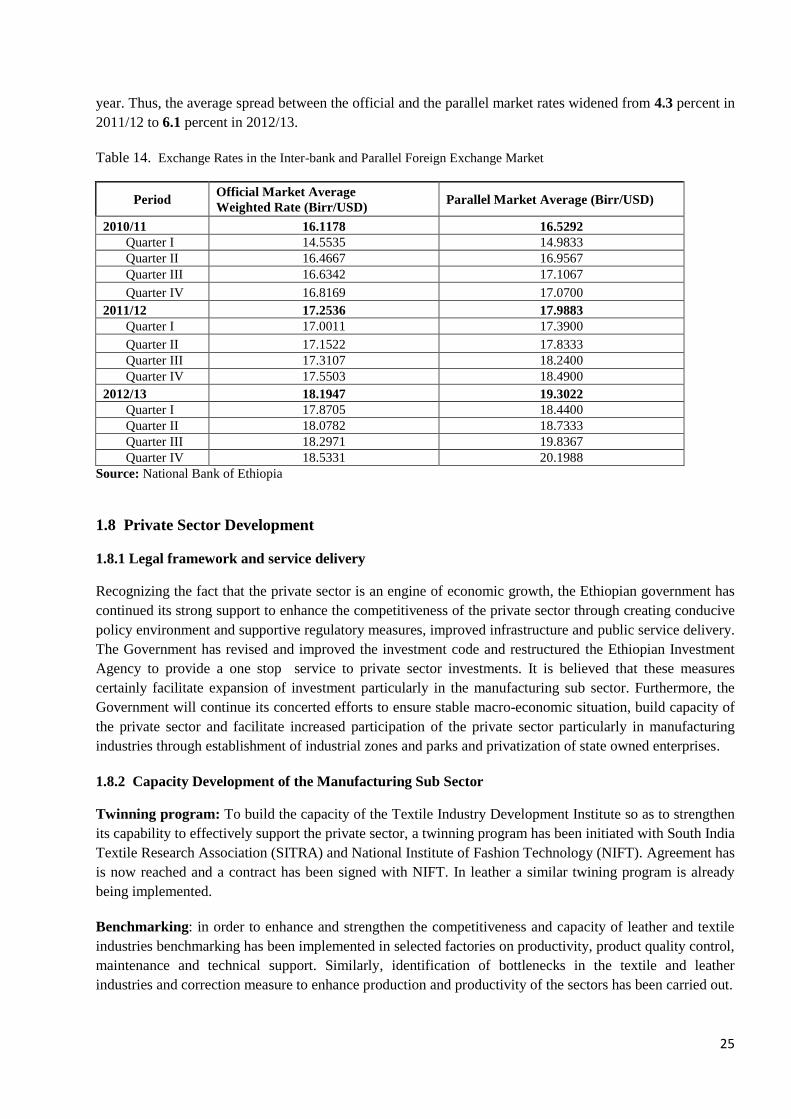
25
year. Thus, the average spread between the official and the parallel market rates widened from 4.3 percent in
2011/12 to 6.1 percent in 2012/13.
Table 14. Exchange Rates in the Inter-bank and Parallel Foreign Exchange Market
Period Official Market Average
Weighted Rate (Birr/USD) Parallel Market Average (Birr/USD)
2010/11 16.1178 16.5292
Quarter I 14.5535 14.9833
Quarter II 16.4667 16.9567
Quarter III 16.6342 17.1067
Quarter IV 16.8169 17.0700
2011/12 17.2536 17.9883
Quarter I 17.0011 17.3900
Quarter II 17.1522 17.8333
Quarter III 17.3107 18.2400
Quarter IV 17.5503 18.4900
2012/13 18.1947 19.3022
Quarter I 17.8705 18.4400
Quarter II 18.0782 18.7333
Quarter III 18.2971 19.8367
Quarter IV 18.5331 20.1988
Source: National Bank of Ethiopia
1.8 Private Sector Development
1.8.1 Legal framework and service delivery
Recognizing the fact that the private sector is an engine of economic growth, the Ethiopian government has
continued its strong support to enhance the competitiveness of the private sector through creating conducive
policy environment and supportive regulatory measures, improved infrastructure and public service delivery.
The Government has revised and improved the investment code and restructured the Ethiopian Investment
Agency to provide a one stop service to private sector investments. It is believed that these measures
certainly facilitate expansion of investment particularly in the manufacturing sub sector. Furthermore, the
Government will continue its concerted efforts to ensure stable macro-economic situation, build capacity of
the private sector and facilitate increased participation of the private sector particularly in manufacturing
industries through establishment of industrial zones and parks and privatization of state owned enterprises.
1.8.2 Capacity Development of the Manufacturing Sub Sector
Twinning program: To build the capacity of the Textile Industry Development Institute so as to strengthen
its capability to effectively support the private sector, a twinning program has been initiated with South India
Textile Research Association (SITRA) and National Institute of Fashion Technology (NIFT). Agreement has
is now reached and a contract has been signed with NIFT. In leather a similar twining program is already
being implemented.
Benchmarking: in order to enhance and strengthen the competitiveness and capacity of leather and textile
industries benchmarking has been implemented in selected factories on productivity, product quality control,
maintenance and technical support. Similarly, identification of bottlenecks in the textile and leather
industries and correction measure to enhance production and productivity of the sectors has been carried out.
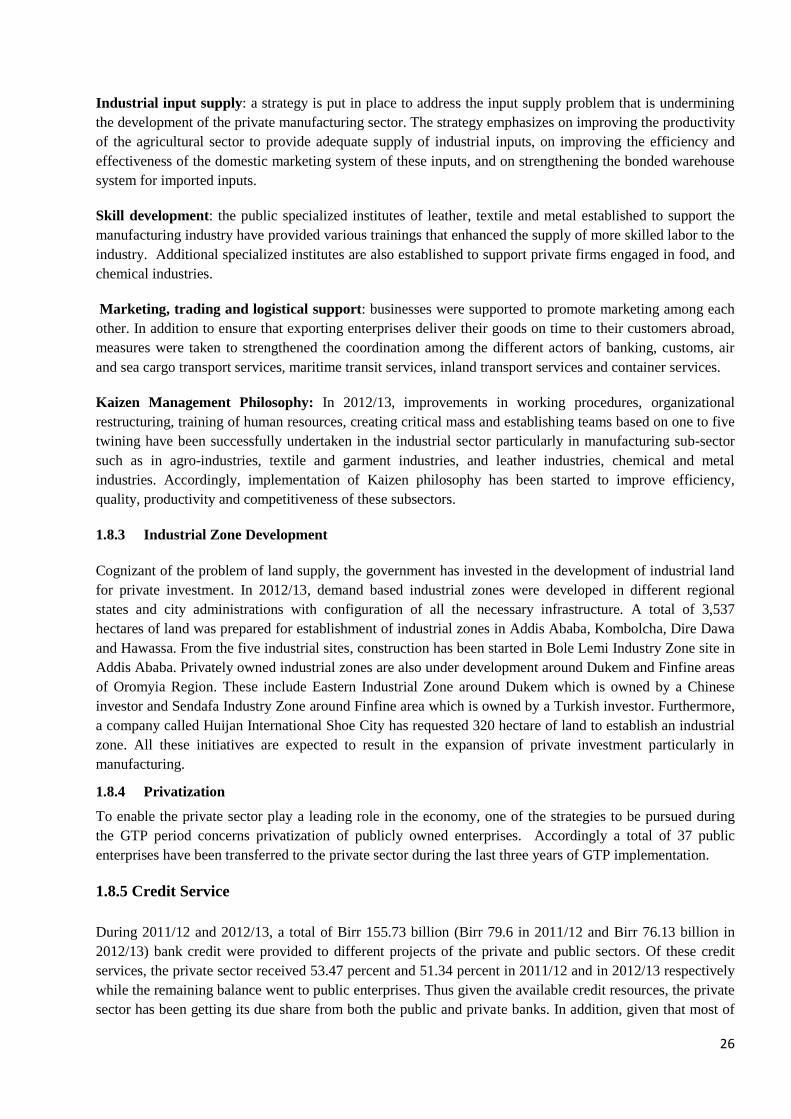
26
Industrial input supply: a strategy is put in place to address the input supply problem that is undermining
the development of the private manufacturing sector. The strategy emphasizes on improving the productivity
of the agricultural sector to provide adequate supply of industrial inputs, on improving the efficiency and
effectiveness of the domestic marketing system of these inputs, and on strengthening the bonded warehouse
system for imported inputs.
Skill development: the public specialized institutes of leather, textile and metal established to support the
manufacturing industry have provided various trainings that enhanced the supply of more skilled labor to the
industry. Additional specialized institutes are also established to support private firms engaged in food, and
chemical industries.
Marketing, trading and logistical support: businesses were supported to promote marketing among each
other. In addition to ensure that exporting enterprises deliver their goods on time to their customers abroad,
measures were taken to strengthened the coordination among the different actors of banking, customs, air
and sea cargo transport services, maritime transit services, inland transport services and container services.
Kaizen Management Philosophy: In 2012/13, improvements in working procedures, organizational
restructuring, training of human resources, creating critical mass and establishing teams based on one to five
twining have been successfully undertaken in the industrial sector particularly in manufacturing sub-sector
such as in agro-industries, textile and garment industries, and leather industries, chemical and metal
industries. Accordingly, implementation of Kaizen philosophy has been started to improve efficiency,
quality, productivity and competitiveness of these subsectors.
1.8.3 Industrial Zone Development
Cognizant of the problem of land supply, the government has invested in the development of industrial land
for private investment. In 2012/13, demand based industrial zones were developed in different regional
states and city administrations with configuration of all the necessary infrastructure. A total of 3,537
hectares of land was prepared for establishment of industrial zones in Addis Ababa, Kombolcha, Dire Dawa
and Hawassa. From the five industrial sites, construction has been started in Bole Lemi Industry Zone site in
Addis Ababa. Privately owned industrial zones are also under development around Dukem and Finfine areas
of Oromyia Region. These include Eastern Industrial Zone around Dukem which is owned by a Chinese
investor and Sendafa Industry Zone around Finfine area which is owned by a Turkish investor. Furthermore,
a company called Huijan International Shoe City has requested 320 hectare of land to establish an industrial
zone. All these initiatives are expected to result in the expansion of private investment particularly in
manufacturing.
1.8.4 Privatization
To enable the private sector play a leading role in the economy, one of the strategies to be pursued during
the GTP period concerns privatization of publicly owned enterprises. Accordingly a total of 37 public
enterprises have been transferred to the private sector during the last three years of GTP implementation.
1.8.5 Credit Service
During 2011/12 and 2012/13, a total of Birr 155.73 billion (Birr 79.6 in 2011/12 and Birr 76.13 billion in
2012/13) bank credit were provided to different projects of the private and public sectors. Of these credit
services, the private sector received 53.47 percent and 51.34 percent in 2011/12 and in 2012/13 respectively
while the remaining balance went to public enterprises. Thus given the available credit resources, the private
sector has been getting its due share from both the public and private banks. In addition, given that most of
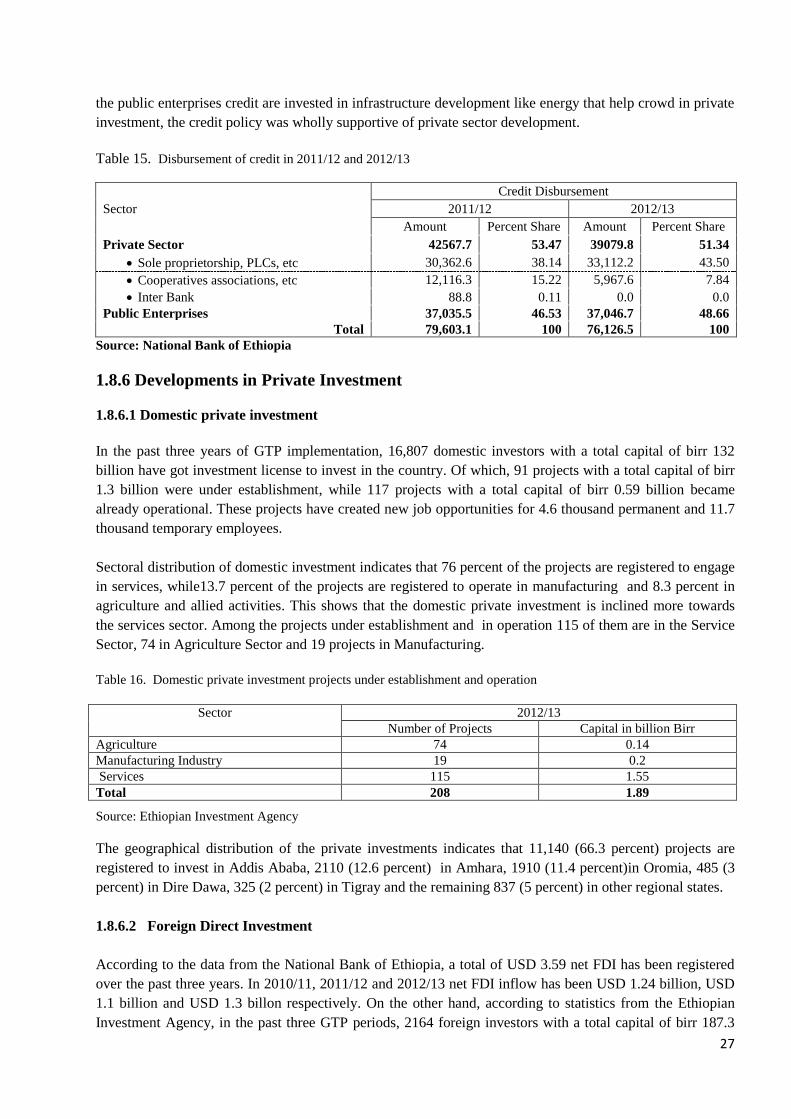
27
the public enterprises credit are invested in infrastructure development like energy that help crowd in private
investment, the credit policy was wholly supportive of private sector development.
Table 15. Disbursement of credit in 2011/12 and 2012/13
Sector
Credit Disbursement
2011/12 2012/13
Amount Percent Share Amount Percent Share
Private Sector 42567.7 53.47 39079.8 51.34
Sole proprietorship, PLCs, etc 30,362.6 38.14 33,112.2 43.50
Cooperatives associations, etc 12,116.3 15.22 5,967.6 7.84
Inter Bank 88.8 0.11 0.0 0.0
Public Enterprises 37,035.5 46.53 37,046.7 48.66
Total 79,603.1 100 76,126.5 100
Source: National Bank of Ethiopia
1.8.6 Developments in Private Investment
1.8.6.1 Domestic private investment
In the past three years of GTP implementation, 16,807 domestic investors with a total capital of birr 132
billion have got investment license to invest in the country. Of which, 91 projects with a total capital of birr
1.3 billion were under establishment, while 117 projects with a total capital of birr 0.59 billion became
already operational. These projects have created new job opportunities for 4.6 thousand permanent and 11.7
thousand temporary employees.
Sectoral distribution of domestic investment indicates that 76 percent of the projects are registered to engage
in services, while13.7 percent of the projects are registered to operate in manufacturing and 8.3 percent in
agriculture and allied activities. This shows that the domestic private investment is inclined more towards
the services sector. Among the projects under establishment and in operation 115 of them are in the Service
Sector, 74 in Agriculture Sector and 19 projects in Manufacturing.
Table 16. Domestic private investment projects under establishment and operation
Sector 2012/13
Number of Projects Capital in billion Birr
Agriculture 74 0.14
Manufacturing Industry 19 0.2
Services 115 1.55
Total 208 1.89
Source: Ethiopian Investment Agency
The geographical distribution of the private investments indicates that 11,140 (66.3 percent) projects are
registered to invest in Addis Ababa, 2110 (12.6 percent) in Amhara, 1910 (11.4 percent)in Oromia, 485 (3
percent) in Dire Dawa, 325 (2 percent) in Tigray and the remaining 837 (5 percent) in other regional states.
1.8.6.2 Foreign Direct Investment
According to the data from the National Bank of Ethiopia, a total of USD 3.59 net FDI has been registered
over the past three years. In 2010/11, 2011/12 and 2012/13 net FDI inflow has been USD 1.24 billion, USD
1.1 billion and USD 1.3 billon respectively. On the other hand, according to statistics from the Ethiopian
Investment Agency, in the past three GTP periods, 2164 foreign investors with a total capital of birr 187.3
28
billion have got investment license to invest across all regions and city administrations. Of these, 133
projects with total capital of birr 21.5 billion were under establishment while the remaining 637 projects
with total capital of birr 28.3 billion have started operation. These projects are reported to have created new
job opportunities for 26 thousand permanent and 35 thousand temporary employees.
Sectoral distribution of the licensed foreign direct investments indicates, 423 (19.5 percent) projects are
registered to engage in agriculture and related activities, while, 888 (41 percent) projects are registered to
produce manufacturing products and the remaining 855 (40 percent) projects are licensed to engage in
agriculture. The fact that 41 percent and 40 percent of foreign investors are registered to invest in
manufacturing and service sectors respectively in starkly contrast with the intentions of domestic investors
where 76 percent of them are licensed to operate in the service sector.
Investors from Peoples Republic of China constitute for the highest number of foreign investors investing on
322 projects followed by investors from Sudan and India who have acquired licenses to invest on 310 and
180 projects respectively. Turkey and Ethiopian Diaspora from America took the 4th and 5
th place through
investing on 98 and 81 projects, respectively. However, with regard to the amount of capital invested in the
economy, Turkey, India, Sudan, Peoples Republic of China, Saudi Arabia and Joint investment by Ethiopian
and Saudi Arabia constitute the top five investors in that order.
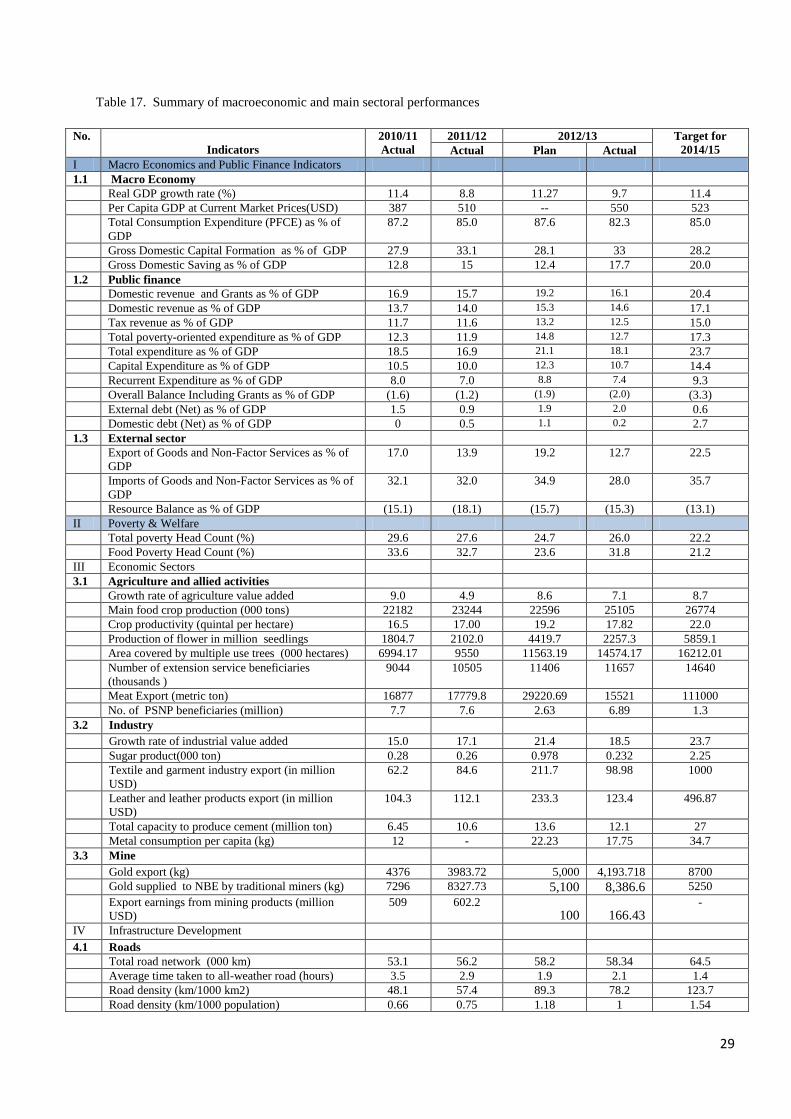
29
Table 17. Summary of macroeconomic and main sectoral performances
No.
Indicators
2010/11
Actual
2011/12 2012/13 Target for
2014/15 Actual Plan Actual
I Macro Economics and Public Finance Indicators
1.1 Macro Economy
Real GDP growth rate (%) 11.4 8.8 11.27 9.7 11.4
Per Capita GDP at Current Market Prices(USD) 387 510 -- 550 523
Total Consumption Expenditure (PFCE) as % of
GDP
87.2 85.0 87.6 82.3 85.0
Gross Domestic Capital Formation as % of GDP 27.9 33.1 28.1 33 28.2
Gross Domestic Saving as % of GDP 12.8 15 12.4 17.7 20.0
1.2 Public finance
Domestic revenue and Grants as % of GDP 16.9 15.7 19.2 16.1 20.4
Domestic revenue as % of GDP 13.7 14.0 15.3 14.6 17.1
Tax revenue as % of GDP 11.7 11.6 13.2 12.5 15.0
Total poverty-oriented expenditure as % of GDP 12.3 11.9 14.8 12.7 17.3
Total expenditure as % of GDP 18.5 16.9 21.1 18.1 23.7
Capital Expenditure as % of GDP 10.5 10.0 12.3 10.7 14.4
Recurrent Expenditure as % of GDP 8.0 7.0 8.8 7.4 9.3
Overall Balance Including Grants as % of GDP (1.6) (1.2) (1.9) (2.0) (3.3)
External debt (Net) as % of GDP 1.5 0.9 1.9 2.0 0.6
Domestic debt (Net) as % of GDP 0 0.5 1.1 0.2 2.7
1.3 External sector
Export of Goods and Non-Factor Services as % of
GDP
17.0 13.9 19.2 12.7 22.5
Imports of Goods and Non-Factor Services as % of
GDP
32.1 32.0 34.9 28.0 35.7
Resource Balance as % of GDP (15.1) (18.1) (15.7) (15.3) (13.1)
II Poverty & Welfare
Total poverty Head Count (%) 29.6 27.6 24.7 26.0 22.2
Food Poverty Head Count (%) 33.6 32.7 23.6 31.8 21.2
III Economic Sectors
3.1 Agriculture and allied activities
Growth rate of agriculture value added 9.0 4.9 8.6 7.1 8.7
Main food crop production (000 tons) 22182 23244 22596 25105 26774
Crop productivity (quintal per hectare) 16.5 17.00 19.2 17.82 22.0
Production of flower in million seedlings 1804.7 2102.0 4419.7 2257.3 5859.1
Area covered by multiple use trees (000 hectares) 6994.17 9550 11563.19 14574.17 16212.01
Number of extension service beneficiaries
(thousands )
9044 10505 11406 11657 14640
Meat Export (metric ton) 16877 17779.8 29220.69 15521 111000
No. of PSNP beneficiaries (million) 7.7 7.6 2.63 6.89 1.3
3.2 Industry
Growth rate of industrial value added 15.0 17.1 21.4 18.5 23.7
Sugar product(000 ton) 0.28 0.26 0.978 0.232 2.25
Textile and garment industry export (in million
USD)
62.2 84.6 211.7 98.98 1000
Leather and leather products export (in million
USD)
104.3 112.1 233.3 123.4 496.87
Total capacity to produce cement (million ton) 6.45 10.6 13.6 12.1 27
Metal consumption per capita (kg) 12 - 22.23 17.75 34.7
3.3 Mine
Gold export (kg) 4376 3983.72 5,000 4,193.718 8700
Gold supplied to NBE by traditional miners (kg) 7296 8327.73 5,100 8,386.6 5250
Export earnings from mining products (million
USD)
509 602.2 100 166.43
-
IV Infrastructure Development
4.1 Roads
Total road network (000 km) 53.1 56.2 58.2 58.34 64.5
Average time taken to all-weather road (hours) 3.5 2.9 1.9 2.1 1.4
Road density (km/1000 km2) 48.1 57.4 89.3 78.2 123.7
Road density (km/1000 population) 0.66 0.75 1.18 1 1.54
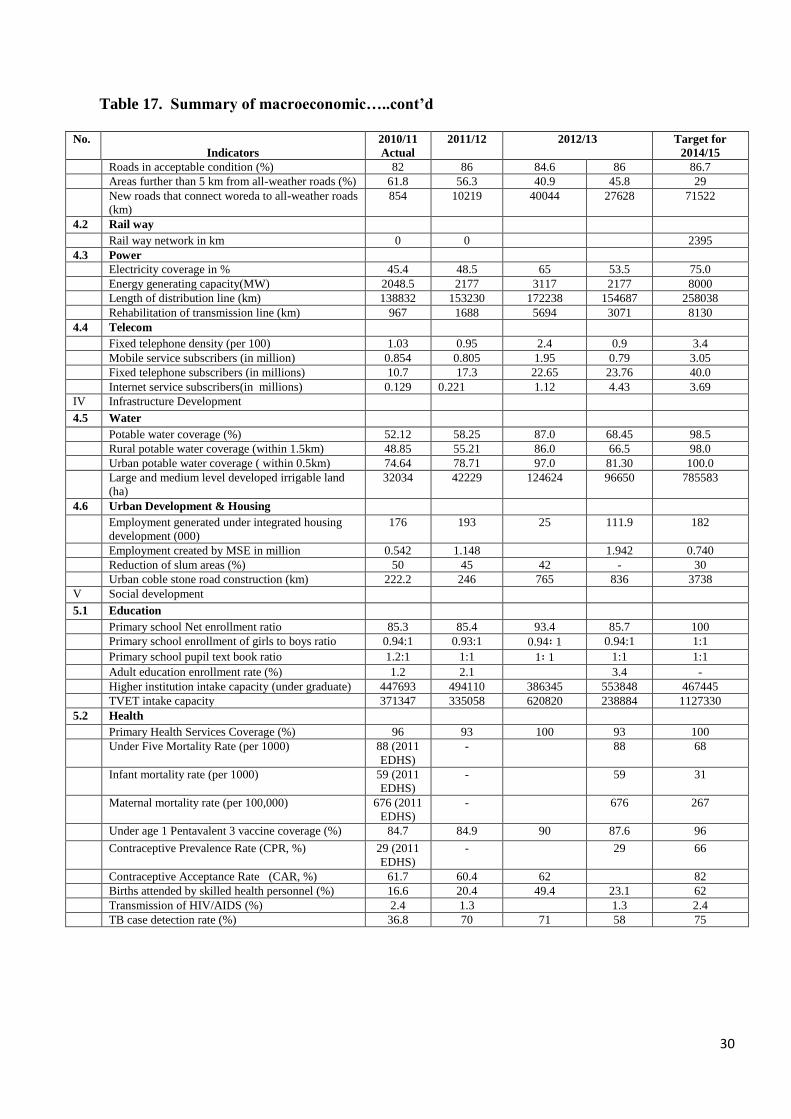
30
Table 17. Summary of macroeconomic…..cont’d
No.
Indicators
2010/11
Actual
2011/12 2012/13 Target for
2014/15
Roads in acceptable condition (%) 82 86 84.6 86 86.7
Areas further than 5 km from all-weather roads (%) 61.8 56.3 40.9 45.8 29
New roads that connect woreda to all-weather roads
(km)
854 10219 40044 27628 71522
4.2 Rail way
Rail way network in km 0 0 2395
4.3 Power
Electricity coverage in % 45.4 48.5 65 53.5 75.0
Energy generating capacity(MW) 2048.5 2177 3117 2177 8000
Length of distribution line (km) 138832 153230 172238 154687 258038
Rehabilitation of transmission line (km) 967 1688 5694 3071 8130
4.4 Telecom
Fixed telephone density (per 100) 1.03 0.95 2.4 0.9 3.4
Mobile service subscribers (in million) 0.854 0.805 1.95 0.79 3.05
Fixed telephone subscribers (in millions) 10.7 17.3 22.65 23.76 40.0
Internet service subscribers(in millions) 0.129 0.221 1.12 4.43 3.69
IV Infrastructure Development
4.5 Water
Potable water coverage (%) 52.12 58.25 87.0 68.45 98.5
Rural potable water coverage (within 1.5km) 48.85 55.21 86.0 66.5 98.0
Urban potable water coverage ( within 0.5km) 74.64 78.71 97.0 81.30 100.0
Large and medium level developed irrigable land
(ha)
32034 42229 124624 96650 785583
4.6 Urban Development & Housing
Employment generated under integrated housing
development (000)
176 193 25 111.9 182
Employment created by MSE in million 0.542 1.148 1.942 0.740
Reduction of slum areas (%) 50 45 42 - 30
Urban coble stone road construction (km) 222.2 246 765 836 3738
V Social development
5.1 Education
Primary school Net enrollment ratio 85.3 85.4 93.4 85.7 100
Primary school enrollment of girls to boys ratio 0.94:1 0.93:1 0.94፡ 1 0.94:1 1:1
Primary school pupil text book ratio 1.2:1 1:1 1፡ 1 1:1 1:1
Adult education enrollment rate (%) 1.2 2.1 3.4 -
Higher institution intake capacity (under graduate) 447693 494110 386345 553848 467445
TVET intake capacity 371347 335058 620820 238884 1127330
5.2 Health
Primary Health Services Coverage (%) 96 93 100 93 100
Under Five Mortality Rate (per 1000) 88 (2011
EDHS)
- 88 68
Infant mortality rate (per 1000) 59 (2011
EDHS)
- 59 31
Maternal mortality rate (per 100,000) 676 (2011
EDHS)
- 676 267
Under age 1 Pentavalent 3 vaccine coverage (%) 84.7 84.9 90 87.6 96
Contraceptive Prevalence Rate (CPR, %) 29 (2011
EDHS)
- 29 66
Contraceptive Acceptance Rate (CAR, %) 61.7 60.4 62 82
Births attended by skilled health personnel (%) 16.6 20.4 49.4 23.1 62
Transmission of HIV/AIDS (%) 2.4 1.3 1.3 2.4
TB case detection rate (%) 36.8 70 71 58 75
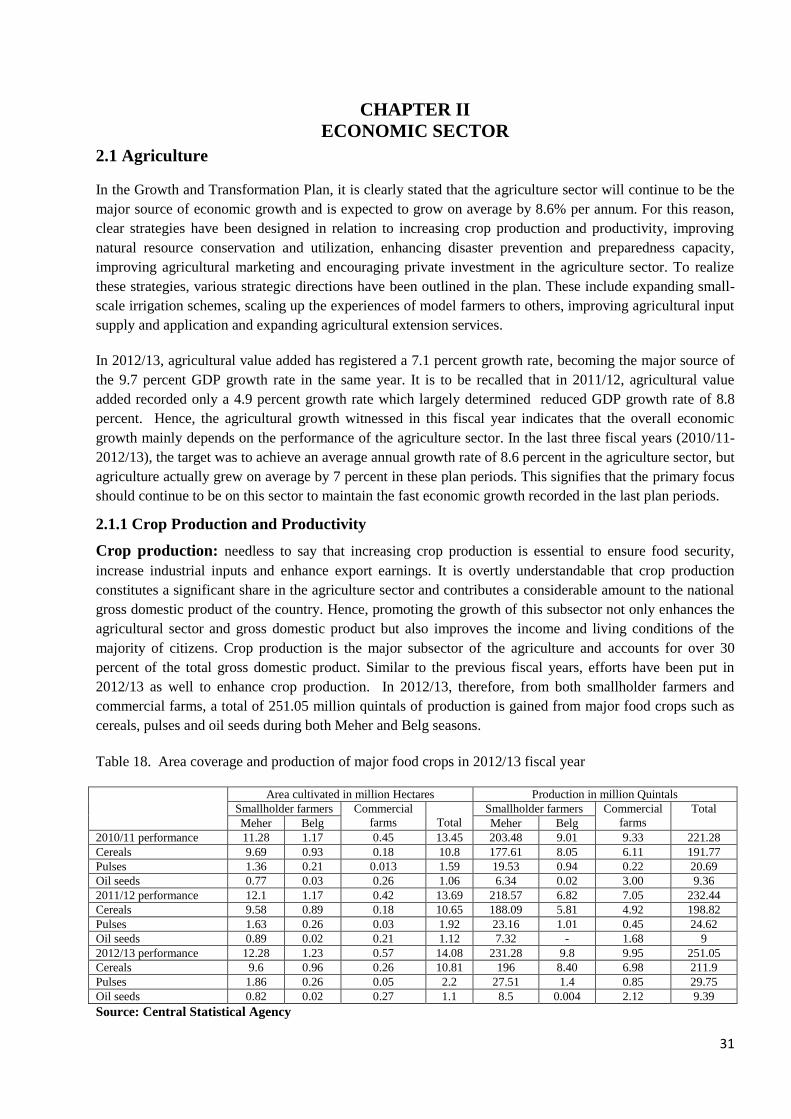
31
CHAPTER II
ECONOMIC SECTOR
2.1 Agriculture
In the Growth and Transformation Plan, it is clearly stated that the agriculture sector will continue to be the
major source of economic growth and is expected to grow on average by 8.6% per annum. For this reason,
clear strategies have been designed in relation to increasing crop production and productivity, improving
natural resource conservation and utilization, enhancing disaster prevention and preparedness capacity,
improving agricultural marketing and encouraging private investment in the agriculture sector. To realize
these strategies, various strategic directions have been outlined in the plan. These include expanding small-
scale irrigation schemes, scaling up the experiences of model farmers to others, improving agricultural input
supply and application and expanding agricultural extension services.
In 2012/13, agricultural value added has registered a 7.1 percent growth rate, becoming the major source of
the 9.7 percent GDP growth rate in the same year. It is to be recalled that in 2011/12, agricultural value
added recorded only a 4.9 percent growth rate which largely determined reduced GDP growth rate of 8.8
percent. Hence, the agricultural growth witnessed in this fiscal year indicates that the overall economic
growth mainly depends on the performance of the agriculture sector. In the last three fiscal years (2010/11-
2012/13), the target was to achieve an average annual growth rate of 8.6 percent in the agriculture sector, but
agriculture actually grew on average by 7 percent in these plan periods. This signifies that the primary focus
should continue to be on this sector to maintain the fast economic growth recorded in the last plan periods.
2.1.1 Crop Production and Productivity
Crop production: needless to say that increasing crop production is essential to ensure food security,
increase industrial inputs and enhance export earnings. It is overtly understandable that crop production
constitutes a significant share in the agriculture sector and contributes a considerable amount to the national
gross domestic product of the country. Hence, promoting the growth of this subsector not only enhances the
agricultural sector and gross domestic product but also improves the income and living conditions of the
majority of citizens. Crop production is the major subsector of the agriculture and accounts for over 30
percent of the total gross domestic product. Similar to the previous fiscal years, efforts have been put in
2012/13 as well to enhance crop production. In 2012/13, therefore, from both smallholder farmers and
commercial farms, a total of 251.05 million quintals of production is gained from major food crops such as
cereals, pulses and oil seeds during both Meher and Belg seasons.
Table 18. Area coverage and production of major food crops in 2012/13 fiscal year
Area cultivated in million Hectares Production in million Quintals
Smallholder farmers Commercial
farms
Total
Smallholder farmers Commercial
farms
Total
Meher Belg Meher Belg
2010/11 performance 11.28 1.17 0.45 13.45 203.48 9.01 9.33 221.28
Cereals 9.69 0.93 0.18 10.8 177.61 8.05 6.11 191.77
Pulses 1.36 0.21 0.013 1.59 19.53 0.94 0.22 20.69
Oil seeds 0.77 0.03 0.26 1.06 6.34 0.02 3.00 9.36
2011/12 performance 12.1 1.17 0.42 13.69 218.57 6.82 7.05 232.44
Cereals 9.58 0.89 0.18 10.65 188.09 5.81 4.92 198.82
Pulses 1.63 0.26 0.03 1.92 23.16 1.01 0.45 24.62
Oil seeds 0.89 0.02 0.21 1.12 7.32 - 1.68 9
2012/13 performance 12.28 1.23 0.57 14.08 231.28 9.8 9.95 251.05
Cereals 9.6 0.96 0.26 10.81 196 8.40 6.98 211.9
Pulses 1.86 0.26 0.05 2.2 27.51 1.4 0.85 29.75
Oil seeds 0.82 0.02 0.27 1.1 8.5 0.004 2.12 9.39
Source: Central Statistical Agency
32
The production gained in this year is considerably larger than both the target set for the year and the
previous fiscal year. The production is 25.1 million quintals higher than the target set for the year and 18.61
million quintals higher than the previous fiscal year. This indicates that the production of these major food
crops has registered a growth rate of 8 percent in the fiscal year under consideration indicating an increase of
3.2 percentage points compared to the growth rate in 2011/12. Furthermore, the production gained in this
fiscal year depicts a 48.6 million quintals increase and a 24 percent growth rate compared to the production
in 2009/10. The encouraging production gained in the fiscal year under review is attributed to the
production increase in both Meher and Belg seasons, and the growth of production registered by commercial
farms.
Of the total production in 2012/13, 96 % (241 million quintal) was produced by smallholder farmers while
the rest 4 % (10 million quintal) was produced by commercial farms. This clearly denotes the fact that
smallholder farmers are the main sources of the production achieved in the year under consideration. This
further vindicates the strategic focus on increasing the productivity and production of smallholder farmers in
the growth and transformation plan.
On the other hand, in 2012/13, the total area covered by these major food crops was 14.08 million hectare
which is 2.2 million hectares higher than the target set for the year and 2.83million hectares higher than the
area cultivated in 2009/10. The area covered by major food crops is also 1.9 million hectares higher than the
target set for the end of the growth and transformation plan. This entails that to increase crop production
further, the focus should be on increasing smallholders’ productivity rather than on area expansion.
Moreover, 76.8 percent, 15.4 percent and 7.8 percent of the total area cultivated was covered by cereals,
pulses and oilseeds, respectively. Again, about 96 percent of the total area covered by major food crops was
owned by smallholders while only 4 percent was managed by commercial farms. The coverage denotes that
the area covered by cereals is declining whereas the area covered by pulses has shown a rise in relative
terms. A slight decline was also recorded in the area covered by oil seeds in 2012/13 although it still remains
higher than the area cultivated in 2010/11. Generally smallholder farmers appear to be slowly shifting land
from cereals to cultivation of pulses and oil seeds.
On the whole, the performance achieved in the last three years of the GTP period in relation to increasing
production is encouraging which reveals the possibility of achieving the 267 million quintal total production
target by the end of the GTP period. This performance, however, indicates that to double the 202.46 million
quintal of production by the end of the GTP period requires more concerted efforts particularly in terms of
fully and effectively implementing the scaling up strategy in the remaining plan periods.
Crop productivity: In relation to the productivity of major food crops, it was planned to increase the
average productivity from 17 quintals per hectare in 2011/12 to 19.2 quintals per hectare in 2012/13. The
average productivity was, however, 17.82 quintals per hectare which is 1.4 quintals per hectare lower than
the target of the fiscal year and 0.82 quintals per hectare higher than the productivity in the previous fiscal
year (Table 19). In 2012/13, cereals, pulses and oil seeds registered an average productivity of 19.59 quintals
per hectare, 13.73 quintals per hectare and 8.5 quintals per hectare respectively. All all three types of grains
show a slight productivity improvements in. The major crops which has registered encouraging
productivity in this fiscal year include Teff 13.55 quintal per hectare, barely 15.97 quintal per hectare, and
wheat 20.50 quintals per hectare, sorghum 20.87 quintal per hectare, maize 26.12 quintals per hectare and
horse beans 16.33 quintals per hectare.
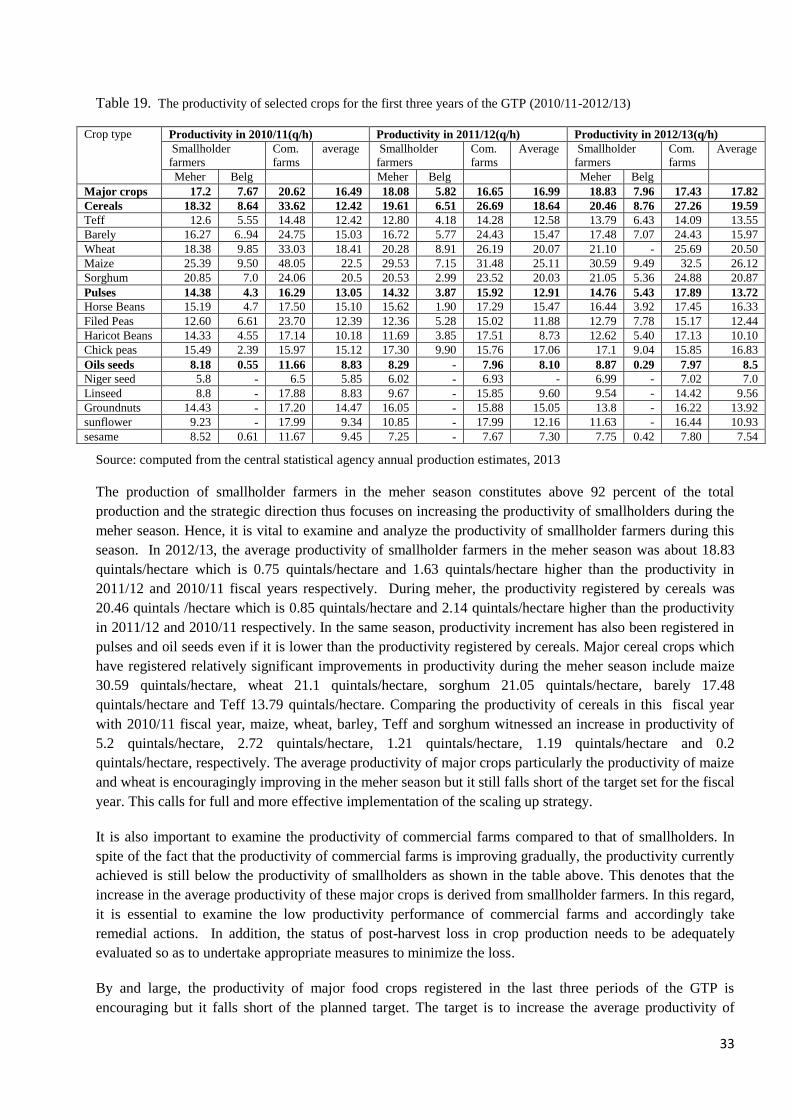
33
Table 19. The productivity of selected crops for the first three years of the GTP (2010/11-2012/13)
Crop type Productivity in 2010/11(q/h) Productivity in 2011/12(q/h) Productivity in 2012/13(q/h)
Smallholder
farmers
Com.
farms
average Smallholder
farmers
Com.
farms
Average Smallholder
farmers
Com.
farms
Average
Meher Belg Meher Belg Meher Belg
Major crops 17.2 7.67 20.62 16.49 18.08 5.82 16.65 16.99 18.83 7.96 17.43 17.82
Cereals 18.32 8.64 33.62 12.42 19.61 6.51 26.69 18.64 20.46 8.76 27.26 19.59
Teff 12.6 5.55 14.48 12.42 12.80 4.18 14.28 12.58 13.79 6.43 14.09 13.55
Barely 16.27 6..94 24.75 15.03 16.72 5.77 24.43 15.47 17.48 7.07 24.43 15.97
Wheat 18.38 9.85 33.03 18.41 20.28 8.91 26.19 20.07 21.10 - 25.69 20.50
Maize 25.39 9.50 48.05 22.5 29.53 7.15 31.48 25.11 30.59 9.49 32.5 26.12
Sorghum 20.85 7.0 24.06 20.5 20.53 2.99 23.52 20.03 21.05 5.36 24.88 20.87
Pulses 14.38 4.3 16.29 13.05 14.32 3.87 15.92 12.91 14.76 5.43 17.89 13.72
Horse Beans 15.19 4.7 17.50 15.10 15.62 1.90 17.29 15.47 16.44 3.92 17.45 16.33
Filed Peas 12.60 6.61 23.70 12.39 12.36 5.28 15.02 11.88 12.79 7.78 15.17 12.44
Haricot Beans 14.33 4.55 17.14 10.18 11.69 3.85 17.51 8.73 12.62 5.40 17.13 10.10
Chick peas 15.49 2.39 15.97 15.12 17.30 9.90 15.76 17.06 17.1 9.04 15.85 16.83
Oils seeds 8.18 0.55 11.66 8.83 8.29 - 7.96 8.10 8.87 0.29 7.97 8.5
Niger seed 5.8 - 6.5 5.85 6.02 - 6.93 - 6.99 - 7.02 7.0
Linseed 8.8 - 17.88 8.83 9.67 - 15.85 9.60 9.54 - 14.42 9.56
Groundnuts 14.43 - 17.20 14.47 16.05 - 15.88 15.05 13.8 - 16.22 13.92
sunflower 9.23 - 17.99 9.34 10.85 - 17.99 12.16 11.63 - 16.44 10.93
sesame 8.52 0.61 11.67 9.45 7.25 - 7.67 7.30 7.75 0.42 7.80 7.54
Source: computed from the central statistical agency annual production estimates, 2013
The production of smallholder farmers in the meher season constitutes above 92 percent of the total
production and the strategic direction thus focuses on increasing the productivity of smallholders during the
meher season. Hence, it is vital to examine and analyze the productivity of smallholder farmers during this
season. In 2012/13, the average productivity of smallholder farmers in the meher season was about 18.83
quintals/hectare which is 0.75 quintals/hectare and 1.63 quintals/hectare higher than the productivity in
2011/12 and 2010/11 fiscal years respectively. During meher, the productivity registered by cereals was
20.46 quintals /hectare which is 0.85 quintals/hectare and 2.14 quintals/hectare higher than the productivity
in 2011/12 and 2010/11 respectively. In the same season, productivity increment has also been registered in
pulses and oil seeds even if it is lower than the productivity registered by cereals. Major cereal crops which
have registered relatively significant improvements in productivity during the meher season include maize
30.59 quintals/hectare, wheat 21.1 quintals/hectare, sorghum 21.05 quintals/hectare, barely 17.48
quintals/hectare and Teff 13.79 quintals/hectare. Comparing the productivity of cereals in this fiscal year
with 2010/11 fiscal year, maize, wheat, barley, Teff and sorghum witnessed an increase in productivity of
5.2 quintals/hectare, 2.72 quintals/hectare, 1.21 quintals/hectare, 1.19 quintals/hectare and 0.2
quintals/hectare, respectively. The average productivity of major crops particularly the productivity of maize
and wheat is encouragingly improving in the meher season but it still falls short of the target set for the fiscal
year. This calls for full and more effective implementation of the scaling up strategy.
It is also important to examine the productivity of commercial farms compared to that of smallholders. In
spite of the fact that the productivity of commercial farms is improving gradually, the productivity currently
achieved is still below the productivity of smallholders as shown in the table above. This denotes that the
increase in the average productivity of these major crops is derived from smallholder farmers. In this regard,
it is essential to examine the low productivity performance of commercial farms and accordingly take
remedial actions. In addition, the status of post-harvest loss in crop production needs to be adequately
evaluated so as to undertake appropriate measures to minimize the loss.
By and large, the productivity of major food crops registered in the last three periods of the GTP is
encouraging but it falls short of the planned target. The target is to increase the average productivity of
34
major food crops to 22 quintals per hectare. The achievements so far are indicative of the possibility of
achieving this productivity target in the smallholder agriculture. To this end, full and more effective
implementation of the strategies outlined in the Growth and Transformation Plan such as scaling up the
experiences of model farmers, improving the application and supply of agricultural inputs, expanding
farmers training and expanding small scale irrigation becomes critical. In addition, sustaining the natural
resource conservation activity and expanding the agricultural extension service more effectively is extremely
imperative.
Crop Research and Input Supply: Agricultural research and input supply play a pivotal role to improve
agricultural productivity and production and priority has thus been given to improving crop research and
agricultural input supply in the growth and transformation plan. In 2012/13 fiscal year, in terms of crop
research it was planned to obtain 161 adequate technologies by conducting research and the performance
shows that 181 adequate technologies are obtained indicating a 12.4% higher performance than the target set
for this year. Capacity building activities have also been undertaken to effectively utilize these technologies
and then improve crop productivity. It has been planned to neutralize 22010 hectare acidic and fertile land
by lime, but only 6000 hectare of land was neutralized and developed in the fiscal year. Though the
performance has shown a relative improvement in comparison to the previous fiscal years, it clearly calls for
additional efforts to meet the targets set for the GTP period. On the other hand, it was planned to develop
720 thousand hectares of koticha soil in 2012/13 and 430.24 hectares of koticha soil was developed
witnessing a 59.8 percent performance. In this fiscal year a better performance has been seen compared with
the last two plan periods. However, concerted efforts are needed to develop the 3000 thousand hectare of
land by the end of the plan period.
In terms of agricultural input supply, it was planned to supply 2729 thousand quintals of improved seed, but
the accomplishment was 2041 thousand quintals in 2012/13. This is only 75 percent of the target, but it is
almost double the amount supplied last year. The improved performance is attributed to the better support
and coordination as well as to wide participation of farmers in the multiplication of improved seeds. Note
that it is planned to supply 3.6 million quintals of improved seed by the end of the plan period. Similarly, it
was planned to supply 1261 thousand ton inorganic fertilizer (UREA and DAP) in the same period.
However, 995.4 thousand ton which is 79 percent of the target and 177.3 thousand ton less than the previous
year was supplied. It has to be noted that the plan is to supply 1.67 million ton fertilizers by the end of the
plan period. This year has also seen the use of natural organic fertilizers by smallholder farmers. The
effective application of agricultural inputs is a decisive factor to improve agricultural productivity and
production. The supply of improved seed has significantly improved but it has only covered 75 percent of
the demand for this year while the supply of fertilizer has declined in comparison to the previous year. This
is expected to have contributed to the slow progress in productivity growth of major food crops. It thus
needs close monitoring and proper remedial action. Furthermore, strong efforts are required to achieve the
targets (1665 thousand metric ton and 3.6 million quintals of improved seed) set to be achieved by the end of
the growth and transformation plan.
The GTP also stresses on improving the health and quality control of important plants. To this end, it was
planned to conduct an assessment on cross-border insects and weeds on 300 Woredas and it was possible to
conduct the assessment on 244 Woredas in 2012/13. Similarly, it was planned to conduct quarantine
inspection on 851.5 thousand tones of different exported plants and plant products and the performance
witnesses that 87 percent of the target was accomplished. Quality inspection and certification was made on
199597.69 tone export coffee in the fiscal year under consideration. On top of that, quarantine inspection
was made on 9.05 million imported cut flowers. Organized efforts undertaken to control the quality and
health of plants and the establishment of new inspection sites have improved the performance of quality
control of these important plants.
35
Improving livestock productivity and production: livestock accounted for about 9.1 percent of GDP in
2012/13 in Ethiopia. Hence, improving livestock productivity and production is crucial to accelerate growth,
ensure food security and expand agricultural export. The government has accordingly paid due attention to
improving the productivity of the sector. Increasing the share of improved cattle has reached 36.47 percent
which is 2.22 percentage points higher than the target. It was planned to produce 1000 thousand doses of
semen and 540 thousand liters of nitrogen in 2012/13. But only 640 thousand doses of semen and 252
thousand liters of nitrogen were produced. The achievements are far below the targets set because of the
limited capacity of regions to produce the expected amount and the repeated breakdown of a producing
machine. Thus, these constraints have to be addressed to consolidate the achievement made in this regard to
increase the number of hybrid cattle. In addition, in the effort to improve the productivity and production of
livestock, it is important to make sure that there exists adequate feed supply. The natural resource
conservation and watershed development works undertaken so far have created a fertile ground to foster
sustainable livestock feed development. It is essential that this potential is properly exploited to promote the
development of sustainable livestock feed. Accordingly, more emphasis would be given to integrate
livestock feed development with the undergoing natural resources conservation and watershed development
programs. In 2012/13, it was planned to supply 86 thousand quintals of improved animal feeding seed and
only 15.95 thousand quintals of improved animal feeding seed was supplied. In the last three plan periods
therefore it was possible to supply 98 thousand quintals improved animal feeding seed which is a 47.2
percent performance. This indeed needs a prompt corrective action on developing integrated livestock feed
(factory processed and integrated with natural resource conservation) to enhance the productivity and
production of livestock.
The other factor which has been given attention to enhance the contribution of the livestock sector to the
overall economy is the health and quality control of livestock. Therefore, regular assessments and
assessments to follow up anthrax and tsetse fly have been conducted in 33 Woredas. The coverage of the
data to be collected on livestock disease control and assessment has reached to 35 Woredas. In the fiscal
year under consideration, it was planned to produce 160.9 million doses of vaccines and distribute 154.77
million doses of vaccines while the performance shows 95.6 percent and 88 percent accomplishment,
respectively. This indicates that in the last three plan periods it has been possible to produce 414.85 million
vaccines and to distribute 389.16 million doses of it. This has helped to give vaccines under the regular
programme for 65 percent of the livestock population in the same fiscal year. Besides, to increase the health
and quality control of animals in the pastoralist community 340 workers were trained on community animal
health. It was also possible to establish three new exit-entry stations and one quality check laboratory. Over
the last three years 489 animal health posts have been built to improve the quality and productivity of
livestock in the pastoral areas.
Considerable efforts have been put in place to improve the production and productivity of the livestock
sector. However, further organized efforts are required to achieve the targets set by the end of the growth
and transformation plan. In 2010/11, 2011/12 and 2012/13, the sector registered a growth rate of 7.5 percent,
5.4 percent and 5.4 percent which indicates an average annual growth rate of 6 percent over the last three
years. In general, the country is endowed with an immense livestock potential which should be exploited to
ensure food security, facilitate agro-processing industry and boost foreign exchange earnings. Thus, to
further develop the contribution of the livestock, it is quite essential to strongly and meaningfully support the
sector in the remaining plan periods.
Agricultural Extension Service: As mentioned in many parts of this section, effective expansion of the
agricultural extension service is pertinent to improve the productivity and production of smallholder farmers
and pastoralists. The extension service mainly focuses on agricultural technology utilization and natural
resource conservation and management. It is believed that the extension service has its own contribution for
36
the gradual improvement of smallholders’ productivity. In 2012/13, the number of extension beneficiaries
has reached 11.66 million which is 2.2 percent higher than the target set for the fiscal year and 1.1 million
higher than the number of beneficiaries in the previous year. This entails that the target of increasing the
number of beneficiaries to 14640 thousand by the end of the plan period is quite possible. Of the total
number of extension beneficiaries 10.88 million are smallholders, and the rest 469 thousand are pastoralists.
On the other hand, of the total beneficiaries 6.64 million, 3.15 million and 1.1 are males, females and youth,
respectively. In other words, from the total number of agricultural extension beneficiaries 30 percent are
females while10 percent are youth. Further expansion of the agricultural extension service particularly in the
pastoralist area and enhancing farmers training on agricultural skill development and technological adoption
to supplement the ongoing extension service is very essential. Moreover, it is desirable to take measures
which will improve the effectiveness of the agricultural extension service delivery system.
2.1.2 Natural Resource Conservation and Development
As natural resource conservation plays a key role in ensuring sustainable development, it has been given due
priority in the growth and transformation plan. It is widely believed that the the natural resource
conservation and development works undertaken over the last three years will gradually improve the
productivity and production of smallholders and pastoralists. The last three GTP years have seen a very
significant achievement in terms of natural resource conservation and development works throughout the
country. At the center of this accomplishment are the extensive awareness creation and resultant conviction
about the benefits of natural resource conservation works in improving productivity and climate change
mitigation Hence, in the fiscal year under consideration, farmers have been undertaking soil and water
conservation activities which are expected to have a significant contribution to improve agricultural
productivity and production. In 2012/13, it was planned to carry out community based natural resource
activities on 5940 thousand hectares of land. By the end of the years communities actually undertook natural
resource conservation works on 13733.7 thousand hectares of land throughout the country. Farmers were
able to undertake soil fertility improving works using natural fertilizers on 8423 thousand hectares of land.
In addition, communities covered 14.57 million hectare of land with multipurpose trees during the fiscal
year under review. To this effect, land covered by forest has reached 15.9 million hectare.
Furthermore,18150 quintal tree seeds have been collected and distributed in this fiscal year. Finally, about
10027 thousand hectares of land was protected for rehabilitation purposes. The above conservation works
have created a conducive environment for water harvesting and small scale irrigation development. Hence,
1830 thousand hectare of land was developed by small scale irrigation schemes during the fiscal year under
review. On the whole, the natural resource conservation and development works undertaken by communities
is encouraging and shows the advancement of awareness of farmers. These massive investments in natural
resource conservation should now be translated into better food security, enhanced agricultural productivity
and farmers/pastoralists’ income. In addition, the current momentum of community mobilization in natural
resource conservations should be sustained to consolidate on the gains made so far. Another very important
area which is closely related with natural resource conversation is rural land administration and land use
planning. In the fiscal year under consideration, land administration system was implemented in 9 Weredas
bringing the total number of Weredas implementing the land administration system to 66. On top of this, it
was possible to give first level land certificates for 1.18 million households and this has increased the
number of households who owned first level land certificates to 2.96 million. Similarly, about 110 thousand
households have been give second level land ownership certificate. Thus, the number of households who
owned this second level land ownership certificate has increased to 0.211 million over the last three plan
periods.
37
2.1.3. Food Security and Disaster Prevention and Preparedness
The strategy being pursued to ensure food security include benefiting food-insecure people from productive
safety net program, encouraging people to build assets through family level credit package and encouraging
productive safety net beneficiaries to graduate from the program after fulfilling their food need. It is to be
recalled that the number of productive safety net program (PSNP) beneficiaries was 7.7 in 2010/11 because
of the additional beneficiaries which were included from Somale and Afar regional states. In 2012/13, the
number of PSNP beneficiaries was 6.89 million. In the same year, it was planned to graduate 161 thousand
households from the productive safety net program. By the end of the year about 205.7 thousand households
graduated from the program by securing their food needs. About 61 thousand of the graduates were female
headed households. Over the last three years the total number of households who graduated from the safety
net program has totaled 585 thousand.
As mentioned above, the productive safety net program will continue to improve the food security of
households who are under chronic poverty. However, the number of beneficiaries graduating from the
program has been small in the last three fiscal years. Hence more efforts are required to reduce the number
of beneficiaries to 1.3 million by the end of the plan period. Accordingly, strengthening the monitoring and
evaluation system, identifying and solving problems related to the program and designing incentive schemes
for the regions which succeed in graduating households from the program by fulfilling their food needs
within the planned period of time are essential to reduce the number of beneficiaries to the desired level.
The other component of food security program is the family level credit package which is designed for
households to build an asset using the credit facility. In 2012/13, it was planned to benefit 101400 food-
insecure households from family level credit package, and accordingly 124684 households have benefited
from the package. Thus, the number of food-insecure households who are benefiting from the family level
credit package has reached 545131.
A plan was set to increase the national food stock to 3 million ton by the end of the GTP period in order to
effectively respond to disaster and emergency needs. However, the food stock has remained at 405 thousand
ton indicating no increment in the last three plan periods. In connection with disaster prevention and
preparedness, it was planned to increase the disaster prevention and preparedness contingency budget to Birr
200 million, and it has been possible to increase the budget to Birr 122 million. On the other hand, to
provide early warning and emergency response based on disaster profile, it was planned to prepare disaster
profile for 200 Woredas. Accordingly disaster profile was prepared for only 108 Woredas during the year,
because the preparations to start the program took much time some regions . To enhance disaster prevention
and preparedness capacity, it is important to increase the stock of food and non-food items. It was planned to
give financial support to 3.5 million people and the support was offered to 3.7 million people. In the same
way, it was planned to provide non-food support to 1.5 million people, and the support was provided to 0.25
million people in 2012/13 fiscal year. In the last three plan periods, food support was provided to11.4
million and non-food support to 3.9 million people.
2.1.4. Private Sector Participation
Encouraging the private sector to effectively involve in the agricultural sector is also a priority as it plays a
key role in ensuring food security and generating foreign exchange. Similar to the previous plan periods,
efforts have been put in this fiscal year to develop land for investment so as to increase the production of
flowers, vegetables, fruits and herbs. To this end, it was planned to cover 2293 hectare, 818 hectare, 8027
hectare, and 1527 hectare of land with flowers, vegetables, fruits and herbs, respectively. Accordingly 62.2
percent, 12.9 percent 127 percent and 5.9 percent of the targets were accomplished. In terms of production,
38
2257.3 million cut flowers (51.1%), 122 thousand tone vegetable (40.2%), 14.1 thousand tone fruits (6.5%)
and 0.8 thousand tone herbs(10.5%) have been accomplished in 2012/13 fiscal year.
Though these are encouraging, they fall short of the plan. Thus, the problems related to capacity, delivery of
developed land, recruitment of private investor and logistics have to be addressed to further expand private
investment in the agricultural sector. Further, ensuring and monitoring the effective utilization of investment
land transferred to investors and conducting intensive capacity building activities are also important to
enhance the participation of private investors in the sector.
Similarly, to increase private investment in the agriculture sector, large scale investment land have been
identified and transferred to investors by federal land bank. As a result, in 2012/13 3.31 million hectare of
land was identified and transferred to the federal land bank. Over the last three plan periods, a total of 473
thousand hectare of land was transferred to investors of which only 11 percent was developed by these
investors.
On the other hand, in the effort of increasing agricultural production through developing suitable and
cultivable land it was possible to cover 203.94 thousand hectares and 254.5 thousand hectares of land with
root crops, and fruits and vegetables, respectively. Similarly, it was possible to cover 702.6 thousand
hectare, 72.4 thousand hectare and 231.4 thousand hectare of land with stimulant crops, industrial crops and
spice crops respectively, in the same fiscal year.
2.2 Industry
2.2.1 Micro and Small Scale Enterprises Development
Development of micro and small enterprises is among the strategic directions during the GTP period.
Accordingly, the focus has been on promoting the development and competitiveness of micro and small
businesses. Public development programs have been used to promote the development of micro and small
enterprises and to promote employment opportunities. Thus micro and small enterprises development as well
as job creations were integrated in the construction of new public universities, the development of sugar
industry, integrated housing development, road construction and railway networking and construction,
power generation, as well as cobblestone development during the last three years of GTP period.
Training on the MSE development strategy and its implementation manuals were provided to 9,477
membership of the leadership and professions of the sector in 2012/13. Over the last three years the total
number of trains that went through similar training of trainers programs was 14,806. In addition, to enhance
the efficiency and productivity of micro and small enterprises training was provided to 2,174,290 business
operators on entrepreneurship, business management and technical skills. Women business operators
accounted for about 38 percent (826,230) of the total number of beneficiaries. The total number of small
businesses trained over the last three years constitutes for over 72.48 % of the target set for the GTP five
year period.
Another critical constrain of small businesses is credit. Thus credits have been extended to these businesses
using micro finance institutions. During the first three years of the GTP period, over Birr 4.81billion was
provided in credit to various micro and small enterprises throughout the country. In addition, to further ease
their financial constraints, a total of 3,226.39 hectares of land, 7,645 shades and 633 blocks (284 completed
and 349 on construction) were distributed to micro and small enterprises in all cities of the country over the
last three years.
39
The comprehensive support provided to micro and small enterprises has helped the enterprises to create
temporary and permanent employment opportunities for about 2.02 million citizens in the fiscal year of
2012/13. During the last three years of the GTP, a total of 3.96 million temporary and permanent
employment opportunities were created throughout the country. Of the total jobs generated in the last three
years, women accounted for about 40 percent of them. This has contributed to the decline of urban
unemployment rate from 18 percent in 2010/11 to 17.5 percent in 2011/12 and further to 16.5 percent in
2012/13. The industrial extension and financial supports accorded to micro and small enterprises have
helped some to grow. In 2012/13 alone a total of 1,775 enterprises graduated from micro and small to
medium scale enterprises.
The promotion of micro and small scale enterprises over the past two years demonstrated the importance of
the sector in terms of job creation and entrepreneurship development. Despite the encouraging results
registered in promoting micro and small-scale enterprises development over the last three years, the high
level of poverty and unemployment in urban areas as well as the low level of productivity and
competiveness of the enterprises still calls for more effective execution of the MSE development strategy
over the coming years. Therefore, more emphasis should continue to be given to enhance the productivity
and competiveness of the enterprises and transform the successful enterprises to medium and large scale
industries. In this regard the quality of the industrial extension services should be improved to transform the
technical and entrepreneurship capacity of the business operators and thereby also their productivity and
competitiveness. In addition to promoting micro and small enterprises using the prevailing strategy, a clear
strategy should also be designed and implemented to support small and medium enterprises in the upcoming
years.
2.2.2 Medium and Large-Scale Manufacturing Industry Development
In the manufacturing industries priority focus has been given by the GTP to textile and apparel, leather and
leather product development, agro-processing, chemical and pharmaceutical, metal, food and beverage
sectors. Accordingly, concerted efforts were exerted during the last three years of GTP implementation to
support medium and large scale manufacturing industries play vital role in industrialization of the economy
and to sustain and enhance the high rate of industrial growth registered so far in the sector. Apart from being
labor intensive and forming a strong linkage with agriculture, these medium and large industries are key for
both export growth and import substitution.
A. Industrial Growth
The medium and large scale manufacturing industry grew at 14.5 percent in 2012/13. Over the last three
GTP years, medium and large scale manufacturing on average grew at 14.9 percent per annum. The medium
and large scale manufacturing sub-sector however still remains very small accounting for less than 3 percent
of GDP. Thus the sub-sector has to grow much faster to drive industrialization and transformation of the
economy.
Textile and apparel industry: In the past three years of GTP implementation, a total of USD 246 million
foreign exchange earnings were obtained from the textile and apparel industry. The industry also created
12,490 new jobs over the last three years compared to a GTP target of 40,000 jobs . Given that 1 billion
USD is expected from the industry in export earnings by 2015, the strategies designed to promote private
investment in the sector need to be implemented more effectively.
Leather and Leather products: during the fiscal year under consideration over 68.33 million meter square
shoe were produced for both domestic and international market. Similarly during the budget year it was
planned to increase factories capacity utilization to 21 percent while it was managed to increase utilization
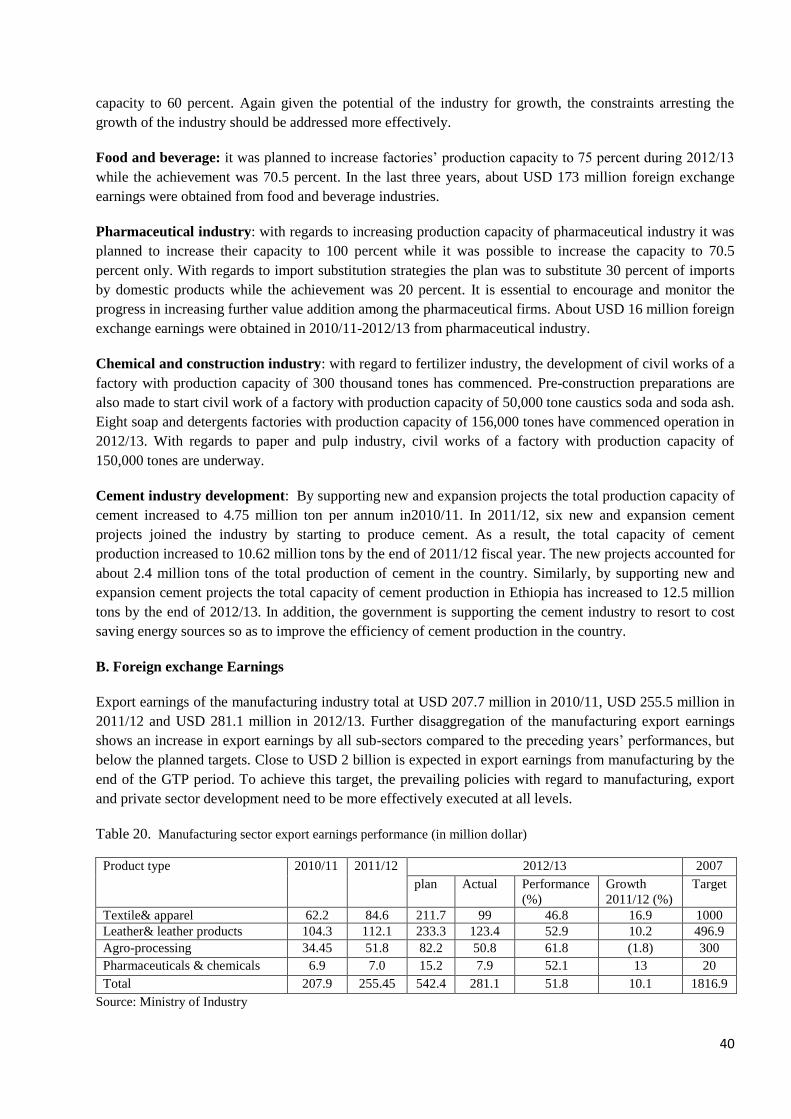
40
capacity to 60 percent. Again given the potential of the industry for growth, the constraints arresting the
growth of the industry should be addressed more effectively.
Food and beverage: it was planned to increase factories’ production capacity to 75 percent during 2012/13
while the achievement was 70.5 percent. In the last three years, about USD 173 million foreign exchange
earnings were obtained from food and beverage industries.
Pharmaceutical industry: with regards to increasing production capacity of pharmaceutical industry it was
planned to increase their capacity to 100 percent while it was possible to increase the capacity to 70.5
percent only. With regards to import substitution strategies the plan was to substitute 30 percent of imports
by domestic products while the achievement was 20 percent. It is essential to encourage and monitor the
progress in increasing further value addition among the pharmaceutical firms. About USD 16 million foreign
exchange earnings were obtained in 2010/11-2012/13 from pharmaceutical industry.
Chemical and construction industry: with regard to fertilizer industry, the development of civil works of a
factory with production capacity of 300 thousand tones has commenced. Pre-construction preparations are
also made to start civil work of a factory with production capacity of 50,000 tone caustics soda and soda ash.
Eight soap and detergents factories with production capacity of 156,000 tones have commenced operation in
2012/13. With regards to paper and pulp industry, civil works of a factory with production capacity of
150,000 tones are underway.
Cement industry development: By supporting new and expansion projects the total production capacity of
cement increased to 4.75 million ton per annum in2010/11. In 2011/12, six new and expansion cement
projects joined the industry by starting to produce cement. As a result, the total capacity of cement
production increased to 10.62 million tons by the end of 2011/12 fiscal year. The new projects accounted for
about 2.4 million tons of the total production of cement in the country. Similarly, by supporting new and
expansion cement projects the total capacity of cement production in Ethiopia has increased to 12.5 million
tons by the end of 2012/13. In addition, the government is supporting the cement industry to resort to cost
saving energy sources so as to improve the efficiency of cement production in the country.
B. Foreign exchange Earnings
Export earnings of the manufacturing industry total at USD 207.7 million in 2010/11, USD 255.5 million in
2011/12 and USD 281.1 million in 2012/13. Further disaggregation of the manufacturing export earnings
shows an increase in export earnings by all sub-sectors compared to the preceding years’ performances, but
below the planned targets. Close to USD 2 billion is expected in export earnings from manufacturing by the
end of the GTP period. To achieve this target, the prevailing policies with regard to manufacturing, export
and private sector development need to be more effectively executed at all levels.
Table 20. Manufacturing sector export earnings performance (in million dollar)
Product type 2010/11 2011/12 2012/13 2007
plan Actual Performance
(%)
Growth
2011/12 (%)
Target
Textile& apparel 62.2 84.6 211.7 99 46.8 16.9 1000
Leather& leather products 104.3 112.1 233.3 123.4 52.9 10.2 496.9
Agro-processing 34.45 51.8 82.2 50.8 61.8 (1.8) 300
Pharmaceuticals & chemicals 6.9 7.0 15.2 7.9 52.1 13 20
Total 207.9 255.45 542.4 281.1 51.8 10.1 1816.9
Source: Ministry of Industry
41
2.2.3 Public Enterprises
The GTP envisages that the government will selectively intervene in the economy where the private sector is
unable or unwilling to undertake certain projects in order to foster industrialization and structural economic
transformation. In this regard, the primary focus of the government investments was on Sugar Industry,
Metal and Engineering Industry and Coal Phosphate Fertilizer Complex.
Sugar Industry: Two sugar factories, Fincha and Wonji,have become operational at the end of the plan
period under review. In addition extensive development of irrigation infrastructure, land preparation, sugar
cane plantation, factory installation and housing construction activities were undertaken over the last three
years. While extensive skill and technological capabilities have been accumulated in the process of
executing the sugar development projects, capacity limitation in both the private and public sectors still
remains a critical factor determining the accomplishment of the program. Thus the focus should remain on
consolidating the capacity development initiatives being undertaken over the last three years.
Coal Phosphate Complex Fertilizer Project: Feasibility study of the project was finalized in 2011/12. A
contract agreement on the construction of coal phosphate fertilizer complex and development of coal mines
has been signed in 2012/13. The construction of civil works are undergoing as planned.
Metal engineering industry: The Metal Engineering Corporation has created significant domestic capacity
in metal engineering by participating itself and supporting other big domestic companies and micro and
small enterprise to participate in the government’s infrastructure development programs.
In general, although the industrial sector has grown by 18.5 percent in 2012/13, the growth rate falls short of
the target and the sector still accounts only for 12.4 percent of GDP. The manufacturing industry in
particular is expected to grow faster and play a more important role in the economy. Thus the manufacturing
industry needs to be promoted to encourage domestic investment and attract foreign direct investment. In
addition, the critical constraints related to logistics and transport, access to land and credit, as well as public
services and facilitation need to be addressed to promote the development of the manufacturing industry. .
2.3 Trade
2.3.1 Trade Practice and Regulatory Activities
Over the last three GTP years, the total number of new commercial registration at the federal level was
7,401. In the same period, the total number of renewal of commercial registration was 42,882. Furthermore,
11,602 new trade licenses were issued over the last three GTP, while a total of 68,153 trade licenses were
renewed during the same period. In the last three years, the total number of trade name verification and
registration was 102,383. Besides, in collaboration with different stakeholders, the Ministry of trade has
prepared and enforced a system of Pre License Competency Certification.
In the last three years, permits have been granted to 1,305,432 metric ton export goods (oil seeds, grains,
vegetable and fruit products and hides and skins) by inspecting for their requirements of mandatory
Ethiopian standards , . Similarly, permits have been granted to 1,467,467 metric ton imported goods (foods,
chemical, construction and electrical materials) after inspecting for their compliance with mandatory
Ethiopian standards
A system of distribution and price stabilization has been established for three main basic consumption goods
of sugar, palm oil and wheat. Accordingly, 9.57 million quintal of sugar, 635.9 million liter of palm oil and
8,369,329 quintal of wheat have been distributed to consumers through different channels.
42
2.3.2 Trade Relation and Negotiation
In order to assess the impact of WTO accession on the Ethiopian economy , various impact assessment
studies had been conducted on the areas of goods and services in the past three years. These studies include
Trade- Related Aspects of Intellectual Property Rights (TRIPS), Impact of WTO Accession on the Health
and Education Services, Study on Initial Offer in Agricultural Products, Non Agricultural Products and
Services, and Ethiopia’s WTO accession negotiation strategy.
WTO Member Countries which have interest on Ethiopia’s accession process had the third and fourth
rounds of questions during the last three years. Ethiopia has prepared replies to the third round questions and
submitted to the WTO Secretariat for circulation. Following the replies to questions the second and the third
Working Party meetings were held in 2010/11 and 2011/12, respectively.
Legislative action plan, which contains trade related laws to be enacted, was prepared in the standard WTO
format and reviewed by the national steering committee and submitted to the WTO Secretariat. The Factual
Summary which was prepared by the WTO Secretariat has been reviewed, checked and new ideas were
incorporated in the document and submitted to the WTO Secretariat. A checklist of laws and regulations on
Trade Related Intellectual Property Rights (TRIPS) which compares and checks whether or not they are
compatible with the WTO rules, was prepared and submitted to the Secretariat.
Initial Offer in goods, Sanitary and Phytosanitary issues (SPS); Technical Barriers to Trade (TBT) and
checklist of Trade Related Intellectual Property Rights have been submitted to the WTO Secretariat. The
bilateral negotiations on trade in goods with United States of America, European Union and Canada were
conducted successfully in Geneva. Follow up and negotiation of the EPA agreements and assessment of the
agreement was conducted. Follow up of the process of the establishment of free trade areas is performed.
The national position of the country is advanced by attending the meetings held in Kampala and Brussels.
2.4 Mining
During the plan period, the focus of the mining sector is to create conducive environment for the
development of the sector by putting in place policies, laws and regulations as well as generating, collecting,
analyzing and interpreting basic geo-science information for potential investors. In this context, ongoing
intervention programs include generation and dissemination of geo-sciences data, mineral exploration and
petroleum investment promotion and expansion, artisanal mining development and marketing promotion,
geosciences research and development.
2.4.1 Geo-science Data Coverage and Mineral Exploration
The main purpose of this program is to support the development of the sector by generating, collecting and
disseminating geo-science data to end users and investors. In view of this, the national Geology and
Hydrogeology mapping coverage increased from 61.6 percent and 54.6 percent 2011/12 to 68 percent and
62.6 percent in 2012/13 respectively. The national Geo-hazard studies coverage also increased from 16.9
percent in 2011/12 to 20.9 percent in 2012/13. On the other hand, in the past three years of GTP
implementation, the respective mapping coverage of national geology, hydrogeology and geo-hazard
information was 32 percent, 21.1 percent and 6.2 percent lower than the target set for 2014/15. The overall
performance indicates that by exerting additional efforts in the remaining period of GTP implementation, it
is possible to achieve the planned targets for the whole planning period.
In 2012/13, by conducting detail exploration and potential estimate of industrial and metallic minerals, 62
and 49 potential areas were delineated. The performance is 96.9 percent and 94.2 percent of the planned
43
target set for the fiscal year respectively, exceeding by 12.7 percent and 14.4 percent compared with
performance of the preceding year. Compared with the targets set for ending period of the GTP, exploration
and potential estimate of industrial and metal minerals deposit reached 80.6 percent and 77.8 percent
respectively, in 2012/13, indicating the targets will be achieved by the end of the plan period. Detail
geothermal study coverage increased from 25 percent in 2011/12 to 35 percent in 2012/13, performing 80.6
percent of the target set for 2012/13 and 10 percent higher than the performance of the preceding fiscal year.
In 2012/13, the plan was to conduct deep geothermal well of 20 MW energy generating potential at Tendaho
and increase the study coverage to 50 percent and performed as per the target. Furthermore, the target set to
undertake detail underground water study was accomplished as per the target.
2.4.2 Mineral and Petroleum Investment Expansion
Due to favorable policy and regulatory environment for the private sector, the revenue from the sector has
shown significant improvements. Investment into the sector increased from Birr 15.1 billion in 2011/12 to
Birr 16.2 billion in 2012/13. Regarding the volume of petroleum investment, the plan was to generate
US$400.7 million; however, as the number of expected licensees fell short of the target, the performance
was US$169.9 million (about 42.2% of the target) in the 2012/13. The average (2010/11-2012/13) Mining
and Petroleum investment performances stood at 81% and 31.4 % of the target set for ending period of the
GTP.
In 2012/13, it was planned to generate Birr 170.9 million in revenues from various minerals while the
performance was Birr 166.43 million (97.4 %). This performance has increased the mining revenue from
Birr 141.4 million in 2011/12 to Birr 166.43 million in 2012/13. The revenue from petroleum was US$2.18
million (68.1% of the target) which is far behind the target because out of the 25 targeted licenses only 7
licenses (28 percent) were provided in 2012/13. Regarding foreign exchange earnings, it was targeted to earn
US$164.9 million from the export of gold, tantalum, marble and various minerals and the performance was
US$148.85 million (90.2 % of the target). The overall foreign exchange earnings from export of gold,
tantalum, marble and various minerals declined by US$50.2 million from the 2011/12 level, because of the
decline in the international price of these minerals. In the same period, out of the target set to offer 15
mineral explorations and extractions licenses, only 7 licenses were provided. To circumvent the challenges
in the mining investment, institutional capacity building and awareness creation of relevant stakeholders
through effective means and increasing the necessary support to improve performances in the provision of
licenses are important measures to be undertaken.
2.4.3 Artisanal Mining and Marketing Promotion
Due to the establishment of the legal framework for the artisanal mineral production and transaction, the
number of organized artisans and their role in the market has significantly increased. Accordingly, in the
2012/13 75 new Artisanal Miners’ Cooperative Associations were established. This has increased the
number of Cooperative Associations to 553, which consist of 38,618 male and 20,029 female and a total of
58,647 members.
The Artisanal Mining and Marketing sub-sector has been performing well during the past three years of GTP
implantation. In 2012/13, it was planned to supply 13200 kg of gold worth USD 594 million to the National
Bank of Ethiopia. Accordingly, 8386.84 kg (63.5 percent) of Gold at USD 430.6 million (72.5 percent) were
supplied by artisanal miners to the National Bank of Ethiopia. The quantity of gold supplied to National
Bank of Ethiopia in 2012/13 was 3.1 percent higher than the preceding fiscal year, while its corresponding
value was lower by 2 percent, indicating the decline in the price of gold at the global market. In the same
fiscal year, about USD 12.24 million foreign exchange earnings were obtained from the export of gemstone
minerals, surpassing by USD 4.04 million compared with the performance registered in 2011/12.
44
Furthermore, about USD 1.6 million foreign exchange earnings were obtained from the export of Tantalum.
However, because of the decline in its export quantity in 2012/13 due to value addition, export earnings
from Tantalum were less by USD 5.9 million than the preceding fiscal year
In general, in 2012/13, total revenue of USD 593.28 million has been secured from the minerals supplied to
the National Bank of Ethiopia by Artisanal Mining cooperatives and from export proceeds by different
companies in the sector. However, the total revenue generated by the sector in 2012/13 was lower by USD
9.92 million than the preceding fiscal year because of the decline in the international market price of gold.
To increase the revenues generated by the mining sector in the upcoming years, it is essential to strengthen
the capacity of artisanal mining production by providing technical as well as material support. Due
consideration should also be given to facilitating marketing and transaction systems of the sector.
2.4.4 Geosciences Sector Research and Development
The primary purpose of research and development is to conduct problem-driven research, introduce and
transfer appropriate technologies and methods in the mining sector. As such, in the 2012/13 fiscal year,
selecting, introducing and adopting new technologies to artisanal miners’ undertaken. Data on Geo-sciences’
research findings have been collected and organized. Moreover, minerals samples’ analysis, identification as
well as sector promotion tasks have been conducted and necessary information disseminated to stakeholders.
45
CHAPTER III
INFRASTRUCTURE DEVELOPMENT
3.1 Road Development
3.1.1 Road sector capacity building
Human resource development in the road sector has been one of the priorities in the five year Growth and
Transformation Plan. Accordingly, wide ranging trainings were provided to middle level and junior
technicians engaged in road construction projects. In order to improve quality in the road sector, a program of
certification of competency was run for professionals and technicians. To improve the competitiveness of the
sector, short term trainings were provided to the private sector and regional road agencies. Likewise similar
training programs were organized various stakeholders and experts working in the road sector. To address the
shortage of skilled professionals in the industry, a postgraduate training program is organized for experts
from both government and non-governmental institutions in different universities of the country.
Ethiopian Road Authority has been reorganized into two independent institutions under government
proclamation with different power and responsibilities since 2011. These are the Ethiopian Road Construction
Corporation and the regulatory body of the Ethiopian Road Authority. The corporation has the operational
responsibility of Road construction and maintenance, whereas the regulatory body is vested with the power
and the responsibility to plan and manage the road network and supervise road works at country level. The
capacity of Wereda Road Offices has also been strengthened to manage the rural road development program.
In addition, in connection with the Universal Rural Road Access Program (URRAP), the capacities of small
and medium enterprise, and local professionals and technicians have been developed.
3.1.2 Federal Roads
In the reporting period, it was planned to execute 190 km of rehabilitation of trunk roads, 240km of
upgrading of trunk roads, 825km of upgrading of link roads, 987km of construction of trunk/link roads,
810km of heavy and periodic maintenance and 16,348km of routine and term maintenance. At the end of the
fiscal year the accomplishment was 137km, 214km, 696km, 927km, 816km, and 16,710 km respectively. In
general, during the year under review the target was to construct and maintain a total of 19,400kms of
federal roads, while the work was accomplished on 19,500km indicating achievement of 101 percent of its
target and 102 percent compared to performance in the previous year. In 2012/13, 89%, 84% and 94% of the
plans were accomplished with regards to upgrading of trunk roads, upgrading of link roads and construction
of trunk/link roads respectively. The heavy/periodic maintenance and routine and term maintenance were
accomplished according to their plans (101% and 102% of their targets respectively). On the contrary,
relatively low progress was recorded in trunk roads rehabilitation, as only 72% of the target was
accomplished,. The poor performance of some asphalt overlay road projects and delay in completing design
study, delay in procurement process, and poor performance of contractors are among the major problems
encountered during the fiscal year under review.
3.1.3 Regional and Woreda Roads
It was planned to construct 2,472km new rural roads and 11,237 km of rural road maintenance by Regional
Road Authorities during the year under review. By the end of the fiscal year, a total of 1,345km of new rural
roads and 10,737 km of maintenance works were accomplished , indicating 61 percent and 88 percent
performance of the target. With regard to the performance of the Woreda roads (URRAP) the target was to
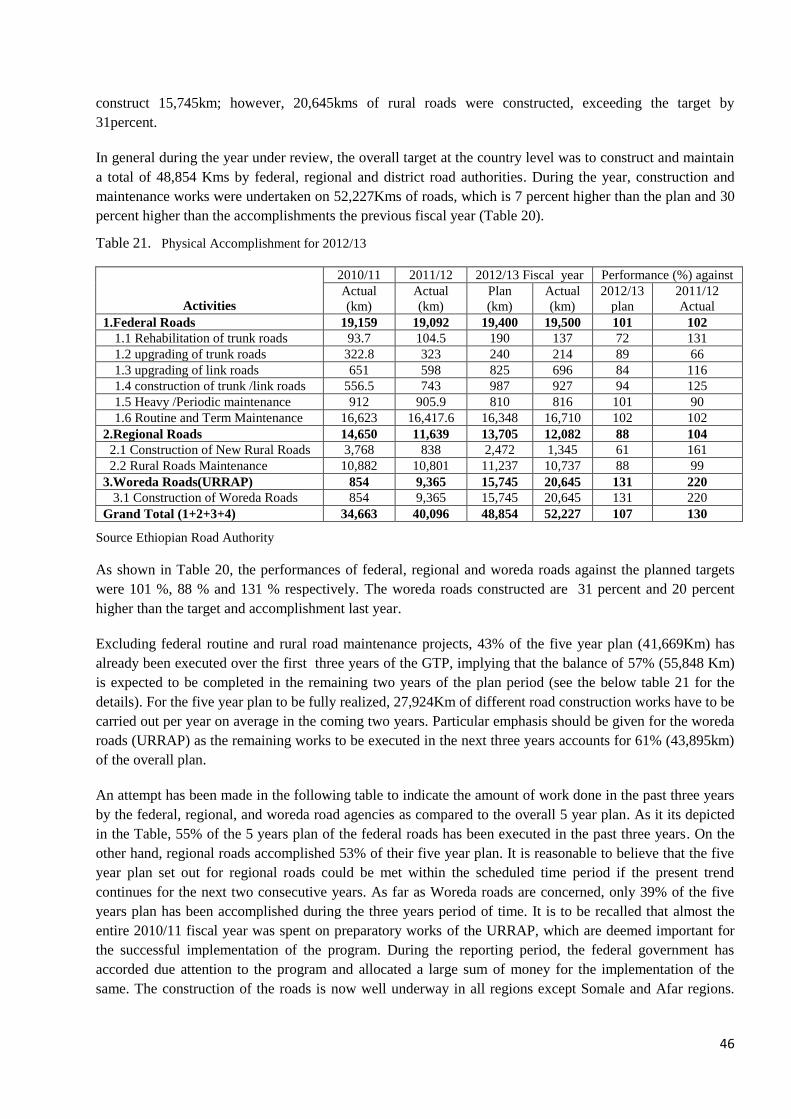
46
construct 15,745km; however, 20,645kms of rural roads were constructed, exceeding the target by
31percent.
In general during the year under review, the overall target at the country level was to construct and maintain
a total of 48,854 Kms by federal, regional and district road authorities. During the year, construction and
maintenance works were undertaken on 52,227Kms of roads, which is 7 percent higher than the plan and 30
percent higher than the accomplishments the previous fiscal year (Table 20).
Table 21. Physical Accomplishment for 2012/13
Activities
2010/11 2011/12 2012/13 Fiscal year Performance (%) against
Actual
(km)
Actual
(km)
Plan
(km)
Actual
(km)
2012/13
plan
2011/12
Actual
1.Federal Roads 19,159 19,092 19,400 19,500 101 102
1.1 Rehabilitation of trunk roads 93.7 104.5 190 137 72 131
1.2 upgrading of trunk roads 322.8 323 240 214 89 66
1.3 upgrading of link roads 651 598 825 696 84 116
1.4 construction of trunk /link roads 556.5 743 987 927 94 125
1.5 Heavy /Periodic maintenance 912 905.9 810 816 101 90
1.6 Routine and Term Maintenance 16,623 16,417.6 16,348 16,710 102 102
2.Regional Roads 14,650 11,639 13,705 12,082 88 104
2.1 Construction of New Rural Roads 3,768 838 2,472 1,345 61 161
2.2 Rural Roads Maintenance 10,882 10,801 11,237 10,737 88 99
3.Woreda Roads(URRAP) 854 9,365 15,745 20,645 131 220
3.1 Construction of Woreda Roads 854 9,365 15,745 20,645 131 220
Grand Total (1+2+3+4) 34,663 40,096 48,854 52,227 107 130
Source Ethiopian Road Authority
As shown in Table 20, the performances of federal, regional and woreda roads against the planned targets
were 101 %, 88 % and 131 % respectively. The woreda roads constructed are 31 percent and 20 percent
higher than the target and accomplishment last year.
Excluding federal routine and rural road maintenance projects, 43% of the five year plan (41,669Km) has
already been executed over the first three years of the GTP, implying that the balance of 57% (55,848 Km)
is expected to be completed in the remaining two years of the plan period (see the below table 21 for the
details). For the five year plan to be fully realized, 27,924Km of different road construction works have to be
carried out per year on average in the coming two years. Particular emphasis should be given for the woreda
roads (URRAP) as the remaining works to be executed in the next three years accounts for 61% (43,895km)
of the overall plan.
An attempt has been made in the following table to indicate the amount of work done in the past three years
by the federal, regional, and woreda road agencies as compared to the overall 5 year plan. As it its depicted
in the Table, 55% of the 5 years plan of the federal roads has been executed in the past three years. On the
other hand, regional roads accomplished 53% of their five year plan. It is reasonable to believe that the five
year plan set out for regional roads could be met within the scheduled time period if the present trend
continues for the next two consecutive years. As far as Woreda roads are concerned, only 39% of the five
years plan has been accomplished during the three years period of time. It is to be recalled that almost the
entire 2010/11 fiscal year was spent on preparatory works of the URRAP, which are deemed important for
the successful implementation of the program. During the reporting period, the federal government has
accorded due attention to the program and allocated a large sum of money for the implementation of the
same. The construction of the roads is now well underway in all regions except Somale and Afar regions.
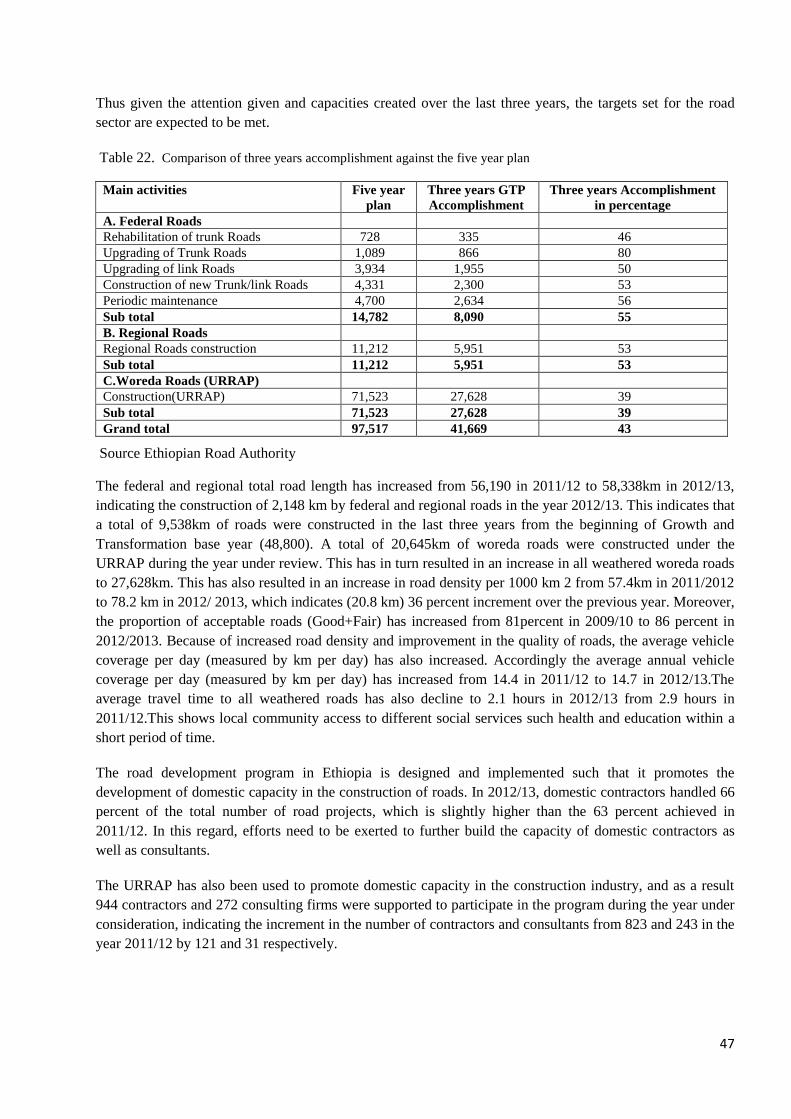
47
Thus given the attention given and capacities created over the last three years, the targets set for the road
sector are expected to be met.
Table 22. Comparison of three years accomplishment against the five year plan
Main activities Five year
plan
Three years GTP
Accomplishment
Three years Accomplishment
in percentage
A. Federal Roads
Rehabilitation of trunk Roads 728 335 46
Upgrading of Trunk Roads 1,089 866 80
Upgrading of link Roads 3,934 1,955 50
Construction of new Trunk/link Roads 4,331 2,300 53
Periodic maintenance 4,700 2,634 56
Sub total 14,782 8,090 55
B. Regional Roads
Regional Roads construction 11,212 5,951 53
Sub total 11,212 5,951 53
C.Woreda Roads (URRAP)
Construction(URRAP) 71,523 27,628 39
Sub total 71,523 27,628 39
Grand total 97,517 41,669 43
Source Ethiopian Road Authority
The federal and regional total road length has increased from 56,190 in 2011/12 to 58,338km in 2012/13,
indicating the construction of 2,148 km by federal and regional roads in the year 2012/13. This indicates that
a total of 9,538km of roads were constructed in the last three years from the beginning of Growth and
Transformation base year (48,800). A total of 20,645km of woreda roads were constructed under the
URRAP during the year under review. This has in turn resulted in an increase in all weathered woreda roads
to 27,628km. This has also resulted in an increase in road density per 1000 km 2 from 57.4km in 2011/2012
to 78.2 km in 2012/ 2013, which indicates (20.8 km) 36 percent increment over the previous year. Moreover,
the proportion of acceptable roads (Good+Fair) has increased from 81percent in 2009/10 to 86 percent in
2012/2013. Because of increased road density and improvement in the quality of roads, the average vehicle
coverage per day (measured by km per day) has also increased. Accordingly the average annual vehicle
coverage per day (measured by km per day) has increased from 14.4 in 2011/12 to 14.7 in 2012/13.The
average travel time to all weathered roads has also decline to 2.1 hours in 2012/13 from 2.9 hours in
2011/12.This shows local community access to different social services such health and education within a
short period of time.
The road development program in Ethiopia is designed and implemented such that it promotes the
development of domestic capacity in the construction of roads. In 2012/13, domestic contractors handled 66
percent of the total number of road projects, which is slightly higher than the 63 percent achieved in
2011/12. In this regard, efforts need to be exerted to further build the capacity of domestic contractors as
well as consultants.
The URRAP has also been used to promote domestic capacity in the construction industry, and as a result
944 contractors and 272 consulting firms were supported to participate in the program during the year under
consideration, indicating the increment in the number of contractors and consultants from 823 and 243 in the
year 2011/12 by 121 and 31 respectively.
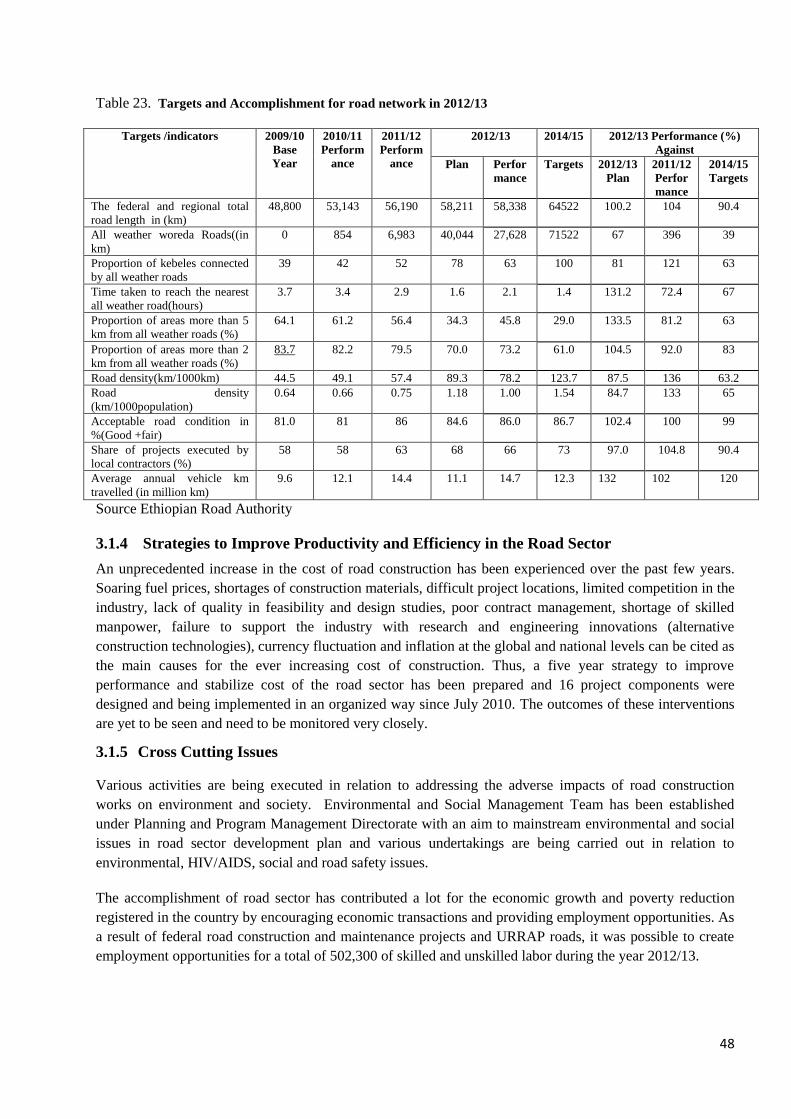
48
Table 23. Targets and Accomplishment for road network in 2012/13
Targets /indicators 2009/10
Base
Year
2010/11
Perform
ance
2011/12
Perform
ance
2012/13
2014/15 2012/13 Performance (%)
Against
Plan Perfor
mance
Targets 2012/13
Plan
2011/12
Perfor
mance
2014/15
Targets
The federal and regional total
road length in (km)
48,800 53,143 56,190 58,211 58,338 64522 100.2 104 90.4
All weather woreda Roads((in
km)
0 854 6,983 40,044 27,628 71522 67 396 39
Proportion of kebeles connected
by all weather roads
39 42 52 78 63 100 81 121 63
Time taken to reach the nearest
all weather road(hours)
3.7 3.4 2.9 1.6 2.1 1.4 131.2 72.4 67
Proportion of areas more than 5
km from all weather roads (%)
64.1 61.2 56.4 34.3 45.8 29.0 133.5 81.2 63
Proportion of areas more than 2
km from all weather roads (%)
83.7 82.2 79.5 70.0 73.2 61.0 104.5 92.0 83
Road density(km/1000km) 44.5 49.1 57.4 89.3 78.2 123.7 87.5 136 63.2
Road density
(km/1000population)
0.64 0.66 0.75 1.18 1.00 1.54 84.7 133 65
Acceptable road condition in
%(Good +fair)
81.0 81 86 84.6 86.0 86.7 102.4 100 99
Share of projects executed by
local contractors (%)
58 58 63 68 66 73 97.0 104.8 90.4
Average annual vehicle km
travelled (in million km)
9.6 12.1 14.4 11.1 14.7 12.3 132 102 120
Source Ethiopian Road Authority
3.1.4 Strategies to Improve Productivity and Efficiency in the Road Sector
An unprecedented increase in the cost of road construction has been experienced over the past few years.
Soaring fuel prices, shortages of construction materials, difficult project locations, limited competition in the
industry, lack of quality in feasibility and design studies, poor contract management, shortage of skilled
manpower, failure to support the industry with research and engineering innovations (alternative
construction technologies), currency fluctuation and inflation at the global and national levels can be cited as
the main causes for the ever increasing cost of construction. Thus, a five year strategy to improve
performance and stabilize cost of the road sector has been prepared and 16 project components were
designed and being implemented in an organized way since July 2010. The outcomes of these interventions
are yet to be seen and need to be monitored very closely.
3.1.5 Cross Cutting Issues
Various activities are being executed in relation to addressing the adverse impacts of road construction
works on environment and society. Environmental and Social Management Team has been established
under Planning and Program Management Directorate with an aim to mainstream environmental and social
issues in road sector development plan and various undertakings are being carried out in relation to
environmental, HIV/AIDS, social and road safety issues.
The accomplishment of road sector has contributed a lot for the economic growth and poverty reduction
registered in the country by encouraging economic transactions and providing employment opportunities. As
a result of federal road construction and maintenance projects and URRAP roads, it was possible to create
employment opportunities for a total of 502,300 of skilled and unskilled labor during the year 2012/13.
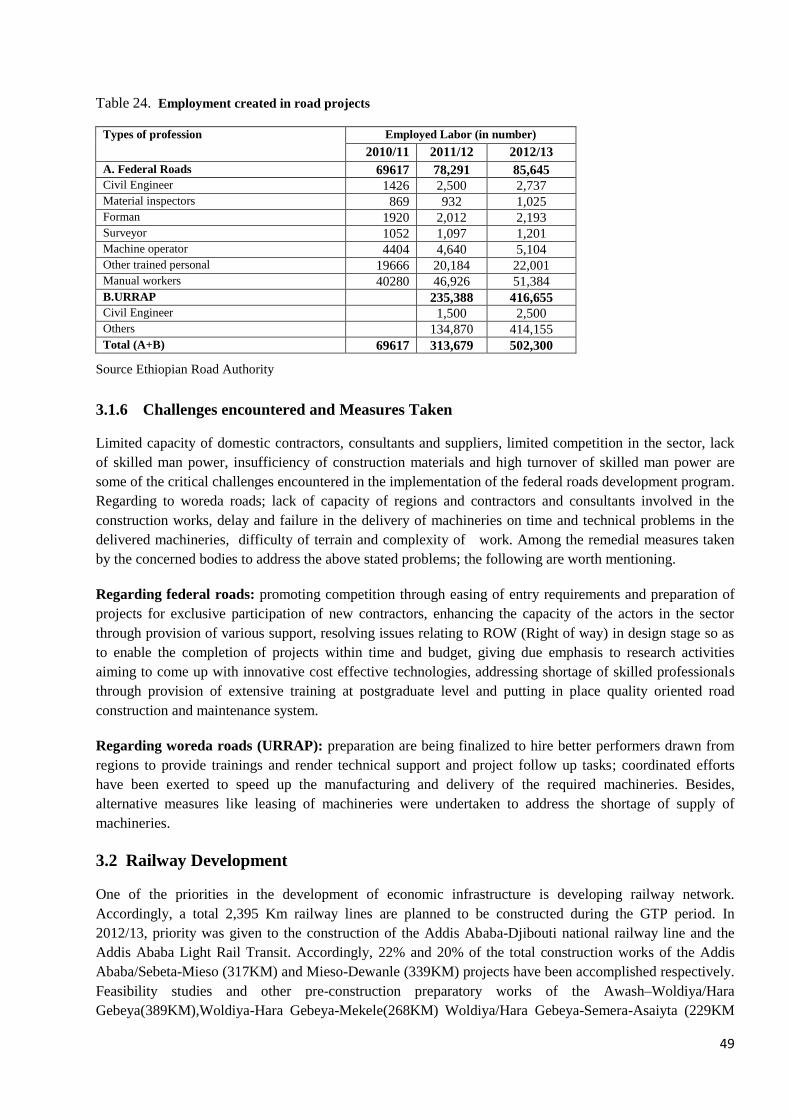
49
Table 24. Employment created in road projects
Types of profession Employed Labor (in number)
2010/11 2011/12 2012/13
A. Federal Roads 69617 78,291 85,645 Civil Engineer 1426 2,500 2,737 Material inspectors 869 932 1,025 Forman 1920 2,012 2,193 Surveyor 1052 1,097 1,201 Machine operator 4404 4,640 5,104 Other trained personal 19666 20,184 22,001 Manual workers 40280 46,926 51,384
B.URRAP 235,388 416,655 Civil Engineer 1,500 2,500 Others 134,870 414,155
Total (A+B) 69617 313,679 502,300
Source Ethiopian Road Authority
3.1.6 Challenges encountered and Measures Taken
Limited capacity of domestic contractors, consultants and suppliers, limited competition in the sector, lack
of skilled man power, insufficiency of construction materials and high turnover of skilled man power are
some of the critical challenges encountered in the implementation of the federal roads development program.
Regarding to woreda roads; lack of capacity of regions and contractors and consultants involved in the
construction works, delay and failure in the delivery of machineries on time and technical problems in the
delivered machineries, difficulty of terrain and complexity of work. Among the remedial measures taken
by the concerned bodies to address the above stated problems; the following are worth mentioning.
Regarding federal roads: promoting competition through easing of entry requirements and preparation of
projects for exclusive participation of new contractors, enhancing the capacity of the actors in the sector
through provision of various support, resolving issues relating to ROW (Right of way) in design stage so as
to enable the completion of projects within time and budget, giving due emphasis to research activities
aiming to come up with innovative cost effective technologies, addressing shortage of skilled professionals
through provision of extensive training at postgraduate level and putting in place quality oriented road
construction and maintenance system.
Regarding woreda roads (URRAP): preparation are being finalized to hire better performers drawn from
regions to provide trainings and render technical support and project follow up tasks; coordinated efforts
have been exerted to speed up the manufacturing and delivery of the required machineries. Besides,
alternative measures like leasing of machineries were undertaken to address the shortage of supply of
machineries.
3.2 Railway Development
One of the priorities in the development of economic infrastructure is developing railway network.
Accordingly, a total 2,395 Km railway lines are planned to be constructed during the GTP period. In
2012/13, priority was given to the construction of the Addis Ababa-Djibouti national railway line and the
Addis Ababa Light Rail Transit. Accordingly, 22% and 20% of the total construction works of the Addis
Ababa/Sebeta-Mieso (317KM) and Mieso-Dewanle (339KM) projects have been accomplished respectively.
Feasibility studies and other pre-construction preparatory works of the Awash–Woldiya/Hara
Gebeya(389KM),Woldiya-Hara Gebeya-Mekele(268KM) Woldiya/Hara Gebeya-Semera-Asaiyta (229KM
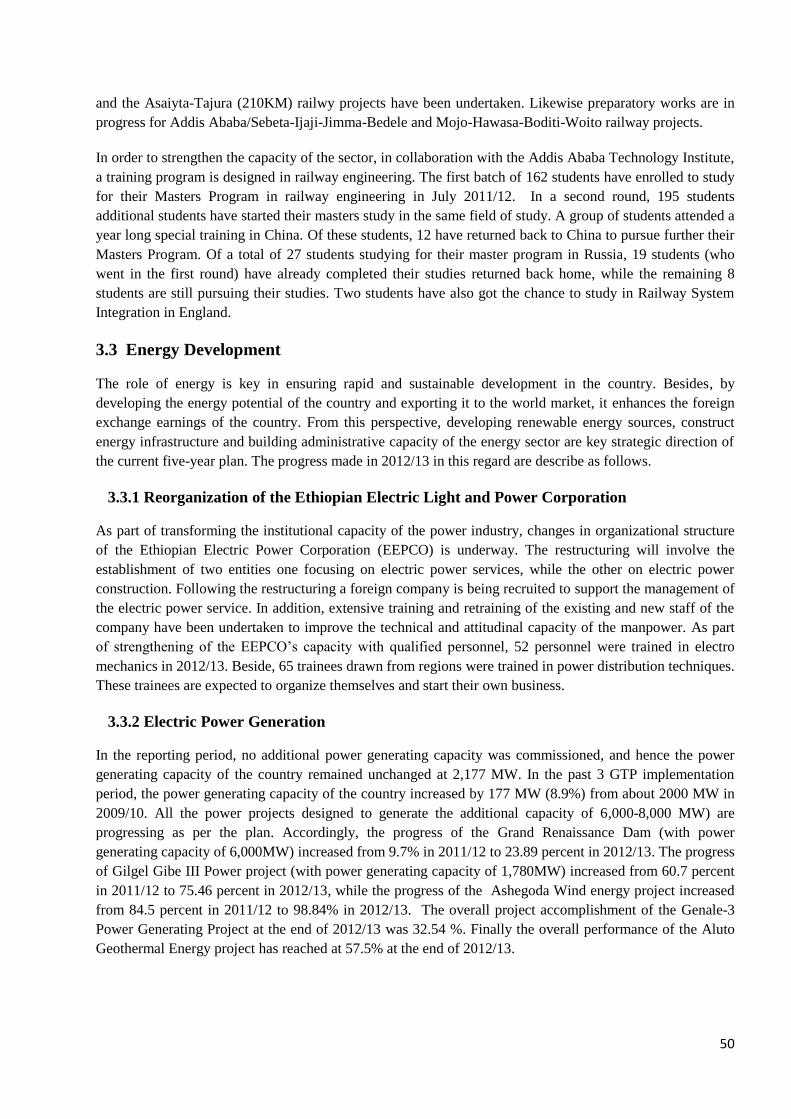
50
and the Asaiyta-Tajura (210KM) railwy projects have been undertaken. Likewise preparatory works are in
progress for Addis Ababa/Sebeta-Ijaji-Jimma-Bedele and Mojo-Hawasa-Boditi-Woito railway projects.
In order to strengthen the capacity of the sector, in collaboration with the Addis Ababa Technology Institute,
a training program is designed in railway engineering. The first batch of 162 students have enrolled to study
for their Masters Program in railway engineering in July 2011/12. In a second round, 195 students
additional students have started their masters study in the same field of study. A group of students attended a
year long special training in China. Of these students, 12 have returned back to China to pursue further their
Masters Program. Of a total of 27 students studying for their master program in Russia, 19 students (who
went in the first round) have already completed their studies returned back home, while the remaining 8
students are still pursuing their studies. Two students have also got the chance to study in Railway System
Integration in England.
3.3 Energy Development
The role of energy is key in ensuring rapid and sustainable development in the country. Besides, by
developing the energy potential of the country and exporting it to the world market, it enhances the foreign
exchange earnings of the country. From this perspective, developing renewable energy sources, construct
energy infrastructure and building administrative capacity of the energy sector are key strategic direction of
the current five-year plan. The progress made in 2012/13 in this regard are describe as follows.
3.3.1 Reorganization of the Ethiopian Electric Light and Power Corporation
As part of transforming the institutional capacity of the power industry, changes in organizational structure
of the Ethiopian Electric Power Corporation (EEPCO) is underway. The restructuring will involve the
establishment of two entities one focusing on electric power services, while the other on electric power
construction. Following the restructuring a foreign company is being recruited to support the management of
the electric power service. In addition, extensive training and retraining of the existing and new staff of the
company have been undertaken to improve the technical and attitudinal capacity of the manpower. As part
of strengthening of the EEPCO’s capacity with qualified personnel, 52 personnel were trained in electro
mechanics in 2012/13. Beside, 65 trainees drawn from regions were trained in power distribution techniques.
These trainees are expected to organize themselves and start their own business.
3.3.2 Electric Power Generation
In the reporting period, no additional power generating capacity was commissioned, and hence the power
generating capacity of the country remained unchanged at 2,177 MW. In the past 3 GTP implementation
period, the power generating capacity of the country increased by 177 MW (8.9%) from about 2000 MW in
2009/10. All the power projects designed to generate the additional capacity of 6,000-8,000 MW) are
progressing as per the plan. Accordingly, the progress of the Grand Renaissance Dam (with power
generating capacity of 6,000MW) increased from 9.7% in 2011/12 to 23.89 percent in 2012/13. The progress
of Gilgel Gibe III Power project (with power generating capacity of 1,780MW) increased from 60.7 percent
in 2011/12 to 75.46 percent in 2012/13, while the progress of the Ashegoda Wind energy project increased
from 84.5 percent in 2011/12 to 98.84% in 2012/13. The overall project accomplishment of the Genale-3
Power Generating Project at the end of 2012/13 was 32.54 %. Finally the overall performance of the Aluto
Geothermal Energy project has reached at 57.5% at the end of 2012/13.
51
Table 25. Energy Sector Performance (2012/13)
(2010) 2010/11 2011/12 2012/12 2012/13 Cumulative
Performance
Up to 2012/13
The 2012/13 performance (%) against
No Indicators Base Year Actual Actual Target Actual 2010/11
Perf.
2011/1
2 perf.
2013
Target
1 Power Generation Capacity(MW)
2,000 48.5 128.5 940 0 2,177 0 0 0
2 400KV Transmission
Line(KM)
710 … … 372 397 1,107 0 0 106.7
3 230,132 and 66KV Transmission Line (KM)
10,730 … 20.93 2,853.07 967.07 11,718 0 4620.5 33.9
4 Distribution Line(KM) 126,038 12,794 14398 19,008 1,457 154,687 11.4 10.1 7.7
5 Distribution Line
Rehabilitation(KM)
450 517 721 4,006 1,383 3,071 267.5 191.8 34.5
6 Electric Access (%) 41 4.4 3.1 16.5 5 53.5 113.6
7 Power Loss (%) 21.4 0.43 2 13..37 5.17 13.8 1,202
Source: Ministry of Water and Energy
3.3.3 Electric Power Transmission and Distribution Lines
In 2012/13, a total of 3,324 KM additional power transmission lines were planned to be constructed (434KM
of 500KV Ethio-Kenya High Voltage Direct Current regional connection, 372KM of 400KV, 2,518KM
230KV, 132KV and 66KV), but the actual accomplishment was only 1,029 KM (31%). Accordingly, in the
past three years of GTP implementation, the total power transmission lines was planned to increase from
11,440 KM in 2009/10 to 15,120 Km in 2012/13 by constructing 3,680 KM additional lines. The actual
accomplishment was 1,385 KM (37.6 %) and accordingly the total power transmission line increased to
12,825 KM in 2012/13.
On the other hand, it was planned to construct a total of 19,008 KM power distribution lines in 2012/13.
However only 1,475 KM (7.7%) lines were constructed. In the past three years, the power distribution lines
were targeted to increase from 126,038 KM in 2009/10 to 172,238 (by constructing 46,200 KM additional
line) in 2012/13. Actually only 28,649 KM (62% of the target) of distribution lines were constructed and
consequently the total length of the distribution line in Ethiopia has increased to 154,687 KM in 2012/13.
Electricity access has therefore increased from 41% in 2009/10 to 53.5% in 2012/13. In the past three years
of GTP, a total of 2,978 towns and villages were targeted to benefit from electricity services. By the end of
the third year a total of 2,046 towns and villages (68.7% of the target) have been connected to grid of which
1,760 towns and villages (86%) are getting electric energy.
As a result of the investments in transmission and distribution lines, total power loss has decreased from
21.4% in 2009/10 to 18.97% in 2011/12 and 13.8% in 2012/13 against a target of 5.6 %. In spite of the
investments in infrastructure and capacity building described above, electricity interruptions and fluctuations
remained serious challenges during the year under review. Power supply network and internal technical
problems, inefficiency as well as some external man-made and natural problems explain the problems of
power interruptions and fluctuations. The lasting solution to the problems are deepening the undergoing
institutional reforms, and accelerating the implementation of the investments in the sector.
3.3.4 Bio-fuel Development
In 2012/13, about 14.07 million hectare of land suitable for bio-fuel development was identified. During the
past three years of GTP implementation, a total of 16.6 million hectare of land suitable for bio-fuel
development was identified. This land is more readily available for investment in bio-fuel development like
jatrofa and caster plantations. In 2012/13, 6.54 million liters of ethanol was produced and 8.63 million was
blended. Compared to the 2011/12 performance, ethanol production has decreased by 7.26 million liters
(111%) and blended ethanol increased by 3.98 million liters (85.6%). Over the last three years a total
production and blended of 52.88million liters, of 40.48million liters of ethanol were produced, while
52
39.27million liters were blended. In the reporting period, 3 ethanol mixing facilities are constructed at fuel
stations, three (75 %) have constructed.
3.3.5 Alternative Energy Technology Promotion
In collaboration with stakeholders, a total of 2,004,751 improved bio-mass stoves were distributed in
2012/13. The performance registered in the fiscal year is 8.4 percent higher than the 1,850,000 stoves
targeted for distribution in the same fiscal year. The performance is also 34.7 percent higher compared with
the performance of the preceding year. In the last three years of GTP , 4.91million improved stoves were
distributed against the plan of 5.07million. Furthermore, of the targeted 4,280 Bio-gas plants for 2012/13, a
total of 3,147 plants (73.5 %) were constructed and become operational.
With regard to solar energy, the target was to distribute and install 627417 solar energy technologies in
2012/13, while the achievement was 120777 (19.25 % of the target). However, the performance registered in
the fiscal year is higher than the 215 solar energy technologies distributed and installed in 2011/12. In the
last three years, the plan was to distribute and install a total of 1,184,480 solar energy technologies while the
achievement was 614,399 (52 % of the target). The performance registered in the last three years is 19.4 %
of the target set in the GTP for the end of the plan period. In general achievements registered in the last three
years in solar energy distribution and installation as well as improved stoves distribution is encouraging, but
clearly requires additional efforts to fully achieve the targets set in the GTP.
3.3.6 Electric Power Operation Regulation
In 2012/13, the plan was to issue and renew licenses for a total of 34 investors in the area of energy
development. Accordingly, 13 new licenses and 11 operational licenses, in total 24 licenses were issued and
renewed. In the last three GTP years, a total of 83 investors were given license issuance and renewal
services. In the fiscal year under review, Occupation Competency Certificates were also issued to 215
professionals. In addition, over the last three GTP years, a total of 406 professionals and technicians were
issued with the relevant Occupational Competency Certificate in electric installation. While this may appear
large, occupational competency certification in electric installation and related trades should be aggressively
expanded to ensure adequate supply of competent professionals and technicians to the fast growing energy
industry.
3.3.7 Petroleum Downstream Operation Regulation
In 2012/13, 751 Petroleum Retail Outlets (125 % of the target) against 600 Petroleum Retail Outlets targeted
have been inspected (based on a checklist) for their service delivery, environmental protection, technical
efficiency, safety, equitable distribution and other parameters. In addition, standards and specifications for
237 petroleum and petroleum products were made in 2012/13. The number of petroleum downstream
businesses and downstream facilities inspected for their quality of service delivery, environmental protection
and technical efficiency were 1,074 against the targeted 993.
In the past three years of the GTP, a draft proclamation for petroleum and petroleum products operations
administration was completed and submitted to the Council of Ministers for approval. A total of 344
standards and specification for petroleum and petroleum products were prepared by the Council for National
Standards. Major problems encountered and Possible Solutions:
Institutional reforms are underway in Ethiopia Electric Power Corporation (EEPCo). However, these
reforms have not yet resulted in the desired level of institutional capability in the area of electric power
development and administration. Specially, the quality of electric service delivery remains a serious
challenge. Likewise the domestic capacity in project planning and management, as well as in financial
resource mobilization, do not match the demands of the country’s energy development programs. It is,
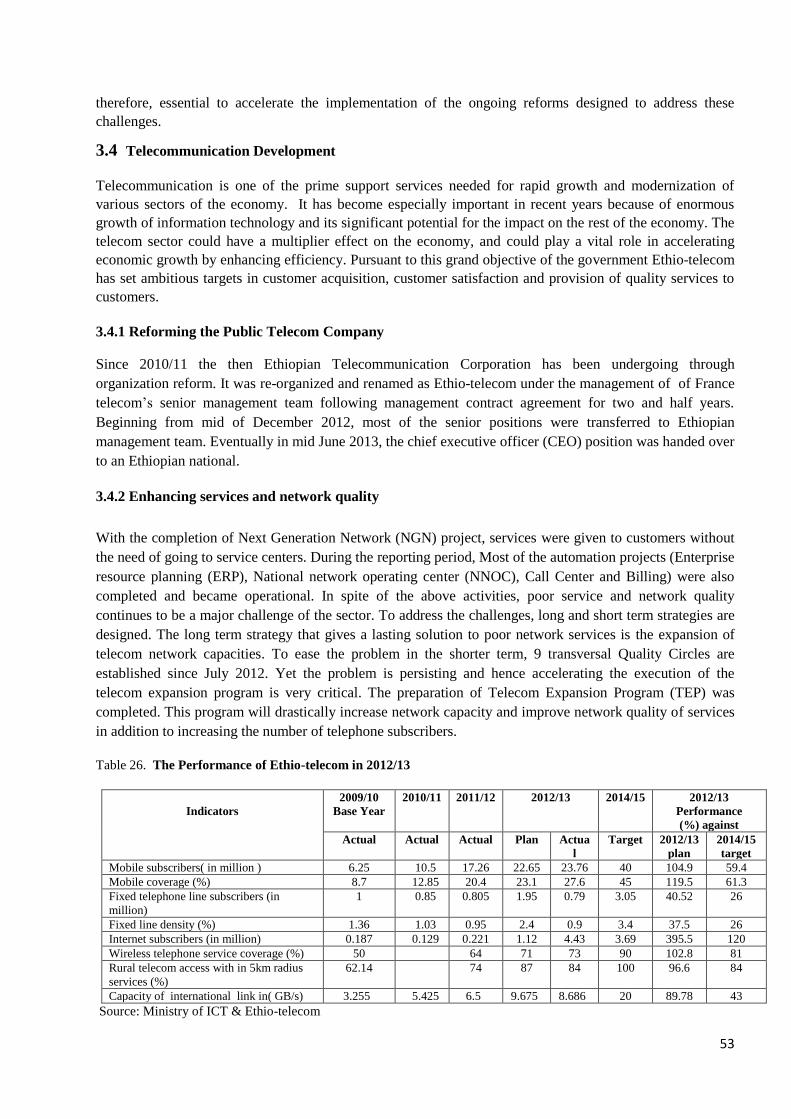
53
therefore, essential to accelerate the implementation of the ongoing reforms designed to address these
challenges.
3.4 Telecommunication Development
Telecommunication is one of the prime support services needed for rapid growth and modernization of
various sectors of the economy. It has become especially important in recent years because of enormous
growth of information technology and its significant potential for the impact on the rest of the economy. The
telecom sector could have a multiplier effect on the economy, and could play a vital role in accelerating
economic growth by enhancing efficiency. Pursuant to this grand objective of the government Ethio-telecom
has set ambitious targets in customer acquisition, customer satisfaction and provision of quality services to
customers.
3.4.1 Reforming the Public Telecom Company
Since 2010/11 the then Ethiopian Telecommunication Corporation has been undergoing through
organization reform. It was re-organized and renamed as Ethio-telecom under the management of of France
telecom’s senior management team following management contract agreement for two and half years.
Beginning from mid of December 2012, most of the senior positions were transferred to Ethiopian
management team. Eventually in mid June 2013, the chief executive officer (CEO) position was handed over
to an Ethiopian national.
3.4.2 Enhancing services and network quality
With the completion of Next Generation Network (NGN) project, services were given to customers without
the need of going to service centers. During the reporting period, Most of the automation projects (Enterprise
resource planning (ERP), National network operating center (NNOC), Call Center and Billing) were also
completed and became operational. In spite of the above activities, poor service and network quality
continues to be a major challenge of the sector. To address the challenges, long and short term strategies are
designed. The long term strategy that gives a lasting solution to poor network services is the expansion of
telecom network capacities. To ease the problem in the shorter term, 9 transversal Quality Circles are
established since July 2012. Yet the problem is persisting and hence accelerating the execution of the
telecom expansion program is very critical. The preparation of Telecom Expansion Program (TEP) was
completed. This program will drastically increase network capacity and improve network quality of services
in addition to increasing the number of telephone subscribers.
Table 26. The Performance of Ethio-telecom in 2012/13
Indicators
2009/10
Base Year
2010/11 2011/12 2012/13 2014/15 2012/13
Performance
(%) against
Actual Actual Actual Plan Actua
l
Target 2012/13
plan
2014/15
target
Mobile subscribers( in million ) 6.25 10.5 17.26 22.65 23.76 40 104.9 59.4
Mobile coverage (%) 8.7 12.85 20.4 23.1 27.6 45 119.5 61.3
Fixed telephone line subscribers (in
million)
1 0.85 0.805 1.95 0.79 3.05 40.52 26
Fixed line density (%) 1.36 1.03 0.95 2.4 0.9 3.4 37.5 26
Internet subscribers (in million) 0.187 0.129 0.221 1.12 4.43 3.69 395.5 120
Wireless telephone service coverage (%) 50 64 71 73 90 102.8 81
Rural telecom access with in 5km radius
services (%)
62.14 74 87 84 100 96.6 84
Capacity of international link in( GB/s) 3.255 5.425 6.5 9.675 8.686 20 89.78 43
Source: Ministry of ICT & Ethio-telecom
54
3.4.3 Service coverage
By 2012/13, the total subscriber base was 28.98 million compared to 20.73 million in 2011/12, indicating
growth of 39%. The number of mobile and fixed telephone line subscribers were 23.76 million and 0.79
million respectively. Similarly mobile coverage was 27.6 percent, and fixed line density was 0.9 percent.
The number of internet subscribers was 4.43 million in 2012/13. In absolute terms the highest growth is
achieved in mobile subscription - more than 6.5 million additional subscribers within a year and more than
17.24 million additional subscribers over the last three GTP years . Similarly, the wireless telephone service
coverage increased from 71% in 2011/12 to 73% in 2012/13.
The Growth and Transformation Plan envisages to have 40 million mobile telephone subscribers at the end
of 2014/15. Ethio-telecom has planned to achieve this target by deploying additional 30 million mobile
subscriber capacities through the Telecom Expansion Program (TEP). Already, 59.4 percent of the plan is
accomplished over the last three years of the GTP, and the balance would be accomplished over the
remaining two GTP years.
In contrast , the number of subscribers for fixed line has declined from 0.805 million in 2011/12 to 0.79
million in 2012/13. This is mainly due to the expansion of mobile service and huge relocation activities in
Addis Ababa for infrastructure and urban constructions. In addition, customer preferences to mobile
compared to fixed line services explain the prevailing structure of demand.
Internet and data subscriber base achievement was above the target for the end of GTP period mainly due to
the expansion of the mobile internet (GPRS). Accordingly, the number of subscribers has increased from
0.221 million in 2011/12 to 4.43 million in 2012/13. The GTP target for internet and data services is 3.69
million at the end of 2014/15. Ethio telecom has planned to reach 4 million broad band and 7.5 million
narrow band customer base.
The rural telecom access within 5 km radius service has also increased from 74% in 2011/12 to 84% in
2012/13. Accordingly, 13,506 (84 percent of the five year) kebeles are connected through the rural
connectivity program. More than 2,700 Kebeles will be connected over the coming period to ensure
universal telecom connectivity of 100% coverage before the end of the GTP period. The capacity of
international link in (GB/s) has also increased from 6.5GB/s in 2011/12 to 8.686 GB/s in 2012/13.
3.5.1 Expansion of information technology
In 2012/13, 13 government offices benefitted from the installation of ICT based government information
system. This brings the total number of government offices that benefited from the installation of ICT based
government information system to 45. The Ethio-ICT Village, located in Addis Ababa, has seen major
infrastructural development. One mobile apparatus assembly company has secured a plot of land and has
commenced preliminary activities in the ICT village to build its own premises. Likewise, a South African
based company has secured a plot of land in the park to start building its center. Similarly, preparation has
been made to register an Indian company for leased office space in the ICT village. The park will provide
impetus for the development of the ICT sector in the country by offering a world class business
environment, destination for foreign investment and foreign earnings and employment opportunities for
Ethiopians when it opens at its full capacity.
55
3.5.2 Promoting Community Use of Information Technology
It was planned to build 10 centers which can serve community in the field of information communication.
However, 80 social centers were established with a view to make the society a beneficiary of information
technology. The number of information service centers that serve as communication bridges between the
public and government has now increased to 100. Similarly, 7 community based radio centers were
constructed against the target of 2 centers during the fiscal year. In addition, two community based radio
centers installations were accomplished during the fiscal year. Likewise, 80 public information provision
centers were established against the targeted of 20 centers. Three centers were established to deliver the
online unified billing system and the progress is low compared to the targeted 60 centers in the fiscal year.
Three types of services have implemented and deliver service in 33 centers in Addis Ababa city during the
budget year.
3.5.3 Supporting Agriculture-led Industrial Development and Export
During the fiscal year about 80 transactional services have been developed against the targeted 30 services
so as to develop and make use of information communication technology to foster the aagricultural- lead
industrialization strategy and export promoting strategy.
3.5.4 Accelerating Information Technology Assisted Social development
The goals with regard to accelerating information technology assisted social development have been
accomplished and have enabled to broaden the scope of quality of education and health services. Similarly,
with regard to developed informational and transactional services to enhance the quality of education, 15
information communication technology supported education facilities were developed against the targeted 4
ICT targeted facilities.
3.5.5 Developing public participation for good governance
In order to insure good governance and enhance public participation, uninterrupted network capacity has
reached to 30 percent. The performance is 10% higher than the targeted 20 percent. Due attention has given
to this need, and further actions will be taken to strength and optimize the government information network
and infrastructure development in the sector. Established communication forums between national and
international ICT companies & organizations to enhance international relations.
Three ICT companies have already started collaboration with the domestic information communication
companies to enhance capacity building and knowledge transfer. The target is 100 percent accomplished
during the fiscal year. In addition to this, three researches have conducted so as to support and enhance
expansion of information communication technology and attract sound investment and investors in the
sector.
3.5.6 Producing trained manpower in due quality and quantity
In the field of ICT’s related subjects, various training programs were planned to be delivered to about 400
workers but was only given to 214. In addition, trainers’ training on ICT was planned to be given to 2185
primary school teachers and was 100 percent accomplished. Likewise a training program was planned for
2119 secondary school (9-10 Grades) teachers and it was actually delivered to 100 percent performance. Due
to budget constraint TVET teachers were not trained during the fiscal year.
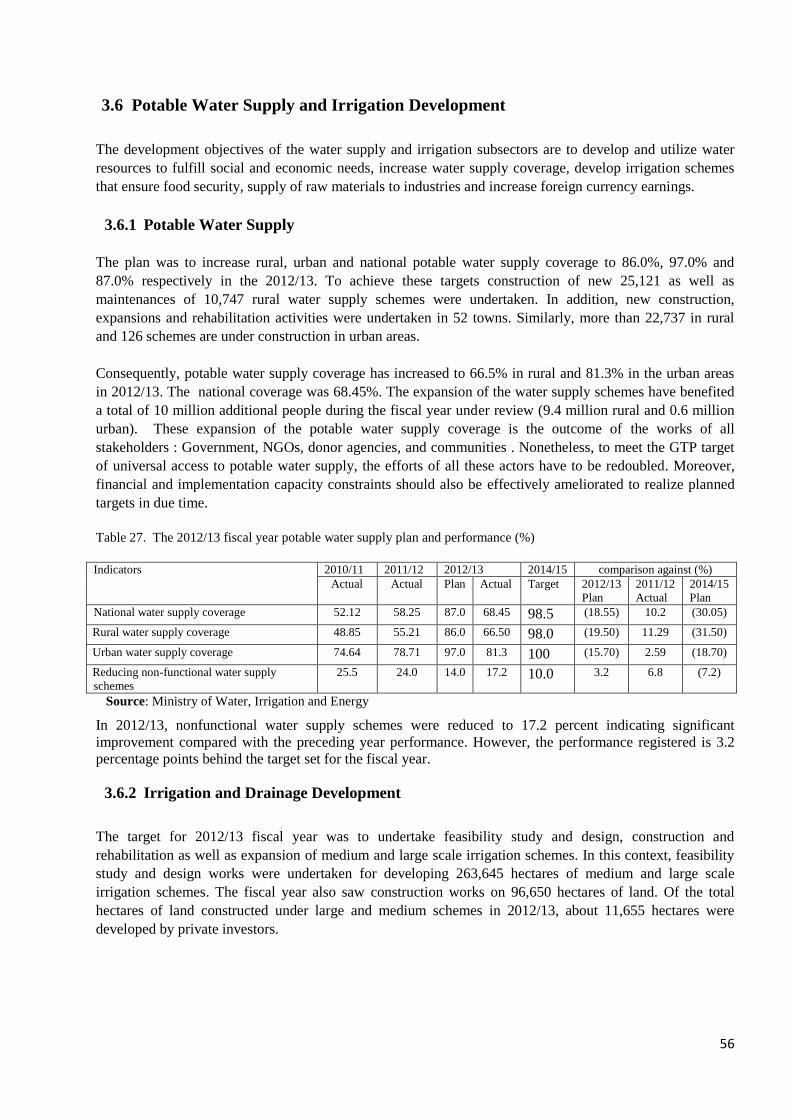
56
3.6 Potable Water Supply and Irrigation Development
The development objectives of the water supply and irrigation subsectors are to develop and utilize water
resources to fulfill social and economic needs, increase water supply coverage, develop irrigation schemes
that ensure food security, supply of raw materials to industries and increase foreign currency earnings.
3.6.1 Potable Water Supply
The plan was to increase rural, urban and national potable water supply coverage to 86.0%, 97.0% and
87.0% respectively in the 2012/13. To achieve these targets construction of new 25,121 as well as
maintenances of 10,747 rural water supply schemes were undertaken. In addition, new construction,
expansions and rehabilitation activities were undertaken in 52 towns. Similarly, more than 22,737 in rural
and 126 schemes are under construction in urban areas.
Consequently, potable water supply coverage has increased to 66.5% in rural and 81.3% in the urban areas
in 2012/13. The national coverage was 68.45%. The expansion of the water supply schemes have benefited
a total of 10 million additional people during the fiscal year under review (9.4 million rural and 0.6 million
urban). These expansion of the potable water supply coverage is the outcome of the works of all
stakeholders : Government, NGOs, donor agencies, and communities . Nonetheless, to meet the GTP target
of universal access to potable water supply, the efforts of all these actors have to be redoubled. Moreover,
financial and implementation capacity constraints should also be effectively ameliorated to realize planned
targets in due time.
Table 27. The 2012/13 fiscal year potable water supply plan and performance (%)
Indicators 2010/11 2011/12 2012/13 2014/15 comparison against (%)
Actual Actual Plan Actual Target 2012/13
Plan
2011/12
Actual
2014/15
Plan
National water supply coverage 52.12 58.25 87.0 68.45 98.5 (18.55) 10.2 (30.05)
Rural water supply coverage 48.85 55.21 86.0 66.50 98.0 (19.50) 11.29 (31.50)
Urban water supply coverage 74.64 78.71 97.0 81.3 100 (15.70) 2.59 (18.70)
Reducing non-functional water supply
schemes
25.5 24.0 14.0 17.2 10.0 3.2 6.8 (7.2)
Source: Ministry of Water, Irrigation and Energy
In 2012/13, nonfunctional water supply schemes were reduced to 17.2 percent indicating significant
improvement compared with the preceding year performance. However, the performance registered is 3.2
percentage points behind the target set for the fiscal year.
3.6.2 Irrigation and Drainage Development
The target for 2012/13 fiscal year was to undertake feasibility study and design, construction and
rehabilitation as well as expansion of medium and large scale irrigation schemes. In this context, feasibility
study and design works were undertaken for developing 263,645 hectares of medium and large scale
irrigation schemes. The fiscal year also saw construction works on 96,650 hectares of land. Of the total
hectares of land constructed under large and medium schemes in 2012/13, about 11,655 hectares were
developed by private investors.
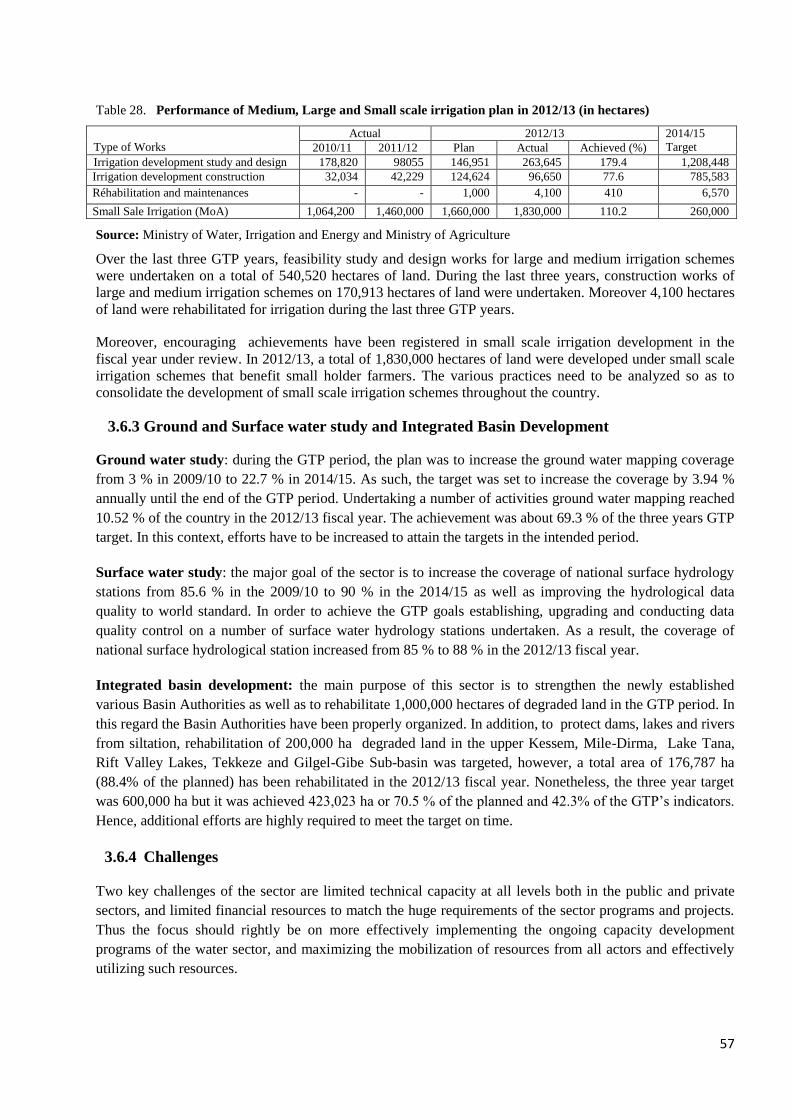
57
Table 28. Performance of Medium, Large and Small scale irrigation plan in 2012/13 (in hectares)
Type of Works
Actual 2012/13 2014/15
Target 2010/11 2011/12 Plan Actual Achieved (%)
Irrigation development study and design 178,820 98055 146,951 263,645 179.4 1,208,448
Irrigation development construction 32,034 42,229 124,624 96,650 77.6 785,583
Réhabilitation and maintenances - - 1,000 4,100 410 6,570
Small Sale Irrigation (MoA) 1,064,200 1,460,000 1,660,000 1,830,000 110.2 260,000
Source: Ministry of Water, Irrigation and Energy and Ministry of Agriculture
Over the last three GTP years, feasibility study and design works for large and medium irrigation schemes
were undertaken on a total of 540,520 hectares of land. During the last three years, construction works of
large and medium irrigation schemes on 170,913 hectares of land were undertaken. Moreover 4,100 hectares
of land were rehabilitated for irrigation during the last three GTP years.
Moreover, encouraging achievements have been registered in small scale irrigation development in the
fiscal year under review. In 2012/13, a total of 1,830,000 hectares of land were developed under small scale
irrigation schemes that benefit small holder farmers. The various practices need to be analyzed so as to
consolidate the development of small scale irrigation schemes throughout the country.
3.6.3 Ground and Surface water study and Integrated Basin Development
Ground water study: during the GTP period, the plan was to increase the ground water mapping coverage
from 3 % in 2009/10 to 22.7 % in 2014/15. As such, the target was set to increase the coverage by 3.94 %
annually until the end of the GTP period. Undertaking a number of activities ground water mapping reached
10.52 % of the country in the 2012/13 fiscal year. The achievement was about 69.3 % of the three years GTP
target. In this context, efforts have to be increased to attain the targets in the intended period.
Surface water study: the major goal of the sector is to increase the coverage of national surface hydrology
stations from 85.6 % in the 2009/10 to 90 % in the 2014/15 as well as improving the hydrological data
quality to world standard. In order to achieve the GTP goals establishing, upgrading and conducting data
quality control on a number of surface water hydrology stations undertaken. As a result, the coverage of
national surface hydrological station increased from 85 % to 88 % in the 2012/13 fiscal year.
Integrated basin development: the main purpose of this sector is to strengthen the newly established
various Basin Authorities as well as to rehabilitate 1,000,000 hectares of degraded land in the GTP period. In
this regard the Basin Authorities have been properly organized. In addition, to protect dams, lakes and rivers
from siltation, rehabilitation of 200,000 ha degraded land in the upper Kessem, Mile-Dirma, Lake Tana,
Rift Valley Lakes, Tekkeze and Gilgel-Gibe Sub-basin was targeted, however, a total area of 176,787 ha
(88.4% of the planned) has been rehabilitated in the 2012/13 fiscal year. Nonetheless, the three year target
was 600,000 ha but it was achieved 423,023 ha or 70.5 % of the planned and 42.3% of the GTP’s indicators.
Hence, additional efforts are highly required to meet the target on time.
3.6.4 Challenges
Two key challenges of the sector are limited technical capacity at all levels both in the public and private
sectors, and limited financial resources to match the huge requirements of the sector programs and projects.
Thus the focus should rightly be on more effectively implementing the ongoing capacity development
programs of the water sector, and maximizing the mobilization of resources from all actors and effectively
utilizing such resources.
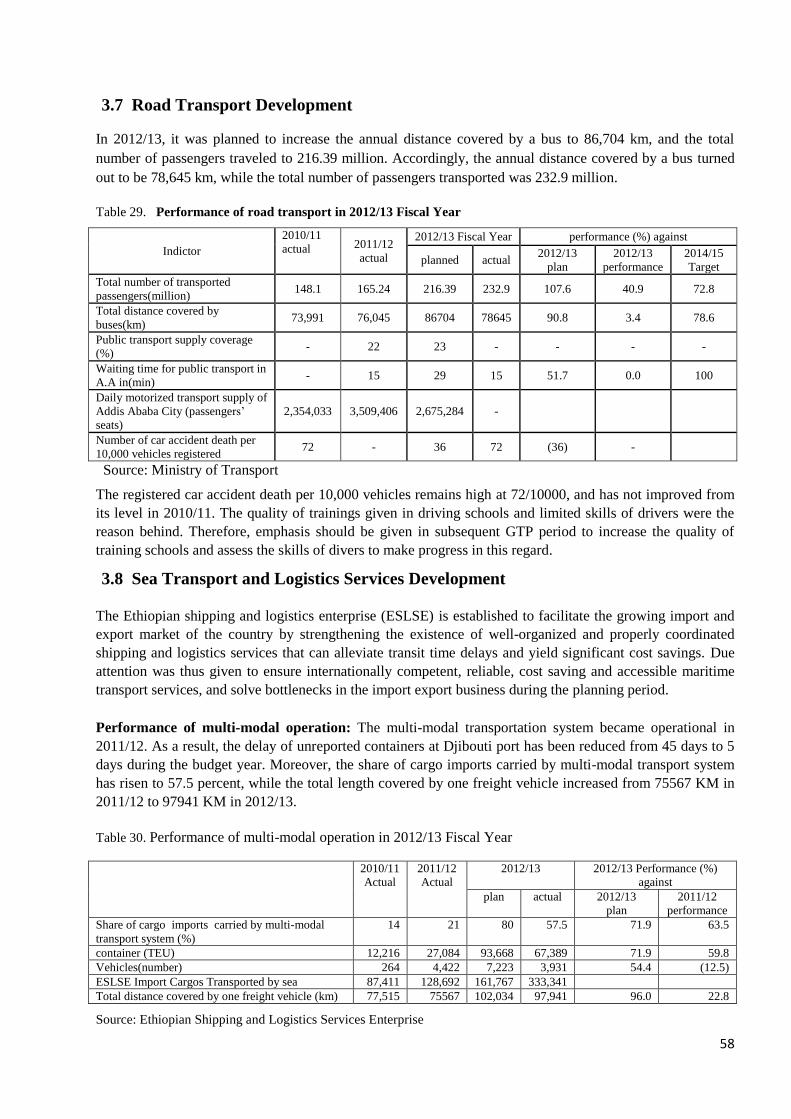
58
3.7 Road Transport Development
In 2012/13, it was planned to increase the annual distance covered by a bus to 86,704 km, and the total
number of passengers traveled to 216.39 million. Accordingly, the annual distance covered by a bus turned
out to be 78,645 km, while the total number of passengers transported was 232.9 million.
Table 29. Performance of road transport in 2012/13 Fiscal Year
Indictor
2010/11
actual 2011/12
actual
2012/13 Fiscal Year performance (%) against
planned actual 2012/13
plan
2012/13
performance
2014/15
Target
Total number of transported
passengers(million) 148.1 165.24 216.39 232.9 107.6 40.9 72.8
Total distance covered by
buses(km) 73,991 76,045 86704 78645 90.8 3.4 78.6
Public transport supply coverage
(%) - 22 23 - - - -
Waiting time for public transport in
A.A in(min) - 15 29 15 51.7 0.0 100
Daily motorized transport supply of
Addis Ababa City (passengers’
seats)
2,354,033 3,509,406 2,675,284 -
Number of car accident death per
10,000 vehicles registered 72 - 36 72 (36) -
Source: Ministry of Transport
The registered car accident death per 10,000 vehicles remains high at 72/10000, and has not improved from
its level in 2010/11. The quality of trainings given in driving schools and limited skills of drivers were the
reason behind. Therefore, emphasis should be given in subsequent GTP period to increase the quality of
training schools and assess the skills of divers to make progress in this regard.
3.8 Sea Transport and Logistics Services Development
The Ethiopian shipping and logistics enterprise (ESLSE) is established to facilitate the growing import and
export market of the country by strengthening the existence of well-organized and properly coordinated
shipping and logistics services that can alleviate transit time delays and yield significant cost savings. Due
attention was thus given to ensure internationally competent, reliable, cost saving and accessible maritime
transport services, and solve bottlenecks in the import export business during the planning period.
Performance of multi-modal operation: The multi-modal transportation system became operational in
2011/12. As a result, the delay of unreported containers at Djibouti port has been reduced from 45 days to 5
days during the budget year. Moreover, the share of cargo imports carried by multi-modal transport system
has risen to 57.5 percent, while the total length covered by one freight vehicle increased from 75567 KM in
2011/12 to 97941 KM in 2012/13.
Table 30. Performance of multi-modal operation in 2012/13 Fiscal Year
2010/11
Actual
2011/12
Actual
2012/13
2012/13 Performance (%)
against
plan actual 2012/13
plan
2011/12
performance
Share of cargo imports carried by multi-modal
transport system (%)
14 21 80 57.5 71.9 63.5
container (TEU) 12,216 27,084 93,668 67,389 71.9 59.8
Vehicles(number) 264 4,422 7,223 3,931 54.4 (12.5)
ESLSE Import Cargos Transported by sea 87,411 128,692 161,767 333,341
Total distance covered by one freight vehicle (km) 77,515 75567 102,034 97,941 96.0 22.8
Source: Ethiopian Shipping and Logistics Services Enterprise
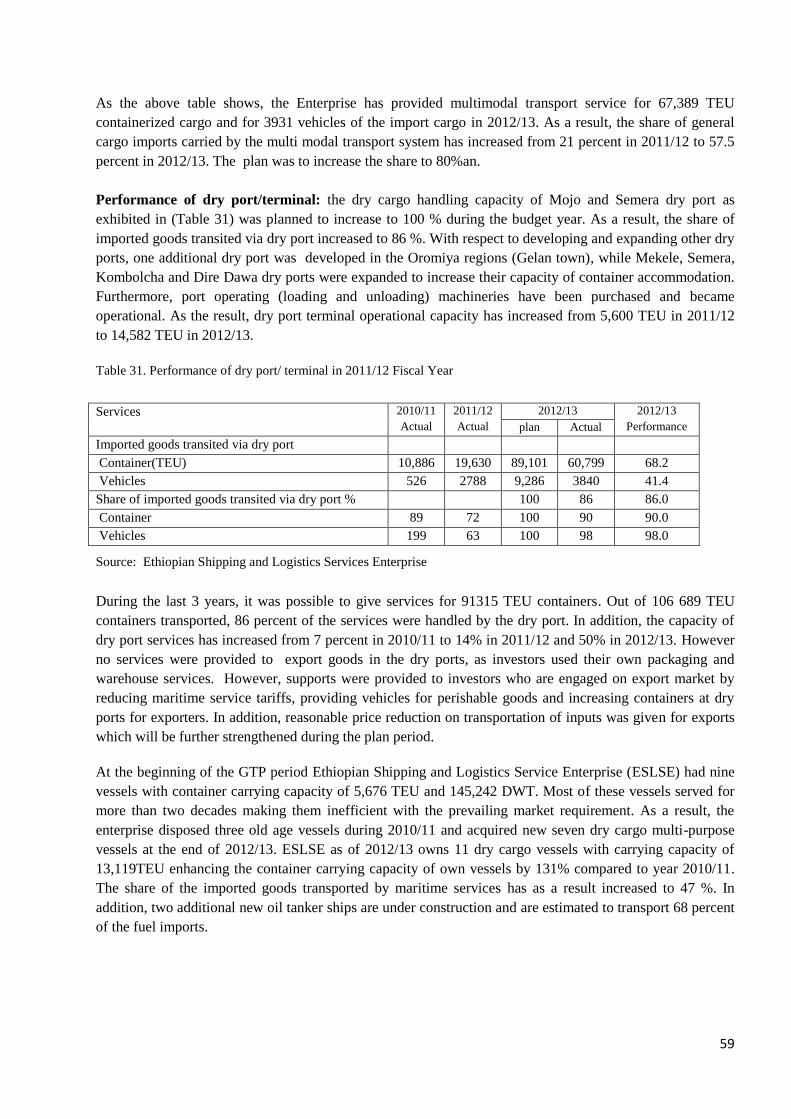
59
As the above table shows, the Enterprise has provided multimodal transport service for 67,389 TEU
containerized cargo and for 3931 vehicles of the import cargo in 2012/13. As a result, the share of general
cargo imports carried by the multi modal transport system has increased from 21 percent in 2011/12 to 57.5
percent in 2012/13. The plan was to increase the share to 80%an.
Performance of dry port/terminal: the dry cargo handling capacity of Mojo and Semera dry port as
exhibited in (Table 31) was planned to increase to 100 % during the budget year. As a result, the share of
imported goods transited via dry port increased to 86 %. With respect to developing and expanding other dry
ports, one additional dry port was developed in the Oromiya regions (Gelan town), while Mekele, Semera,
Kombolcha and Dire Dawa dry ports were expanded to increase their capacity of container accommodation.
Furthermore, port operating (loading and unloading) machineries have been purchased and became
operational. As the result, dry port terminal operational capacity has increased from 5,600 TEU in 2011/12
to 14,582 TEU in 2012/13.
Table 31. Performance of dry port/ terminal in 2011/12 Fiscal Year
Services 2010/11
Actual
2011/12
Actual
2012/13 2012/13
Performance plan Actual
Imported goods transited via dry port
Container(TEU) 10,886 19,630 89,101 60,799 68.2
Vehicles 526 2788 9,286 3840 41.4
Share of imported goods transited via dry port % 100 86 86.0
Container 89 72 100 90 90.0
Vehicles 199 63 100 98 98.0
Source: Ethiopian Shipping and Logistics Services Enterprise
During the last 3 years, it was possible to give services for 91315 TEU containers. Out of 106 689 TEU
containers transported, 86 percent of the services were handled by the dry port. In addition, the capacity of
dry port services has increased from 7 percent in 2010/11 to 14% in 2011/12 and 50% in 2012/13. However
no services were provided to export goods in the dry ports, as investors used their own packaging and
warehouse services. However, supports were provided to investors who are engaged on export market by
reducing maritime service tariffs, providing vehicles for perishable goods and increasing containers at dry
ports for exporters. In addition, reasonable price reduction on transportation of inputs was given for exports
which will be further strengthened during the plan period.
At the beginning of the GTP period Ethiopian Shipping and Logistics Service Enterprise (ESLSE) had nine
vessels with container carrying capacity of 5,676 TEU and 145,242 DWT. Most of these vessels served for
more than two decades making them inefficient with the prevailing market requirement. As a result, the
enterprise disposed three old age vessels during 2010/11 and acquired new seven dry cargo multi-purpose
vessels at the end of 2012/13. ESLSE as of 2012/13 owns 11 dry cargo vessels with carrying capacity of
13,119TEU enhancing the container carrying capacity of own vessels by 131% compared to year 2010/11.
The share of the imported goods transported by maritime services has as a result increased to 47 %. In
addition, two additional new oil tanker ships are under construction and are estimated to transport 68 percent
of the fuel imports.
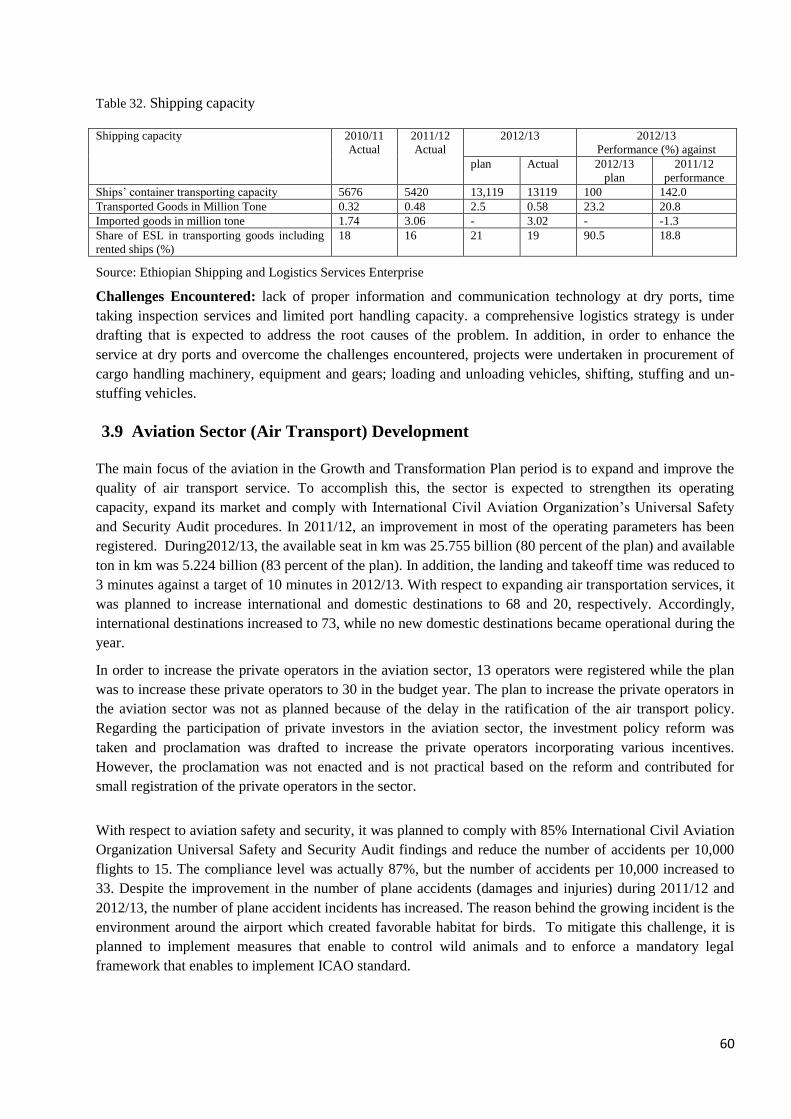
60
Table 32. Shipping capacity
Shipping capacity 2010/11
Actual
2011/12
Actual
2012/13 2012/13
Performance (%) against
plan Actual 2012/13
plan
2011/12
performance
Ships’ container transporting capacity 5676 5420 13,119 13119 100 142.0
Transported Goods in Million Tone 0.32 0.48 2.5 0.58 23.2 20.8
Imported goods in million tone 1.74 3.06 - 3.02 - -1.3
Share of ESL in transporting goods including
rented ships (%)
18 16 21 19 90.5 18.8
Source: Ethiopian Shipping and Logistics Services Enterprise
Challenges Encountered: lack of proper information and communication technology at dry ports, time
taking inspection services and limited port handling capacity. a comprehensive logistics strategy is under
drafting that is expected to address the root causes of the problem. In addition, in order to enhance the
service at dry ports and overcome the challenges encountered, projects were undertaken in procurement of
cargo handling machinery, equipment and gears; loading and unloading vehicles, shifting, stuffing and un-
stuffing vehicles.
3.9 Aviation Sector (Air Transport) Development
The main focus of the aviation in the Growth and Transformation Plan period is to expand and improve the
quality of air transport service. To accomplish this, the sector is expected to strengthen its operating
capacity, expand its market and comply with International Civil Aviation Organization’s Universal Safety
and Security Audit procedures. In 2011/12, an improvement in most of the operating parameters has been
registered. During2012/13, the available seat in km was 25.755 billion (80 percent of the plan) and available
ton in km was 5.224 billion (83 percent of the plan). In addition, the landing and takeoff time was reduced to
3 minutes against a target of 10 minutes in 2012/13. With respect to expanding air transportation services, it
was planned to increase international and domestic destinations to 68 and 20, respectively. Accordingly,
international destinations increased to 73, while no new domestic destinations became operational during the
year.
In order to increase the private operators in the aviation sector, 13 operators were registered while the plan
was to increase these private operators to 30 in the budget year. The plan to increase the private operators in
the aviation sector was not as planned because of the delay in the ratification of the air transport policy.
Regarding the participation of private investors in the aviation sector, the investment policy reform was
taken and proclamation was drafted to increase the private operators incorporating various incentives.
However, the proclamation was not enacted and is not practical based on the reform and contributed for
small registration of the private operators in the sector.
With respect to aviation safety and security, it was planned to comply with 85% International Civil Aviation
Organization Universal Safety and Security Audit findings and reduce the number of accidents per 10,000
flights to 15. The compliance level was actually 87%, but the number of accidents per 10,000 increased to
33. Despite the improvement in the number of plane accidents (damages and injuries) during 2011/12 and
2012/13, the number of plane accident incidents has increased. The reason behind the growing incident is the
environment around the airport which created favorable habitat for birds. To mitigate this challenge, it is
planned to implement measures that enable to control wild animals and to enforce a mandatory legal
framework that enables to implement ICAO standard.
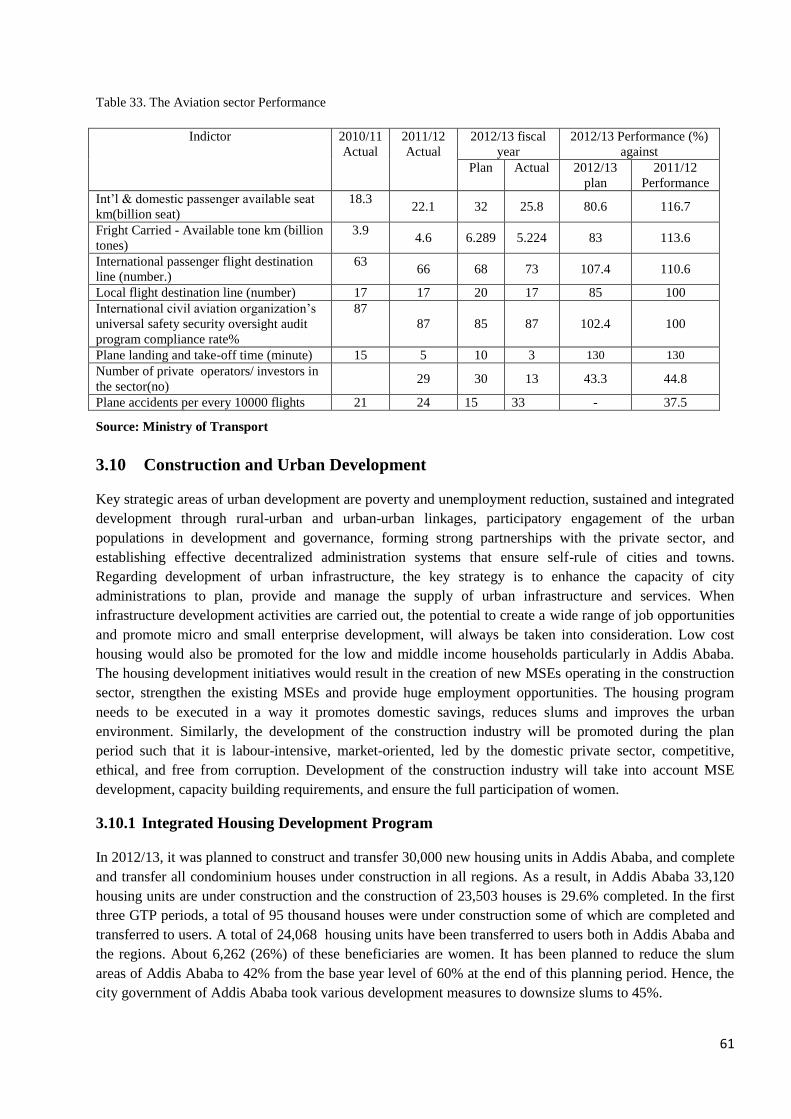
61
Table 33. The Aviation sector Performance
Indictor 2010/11
Actual
2011/12
Actual
2012/13 fiscal
year
2012/13 Performance (%)
against
Plan Actual 2012/13
plan
2011/12
Performance
Int’l & domestic passenger available seat
km(billion seat)
18.3 22.1 32 25.8 80.6 116.7
Fright Carried - Available tone km (billion
tones)
3.9 4.6 6.289 5.224 83 113.6
International passenger flight destination
line (number.)
63 66 68 73 107.4 110.6
Local flight destination line (number) 17 17 20 17 85 100
International civil aviation organization’s
universal safety security oversight audit
program compliance rate%
87
87 85 87 102.4 100
Plane landing and take-off time (minute) 15 5 10 3 130 130
Number of private operators/ investors in
the sector(no)
29 30 13 43.3 44.8
Plane accidents per every 10000 flights 21 24 15 33 - 37.5
Source: Ministry of Transport
3.10 Construction and Urban Development
Key strategic areas of urban development are poverty and unemployment reduction, sustained and integrated
development through rural-urban and urban-urban linkages, participatory engagement of the urban
populations in development and governance, forming strong partnerships with the private sector, and
establishing effective decentralized administration systems that ensure self-rule of cities and towns.
Regarding development of urban infrastructure, the key strategy is to enhance the capacity of city
administrations to plan, provide and manage the supply of urban infrastructure and services. When
infrastructure development activities are carried out, the potential to create a wide range of job opportunities
and promote micro and small enterprise development, will always be taken into consideration. Low cost
housing would also be promoted for the low and middle income households particularly in Addis Ababa.
The housing development initiatives would result in the creation of new MSEs operating in the construction
sector, strengthen the existing MSEs and provide huge employment opportunities. The housing program
needs to be executed in a way it promotes domestic savings, reduces slums and improves the urban
environment. Similarly, the development of the construction industry will be promoted during the plan
period such that it is labour-intensive, market-oriented, led by the domestic private sector, competitive,
ethical, and free from corruption. Development of the construction industry will take into account MSE
development, capacity building requirements, and ensure the full participation of women.
3.10.1 Integrated Housing Development Program
In 2012/13, it was planned to construct and transfer 30,000 new housing units in Addis Ababa, and complete
and transfer all condominium houses under construction in all regions. As a result, in Addis Ababa 33,120
housing units are under construction and the construction of 23,503 houses is 29.6% completed. In the first
three GTP periods, a total of 95 thousand houses were under construction some of which are completed and
transferred to users. A total of 24,068 housing units have been transferred to users both in Addis Ababa and
the regions. About 6,262 (26%) of these beneficiaries are women. It has been planned to reduce the slum
areas of Addis Ababa to 42% from the base year level of 60% at the end of this planning period. Hence, the
city government of Addis Ababa took various development measures to downsize slums to 45%.
62
The housing program has also registered an impressive result in terms of job creation. During 2012/13,
111,993 job opportunities were created for urban dwellers in all regions through the program by strengthen
1,000 micro and small enterprises, contractors, and consultants. In the last three GTP years, over 481,000
jobs have been created through housing development and related projects. Hence, housing development
program has enable to create employment opportunities and promote the development of micro and small
enterprises
3.10.2 Urban Infrastructure Development Program The urban infrastructure development program is developed with the aim of reducing poverty through
creation of employment, improving infrastructure delivery, strengthening the capacity of cities to self-govern
and improving public participation. In2012/13, a total of 829.4 km cobble-stone roads, 1462.26 km drainage
networks, 5 solid waste landfills sites, 1 liquid waste landfills sites, 71 market area, and 66 market centers
have been constructed under the Urban Infrastructure Development Program (ULGDP). Besides, 33 industry
zones have also been developed by different cities.
3.10.3 Construction Industry Development
The major objective of the industry is creating conducive environment so as to increase the competency of
contractors, consultants and construction companies at national and international level. Accordingly, 3
internationally competent contractors and 14 consultants under grade 1 and 2 have been capacitated to get
ISO 9001:2003 standard certification. Moreover, 26 construction sector consultants are capacitated and 37
small and medium level contractors are organized. Besides, 11,346 medium and high level professionals,
228 consultants, 375 medium and small contractors and 801 associations organized to lease construction
machineries have been registered.
During the last three years, the number of internationally competent contractors’ companies has increased to
5, while that of internationally competent consultants’ companies has increased to 17. In addition, 10,621
junior construction professional were certified for their occupational competency. Moreover, 2 low cost
construction materials are being under study, 13 prefabricated low cost construction technologies are being
transferred and 121 revisions of construction professionals list and level have been conducted. In addition,
10 construction materials got quality approval together with Quality and Standard Agency. To conduct
research on construction materials and technology the Ministry of Urban Development and Construction has
signed memorandum of understanding with Addis Ababa University Technology Faculty.
The other most important achievement of this fiscal year is evaluation and certification of the small and
medium level construction sectors professionals. In this regard since creating lead evaluators is a must to
carry out the overall evaluation, currently 710 lead evaluators are ready. The regional distribution is 599 in
Addis Ababa, 70 in Tigray, 35 in Amhara, and 6 in Harari regions. Besides, various legal frameworks
(manuals, guidelines, etc.) are prepared to conduct the evaluation.
3.10.4 Urban land development and management
Awareness creation and capacity building training was offered to over 9,844 managers/higher officials and
experts of city administration and regional states in charge of urban land administration and management. In
the year under review, it was also possible to train over 283 experts/staff on long term training program.
Urban development plans were developed for 158 small towns in 2012/13. Furthermore, about 490 urban
development experts were trained during the year.. During the budget, urban land administration and
management database was developed for23 urban areas, while 133 cities were made to be governed by the
urban land leasing system. Finally over 1000 officials, managers and experts were trained on land
administration and management.
63
CHAPTER IV
SOCIAL SECTOR DEVELOPMENT
4.1 Education and training
The main strategic direction of the education sector development program is to ensure equitable access to
quality education at all levels. Regarding general education, priority has been given to enhance quality and
the MDGs. This activity has been strengthened during the fiscal year. On that basis required inputs,
demanding the necessary standards and appropriate follow up, ensure the improvement of relevance, equity
and access in the sector have been given the highest focus. Through the implementation of the TVET
strategy the government focuses establishing efficient TVET system and fulfilling the demand for middle
level skilled human resources that the industry demands. The TVET institutions are reoriented to mainly
focus on giving support to micro and small scale enterprises through training, counseling and knowledge and
technology transfer. With regard to higher education institutions, besides improving enrolment rate, equity
and quality; focus has been given to ensuring relevance of education and research to the demand of the
economy and the labor market. Moreover, it is important to strengthen the existing efforts so that higher
education institutions support the economic development by serving as strategic centers of technology.
4.1.1 General Education
(i) Equity and access to general education
Pre-school enrolment rate: gross enrolment rate of pre-school education was 24.6 percent (male 25.1
percent and female 24 percent) in 2012/13. This signifies improvements over the past three years where pre-
school enrollment rates were 4.8 percent, 5.2 percent and 21.6 percent in 2009/10, 2010/11 and 2011/12
respectively. The enrolment rate in 2012/13 indicates the enrolment of 1.89 million children in pre-schools. .
Disaggregating the achievement by gender, the gross enrolment rate of boys increased from 5.3 percent in
2010/11 to 22.1 percent in 2011/12 and to 25.1 percent in 2012/13. Similarly, gross enrolment of girls
increased from 5.2 percent in 2010/11 to 21.1 percent in 2011/12 and to 24 percent in 2012/13. The
achievements in 2011/12 and 2012/13 both in boys and girls enrolment has exceeded the target of 20 percent
set for 2014/15. Generally, the child to child and zero class programs have contributed to this expansion of
pre-school education. In addition, the expansion of kindergartens particularly in cities and town have also
contributed to the expansion of pre-school education. The number of kindergartens increased from 3,318 in
2009/10, to 3,418 in 2010/11 and 3,580 in 2011/12. In 2012/13 additional 108 kindergartens were
constructed and the number of kindergartens increased to 3688. As a result, the number of children enrolled
in kindergartens increased from 341,315 in 2009/10 to 382,749 in 2010/11, and 1,622,762 in 2011/12; . In
2012/13 the number of children in pre-schools further increased to 1,894,918.
Primary education (1–8) including alternative basic education: During the three years (2010/11-
2012/13), achievement of primary schools expansion both in rural and urban areas was encouraging.
Improvement of first grade gross enrolment has contributed for the achievement of this success. First grade
gross enrolment rate has increased from 142.9 percent in 2009/10 to 163.4 percent in 2010/11 and 156
percent in 2011/12. In 2012/13, the plan was 122 percent while achievement reached 143.9 percent (male
150 percent, female 137.6 percent). The target for 2014/15 is 120 percent. Disaggregated by gender, GER in
grade one was 171.9 percent for boys and 154.5 percent for girls in 2010/11. Similarly, GER in grade one
stood at 156 percent male and 142.4 female in 2011/12. In 2012/13, the GER for male was 150 percent,
while it was 137.6 percent for female.
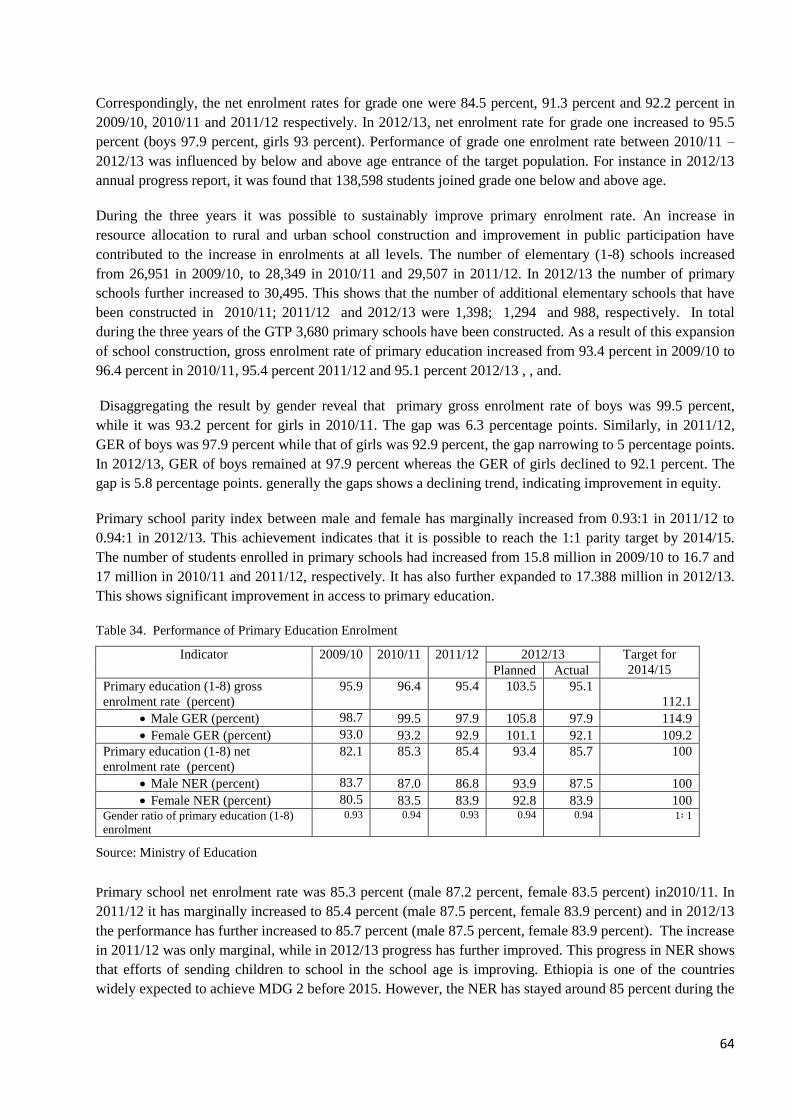
64
Correspondingly, the net enrolment rates for grade one were 84.5 percent, 91.3 percent and 92.2 percent in
2009/10, 2010/11 and 2011/12 respectively. In 2012/13, net enrolment rate for grade one increased to 95.5
percent (boys 97.9 percent, girls 93 percent). Performance of grade one enrolment rate between 2010/11 –
2012/13 was influenced by below and above age entrance of the target population. For instance in 2012/13
annual progress report, it was found that 138,598 students joined grade one below and above age.
During the three years it was possible to sustainably improve primary enrolment rate. An increase in
resource allocation to rural and urban school construction and improvement in public participation have
contributed to the increase in enrolments at all levels. The number of elementary (1-8) schools increased
from 26,951 in 2009/10, to 28,349 in 2010/11 and 29,507 in 2011/12. In 2012/13 the number of primary
schools further increased to 30,495. This shows that the number of additional elementary schools that have
been constructed in 2010/11; 2011/12 and 2012/13 were 1,398; 1,294 and 988, respectively. In total
during the three years of the GTP 3,680 primary schools have been constructed. As a result of this expansion
of school construction, gross enrolment rate of primary education increased from 93.4 percent in 2009/10 to
96.4 percent in 2010/11, 95.4 percent 2011/12 and 95.1 percent 2012/13 , , and.
Disaggregating the result by gender reveal that primary gross enrolment rate of boys was 99.5 percent,
while it was 93.2 percent for girls in 2010/11. The gap was 6.3 percentage points. Similarly, in 2011/12,
GER of boys was 97.9 percent while that of girls was 92.9 percent, the gap narrowing to 5 percentage points.
In 2012/13, GER of boys remained at 97.9 percent whereas the GER of girls declined to 92.1 percent. The
gap is 5.8 percentage points. generally the gaps shows a declining trend, indicating improvement in equity.
Primary school parity index between male and female has marginally increased from 0.93:1 in 2011/12 to
0.94:1 in 2012/13. This achievement indicates that it is possible to reach the 1:1 parity target by 2014/15.
The number of students enrolled in primary schools had increased from 15.8 million in 2009/10 to 16.7 and
17 million in 2010/11 and 2011/12, respectively. It has also further expanded to 17.388 million in 2012/13.
This shows significant improvement in access to primary education.
Table 34. Performance of Primary Education Enrolment
Indicator 2009/10 2010/11 2011/12 2012/13 Target for
2014/15 Planned Actual
Primary education (1-8) gross
enrolment rate (percent)
95.9 96.4 95.4 103.5 95.1
112.1
Male GER (percent) 98.7 99.5 97.9 105.8 97.9 114.9
Female GER (percent) 93.0 93.2 92.9 101.1 92.1 109.2
Primary education (1-8) net
enrolment rate (percent)
82.1 85.3 85.4 93.4 85.7 100
Male NER (percent) 83.7 87.0 86.8 93.9 87.5 100
Female NER (percent) 80.5 83.5 83.9 92.8 83.9 100 Gender ratio of primary education (1-8)
enrolment
0.93 0.94 0.93 0.94 0.94 1፡ 1
Source: Ministry of Education
Primary school net enrolment rate was 85.3 percent (male 87.2 percent, female 83.5 percent) in2010/11. In
2011/12 it has marginally increased to 85.4 percent (male 87.5 percent, female 83.9 percent) and in 2012/13
the performance has further increased to 85.7 percent (male 87.5 percent, female 83.9 percent). The increase
in 2011/12 was only marginal, while in 2012/13 progress has further improved. This progress in NER shows
that efforts of sending children to school in the school age is improving. Ethiopia is one of the countries
widely expected to achieve MDG 2 before 2015. However, the NER has stayed around 85 percent during the
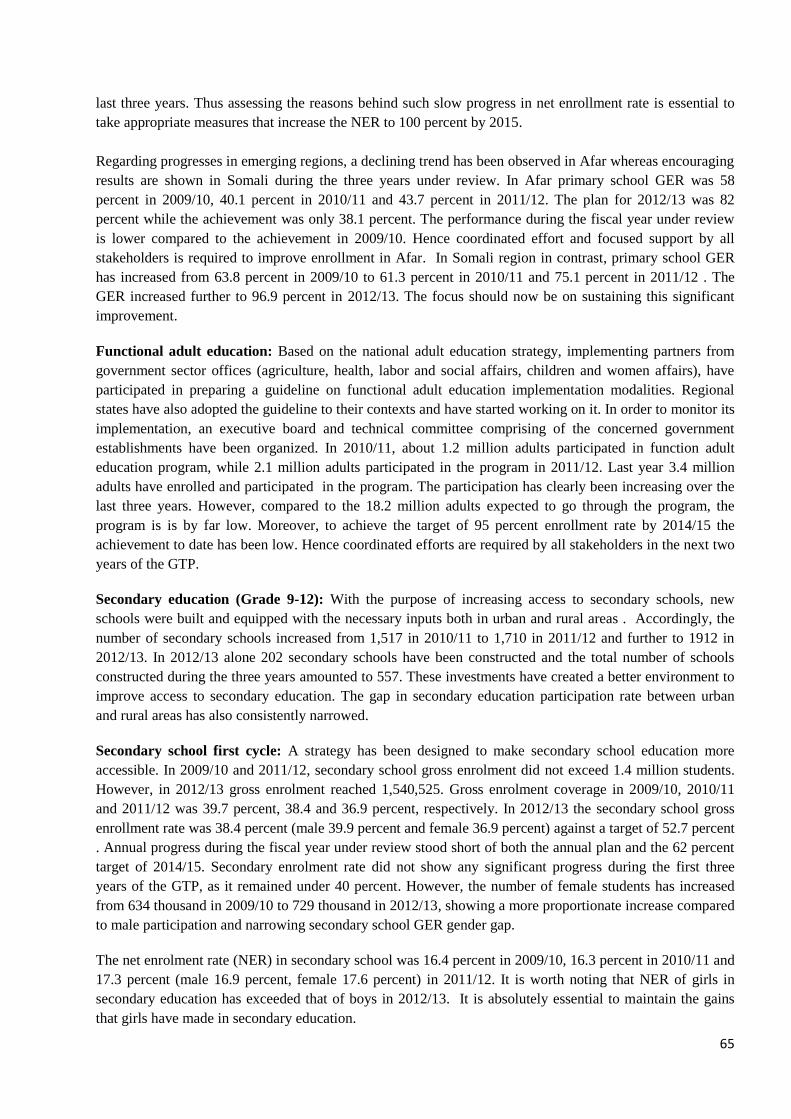
65
last three years. Thus assessing the reasons behind such slow progress in net enrollment rate is essential to
take appropriate measures that increase the NER to 100 percent by 2015.
Regarding progresses in emerging regions, a declining trend has been observed in Afar whereas encouraging
results are shown in Somali during the three years under review. In Afar primary school GER was 58
percent in 2009/10, 40.1 percent in 2010/11 and 43.7 percent in 2011/12. The plan for 2012/13 was 82
percent while the achievement was only 38.1 percent. The performance during the fiscal year under review
is lower compared to the achievement in 2009/10. Hence coordinated effort and focused support by all
stakeholders is required to improve enrollment in Afar. In Somali region in contrast, primary school GER
has increased from 63.8 percent in 2009/10 to 61.3 percent in 2010/11 and 75.1 percent in 2011/12 . The
GER increased further to 96.9 percent in 2012/13. The focus should now be on sustaining this significant
improvement.
Functional adult education: Based on the national adult education strategy, implementing partners from
government sector offices (agriculture, health, labor and social affairs, children and women affairs), have
participated in preparing a guideline on functional adult education implementation modalities. Regional
states have also adopted the guideline to their contexts and have started working on it. In order to monitor its
implementation, an executive board and technical committee comprising of the concerned government
establishments have been organized. In 2010/11, about 1.2 million adults participated in function adult
education program, while 2.1 million adults participated in the program in 2011/12. Last year 3.4 million
adults have enrolled and participated in the program. The participation has clearly been increasing over the
last three years. However, compared to the 18.2 million adults expected to go through the program, the
program is is by far low. Moreover, to achieve the target of 95 percent enrollment rate by 2014/15 the
achievement to date has been low. Hence coordinated efforts are required by all stakeholders in the next two
years of the GTP.
Secondary education (Grade 9-12): With the purpose of increasing access to secondary schools, new
schools were built and equipped with the necessary inputs both in urban and rural areas . Accordingly, the
number of secondary schools increased from 1,517 in 2010/11 to 1,710 in 2011/12 and further to 1912 in
2012/13. In 2012/13 alone 202 secondary schools have been constructed and the total number of schools
constructed during the three years amounted to 557. These investments have created a better environment to
improve access to secondary education. The gap in secondary education participation rate between urban
and rural areas has also consistently narrowed.
Secondary school first cycle: A strategy has been designed to make secondary school education more
accessible. In 2009/10 and 2011/12, secondary school gross enrolment did not exceed 1.4 million students.
However, in 2012/13 gross enrolment reached 1,540,525. Gross enrolment coverage in 2009/10, 2010/11
and 2011/12 was 39.7 percent, 38.4 and 36.9 percent, respectively. In 2012/13 the secondary school gross
enrollment rate was 38.4 percent (male 39.9 percent and female 36.9 percent) against a target of 52.7 percent
. Annual progress during the fiscal year under review stood short of both the annual plan and the 62 percent
target of 2014/15. Secondary enrolment rate did not show any significant progress during the first three
years of the GTP, as it remained under 40 percent. However, the number of female students has increased
from 634 thousand in 2009/10 to 729 thousand in 2012/13, showing a more proportionate increase compared
to male participation and narrowing secondary school GER gender gap.
The net enrolment rate (NER) in secondary school was 16.4 percent in 2009/10, 16.3 percent in 2010/11 and
17.3 percent (male 16.9 percent, female 17.6 percent) in 2011/12. It is worth noting that NER of girls in
secondary education has exceeded that of boys in 2012/13. It is absolutely essential to maintain the gains
that girls have made in secondary education.
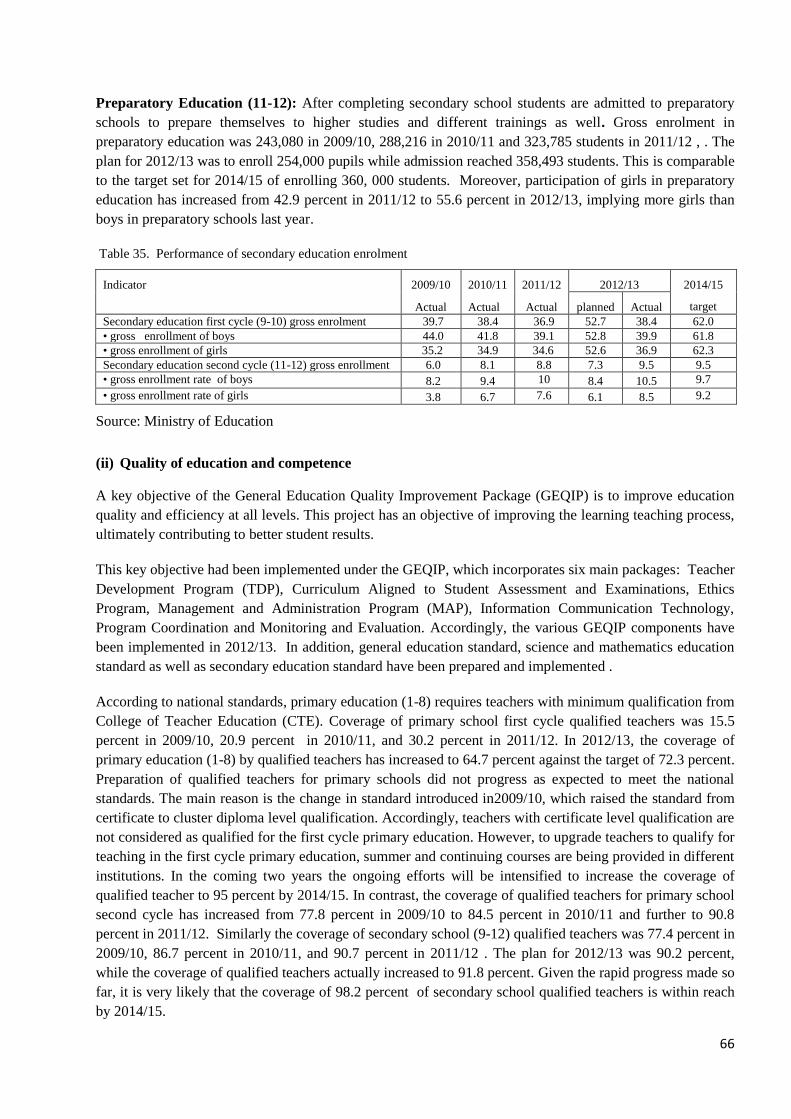
66
Preparatory Education (11-12): After completing secondary school students are admitted to preparatory
schools to prepare themselves to higher studies and different trainings as well. Gross enrolment in
preparatory education was 243,080 in 2009/10, 288,216 in 2010/11 and 323,785 students in 2011/12 , . The
plan for 2012/13 was to enroll 254,000 pupils while admission reached 358,493 students. This is comparable
to the target set for 2014/15 of enrolling 360, 000 students. Moreover, participation of girls in preparatory
education has increased from 42.9 percent in 2011/12 to 55.6 percent in 2012/13, implying more girls than
boys in preparatory schools last year.
Table 35. Performance of secondary education enrolment
Indicator
2009/10 2010/11 2011/12 2012/13 2014/15
target Actual Actual Actual planned Actual
Secondary education first cycle (9-10) gross enrolment 39.7 38.4 36.9 52.7 38.4 62.0
• gross enrollment of boys 44.0 41.8 39.1 52.8 39.9 61.8
• gross enrollment of girls 35.2 34.9 34.6 52.6 36.9 62.3
Secondary education second cycle (11-12) gross enrollment 6.0 8.1 8.8 7.3 9.5 9.5
• gross enrollment rate of boys 8.2 9.4 10 8.4 10.5 9.7
• gross enrollment rate of girls 3.8 6.7 7.6 6.1 8.5 9.2
Source: Ministry of Education
(ii) Quality of education and competence
A key objective of the General Education Quality Improvement Package (GEQIP) is to improve education
quality and efficiency at all levels. This project has an objective of improving the learning teaching process,
ultimately contributing to better student results.
This key objective had been implemented under the GEQIP, which incorporates six main packages: Teacher
Development Program (TDP), Curriculum Aligned to Student Assessment and Examinations, Ethics
Program, Management and Administration Program (MAP), Information Communication Technology,
Program Coordination and Monitoring and Evaluation. Accordingly, the various GEQIP components have
been implemented in 2012/13. In addition, general education standard, science and mathematics education
standard as well as secondary education standard have been prepared and implemented .
According to national standards, primary education (1-8) requires teachers with minimum qualification from
College of Teacher Education (CTE). Coverage of primary school first cycle qualified teachers was 15.5
percent in 2009/10, 20.9 percent in 2010/11, and 30.2 percent in 2011/12. In 2012/13, the coverage of
primary education (1-8) by qualified teachers has increased to 64.7 percent against the target of 72.3 percent.
Preparation of qualified teachers for primary schools did not progress as expected to meet the national
standards. The main reason is the change in standard introduced in2009/10, which raised the standard from
certificate to cluster diploma level qualification. Accordingly, teachers with certificate level qualification are
not considered as qualified for the first cycle primary education. However, to upgrade teachers to qualify for
teaching in the first cycle primary education, summer and continuing courses are being provided in different
institutions. In the coming two years the ongoing efforts will be intensified to increase the coverage of
qualified teacher to 95 percent by 2014/15. In contrast, the coverage of qualified teachers for primary school
second cycle has increased from 77.8 percent in 2009/10 to 84.5 percent in 2010/11 and further to 90.8
percent in 2011/12. Similarly the coverage of secondary school (9-12) qualified teachers was 77.4 percent in
2009/10, 86.7 percent in 2010/11, and 90.7 percent in 2011/12 . The plan for 2012/13 was 90.2 percent,
while the coverage of qualified teachers actually increased to 91.8 percent. Given the rapid progress made so
far, it is very likely that the coverage of 98.2 percent of secondary school qualified teachers is within reach
by 2014/15.
67
Pupil-teacher ratio (PSR) in primary schools (1-8) stood at 56.9:1 in 2009/10, 51:1 in 2010/11 and 50:1 in
2011/12. The ratio has further improved to 49:1 in 2012/13. This performance shows that it is possible to
achieve the target of 47.8:1 by 2014/15. Secondary school (9-12) pupil-teacher ratio stood at 31:1 in 2010/11
and 29:1 in 2011/12. In 2012/13 it has improved further to 28.7:1.
Table 36. Number of teachers at all levels (in thousands)
Indicator 2009/10 2010/11 2011/12 2012/13
Male Female Total Male Female Total Male Female Total Kindergarten 9.7 4.2 9.7 13.9 0.7 11.7 12.4 …. …. 12.6
Primary school (1-8) 283.1 192.2 113.9 306.1 203.6 118.2 321.9 210.9 124.0 334.9
Secondary school (9-12) 46.0 42.8 9.6 52.5 50.5 8.8 59.3 55.4 9.7 65.1
TVET 11.4 10.7 2.1 12.9 10.7 2.1 12.9 … …. ….
Higher Education 15.7 15.7 1.6 17.3 18.7 1.9 20.6 21.4 2.5 23.9
Source: Ministry of Education
The pupil section ratio of elementary education (1-8) was 56.9:1 in 2009/10, 57:1 in 2010/11 and 55:1 in
2011/12. In 2012/13 it has further improved to 54:1. The standard set to be achieved by 2014/15 is 50:1.
Student section ratio in secondary school was 64:1 in 2009/10; 58:1 in 2010/11; 56:1 in 2011/12 and 59.3:1
in 2012/13 . Student-Section-Ratio for secondary school is targeted to reach 40:1 by the end of 2014/15. To
improve the ratios, expansion of both primary and particularly secondary education classes is required.
Primary school student-text books ratio has improved from 1.2:1 in 2011/12 to 1:1 in 2012/13 both in
primary and secondary schools.
Students’ dropout and repetition rates reduce the efficiency of the schooling results. First grade dropout rate
remains high and generally increasing at 16.7 percent in 2009/10; 19.8 percent in 2010/11 and 25 percent in
2011/12 . During the fiscal year under review it was planned to reduce dropout rate to 7.3 percent, but first
grade dropout rate declined only to 22.6 percent (male 23.4 percent, female 21.7 percent). In 2012/13
dropout rate of primary school (1-8) stood at 16.3 percent (male 16.1 percent, female 16.2 percent). During
the last three years dropout rates ranging between 16 and 25 percent were registered. The factors behind this
high and generally increasing student dropout rate have to be investigated in order to address the root causes
of the problem. More effective community participation in the education system is one of the key strategies
required to address the problem.
Fifth grade completion rate was 74 percent in 2009/10, 55 percent in 2010/11 and 79.7 percent in 2011/12.
The completion rate was only 76.1 percent (male 77.1 percent, female 75.1 percent) in 2012/13. This is far
short of the 97 percent target for the fiscal year. Similarly, eighth grade completion rate was planned to
improve to 59 percent in 2012/13, but the completion rate stood at 52.8 percent (male 52.3 percent, female
52.2 percent).
Primary school (1-8) repetition rate stood at 8.1 percent (male 7.7 percent, female 7.9 percent) in 2012/13.
Similarly, eighth grade repetition rate stood at 8.1 percent (male 8.1 percent, female 8 percent) in 2012/13.
Eight grade repetition rate was 5.8 percent in 2009/10, 8.5 percent in 2010/11 and 11.9 percent in 2011/12.
The implementation of the quality improvement program and other interventions, have to be enhanced to
bring about significant improvements in dropout and repetition rates. Generally, more focus has to be given
to student centered approaches, encouraging teacher’s initiatives, efficiency of school management,
community participation, various input supplies as well as strengthening adequate implementation and
follow up of the General Education Quality Improvement Package (GEQIP). As a result coordinated and
strengthened efforts are required to reverse such adverse effects of quality and efficiency. In addition, the
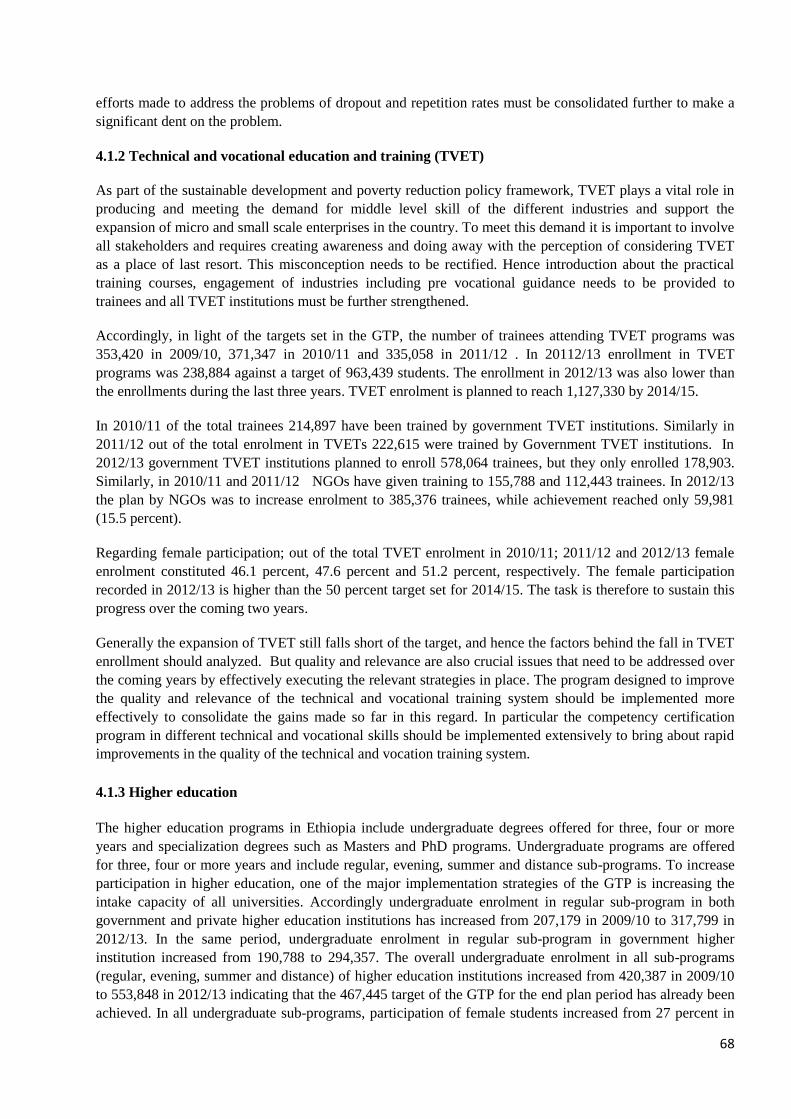
68
efforts made to address the problems of dropout and repetition rates must be consolidated further to make a
significant dent on the problem.
4.1.2 Technical and vocational education and training (TVET)
As part of the sustainable development and poverty reduction policy framework, TVET plays a vital role in
producing and meeting the demand for middle level skill of the different industries and support the
expansion of micro and small scale enterprises in the country. To meet this demand it is important to involve
all stakeholders and requires creating awareness and doing away with the perception of considering TVET
as a place of last resort. This misconception needs to be rectified. Hence introduction about the practical
training courses, engagement of industries including pre vocational guidance needs to be provided to
trainees and all TVET institutions must be further strengthened.
Accordingly, in light of the targets set in the GTP, the number of trainees attending TVET programs was
353,420 in 2009/10, 371,347 in 2010/11 and 335,058 in 2011/12 . In 20112/13 enrollment in TVET
programs was 238,884 against a target of 963,439 students. The enrollment in 2012/13 was also lower than
the enrollments during the last three years. TVET enrolment is planned to reach 1,127,330 by 2014/15.
In 2010/11 of the total trainees 214,897 have been trained by government TVET institutions. Similarly in
2011/12 out of the total enrolment in TVETs 222,615 were trained by Government TVET institutions. In
2012/13 government TVET institutions planned to enroll 578,064 trainees, but they only enrolled 178,903.
Similarly, in 2010/11 and 2011/12 NGOs have given training to 155,788 and 112,443 trainees. In 2012/13
the plan by NGOs was to increase enrolment to 385,376 trainees, while achievement reached only 59,981
(15.5 percent).
Regarding female participation; out of the total TVET enrolment in 2010/11; 2011/12 and 2012/13 female
enrolment constituted 46.1 percent, 47.6 percent and 51.2 percent, respectively. The female participation
recorded in 2012/13 is higher than the 50 percent target set for 2014/15. The task is therefore to sustain this
progress over the coming two years.
Generally the expansion of TVET still falls short of the target, and hence the factors behind the fall in TVET
enrollment should analyzed. But quality and relevance are also crucial issues that need to be addressed over
the coming years by effectively executing the relevant strategies in place. The program designed to improve
the quality and relevance of the technical and vocational training system should be implemented more
effectively to consolidate the gains made so far in this regard. In particular the competency certification
program in different technical and vocational skills should be implemented extensively to bring about rapid
improvements in the quality of the technical and vocation training system.
4.1.3 Higher education
The higher education programs in Ethiopia include undergraduate degrees offered for three, four or more
years and specialization degrees such as Masters and PhD programs. Undergraduate programs are offered
for three, four or more years and include regular, evening, summer and distance sub-programs. To increase
participation in higher education, one of the major implementation strategies of the GTP is increasing the
intake capacity of all universities. Accordingly undergraduate enrolment in regular sub-program in both
government and private higher education institutions has increased from 207,179 in 2009/10 to 317,799 in
2012/13. In the same period, undergraduate enrolment in regular sub-program in government higher
institution increased from 190,788 to 294,357. The overall undergraduate enrolment in all sub-programs
(regular, evening, summer and distance) of higher education institutions increased from 420,387 in 2009/10
to 553,848 in 2012/13 indicating that the 467,445 target of the GTP for the end plan period has already been
achieved. In all undergraduate sub-programs, participation of female students increased from 27 percent in
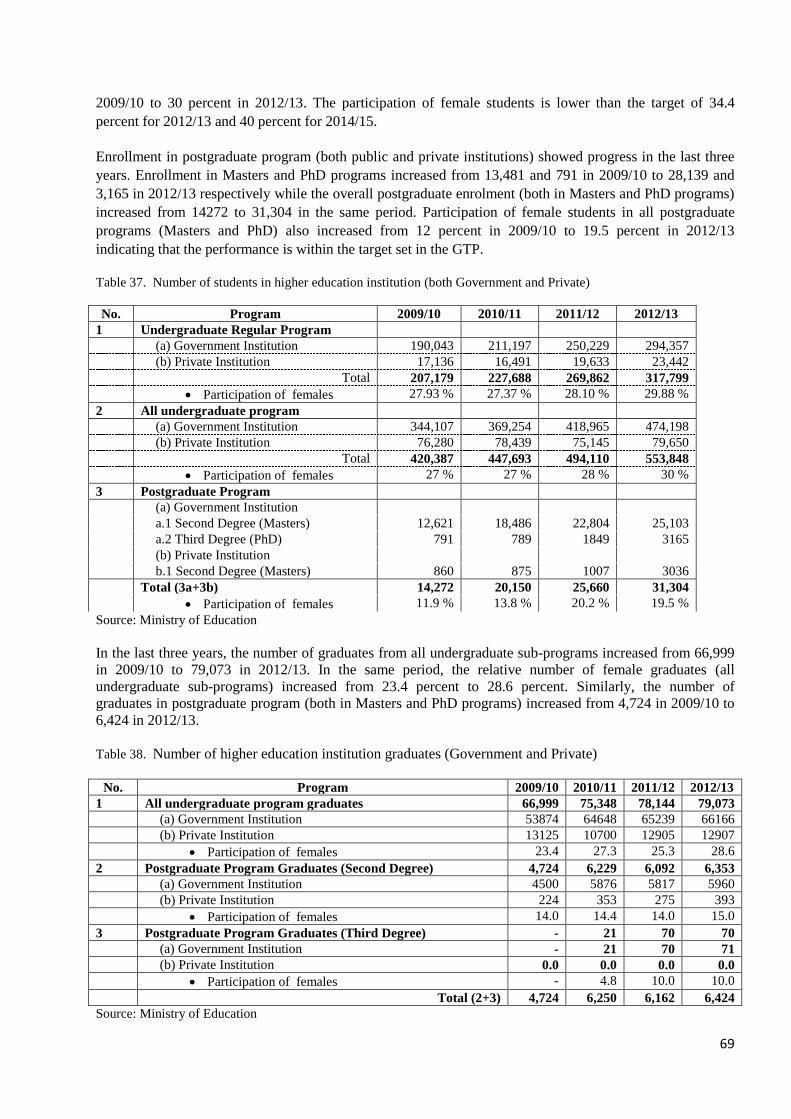
69
2009/10 to 30 percent in 2012/13. The participation of female students is lower than the target of 34.4
percent for 2012/13 and 40 percent for 2014/15.
Enrollment in postgraduate program (both public and private institutions) showed progress in the last three
years. Enrollment in Masters and PhD programs increased from 13,481 and 791 in 2009/10 to 28,139 and
3,165 in 2012/13 respectively while the overall postgraduate enrolment (both in Masters and PhD programs)
increased from 14272 to 31,304 in the same period. Participation of female students in all postgraduate
programs (Masters and PhD) also increased from 12 percent in 2009/10 to 19.5 percent in 2012/13
indicating that the performance is within the target set in the GTP.
Table 37. Number of students in higher education institution (both Government and Private)
No. Program 2009/10 2010/11 2011/12 2012/13
1 Undergraduate Regular Program
(a) Government Institution 190,043 211,197 250,229 294,357
(b) Private Institution 17,136 16,491 19,633 23,442
Total 207,179 227,688 269,862 317,799
Participation of females 27.93 % 27.37 % 28.10 % 29.88 %
2 All undergraduate program
(a) Government Institution 344,107 369,254 418,965 474,198
(b) Private Institution 76,280 78,439 75,145 79,650
Total 420,387 447,693 494,110 553,848
Participation of females 27 % 27 % 28 % 30 %
3 Postgraduate Program
(a) Government Institution
a.1 Second Degree (Masters) 12,621 18,486 22,804 25,103
a.2 Third Degree (PhD) 791 789 1849 3165
(b) Private Institution
b.1 Second Degree (Masters) 860 875 1007 3036
Total (3a+3b) 14,272 20,150 25,660 31,304
Participation of females 11.9 % 13.8 % 20.2 % 19.5 %
Source: Ministry of Education
In the last three years, the number of graduates from all undergraduate sub-programs increased from 66,999
in 2009/10 to 79,073 in 2012/13. In the same period, the relative number of female graduates (all
undergraduate sub-programs) increased from 23.4 percent to 28.6 percent. Similarly, the number of
graduates in postgraduate program (both in Masters and PhD programs) increased from 4,724 in 2009/10 to
6,424 in 2012/13.
Table 38. Number of higher education institution graduates (Government and Private)
No. Program 2009/10 2010/11 2011/12 2012/13
1 All undergraduate program graduates 66,999 75,348 78,144 79,073
(a) Government Institution 53874 64648 65239 66166
(b) Private Institution 13125 10700 12905 12907
Participation of females 23.4 27.3 25.3 28.6
2 Postgraduate Program Graduates (Second Degree) 4,724 6,229 6,092 6,353
(a) Government Institution 4500 5876 5817 5960
(b) Private Institution 224 353 275 393
Participation of females 14.0 14.4 14.0 15.0
3 Postgraduate Program Graduates (Third Degree) - 21 70 70
(a) Government Institution - 21 70 71
(b) Private Institution 0.0 0.0 0.0 0.0
Participation of females - 4.8 10.0 10.0
Total (2+3) 4,724 6,250 6,162 6,424
Source: Ministry of Education
70
In general performances in education sector in the last three years of GTP indicate the substantial progress
made in coverage and access except in TVET, which appears to slowdown in enrollment. However the
performance so far calls also for more concerted efforts to improve quality of education at all levels with full
and enhanced implementation of the General Education Quality Improvement Package in the upcoming
years. Though, achievements in access to general education have been remarkable at the national level,
further improvements need to be required in emerging regions such as in Afar Region where both gross and
net enrollments are very low registering 50.5 percent and 41.5 percent respectively in 2012/13 compared
with 95.3 percent and 85.9 percent of national average. Quality and relevance of TVET need to be
strengthened while the government should give utmost attention to significantly increase participation in
functional adult education in the upcoming years of GTP implementation.
4.2 Health Sector
The health sector has envisioned creating healthy and productive citizen in Ethiopia. Based on the preventive
health care policy, focus has been given to constructing Health Posts and Health Centres in rural and urban
areas. The government has staffed health facilities with health personnel and equipped them with materials
so as to ensure quality primary health care and combat communicable diseases . By doing that significant
progress has been made towards achieving universal access to basic health services. Notwithstanding the
focus on primary health care, due emphasis has been given to quality hospital services. The fourth Health
Sector Development Program (2010/11-2014/15) has also been prepared and is being implemented to
achieve this objective and the Millennium Development Goals (MDGs).
4.2.1 Community participation and ownership
This objective aims to empower the community to produce its own health. It ensures the involvement,
engagement and empowerment of the community via the implementation of Health Development Army
(HAD). To achieve the objectives of the Growth and Transformation Plan and the MDGs, it was believed
that establishing and coordinating health development teams within the community and scaling up their
activities was very crucial. This evidence based participation of communities such as women health
development teams in the community has been proved a practical means to narrow the gaps related to
cultural health problems. Hence organizing health development army and scaling up their best practices has
been considered a key strategy.
As evidenced from results registered during the previous year’s activity, disease prevention strategy is a
means to give sustainable solutions of the health sector problems. Moreover, efforts were made to improve
the access of providing quality primary health care. Lesson has been drawn that it was possible to improve
community ownership and create model families. Involvement of HDA has helped a lot to the improvement
of the realization of the health extension package. Organizing and mobilizing the community also helped to
limit the spread of communicable diseases and enabled to decrease child mortality. It also helped to create
awareness among women so that they give birth in health facilities. The health development army has helped
to improve maternal and child health. Related to this mothers are encouraged to give birth in health
institutions and thereby contributed to the decline in maternal mortality.
4.2.2 Improve Access to Health Services
In light of improving access ability of health service status the expected outcomes will improve citizen
confidence in the health system and proactive seeking of prevention and treatment services from health
facilities.
71
a) Maternal, new born and child health services
Family planning services: It has been documented that contraceptive use can have an impact in reducing
maternal mortality. During the first three years of the GTP it has been planned to benefit on average 10
million non-pregnant women of reproductive age accepting modern contraceptive methods and improve
their Contraceptive Acceptance Rate (CAR). CAR decreased from 60.4 percent in 2011/12 to 60 percent in
2012/13, which is below the target of 76.2 percent. The reason for not showing improvement in CAR is due
to data problems. Family planning beneficiaries use long acting methods, which are expected to be reported
as new users for that fiscal year and as repeat users after one year. The fact is they are not recorded and
reported accordingly and this resulted in slow increase of CAR coverage during the first 3 years of the GTP.
In 2012/13 wide variation was observed across regions. The highest coverage was registered in Amhara
(86.3 percent), Southern Nations Nationalities and Peoples-SNNP (61.9 percent), Oromiya 60.4 percent.
Low coverage was observed in Somali (8.3 percent) and Gambella 9.2 percent. By the end of the GTP
period family planning services is targeted to reach 82 percent.
b) Antenatal Care (ANC)
In 2012/13 eligible total number of expected pregnancies was estimated to be 2.88 million. ANC service was
given to 2.86 million beneficiaries, increasing the coverage from 89.1 percent in 2011/12 to 97.4 percent in
2012/13. This shows the GTP target for 2014/15 was already achieved well ahead of time. However
regional variation have been observed in coverage of ANC services. As a result the highest coverage was
reported for Harari (111.6 percent) and Oromiya (103 percent) while the lowest coverage was observed in
Somali (41.6 percent) and Afar (53.7 percent).
c) Deliveries attended by skilled birth attendants
Skilled attendance at birth is the most important intervention in reducing maternal mortality. Equipping
health facilities by medical equipment and deploying skilled health professionals are among key
interventions undertaken to increase the coverage during the fiscal year. During the three years Basic
Emergency Obsteric and Neonatal Care (BEmONC) and Comprehensive Emergency Obsteric and Neonatal
Care (CEmONC) service delivering health centers increased from 752 in 2009/10 to 1,813 in 2012/13.
Totally 2366 professionals were trained and 15 hospitals were selected to serve as training centers.
Moreover, BEmONC and CEmONC services are being given in 88 hospitals. Hence, births attended by
skilled personnel improved from 20.4 percent in 2011/12 to 23.1 percent in 2012/13. This coverage is below
the target of 49.4 percent for 2012/13. Regarding regional performance, wide variation was shown. Addis
Ababa (72.9 percent) and Harari (72 percent) registered better results; while Benshangul Gumz (14.4
percent), Afar (14.7 percent) and Somali (17.4 percent) were lowest performers.
d) Postnatal Care (PNC)
During 2012/13 the service was given to 2.9 million mothers and the coverage increased from 44.5 percent
to 50.5 percent in 2012/13. This performance is below the 70 percent target of 2012/13. Therefore efforts
need to be strengthened to achieve the 78 percent of GTP target by 2014/15. With regard to regional
distribution of PNC services SNNP (65.4 percent), Tigray (65.2 percent) and Harari (52.9 percent) showed
better coverage, while Afar (11 percent), Gambela (11.8 percent) and Somali (18.1 percent) registered the
lowest performance. The low rates of the service across emerging regions are related to adverse influences
primarily caused by cultural beliefs and practices. Moreover, transportation limitations and poor quality of
health services in facilities can be mentioned as bottlenecks leading to maternal death. Currently 811
ambulances have been purchased and distributed to woredas.
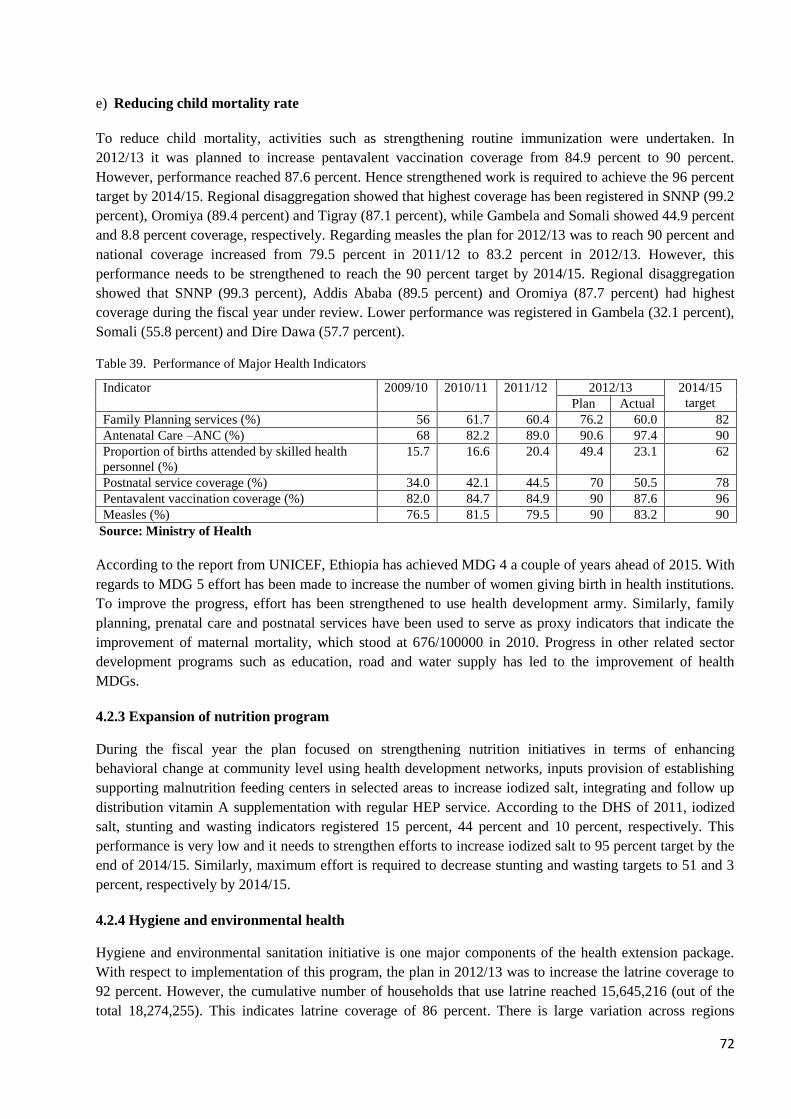
72
e) Reducing child mortality rate
To reduce child mortality, activities such as strengthening routine immunization were undertaken. In
2012/13 it was planned to increase pentavalent vaccination coverage from 84.9 percent to 90 percent.
However, performance reached 87.6 percent. Hence strengthened work is required to achieve the 96 percent
target by 2014/15. Regional disaggregation showed that highest coverage has been registered in SNNP (99.2
percent), Oromiya (89.4 percent) and Tigray (87.1 percent), while Gambela and Somali showed 44.9 percent
and 8.8 percent coverage, respectively. Regarding measles the plan for 2012/13 was to reach 90 percent and
national coverage increased from 79.5 percent in 2011/12 to 83.2 percent in 2012/13. However, this
performance needs to be strengthened to reach the 90 percent target by 2014/15. Regional disaggregation
showed that SNNP (99.3 percent), Addis Ababa (89.5 percent) and Oromiya (87.7 percent) had highest
coverage during the fiscal year under review. Lower performance was registered in Gambela (32.1 percent),
Somali (55.8 percent) and Dire Dawa (57.7 percent).
Table 39. Performance of Major Health Indicators
Indicator 2009/10 2010/11 2011/12 2012/13 2014/15
target Plan Actual
Family Planning services (%) 56 61.7 60.4 76.2 60.0 82
Antenatal Care –ANC (%) 68 82.2 89.0 90.6 97.4 90
Proportion of births attended by skilled health
personnel (%)
15.7 16.6 20.4 49.4 23.1 62
Postnatal service coverage (%) 34.0 42.1 44.5 70 50.5 78
Pentavalent vaccination coverage (%) 82.0 84.7 84.9 90 87.6 96
Measles (%) 76.5 81.5 79.5 90 83.2 90
Source: Ministry of Health
According to the report from UNICEF, Ethiopia has achieved MDG 4 a couple of years ahead of 2015. With
regards to MDG 5 effort has been made to increase the number of women giving birth in health institutions.
To improve the progress, effort has been strengthened to use health development army. Similarly, family
planning, prenatal care and postnatal services have been used to serve as proxy indicators that indicate the
improvement of maternal mortality, which stood at 676/100000 in 2010. Progress in other related sector
development programs such as education, road and water supply has led to the improvement of health
MDGs.
4.2.3 Expansion of nutrition program
During the fiscal year the plan focused on strengthening nutrition initiatives in terms of enhancing
behavioral change at community level using health development networks, inputs provision of establishing
supporting malnutrition feeding centers in selected areas to increase iodized salt, integrating and follow up
distribution vitamin A supplementation with regular HEP service. According to the DHS of 2011, iodized
salt, stunting and wasting indicators registered 15 percent, 44 percent and 10 percent, respectively. This
performance is very low and it needs to strengthen efforts to increase iodized salt to 95 percent target by the
end of 2014/15. Similarly, maximum effort is required to decrease stunting and wasting targets to 51 and 3
percent, respectively by 2014/15.
4.2.4 Hygiene and environmental health
Hygiene and environmental sanitation initiative is one major components of the health extension package.
With respect to implementation of this program, the plan in 2012/13 was to increase the latrine coverage to
92 percent. However, the cumulative number of households that use latrine reached 15,645,216 (out of the
total 18,274,255). This indicates latrine coverage of 86 percent. There is large variation across regions
73
ranging between SNNPR (94.2 percent), Tigray (92.7 percent) and Amhara (92.4 percent) and Afar (9
percent ), Benshangul Gumuz (27.6 percent) and Diredawa (29 percent), respectively.
4.2.5 Improving disease prevention and control
Improvement in HIV/AIDs voluntary counseling, condom distribution, prevention of mother to child
transmission (PMTCT) services encouraging work has been conducted. Hence during the three years
Ethiopia has been successful to control communicable diseases and maintain HIV/AIDs prevalence by then
showing it is possible to achieve the MDGs by 2015.
According to initiatives taken to strengthen activities related to major communicable diseases, the target was
to increase TB case detection to 75 percent by 2014/15. Performance during the fiscal year under review
reached 58 percent, which showed an improvement from 36 percent at the base year of GTP. Regarding TB
treatment, success rate was 83 percent in 2010/11, 91 percent in 2011/12 and 91 percent in 2012/13. The
achievement in the last two years are similar to the target set for 2014/15.
In terms of strengthening malaria prevention and control mechanisms, cumulative number of distributed
insect side treatment nets increased from 39.5 million in 2010/11 to 45.7 million in 2011/12 and to 46.8
million in 2012/13. Regarding household in epidemic prone villages that were covered with indoor residual
spraying (IRS) has increased. Routine information of IRS showed an increase from 56 percent in 2009/10 to
84 percent in 2012/13. In order to strengthen the diagnostic and treatment of malaria 18.3 million rapid kit
and 12.8 million cases anti malaria drugs were distributed to malaria prone areas during the fiscal year under
review.
4.2.6 Improving inputs supply and usage systems
Apart from the budget allocated from the government providing with adequate and sustainable financial
support to all the health facilities, effort has been made to mobilize resources. To implement programs,
commitments from development partners increased from 302.8 million USD in 2010/11 to 730.6 million
USD in 2011/12 and 806.4 million USD in 2012/13.
4.2.7 Improve quality of health service delivery
In line with the GTP objectives this initiative aims at ensuring quality standards such as speed of health
service delivery, harmonization at service delivery point, availability of the required inputs (HR, finance,
pharmaceuticals…). As a result, to realize hospital management initiative, 124 standards have been designed
and implemented since 2011. Based on quality indicators 15 public lead hospitals were selected and other
public hospitals were clustered under the lead hospitals so as to get support. In order to improve emergency
medical care at hospital level, emergency medical care equipment have been procured and distributed to 30
hospitals (4 federal and 26 regional). In addition Magnetic Resonance Imaging (MRI) and CT-Scan
equipment have been given to Gondar, Jimma and Hawasa hospitals.
As per the federal and regional level strategic initiative to improve quality health services the transfer of the
overall management of blood transfusion services has been completed. To enhance availability of adequate
and safe blood in health care facilities, 14 new blood banks were constructed and handed over to the
respective Regional Health Bureaus to make the facilities ready for service. In order to scale up blood
collection from voluntary and non-voluntary blood donors and make safe blood from blood banks available
to hospitals, 46 vehicles were procured and distributed. In 2012/13 blood collected showed progress and
reached 60,096 units.
74
4.2.8 Improve health regulatory system
This initiative has the aim of assessing the process required for quality standard and assurance of the quality
of health related products (food, drugs…). The focus is on food and drug standard control. From that point
of view importers and distributors are required to enter into the systems of license registration. Strengthening
inspection systems, control mechanisms of import and export of foods, drugs and raw materials;
strengthening the system that enhances rational drug use has been focused on.
Related to that, the number of registered importers and distributers reached 412 in 2012/13. Similarly,
during the same period the number of food producers reached 600. In terms of awareness creation,
consultation related to health related trade and services has taken place with importers, executive bodies at
different levels, religious leaders and the youth.
4.2.9 Evidenced – based Decision making by enhanced harmonization and alignment
Using regular performance monitoring in health facilities Health Management Information System (HMIS)
has been strengthened at all levels to ensure timely and reliable administrative data. In this regard HMIS
performance at health center level increased from 69 percent in 2010/11 to 80 percent in 2011/12 and further
to 87 percent in 2012/13. Similarly, at hospital level it has shown progress by increasing from 75 percent in
2010/11 to 93 percent in 2011/12 and to 97 percent in 2012/13.
4.2.10 Improve pharmaceutical supplies and equipments
The objective is designed to increase the availability of pharmaceuticals (medical equipment and products),
distribute essential drugs at an affordable price, ensure adequate supply to health facilities and improve
rational drug use, implement drug control and abuse prevention strategy. It also aims to reduce procurement
lead time of medical products and equipment. On that basis focus has been given to capacity building of
domestic producers of pharmaceutical supplies and equipment. Priority has been given for producers that
win bids of domestic drug purchase. When purchase order is given by domestic producers they benefit 30
percent advance payment of the bid price. Hence in 2012/13 the supply has increased to birr 790 million.
Distribution of drugs and medical equipment supplies to public health facilities has increased from birr 3.5
billion in 2010/11 to birr 5 billion in 2011/12 and further to birr 6.77 billion in 2012/13. In terms of reducing
the procurement lead time, it has decreased from 240 days at the base year of the GTP to 140 days in
2012/13. The target for 2014/15 is to reduce purchase time to 125 days. So, strengthened and coordinated
work is required to achieve the GTP target.
4.2.11 Improve public health infrastructure
The main objective of this initiative is to expand, equip and manage health facilities. During the GTP period
Health Extension Program (HEP) that aims at ensuring accessibility of health care and subsequently
achieving universal coverage of primary health service has been strengthened. Moreover, ensuring the
availability of one health post in each kebele is key for institutionalization and successful implementation of
HEP at community level. To date there has been a linear increase in Health Posts (HP) and Health Centers
(HC). During 2010-2012/13 the number of health posts constructed was 903; 573; and 380, respectively;
totaling 1856 for the three years. Hence the cumulative number of HP increased from 15,095 in 2010/11 to
15,668 in 2011/12 and to 16,048 in 2012/13. This performance has improved HP population ratio to reach
1፡ 5352. The target for 2014/15 is 1:5,000. Expansion of HC plays a pivotal role for the achievement of
universal primary health coverage. Through joint efforts of Federal government and Regions during 2010-
2012/13, the number of HCs constructed was 518; 339 and 101, respectively; totaling 958 for the three
75
years. Hence cumulative number of functional HCs increased from 2,660 in 2010/11 to 2,999 in 2011/12 and
to 3,100 in 2012/13.
Accordingly one health center is currently providing services to a population of below 28 thousand, which
was 1:37,299 in 2009/10 to 1:27,706 in 2012/13. To realize full coverage of basic health service it requires
3,300 HCs and at the end of the GTP. HC to population ratio is targeted to decline to 1:25,000 by 2014/15.
Based on these achievements in HP and HC primary health coverage increased from 92.1 percent in 2010/11
to 92.9 percent in 2011/12 and to 93.4 percent in 2012/13. Regarding the cumulative number of hospitals it
has increased from122 in 2010/11, to 125 in 2011/12 and to 127 in 2012/13.
4.2.12 Improve human capital and leadership
Human resource planning and capacity building is the major aim of this initiative. Efforts have been done to
fulfill recruitment and deployment of human resource in the health system in line with the standards put by
WHO. With regard to the training of integrated emergency surgery and obstetrics officers to date,
professionals have been trained and deployed in work whereas 400 students are taking training. In 2010/11
a total of 38,298 HEWs (rural 34382 and urban 3,916) were deployed throughout the country. Similarly, in
2011/12 the number of HEWs stood at 38,102 (34,604 rural and 3,498 urban); while in 2012/13 it was
36,336 (rural 32,252 and urban 4,084).
With reference to accelerated midwifery training, about 1558 and 1791 professionals have been trained and
deployed in 2011/12 and 2012/13 respectively throughout the country. Currently 1,746 and 1,190 midwifes
are taking training in the second and third round. Accordingly midwifes to population ratio decreased from
1:39,758 in 2009/10 to 1:14,838 in 2012/13. In 2014/15 it is targeted to deploy 8635 midwives thereby
improving the ratio. Total number of nurses has increased from 26,423 in 2009/10 to 37,218 in 2012/13.
Regarding physician to population ratio, it has declined from1:37,996 in 2009/10 to 1:26,943 in 2012/13.
Hence strengthened work must be done to reach 1:10,000 standard put by WHO for developing countries.
Currently 10,232 physicians are taking training in 25 universities.
76
CHAPTER V
CAPACITY BUILDING AND GOOD GOVERNANCE
5.1 Public Sector Capacity Building
From capacity building perspective, the main strategic directions of the GTP are strengthening
implementation capacity of government structures , establishing transparency and accountability, combating
corruption, ensuring public participation and incorporating cross cutting issues in the civil service.
5.1.1 Enhancing leadership, managerial and professional capacity
During the fiscal year of 2012/13, various training programs were delivered to the top leadership and
middle management at federal and regional levels on different subjects essential to meet the
transformational need of their respective jobs. During the fiscal year, training has also been given on
leadership skills in order to improve the execution capacity of the top leadership . On the other hand, a
study has been underway to explore the establishment of a Civil Service Capacity Building Academy . In the
last three years of the GTP period, efforts have been made to recruit competent young graduates for the
various government structure so as to capacitate the civil service. In this regard, various trainings were
provided to the young graduates joining the civil service so as to equip them with the necessary ethical
principles and professional disciplines to provide efficient and effective services within the civil service. The
need and significance to continue with such capacity building trainings in the upcoming years is huge.
5.1.2 Improve public organizations structure and working system
Assessments and researches have been conducted on improving the efficiency and effectiveness of public
organizations in providing public services and advancing satisfaction of customers. Accordingly an
assessment was conducted on the implementation and significance of the balanced score card (BSC) in
improving the efficiency and effectiveness of public services. The progress with regard to the
implementation of BSC and other reforms were inspected, while support and consultancies were provided to
the public organizations on the use of the tool to improve their efficiency and effectiveness in the delivery of
their services. In addition, a supervision team including members of the parliament was organized to
evaluate the progress of the civil service reforms in federal organization and in four regions (Amhara,
Oromiya, SNNP and Tigray). The report on the findings of this group have been presented and discussed
both at federal level and with respective regions. Moreover, employees have been hired to support the
emerging regions on fulltime basis with the design and implementation of civil service reforms.
5.1.3 Developing the System of Transparency and Accountability
During the fiscal year of 2012/13, many public organizations prepared citizen’s charter disclosing their
service delivery standards. The disclosure of citizen’s charter to the general public is expected to enhance
transparent and accountable service delivery in these organizations. Based on the citizen charter, service
delivery efforts were showing progress. Further improvements and adjustments will also be taken in order to
ensure accountability and reveal the level of service delivery. In addition, public organizations were also
engaged in extensive public education and awareness creation programs concerning the risks, prevention
and control mechanisms of rent seeking and corruption. The resultant outcomes in terms of ensuring
transparency and accountability, as well as combating rent seeking and corruption leave much to be desired.
Hence the ongoing reforms should be more effectively executed to further advance transparency and
accountability in the public sector.
77
5.1.4 Enhance Public Participation
Many measures were taken over the last three GTP years to promote effective public participation in all
development and governance programs at all levels of government. A central element of these initiatives has
been the formation and strengthening of developmental change agents or groups. The public has been
encouraged to participated in an organized way in policy formulation and service delivery through various
developmental change groups. Manuals have been prepared defining the roles and responsibilities of the
developmental change groups, their organization and working systems, as well as the monitoring and
evaluation system of the public participation . Accordingly, organized and effective public participation
have been promoted at all levels over the last three years. But the system is still at its earliest stage
particularly at federal level, and hence the efforts need to be strengthened to enhance the capacity of the
development change agents so as to further promote active participation of citizens in the development and
governance process of their country.
5.2 Justices Sector
5.2.1 Human Resource Capacity Building
Extensive short-term and long-term capacity building trainings have been given to judges, lawyers, police
and other professionals in the justice sector over the last three GTP years. Furthermore hiring of new staff
was also undertaken extensively during the three years of the GTP implementation. Thus, over the last three
years of GTP implementation short-term training was offered to over 119,703 judges, lawyers and different
managements and professionals of the justice sector. Similarly, long-term trainings have been offered to
10,377 professionals and different stakeholders of the justice sector. With regards to 2012/13 fiscal year,
over 30,460 and 1254 short-term and long-term training was respectively offered to judges, lawyers, police
and other professionals. In relation to reform program of education institutes several reform measures were
pursued and different trainings were offered. Similarly, over the last three year more than 58 research and
studies were undertaken while 35 research works have been carried out during the fiscal year under review.
5.2.2 Enhance efficiency and effectiveness of the sector
To enhance the effectiveness of the justice sector and to enable the justice sector bodies conduct transparent,
efficient and reliable service several measures were implemented specially with regards to establishment of
coordinated system in combating crimes at all levels and improving society’s confidence in the justice
system. Similarly to improve the justice system proclamation was formulated and passed by the parliament
on citizen vital registration and identity system.
In order to improve prosecution rate the existing judiciary system was strengthened to improve the
efficiency and the service delivery of the judiciary. Therefore, the congestion rate has decreased and
clearance rate of courts have improved, reaching 92 percent against a target of 100 percent. Various
activities have also been undertaken to improve the effectiveness of the justice system during the budget
year where consequently the national average rate of pleading guilty has reached 88.9 % while clearance rate
for heavy cases has increased to 98.6 % and pleading guilty for the same case has reached on average 87.5
%. Average duration for reaching decision of cases at federal judicial organs reached an average of 40 days
for heavy cases, 31 days for medium crimes cases and 22 days for light case crimes.
5.2.3 Ensure Supremacy of Law
During the last three years, more than 59 proclamation and 104 directives that are in tandem with the federal
constitution and also international laws were enacted. Moreover, with regards to extradition of criminals,
78
two laws that are signed among IGAD member countries were ratified by parliament. To enhance citizen
awareness on the federal constitution and related laws, , awareness creation education was provided to more
than 63.18 million citizens by establishing more than 1,740 platforms/ forums during the last three GTP
years.
5.2.4 Improving transparency and accountability of the justice sector
To enhance transparency and accountability in the justice system, measures were taken to improve and
modernize the information management system, establish compliant handling mechanism, as well as develop
clear rules and regulations. Accordingly more than 55 directives that help enhance the transparency and
accountability of the justice system were undertaken.
5.2.5 Improve access to justice service
With regards to ensuring accessibility of the judicial system to the general public, a system supported by IT
was put in place to reduce cost of the justice, and make the service delivery fast, transparent and effective.
Consequently, encouraging achievements were registered over the last three years. Several offices were
opened to increase access to justice sector both at federal and regional level, while various alternative
temporary and permanent litigation systems were established to render services to the public. Similarly
prisoners were able to follow their cases at court using Video conferencing and E-litigation. Several police
stations were also built through community support and mobilization. Free legal service were provided to
poor individuals that cannot afford to pay for the service
5.2.6 Rehabilitation of prisoners
After verdict was passed and criminals pleaded guilty, the major tasks of the prison/rehabilitation centre are
implementing the decision of the court ruling, and producing productive citizen by providing skill trainings
and counseling to the prisoners. Accordingly, at national level formal education was provided to 446,262
prisoners, while adult education was given to over 2,744 prisoners to improve their skills and knowledge.
Moreover, technical and vocational training was also given to more than 88,810 prisoners so as to create
peaceful and productive citizen that serve their countries and themselves after serving their time in prison.
5.2.7 Enhance public participation in the Justice Sector
National justice week was celebrated consecutively over the last three years at national level and several
platforms were established to discuss the achievements and challenges in the justice sector with the public
and gather productive feedback to further improve service delivery in the sector. To engage the citizens into
the justice sector remarkable achievement were registered regarding community policing to prevent crime in
coordinated and harmonized manner.
5.3 Deepening the Democracy Process
5.3.1 Strengthening the Federal Democratic System
Strengthening Economic and Political Community: with the aim of creating and strengthening one
economic and political community, conferences and forums that celebrate and preach the diversity and
beauty of Nation, Nationalities and Peoples of Ethiopia, democratic unity, tolerance and strengthening
peaceful relations were organized. The fifth Ethiopian Nations, Nationalities and People’s Day (Constitution
Day) along with the fifth International Conference on Federalism (ICF) has been hosted in Addis Ababa.
Similarly the sixth and seventh Constitution Day has been colorfully celebrated in the capital city of the
79
Regional State of Tigray, Mekele and in the capital city of the Regional State of Amhara, Bahir Dar
respectively. The principal motto of the seventh Constitution Day (2012/13) was “Unity within Diversity
with the Vision of Meles our Constitution for our Renaissance”. In addition, 225 thousand magazines, 210
thousand booklets, 5 thousand documentary film CDs, 218 thousand posters in various languages as well as
240 thousand pamphlets have been distributed in all areas of the country. National Flag Days and
International Day of Democracy were celebrated for three consecutive years using selected inspiring and
informative international and national mottos. Research has been conducted which enable to prepare national
conflict resolution strategy and identify issues and causes of conflict. The findings of the study have been
discussed by stakeholders and got approved. And the conflict mapping preparation is under way.
Revising the Federal Grant Sharing Formula for Equitable Grant Distribution: The House in virtue of
the power vested to it by the Constitution, has put in place the formula for grant distribution of the federal
government to the regional state based on expenditure need and revenue raising capacity. The grant
distribution formula has been approved and the approved formula has been decided to be implemented by
the concerned executive organs starting from the budget year of 2012/13.
Ensuring Constitutional Supremacy, Interpretation of the Constitution and Rights and Passing
Resolutions against Appeals: Regarding Constitution interpretation and requests for constitutional right
enforcement, out of the presented 702 Constitutional interpretation appeals in the three years (272 in
2012/13), resolution has been given for 610 appeals. 67 appeals are waiting for decision and the rest 25
appeals are under investigation.
Enhance citizens' constitutional and federalism knowledge: in order to develop citizen’s constitutional
consciousness, as well as nurture citizens that are reasonable, believe in negotiation and accept differences in
a democratic manner, a question and answer competition on federalism and constitution has been prepared
through television and radio. A total of 150 programs have been transmitted during the last three years using
different local languages. In order to develop children’s constitutional consciousness, a cartoon film named
“Abeba ena Abebe” has been prepared and 52 episodes have been transmitted. Website has been developed
for the cartoon film. Furthermore, in order to improve the society’s constitutional awareness, 100 thousand
copies of the constitution have been printed in different languages and distributed. For people who are
visually impaired 2 thousand brail constitution copies have been printed and distributed. Moreover, more
than 14,020 copies of federalism and constitutional basic principles training document has been prepared
and distributed to the participants of the awareness creating trainings from different regional and federal
offices.
5.3.2 Strengthening representatives’ councils
Carrying out Legislation and Oversight: Legislation is one of the House of People’s Representatives
(HoPR’s) power and responsibility. Consequently the council has reviewed over 39 draft bills that dealt with
social, international agreements, diplomacy, economic issues such as loan agreements including annual
budget, and political issues that were sent to the legislative body by the government. The house forwarded
the draft bills for further review to permanent committees. The committees thoroughly reviewed the drafts
by consulting different experts and adopted or passed 38 draft bills during the 2012/13 fiscal budget year.
Besides, the House passed resolutions on six different issues after they were widely examined. One of the
main constitutional responsibilities assigned to the council is over-sighting of federal executing bodies and
also monitoring efficient utilization of government and public resources. Hence, during the last three years
of GTP implementation period in general and the year under review in particular, several field and desk
oversight has been undertaken. In the just ended year 2012/13, the permanent committees have reviewed
plan and performance of 224 federal institutions and forwarded comment and corrective measures
80
accordingly to the respective institutions. Similarly the committee has undertaken over 77 field visit and
monitoring to review the performance of some of the big project and government institutions.
Building the Capacity of the House: It is critical to deepen the implementation capacity in all range of
sectors, programs over the coming years. In this understanding, various management as well as professional
trainings were given to members of parliament and the experts of the secretariat so as to enhance their skills.
Thus, over 1077 training was offered over the budget years on basic legal concepts of law, basic computer
and IT skills, parliament diplomacy, leadership, entrepreneurship, decision making, capacity building and
time management, English language etc to member of parliaments and staff of the secretariats. These
trainings contributed to efficient and effective delivery of service by member of parliaments and contribute
to the on-going democratization process. Members of the leadership of the House and experts of the
Secretariat have taken training on the area of Inter-Governmental Relations (IGR). In addition to the above
stated professional and mission oriented trainings, knowledge transferring forums, various management,
information communication and technology and communication trainings has been given for the purpose of
enhancing the administrational capacity of the House and the Secretariat
5.3.3 Human rights protection and monitoring
Citizen’s Human rights awareness creation: to raise citizens’ awareness and develop their knowledge
regarding protection of basic human right, protection of disabled personnel’s, economic and cultural right,
children right, illegal human trafficking, protection of women and child rights, over 77 trainings were
provided to different stakeholders from different parts of the society. During the year 2012/13 it was able to
train over 195 participants from different institutions including federation of employee associations,
representatives from disabled association, teachers associations regarding protection of basic human right
and related matters. Furthermore, training was given to higher officials and experts from developing regions
on protection of basic human right and harmful traditional practices against women to over 320 participants.
Regarding the prevention and protection of illegal human trafficking, awareness creation education was
provided to 109 participant selected from different part of the society. Similarly over 26,797 copies of
international human right documents were translated in to Amharic, Afan Oromo and Tigrigna languages
and distributed to different institutions and the general public.
Build the capacity of democratic institutions and law enforcement organs about human rights: to
enhance the capacity of democratic institutions, enable member of councils understand, respect and protect
human right, training was offered to over 2,374 representatives from federal and regional council, 5,555
police and prison officers, judges and representatives from defense and military personnel’s over the last
three years of the GTP. During the year 2012/13 in order to enable justice bodies perform their duty in
efficient and effective manner and ensure protection of human right awareness creation training and
education was offered to over 1,493 representatives from councils, police, prison officers, judges, and
defence and military personnel.
Monitoring of human right protection and expanding Commission’s accessibility: several activities
were conducted during the fiscal year under review on complaint investigation and rectification of human
right violations. One of the mandates of the Commission is to undertake investigation, upon receipt of
complaints or by its own initiation, on human rights violations. Accordingly several activities were
conducted to act on complaint of the public regarding human right violation during the last three years.
About 4,222 complaints were received during the last three years of the GTP. While in the year 2012/13
alone 1,290 complaint (105 cases rolled over from last year) were received. Furthermore the Commission
has undertook monitoring, follow-up and inspection on 114 policy stations, prisons, and child protection
centers during the budget year under consideration
81
Rectify human rights violations committed against citizens: To analyze and curb administrative
malpractices and violations against the citizen’s rights especially vulnerable part of the society it was
planned to undertake 58 studies during the five year plan period. Accordingly, 37 deep rotted studies were
conducted on the causes and consequence of such administrative malpractices. Similarly during the plan
period under review (2012/13) the plan was to undertake 11 studies while it was possible to conduct over 20
studies. Over 206 forums were established to enable executive organ of the government to respect and
protect citizens’ constitutional right during the budget year. Moreover, although it was planned to conduct
60 awareness creation platforms during the budget year it was possible to conduct 79 awareness creation
platforms. Regarding acceptance and taking appropriate steps if needed on compliant reported to the agency
it was planned to increase the complaint response to 75 percent and managed to increase the number to 78
percent by 2012/13. Regarding monitoring and support on government/executive organ malpractices on
citizens it was managed to undertake more than 135 monitoring and support until 2012/13. With regards to
ensuring citizens right to Freedom of Information significant number of workshops and seminars were
organized and conducted, for civic societies, executive bodies, think thanks and professional associations
and the general public where in the year 2012/13 alone over 54 discussion forums, workshops and seminar
were undertaken; the cumulative (2003-2005) performance is 62 percent. Regarding proclamation 590/2000
section three on mass media right to information freedom guidelines, manuals and directives have been
formulated on the overall legal framework of implementation and more than 20 different documents were
distributed over the three years span. Furthermore to enhance the implementation capacity of the authority it
was planned to train over 200 experts while it was managed to train 349 staffs over the last three years of
GTP implementation.
5.3.4 Electoral and Multiparty Political systems
Establishment of transparent and accountable electoral system is the foundation of good governance and
democratization process. Hence, several activities were undertaken to ensure transparency, accountability
and fairness of the 2012/13 local, Addis Ababa and Dire Dawa city councils election. Thus, over 44,509
election stations were established for the 2012/13 election. Furthermore, several support input including
logistic and electoral materials that enable to conduct fair, transparent, peaceful election were undertaken
well before the election start.
The National Election Board consulted all political parties on the time table it developed, the election and
process ahead and took inputs from all stakeholders. Thus based on the agreed time table, registration of
candidate was undertaken. Accordingly 23 political parties and 22 individuals were registered to engage in
the election.
Again following the Board’s time table for registration of voters, a total of 16.26 million male and 15.38
female voters were registered throughout the country. Similarly, election campaign was undertaken
accordingly to the time table the board gave to all candidates until 2 days are left for the Election Day. Thus
political parties and individuals has undertaken the campaign using different channels including free media
spot given to them and the press spot on publicly administered medias. On the Election Day, public
observers, observers from political parties, election executives and law enforcement bodies were gathered to
take part on the election process and observe the fairness and transparency of the election process.
Regarding post-election processes, following the improved election process law, after the completion of the
voting process, counting of the voting was undertaken and the result of the voting was posted immediately
on every election/voting stations and displayed to the public. Similarly the result of every voting stations
was transferred to voting region and after summing up the pooling of all the station the election region
announced the result to the public by posting the result accordingly.
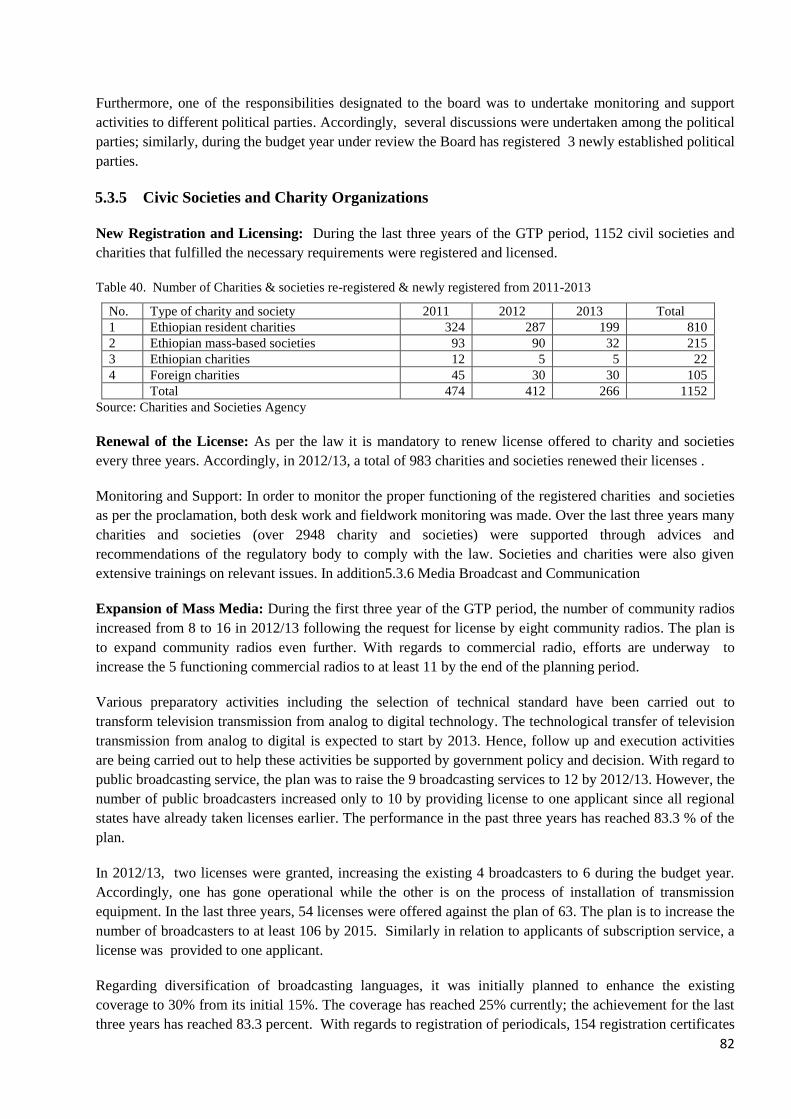
82
Furthermore, one of the responsibilities designated to the board was to undertake monitoring and support
activities to different political parties. Accordingly, several discussions were undertaken among the political
parties; similarly, during the budget year under review the Board has registered 3 newly established political
parties.
5.3.5 Civic Societies and Charity Organizations
New Registration and Licensing: During the last three years of the GTP period, 1152 civil societies and
charities that fulfilled the necessary requirements were registered and licensed.
Table 40. Number of Charities & societies re-registered & newly registered from 2011-2013
No. Type of charity and society 2011 2012 2013 Total
1 Ethiopian resident charities 324 287 199 810
2 Ethiopian mass-based societies 93 90 32 215
3 Ethiopian charities 12 5 5 22
4 Foreign charities 45 30 30 105
Total 474 412 266 1152
Source: Charities and Societies Agency
Renewal of the License: As per the law it is mandatory to renew license offered to charity and societies
every three years. Accordingly, in 2012/13, a total of 983 charities and societies renewed their licenses .
Monitoring and Support: In order to monitor the proper functioning of the registered charities and societies
as per the proclamation, both desk work and fieldwork monitoring was made. Over the last three years many
charities and societies (over 2948 charity and societies) were supported through advices and
recommendations of the regulatory body to comply with the law. Societies and charities were also given
extensive trainings on relevant issues. In addition5.3.6 Media Broadcast and Communication
Expansion of Mass Media: During the first three year of the GTP period, the number of community radios
increased from 8 to 16 in 2012/13 following the request for license by eight community radios. The plan is
to expand community radios even further. With regards to commercial radio, efforts are underway to
increase the 5 functioning commercial radios to at least 11 by the end of the planning period.
Various preparatory activities including the selection of technical standard have been carried out to
transform television transmission from analog to digital technology. The technological transfer of television
transmission from analog to digital is expected to start by 2013. Hence, follow up and execution activities
are being carried out to help these activities be supported by government policy and decision. With regard to
public broadcasting service, the plan was to raise the 9 broadcasting services to 12 by 2012/13. However, the
number of public broadcasters increased only to 10 by providing license to one applicant since all regional
states have already taken licenses earlier. The performance in the past three years has reached 83.3 % of the
plan.
In 2012/13, two licenses were granted, increasing the existing 4 broadcasters to 6 during the budget year.
Accordingly, one has gone operational while the other is on the process of installation of transmission
equipment. In the last three years, 54 licenses were offered against the plan of 63. The plan is to increase the
number of broadcasters to at least 106 by 2015. Similarly in relation to applicants of subscription service, a
license was provided to one applicant.
Regarding diversification of broadcasting languages, it was initially planned to enhance the existing
coverage to 30% from its initial 15%. The coverage has reached 25% currently; the achievement for the last
three years has reached 83.3 percent. With regards to registration of periodicals, 154 registration certificates
83
were offered to applicants against 156 targeted over the three years which was 98.7 % of the plan during the
last three years. In view of ensuring applicants’ satisfaction in mass media licensing and registration service,
the initial satisfaction of customers was 85%. Currently, 91.6 percent of the satisfaction level has been
reached against 95% targeted for three years.
With regards to improving legal procedures and system of performance, it was targeted to compile and
amend 10 mass media legal procedures and system of performance while one advertisement proclamation,
three directives and three standards were compiled totaling 7 legal and procedural documents. To enhance
proper communication between the authority and the media, some 17 communication activities have been
undertaken in the last three years against the 15 targets. To enhance the implementation capacity of
professionals, 20 discussion forums were organized during the last period. Various trainings were also given
to enhance the implementation capacity of professionals
Mass Media Monitoring and Support: A total of 557 legal and procedural violations were rectified based
on information gathered from monitoring activities, information provided from the public and field visit
inspection. Regarding periodicals some 107 violations were corrected. The situation indicates among others
the need to provide capacity building to professionals.
To support the media conform to mass media laws, training on mass media laws was offered to 646 media
professionals over the last three years. In order to create conducive environment in the mass media sector, 8
discussion forums were organized with mass media owners and civic societies over the last three years.
To strengthen sense of responsibility and transparency and compile manuals and standards that support the
monitoring and inspection activity, 7 manuals and standards were prepared.
5.4 Ensuring Good Governance
5.4.1 Strengthening institutional capacity to prevent and control corruption
Due attention has been attached to ensuring transparency and rooting out corruption in the Growth and
Transformation Plan (GTP). Ethics and Anti-Corruption Institutions at every level have a significant role in
the all rounded efforts to ensure transparency in the government system and restrain corruption from
hampering development and good governance endeavors. Hence, several activities are undertaken with
regards to public education and participation, institutional capacity building and enforcement of law.
Institutional capacity building:- To capacitate the anti-corruption institutions with human resource a total
of 168 professionals were hired both at federal and regional states in 2012/13. Similarly to resolve the
efficiency and effectiveness challenges at the sector over 704 professional were able to get short term
trainings, while over 19 professional have attended long term trainings. In an effort launched to create a
society that does not condone corruption, Training of Trainers (ToT) was offered to some 17,467 people
drawn from various segments of the society.
In 2012/13, more than 46,524 senior officials, elected people representatives and experts registered their
assets with the Commission. Over the last three years, the assets of 97,317 senior government officials,
members of the House of People’s Representatives, appointees and employees of various governmental
institutions, heads and employees of public enterprises have been registered both at federal and regional
levels.
Enhancing public education and participation: More than 34 million people drawn from various
segments of the society received awareness raising trainings on issues of ethics and anti-corruption.
Awareness raising education was also provided to some 21.14 million people drawn from various segments
84
of the society during the budget year under consideration. In an effort launched to reach the public through
print media outlets, about 1.3 million copies of different print materials were distributed to various
institutions and the public. Similarly regarding print media in the year 2012/13 alone it was possible to print
and distribute 83,270 brochures, 22,151 posters, 127,198 fliers, and 35,800 magazines to the public. Some
96 radio and 73 television spots focusing on current issues were produced and transmitted via the media. In
addition, seven television and twelve radio dramas focusing on different anti-corruption issues were aired.
Some 93 modules focusing on strategic focus areas were developed and published. Awareness raising
education on Asset Disclosure and Registration Proclamation was provided to the public through various
forums and via media.
Enforcement of law: In 2012/13, 8,515 tip-offs were received, while investigation was opened on 2,524
files of which 783 files were taken to court. Accordingly, the conviction rate was 88.98 percent by files and
74.59 percent by number of defendants. Over the last three years 21,648 tip-off and complaints were
received, while investigation was made on 8027 files of which 2,941 cases were taken to the Court. The
conviction rate was 87.4 percent on files and 77.69 percent by number of defendants.
Studies on working procedures on some 263 activities of various public offices and public enterprises
focusing on procurement, land administration, revenue collection, and justice system were conducted.
Follow up and evaluation was conducted on some 244 working procedure studies undertaken. In an effort
launched to strengthen the relation between Ethics and Anti-Corruption Institutions and Ethics
Infrastructures, some 503 joint forums were held. All the necessary follow up and support activities were
provided to enable competent ethics infrastructures expand ethics and anti-corruption education in their own
initiation. Accordingly, the ethics infrastructures offered awareness raising education to several people.
5.4.2 Strengthen tax administration system
Tax administration is among the sectors identified as heavily vulnerable to corruption and rent seeking
practices. Thus, during the GTP period several reform strategies are laid to combat such malpractices and
corruption. The first strategy concerns strengthening of the administration of the tax information system.
Public education and communication on taxation is another strategy pursued to improve the tax
administration system. Third, strengthening the capacity of the tax administration authority particularly with
manpower with the right attitude and skills is crucial to minimize corruption and transform the tax
administration system. Finally, strengthening the enforcement of the tax law in such a way that it disciplines
all actors also forms part of the strategy during the GTP period. The implementation of these strategies is
already described in detail in chapter one and is not repeated here. But, the bold measure taken during the
budget year under consideration in fighting corruption involving high profile individuals is worth
highlighting here. A number of higher tax officials and other actors suspected of corruption were taken to the
court . This effort clearly demonstrates the commitment of the government in fighting corruption and corrupt
officials and individuals.
Tax administration is among the sectors identified as heavily vulnerable to corruption and rent seeking
practices . Thus, during the GTP period several reform strategies are laid to combat such malpractices and
corruption. Thee first strategy concerns strengthening of the administration of the tax information system.
Public education and communication on taxation is another strategy pursued to improve the tax
administration system. Third, strengthening the capacity of the tax administration authority particularly with
manpower with the right attitude and skills is crucial to minimize corruption and transform the tax
administration system. Finally, strengthening the enforcement of the tax law in such a way that it disciplines
all actors also forms part of the strategy during the GTP period. The implementation of these strategies is
already described in detail in chapter one and is not repeated here. Furthermore, a decisive step was taken
85
during the budget year under consideration with regards to fighting corruption where higher tax officials and
other actors are taken to the court . This effort clearly demonstrates the commitment of the government in
fighting corruption and corrupt officials and individuals.
5.4.3 Urban good governance
To ensure democracy and good governance, eradicate corruption and rent seeking, establishing efficient and
effective land administration system is vital and is among the strategic direction in the GTP. Accordingly,
measures were taken to establishg modern land administration system, capacitate city administration in
efficiently managing their land , boosting land information management reform program, as well as taking
administrative measures to prevent and control illegal land acquisition.
5.4.4 Transparent & Accountable Government Financial System
Inefficient and ineffective government financial system and expenditure is identified as the major source of
corruption and malpractice. Hence, creating efficient, effective, transparent and accountable government
financial system is among the strategic direction being pursued during the plan period. Thus to achieve the
broad objective various reform projects were designed and implemented during the last three years of the
GTP period: system development and capacity building on auditing, accounting, program budgeting and
IFMIS system implementation.
Consequently during the three fiscal years of GTP (2010/11-2012/13) several reform measures and
remarkable achievements were registered. In this regards:-
To implement outcome oriented program budgeting system has been designed and Federal
government budget is fully prepared using program budgeting system since 2011/12.
To enable demand driven cash transfer to government offices and change the traditional approach of
transfer establishing ceiling based on actual expenditure by transferring the money through banks,
enable Zones and Woredas get the finance services using common pool several reform measures
were undertaken
Following the experience/ lesson from different countries a Self-accounting system was
implemented where budgeting organization close their balance and Audit it and present it after the
parliament
To implement integrated and interlinked structure among all government entities from the federal to
region and up to the Woreda it is planned during the first round to link 592 Woredas and Zones,
while at the second round 67 federal budget offices will be linked using WoredaNet network, hence,
to achieve this broad objective infrastructural works are being underway following negotiation with
telecom service provider
To implement performance audit system manuals, standards and guidelines were prepared and
preparatory work are underway to undertake holistic and dynamic training to implement the system
across the board.
To enhance the capacity of Internal auditing priority was given to boost the capacity of Woredas by
doing so on preparation of implementation manuals has commenced to establish audit committees
on selected 400 Woredas
To implement integrated financial management Information System nationwide piloting
implementation was undertaken on 6 federal institutions, 2 regional states and 2 Woredas
totalling 10 pilots
86
Manuals and guidelines that assists proper implementation of the proclamation on government
finance management, government procurements, were prepared and implemented
To aware the general public about the finance administration, to enhance citizen participation on
planning and budgeting, aware the public the allocated budget and tracking the purposeful allocation
of the budget in a transparent and accountable manner, different directives, manuals and templates
were prepared and distributed, training were conducted. Furthermore the public was made aware
using mass-media; similarly several awareness creation activities were conducted at regional states
and Woredas level. Over all more than 243,564 citizen were trained nationwide regarding the
finance administration, budget preparation and execution
Proclamation and directive on establishment of National Auditors and Accountants Board that
stratify international Accounting and Auditing standards and that will be used as basis for
harmonizing finance reporting system was developed and presented to council of ministers for
approval. Similarly proclamation and directive to establish professional training institute was
presented after the council
Training was conducted to more than 2000 professionals from federal government offices on cash
management, government account control and management, internal audit and internal control
standards, information system management, government procurement system, government assets
and stock management/ administration. Similarly trainings were given to experts of regional states
on the above listed reform measures and system development
Improving the existing proclamation, guidelines and directive in relation to program budgeting and
IFMIS implementation and development of new procurement documents that need to be
implemented nation-wide has been undertaking and underway as well. Furthermore,
professionalized training for procurement professionals, preparation of audit implementation
guidelines was some of the other activities undertaken. Similarly after development and presentation
of IFMIS Roll-Out strategy to the senior officials the bid process is under way to select a company
which took over the task. To efficiently and effectively implement the IFMIS and finalise
development of infrastructural work through WoredaNet different measures are being undertaken
and several work have been conducted
To develop national procurement implementation system and to strengthen property disposal system,
between 2010/11-2012/13 procurement of several assets in a coordinated and harmonized manner to
federal budget offices were undertaken similarly different contract were signed with both domestic
and foreign supply to conduct effective, efficient and fast procurement that narrow the room for
corruption and malpractices in the area of government procurement. Similarly systems were laid that
reduce cost and raise efficiency in public procurement that allows proper utilization of government
and public resource and enable allocate properties to their intended objective. Similarly during the
fiscal year 2012/13 proper disposal of 197 vehicles and other properties of 9 offices took place and
resource worth millions was earned during the process.
87
CHAPTER VI
CROSS CUTTING SECTORS
6.1 Women, Children and Youth Affairs
Ensuring women, children and youth participation in the on-going social, economic and political affairs and
organize them to benefit from the economic growth, following up that adequate care and support provided to
orphans and children at risk, protecting children from harmful traditional practices and following-up that
their safety and rights are respected were the main focus during 2012/13. Accordingly, in 2012/13, targets
were set to promote 242 women cooperatives from micro and small to medium level entrepreneurs and 237
(98 percent of the target) women cooperatives have been transformed from micro and small to medium level
entrepreneurs.
In the fiscal year under review, it was planned to engage 600,000 women in micro and macro enterprises and
it was possible to engage 723,275 women, indicating that the performance is about 21% higher than the
planned target for the fiscal year. About 0.89 and 4.2 million women have also been organized and
benefited from self-help group and agricultural package respectively. In the same period, 4.1 million women
have been provided saving and credit services showing about 46 % higher performance than the planned
target. In the fiscal year under review, 729,671 women have received training on management and business
livelihood skills.
Childcare and support
During 2012/13 fiscal year, 2,860 child rights committees were strengthened and empowered form federal
down to kebele level to support the implementation of children rights and to protect children from all forms
of abuse and neglect while 3,441 community dialogues have been organized and 1.2 million vulnerable
children at risk have received support from community based support. In addition, 1900 people were trained
to provide door to door support for vulnerable children.
Mainstreaming and institutionalizing women’s and children’s affairs in all sectors
In the budget year, it was planned to strengthen different institutions and working systems to enable
women to benefit from the ongoing social and economic development. In this regards, targets were
set to strengthen 801 women’s association and create 9 initiative forums and to capacitate 60
women’s affairs institutions. Accordingly, 3,892 women’s association was strengthened, 62 forums
were organized and 80 women’s affairs institutions were strengthened.
Establishing management information system and strengthen women’s coalition: To facilitate
information communication between the Federal Ministry of Women, Children and Youth Affairs
and Regional Bureaus of Women, Children and Youth Affairs, it was planned to connect three
regions and Jigjiga University with internet and the plan was fully accomplished. To identify the
problems in ongoing activities regarding women’s and children’s affairs, it was planned to conduct
23 studies and it was possible to conduct 30 studies.
Harmful Traditional Practices Affecting Women and Children
Protecting women and children from harmful practices is one of the key activities that have been
undertaken in the budget year. In this regards, discussions focused on harmful practices, with a
88
special focus on child marriage has been undertaken. In the last three years of the GTP, over 20
million people and 12 million youth have received awareness creation on violence against women
and harmful practice and 3.7 million youth have received different trainings through their
association regarding harmful practices including female circumcision and early marriage.
To address the issues of harmful traditional practices on women and children, national committee
composed of high-level officials have been formed. In four regions, i.e., in Oromia 3.7 million, in
Amhara 2.6 million, in SNNP 1 million and in Tgray 823 thousand girls organized in one to-five
development groups to work against harmful traditional practices. Furthermore, 800 community
based dialogues have been organized in Amhara Regional State to protect girls against early
marriage and 250 community based committee were established during 2003-2005 plan period.
Strengthening Youth Associations
Capacitating youth implementation capacity and enabling them to benefit from the economic
growth was one of the target areas in the fiscal year under review. Accordingly it was targeted to
promote 400 youth micro and small enterprises to medium enterprises and 290 youth micro and
small enterprises were promoted indicating 73 % achievement of the planned target. It was also
planned to organize 700,000 youths in micro and small enterprises and it was possible to organize
1,131,275 youths in micro and small enterprises, performing 62 percent higher than the target.
Furthermore, it was targeted to organize 412,498 youths in agricultural development and 345,228
youths outside the agricultural sector and the achievement was 123 percent and 56 percent
respectively.
6.2 Sport Sector
The strategic directions for sport sector development in the GTP period are focusing to ensure
peoples participation at all levels in sport activities, organize and support sport federations,
associations and sport committees, development of sport facilities, supporting community sport
committees and expanding education and training programs. Accordingly in 2012/13 fiscal year
activities were performed within the strategic direction of the GTP and performances are presented
below.
Organizing and Supporting Sport Federation Association and Community sport Committees
During the GTP period, it has been targeted to establish a total of 94,214 sport associations of
which 21,350 sport associations were planned for 2010/11-2012/13. In 2012/13, one sport
association at national level, 6724 federations and community committees at regional, zonal and
woreda levels, 63 sport recreation committees at various government organizations and 9,353 sport
teams at regional to kebele levels were established. Furthermore, 14,954 clubs and association
received financial, technical and material support.
89
Expanding Sport Facilities
The development of Sport infrastructure such as pitches, gymnasiums, stadiums, tracks and training centers
have direct impact on sport growth and development. The government is committed to increase its efforts to
finance sport infrastructure and create conducive environment for the private sector to invest its capital in
sport infrastructures and facilities. During the 2012/13 fiscal year, it was planned 18 private investors
to take part in the preparation of 4,056 sport field and construct 1 training center and it was
possible to construct 3,977 sport fields by 12 investors and 2 training centers. Overall, a total of
10,616 sport fields were constructed in 2010/11-2012/13.
With regard to community participation
Developing people’s participation at all levels and in each direction is recognized as a major direction for
sport sector development. To fulfill this target, the participation of people, increasing the number of sport
events, games, festivals, seminars, workshops, and discussion programs were to be undertaken. During
2010/11-2012/13 GTP period, a total of 109,085 community sport events, games and festivals were
undertaken.
Expand education and training program
Attention has been given to expand training centers and organize training programs to those elite athletes
and sport professionals. To accomplish this target, Federal sport commission, with the collaboration of
ministry of education launch youth training project throughout the country and have implemented sport
science training programs in joint venture of higher institutions. In 2012/13 fiscal year, 21,757 youth have
received training services, 7,995 sport professionals and 3,179 sport physiotherapists have received
trainings.
6.3 Prevention and control of HIV/AIDS
Decreasing adult HIV incidence from 0.28 in 2009/10 to 0.14 in 2014/15 and maintaining HIV prevalence at
2.4 percent were key planned targets. Related to that adult incidence has been declining by 0.03 percent
annually over the last three years. Similarly, maintaining the GTP target of adult prevalence at 2.4 percent in
2009/10 has declined to 1.5 percent in 2010/11 and further reduced to 1.3 percent in 2012/13. The number of
people that were provided with voluntary counseling and testing services increased from 9.45 million in
2010/11 to 11.29 million in 2011/12 and further to 11.57 million in 2012/13. Over the last three years a total
of 32.31 million beneficiaries received the service. However, compared to the 2014/15 target this
performance is only 67.7 percent and coordinated work is required.
The number of health facilities providing HCT services increased from 1445 in 2010/11 to 190 in 2011/12
and to 2150 in 2012/13. Trend in the coverage of HIV positive mothers who received prevention of mother
to child transmission (PMTCT) service in increased from 11 percent in 2010/11 to 24 percent in 2011/12
and to 43 percent in 2012/13. Compared to the 2014/15 target of 85 percent this performance is lagging
behind. In relation to improving condom distribution, over the three years, 173.8 million, 146.8 million, and
147.3 million totally 467.91 million condoms have been distributed. This distribution is only 23.8 percent of
the GTP target and hence needs to be improved in the next two years of the GTP period.
To decrease HIV/AIDs incidence rate and to stabilize it awareness creation among teenagers (15-19) is one
of the key activities. Based on this, awareness creation has slightly improved from 22.6 percent in the base
90
year of the GTP to 22.8 percent in 2012/13. Compared to the 80.2 percent target of 2014/15 a strengthened
work is needed during the next two years.
6.4 Social Affairs
The main strategic direction of social welfare is protecting the rights of and creating opportunities for
participation of the disabled and the elderly people so that they contribute fully to the development process
as well as to political, economic and social activities in the country. Hence during the fiscal year the
following activities have been carried out.
During the reporting period at national level a total of 53,632 who are with disabilities have received
physical rehabilitation services which facilitated their free movements and reduced their psycho - social
problems in earning their livelihoods. The performance is 79% of the target set for the budget year. The
reason for this less performance as compared to the target set for the budget year is due to the limited
number and location of the physical rehabilitation service centers in the country as compared to the demand
required. The performance is 10% higher than the previous year and it is 56% of the target set for the GTP
final year. Moreover, since the centers are located in urban areas, most of the needy service users face
difficulties to reach the service centers.
Regarding social Welfare/protection service it was planned to provide 454,392 people who are under
difficult circumstances all over the country and the performance is 277,349. It is 61% of the plan target
which is of course under the target of the budget year. The reason for low performance is that the access to
the service is limited in most of the regions and the service is provided with low capacity. Hence, the
performance is 1% less than the previous year but the total performance of the budget year as compared to
the target set for the year 2014/15 is 43%
With regard to Awareness Creation program on social protection issues for the budget year it was planned
to conduct trainings for 384,055 citizens and 5,567,170 were trained on prevention of social problems. The
performance is 10 times fold of the plan for the budget year and 1% higher than the previous year. Moreover
the performance is 100% of the target set for the year 2014/15.
6.5 Labor Affairs
The main focus areas of this program are to expand job information services, expand workplace support and
cooperation and monitor of the working environment. Hence during the reporting period the following
activities have been achieved.
During the GTP period it was planned to establish 7 key labor market indicators. The performance during
the last three years is 100% and saved on the website of The Ministry of Labor & Social Affairs.
Regarding Ethiopian citizen working abroad, a national committee has been formed to protect the welfare of
the citizen and prevent the illegal trafficking of human being. Under this national committee a technical
committee has been organized and a working manual was issued for its further task. A one day seminar was
also held to hear the performance of the sectors. Different sectors have been presented their report and
performance evaluation has been conducted and a direction has been set for future task. Since then the
committee has undergone the following activities.
In 6 Regions and two city Administrations, Awareness was given for 3,517,408 gov’t bodies and different
stockholders to prevent human trafficking. In addition, in collaboration with Fana Broad cast corporate
91
awareness was given for 390 woredas’ human trafficking prevention committees, Elders, Religious
institutions, NGOS’ representatives and victims’ families in specifically high human trafficking areas.
During the reporting period, for 112 Private foreign employment agencies and for 157 domestic employment
agencies work permits were issued. Furthermore, 336 inspections have been conducted by the ministry on
Private employment agencies to check whether they are operating in line with the rules and regulations.
After the inspection, the licenses of 1094 agencies found illegal were banned, out of which 875 licenses
were released after a while for agencies complied with the law.
During the budget year it was planned to employee 42, 000 citizens abroad, but 182,283 citizens (consists of
7261males and 175,022 females) have been sent to foreign countries. The performance is four times fold the
target set for the budget year. Though the performance is 8% less than the previous year, it exceeds the
target estimated for 2014/15.
For the budget year it was planned to issue work permit for 25,000 foreign citizens. Totally 29,957 foreign
nationals were issued with work permit services. The performance is four times fold of the target set for the
budget year and the target set for the GTP period is above 100% completed.
With regard to improving working environment, during the budget year it was planned to monitor service of
working conditions of 6,972 different organizations. During the reporting period a total of 50,840 enterprises
were inspected. The performance of the budget year is higher as compared to the target set for the year and
the performance of the last fiscal year.
Regarding bilateral consultation system at organizational level, during the budget year it was planned to
establish bilateral consultation system between the employee and employers with in 100 organizations. In
the reporting period, a total number of 938 bilateral consultation mechanisms were established. The
performance for the budget year is much higher as compared to the target set for the year and significantly
exceeds the target estimated for the final year of the GTP.
Regarding work disputes and solving through dialogue, during the budget year it was planned to settle work
disputes of 78% of the total disputes for settlement in 8 regions and 2 cities administrations. Out of the total
disputes submitted for dialogue, 86% were settled by agreement. In other words out of 7,778 submitted
disputes for settlement services, 6,697 (86%) were settled by agreement. The reason for such good
performance is the same reason as the previous year.
Regarding the future two consecutive planning periods (2006 and 2007 EFY), the sector has planned to
accomplish all remaining GTP and MDG targets through: - Capacity building, supporting and strong and
coordinated monitoring and evaluation system for all regions and Delivery of special support for developing
regions.
6.6 Population and Development
With regard to expansion of health extension services and strengthening family planning, it is known that the
survey (DHS) is conducted every five years. According to the 2011 Demographic health Survey,
contraceptive use among currently married women of child bearing age has increased to 29%. However, the
performance during the last three years is expected to rise especially by participating the public in general
and women in particular.
National taskforce has been formed involving stakeholders and partners and a draft of the assessments on the
implementation of population policy discussed with stakeholders in which constructive comments were
92
collected to incorporate in the draft document. Consultative meeting was also held to establish population
and development parliamentary network and reached consensus.
Different workshops were held to promote/launch results gained from capacity need assessment made at the
federal sector offices and regions and necessary feedbacks were collected to prepare the 2012’s population
and development indicators. And finally dissemination workshop was conducted on the National Research
Agenda on Population and Development to participants drawn from higher education institutions, and
partner organizations.
During the reporting period for 22 federal and regional mass media practitioners/journalists focused on
raising their skills about how to convey population and development information and education through
their programs. Training was also given to planners and implementing bodies that have close relation with
planning about the utilization and explanation of 2011 EDHS, national census, and other surveys
information. Moreover different trainings including training on Spectrum software and population and
development related issues were given for the staffs of the directorate.
Using multimedia useful messages were transmitted on air to the society in order to increase the awareness
on the inter-relationship between population and development and inculcate the National motto of small,
happy and prosperous family.
6.7 Culture and Tourism
The direction of the sector is to enhance the role tourism and culture play in socio economic and political
development initiatives. Hence the cultural, natural and historical heritages and values of the country would
be developed so that they play a significant role in socio and economic development and make the country
the best tourist destinations in Africa. Tourism industry products and services will be expanded in quality
and quantity to enable them to compete globally. Therefore during the budget year the following main
activities have been carried out.
During the fiscal year at national level, it was planned to register 7 non moveable heritages, 14 intangible
heritages, 802 moveable heritages, and 2 heritage places and the entire target is achieved. The targets
registered performance for each activity was 173 for non-movable heritages, 79 for intangible heritages,
4567 respectively. It was planned to employee in the sector about 886,000 job seekers and the performance
registered is 783,638.
During the budget year it was planned to increase the number of tourists inflow up to 750, 000 and the
performance is 629,050 in which 633,767,875 USD revenue is collected. In the budget year it was also
planned to collect income from different services of the sectors amounting Birr 80,400,000 and the
performance is Birr 213,910,205.
It was planned to provide certificate for 600 tourism service providers in the fiscal year but the performance
is 900 and 1 language profile document is published according the plan. It was planned to conduct research
on 10 folklore arts and the performance is 19. At international level it was planned to participate on 31
tourism trade fare, exposes and festivals and the performance is 28. It was planned to participate on 9
domestic tourism trade fares and the performance is 10. It was planned to maintain the existing road network
of 4,183 KM in all parks and the performance is 3,868 KM. It was planned to construct 17 Scout houses
and the performance is 13. It was planned to construct 83 tourist destinations in all national parks and the
performance is 65.
93
6.8 Science and technology development
Innovation Governance: Over the 3 years identifying and selecting technology, preparation of draft
innovation policy and mechanism document, and innovation has been conducted and submitted to the
Council of Ministers, which approves the policy. Furthermore, national science and technology innovation
council has been established and detailed strategy was prepared.
Technology Transfer and Development: effort was made to create technological transfer and development
system in preparing the guideline for technology assessment, selection and utilization. During 2010/11-
2012/13 period 1723 value added technology information and 31 documents were distributed to different
institutions.
Human Resource Development: National award was prepared to give recognition and honor outstanding
achievements of researchers, innovators and institutions. Following the evaluation of the work of applicants,
432 researchers received the national award. Furthermore, with respect to technological usage training was
given to 407 small and medium enterprises staffs to fill the gaps.
Eradication and suppression of tsetse flies was respectively accomplished on the land area of 23,500
square km and 76,500 square km located in the southern Ethiopia rift valley. The plan was to cover the total
land area of 105,000 square km including the project are of 25,000 square km.
Protection and Development of Intellectual property: During the three years, in the intellectual property
sector, 13.2 million patent documents were collected and 4.3 million patent documents were distributed to
the institutions as per their requirement. For the next two years 13.6 million patent document accumulations
and 4.6 million documents dissemination is planned.
Radiation Protection and Regulatory Control: During 2010/11-2012/13 radiation protection and safety
inspection were done for 970 institutions of radiation emitting materials. In addition service was given to
856 users.
Standards Development and Implementation: Over the GTP period it was planned to prepare 10,000
Ethiopian standards (5,000 new, 5000 revised). Performance of the last three years showed that 6,975
(65.79 percent) new and revised standards were achieved. Within the next two years 3,421 standards will be
prepared.
National Meteorology: The plan was to increase national measurement coverage from 10 percent at the
base year of the GTP to 75 percent by 2014/15. Performance during the last three years showed 20, 30, and
42.5 percent, respectively. Within the next two years of the GTP period it is targeted to reach 65 and 75
percent of first level national measurement coverage.
National Accreditation: During the GTP period 60 institutions have been targeted for accreditation. Six
laboratories have been accredited and eight laboratories have applied. In the next two years of the GTP
period it is planned to give accreditation for 54 institutions.
Conformity Assessment: Over the last three years of GTP period certification, ensuring product quality and
laboratory testing services were provided to enhance the quality of products and services that are given by
producers. Moreover, four branch laboratories (Hawassa, Dessie, Dire Dawa and Bahir Dar) were
constructed and two additional will be constructed in the next two years of the GTP period.
94
6.9 Environment and Climate Change
Ensuring sustainable development demands environmental protection and combating the impacts and causes
of climate change. Thus, the Growth and Transformation plan focuses on building climate resilient green
economy and enforcing environmental laws at different administration levels. Building climate resilient
green economy in turn needs adaptation to climate change and mitigation of Green House Gases (GHGs). To
contribute for the national goal of sustainable development, there have been several undertakings
accomplished in this sector in 2012/13 fiscal year. The major ones include enhancing the capacity required
to build climate change resilient green economy, developing capacity for taking actions on mitigating green
house gases and enforcing environmental laws at all administrative units and sectors.
Enhancing the Capacity Required to Build Climate Change Resilient Green Economy: In this regard, 2
climate change adaptation manuals have been prepared in accordance with the target and it was planned to
prepare 21 sectoral and regional climate change adaptation plans and it was possible to prepare 28 sectoral
and regional climate change adaptation plans witnessing a performance which is higher the target. On the
other hand, it was possible to implement environmental conservation technologies to ensure the safety of the
4 infrastructures at the upper basin showing a 36.3 percent performance and 11 environmental technologies
have been implemented in 106 Woredas on the upper basins of Tekeze, Ghibe, Tendaho and The Great
Renaissance Dam to ensure the safety of infrastructures. Besides, one project has been implemented to
reduce the impacts of climate change on rivers and wetlands.
Developing Capacity for Taking Actions on Mitigating Green House Gases (GHGs): In terms of
mitigating green house gases, it was planned to provide 3 supports to implement projects which will at least
reduce 8000 mega watt green house gases and 1 support was provided in the fiscal year under consideration.
It was planned to implement 4 projects to produce 525 000 liter clean ethanol and biodiesel and it was fully
accomplished. In addition, 1 support was provided to prepare projects for mitigation of at least 20 million
cube methane gas emissions from newly constructed and old landfill sites, and one support also provided to
increase the vegetation coverage of 200 square kilometer degraded land and to increase the carbon
sequestration capacity in productive forests on 25000 sq of land.
Enforcing Environmental laws in all administrative units and sectors: to ensure the enforcement of
environmental laws at all levels, a report of the effectiveness report on emission level and compliance was
prepared in 8 identified industry sectors in the fiscal year under consideration. Two additional environmental
conservation systems have also been prepared. On the other hand, it was planned to conduct 16 trainings to
build the capacity of regional environmental agencies, environmental units and environmental
conservationists at community level, and 9 trainings have been offered showing a 66.7 percent performance.
In conclusion, various activities have been accomplished in relation to environment and climate change. In
order to achieve the broad goals of building climate resilient green economy and enforcing environmental
laws at all levels, and to enhance the capacity of accomplishing these broad objectives, the government
established a new ministry to handle these issues. The new ministry is expected to accomplish its duties and
responsibilities in the process to develop the capacity of building climate resilient green economy and
enhance the leading role of the country in the international world. In addition, the natural resource
conservation and basin development works undertaken through the active participation of communities, and
the construction of power projects from renewal sources of energy indicate Ethiopia’s commitment to
implement its climate resilient green economy strategy.
95
CHAPTER VII
MONITORIING AND EVALUATION SYSTEM
The objective of Monitoring and Evaluation System of GTP is to follow-up, monitor and evaluate the
accomplishments and inform the decision making. The system also comprises major results of the GTP that
have been built on government policies and strategies. Accordingly, in 2012/13, the following activities have
performed by federal executing bodies and the Central Statistical Agency (CSA).
7.1 Monitoring the Overall Plan Performance by MoFED
The first two years annual progress Reports of the GTP implementation have prepared, conducted
consultative meeting(both at federal and regional levels) on the reports, all relevant stakeholders including
representatives of Government institutions, the private sectors, development partners, civil society
organizations, religious institutions, youth and women associations have participated in the consultative
meetings. Lessons have learned from the first two years of GTP implementation. Bi-annual High-level
Forum(HLF) and Joint Budget and Aid Review (JRIS/JBAR) were also conducted to review progresses in
GTP and Protection of Basic Services Program II.
In view of managing the economy in a transparent and accountable manner, price information was updated
on monthly basis and used as input for policy decision. Follow-ups were conducted on the implementation
of fiscal and monitoring policies and export performance, public finance, macroeconomic performances and
have taken immediate action for the problems encountered and as a result stable and sustainable macro
economic performance ensured.
7.2 Performances of the Federal Executive Bodies
Executive bodies at federal level have implemented their annual plans, performance were monitored and
reviewed at consultative meetings prepared at different levels and the annual reports of the executive bodies
have submitted to the federal government and use as input for preparation the national level GTP Progress
Report.
7.3 National Survey and Census studies
Follow-up and monitoring activities are being conducted based on administrative and survey data.
Administrative data are those produced by executive bodies and the survey data are those generated by CSA.
Accordingly, survey data are generated by the CSA and used as input for in producing the current GTP
Annual Progress Report.
Agriculture, Natural Resources and Environmental Statistics: In 2012/13, the following agricultural
statistics were collected processed and disseminated through printed copies and posted on the CSA’s web
site: the 2012/13 Crop Production Forecast Survey Report, The 2012/13 Livestock and livestock
Characteristics Survey Report, the 2012/13 Crop Production Main Season(Area, Production and Yield of the
Major Crops Survey Report, farm Management and Agricultural Practices Survey Report, Crop Land Use
Survey Report), the 2012/13 Large and Medium Scale Commercial Farms Survey Report, the 2012/13
Cropland and Livestock Products Utilization Survey Report.
In addition to the above indicated surveys, the 2012/13 Belg Season Survey (Cropland Area, Production and
Yield; and Farm Management Practices) data collection at field level has been completed and the data
processing work is in progress. The cleaned data for 2012/13 Sustainable Land Use Management survey and
Productive Safety Net Panel(PSNP) Survey of Afar and Somali Regions are submitted to the Ministry of
Agriculture for further analysis.
96
Business Statistics: The 2010/11 data executed from the manufacturing industries survey, the 2011/12 data
of the Small Scale Manufacturing Industries, Distribute Trade Survey and The Constriction Survey were
completed and the results of the surveys were disseminated to data users in printed copies and posted on the
agency’s website. Data processing is underway for 2012/13 Large Scale Manufacturing Industries Survey.
The quarterly report on producer’s price index for manufacturing (PPI-M) and quarterly reports on large and
medium manufacturing industries surveys were carried out. Quarterly foreign trade statistics was also
compiled and reports were produced and released to users.
Household Surveys and Price Statistics: Monthly Retail prices of goods and services, Producer Prices of
Agricultural products, and compile Consumer Price Index (CPI), Producer Price Index of Agricultural
Products (PPI-A) and International Comparison Program (ICP) for Africa price survey (ICP-Africa-2011)
which is done in cooperation with African Development Bank (AfDB) and COMESA had been executed as
planned.
The quarterly data for price statistics which was done in collaboration with the Federal Procurement Agency
was collected and submitted to the office on time. Consequently, the statistical and analytical reports for the
Household Expenditure and Consumption Survey (HECS) and Welfare Monitoring Survey (WMS) were
prepared and disseminated to data users in printed copies and posted on the agency’s website. The 2011/12
Urban Employment and Unemployment Survey statistical and analytical reports were done and disseminated
to data users in printed copies and posted on the agency’s website. And the 2012/13 Time Use survey and
Labour Force Survey data collection conducted and data the processing work is in progress.
Population Statistics: Inter-censual survey has been conducted and based on this survey, the report of the
population projection completed and the printing process is underway.
National Statistical Quality and Standards Coordination and Capacity Building: CSA is responsible for
coordinating the implementation of the National Statistical System(NSS). Accordingly, CSA is responsible
to assure quality and standard procedures by minimizing the gap of the results of statistical data. To this end,
CSA produced a document on statistical concepts, definitions and coding and based on this document
Orientation Workshop conducted for 80 experts, drawn from 11 regional Bureaus and 38 federal institutions.
The Agency organized training on data quality by consultants, come from South Africa, Philippines and
India, to experts from federal ministries and regional sector bureaus. In addition, 150 experts from 11
regional sector bureaus were trained on data quality, standard documents and administrative records for six
days in two rounds. Software is being developed for putting the Ethiopian Data Quality Assessment
Framework into effect. The Software under construction helps to control the quality (data entry and
analysis).
7.4 Geo-Information
During the GTP period, emphasis is given to build a national geo-information system that provides quality,
consistent and usefulness of geo-information. Accordingly, 843 photo control works conducted, published
2,203 air photograph positive publications, 87 camera positive print which convert from analog to digital,
converting from analog to digital works prepared for seventy three 1:50000 scale maps, geo-data base work
for twenty nine 1:50000 scale maps, ensured competencies of 70 geo-spatial information products and
prepared standards for 3 geo-spatial information products.
The major problem encountered during the reporting period in relation to geo-information is shortage of
materials for mapping work in domestic markets. Materials for mapping work were also in short supply at
international markets. Procurement, therefore, made possible through repeated Bids.
97
CHAPTER VIII
SUMMARY AND CONCLUSION
The Ethiopian economy continued to grow faster during the third year of the GTP, making a decade of
double digit economic growth between 2004 and 2013. Real Gross Domestic Product (GDP) grew by 9.7
percent in 2012/13 against the target of 11.3 percent set for the fiscal year. During the same period,
agriculture, industry and services grew by 7.1 percent, 18.5 percent and 9.9 percent respectively. The rate of
GDP growth registered in 2012/13 is rapid, broad-based and well above the average growth rate of about 5
percent registered by Sub-Saharan African countries for the same period. In the last three years (2010/11-
2012/13) of GTP implementation, real GDP on average grew by 10 percent per annum. During the same
period, value added in agriculture, industry and services on average grew by 7 percent, 17 percent and 11
percent per annum respectively. Furthermore, the rate of real GDP growth registered in 2012/13 has enabled
the economy to sustain the high growth trajectory for the last ten years. Real GDP on average grew at about
11 percent per annum over the last ten years between 2003/04 and 2012/13.
The structure of the economy has been evolving but slower than planned. In 2012/13 agriculture accounted
for 42.9 percent of GDP compared to 46.5 percent in 2009/10. The share of the industrial sector in GDP
increased to 12.4 percent in 2012/13 from 10.3 percent in 2009/10, while the service sector accounted for
45.2 percent in 2012/13 compared to 44.1 percent in 2009/10. Thus although the composition of the
economy has changed in favor of industry and service sectors over the last three years, the process need to
be accelerated to bring about a significant shift in the structure of the economy. On the supply side the main
driver of the rapid economic growth in Ethiopia has been the agricultural sector. In particular, agricultural
crop production which accounted for about 30 percent of the GDP was the single most important source of
the rapid economic growth registered over the last three years. Thus to sustain the rapid economic growth,
enhancing the productivity of agriculture and particularly of crop production remains critical in the coming
years.
The rapid and broad-based economic growth registered over the last three years has been effective in
generating employment, improving income and reducing poverty. The per capita GDP in current prices has
grown from USD 373 in 2009/10 to USD 550 in 2012/13. The overall poverty level is estimated to decline
from 29.6 percent in 2010/11 to 26 percent in 2012/13. In the same period, food poverty is estimated to
decline from 33.6 percent in 2010/11 to 31.8 in 2012/13. The progress made so far over the last three years
in economic growth and social development has set Ethiopia in a better position to achieve the MDGs target
of reducing poverty level to 22.2 percent in 2015.
Domestic revenue: In 2012/13, about Birr 124.1 billion (91 percent) was collected from domestic sources
(Birr 107 billion tax and Birr 17.1 billion non-tax revenues), clearly indicating the dominant significance of
domestic revenue sources in financing the government budget. Tax revenues are the dominant domestic
government receipts accounting for over 86 percent of the domestic government revenue. Tax revenue alone
account for 78 percent of the total government revenue including grants. All these indicate that the
government largely relies on domestic sources particularly on tax revenues for its budget, which are more
reliable sources and give the government more leverage to advance its policy priorities. The total
Government revenue collected in 2012/13 has grown by 18.62 percent compared to the receipts in the
previous year. Total domestic revenue and tax revenue collected in 2012/13 were 31.8 percent and 31.7
percent higher than their respective targets set for the fiscal year. In 2012/13, total revenue increased by 20.6
percent, while tax revenue grew by 24.8 percent compared to the previous fiscal year of 2011/12. In the past
three years of GTP period, the share of domestic revenue in total Government revenue was on average 90.44
percent indicating a significant increase in domestic capacity of undertaking socio-economic development
98
with own resources. Furthermore, on average about 85 percent of the total domestic revenue in 2010/11-
2012/13 was generated from tax. The increase in domestic revenue and particularly tax revenue has led to an
increase in tax revenue as a proportion of GDP. The tax to GDP ratio has increased from 11.7 percent in
2010/11 to 12.5 percent in 2012/13.
Government expenditure: the fiscal and monetary policy objectives of the GTP are macroeconomic
stability, rapid and sustainable economic growth and increased public spending on the pro-poor sectors.
Total Government expenditure in 2012/13 was Birr 153.9 billion while the planned target was Birr 130.2
billion indicating 18.2 percent higher expenditure than the planned target. Of the total expenditure, Birr 91.2
billion (59.2 percent) were spent on capital expenditure, while the remaining Birr 62.8 billion (40.8 percent)
went to recurrent expenditure. Over the past three years of the GTP period, the Government on average
spent Birr 125.5 billion per annum. Out of this government expenditure, over 69 percent was spent on pro-
poor sectors of education, health, water and sanitation, agriculture and road infrastructure. This clearly
shows the government’s commitment to sustain its efforts to eradicate poverty and improve the welfare of
citizens. In 2012/13, government budget deficit was 2% of GDP. It is to be recalled that the budget deficits
were 1.6 percent and 1.2 percent in 2010/11 and 2011/12 respectively. In 2012/13, the budget deficit was
largely financed by net external debt, while net domestic debt financing played a marginal role.
Domestic saving: with regard to domestic saving the target was to increase to 15 percent of GDP.
Accordingly, various measures have been taken to achieve this target in the past three years, including
awareness raising of the citizens on saving culture, expanding access to financial services, launching and
implementing social insurance program for private sector employees, strengthening Government social
insurance coverage, introducing saving bonds and other saving instruments such as housing saving program,
investment equipment saving program, etc. and allocating more Government expenditure on investments
that increase capital accumulation. As a result of these measures, domestic saving increased from 5.2 percent
in 2009/10 to 17.7 percent in 2012/13. Similarly, the share of gross domestic investment increased from 24.7
percent in 2009/10 to 33 percent in 2012/13 which is relatively high compared to countries at similar stage
of development with Ethiopia. Though the achievements made so far in domestic savings and investment
were remarkable, the gap between gross domestic savings and investment has remained high indicating that
additional efforts are required to further increase growth in domestic savings in the remaining two years of
GTP.
Private sector development: the GTP envisages the private sector to play a critical role in the development
of the medium and large-scale manufacturing industry. Accordingly, in the first three years of GTP period,
measures were undertaken to further improve the enabling environment for the private sector, including
revision of the investment code and restructuring of the Investment Agency to establish a one stop service
for private investment. Medium and large-scale enterprises play a crucial role in creating a competitive
economy through rapid and continuous technological transfer and accumulation, generating foreign
exchange earnings, and supporting the development of small scale enterprise and agricultural growth.
Education: the number of primary schools (Grades 1-8) has increased from 26,951 in 2009/10 to 28,349 in
2010/11. The number of primary schools has further increased to 29,507 in 2011/12 and to 30,495 in
2012/13. These show that a total of 3,544 primary schools were constructed over the last three years. As a
result, primary gross enrolment rate increased from 93.4 percent in 2009/10 to 95.1 percent in 2012/13,
while net enrolment rate increased from 82.1 percent in 2009/10 to 85.9 percent in 2012/13. During the same
period, the gender parity index in primary schools as approximated as the ratio of girls to boys reached
0.94:1 in 2012/13. The number of students in primary schools increased from 15.8 million in 2009/10 to
16.7 million in 2010/11, 17 million in 2011/12 and further to 17.4 million in 2012/13. The progress
indicates that Ethiopia is getting closer to achieving the MDGs target of universal access to primary
99
education. However, additional efforts are required to increase the net primary enrolment rate (particularly
net enrolment in upper primary) in the remaining two years of the GTP period. The number of adults who
participated in functional adult education program increased from 1.2 million in 2010/11 to 2.1 million in
2011/12 and further to 3.4 million in 2012/13. However, compared to the planned target of 18.2 million in
2012/13, the cumulative progress achieved in 2012/13 is very low. With regard to secondary and tertiary
education impressive progresses have been made in the past three years of GTP implementation.
Health: health infrastructure and health extension program have expanded over the last three years
(2010/11-2012/13). The number of health posts increased from 14,192 in 2009/10 to 16,048 in 2012/13,
showing the construction of a total of 1,856 additional health posts during the first three years of GTP
period. As a result, the ratio of health posts to population was 1:5352 in 2012/13 indicating that the standard
of 1:5000 is almost already achieved. The number of Health Centres increased from 2142 in 2009/10 to 3100
in 2012/13, indicating the construction of 958 health centres over the first three years of the GTP period.
Accordingly, the ratio of Health Centres to population declined from 1: 37,299 in 2009/10 to 1:27,706 in
2012/13, which is very close to the standard of 1:25,000 set by the Ministry of Health. Similarly, the number
of hospitals increased from 116 in 2009/10 to 127 in 2012/13. As a result primary health service coverage
reached 93.4 percent in 2012/13, indicating the significant progress made in ensuring universal access to
primary health care. . The ante-natal and post-natal service coverage were 97.4 percent and 50.5 percent in
2012/13 respectively, while births attended by skilled personnel improved from 20.4 percent in 2011/12 to
23.1 percent in 2012/13. Ethiopia has now achieved the MDGs target of reducing child mortality by two
third well ahead of the MDG period.
Capacity building and good governance: over the last three years of GTP period, extensive leadership and
technical trainings have been provided to top management and civil service professionals to strengthen the
capacity of the public sector. Young professionals have been recruited and hired in the public sector at
different levels of government administration. Extensive consultations and awareness creations were
undertaken among the private sector and the public at large concerning the significance of developmental
attitudes and behaviors in accelerating rapid and inclusive growth as well as promoting good governance.
The role of civil societies and charities in the development and democratization process of the country has
also been enhanced over the last three years through improving transparency, accountability and capacity
development in the sector. A total of 1,152 charities and societies organizations were registered and licensed
in the past three years, showing increasing engagement of civil society organizations in the development and
governance process. To ensure transparency and accountability and thereby eliminate corruption, a number
of appropriate measures have been undertaken with regard to strengthening an efficient tax administration,
and urban land administration systems. Furthermore, the ongoing reforms of improving transparency and
accountability in public financial management have been deepened during the past three years of GTP
period. Registration of assets of higher Government Officials, and senior civil servants has been carried out.
Accordingly, a total of 97,317 higher officials and civil servants have registered their assets over the last
three years.
Empowering women and youth: Concerted efforts have been made to ensure women and youth
participation in national development and governance processes of the country. In 2012/13, women
participation in the decision making process in the legislative, executive and judicial bodies has reached 27.9
percent, 30 percent and 20 percent respectively. More than 20 million people participated in different forums
organized by youths to create awareness on harmful traditional practices such as female genital mutilations,
abduction of girls, etc. During the last three years of GTP, 279 youth centers were constructed and about
10.3 million youths provided voluntary services while 6.7 million youths participated in conferences
organized on Development, Democracy and Good Governance.

100
APPENDIX
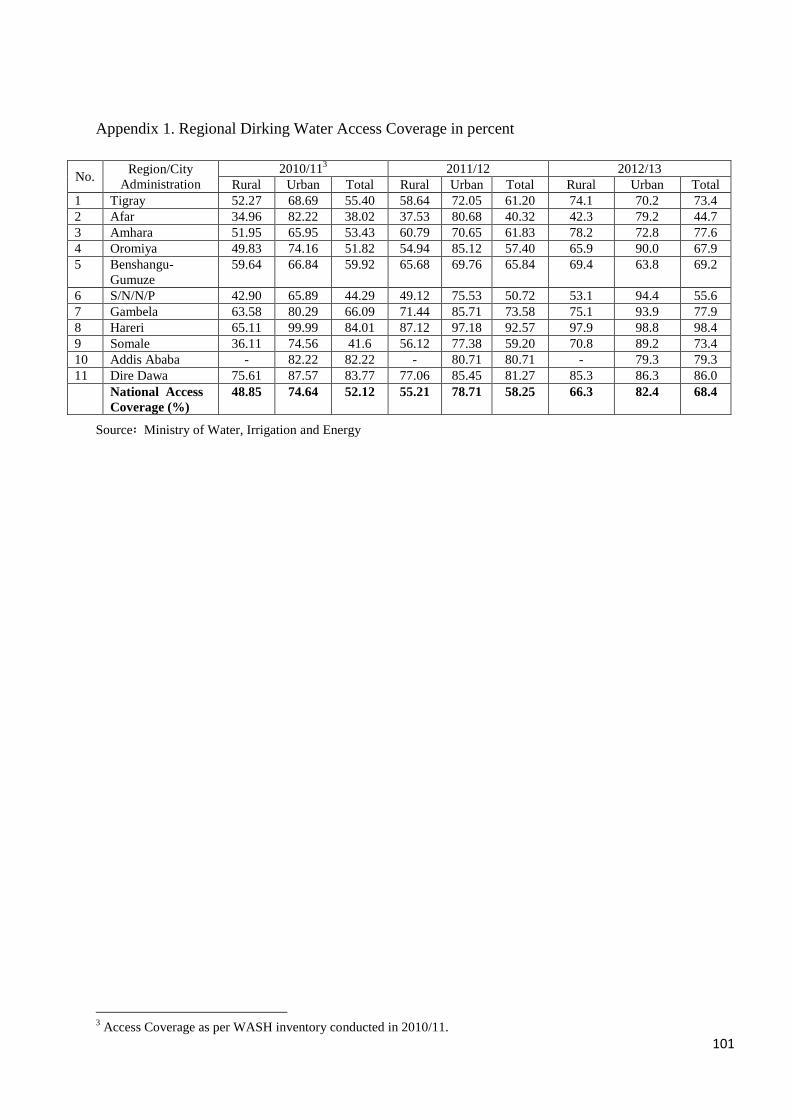
101
Appendix 1. Regional Dirking Water Access Coverage in percent
No. Region/City
Administration
2010/113 2011/12 2012/13
Rural Urban Total Rural Urban Total Rural Urban Total
1 Tigray 52.27 68.69 55.40 58.64 72.05 61.20 74.1 70.2 73.4
2 Afar 34.96 82.22 38.02 37.53 80.68 40.32 42.3 79.2 44.7
3 Amhara 51.95 65.95 53.43 60.79 70.65 61.83 78.2 72.8 77.6
4 Oromiya 49.83 74.16 51.82 54.94 85.12 57.40 65.9 90.0 67.9
5 Benshangu-
Gumuze
59.64 66.84 59.92 65.68 69.76 65.84 69.4 63.8 69.2
6 S/N/N/P 42.90 65.89 44.29 49.12 75.53 50.72 53.1 94.4 55.6
7 Gambela 63.58 80.29 66.09 71.44 85.71 73.58 75.1 93.9 77.9
8 Hareri 65.11 99.99 84.01 87.12 97.18 92.57 97.9 98.8 98.4
9 Somale 36.11 74.56 41.6 56.12 77.38 59.20 70.8 89.2 73.4
10 Addis Ababa - 82.22 82.22 - 80.71 80.71 - 79.3 79.3
11 Dire Dawa 75.61 87.57 83.77 77.06 85.45 81.27 85.3 86.3 86.0
National Access
Coverage (%)
48.85 74.64 52.12 55.21 78.71 58.25 66.3 82.4 68.4
Source፡ Ministry of Water, Irrigation and Energy
3 Access Coverage as per WASH inventory conducted in 2010/11.
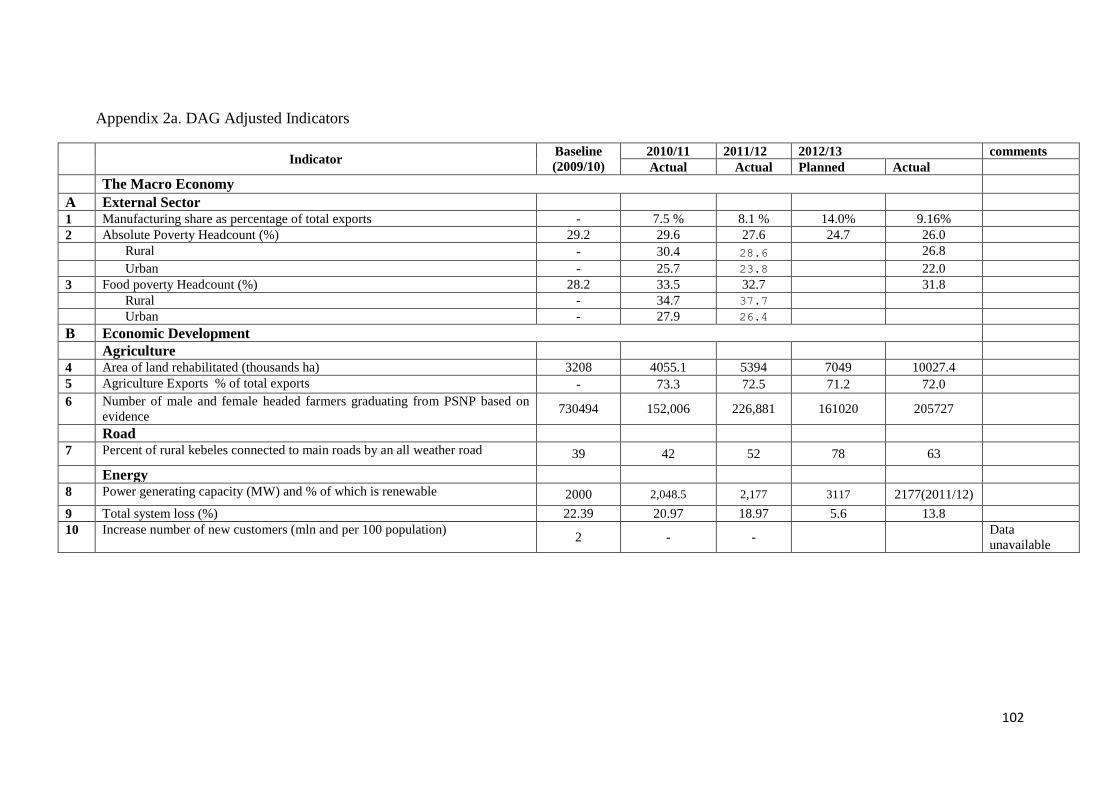
102
Appendix 2a. DAG Adjusted Indicators
Indicator
Baseline
(2009/10) 2010/11 2011/12 2012/13 comments Actual Actual Planned Actual
The Macro Economy
A External Sector 1 Manufacturing share as percentage of total exports - 7.5 % 8.1 % 14.0% 9.16%
2 Absolute Poverty Headcount (%) 29.2 29.6 27.6 24.7 26.0
Rural - 30.4 28.6 26.8
Urban - 25.7 23.8 22.0
3 Food poverty Headcount (%) 28.2 33.5 32.7 31.8
Rural - 34.7 37.7
Urban - 27.9 26.4
B Economic Development
Agriculture 4 Area of land rehabilitated (thousands ha) 3208 4055.1 5394 7049 10027.4
5 Agriculture Exports % of total exports - 73.3 72.5 71.2 72.0
6 Number of male and female headed farmers graduating from PSNP based on
evidence 730494 152,006 226,881 161020 205727
Road 7 Percent of rural kebeles connected to main roads by an all weather road 39 42 52 78 63
Energy 8 Power generating capacity (MW) and % of which is renewable 2000 2,048.5 2,177 3117 2177(2011/12)
9 Total system loss (%) 22.39 20.97 18.97 5.6 13.8
10 Increase number of new customers (mln and per 100 population) 2 - -
Data
unavailable
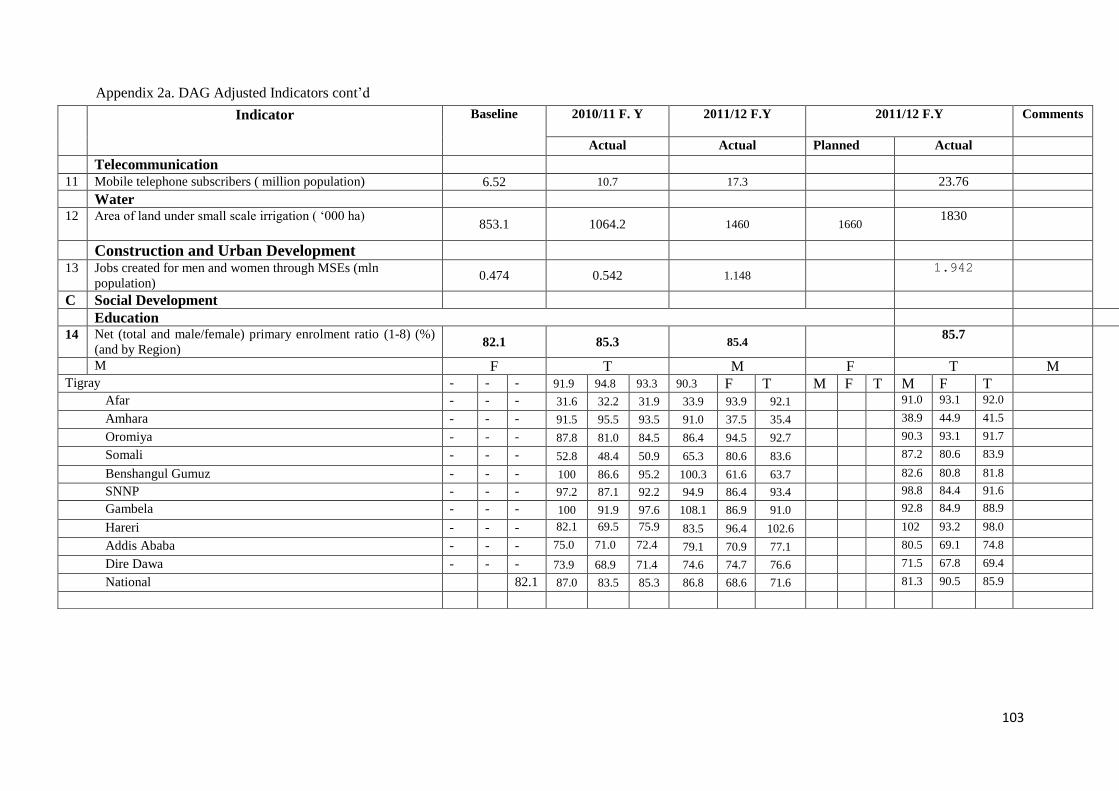
103
Appendix 2a. DAG Adjusted Indicators cont’d
Indicator Baseline
2010/11 F. Y 2011/12 F.Y 2011/12 F.Y
Comments
Actual Actual Planned Actual
Telecommunication
11 Mobile telephone subscribers ( million population) 6.52 10.7 17.3 23.76
Water 12 Area of land under small scale irrigation ( ‘000 ha)
853.1 1064.2 1460 1660 1830
Construction and Urban Development
13 Jobs created for men and women through MSEs (mln
population) 0.474 0.542 1.148
1.942
C Social Development
Education 14 Net (total and male/female) primary enrolment ratio (1-8) (%)
(and by Region) 82.1 85.3 85.4
85.7
M F T M F T M
Tigray - - - 91.9 94.8 93.3 90.3 F T M F T M F T Afar - - - 31.6 32.2 31.9 33.9 93.9 92.1 91.0 93.1 92.0
Amhara - - - 91.5 95.5 93.5 91.0 37.5 35.4 38.9 44.9 41.5
Oromiya - - - 87.8 81.0 84.5 86.4 94.5 92.7 90.3 93.1 91.7
Somali - - - 52.8 48.4 50.9 65.3 80.6 83.6 87.2 80.6 83.9
Benshangul Gumuz - - - 100 86.6 95.2 100.3 61.6 63.7 82.6 80.8 81.8 SNNP - - - 97.2 87.1 92.2 94.9 86.4 93.4 98.8 84.4 91.6 Gambela - - - 100 91.9 97.6 108.1 86.9 91.0 92.8 84.9 88.9
Hareri - - - 82.1 69.5 75.9 83.5 96.4 102.6 102 93.2 98.0
Addis Ababa - - - 75.0 71.0 72.4 79.1 70.9 77.1 80.5 69.1 74.8
Dire Dawa - - - 73.9 68.9 71.4 74.6 74.7 76.6 71.5 67.8 69.4
National 82.1 87.0 83.5 85.3 86.8 68.6 71.6 81.3 90.5 85.9
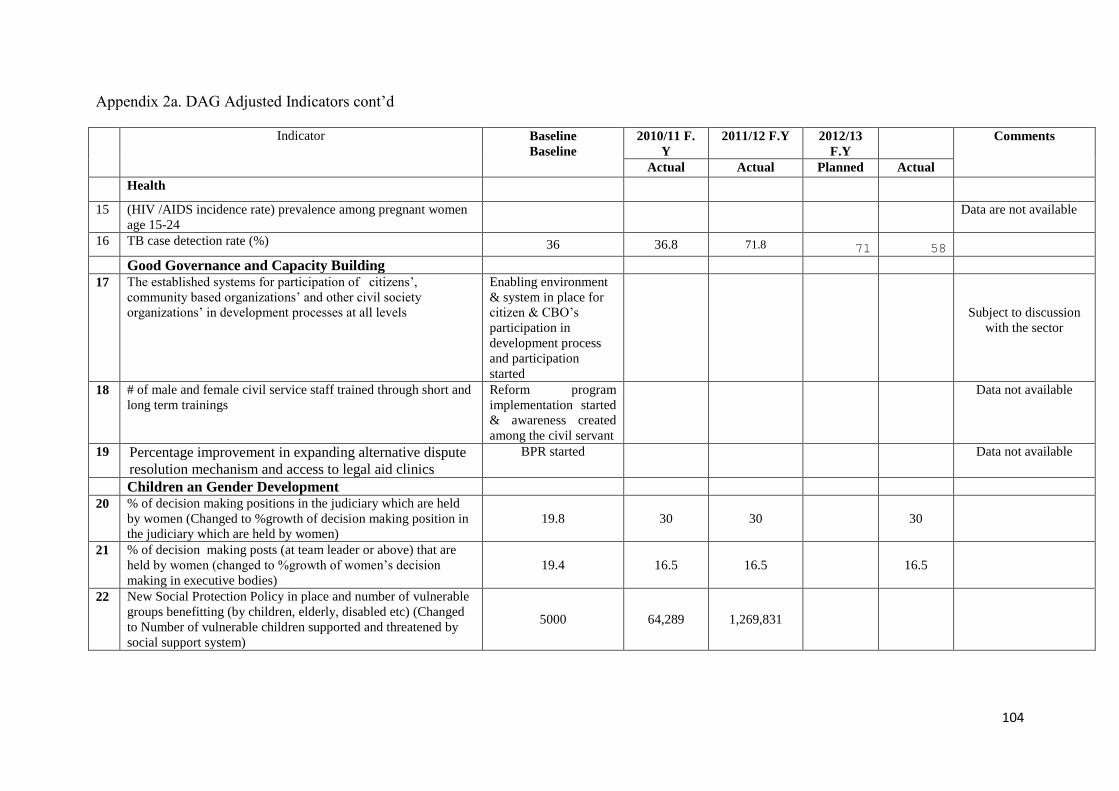
104
Appendix 2a. DAG Adjusted Indicators cont’d Indicator Baseline
Baseline
2010/11 F.
Y
2011/12 F.Y 2012/13
F.Y
Comments
Actual Actual Planned Actual
Health
15 (HIV /AIDS incidence rate) prevalence among pregnant women
age 15-24
Data are not available
16 TB case detection rate (%) 36 36.8 71.8 71 58
Good Governance and Capacity Building 17 The established systems for participation of citizens’,
community based organizations’ and other civil society
organizations’ in development processes at all levels
Enabling environment
& system in place for
citizen & CBO’s
participation in
development process
and participation
started
Subject to discussion
with the sector
18 # of male and female civil service staff trained through short and
long term trainings
Reform program
implementation started
& awareness created
among the civil servant
Data not available
19 Percentage improvement in expanding alternative dispute
resolution mechanism and access to legal aid clinics
BPR started Data not available
Children an Gender Development 20 % of decision making positions in the judiciary which are held
by women (Changed to %growth of decision making position in
the judiciary which are held by women)
19.8 30 30
30
21 % of decision making posts (at team leader or above) that are
held by women (changed to %growth of women’s decision
making in executive bodies)
19.4 16.5 16.5
16.5
22 New Social Protection Policy in place and number of vulnerable
groups benefitting (by children, elderly, disabled etc) (Changed
to Number of vulnerable children supported and threatened by
social support system)
5000 64,289 1,269,831
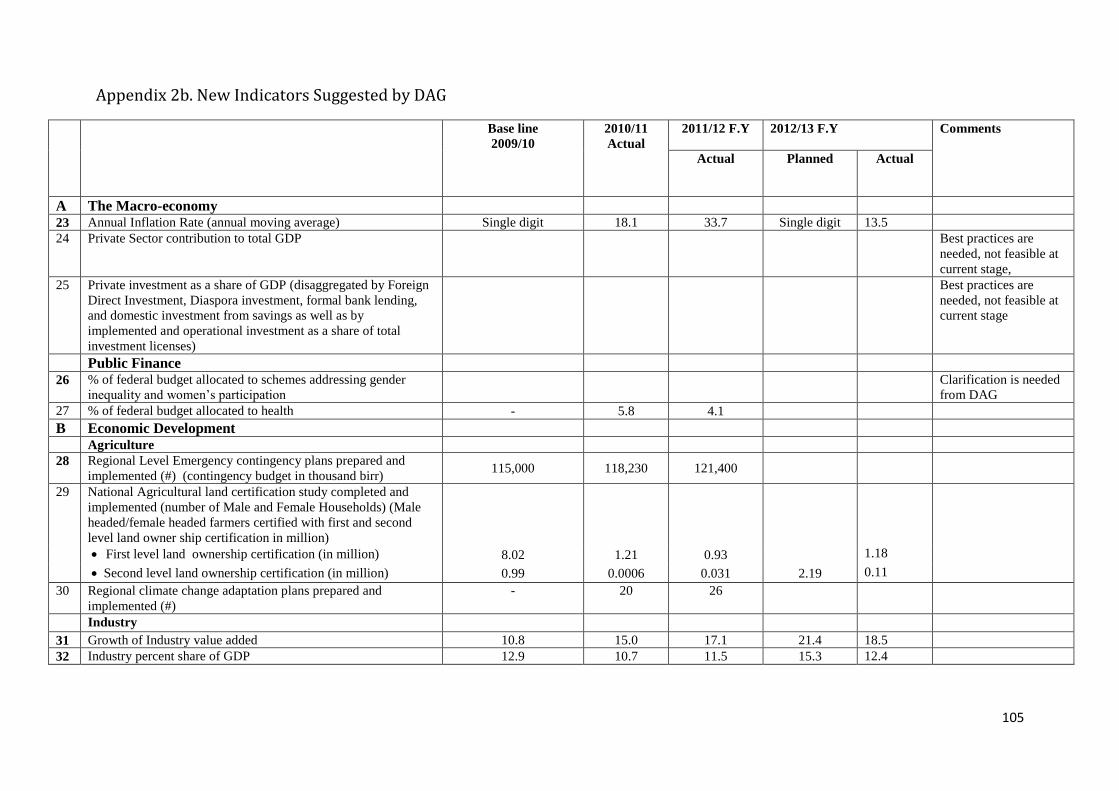
105
Appendix 2b. New Indicators Suggested by DAG
Base line
2009/10
2010/11
Actual
2011/12 F.Y 2012/13 F.Y Comments
Actual
Planned Actual
A The Macro-economy 23 Annual Inflation Rate (annual moving average) Single digit 18.1 33.7 Single digit 13.5
24 Private Sector contribution to total GDP
Best practices are
needed, not feasible at
current stage,
25 Private investment as a share of GDP (disaggregated by Foreign
Direct Investment, Diaspora investment, formal bank lending,
and domestic investment from savings as well as by
implemented and operational investment as a share of total
investment licenses)
Best practices are
needed, not feasible at
current stage
Public Finance 26 % of federal budget allocated to schemes addressing gender
inequality and women’s participation
Clarification is needed
from DAG
27 % of federal budget allocated to health - 5.8 4.1
B Economic Development Agriculture
28 Regional Level Emergency contingency plans prepared and
implemented (#) (contingency budget in thousand birr) 115,000 118,230 121,400
29 National Agricultural land certification study completed and
implemented (number of Male and Female Households) (Male
headed/female headed farmers certified with first and second
level land owner ship certification in million)
First level land ownership certification (in million) 8.02 1.21 0.93 1.18
Second level land ownership certification (in million) 0.99 0.0006 0.031 2.19 0.11
30 Regional climate change adaptation plans prepared and
implemented (#)
- 20 26
Industry
31 Growth of Industry value added 10.8 15.0 17.1 21.4 18.5
32 Industry percent share of GDP 12.9 10.7 11.5 15.3 12.4
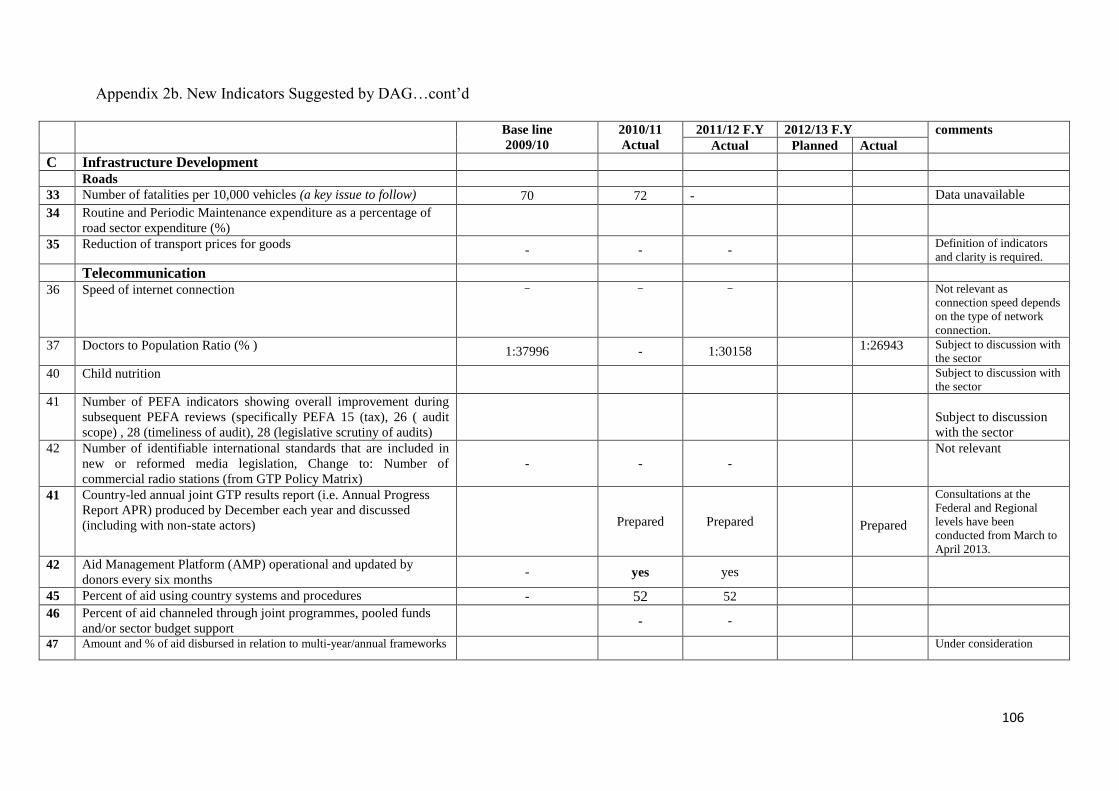
106
Appendix 2b. New Indicators Suggested by DAG…cont’d
Base line
2009/10
2010/11
Actual
2011/12 F.Y 2012/13 F.Y comments
Actual Planned Actual
C Infrastructure Development Roads
33 Number of fatalities per 10,000 vehicles (a key issue to follow) 70 72 - Data unavailable
34 Routine and Periodic Maintenance expenditure as a percentage of
road sector expenditure (%)
35 Reduction of transport prices for goods - - -
Definition of indicators
and clarity is required.
Telecommunication 36 Speed of internet connection - - - Not relevant as
connection speed depends
on the type of network
connection.
37 Doctors to Population Ratio (% ) 1:37996 - 1:30158
1:26943 Subject to discussion with
the sector
40 Child nutrition
Subject to discussion with
the sector
41 Number of PEFA indicators showing overall improvement during
subsequent PEFA reviews (specifically PEFA 15 (tax), 26 ( audit
scope) , 28 (timeliness of audit), 28 (legislative scrutiny of audits)
Subject to discussion
with the sector
42 Number of identifiable international standards that are included in
new or reformed media legislation, Change to: Number of
commercial radio stations (from GTP Policy Matrix)
- - -
Not relevant
41 Country-led annual joint GTP results report (i.e. Annual Progress
Report APR) produced by December each year and discussed
(including with non-state actors) Prepared Prepared
Prepared
Consultations at the
Federal and Regional
levels have been
conducted from March to
April 2013.
42 Aid Management Platform (AMP) operational and updated by
donors every six months - yes yes
45 Percent of aid using country systems and procedures - 52 52
46 Percent of aid channeled through joint programmes, pooled funds
and/or sector budget support - -
47 Amount and % of aid disbursed in relation to multi-year/annual frameworks Under consideration