Embed Size (px)
Citation preview
GROWTH AND STRUCTURE OF EMPLOYMENT IN INDIA
Long-Term and Post-Reform Performance and the Emerging Challenge
T.S. Papola Partha Pratim Sahu
March 2012
Institute for Studies in Industrial Development New Delhi

A Study Prepared as a Part of a Research Programme STRUCTURAL CHANGES, INDUSTRY AND EMPLOYMENT
IN THE INDIAN ECONOMY Macro‐economic Implications of Emerging Pattern
Sponsored by Indian Council of Social Science Research (ICSSR)
New Delhi
~ ii ~
Contents
Preface
I. Introduction 1
II. Employment Performance of the Indian Economy: The Long‐Term Experience 3
II.1 Employment Growth: Overall, Major Sectors and
II.1.1 Long and Short Term Trends
II.1.2 Growth in Employment and GDP
II.1.3 Employment Growth in Major Economic Activity Sectors
II.1.4 Employment Growth in Rural and Urban Areas
II.1.5 Employment in Rural Non‐Farm Sector
II.1.6 Employment Growth in Organised Sector: Reversal of a Declining Trend?
II.1.7 Employment Growth in Manufacturing: Role of Export Growth
II.1.8 Employment Growth in Emerging Services
III. Employment Growth in the Post Reform Period 25
III.1 Expectations and Apprehensions: Initial Shock and Quick Recovery?
III.2 Employment Growth in Different Sectors
III.3 Steep Decline in Employment Growth, 2005‐10: Results of Positive Development – Increase in Enrolment?
III.4 Impact of Global Economic Slowdown
IV. Structure of Employment: Changes and Implications 35
IV.1 Sectoral Employment Shares
IV.2 Employment Categories
IV.3 Organised Versus Unorganised Sector Employment
V. The Employment Challenge: Quantitative Dimensions 44
V.1 Unemployment Rates
V.2 The Underemployed and the Working Poor
V.3 Growth of Labour Force
~ iii ~
VI. The Employment Challenge: Qualitative Dimension 50
VI.1 Quality Deficit: Earnings
VI.2 Social Protection
VI.3 Workforce Structure and Quality of Employment
VI.4 Large Quality Deficit in Employment: The Case of Women Workers
VII. Employment Prospects: Promising Sectors and Activities 61
VII.1 Projections and Prospects: The Twelfth Five Year Plan (2012‐2017)
VII.2 Growth Rate: Composition and Employment
VII.3 Manufacturing: The Sector with Highest Employment Potential
VII.4 Economic Services: Trade, Transport and Finance
VII.5 Social and Personal Services: Vast Scope and Need for Expansion
VIII. Improving Quality of Employment: Productivity Increase, the Key Issue 67
VIII.1 Structural Shift in Workforce
VIII.2 Exports: The Question of Employment Intensity
VIII.3 Organised Sector: Can Recent Trends be Strengthened?
VIII.4 Productivity in Informal Sector
IX. Conclusion: Some Elements of a Strategy for Faster Growth of Productive Employment 73
X. MGNREGA: Some Observations 77
References 81
List of Tables
1 Growth of Employment (UPSS)
2 Growth of GDP (at constant 1999‐2000 Price): 1972‐73/2009‐10
3 Elasticity of Employment w.r.t. GDP
4 Growth of Rural Employment (UPSS)
5 Growth of Urban Employment (UPSS)
6 Sectoral Distribution of Rural NDP (%)
7 Composition of Rural Non‐Farm Employment (UPSS)
8 Growth of Employment in Organised Sector
9 Growth of Manufacturing (Organised & Unorganised) Employment: 1983/2004‐05
10 Growth of Manufacturing Exports (Major Items) (Growth rates, % per annum)
11 Growth and Structure of India’s Merchandise Exports (1995‐96 to 2003‐04)
12 Employment in IT and ITeS Services, India 1999‐2009
~ iv ~
13 Labour force Participation Rate (% to Population)
14 Current Status of Attending Educational Institutions (15‐24 Age Group)
15 Changes in Estimated Employment based on Various Quarterly Survey Results (in Lakhs)
16 Employment Share of Major Sectors and Activity Divisions (%)
17 Sectoral Share in GDP (%)
18 Distribution of UPSS Workers by Category of Employment (%)
19 Percentage Distribution of Workers in Formal/Informal Sectors/Employment
20 Employment in Organised Sector
21 Employment in Organised Public Sector
22 Employment in Organised Private Sector
23 Unemployment Rates (% of Labour Force)
24 Labour Force Participation Rates (UPSS)
25 Wages Per Worker in Organised Manufacturing Industries
26 Level of Per Worker Productivity (Rs. at constant 1999‐2000 prices)
27 Sectoral Distribution of Male and Female Workers (UPSS)
28 Distribution of Workers (UPSS) by Their Status of Employment: Male, Female and Total
29 Women Workers in Organised Sector
A: Women Workers in Organised Sector by industrial Activity in 2007 (Figures in thousands)
B: Distribution of Women Workers in Organised Sector by Industrial Activity in 2007 (%)
30 Long Term (1983/2009‐10) Employment Elasticities
31 Growth of Manufacturing Employment: Total and Organised Sector, 1983/2004‐05
32 MGNAREGA: Progress and Performance
List of Boxes
1 Employment Challenge 2007‐2012
2 Employment Challenge 2012‐2017 (An Illustrative Exercise)
Preface
Institute for Studies in Industrial Development (ISID) has been carrying out a 3-year
Research Programme on “Structural Changes, Industry and Employment in Indian Economy:
Macro-economic Implications of Emerging Pattern” with the sponsorship of the Indian
Council of Social Science Research (ICSSR) since March 2009. The Programmes envisages
undertaking studies on various aspects of the structural changes in the Indian economy
under the following six major themes:
i) Growth and Structural Changes in Indian Economy
ii) Employment: Implications of Structural Changes
iii) Growth and Structure of Industry
iv) Structure of Services Sector
v) Income Distribution, Demand Supply Balances and Price Stability
vi) Trade
The Programme team which consists of several faculty members of the Institute has
identified over a dozen different sub-themes within the above major themes for study. The
present paper on “Growth and Structure of Employment in India: Long-Term and Post-
Reform Performance and the Emerging Challenge” is the outcome of the study under theme
(ii). An earlier draft of the paper was presented at a national workshop, organised to discuss
10 studies at different stages of progress under the Programme, during 7–8 July 2011. We
have immensely benefited from the comments and suggestions made by participants,
especially by Dr Ajit Ghose, who chaired the discussion on it and also made detailed
comments and Prof. Sheila Bhalla and Prof. Niti Mehta who acted as the main discussants on
the paper.
We are grateful to other members of the Programme Team for their comments,
cooperation and help. We are also thankful to Nitu Maurya and Narendra Jena for help in
statistical analysis.
T.S. Papola Partha Pratim Sahu
March 2012
~ 1 ~
I. Introduction
Employment has always featured as an element of development policy in India. The
priority and attention it has received in development plans have, however, varied
from time to time and so have the approaches and strategies as well as policies and
programmes for employment generation. When India embarked on a strategy of
industrialisation-based development in 1950’s, employment was not perceived to be
a major issue in so far as a relatively faster growth of economy as envisaged in the
consecutive Five Year Plans was expected to generate enough employment,
particularly in industry, to take care of a small backlog of unemployment at the time
and increase in labour force that was expected to be relatively modest. Ensuring a
regular and adequate supply of suitably skilled workforce was conceived to be a
matter of greater concern. Improving the quality of employment, in terms of
reasonable and rising level of wages and a minimum measure of social security
against the common risks of work and life was, however, considered an important
concern of state policy.
Public sector, providing conditions of good quality employment, was regarded
as ‘model employer’ and expanded its workforce continuously for about four
decades. Also, where the private sector failed to continue operations of enterprises
and employment of workers, the government took over such enterprises, with a
view to, inter alia, protecting employment. The private sector was expected to follow
the rules of employment as laid down in various legislations and agreements so as
not only to protect employment but ensure its quality.
Growth of employment emerged as an important concern in development
planning around the middle of 1970s, when it was realised that economic and
demographic performance of the economy had fallen short of earlier expectations
and as a result unemployment had been on an increase. The problem was sought to
be tackled through a two-pronged strategy: on the one hand, efforts were initiated
to make development more employment oriented, by encouraging growth of
employment intensive sectors and including employment among the objectives of
~ 2 ~
macro-economic and sectoral policies, and, on the other, special employment
programmes, for creating both short-term wage employment and self-employment
were introduced. This approach was continued over the next one and a half decade1.
The beginning of 1990’s saw initiation of economic reforms, involving
deregulation of domestic economic activities and liberalisation of foreign trade and
investment regimes. Public sector was no longer seen as an employment provider; it
has, in fact, experienced a continuous decline in employment since mid-1990s.
Higher growth of the economy induced by liberalisation, was expected to lead to a
faster expansion of employment. Growth rate accelerated but employment growth
saw a deceleration. And most new jobs were located in the informal sector with low
earnings and no social protection. Start of the new millennium, however, seemed to
have brought in a turnaround, suggesting an end of the period of ‘jobless’ growth and
beginning of the positive result of liberalization in terms of a high employment
growth. Doubts about the quality of employment based on NSSO estimates for
2004-05, on which this optimism was based, however, made such a conclusion sound
rather hasty (see e.g. Unni and Raveendran, 2007). Results of the last NSSO Round
(2009-10) suggesting a virtual stagnation in employment during 2004-05/2009-10
have proved a dampener in this regard.
The present paper describes the growth and structural changes in
employment in the long and short periods, with a special focus on the period since
economic liberalisation. It assesses the employment challenge in its quantitative and
qualitative dimensions and examines the prospects of generating productive
employment of adequate quantity and quality. It concludes with indication of some
broad measures of policy for faster growth of productive and decent employment.
1 For some details on the treatment of employment in development planning and policy in India, see, Papola, 1992 and Papola, 2004.
~ 3 ~
II. Employment Performance of the Indian Economy: The LongTerm Experience
Employment has grown at an average annual rate of two per cent in India during the
past four decades since 1972-73 when comprehensive information on employment
and unemployment started becoming available from the NSSO quinquinnial surveys.
In itself this could be regarded as a significant record, as such an employment growth
has not been recorded by many countries historically or in recent periods. In fact,
most countries in general, and developed countries in particular, have had very low
employment growth in recent years. According to ILO data, most of them saw an
increase of less than one per cent per annum in their employment during the 1990s.
It was 0.45 per cent in United States, 0.18 per cent in United Kingdom, 0.32 per cent
in France, 0.41 per cent in Germany and -0.15 per cent in Japan. In the case of
developing countries strictly comparable data are not available, but broad assessment
places their average employment growth at around 1.5 per cent per annum during
that period (ILO, KILM, 2007 and Ghose et al, 2008). During the past decade, 2001-
2010, employment is estimated to have grown globally at about 1.5 per cent per
annum: the developed countries registering a growth rate of barely one per cent
during 2001-08, which also seems to have been more than negated by a large decline
during the next two years. The developing countries in East and South East Asia, and
transition economies of Eastern Europe also saw very little growth in employment.
But Latin America and Africa performed better. South Asia maintained a steady
growth of employment of 2.4 per cent in which India had a major contribution (ILO,
KILM, 2011).
India’s significant record on employment growth has, however, not been
adequate in view of a faster growth of labour force. Further, there are a few
disconcerting features of employment growth in recent years. First, employment
growth has decelerated. Second, employment content of growth has shown a
decline. Third, sectors with higher employment potential have registered relatively
slower growth. Fourth, agriculture, despite a sharp decline in its importance in gross
domestic product, continues to be the largest employer as the non-agricultural
~ 4 ~
sectors have not generated enough employment to effect a shift of workforce. Fifth,
most of the employment growth has been contributed by the unorganised, informal
sector which is characterised by poor incomes and conditions of work. And, sixth,
employment growth in the organised sector which seems to have picked up in
recent years, has been mostly in the categories of casual and contract labour.
II.1 Employment Growth II.1.1 Long and Short Term Trends
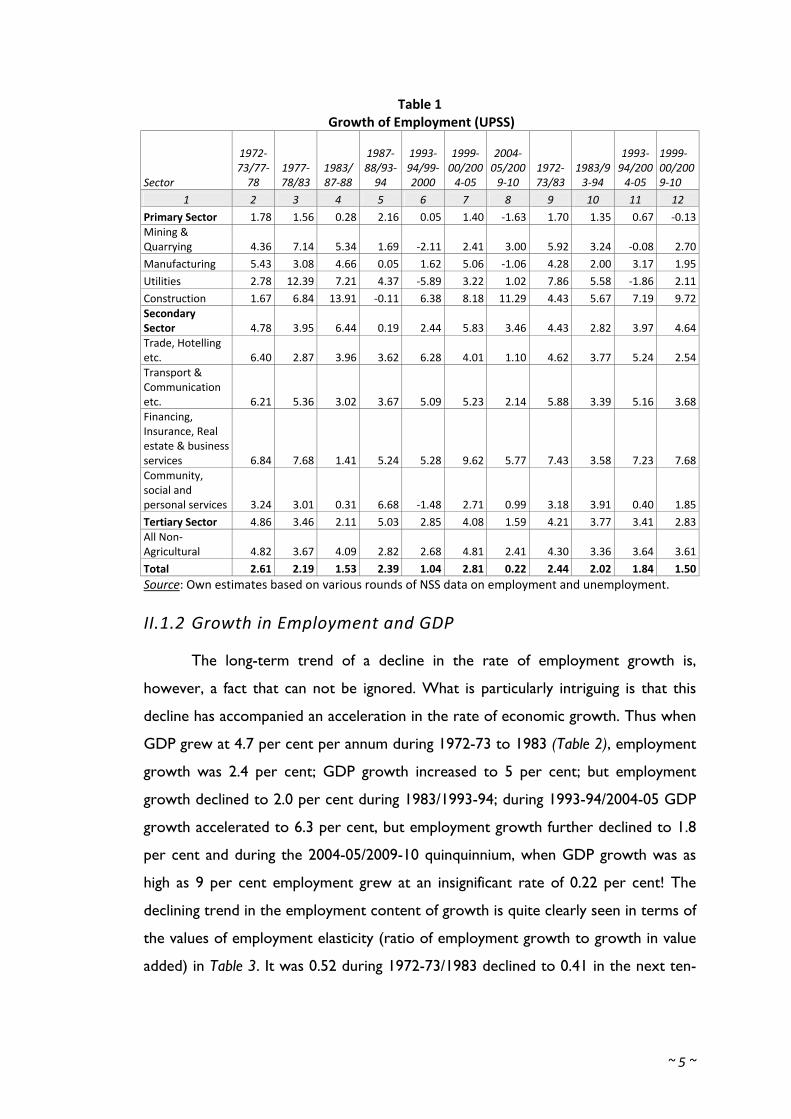
Long-term employment growth over the period of about four decades, as
noted earlier, has been around 2 per cent per annum. It has, however, seen a
declining trend from one decade to another: it was 2.44 per cent during 1972-
73/1983, 2.02 per cent during the next ten year period and 1.84 per cent during
1993-94/2004-05 (Table 1). In between, these decadal periods, some fluctuations
were noted in shorter periods of five years. Of these, a sharp rise in employment
growth during 2000-2005 to 2.81 per cent over 1.00 per cent during 1993-94/2004-
05, is most striking. The most favourable interpretation of this upturn in employment
growth in post-2000 period is that the teething troubles of the economic reforms
which led to slow growth of employment initially were over by 2000 and
globalisation started having its beneficial effect on employment with the start of the
millennium. The facts that GDP growth was no better—was, in fact lower—during
2000-2005 than during 1994-2000, that most employment growth recorded during
the later period was in the informal sector of which a large part was as self-
employment in agriculture, and, organised sector employment, in fact, saw an
absolute decline, however, raise doubts about the high employment growth during
2000-05 being demand-led and productive. A virtual stagnation in employment during
2004-05/2009-10 as revealed by the latest round of NSSO survey casts further doubt
on the veracity of the 2004-05 estimates. We will turn to this aspect later while
dealing in some detail with the issue of employment growth in the post-reform
period.
~ 5 ~
Table 1 Growth of Employment (UPSS)
Sector
1972‐73/77‐78
1977‐78/83
1983/ 87‐88
1987‐88/93‐94
1993‐94/99‐2000
1999‐00/2004‐05
2004‐05/2009‐10
1972‐73/83
1983/93‐94
1993‐94/2004‐05
1999‐00/2009‐10
1 2 3 4 5 6 7 8 9 10 11 12
Primary Sector 1.78 1.56 0.28 2.16 0.05 1.40 ‐1.63 1.70 1.35 0.67 ‐0.13Mining & Quarrying 4.36 7.14 5.34 1.69 ‐2.11 2.41 3.00 5.92 3.24 ‐0.08 2.70
Manufacturing 5.43 3.08 4.66 0.05 1.62 5.06 ‐1.06 4.28 2.00 3.17 1.95
Utilities 2.78 12.39 7.21 4.37 ‐5.89 3.22 1.02 7.86 5.58 ‐1.86 2.11
Construction 1.67 6.84 13.91 ‐0.11 6.38 8.18 11.29 4.43 5.67 7.19 9.72Secondary Sector 4.78 3.95 6.44 0.19 2.44 5.83 3.46 4.43 2.82 3.97 4.64Trade, Hotelling etc. 6.40 2.87 3.96 3.62 6.28 4.01 1.10 4.62 3.77 5.24 2.54Transport & Communication etc. 6.21 5.36 3.02 3.67 5.09 5.23 2.14 5.88 3.39 5.16 3.68Financing, Insurance, Real estate & business services 6.84 7.68 1.41 5.24 5.28 9.62 5.77 7.43 3.58 7.23 7.68Community, social and personal services 3.24 3.01 0.31 6.68 ‐1.48 2.71 0.99 3.18 3.91 0.40 1.85
Tertiary Sector 4.86 3.46 2.11 5.03 2.85 4.08 1.59 4.21 3.77 3.41 2.83All Non‐Agricultural 4.82 3.67 4.09 2.82 2.68 4.81 2.41 4.30 3.36 3.64 3.61
Total 2.61 2.19 1.53 2.39 1.04 2.81 0.22 2.44 2.02 1.84 1.50Source: Own estimates based on various rounds of NSS data on employment and unemployment.
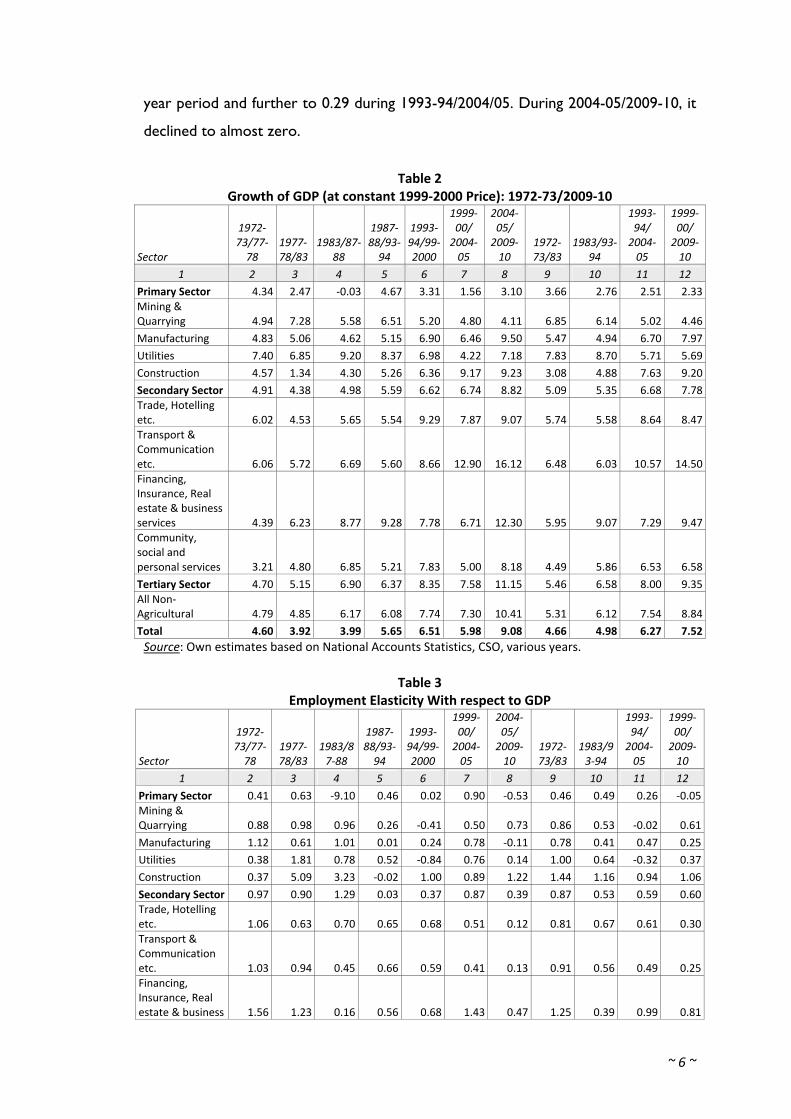
II.1.2 Growth in Employment and GDP
The long-term trend of a decline in the rate of employment growth is,
however, a fact that can not be ignored. What is particularly intriguing is that this
decline has accompanied an acceleration in the rate of economic growth. Thus when
GDP grew at 4.7 per cent per annum during 1972-73 to 1983 (Table 2), employment
growth was 2.4 per cent; GDP growth increased to 5 per cent; but employment
growth declined to 2.0 per cent during 1983/1993-94; during 1993-94/2004-05 GDP
growth accelerated to 6.3 per cent, but employment growth further declined to 1.8
per cent and during the 2004-05/2009-10 quinquinnium, when GDP growth was as
high as 9 per cent employment grew at an insignificant rate of 0.22 per cent! The
declining trend in the employment content of growth is quite clearly seen in terms of
the values of employment elasticity (ratio of employment growth to growth in value
added) in Table 3. It was 0.52 during 1972-73/1983 declined to 0.41 in the next ten-
~ 6 ~
year period and further to 0.29 during 1993-94/2004/05. During 2004-05/2009-10, it
declined to almost zero.
Table 2 Growth of GDP (at constant 1999‐2000 Price): 1972‐73/2009‐10
Sector
1972‐73/77‐78
1977‐78/83
1983/87‐88
1987‐88/93‐94
1993‐94/99‐2000
1999‐00/ 2004‐05
2004‐05/ 2009‐10
1972‐73/83
1983/93‐94
1993‐94/ 2004‐05
1999‐00/ 2009‐10
1 2 3 4 5 6 7 8 9 10 11 12
Primary Sector 4.34 2.47 ‐0.03 4.67 3.31 1.56 3.10 3.66 2.76 2.51 2.33Mining & Quarrying 4.94 7.28 5.58 6.51 5.20 4.80 4.11 6.85 6.14 5.02 4.46
Manufacturing 4.83 5.06 4.62 5.15 6.90 6.46 9.50 5.47 4.94 6.70 7.97
Utilities 7.40 6.85 9.20 8.37 6.98 4.22 7.18 7.83 8.70 5.71 5.69
Construction 4.57 1.34 4.30 5.26 6.36 9.17 9.23 3.08 4.88 7.63 9.20
Secondary Sector 4.91 4.38 4.98 5.59 6.62 6.74 8.82 5.09 5.35 6.68 7.78Trade, Hotelling etc. 6.02 4.53 5.65 5.54 9.29 7.87 9.07 5.74 5.58 8.64 8.47Transport & Communication etc. 6.06 5.72 6.69 5.60 8.66 12.90 16.12 6.48 6.03 10.57 14.50Financing, Insurance, Real estate & business services 4.39 6.23 8.77 9.28 7.78 6.71 12.30 5.95 9.07 7.29 9.47Community, social and personal services 3.21 4.80 6.85 5.21 7.83 5.00 8.18 4.49 5.86 6.53 6.58
Tertiary Sector 4.70 5.15 6.90 6.37 8.35 7.58 11.15 5.46 6.58 8.00 9.35All Non‐Agricultural 4.79 4.85 6.17 6.08 7.74 7.30 10.41 5.31 6.12 7.54 8.84
Total 4.60 3.92 3.99 5.65 6.51 5.98 9.08 4.66 4.98 6.27 7.52Source: Own estimates based on National Accounts Statistics, CSO, various years.
Table 3 Employment Elasticity With respect to GDP
Sector
1972‐73/77‐78
1977‐78/83
1983/87‐88
1987‐88/93‐94
1993‐94/99‐2000
1999‐00/ 2004‐05
2004‐05/ 2009‐10
1972‐73/83
1983/93‐94
1993‐94/ 2004‐05
1999‐00/ 2009‐10
1 2 3 4 5 6 7 8 9 10 11 12
Primary Sector 0.41 0.63 ‐9.10 0.46 0.02 0.90 ‐0.53 0.46 0.49 0.26 ‐0.05Mining & Quarrying 0.88 0.98 0.96 0.26 ‐0.41 0.50 0.73 0.86 0.53 ‐0.02 0.61
Manufacturing 1.12 0.61 1.01 0.01 0.24 0.78 ‐0.11 0.78 0.41 0.47 0.25
Utilities 0.38 1.81 0.78 0.52 ‐0.84 0.76 0.14 1.00 0.64 ‐0.32 0.37
Construction 0.37 5.09 3.23 ‐0.02 1.00 0.89 1.22 1.44 1.16 0.94 1.06
Secondary Sector 0.97 0.90 1.29 0.03 0.37 0.87 0.39 0.87 0.53 0.59 0.60Trade, Hotelling etc. 1.06 0.63 0.70 0.65 0.68 0.51 0.12 0.81 0.67 0.61 0.30Transport & Communication etc. 1.03 0.94 0.45 0.66 0.59 0.41 0.13 0.91 0.56 0.49 0.25Financing, Insurance, Real estate & business 1.56 1.23 0.16 0.56 0.68 1.43 0.47 1.25 0.39 0.99 0.81
~ 7 ~
Sector
1972‐73/77‐78
1977‐78/83
1983/87‐88
1987‐88/93‐94
1993‐94/99‐2000
1999‐00/ 2004‐05
2004‐05/ 2009‐10
1972‐73/83
1983/93‐94
1993‐94/ 2004‐05
1999‐00/ 2009‐10
1 2 3 4 5 6 7 8 9 10 11 12 services
Community, social and personal services 1.01 0.63 0.05 1.28 ‐0.19 0.54 0.12 0.71 0.67 0.06 0.28
Tertiary Sector 1.03 0.67 0.31 0.79 0.34 0.54 0.14 0.77 0.57 0.43 0.30All Non‐Agricultural 1.01 0.76 0.66 0.46 0.35 0.66 0.23 0.81 0.55 0.48 0.41
Total 0.57 0.56 0.38 0.42 0.16 0.47 0.02 0.52 0.41 0.29 0.20Source: Own estimates based on various rounds of NSS data on employment and unemployment and
National Accounts Statistics, CSO, various years.
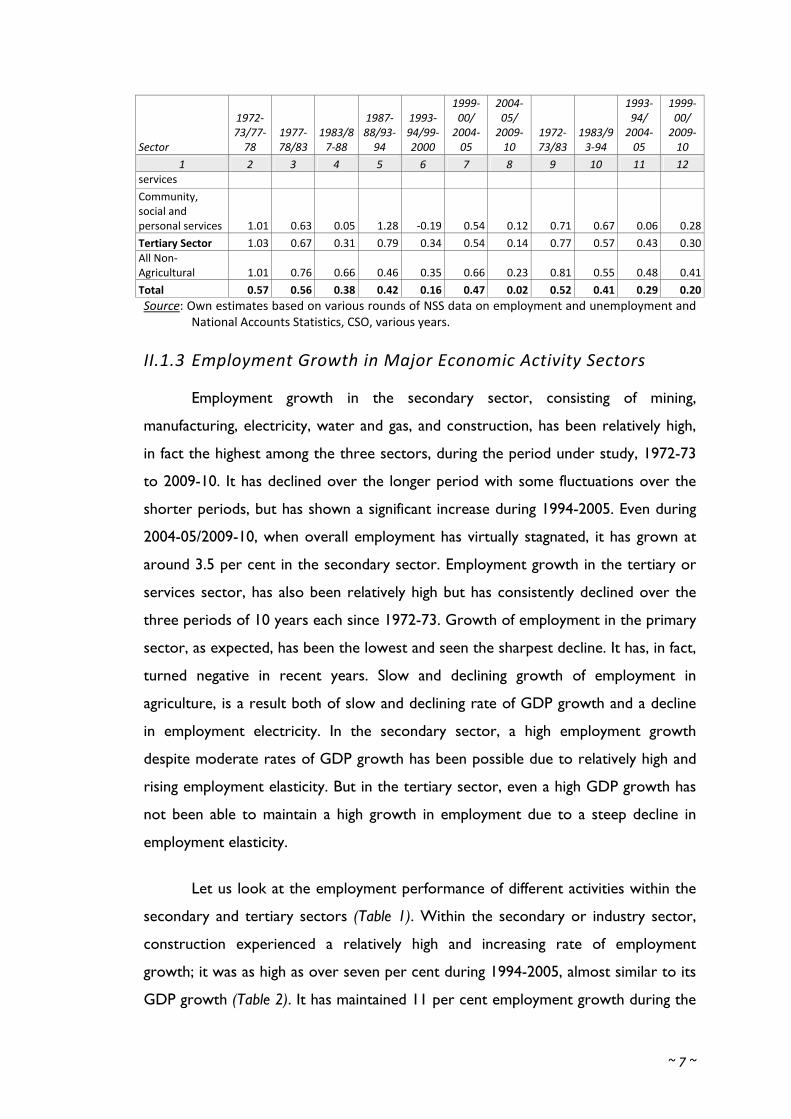
II.1.3 Employment Growth in Major Economic Activity Sectors
Employment growth in the secondary sector, consisting of mining,
manufacturing, electricity, water and gas, and construction, has been relatively high,
in fact the highest among the three sectors, during the period under study, 1972-73
to 2009-10. It has declined over the longer period with some fluctuations over the
shorter periods, but has shown a significant increase during 1994-2005. Even during
2004-05/2009-10, when overall employment has virtually stagnated, it has grown at
around 3.5 per cent in the secondary sector. Employment growth in the tertiary or
services sector, has also been relatively high but has consistently declined over the
three periods of 10 years each since 1972-73. Growth of employment in the primary
sector, as expected, has been the lowest and seen the sharpest decline. It has, in fact,
turned negative in recent years. Slow and declining growth of employment in
agriculture, is a result both of slow and declining rate of GDP growth and a decline
in employment electricity. In the secondary sector, a high employment growth
despite moderate rates of GDP growth has been possible due to relatively high and
rising employment elasticity. But in the tertiary sector, even a high GDP growth has
not been able to maintain a high growth in employment due to a steep decline in
employment elasticity.
Let us look at the employment performance of different activities within the
secondary and tertiary sectors (Table 1). Within the secondary or industry sector,
construction experienced a relatively high and increasing rate of employment
growth; it was as high as over seven per cent during 1994-2005, almost similar to its
GDP growth (Table 2). It has maintained 11 per cent employment growth during the
~ 8 ~
2004-05/2009-10, when total employment has virtually stagnated. Employment
growth in manufacturing has also been moderately high, and after declining during
1983/1993-94 over the earlier ten year period, it registered an increase in the next
period, 1994-2005. But it experienced a decline in employment during 2004-
05/2009-10. Employment elasticity in manufacturing, has been relatively high except
in the last period (Table 3). Mining and utilities (electricity, water and gas), the minor
activities contributing 0.56% and 0.26% to total employment, have each experienced
a decline in employment during 1994-2005, after registering a high growth in earlier
periods. Both registered a small positive growth in employment during 2004-
05/2009-10, with relatively low GDP growth.
In the services sector, trade and transport have shown the best employment
performance, both registering a growth of over 5 per cent during 1994-2005, after
having seen a decline in growth rate, sharper in transport than in trade, during 1983-
94, over 1973-83. These trends are in line with respective GDP growth rates in the
two activities, though the dip in employment growth is deeper than in GDP growth,
while the jump in employment growth is lower than in GDP growth. Thus in
transport, for example, while GDP growth declined from 6.5 to 6 per cent,
employment growth declined from 5.8 to 3.5 per cent; but when in the next period
GDP growth rose sharply from 6 to 10.5 per cent, employment growth increased
from 3.5 to 5.3 per cent. Financial services, however, have recorded the highest
increase in employment over the longer period 1983-2005 except during 1983/1993-
94. Even during 2004-05/2009-10, this sub-sector of services has registered an
employment growth of about 6 per cent, while trade and transport sub-sectors
experienced only about 1 to 2 per cent growth in employment. Thus it appears that
all sub-sectors of the tertiary sector with the possible exception of community,
social and personal services have shown reasonably high potential for employment
generation. It must, however, be noted that in most sub-sectors of services, while
GDP has seen a high and increasing growth rate, employment growth has been on a
declining rate. Employment elasticity has, therefore, declined sharply from 0.81
during 1972-73/1983 to 0.30 during 1999-2000/2009-10 in trade, from 0.91 to 0.25
in transport, from 0.71 to 0.28 in community, social and personal, services, although
in financial services it increased during 1993-94/2009-10.
~ 9 ~
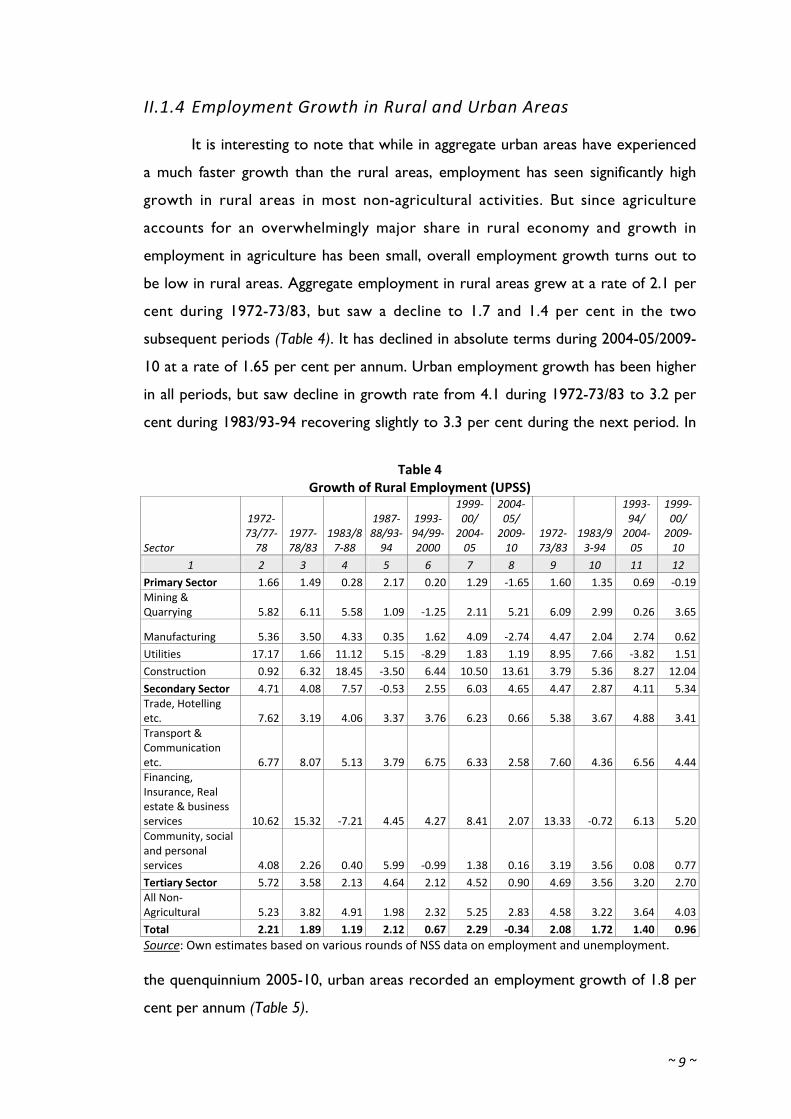
II.1.4 Employment Growth in Rural and Urban Areas
It is interesting to note that while in aggregate urban areas have experienced
a much faster growth than the rural areas, employment has seen significantly high
growth in rural areas in most non-agricultural activities. But since agriculture
accounts for an overwhelmingly major share in rural economy and growth in
employment in agriculture has been small, overall employment growth turns out to
be low in rural areas. Aggregate employment in rural areas grew at a rate of 2.1 per
cent during 1972-73/83, but saw a decline to 1.7 and 1.4 per cent in the two
subsequent periods (Table 4). It has declined in absolute terms during 2004-05/2009-
10 at a rate of 1.65 per cent per annum. Urban employment growth has been higher
in all periods, but saw decline in growth rate from 4.1 during 1972-73/83 to 3.2 per
cent during 1983/93-94 recovering slightly to 3.3 per cent during the next period. In
Table 4 Growth of Rural Employment (UPSS)
Sector
1972‐73/77‐78
1977‐78/83
1983/87‐88
1987‐88/93‐94
1993‐94/99‐2000
1999‐00/ 2004‐05
2004‐05/ 2009‐10
1972‐73/83
1983/93‐94
1993‐94/ 2004‐05
1999‐00/ 2009‐10
1 2 3 4 5 6 7 8 9 10 11 12
Primary Sector 1.66 1.49 0.28 2.17 0.20 1.29 ‐1.65 1.60 1.35 0.69 ‐0.19Mining & Quarrying 5.82 6.11 5.58 1.09 ‐1.25 2.11 5.21 6.09 2.99 0.26 3.65
Manufacturing 5.36 3.50 4.33 0.35 1.62 4.09 ‐2.74 4.47 2.04 2.74 0.62
Utilities 17.17 1.66 11.12 5.15 ‐8.29 1.83 1.19 8.95 7.66 ‐3.82 1.51
Construction 0.92 6.32 18.45 ‐3.50 6.44 10.50 13.61 3.79 5.36 8.27 12.04
Secondary Sector 4.71 4.08 7.57 ‐0.53 2.55 6.03 4.65 4.47 2.87 4.11 5.34Trade, Hotelling etc. 7.62 3.19 4.06 3.37 3.76 6.23 0.66 5.38 3.67 4.88 3.41Transport & Communication etc. 6.77 8.07 5.13 3.79 6.75 6.33 2.58 7.60 4.36 6.56 4.44Financing, Insurance, Real estate & business services 10.62 15.32 ‐7.21 4.45 4.27 8.41 2.07 13.33 ‐0.72 6.13 5.20Community, social and personal services 4.08 2.26 0.40 5.99 ‐0.99 1.38 0.16 3.19 3.56 0.08 0.77
Tertiary Sector 5.72 3.58 2.13 4.64 2.12 4.52 0.90 4.69 3.56 3.20 2.70All Non‐Agricultural 5.23 3.82 4.91 1.98 2.32 5.25 2.83 4.58 3.22 3.64 4.03
Total 2.21 1.89 1.19 2.12 0.67 2.29 ‐0.34 2.08 1.72 1.40 0.96Source: Own estimates based on various rounds of NSS data on employment and unemployment.
the quenquinnium 2005-10, urban areas recorded an employment growth of 1.8 per
cent per annum (Table 5).
~ 10 ~
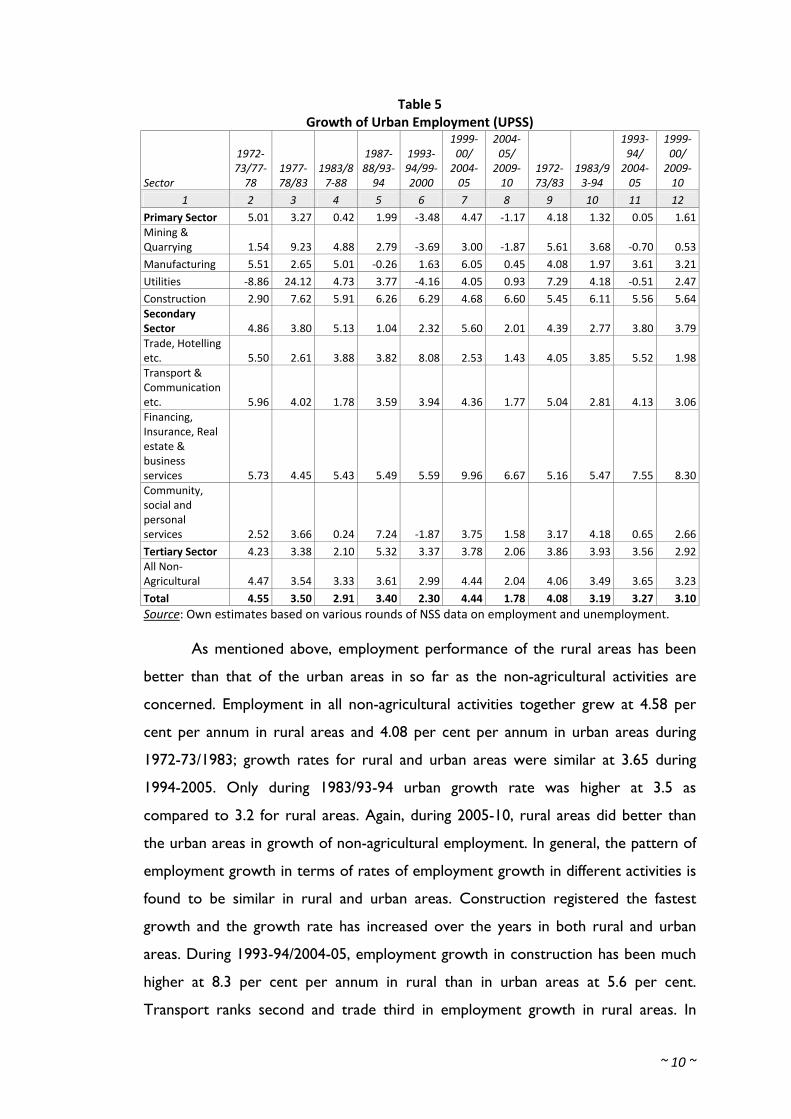
Table 5 Growth of Urban Employment (UPSS)
Sector
1972‐73/77‐78
1977‐78/83
1983/87‐88
1987‐88/93‐94
1993‐94/99‐2000
1999‐00/ 2004‐05
2004‐05/ 2009‐10
1972‐73/83
1983/93‐94
1993‐94/ 2004‐05
1999‐00/ 2009‐10
1 2 3 4 5 6 7 8 9 10 11 12
Primary Sector 5.01 3.27 0.42 1.99 ‐3.48 4.47 ‐1.17 4.18 1.32 0.05 1.61Mining & Quarrying 1.54 9.23 4.88 2.79 ‐3.69 3.00 ‐1.87 5.61 3.68 ‐0.70 0.53
Manufacturing 5.51 2.65 5.01 ‐0.26 1.63 6.05 0.45 4.08 1.97 3.61 3.21
Utilities ‐8.86 24.12 4.73 3.77 ‐4.16 4.05 0.93 7.29 4.18 ‐0.51 2.47
Construction 2.90 7.62 5.91 6.26 6.29 4.68 6.60 5.45 6.11 5.56 5.64Secondary Sector 4.86 3.80 5.13 1.04 2.32 5.60 2.01 4.39 2.77 3.80 3.79Trade, Hotelling etc. 5.50 2.61 3.88 3.82 8.08 2.53 1.43 4.05 3.85 5.52 1.98Transport & Communication etc. 5.96 4.02 1.78 3.59 3.94 4.36 1.77 5.04 2.81 4.13 3.06Financing, Insurance, Real estate & business services 5.73 4.45 5.43 5.49 5.59 9.96 6.67 5.16 5.47 7.55 8.30Community, social and personal services 2.52 3.66 0.24 7.24 ‐1.87 3.75 1.58 3.17 4.18 0.65 2.66
Tertiary Sector 4.23 3.38 2.10 5.32 3.37 3.78 2.06 3.86 3.93 3.56 2.92All Non‐Agricultural 4.47 3.54 3.33 3.61 2.99 4.44 2.04 4.06 3.49 3.65 3.23
Total 4.55 3.50 2.91 3.40 2.30 4.44 1.78 4.08 3.19 3.27 3.10Source: Own estimates based on various rounds of NSS data on employment and unemployment.
As mentioned above, employment performance of the rural areas has been
better than that of the urban areas in so far as the non-agricultural activities are
concerned. Employment in all non-agricultural activities together grew at 4.58 per
cent per annum in rural areas and 4.08 per cent per annum in urban areas during
1972-73/1983; growth rates for rural and urban areas were similar at 3.65 during
1994-2005. Only during 1983/93-94 urban growth rate was higher at 3.5 as
compared to 3.2 for rural areas. Again, during 2005-10, rural areas did better than
the urban areas in growth of non-agricultural employment. In general, the pattern of
employment growth in terms of rates of employment growth in different activities is
found to be similar in rural and urban areas. Construction registered the fastest
growth and the growth rate has increased over the years in both rural and urban
areas. During 1993-94/2004-05, employment growth in construction has been much
higher at 8.3 per cent per annum in rural than in urban areas at 5.6 per cent.
Transport ranks second and trade third in employment growth in rural areas. In
~ 11 ~
urban areas trade has performed better than transport, but both have registered
high employment growth. Financial services had an employment growth of 6.30 per
cent in rural and 7.54 per cent per annum in urban areas. Other services have had
the lowest growth in employment in both areas; it has been particularly low, 0.64 per
cent in urban and 0.25 per cent in rural areas, during the period, 1994-2005. The two
minor activities mining and utilities saw a decline in employment in urban areas and
utilities in rural areas during 1994-2005 after growing fast in the earlier two decades,
in both areas. Despite a decline in aggregate employment, construction employment
grew at 13.6 per cent per annum in rural areas during 2004-05/2010. In urban areas
construction and financial services were the best performers with an employment
growth rate of 6.6 per cent each during this period.
The fact that the non-farm employment has registered a fast growth in
employment in rural areas, even faster than in urban areas, for most of the period
under consideration, has significant implications for growth of rural employment in
future. It is, therefore, interesting and useful to probe the status and dynamics of the
rural non-farm activities in some detail.
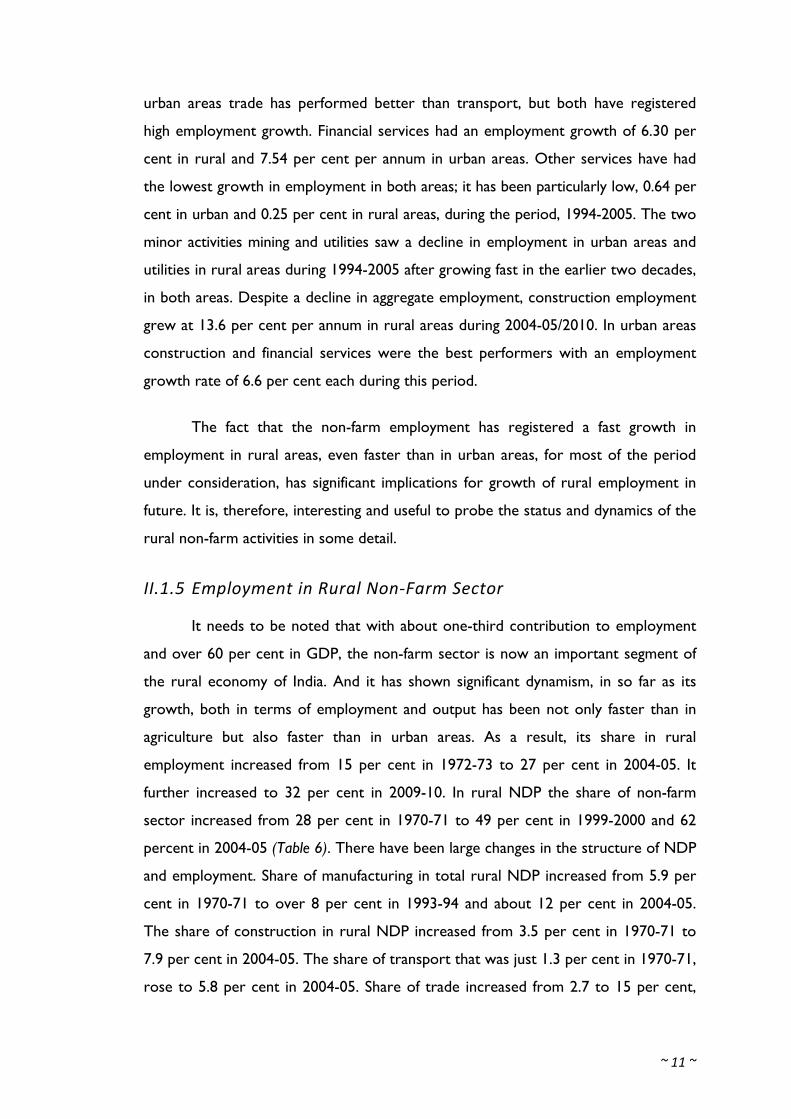
II.1.5 Employment in Rural Non‐Farm Sector
It needs to be noted that with about one-third contribution to employment
and over 60 per cent in GDP, the non-farm sector is now an important segment of
the rural economy of India. And it has shown significant dynamism, in so far as its
growth, both in terms of employment and output has been not only faster than in
agriculture but also faster than in urban areas. As a result, its share in rural
employment increased from 15 per cent in 1972-73 to 27 per cent in 2004-05. It
further increased to 32 per cent in 2009-10. In rural NDP the share of non-farm
sector increased from 28 per cent in 1970-71 to 49 per cent in 1999-2000 and 62
percent in 2004-05 (Table 6). There have been large changes in the structure of NDP
and employment. Share of manufacturing in total rural NDP increased from 5.9 per
cent in 1970-71 to over 8 per cent in 1993-94 and about 12 per cent in 2004-05.
The share of construction in rural NDP increased from 3.5 per cent in 1970-71 to
7.9 per cent in 2004-05. The share of transport that was just 1.3 per cent in 1970-71,
rose to 5.8 per cent in 2004-05. Share of trade increased from 2.7 to 15 per cent,
~ 12 ~
make it the largest non-agricultural activity in rural areas and of community, social
and personal services from 6.4 to 8.3 per cent.
Table 6 Sectoral Distribution of Rural NDP (%)
Sector 1970‐71 1980‐81 1993‐94 1999‐00 2004‐05 1 2 3 4 5 6
Agriculture and allied 72.37 64.36 56.99 51.42 38.34Mining & Quarrying 0.85 1.24 2.60 1.82 3.70Manufacturing 5.87 9.16 8.15 11.13 11.86Utilities 0.37 0.56 0.88 1.43 0.66Construction 3.47 4.05 4.61 5.59 7.91Trade, hotels & restaurants 2.72 6.68 7.77 8.72 14.98Transport, storage & communication 1.26 1.32 3.41 4.03 5.81Banking & Insurance 0.54 0.81 1.73 1.93 1.96Real estate and business services 6.18 4.55 4.26 4.60 6.46Community, Social & Personal Services 6.36 7.27 9.58 9.35 8.31Total rural nonfarm 27.63 35.64 43.01 48.58 61.66Total 100 100 100 100 100Source: Own estimates based on National Accounts Statistics, CSO, various years.
According to the NSSO estimates rural non-farm activities employed 28.51
million workers in 1972-73, the number went up to 56.11 million by 1987-88 and to
93.53 million in 2004-05. According to the NSSO survey of 2009-10, the number
stood at 107.51 million in that year. While the growth rate of employment in the
total economy and rural areas as a whole declined in the period 1994-2005 over the
earlier 10-year period, in the rural non-farm sector, it showed an increase. And
when during 2004-05/2009-10, total employment stagnated and rural employment
declined, rural non-agricultural employment showed a significant growth of 2.8 per
cent per annum. It may be argued that a high growth of employment in non-farm
activities could have been induced by declining employment opportunities in
agriculture, which grew at slow rate, slower (at 0.87 per cent during 1994-2005 as
compared to 1.39 per cent) during preceding 10-year period. And in this sense, the
growth of employment in non-farm sector may be seen as driven by ‘distress’ in
agriculture. A significantly higher productivity per worker in the non-farm activities
than in agriculture (the ratio was 4.4:1 in 2004-05, according to the sectoral
distribution of NDP and workers), however, casts serious doubt on such a
hypothesis and suggests that employment increase in rural non-farm activities was
driven by productive employment opportunity arising in them.
~ 13 ~
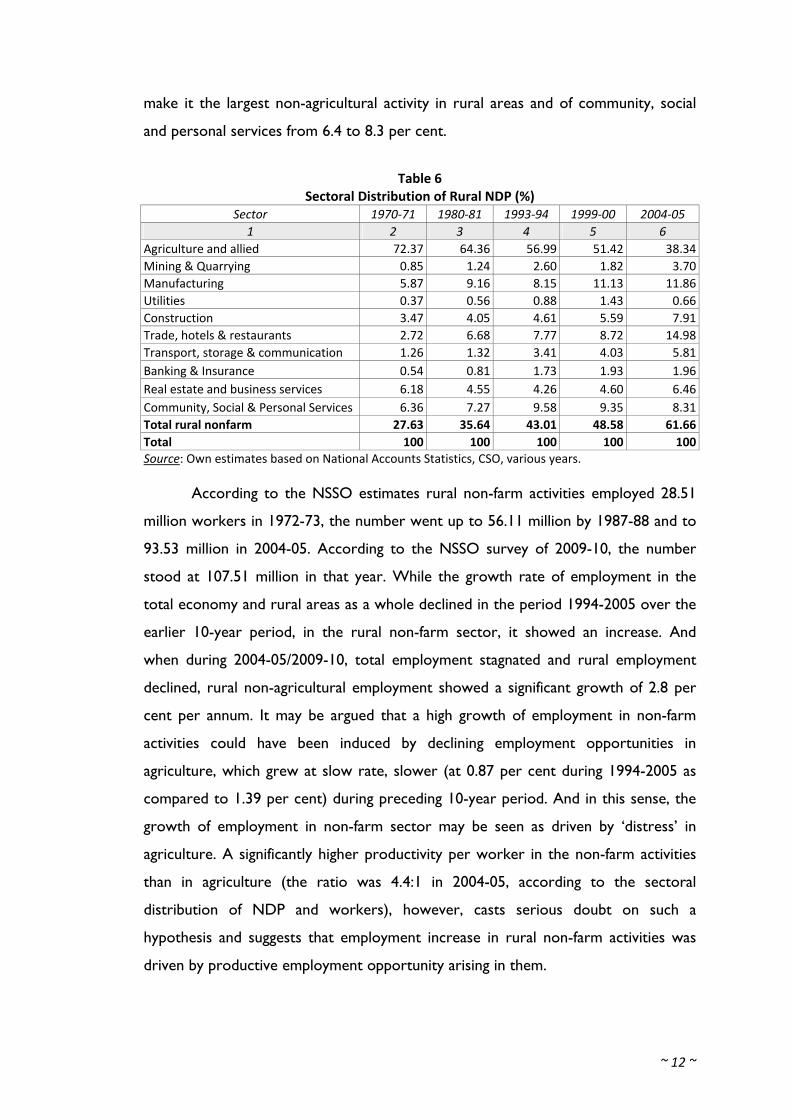
Let us briefly look at the pattern of employment in the rural non-farm sector
in terms of shares of major activities and how they have changed in recent years.
First, it appears that the non-farm segment of the rural economy was more or less
equally distributed between the secondary (industry) and tertiary (services) sectors
in terms of shares of employment, the former accounting for 49.5 and the latter 50.5
per cent in 2004-05 (Table 7). There has been an increase in the share of secondary
and decline in the share of tertiary activities during 2004-05/2009-10, with former
now accounting for 54 and latter 46 per cent. Manufacturing constitutes, by far, the
largest segment of the rural non-farm sector, but its share in employment has
declined from 32 per cent in 1993-94 to 29 per cent in 2004-05, and further to 22
per cent in 2009-10. Construction gained significantly raising its share from 11 per
cent in 1993-94 to 18 per cent in 2004-05. In 2009-10, it has jumped to 29 per cent,
making the largest non-farm activity in the rural areas. Among services, trade
constitutes the largest, and among all divisions, the second largest, activity accounting
for 20 per cent of non-farm employment in 2009-10, down from 23 per cent in
2004-05, back to the same share as in 1993-94. Transport has gained substantially
from 7 per cent in 1993-94 to 9 per cent in 2009-10. Community, social and
Table 7 Composition of Rural Non‐Farm Employment (UPSS)
Sector 1993‐94 1999‐00 2004‐05 2009‐10 1 2 3 4 5
Agriculture 78.43 76.23 72.58 67.93Non‐agriculture 21.57 23.77 27.42 32.07Distribution within non‐agriculture: Mining & Quarrying 2.58 2.09 1.79 2.01Manufacturing 32.46 31.15 29.47 22.32Utilities 1.06 0.55 0.47 0.43Construction 11.02 13.96 17.81 29.32Secondary Sector 47.12 47.74 49.53 54.08Trade, Hotelling etc. 19.86 21.59 22.62 20.33Transport & Communication etc. 6.71 8.66 9.11 9.00Financing, Insurance, Real estate & business services 1.36 1.52 1.76 1.70Community, social and personal services 24.96 20.49 16.98 14.89Tertiary Sector 52.88 52.26 50.47 45.92Source: Own estimates based on various rounds of NSS data on employment and unemployment.
personnel services have seen a steep decline in their share in employment from 25
per cent in 1993-94 to 17 per cent in 2004-05 and to 15 per cent in 2009-10.
~ 14 ~
Construction as noted above, has emerged as the largest rural non-farm
activity in terms of employment, now accounting for over 29 per cent of total non-
farm employment in 2009-10. It has registered a fast increase, raising its share from
11 per cent in 1993-94 and 18 per cent in 2004-05. It is not clear how much of it is
in terms of housing and how much in infrastructure. But it is likely that a large part
of it may be in public programmes of infrastructure building including under Mahatma
Gandhi National Rural Employment Guarantee Act (MGNREA). That a good part of
it must have taken place in building road connectivity is also reflected in relatively
sharp increase in employment in transport: from 6.7 per cent to over 9 per cent
during 1993-94/2009-10. Trade, however, is the largest non-farm activity in rural
areas in terms of contribution to rural GNP, with a 15 per cent share, having
increased from 8 per cent in 1993-94 and 9 per cent in 1999-2000. Its share in rural
employment, has, however, not increased.
Manufacturing is the second largest segment of the rural non-farm sector
accounting for 22 per cent of employment. In terms of NDP also, it is the second
largest segment: it accounted for over about 20 per cent for rural non-farm NDP.
Even though employment growth in manufacturing has been lower than overall
employment growth in rural non-farm sector during 1994-2010 and has thus lost its
position of largest non-farm sector, it is noteworthy that its share in rural NDP has
significantly increased over the years. It is, therefore, reasonable to see the rural
manufacturing as an important source of productive employment in rural areas. It
must, however, be seen to consist not only of ‘village industries’, but to include such
modern industries which have comparative advantage in terms of raw material and
labour in rural areas. It is estimated that industries based on agricultural raw material
or rural skills account for 83 per cent of all rural industrial enterprises and 78 per
cent of all rural manufacturing employment (Sarkar and Karan, 2005) and they should
obviously become the focus for a strategy of employment expansion in rural
manufacturing activities.
II.1.6 Employment Growth in the Organised Sector: Reversal of a Declining Trend?
In aggregate, growth rate of employment in the organised sector has
registered a continuous decline from one quinquennial period to another during
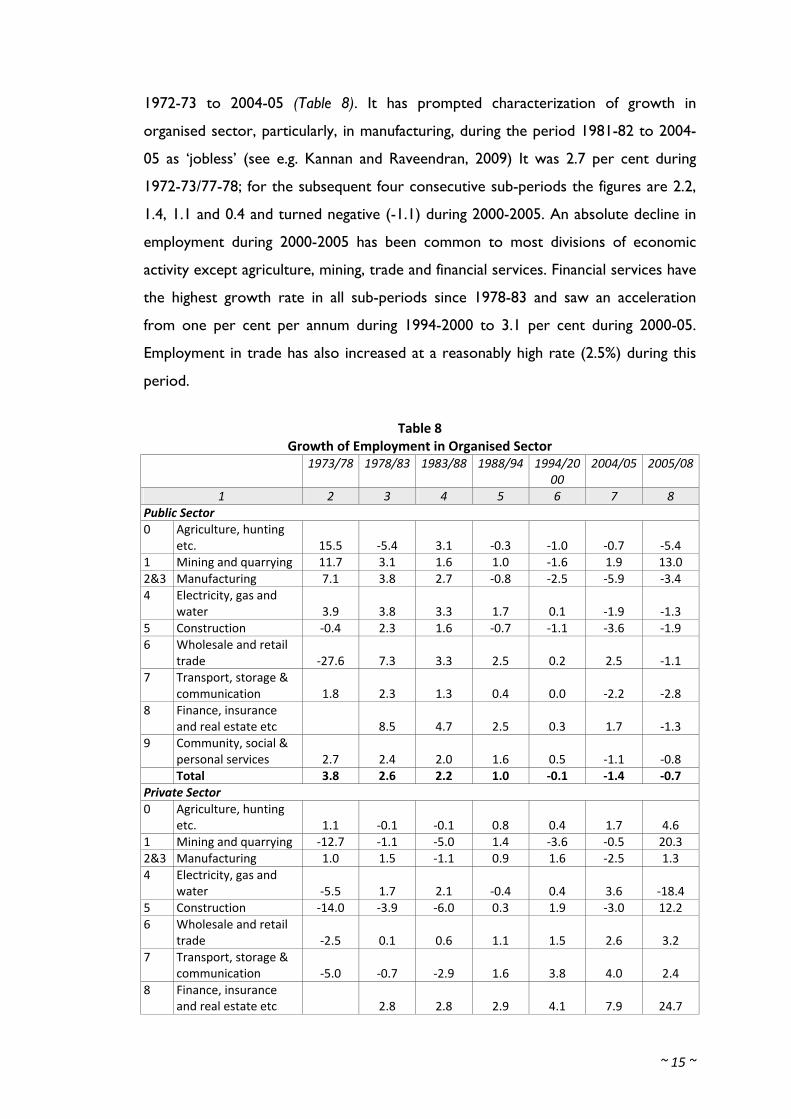
~ 15 ~
1972-73 to 2004-05 (Table 8). It has prompted characterization of growth in
organised sector, particularly, in manufacturing, during the period 1981-82 to 2004-
05 as ‘jobless’ (see e.g. Kannan and Raveendran, 2009) It was 2.7 per cent during
1972-73/77-78; for the subsequent four consecutive sub-periods the figures are 2.2,
1.4, 1.1 and 0.4 and turned negative (-1.1) during 2000-2005. An absolute decline in
employment during 2000-2005 has been common to most divisions of economic
activity except agriculture, mining, trade and financial services. Financial services have
the highest growth rate in all sub-periods since 1978-83 and saw an acceleration
from one per cent per annum during 1994-2000 to 3.1 per cent during 2000-05.
Employment in trade has also increased at a reasonably high rate (2.5%) during this
period.
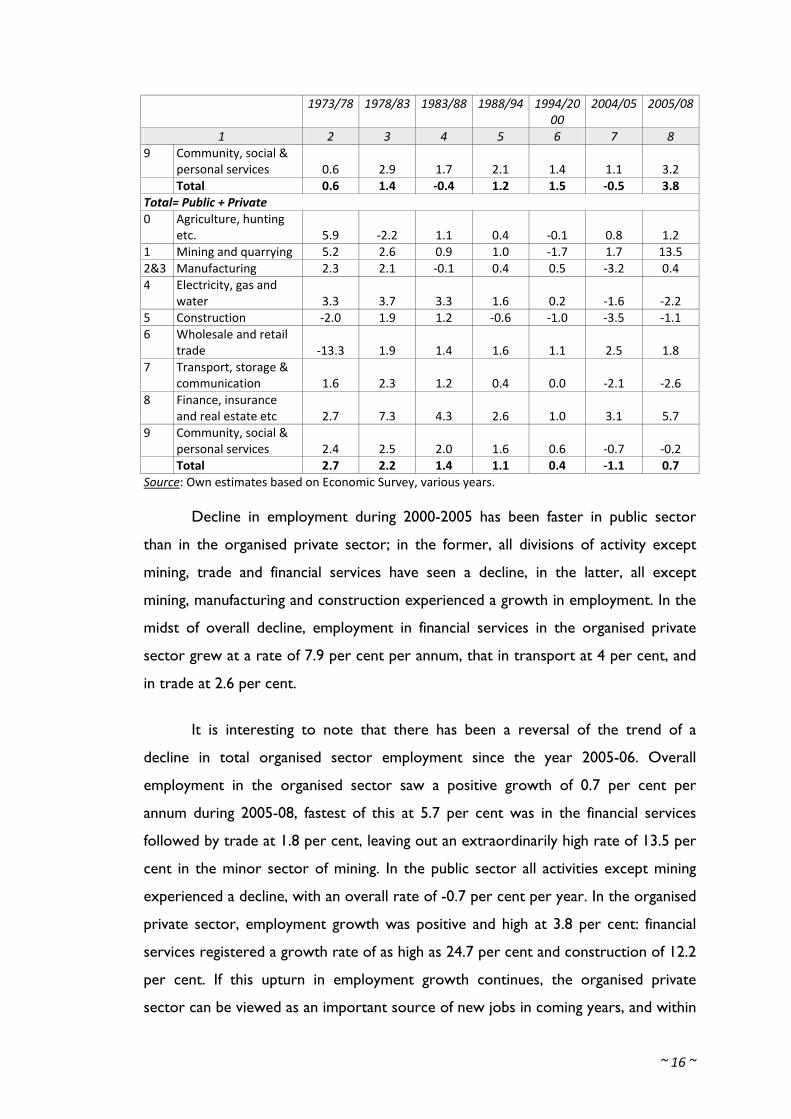
Table 8 Growth of Employment in Organised Sector
1973/78 1978/83 1983/88 1988/94 1994/2000
2004/05 2005/08
1 2 3 4 5 6 7 8 Public Sector 0 Agriculture, hunting
etc. 15.5 ‐5.4 3.1 ‐0.3 ‐1.0 ‐0.7 ‐5.4 1 Mining and quarrying 11.7 3.1 1.6 1.0 ‐1.6 1.9 13.0 2&3 Manufacturing 7.1 3.8 2.7 ‐0.8 ‐2.5 ‐5.9 ‐3.4 4 Electricity, gas and
water 3.9 3.8 3.3 1.7 0.1 ‐1.9 ‐1.3 5 Construction ‐0.4 2.3 1.6 ‐0.7 ‐1.1 ‐3.6 ‐1.9 6 Wholesale and retail
trade ‐27.6 7.3 3.3 2.5 0.2 2.5 ‐1.1 7 Transport, storage &
communication 1.8 2.3 1.3 0.4 0.0 ‐2.2 ‐2.8 8 Finance, insurance
and real estate etc 8.5 4.7 2.5 0.3 1.7 ‐1.3 9 Community, social &
personal services 2.7 2.4 2.0 1.6 0.5 ‐1.1 ‐0.8 Total 3.8 2.6 2.2 1.0 ‐0.1 ‐1.4 ‐0.7 Private Sector 0 Agriculture, hunting
etc. 1.1 ‐0.1 ‐0.1 0.8 0.4 1.7 4.6 1 Mining and quarrying ‐12.7 ‐1.1 ‐5.0 1.4 ‐3.6 ‐0.5 20.3 2&3 Manufacturing 1.0 1.5 ‐1.1 0.9 1.6 ‐2.5 1.3 4 Electricity, gas and
water ‐5.5 1.7 2.1 ‐0.4 0.4 3.6 ‐18.4 5 Construction ‐14.0 ‐3.9 ‐6.0 0.3 1.9 ‐3.0 12.2 6 Wholesale and retail
trade ‐2.5 0.1 0.6 1.1 1.5 2.6 3.2 7 Transport, storage &
communication ‐5.0 ‐0.7 ‐2.9 1.6 3.8 4.0 2.4 8 Finance, insurance
and real estate etc 2.8 2.8 2.9 4.1 7.9 24.7
~ 16 ~
1973/78 1978/83 1983/88 1988/94 1994/2000
2004/05 2005/08
1 2 3 4 5 6 7 8 9 Community, social &
personal services 0.6 2.9 1.7 2.1 1.4 1.1 3.2 Total 0.6 1.4 ‐0.4 1.2 1.5 ‐0.5 3.8 Total= Public + Private 0 Agriculture, hunting
etc. 5.9 ‐2.2 1.1 0.4 ‐0.1 0.8 1.2 1 Mining and quarrying 5.2 2.6 0.9 1.0 ‐1.7 1.7 13.5 2&3 Manufacturing 2.3 2.1 ‐0.1 0.4 0.5 ‐3.2 0.4 4 Electricity, gas and
water 3.3 3.7 3.3 1.6 0.2 ‐1.6 ‐2.2 5 Construction ‐2.0 1.9 1.2 ‐0.6 ‐1.0 ‐3.5 ‐1.1 6 Wholesale and retail
trade ‐13.3 1.9 1.4 1.6 1.1 2.5 1.8 7 Transport, storage &
communication 1.6 2.3 1.2 0.4 0.0 ‐2.1 ‐2.6 8 Finance, insurance
and real estate etc 2.7 7.3 4.3 2.6 1.0 3.1 5.7 9 Community, social &
personal services 2.4 2.5 2.0 1.6 0.6 ‐0.7 ‐0.2 Total 2.7 2.2 1.4 1.1 0.4 ‐1.1 0.7 Source: Own estimates based on Economic Survey, various years.
Decline in employment during 2000-2005 has been faster in public sector
than in the organised private sector; in the former, all divisions of activity except
mining, trade and financial services have seen a decline, in the latter, all except
mining, manufacturing and construction experienced a growth in employment. In the
midst of overall decline, employment in financial services in the organised private
sector grew at a rate of 7.9 per cent per annum, that in transport at 4 per cent, and
in trade at 2.6 per cent.
It is interesting to note that there has been a reversal of the trend of a
decline in total organised sector employment since the year 2005-06. Overall
employment in the organised sector saw a positive growth of 0.7 per cent per
annum during 2005-08, fastest of this at 5.7 per cent was in the financial services
followed by trade at 1.8 per cent, leaving out an extraordinarily high rate of 13.5 per
cent in the minor sector of mining. In the public sector all activities except mining
experienced a decline, with an overall rate of -0.7 per cent per year. In the organised
private sector, employment growth was positive and high at 3.8 per cent: financial
services registered a growth rate of as high as 24.7 per cent and construction of 12.2
per cent. If this upturn in employment growth continues, the organised private
sector can be viewed as an important source of new jobs in coming years, and within
~ 17 ~
it financial services, trade, construction, transport, other services and even
manufacturing which in earlier years showed limited employment potential, can be
expected to play important role.
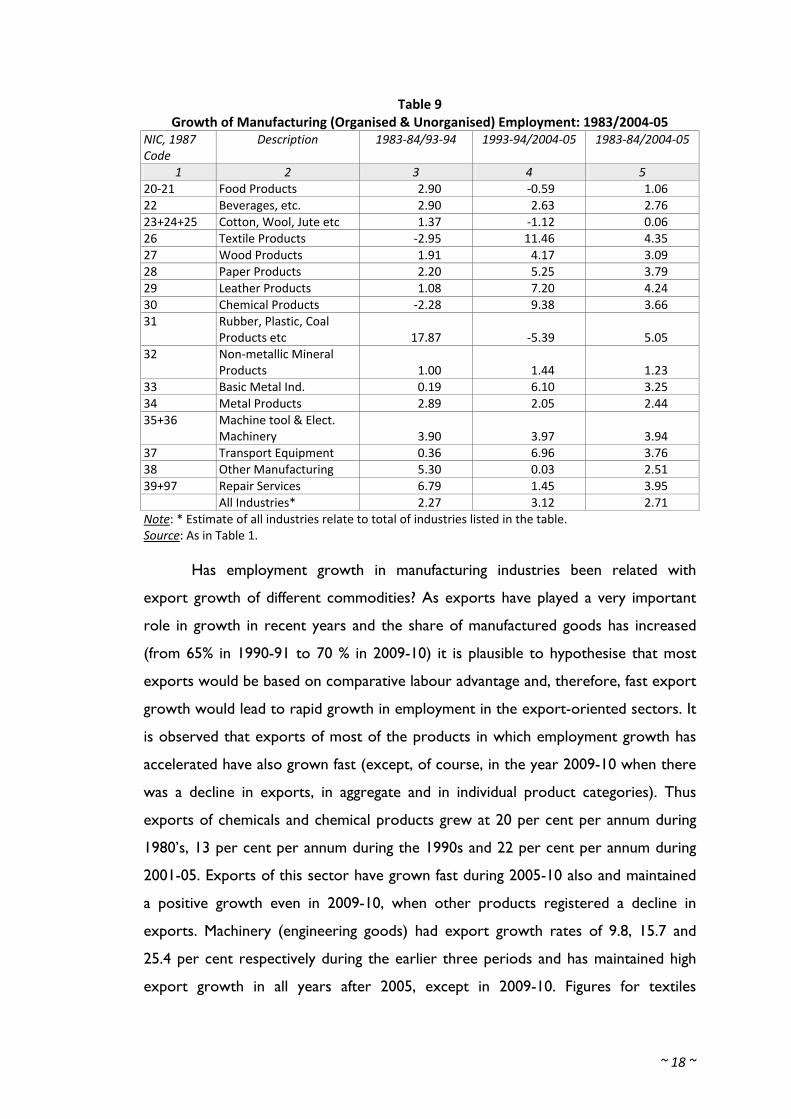
II.1.7 Employment Growth in Manufacturing: Role of Export Growth
Rate of employment growth in manufacturing sector as a whole—including
both organised and organised segments—as noted earlier, has been reasonably high
over the long period. (See Table 1). Employment in manufacturing grew at 4.3 per
cent per annum during 1972-73/1983, the growth rate fell to around 2 per cent
during 1983-1994, but accelerated to 3.2 per cent during 2000-05. It has declined
during 2004-05/2009-10, but still turns out to be around 2 per cent during 2000-
2010. Different product groups have obviously shown different rates of employment
growth (Table 9). For examining the products growth wise growth in employment,
let us concentrate on the period since 1983. For the whole period 1983-2005,
employment growth rate in manufacturing was 2.7 per cent per annum.
What are the product groups that have experienced high rates of
employment growth? For the entire period of 1983-2005, rubber, plastic and coal
products, textile products and leather products were the best performers with over
4 per cent annual average growth rate of employment. Machinery, transport
equipment, chemical products and paper products were close second with
employment growth rate between 3.5 and 4.0 per cent. Basic metals and wood
products were not far behind with growth rates between 3.0 and 3.5 per cent.
Most industries saw an acceleration in employment growth in the period
1994-2005 over 1983-94. Fastest acceleration was seen in textile products (from -
2.95% to 11.46%), followed by leather products (from 1.08% to 7.20%), chemical
products (from -2.28% to 9.38%), transport equipment (from 0.36% to 6.96%),
leather products (from 1.08% to 7.20%) and basic metals (from 0.19% to 6.10%).
Rubber, plastic and coal products and food products, on the other hand, saw a sharp
deceleration in employment growth: from 17.87 per cent to -5.39 per cent in the
case of former and from 2.90 to -0.59 per cent in the case of latter product group.
~ 18 ~
Table 9 Growth of Manufacturing (Organised & Unorganised) Employment: 1983/2004‐05
NIC, 1987 Code
Description 1983‐84/93‐94 1993‐94/2004‐05 1983‐84/2004‐05
1 2 3 4 5 20‐21 Food Products 2.90 ‐0.59 1.06 22 Beverages, etc. 2.90 2.63 2.76 23+24+25 Cotton, Wool, Jute etc 1.37 ‐1.12 0.06 26 Textile Products ‐2.95 11.46 4.35 27 Wood Products 1.91 4.17 3.09 28 Paper Products 2.20 5.25 3.79 29 Leather Products 1.08 7.20 4.24 30 Chemical Products ‐2.28 9.38 3.66 31 Rubber, Plastic, Coal
Products etc 17.87 ‐5.39 5.05 32 Non‐metallic Mineral
Products 1.00 1.44 1.23 33 Basic Metal Ind. 0.19 6.10 3.25 34 Metal Products 2.89 2.05 2.44 35+36 Machine tool & Elect.
Machinery 3.90 3.97 3.94 37 Transport Equipment 0.36 6.96 3.76 38 Other Manufacturing 5.30 0.03 2.51 39+97 Repair Services 6.79 1.45 3.95 All Industries* 2.27 3.12 2.71 Note: * Estimate of all industries relate to total of industries listed in the table. Source: As in Table 1.
Has employment growth in manufacturing industries been related with
export growth of different commodities? As exports have played a very important
role in growth in recent years and the share of manufactured goods has increased
(from 65% in 1990-91 to 70 % in 2009-10) it is plausible to hypothesise that most
exports would be based on comparative labour advantage and, therefore, fast export
growth would lead to rapid growth in employment in the export-oriented sectors. It
is observed that exports of most of the products in which employment growth has
accelerated have also grown fast (except, of course, in the year 2009-10 when there
was a decline in exports, in aggregate and in individual product categories). Thus
exports of chemicals and chemical products grew at 20 per cent per annum during
1980’s, 13 per cent per annum during the 1990s and 22 per cent per annum during
2001-05. Exports of this sector have grown fast during 2005-10 also and maintained
a positive growth even in 2009-10, when other products registered a decline in
exports. Machinery (engineering goods) had export growth rates of 9.8, 15.7 and
25.4 per cent respectively during the earlier three periods and has maintained high
export growth in all years after 2005, except in 2009-10. Figures for textiles
~ 19 ~
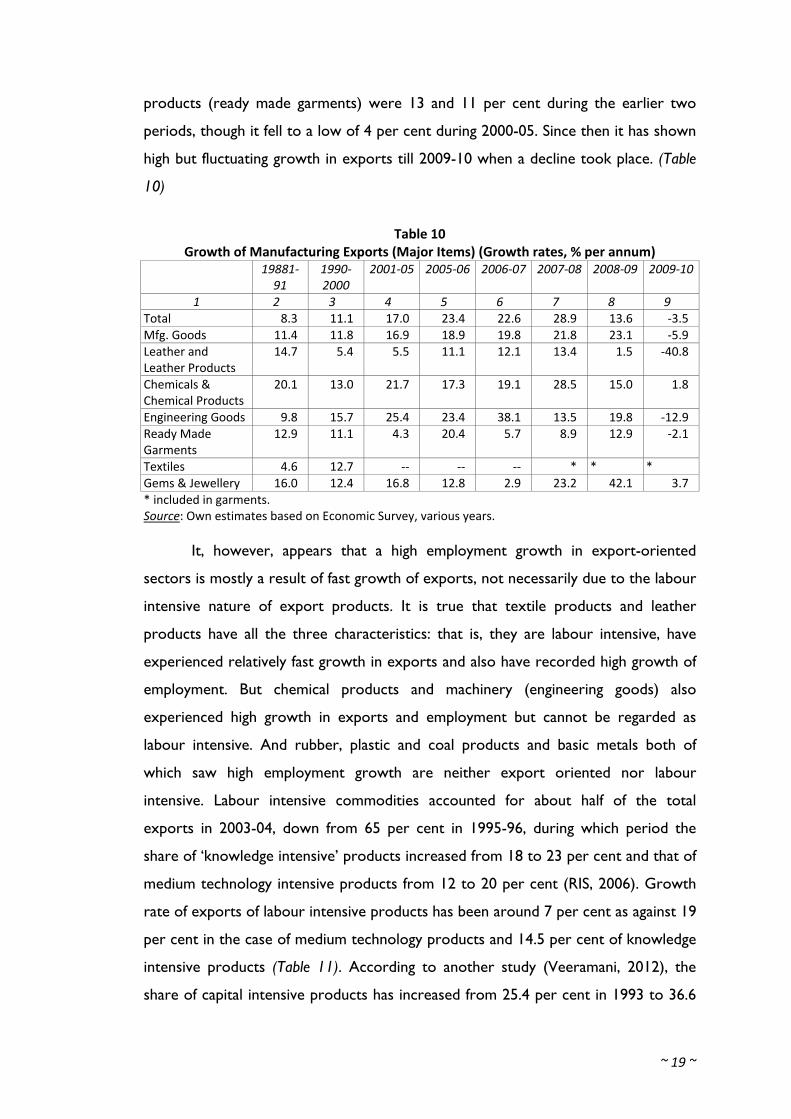
products (ready made garments) were 13 and 11 per cent during the earlier two
periods, though it fell to a low of 4 per cent during 2000-05. Since then it has shown
high but fluctuating growth in exports till 2009-10 when a decline took place. (Table
10)
Table 10 Growth of Manufacturing Exports (Major Items) (Growth rates, % per annum) 19881‐
91 1990‐2000
2001‐05 2005‐06 2006‐07 2007‐08 2008‐09 2009‐10
1 2 3 4 5 6 7 8 9 Total 8.3 11.1 17.0 23.4 22.6 28.9 13.6 ‐3.5 Mfg. Goods 11.4 11.8 16.9 18.9 19.8 21.8 23.1 ‐5.9 Leather and Leather Products
14.7 5.4 5.5 11.1 12.1 13.4 1.5 ‐40.8
Chemicals & Chemical Products
20.1 13.0 21.7 17.3 19.1 28.5 15.0 1.8
Engineering Goods 9.8 15.7 25.4 23.4 38.1 13.5 19.8 ‐12.9 Ready Made Garments
12.9 11.1 4.3 20.4 5.7 8.9 12.9 ‐2.1
Textiles 4.6 12.7 ‐‐ ‐‐ ‐‐ * * * Gems & Jewellery 16.0 12.4 16.8 12.8 2.9 23.2 42.1 3.7 * included in garments. Source: Own estimates based on Economic Survey, various years.
It, however, appears that a high employment growth in export-oriented
sectors is mostly a result of fast growth of exports, not necessarily due to the labour
intensive nature of export products. It is true that textile products and leather
products have all the three characteristics: that is, they are labour intensive, have
experienced relatively fast growth in exports and also have recorded high growth of
employment. But chemical products and machinery (engineering goods) also
experienced high growth in exports and employment but cannot be regarded as
labour intensive. And rubber, plastic and coal products and basic metals both of
which saw high employment growth are neither export oriented nor labour
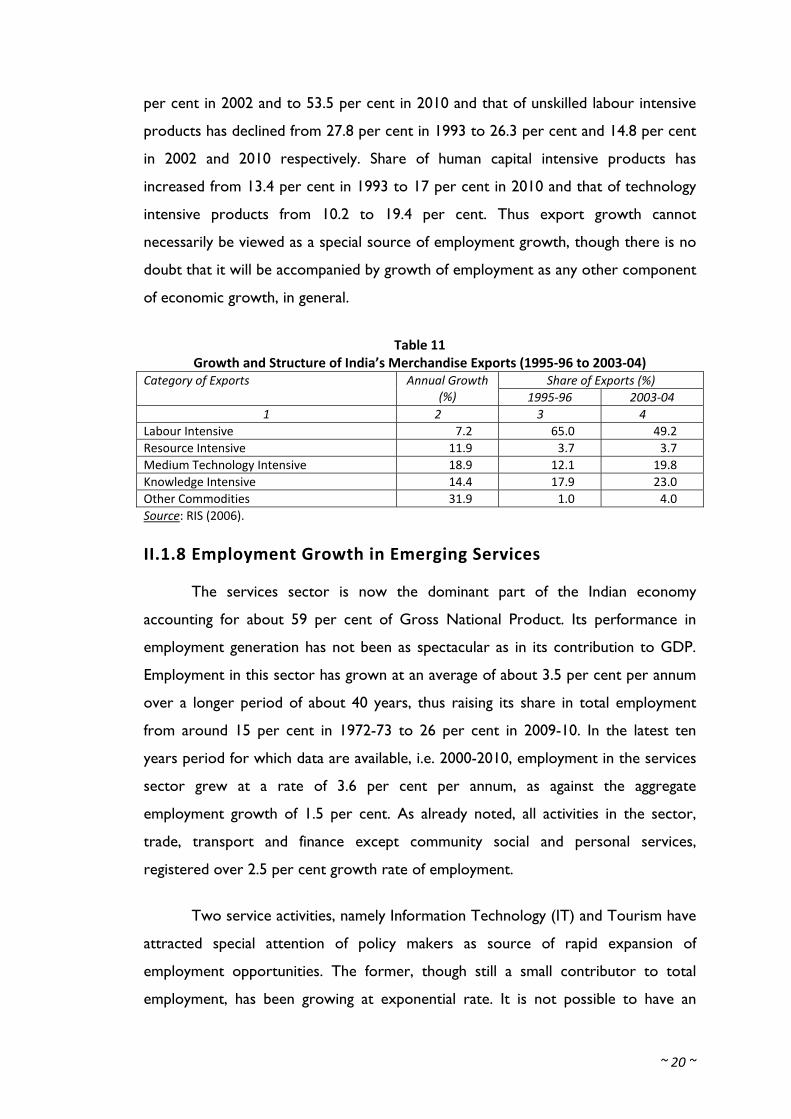
intensive. Labour intensive commodities accounted for about half of the total
exports in 2003-04, down from 65 per cent in 1995-96, during which period the
share of ‘knowledge intensive’ products increased from 18 to 23 per cent and that of
medium technology intensive products from 12 to 20 per cent (RIS, 2006). Growth
rate of exports of labour intensive products has been around 7 per cent as against 19
per cent in the case of medium technology products and 14.5 per cent of knowledge
intensive products (Table 11). According to another study (Veeramani, 2012), the
share of capital intensive products has increased from 25.4 per cent in 1993 to 36.6
~ 20 ~
per cent in 2002 and to 53.5 per cent in 2010 and that of unskilled labour intensive
products has declined from 27.8 per cent in 1993 to 26.3 per cent and 14.8 per cent
in 2002 and 2010 respectively. Share of human capital intensive products has
increased from 13.4 per cent in 1993 to 17 per cent in 2010 and that of technology
intensive products from 10.2 to 19.4 per cent. Thus export growth cannot
necessarily be viewed as a special source of employment growth, though there is no
doubt that it will be accompanied by growth of employment as any other component
of economic growth, in general.
Table 11 Growth and Structure of India’s Merchandise Exports (1995‐96 to 2003‐04)
Share of Exports (%) Category of Exports Annual Growth (%) 1995‐96 2003‐04
1 2 3 4 Labour Intensive 7.2 65.0 49.2 Resource Intensive 11.9 3.7 3.7 Medium Technology Intensive 18.9 12.1 19.8 Knowledge Intensive 14.4 17.9 23.0 Other Commodities 31.9 1.0 4.0 Source: RIS (2006).
II.1.8 Employment Growth in Emerging Services
The services sector is now the dominant part of the Indian economy
accounting for about 59 per cent of Gross National Product. Its performance in
employment generation has not been as spectacular as in its contribution to GDP.
Employment in this sector has grown at an average of about 3.5 per cent per annum
over a longer period of about 40 years, thus raising its share in total employment
from around 15 per cent in 1972-73 to 26 per cent in 2009-10. In the latest ten
years period for which data are available, i.e. 2000-2010, employment in the services
sector grew at a rate of 3.6 per cent per annum, as against the aggregate
employment growth of 1.5 per cent. As already noted, all activities in the sector,
trade, transport and finance except community social and personal services,
registered over 2.5 per cent growth rate of employment.
Two service activities, namely Information Technology (IT) and Tourism have
attracted special attention of policy makers as source of rapid expansion of
employment opportunities. The former, though still a small contributor to total
employment, has been growing at exponential rate. It is not possible to have an
~ 21 ~
independent estimate of employment in the IT sector as it does not feature as an
item in official data on employment. Tourism also does not constitute a sector as it
is made up of various activities which are parts of different sectors in the
classification of economic activity. In view of their emerging importance, we attempt
here some estimation and assessment of employment generation in these sectors,
utilising limited data that are available or can be derived.
Information Technology Sector consists of two main segments: information
technology services (ITS) known as the software services and information technology
enabled services (ITeS) also often referred to as business process outsourcing (BPO)
As mentioned above, the official data collection system does not distinctly and fully
capture the employment situation in the various facets of IT activity. Employment
statistics from Directorate General of Employment and Training (DGET) of Ministry
of Labour and Employment (MoLE) reports employment under the NIC Code 892:
computer and related sector, but its coverage is limited to the organised sector. In
1997-98, for example, employment under this category was reported to be 36071,
constituting 0.3 per cent all employment in the sectors covered by DGET. It must be
noted, however, that it had more than doubled in a short period of three years, from
a figure of 17686 and from a share of 0.06 per cent in 1994-95. Thus though
miniscule in size, it was growing very fast. NSSO estimate which includes both
organised and unorganised segment of the ITS sector was 2,29,000 workers for the
year 1999-2000 representing 0.3 per cent of total urban employment. Employment in
the ITeS is likely to be included in the sectors in which these services are provided
e.g., banking, education, trade etc. Thus even the NSSO estimates do not fully
account for employment in IT.
The National Association of Software and Service Companies (NASSCOM),
the sector’s promotional body, has been collecting information on different aspects,
including employment, of the sector, on the basis of survey among all software
companies listed by them. Their estimate of the IT software and services
professionals employed in 1999-2000 was 2,42,000, with another 42,000 estimated
for the ITeS sector. NASSCOM estimates of employment for the recent years for
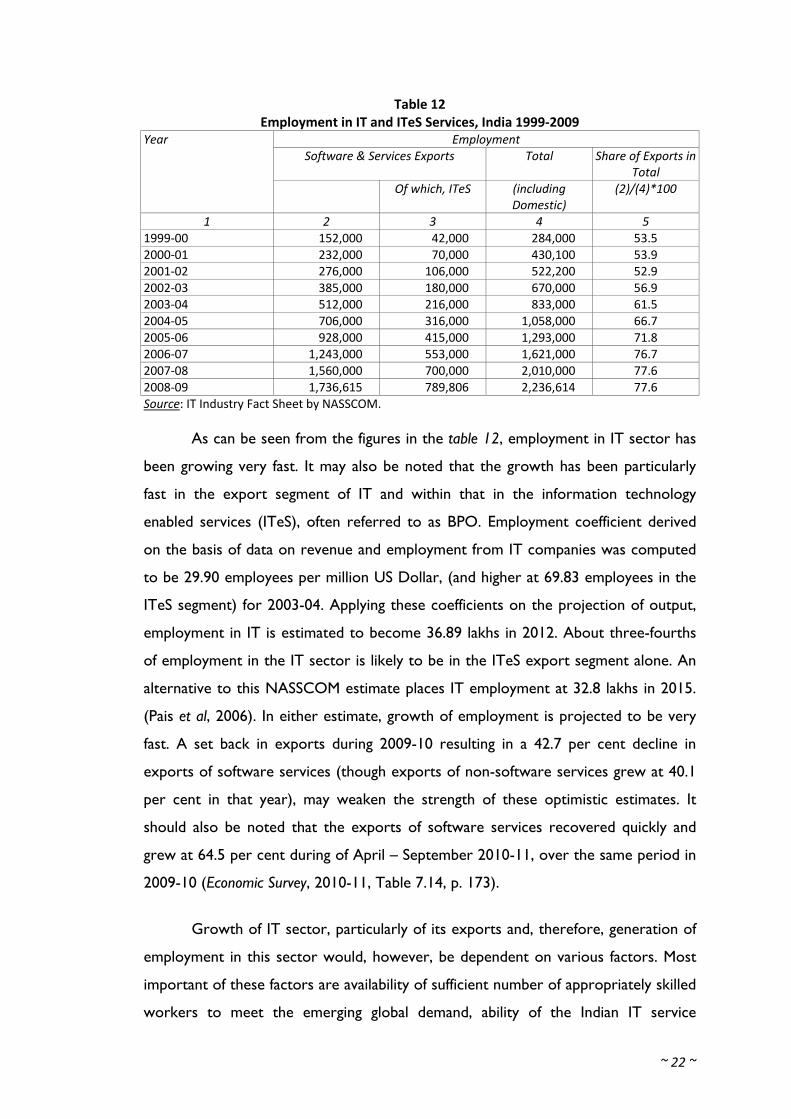
which they are available are given in (Table 12).
~ 22 ~
Table 12 Employment in IT and ITeS Services, India 1999‐2009
Employment Software & Services Exports Total Share of Exports in
Total
Year
Of which, ITeS (including Domestic)
(2)/(4)*100
1 2 3 4 5 1999‐00 152,000 42,000 284,000 53.5 2000‐01 232,000 70,000 430,100 53.9 2001‐02 276,000 106,000 522,200 52.9 2002‐03 385,000 180,000 670,000 56.9 2003‐04 512,000 216,000 833,000 61.5 2004‐05 706,000 316,000 1,058,000 66.7 2005‐06 928,000 415,000 1,293,000 71.8 2006‐07 1,243,000 553,000 1,621,000 76.7 2007‐08 1,560,000 700,000 2,010,000 77.6 2008‐09 1,736,615 789,806 2,236,614 77.6 Source: IT Industry Fact Sheet by NASSCOM.
As can be seen from the figures in the table 12, employment in IT sector has
been growing very fast. It may also be noted that the growth has been particularly
fast in the export segment of IT and within that in the information technology
enabled services (ITeS), often referred to as BPO. Employment coefficient derived
on the basis of data on revenue and employment from IT companies was computed
to be 29.90 employees per million US Dollar, (and higher at 69.83 employees in the
ITeS segment) for 2003-04. Applying these coefficients on the projection of output,
employment in IT is estimated to become 36.89 lakhs in 2012. About three-fourths
of employment in the IT sector is likely to be in the ITeS export segment alone. An
alternative to this NASSCOM estimate places IT employment at 32.8 lakhs in 2015.
(Pais et al, 2006). In either estimate, growth of employment is projected to be very
fast. A set back in exports during 2009-10 resulting in a 42.7 per cent decline in
exports of software services (though exports of non-software services grew at 40.1
per cent in that year), may weaken the strength of these optimistic estimates. It
should also be noted that the exports of software services recovered quickly and
grew at 64.5 per cent during of April – September 2010-11, over the same period in
2009-10 (Economic Survey, 2010-11, Table 7.14, p. 173).
Growth of IT sector, particularly of its exports and, therefore, generation of
employment in this sector would, however, be dependent on various factors. Most
important of these factors are availability of sufficient number of appropriately skilled
workers to meet the emerging global demand, ability of the Indian IT service
~ 23 ~
providers to meet competition from others particularly China in exports of services
in general and of low skill intensive services, in particular; capacity to continue
competing in BPO exports to English language area, and to compete in the newly
emerging markets in non-English language areas; linkages of IT services with rest of
the economy particularly with hardware industry, which are weak, particularly when
compared with China and availability of Mode 4 export of services, namely,
“temporary movement of natural persons”, which is threatened by increasing visa
restrictions by the developed countries (Pais et al, 2006).
Tourism is another activity which is seen as having large potential for growth
and also with high employment potential. There are, however, no separate data
available from official sources either on income or employment generated in tourism
because it does not feature as a sector in the classificatory scheme of economic
activities. Income and employment generated by tourism are accounted for in such
different activities as hotels and other accommodation units, restaurants, travel
agents and tour operators, transport services, tourist resorts and complexes,
entertainment facilities, shopping facilities including sales outlets for curios,
handicrafts, souvenirs etc., conference and convention facilities, adventure and
recreational sports facilities and guide services, which feature as sectors and
subsectors in National Accounts Statistics. It must be noted that only a part of
income and employment is generated due to tourism in several of these activities.
There is no basis on which the contribution of tourism could be directly separated
from the total output and employment in these cases. It is possible to estimate such
contribution indirectly on the basis of pattern of expenditure by tourists: total
expenditure by tourists on an item is taken as income arising out of tourism and
using employment coefficient (number of persons employed per given volume of
output (income)) employment generated due to tourism in the production of that
item is estimated. Some surveys have generated such estimates in the case of foreign
tourists (e.g. MoT, 2006). Since the pattern of expenditure of domestic tourists may
vary from that of the foreign tourists, estimates have generally been made only of
employment generated due to foreign tourism. Also while Ministry of Tourism
maintains data on foreign tourists on a regular basis, no such data base exists for
domestic tourists.
~ 24 ~
According to one study, expenditure of one million of rupees by foreign
tourists in India generated 44.9 year round jobs in 2000-01, and 39.3 jobs in 2004-05.
Using survey data on per tourist expenditure and applying it on the total number of
tourists during a year, total employment generated by foreign tourism is estimated at
4.93 million in 2000-01 and 6.2 million in 2004-05. Assuming the growth of tourism
receipts at the same rate as during 2000-01/2004-05, but a declining trend in
employment coefficient as seen in the past, this study has projected employment due
to foreign tourism in India at 10.7 million in 2009-10 (Pais, 2006). A decline in the
exports of travel (0.9%) and transport (9.9%) services in 2009-10 would, no doubt,
affect these expectations. But it must also be noted that a quick recovery seems to
have occurred reflected in a 16 per cent and 33 per cent growth in the export of
these items during April – September, 2010, over the corresponding period of
earlier year (Economic Survey, 2010-11). One can, therefore, expect the growth of
tourism to accelerate and more visitors coming for reasons of business, as well as
health2 and education, the emerging areas of tourism, and, therefore, the actual
employment generated to be even higher than projected in future.
2 CII estimated 1,50,000 foreign patients coming to India for treatment in 2004 (CII, 2004). About
2.2 lakhs of foreign tourists, making 5 per cent of all tourists interviewed in a 2003 survey of foreign tourists reported “health and treatment” as main purpose of visiting India (MoT, 2003);
~ 25 ~
III. Employment Growth in the Post Reform Period
III.1 Expectations and Apprehensions: Initial Shock and Quick Recovery?
Introduction of major economic reforms in India in 1991 evoked diverse views on
the employment implications of post-reform growth. To begin with, it was
apprehended that the immediate impact of reforms may be felt in the form of a slow
down in the state of economic growth which will also mean a slower growth of
employment. This view was held commonly by the proponents and critics of
economic reforms. Consensus, however, ended here and sharply divergent
prognoses were put forward by different groups with respect to growth and quality
of employment in medium term. Advocates of reforms argued that reforms will soon
result in higher economic growth which will also lead to faster expansion of
employment opportunities. It will be further strengthened by increase in global trade,
with the liberalised trade providing India an opportunity to increase labour –
intensive exports. Critics of reforms, on the other hand, argued that internal and
external competition ushered in by domestic and trade liberalisation will compel
industry to adopt more and more capital intensive technologies and also necessitate
more liberal labour policy to allow flexibility in the use of labour. As a result even if a
higher growth rate is achieved it will not be accompanied by higher growth of
employment. There may, in fact, be a decline, specially in organised sector, as a result
of retrenchment and downsizing both in private and public sector. Similarly divergent
views were held in respect of the structure and quality of employment: Reformists
projected more regular wage/salary jobs in the organised sector while the detractors
of reforms predicted increasing casualisation and informalisation and declining social
protection, with another middle view expecting increase both in formal and informal
employment, after an initial bout of informalisation and casualisation.
As we have seen in the earlier section, employment growth has shown a
declining trend over relatively longer period, but sharply fluctuated in the shorter
periods. We have comprehensive data from four rounds of NSSO in the post-reform
~ 26 ~
period (1993-94, 1999-2000, 2004-05 and 2009-10) to assess the employment
performance of the post-reform economy. Employment grew at 1.84 per cent per
annum during 1993-94/2004-05, as against 2.02 per cent in the preceding ten year
period, and during the period 2004-05/2009-10, employment growth, has been
abysmally low, 0.22 per cent per annum (Table 1). This deceleration in employment
growth has taken place with an acceleration in GDP growth, which was about 5 per
cent during 1983-84/1993-94, rose to about 6.3 per cent during 1993-94/2004-05
and accelerated to as high as 9 per cent during the period 2004-05/2009-10, (Table 2)
when employment virtually stagnated. Even if one disregards the 2004-05 estimates
which seem “outliers” in several respects – a point to which we shall return later –
growth rate of employment during the first decade of the 21st century, 1999-
2000/2009-10, turns out to be only 1.50, still showing a long term deceleration, with
the highest GDP growth of 7.5 per cent, the highest in any short or long periods
before.
Within a long-term declining trend, of employment growth has shown a
intriguingly fluctuating trend in the shorter periods. The 6-year period following the
introduction of reforms for which point to point data are available, viz., 1993-94 to
1999-2000, showed a steep decline in the rate of employment growth (to 1.04%)
over the preceding 6-year period, 1987-88/1993-94 (at 2.39%). Over the next five
years (1999-2000/2004-05) employment growth was estimated to be high at 2.81 per
cent and in the next five years no significant growth in employment is recorded.
Among these four periods change in growth rate of employment has been in inverse
relationship with the change in GDP growth rate. Employment elasticity sharply
declined in the years following the reforms, it increased during 2000-2005 and was
almost zero during 2005-10 (Table 3).
III.2 Employment Growth in Different Sectors
Let us note a few other features of employment growth during the post-
reform period. First, as expected, fastest employment growth has taken place in the
secondary sector, at an annual average rate of about 3.5 per cent over the entire
period 1993-94/2009-10. Even during 2005-10 when there has hardly been any
growth in employment in aggregate, secondary sector employment grew at 3.5 per
~ 27 ~
cent per annum. Agriculture, understandably, did not experience any significant
increase in employment; during recent years; it has in fact seen a decline in
employment. Services sector registered relatively high employment growth,
averaging at about 3 per cent per annum over the entire post-reform period, though
it was not commensurate with its GDP growth which has been over 10 per cent per
annum. As a result, employment elasticity in this sector has been relatively low and
has sharply declined particularly since 2004-05. Most divisions of economic activities
have registered a decline in the rate of their employment growth in the post-reform
period, but construction has seen an acceleration in the rate of employment growth.
Trade, transport and financial services also saw an acceleration in employment
growth during 1993-94/2004-05, but the rate declined during 2004-05/2009-10.
It is also interesting to note that the deceleration in the rate of employment
growth in the post-reform period can primarily be attributed to a decline in
employment growth in rural areas where employment grew at 1.4 per cent during
1993-94/2004-05 and actually declined during 2004-05/2009-10, against a growth of
about 2 per cent per annum in earlier 20 year period. In urban areas employment
growth rate was higher in the first post-reform decade, 1993-94/2004-05 and
declined to 2005-10, but was still positive and significant at 1.80 per cent per annum.
All divisions of activity in the secondary and tertiary sectors except, mining and
community, social and personal services, recorded reasonably high employment
growth in the post-reform period in urban areas. In rural areas, construction was the
biggest contributor to employment growth, followed by transport. Overall
employment growth has been low and at a declining rate in rural areas primarily
because of the low and declining, and recently a negative, growth in employment of
agriculture (Table 4 and 5).
III.3 Steep Decline in Employment Growth, 2005‐10: Result of a Positive Development – Increase in Enrolment?
A steep decline in the employment growth during 2004-05/2009-10, as
estimated on the basis of the 61st and 66th rounds of NSSO surveys has not only led
to dampening of the optimistic prospects projected earlier, around the start of the
Eleventh Five Year Plan (EAC, 2007, Planning Commission, 2008), but has also
proved intriguing for those interested in the study of employment growth and also
~ 28 ~
for policy makers. It seems particularly puzzling in the face of an unprecedentedly
high economic growth during this period. Also several labour market developments
during this period suggest an increase in demand for labour. For example, organised
sector employment has shown an increase during this period for the first time since
1997. Real wage rates of workers in all sectors and categories have recorded a rapid
increase. There has been a faster decline in poverty, during this period than during
the earlier two quenquinnia (Planning Commission, 2011). Also, as shown by NSSO
figures, a highest ever increase occurred in the proportion of regular employee
category in the total workforce.
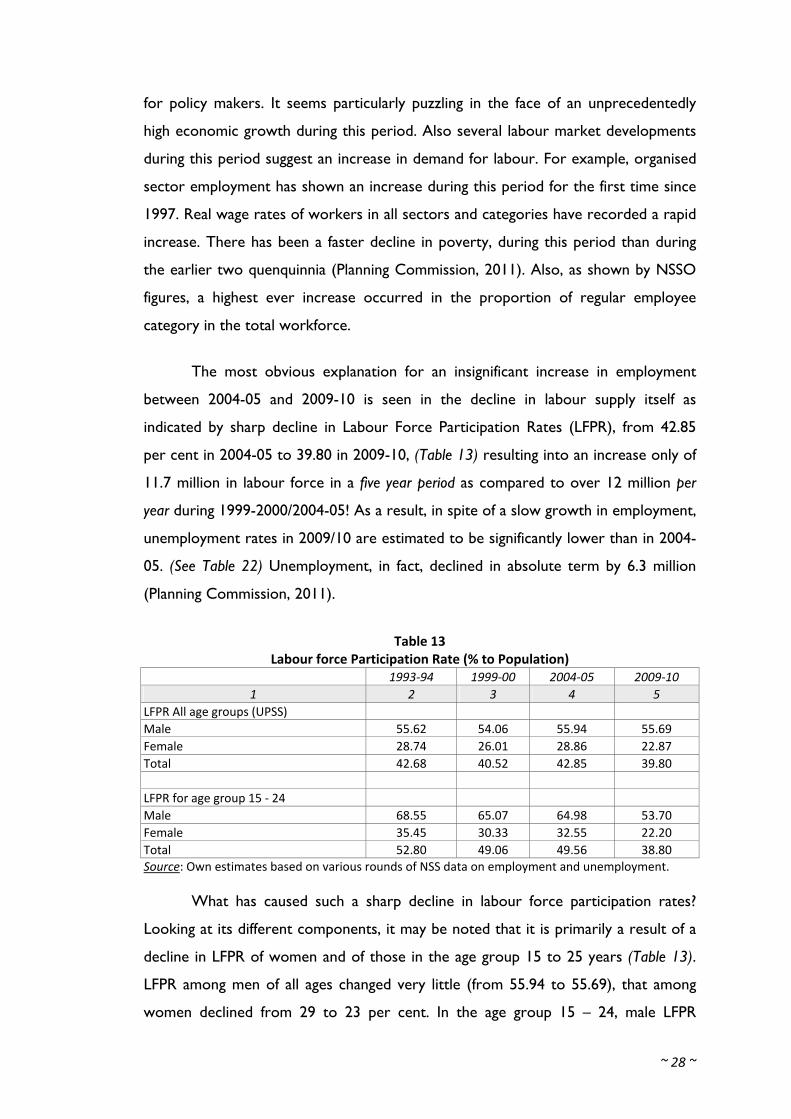
The most obvious explanation for an insignificant increase in employment
between 2004-05 and 2009-10 is seen in the decline in labour supply itself as
indicated by sharp decline in Labour Force Participation Rates (LFPR), from 42.85
per cent in 2004-05 to 39.80 in 2009-10, (Table 13) resulting into an increase only of
11.7 million in labour force in a five year period as compared to over 12 million per
year during 1999-2000/2004-05! As a result, in spite of a slow growth in employment,
unemployment rates in 2009/10 are estimated to be significantly lower than in 2004-
05. (See Table 22) Unemployment, in fact, declined in absolute term by 6.3 million
(Planning Commission, 2011).
Table 13 Labour force Participation Rate (% to Population)
1993‐94 1999‐00 2004‐05 2009‐10 1 2 3 4 5
LFPR All age groups (UPSS) Male 55.62 54.06 55.94 55.69 Female 28.74 26.01 28.86 22.87 Total 42.68 40.52 42.85 39.80 LFPR for age group 15 ‐ 24 Male 68.55 65.07 64.98 53.70 Female 35.45 30.33 32.55 22.20 Total 52.80 49.06 49.56 38.80 Source: Own estimates based on various rounds of NSS data on employment and unemployment.
What has caused such a sharp decline in labour force participation rates?
Looking at its different components, it may be noted that it is primarily a result of a
decline in LFPR of women and of those in the age group 15 to 25 years (Table 13).
LFPR among men of all ages changed very little (from 55.94 to 55.69), that among
women declined from 29 to 23 per cent. In the age group 15 – 24, male LFPR
~ 29 ~
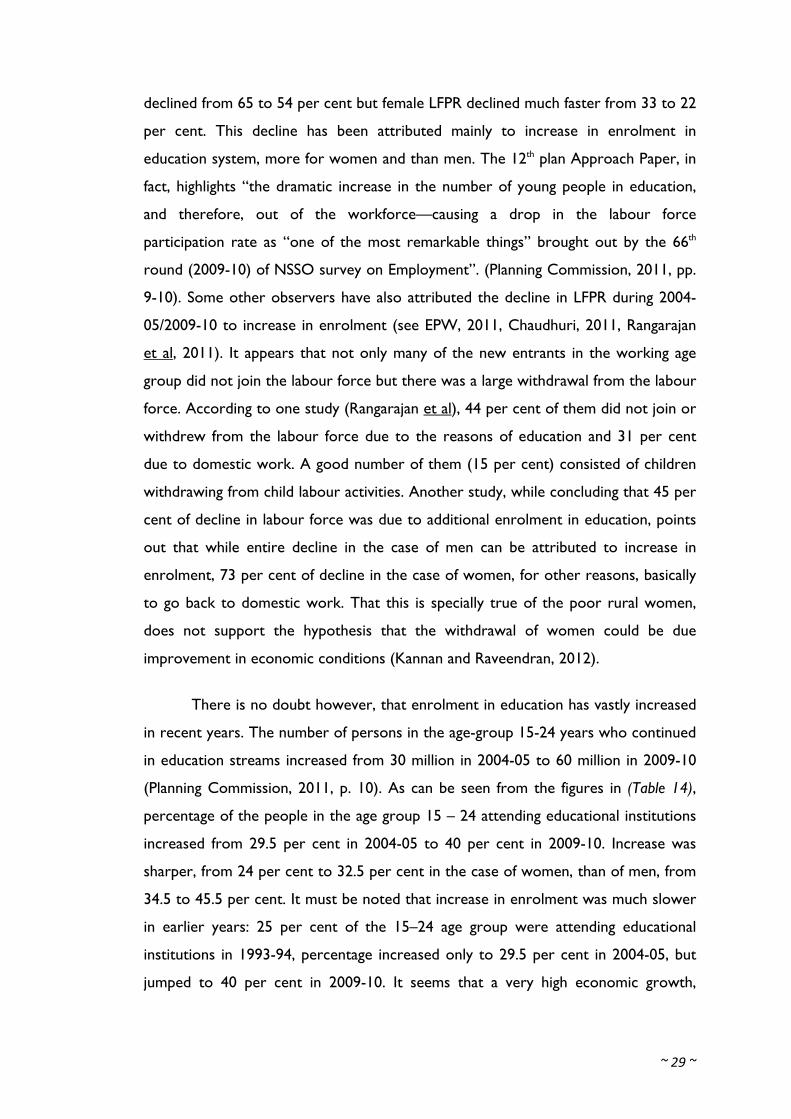
declined from 65 to 54 per cent but female LFPR declined much faster from 33 to 22
per cent. This decline has been attributed mainly to increase in enrolment in
education system, more for women and than men. The 12th plan Approach Paper, in
fact, highlights “the dramatic increase in the number of young people in education,
and therefore, out of the workforce—causing a drop in the labour force
participation rate as “one of the most remarkable things” brought out by the 66th
round (2009-10) of NSSO survey on Employment”. (Planning Commission, 2011, pp.
9-10). Some other observers have also attributed the decline in LFPR during 2004-
05/2009-10 to increase in enrolment (see EPW, 2011, Chaudhuri, 2011, Rangarajan
et al, 2011). It appears that not only many of the new entrants in the working age
group did not join the labour force but there was a large withdrawal from the labour
force. According to one study (Rangarajan et al), 44 per cent of them did not join or
withdrew from the labour force due to the reasons of education and 31 per cent
due to domestic work. A good number of them (15 per cent) consisted of children
withdrawing from child labour activities. Another study, while concluding that 45 per
cent of decline in labour force was due to additional enrolment in education, points
out that while entire decline in the case of men can be attributed to increase in
enrolment, 73 per cent of decline in the case of women, for other reasons, basically
to go back to domestic work. That this is specially true of the poor rural women,
does not support the hypothesis that the withdrawal of women could be due
improvement in economic conditions (Kannan and Raveendran, 2012).
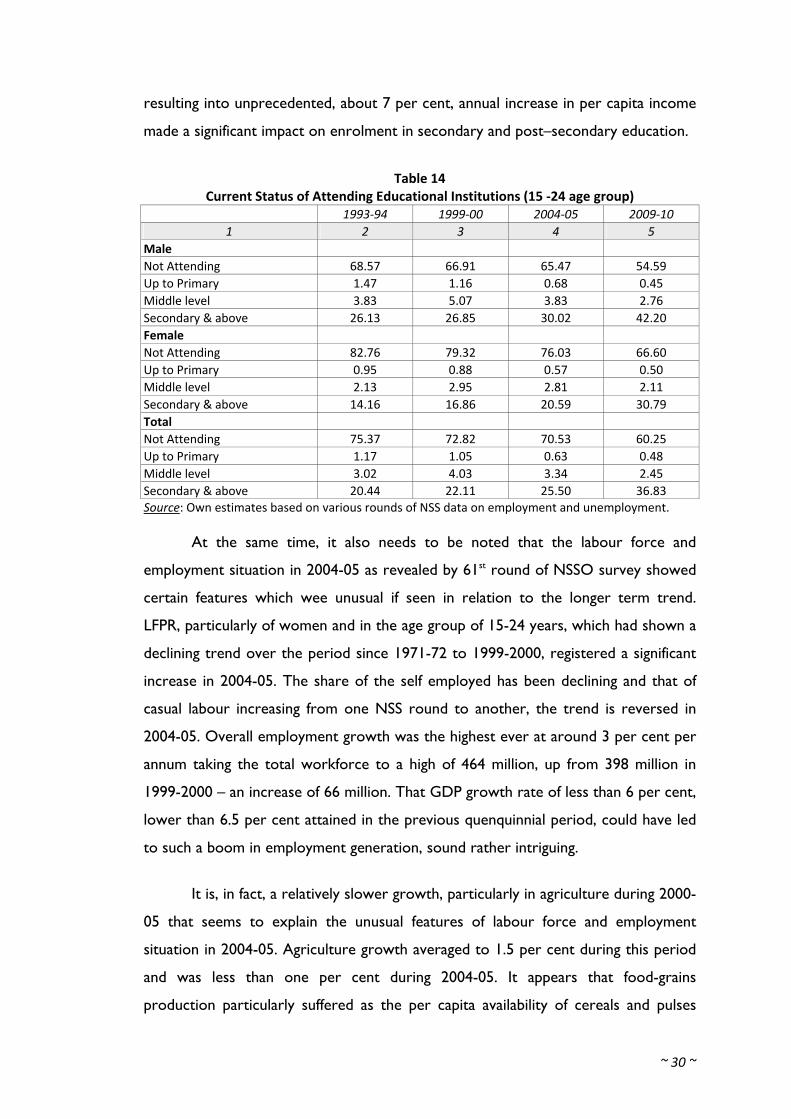
There is no doubt however, that enrolment in education has vastly increased
in recent years. The number of persons in the age-group 15-24 years who continued
in education streams increased from 30 million in 2004-05 to 60 million in 2009-10
(Planning Commission, 2011, p. 10). As can be seen from the figures in (Table 14),
percentage of the people in the age group 15 – 24 attending educational institutions
increased from 29.5 per cent in 2004-05 to 40 per cent in 2009-10. Increase was
sharper, from 24 per cent to 32.5 per cent in the case of women, than of men, from
34.5 to 45.5 per cent. It must be noted that increase in enrolment was much slower
in earlier years: 25 per cent of the 15–24 age group were attending educational
institutions in 1993-94, percentage increased only to 29.5 per cent in 2004-05, but
jumped to 40 per cent in 2009-10. It seems that a very high economic growth,
~ 30 ~
resulting into unprecedented, about 7 per cent, annual increase in per capita income
made a significant impact on enrolment in secondary and post–secondary education.
Table 14 Current Status of Attending Educational Institutions (15 ‐24 age group)
1993‐94 1999‐00 2004‐05 2009‐10 1 2 3 4 5
Male Not Attending 68.57 66.91 65.47 54.59 Up to Primary 1.47 1.16 0.68 0.45 Middle level 3.83 5.07 3.83 2.76 Secondary & above 26.13 26.85 30.02 42.20 Female Not Attending 82.76 79.32 76.03 66.60 Up to Primary 0.95 0.88 0.57 0.50 Middle level 2.13 2.95 2.81 2.11 Secondary & above 14.16 16.86 20.59 30.79 Total Not Attending 75.37 72.82 70.53 60.25 Up to Primary 1.17 1.05 0.63 0.48 Middle level 3.02 4.03 3.34 2.45 Secondary & above 20.44 22.11 25.50 36.83 Source: Own estimates based on various rounds of NSS data on employment and unemployment.
At the same time, it also needs to be noted that the labour force and
employment situation in 2004-05 as revealed by 61st round of NSSO survey showed
certain features which wee unusual if seen in relation to the longer term trend.
LFPR, particularly of women and in the age group of 15-24 years, which had shown a
declining trend over the period since 1971-72 to 1999-2000, registered a significant
increase in 2004-05. The share of the self employed has been declining and that of
casual labour increasing from one NSS round to another, the trend is reversed in
2004-05. Overall employment growth was the highest ever at around 3 per cent per
annum taking the total workforce to a high of 464 million, up from 398 million in
1999-2000 – an increase of 66 million. That GDP growth rate of less than 6 per cent,
lower than 6.5 per cent attained in the previous quenquinnial period, could have led
to such a boom in employment generation, sound rather intriguing.
It is, in fact, a relatively slower growth, particularly in agriculture during 2000-
05 that seems to explain the unusual features of labour force and employment
situation in 2004-05. Agriculture growth averaged to 1.5 per cent during this period
and was less than one per cent during 2004-05. It appears that food-grains
production particularly suffered as the per capita availability of cereals and pulses
~ 31 ~
declined from 462 grams per day in 2004 to 422 grams per day in 2005. With
declining incomes, it appears that more and more women (who would otherwise
have been in domestic work) and children (who would otherwise have been in
schools) joined the labour force and participated in workforce, swelling the figures of
employment. As a result, employment growth was of poor quality, mostly in the self-
employed category and was poorly remunerative as reflected in decline in real wages
(Unni and Raveendran, 2007). In other words, the 2004-05 estimates of labour force
and work force seem to have been significantly inflated as a good part of
employment could be regarded as ‘spurious’. Even with a ‘high’ rate of employment
growth, unemployment rates (by any status) in 2004-05 were higher than in 1999-
2000.
It thus appears that the year 2004-05 was an aberration from the longer term
trends and an outlier in so far as comparison between different NSS rounds is
concerned. The fact that the long term trends – decline in LFPR, decline in the share
of the self employed and increase in that of casual workers – have been restored
during 2004-05/2009-10, supports the hypothesis regarding the unusual nature of
2004-05 situation. It can be argued that ‘distress’ led participation in labour force
could have also taken place in 2009-10 as agricultural growth in that as also the
previous year was very low. It should, however, be noted that the average growth in
agriculture during 2004-05/2009-10 was quite high at over 3 per cent per annum and
even in the years of low agricultural growth, food grains production was high enough
to prevent a decline in per capita availability of food grains. In any case, overall
economic growth was very high, between 8.5 and 9 per cent and could have
provided good enough buffer to absorb sectoral stocks.
A very slow growth of employment as revealed by the data for 2009-10 over
those for 2004-05 should, therefore, be viewed with caution. It may not necessarily
be reflecting a worsening situation; it could even be interpreted like by the Planning
Commission as a result of a positive developments, namely, a larger number of
young persons particularly women, going through secondary and higher education.
Taking only the persons in the working age (15-59) group and using usual Principal
Status (UPS) concept, an analysist has estimated a reasonably high rate (1.71 per cent
per annum) of employment growth during 2004-05/2009-10 (Ghose, 2011). He has
~ 32 ~
also argued that employment quality has substantially improved during this period as
indicated by a fast growth (7.24% per annum) of employment in the organised sector
than in the unorganised (0.95% per annum) and a reasonably high growth of formal
employment (4.02% per annum).
It may be advisable to disregard the estimates for 2004-05 for a longer term
analysis and an assessment of the post-reform growth in employment, for the
reasons elaborated above. A low employment growth in the immediate post-reform
period 1993-94/1999-2000 was expected as mentioned in the beginning of this
section. Has employment growth recovered since and got accelerated over the
years? It seems to have slightly improved, but has been in line with the long term
declining trend. Employment growth during 1999-2000 to 2009-10 has been 1.5 per
cent per annum, lower than any ten-year period earlier and for the entire post-
reform period it would still be lower, as employment growth during 1993-94/1999-
2000 was only about one per cent per annum. So, the reforms, inspite of high
growth of GDP, do not seem to have delivered on employment front.
III.4 Impact of Global Economic Slowdown
Let us briefly look at the impact of 2008 global financial crisis on Indian
economy and employment. The global crisis adversely affected the Indian economy,
but impact is not as severe was felt globally. GDP growth slowed down from over 9
per cent during the three year period ending with 2007-08, to 6.8 per cent during
2008-09. What impact this slowdown had on employment?
No comprehensive data are available for assessing impact of the slow down
on employment. Limited surveys by Labour Bureau of the Ministry of Labour and
Employment (MoLE), based on a sample of about 3000 Annual Survey of Industries
(ASI) covered units in the manufacturing sector and in IT/BPO segment of the
services sector, indicates some, though not very severe, impact. According to these
surveys, there was a loss of 5 lakh jobs in the quarter October – December 2008, a
gain of 2.8 lakhs jobs during the next quarter and again a loss of 1.3 lakh jobs during
April-June 2009. The subsequent surveys for quarters June-September 2009 and
September 2009-December 2009 revealed significant increase, the estimates for the
two periods being 5.0 and 6.4 lakhs respectively. After initial decline of 5 lakhs during
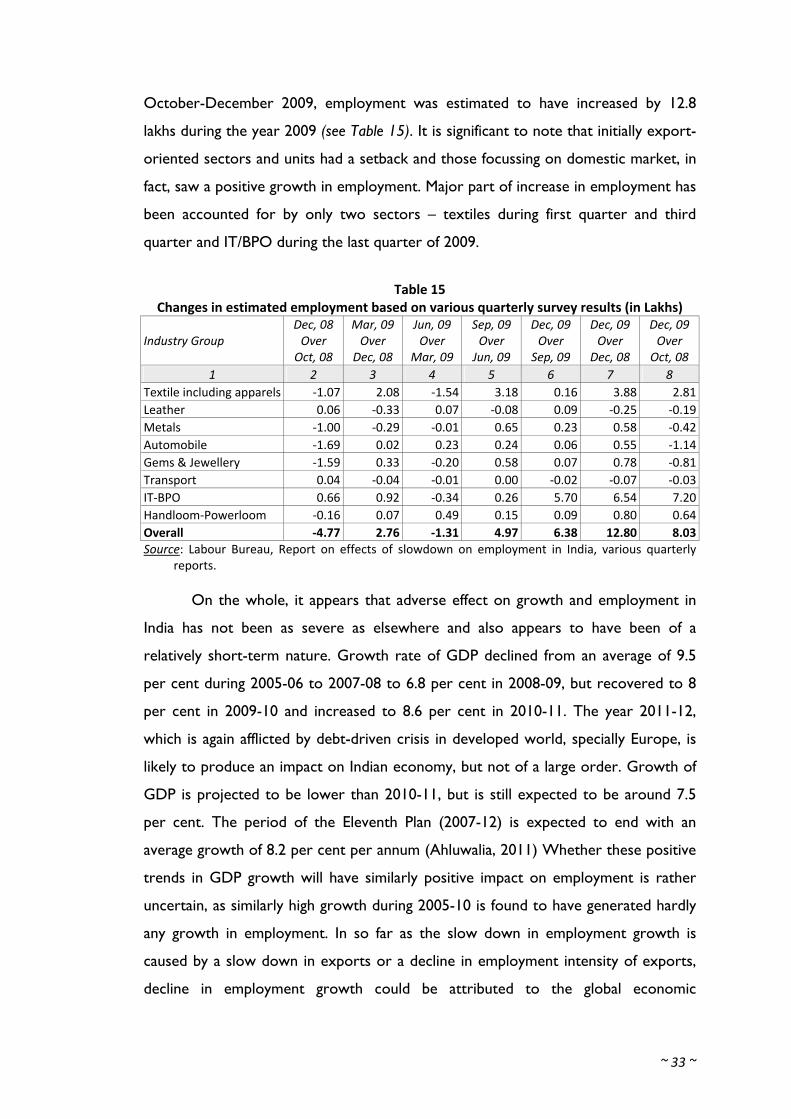
~ 33 ~
October-December 2009, employment was estimated to have increased by 12.8
lakhs during the year 2009 (see Table 15). It is significant to note that initially export-
oriented sectors and units had a setback and those focussing on domestic market, in
fact, saw a positive growth in employment. Major part of increase in employment has
been accounted for by only two sectors – textiles during first quarter and third
quarter and IT/BPO during the last quarter of 2009.
Table 15 Changes in estimated employment based on various quarterly survey results (in Lakhs)
Industry Group
Dec, 08 Over Oct, 08
Mar, 09 Over
Dec, 08
Jun, 09 Over
Mar, 09
Sep, 09 Over Jun, 09
Dec, 09 Over
Sep, 09
Dec, 09 Over
Dec, 08
Dec, 09 Over Oct, 08
1 2 3 4 5 6 7 8 Textile including apparels ‐1.07 2.08 ‐1.54 3.18 0.16 3.88 2.81Leather 0.06 ‐0.33 0.07 ‐0.08 0.09 ‐0.25 ‐0.19Metals ‐1.00 ‐0.29 ‐0.01 0.65 0.23 0.58 ‐0.42Automobile ‐1.69 0.02 0.23 0.24 0.06 0.55 ‐1.14Gems & Jewellery ‐1.59 0.33 ‐0.20 0.58 0.07 0.78 ‐0.81Transport 0.04 ‐0.04 ‐0.01 0.00 ‐0.02 ‐0.07 ‐0.03IT‐BPO 0.66 0.92 ‐0.34 0.26 5.70 6.54 7.20Handloom‐Powerloom ‐0.16 0.07 0.49 0.15 0.09 0.80 0.64Overall ‐4.77 2.76 ‐1.31 4.97 6.38 12.80 8.03Source: Labour Bureau, Report on effects of slowdown on employment in India, various quarterly
reports.
On the whole, it appears that adverse effect on growth and employment in
India has not been as severe as elsewhere and also appears to have been of a
relatively short-term nature. Growth rate of GDP declined from an average of 9.5
per cent during 2005-06 to 2007-08 to 6.8 per cent in 2008-09, but recovered to 8
per cent in 2009-10 and increased to 8.6 per cent in 2010-11. The year 2011-12,
which is again afflicted by debt-driven crisis in developed world, specially Europe, is
likely to produce an impact on Indian economy, but not of a large order. Growth of
GDP is projected to be lower than 2010-11, but is still expected to be around 7.5
per cent. The period of the Eleventh Plan (2007-12) is expected to end with an
average growth of 8.2 per cent per annum (Ahluwalia, 2011) Whether these positive
trends in GDP growth will have similarly positive impact on employment is rather
uncertain, as similarly high growth during 2005-10 is found to have generated hardly
any growth in employment. In so far as the slow down in employment growth is
caused by a slow down in exports or a decline in employment intensity of exports,
decline in employment growth could be attributed to the global economic

~ 34 ~
slowdown. That, however, is only part of the story as the employment intensive
exports contribute a small part to total employment whereas the decline in
employment growth during 2005-10 all sectors of economic activity except
construction.
~ 35 ~
IV. Structure of Employment: Changes and Implications
Any assessment of the employment performance of the Indian Economy is not
meaningful without an analysis of the structural dimensions of employment. These
dimensions define and determine the substantive meaning of employment in terms of
its nature and quality. Only a small segment of the workforce is employed on a
regular basis at reasonable levels of wages and salaries. A large part is self-employed
in agriculture which continues to be the major source of employment and livelihood
for majority of the Indian workers. And an overwhelming majority works in what is
called the unorganised or the informal sector. These qualitative dimensions are, of
course, interrelated and reinforce each other in the direction of keeping the quality
of employment low. We look at these aspects of employment particularly focusing
on the nature and extent of structural changes that have taken place in the recent
decades, in this section.
IV.1 Sectoral Employment Shares
As is well know, majority of Indian workers are engaged in agriculture and
allied activities. With economic development, agriculture is expected to decline in
importance in terms of its share in employment and output. Proportion of
agriculture in total employment has declined over the years: from 74 per cent in
1972-73 to 68 per cent in 1983, 60 per cent in 1993-94 and to 57 per cent in 2004-
05. It has declined further to 51 per cent in 2009-11 (Table 16).
It is particularly important to note that the decline in the employment share
of agriculture has been much slower than the share of gross domestic product
(GDP) from agriculture. Thus, while share of agriculture in GDP declined from 41
per cent in 1972-73 to 15 per cent in 2009-10 (Table 17), that in employment
declined from 74 per cent to 51 per cent. And rate of decline in GDP share has been
faster during 1993-94 to 2009-10, from 30 to 15 per cent; while the rate of decline
in employment share has been relatively slow, from 64 per cent to 51per cent.
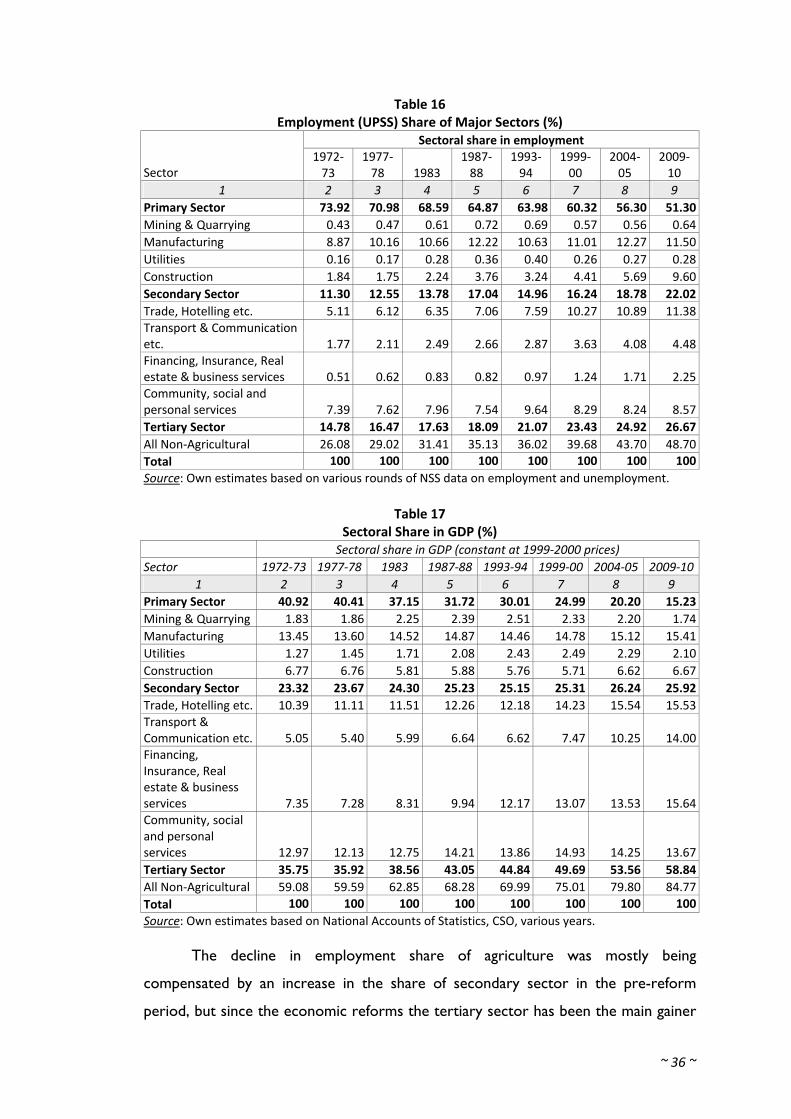
~ 36 ~
Table 16 Employment (UPSS) Share of Major Sectors (%)
Sectoral share in employment
Sector 1972‐73
1977‐78 1983
1987‐88
1993‐94
1999‐00
2004‐05
2009‐10
1 2 3 4 5 6 7 8 9 Primary Sector 73.92 70.98 68.59 64.87 63.98 60.32 56.30 51.30Mining & Quarrying 0.43 0.47 0.61 0.72 0.69 0.57 0.56 0.64Manufacturing 8.87 10.16 10.66 12.22 10.63 11.01 12.27 11.50Utilities 0.16 0.17 0.28 0.36 0.40 0.26 0.27 0.28Construction 1.84 1.75 2.24 3.76 3.24 4.41 5.69 9.60Secondary Sector 11.30 12.55 13.78 17.04 14.96 16.24 18.78 22.02Trade, Hotelling etc. 5.11 6.12 6.35 7.06 7.59 10.27 10.89 11.38Transport & Communication etc. 1.77 2.11 2.49 2.66 2.87 3.63 4.08 4.48Financing, Insurance, Real estate & business services 0.51 0.62 0.83 0.82 0.97 1.24 1.71 2.25Community, social and personal services 7.39 7.62 7.96 7.54 9.64 8.29 8.24 8.57Tertiary Sector 14.78 16.47 17.63 18.09 21.07 23.43 24.92 26.67All Non‐Agricultural 26.08 29.02 31.41 35.13 36.02 39.68 43.70 48.70Total 100 100 100 100 100 100 100 100Source: Own estimates based on various rounds of NSS data on employment and unemployment.
Table 17 Sectoral Share in GDP (%)
Sectoral share in GDP (constant at 1999‐2000 prices) Sector 1972‐73 1977‐78 1983 1987‐88 1993‐94 1999‐00 2004‐05 2009‐10
1 2 3 4 5 6 7 8 9 Primary Sector 40.92 40.41 37.15 31.72 30.01 24.99 20.20 15.23Mining & Quarrying 1.83 1.86 2.25 2.39 2.51 2.33 2.20 1.74Manufacturing 13.45 13.60 14.52 14.87 14.46 14.78 15.12 15.41Utilities 1.27 1.45 1.71 2.08 2.43 2.49 2.29 2.10Construction 6.77 6.76 5.81 5.88 5.76 5.71 6.62 6.67Secondary Sector 23.32 23.67 24.30 25.23 25.15 25.31 26.24 25.92Trade, Hotelling etc. 10.39 11.11 11.51 12.26 12.18 14.23 15.54 15.53Transport & Communication etc. 5.05 5.40 5.99 6.64 6.62 7.47 10.25 14.00Financing, Insurance, Real estate & business services 7.35 7.28 8.31 9.94 12.17 13.07 13.53 15.64Community, social and personal services 12.97 12.13 12.75 14.21 13.86 14.93 14.25 13.67Tertiary Sector 35.75 35.92 38.56 43.05 44.84 49.69 53.56 58.84All Non‐Agricultural 59.08 59.59 62.85 68.28 69.99 75.01 79.80 84.77Total 100 100 100 100 100 100 100 100Source: Own estimates based on National Accounts of Statistics, CSO, various years.
The decline in employment share of agriculture was mostly being
compensated by an increase in the share of secondary sector in the pre-reform
period, but since the economic reforms the tertiary sector has been the main gainer
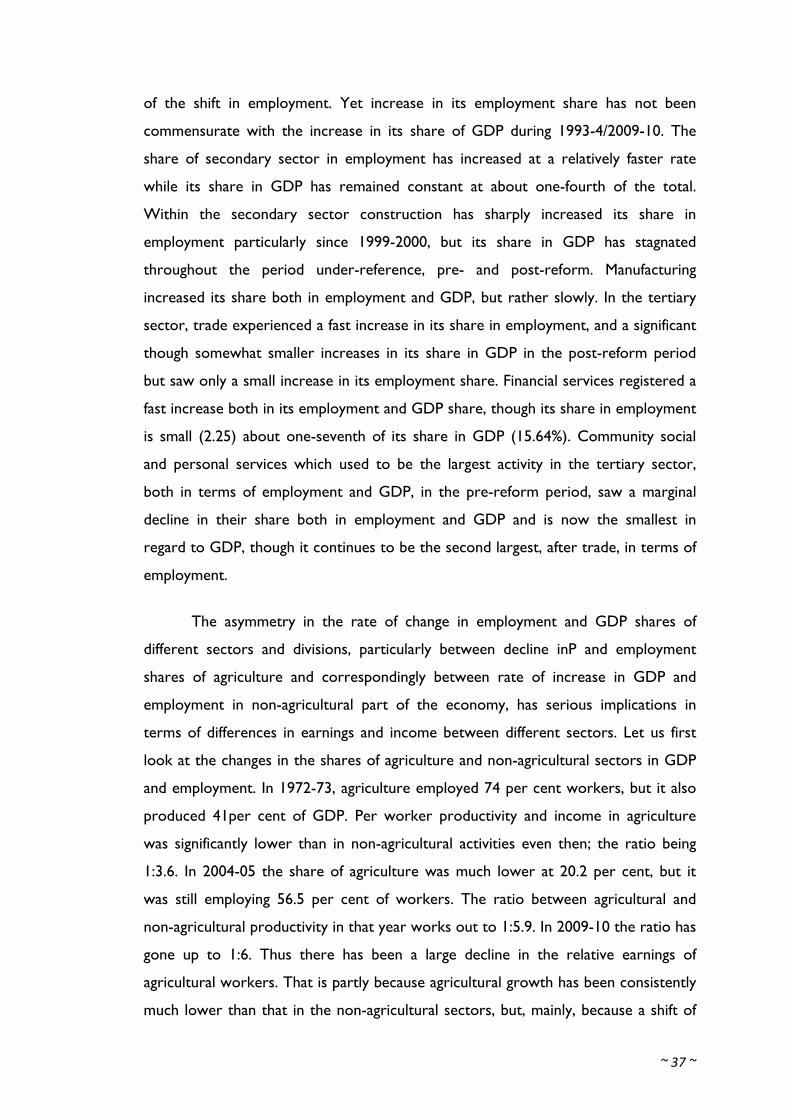
~ 37 ~
of the shift in employment. Yet increase in its employment share has not been
commensurate with the increase in its share of GDP during 1993-4/2009-10. The
share of secondary sector in employment has increased at a relatively faster rate
while its share in GDP has remained constant at about one-fourth of the total.
Within the secondary sector construction has sharply increased its share in
employment particularly since 1999-2000, but its share in GDP has stagnated
throughout the period under-reference, pre- and post-reform. Manufacturing
increased its share both in employment and GDP, but rather slowly. In the tertiary
sector, trade experienced a fast increase in its share in employment, and a significant
though somewhat smaller increases in its share in GDP in the post-reform period
but saw only a small increase in its employment share. Financial services registered a
fast increase both in its employment and GDP share, though its share in employment
is small (2.25) about one-seventh of its share in GDP (15.64%). Community social
and personal services which used to be the largest activity in the tertiary sector,
both in terms of employment and GDP, in the pre-reform period, saw a marginal
decline in their share both in employment and GDP and is now the smallest in
regard to GDP, though it continues to be the second largest, after trade, in terms of
employment.
The asymmetry in the rate of change in employment and GDP shares of
different sectors and divisions, particularly between decline inP and employment
shares of agriculture and correspondingly between rate of increase in GDP and
employment in non-agricultural part of the economy, has serious implications in
terms of differences in earnings and income between different sectors. Let us first
look at the changes in the shares of agriculture and non-agricultural sectors in GDP
and employment. In 1972-73, agriculture employed 74 per cent workers, but it also
produced 41per cent of GDP. Per worker productivity and income in agriculture
was significantly lower than in non-agricultural activities even then; the ratio being
1:3.6. In 2004-05 the share of agriculture was much lower at 20.2 per cent, but it
was still employing 56.5 per cent of workers. The ratio between agricultural and
non-agricultural productivity in that year works out to 1:5.9. In 2009-10 the ratio has
gone up to 1:6. Thus there has been a large decline in the relative earnings of
agricultural workers. That is partly because agricultural growth has been consistently
much lower than that in the non-agricultural sectors, but, mainly, because a shift of
~ 38 ~
workers from agricultural to non-agricultural activities as expected in the process of
economic development has not taken place. Agriculture has grown at an average rate
of 2 to 3 per cent per annum as against 5 to 6.5 per cent growth in the non-
agricultural sector during the period under consideration. It is not generally realistic
to expect a much higher growth rate in agriculture. But even if it grew at a rate of
about 4 per cent per annum, as envisaged in the Eleventh Plan, it cannot employ
many more persons productively. In fact, productivity per worker in agriculture is so
low that even with a higher growth rate, it would need to reduce its workforce so as
to provide a reasonable level of income to those engaged in it. It is precisely for this
reason that the Planning Commission projected no increase in the number of
workers in agriculture during the Eleventh Plan (2007-12) and a decline of 4 million
during the Twelfth Plan period (2012-17). (Planning Commission, 2008, Vol. I, pp. 76-
77).
In other words, new jobs that are required to be created are not likely to be
in agriculture, they have to come from the non-agricultural sectors. In a 25 to 30
years perspective, employment structure must be envisioned as consisting of about
30-35 per cent in agriculture and 70-75 per cent in non-agricultural activities as
against of 51 per cent in agriculture and 49 per cent in non-agriculture in 2004-05. It
would imply that all the new employment opportunities will be located in non-
agricultural activities in the coming years.
IV.2 Employment Categories
The concept of employment is commonly understood to mean a job with a
wage or salary. In India, major part of employment, however, consists of self-
employment. Even though the share of this category in total employment has been
declining, as is expected in the process of modern economic development, it still
accounts for majority of workers. In 2009-10, the self-employed accounted for 50.6
per cent of the total employed persons. It has declined continuously from 61.4 per
cent in 1972-73 to 52.6 per cent in 1999-2000, but showed an increase to 56.5 per
cent in 2004-05. Estimates based on NSSO survey for 2009-10, however, shows a
resumption of the long-term declining trend (Table 18).
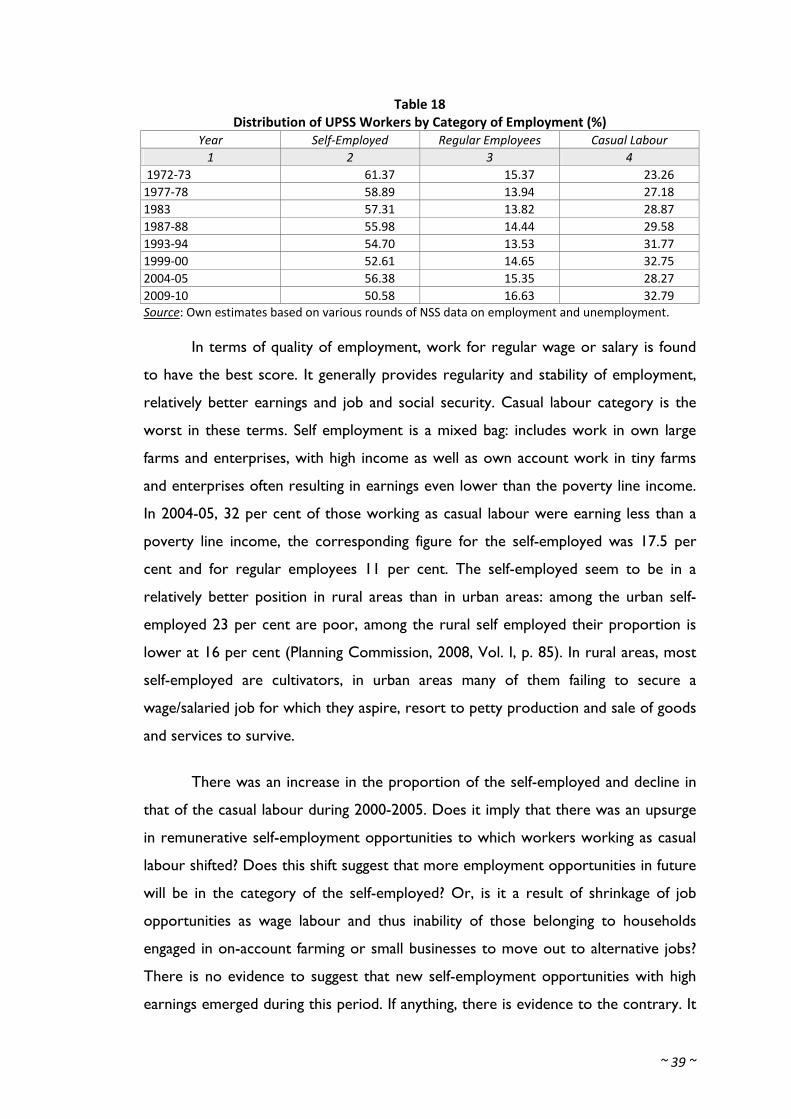
~ 39 ~
Table 18 Distribution of UPSS Workers by Category of Employment (%)
Year Self‐Employed Regular Employees Casual Labour 1 2 3 4
1972‐73 61.37 15.37 23.26 1977‐78 58.89 13.94 27.18 1983 57.31 13.82 28.87 1987‐88 55.98 14.44 29.58 1993‐94 54.70 13.53 31.77 1999‐00 52.61 14.65 32.75 2004‐05 56.38 15.35 28.27 2009‐10 50.58 16.63 32.79 Source: Own estimates based on various rounds of NSS data on employment and unemployment.
In terms of quality of employment, work for regular wage or salary is found
to have the best score. It generally provides regularity and stability of employment,
relatively better earnings and job and social security. Casual labour category is the
worst in these terms. Self employment is a mixed bag: includes work in own large
farms and enterprises, with high income as well as own account work in tiny farms
and enterprises often resulting in earnings even lower than the poverty line income.
In 2004-05, 32 per cent of those working as casual labour were earning less than a
poverty line income, the corresponding figure for the self-employed was 17.5 per
cent and for regular employees 11 per cent. The self-employed seem to be in a
relatively better position in rural areas than in urban areas: among the urban self-
employed 23 per cent are poor, among the rural self employed their proportion is
lower at 16 per cent (Planning Commission, 2008, Vol. I, p. 85). In rural areas, most
self-employed are cultivators, in urban areas many of them failing to secure a
wage/salaried job for which they aspire, resort to petty production and sale of goods
and services to survive.
There was an increase in the proportion of the self-employed and decline in
that of the casual labour during 2000-2005. Does it imply that there was an upsurge
in remunerative self-employment opportunities to which workers working as casual
labour shifted? Does this shift suggest that more employment opportunities in future
will be in the category of the self-employed? Or, is it a result of shrinkage of job
opportunities as wage labour and thus inability of those belonging to households
engaged in on-account farming or small businesses to move out to alternative jobs?
There is no evidence to suggest that new self-employment opportunities with high
earnings emerged during this period. If anything, there is evidence to the contrary. It
~ 40 ~
is observed that a large number of on-account enterprises in the unorganised
manufacturing sector closed down resulting in loss of 1.4 million jobs, mostly in the
self-employment category during 2000-2005. appears that the increase in the
proportion of self-employed was primarily a result of the inability of workers getting
added to farming households to find wage labour in agriculture or move out to non-
agricultural wage employment. They may not have necessarily been needed to work
on their farms but were not able to get productive employment elsewhere.
Plausibility of this explanation is established by the fact that the increase in self-
employment category was mainly accounted for by agriculture. It increased from 58
per cent in 1999-2000 to 64 per cent in 2004-2005 in agriculture while increase in
self-employment was from 45 to 46 per cent only in the non-agricultural activities.
Estimates based on the data from the 66th round (2009-10) of NSSO Survey
suggest that the picture emerging from the survey for 2004-05 was an aberration in
the long term trend in the changes in workforce structure by employment
categories. They show a resumption of the trend of a decline in the share of the self-
employed and an increase in that of the casual labour. In other words, a
deterioration in the quality of employment in aggregate continues. Even a different
trend during 1999-2000/2004-05 did not necessarily reflect any improvement as
argued above. But the continuation of an increase in the share of casual labour
directly testifies to the deterioration. It is, however, to be noted that a gradual
increase in the share of regular employees in the post-reform period promises to
deter this trend to howsoever small an extent.
IV.3 Organised Versus Unorganised Sector Employment
Organised or formal sector is defined to consist of the entire public sector
and the private sector enterprises employing 10 or more workers. It accounted for
only about 14 per cent of total employment in 1999-2000 as also in 2004-05. The
proportion is found to have slightly increased to 16 per cent in 2009-10. Still that
leaves 84 per cent of workers in the ‘unorganised’ or ‘informal’ sector, with no job
security or social security. Even in the formal sector, over half the workers are in
‘informal’ category, with no secured tenure of employment, nor any protection
against the contingent risks during or after employment. What is further distressing
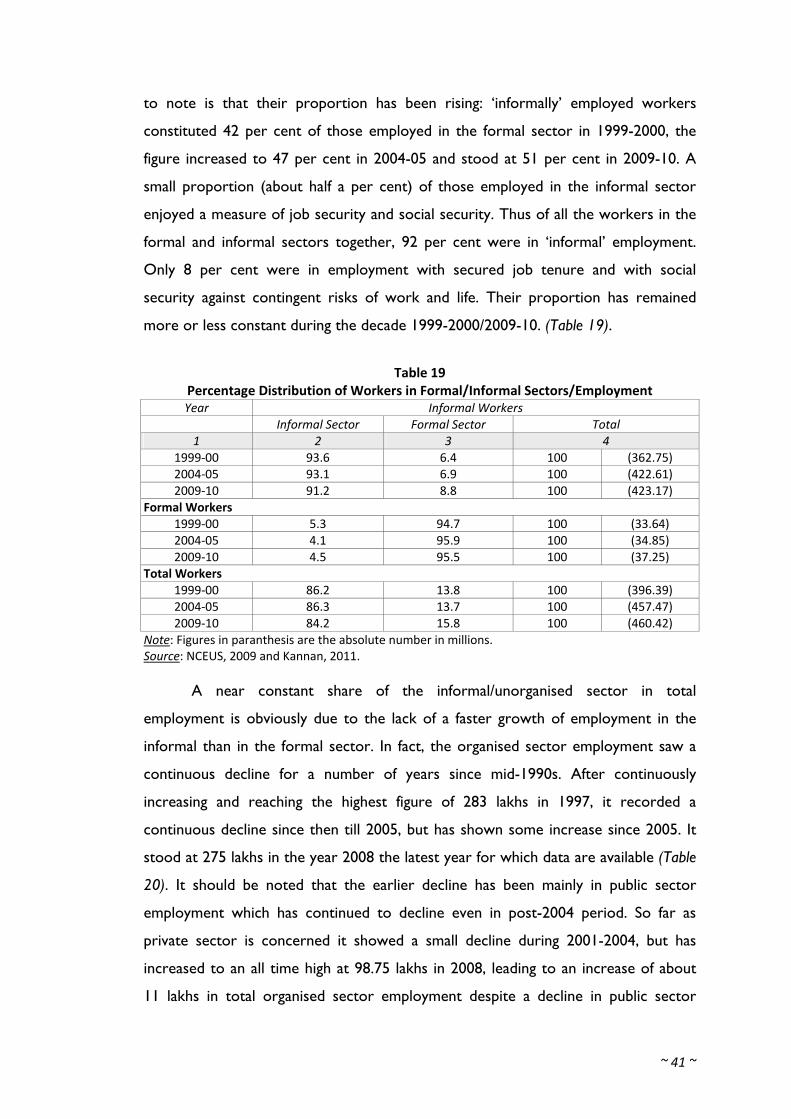
~ 41 ~
to note is that their proportion has been rising: ‘informally’ employed workers
constituted 42 per cent of those employed in the formal sector in 1999-2000, the
figure increased to 47 per cent in 2004-05 and stood at 51 per cent in 2009-10. A
small proportion (about half a per cent) of those employed in the informal sector
enjoyed a measure of job security and social security. Thus of all the workers in the
formal and informal sectors together, 92 per cent were in ‘informal’ employment.
Only 8 per cent were in employment with secured job tenure and with social
security against contingent risks of work and life. Their proportion has remained
more or less constant during the decade 1999-2000/2009-10. (Table 19).
Table 19 Percentage Distribution of Workers in Formal/Informal Sectors/Employment Year Informal Workers
Informal Sector Formal Sector Total 1 2 3 4
1999‐00 93.6 6.4 100 (362.75) 2004‐05 93.1 6.9 100 (422.61) 2009‐10 91.2 8.8 100 (423.17)
Formal Workers 1999‐00 5.3 94.7 100 (33.64) 2004‐05 4.1 95.9 100 (34.85) 2009‐10 4.5 95.5 100 (37.25)
Total Workers 1999‐00 86.2 13.8 100 (396.39) 2004‐05 86.3 13.7 100 (457.47) 2009‐10 84.2 15.8 100 (460.42)
Note: Figures in paranthesis are the absolute number in millions. Source: NCEUS, 2009 and Kannan, 2011.
A near constant share of the informal/unorganised sector in total
employment is obviously due to the lack of a faster growth of employment in the
informal than in the formal sector. In fact, the organised sector employment saw a
continuous decline for a number of years since mid-1990s. After continuously
increasing and reaching the highest figure of 283 lakhs in 1997, it recorded a
continuous decline since then till 2005, but has shown some increase since 2005. It
stood at 275 lakhs in the year 2008 the latest year for which data are available (Table
20). It should be noted that the earlier decline has been mainly in public sector
employment which has continued to decline even in post-2004 period. So far as
private sector is concerned it showed a small decline during 2001-2004, but has
increased to an all time high at 98.75 lakhs in 2008, leading to an increase of about
11 lakhs in total organised sector employment despite a decline in public sector
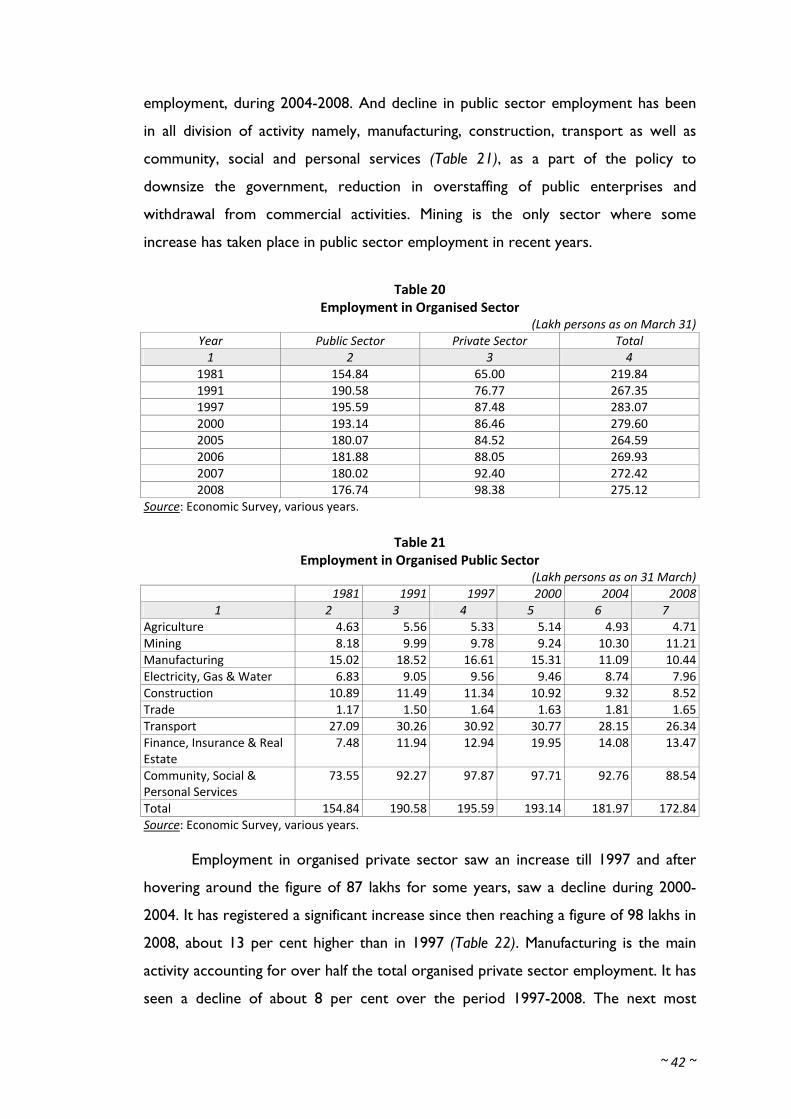
~ 42 ~
employment, during 2004-2008. And decline in public sector employment has been
in all division of activity namely, manufacturing, construction, transport as well as
community, social and personal services (Table 21), as a part of the policy to
downsize the government, reduction in overstaffing of public enterprises and
withdrawal from commercial activities. Mining is the only sector where some
increase has taken place in public sector employment in recent years.
Table 20 Employment in Organised Sector
(Lakh persons as on March 31) Year Public Sector Private Sector Total 1 2 3 4
1981 154.84 65.00 219.84 1991 190.58 76.77 267.35 1997 195.59 87.48 283.07 2000 193.14 86.46 279.60 2005 180.07 84.52 264.59 2006 181.88 88.05 269.93 2007 180.02 92.40 272.42 2008 176.74 98.38 275.12
Source: Economic Survey, various years.
Table 21 Employment in Organised Public Sector
(Lakh persons as on 31 March) 1981 1991 1997 2000 2004 2008
1 2 3 4 5 6 7 Agriculture 4.63 5.56 5.33 5.14 4.93 4.71Mining 8.18 9.99 9.78 9.24 10.30 11.21Manufacturing 15.02 18.52 16.61 15.31 11.09 10.44Electricity, Gas & Water 6.83 9.05 9.56 9.46 8.74 7.96Construction 10.89 11.49 11.34 10.92 9.32 8.52Trade 1.17 1.50 1.64 1.63 1.81 1.65Transport 27.09 30.26 30.92 30.77 28.15 26.34Finance, Insurance & Real Estate
7.48 11.94 12.94 19.95 14.08 13.47
Community, Social & Personal Services
73.55 92.27 97.87 97.71 92.76 88.54
Total 154.84 190.58 195.59 193.14 181.97 172.84Source: Economic Survey, various years.
Employment in organised private sector saw an increase till 1997 and after
hovering around the figure of 87 lakhs for some years, saw a decline during 2000-
2004. It has registered a significant increase since then reaching a figure of 98 lakhs in
2008, about 13 per cent higher than in 1997 (Table 22). Manufacturing is the main
activity accounting for over half the total organised private sector employment. It has
seen a decline of about 8 per cent over the period 1997-2008. The next most
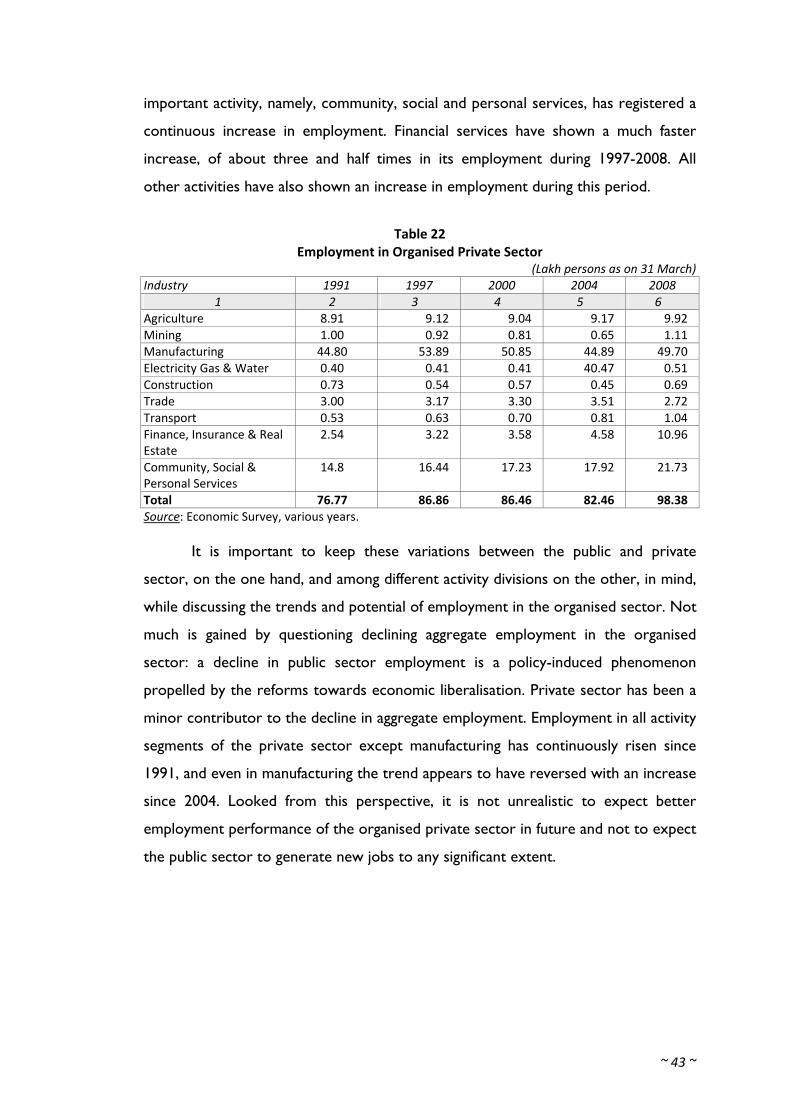
~ 43 ~
important activity, namely, community, social and personal services, has registered a
continuous increase in employment. Financial services have shown a much faster
increase, of about three and half times in its employment during 1997-2008. All
other activities have also shown an increase in employment during this period.
Table 22 Employment in Organised Private Sector
(Lakh persons as on 31 March) Industry 1991 1997 2000 2004 2008
1 2 3 4 5 6 Agriculture 8.91 9.12 9.04 9.17 9.92 Mining 1.00 0.92 0.81 0.65 1.11 Manufacturing 44.80 53.89 50.85 44.89 49.70 Electricity Gas & Water 0.40 0.41 0.41 40.47 0.51 Construction 0.73 0.54 0.57 0.45 0.69 Trade 3.00 3.17 3.30 3.51 2.72 Transport 0.53 0.63 0.70 0.81 1.04 Finance, Insurance & Real Estate
2.54 3.22 3.58 4.58 10.96
Community, Social & Personal Services
14.8 16.44 17.23 17.92 21.73
Total 76.77 86.86 86.46 82.46 98.38 Source: Economic Survey, various years.
It is important to keep these variations between the public and private
sector, on the one hand, and among different activity divisions on the other, in mind,
while discussing the trends and potential of employment in the organised sector. Not
much is gained by questioning declining aggregate employment in the organised
sector: a decline in public sector employment is a policy-induced phenomenon
propelled by the reforms towards economic liberalisation. Private sector has been a
minor contributor to the decline in aggregate employment. Employment in all activity
segments of the private sector except manufacturing has continuously risen since
1991, and even in manufacturing the trend appears to have reversed with an increase
since 2004. Looked from this perspective, it is not unrealistic to expect better
employment performance of the organised private sector in future and not to expect
the public sector to generate new jobs to any significant extent.
~ 44 ~
V. The Employment Challenge: Quantitative Dimensions
The dynamics of employment growth specially in relation to economic growth and
juxtaposed with the growth and changing composition or labour force, on the one
hand, and composition and structural changes in employment, on the other, as
described in preceding sections makes an assessment of the problem of employment
that India faces, a difficult task. The employment problem has both quantitative and
qualitative dimensions. In quantitative terms, it is indicated by the magnitude of
employment opportunities that need to be generated over a period of time so that
everyone available and looking for work is able to secure it. It consists of two elements:
the number of unemployed in the initial period and additions that take place to labour
force over the period under consideration. The former is arrived at on the basis of
prevalent rate of unemployment and the latter by applying the expected labour force
participation rate on the projected population figures.
V.1 Unemployment Rates
Unemployment rates measured by different criteria are found to be quite low
in India and have not changed much over the years. Measured as unemployed
persons as percentage of labour force they varied between 2.09 percent among all
workers (main and subsidiary) on a yearly reference period to 3.61 on a weekly
reference period, in 2009-10, the latest year for which data are available (Table 23).
In terms of persondays of unemployment the estimates are higher at 6.52 percent.
But that includes unemployment days not only of those completely unemployed
during the week, but also of those among the employed who are unemployed for
different length of time, from half day onwards during the reference week.
These rates seem to have maintained a remarkable stability over the years.
The UPS rate has in fact, shown a decline; so, it was around 4 per cent during 1970’s
and 1980’s, around 3 per cent during 1990’s but has declined to lowest ever of 2.5
per cent in 2009-10 UPSS rate has mostly fluctuated between 2 and 2.5 per cent.
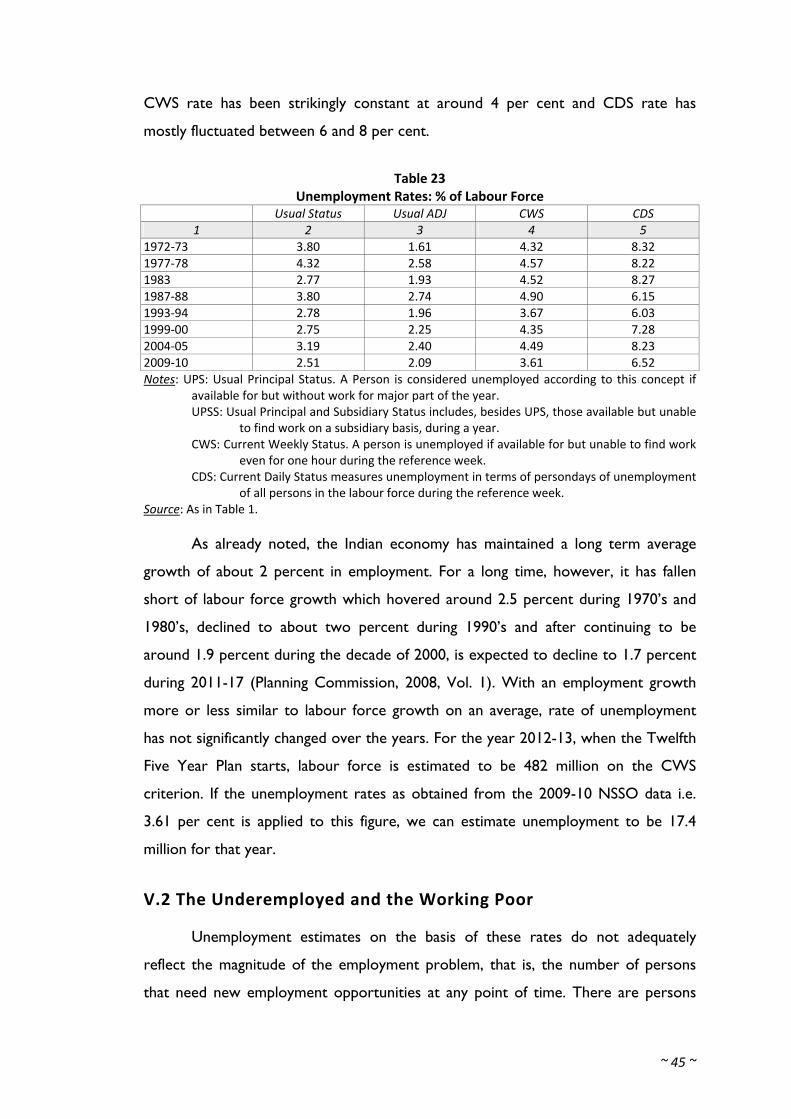
~ 45 ~
CWS rate has been strikingly constant at around 4 per cent and CDS rate has
mostly fluctuated between 6 and 8 per cent.
Table 23 Unemployment Rates: % of Labour Force
Usual Status Usual ADJ CWS CDS 1 2 3 4 5
1972‐73 3.80 1.61 4.32 8.32 1977‐78 4.32 2.58 4.57 8.22 1983 2.77 1.93 4.52 8.27 1987‐88 3.80 2.74 4.90 6.15 1993‐94 2.78 1.96 3.67 6.03 1999‐00 2.75 2.25 4.35 7.28 2004‐05 3.19 2.40 4.49 8.23 2009‐10 2.51 2.09 3.61 6.52 Notes: UPS: Usual Principal Status. A Person is considered unemployed according to this concept if
available for but without work for major part of the year. UPSS: Usual Principal and Subsidiary Status includes, besides UPS, those available but unable
to find work on a subsidiary basis, during a year. CWS: Current Weekly Status. A person is unemployed if available for but unable to find work
even for one hour during the reference week. CDS: Current Daily Status measures unemployment in terms of persondays of unemployment
of all persons in the labour force during the reference week. Source: As in Table 1.
As already noted, the Indian economy has maintained a long term average
growth of about 2 percent in employment. For a long time, however, it has fallen
short of labour force growth which hovered around 2.5 percent during 1970’s and
1980’s, declined to about two percent during 1990’s and after continuing to be
around 1.9 percent during the decade of 2000, is expected to decline to 1.7 percent
during 2011-17 (Planning Commission, 2008, Vol. 1). With an employment growth
more or less similar to labour force growth on an average, rate of unemployment
has not significantly changed over the years. For the year 2012-13, when the Twelfth
Five Year Plan starts, labour force is estimated to be 482 million on the CWS
criterion. If the unemployment rates as obtained from the 2009-10 NSSO data i.e.
3.61 per cent is applied to this figure, we can estimate unemployment to be 17.4
million for that year.
V.2 The Underemployed and the Working Poor
Unemployment estimates on the basis of these rates do not adequately
reflect the magnitude of the employment problem, that is, the number of persons
that need new employment opportunities at any point of time. There are persons
~ 46 ~
recorded as employed but are ‘severely’ underemployed, having work only for a
minor part of the time. And then there are ‘working poor’ who are employed but
are able to earn only a fraction of what is regarded as minimum necessary to
overcome poverty. This category forms a large proportion of ‘employed’ worker:
was estimated to be about 20 per cent in 1999-2000 and 21 per cent in 2004-05 and
in fact, constitutes the core part of the employment problem in India (Ghose, 2004).
In case of the former category of workers their present activity (wage-labour or self-
employment) is not able to provide them closer to full time work; while in the case
of the latter, it may be engaging them more or less full time, but is not productive
enough to generate even subsistence level income nor is it likely to become so due
to the declining market for their products. A large number of workers are engaged
in production of goods and services which face a negative income elasticity of
demand due to their ‘inferior’ nature and replacement by ‘modern’, and often
cheaper, products. Products of traditional village and cottage industries would, by
and large, fall in this category. And the number of persons engaged in these
industries is quite large.
It is not possible to precisely estimate the number of workers who are in
need of alternative employment due to either of the above reasons, because of non-
availability of relevant data. Some rough estimates can, however, be made with
certain assumptions, on the basis of available data. It may be assumed that those
having work for less than half the time (e.g. less than 3 days in a week) are “severely
underemployed”, and in need of alternative employment. Similarly, those earning less
than one-half of the poverty line income may be regarded as ‘working ultra-poor’
also in need of alternative employment. An exercise on the basis of these
assumptions placed the estimate of those in need of employment in 2007 at about 58
million, and not just 21.6 million estimated as unemployed (Papola and Sahu, 2008).
Results of the exercise are summarised in the Box 1 below.
There could be some overlap between the category of ‘severely
underemployed’ (estimated at 10.5 million) and ‘employed ultra-poor’ (26.0 million),
which could be corrected by including only the ‘fully employed’ in the later, if data
availability permitted. But the argument that employment problem at any point of
~ 47 ~
time is of a much larger magnitude than reflected in the conventional estimates of
unemployment, holds.
V.3 Growth of Labour Force
The other component of the quantitative dimension of the employment
problem consists of the increase in labour force. Growth rate of labour force
depends on the growth of population (in earlier periods) and labour force
participation rate (LFPR). Population growth in India has been relatively high but has
slowed down since 1990’s. It was 2.32 per annum during 1961-71, 2.22 during 1971-
81 and 2.14 during 1981-91; but the decade 1991-2001 saw a significant decline in
the growth rate to 1.93 and the last census conducted during March 2011, reports a
growth-rate of 1.76 per cent during 2001-2011. Estimates of population growth for
the periods corresponding to NSSO surveys on employment and unemployment are:
2.11 per cent for 1983 to 1993-94, 1.98 for 1993-94 to 1999-2000, 1.69 for 1999-
2000 to 2004-05, and 1.68 per cent for the decade of 1993-94 to 2004-05. For the
period 2004-05 to 2009-10, it estimates at 1.70 per cent. Growth of labour force
during these four periods has been 2.28, 1.47 and 2.84 and 2.09 per cent per annum
respectively. Labour force growth during 2004-05/2009-10 is recorded to be virtually
zero due to a steep fall in LFPR.
Such sharp fluctuations in the growth of labour force are a result of changes
in LFPR, either real or caused by conceptual and survey problems. The long-term
trend in participation rates over the last three decades has been one of a decline.
(Table 24). It was about 43 in 1983, declined to 42.7 and 40.5 in 1993-94 and 1999-
2000, but saw an increase to 42.9 per cent in 2004-05. In 2009-10 it is estimated to
Box 1 Employment Challenge 2007‐2012
a) Unemployed – 4.5% of the Labour Force (CWS) = 479.6 X 0.045 = 21.6 million b) Severely Under Employed – 2.3% of the Work force = 457.9 X 0.023 = 10.5 million c) Working Poor in need of alternative employment = 26.0 million d) Persons needing employment as in the beginning of the year 2007(a+b+c) = 58.1
million e) Additions to Labour Force – 1.8% per year = 479.6 X 0.018 X 5 = 44.7 million f) Persons looking for employment during the 5‐year period 2007‐2012(d+e) = 102.8
million Total = 76.8 Million
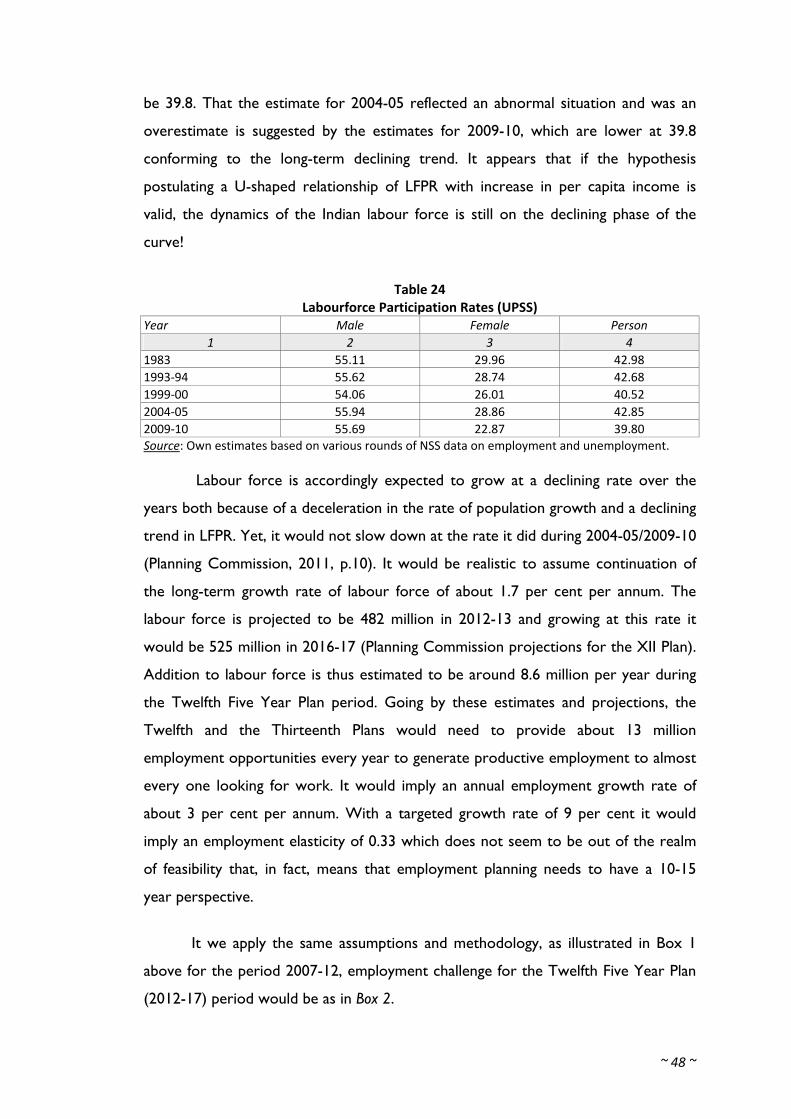
~ 48 ~
be 39.8. That the estimate for 2004-05 reflected an abnormal situation and was an
overestimate is suggested by the estimates for 2009-10, which are lower at 39.8
conforming to the long-term declining trend. It appears that if the hypothesis
postulating a U-shaped relationship of LFPR with increase in per capita income is
valid, the dynamics of the Indian labour force is still on the declining phase of the
curve!
Table 24 Labourforce Participation Rates (UPSS)
Year Male Female Person 1 2 3 4
1983 55.11 29.96 42.98 1993‐94 55.62 28.74 42.68 1999‐00 54.06 26.01 40.52 2004‐05 55.94 28.86 42.85 2009‐10 55.69 22.87 39.80 Source: Own estimates based on various rounds of NSS data on employment and unemployment.
Labour force is accordingly expected to grow at a declining rate over the
years both because of a deceleration in the rate of population growth and a declining
trend in LFPR. Yet, it would not slow down at the rate it did during 2004-05/2009-10
(Planning Commission, 2011, p.10). It would be realistic to assume continuation of
the long-term growth rate of labour force of about 1.7 per cent per annum. The
labour force is projected to be 482 million in 2012-13 and growing at this rate it
would be 525 million in 2016-17 (Planning Commission projections for the XII Plan).
Addition to labour force is thus estimated to be around 8.6 million per year during
the Twelfth Five Year Plan period. Going by these estimates and projections, the
Twelfth and the Thirteenth Plans would need to provide about 13 million
employment opportunities every year to generate productive employment to almost
every one looking for work. It would imply an annual employment growth rate of
about 3 per cent per annum. With a targeted growth rate of 9 per cent it would
imply an employment elasticity of 0.33 which does not seem to be out of the realm
of feasibility that, in fact, means that employment planning needs to have a 10-15
year perspective.
It we apply the same assumptions and methodology, as illustrated in Box 1
above for the period 2007-12, employment challenge for the Twelfth Five Year Plan
(2012-17) period would be as in Box 2.

~ 49 ~
Box 2 Employment Challenge 2012‐2017 (An Illustrative Exercise)
a) Unemployment as in April 2012 (CWS) ‐ 3.61% of the Labour force = (482 million) =17.4 million
b) Severely Under Employed – 2.3% of the work force (464.64 million) =10.69 million c) Working ‘ultra‐poor – 5% of the workforce = 23.25 million d) Persons needing employment in the beginning of the period =( a+b+c) = 51.35 million e) Additions to Labour force, 2012 – 2017 = 43 million f) Persons looking for employment during the 5‐year period: (d+e) = 94 million
~ 50 ~
VI. The Employment Challenge: Qualitative Dimension
Relatively low unemployment rates and declining labour force participation rates and
consequent slowdown in growth of labour force have sometimes prompted the
policy makers to believe that the employment challenge in India consists not so much
of the quantity as of the quality of employment. Thus, the Economic Advisory
Council (EAC) to the Prime Minister in one of its reports in 2007 reckoned that by
2010, workforce would become equal to labour force, thus eliminating the problem
of unemployment in terms of numbers; the quality of employment in terms of
productivity, particularly in agriculture and the informal sector would be the new
challenge (EAC, 2007). The Eleventh Five Year Plan (2007-2012) document, even
while emphasizing employment as an element of its strategy for ‘inclusive growth’
and targeting creation of 58 million employment opportunities, against an addition of
45 million in the labour force, primarily focused on the improvement in the quality of
employment in its substantive part (Planning Commission, 2008).
Such an assessment regarding the quantitative dimension of the employment
challenge was not realistic due to the following two reasons. One, the growth rate of
employment over the recent past five years has not been as high as assumed or
envisaged: it has, in fact, been virtually insignificant, going by the estimates based on
2009-10 NSSO survey. The Eleventh Plan envisaged a 2.73 per cent growth in
employment during 2007-12; it is likely to be lower due to the lower growth (8 per
cent) of GDP than targeted (9 per cent) and also due to adverse employment effects
of global financial crisis in 2008 and the ongoing global economic slowdown in 2011.
Second, and more important reason for underestimation of quantitative challenge
lies in assuming that the challenge at any point of time is confined to the magnitude
of unemployment as recorded. A much larger number of persons are in need of
alternative employment, as explained earlier.
~ 51 ~
VI.1 Quality Deficit: Earnings
The quantitative challenge of employment creation is thus much larger than
commonly understood. But the qualitative dimension of the employment challenge is
as much if not more, serious as the need to create new jobs. Even if all those
unemployed, severely under-employed and working ‘ultra–poor’ are counted as
candidates for new jobs, the number still estimates to about 12 per cent of the
labour force. But, over one-fifth of those employed are poor. One reason for
poverty among the employed workers could be that they do not have full time work.
Those severely underemployed may need alternative employment, as argued earlier.
But others may have the potential of raising their income by working full time in
their present activity or in supplementary work in other activities. Additional work
can also be provided in government funded employment programmes like under the
Mahatma Gandhi National Rural Employment Guarantee Act (MGNREGA) to
alleviate their current poverty. Degree of underemployment as revealed by the data
from surveys on employment and unemployment is one measure of lack of regularity
of employment. According to the data for 2004-05, about 4 per cent of all the
persondays of those in the labour force belonged to those employed (out of over 8
per cent for all – employed and unemployed). But in the case of some worker
groups under-employment is quite high. For example, agricultural labourers were
reported to be in the labour force on an average for 312 days out of which they
were unemployed for 51 days, in 2004-05, making the persondays of unemployment
(or underemployment) to be 16 per cent.
But most often the reason for poverty amongst the employed lies in low
earning out of their work-either on a self-employed, or wage/salary basis. Data on
earnings of the self-employed are not available, but according to a survey among
farmers who constitute the majority among the self-employed about 48 per cent
earned on an average less than the poverty line expenditure of Rs1,800 per month in
2003 (NSSO, 2005, Bhalla, 2006, Papola, 2010). Average daily earnings of casual
workers constituting 31 per cent of all workers and were estimated to be Rs 49 in
rural and Rs 58 in urban areas as against per capita per day income of Rs 64 for the
entire population in 2004-05. Earnings of a regular worker were relatively higher at
Rs 134 in rural and Rs 194 in urban areas. Average daily earnings of casual workers
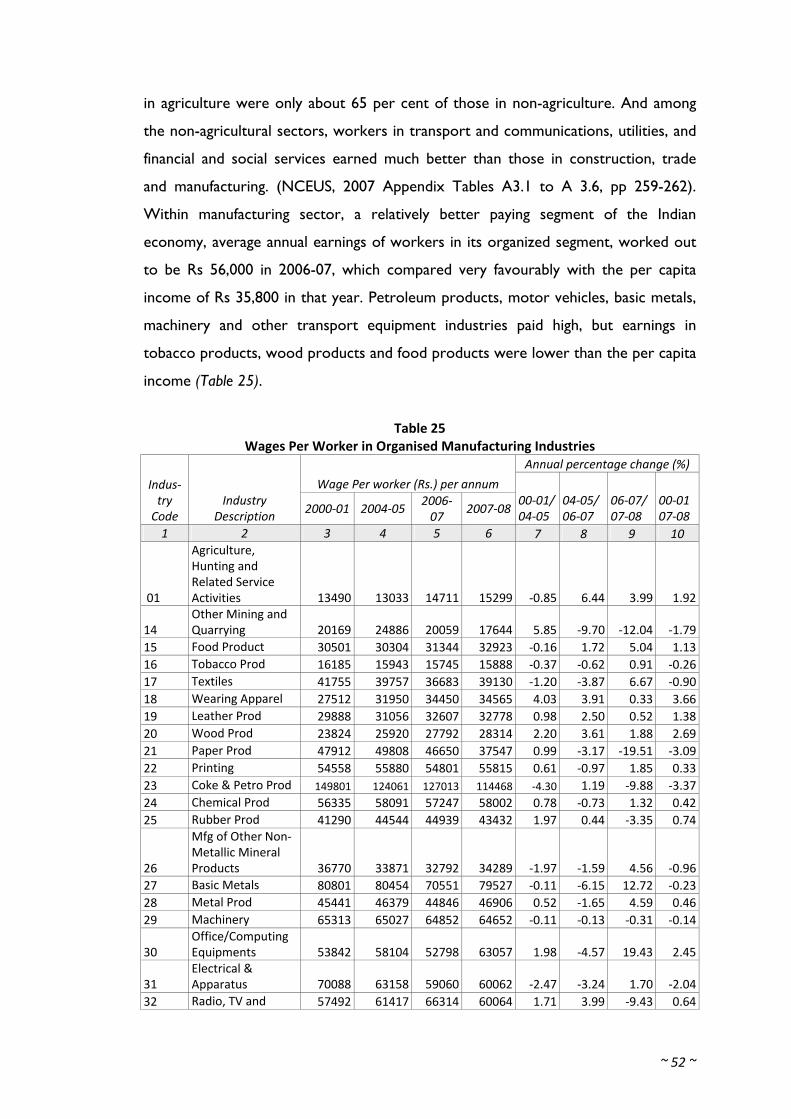
~ 52 ~
in agriculture were only about 65 per cent of those in non-agriculture. And among
the non-agricultural sectors, workers in transport and communications, utilities, and
financial and social services earned much better than those in construction, trade
and manufacturing. (NCEUS, 2007 Appendix Tables A3.1 to A 3.6, pp 259-262).
Within manufacturing sector, a relatively better paying segment of the Indian
economy, average annual earnings of workers in its organized segment, worked out
to be Rs 56,000 in 2006-07, which compared very favourably with the per capita
income of Rs 35,800 in that year. Petroleum products, motor vehicles, basic metals,
machinery and other transport equipment industries paid high, but earnings in
tobacco products, wood products and food products were lower than the per capita
income (Table 25).
Table 25 Wages Per Worker in Organised Manufacturing Industries
Annual percentage change (%)
Wage Per worker (Rs.) per annum Indus‐try Code
Industry Description 2000‐01 2004‐05
2006‐07
2007‐0800‐01/04‐05
04‐05/ 06‐07
06‐07/ 07‐08
00‐01 07‐08
1 2 3 4 5 6 7 8 9 10
01
Agriculture, Hunting and Related Service Activities 13490 13033 14711 15299 ‐0.85 6.44 3.99 1.92
14 Other Mining and Quarrying 20169 24886 20059 17644 5.85 ‐9.70 ‐12.04 ‐1.79
15 Food Product 30501 30304 31344 32923 ‐0.16 1.72 5.04 1.1316 Tobacco Prod 16185 15943 15745 15888 ‐0.37 ‐0.62 0.91 ‐0.2617 Textiles 41755 39757 36683 39130 ‐1.20 ‐3.87 6.67 ‐0.9018 Wearing Apparel 27512 31950 34450 34565 4.03 3.91 0.33 3.6619 Leather Prod 29888 31056 32607 32778 0.98 2.50 0.52 1.3820 Wood Prod 23824 25920 27792 28314 2.20 3.61 1.88 2.6921 Paper Prod 47912 49808 46650 37547 0.99 ‐3.17 ‐19.51 ‐3.0922 Printing 54558 55880 54801 55815 0.61 ‐0.97 1.85 0.3323 Coke & Petro Prod 149801 124061 127013 114468 ‐4.30 1.19 ‐9.88 ‐3.3724 Chemical Prod 56335 58091 57247 58002 0.78 ‐0.73 1.32 0.4225 Rubber Prod 41290 44544 44939 43432 1.97 0.44 ‐3.35 0.74
26
Mfg of Other Non‐Metallic Mineral Products 36770 33871 32792 34289 ‐1.97 ‐1.59 4.56 ‐0.96
27 Basic Metals 80801 80454 70551 79527 ‐0.11 ‐6.15 12.72 ‐0.2328 Metal Prod 45441 46379 44846 46906 0.52 ‐1.65 4.59 0.4629 Machinery 65313 65027 64852 64652 ‐0.11 ‐0.13 ‐0.31 ‐0.14
30 Office/Computing Equipments 53842 58104 52798 63057 1.98 ‐4.57 19.43 2.45
31 Electrical & Apparatus 70088 63158 59060 60062 ‐2.47 ‐3.24 1.70 ‐2.04
32 Radio, TV and 57492 61417 66314 60064 1.71 3.99 ‐9.43 0.64
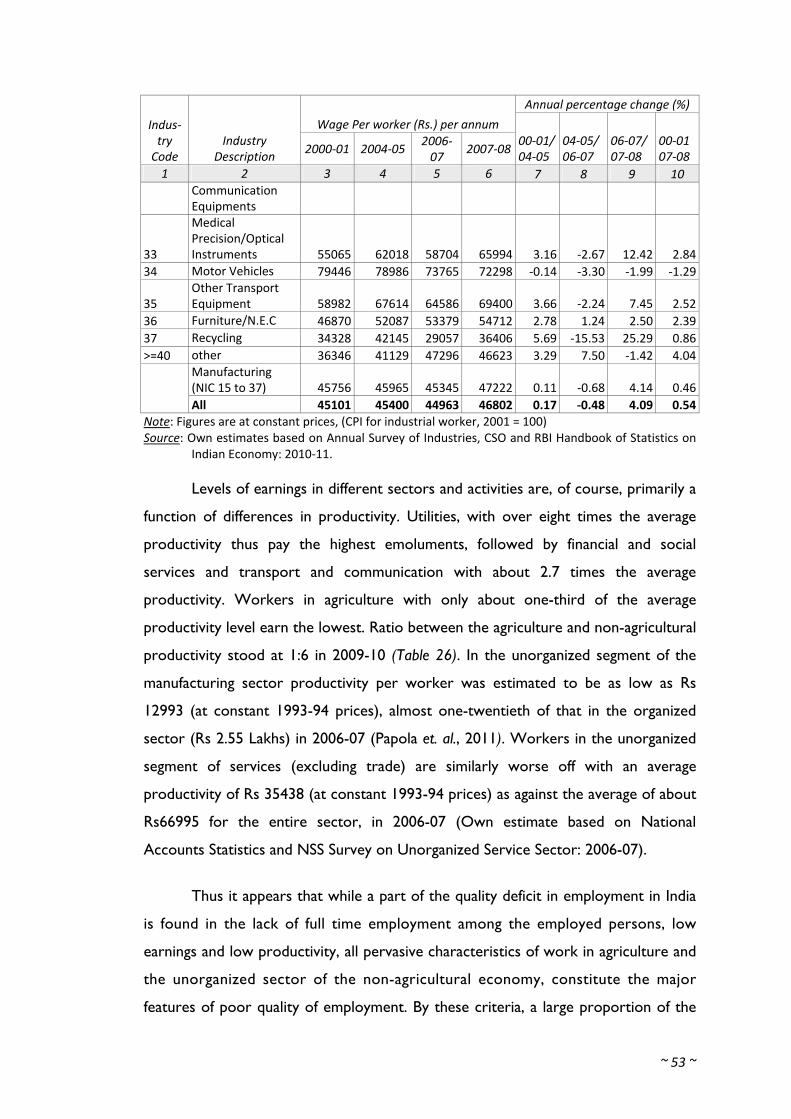
~ 53 ~
Annual percentage change (%)
Wage Per worker (Rs.) per annum Indus‐try Code
Industry Description 2000‐01 2004‐05
2006‐07
2007‐0800‐01/04‐05
04‐05/ 06‐07
06‐07/ 07‐08
00‐01 07‐08
1 2 3 4 5 6 7 8 9 10 Communication Equipments
33
Medical Precision/Optical Instruments 55065 62018 58704 65994 3.16 ‐2.67 12.42 2.84
34 Motor Vehicles 79446 78986 73765 72298 ‐0.14 ‐3.30 ‐1.99 ‐1.29
35 Other Transport Equipment 58982 67614 64586 69400 3.66 ‐2.24 7.45 2.52
36 Furniture/N.E.C 46870 52087 53379 54712 2.78 1.24 2.50 2.3937 Recycling 34328 42145 29057 36406 5.69 ‐15.53 25.29 0.86>=40 other 36346 41129 47296 46623 3.29 7.50 ‐1.42 4.04
Manufacturing (NIC 15 to 37) 45756 45965 45345 47222 0.11 ‐0.68 4.14 0.46
All 45101 45400 44963 46802 0.17 ‐0.48 4.09 0.54Note: Figures are at constant prices, (CPI for industrial worker, 2001 = 100) Source: Own estimates based on Annual Survey of Industries, CSO and RBI Handbook of Statistics on
Indian Economy: 2010‐11.
Levels of earnings in different sectors and activities are, of course, primarily a
function of differences in productivity. Utilities, with over eight times the average
productivity thus pay the highest emoluments, followed by financial and social
services and transport and communication with about 2.7 times the average
productivity. Workers in agriculture with only about one-third of the average
productivity level earn the lowest. Ratio between the agriculture and non-agricultural
productivity stood at 1:6 in 2009-10 (Table 26). In the unorganized segment of the
manufacturing sector productivity per worker was estimated to be as low as Rs
12993 (at constant 1993-94 prices), almost one-twentieth of that in the organized
sector (Rs 2.55 Lakhs) in 2006-07 (Papola et. al., 2011). Workers in the unorganized
segment of services (excluding trade) are similarly worse off with an average
productivity of Rs 35438 (at constant 1993-94 prices) as against the average of about
Rs66995 for the entire sector, in 2006-07 (Own estimate based on National
Accounts Statistics and NSS Survey on Unorganized Service Sector: 2006-07).
Thus it appears that while a part of the quality deficit in employment in India
is found in the lack of full time employment among the employed persons, low
earnings and low productivity, all pervasive characteristics of work in agriculture and
the unorganized sector of the non-agricultural economy, constitute the major
features of poor quality of employment. By these criteria, a large proportion of the
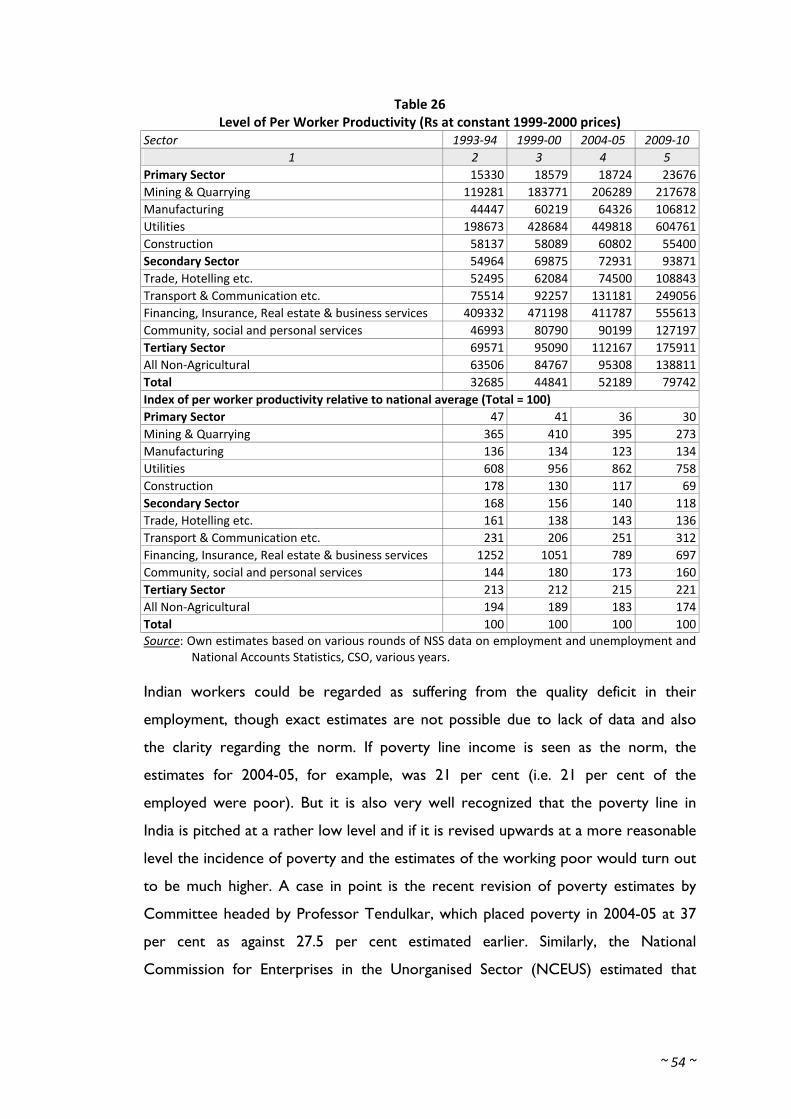
~ 54 ~
Table 26 Level of Per Worker Productivity (Rs at constant 1999‐2000 prices)
Sector 1993‐94 1999‐00 2004‐05 2009‐10 1 2 3 4 5
Primary Sector 15330 18579 18724 23676Mining & Quarrying 119281 183771 206289 217678Manufacturing 44447 60219 64326 106812Utilities 198673 428684 449818 604761Construction 58137 58089 60802 55400Secondary Sector 54964 69875 72931 93871Trade, Hotelling etc. 52495 62084 74500 108843Transport & Communication etc. 75514 92257 131181 249056Financing, Insurance, Real estate & business services 409332 471198 411787 555613Community, social and personal services 46993 80790 90199 127197Tertiary Sector 69571 95090 112167 175911All Non‐Agricultural 63506 84767 95308 138811Total 32685 44841 52189 79742Index of per worker productivity relative to national average (Total = 100) Primary Sector 47 41 36 30Mining & Quarrying 365 410 395 273Manufacturing 136 134 123 134Utilities 608 956 862 758Construction 178 130 117 69Secondary Sector 168 156 140 118Trade, Hotelling etc. 161 138 143 136Transport & Communication etc. 231 206 251 312Financing, Insurance, Real estate & business services 1252 1051 789 697Community, social and personal services 144 180 173 160Tertiary Sector 213 212 215 221All Non‐Agricultural 194 189 183 174Total 100 100 100 100Source: Own estimates based on various rounds of NSS data on employment and unemployment and
National Accounts Statistics, CSO, various years.
Indian workers could be regarded as suffering from the quality deficit in their
employment, though exact estimates are not possible due to lack of data and also
the clarity regarding the norm. If poverty line income is seen as the norm, the
estimates for 2004-05, for example, was 21 per cent (i.e. 21 per cent of the
employed were poor). But it is also very well recognized that the poverty line in
India is pitched at a rather low level and if it is revised upwards at a more reasonable
level the incidence of poverty and the estimates of the working poor would turn out
to be much higher. A case in point is the recent revision of poverty estimates by
Committee headed by Professor Tendulkar, which placed poverty in 2004-05 at 37
per cent as against 27.5 per cent estimated earlier. Similarly, the National
Commission for Enterprises in the Unorganised Sector (NCEUS) estimated that
~ 55 ~
about 77 per cent of the Indian population survives on less than Rs 20 per day
(NCEUES, 2009)!
VI.2 Social Protection
If the criterion of social protection is added to the characteristics of good
jobs, the quality deficit in employment becomes much larger. According to the
estimate made by the National Commission for Enterprises in the Unorganised
Sector (NCEUS), only about 8 per cent of all workers enjoy any statutory protection
against such risks as sickness, maternity, disability and old age, through various
central and state level legislations on conventional social security (NCEUS, 2006).
This is particularly disconcerting because the universalized provisions of social
protection for population at large, such as public health and old age pension, are
rather limited and poorly delivered.
Practically all the workers in the unorganized sector, which employs about 86
per cent of the total workers, are without any statutory social security benefit. But
almost one-half of workers in the organized sector, also do not enjoy such benefits.
Of late, there have been some initiatives to increase universal social protection in
respect of health and old age (e.g. National Health Insurance Scheme and Old Age
Pension Scheme, both launched in 2007) as well as to extend the social security
available to the formal workers to informal workers (e.g. Unorganised Workers’
Social Security Act, 2008). The coverage and effectiveness of delivery of services,
however, continue to be poor.
VI.3 Workforce Structure and Quality of Employment
While the overall quality of employment in terms of regularity, earnings,
productivity and social protection is poor, it nevertheless varies among sectors,
industries and types of employment as was already indicated by some broad statistics
in the preceding section. These variations not only reflect the differences in quality,
but in a way are responsible for poor quality of employment for a large mass of
workers. The first of such structural aspects of employment quality consists of the
continuing dominance of agriculture in employment. Even though its share in
employment has declined over the years, it still accounted for over half the workers
~ 56 ~
in 2009-10. Its share in GDP, on the other hand, has declined from about 43 per
cent in 1972-73 (when its employment share was 74 per cent) to 15 per cent in
2009-10. Lack of similar structural change in workforce as in the national output has
meant a steep relative deterioration in the quality of employment in agriculture.
The second structural characteristic of the Indian economy that signifies poor
employment quality is the predominance of the informal employment. Productivity
per worker in large part of the informal sector is miserably low. For example, in
manufacturing, as it was noted earlier, it was one-twentieth of that in the organized
sector. Virtually all the employment in agriculture is informal, but in manufacturing
also about 88 per cent of employment is in this category. Average earnings per
worker were Rs 62 in the unorganized sector as against Rs 239 in the organized
sector in 2004-05. In terms of social protection, only about 0.4 per cent of the
workers in the unorganized sector were covered under any statutory social security
scheme, though even in the organized sector the extent of such coverage was only
53 per cent (NCEUS, 2006). According to the latest estimates it has declined to less
than 50 per cent in 2009-10. (Kannan, 2011).
The third aspect of workforce structure with direct implications for quality of
employment is the dominance of the self-employed and casual labour categories, the
regular employer category forming a small percentage of total workers. It is only the
last category that generally provides an assurance of reasonable quality of
employment in terms of regularity of work, reasonable level of earnings and a
measure of social security. By definition, the workers in this category have regular
employment. Estimates of earnings of the self-employed are not available, but
earnings of the casual workers were only one-fourth of the wages of regular
workers (Rs. 51 as against Rs. 200) in 2004-05. Incidence of poverty was as high as
32 per cent among the casual labour, and 17.5 per cent among the self- employed,
but lower at 11 per cent among the regular workers, with an average of 20.51 per
cent for all employed workers. (Planning Commission, 2008, Chapter 4, Annexure
4.7). Any social security benefits that are statutorily available to workers are only to
regular employees of establishments, very rarely to the casual workers or the self-
employed. Given these differences between the regular workers and other
categories of workers, the facts that they constitute less than one-sixth of total
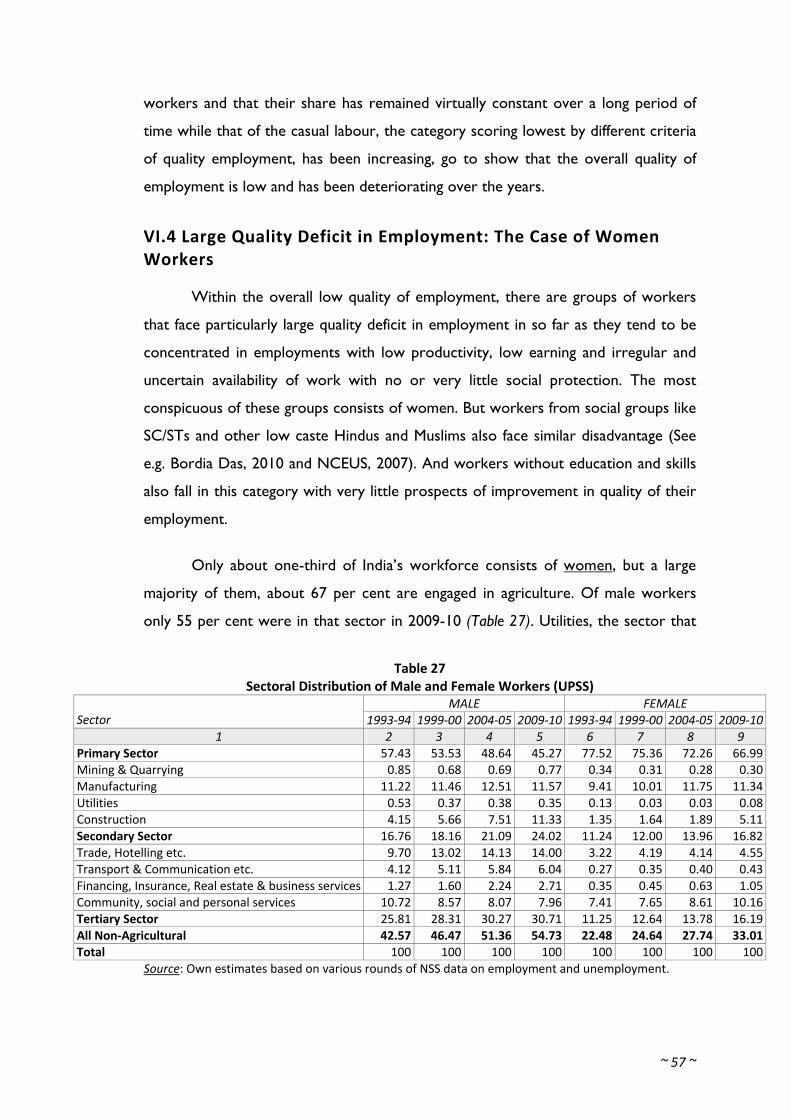
~ 57 ~
workers and that their share has remained virtually constant over a long period of
time while that of the casual labour, the category scoring lowest by different criteria
of quality employment, has been increasing, go to show that the overall quality of
employment is low and has been deteriorating over the years.
VI.4 Large Quality Deficit in Employment: The Case of Women Workers
Within the overall low quality of employment, there are groups of workers
that face particularly large quality deficit in employment in so far as they tend to be
concentrated in employments with low productivity, low earning and irregular and
uncertain availability of work with no or very little social protection. The most
conspicuous of these groups consists of women. But workers from social groups like
SC/STs and other low caste Hindus and Muslims also face similar disadvantage (See
e.g. Bordia Das, 2010 and NCEUS, 2007). And workers without education and skills
also fall in this category with very little prospects of improvement in quality of their
employment.
Only about one-third of India’s workforce consists of women, but a large
majority of them, about 67 per cent are engaged in agriculture. Of male workers
only 55 per cent were in that sector in 2009-10 (Table 27). Utilities, the sector that
Table 27 Sectoral Distribution of Male and Female Workers (UPSS)
MALE FEMALE Sector 1993‐94 1999‐00 2004‐05 2009‐10 1993‐94 1999‐00 2004‐05 2009‐10
1 2 3 4 5 6 7 8 9 Primary Sector 57.43 53.53 48.64 45.27 77.52 75.36 72.26 66.99Mining & Quarrying 0.85 0.68 0.69 0.77 0.34 0.31 0.28 0.30Manufacturing 11.22 11.46 12.51 11.57 9.41 10.01 11.75 11.34Utilities 0.53 0.37 0.38 0.35 0.13 0.03 0.03 0.08Construction 4.15 5.66 7.51 11.33 1.35 1.64 1.89 5.11Secondary Sector 16.76 18.16 21.09 24.02 11.24 12.00 13.96 16.82Trade, Hotelling etc. 9.70 13.02 14.13 14.00 3.22 4.19 4.14 4.55Transport & Communication etc. 4.12 5.11 5.84 6.04 0.27 0.35 0.40 0.43Financing, Insurance, Real estate & business services 1.27 1.60 2.24 2.71 0.35 0.45 0.63 1.05Community, social and personal services 10.72 8.57 8.07 7.96 7.41 7.65 8.61 10.16Tertiary Sector 25.81 28.31 30.27 30.71 11.25 12.64 13.78 16.19All Non‐Agricultural 42.57 46.47 51.36 54.73 22.48 24.64 27.74 33.01Total 100 100 100 100 100 100 100 100
Source: Own estimates based on various rounds of NSS data on employment and unemployment.
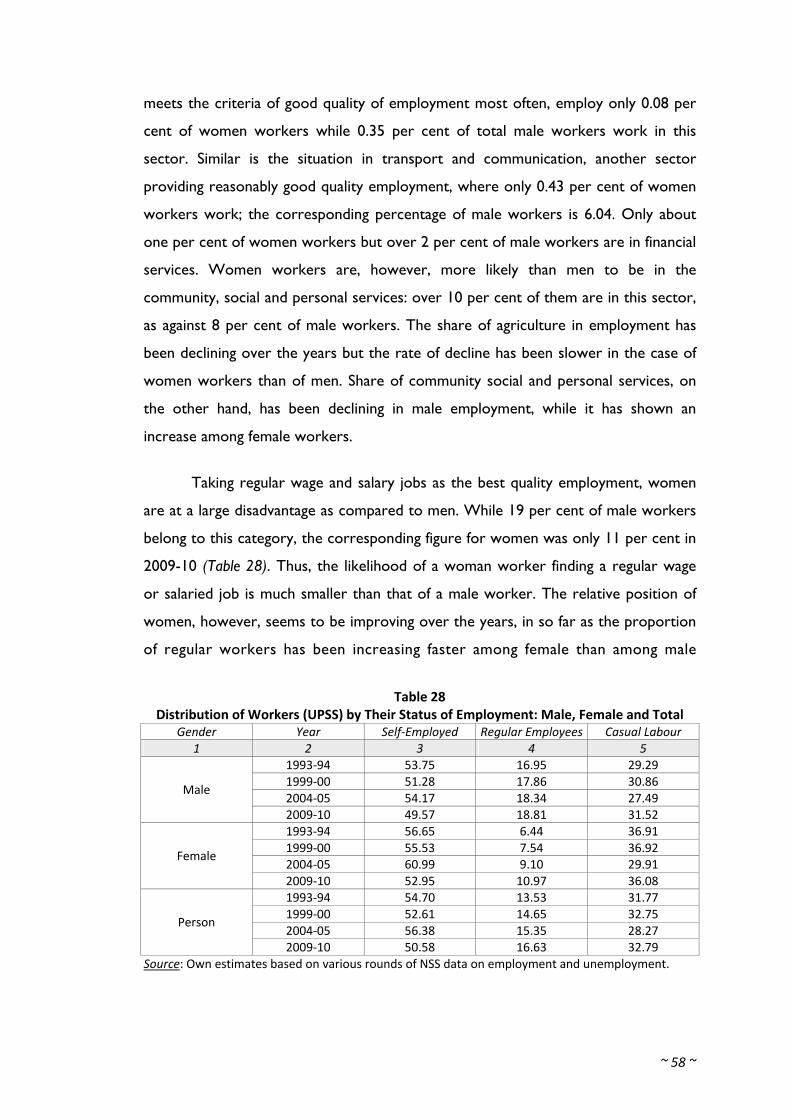
~ 58 ~
meets the criteria of good quality of employment most often, employ only 0.08 per
cent of women workers while 0.35 per cent of total male workers work in this
sector. Similar is the situation in transport and communication, another sector
providing reasonably good quality employment, where only 0.43 per cent of women
workers work; the corresponding percentage of male workers is 6.04. Only about
one per cent of women workers but over 2 per cent of male workers are in financial
services. Women workers are, however, more likely than men to be in the
community, social and personal services: over 10 per cent of them are in this sector,
as against 8 per cent of male workers. The share of agriculture in employment has
been declining over the years but the rate of decline has been slower in the case of
women workers than of men. Share of community social and personal services, on
the other hand, has been declining in male employment, while it has shown an
increase among female workers.
Taking regular wage and salary jobs as the best quality employment, women
are at a large disadvantage as compared to men. While 19 per cent of male workers
belong to this category, the corresponding figure for women was only 11 per cent in
2009-10 (Table 28). Thus, the likelihood of a woman worker finding a regular wage
or salaried job is much smaller than that of a male worker. The relative position of
women, however, seems to be improving over the years, in so far as the proportion
of regular workers has been increasing faster among female than among male
Table 28 Distribution of Workers (UPSS) by Their Status of Employment: Male, Female and Total
Gender Year Self‐Employed Regular Employees Casual Labour 1 2 3 4 5
1993‐94 53.75 16.95 29.29 1999‐00 51.28 17.86 30.86 2004‐05 54.17 18.34 27.49
Male
2009‐10 49.57 18.81 31.52 1993‐94 56.65 6.44 36.91 1999‐00 55.53 7.54 36.92 2004‐05 60.99 9.10 29.91
Female
2009‐10 52.95 10.97 36.08 1993‐94 54.70 13.53 31.77 1999‐00 52.61 14.65 32.75 2004‐05 56.38 15.35 28.27
Person
2009‐10 50.58 16.63 32.79 Source: Own estimates based on various rounds of NSS data on employment and unemployment.
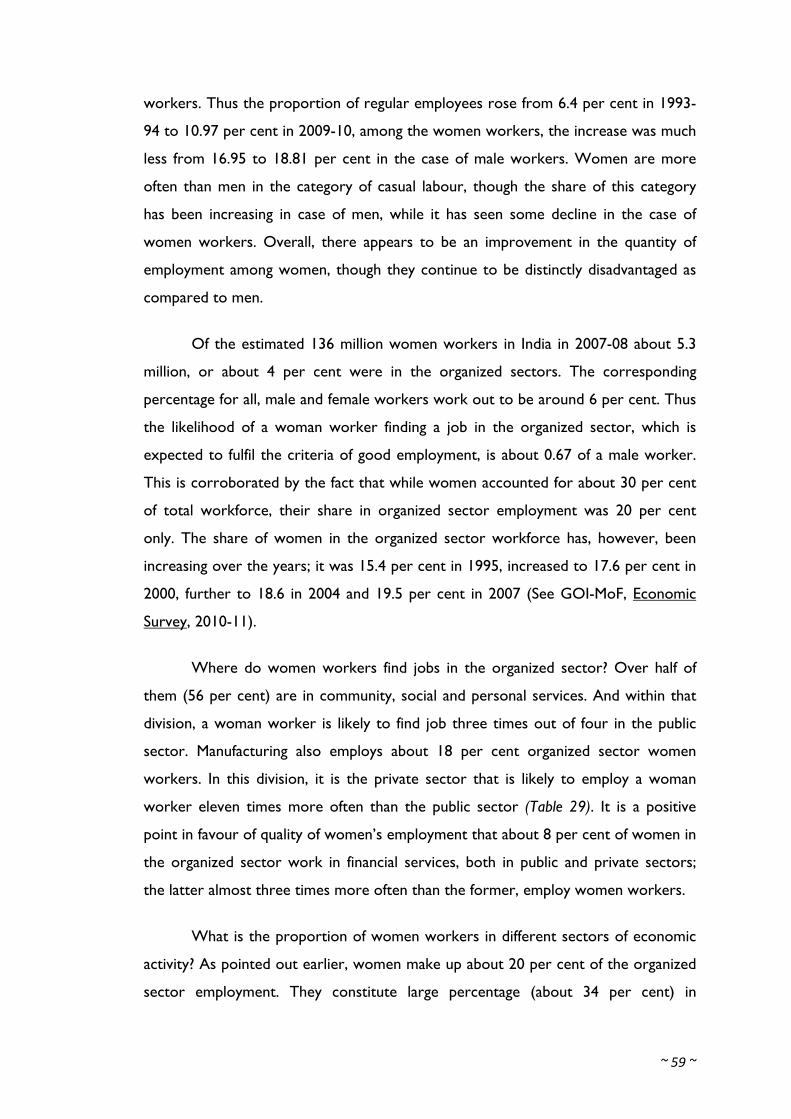
~ 59 ~
workers. Thus the proportion of regular employees rose from 6.4 per cent in 1993-
94 to 10.97 per cent in 2009-10, among the women workers, the increase was much
less from 16.95 to 18.81 per cent in the case of male workers. Women are more
often than men in the category of casual labour, though the share of this category
has been increasing in case of men, while it has seen some decline in the case of
women workers. Overall, there appears to be an improvement in the quantity of
employment among women, though they continue to be distinctly disadvantaged as
compared to men.
Of the estimated 136 million women workers in India in 2007-08 about 5.3
million, or about 4 per cent were in the organized sectors. The corresponding
percentage for all, male and female workers work out to be around 6 per cent. Thus
the likelihood of a woman worker finding a job in the organized sector, which is
expected to fulfil the criteria of good employment, is about 0.67 of a male worker.
This is corroborated by the fact that while women accounted for about 30 per cent
of total workforce, their share in organized sector employment was 20 per cent
only. The share of women in the organized sector workforce has, however, been
increasing over the years; it was 15.4 per cent in 1995, increased to 17.6 per cent in
2000, further to 18.6 in 2004 and 19.5 per cent in 2007 (See GOI-MoF, Economic
Survey, 2010-11).
Where do women workers find jobs in the organized sector? Over half of
them (56 per cent) are in community, social and personal services. And within that
division, a woman worker is likely to find job three times out of four in the public
sector. Manufacturing also employs about 18 per cent organized sector women
workers. In this division, it is the private sector that is likely to employ a woman
worker eleven times more often than the public sector (Table 29). It is a positive
point in favour of quality of women’s employment that about 8 per cent of women in
the organized sector work in financial services, both in public and private sectors;
the latter almost three times more often than the former, employ women workers.
What is the proportion of women workers in different sectors of economic
activity? As pointed out earlier, women make up about 20 per cent of the organized
sector employment. They constitute large percentage (about 34 per cent) in
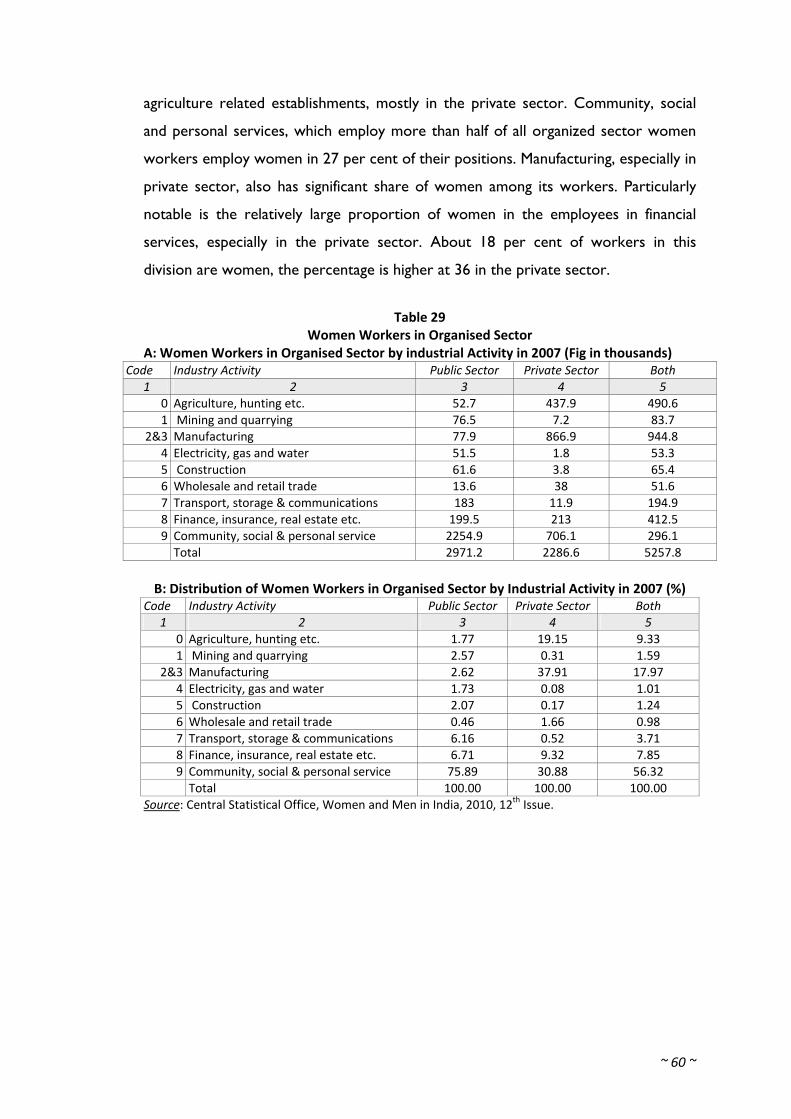
~ 60 ~
agriculture related establishments, mostly in the private sector. Community, social
and personal services, which employ more than half of all organized sector women
workers employ women in 27 per cent of their positions. Manufacturing, especially in
private sector, also has significant share of women among its workers. Particularly
notable is the relatively large proportion of women in the employees in financial
services, especially in the private sector. About 18 per cent of workers in this
division are women, the percentage is higher at 36 in the private sector.
Table 29 Women Workers in Organised Sector
A: Women Workers in Organised Sector by industrial Activity in 2007 (Fig in thousands) Code Industry Activity Public Sector Private Sector Both
1 2 3 4 5 0 Agriculture, hunting etc. 52.7 437.9 490.6 1 Mining and quarrying 76.5 7.2 83.7
2&3 Manufacturing 77.9 866.9 944.8 4 Electricity, gas and water 51.5 1.8 53.3 5 Construction 61.6 3.8 65.4 6 Wholesale and retail trade 13.6 38 51.6 7 Transport, storage & communications 183 11.9 194.9 8 Finance, insurance, real estate etc. 199.5 213 412.5 9 Community, social & personal service 2254.9 706.1 296.1
Total 2971.2 2286.6 5257.8
B: Distribution of Women Workers in Organised Sector by Industrial Activity in 2007 (%) Code Industry Activity Public Sector Private Sector Both
1 2 3 4 5 0 Agriculture, hunting etc. 1.77 19.15 9.33 1 Mining and quarrying 2.57 0.31 1.59
2&3 Manufacturing 2.62 37.91 17.97 4 Electricity, gas and water 1.73 0.08 1.01 5 Construction 2.07 0.17 1.24 6 Wholesale and retail trade 0.46 1.66 0.98 7 Transport, storage & communications 6.16 0.52 3.71 8 Finance, insurance, real estate etc. 6.71 9.32 7.85 9 Community, social & personal service 75.89 30.88 56.32
Total 100.00 100.00 100.00 Source: Central Statistical Office, Women and Men in India, 2010, 12th Issue.
~ 61 ~
VII. Employment Prospects: Promising Sectors and Activities
The Eleventh Five Year Plan (2007-12) projected 58.07 million additional
employment opportunities over the five year period. Taking the 2007 estimates of
employment (on CDS basis) at 402.24 million, it implied an employment growth rate
of 2.75 per cent per annum. The Plan further projected additional employment
opportunities of 57.89 million during 2012-17, which again implied an employment
growth rate of about 2.5 per cent per annum. Employment growth of the projected
magnitude was expected to largely take care of backlog of the unemployed
(estimated at 36.71 million) as on April 1, 2007 and additions to labour force
(projected to be 44.71 million during 2007-12 and 40.40 million during 2012-17), and
reduce the number of unemployed to only 5.85 million or 1.12 per cent of labour
force by 2017.
From the figures revealed by the 66th round of NSSO Survey, it does not
seem likely that the employment growth projected in the Eleventh Plan would be
realised. Going by the Plan estimates of CDS employment at 402 million for 2007
and 404 million for 2009-10 based on the NSSO survey, growth of employment in
the first three years of the Plan could be placed at 0.49 per cent per annum with a
somewhat improved employment growth during the last two years of the Plan, the
CDS employment in 2012-13, is estimated to be 428 million. An apparently brighter
side of the picture revealed by the 2009-10 survey data is that labour force has
shown even a lower growth than employment during 2004-05/2009-10, thus leading
to a decline in unemployment rates. Going by these figures the number of
unemployed in 2012-13 are estimated to be lower in 2012 than in 2007: 17.4 million
as compared to 21.6 million by the CWS criterion. Also the growth in labour force
is also likely to be relatively low due to the long-term trend of decline in population
growth and declining labour force participation rate. It must, however, be noted, as
explained earlier, the employment challenge is much larger than these figures of
unemployment and additions to labour force indicate. As estimated earlier, about 94
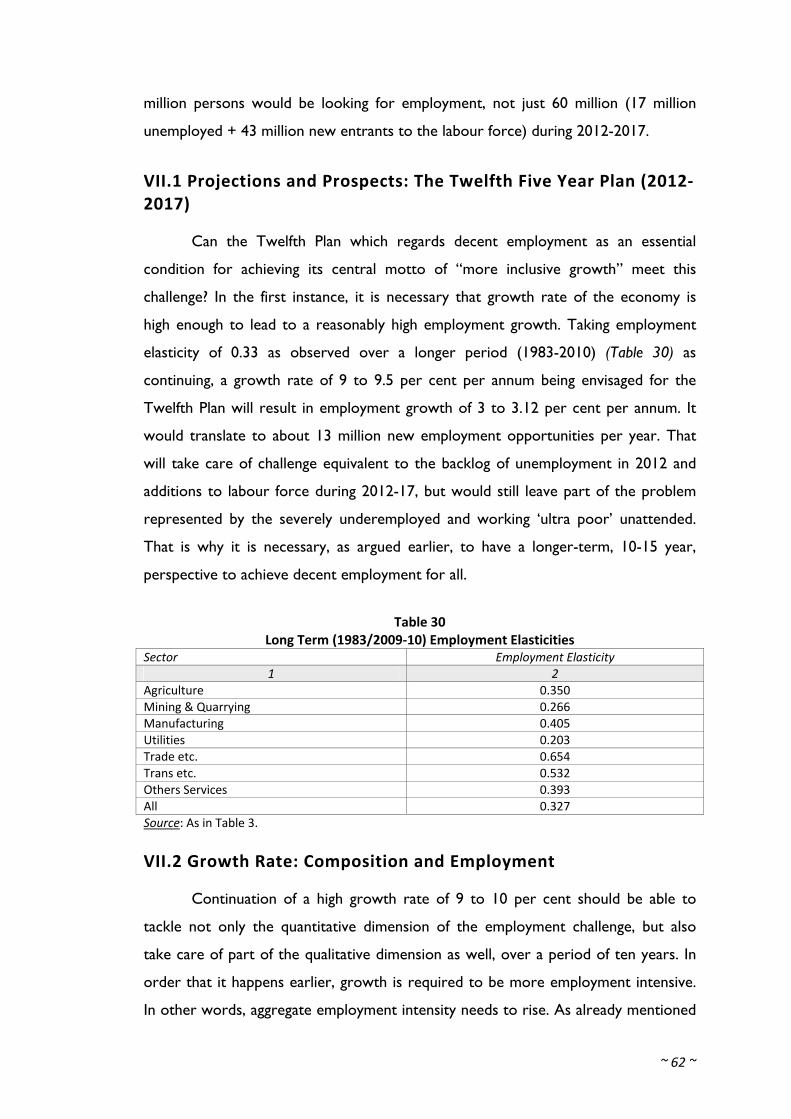
~ 62 ~
million persons would be looking for employment, not just 60 million (17 million
unemployed + 43 million new entrants to the labour force) during 2012-2017.
VII.1 Projections and Prospects: The Twelfth Five Year Plan (2012‐2017)
Can the Twelfth Plan which regards decent employment as an essential
condition for achieving its central motto of “more inclusive growth” meet this
challenge? In the first instance, it is necessary that growth rate of the economy is
high enough to lead to a reasonably high employment growth. Taking employment
elasticity of 0.33 as observed over a longer period (1983-2010) (Table 30) as
continuing, a growth rate of 9 to 9.5 per cent per annum being envisaged for the
Twelfth Plan will result in employment growth of 3 to 3.12 per cent per annum. It
would translate to about 13 million new employment opportunities per year. That
will take care of challenge equivalent to the backlog of unemployment in 2012 and
additions to labour force during 2012-17, but would still leave part of the problem
represented by the severely underemployed and working ‘ultra poor’ unattended.
That is why it is necessary, as argued earlier, to have a longer-term, 10-15 year,
perspective to achieve decent employment for all.
Table 30 Long Term (1983/2009‐10) Employment Elasticities
Sector Employment Elasticity 1 2
Agriculture 0.350 Mining & Quarrying 0.266 Manufacturing 0.405 Utilities 0.203 Trade etc. 0.654 Trans etc. 0.532 Others Services 0.393 All 0.327 Source: As in Table 3.
VII.2 Growth Rate: Composition and Employment
Continuation of a high growth rate of 9 to 10 per cent should be able to
tackle not only the quantitative dimension of the employment challenge, but also
take care of part of the qualitative dimension as well, over a period of ten years. In
order that it happens earlier, growth is required to be more employment intensive.
In other words, aggregate employment intensity needs to rise. As already mentioned
~ 63 ~
this should not and cannot be done by raising employment elasticity of growth of
production of each product and service. An increase in productivity, which implies a
decline in employment elasticity is necessary in the case of a large number of
activities. But it is possible to have an increase in employment elasticity in aggregate,
even with a decline in employment elasticity at individual product level, by making
products with high elasticity grow faster than those with low elasticity.
For example, the long term employment elasticity is observed to be high in,
construction, trade, transport and manufacturing and a faster growth in these
sectors would lead to a faster growth of employment. Construction, however, often
shows an employment elasticity of more than one implying a decline in productivity.
With low labour productivity, lowest among all activities barring agriculture, any
further increase in employment in this sector must be only at an increasing level of
productivity. Employment generated in manufacturing, financial services and
transport, each with the highest levels of productivity, and employment elasticity will,
on the other hand, be highly productive. Utilities have the highest productivity, but
the lowest employment elasticity. Agriculture may have an above average long-term
employment elasticity, but with the lowest, less than one third of aggregate,
productivity, it would not be advisable to expect any new employment generation in
this activity. Employment must in fact decline in agriculture. Recent short-term
employment elasticity (Table 3) of different activities show similar pattern, though a
lower value, as the long-term elasticities. Aggregate elasticity during 2005-10 turns
out to be almost zero due to negligible employment growth during that period. It
was high at 0.42 during 2000-2005 due to an almost 3 per cent annual growth in
employment. For the entire 2000-2010 period, employment elasticity works out to
be relatively low at 0.20 due both to low (1.5%) growth rate of employment and high
(8%) growth rate of GDP. But as in the long-term, construction, manufacturing,
trade, and transport and financial services have shown relatively higher employment
elasticities.
VII.3 Manufacturing: The Sector with Highest Employment Potential
An assessment of employment potential of different divisions of economic
activity places manufacturing among the activities with the high potential for
~ 64 ~
productive employment generation, for the following reasons. One, after agriculture,
it accounts for the largest share of employment at 11.5 per cent among different
divisions of economic activity; and a faster growth of employment in it, therefore,
means addition of a large number of jobs. A one per cent growth in employment in
manufacturing sector would mean over 6.85 lakh new jobs. Second, employment
elasticity of this sector has not only been much higher than average (0.40) as against
0.32 during 1983/2009-10), it also showed an increase for most of the post reform
period (1994-2004-05) as compared to earlier decade, though it declined like in most
other activities during 2005-10. All other divisions of economic activity except
financial services registered a decline in employment elasticity (Table 3). Third, it has
a reasonably high labour productivity, about 34 per cent higher than the average and
has shown a significant increase, in productivity during the post-reform period, 1993-
94/2009-10. Thus employment growth in this sector is creating jobs with increasing
levels of productivity.
It is probably a realisation of the importance of manufacturing for, inter alia,
generation of productive employment that the Approach Paper to the Twelfth Plan
proposes to place it on the highest growth pedestal. It is targeted to grow at 10 per
cent per annum in the 9 per cent growth scenario and at 11.5 per cent per annum in
the alternative 9.5 per cent growth scenario (Planning Commission, 2011, p.25). An
11.5 per cent annual growth in GDP in manufacturing would mean a 4.6 per cent
annual growth in employment (on daily status basis) translating into 32 lakh new jobs
every year and over 16 million jobs over the Plan period.
It could be higher if the aggregate growth in manufacturing is based on a
faster growth of products groups like textile products, food products, beverages, and
leather products. Faster growth of even industry groups like metal products,
machinery and chemicals, which are commonly considered to be less labour
intensive, is likely to contribute significantly to employment growth due to their
relatively high employment elasticity.
VII.4 Economic Services: Trade, Transport and Finance
Services have made a significant contribution to employment growth in the
post-reform period. Their share in total employment has increased from 21 per cent

~ 65 ~
in 1993-94 to 27 per cent in 2009-10. Employment growth in the tertiary sector,
however, has not been commensurate with its GDP growth. The share of services in
GDP rose much faster from 45 to 59 per cent during this period. Employment
elasticity in this sector has been lower than in the secondary sector, and has declined
continuously. Employment elasticity in the tertiary sector is estimated to be 0.30 as
compared to 0.60 in the secondary sector in the last decade. But within the services
sector, financial services have shown high employment elasticity, followed by trade
and transport sub-sectors. Community social and personal services, had the lowest
employment growth and employment elasticity, primarily on account of a decline in
the public sector employment in these services. Employment growth in these
services in the private sector has been positive, but it is rather small.
According the Approach paper for the Twelfth Five Year Plan, GDP in
services is targeted to grow at 10 per cent per annum. With a long term elasticity of
0.40 and short term elasticity of 0.30, it can be expected to lead to a 3.5 per cent
growth in employment, which translates to 45 lakhs new jobs per year. Major part of
this increase is expected to be in trade and transport which together are to grow at
11 per cent per annum. With an employment elasticity of 0.40, employment in these
sectors can grow at over 4 per cent per annum, leading to creation of about 32 lakh
employment (on daily status basis) opportunity per year. Financial services, another
subsector to grow fast, and with its high employment elasticity, will also have fast
employment growth. But it, is a relatively small sector, as compared to trade,
transport and other services.
VII.5 Social and Personal Services: Vast Scope and Need for Expansion
Education and health constitute an important part of the community, social
and personal services which have had relatively poor performance in respect of
employment. As noted earlier, employment growth in these services has been very
low. Should that mean that they will not be creating any significant magnitude of jobs
in future? It would not be desirable to take that view because of the huge
requirements of expansion of education and health in the country. Large investment
both in public and private sector, in the area of education are needed and are being
envisaged to meet the current and growing requirements of these services. The
~ 66 ~
Twelfth Plan envisages an 8 per cent growth in this subsector. With a rather low
(0.30) employment elasticity, employment growth in this subsector could be around
2.5 per cent translating into about 12 lakh new jobs every year. It, however, seems
important that the social services sector should get a higher priority than is
envisaged in the Approach Paper and its growth should be pegged up to 10 to 11 per
cent, which would also mean its larger contribution to employment growth.
In an economy that is expected to grow at over 9 per cent per annum,
resulting at over 7 per cent increase in per capita income, demand for personal
services will grow at an unprecedented rate. Media and entertainment services and,
even if for the wrong reasons, security services, for example, have seen enormous
growth and likely to grow even faster in future. Services towards household
management and personal care are also emerging fast, particularly in urban areas.
Many of these services at present are provided by semi-skilled and low-paid workers
on an unorganised basis. Their increasing demand warrants that appropriate
institutional and organisational mechanisms are developed to ensure services of
reasonable standard to the consumers, on the one hand, and reasonable earnings to
those rendering these services, on the other. Existence of such mechanisms is likely
to increase demand for these services and, therefore, create more employment.
~ 67 ~
VIII. Improving Quality of Employment: Productivity Increase, the Key Issue
It is quite clear that employment opportunities have to grow at a reasonably high
rate to ensure quality employment to an increasingly larger number of Indian
workers. A high employment growth will ensure jobs to the unemployed and new
entrants in the labour force, on the one hand, and will improve the quality of
employment of those already at work, by enabling them to shift to better quality jobs
and increasing the demand pressure in the labour market, on the other. It is,
however, most important that employment growth is accompanied by increase in
productivity. While a “jobless” growth is a matter of concern in an economy with
large labour surplus and high growth in labour force, it is of little use to create jobs
that do not result in production of a reasonable level of output in an economy that is
characterized by low labour productivity and with a large proportion of the
employed as “working poor”. In other words, of the two components of economic
growth – productivity growth and employment growth – the former needs to
contribute as much as, if not more than the latter.
In this perspective, employment elasticity need not became a fetish; a low
employment elasticity can even be seen as a desirable phenomenon, as it implies
growth with increasing productivity per worker! A declining trend, in employment
elasticity that has been observed over the years (see Table 3), therefore, need not be
seen, as is often done, as a danger signal. But, a reasonably high employment growth
with increasing productivity (low employment elasticity) requires a high growth of
GDP. For example a 2.5 per cent growth in employment will require a 10 per cent
GDP growth if employment elasticity is only 0.25. It must, however, be recognized
that it is possible to have a reasonably high employment elasticity in aggregate
without sacrificing the growth of productivity in individual sectors and activities by
making those among them grow faster which have relatively high, even if declining,
employment elasticity. The most preferred ‘quality-employment-creating-growth
strategy’ should consist of a high rate of GDP growth derived from faster growth of
sectors with relatively high employment elasticity and high productivity and primarily
productivity–led growth in sectors with low productivity.
~ 68 ~
VIII.1 Structural Shift in Workforce
Thus prospects for faster growth of quality employment, at least in terms of
labour productivity, would depend, in the first instance, on the degree of structural
shifts of work force from low productivity sectors to high productivity sectors. The
major component of this shift would be from agriculture to non-agriculture which
has been taking place rapidly in terms of GDP but rather slowly in respect of
employment. As a result, productivity per worker in agriculture is low and has been
increasing at a very slow rate. It was about one-fourth of the non-agricultural sector
in 1993-94, and after growing at much slower rate than average, declined to one-
sixth in 2009-10. Combined with rather low extent of other attributes of quality
employment, such as regularly of work and social protection, the low earnings of
agricultural workers place them at the lowest rung of the quality ladder. And
constituting the majority, they pull down the overall quality of employment in the
country.
Non-agricultural employment, of course, has been growing faster than in
agriculture, the former on an average has grown at around 3.5 per cent per annum
as compared to around 1 per cent in the latter during 1993-94/2009-10. But it has
not been sufficient to draw workers from agriculture to non-agricultural sectors on a
large scale. Construction has experienced the highest growth in employment
averaging at about 7 per cent per annum and it has low productivity level and has
also recorded a decline in productivity, in recent period i.e. 1999-2000 to 2009-2010
(Table 26). But transport with high growth of employment and high level of and rapid
growth in productivity stands out as the strongest candidates for special focus for
accelerating the growth rate so as to achieve a faster growth of quality employment.
Financial services come next in this category. Manufacturing, and trade with a
relatively low, but rising productivity, are other strong candidates for special
attention particularly because these two are the largest employment sectors,
together accounting for 23 per cent of total and almost one half of the non-
agricultural employment.
~ 69 ~
VIII.2 Exports: The Question of Employment Intensity
Exports, specially after economic reforms and globalization have been
regarded not only an important engine of growth but also a major source of good
quality employment. Export oriented sectors are found to pay better wages and
provide better conditions of work including social protection. In so far as the Indian
exports have rapidly grown, increasing from only 5.8 per cent of GDP in 1991 to
about 15 per cent in 2009-10, and major part of them has been in the category of
labour intensive products, they can be presumed to have made a significant
contribution to the growth of quantity and quality of employment. The experience
during the global financial crisis which seems to have adversely affected employment,
more than the GDP growth, has raised questions on placing too much reliance on
exports for employment growth, as the adverse effect on employment was primarily
found in export-oriented labour intensive lines of products. Also, it may be noted
that the share of labour intensive products has significantly declined in the Indian
exports: it declined from 65 per cent in 1995-96 to less than 50 per cent in 2004-05.
By 2009-10, it has further slided down to about one-third (Veeramani, 2012). It is
becoming rather doubtful if the cheap labour advantage India enjoyed is sustainable,
given that labour productivity in Indian manufacturing is abysmally low as compared
to UK, USA, France and Japan; and significantly lower than in China and somewhat
comparable only to Brazil and Indonesia, among the major trading countries (ILO,
2007, KILM). And technological up-gradation to raise productivity will make Indian
products lose their labour advantage!
Services exports, which have been growing in importance over the years,
now making over 36 per cent of value of all exports, however, seem to hold
relatively better promise for sustained growth and therefore, for quality
employment. Growth in all segments of services exports like travel, transportation
and other services has been quite fast during the recent years, but exports of
software services and business and financial services have seen the fastest increase.
Information Technology (IT) services which consist of Information
Technology Services (ITs) and Information Technology Enabled Services (ITeS), latter
also referred to as Business Process Outsourcing (BPO), now constitutes about 75
~ 70 ~
per cent of service exports. Software services which constitute about 40 per cent of
service exports have seen an export growth of about 33 per cent per annum during
2001-2007, financial services exports have grown at about 100 per cent per annum,
and business services at 90 per cent per annum (GOI, MOF, Economic Survey,
various years). The last, constituting about 25 per cent of service exports, are
particularly seen as an important source of quality employment. Wages in this sector
at around Rs. 100,000 per year were double those paid by the organized
manufacturing sector in 2007. Average wages in sector increased at a rate of about
16.5 per cent per year during 2005-2007. Regularity of employment seem quite
assured particularly due to the shortage of skilled workers at present. A high rate of
attrition observed in the industry may, in fact, be reflecting voluntary mobility on the
part of workers. BPO industry also provides social security benefits including liberal
facilities of medical and accident insurance. It also spends significantly in training of
workers (www.nasscom.in).
Employment in the IT sector has grown similarly rapidly: from a small figure
of 2,84,000 in 1999-2000, it is estimated to be 2,236.614 in 2008-09, of which 78 per
cent is estimated to be in the exporting establishments. And within the export-based
employment 45 per cent is in the BPO (ITeS) sector (Table 12). What is particularly
significant to note is that while employment in different industries, particularly the
export-oriented ones like textiles, leather, gems and jewellery saw a decline in
employment, the IT BPO sector saw a large increase in employment during October
2008 to December 2009, when the adverse impact of global financial crisis was in
operation (Table 15). This probably shows the resilience and sustainability of BPO
sector in export market and its potential to continue to generate quality
employment on a larger scale.
VIII.3 Organised Sector: Can Recent Trends be Strengthened?
Organised sector is the major provider of quality employment. Its share in
total employment is less than ten per cent. There has been a decline not only in its
share over the years, but also in absolute number of workers since the mid-1990
(Table 19). It may, however, be noted that the decline has mainly been in the public
sector; in the private sector a decline was seen only for a few years, during 2001-
~ 71 ~
2004 (Table 20 & 21). What is particularly significant to note is that since 2004, the
declining trend in organized sector employment has seen a reversal, thanks again to a
growth of about 3.8 per cent per annum in the private sector; public sector
employment has, in fact, continued to decline even during this period (Table 8).
Among different activity divisions, financial services, with a nine percent share in
employment had the fastest growth in employment. Trade, with about 3 per cent of
organised sector employment, recorded the next highest (1.8%) growth rate in
employment. Manufacturing which made about 22 per cent of total organized sector
employment and about 50 per cent in the private sector, had an employment growth
of 0.4 per cent per annum during the period 2004-08. Here again it is the private
sector which has contributed all the employment growth, public sector employment
has continued to decline. Employment growth in private organized manufacturing
during 2004-2008 has been about 3.8 per cent per annum.
Continuation of the recent trend of growth in organized sector employment
should lead to an improvement in the quality of employment in manufacturing. It is,
however, noted that the growth of organized sector employment over the longer periods
of time, 1983-2005, or 1993-2005 has been much smaller (less than one per cent per
annum) than of the total employment (2.7 and 3.1 respectively Table 31). Yet, industries
which saw high employment growth in aggregate, also experienced relatively high growth
of employment in the organized sector. Thus, textile products registered 11.5 per cent
average annual growth in total employment during 1993-2005. It also saw a growth rate of
9.3 per cent in organized sector employment. Taking a longer period, 1983-2005, it, in
fact, had a faster growth of organized (9.7 per cent) than of total (4.4 per cent)
employment. Similarly, leather products, rubber and plastic products, metal products and
‘other manufacturing’ registered high growth rate of employment both in total and the
organized segment. Coefficient of co-relation between growth rates of total and organized
sector employment in different industries turned out to be 0.45 during the period 1983-
2005 and 0.35 during 1993-2005, both significant at 0.05 level. Thus it appears that though
there could be other factors to determine the employment growth in the organized
segment of any industry, a faster growth of employment in aggregate appears a necessary
condition for it. A faster growth of manufacturing sector, which has a relatively high
employment elasticity, along with a higher than average levels of and rising trend in
productivity, will, therefore, be a key factor in improving the quality of employment.
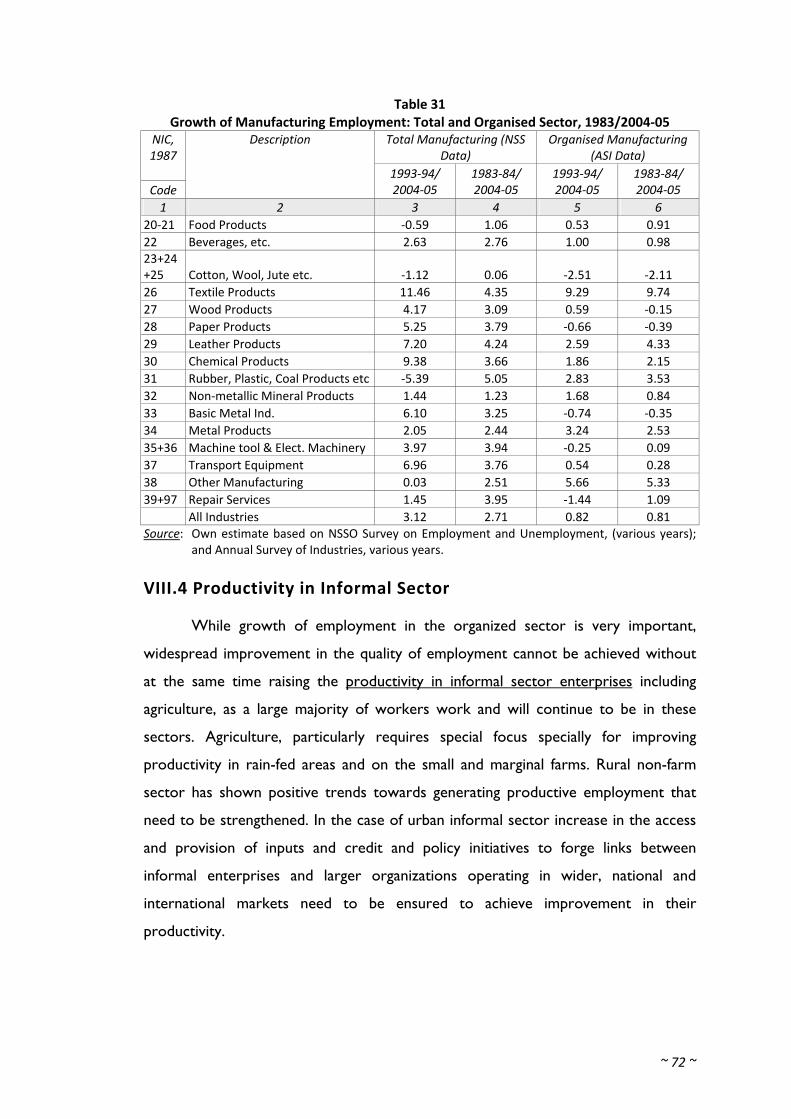
~ 72 ~
Table 31 Growth of Manufacturing Employment: Total and Organised Sector, 1983/2004‐05
Total Manufacturing (NSS Data)
Organised Manufacturing (ASI Data)
NIC, 1987
Code
Description
1993‐94/ 2004‐05
1983‐84/ 2004‐05
1993‐94/ 2004‐05
1983‐84/ 2004‐05
1 2 3 4 5 6 20‐21 Food Products ‐0.59 1.06 0.53 0.91 22 Beverages, etc. 2.63 2.76 1.00 0.98 23+24 +25 Cotton, Wool, Jute etc. ‐1.12 0.06 ‐2.51 ‐2.11 26 Textile Products 11.46 4.35 9.29 9.74 27 Wood Products 4.17 3.09 0.59 ‐0.15 28 Paper Products 5.25 3.79 ‐0.66 ‐0.39 29 Leather Products 7.20 4.24 2.59 4.33 30 Chemical Products 9.38 3.66 1.86 2.15 31 Rubber, Plastic, Coal Products etc ‐5.39 5.05 2.83 3.53 32 Non‐metallic Mineral Products 1.44 1.23 1.68 0.84 33 Basic Metal Ind. 6.10 3.25 ‐0.74 ‐0.35 34 Metal Products 2.05 2.44 3.24 2.53 35+36 Machine tool & Elect. Machinery 3.97 3.94 ‐0.25 0.09 37 Transport Equipment 6.96 3.76 0.54 0.28 38 Other Manufacturing 0.03 2.51 5.66 5.33 39+97 Repair Services 1.45 3.95 ‐1.44 1.09 All Industries 3.12 2.71 0.82 0.81 Source: Own estimate based on NSSO Survey on Employment and Unemployment, (various years);
and Annual Survey of Industries, various years.
VIII.4 Productivity in Informal Sector
While growth of employment in the organized sector is very important,
widespread improvement in the quality of employment cannot be achieved without
at the same time raising the productivity in informal sector enterprises including
agriculture, as a large majority of workers work and will continue to be in these
sectors. Agriculture, particularly requires special focus specially for improving
productivity in rain-fed areas and on the small and marginal farms. Rural non-farm
sector has shown positive trends towards generating productive employment that
need to be strengthened. In the case of urban informal sector increase in the access
and provision of inputs and credit and policy initiatives to forge links between
informal enterprises and larger organizations operating in wider, national and
international markets need to be ensured to achieve improvement in their
productivity.
~ 73 ~
IX. Conclusion: Some Elements of a Strategy for Faster Growth of Productive Employment
As the employment challenge that India faces consists both of creating of new jobs
and improving the quality of existing jobs, a faster economic growth is the key to
meet this challenge. A faster growth even with relatively low employment elasticity
can generate reasonably high employment growth with significant increase in
productivity. With a view to making employment growth faster, sectors and activities
with relatively higher employment elasticity could be targeted for particularly high
economic growth. But the compulsion of raising productivity with a view to
improving employment quality in major part of the economy makes it imperative that
economy grows at a high rate to generate the required number of new employment
opportunities. Thus the strategy for creating quality employment essentially consists
of a strategy for a rapid and diversified economic growth.
A faster growth of agriculture derived from geographically and crop wise
diversification is an essential element of such a strategy in the Indian case.
Agricultural growth is to be achieved not for a quantitative increase in employment
but for a qualitative improvement in employment of those working in the farm
sector, through increase in productivity and income. So far as the numbers of
workers in agriculture are concerned one should expect them to decline as more
and more of them move out to other sectors. Manufacturing offers itself as the best
candidate for absorbing those moving out of agriculture as also other job seekers in
relatively good quality employment and, therefore, must be the another major sector
to be targeted for higher growth. Transport and trade are other sectors with
significant potential for generating productive employment.
A major proportion of workers in non-agricultural economic activities work
in the informal sector where they suffer from a large quality deficit in employment, in
terms of low productivity, low earnings, poor conditions of work and lack of social
protection. A number of measures to improve the quality of employment – of both
self-employed and wage earners– in the informal sector have been suggested some
~ 74 ~
time back by the government-appointed National Commission for Enterprises in the
Unorganised Sector (NCEUS, 2009). Those of them relating to productivity
enhancement, such as provision of technology support, input supply, access to credit
and marketing need to be adopted on a priority basis.
It is, however, important that employment in the formal sector increases to
ensure improvement in quality of employment on a sustainable basis. ‘Restrictive
labour laws’ have often been identified among the factors that constrain increase in
investment and employment. For example, several studies over the years have
concluded that employment in organized manufacturing sector in India would have
been significantly larger if the provision relating to prior government permission for
retrenchment, lay off and closure, under the Industrial Disputes Act (IDA) was not
made applicable to all enterprises employing 100 or more workers (e.g. Fallon and
Lucas, 1991, Besley and Burgess, 2004). World Bank Doing Business Reports
classified India as a country with stringent regulations, including labour regulations.
(For a detailed account of the findings of studies and reviews on the subject, see
World Bank, 2010). Though restrictive labour laws do not get listed among the most
severe constraints by the employers, it is widely agreed, including by the government
(See e.g. Economic Survey, 2005-06, Planning Commission 2008, Vol. III, pp. 49-50)
that some of the legal provisions including the above mentioned one in IDA and
restrictions in the use of contract labour under the Contract Labour Regulation and
Abolition Act (CLRA), which specially hinder the operations of firms that produce
primarily to meet fluctuating export orders, constrain expansion of production and
employment. Political compulsions seem to have made the government refrain from
taking any initiative to change the law. However, some states have taken steps to
modify laws and rules to make employment of labour more flexible. Also, a generally
relaxed attitude to implementation has prevailed in recent years (See Papola, et al
2008). In fact, in a recent speech, the Prime Minister stated that “….this view (that
the labour laws are unduly protective of labour) has lost its importance in recent
years as more and more state governments have become considerably more flexible
in their approach to labour restructuring and rationalization (Speech at 44th Session
of the Indian Labour Conference, New Delhi, 14th February 2012).
~ 75 ~
Some recent studies (e.g. Hasan, et al 2003, Goldar 2011) have found that
states, having made industry friendly changes in laws and rules have higher
employment elasticities or have experienced higher growth of employment in the
organized manufacturing sector. There are studies which have questioned the
findings of the earlier as well as recent studies (see e.g. Bhattacharjea, 2006 and
Nagraj, 2011). It appears that restrictive labour laws are, but not the most important
constraints in expansion of organized sector employment.
At the same time, it seems, necessary to bring in changes in the labour law
regime in India to ensure expansion of and improvement in overall quality of
employment. First, IDA provision on prior government permission for
retrenchment, lay – off and closure needs to be removed with corresponding
enhancement of compensation from the present 15 days wages for each completed
year of service. Second, provisions of CLRA need to be relaxed to permit more
flexible use of contract labour where labour is not required on a stable long term
basis, while, at the same time, ensuring stricter compliance of provisions relating to
payment of wages and social security. Third, multiplicity of labour laws and variations
in concepts and definitions in different statutes need to be removed by streamlining,
simplifying and codifying them, so as to reduce transaction costs and minimize the
avoidance of compliance. Fourth, a time-bound programme of legislation to
guarantee the minimum quality of working conditions and basic social protection to
workers in the informal sector needs to be evolved. In this respect the
recommendations made by the National Commission for Enterprises in the
Unorganized Sector (NCEUS) both in respect of conditions of work and social
security deserve serious consideration.
In addition to the foregoing demand side measures, an important initiative
relating to the supply side of the labour market that needs special attention is
development of adequate quantity and quality of skills. Most workers – employed
and looking for work – have not had any vocational training for acquiring skills.
Institutional capacity needs to be vastly expanded for training of young entrants to
the labour market and realisation of the ‘demographic dividend’ India potentially
possesses. It also needs to be oriented towards greater flexibility in timing and
regularity to suit the requirements of the employed, specially those in the informal
~ 76 ~
sector, to enable them to upgrade their skills. Training requires to be made demand
– induced for which it would be necessary to have an important role for industry in
its planning and execution. A public – private partnership mode is necessary for this
purpose as well as for sharing the financial cost by the users. It is hoped that the
nationally launched Skill Development Mission, establishment of the National Skill
Development Corporation and formation of a Council under the chairmanship of the
Prime Minister to monitor progress will place the subject on the high enough
priority to give effect to adequate expansion in the skill base of the Indian workforce
and better matching of skill supplies and demand, both in quantity and quality.
~ 77 ~
X. MGNREGA: Some Observations
The story of India’s employment experience in recent years would not be complete
without a reference to the National Rural Employment Guarantee Programme which
has been in operations since 2006 under the National Rural Employment Guarantee
Act (NREGA), now rechristened as Mahatma Gandhi National Rural Employment
Guarantee Act (MGNREGA). India has a long history of special employment
programmes, specially since 1970’s when such wage employment programmes, along
with subsidized self employment programmes were started as a part of the strategy
to combat poverty. The unique feature of the employment programmes under
MGNREGA is the provision of manual work up to 100 days per rural household in a
year, as a matter of a statutory right. It primarily aims at enhancing livelihood
security of rural households by supplementing their income through wage
employment. Side by side, it is also expected to create infrastructure such as rural
connectivity and irrigation, enhance the livelihood and natural resource base to
mitigate poverty and environmental degradation and strengthen grass roots
processes of democracy and infuse transparency and accountability of governance.
Programmes under the Act have now been in operation for over five years. Starting
with 200 districts in 2006, they are now implemented in all the rural districts of the
country. Major outcomes of the programmes during the first five years are
summarized in Table 32.
The programme could be regarded as having significant achievements in
terms of coverage of households, inclusion of women and socially disadvantaged
groups as well the relevance of the types of assets created. Average number of days
or employment provided to participating households has been increasing from year
to year till 2010-11 when it reached 54. It is however, significantly lower than
maximu provision of 100 days. And in 2010-11, it declined to 47. Averages wages per
day of work stood at Rs 117 in 201-011 rising steadily from Rs 65 in the first year
(2006-07). Average earnings of participating households from the work in the
programme now are thus around Rs 5500 which is a significant addition to the
incomes of poor households in rural areas. According to a study based on household
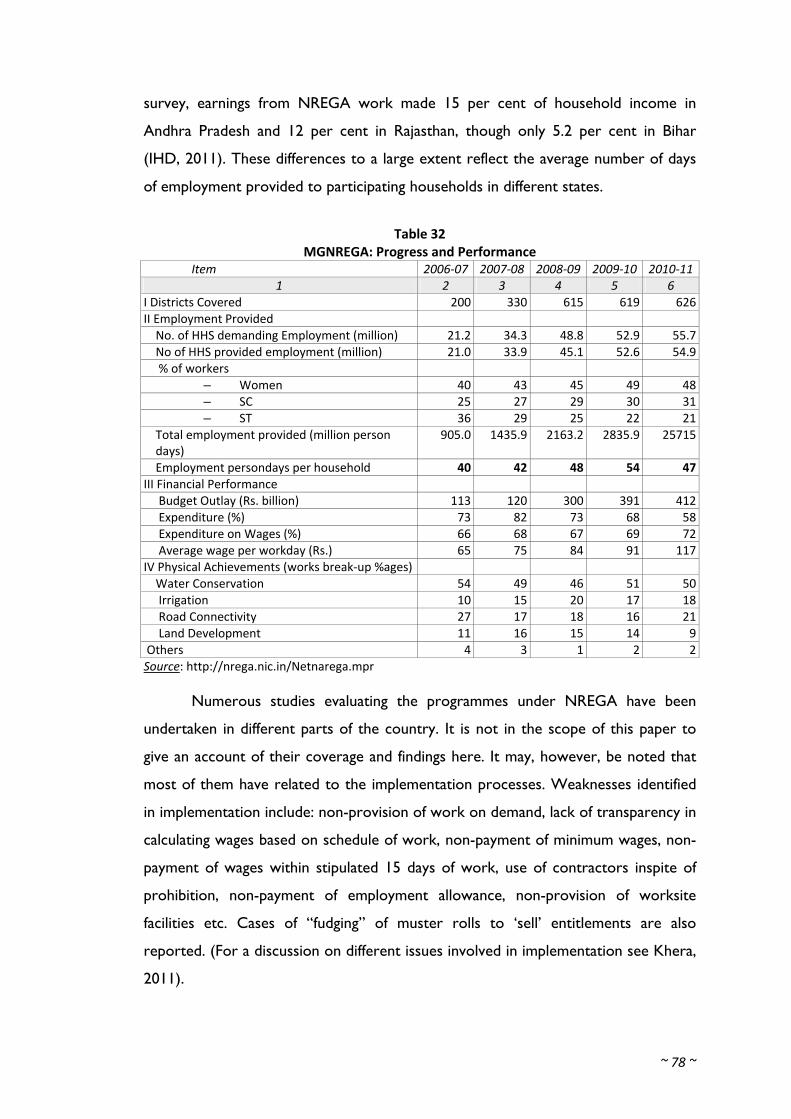
~ 78 ~
survey, earnings from NREGA work made 15 per cent of household income in
Andhra Pradesh and 12 per cent in Rajasthan, though only 5.2 per cent in Bihar
(IHD, 2011). These differences to a large extent reflect the average number of days
of employment provided to participating households in different states.
Table 32 MGNREGA: Progress and Performance
Item 2006‐07 2007‐08 2008‐09 2009‐10 2010‐111 2 3 4 5 6
I Districts Covered 200 330 615 619 626II Employment Provided No. of HHS demanding Employment (million) 21.2 34.3 48.8 52.9 55.7No of HHS provided employment (million) 21.0 33.9 45.1 52.6 54.9 % of workers
– Women 40 43 45 49 48– SC 25 27 29 30 31– ST 36 29 25 22 21
Total employment provided (million person days)
905.0 1435.9 2163.2 2835.9 25715
Employment persondays per household 40 42 48 54 47III Financial Performance Budget Outlay (Rs. billion) 113 120 300 391 412 Expenditure (%) 73 82 73 68 58 Expenditure on Wages (%) 66 68 67 69 72 Average wage per workday (Rs.) 65 75 84 91 117
IV Physical Achievements (works break‐up %ages) Water Conservation 54 49 46 51 50 Irrigation 10 15 20 17 18 Road Connectivity 27 17 18 16 21 Land Development 11 16 15 14 9
Others 4 3 1 2 2Source: http://nrega.nic.in/Netnarega.mpr
Numerous studies evaluating the programmes under NREGA have been
undertaken in different parts of the country. It is not in the scope of this paper to
give an account of their coverage and findings here. It may, however, be noted that
most of them have related to the implementation processes. Weaknesses identified
in implementation include: non-provision of work on demand, lack of transparency in
calculating wages based on schedule of work, non-payment of minimum wages, non-
payment of wages within stipulated 15 days of work, use of contractors inspite of
prohibition, non-payment of employment allowance, non-provision of worksite
facilities etc. Cases of “fudging” of muster rolls to ‘sell’ entitlements are also
reported. (For a discussion on different issues involved in implementation see Khera,
2011).
~ 79 ~
At the same time, it is generally agreed that in spite of its scale of operations
and generally poor management capability of village councils who are supposed to be
responsible for its implementation, NREGA programmes are better implemented
than similar programmes in the past. That is probably because of the provision of
elaborate monitoring of the process and large scale and high–pitch awareness
campaign that has been undertaken for it. The five-year experience of its
implementation, however, has thrown up some questions regarding the design of the
programme, based on aggregate outcome indicators and findings of various studies.
First, the programme has led to an increase in wages of casual labour particularly in
agriculture. In itself it may be considered to be a desirable outcome of NREGA. But
to the extent inability of farmers to pay higher wages leads to shortage of labour for
agricultural operations, it may have an adverse effect on agricultural production. The
question of suspending NREGA operations, during busy agricultural months in
certain areas may, therefore, have to be considered, as one of the options. Second,
the average number of days of work per participating household is rising and
percentage of households having availed of their quota of 100 days is also increasing.
Still, there would be households who do not get work for all the days they are in
need of it, because of the ceiling of 100 days. Should, then, the removal of this limit
not be considered?
Third, inspite of the fact that there is no budgetary constraint as it is an open-
ended demand-driven programme, why the average days of work per participating
households continues to be much less than the limit of 100 days? In fact, the
percentage of expenditure to available funds has been declining over the past four
years. Is there no more demand for work? There is, of course, large variation in
average number of employment per household across states, e.g. from 69 days in
Rajasthan and 66 days in Andhra Pradesh to 28 days in Bihar and Punjab, against the
nationwide average of 54 days, in 2009-10. In 2010-11 variations seem to have
reduced, still the figure is high at 54 per cent in Andhra Pradesh and Tamil Nadu and
51 in Rajasthan and low at 27 in Punjab, 31 in West Bengal and 34 in Bihar, among
major states. Is it due to the differences in administrative capacity of the states to
implement the programme? Or, is it that the labour market situation differs among
states and “one-size-does not fit-all”? For example, in several states, as market wages
are much higher than the NREGA rates, men are not generally available for work in
~ 80 ~
its programmes, and it is mostly women who offer to work in them. Women making
up 90 per cent of workers in Kerala and 83 per cent in Tamil Nadu against the
nationwide average of 48 per cent, in 2009-10 probably reflects this phenomenon.
Sometimes an increase in wages is suggested for raising participation, in general, and
of men, in particular. That, however, may not be in line with the very objective of the
programme, which is to supplement and not substitute the main source of
employment and incomes of the households and their members.
Finally, an assessment of the programme, on the basis of its six year long
functioning, towards its contribution in enhancing the capacity of the rural areas to
generate sustainable quality employment is necessary. It appears that while the
programme is successful to a significant extent in meeting its main objective, namely,
to enhance the livelihood security of the poor households, in the long run, its
contribution in enhancing skills and capacity of the poor on the one hand, and in
increasing the productive capacity of the local resources, on the other will be of
great significance in creating employment on a sustainable basis. To the extent, the
present design and scheme of the programme are inadequate in this regard, suitable
changes to enhance its potential to create productive assets and skills need to be
introduced. In other words, the possibility of utilising the programme for not only
enhancing the livelihood security for the poor, but towards building capacities for
sustainable productive employment opportunities need to be seriously explored.
~ 81 ~
References
Ahluwalia, M. S. (2011) “Prospects and Policy Challenges in the Twelfth Plan”, Economic and Political Weekly, Vol. XLVI, No. 21.
Besley, T. And R. Burgess (2004) ‘Can Labour Regulation Hinder Economic Performance? Evidence from India’, The Quarterly Journal of Economics, 119 (1).
Bhalla, G S (2006) Conditions of Indian Peasantry, New Delhi, National Book Trust, India.
Bhattacharjea, Aditya (2006) “Labour Market Regulation and Industrial Performance in India: A Critical Review of the Empirical Evidence”, Indian Journal of Labour Economics, Vol. 49, No.2.
Bordia Das, Maitreyi (2010) “Minority Status and Labour Market Outcomes: Does India Have Minority Enclaves?” in Sukhadeo Thorat and Katterini S. Newman (eds.), Blocked by Caste: Economic Discrimination in Modern India, New Delhi, Oxford University Press.
Chaudhari, Subhanil (2011) “Employment in India: What does the Latest Data Show?”, Economic and Political Weekly, August 6.
CII (2004) “Tourism in Rajasthan a Golden Opportunity,” Confederation of Indian Industry, Northern Region.
EAC (2007) Employment and Growth, Report of the Economic Advisory Council to the Prime Minister, New Delhi, Government of India.
EPW (2011) ‘Don’t Shoot the Messenger’, Economic and Political Weekly, July 9, (Editorial).
Fallon, Peter R. and R.E.B. Lucas (1991) “The Impact of Changes in Job Security Regulations in India and Zimbabwe’, World Bank Economic Review, Vol. 5, No. 3.
Ghose, Ajit K., (2004) “The Employment Challenge in India”, Economic and Political Weekly, November 27.
Ghose, Ajit K., Nomann Majid, Christoph Ernst (2008), The Global Employment Challenge, Geneva, ILO-.
Ghose, Ajit K. (2011) ‘The Growth Employment Inter-Action in a Developing Economy’ V B Singh Memorial Lecture at the 53rd Annual Conference of Indian Society of Labour Economic, Udaipur, 17-9 December.
~ 82 ~
Goldar, Bishwanath (2011) Growth in Organised Manufacturing Employment in Recent Years’, Economic and Political Weekly, Vol. XLVI, No.7, February 12.
Government of India (Various Years), Economic Survey, New Delhi, Ministry of Finance.
Government of India, Report on Effect of Economic Slowdown on Employment in India, Labour Bureau, Ministry of Labour and Employment (various quarterly reports).
Hassan, Rana, Devashish Mitra and K V Ramaswamy (2003) ‘Trade Reforms, Labour Regulations and Labour Demand Elasticities: Empirical Evidence from India’, Working Paper 9879, National Bureau of Economic Research, Cambridge MA.
IHD, (2011) ‘Experience of National Rural Employment Guarantee Act in India and Some Aspects of Decent Work Agenda’, New Delhi, Institute for Human Development (Mimeo).
ILO (2007) Key Indicators of Labour Market, Geneva, International Labour Office, Fifth Edition.
ILO (2011) Key Indicators of Labour Market, Geneva, International Labour Office, Seventh Edition.
Kannan, K.P. (2011) ‘How Inclusive is Inclusive Growth in India’ paper presented at the International Expert Workshop on ‘Inclusive Growth: From Policy to Reality’, jointly organised by International Development Research Centre (IDRC), Canada and Indian Institute for Dalit Studies (IIDs), New Delhi; 11-13 December, 2011, New Delhi.
Kannan, K P and G Raveendran, (2009) “Growth sans Employment: A Quarter Century of Jobless Growth in India’s Organised Manufacturing”, Economic and Political Weekly, Vol. XLIV, No. 10, March 7.
Kannan, K P and G Raveendran, (2012) “Counting and Profiling of the Missing Labour Force”, Economic and Political Weekly, Vol. XLVII, No. 6, February 11.
Khera, Reetika (ed), The Battle for Employment Guarantee, New Delhi, Oxford University Press.
Ministry of Tourism (2004) India Tourism Statistics, New Delhi, Government of India.
--------------------- (2006) International Passenger Survey, 2003, Final Report, New Delhi, Government of India.
Nagraj R (2011) ‘Growth in Organised Manufacturing Employment: A Comment’, Economic and Political Weekly, Vol. 46, N0. 12, March 17-24.
~ 83 ~
NCEUS (2006) Social Security for Unorganised Workers, New Delhi, National Commission for Enterprises in the Unorganised Sector, New Delhi, Government of India.
--------------------- (2007) Report on Conditions of Work and Promotion of Livelihoods in the Unorganised Sector, New Delhi, Government of India and Academic Foundation.
--------------------- (2009) The Challenge of Employment in India: An Informal Economy Perspective, New Delhi, Government of India.
NSSO, (Various Years) Surveys on Employment and Unemployment, Various Rounds, New Delhi, National Sample Survey Organisation.
NSSO (2005) Income, Expenditure and Productive Assets of Farmer Households (Situation Assessment Survey of Farmers), 59th Round, Report No. 497, New Delhi, National Sample Survey Organisation.
Pais, J, Papola, T.S., Ranganathan, K.V.K and Rao K.S.C. (2006) Employment Implications of Growing Export of Services, (New Delhi, Institute for Studies in Industrial Development) Report prepared for Ministry of Commerce and Industry, Government of India.
Pais, J. (2006) Tourism Employment: An Analysis of Foreign Tourism in India, ISID Working Paper: 2006/04.
Papola, T. S. (1992) “The Question of Unemployment”, in Bimal Jalan (ed.) The Indian Economy: Problems and Prospects, New Delhi, Viking, Penguin Books India Pvt. Ltd.
Papola, T. S. (2004) Employment Challenges and Strategies in India: An Assessment in the Framework of ILO’s Global Employment Agenda, Geneva, ILO, Poverty and Reconstruction Department.
Papola T S (2008), ‘Industry and Employment: Dissecting Recent Indian Experience’, in S R Hashim et al (eds), Indian Industrial Development and Globalisation, New Delhi. ISID and Academic Foundation.
Papola T.S., Jesim Pais and Partha Pratim Sahu (2008) Labour Regulation in Indian Industry: Towards a Rational and Equitable Framework, New Delhi, ISID and Bookwell.
Papola T.S. and Partha Pratim Sahu (2008) ‘Mainstreaming Employment in Macro-economic and Sectoral Development: A Framework for Analysis and Policy’, New Delhi, International Labour Organization, April.
Papola T.S. (2010) ‘Livelihoods in Agriculture: Status, Policies and Prospects’, in Sankar Datta and Vipin Sharma (eds), State of India’s Livelihoods Report, The 4P Report, New Delhi, Sage.
~ 84 ~
Papola, T.S., Nitu Maurya and Narendra Jena (2011) Inter-Regional Disparities in Industrial Growth and Structure, A Study Prepared as a Part of a Research Programme on Structural Changes, Industry and Employment in the Indian Economy:
Macro‐economic Implications of Emerging Pattern, Sponsored by Indian Council of Social Science Research (ICSSR) New Delhi.
Planning Commission (2008), Eleventh Five Year Plan (2007-2012) –– Volume I, Inclusive Growth, –– Volume III, Agriculture, Industry, Services and Physical Infrastructure, New Delhi, Planning Commission, Government of India.
Planning Commission (2011) Faster Sustainable and More Inclusive Growth: An Approach to the 12th Five Year Plan, August.
Rangarajan C, Padma Iyer Kaul, Seema, (2011) ‘Where is the Missing Labour Force’, Economic and Political Weekly, September 24-30.
RIS (2006) Towards an Employment Oriented Export Strategy: Some Explorations, New Delhi, Research and Information System for Developing Countries.
Sarkar, Sandip and Anup K Karan (2005) Status and Potential of Village Agro-Processing Units/Industries, Occasional Paper-37, Mumbai, NABARD.
Unni, Jeemol and G Raveendran (2007) “Growth of Employment (1993-94 to 2004-05): Illusion of Inclusiveness?, Economic and Political Weekly, January 20.
Veeramani, C. (2012) “Anatomy of India’s Merchandise Exports Growth, 1993-94 – 2010-11”, Economic and Political Weekly, January 7.
World Bank (2010) India’s Employment Challenge, Creating Jobs, Helping Workers, New Delhi, Oxford University Press and The World Bank.