Embed Size (px)
Citation preview
ARTICLE IN PRESS
Vacuum 73 (2004) 115–121
*Correspondin
E-mail addre
(D.J. O’Connor)
0042-207X/$ - see
doi:10.1016/j.vac
Growth and alloying of submonolayer Cu on Pt(12 12 11)
D.J. O’Connora,*, D.A. MacLarenb, T.C.Q. Noakesc, P. Baileyc, W. Allisonb,P.C. Dastoora
aSchool of Mathematical and Physical Sciences, University of Newcastle, Callaghan, NSW 2308, AustraliabCavendish Laboratory, University of Cambridge, CB3 0HE, UK
cCLRC Daresbury Laboratory, Daresbury, Warrington WA4 4AD, UK
Received 29 August 2003; accepted 2 December 2003
Abstract
A detailed comparative study of Cu growth on the vicinal surface Pt(12 12 11) has been performed with helium atom
scattering (HAS) and medium energy ion scattering (MEIS). These techniques are ideally complementary in that HAS is
extremely sensitive to the electronic structure of the surface layer, while MEIS accurately probes the atom core structure
of the surface. By combining these two techniques it has been possible to measure the initial structure of Cu on the
stepped Pt surface and to study how the Cu redistributes across the surface and into the bulk on annealing. The HAS
and MEIS data identify two significant diffusion transitions on the surface occurring at temperatures of 450 and 600K.
Crown Copyright r 2004 Published by Elsevier Ltd. All rights reserved.
Keywords: Epitaxial growth; Surface alloy; Pt(1 1 1); Surface relaxation
1. Introduction
The growth of Cu on Pt(1 1 1) has been studiedextensively both as an evaporated film in UHVusing helium atom scattering (HAS) and STM,and as an electrodeposited film in liquid usingSTM. The combination of Cu and Pt is expected togenerate interesting structures as there is an 8%difference in the lattice constant for these materialshence epitaxial growth will involve considerablelattice strain.Submonolayer growth of Cu on Pt(1 1 1) is
epitaxial, with the strong Pt–Cu bond drivingcommensurate, strained growth of a copper over-
g author. Fax: +61-02-492-168-98.
.
front matter Crown Copyright r 2004 Published
uum.2003.12.028
layer. LEED patterns retain sharp, 1� 1 structureswithout significant diffuse scattering. At roomtemperature, STM and HAS evidence suggeststhat growth is dendritic, indicating that Cuadatom diffusion across terraces is facile but thatdiffusion/migration about island and step edges iskinetically limited. As coverage increases, dendriticislands merge to form a 2d monolayer with a fewdefects and holes attributed to the merging ofindividual islands.This study has grown out of a complementary
study of Pt growth on Cu(1 1 1) [1–3] and it buildson the HAS and STM study of Cu growth onPt(1 1 1) [4,5] which investigated the growth of Cuon a flat crystal. From these studies it is clear thatsteps play an important role. To enhance the roleof step edges and to ultimately probe the structureof the film at a step edge, a vicinal surface,
by Elsevier Ltd. All rights reserved.
ARTICLE IN PRESS
D.J. O’Connor et al. / Vacuum 73 (2004) 115–121116
(12 12 11), was used which provides a large numberof steps while also ensuring relatively large terracewidths. One goal of the project is to compare andcontrast the information provided by HAS andmedium energy ion scattering (MEIS) to bettercharacterise the structural information obtainableabout a crystal surface growth processes.In a parallel study using HAS [6] the surface
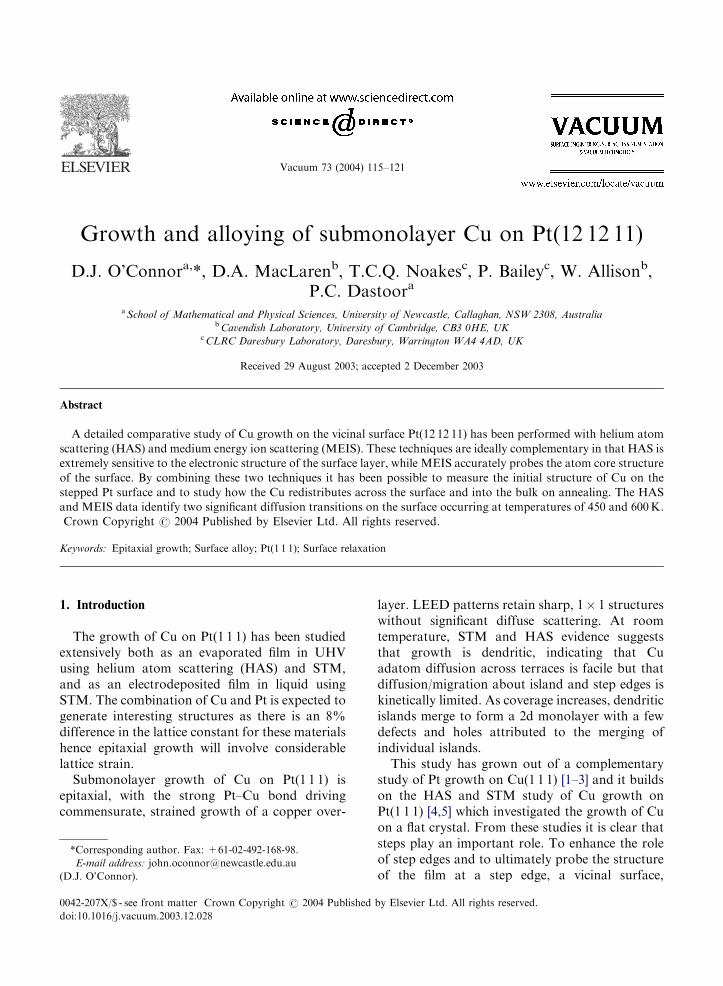
rearrangement and alloying of 0.5ML of Cudeposited on Pt(12 12 11) has revealed a numberof interesting phases (see Fig. 1). In this study thereflectivity of the surface is monitored as thesample is annealed. If the film underwent norearrangement the reflectivity would drop expo-nentially with increasing temperature to reflect theincreased thermal vibration effects of the targetatoms. However for this combination there isapparently a much more complex sequence ofevents. There are several irreversible phase transi-tions:a–b—slow kinetically-limited smoothing invol-
ving significant mass transfer. This is initiated at200K and increases rapidly at 300K;b–d—two sharp transitions centred on 480K
consistent with a reconstruction causing rough-ening then the onset of alloying leading to asmoothing as evidenced by the increased specularyield;
Fig. 1. Specular helium reflectivity from a 0.5ML Cu film
grown on Pt(12 12 11) at 180K and subsequently annealed at
+10K/min to 800K (points a–f), then cooled at �10K/min to180K (points f–h). The intensity axis is logarithmic.
d–f–g—several distinct phases. The sharp in-crease in reflectivity at 800K is consistent with theexpected bulk alloying temperature of theseelements. Mobility is not frozen until the tempera-ture drops below 520K.
2. Experimental methods
MEIS data were taken at the UK MEIS facilitywhich is described in detail elsewhere [7]. Thechamber base pressure was 5� 10�10mbar. Thesample was bombarded by a collimated beam of100 keV H+ ions and scattered ions were analysedby a toroidal electrostatic analyser which had aneffective acceptance angle in the scattering plane of20�. Each data set is the cumulative signal from atypical ion dose of 1016 ions cm�2.The samples were sputter cleaned using normal
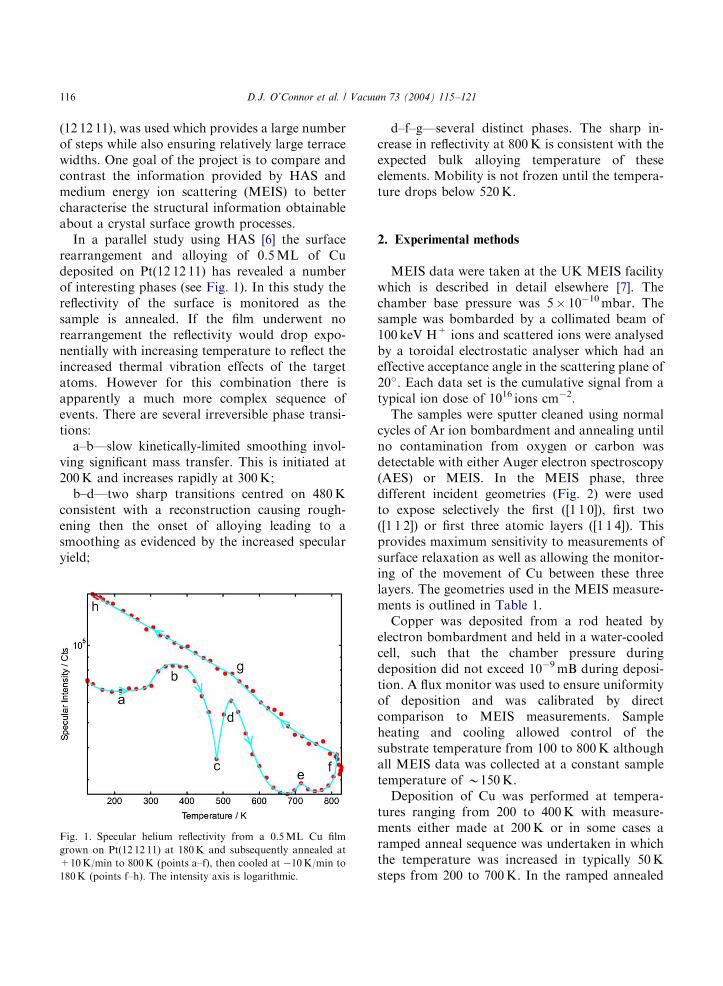
cycles of Ar ion bombardment and annealing untilno contamination from oxygen or carbon wasdetectable with either Auger electron spectroscopy(AES) or MEIS. In the MEIS phase, threedifferent incident geometries (Fig. 2) were usedto expose selectively the first ([1 1 0]), first two([1 1 2]) or first three atomic layers ([1 1 4]). Thisprovides maximum sensitivity to measurements ofsurface relaxation as well as allowing the monitor-ing of the movement of Cu between these threelayers. The geometries used in the MEIS measure-ments is outlined in Table 1.Copper was deposited from a rod heated by
electron bombardment and held in a water-cooledcell, such that the chamber pressure duringdeposition did not exceed 10�9mB during deposi-tion. A flux monitor was used to ensure uniformityof deposition and was calibrated by directcomparison to MEIS measurements. Sampleheating and cooling allowed control of thesubstrate temperature from 100 to 800K althoughall MEIS data was collected at a constant sampletemperature of B150K.Deposition of Cu was performed at tempera-
tures ranging from 200 to 400K with measure-ments either made at 200K or in some cases aramped anneal sequence was undertaken in whichthe temperature was increased in typically 50Ksteps from 200 to 700K. In the ramped annealed
ARTICLE IN PRESS
Fig. 2. Three different geometries used in the MEIS analysis.
These geometries are designed to irradiate selectively the first
one, two and three atomic layers.
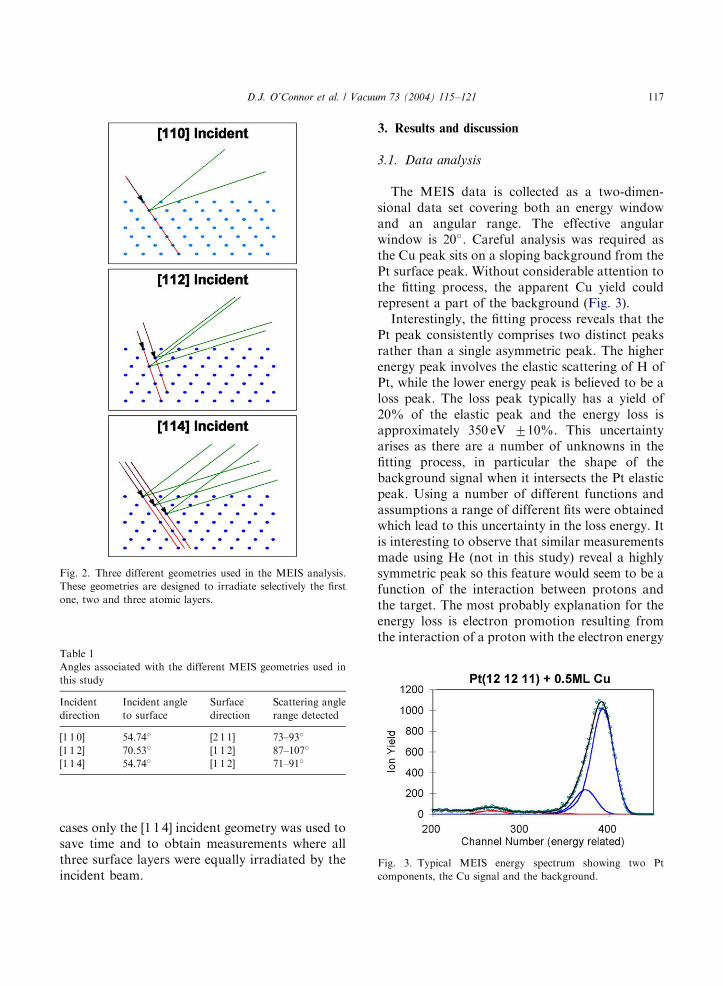
Fig. 3. Typical MEIS energy spectrum showing two Pt
components, the Cu signal and the background.
Table 1
Angles associated with the different MEIS geometries used in
this study
Incident
direction
Incident angle
to surface
Surface
direction
Scattering angle
range detected
[1 1 0] 54.74� [2 1 1] 73–93�
[1 1 2] 70.53� [1 1 2] 87–107�
[1 1 4] 54.74� [1 1 2] 71–91�
D.J. O’Connor et al. / Vacuum 73 (2004) 115–121 117
cases only the [1 1 4] incident geometry was used tosave time and to obtain measurements where allthree surface layers were equally irradiated by theincident beam.
3. Results and discussion
3.1. Data analysis
The MEIS data is collected as a two-dimen-sional data set covering both an energy windowand an angular range. The effective angularwindow is 20�. Careful analysis was required asthe Cu peak sits on a sloping background from thePt surface peak. Without considerable attention tothe fitting process, the apparent Cu yield couldrepresent a part of the background (Fig. 3).Interestingly, the fitting process reveals that the
Pt peak consistently comprises two distinct peaksrather than a single asymmetric peak. The higherenergy peak involves the elastic scattering of H ofPt, while the lower energy peak is believed to be aloss peak. The loss peak typically has a yield of20% of the elastic peak and the energy loss isapproximately 350 eV 710%. This uncertaintyarises as there are a number of unknowns in thefitting process, in particular the shape of thebackground signal when it intersects the Pt elasticpeak. Using a number of different functions andassumptions a range of different fits were obtainedwhich lead to this uncertainty in the loss energy. Itis interesting to observe that similar measurementsmade using He (not in this study) reveal a highlysymmetric peak so this feature would seem to be afunction of the interaction between protons andthe target. The most probably explanation for theenergy loss is electron promotion resulting fromthe interaction of a proton with the electron energy

ARTICLE IN PRESS
Fig. 4. Electronic energy level diagram for Pt showing the
transition which may lead to the observed energy loss for
100 keV H scattered off Pt.
Fig. 5. The quality of fit of the MEIS data for clean Pt
(12 12 11).
D.J. O’Connor et al. / Vacuum 73 (2004) 115–121118
levels of platinum. Analysis of the energy leveldiagram (Fig. 4) for Pt [8] reveals that the observedenergy loss involves ionisation from the 4d level(B310 eV).In addition to the fitting of the energy spectra,
there was an apparent charge exchange processwhich needed to be accounted for in the angularscans. Once the raw data was corrected for cross-section and converted to the unit of atoms per row,there was a trend in the angular profile ofincreasing yield from low scattering angle to highscattering angle. This trend was not related to theinteratomic potential used as it was evident for abroad range of potentials. The trend was contraryto the predictions of computer simulations andproduced results which were not supported byconsiderations of blocking and channelling. Otherthan the interatomic potential, the possible causesare either a uniformly changing detection effi-ciency across the microchannel plates, or a varyingcharge fraction of the scattered projectiles as afunction of exit angle to the surface. While this is acommon expectation for inert gas scattering, theoccurrence of a charge exchange effect is lesscommon at medium energies (100 keV) forprotons.
3.2. Clean Pt(12 12 11)
A key preliminary phase involved determiningthe structure and thermal vibrations of a clean
Pt(12 12 11) surface (Fig. 5). Using the threegeometries described in Fig. 2, data was collectedand compared with the VEGAS program [9] toidentify the relaxation between the first and secondatomic layers, the second and third atomic layersand the enhancement of the thermal vibrationamplitudes for the atoms of the first atomic layerand the second atomic layer. The bulk thermalvibration amplitude was determined from the PtDebye temperature of 240K. The data from allthree geometries were fitted to the computersimulations simultaneously to obtain the bestoverall fit between data and simulation.

ARTICLE IN PRESS
D.J. O’Connor et al. / Vacuum 73 (2004) 115–121 119
The Pt(1 1 1) surface has attracted considerableinterest involving many different techniques [10–13] however the consensus view is that there is nomeasurable relaxation at room temperature but atelevated temperature and for surfaces exposed toadsorbates there is significant reconstruction. Thisis still a contested result and a recent paper hasoffered very accurate estimates of relaxation forPt(1 1 1) at room temperature [14]. In this study theclean sample was measured at room temperature.The outcome of our MEIS measurement was an
estimate that the first interlayer spacing increasedby 0.04 (A and the second interlayer spacingdecreased by 0.02 (A. This is unusual as theexpectation in most circumstances is a compres-sion of the first interlayer spacing and a smallerexpansion of the second interlayer spacing.However these values are in excellent agreement
with recent LEED determinations [14] of thestructure of clean Pt(1 1 1) in which it was foundthat the first interlayer spacing was increased by0.035 (A and the second interlayer spacing wasreduced by 0.01 (A relative to the bulk spacing theymeasure. In both sets of measurements theuncertainty is quoted to be typically 70.02 (A.Relative to the recognised bulk value of 2.265 (Athe first and second layer spacings were quoted tobe +0.02 (A and �0.02 (A.In the same paper, it is claimed that there is an
in-plane contraction of 0.5% which may not beseen in these experiments as the 50 lattice spacingbetween step edges may be enough to relieve thecompression and frustrate observable lateral shifts.However this stress may cause random displace-ments in which case it could appear as an increasedthermal vibration amplitude. The thermal vibra-tion amplitudes were determined to be 0.094 (A forthe first layer and 0.092 (A for the second layerwhich is to be compared to 0.064 (A for the thirdand subsequent layers. The larger than expectedvalue for the second layer may be due to a randomdisorder induced by the measured contraction.
3.3. Submonolayer growth of Cu on Pt(12 12 11) at
300 K
Cu deposition was conducted at a range ofsubstrate temperatures and with different cov-
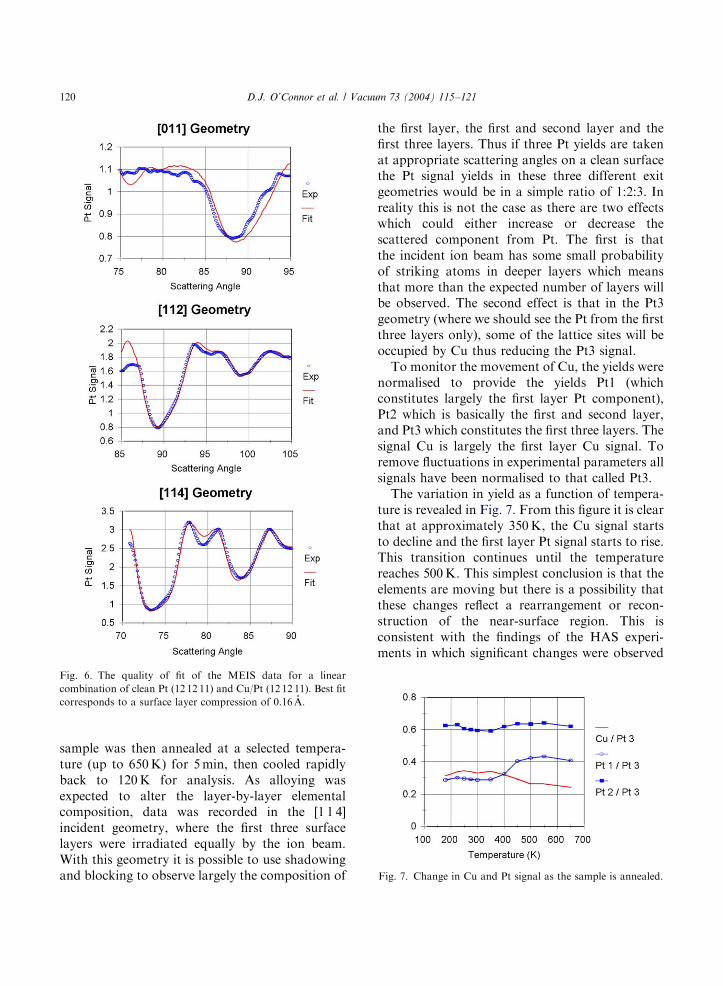
erages. For films grown on a substrate at or below300K and with a coverage significantly less thanone monolayer (i.e. o0.75ML), it was found thatthe Cu overlayer was observed to relax. The datawas fitted by assuming the Cu to form islands onthe surface [4] and the data was compared to alinear sum of simulations comprising a portion ofthe surface which is clean Pt and a portion which iscovered by a monolayer of Cu which is relaxed.The proportions used of the two models wasdetermined from the measured Cu coverage. Thismodel fitted the data well and from the fit it ispossible to conclude that the Cu covered compo-nent experienced a relaxation of �0.1670.02 (A. Itwas also possible to measure the thermal vibrationamplitude using the same approach and the firstlayer thermal vibration amplitude was determinedto be 0.1270.005 (A and the second layer was0.1070.005 (A. The quality of these fits is shown inFig. 6.Previous STM [4] studies indicate that there is a
change in morphology once a monolayer isformed. The Cu islands grow and coalesce but asecond layer starts to develop before all the ‘holes’are filled in the first layer. It is for this reason thatone result for 0.82ML coverage is believed to notfit the relaxations outlined above although thelevel of disagreement is small as the relaxation isgiven as 0.19 (A and the thermal vibration ampli-tudes are 0.13 and 0.10 (A.Most noticeably different was a set of deposi-
tions which were performed at a substratetemperature of 400K. These results could not befitted simply by a sum of clean Pt(1 1 1) andrelaxed Cu surface. While there is compellingevidence for a relaxation of 0.16 (A there isevidence of other structural features not yetresolved. This effect causes a significant variationbetween the widths of the blocking dips in thesimulation and the experiment.
3.4. Annealing submonolayer Cu/Pt(12 12 11)
Key insights into the surface kinetics of asubmonolayer Cu film can be gained by monitor-ing the MEIS signal with sample temperature. Acopper film of B0.5ML coverage was grown at asample temperature of 150K. Following MEIS the
ARTICLE IN PRESS
Fig. 6. The quality of fit of the MEIS data for a linear
combination of clean Pt (12 12 11) and Cu/Pt (12 12 11). Best fit
corresponds to a surface layer compression of 0.16 (A.
Fig. 7. Change in Cu and Pt signal as the sample is annealed.
D.J. O’Connor et al. / Vacuum 73 (2004) 115–121120
sample was then annealed at a selected tempera-ture (up to 650K) for 5min, then cooled rapidlyback to 120K for analysis. As alloying wasexpected to alter the layer-by-layer elementalcomposition, data was recorded in the [1 1 4]incident geometry, where the first three surfacelayers were irradiated equally by the ion beam.With this geometry it is possible to use shadowingand blocking to observe largely the composition of
the first layer, the first and second layer and thefirst three layers. Thus if three Pt yields are takenat appropriate scattering angles on a clean surfacethe Pt signal yields in these three different exitgeometries would be in a simple ratio of 1:2:3. Inreality this is not the case as there are two effectswhich could either increase or decrease thescattered component from Pt. The first is thatthe incident ion beam has some small probabilityof striking atoms in deeper layers which meansthat more than the expected number of layers willbe observed. The second effect is that in the Pt3geometry (where we should see the Pt from the firstthree layers only), some of the lattice sites will beoccupied by Cu thus reducing the Pt3 signal.To monitor the movement of Cu, the yields were
normalised to provide the yields Pt1 (whichconstitutes largely the first layer Pt component),Pt2 which is basically the first and second layer,and Pt3 which constitutes the first three layers. Thesignal Cu is largely the first layer Cu signal. Toremove fluctuations in experimental parameters allsignals have been normalised to that called Pt3.The variation in yield as a function of tempera-
ture is revealed in Fig. 7. From this figure it is clearthat at approximately 350K, the Cu signal startsto decline and the first layer Pt signal starts to rise.This transition continues until the temperaturereaches 500K. This simplest conclusion is that theelements are moving but there is a possibility thatthese changes reflect a rearrangement or recon-struction of the near-surface region. This isconsistent with the findings of the HAS experi-ments in which significant changes were observed

ARTICLE IN PRESS
D.J. O’Connor et al. / Vacuum 73 (2004) 115–121 121
to take place over the temperature range of 300–500K resulting in an alloying process.
4. Conclusions
Accurate measurements of the structure of cleanPt(12 12 11) and Cu covered Pt(12 12 11) have beenperformed using MEIS and HAS. The dataindicates that while the clean Pt (12 12 11) surfaceis essentially unreconstructed, the Cu coveredPt(1 1 1) surface appears to undergo a reconstruc-tion that’s essentially constant for all coverages upto 1ML provided the deposition temperature is300K or less. There appear to be two maindiffusion processes that are activated with tem-perature. While bulk diffusion of Cu into Pt(1 1 1)appears to be activated above 500K, an additionalprocess is activated just above room temperature.The ion scattering data is supported by the HASdata which shows a significant departure from thenormal Debye–Waller decay behaviour at thistemperature.
References
[1] Shen YG, O’Connor DJ, Wandelt K, MacDonald RJ. Surf
Sci 1996;358:921.
[2] Shen YG, O’Connor DJ, King BV, MacDonald RJ. Nucl
Instrum Methods B 1996;115:191.
[3] Shen YG, O’Connor DJ, MacDonald RJ. Nucl Instrum
Methods B 1998;135:361.
[4] Holst B, Nohlen M, Wandelt K, Allison W. Surf Sci
1997;377–379:891–4.
[5] Holst B, Nohlen M, Wandelt K, Allison W. Phys Rev B
1998;58:10195–8.
[6] MacLaren DA, Dastoor PC, Allison W. in preparation.
[7] Bailey P, Noakes TCQ, Woodruff DP. Surf Sci
1999;426:358.
[8] http://physics.nist.gov/PhysRefData/DFTdata/Tables/
78Pt.html
[9] Frenken JWM, Tromp RM, van der Veen JF. Nucl
Instrum Methods B 1986;17:334.
[10] Teichert C, Hohage M, Michely T, Comsa G. Phys Rev
Lett 1994;72:1682.
[11] Sandy AR, Mochrie SGJ, Zehner DM, Grubel G, Huang
KG, Gibbs D. Phys Rev Lett 1992;68:2192.
[12] Steadman P, Peters KF, Isern H, Ferrer S. Phys Rev B
2001;64:125418.
[13] Hohage M, Michely T, Comsa G. Surf Sci 1995;337(9):249.
[14] Ocal GC, Soria F. Surf Sci 1997;377–379:18–22.